| | OMB APPROVAL |
| | OMB Number: 3235-0570 |
| | Expires: September 30, 2026 Estimated average burden |
| | hours per response 7.78 |
UNITED STATES
SECURITIES AND EXCHANGE COMMISSION
Washington, D.C. 20549
FORM N-CSR
CERTIFIED SHAREHOLDER REPORT OF REGISTERED
MANAGEMENT INVESTMENT COMPANIES
Investment Company Act file number 811-23592
First Eagle Credit Opportunities Fund
(Exact name of registrant as specified in charter)
1345 Avenue of the Americas
New York, NY 10105-4300
(Address of principal executive offices)(Zip code)
Sheelyn Michael
First Eagle Funds
1345 Avenue of the Americas
New York, NY 10105
(Name and address of agent for service)
Registrant’s telephone number, including area code: 1-212-632-2700
Date of fiscal year end: December 31
Date of reporting period: June 30,2024
Form N-CSR is to be used by management investment companies to file reports with the Commission not later than 10 days after the transmission to stockholders of any report that is required to be transmitted to stockholders under Rule 30e-1 under the Investment Company Act of 1940 (17 CFR 270.30e-1). The Commission may use the information provided on Form N-CSR in its regulatory, disclosure review, inspection, and policymaking roles.
A registrant is required to disclose the information specified by Form N-CSR, and the Commission will make this information public. A registrant is not required to respond to the collection of information contained in Form N- CSR unless the Form displays a currently valid Office of Management and Budget (“OMB”) control number. Please direct comments concerning the accuracy of the information collection burden estimate and any suggestions for reducing the burden to Secretary, Securities and Exchange Commission, 100 F Street, NE, Washington, DC 20549- 1090. The OMB has reviewed this collection of information under the clearance requirements of 44 U.S.C. § 3507.
Item 1. Reports to Stockholders.

Semiannual Report
June 30, 2024
First Eagle Credit Opportunities Fund
Advised by First Eagle Investment Management, LLC

Forward-Looking Statement Disclosure
One of our most important responsibilities as fund managers is to communicate with shareholders in an open and direct manner. Some of our comments in our letters to shareholders are based on current management expectations and are considered "forward-looking statements". Actual future results, however, may prove to be different from our expectations. You can identify forward-looking statements by words such as "may", "will", "believe", "attempt", "seek", "think", "ought", "try" and other similar terms. We cannot promise future returns. Our opinions are a reflection of our best judgment at the time this report is compiled, and we disclaim any obligation to update or alter forward-looking statements as a result of new information, future events, or otherwise.
First Eagle Credit Opportunities Fund | Semiannual Report | June 30, 2024
2
Table of Contents
Fund Overview | | | 4 | | |
Consolidated Schedule of Investments | | | 5 | | |
Consolidated Statement of Assets and Liabilities | | | 50 | | |
Consolidated Statement of Operations | | | 51 | | |
Consolidated Statements of Changes in Net Assets | | | 52 | | |
Consolidated Statement of Cash Flows | | | 54 | | |
Financial Highlights | | | 56 | | |
Notes to Financial Statements | | | 60 | | |
Fund Expenses | | | 88 | | |
General Information | | | 92 | | |
Dividend Reinvestment Plan | | | 93 | | |
Board Considerations for Continuation of Advisory Agreement | | | 94 | | |
Board Considerations for Continuation of Subadvisory Agreement | | | 97 | | |
First Eagle Credit Opportunities Fund | Semiannual Report | June 30, 2024
3
First Eagle Credit Opportunities Fund
Fund Overview
Data as of June 30, 2024 (unaudited)
Top 5 Industries* (%)
Health Care Services | | | 14.5 | | |
Application Software | | | 6.0 | | |
Research & Consulting Services | | | 3.1 | | |
Pharmaceuticals | | | 3.0 | | |
IT Consulting & Other Services | | | 2.9 | | |
Debt Breakdown** (%)
Secured vs. Unsecured | |
First Lien Secured Loans | | | 89.42 | | |
Second Lien Secured Loans | | | 4.96 | | |
Unsecured Debt | | | 5.62 | | |
Floating vs Fixed | |
Floating Rate | | | 94.38 | | |
Fixed Rate | | | 5.62 | | |
Portfolio Characteristics**
Weighted Average Loan Spread | | | 5.11 | % | |
% of Portfolio at Floor | | | 0.00 | % | |
Weighted Average Maturity (Years) | | | 3.96 | | |
Weighted Average Duration (Years) | | | 0.32 | | |
Weighted Average Days to Reset | | | 37.79 | *** | |
Weighted Average Purchase Price | | $ | 96.79 | | |
Weighted Average Market Price | | $ | 93.70 | | |
Number of Positions | | | 405 | | |
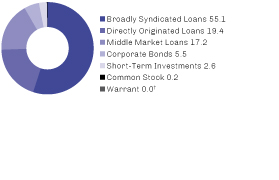
^ Broadly Syndicated Loans, Middle Market Loans and Directly Originated Loans are presented under the Senior Loans category on the Schedule of Investments.
~ The returns shown are based on net asset values calculated for shareholder transactions and may differ from the returns shown in the financial highlights, which reflect adjustments made to the net asset values in accordance with accounting principles generally accepted in the United States of America.
* Asset Allocation and Industries percentages are based on total investments in the portfolio.
** Excludes short-term investments, common stocks and warrants.
*** Includes Senior Loans only.
† Less than 0.05%.
The Fund's portfolio composition is subject to change at any time.
First Eagle Credit Opportunities Fund | Semiannual Report | June 30, 2024
4
First Eagle Credit Opportunities Fund | Consolidated Schedule of Investments | June 30, 2024 (unaudited)
Investments | | Principal Amount ($) | | Value ($) | |
Senior Loans (a) — 101.8% | |
Advertising — 2.0% | |
MH Sub I / Indigo / WebMD Health
(fka Micro holdings / Internet Brands),
2023 May Incremental Term Loan — First Lien
(SOFR 1 month + 4.25%), 9.59%, 5/3/2028 | | | 6,943,909 | | | | 6,945,332 | | |
New Insight Holdings Inc. (Research Now/
Dynata/Survey Sampling), DIP Term Loan — First Lien
(SOFR 1 month + 8.75%), 14.21%, 8/6/2024‡ | | | 374,482 | | | | 378,227 | | |
New Insight Holdings Inc. (Research Now/Dynata/
Survey Sampling), Initial Term Loan — First Lien
(SOFR 3 month + 5.50%, 1.00% Floor),
0.00%, 12/20/2024^ | | | 4,921,656 | | | | 3,733,618 | | |
WH Borrower, LLC (aka WHP Global),
2024-2 Term Loan — First Lien
(SOFR 3 month + 5.50%, 0.50% Floor),
10.82%, 2/15/2027‡ | | | 1,980,000 | | | | 1,955,250 | | |
WH Borrower, LLC (aka WHP Global),
Initial Term Loan — First Lien
(SOFR 3 month + 5.50%, 0.50% Floor),
10.82%, 2/15/2027 | | | 2,947,500 | | | | 2,911,585 | | |
| | | | 15,924,012 | | |
Aerospace & Defense — 1.2% | |
Chromalloy, Term Loan — First Lien
(SOFR 3 month + 3.75%), 9.06%, 3/27/2031 | | | 3,000,000 | | | | 3,012,750 | | |
HDT Holdco, Inc., Initial Term Loan — First Lien
(SOFR 3 month + 1.00%, 0.75% Floor),
11.44%, 7/8/2027 | | | 2,677,215 | | | | 1,669,913 | | |
MAG DS Corp., Initial Term Loan — First Lien
(SOFR 3 month + 5.50%, 1.00% Floor),
10.93%, 4/1/2027‡ (b)(c) | | | 1,972,926 | | | | 1,913,739 | | |
New Constellis Borrower LLC, Extended
Term B Loan — First Lien
(SOFR 3 month + 7.75%, 1.00% Floor),
13.33%, 9/27/2025 | | | 2,971,871 | | | | 2,879,000 | | |
| | | | 9,475,402 | | |
Agricultural & Farm Machinery — 0.1% | |
Hydrofarm Holdings Group, Inc., Term Loan — First Lien
(SOFR 1 month + 5.50%, 1.00% Floor),
10.96%, 10/25/2028‡ (b)(c) | | | 1,175,252 | | | | 969,583 | | |
First Eagle Credit Opportunities Fund | Semiannual Report | June 30, 2024
5
First Eagle Credit Opportunities Fund | Consolidated Schedule of Investments | June 30, 2024 (unaudited)
Investments | | Principal Amount ($) | | Value ($) | |
Air Freight & Logistics — 0.2% | |
LaserShip, Inc., Initial Term Loan — First Lien
(SOFR 3 month + 4.50%, 0.75% Floor),
10.10%, 5/7/2028 (d) | | | 1,903,745 | | | | 1,627,445 | | |
Airlines — 0.5% | |
AAdvantage Loyalty IP Ltd., Initial Term
Loan — First Lien
(SOFR 3 month + 4.75%,
0.75% Floor), 10.34%, 4/20/2028 | | | 4,000,000 | | | | 4,137,500 | | |
Alternative Carriers — 0.3% | |
Zayo Group Holdings, Inc., 2022 Incremental
Term Loan — First Lien (SOFR 1 month + 4.33%,
0.50% Floor), 9.67%, 3/9/2027 | | | 2,977,157 | | | | 2,633,861 | | |
Apparel Retail — 0.3% | |
Lids Holdings, Inc., Initial Term Loan — First Lien
(SOFR 3 month + 5.50%, 1.00% Floor),
10.99%, 12/14/2026‡ (b) | | | 2,108,952 | | | | 2,108,952 | | |
Apparel, Accessories & Luxury Goods — 1.5% | |
Outerstuff LLC, 2023 Extended Closing Date
Loan — First Lien
(SOFR 3 month + 8.50%,
2.50% Floor), 14.07%, 12/31/2027‡ | | | 7,823,337 | | | | 7,497,378 | | |
Rachel Zoe, Inc., Tranche A Loan — First Lien
(SOFR 3 month + 7.66%, 3.00% Floor),
12.97%, 10/9/2026‡ (b)(c)(e) | | | 1,150,815 | | | | 1,150,815 | | |
TR Apparel, LLC, Term Loan — First Lien
(SOFR 1 month + 9.00%, 2.00% Floor),
14.33%, 6/21/2027‡ (b)(c)(e) | | | 3,230,299 | | | | 3,230,299 | | |
| | | | 11,878,492 | | |
Application Software — 6.6% | |
Apex Analytix, Inc. (Montana Buyer, Inc.),
Initial Term Loan — First Lien
(SOFR 1 month + 5.75%, 0.75% Floor),
11.09%, 7/22/2029‡ (b)(e) | | | 2,661,957 | | | | 2,615,372 | | |
Apex Analytix, Inc. (Montana Buyer, Inc.),
Revolving Credit Loan — First Lien
(PRIME 3 month + 4.75%), 13.25%, 7/22/2028‡ (b)(e) | | | 17,391 | | | | 17,087 | | |
AppHub LLC, Delayed Draw Tem Loan — First Lien
(SOFR 6 month + 5.50%, 1.00% Floor),
10.97%, 9/29/2028‡ (b)(e) | | | 365,863 | | | | 365,863 | | |
First Eagle Credit Opportunities Fund | Semiannual Report | June 30, 2024
6
First Eagle Credit Opportunities Fund | Consolidated Schedule of Investments | June 30, 2024 (unaudited)
Investments | | Principal Amount ($) | | Value ($) | |
Application Software — 6.6% (continued) | |
AppHub LLC, Term Loan — First Lien
(SOFR 6 month + 5.50%, 1.00% Floor),
10.98%, 9/29/2028‡ (b)(c)(e) | | | 2,655,580 | | | | 2,655,580 | | |
AppLovin Corp., Initial Term Loan 2024 — First Lien
(SOFR 1 month + 2.50%, 0.50% Floor),
7.84%, 8/16/2030 | | | 4,985,000 | | | | 4,996,141 | | |
Apryse Software Corp. (PDFTron Systems Inc.),
2022-1 Incremental Term Loan — First Lien
(SOFR 3 month + 5.50%, 1.00% Floor),
10.83%, 7/15/2027‡ (b)(c)(e) | | | 3,421,250 | | | | 3,421,250 | | |
Apryse Software Corp. (PDFTron Systems Inc.),
2024-1 Incremental Term Loan — First Lien
(SOFR 3 month + 5.50%, 1.00% Floor),
10.83%, 7/15/2027‡ (b)(c)(e) | | | 1,820,948 | | | | 1,820,948 | | |
Apryse Software Corp. (PDFTron Systems Inc.),
Delayed Draw Term Loan — First Lien
(SOFR 3 month + 5.50%, 1.00% Floor),
10.83%, 7/15/2027‡ (b)(c)(e) | | | 353,516 | | | | 353,516 | | |
Apryse Software Corp. (PDFTron Systems Inc.),
Initial Term Loan — First Lien
(SOFR 3 month + 5.50%, 1.00% Floor),
10.83%, 7/15/2027‡ (b)(c)(e) | | | 1,091,361 | | | | 1,091,361 | | |
Boxer Parent Co., Inc. (BMC Software) (Banff Merger
Sub), 2028 Extended Dollar Term Loan — First Lien
(SOFR 1 month + 4.00%), 9.34%, 12/29/2028 | | | 2,983,595 | | | | 2,993,441 | | |
CMI Marketing, Inc. (AdThrive), Initial Term
Loan 2021 — First Lien
(SOFR 1 month + 4.25%), 9.71%, 3/23/2028 | | | 997,429 | | | | 980,598 | | |
EagleView Technology Corp., Term Loan — First Lien
(SOFR 3 month + 3.50%), 9.10%, 8/14/2025 (d) | | | 3,476,502 | | | | 3,357,710 | | |
Enverus Holdings, Inc., Initial Term Loan — First Lien
(SOFR 1 month + 5.50%, 0.75% Floor),
10.84%, 12/24/2029‡ (b) | | | 3,838,514 | | | | 3,848,110 | | |
Flexera Software LLC (fka Flexera Software, Inc.),
Term Loan — First Lien
(SOFR 3 month + 3.50%, 0.75% Floor), 8.83%, 3/3/2028 | | | 992,332 | | | | 997,293 | | |
Greeneden U.S. Holdings II, LLC (Genesys
Telecommunications Laboratories),
2024 Incremental No. 2 Dollar Term Loan — First Lien
(SOFR 1 month + 3.50%, 0.75% Floor), 8.84%, 12/1/2027 | | | 994,859 | | | | 1,000,723 | | |
First Eagle Credit Opportunities Fund | Semiannual Report | June 30, 2024
7
First Eagle Credit Opportunities Fund | Consolidated Schedule of Investments | June 30, 2024 (unaudited)
Investments | | Principal Amount ($) | | Value ($) | |
Application Software — 6.6% (continued) | |
Help/Systems Holdings, Inc. (Fortra),
Term Loan — First Lien
(SOFR 3 month + 4.00%, 0.75% Floor),
9.43%, 11/19/2026 | | | 992,228 | | | | 896,106 | | |
Instructure Holdings, Inc., Initial Term Loan — First Lien
(SOFR 3 month + 2.75%, 0.50% Floor),
8.35%, 10/30/2028 | | | 1,989,822 | | | | 1,991,066 | | |
Mitchell International, Inc., Initial Term Loan — First Lien
(SOFR 1 month + 3.25%), 8.58%, 6/17/2031 (d) | | | 4,100,000 | | | | 4,070,234 | | |
QuickBase Inc. (Quartz Holding Co.),
Term Loan — First Lien
(SOFR 3 month + 3.75%), 9.30%, 10/2/2028‡ (b) | | | 3,979,058 | | | | 3,981,604 | | |
Sapio Sciences, LLC (Jarvis Bidco),
Initial Term Loan — First Lien
(SOFR 1 month + 6.25%, 1.00% Floor),
11.69%, 11/17/2028‡ (b)(c)(e) | | | 3,262,813 | | | | 3,262,812 | | |
Sunshine Software Merger Sub Inc.
(Cornerstone OnDemand), Initial Term Loan — First Lien
(SOFR 1 month + 3.75%, 0.50% Floor),
9.21%, 10/16/2028 | | | 992,386 | | | | 939,457 | | |
TMA Buyer, LLC, Delayed Draw Term Loan — First Lien
(SOFR 1 month + 6.50%, 1.00% Floor),
11.94%, 9/30/2027‡ (b)(e) | | | 145,609 | | | | 136,144 | | |
TMA Buyer, LLC, Revolving Credit Loan — First Lien
(SOFR 1 month + 6.50%, 1.00% Floor),
11.93%, 9/30/2027‡ (b)(e) | | | 46,196 | | | | 43,193 | | |
TMA Buyer, LLC, Term Loan — First Lien
(SOFR 3 month + 6.50%, 1.00% Floor),
11.98%, 9/30/2027‡ (b)(c)(e) | | | 1,223,270 | | | | 1,143,758 | | |
Upland Software, Inc., Initial Term Loan — First Lien
(SOFR 1 month + 3.75%), 9.19%, 8/6/2026 | | | 4,021,006 | | | | 3,842,554 | | |
Veracode (Mitnick Corp., Purchaser Inc.),
Initial Term Loan — First Lien
(SOFR 3 month + 4.50%, 0.50% Floor), 9.93%, 5/2/2029 | | | 2,955,000 | | | | 2,757,015 | | |
| | | | 53,578,936 | | |
Asset Management & Custody Banks — 1.8% | |
Advisor Group Holdings Inc. (Osaic Holdings),
Term B-3 Loan — First Lien
(SOFR 1 month + 4.00%), 9.34%, 8/17/2028 | | | 2,992,500 | | | | 3,005,413 | | |
Apella Capital LLC, Initial Term Loan — First Lien
(PRIME 3 month + 5.50%, 1.00% Floor),
14.00%, 3/1/2029‡ (b)(c)(e) | | | 1,266,825 | | | | 1,243,072 | | |
First Eagle Credit Opportunities Fund | Semiannual Report | June 30, 2024
8
First Eagle Credit Opportunities Fund | Consolidated Schedule of Investments | June 30, 2024 (unaudited)
Investments | | Principal Amount ($) | | Value ($) | |
Asset Management & Custody Banks — 1.8% (continued) | |
Apella Capital LLC, Revolving Loan — First Lien
(SOFR 3 month + 6.50%, 1.00% Floor),
11.85%, 3/1/2029‡ (b)(e) | | | 250,000 | | | | 245,312 | | |
Modena Buyer LLC (End User Computing),
Term — First Lien 4/17/2031 (d) | | | 5,000,000 | | | | 4,886,725 | | |
Oak Point Partners, LLC, Term Loan — First Lien
(SOFR 1 month + 5.25%, 1.00% Floor),
10.69%, 12/1/2027‡ (b)(c)(e) | | | 2,501,281 | | | | 2,476,268 | | |
Orion Group Holdco, LLC, First Amendment
Incremental Delayed Draw Term Loan — First Lien
(SOFR 3 month + 6.00%, 1.00% Floor),
11.56%, 3/19/2027‡ (b)(c)(e) | | | 886,958 | | | | 886,958 | | |
Orion Group Holdco, LLC, First Amendment
Incremental Term Loan — First Lien
(SOFR 3 month + 6.00%, 1.00% Floor),
11.60%, 3/19/2027‡ (b)(c)(e) | | | 2,148,227 | | | | 2,148,227 | | |
| | | | 14,891,975 | | |
Auto Parts & Equipment — 2.2% | |
Enthusiast Auto Holdings, LLC (EAH-Intermediate
Holdco LLC), Third Amendment Term Loan — First Lien
(SOFR 1 month + 6.25%, 1.00% Floor),
11.68%, 12/19/2025‡ (b)(c)(e) | | | 1,408,664 | | | | 1,408,664 | | |
First Brands Group, LLC, Term Loan B — First Lien
(SOFR 3 month + 5.00%), 10.59%, 3/30/2027 | | | 1,262,960 | | | | 1,257,435 | | |
Hertz Corp., The, 2023 Incremental
Term Loan — First Lien
(SOFR 3 month + 3.75%), 9.10%, 6/30/2028 | | | 3,628,194 | | | | 3,299,716 | | |
Hertz Corp., The, Initial Term B Loan — First Lien
(SOFR 3 month + 3.25%), 8.86%, 6/30/2028 | | | 1,133,581 | | | | 1,028,469 | | |
Hertz Corp., The, Initial Term C Loan — First Lien
(SOFR 3 month + 3.25%), 8.86%, 6/30/2028 | | | 219,677 | | | | 199,308 | | |
Power Stop, LLC, Initial Term Loan — First Lien
(SOFR 3 month + 4.75%, 0.50% Floor),
10.20%, 1/26/2029 (d) | | | 11,163,122 | | | | 10,935,227 | | |
| | | | 18,128,819 | | |
Automotive Retail — 0.4% | |
BW Gas & Convenience Holdings, LLC (Yesway),
Initial Term Loan — First Lien
(SOFR 1 month + 3.50%), 8.96%, 3/31/2028‡ | | | 2,992,288 | | | | 2,996,028 | | |
First Eagle Credit Opportunities Fund | Semiannual Report | June 30, 2024
9
First Eagle Credit Opportunities Fund | Consolidated Schedule of Investments | June 30, 2024 (unaudited)
Investments | | Principal Amount ($) | | Value ($) | |
Brewers — 2.2% | |
City Brewing Co., LLC, First Lien Second Out
Term Loan — First Lien
(SOFR 3 month + 3.50%), 9.09%, 4/14/2028‡ | | | 8,516,856 | | | | 6,813,485 | | |
City Brewing Co., LLC, First-Out Closing Date
Exchanging Term Loan — First Lien
(SOFR 3 month + 3.50%, 0.75% Floor), 9.09%, 4/5/2028‡ | | | 8,258,040 | | | | 7,576,751 | | |
City Brewing Co., LLC, Term Loan — New
Money — First Lien
(SOFR 3 month + 6.25%), 11.58%, 4/5/2028‡ | | | 3,522,235 | | | | 3,575,069 | | |
| | | | 17,965,305 | | |
Broadcasting — 1.3% | |
A-L Parent LLC (Learfield), 2023
Term Loan — First Lien
(SOFR 1 month + 5.50%, 2.00% Floor),
10.84%, 6/30/2028 | | | 787,497 | | | | 793,647 | | |
Allen Media, LLC, Initial Term Loan 2021 — First Lien
(SOFR 3 month + 5.50%), 10.98%, 2/10/2027 | | | 1,954,074 | | | | 1,474,105 | | |
Terrier Media Buyer Inc. (Cox Media Group),
2021 Term B Loan — First Lien
(SOFR 3 month + 3.50%), 8.93%, 12/17/2026 | | | 9,948,454 | | | | 7,931,803 | | |
| | | | 10,199,555 | | |
Casinos & Gaming — 2.0% | |
Caesars Entertainment Inc., Incremental
Term B-1 Loan — First Lien
(SOFR 3 month + 2.75%), 8.10%, 2/6/2031 | | | 15,000,000 | | | | 15,030,448 | | |
Jack Ohio Finance (Jack Entertainment),
Initial Term Loan — First Lien
(SOFR 1 month + 4.75%, 0.75% Floor),
10.21%, 10/4/2028 | | | 981,233 | | | | 984,304 | | |
| | | | 16,014,752 | | |
Commercial Printing — 0.5% | |
Anthology / Blackboard (Astra AcquisitionCorp.;
BruinMergerCoInc.), Initial Purchased
Tranche A Term Loan — First Lien
(SOFR 1 month + 6.75%, 2.00% Floor),
12.06%, 2/25/2028 (c) | | | 906,888 | | | | 832,070 | | |
Anthology / Blackboard (Astra AcquisitionCorp.;
BruinMergerCoInc.), Initial Tranche B
Term Loan — First Lien
(SOFR 3 month + 5.25%, 2.00% Floor),
10.56%, 10/25/2028‡ (c) | | | 3,995,900 | | | | 1,478,483 | | |
First Eagle Credit Opportunities Fund | Semiannual Report | June 30, 2024
10
First Eagle Credit Opportunities Fund | Consolidated Schedule of Investments | June 30, 2024 (unaudited)
Investments | | Principal Amount ($) | | Value ($) | |
Commercial Printing — 0.5% (continued) | |
Anthology / Blackboard (Astra AcquisitionCorp.;
BruinMergerCoInc.), New Money Tranche A
Term Loan — First Lien
(SOFR 1 month + 6.75%, 2.00% Floor),
12.07%, 2/25/2028 (c) | | | 1,619,443 | | | | 1,485,839 | | |
| | | | 3,796,392 | | |
Commodity Chemicals — 0.6% | |
A&A Global Imports, LLC, First Out
Term Loan — First Lien
(SOFR 3 month + 6.50%, 1.00% Floor,
11.97% PIK), 11.97%, 6/1/2026‡ (b)(c)(e) | | | 896,104 | | | | 896,104 | | |
A&A Global Imports, LLC, Last Out
Term Loan — First Lien
(SOFR 3 month + 8.50%, 1.00% Floor, 13.97% PIK),
13.97%, 6/1/2026‡ (b)(c)(e) | | | 1,002,126 | | | | 100,213 | | |
A&A Global Imports, LLC, New
Revolving Loan — First Lien
(SOFR 1 month + 6.50%, 1.00% Floor),
11.94%, 6/1/2026‡ (b)(e) | | | 3,256 | | | | 3,256 | | |
(PRIME 1 month + 5.50%, 1.00% Floor),
14.00%, 6/1/2026‡ (b)(e) | | | 12,663 | | | | 12,663 | | |
Ineos US Finance LLC, 2031 Dollar
Term Loan — First Lien
(SOFR 1 month + 3.75%), 9.09%, 2/7/2031 | | | 1,000,000 | | | | 1,003,750 | | |
USALCO, LLC, Second Amendment
Term Loan — First Lien
(SOFR 3 month + 6.00%, 1.00% Floor),
11.60%, 10/19/2027‡ (b)(c)(e) | | | 201,718 | | | | 201,718 | | |
USALCO, LLC, Term Loan A — First Lien
(SOFR 3 month + 6.00%, 1.00% Floor),
11.57%, 10/19/2027‡ (b)(c)(e) | | | 2,925,000 | | | | 2,925,000 | | |
| | | | 5,142,704 | | |
Communications Equipment — 0.4% | |
SonicWALL Inc., Initial Term Loan — Second Lien
(SOFR 3 month + 7.50%), 12.98%, 5/18/2026 | | | 3,855,000 | | | | 3,580,331 | | |
Construction & Engineering — 0.8% | |
Amentum Government Services Holdings LLC
(AECOM Technology Corp.), Tranche 2
Term Loan — Second Lien
(SOFR 1 month + 7.50%, 0.75% Floor),
12.94%, 2/15/2030‡ | | | 1,867,696 | | | | 1,872,365 | | |
First Eagle Credit Opportunities Fund | Semiannual Report | June 30, 2024
11
First Eagle Credit Opportunities Fund | Consolidated Schedule of Investments | June 30, 2024 (unaudited)
Investments | | Principal Amount ($) | | Value ($) | |
Construction & Engineering — 0.8% (continued) | |
Amentum Government Services Holdings LLC
(AECOM Technology Corp.), Tranche 3
Term Loan — First Lien
(SOFR 1 month + 4.00%, 0.50% Floor),
9.34%, 2/15/2029 | | | 1,965,000 | | | | 1,976,053 | | |
RL James, Inc. (HH Restore Acquisition, Inc.),
Closing Date Term Loan — First Lien
(SOFR 1 month + 6.00%, 1.00% Floor),
11.44%, 12/15/2028‡ (b)(c)(e) | | | 954,110 | | | | 936,220 | | |
TriStrux, LLC, Delayed Draw Term Loan — First Lien
(SOFR 3 month + 6.00%, 1.00% Floor),
11.48%, 12/23/2026‡ (b)(c)(e) | | | 316,118 | | | | 271,861 | | |
TriStrux, LLC, Initial Term Loan — First Lien
(SOFR 3 month + 6.00%, 1.00% Floor),
11.46%, 12/23/2026‡ (b)(c)(e) | | | 903,409 | | | | 776,932 | | |
TriStrux, LLC, Revolving Loan — First Lien
(SOFR 3 month + 6.00%, 1.00% Floor),
11.45%, 12/23/2026‡ (b)(e) | | | 316,385 | | | | 272,091 | | |
| | | | 6,105,522 | | |
Construction Machinery & Heavy Trucks — 0.2% | |
AI Mistral Luxembourg Subco Sarl (V. Group), 2022
Extended Term B Loan — First Lien
(SOFR 1 month + 6.00%, 1.00% Floor),
11.34%, 9/30/2025‡ | | | 1,743,202 | | | | 1,817,288 | | |
Distributors — 1.0% | |
Highline Aftermarket Acquisition, LLC, Initial
Term Loan — First Lien
(SOFR 1 month + 4.50%, 0.75% Floor),
9.94%, 11/9/2027 | | | 928,187 | | | | 933,988 | | |
Project Castle, Inc. (Material Handling Systems Inc./
MHS/Deliver Buyer) , Initial Term Loan — First Lien
(SOFR 3 month + 5.50%, 0.50% Floor), 10.80%, 6/1/2029 | | | 7,979,695 | | | | 7,148,491 | | |
| | | | 8,082,479 | | |
Diversified Chemicals — 1.1% | |
Project Cloud Holdings, LLC (AgroFresh Inc.),
2024-1 Incremental Term Loan (USD) — First Lien
(SOFR 1 month + 6.25%, 1.00% Floor),
11.68%, 3/31/2029‡ (b)(e) | | | 2,928,667 | | | | 2,870,093 | | |
Project Cloud Holdings, LLC (AgroFresh Inc.),
Initial USD Term Loan Retired — First Lien
(SOFR 1 month + 6.25%, 1.00% Floor),
11.68%, 3/31/2029‡ (b)(c)(e) | | | 5,166,843 | | | | 5,063,507 | | |
First Eagle Credit Opportunities Fund | Semiannual Report | June 30, 2024
12
First Eagle Credit Opportunities Fund | Consolidated Schedule of Investments | June 30, 2024 (unaudited)
Investments | | Principal Amount ($) | | Value ($) | |
Diversified Chemicals — 1.1% (continued) | |
Project Cloud Holdings, LLC (AgroFresh Inc.),
Replacement Revolver — First Lien
(SOFR 1 month + 6.25%), 11.68%, 3/31/2029‡ (b)(e) | | | 568,869 | | | | 557,492 | | |
| | | | 8,491,092 | | |
Diversified Metals & Mining — 1.1% | |
Form Technologies (Dynacast), Last Out
Term Loan — First Lien
(SOFR 3 month + 9.25%, 1.00% Floor),
14.70%, 10/22/2025‡ (c) | | | 282,739 | | | | 208,991 | | |
Form Technologies (Dynacast),
Term B Loan — First Lien
(SOFR 3 month + 4.75%, 1.00% Floor),
10.20%, 7/22/2025 (c) | | | 321,797 | | | | 308,925 | | |
Mid-State Machine and Fabricating Corp.,
Revolver — First Lien
(SOFR 1 month + 5.50%, 1.00% Floor),
10.84%, 6/21/2029‡ (b)(e) | | | 333,333 | | | | 328,333 | | |
Mid-State Machine and Fabricating Corp.,
Term Loan — First Lien
(SOFR 1 month + 5.50%, 1.00% Floor),
10.84%, 6/21/2029‡ (b)(c)(e) | | | 8,333,333 | | | | 8,208,333 | | |
| | | | 9,054,582 | | |
Diversified Support Services — 0.5% | |
AMCP Clean Acquisition Co., LLC (PureStar),
Term Loan — First Lien
(SOFR 3 month + 5.00%, 0.50% Floor),
10.35%, 6/10/2028‡ (b)(c) | | | 4,433,333 | | | | 4,427,791 | | |
Education Services — 1.4% | |
Cengage Learning Acquisitions, Inc.,
Term Loan B — First Lien
(SOFR 6 month + 4.25%, 1.00% Floor),
9.54%, 3/15/2031 | | | 3,000,000 | | | | 3,012,195 | | |
Point Quest Acquisition, LLC, Initial
Term Loan — First Lien
(SOFR 3 month + 5.50%, 1.00% Floor),
10.99%, 8/14/2028‡ (b)(c)(e) | | | 7,565,489 | | | | 7,565,489 | | |
Point Quest Acquisition, LLC, Revolving
Credit Loan — First Lien
(SOFR 1 month + 5.50%, 1.00% Floor),
10.95%, 8/14/2028‡ (b)(e) | | | 576,669 | | | | 576,669 | | |
| | | | 11,154,353 | | |
First Eagle Credit Opportunities Fund | Semiannual Report | June 30, 2024
13
First Eagle Credit Opportunities Fund | Consolidated Schedule of Investments | June 30, 2024 (unaudited)
Investments | | Principal Amount ($) | | Value ($) | |
Electric Utilities — 0.2% | |
Granite Acquisition Inc. (Wheelabrator) (WIN Waste
Innovations Holdings), Initial Term Loan — First Lien
3/24/2028 (d) | | | 1,518,971 | | | | 1,418,248 | | |
Electrical Components & Equipment — 0.8% | |
Electrical Components International, Inc. (ECI),
Closing Date Term Loan — First Lien
(SOFR 1 month + 6.50%, 2.00% Floor),
11.83%, 5/10/2029‡ (b)(c)(e) | | | 6,033,333 | | | | 5,912,667 | | |
Electrical Components International, Inc. (ECI),
Delayed Draw Term Loan — First Lien
(SOFR 1 month + 6.50%, 2.00% Floor),
11.84%, 5/10/2029‡ (b)(e) | | | 286,667 | | | | 280,933 | | |
| | | | 6,193,600 | | |
Electronic Equipment & Instruments — 0.1% | |
VeriFone Systems, Inc., Initial Term Loan — First Lien
(SOFR 3 month + 4.00%), 9.60%, 8/20/2025 | | | 992,126 | | | | 816,167 | | |
Electronic Manufacturing Services — 1.3% | |
Creation Technologies Inc., Initial
Term Loan — First Lien
(SOFR 3 month + 5.75%, 0.50% Floor),
11.32%, 10/5/2028 | | | 4,974,619 | | | | 4,638,833 | | |
Natel Engineering Co., Inc., Initial
Term Loan — First Lien
(SOFR 1 month + 6.25%, 1.00% Floor),
11.71%, 4/30/2026 (c) | | | 6,839,851 | | | | 6,032,748 | | |
| | | | 10,671,581 | | |
Environmental & Facilities Services — 0.8% | |
EnergySolutions (Energy Capital Partners),
Initial Term Loan — First Lien
(SOFR 1 month + 3.75%), 9.09%, 9/20/2030 | | | 2,930,663 | | | | 2,957,229 | | |
SR Landscaping, LLC, Closing Date
Term Loan — First Lien
(SOFR 1 month + 6.00%, 1.00% Floor),
11.43%, 10/30/2029‡ (b)(c)(e) | | | 2,688,477 | | | | 2,661,592 | | |
SR Landscaping, LLC, Delayed Draw
Term Loan — First Lien
(SOFR 1 month + 6.00%, 1.00% Floor),
11.44%, 10/30/2029‡ (b)(e) | | | 477,125 | | | | 472,353 | | |
First Eagle Credit Opportunities Fund | Semiannual Report | June 30, 2024
14
First Eagle Credit Opportunities Fund | Consolidated Schedule of Investments | June 30, 2024 (unaudited)
Investments | | Principal Amount ($) | | Value ($) | |
Environmental & Facilities Services — 0.8% (continued) | |
SR Landscaping, LLC, Revolving Loan — First Lien
(SOFR 1 month + 6.00%, 1.00% Floor),
11.43%, 10/30/2029‡ (b)(e) | | | 44,511 | | | | 44,066 | | |
| | | | 6,135,240 | | |
Financial Exchanges & Data — 0.6% | |
Priority Holdings LLC, PRTH
Term Loan B USD — First Lien
(SOFR 1 month + 4.75%), 10.08%, 4/24/2029 | | | 4,814,563 | | | | 4,822,098 | | |
Footwear — 0.1% | |
SHO Holding I Corp., New Money
Delayed Draw DIP — First Lien
(SOFR 1 month + 8.00%, 1.00% Floor),
13.44%, 1/12/2031‡ (b) | | | 542,943 | | | | 518,511 | | |
Health Care Equipment — 0.7% | |
Carestream Dental Equipment Inc.,
Initial Term Loan — First Lien
(ICE LIBOR USD 1 month + 3.25%, 1.00% Floor),
8.71%, 9/1/2024 | | | 5,956,572 | | | | 5,182,218 | | |
Carestream Dental Equipment Inc., Tranche B
Term Loan — First Lien
(SOFR 3 month + 4.50%, 0.50% Floor),
10.07%, 9/1/2024 | | | 965,823 | | | | 804,048 | | |
| | | | 5,986,266 | | |
Health Care Facilities — 2.1% | |
ConvenientMD (CMD Intermediate Holdings, Inc.),
2024 Extended Term Loan — First Lien
(SOFR 3 month + 5.00%, 1.00% Floor),
10.49%, 6/8/2029‡ (b)(c)(e) | | | 1,802,631 | | | | 1,748,552 | | |
Crisis Prevention Institute Inc.,
Initial Term Loan — First Lien
(SOFR 3 month + 4.75%, 0.50% Floor),
10.08%, 4/9/2031 | | | 2,000,000 | | | | 2,008,330 | | |
Quorum Health Resources (QHR), 2023
Incremental Term Loan — First Lien
(SOFR 1 month + 5.25%),
10.69%, 5/28/2027‡ (b)(c)(e) | | | 1,980,000 | | | | 1,930,500 | | |
Quorum Health Resources (QHR), Specified
Delayed Draw Term Loan — First Lien
(SOFR 6 month + 5.25%), 10.68%, 5/28/2027‡ (b)(c)(e) | | | 1,980,000 | | | | 1,930,500 | | |
First Eagle Credit Opportunities Fund | Semiannual Report | June 30, 2024
15
First Eagle Credit Opportunities Fund | Consolidated Schedule of Investments | June 30, 2024 (unaudited)
Investments | | Principal Amount ($) | | Value ($) | |
Health Care Facilities — 2.1% (continued) | |
Quorum Health Resources (QHR),
Term Loan — First Lien
(SOFR 6 month + 5.25%, 1.00% Floor),
10.79%, 5/28/2027‡ (b)(c)(e) | | | 1,046,292 | | | | 1,020,135 | | |
RegionalCare Hospital Partners Holdings Inc.
(Lifepoint Health), Term Loan B — First Lien
(SOFR 3 month + 4.00%), 9.33%, 5/9/2031 | | | 3,362,530 | | | | 3,371,474 | | |
RegionalCare Hospital Partners Holdings Inc.
(Lifepoint Health), 2024 Refinancing
Term Loan — First Lien
(SOFR 3 month + 4.75%), 10.06%, 11/16/2028 | | | 4,987,500 | | | | 5,020,866 | | |
| | | | 17,030,357 | | |
Health Care Services — 16.1% | |
Anne Arundel Dermatology Management, LLC,
DDTL A — First Lien
(SOFR 3 month + 2.75%, 1.00% Floor,
4.25% PIK), 12.48%, 10/16/2025‡ (b)(c)(e) | | | 116,824 | | | | 105,142 | | |
Anne Arundel Dermatology Management, LLC,
DDTL B — First Lien
(SOFR 3 month + 2.75%, 1.00% Floor,
4.25% PIK), 12.48%, 10/16/2025‡ (b)(c)(e) | | | 197,886 | | | | 178,097 | | |
Anne Arundel Dermatology Management, LLC,
DDTL C — First Lien
(SOFR 3 month + 2.75%, 1.00% Floor,
4.25% PIK), 12.48%, 10/16/2025‡ (b)(e) | | | 557,254 | | | | 501,331 | | |
Anne Arundel Dermatology Management, LLC,
Restatement Date Term Loan — First Lien
(SOFR 3 month + 2.75%, 1.00% Floor,
4.25% PIK), 12.48%, 10/16/2025‡ (b)(c)(e) | | | 1,927,840 | | | | 1,735,056 | | |
Aspen Dental Management Inc. (aka: ADMI Corp.),
Amendment No.10 Extended Term Loan — First Lien
(SOFR 1 month + 5.75%), 11.09%, 12/23/2027 | | | 2,985,000 | | | | 3,009,865 | | |
BCDI BHI Intermediate 2, LP (Basic Home Infusion),
Delayed Draw Term Loan — First Lien
(SOFR 3 month + 5.75%, 1.00% Floor),
11.25%, 9/29/2028‡ (b)(c)(e) | | | 1,222,271 | | | | 1,216,160 | | |
BCDI BHI Intermediate 2, LP (Basic Home Infusion),
Initial Term Loan — First Lien
(SOFR 3 month + 5.75%, 1.00% Floor),
11.23%, 9/29/2028‡ (b)(c)(e) | | | 2,899,432 | | | | 2,884,935 | | |
First Eagle Credit Opportunities Fund | Semiannual Report | June 30, 2024
16
First Eagle Credit Opportunities Fund | Consolidated Schedule of Investments | June 30, 2024 (unaudited)
Investments | | Principal Amount ($) | | Value ($) | |
Health Care Services — 16.1% (continued) | |
BCDI BHI Intermediate 2, LP (Basic Home Infusion),
Revolving Credit Loan — First Lien
(SOFR 3 month + 5.75%, 1.00% Floor),
11.23%, 9/29/2028‡ (b)(e) | | | 331,251 | | | | 329,594 | | |
Boston Clinical Trials LLC (Alcanza Clinical Research),
Fourth Amendment Delayed Draw
Term Loan — First Lien
(SOFR 3 month + 5.50%, 1.00% Floor),
11.00%, 12/20/2027‡ (b)(e) | | | 906,977 | | | | 897,907 | | |
Boston Clinical Trials LLC (Alcanza Clinical Research),
Fourth Amendment Term Loan — First Lien
(SOFR 3 month + 5.50%, 1.00% Floor),
10.98%, 12/20/2027‡ (b)(c)(e) | | | 2,093,023 | | | | 2,072,093 | | |
Boston Clinical Trials LLC (Alcanza Clinical Research),
Initial Term Loan — First Lien
(SOFR 3 month + 6.00%, 1.00% Floor),
11.48%, 12/20/2027‡ (b)(c)(e) | | | 4,718,153 | | | | 4,694,562 | | |
Boston Clinical Trials LLC (Alcanza Clinical Research),
Revolving Credit Loan — First Lien
(SOFR 3 month + 6.00%, 1.00% Floor),
11.49%, 12/20/2027‡ (b)(e) | | | 187,500 | | | | 186,562 | | |
CC Amulet Management, LLC (Children's Choice),
Delayed Draw Term Loan — First Lien
(SOFR 3 month + 6.50%, 1.00% Floor),
12.09%, 8/31/2027‡ (b)(e) | | | 96,856 | | | | 96,856 | | |
CC Amulet Management, LLC (Children's Choice),
Revolving Loan — First Lien
(SOFR 3 month + 5.25%, 1.00% Floor),
10.84%, 8/31/2026‡ (b)(e) | | | 44,099 | | | | 43,879 | | |
CC Amulet Management, LLC (Children's Choice),
Term Loan — First Lien
(SOFR 3 month + 5.25%, 1.00% Floor),
10.84%, 8/31/2027‡ (b)(c)(e) | | | 1,666,822 | | | | 1,658,488 | | |
Civitas Solutions Inc. (National Mentor Holding),
Initial Term C Loan — First Lien 3/2/2028 (d) | | | 134,248 | | | | 127,049 | | |
Civitas Solutions Inc. (National Mentor Holding),
Initial Term Loan — First Lien 3/2/2028 (d) | | | 4,657,661 | | | | 4,407,894 | | |
Civitas Solutions Inc. (National Mentor Holding),
Initial Term Loan — Second Lien
(SOFR 3 month + 7.25%, 0.75% Floor),
12.68%, 3/2/2029 | | | 9,386,585 | | | | 8,457,313 | | |
First Eagle Credit Opportunities Fund | Semiannual Report | June 30, 2024
17
First Eagle Credit Opportunities Fund | Consolidated Schedule of Investments | June 30, 2024 (unaudited)
Investments | | Principal Amount ($) | | Value ($) | |
Health Care Services — 16.1% (continued) | |
Community Based Care Acquisition, Inc.,
Delayed Draw Tranche A Term Loan — First Lien
(SOFR 3 month + 5.25%, 1.00% Floor),
10.68%, 9/16/2027‡ (b)(c)(e) | | | 894,309 | | | | 894,309 | | |
Community Based Care Acquisition, Inc.,
Delayed Draw Tranche B Term Loan — First Lien
(SOFR 3 month + 5.50%, 1.00% Floor),
10.93%, 9/30/2027‡ (b)(e) | | | 939,394 | | | | 939,394 | | |
Community Based Care Acquisition, Inc.,
Initial Term Loan — First Lien
(SOFR 3 month + 5.25%, 1.00% Floor),
10.68%, 9/16/2027‡ (b)(c)(e) | | | 2,205,915 | | | | 2,205,915 | | |
Community Based Care Acquisition, Inc.,
Revolving Credit Loan — First Lien
(PRIME 3 month + 4.25%, 1.00% Floor),
12.75%, 9/16/2027‡ (b)(e) | | | 43,903 | | | | 43,902 | | |
Dermatology Intermediate Holdings III, Inc.
(Forefront), Term B-1 Loan — First Lien
(SOFR 3 month + 5.50%, 0.50% Floor),
10.83%, 3/30/2029 (d) | | | 5,486,250 | | | | 5,422,225 | | |
Elevate HD Parent, Inc., Delayed Draw
Term Loan A — First Lien
(SOFR 1 month + 6.00%, 1.00% Floor),
11.44%, 8/20/2029‡ (b)(e) | | | 74,750 | | | | 74,003 | | |
Elevate HD Parent, Inc., Initial Term Loan — First Lien
(SOFR 1 month + 6.00%, 1.00% Floor),
11.44%, 8/20/2029‡ (b)(c)(e) | | | 3,225,625 | | | | 3,193,369 | | |
Elevate HD Parent, Inc., Revolving Loan — First Lien
(SOFR 1 month + 6.10%, 1.00% Floor),
11.44%, 8/20/2029‡ (b)(e) | | | 65,000 | | | | 64,350 | | |
Endo1 Partners, LLC, Seventh
Amendment DDTL — First Lien
(SOFR 1 month + 5.25%, 1.00% Floor),
10.84%, 3/24/2026‡ (b)(c)(e) | | | 7,942,857 | | | | 7,883,286 | | |
Endo1 Partners, LLC, Third
Amendment DDTL — First Lien
(SOFR 1 month + 5.25%, 1.00% Floor),
10.84%, 3/24/2026‡ (b)(c)(e) | | | 1,820,631 | | | | 1,806,976 | | |
Epic Staffing Group (Cirrus/Tempus/Explorer
Investor), Initial Term Loan — First Lien
(SOFR 1 month + 6.00%, 0.50% Floor),
11.34%, 6/28/2029‡ (b) | | | 4,914,531 | | | | 4,791,668 | | |
First Eagle Credit Opportunities Fund | Semiannual Report | June 30, 2024
18
First Eagle Credit Opportunities Fund | Consolidated Schedule of Investments | June 30, 2024 (unaudited)
Investments | | Principal Amount ($) | | Value ($) | |
Health Care Services — 16.1% (continued) | |
First Steps Recovery Acquisition, LLC (True North
Detox), Term Loan — First Lien
(SOFR 1 month + 6.25%, 1.00% Floor),
11.59%, 3/29/2030‡ (b)(c)(e) | | | 3,113,818 | | | | 3,067,110 | | |
Gen4 Dental Partners Opco, LLC,
Initial Term Loan — First Lien
(SOFR 3 month + 5.50%, 1.00% Floor),
10.82%, 5/13/2030‡ (b)(c)(e) | | | 5,500,000 | | | | 5,390,000 | | |
Grifols Worldwide Operations USA, Inc., Dollar
Tranche B Term Loan — First Lien
(SOFR 1 month + 2.00%), 7.44%, 11/15/2027 | | | 1,796,197 | | | | 1,769,254 | | |
Houseworks Holdings, Fourth Amendment
Term Loan — First Lien
(SOFR 6 month + 5.25%, 1.00% Floor),
10.55%, 12/15/2028‡ (b)(c)(e) | | | 2,649,964 | | | | 2,596,965 | | |
Houseworks Holdings, Revolving Loan — First Lien
(SOFR 3 month + 6.50%, 1.00% Floor),
6.50%, 12/15/2028‡ (b)(e) | | | 18,800 | | | | 18,800 | | |
Houseworks Holdings, Third Amendment
Term Loan — First Lien
(SOFR 3 month + 6.50%), 12.00%, 12/15/2028‡ (b)(c)(e) | | | 1,679,041 | | | | 1,679,041 | | |
In Vitro Sciences, LLC (New IVS Holdings, LLC),
Closing Date Term Loan — First Lien
(SOFR 1 month + 6.00%, 1.00% Floor),
11.46%, 2/28/2029‡ (b)(c)(e) | | | 4,393,352 | | | | 4,327,451 | | |
In Vitro Sciences, LLC (New IVS Holdings, LLC),
Delayed Draw Term Loan — First Lien
(SOFR 1 month + 6.00%, 1.00% Floor),
11.46%, 2/28/2029‡ (b)(e) | | | 1,122,400 | | | | 1,105,564 | | |
IPM MSO Management, LLC, Closing Date
Term Loan — First Lien
(SOFR 3 month + 6.50%, 1.00% Floor),
11.95%, 6/17/2026‡ (b)(c)(e) | | | 800,569 | | | | 788,560 | | |
IPM MSO Management, LLC, Delayed Draw
Term Loan — First Lien
(SOFR 3 month + 6.50%, 1.00% Floor),
11.95%, 6/17/2026‡ (b)(c)(e) | | | 96,081 | | | | 94,640 | | |
IPM MSO Management, LLC, Second Amendment
Term Loan — First Lien
(SOFR 3 month + 6.50%), 11.95%, 6/17/2026‡ (b)(c)(e) | | | 220,073 | | | | 216,772 | | |
First Eagle Credit Opportunities Fund | Semiannual Report | June 30, 2024
19
First Eagle Credit Opportunities Fund | Consolidated Schedule of Investments | June 30, 2024 (unaudited)
Investments | | Principal Amount ($) | | Value ($) | |
Health Care Services — 16.1% (continued) | |
Life Northwestern Pennsylvania, LLC (FFL Pace
Buyer, Inc.), Delayed Draw Term Loan — First Lien
(SOFR 1 month + 5.75%, 1.00% Floor),
11.18%, 12/6/2027‡ (b)(c)(e) | | | 576,759 | | | | 563,782 | | |
Life Northwestern Pennsylvania, LLC (FFL Pace
Buyer, Inc.), Initial Term Loan — First Lien
(SOFR 1 month + 5.75%, 1.00% Floor),
11.18%, 12/6/2027‡ (b)(c)(e) | | | 1,721,250 | | | | 1,682,522 | | |
Life Northwestern Pennsylvania, LLC (FFL Pace
Buyer, Inc.), Revolving Loan — First Lien
(SOFR 1 month + 5.75%, 1.00% Floor),
11.18%, 12/6/2027‡ (b)(e) | | | 219,578 | | | | 214,638 | | |
LMSI Buyer, LLC, Initial Term Loan — First Lien
(SOFR 3 month + 5.75%, 1.00% Floor),
11.23%, 10/25/2027‡ (b)(c)(e) | | | 2,150,159 | | | | 1,935,143 | | |
LMSI Buyer, LLC, Revolving Credit Loan — First Lien
(SOFR 3 month + 5.75%, 1.00% Floor),
11.23%, 10/25/2027‡ (b)(e) | | | 334,728 | | | | 301,255 | | |
Medrina, LLC, Initial Term Loan — First Lien
(SOFR 3 month + 6.25%, 1.00% Floor),
11.55%, 10/20/2029‡ (b)(c)(e) | | | 5,479,417 | | | | 5,424,623 | | |
Midwest Physician Administrative Services, LLC
(ACOF V DP Acquiror LLC aka Dupage Medical Group),
Initial Term Loan — First Lien
(SOFR 3 month + 3.25%), 8.85%, 3/12/2028 (d) | | | 4,987,113 | | | | 4,382,426 | | |
Monarch Behavioral Therapy, LLC,
Term Loan — First Lien
(SOFR 3 month + 5.00%, 1.00% Floor),
10.33%, 6/6/2030‡ (b)(c)(e) | | | 9,668,583 | | | | 9,523,554 | | |
NAPA Management Services Corp., Initial
Term Loan — First Lien
(SOFR 1 month + 5.25%, 0.75% Floor),
10.69%, 2/23/2029 (c)(d) | | | 1,775,026 | | | | 1,703,102 | | |
NSM Top Holdings Corp. (National Seating &
Mobility Inc.), Initial Term Loan — First Lien
(SOFR 3 month + 5.25%), 10.66%, 11/16/2026 | | | 3,923,182 | | | | 3,933,009 | | |
Phoenix Guarantor (BrightSpring Health),
Tranche B-4 Term Loan — First Lien
(SOFR 1 month + 3.25%), 8.59%, 2/21/2031 | | | 4,987,500 | | | | 4,980,667 | | |
Physician Partners, LLC, Second Amendment
Incremental Term Loan — First Lien
(SOFR 6 month + 5.50%), 10.81%, 12/22/2028‡ | | | 1,990,000 | | | | 1,502,450 | | |
First Eagle Credit Opportunities Fund | Semiannual Report | June 30, 2024
20
First Eagle Credit Opportunities Fund | Consolidated Schedule of Investments | June 30, 2024 (unaudited)
Investments | | Principal Amount ($) | | Value ($) | |
Health Care Services — 16.1% (continued) | |
Visante Acquisition, LLC, Initial Term Loan — First Lien
(SOFR 3 month + 5.75%, 1.00% Floor),
11.08%, 1/31/2030‡ (b)(c)(e) | | | 4,964,587 | | | | 4,890,118 | | |
Women's Care Holdings, Inc.,
Initial Term Loan — First Lien
(SOFR 3 month + 4.50%, 0.75% Floor), 9.93%, 1/15/2028 | | | 2,646,002 | | | | 2,466,074 | | |
Women's Care Holdings, Inc., Initial
Term Loan — Second Lien
(SOFR 3 month + 8.25%, 0.75% Floor),
13.68%, 1/12/2029‡ (c) | | | 5,701,232 | | | | 4,879,314 | | |
| | | | 129,359,014 | | |
Health Care Supplies — 1.0% | |
Journey Personal Care (Domtar Corp.), Initial
Term Loan — First Lien
(SOFR 1 month + 4.25%, 0.75% Floor),
9.69%, 3/1/2028 | | | 5,000,000 | | | | 4,992,500 | | |
LifeScan Global Corp., Term Loan — First Lien
(SOFR 3 month + 6.50%, 1.00% Floor),
11.93%, 12/30/2026 (c) | | | 5,877,278 | | | | 2,825,972 | | |
| | | | 7,818,472 | | |
Health Care Technology — 2.6% | |
AG Parent Holdings LLC (ArisGlobal), Initial
Term Loan — First Lien
(SOFR 3 month + 5.00%), 10.60%, 7/31/2026 (c) | | | 5,855,198 | | | | 5,381,923 | | |
Athenahealth Group Inc., Initial Term Loan — First Lien
(SOFR 1 month + 3.25%, 0.50% Floor), 8.59%, 2/15/2029 | | | 992,405 | | | | 990,390 | | |
CT Technologies Intermediate Holdings, Inc.
(HealthPort), 2021 Term Loan — First Lien
(SOFR 1 month + 4.25%, 0.75% Floor),
9.71%, 12/16/2025 | | | 3,437,949 | | | | 3,446,544 | | |
Greenway Health, LLC (fka Vitera Healthcare
Solutions, LLC), Term Loan — First Lien
(SOFR 6 month + 6.75%), 12.01%, 4/1/2029‡ (b)(c)(e) | | | 7,079,032 | | | | 7,025,939 | | |
nThrive, Inc. (fka Precyse Acquisition Corp.),
Initial Loan — Second Lien
(SOFR 1 month + 6.75%, 0.50% Floor),
12.21%, 12/17/2029 | | | 2,000,000 | | | | 1,383,340 | | |
RMBUS Holdco Inc. (Eclat Health Solutions Inc.),
Initial Term Loan — First Lien
(SOFR 6 month + 6.50%, 1.00% Floor),
11.68%, 1/8/2029‡ (b)(c)(e) | | | 2,815,524 | | | | 2,768,012 | | |
| | | | 20,996,148 | | |
First Eagle Credit Opportunities Fund | Semiannual Report | June 30, 2024
21
First Eagle Credit Opportunities Fund | Consolidated Schedule of Investments | June 30, 2024 (unaudited)
Investments | | Principal Amount ($) | | Value ($) | |
Heavy Electrical Equipment — 0.1% | |
Arcline FM Holding, LLC (Fairbanks), Initial
Term Loan — First Lien
(SOFR 3 month + 4.75%), 10.35%, 6/23/2028 | | | 994,885 | | | | 999,004 | | |
Highways & Railtracks — 0.4% | |
Patriot Rail Co., LLC (NA Rail), Tranche B-2
Term Loan — First Lien
(SOFR 3 month + 4.00%, 0.25% Floor),
9.60%, 10/19/2026‡ (b)(c) | | | 2,976,681 | | | | 2,978,542 | | |
Home Furnishings — 0.4% | |
Dorel Industries Inc., First Out Term Loan — First Lien
(SOFR 1 month + 8.30%, 2.00% Floor),
13.63%, 12/8/2026‡ (b)(e) | | | 2,961,107 | | | | 2,961,107 | | |
Home Improvement Retail — 0.4% | |
Air Conditioning Specialist, Inc.,
Revolving Loan — First Lien
(SOFR 3 month + 7.25%, 1.00% Floor),
12.81%, 11/9/2026‡ (b)(e) | | | 84,926 | | | | 84,289 | | |
Air Conditioning Specialist, Inc., Term Loan — First Lien
(SOFR 3 month + 7.25%, 1.00% Floor),
12.82%, 11/9/2026‡ (b)(c)(e) | | | 3,133,574 | | | | 3,110,072 | | |
| | | | 3,194,361 | | |
Hotels, Resorts & Cruise Lines — 0.9% | |
Stats, LLC (Peak Jersey Holdco Ltd.),
Term Loan — First Lien
(SOFR 3 month + 5.25%), 10.84%, 7/10/2026 (c) | | | 7,148,295 | | | | 7,005,329 | | |
| | | | 7,005,329 | | |
Household Products — 0.2% | |
Lash Opco LLC, Initial Term Loan — First Lien
(SOFR 3 month + 2.65%, 1.00% Floor,
5.10% PIK), 13.18%, 3/18/2026‡ (b)(c)(e) | | | 1,933,312 | | | | 1,822,496 | | |
Human Resource & Employment Services — 1.3% | |
Danforth Global, Inc., First Amendment
Additional Term Loan — First Lien
(SOFR 3 month + 5.25%, 1.00% Floor),
10.60%, 12/9/2027‡ (b)(c)(e) | | | 971,797 | | | | 957,220 | | |
Danforth Global, Inc., Initial Term Loan — First Lien
(SOFR 3 month + 5.25%, 1.00% Floor),
10.71%, 12/9/2027‡ (b)(c)(e) | | | 1,232,437 | | | | 1,213,950 | | |
Danforth Global, Inc., Revolving Credit Loan — First Lien
(SOFR 1 month + 5.25%, 1.00% Floor),
10.58%, 12/9/2027‡ (b)(e) | | | 83,333 | | | | 82,083 | | |
First Eagle Credit Opportunities Fund | Semiannual Report | June 30, 2024
22
First Eagle Credit Opportunities Fund | Consolidated Schedule of Investments | June 30, 2024 (unaudited)
Investments | | Principal Amount ($) | | Value ($) | |
Human Resource & Employment Services — 1.3% (continued) | |
Danforth Global, Inc., Second Amendment Incremental
Term Loan — First Lien
(SOFR 3 month + 5.25%, 1.00% Floor),
10.58%, 12/9/2027‡ (b)(c)(e) | | | 7,282,649 | | | | 7,173,410 | | |
Triple Crown Consulting, Term A Loan — First Lien
(SOFR 1 month + 6.75%, 1.50% Floor),
12.19%, 6/2/2028‡ (b)(c)(e) | | | 1,469,203 | | | | 1,333,302 | | |
| | | | 10,759,965 | | |
Industrial Machinery — 2.9% | |
Filtration Group Corp., 2021 Incremental
Term Loan — First Lien
(SOFR 1 month + 3.50%, 0.50% Floor),
8.96%, 10/21/2028 (b) | | | 2,574,000 | | | | 2,588,479 | | |
Kenan Advantage Group, Inc., The, U.S.
Term B-3 Loan — First Lien
(SOFR 1 month + 3.75%), 9.09%, 1/25/2029 (c) | | | 4,987,500 | | | | 5,018,672 | | |
SPX Flow Inc., Term Loan — First Lien
(SOFR 1 month + 3.50%), 8.84%, 4/5/2029 | | | 8,004,241 | | | | 8,059,630 | | |
WasteQuip, Inc. (Patriot Container), Closing Date
Term Loan — First Lien
(SOFR 1 month + 3.75%, 1.00% Floor),
9.19%, 3/20/2025 | | | 7,915,567 | | | | 7,730,422 | | |
| | | | 23,397,203 | | |
Insurance Brokers — 3.0% | |
Acrisure, LLC, Term Loan B6 USD — First Lien
11/6/2030 (d) | | | 5,000,000 | | | | 5,000,025 | | |
Amynta Agency Borrower Inc. (Amynta Warranty
Borrower Inc.), MAYAGE Term Loan B USD — First Lien
2/28/2028 (d) | | | 2,000,000 | | | | 2,007,320 | | |
Newcleus, LLC, Initial Term Loan — First Lien
(SOFR 3 month + 6.00%, 1.00% Floor,
2.00% PIK), 13.48%, 8/2/2026‡ (b)(c)(e) | | | 1,212,797 | | | | 1,115,571 | | |
Portfolio Holding, Inc. (Turbo Buyer / PGM),
Amendment No. 3 Incremental Term Loan — First Lien
(SOFR 3 month + 6.00%, 1.00% Floor),
11.48%, 12/2/2025‡ (b)(c)(e) | | | 1,940,000 | | | | 1,862,400 | | |
Portfolio Holding, Inc. (Turbo Buyer / PGM),
Amendment No. 4 Incremental Delayed Draw
Term Loan — First Lien
(SOFR 3 month + 6.00%, 1.00% Floor),
11.48%, 12/2/2025‡ (b)(c)(e) | | | 762,590 | | | | 732,087 | | |
First Eagle Credit Opportunities Fund | Semiannual Report | June 30, 2024
23
First Eagle Credit Opportunities Fund | Consolidated Schedule of Investments | June 30, 2024 (unaudited)
Investments | | Principal Amount ($) | | Value ($) | |
Insurance Brokers — 3.0% (continued) | |
Portfolio Holding, Inc. (Turbo Buyer / PGM),
Amendment No. 4 Incremental Term Loan — First Lien
(SOFR 3 month + 6.00%, 1.00% Floor),
11.48%, 12/2/2025‡ (b)(c)(e) | | | 1,141,193 | | | | 1,095,545 | | |
The Mutual Group, LLC, Term Loan — First Lien
(SOFR 3 month + 5.50%, 1.00% Floor),
11.08%, 1/31/2030‡ (b)(c)(e) | | | 4,857,955 | | | | 4,785,085 | | |
Tricor, LLC, Amendment No 3 Incremental
Term Loan — First Lien
(SOFR 1 month + 5.00%, 1.00% Floor),
10.44%, 10/22/2026‡ (c)(e) | | | 1,827,000 | | | | 1,799,595 | | |
Tricor, LLC, Delayed Draw Term Loan — First Lien
(SOFR 3 month + 5.00%, 1.00% Floor),
10.46%, 10/22/2026‡ (b)(c)(e) | | | 717,519 | | | | 713,931 | | |
Tricor, LLC, Revolving Loan — First Lien
(SOFR 3 month + 5.00%, 1.00% Floor),
10.45%, 10/22/2026‡ (b)(e) | | | 128,077 | | | | 127,437 | | |
Tricor, LLC, Term Loan — First Lien
(SOFR 1 month + 5.00%, 1.00% Floor),
10.44%, 10/22/2026‡ (b)(c)(e) | | | 1,909,753 | | | | 1,900,204 | | |
Truist Insurance Holdings, LLC, Initial
Term Loan — First Lien
(SOFR 3 month + 3.25%), 8.59%, 5/6/2031 | | | 3,000,000 | | | | 3,010,170 | | |
| | | | 24,149,370 | | |
Integrated Telecommunication Services — 0.8% | |
Altice France SA (Numericable), USD Term
Loan B-[14] Loan — First Lien
(SOFR 3 month + 5.50%), 10.83%, 8/15/2028 | | | 4,987,406 | | | | 3,678,212 | | |
NEP Group, Inc., Extended Initial Dollar
Term Loan — First Lien 8/19/2026 (d) | | | 2,995,755 | | | | 2,848,453 | | |
| | | | 6,526,665 | | |
Interactive Media & Services — 0.6% | |
Ingenio LLC, First Amendment Term Loan — First Lien
(SOFR 3 month + 7.00%, 1.00% Floor),
12.50%, 8/3/2026‡ (b)(c)(e) | | | 3,893,273 | | | | 3,873,806 | | |
Ingenio LLC, Term Loan — First Lien
(SOFR 3 month + 7.00%, 1.00% Floor),
12.50%, 8/3/2026‡ (b)(c)(e) | | | 1,255,699 | | | | 1,249,421 | | |
| | | | 5,123,227 | | |
First Eagle Credit Opportunities Fund | Semiannual Report | June 30, 2024
24
First Eagle Credit Opportunities Fund | Consolidated Schedule of Investments | June 30, 2024 (unaudited)
Investments | | Principal Amount ($) | | Value ($) | |
Internet & Direct Marketing Retail — 1.3% | |
Everlane, Inc., Term Loan — First Lien
(SOFR 1 month + 6.50%, 1.00% Floor),
11.83%, 3/31/2025‡ (b)(e) | | | 3,750,000 | | | | 3,750,000 | | |
Kobra International, Ltd. (d/b/a Nicole Miller),
Term Loan — First Lien
(SOFR 1 month + 6.75%, 1.00% Floor),
12.08%, 5/17/2025‡ (b)(e) | | | 4,448,118 | | | | 4,448,118 | | |
Sweetwater Borrower LLC, Initial
Term Loan — First Lien
(SOFR 1 month + 4.25%, 0.75% Floor),
9.71%, 8/7/2028 | | | 2,556,950 | | | | 2,568,303 | | |
| | | | 10,766,421 | | |
Internet Services & Infrastructure — 0.3% | |
Dcert Buyer Inc. (Digicert), Initial
Term Loan — First Lien
(SOFR 1 month + 4.00%), 9.34%, 10/16/2026 | | | 374,403 | | | | 365,744 | | |
Technology Partners, LLC (Imagine Software),
Initial Term Loan — First Lien
(SOFR 3 month + 5.00%, 1.00% Floor),
10.43%, 11/16/2027‡ (b)(c)(e) | | | 2,275,438 | | | | 2,269,750 | | |
| | | | 2,635,494 | | |
Investment Banking & Brokerage — 0.6% | |
Aretec Group Inc. (Cetera Financial Group),
RCAP Term Loan USD — First Lien
(SOFR 1 month + 4.00%), 9.34%, 8/9/2030 | | | 4,962,500 | | | | 4,987,834 | | |
IT Consulting & Other Services — 3.3% | |
Acumera, Inc., Initial Term Loan — First Lien
(SOFR 3 month + 7.00%, 1.00% Floor),
12.44%, 6/7/2028‡ (b)(c)(e) | | | 2,391,275 | | | | 2,391,275 | | |
Ahead DB Holdings, LLC, 2024 Incremental
Term Loan — First Lien
(SOFR 3 month + 4.25%, 0.75% Floor), 9.58%, 2/1/2031 | | | 5,000,000 | | | | 5,022,675 | | |
Alpine SG, LLC (ASG), February 2023
Term Loan — First Lien
(SOFR 3 month + 6.50%, 1.00% Floor), 11.98%,
11/5/2027‡ (b)(c)(e) | | | 809,139 | | | | 801,047 | | |
Alpine SG, LLC (ASG), Initial Term Loan — First Lien
(SOFR 3 month + 6.50%, 1.00% Floor),
11.98%, 11/5/2027‡ (b)(c)(e) | | | 1,351,194 | | | | 1,337,682 | | |
Alpine SG, LLC (ASG), May 2022 Term Loan — First Lien
(SOFR 3 month + 6.50%, 1.00% Floor),
11.98%, 11/5/2027‡ (b)(c)(e) | | | 708,496 | | | | 701,411 | | |
First Eagle Credit Opportunities Fund | Semiannual Report | June 30, 2024
25
First Eagle Credit Opportunities Fund | Consolidated Schedule of Investments | June 30, 2024 (unaudited)
Investments | | Principal Amount ($) | | Value ($) | |
IT Consulting & Other Services — 3.3% (continued) | |
Alpine SG, LLC (ASG), November 2021
Term Loan — First Lien
(SOFR 3 month + 6.50%, 1.00% Floor),
11.98%, 11/5/2027‡ (b)(c)(e) | | | 2,101,990 | | | | 2,080,970 | | |
Alpine X, Delayed Draw Term Loan — First Lien
(SOFR 3 month + 6.00%, 1.00% Floor),
11.56%, 12/27/2027‡ (b)(c)(e) | | | 599,037 | | | | 599,037 | | |
Alpine X, Fourth Amendment Term Loan — First Lien
(SOFR 3 month + 7.25%), 12.81%, 12/27/2027‡ (b)(c)(e) | | | 86,120 | | | | 86,120 | | |
Alpine X, Revolving Loan — First Lien
(SOFR 3 month + 6.00%, 1.00% Floor),
11.56%, 12/27/2027‡ (b)(e) | | | 60,876 | | | | 60,876 | | |
Alpine X, Second Amendment Incremental
Revolving Loan — First Lien
(SOFR 3 month + 6.00%, 1.00% Floor),
11.56%, 12/27/2027‡ (b)(e) | | | 28,571 | | | | 28,572 | | |
Alpine X, Second Amendment Incremental
Term Loan — First Lien
(SOFR 3 month + 6.00%, 1.00% Floor),
11.56%, 12/27/2027‡ (b)(c)(e) | | | 982,500 | | | | 982,500 | | |
Alpine X, Term Loan — First Lien
(SOFR 3 month + 6.00%, 1.00% Floor),
11.56%, 12/27/2027‡ (b)(c)(e) | | | 929,109 | | | | 929,109 | | |
Asurion, LLC, New B-11 Term Loan — First Lien
(SOFR 1 month + 4.25%), 9.69%, 8/19/2028 | | | 4,962,312 | | | | 4,931,843 | | |
Eliassen Group, LLC, 2022 Delayed Draw
Term Loan — First Lien
(SOFR 3 month + 5.75%, 0.75% Floor),
11.08%, 4/14/2028‡ (b)(e) | | | 172,854 | | | | 171,126 | | |
Eliassen Group, LLC, Initial Term Loan — First Lien
(SOFR 3 month + 5.75%, 0.75% Floor),
11.05%, 4/14/2028‡ (b)(c)(e) | | | 2,401,667 | | | | 2,377,650 | | |
Inflexionpoint LLC (fka Automated Control Concepts),
Revolving Credit Loan — First Lien
(SOFR 3 month + 5.50%, 1.00% Floor),
11.10%, 10/22/2026‡ (b)(e) | | | 104,167 | | | | 103,646 | | |
Inflexionpoint LLC (fka Automated Control Concepts),
Term Loan — First Lien
(SOFR 3 month + 5.50%, 1.00% Floor),
11.10%, 10/22/2026‡ (b)(c)(e) | | | 2,241,953 | | | | 2,230,743 | | |
First Eagle Credit Opportunities Fund | Semiannual Report | June 30, 2024
26
First Eagle Credit Opportunities Fund | Consolidated Schedule of Investments | June 30, 2024 (unaudited)
Investments | | Principal Amount ($) | | Value ($) | |
IT Consulting & Other Services — 3.3% (continued) | |
Marlin DTC — LS Midco 2, LLC (Clarus Commerce, LLC),
2A Term Loan — First Lien
(SOFR 6 month + 6.50%, 1.00% Floor),
11.92%, 7/1/2025‡ (b)(c)(e) | | | 1,501,002 | | | | 1,478,487 | | |
| | | | 26,314,769 | | |
Leisure Facilities — 0.5% | |
Bandon Fitness Texas, Inc., Delayed Draw
Term Loan — First Lien
(SOFR 1 month + 6.00%, 1.00% Floor),
11.47%, 7/27/2028‡ (b)(e) | | | 902,618 | | | | 891,336 | | |
Bandon Fitness Texas, Inc., Initial
Term Loan — First Lien
(SOFR 3 month + 6.00%, 1.00% Floor),
11.48%, 7/27/2028‡ (b)(c)(e) | | | 2,891,447 | | | | 2,855,304 | | |
Bandon Fitness Texas, Inc.,
Revolving Loan — First Lien
(SOFR 3 month + 6.00%, 1.00% Floor),
11.48%, 7/27/2028‡ (b)(e) | | | 147,297 | | | | 145,456 | | |
| | | | 3,892,096 | | |
Leisure Products — 0.2% | |
Abe Investment Holdings, Inc., (Getty Images, Inc.),
Initial Dollar Term Loan — First Lien
(SOFR 3 month + 4.50%), 9.93%, 2/19/2026 | | | 1,344,393 | | | | 1,345,670 | | |
Life Sciences Tools & Services — 1.1% | |
Sequoia Consulting Group, LLC, Term Loan — First Lien
(SOFR 3 month + 6.75%, 1.00% Floor),
12.23%, 12/17/2026‡ (b)(c)(e) | | | 4,231,809 | | | | 3,977,901 | | |
VCR Buyer, Inc. (Velocity Clinical Research),
Facility B1 — First Lien
(SOFR 3 month + 7.50%, 1.00% Floor),
12.84%, 4/28/2028‡ (b)(c)(e) | | | 4,903,650 | | | | 4,830,095 | | |
VCR Buyer, Inc. (Velocity Clinical Research),
Revolving Credit Facility — First Lien
(SOFR 3 month + 6.50%, 1.00% Floor),
11.83%, 4/28/2027‡ (b)(e) | | | 248,525 | | | | 244,797 | | |
| | | | 9,052,793 | | |
Managed Health Care — 0.3% | |
LBH Services, LLC, Delayed Draw
Term Loan — First Lien
(SOFR 3 month + 5.75%, 1.00% Floor, 0.50% PIK),
11.84%, 3/28/2028‡ (b)(e) | | | 313,940 | | | | 266,579 | | |
First Eagle Credit Opportunities Fund | Semiannual Report | June 30, 2024
27
First Eagle Credit Opportunities Fund | Consolidated Schedule of Investments | June 30, 2024 (unaudited)
Investments | | Principal Amount ($) | | Value ($) | |
Managed Health Care — 0.3% (continued) | |
LBH Services, LLC, Revolving Loan — First Lien
(SOFR 3 month + 5.75%, 1.00% Floor, 0.50% PIK),
11.83%, 3/28/2028‡ (b)(e) | | | 768,218 | | | | 652,953 | | |
LBH Services, LLC, Term Loan — First Lien
(SOFR 3 month + 5.75%, 1.00% Floor, 0.00% PIK),
11.35%, 3/28/2028‡ (b)(c)(e) | | | 1,502,057 | | | | 1,276,686 | | |
| | | | 2,196,218 | | |
Metal & Glass Containers — 1.5% | |
Closure Systems International Group Inc.
(Canister International Group Inc.),
Amendment No. 4 Term Loan — First Lien
(SOFR 1 month + 4.00%), 9.34%, 3/22/2029 | | | 5,000,000 | | | | 5,035,950 | | |
Pretium PKG Holdings, Inc., Initial
Term Loan — Second Lien
(SOFR 3 month + 6.75%, 0.50% Floor),
12.33%, 10/1/2029 | | | 2,868,534 | | | | 1,685,665 | | |
Pretium PKG Holdings, Inc., Initial Third
Amendment Tranche A-1 Term Loan — First Lien
(SOFR 3 month + 3.20%), 8.52%, 10/2/2028 | | | 3,688,096 | | | | 3,212,332 | | |
Pretium PKG Holdings, Inc., Third Amendment
Tranche A Term Loan — First Lien
(SOFR 3 month + 2.50%), 7.83%, 10/2/2028 | | | 2,438,312 | | | | 2,503,570 | | |
| | | | 12,437,517 | | |
Movies & Entertainment — 0.7% | |
WildBrain Ltd. (DHX Media), Term Loan — B — First Lien
(SOFR 1 month + 4.25%, 0.75% Floor),
9.71%, 3/24/2028‡ (c) | | | 5,838,749 | | | | 5,702,823 | | |
Multi-Sector Holdings — 0.4% | |
Auxey Bidco Ltd. (Alexander Mann Solutions),
Facility B (USD) — First Lien
(SOFR 1 month + 6.00%), 11.41%, 6/29/2027‡ (b) | | | 2,977,500 | | | | 2,929,116 | | |
Office Services & Supplies — 0.8% | |
Equiniti Group PLC (AST/Armor Holdco),
Initial Dollar Term Loan — First Lien
(SOFR 6 month + 4.50%), 9.93%, 12/11/2028‡ (d) | | | 6,454,660 | | | | 6,490,967 | | |
Oil & Gas Storage & Transportation — 0.6% | |
Essar Oil (UK) Ltd., Receivables Finance
Facility — First Lien
(SOFR 1 month + 6.25%, 3.00% Floor),
11.71%, 10/29/2024‡ (b)(c)(e) | | | 3,804,348 | | | | 3,804,348 | | |
First Eagle Credit Opportunities Fund | Semiannual Report | June 30, 2024
28
First Eagle Credit Opportunities Fund | Consolidated Schedule of Investments | June 30, 2024 (unaudited)
Investments | | Principal Amount ($) | | Value ($) | |
Oil & Gas Storage & Transportation — 0.6% (continued) | |
Liquid Tech Solutions Holdings, LLC, Sixth
Amendment Incremental Term Loan — First Lien
(SOFR 1 month + 4.75%), 10.19%, 3/20/2028‡ | | | 992,500 | | | | 993,740 | | |
| | | | 4,798,088 | | |
Packaged Foods & Meats — 0.6% | |
Aspire Bakeries Holdings LLC, Initial
Term Loan — First Lien
(SOFR 1 month + 4.25%), 9.59%, 12/23/2030 | | | 997,500 | | | | 1,001,241 | | |
Bengal Debt Sub Merger LLC (Tropicana,
Naked Juice), Initial Loan — Second Lien
(SOFR 3 month + 6.00%, 0.50% Floor),
11.43%, 1/24/2030 | | | 4,915,863 | | | | 3,999,595 | | |
| | | | 5,000,836 | | |
Paper Packaging — 1.3% | |
Advanced Web Technologies (AWT),
Delayed Draw Term Loan — First Lien
(SOFR 3 month + 6.00%, 1.00% Floor),
11.49%, 12/17/2026‡ (b)(c)(e) | | | 307,805 | | | | 302,418 | | |
Advanced Web Technologies (AWT), First Amendment
Delayed Draw Term Loan 1 — First Lien
(SOFR 3 month + 6.00%, 1.00% Floor),
11.49%, 12/17/2026‡ (b)(c)(e) | | | 325,833 | | | | 320,132 | | |
Advanced Web Technologies (AWT), First Amendment
Delayed Draw Term Loan 2 — First Lien
(SOFR 3 month + 6.25%), 11.74%, 12/17/2026‡ (b)(c)(e) | | | 469,726 | | | | 461,506 | | |
Advanced Web Technologies (AWT), First Requested
Incremental Term Loan — First Lien
(SOFR 3 month + 6.25%, 1.00% Floor),
11.74%, 12/17/2026‡ (b)(c)(e) | | | 982,500 | | | | 965,306 | | |
Advanced Web Technologies (AWT), Second
Amendment Delayed Draw Term Loan — First Lien
(SOFR 3 month + 6.25%, 1.00% Floor),
11.74%, 12/17/2026‡ (b)(c)(e) | | | 728,600 | | | | 715,849 | | |
Advanced Web Technologies (AWT),
Term Loan — First Lien
(SOFR 3 month + 6.00%, 1.00% Floor),
11.49%, 12/17/2026‡ (b)(c)(e) | | | 782,462 | | | | 768,769 | | |
Golden West Packaging Group LLC,
Initial Term Loan — First Lien
(SOFR 1 month + 5.25%, 0.75% Floor),
10.99%, 12/1/2027‡ (b) | | | 8,212,500 | | | | 6,919,031 | | |
| | | | 10,453,011 | | |
First Eagle Credit Opportunities Fund | Semiannual Report | June 30, 2024
29
First Eagle Credit Opportunities Fund | Consolidated Schedule of Investments | June 30, 2024 (unaudited)
Investments | | Principal Amount ($) | | Value ($) | |
Paper Products — 0.6% | |
R-Pac International Corp. (Project Radio),
Initial Revolving Loan — First Lien
(SOFR 1 month + 6.00%, 0.75% Floor),
11.44%, 12/29/2027‡ (b)(e) | | | 254,975 | | | | 248,601 | | |
R-Pac International Corp. (Project Radio),
Initial Term Loan — First Lien
(SOFR 3 month + 6.00%, 0.75% Floor),
11.59%, 12/29/2027‡ (b)(e) | | | 4,887,500 | | | | 4,765,312 | | |
| | | | 5,013,913 | | |
Pharmaceuticals — 3.3% | |
Alvogen Pharma US, Inc., June 2022 Loan — First Lien
(SOFR 3 month + 7.50%, 1.00% Floor),
12.98%, 6/30/2025‡ | | | 15,188,699 | | | | 13,897,180 | | |
Amneal Pharmaceuticals LLC, 2023
Term Loan B — First Lien
(SOFR 1 month + 5.50%), 10.84%, 5/4/2028 | | | 3,151,480 | | | | 3,175,762 | | |
ANI Pharmaceuticals, Inc., Initial
Term Loan — First Lien
(SOFR 1 month + 6.00%, 0.75% Floor),
11.46%, 11/19/2027‡ | | | 5,088,132 | | | | 5,107,212 | | |
Carestream Health, Inc. (aka Onex),
Term Loan — First Lien
(SOFR 3 month + 7.50%, 1.00% Floor),
12.91%, 9/30/2027 (c) | | | 4,993,906 | | | | 4,473,716 | | |
| | | | 26,653,870 | | |
Real Estate Services — 1.0% | |
Auction.com LLC (fka Ten-X LLC),
Term Loan — First Lien
(SOFR 1 month + 6.00%, 1.50% Floor),
11.34%, 5/26/2028 | | | 986,807 | | | | 953,749 | | |
(PRIME 1 month + 5.00%), 13.50%, 5/26/2028 | | | 2,639 | | | | 2,550 | | |
Avison Young (Canada) Inc., First Out
Term Loan — First Lien
(SOFR 3 month + 7.50%, 2.00% Floor),
13.10%, 3/12/2028 (c) | | | 1,184,525 | | | | 1,184,158 | | |
Avison Young (Canada) Inc., Second Out
Term Loan — First Lien
(SOFR 1 month + 8.00%, 2.00% Floor),
13.33%, 3/12/2029 (c) | | | 1,596,751 | | | | 1,257,442 | | |
First Eagle Credit Opportunities Fund | Semiannual Report | June 30, 2024
30
First Eagle Credit Opportunities Fund | Consolidated Schedule of Investments | June 30, 2024 (unaudited)
Investments | | Principal Amount ($) | | Value ($) | |
Real Estate Services — 1.0% (continued) | |
Avison Young (Canada) Inc., Third Out
Term Loan — First Lien
(SOFR 1 month + 8.00%, 2.00% Floor),
13.59%, 3/12/2029‡ (c) | | | 528,434 | | | | 311,116 | | |
Hudson's Bay Co., ULC, First Out Loan
(Term Loan) — First Lien
(SOFR 3 month + 7.00%, 1.00% Floor),
12.33%, 9/30/2026‡ (b)(c)(e) | | | 935,939 | | | | 935,939 | | |
Hudson's Bay Co., ULC, Last Out Loan
(Term Loan) — Second Lien
(SOFR 3 month + 9.73%, 1.00% Floor),
15.16%, 9/30/2026‡ (b)(c)(e) | | | 3,556,101 | | | | 3,556,101 | | |
| | | | 8,201,055 | | |
Research & Consulting Services — 3.5% | |
Axiom Global Inc., Initial Term Loan — First Lien
(SOFR 3 month + 4.75%, 0.75% Floor),
10.17%, 10/1/2026‡ (b)(c) | | | 2,923,664 | | | | 2,837,781 | | |
Eisner Advisory Group LLC, February 2024
Incremental Term Loan — First Lien
(SOFR 1 month + 4.00%, 0.50% Floor),
9.34%, 2/28/2031 | | | 5,000,000 | | | | 5,055,225 | | |
Grant Thornton LLP/Chicago, GRATHO
Term Loan B USD — First Lien
(SOFR 3 month + 3.25%), 8.60%, 5/30/2031 | | | 2,000,000 | | | | 2,008,230 | | |
Nielsen Consumer, Inc. (NielsenIQ),
Term Loan — First Lien
3/6/2028 (d) | | | 3,000,000 | | | | 3,007,500 | | |
Star Merger Sub Inc. (Dun & Bradstreet),
2022 Incremental Term B-2 Loan 2024 — First Lien
(SOFR 1 month + 2.75%), 8.10%, 1/18/2029 | | | 3,000,000 | | | | 3,005,625 | | |
Strategy Corps., LLC, Term Loan — First Lien
(SOFR 1 month + 5.25%, 1.00% Floor),
10.59%, 6/28/2030‡ (b)(c)(e) | | | 6,578,947 | | | | 6,492,105 | | |
Teneo Holdings LLC, Initial Term Loan — First Lien
(SOFR 1 month + 4.75%, 1.00% Floor),
10.09%, 3/13/2031 | | | 2,992,500 | | | | 3,004,350 | | |
Vaco Holdings LLC, Initial Term Loan — First Lien
(SOFR 3 month + 5.00%, 0.75% Floor),
10.43%, 1/21/2029 (d) | | | 1,655,771 | | | | 1,646,797 | | |
First Eagle Credit Opportunities Fund | Semiannual Report | June 30, 2024
31
First Eagle Credit Opportunities Fund | Consolidated Schedule of Investments | June 30, 2024 (unaudited)
Investments | | Principal Amount ($) | | Value ($) | |
Research & Consulting Services — 3.5% (continued) | |
Zenith American Holding, Inc. (Harbour Benefit Holding
Inc / HPH-TH Holdings, LLC), Term Loan — First Lien
(SOFR 3 month + 5.00%, 1.00% Floor),
10.45%, 12/13/2024‡ (b)(c)(e) | | | 878,735 | | | | 878,735 | | |
| | | | 27,936,348 | | |
Security & Alarm Services — 0.6% | |
SuperHero Fire Protection, LLC, Closing Date
Term Loan — First Lien
(SOFR 3 month + 6.25%, 1.00% Floor),
11.73%, 9/1/2026‡ (b)(c)(e) | | | 1,460,135 | | | | 1,460,135 | | |
SuperHero Fire Protection, LLC,
Revolving Loan — First Lien
(SOFR 1 month + 6.25%, 1.00% Floor),
11.69%, 9/1/2026‡ (b)(e) | | | 464,674 | | | | 464,674 | | |
SuperHero Fire Protection, LLC, Second Amendment
Incremental Term Loan — First Lien
(SOFR 3 month + 6.50%), 11.98%, 9/1/2026‡ (b)(c)(e) | | | 3,066,115 | | | | 3,066,115 | | |
| | | | 4,990,924 | | |
Soft Drinks — 0.4% | |
Pegasus BidCo BV (Refresco), 2024-1
Term Dollar Loan — First Lien
(SOFR 3 month + 3.75%, 0.50% Floor), 9.07%, 7/12/2029 | | | 2,955,150 | | | | 2,976,072 | | |
Specialized Consumer Services — 2.0% | |
LaserAway, Initial Term Loan — First Lien
(SOFR 3 month + 5.75%, 0.75% Floor),
11.33%, 10/14/2027‡ (b)(c)(e) | | | 4,117,272 | | | | 4,117,272 | | |
Mammoth Holdings, LLC, Delayed Draw
Term Loan — First Lien
(SOFR 3 month + 5.75%, 1.00% Floor),
11.06%, 11/15/2030‡ (b)(e) | | | 818,182 | | | | 801,818 | | |
Mammoth Holdings, LLC, Initial Term Loan — First Lien
(SOFR 3 month + 5.75%, 1.00% Floor),
11.08%, 11/15/2030‡ (b)(c)(e) | | | 3,618,182 | | | | 3,545,818 | | |
Reedy Industries Inc. (Thermostat Purchaser),
(USD) Term Loan B — First Lien
(SOFR 1 month + 4.00%), 9.34%, 8/31/2028‡ (d) | | | 7,403,828 | | | | 7,440,847 | | |
| | | | 15,905,755 | | |
Specialized Finance — 2.8% | |
Alchemy US Holdco 1 LLC (Kymera),
2023 Incremental Term Loan — First Lien
(SOFR 6 month + 6.00%), 12.78%, 10/10/2025‡ | | | 981,250 | | | | 981,250 | | |
First Eagle Credit Opportunities Fund | Semiannual Report | June 30, 2024
32
First Eagle Credit Opportunities Fund | Consolidated Schedule of Investments | June 30, 2024 (unaudited)
Investments | | Principal Amount ($) | | Value ($) | |
Specialized Finance — 2.8% (continued) | |
Apex Group Treasury LLC, 2022 Incremental
Term Loan — First Lien
(SOFR 3 month + 5.00%), 10.32%, 7/27/2028 | | | 8,865,000 | | | | 8,920,406 | | |
Apex Group Treasury Ltd., USD Term Loan — First Lien
(SOFR 3 month + 3.75%, 0.50% Floor),
9.33%, 7/27/2028 | | | 8,895,900 | | | | 8,918,139 | | |
BCP Qualtek Merger Sub LLC (Qualtek), Initial
Second Lien Term Loan — Second Lien
(SOFR 3 month + 1.00%, 9.00% PIK),
0.00%, 1/14/2027‡ (b)(e) | | | 2,245,957 | | | | — | | |
BCP Qualtek Merger Sub LLC (Qualtek),
Initial Term Loan — First Lien
(SOFR 3 month + 10.00%, 9.00% PIK),
0.00%, 7/14/2025‡ (b)(e) | | | 4,005,923 | | | | 621,199 | | |
BCP Qualtek Merger Sub LLC (Qualtek),
QUAUSA REV EXIT USD — First Lien
7/14/2024‡ (b)(d)(e) | | | 760,079 | | | | 760,079 | | |
iLending LLC, Term Loan — First Lien
(SOFR 1 month + 6.50%, 1.00% Floor, 2.00% PIK),
13.94%, 6/21/2026‡ (b)(c)(e) | | | 1,162,466 | | | | 871,268 | | |
Univar (Windsor Holdings III LLC), 2024 Dollar
Refinancing Term B Loan — First Lien
(SOFR 1 month + 4.00%), 9.34%, 8/1/2030 | | | 1,883,096 | | | | 1,897,690 | | |
| | | | 22,970,031 | | |
Specialty Chemicals — 0.9% | |
Nouryon USA LLC (StarFruit US Holdco),
2024 B-1 Dollar Term Loan — First Lien
(SOFR 3 month + 3.50%), 8.83%, 4/3/2028 | | | 2,984,962 | | | | 2,996,529 | | |
Plaze (PLZ Aeroscience), 2021-1 Term Loan — First Lien
(SOFR 1 month + 3.75%, 0.75% Floor), 9.21%, 8/3/2026 | | | 994,859 | | | | 962,526 | | |
RLG Holdings, LLC, 2022 Incremental
Term Loan — First Lien
(SOFR 1 month + 5.00%), 10.34%, 7/7/2028 | | | 2,650,113 | | | | 2,635,537 | | |
RLG Holdings, LLC, Closing Date Initial
Term Loan — First Lien
(SOFR 1 month + 4.25%, 0.75% Floor), 9.71%, 7/7/2028 | | | 910,324 | | | | 896,342 | | |
| | | | 7,490,934 | | |
Systems Software — 1.8% | |
Condor Merger Sub, Inc. (McAfee), MCFE
Term Loan B USD — First Lien
(SOFR 1 month + 3.25%), 8.58%, 3/1/2029 | | | 2,947,500 | | | | 2,948,192 | | |
First Eagle Credit Opportunities Fund | Semiannual Report | June 30, 2024
33
First Eagle Credit Opportunities Fund | Consolidated Schedule of Investments | June 30, 2024 (unaudited)
Investments | | Principal Amount ($) | | Value ($) | |
Systems Software — 1.8% (continued) | |
Idera Inc., 2021 Refinancing Loan — Second Lien
(SOFR 3 month + 6.75%), 12.23%, 3/2/2029‡ | | | 1,341,463 | | | | 1,316,311 | | |
McAfee Enterprise (Magenta Buyer LLC), Initial
Term Loan — First Lien
(SOFR 3 month + 5.00%, 0.75% Floor),
10.59%, 7/27/2028 (c) | | | 3,681,307 | | | | 2,063,833 | | |
McAfee Enterprise (Magenta Buyer LLC),
Initial Term Loan — Second Lien
(SOFR 3 month + 8.25%, 0.75% Floor),
13.84%, 7/27/2029 (c) | | | 12,000,000 | | | | 3,728,340 | | |
RSA Security LLC (Redstone), Initial Loan — Second Lien
(SOFR 1 month + 7.75%, 0.75% Floor),
13.21%, 4/27/2029 | | | 5,000,000 | | | | 4,100,000 | | |
| | | | 14,156,676 | | |
Technology Hardware, Storage & Peripherals — 0.5% | |
TouchTunes (TA TT Buyer), Initial
Term Loan — First Lien
(SOFR 1 month + 5.25%, 0.50% Floor),
10.59%, 4/2/2029 | | | 3,917,817 | | | | 3,926,789 | | |
Textiles — 0.4% | |
International Textile Group Inc. (Elevate Textiles, Inc.),
First Out Term Loan — First Lien
(SOFR 3 month + 8.50%), 13.95%, 9/30/2027‡ | | | 2,095,810 | | | | 2,062,633 | | |
International Textile Group Inc. (Elevate Textiles, Inc.),
Last Out Term Loan — First Lien
(SOFR 3 month + 1.00%, 1.00% Floor, 5.50% PIK),
11.95%, 9/30/2027‡ | | | 2,459,078 | | | | 1,385,930 | | |
| | | | 3,448,563 | | |
Trading Companies & Distributors — 0.9% | |
Johnstone Supply, LLC, JHNSPL
Term Loan B USD — First Lien
(SOFR 1 month + 3.00%), 8.33%, 6/9/2031 | | | 2,000,000 | | | | 2,005,000 | | |
Verde Purchaser, LLC, Initial Term Loan — First Lien
(SOFR 3 month + 4.50%), 9.81%, 11/30/2030 | | | 5,000,000 | | | | 5,001,875 | | |
| | | | 7,006,875 | | |
Trucking — 1.4% | |
A&R Logistics Holdings, Inc., Tranche 7
Incremental Term Loan — First Lien
(SOFR 3 month + 6.75%, 1.00% Floor),
12.20%, 8/3/2026‡ (b)(c)(e) | | | 3,238,512 | | | | 3,189,934 | | |
First Eagle Credit Opportunities Fund | Semiannual Report | June 30, 2024
34
First Eagle Credit Opportunities Fund | Consolidated Schedule of Investments | June 30, 2024 (unaudited)
Investments | | Principal Amount ($) | | Value ($) | |
Trucking — 1.4% (continued) | |
A&R Logistics Holdings, Inc., Tranche 9
Incremental Term Loan — First Lien
(SOFR 3 month + 6.75%, 1.00% Floor),
12.20%, 8/3/2026‡ (b)(c)(e) | | | 612,818 | | | | 603,626 | | |
First Student Bidco Inc. (First Transit Parent Inc.),
Initial Term B Loan — First Lien
(SOFR 3 month + 3.00%), 8.56%, 7/21/2028 | | | 1,433,731 | | | | 1,436,017 | | |
First Student Bidco Inc. (First Transit Parent Inc.),
Initial Term C Loan — First Lien
(SOFR 3 month + 3.00%), 8.56%, 7/21/2028 | | | 436,106 | | | | 436,802 | | |
First Student Bidco Inc. (First Transit Parent Inc.),
Term Loan B-2 — First Lien
(SOFR 3 month + 3.00%, 0.50% Floor), 8.43%, 7/21/2028 | | | 745,976 | | | | 747,491 | | |
Stonepeak Taurus Lower Holdings LLC (TRAC),
Initial Term Loan — Second Lien
(SOFR 3 month + 7.00%, 0.50% Floor),
12.43%, 1/28/2030‡ | | | 5,000,000 | | | | 4,600,000 | | |
| | | | 11,013,870 | | |
Water Utilities — 0.6% | |
Waste Resource Management Inc.,
Delayed Draw Term Loan — First Lien
(SOFR 1 month + 5.75%, 1.00% Floor),
11.09%, 12/28/2029‡ (b)(e) | | | 397,262 | | | | 393,290 | | |
Waste Resource Management Inc.,
Term Loan — First Lien
(SOFR 1 month + 5.75%, 1.00% Floor),
11.09%, 12/28/2029‡ (b)(c)(e) | | | 4,210,361 | | | | 4,168,258 | | |
| | | | 4,561,548 | | |
Total Senior Loans
(Cost $847,729,853) | | | 820,122,998 | | |
Corporate Bonds — 6.0% | |
Building Products — 0.7% | |
Smyrna Ready Mix Concrete LLC
8.88%, 11/15/2031 (f) | | | 5,500,000 | | | | 5,835,093 | | |
Capital Markets — 0.5% | |
Jane Street Group
4.50%, 11/15/2029 (f) | | | 4,032,000 | | | | 3,782,309 | | |
Chemicals — 0.3% | |
Vibrantz Technologies, Inc.
9.00%, 2/15/2030 (f) | | | 3,000,000 | | | | 2,745,750 | | |
First Eagle Credit Opportunities Fund | Semiannual Report | June 30, 2024
35
First Eagle Credit Opportunities Fund | Consolidated Schedule of Investments | June 30, 2024 (unaudited)
Investments | | Principal Amount ($) | | Value ($) | |
Commercial Services & Supplies — 0.6% | |
Madison IAQ LLC
5.88%, 6/30/2029 (f) | | | 5,000,000 | | | | 4,651,995 | | |
Containers & Packaging — 0.7% | |
Mauser Packaging Solutions Holding Co.
9.25%, 4/15/2027 (f) | | | 6,000,000 | | | | 6,003,852 | | |
Entertainment — 0.2% | |
Allen Media LLC
10.50%, 2/15/2028 (f) | | | 3,000,000 | | | | 1,314,902 | | |
Financial Services — 0.1% | |
Armor Holdco, Inc.
8.50%, 11/15/2029 (f) | | | 1,000,000 | | | | 952,784 | | |
Insurance — 0.9% | |
Panther Escrow Issuer LLC
7.13%, 6/1/2031 (f) | | | 3,000,000 | | | | 3,034,302 | | |
Ryan Specialty LLC
4.38%, 2/1/2030 (f) | | | 5,000,000 | | | | 4,630,805 | | |
| | | | 7,665,107 | | |
Media — 0.3% | |
Univision Communications, Inc.
7.38%, 6/30/2030 (f) | | | 3,000,000 | | | | 2,790,506 | | |
Passenger Airlines — 1.2% | |
American Airlines, Inc.
5.50%, 4/20/2026 (f) | | | 666,667 | | | | 660,741 | | |
5.75%, 4/20/2029 (f) | | | 2,000,000 | | | | 1,945,737 | | |
United Airlines, Inc.
4.38%, 4/15/2026 (f) | | | 5,000,000 | | | | 4,830,037 | | |
4.63%, 4/15/2029 (f) | | | 2,000,000 | | | | 1,862,620 | | |
| | | | 9,299,135 | | |
Software — 0.5% | |
AthenaHealth Group, Inc.
6.50%, 2/15/2030 (f) | | | 1,000,000 | | | | 920,699 | | |
McAfee Corp.
7.38%, 2/15/2030 (f) | | | 2,000,000 | | | | 1,847,706 | | |
SS&C Technologies, Inc.
6.50%, 6/1/2032 (f) | | | 1,000,000 | | | | 1,008,696 | | |
| | | | 3,777,101 | | |
Total Corporate Bonds
(Cost $49,872,963) | | | 48,818,534 | | |
First Eagle Credit Opportunities Fund | Semiannual Report | June 30, 2024
36
First Eagle Credit Opportunities Fund | Consolidated Schedule of Investments | June 30, 2024 (unaudited)
Investments | | Shares | | Value ($) | |
Common Stocks — 0.3% | |
Chemicals — 0.0% | |
A&A Global Imports, LLC, Class A*‡ (b)(c) | | | 41 | | | | — | | |
Construction & Engineering — 0.0% | |
BCP Qualtek Merger Sub LLC*‡ (b)(e) | | | 218,326 | | | | — | | |
Electric Utilities — 0.0% (g) | |
Frontera Generation Holdings LLC*‡ | | | 62,500 | | | | 19,531 | | |
Media — 0.1% | |
A-L Parent LLC*‡ | | | 13,507 | | | | 911,723 | | |
Real Estate Management & Development — 0.2% | |
Avison Young-Investments LLC (Canada)*‡ (c) | | | 1,236 | | | | 1,359 | | |
Avison Young-Investments LLC,
Preference (Canada)*‡ (c) | | | 1,950,816 | | | | 1,072,949 | | |
| | | | 1,074,308 | | |
Textiles, Apparel & Luxury Goods — 0.0% (g) | |
Elevate Textiles, Inc.*‡ | | | 100,072 | | | | 162,667 | | |
Transportation Infrastructure — 0.0% (g) | |
Limetree Bay Cayman Ltd.*‡ (e) | | | 1,430 | | | | 15 | | |
Total Common Stocks
(Cost $1,992,344) | | | 2,168,244 | | |
| | | Number of Warrants | | | |
Warrants — 0.0% (g) | |
Software — 0.0% (g) | |
Acumera, Inc., expiring 5/19/2028*‡ (b)(c)(e) | | | 2,594 | | | | 5,318 | | |
Total Warrants
(Cost $—) | | | 5,318 | | |
First Eagle Credit Opportunities Fund | Semiannual Report | June 30, 2024
37
First Eagle Credit Opportunities Fund | Consolidated Schedule of Investments | June 30, 2024 (unaudited)
Investments | | Shares | | Value ($) | |
Short-Term Investments — 2.9% | |
Investment Companies — 2.9% | |
JP Morgan U.S. Government Money Market Fund,
Capital Shares 5.34% (h)
(Cost $23,360,628) | | | 23,360,628 | | | | 23,360,628 | | |
Total Investments — 111.0%
(Cost $922,955,788) | | | 894,475,722 | | |
Credit Facility — (10.6)%
(Cost $85,014,577) | | | (85,014,577 | ) | |
Liabilities in excess of other assets — (0.4%) | | | (3,595,550 | ) | |
Net Assets — 100.0% | | | 805,865,595 | | |
* Non-income producing security.
‡ Value determined using significant unobservable inputs.
^ Security is in default.
(a) Senior loans pay interest at rates that are periodically determined on the basis of a floating benchmark lending rate, sometimes subject to a floor, plus a spread, unless otherwise indicated. The most popular benchmark lending rates are SOFR (a broad measure of the cost of borrowing cash overnight collateralized by U.S. Treasury securities in the repurchase agreement market) and the prime rate offered by one or more major U.S. banks ("Prime"). Additionally, LIBOR (a synthetic calculation by ICE based on CME Term SOFR plus an ISDA/ARRC Spread Adjustment) continues to be used on certain interest rate contracts that were entered into prior to the discontinuation of LIBOR and are expected to be transitioned to alternative benchmarks prior to the cessation of the publishing of the synthetic LIBOR, currently expected in September 2024. SOFR based contracts may include a credit spread adjustment that is charged in addition to the benchmark rate and the stated spread. SOFR, Prime and LIBOR were utilized as benchmark lending rates for the senior loans at June 30, 2024. The rates shown represent the contractual rates (benchmark rate or floor plus spread) in effect at period end.
(b) Represents a security that is subject to legal or contractual restrictions on resale. The Fund generally acquires its investments in private transactions exempt from registration under the Securities Act of 1933, as amended, or the Securities Act. Its investments are therefore generally subject to certain limitations on resale, and may be deemed to be "restricted securities" under the Securities Act. Total value of all such securities at June 30, 2024 amounted to $331,863,900, which represents approximately 41.18% of net assets of the Fund.
| Restricted Securities | | Acquisition Date | | Cost | | Carrying Value
Per
Share/Principal | |
A&A Global Imports, LLC, Class A | | 02/15/24 | | $ | — | | | $ | — | | |
A&A Global Imports, LLC, First Out
Term Loan — First Lien | | 06/01/21 - 10/19/22 | | | 889,281 | | | | 100.00 | | |
A&A Global Imports, LLC, Last Out
Term Loan — First Lien | | 06/01/21 - 10/19/22 | | | 994,501 | | | | 10.00 | | |
A&A Global Imports, LLC, New
Revolving Loan — First Lien | | 02/14/24 - 05/22/24 | | | 14,996 | | | | 100.00 | | |
A&R Logistics Holdings, Inc., Tranche 7
Incremental Term Loan — First Lien | | 07/06/22 | | | 3,204,189 | | | | 98.50 | | |
First Eagle Credit Opportunities Fund | Semiannual Report | June 30, 2024
38
First Eagle Credit Opportunities Fund | Consolidated Schedule of Investments | June 30, 2024 (unaudited)
| Restricted Securities | | Acquisition Date | | Cost | | Carrying Value
Per
Share/Principal | |
A&R Logistics Holdings, Inc., Tranche 9
Incremental Term Loan — First Lien | | 08/01/22 | | $ | 606,448 | | | $ | 98.50 | | |
Acumera, Inc. | | 09/29/23 | | | — | | | | 2.05 | | |
Acumera, Inc., Initial Term
Loan — First Lien | | 09/29/23 | | | 2,362,549 | | | | 100.00 | | |
Advanced Web Technologies (AWT),
Delayed Draw Term Loan — First Lien | | 03/14/22 | | | 306,368 | | | | 98.25 | | |
Advanced Web Technologies (AWT),
First Amendment Delayed Draw
Term Loan 1 — First Lien | | 05/09/23 | | | 322,227 | | | | 98.25 | | |
Advanced Web Technologies (AWT),
First Amendment Delayed Draw
Term Loan 2 — First Lien | | 02/13/24 | | | 469,726 | | | | 98.25 | | |
Advanced Web Technologies (AWT),
First Requested Incremental
Term Loan — First Lien | | 10/18/22 | | | 966,915 | | | | 98.25 | | |
Advanced Web Technologies (AWT),
Second Amendment Delayed Draw
Term Loan — First Lien | | 02/13/24 | | | 727,953 | | | | 98.25 | | |
Advanced Web Technologies (AWT),
Term Loan — First Lien | | 02/05/21 | | | 775,745 | | | | 98.25 | | |
Air Conditioning Specialist, Inc.,
Revolving Loan — First Lien | | 08/16/23 - 09/28/23 | | | 84,446 | | | | 99.25 | | |
Air Conditioning Specialist, Inc.,
Term Loan — First Lien | | 08/16/23 - 05/08/24 | | | 3,094,750 | | | | 99.25 | | |
Alpine SG, LLC (ASG), February 2023
Term Loan — First Lien | | 02/03/23 | | | 791,543 | | | | 99.00 | | |
Alpine SG, LLC (ASG), Initial Term
Loan — First Lien | | 11/05/21 | | | 1,337,082 | | | | 99.00 | | |
Alpine SG, LLC (ASG), May 2022 Term
Loan — First Lien | | 05/13/22 | | | 698,167 | | | | 99.00 | | |
Alpine SG, LLC (ASG), November 2021
Term Loan — First Lien | | 11/24/21 | | | 2,071,111 | | | | 99.00 | | |
Alpine X, Delayed Draw Term
Loan — First Lien | | 05/09/23 | | | 595,014 | | | | 100.00 | | |
Alpine X, Fourth Amendment Term
Loan — First Lien | | 12/15/23 | | | 84,129 | | | | 100.00 | | |
Alpine X, Revolving Loan — First Lien | | 04/10/23 | | | 60,514 | | | | 100.00 | | |
Alpine X, Second Amendment
Incremental Revolving
Loan — First Lien | | 09/16/22 | | | 28,378 | | | | 100.00 | | |
Alpine X, Second Amendment
Incremental Term Loan — First Lien | | 09/16/22 | | | 962,054 | | | | 100.00 | | |
Alpine X, Term Loan — First Lien | | 12/27/21 | | | 916,793 | | | | 100.00 | | |
First Eagle Credit Opportunities Fund | Semiannual Report | June 30, 2024
39
First Eagle Credit Opportunities Fund | Consolidated Schedule of Investments | June 30, 2024 (unaudited)
| Restricted Securities | | Acquisition Date | | Cost | | Carrying Value
Per
Share/Principal | |
AMCP Clean Acquisition Co., LLC
(PureStar), Term Loan — First Lien | | 02/27/24 | | $ | 4,370,517 | | | $ | 99.88 | | |
Anne Arundel Dermatology
Management, LLC, DDTL A — First
Lien | | 03/14/22 | | | 116,824 | | | | 90.00 | | |
Anne Arundel Dermatology
Management, LLC, DDTL B — First
Lien | | 03/14/22 | | | 197,886 | | | | 90.00 | | |
Anne Arundel Dermatology
Management, LLC, DDTL C — First
Lien | | 11/09/21 - 08/09/23 | | | 558,303 | | | | 90.00 | | |
Anne Arundel Dermatology
Management, LLC, Restatement Date
Term Loan — First Lien | | 02/05/21 - 03/14/22 | | | 1,916,891 | | | | 90.00 | | |
Apella Capital LLC, Initial Term
Loan — First Lien | | 03/01/24 | | | 1,243,972 | | | | 98.13 | | |
Apella Capital LLC, Revolving
Loan — First Lien | | 05/31/24 - 06/25/24 | | | 245,502 | | | | 98.13 | | |
Apex Analytix, Inc. (Montana Buyer,
Inc.), Initial Term Loan — First Lien | | 06/15/22 | | | 2,620,599 | | | | 98.25 | | |
Apex Analytix, Inc. (Montana Buyer,
Inc.), Revolving Credit Loan — First
Lien | | 06/25/24 | | | 18,919 | | | | 98.25 | | |
AppHub LLC, Delayed Draw Tem
Loan — First Lien | | 10/04/22 - 04/02/24 | | | 364,581 | | | | 100.00 | | |
AppHub LLC, Term Loan — First Lien | | 09/29/22 | | | 2,621,857 | | | | 100.00 | | |
Apryse Software Corp. (PDFTron
Systems Inc.), 2022-1 Incremental
Term Loan — First Lien | | 07/19/22 | | | 3,379,273 | | | | 100.00 | | |
Apryse Software Corp. (PDFTron
Systems Inc.), 2024-1 Incremental
Term Loan — First Lien | | 01/24/24 | | | 1,808,687 | | | | 100.00 | | |
Apryse Software Corp. (PDFTron
Systems Inc.), Delayed Draw Term
Loan — First Lien | | 07/26/22 | | | 349,738 | | | | 100.00 | | |
Apryse Software Corp. (PDFTron
Systems Inc.), Initial Term
Loan — First Lien | | 07/19/22 | | | 1,078,726 | | | | 100.00 | | |
Auxey Bidco Ltd. (Alexander Mann
Solutions), Facility B (USD) — First Lien | | 07/26/23 | | | 2,878,043 | | | | 98.38 | | |
Axiom Global Inc., Initial Term
Loan — First Lien | | 08/03/22 | | | 2,911,719 | | | | 97.06 | | |
Bandon Fitness Texas, Inc., Delayed
Draw Term Loan — First Lien | | 08/02/22 - 03/28/24 | | | 898,952 | | | | 98.75 | | |
Bandon Fitness Texas, Inc., Initial
Term Loan — First Lien | | 07/27/22 | | | 2,859,681 | | | | 98.75 | | |
First Eagle Credit Opportunities Fund | Semiannual Report | June 30, 2024
40
First Eagle Credit Opportunities Fund | Consolidated Schedule of Investments | June 30, 2024 (unaudited)
| Restricted Securities | | Acquisition Date | | Cost | | Carrying Value
Per
Share/Principal | |
Bandon Fitness Texas, Inc., Revolving
Loan — First Lien | | 07/27/22 - 09/29/22 | | $ | 146,918 | | | $ | 98.75 | | |
BCDI BHI Intermediate 2, LP (Basic
Home Infusion), Delayed Draw Term
Loan — First Lien | | 02/13/24 | | | 1,218,064 | | | | 99.50 | | |
BCDI BHI Intermediate 2, LP (Basic
Home Infusion), Initial Term
Loan — First Lien | | 09/30/22 | | | 2,867,847 | | | | 99.50 | | |
BCDI BHI Intermediate 2, LP (Basic
Home Infusion), Revolving Credit
Loan — First Lien | | 03/27/24 | | | 329,036 | | | | 99.50 | | |
BCP Qualtek Merger Sub LLC | | 07/14/23 | | | 362,265 | | | | 0.00 | | |
BCP Qualtek Merger Sub LLC
(Qualtek), Initial Second Lien Term
Loan — Second Lien | | 06/17/21 - 07/14/23 | | | 2,222,008 | | | | 0.00 | | |
BCP Qualtek Merger Sub LLC
(Qualtek), Initial Term
Loan — First Lien | | 03/16/23 - 07/14/23 | | | 3,926,774 | | | | 17.41 | | |
BCP Qualtek Merger Sub LLC
(Qualtek), QUAUSA REV EXIT
USD — First Lien | | 05/03/24 - 06/14/24 | | | 739,198 | | | | 100.00 | | |
Boston Clinical Trials LLC (Alcanza
Clinical Research), Fourth
Amendment Delayed Draw Term
Loan — First Lien | | 05/31/24 | | | 902,616 | | | | 99.00 | | |
Boston Clinical Trials LLC (Alcanza
Clinical Research), Fourth
Amendment Term Loan — First Lien | | 04/19/24 | | | 2,062,946 | | | | 99.00 | | |
Boston Clinical Trials LLC (Alcanza
Clinical Research), Initial Term
Loan — First Lien | | 12/21/21 - 02/13/24 | | | 4,659,805 | | | | 99.50 | | |
Boston Clinical Trials LLC (Alcanza
Clinical Research), Revolving Credit
Loan — First Lien | | 12/13/23 - 06/17/24 | | | 185,815 | | | | 99.50 | | |
CC Amulet Management, LLC
(Children's Choice), Delayed Draw
Term Loan — First Lien | | 08/31/23 - 04/02/24 | | | 96,993 | | | | 100.00 | | |
CC Amulet Management, LLC
(Children's Choice), Revolving
Loan — First Lien | | 08/31/21 - 05/06/24 | | | 43,756 | | | | 99.50 | | |
CC Amulet Management, LLC
(Children's Choice), Term
Loan — First Lien | | 08/31/21 | | | 1,654,345 | | | | 99.50 | | |
Community Based Care Acquisition,
Inc., Delayed Draw Tranche A Term
Loan — First Lien | | 06/15/22 | | | 888,997 | | | | 100.00 | | |
First Eagle Credit Opportunities Fund | Semiannual Report | June 30, 2024
41
First Eagle Credit Opportunities Fund | Consolidated Schedule of Investments | June 30, 2024 (unaudited)
| Restricted Securities | | Acquisition Date | | Cost | | Carrying Value
Per
Share/Principal | |
Community Based Care Acquisition,
Inc., Delayed Draw Tranche B Term
Loan — First Lien | | 09/30/22 - 04/29/24 | | $ | 927,545 | | | $ | 100.00 | | |
Community Based Care Acquisition,
Inc., Initial Term Loan — First Lien | | 09/16/21 | | | 2,175,609 | | | | 100.00 | | |
Community Based Care Acquisition,
Inc., Revolving Credit Loan — First
Lien | | 12/27/23 | | | 46,369 | | | | 100.00 | | |
ConvenientMD (CMD Intermediate
Holdings, Inc.), 2024 Extended Term
Loan — First Lien | | 11/24/21 - 06/09/22 | | | 1,787,273 | | | | 97.00 | | |
Danforth Global, Inc., First
Amendment Additional Term
Loan — First Lien | | 12/01/22 | | | 959,184 | | | | 98.50 | | |
Danforth Global, Inc., Initial Term
Loan — First Lien | | 05/13/22 | | | 1,219,539 | | | | 98.50 | | |
Danforth Global, Inc., Revolving Credit
Loan — First Lien | | 06/10/24 | | | 83,369 | | | | 98.50 | | |
Danforth Global, Inc., Second
Amendment Incremental Term
Loan — First Lien | | 05/24/24 | | | 7,176,694 | | | | 98.50 | | |
Dorel Industries Inc., First Out Term
Loan — First Lien | | 12/08/23 | | | 2,921,075 | | | | 100.00 | | |
Electrical Components International,
Inc. (ECI), Closing Date Term
Loan — First Lien | | 05/10/24 | | | 5,914,645 | | | | 98.00 | | |
Electrical Components International,
Inc. (ECI), Delayed Draw Term
Loan — First Lien | | 06/18/24 | | | 281,086 | | | | 98.00 | | |
Elevate HD Parent, Inc., Delayed Draw
Term Loan A — First Lien | | 12/01/23 | | | 74,414 | | | | 99.00 | | |
Elevate HD Parent, Inc., Initial Term
Loan — First Lien | | 08/18/23 | | | 3,173,852 | | | | 99.00 | | |
Elevate HD Parent, Inc., Revolving
Loan — First Lien | | 04/30/24 | | | 65,474 | | | | 99.00 | | |
Eliassen Group, LLC, 2022 Delayed
Draw Term Loan — First Lien | | 03/31/22 - 09/29/23 | | | 172,592 | | | | 99.00 | | |
Eliassen Group, LLC, Initial Term
Loan — First Lien | | 08/03/22 | | | 2,383,808 | | | | 99.00 | | |
Endo1 Partners, LLC, Seventh
Amendment DDTL — First Lien | | 05/09/23 | | | 7,866,819 | | | | 99.25 | | |
Endo1 Partners, LLC, Third
Amendment DDTL — First Lien | | 07/19/22 | | | 1,802,450 | | | | 99.25 | | |
Enthusiast Auto Holdings, LLC
(EAH-Intermediate Holdco LLC), Third
Amendment Term Loan — First Lien | | 03/20/23 | | | 1,384,461 | | | | 100.00 | | |
First Eagle Credit Opportunities Fund | Semiannual Report | June 30, 2024
42
First Eagle Credit Opportunities Fund | Consolidated Schedule of Investments | June 30, 2024 (unaudited)
| Restricted Securities | | Acquisition Date | | Cost | | Carrying Value
Per
Share/Principal | |
Enverus Holdings, Inc., Initial Term
Loan — First Lien | | 12/04/23 | | $ | 3,787,562 | | | $ | 100.25 | | |
Epic Staffing Group (Cirrus/Tempus/
Explorer Investor), Initial Term
Loan — First Lien | | 06/27/22 - 09/15/23 | | | 4,682,301 | | | | 97.50 | | |
Essar Oil (UK) Ltd., Receivables
Finance Facility — First Lien | | 10/31/23 - 12/18/23 | | | 3,791,827 | | | | 100.00 | | |
Everlane, Inc., Term Loan — First Lien | | 10/07/22 | | | 3,727,307 | | | | 100.00 | | |
Filtration Group Corp., 2021
Incremental Term Loan — First Lien | | 05/19/23 | | | 2,553,531 | | | | 100.56 | | |
First Steps Recovery Acquisition,
LLC (True North Detox), Term
Loan — First Lien | | 03/29/24 | | | 3,068,360 | | | | 98.50 | | |
Gen4 Dental Partners Opco, LLC,
Initial Term Loan — First Lien | | 05/13/24 | | | 5,392,746 | | | | 98.00 | | |
Golden West Packaging Group LLC,
Initial Term Loan — First Lien | | 11/29/21 - 02/08/24 | | | 7,068,074 | | | | 84.25 | | |
Greenway Health, LLC (fka Vitera
Healthcare Solutions, LLC), Term
Loan — First Lien | | 12/18/23 | | | 6,876,626 | | | | 99.25 | | |
Houseworks Holdings, Fourth
Amendment Term Loan — First Lien | | 05/28/24 | | | 2,597,481 | | | | 98.00 | | |
Houseworks Holdings, Revolving
Loan — First Lien | | 09/01/23 | | | 18,320 | | | | 100.00 | | |
Houseworks Holdings, Third
Amendment Term Loan — First Lien | | 09/01/23 | | | 1,636,142 | | | | 100.00 | | |
Hudson's Bay Co., ULC, First Out Loan
(Term Loan) — First Lien | | 09/30/21 - 03/31/23 | | | 931,031 | | | | 100.00 | | |
Hudson's Bay Co., ULC, Last Out Loan
(Term Loan) — Second Lien | | 09/30/21 - 03/31/23 | | | 3,529,434 | | | | 100.00 | | |
Hydrofarm Holdings Group, Inc.,
Term Loan — First Lien | | 12/10/21 - 03/18/22 | | | 1,152,808 | | | | 82.50 | | |
iLending LLC, Term Loan — First Lien | | 11/24/21 | | | 1,155,354 | | | | 75.00 | | |
In Vitro Sciences, LLC (New IVS
Holdings, LLC), Closing Date Term
Loan — First Lien | | 02/29/24 | | | 4,331,866 | | | | 98.50 | | |
In Vitro Sciences, LLC (New IVS
Holdings, LLC), Delayed Draw Term
Loan — First Lien | | 02/29/24 - 03/28/24 | | | 1,117,357 | | | | 98.50 | | |
Inflexionpoint LLC (fka Automated
Control Concepts), Revolving Credit
Loan — First Lien | | 10/22/21 | | | 105,799 | | | | 99.50 | | |
Inflexionpoint LLC (fka Automated
Control Concepts), Term Loan — First
Lien | | 10/22/21 - 05/06/22 | | | 2,222,538 | | | | 99.50 | | |
First Eagle Credit Opportunities Fund | Semiannual Report | June 30, 2024
43
First Eagle Credit Opportunities Fund | Consolidated Schedule of Investments | June 30, 2024 (unaudited)
| Restricted Securities | | Acquisition Date | | Cost | | Carrying Value
Per
Share/Principal | |
Ingenio LLC, First Amendment Term
Loan — First Lien | | 04/28/22 | | $ | 3,855,397 | | | $ | 99.50 | | |
Ingenio LLC, Term Loan — First Lien | | 08/03/21 | | | 1,246,228 | | | | 99.50 | | |
IPM MSO Management, LLC, Closing
Date Term Loan — First Lien | | 12/10/21 | | | 793,084 | | | | 98.50 | | |
IPM MSO Management, LLC, Delayed
Draw Term Loan — First Lien | | 06/15/22 | | | 95,743 | | | | 98.50 | | |
IPM MSO Management, LLC, Second
Amendment Term Loan — First Lien | | 05/10/22 | | | 217,706 | | | | 98.50 | | |
Kobra International, Ltd. (d/b/a
Nicole Miller), Term Loan — First Lien | | 05/17/22 - 03/31/23 | | | 4,435,105 | | | | 100.00 | | |
LaserAway, Initial Term
Loan — First Lien | | 07/27/22 - 09/11/23 | | | 4,068,388 | | | | 100.00 | | |
Lash Opco LLC, Initial Term
Loan — First Lien | | 02/05/21 | | | 1,910,628 | | | | 95.00 | | |
LBH Services, LLC, Delayed Draw
Term Loan — First Lien | | 03/28/22 | | | 310,556 | | | | 85.00 | | |
LBH Services, LLC, Revolving
Loan — First Lien | | 03/28/22 - 02/17/23 | | | 766,373 | | | | 85.00 | | |
LBH Services, LLC, Term
Loan — First Lien | | 03/28/22 | | | 1,488,331 | | | | 85.00 | | |
Lids Holdings, Inc., Initial Term
Loan — First Lien | | 07/12/23 | | | 2,027,441 | | | | 100.00 | | |
Life Northwestern Pennsylvania, LLC
(FFL Pace Buyer, Inc.), Delayed Draw
Term Loan — First Lien | | 02/13/24 | | | 576,759 | | | | 97.75 | | |
Life Northwestern Pennsylvania, LLC
(FFL Pace Buyer, Inc.), Initial Term
Loan — First Lien | | 12/10/21 | | | 1,700,777 | | | | 97.75 | | |
Life Northwestern Pennsylvania, LLC
(FFL Pace Buyer, Inc.), Revolving
Loan — First Lien | | 01/23/23 - 03/26/24 | | | 217,985 | | | | 97.75 | | |
LMSI Buyer, LLC, Initial Term
Loan — First Lien | | 12/10/21 - 11/09/23 | | | 2,131,993 | | | | 90.00 | | |
LMSI Buyer, LLC, Revolving Credit
Loan — First Lien | | 09/30/22 - 04/02/24 | | | 334,719 | | | | 90.00 | | |
MAG DS Corp., Initial Term
Loan — First Lien | | 02/05/21 - 05/11/23 | | | 1,904,237 | | | | 97.00 | | |
Mammoth Holdings, LLC, Delayed
Draw Term Loan — First Lien | | 11/24/23 - 06/26/24 | | | 810,621 | | | | 98.00 | | |
Mammoth Holdings, LLC, Initial Term
Loan — First Lien | | 11/14/23 | | | 3,549,846 | | | | 98.00 | | |
Marlin DTC — LS Midco 2, LLC
(Clarus Commerce, LLC), 2A Term
Loan — First Lien | | 04/08/21 | | | 1,487,446 | | | | 98.50 | | |
First Eagle Credit Opportunities Fund | Semiannual Report | June 30, 2024
44
First Eagle Credit Opportunities Fund | Consolidated Schedule of Investments | June 30, 2024 (unaudited)
| Restricted Securities | | Acquisition Date | | Cost | | Carrying Value
Per
Share/Principal | |
Medrina, LLC, Initial Term
Loan — First Lien | | 10/20/23 | | $ | 5,382,820 | | | $ | 99.00 | | |
Mid-State Machine and Fabricating
Corp., Revolver — First Lien | | 06/21/24 | | | 328,461 | | | | 98.50 | | |
Mid-State Machine and Fabricating
Corp., Term Loan — First Lien | | 06/21/24 | | | 8,208,729 | | | | 98.50 | | |
Monarch Behavioral Therapy, LLC,
Term Loan — First Lien | | 06/06/24 | | | 9,525,085 | | | | 98.50 | | |
Newcleus, LLC, Initial Term
Loan — First Lien | | 08/02/21 - 08/04/21 | | | 1,202,515 | | | | 92.00 | | |
Oak Point Partners, LLC, Term
Loan — First Lien | | 12/10/21 | | | 2,478,479 | | | | 99.00 | | |
Orion Group Holdco, LLC, First
Amendment Incremental Delayed
Draw Term Loan — First Lien | | 05/09/23 | | | 901,461 | | | | 100.00 | | |
Orion Group Holdco, LLC, First
Amendment Incremental Term
Loan — First Lien | | 12/10/21 | | | 2,122,964 | | | | 100.00 | | |
Patriot Rail Co., LLC (NA Rail),
Tranche B-2 Term Loan — First Lien | | 10/02/23 | | | 2,958,925 | | | | 100.06 | | |
Point Quest Acquisition, LLC, Initial
Term Loan — First Lien | | 08/12/22 - 05/09/24 | | | 7,461,142 | | | | 100.00 | | |
Point Quest Acquisition, LLC,
Revolving Credit Loan — First Lien | | 08/12/22 - 03/08/24 | | | 571,670 | | | | 100.00 | | |
Portfolio Holding, Inc. (Turbo Buyer/
PGM), Amendment No. 3 Incremental
Term Loan — First Lien | | 05/14/21 | | | 1,916,696 | | | | 96.00 | | |
Portfolio Holding, Inc. (Turbo Buyer/
PGM), Amendment No. 4 Incremental
Delayed Draw Term Loan — First Lien | | 05/31/22 | | | 758,082 | | | | 96.00 | | |
Portfolio Holding, Inc. (Turbo Buyer/
PGM), Amendment No. 4 Incremental
Term Loan — First Lien | | 11/15/21 | | | 1,128,209 | | | | 96.00 | | |
Project Cloud Holdings, LLC
(AgroFresh Inc.), 2024-1 Incremental
Term Loan (USD) — First Lien | | 03/27/24 | | | 2,866,282 | | | | 98.00 | | |
Project Cloud Holdings, LLC
(AgroFresh Inc.), Initial USD Term
Loan Retired — First Lien | | 02/13/24 | | | 5,071,319 | | | | 98.00 | | |
Project Cloud Holdings, LLC
(AgroFresh Inc.), Replacement
Revolver — First Lien | | 03/27/24 - 06/12/24 | | | 556,271 | | | | 98.00 | | |
QuickBase Inc. (Quartz Holding Co.),
Term Loan — First Lien | | 03/13/24 | | | 3,959,564 | | | | 100.06 | | |
First Eagle Credit Opportunities Fund | Semiannual Report | June 30, 2024
45
First Eagle Credit Opportunities Fund | Consolidated Schedule of Investments | June 30, 2024 (unaudited)
| Restricted Securities | | Acquisition Date | | Cost | | Carrying Value
Per
Share/Principal | |
Quorum Health Resources (QHR),
2023 Incremental Term Loan — First
Lien | | 06/30/23 | | $ | 1,949,857 | | | $ | 97.50 | | |
Quorum Health Resources (QHR),
Specified Delayed Draw Term
Loan — First Lien | | 02/13/24 | | | 1,970,426 | | | | 97.50 | | |
Quorum Health Resources (QHR),
Term Loan — First Lien | | 05/28/21 | | | 1,038,594 | | | | 97.50 | | |
Rachel Zoe, Inc., Tranche A
Loan — First Lien | | 10/11/23 | | | 1,142,219 | | | | 100.00 | | |
RL James, Inc. (HH Restore
Acquisition, Inc.), Closing Date Term
Loan — First Lien | | 12/15/23 | | | 937,987 | | | | 98.13 | | |
RMBUS Holdco Inc. (Eclat Health
Solutions Inc.), Initial Term
Loan — First Lien | | 01/08/24 | | | 2,770,158 | | | | 98.31 | | |
R-Pac International Corp. (Project
Radio), Initial Revolving Loan — First
Lien | | 12/15/23 - 06/21/24 | | | 254,913 | | | | 97.50 | | |
R-Pac International Corp. (Project
Radio), Initial Term Loan — First Lien | | 11/23/21 | | | 4,823,784 | | | | 97.50 | | |
Sapio Sciences, LLC (Jarvis Bidco),
Initial Term Loan — First Lien | | 11/18/22 | | | 3,225,245 | | | | 100.00 | | |
Sequoia Consulting Group, LLC, Term
Loan — First Lien | | 05/13/22 - 02/10/23 | | | 4,172,543 | | | | 94.00 | | |
SHO Holding I Corp., New Money
Delayed Draw DIP — First Lien | | 04/05/24 | | | 534,882 | | | | 95.50 | | |
SR Landscaping, LLC, Closing Date
Term Loan — First Lien | | 10/30/23 | | | 2,652,376 | | | | 99.00 | | |
SR Landscaping, LLC, Delayed Draw
Term Loan — First Lien | | 05/01/24 | | | 475,256 | | | | 99.00 | | |
SR Landscaping, LLC, Revolving
Loan — First Lien | | 10/30/23 | | | 44,582 | | | | 99.00 | | |
Strategy Corps., LLC, Term
Loan — First Lien | | 06/28/24 | | | 6,492,105 | | | | 98.68 | | |
SuperHero Fire Protection, LLC,
Closing Date Term Loan — First Lien | | 09/01/21 - 06/15/22 | | | 1,448,997 | | | | 100.00 | | |
SuperHero Fire Protection, LLC,
Revolving Loan — First Lien | | 09/01/21 - 06/28/24 | | | 458,316 | | | | 100.00 | | |
SuperHero Fire Protection, LLC,
Second Amendment Incremental
Term Loan — First Lien | | 02/06/23 - 08/31/23 | | | 3,020,461 | | | | 100.00 | | |
Technology Partners, LLC (Imagine
Software), Initial Term Loan — First
Lien | | 11/16/21 | | | 2,250,979 | | | | 99.75 | | |
First Eagle Credit Opportunities Fund | Semiannual Report | June 30, 2024
46
First Eagle Credit Opportunities Fund | Consolidated Schedule of Investments | June 30, 2024 (unaudited)
| Restricted Securities | | Acquisition Date | | Cost | | Carrying Value
Per
Share/Principal | |
The Mutual Group, LLC, Term
Loan — First Lien | | 01/31/24 | | $ | 4,791,365 | | | $ | 98.50 | | |
TMA Buyer, LLC, Delayed Draw Term
Loan — First Lien | | 09/09/22 | | | 146,200 | | | | 93.50 | | |
TMA Buyer, LLC, Revolving Credit
Loan — First Lien | | 06/10/24 | | | 46,547 | | | | 93.50 | | |
TMA Buyer, LLC, Term Loan — First
Lien | | 09/30/21 | | | 1,213,573 | | | | 93.50 | | |
TR Apparel, LLC, Term Loan — First
Lien | | 08/09/23 | | | 3,171,341 | | | | 100.00 | | |
Tricor, LLC, Delayed Draw Term
Loan — First Lien | | 02/13/24 | | | 717,519 | | | | 99.50 | | |
Tricor, LLC, Revolving Loan — First
Lien | | 06/27/24 | | | 127,524 | | | | 99.50 | | |
Tricor, LLC, Term Loan — First Lien | | 10/22/21 | | | 1,896,400 | | | | 99.50 | | |
Triple Crown Consulting, Term A
Loan — First Lien | | 06/02/23 | | | 1,448,748 | | | | 90.75 | | |
TriStrux, LLC, Delayed Draw Term
Loan — First Lien | | 02/13/24 | | | 314,836 | | | | 86.00 | | |
TriStrux, LLC, Initial Term
Loan — First Lien | | 12/23/21 | | | 895,898 | | | | 86.00 | | |
TriStrux, LLC, Revolving Loan — First
Lien | | 12/23/21 - 03/01/24 | | | 314,074 | | | | 86.00 | | |
USALCO, LLC, Second Amendment
Term Loan — First Lien | | 12/28/23 | | | 198,148 | | | | 100.00 | | |
USALCO, LLC, Term Loan A — First
Lien | | 11/05/21 | | | 2,906,008 | | | | 100.00 | | |
VCR Buyer, Inc. (Velocity Clinical
Research), Facility B1 — First Lien | | 12/15/22 | | | 4,823,530 | | | | 98.50 | | |
VCR Buyer, Inc. (Velocity Clinical
Research), Revolving Credit
Facility — First Lien | | 12/15/22 - 09/29/23 | | | 246,599 | | | | 98.50 | | |
Visante Acquisition, LLC, Initial Term
Loan — First Lien | | 01/31/24 | | | 4,895,300 | | | | 98.50 | | |
Waste Resource Management Inc.,
Delayed Draw Term Loan — First Lien | | 05/08/24 | | | 395,925 | | | | 99.00 | | |
Waste Resource Management Inc.,
Term Loan — First Lien | | 12/28/23 | | | 4,152,484 | | | | 99.00 | | |
Zenith American Holding, Inc.
(Harbour Benefit Holding Inc/
HPH-TH Holdings, LLC), Term
Loan — First Lien | | 12/10/21 | | | 873,314 | | | | 100.00 | | |
Total | | | | $ | 339,842,704 | | | | |
First Eagle Credit Opportunities Fund | Semiannual Report | June 30, 2024
47
First Eagle Credit Opportunities Fund | Consolidated Schedule of Investments | June 30, 2024 (unaudited)
(c) The Credit Facility is secured by a lien on all or a portion of the security. See Note 10 for additional details.
(d) All or a portion of this position has not yet settled as of June 30, 2024. The Fund will not accrue interest on its Senior Loans until the settlement date at which point Prime or SOFR will be established.
(e) Security fair valued as of June 30, 2024 by the Adviser as "valuation designee" under the oversight of the Fund's Board of Trustees. Total value of all such securities at June 30, 2024 amounted to $292,850,603, which represents approximately 36.34% of net assets of the Fund.
(f) Securities exempt from registration under Rule 144A or section 4(a)2 of the Securities Act of 1933. Total value of all such securities at June 30, 2024 amounted to $48,818,534, which represents approximately 6.06% of net assets of the Fund.
(g) Represents less than 0.05% of net assets.
(h) Represents 7-day effective yield as of June 30, 2024.
As of June 30, 2024, the gross unrealized appreciation (depreciation) of investments based on the aggregate cost of investment securities and derivative instruments, if applicable, for federal income tax purposes was as follows:
Aggregate gross unrealized appreciation | | $ | 8,375,396 | | |
Aggregate gross unrealized depreciation | | | (36,855,462 | ) | |
Net unrealized depreciation | | $ | (28,480,066 | ) | |
Federal income tax cost | | $ | 922,955,788 | | |
Abbreviations
DIP — Debtor-in-Possession
ICE — Intercontinental Exchange
LIBOR — London Interbank Offered Rate
PIK — Pay in Kind
Preference — A special type of equity investment that shares in the earnings of the company, has limited voting rights, and may have a dividend preference. Preference shares may also have liquidation preference.
SOFR — Secured Overnight Financing Rate
USD — United States Dollar
See Notes to Consolidated Financial Statements.
First Eagle Credit Opportunities Fund | Semiannual Report | June 30, 2024
48
This page was intentionally left blank.
Consolidated Statement of Assets and Liabilities
June 30, 2024 (unaudited)
| | | First Eagle Credit
Opportunities Fund* | |
Assets | |
Investments (Cost $922,955,788) (Note 2 and Note 3) | | $ | 894,475,722 | | |
Cash | | | 19,850,701 | | |
Receivable for investments sold | | | 12,751,778 | | |
Receivable for Fund shares sold | | | 4,533,938 | | |
Accrued interest and dividends receivable | | | 8,174,030 | | |
Due from Adviser (Note 6) | | | 471,709 | | |
Other assets | | | 9,439 | | |
Total Assets | | | 940,267,317 | | |
Liabilities | |
Investment advisory fees payable (Note 6) | | | 812,733 | | |
Payable for investment purchased | | | 41,294,709 | | |
Distribution fees payable (Note 7) | | | 19,191 | | |
Administrative fees payable (Note 6) | | | 228,916 | | |
Service fees payable (Note 7) | | | 5,464 | | |
Credit facility (Net of unamortized deferred financing costs of $2,585,423) (Note 10) | | | 85,014,577 | | |
Payable for dividends to shareholders | | | 5,522,821 | | |
Unrealized depreciation on unfunded delayed draw loan commitments (Note 9) | | | 22,342 | | |
Payable for Fund shares redeemed | | | 49,841 | | |
Accrued expenses and other liabilities | | | 1,431,128 | | |
Total Liabilities | | | 134,401,722 | | |
Commitments and contingent liabilities^ | | | — | | |
Net Assets | | $ | 805,865,595 | | |
Net Assets Consist of | |
Capital stock (par value, $0.001 per share) | | $ | 34,535 | | |
Capital surplus | | | 850,145,367 | | |
Total distributable earnings (losses) | | | (44,314,307 | ) | |
Net Assets | | $ | 805,865,595 | | |
Class A | |
Net Assets | | $ | 41,386,926 | | |
Shares Outstanding | | | 1,763,948 | | |
Net asset value per share and redemption proceeds per share | | | 23.46 | | |
Offering price per share (NAV per share plus maximum sales charge) | | | 24.06 | (1) | |
Authorized common shares | | | Unlimited | | |
Class A-2 | |
Net Assets | | $ | 27,281,026 | | |
Shares Outstanding | | | 1,166,365 | | |
Net asset value per share and redemption proceeds per share | | | 23.39 | | |
Offering price per share (NAV per share plus maximum sales charge) | | | 23.99 | (1) | |
Authorized common shares | | | Unlimited | | |
Class I | |
Net Assets | | $ | 737,197,643 | | |
Shares Outstanding | | | 31,604,184 | | |
Net asset value per share and redemption proceeds per share | | | 23.33 | | |
Authorized common shares | | | Unlimited | | |
* Financial statements are shown on a consolidated basis and include the balances of the First Eagle Credit Opportunities Fund SPV, LLC.
^ See Note 6 and Note 9 in the Notes to the Consolidated Financial Statements
(1) The maximum sales charge is 2.50% for Class A and Class A-2 shares. Class I shares have no front-end sales charges.
See Notes to Consolidated Financial Statements.
First Eagle Credit Opportunities Fund | Semiannual Report | June 30, 2024
50
Consolidated Statement of Operations
Period Ended June 30, 2024 (unaudited)
| | | First Eagle Credit
Opportunities Fund* | |
Investment Income | |
Interest | | $ | 51,184,499 | | |
Dividends | | | 1,216,666 | | |
Total Income | | | 52,401,165 | | |
Expenses | |
Investment advisory fees (Note 6) | | | 5,348,800 | | |
Distribution fees (Note 7) | | | |
Class A | | | 36,709 | | |
Class A-2 | | | 45,022 | | |
Shareholder servicing agent fees | | | 624,627 | | |
Service fees (Note 7) | | | |
Class A-2 | | | 22,511 | | |
Administrative fees (Note 6) | | | 435,530 | | |
Professional fees | | | 741,183 | | |
Custodian and accounting fees | | | 250,731 | | |
Shareholder reporting fees | | | 123,345 | | |
Trustees' fees (Note 6) | | | 13,907 | | |
Interest expense and fees on borrowings (Note 10) | | | 5,717,097 | | |
Recoupment expense | | | 160,855 | | |
Registration and filing fees | | | 85,387 | | |
Other expenses | | | 63,594 | | |
Total Expenses | | | 13,669,298 | | |
Expense waiver (Note 6) | | | (469,977 | ) | |
Net Expenses | | | 13,199,321 | | |
Net Investment Income (Note 2) | | | 39,201,844 | | |
Realized and Unrealized Gains (Losses) on Investments and Unfunded
Delayed Draw Loan Commitments (Note 2 and Note 9) | |
Net realized gains (losses) from: | |
Transactions in investments | | | (2,406,804 | ) | |
| | | | (2,406,804 | ) | |
Changes in unrealized appreciation (depreciation) of: | |
Investments | | | (7,291,961 | ) | |
Unfunded delayed draw loan commitments | | | 122,018 | | |
| | | | (7,169,943 | ) | |
Net realized and unrealized (losses) on investments and unfunded delayed
draw loan commitments | | | (9,576,747 | ) | |
Net Increase in Net Assets Resulting from Operations | | $ | 29,625,097 | | |
* Financial statements are shown on a consolidated basis and include the balances of the First Eagle Credit Opportunities Fund SPV, LLC.
See Notes to Consolidated Financial Statements.
First Eagle Credit Opportunities Fund | Semiannual Report | June 30, 2024
51
Consolidated Statements of Changes in Net Assets
| | | First Eagle Credit
Opportunities Fund* | |
| | | For the Six
Months ended
June 30, 2024
(unaudited) | | For the year
ended
December 31,
2023 | |
Operations | |
Net investment income | | $ | 39,201,844 | | | $ | 57,397,287 | | |
Net realized (loss) from investments | | | (2,406,804 | ) | | | (8,482,811 | ) | |
Change in unrealized appreciation (depreciation) of investments | | | (7,169,943 | ) | | | 14,410,059 | | |
Net increase in net assets resulting from operations | | | 29,625,097 | | | | 63,324,535 | | |
Distributions to Shareholders | |
Distributable earnings: | |
Class A | | | (1,547,501 | ) | | | (1,803,402 | ) | |
Class A-2 | | | (908,987 | ) | | | (279,568 | ) | |
Class I | | | (37,771,960 | ) | | | (54,708,306 | ) | |
Decrease in net assets resulting from distributions | | | (40,228,448 | ) | | | (56,791,276 | ) | |
Fund Share Transactions | |
Class A | |
Net proceeds from shares sold | | | 26,270,663 | | | | 12,518,154 | | |
Net asset value of shares issued for reinvested dividends and
distributions | | | 382,983 | | | | 576,708 | | |
Cost of shares redeemed** | | | (9,101,740 | ) | | | (1,926,600 | ) | |
Increase in net assets from Class A share transactions | | | 17,551,906 | | | | 11,168,262 | | |
Class A-2 | |
Net proceeds from shares sold | | | 13,909,296 | | | | 12,559,604 | | |
Net asset value of shares issued for reinvested dividends and
distributions | | | 688,812 | | | | 224,689 | | |
Cost of shares redeemed | | | (30 | ) | | | — | | |
Increase in net assets from Class A-2 share transactions | | | 14,598,078 | | | | 12,784,293 | | |
Class I | |
Net proceeds from shares sold | | | 176,597,780 | | | | 255,025,311 | | |
Net asset value of shares issued for reinvested dividends and
distributions | | | 7,502,826 | | | | 13,475,692 | | |
Cost of shares redeemed | | | (83,820,999 | ) | | | (67,185,998 | ) | |
Increase in net assets from Class I share transactions | | | 100,279,607 | | | | 201,315,005 | | |
Increase in net assets from Fund share transactions | | | 132,429,591 | | | | 225,267,560 | | |
Net increase in net assets | | | 121,826,240 | | | | 231,800,819 | | |
Net Assets (Note 2) | |
Beginning of period | | | 684,039,355 | | | | 452,238,536 | | |
End of period | | $ | 805,865,595 | | | $ | 684,039,355 | | |
* Financial statements are shown on a consolidated basis and include the balances of the First Eagle Credit Opportunities Fund SPV, LLC.
** Including class exchanges.
First Eagle Credit Opportunities Fund | Semiannual Report | June 30, 2024
52
Consolidated Statements of Changes in Net Assets (continued)
| | | First Eagle Credit
Opportunities Fund* | |
| | | For the Six
Months ended
June 30, 2024
(unaudited) | | For the year
ended
December 31,
2023 | |
Changes in Shares Outstanding | |
Class A | |
Shares outstanding, beginning of period | | | 1,020,016 | | | | 547,224 | | |
Shares sold | | | 1,112,025 | | | | 529,955 | | |
Shares issued on reinvestment of distributions | | | 16,231 | | | | 24,388 | | |
Shares redeemed** | | | (384,324 | ) | | | (81,551 | ) | |
Shares outstanding, end of period | | | 1,763,948 | | | | 1,020,016 | | |
Class A-2 | |
Shares outstanding, beginning of period | | | 546,036 | | | | 4,213 | | |
Shares sold | | | 591,034 | | | | 532,311 | | |
Shares issued on reinvestment of distributions | | | 29,296 | | | | 9,512 | | |
Shares redeemed | | | (1 | ) | | | — | | |
Shares outstanding, end of period | | | 1,166,365 | | | | 546,036 | | |
Class I | |
Shares outstanding, beginning of period | | | 27,342,670 | | | | 18,788,384 | | |
Shares sold | | | 7,512,053 | | | | 10,836,823 | | |
Shares issued on reinvestment of distributions | | | 319,662 | | | | 572,304 | | |
Shares redeemed | | | (3,570,201 | ) | | | (2,854,841 | ) | |
Shares outstanding, end of period | | | 31,604,184 | | | | 27,342,670 | | |
* Financial statements are shown on a consolidated basis and include the balances of the First Eagle Credit Opportunities Fund SPV, LLC.
** Including class exchanges.
See Notes to Consolidated Financial Statements.
First Eagle Credit Opportunities Fund | Semiannual Report | June 30, 2024
53
Consolidated Statement of Cash Flows
June 30, 2024 (unaudited)
| | | First Eagle Credit
Opportunities Fund* | |
Cash Flows from (Used in) Operating Activities: | |
Net increase in net assets resulting from operations | | $ | 29,625,097 | | |
Adjustments to reconcile net increase (decrease) in net assets resulting
from operations to net cash provided by (used in) operating activities: | |
Payments to purchase investments | | | (406,195,852 | ) | |
Proceeds from sale and paydowns of investments | | | 290,455,259 | | |
Net decrease in short term investments | | | 34,862,163 | | |
Realized (gain) loss on investments | | | 2,406,804 | | |
Change in unrealized (appreciation) depreciation on investments | | | 7,291,961 | | |
Amortization (accretion) of bond premium (discount) | | | (5,023,669 | ) | |
Change in unrealized (appreciation) depreciation on unfunded delayed
draw loan commitments | | | (122,018 | ) | |
(Increases) decreases in operating assets: | |
Accrued interest and dividends receivable | | | (920,893 | ) | |
Due from Adviser | | | 31,108 | | |
Other assets | | | (1,865,700 | ) | |
Increases (decreases) in operating liabilities | |
Investment advisory fees payable | | | 111,869 | | |
Administrative fees payable | | | 221,721 | | |
Distribution fees payable | | | 9,738 | | |
Service fees payable | | | 3,174 | | |
Accrued expenses and other liabilities | | | 361,551 | | |
Net cash provided by (used in) operating activities | | $ | (48,747,687 | ) | |
Cash Flows from (Used in) Financing Activities: | |
Proceeds from shares sold | | | 217,770,262 | | |
Payments on shares redeemed | | | (92,872,928 | ) | |
Cash distributions paid | | | (30,921,255 | ) | |
Borrowings under Credit Facility | | | 27,800,000 | | |
Repayment under Credit Facility | | | (59,200,000 | ) | |
Net cash provided by (used in) financing activities | | $ | 62,576,079 | | |
Net change in cash and cash denominated in foreign currencies | | | 13,828,392 | | |
Cash, beginning of period | | | 6,022,309 | | |
Cash, end of period | | $ | 19,850,701 | | |
Supplemental disclosure of cash flow information:
Cash paid during the period for interest in the amount of $5,317,363.
Non-cash financing activities consist of reinvestment of distributions in the amount $8,574,621.
* Financial statements are shown on a consolidated basis and include the balances of the First Eagle Credit Opportunities Fund SPV, LLC.
See Notes to Consolidated Financial Statements.
First Eagle Credit Opportunities Fund | Semiannual Report | June 30, 2024
54
This page was intentionally left blank.
First Eagle Credit Opportunities Fund
| | | Per share operating performance* | |
Class A | | For the Six
Months Ended
June 30, 2024**
(unaudited) | | For the Year
Ended
December 31,
2023** | | For the Year
Ended
December 31,
2022** | | For the Year
Ended
December 31,
2021** | | For the Period
12/02/20^ -
12/31/20 | |
Investment Operations | |
Net asset value,
beginning of period | | $ | 23.79 | | | $ | 23.47 | | | $ | 26.22 | | | $ | 25.48 | | | $ | 25.15 | | |
Net investment Income | | | 1.20 | | | | 2.49 | | | | 2.10 | | | | 2.10 | | | | 0.10 | | |
Net realized and
unrealized gains(losses)
on investments and
unfunded delayed draw
loan commitments | | | (0.29 | ) | | | 0.20 | | | | (2.93 | ) | | | 0.53 | | | | 0.32 | | |
Total investment
operations | | | 0.91 | | | | 2.69 | | | | (0.83 | ) | | | 2.63 | | | | 0.42 | | |
Less Dividends and Distributions | |
From net investment
income | | | (1.24 | ) | | | (2.37 | ) | | | (1.91 | ) | | | (1.81 | ) | | | (0.09 | ) | |
From capital gains | | | — | | | | — | | | | (0.01 | ) | | | (0.08 | ) | | | — | | |
Total distributions | | | (1.24 | ) | | | (2.37 | ) | | | (1.92 | ) | | | (1.89 | ) | | | (0.09 | ) | |
Net asset value,
end of period | | $ | 23.46 | | | $ | 23.79 | | | $ | 23.47 | | | $ | 26.22 | | | $ | 25.48 | | |
Total return(a) | | | 3.92 | %(b) | | | 12.03 | % | | | (3.23 | )% | | | 10.60 | % | | | 1.62 | %(b) | |
Net assets, end of
period (thousands) | | $ | 41,387 | | | $ | 24,269 | | | $ | 12,844 | | | $ | 7,592 | | | $ | 1,016 | | |
Ratios to Average Net Assets | |
Operating expenses
excluding fee waivers | | | 3.94 | %(c) | | | 3.87 | % | | | 3.76 | % | | | 4.83 | % | | | 5.45 | %(c) | |
Operating expenses
including fee waivers | | | 3.81 | %(c) | | | 3.65 | % | | | 2.62 | % | | | 2.28 | % | | | 2.75 | %(c) | |
Net investment income
excluding fee waivers | | | 10.07 | %(c) | | | 10.32 | % | | | 7.36 | % | | | 5.47 | % | | | 2.16 | %(c) | |
Net investment income
including fee waivers | | | 10.19 | %(c) | | | 10.55 | % | | | 8.50 | % | | | 8.02 | % | | | 4.86 | %(c) | |
Supplemental Data | |
Portfolio turnover rate | | | 39.18 | %(b) | | | 68.91 | % | | | 49.93 | % | | | 73.15 | % | | | 21.38 | %(b) | |
^ Inception date.
* Per share amounts have been calculated using the average shares method.
** Financial statements are shown on a consolidated basis and include the balances of the First Eagle Credit Opportunities Fund SPV, LLC.
(a) Does not take into account the sales charge of 2.50% for Class A shares. Prior to April 30, 2022, the sales charge for Class A was 3.50%, which was also not taken into account.
(b) Not annualized.
(c) Annualized.
See Notes to Consolidated Financial Statements.
First Eagle Credit Opportunities Fund | Semiannual Report | June 30, 2024
56
First Eagle Credit Opportunities Fund
| | | Per share operating performance* | |
Class A-2 | | For the Six
Months Ended
June 30, 2024**
(unaudited) | | For the Year
Ended
December 31,
2023** | | For the Period
5/31/22^ - 12/31/22** | |
Investment Operations | |
Net asset value, beginning of period | | $ | 23.70 | | | $ | 23.42 | | | $ | 24.94 | | |
Net investment Income | | | 1.15 | | | | 2.42 | | | | 1.18 | | |
Net realized and unrealized gains(losses) on
investments and unfunded delayed draw
loan commitments | | | (0.28 | ) | | | 0.16 | | | | (1.51 | ) | |
Total investment operations | | | 0.87 | | | | 2.58 | | | | (0.33 | ) | |
Less Dividends and Distributions | |
From net investment income | | | (1.18 | ) | | | (2.30 | ) | | | (1.18 | ) | |
From capital gains | | | — | | | | — | | | | (0.01 | ) | |
Total distributions | | | (1.18 | ) | | | (2.30 | ) | | | (1.19 | ) | |
Net asset value, end of period | | $ | 23.39 | | | $ | 23.70 | | | $ | 23.42 | | |
Total return(a) | | | 3.77 | %(b) | | | 11.52 | % | | | (1.34 | )%(b) | |
Net assets, end of period (thousands) | | $ | 27,281 | | | $ | 12,940 | | | $ | 99 | | |
Ratios to Average Net Assets | |
Operating expenses excluding fee waivers | | | 4.26 | %(c) | | | 4.35 | % | | | 4.39 | %(c) | |
Operating expenses including fee waivers | | | 4.19 | %(c) | | | 4.14 | % | | | 3.57 | %(c) | |
Net investment income excluding fee waivers | | | 9.79 | %(c) | | | 10.05 | % | | | 7.50 | %(c) | |
Net investment income including fee waivers | | | 9.86 | %(c) | | | 10.26 | % | | | 8.32 | %(c) | |
Supplemental Data | |
Portfolio turnover rate | | | 39.18 | %(b) | | | 68.91 | % | | | 49.93 | %(b) | |
^ Inception date.
* Per share amounts have been calculated using the average shares method.
** Financial statements are shown on a consolidated basis and include the balances of the First Eagle Credit Opportunities Fund SPV, LLC.
(a) Does not take into account the sales charge of 2.50% for Class A-2 shares.
(b) Not annualized.
(c) Annualized.
See Notes to Consolidated Financial Statements.
First Eagle Credit Opportunities Fund | Semiannual Report | June 30, 2024
57
First Eagle Credit Opportunities Fund
| | | Per share operating performance* | |
Class I | | For the Six
Months Ended
June 30, 2024***
(unaudited) | | For the Year
Ended
December 31,
2023*** | | For the Year
Ended
December 31,
2022*** | | For the Year
Ended
December 31,
2021*** | | For the Period
9/15/20^ -
12/31/20 | |
Investment Operations | |
Net asset value,
beginning of period | | $ | 23.66 | | | $ | 23.38 | | | $ | 26.19 | | | $ | 25.47 | | | $ | 25.00 | | |
Net investment Income | | | 1.24 | | | | 2.55 | | | | 2.17 | | | | 2.27 | | | | 0.33 | | |
Net realized and
unrealized gains(losses)
on investments and
unfunded delayed draw
loan commitments | | | (0.29 | ) | | | 0.21 | | | | (2.94 | ) | | | 0.57 | | | | 0.45 | | |
Total investment
operations | | | 0.95 | | | | 2.76 | | | | (0.77 | ) | | | 2.84 | | | | 0.78 | | |
Less Dividends and Distributions | |
From net
investment income | | | (1.28 | ) | | | (2.48 | ) | | | (2.03 | ) | | | (2.04 | ) | | | (0.30 | ) | |
From capital gains | | | — | | | | — | | | | (0.01 | ) | | | (0.08 | ) | | | (0.00 | )** | |
Return of capital | | | — | | | | — | | | | — | | | | — | | | | (0.01 | ) | |
Total distributions | | | (1.28 | ) | | | (2.48 | ) | | | (2.04 | ) | | | (2.12 | ) | | | (0.31 | ) | |
Net asset value,
end of period | | $ | 23.33 | | | $ | 23.66 | | | $ | 23.38 | | | $ | 26.19 | | | $ | 25.47 | | |
Total return | | | 4.10 | %(a) | | | 12.41 | % | | | (3.02 | )% | | | 11.45 | % | | | 3.13 | %(a) | |
Net assets, end of
period (thousands) | | $ | 737,198 | | | $ | 646,830 | | | $ | 439,296 | | | $ | 181,346 | | | $ | 41,086 | | |
Ratios to Average Net Assets | |
Operating expenses
excluding fee waivers | | | 3.68 | %(b) | | | 3.62 | % | | | 3.48 | % | | | 4.18 | % | | | 4.70 | %(b) | |
Operating expenses
including fee waivers | | | 3.55 | %(b) | | | 3.39 | % | | | 2.41 | % | | | 1.70 | % | | | 2.00 | %(b) | |
Net investment income
excluding fee waivers | | | 10.52 | %(b) | | | 10.60 | % | | | 7.71 | % | | | 6.15 | % | | | 1.74 | %(b) | |
Net investment income
including fee waivers | | | 10.65 | %(b) | | | 10.83 | % | | | 8.79 | % | | | 8.63 | % | | | 4.44 | %(b) | |
Supplemental Data | |
Portfolio turnover rate | | | 39.18 | %(a) | | | 68.91 | % | | | 49.93 | % | | | 73.15 | % | | | 21.38 | %(a) | |
^ Inception date.
* Per share amounts have been calculated using the average shares method.
** Amount represents less than $0.01 per share.
*** Financial statements are shown on a consolidated basis and include the balances of the First Eagle Credit Opportunities Fund SPV, LLC.
(a) Not annualized.
(b) Annualized.
See Notes to Consolidated Financial Statements.
First Eagle Credit Opportunities Fund | Semiannual Report | June 30, 2024
58
This page was intentionally left blank.
Notes to Consolidated Financial Statements
Note 1 — Organization
First Eagle Credit Opportunities Fund (the "Fund") is a non-diversified, closed-end management investment company registered under the Investment Company Act of 1940, as amended (the "1940 Act") that continuously offers its shares of beneficial interest (the "Common Shares"), and is operated as an "interval fund." The Fund was organized as a Delaware statutory trust on July 8, 2020, pursuant to a Declaration of Trust governed by the laws of the State of Delaware as amended and restated by the Amended and Restated Declaration of Trust, dated as of September 4, 2020.
The Fund's primary investment objective is to provide current income, with a secondary objective of providing long-term risk-adjusted returns. The Fund seeks to achieve its investment objective by investing in a portfolio of a variety of credit asset classes. The Fund will invest, under normal market conditions, at least 80% of its Managed Assets, defined as total assets of the Fund (including any assets attributable to borrowings for investment purposes) minus the sum of the Fund's accrued liabilities (other than liabilities representing borrowings for investment purposes), in a credit portfolio of below investment grade credit assets including syndicated bank loans, middle market "club" loans (senior secured loans in middle market companies funded by an arranged group of lenders that generally does not involve syndication), direct lending (consisting of first lien loans, including unitranche loans), asset-based loans, and high-yield bonds (commonly referred to as "junk" bonds).
The Fund currently offers three classes of Common Shares: Class A Shares, Class A-2 Shares and Class I Shares. The Fund has been granted exemptive relief (the "Exemptive Relief") from the Securities and Exchange Commission (the "SEC") that permits the Fund to issue multiple classes of shares and to impose asset-based distribution fees and early-withdrawal fees. The Fund may offer additional classes of shares in the future.
First Eagle Investment Management, LLC (the "Adviser") is the investment adviser of the Fund. The Adviser is a subsidiary of First Eagle Holdings, Inc. ("First Eagle Holdings"). A controlling interest in First Eagle Holdings is owned by BCP CC Holdings L.P., a Delaware limited partnership ("BCP CC Holdings"). BCP CC Holdings GP L.L.C., a Delaware limited liability company, is the general partner of BCP CC Holdings and has two managing members, Blackstone Capital Partners VI L.P. ("BCP VI") and Corsair IV Financial Services Capital Partners L.P. ("Corsair IV"). BCP VI and Corsair IV are indirectly controlled by Blackstone Inc. ("Blackstone") and Corsair Capital LLC ("Corsair"), respectively. Investment vehicles indirectly controlled by Blackstone and Corsair and certain co-investors own a majority economic interest in First Eagle Holdings and the Adviser through BCP CC Holdings.
First Eagle Alternative Credit, LLC (the "Subadviser"), in its capacity as the alternative credit group of the Adviser, serves as the Fund's investment subadviser. The Subadviser is an investment adviser for both direct lending and broadly
First Eagle Credit Opportunities Fund | Semiannual Report | June 30, 2024
60
Notes to Consolidated Financial Statements
syndicated investments, through public and private vehicles, collateralized loan obligations, separately managed accounts and commingled funds. The Subadviser was formed in 2009 under the name THL Credit Advisors LLC. In January 2020, the Subadviser was acquired by the Adviser and is a wholly-owned subsidiary of the Adviser.
Note 2 — Significant Accounting Policies
The following is a summary of significant accounting policies that are adhered to by the Fund. The Fund is an investment company and, accordingly, follows the investment company accounting and reporting guidance of the Financial Accounting Standards Board Accounting Standards (the "FASB") Codification Topic 946 — Investment Companies, which is part of U.S. generally accepted accounting principles ("GAAP").
a) Investments in Subsidiaries — The First Eagle Credit Opportunities Fund SPV, LLC (the "SPV"), established on January 11, 2021, is a wholly-owned Delaware limited liability company, which functions as the Fund's special purpose, bankruptcy-remote, financing subsidiary. The consolidated financial statements include the accounts of the Fund and the SPV. All intercompany transactions and balances have been eliminated. As of June 30, 2024, the SPV has $220,782,428 in net assets, representing 27.40% of the Fund's net assets.
b) Investment Valuation — The Fund's net asset value ("NAV") per share is computed by dividing the total current value of the assets of the Fund, less its liabilities, by the total number of shares outstanding at the time of such computation. The Fund computes its NAV per share as of the close of trading on each day the New York Stock Exchange ("NYSE") is open for trading.
The Fund's securities are valued by various methods, as described below:
Portfolio securities and other assets for which market quotes are readily available are valued at market value.
Senior Loans refers to Loans and Assignments, Bank Loans, Direct Lending and Middle Market "Club" Loans. Senior Loans are primarily valued by using a composite loan price at the mean of the bid and ask prices from an approved pricing service. Initial purchases of investments, including Direct Loans, may be fair valued at their cost which approximates market value and are monitored by the Adviser and the Subadviser (individually or collectively referred to as "First Eagle Management") for any significant positive or negative events subsequent to the date of the original investment that necessitates a change to another valuation method, such as the market or income approach. Subsequent to the initial purchase, direct loans may be valued utilizing the income approach method. The income approach method values an investment by estimating the present value of future economic benefits it is expected to produce. These benefits include earnings, cash flows and disposition proceeds. Expected current value is determined by discounting expected cash flows at rate of return
First Eagle Credit Opportunities Fund | Semiannual Report | June 30, 2024
61
Notes to Consolidated Financial Statements
(discount rate or cost of capital) that reflects the risk associated with realizing the cash flows in the amounts and times projected.
All bonds, whether listed on an exchange or traded in the over-the-counter market for which market quotations are readily available are generally priced at the evaluated bid price provided by an approved pricing service as of the close of trading on the NYSE (normally 4:00 PM EST), or dealers in the over-the-counter markets in the United States or abroad. Pricing services and broker-dealers use multiple valuation techniques to determine value. In instances where sufficient market activity exists, dealers or pricing services utilize a market-based approach through which quotes from market makers are used to determine fair value. In instances where sufficient market activity may not exist or is limited, the dealers or pricing services also utilize proprietary valuation models which may consider market transactions in comparable instruments and the various relationships between instruments in determining value and/or market characteristics such as benchmark yield curves, option-adjusted spreads, credit spreads, estimated default rates, coupon rates, anticipated timing of principal repayments, underlying collateral, and other unique features of the instrument in order to estimate the relevant cash flows, which are then discounted to calculate the fair values. First Eagle Management's Valuation Committee, at least annually, will review the pricing service's inputs, methods, models, and assumptions for its evaluated prices.
Non-exchange traded equity securities may be valued at prices supplied by the Fund's pricing agent based on the average of the bid/ask prices quoted by brokers that are knowledgeable about the securities. If broker quotes are unavailable, then the equity will be fair valued as described below.
Investment companies, including money market funds, are valued at their net asset value.
If a price is not available from an independent pricing service or broker, or if the price provided is believed to be unreliable, the security will be fair valued as described below. As a general principle, the fair value of a security is the amount that the owner might reasonably expect to receive for it in a current sale. Fair value methods may include, but are not limited to, the use of market comparable and/or income approach methodologies. Using a fair value pricing methodology to value securities may result in a value that is different from a security's most recent sale price and from the prices used by other investment companies to calculate their NAV. Determination of fair value is uncertain because it involves subjective judgments and estimates. There can be no assurance that the Fund's valuation of a security will not differ from the amount that it realizes upon the sale of such security.
The Fund adopted provisions surrounding fair value measurements and disclosures that define fair value, establish a framework for measuring fair value in GAAP and expand disclosures about fair value measurements. This applies to fair value measurements that are already required or permitted by
First Eagle Credit Opportunities Fund | Semiannual Report | June 30, 2024
62
Notes to Consolidated Financial Statements
other accounting standards and is intended to increase consistency of those measurements and applies broadly to securities and other types of assets and liabilities.
The Fund discloses the fair value of its investments in a hierarchy that prioritizes the inputs or assumptions to valuation techniques used to measure fair value. These inputs are used in determining the value of the Fund's investments and are summarized in the following fair value hierarchy:
Level 1 — Quoted prices in active markets for identical securities;
Level 2 — Other significant observable inputs (including quoted prices for similar securities, interest rates, prepayment speeds, credit risk, etc.);
Level 3 — Other significant unobservable inputs (including the Fund's own assumption in determining the fair value of investments).
The two primary significant unobservable inputs used in the fair value measurement of the Fund's debt investments, excluding asset-backed loans, is the weighted average cost of capital, or WACC, and the comparative yield. Significant increases (decreases) in the WACC or in the comparative yield in isolation would result in a significantly lower (higher) fair value measurement. In determining the WACC, for the income, or yield approach, the Fund considers current market yields and multiples, portfolio company performance, leverage levels, credit quality, among other factors, including U.S. federal tax rates, in its analysis. Changes in one or more of these factors can have a similar directional change on other factors in determining the appropriate WACC to use in the income approach. In determining the comparative yield, for the income, or yield approach, the Fund considers current market yields and multiples, weighted average cost of capital, portfolio company performance, leverage levels, credit quality, among other factors, including U.S. federal tax rates, in its analysis.
The primary significant unobservable inputs used in the fair value measurement of the Fund's investments in asset-backed loans is the net realized value of the underlying collateral of the loan. The Fund considers information provided by the borrower in its compliance certificates and information from third party appraisals, among other factors, in its analysis. Significant increases (decreases) in net realizable value of the underlying collateral would result in a significantly higher (lower) fair value measurement.
The primary significant unobservable input used in the fair value measurement of the Fund's equity investments, investments in warrants, and other debt investments using a market approach is the EBITDA multiple adjusted by management for differences between the investment and referenced comparables, or the multiple. Significant increases (decreases) in the multiple in isolation would result in a significantly higher (lower) fair value measurement. To determine the multiple for the market approach, the Fund considers current market trading and/or transaction multiples, portfolio company performance (financial ratios) relative to public and private peer companies and leverage
First Eagle Credit Opportunities Fund | Semiannual Report | June 30, 2024
63
Notes to Consolidated Financial Statements
levels, among other factors. Changes in one or more of these factors can have a similar directional change on other factors in determining the appropriate multiple to use in the market approach.
Fair valuation of securities, other financial instruments or other assets (collectively, "securities") held by the Fund are determined in good faith by the Adviser as "valuation designee" under the oversight of the Fund's Board of Trustees (the "Board"). The Board Valuation, Liquidity and Allocations Committee (the "Committee") oversees the execution of the valuation procedures for the Fund. In accordance with Rule 2a-5 under the 1940 Act, the Board has designated the Adviser the "valuation designee" to perform the Fund's fair value determinations. The Adviser's fair valuation process is subject to Board oversight and certain reporting and other requirements.
The following table summarizes the valuation of the Fund's investments under the fair value hierarchy levels as of June 30, 2024:
Description | | Level 1 | | Level 2 | | Level 3‡ | | Total | |
Assets | |
Common Stocks† | | $ | — | | | $ | — | | | $ | 2,168,244 | | | $ | 2,168,244 | | |
Corporate Bonds† | | | — | | | | 48,818,534 | | | | — | | | | 48,818,534 | | |
Senior Loans | |
Advertising | | | — | | | | 13,590,535 | | | | 2,333,477 | | | | 15,924,012 | | |
Aerospace & Defense | | | — | | | | 7,561,663 | | | | 1,913,739 | | | | 9,475,402 | | |
Agricultural & Farm Machinery | | | — | | | | — | | | | 969,583 | | | | 969,583 | | |
Air Freight & Logistics | | | — | | | | 1,627,445 | | | | — | | | | 1,627,445 | | |
Airlines | | | — | | | | 4,137,500 | | | | — | | | | 4,137,500 | | |
Alternative Carriers | | | — | | | | 2,633,861 | | | | — | | | | 2,633,861 | | |
Apparel Retail | | | — | | | | — | | | | 2,108,952 | | | | 2,108,952 | | |
Apparel, Accessories & Luxury Goods | | | — | | | | — | | | | 11,878,492 | | | | 11,878,492 | | |
Application Software | | | — | | | | 28,822,338 | | | | 24,756,598 | | | | 53,578,936 | | |
Asset Management & Custody Banks | | | — | | | | 7,892,138 | | | | 6,999,837 | | | | 14,891,975 | | |
Auto Parts & Equipment | | | — | | | | 16,720,155 | | | | 1,408,664 | | | | 18,128,819 | | |
Automotive Retail | | | — | | | | — | | | | 2,996,028 | | | | 2,996,028 | | |
Brewers | | | — | | | | — | | | | 17,965,305 | | | | 17,965,305 | | |
Broadcasting | | | — | | | | 10,199,555 | | | | — | | | | 10,199,555 | | |
Casinos & Gaming | | | — | | | | 16,014,752 | | | | — | | | | 16,014,752 | | |
Commercial Printing | | | — | | | | 2,317,909 | | | | 1,478,483 | | | | 3,796,392 | | |
Commodity Chemicals | | | — | | | | 1,003,750 | | | | 4,138,954 | | | | 5,142,704 | | |
Communications Equipment | | | — | | | | 3,580,331 | | | | — | | | | 3,580,331 | | |
First Eagle Credit Opportunities Fund | Semiannual Report | June 30, 2024
64
Notes to Consolidated Financial Statements
Description | | Level 1 | | Level 2 | | Level 3‡ | | Total | |
Construction & Engineering | | $ | — | | | $ | 1,976,053 | | | $ | 4,129,469 | | | $ | 6,105,522 | | |
Construction Machinery & Heavy Trucks | | | — | | | | — | | | | 1,817,288 | | | | 1,817,288 | | |
Distributors | | | — | | | | 8,082,479 | | | | — | | | | 8,082,479 | | |
Diversified Chemicals | | | — | | | | — | | | | 8,491,092 | | | | 8,491,092 | | |
Diversified Metals & Mining | | | — | | | | 308,925 | | | | 8,745,657 | | | | 9,054,582 | | |
Diversified Support Services | | | — | | | | — | | | | 4,427,791 | | | | 4,427,791 | | |
Education Services | | | — | | | | 3,012,195 | | | | 8,142,158 | | | | 11,154,353 | | |
Electric Utilities | | | — | | | | 1,418,248 | | | | — | | | | 1,418,248 | | |
Electrical Components & Equipment | | | — | | | | — | | | | 6,193,600 | | | | 6,193,600 | | |
Electronic Equipment & Instruments | | | — | | | | 816,167 | | | | — | | | | 816,167 | | |
Electronic Manufacturing Services | | | — | | | | 10,671,581 | | | | — | | | | 10,671,581 | | |
Environmental & Facilities Services | | | — | | | | 2,957,229 | | | | 3,178,011 | | | | 6,135,240 | | |
Financial Exchanges & Data | | | — | | | | 4,822,098 | | | | — | | | | 4,822,098 | | |
Footwear | | | — | | | | — | | | | 518,511 | | | | 518,511 | | |
Health Care Equipment | | | — | | | | 5,986,266 | | | | — | | | | 5,986,266 | | |
Health Care Facilities | | | — | | | | 10,400,670 | | | | 6,629,687 | | | | 17,030,357 | | |
Health Care Services | | | — | | | | 40,658,878 | | | | 88,700,136 | | | | 129,359,014 | | |
Health Care Supplies | | | — | | | | 7,818,472 | | | | — | | | | 7,818,472 | | |
Health Care Technology | | | — | | | | 11,202,197 | | | | 9,793,951 | | | | 20,996,148 | | |
Heavy Electrical Equipment | | | — | | | | 999,004 | | | | — | | | | 999,004 | | |
Highways & Railtracks | | | — | | | | — | | | | 2,978,542 | | | | 2,978,542 | | |
Home Furnishings | | | — | | | | — | | | | 2,961,107 | | | | 2,961,107 | | |
Home Improvement Retail | | | — | | | | — | | | | 3,194,361 | | | | 3,194,361 | | |
Hotels, Resorts & Cruise Lines | | | — | | | | 7,005,329 | | | | — | | | | 7,005,329 | | |
Household Products | | | — | | | | — | | | | 1,822,496 | | | | 1,822,496 | | |
Human Resource & Employment Services | | | — | | | | — | | | | 10,759,965 | | | | 10,759,965 | | |
Industrial Machinery | | | — | | | | 23,397,203 | | | | — | | | | 23,397,203 | | |
Insurance Brokers | | | — | | | | 10,017,515 | | | | 14,131,855 | | | | 24,149,370 | | |
Integrated Telecommunication Services | | | — | | | | 6,526,665 | | | | — | | | | 6,526,665 | | |
Interactive Media & Services | | | — | | | | — | | | | 5,123,227 | | | | 5,123,227 | | |
Internet & Direct Marketing Retail | | | — | | | | 2,568,303 | | | | 8,198,118 | | | | 10,766,421 | | |
Internet Services & Infrastructure | | | — | | | | 365,744 | | | | 2,269,750 | | | | 2,635,494 | | |
Investment Banking & Brokerage | | | — | | | | 4,987,834 | | | | — | | | | 4,987,834 | | |
IT Consulting & Other Services | | | — | | | | 9,954,518 | | | | 16,360,251 | | | | 26,314,769 | | |
First Eagle Credit Opportunities Fund | Semiannual Report | June 30, 2024
65
Notes to Consolidated Financial Statements
Description | | Level 1 | | Level 2 | | Level 3‡ | | Total | |
Leisure Facilities | | $ | — | | | $ | — | | | $ | 3,892,096 | | | $ | 3,892,096 | | |
Leisure Products | | | — | | | | 1,345,670 | | | | — | | | | 1,345,670 | | |
Life Sciences Tools & Services | | | — | | | | — | | | | 9,052,793 | | | | 9,052,793 | | |
Managed Health Care | | | — | | | | — | | | | 2,196,218 | | | | 2,196,218 | | |
Metal & Glass Containers | | | — | | | | 12,437,517 | | | | — | | | | 12,437,517 | | |
Movies & Entertainment | | | — | | | | — | | | | 5,702,823 | | | | 5,702,823 | | |
Multi-Sector Holdings | | | — | | | | — | | | | 2,929,116 | | | | 2,929,116 | | |
Office Services & Supplies | | | — | | | | — | | | | 6,490,967 | | | | 6,490,967 | | |
Oil & Gas Storage & Transportation | | | — | | | | — | | | | 4,798,088 | | | | 4,798,088 | | |
Packaged Foods & Meats | | | — | | | | 5,000,836 | | | | — | | | | 5,000,836 | | |
Paper Packaging | | | — | | | | — | | | | 10,453,011 | | | | 10,453,011 | | |
Paper Products | | | — | | | | — | | | | 5,013,913 | | | | 5,013,913 | | |
Pharmaceuticals | | | — | | | | 7,649,478 | | | | 19,004,392 | | | | 26,653,870 | | |
Real Estate Services | | | — | | | | 3,397,899 | | | | 4,803,156 | | | | 8,201,055 | | |
Research & Consulting Services | | | — | | | | 17,727,727 | | | | 10,208,621 | | | | 27,936,348 | | |
Security & Alarm Services | | | — | | | | — | | | | 4,990,924 | | | | 4,990,924 | | |
Soft Drinks | | | — | | | | 2,976,072 | | | | — | | | | 2,976,072 | | |
Specialized Consumer Services | | | — | | | | — | | | | 15,905,755 | | | | 15,905,755 | | |
Specialized Finance | | | — | | | | 19,736,235 | | | | 3,233,796 | | | | 22,970,031 | | |
Specialty Chemicals | | | — | | | | 7,490,934 | | | | — | | | | 7,490,934 | | |
Systems Software | | | — | | | | 12,840,365 | | | | 1,316,311 | | | | 14,156,676 | | |
Technology Hardware, Storage &
Peripherals | | | — | | | | 3,926,789 | | | | — | | | | 3,926,789 | | |
Textiles | | | — | | | | — | | | | 3,448,563 | | | | 3,448,563 | | |
Trading Companies & Distributors | | | — | | | | 7,006,875 | | | | — | | | | 7,006,875 | | |
Trucking | | | — | | | | 2,620,310 | | | | 8,393,560 | | | | 11,013,870 | | |
Water Utilities | | | — | | | | — | | | | 4,561,548 | | | | 4,561,548 | | |
Total Senior Loans | | | — | | | | 396,212,212 | | | | 423,910,786 | | | | 820,122,998 | | |
Warrants† | | | — | | | | — | | | | 5,318 | | | | 5,318 | | |
Short-Term Investments | |
Investment Companies | | | 23,360,628 | | | | — | | | | — | | | | 23,360,628 | | |
Total | | $ | 23,360,628 | | | $ | 445,030,746 | | | $ | 426,084,348 | | | $ | 894,475,722 | | |
First Eagle Credit Opportunities Fund | Semiannual Report | June 30, 2024
66
Notes to Consolidated Financial Statements
Description | | Level 1 | | Level 2 | | Level 3‡ | | Total | |
Liabilities: | |
Unfunded Commitments* | | $ | — | | | $ | — | | | $ | (22,342 | ) | | $ | (22,342 | ) | |
Total | | $ | 23,360,628 | | | $ | 445,030,746 | | | $ | 426,062,006 | | | $ | 894,453,380 | | |
† See Consolidated Schedule of Investments for additional detailed categorizations.
* Unfunded commitments are presented at net unrealized appreciation (depreciation)
‡ Value determined using significant unobservable inputs.
The following is a reconciliation of assets in which significant unobservable inputs (Level 3) were used in determining fair value:
| | Common
Stocks | | Senior
Loans | | Warrants | | Unfunded
Commitments* | | Total | |
Beginning Balance —
market value | | $ | 635,682 | | | $ | 346,636,800 | | | $ | — | | | $ | (144,360 | ) | | $ | 347,128,122 | | |
Purchases(1) | | | 1,127,882 | | | | 159,061,326 | | | | — | | | | — | | | | 160,189,208 | | |
Sales(2) | | | — | | | | (67,871,736 | ) | | | — | | | | — | | | | (67,871,736 | ) | |
Transfer In — Level 3 | | | 592,087 | | | | 14,899,263 | | | | — | | | | — | | | | 15,491,350 | | |
Transfer Out — Level 3 | | | — | | | | (22,188,119 | ) | | | — | | | | — | | | | (22,188,119 | ) | |
Accrued discounts/(premiums) | | | — | | | | 1,766,698 | | | | — | | | | — | | | | 1,766,698 | | |
Realized Gains (Losses) | | | — | | | | (2,128,870 | ) | | | — | | | | — | | | | (2,128,870 | ) | |
Change in Unrealized
Appreciation (Depreciation) | | | (187,407 | ) | | | (6,264,576 | ) | | | 5,318 | | | | 122,018 | | | | (6,324,647 | ) | |
Ending Balance —
market value | | $ | 2,168,244 | | | $ | 423,910,786 | | | $ | 5,318 | | | $ | (22,342 | ) | | $ | 426,062,006 | | |
Change in unrealized
gains or (losses) relating
to assets still held at
reporting date | | $ | (187,407 | ) | | $ | (6,904,499 | ) | | $ | 5,318 | | | $ | 97,327 | | | $ | (6,989,261 | ) | |
(1) Purchases include all purchases of securities and securities received in corporate actions.
(2) Sales include all sales of securities, maturities, paydowns and securities tendered in corporate actions.
* Unfunded commitments are presented at net unrealized appreciation (depreciation).
Investments were transferred into Level 3 during the period ended June 30, 2024 due to changes in the quantity and quality of information, specifically the number of vendor quotes available to support the valuation of each investment and the increased incidence of stale prices, as assessed by the Adviser. Investments were transferred out of Level 3 during the period ended June 30, 2024 due to improvements in the quantity and quality of information, specifically the number of vendor quotes available to support the valuation of each investment and the reduced incidence of stale prices, as assessed by the Adviser.
First Eagle Credit Opportunities Fund | Semiannual Report | June 30, 2024
67
Notes to Consolidated Financial Statements
The following is a summary of the Fund's valuation techniques and significant amounts of unobservable inputs used in the Fund's Level 3 securities as of June 30, 2024:
| Investment Type | | Fair Value as of
June 30, 2024 | | Valuation
Technique(s) | | Unobservable
Inputs | | Range
(Weighted
Average) | | Direction
Change in Fair
Value Resulting
from Increase
in Unobservable
Inputs(a) | |
Common Stock | | $ | 2,168,229 | | | Broker Quotes | | N/A | | N/A | | Increase | |
| | | | 15 | | | Market
Comparable
Companies | | EBITDA
Multiple | |
4.32x-8.37X
(8.26X) | | Increase | |
| | | | 0 | | | Market
Waterfall
Approach | | Expected
sales and
earnings | |
N/A | | Increase | |
Common Stock
Total | | | 2,168,244 | | | | | | | | | | |
| Warrant | | | 5,318 | | | Option
Pricing Model | | Volatility | | 35%-45% (40%) | | Increase | |
Warrant Total | | | 5,318 | | | | | | | | | | |
Senior Loans | | | 131,065,514 | | | Broker Quotes | | N/A | | N/A | | Increase | |
| | | | 266,615,031 | | | Discounted
Cash Flow
(Income
Approach | | Comparable
Yield | |
9.58%-26.97%
(11.33%) | | Decrease | |
| | | 23,836,728 | | | Liquidation | | Collateral
Value | | 19.6-2,432.4
(548.4)* | | Increase | |
| | | | 1,012,236 | | | Market
Comparable
Companies | | EBITDA
Multiple | |
4.32x-4.32X
(4.32X) | | Increase | |
| | | | 1,381,277 | | | Market
Waterfall
Approach | | Expected
sales and
earnings | | N/A | | Increase | |
Senior
Loans Total | | | 423,910,786 | | | | | | | | | | |
Total Investments | | $ | 426,084,348 | | | | | | | | | | |
First Eagle Credit Opportunities Fund | Semiannual Report | June 30, 2024
68
Notes to Consolidated Financial Statements
| Investment Type | | Fair Value as of
June 30, 2024 | | Valuation
Technique(s) | | Unobservable
Inputs | | Range
(Weighted
Average) | | Direction
Change in Fair
Value Resulting
from Increase
in Unobservable
Inputs(a) | |
Unfunded
Commitment** | | | (1,025 | ) | | Broker Quotes | | N/A | | N/A | | Increase | |
| | | | (21,956 | ) | | Discounted
Cash Flow
(Income
Approach | | Comparable
Yield | |
9.86%-26.97%
(10.53%) | | Decrease | |
| | | | 639 | | | Market
Comparable
Companies | | EBITDA
Multiple | |
4.32x-4.32X
(4.32X) | | Increase | |
Unfunded
Commitment total | | $ | (22,342 | ) | | | | | | | | | |
Note:
* Collateral values are presented in $ millions
** Fair Value for unfunded commitments is unrealized appreciation/depreciation.
(a) This column represents the direction change in the fair value of level 3 securities that would result from an increase to the corresponding unobservable inputs. A decrease to the unobservable input would have the opposite effect. Significant increases and decreases of these inputs could result in significantly higher or lower fair value determination.
c) Cash — For the purposes of the Statement of Cash Flows, the Fund defines cash as cash, including foreign currency and restricted cash. The Fund's cash is maintained with a major United States financial institution, which is a member of the Federal Deposit Insurance Corporation. The Fund's cash balance may exceed insurance limits at times.
d) Investment Transactions and Income — Investment transactions are accounted for on a trade date basis. Interest income, adjusted for the accretion of discount and amortization of premiums, is recorded daily on an accrual basis. The specific identification method is used in determining realized gains and losses from investment transactions. In computing investment income, the Fund accretes to call or put date and value providing the effective method. Paydown gains and losses are netted and recorded as interest income on the Consolidated Statement of Operations.
The difference between cost and fair value on open investments is reflected as unrealized appreciation (depreciation) on investments, and any change in that amount from prior period is reflected as change in unrealized gains (losses) of investment securities in the Consolidated Statement of Operations.
First Eagle Credit Opportunities Fund | Semiannual Report | June 30, 2024
69
Notes to Consolidated Financial Statements
e) Deferred Financing Costs — Deferred financing costs consist of fees and expenses paid in connection with the closing of the Credit Facility, including upfront fees and legal fees. The costs are capitalized at the time of payment and are amortized using the straight line method over the term of the Credit Facility. The unamortized deferred financing costs are reflected on the Consolidated Statement of Assets and Liabilities as a reduction to the Credit Facility liability.
f) United States Income Taxes — The Fund intends to continue to qualify as a regulated investment company by complying with the requirements of Subchapter M of the U.S. Internal Revenue Code of 1986, as amended, applicable to regulated investment companies, and to distribute substantially all of its earnings to its shareholders.
Income distributions and capital gain distributions are determined in accordance with income tax regulations, which may differ from U.S. GAAP. These differences are primarily due to differing treatments of income and gains on various investment securities held by the Fund, timing differences and differing characterization of distributions made by the Fund as a whole.
g) Expenses — Expenses directly related to the Fund are charged to the Fund. Other operating expenses shared by several funds, also managed by the Adviser, are prorated among those funds on the basis of relative net assets or other appropriate methods.
h) Use of Estimates — The preparation of financial statements in conformity with U.S. GAAP requires management to make estimates and assumptions that affect the reported amounts of assets and liabilities at the date of the financial statements and the reported amounts of revenues and expenses during the reporting period. Actual results could differ from those estimates.
i) Class Accounting — Investment income, common expenses and realized/ unrealized gain or loss on investments are allocated to the various classes of the Fund on the basis of daily net assets of each class. Fees relating to a specific class are charged directly to that class.
j) Indemnification — In the normal course of business, the Fund enters into contracts which provide general indemnifications. The Fund's maximum exposure under these arrangements is unknown, as this would involve future claims that may be made against the Fund that have not yet occurred. However, based on experience, the Fund expects the risk of loss to be remote.
k) New Accounting Pronouncements — In June 2022, FASB issued Accounting Standards Update ("ASU") 2022-03, Fair Value Measurement (Topic 820)—Fair Value Measurement of Equity Securities Subject to Contractual Sale Restrictions. The amendments in the ASU clarify that a contractual restriction on the sale of an equity security is not considered part of the unit of account of the equity security and, therefore, should not be considered in measuring fair value. The ASU is effective for interim and annual reporting periods beginning after December 15, 2023, with the option of early adoption. There is no material impact to the financial statements and related disclosures.
First Eagle Credit Opportunities Fund | Semiannual Report | June 30, 2024
70
Notes to Consolidated Financial Statements
Note 3 — Securities and Other Investments
The Fund's portfolio primarily consists of some combination of the following types of investments:
Syndicated Loans — Syndicated loans are typically underwritten and syndicated by large commercial and investment banks. These loans may be recently originated by such banks pursuant to the originating bank's, or lead arranger's, underwriting standards applicable to corporate borrowers at the time of issuance. The Fund may purchase syndicated loans either in the primary market in connection with their syndication or in the secondary market. In most cases, syndicated loans will be secured by specific collateral of the issuer. In general, most of the syndicated loans purchased by the Fund will be current on principal and interest payments at the time of purchase. However, the Fund can purchase syndicated loans that are not current on principal and are likely to default. In addition, syndicated loans held by the Fund may at times cease being current on principal and interest payments.
When all or a portion of a loan held by the Fund has not yet settled, the Fund does not accrue interest on such a loan until the settlement date at which point SOFR or Prime will be established.
Middle Market "Club" Loans — Middle market "club" loans are loans made to upper middle market companies that may not have access to traditional capital markets. Middle market "club" loans are distinct from customary direct lending loans described herein in that they are generally more liquid, often rated by a third party and funded by more than one lender, often a "club" of unaffiliated lenders. Middle market "club" loans held by the Fund will consist of first lien senior secured loans.
Direct Lending — The Fund may invest in sponsor-backed, first lien senior secured directly originated loans (including "unitranche" loans, which are loans that combine both senior and mezzanine debt, generally in a first lien position) of middle- market U.S. companies. Direct lending middle market loans are generally illiquid, unrated and funded by one affiliated lender group.
Asset-Based Loans — Asset-based loans are loans that are secured by collateral consisting of inventory, accounts receivable, machinery/equipment, real estate, intellectual property/brands and/or other assets owned by the borrower(s) where by the underlying loan will be underwritten by the value of the collateral. These loans are highly structured and typically include frequent monitoring including but not limited to financial and collateral reporting. The term loans are provided to both private and public borrowers with varying ownership structures.
High Yield Bonds — The Fund may invest in high-yield bonds, which are securities rated below "Baa3" by Moody's, or below "BBB-" by S&P and/or lower than "BBB-" by Fitch Ratings and unrated debt securities and other types of credit instruments of similar quality, commonly referred to as "junk bonds." Such securities are predominately speculative with respect to the issuer's capacity to pay interest and repay principal in accordance with the terms of the obligation. The ratings of S&P represent its opinion as to the credit quality of the securities it undertakes to rate.
First Eagle Credit Opportunities Fund | Semiannual Report | June 30, 2024
71
Notes to Consolidated Financial Statements
It should be emphasized, however, the ratings are relative and subjective and, although ratings may be useful in evaluating the safety of interest and principal payments, they do not evaluate the market price risk of these securities. In seeking to achieve its investment objective, the Fund depends on credit analysis to identify investment opportunities.
Derivative Transactions — Unless the Fund is relying on the Limited Derivatives User Exception (as defined below), the Fund must comply with Rule 18f-4 with respect to its Derivatives Transactions (as defined below). Rule 18f-4, among other things, requires the Fund to adopt and implement a comprehensive written derivatives risk management program ("DRMP") and comply with a relative or absolute limit on Fund leverage risk calculated based on value-at-risk ("VaR"). The DRMP is administered by a "derivatives risk manager," who is appointed by the Board, including a majority of Independent Trustees, and periodically reviews the DRMP and reports to the Board. Rule 18f-4 provides an exception from the DRMP, VaR limit and certain other requirements if the Fund's "derivatives exposure" (as defined in Rule 18f-4) is limited to 10% of its net assets (as calculated in accordance with Rule 18f-4) and the Fund adopts and implements written policies and procedures reasonably designed to manage its derivatives risks (the "Limited Derivatives User Exception"). As of the date hereof, the Fund relies on the Limited Derivatives User Exception.
Under Rule 18f-4, "Derivatives Transactions" include the following: (1) any swap, security-based swap (including a contract for differences), futures contract, forward contract, option (excluding purchased options), any combination of the foregoing, or any similar instrument, under which the Fund is or may be required to make any payment or delivery of cash or other assets during the life of the instrument or at maturity or early termination, whether as margin or settlement payment or otherwise; (2) any short sale borrowing; (3) reverse repurchase agreements and similar financing transactions (e.g., recourse and nonrecourse tender option bonds, and borrowed bonds), if the Fund elects to treat these transactions as Derivatives Transactions under Rule 18f-4; and (4) when issued or forward-settling securities (e.g., firm and standby commitments, including to-be- announced ("TBA") commitments, and dollar rolls) and nonstandard settlement cycle securities, unless the Fund intends to physically settle the transaction and the transaction will settle within 35 days of its trade date.
Note 4 — Principal Risks
Market Risk — The Fund is subject to market risks including unexpected directional price movements, deviations from historical pricing relationships, changes in the regulatory environment, changes in market volatility, panicked or forced selling of assets and contraction of available credit or other financing sources. The success of the Fund's activities may be affected by general economic and market conditions, such as interest rates, availability of credit, inflation rates, economic uncertainty,
First Eagle Credit Opportunities Fund | Semiannual Report | June 30, 2024
72
Notes to Consolidated Financial Statements
changes in laws and national and international political circumstances. Geopolitical and other risks, including environmental and public health, may also add to instability in world economies and markets generally.
Recent market conditions and events, including a global public health crisis, wars and armed conflicts and actions taken by governments in response, may exacerbate volatility. Rapid changes in prices or liquidity, which often are not anticipated and can relate to events not connected to particular investments, may limit the ability of the Fund to dispose of its assets at the price or time of its choosing and can result in losses. Changes in prices may be temporary or may last for extended periods.
Market turmoil may negatively affect the Fund's performance. Credit markets may become illiquid, credit spreads may widen and the equity markets may lose substantial value. Such market conditions may cause the Fund to suffer substantial losses and/or implement measures that adversely affect the Fund.
Interest Rate Risk — An increase in interest rates tends to reduce the market value of debt instruments, while a decline in interest rates tends to increase their values. A debt instrument's "duration" is a way of measuring a debt instrument's sensitivity to a potential change in interest rates. Longer duration instruments tend to be more sensitive to interest rate changes than those with shorter durations. Generally, debt instruments with long maturities and low coupons have the longest durations. A significant increase in market interest rates could harm the Fund's ability to attract new portfolio companies and originate new loans and investments. In periods of rising interest rates, the Fund's cost of funds would increase, resulting in a decrease in the Fund's net investment income. In addition, a decrease in interest rates may reduce net income, because new investments may be made at lower rates despite the increased demand for the Fund's capital that the decrease in interest rates may produce. As of the date hereof, there have been significant recent rate increases in the United States to combat inflation in the U.S. economy, and additional rate increases are possible.
Credit Risk — The value of the Fund's portfolio may fluctuate in response to the risk that the issuer of a bond or other instrument will not be able to make payments of interest and principal when due. Investment in private and middle market companies is highly speculative and involves a high degree of risk of credit loss. Additionally, issuers of syndicated loans and other types of credit instruments in which the Fund may invest may default on their obligations to pay principal or interest when due. This would decrease the Fund's income and lower the value of the syndicated loans and credit instruments experiencing default. With respect to the Fund's investments in syndicated loans and debt securities that are secured, there can be no assurance that the collateral would satisfy the issuer's obligation in the event of non-payment or that such collateral could be readily liquidated. In the event of an issuer's bankruptcy, the Fund could be delayed or limited in its ability to realize the benefits of any collateral securing such syndicated loans or credit instruments. To the extent the Fund invests in high-yield securities and other
First Eagle Credit Opportunities Fund | Semiannual Report | June 30, 2024
73
Notes to Consolidated Financial Statements
types of credit instruments, it will be exposed to a greater amount of credit risk than if it invested solely in investment grade debt securities and other types of credit instruments.
Second Lien Risk — The Fund may invest in second lien and the "last-out" tranche of unitranche loans (also known as first lien second out loans). The borrower usually has, or may be permitted to incur, other debt that ranks equally with, or senior to, such debt securities. Such subordinated investments are subject to greater risk of default than senior obligations as a result of adverse changes in the financial condition of the obligor or in general economic conditions. By their terms, such debt instruments may provide that the holders are entitled to receive payment of interest or principal on or before the dates on which the Fund is entitled to receive payments in respect of the debt securities in which the Fund invests. These debt instruments would usually prohibit the borrower from paying interest on or repaying Fund investments in the event and during the continuance of a default under the debt. Also, in the event of insolvency, liquidation, dissolution, reorganization or bankruptcy of a borrower, holders of debt instruments ranking senior to the Fund's investment would typically be entitled to receive payment in full before the Fund receives any distribution in respect of its investment. After repaying such senior creditors, such borrower may not have any remaining assets to use for repaying its obligation to the Fund. In the case of debt ranking equally with debt securities in which the Fund invests, the Fund would have to share any distributions on an equal and ratable basis with other creditors holding such debt in the event of an insolvency, liquidation, dissolution, reorganization or bankruptcy of the relevant borrower.
Covenant-Lite Obligations Risk — Covenant-lite risk is the risk that credit agreements contain fewer maintenance covenants than other obligations, or no maintenance covenants, and may not include terms that allow the lender to monitor the performance of the borrower and declare a default if certain criteria are breached. Covenant-lite loans may carry more risk than traditional loans as they allow individuals and corporations to engage in activities that would otherwise be difficult or impossible under a covenant-heavy loan agreement. In the event of default, covenant-lite loans may exhibit diminished recovery values as the lender may not have the opportunity to negotiate with the borrower prior to default.
Below Investment Grade Rating Risk — Most of the Fund's investments will be in below investment grade securities or comparable unrated securities (commonly referred to as "high-yield securities" or "junk bonds"). This includes the Fund's investments in syndicated bank loans, middle market "club" loans, direct lending, asset-based loans, and high-yield bonds. While generally having higher potential returns, high-yield securities may be subject to significant price fluctuations and have a higher risk of default. Because unrated securities may not have an active trading market or may be difficult to value, the Fund might have difficulty selling them promptly at an acceptable price. To the extent that the Fund invests in unrated securities, the Fund's ability to achieve its investment objectives will be more
First Eagle Credit Opportunities Fund | Semiannual Report | June 30, 2024
74
Notes to Consolidated Financial Statements
dependent on the Subadviser's credit analysis than would be the case when the Fund invests in rated securities. The Fund may incur additional expenses to the extent it is required to seek recovery upon a default in the payment of principal or interest on its portfolio holdings. In any reorganization or liquidation proceeding relating to an investment, the Fund may lose its entire investment or may be required to accept cash or securities with a value substantially less than its original investment.
Bank Loan Risk — Investments in bank loans may expose the Fund to the credit risk of the underlying borrower, and in certain cases, of the financial institution. A loan is often administered by a bank or other financial institution (the "Agent") that acts as agent for all holders. The Agent administers the terms of the loan, as specified in the loan agreement. The Fund's ability to receive payments in connection with the loan depends primarily on the financial condition of the borrower. Even investments in secured loans present risk, as there is no assurance that the collateral securing the loan will be sufficient to satisfy the loan obligation. The market for bank loans may be illiquid and the Fund may have difficulty selling them. In addition, bank loans often have contractual restrictions on resale, which can delay the sale and adversely impact the sale price. In some instances, other accounts managed by the Adviser, the Subadviser or an affiliate may hold other securities issued by borrowers whose loans may be held in the Fund's portfolio. If the credit quality of the issuer deteriorates, the Adviser or the Subadviser may owe conflicting fiduciary duties to the Fund and other client accounts. At times, the Fund may decline to receive non-public information relating to loans, which could disadvantage the Fund relative to other investors.
Loans and Assignments Risk — The Fund may acquire loans through assignments of interests in such loans. The purchaser of an assignment typically succeeds to all the rights and obligations of the assigning institution and becomes a lender under the credit agreement with respect to such debt obligation. However, the purchaser's rights can be more restricted than those of the assigning institution, and the Fund may not be able to unilaterally enforce all rights and remedies under an assigned debt obligation and with regard to any associated collateral.
Direct Lending and Middle Market "Club" Loan Risk — Generally, little public information exists about private and middle market companies, and the Fund must rely on the ability of the Subadviser's investment professionals to obtain adequate information about these companies. If the Subadviser cannot uncover all material information to make a fully-informed investment decision, the Fund may lose money on its investments. Private and middle market portfolio companies may have limited financial resources and be unable to fulfill their debt service obligations to the Fund, which may accompany a deterioration in the value of any collateral and a reduced likelihood of the Fund realizing any guarantees it may have obtained in connection with its investment. In addition, such companies typically have shorter operating histories, narrower product lines and smaller market shares than larger businesses, which tend to render them more vulnerable to competitors' actions
First Eagle Credit Opportunities Fund | Semiannual Report | June 30, 2024
75
Notes to Consolidated Financial Statements
and general market conditions. Additionally, middle market companies are more likely to depend on the management talents and efforts of a small group of persons; therefore, the death, incapacity or departure of such persons could have a material adverse impact on the Fund's portfolio company and, in turn, on the Fund. Middle market companies also generally have less predictable operating results and may require substantial additional capital to finance their operations or expansion. In addition, the Fund's executive officers, directors and the Adviser and/or Subadviser may, in the ordinary course of business, be named as defendants in litigation arising from the Fund's investments in its portfolio companies.
Large Shareholder Risk — To the extent that certain shareholders, including affiliates of the Adviser and the Subadviser, hold a substantial amount of Common Shares, there is a risk that these shareholders will seek to sell Common Shares in large amounts rapidly in connection with repurchase offers. These transactions could adversely affect the Fund's ability to conduct its investment program. Additionally, if a repurchase offer is oversubscribed by shareholders, the Fund will repurchase only a pro rata portion of Common Shares tendered by each shareholder. In such situations, shareholders unaffiliated with the Adviser and the Subadviser will not be given priority over affiliated shareholders, whose holdings in the Fund may be significant and may have the effect of diluting third-party shareholders with respect to any repurchase offer.
Liquidity Risk — The Fund intends to invest in illiquid investments, which are securities or other investments that cannot be disposed of within seven days or less in current market conditions without significantly changing their market value.
Illiquid investments often can only be resold in privately negotiated transactions with a limited number of purchasers or in a public offering registered under the 1933 Act. There could be considerable delay in either event and, unless otherwise contractually provided, the Fund's proceeds upon sale may be reduced by the costs of registration or underwriting discounts. The difficulties and delays associated with such transactions could preclude the Fund from realizing a favorable price upon disposition of illiquid investments, and at times might make disposition of such securities impossible.
Valuation Risk — When market quotations are not readily available or are deemed unreliable, the Fund's investments are valued at fair value as determined in good faith pursuant to policies and procedures approved by the Board. Fair value pricing may require subjective determinations about the value of a security or other asset. As a result, there can be no assurance that fair value pricing will reflect actual market value, and it is possible that the fair value determined for a security or other asset will be materially different from quoted or published prices, from the prices used by others for the same security or other asset and/or from the value that actually could be or is realized upon disposition.
SOFR Risk — The London Interbank Offered Rate ("LIBOR") has been discontinued and is no longer considered a representative rate. The market in the U.S. has transitioned to the Secured Overnight Financing Rate ("SOFR") based rates as
First Eagle Credit Opportunities Fund | Semiannual Report | June 30, 2024
76
Notes to Consolidated Financial Statements
modified, in some cases, by an applicable spread adjustment. The Fund's Credit Facility utilizes a SOFR-based reference rate. There is no assurance that SOFR-based rates, as modified by an applicable spread adjustment, will be the economic equivalent of U.S. dollar LIBOR. SOFR-based rates will differ from U.S. dollar LIBOR, and the differences may be material. As a result of the LIBOR discontinuation, interest rates on financial instruments tied to LIBOR rates, as well as the revenue and expenses associated with those financial instruments, may be adversely affected. SOFR-based rates or other alternative reference rates may be an ineffective substitute for LIBOR, resulting in prolonged adverse market conditions for the Fund.
The publication of SOFR began in April 2018, and, therefore, it has a very limited history. In addition, the future performance of SOFR cannot be predicted based on its limited historical performance. Future levels of SOFR may bear little or no relation to the historical actual or historical indicative data. Prior observed patterns, if any, in the behavior of market variables and their relation to SOFR, such as correlations, may change in the future. Because only limited historical data has been released by the Federal Reserve Bank of New York, as administrator of SOFR, such analysis inherently involves assumptions, estimates and approximations. The future performance of SOFR is impossible to predict and therefore no future performance of SOFR may be inferred from any of the historical actual or historical indicative data. Hypothetical or historical performance data are not indicative of, and have no bearing on, the potential performance of SOFR or any SOFR-linked investments. SOFR is a relatively new rate, and the Federal Reserve Bank of New York (or a successor) may make methodological or other changes that could change the value of SOFR, including changes related to the methods by which SOFR is calculated, eligibility criteria applicable to the transactions used to calculate SOFR, or the averages or periods used to report SOFR. If the manner in which SOFR is calculated is changed, that change may result in a reduction of the amount of interest payable on SOFR-linked investments, such as loans and notes, which may adversely affect the trading prices and marketability of such investments. The administrator of SOFR may withdraw, modify, amend, suspend or discontinue the calculation or dissemination of SOFR in its sole discretion and without notice and has no obligation to consider the interests of holders of such investments in calculating, withdrawing, modifying, amending, suspending or discontinuing SOFR.
Leverage Risk — The Fund utilizes the Credit Facility to increase its assets available for investment. When the Fund leverages its assets, common shareholders bear the fees associated with the Credit Facility and have the potential to benefit from or be disadvantaged by the use of leverage. The investment advisory fee is also increased in dollar terms from the use of leverage. Consequently, the Fund and the Adviser may have differing interests in determining whether to leverage the Fund's assets. Leverage creates risks that may adversely affect the return for the holders of Common Shares, including the likelihood of greater volatility of net asset value; fluctuations in the interest rate paid for the use of the Credit Facility; increased operating costs, which may reduce the Fund's total return; the potential for decline
First Eagle Credit Opportunities Fund | Semiannual Report | June 30, 2024
77
Notes to Consolidated Financial Statements
in the value of an investment acquired through leverage, while the Fund's obligations under such leverage remains fixed; and the Fund is more likely to have to sell investments in a volatile market in order to meet asset coverage or other debt compliance requirements.
To the extent the income or capital appreciation derived from securities purchased with funds received from leverage exceeds the cost of leverage, the Fund's return will be greater than if leverage had not been used; conversely, returns would be lower if the cost of the leverage exceeds the income or capital appreciation derived.
In addition to the risks created by the Fund's use of leverage, the Fund is subject to the risk that it would be unable to timely, or at all, obtain replacement financing if the Credit Facility is terminated. Were this to happen, the Fund would be required to de-leverage, selling securities at a potentially inopportune time and incurring tax consequences. Further, the Fund's ability to generate income from the use of leverage would be adversely affected.
Repurchase Offers Risk — In order to provide liquidity to shareholders, the Fund, subject to applicable law, conducts quarterly repurchase offers of the Fund's outstanding Common Shares at NAV, subject to approval of the Board. In all cases such repurchases will be for at least 5% and not more than 25% of its outstanding Common Shares at NAV, pursuant to Rule 23c-3 under the 1940 Act. The Fund currently expects to conduct quarterly repurchase offers for 5% of its outstanding Common Shares under ordinary circumstances. The Fund believes that these repurchase offers are generally beneficial to the Fund's shareholders, and repurchases generally will be funded from available cash or sales of portfolio securities.
However, repurchase offers and the need to fund repurchase obligations may affect the ability of the Fund to be fully invested or force the Fund to maintain a higher percentage of its assets in liquid investments, which may harm the Fund's investment performance. Moreover, diminution in the size of the Fund through repurchases may result in untimely sales of portfolio securities (with associated imputed transaction costs, which may be significant), and may limit the ability of the Fund to participate in new investment opportunities or to achieve its investment objective. The Fund may accumulate cash by holding back (i.e., not reinvesting) payments received in connection with the Fund's investments. The Fund believes that payments received in connection with the Fund's investments will generate sufficient cash to meet the maximum potential amount of the Fund's repurchase obligations. If at any time cash and other liquid assets held by the Fund are not sufficient to meet the Fund's repurchase obligations, the Fund intends, if necessary, to sell investments, which may accelerate the realization of taxable income and cause the Fund to make taxable distributions to Common Shareholders earlier than the Fund otherwise would have. In addition, under certain circumstances, non-redeeming Common Shareholders may be treated as receiving a disproportionately large taxable distribution during or with respect to such year. If, as expected, the Fund employs investment leverage, repurchases of Common Shares would
First Eagle Credit Opportunities Fund | Semiannual Report | June 30, 2024
78
Notes to Consolidated Financial Statements
compound the adverse effects of leverage in a declining market. In addition, if the Fund borrows to finance repurchases, interest on that borrowing will negatively affect Common Shareholders who do not tender their Common Shares by increasing the Fund's expenses and reducing any net investment income.
If a repurchase offer is oversubscribed, the Fund may determine to increase the amount repurchased by up to 2% of the Fund's outstanding shares as of the date of the Repurchase Request Deadline. In the event that the Fund determines not to repurchase more than the repurchase offer amount, or if shareholders tender more than the repurchase offer amount plus 2% of the Fund's outstanding shares as of the date of the Repurchase Request Deadline, the Fund will repurchase the Common Shares tendered on a pro rata basis, and shareholders will have to wait until the next repurchase offer to make another repurchase request. As a result, shareholders may be unable to liquidate all or a given percentage of their investment in the Fund during a particular repurchase offer. Some shareholders, in anticipation of proration, may tender more Common Shares than they wish to have repurchased in a particular quarter, thereby increasing the likelihood that proration will occur. The NAV of the Fund's Common Shares tendered in a repurchase offer may decline between the Repurchase Request Deadline and the date on which the NAV for tendered Common Shares is determined. In addition, the repurchase of Common Shares by the Fund will be a taxable event to Common Shareholders, potentially even to those Common Shareholders that do not participate in the repurchase.
Note 5 — Purchases and Sales of Securities
For the period ended June 30, 2024, purchases and sales of investments, excluding short-term investments, were $393,086,251 and $327,652,790, respectively.
Note 6 — Investment Advisory Agreement and Other Transactions with Related Persons
Pursuant to a management agreement with the Fund (the "Management Agreement"), the Adviser is responsible for the management of the Fund's portfolio. In return for its investment advisory services, the Fund pays the Adviser a monthly fee at the annual rate of 1.25% of the average daily value of the Fund's Managed Assets. The Adviser has entered into a subadvisory agreement with the Subadviser relating to the Fund (the "Subadvisory Agreement"). The Subadvisory Agreement provides that the Subadviser will furnish investment advisory services in connection with the management of the Fund. For its services under the Subadvisory Agreement, the Adviser pays the Subadviser a monthly fee at the annual rate of 0.625% of the average daily value of the Fund's Managed Assets. No advisory fee will be paid by the Fund directly to the Subadviser.
The Adviser has contractually undertaken to waive and/or reimburse certain fees and expenses of the Fund so that the total annual operating expenses (excluding interest, taxes, brokerage commissions, acquired fund fees and expenses, dividend
First Eagle Credit Opportunities Fund | Semiannual Report | June 30, 2024
79
Notes to Consolidated Financial Statements
and interest expenses relating to short sales, and extraordinary expenses, if any) ("annual operating expenses") of the Class A, Class A-2 and Class I shareholders are limited to 2.25%, 2.75% and 2.00%, respectively, of average net assets (the "Expense Limitations"). This undertaking lasts until April 30, 2025 and may not be terminated during its term without the consent of the Board. The Fund has agreed that each of Class A, Class A-2 and Class I will repay the Adviser for fees and expenses waived or reimbursed for the class provided that repayment does not cause annual operating expenses (after the repayment is taken into account) to exceed either: (1) 2.25%, 2.75% and 2.00% of the class' average net assets, respectively; or (2) if applicable, the then-current expense limitations. Any such repayment must be made within three years after the year in which the Fund incurred the fee and/or expense.
During the period ended June 30, 2024, the Adviser waived $226,358 in expenses, which are included under "expense waiver" on its Consolidated Statement of Operations. As of June 30, 2024, the Fund has $148,903 receivable from the Adviser for reimbursement of expenses, which are included under "due from adviser" on its Consolidated Statement of Assets and Liabilities.
For the period ended June 30, 2024, the amounts available for potential future repayment by the Adviser and the expiration schedule are as follows:
| | | | | Potential Repayment Amounts Expiring | |
| | | Total Eligible for
Recoupment | | 2024* | | 2025 | | 2026 | | 2027** | |
Class A | | $ | 100,701 | | | $ | 18,071 | | | $ | 56,152 | | | $ | 17,565 | | | $ | 8,913 | | |
Class A-2 | | | — | | | | — | | | | — | | | | — | | | | — | | |
Class I | | | 2,974,729 | | | | 706,850 | | | | 1,517,801 | | | | 532,633 | | | | 217,445 | | |
Total | | $ | 3,075,430 | | | $ | 724,921 | | | $ | 1,573,953 | | | $ | 550,198 | | | $ | 226,358 | | |
* Amounts included represent the amounts incurred for the period July 1, 2021 to December 31, 2021.
** Amounts included represent the amounts incurred for the period January 1, 2024 to June 30, 2024.
The Adviser also performs certain non-investment advisory, administrative, accounting, operations, legal, compliance and other services on behalf of the Fund, and in accordance with the Management Agreement, the Fund reimburses the Adviser for costs and expenses (including overhead and personnel costs) associated with such services. These reimbursements may not exceed an annual rate of 0.05% of Fund's average daily net assets. For the period ended June 30, 2024, the adviser waived $243,619 for administrative fees, which are included under "expense waiver" on Consolidated Statement of Operations. As of June 30, 2024, the Fund has a receivable from the Adviser of $322,806 for reimbursement of expenses, which are included under due from adviser on its Consolidated Statement of Assets and Liabilities.
J.P. Morgan Chase Bank, N.A. ("JPM"), the Fund's administrator, accounting agent and primary custodian, holds the Fund's portfolio securities and other assets and is
First Eagle Credit Opportunities Fund | Semiannual Report | June 30, 2024
80
Notes to Consolidated Financial Statements
responsible for calculating the Fund's net asset value and maintaining the accounting records of the Fund. JPM, as the Fund's administrator, receives annual fees separate from and in addition to the fees it receives for its services as the Funds' custodian.
Independent Trustees are compensated by the Fund for their services. As of June 30, 2024, such compensations are included under Trustees' fees on the Consolidated Statement of Operations.
Note 7 — Plans of Distribution
FEF Distributors, LLC (the "Distributor"), an affiliate of the Adviser, serves as the principal underwriter and distributor of the Fund's Common Shares pursuant to a distribution contract with the Fund.
Common Shares of the Fund are continuously offered through the Distributor and/or certain financial intermediaries that have agreements with the Distributor. Class A Shares, Class A-2 Shares and Class I Shares are sold on a continuous basis at the Fund's NAV per share, plus for Class A Shares and Class A-2 Shares only, a maximum front-end sales commission of 2.50%. Investors that purchase $250,000 or more of the Fund's Class A Shares or Class A-2 Shares will not pay any initial sales charge on the purchase. However, unless eligible for a waiver, purchases of $250,000 or more of Class A Shares or Class A-2 Shares will be subject to an early withdrawal charge of 1.50% if the shares are repurchased during the first 12 months after their purchase.
The Fund has adopted a Distribution and Servicing Plan (the "Plan") for the Class A Shares and Class A-2 Shares of the Fund. Although the Fund is not an open-end investment company, it intends to comply with the terms of Rule 12b-1 as a condition of the Exemptive Relief which permits the Fund to have, among other things, a multi-class structure and distribution and shareholder servicing fees. The Plan permits the Fund to compensate the Distributor for providing or procuring through financial firms, distribution, administrative, recordkeeping, shareholder and/or related services with respect to the Class A Shares and Class A-2 Shares, as applicable. The maximum annual rates at which the distribution and/or service fees may be paid under the Distribution and Servicing Plan is 0.25% for Class A Shares and 0.75% for Class A-2 Shares (calculated as a percentage of the Fund's average daily net assets attributable to the Class A Shares and Class A-2 Shares, respectively). Class I Shares do not pay distribution or servicing fees.
For the period ended June 30, 2024, the distribution and servicing fees incurred by the Fund are disclosed in the Consolidated Statement of Operations.
Note 8 — Periodic Repurchase Offers
The Fund is a closed-end interval fund, a type of fund that, in order to provide liquidity to shareholders, has adopted a fundamental investment policy to make quarterly offers to repurchase between 5% and 25% of its outstanding Common
First Eagle Credit Opportunities Fund | Semiannual Report | June 30, 2024
81
Notes to Consolidated Financial Statements
Shares at net asset value. Subject to applicable law and approval of the Board, for each quarterly repurchase offer, the Fund currently expects to offer to repurchase 5% of the Fund's outstanding Common Shares at net asset value, which is the minimum amount permitted.
The following table summarizes the share repurchases completed during the period ended June 30, 2024:
| | Repurchase
Date | | Size of
Repurchase
Offer | | % of
Outstanding
Shares
Offered to be
Repurchased | | Number
of Shares
Tendered
for
Repurchase | | Shares
Repurchased | | Aggregate
Consideration
for
Repurchased
Shares | | % of
Outstanding
Shares
Repurchased | | Proration %
Repurchased(1) | |
12/31/23 | | 1/16/24 | | | 1,477,672 | | | | 5 | % | | | 1,276,467 | | | | 1,276,467 | | | $ | 30,151,751 | | | | 4.41 | % | | | N/A | | |
3/31/24 | | 4/29/24 | | | 1,688,386 | | | | 5 | % | | | 2,399,118 | | | | 2,362,742 | | | $ | 55,296,228 | | | | 7.00 | % | | | 98.48 | % | |
(1) If the repurchase offer was oversubscribed, then Fund repurchased shares on a pro-rata basis. After proration, the total shares repurchased by the Fund did not exceed 7% of the total shares outstanding of the Fund. The Proration% Repurchased equals the Shares Repurchased divided by the Number of Shares Tendered for Repurchase.
The Fund does not currently charge a repurchase fee. However, in the future the Fund may charge a repurchase fee of up to 2.00%, which the Fund would retain to help offset non-de minimis estimated costs related to the repurchase incurred by the Fund, directly or indirectly, as a result of repurchasing Common Shares, thus allocating estimated transaction costs to the shareholder whose Common Shares are being repurchased. The Fund may introduce, or modify the amount of, a repurchase fee at any time. The Fund may also waive or reduce a repurchase fee if the Adviser or Subadviser determines that the repurchase is offset by a corresponding purchase or if for other reasons the Fund will not incur transaction costs or will incur reduced transaction costs.
Note 9 — Unfunded Commitment/Delayed Draw Loan Commitment
As of June 30, 2024, the Fund had the following unfunded loan commitments outstanding, which could be extended at the option of the borrower:
Loan | | Principal
Amount | | Value | | Net Unrealized
Appreciaton
(Depreciation) | |
A&A Global Imports, LLC, New Revolving
Loan — First Lien | | $ | 11,023 | | | $ | 11,023 | | | $ | 639 | | |
Acumera, Inc., Revolving Loan — First Lien | | | 156,105 | | | | 156,105 | | | | 2,341 | | |
Air Conditioning Specialist, Inc., Delayed Draw
Term Loan — First Lien | | | 77,206 | | | | 76,627 | | | | (193 | ) | |
Air Conditioning Specialist, Inc., Revolving
Loan — First Lien | | | 172,426 | | | | 171,133 | | | | 1,293 | | |
Alpine SG, LLC (ASG), Revolving Credit
Loan — First Lien | | | 105,232 | | | | 104,179 | | | | 526 | | |
First Eagle Credit Opportunities Fund | Semiannual Report | June 30, 2024
82
Notes to Consolidated Financial Statements
Loan | | Principal
Amount | | Value | | Net Unrealized
Appreciaton
(Depreciation) | |
Alpine X, Revolving Loan — First Lien | | $ | 91,314 | | | $ | 91,314 | | | $ | 1,826 | | |
Alpine X, Second Amendment Incremental Revolving
Loan — First Lien | | | 42,857 | | | | 42,857 | | | | 1,178 | | |
Apella Capital LLC, Delayed Draw Term
Loan — First Lien | | | 250,000 | | | | 245,313 | | | | (2,500 | ) | |
Apex Analytix, Inc. (Montana Buyer, Inc.),
Revolving Credit Loan — First Lien | | | 286,957 | | | | 281,935 | | | | 718 | | |
AppHub LLC, Revolving Credit Loan — First Lien | | | 103,013 | | | | 103,013 | | | | 1,545 | | |
AppHub LLC, Second Amendment Delayed Draw
Term Loan — First Lien | | | 5,000,000 | | | | 5,000,000 | | | | 17,500 | | |
Bandon Fitness Texas, Inc., Delayed Draw Term
Loan — First Lien | | | 427,149 | | | | 421,810 | | | | (2,136 | ) | |
Bandon Fitness Texas, Inc., Revolving
Loan — First Lien | | | 96,572 | | | | 95,365 | | | | 241 | | |
BCDI BHI Intermediate 2, LP (Basic Home Infusion),
Revolving Credit Loan — First Lien | | | 331,251 | | | | 329,594 | | | | 3,312 | | |
CC Amulet Management, LLC (Children's Choice),
Delayed Draw Term Loan — First Lien | | | 210,080 | | | | 210,080 | | | | 1,050 | | |
CC Amulet Management, LLC (Children's Choice),
Revolving Loan — First Lien | | | 3,433 | | | | 3,416 | | | | 34 | | |
Community Based Care Acquisition, Inc., Delayed
Draw Tranche B Term Loan — First Lien | | | 56,515 | | | | 56,515 | | | | 1,130 | | |
Community Based Care Acquisition, Inc., Delayed
Draw Tranche C Term Loan — First Lien | | | 2,000,000 | | | | 2,000,000 | | | | 20,000 | | |
Community Based Care Acquisition, Inc., Revolving
Credit Loan — First Lien | | | 321,951 | | | | 321,951 | | | | 6,439 | | |
ConvenientMD (CMD Intermediate Holdings, Inc.),
2024 Extended Revolving Credit Loan — First Lien | | | 50,000 | | | | 48,500 | | | | (750 | ) | |
Danforth Global, Inc., Delayed Draw — First Lien | | | 684,448 | | | | 674,181 | | | | (6,845 | ) | |
Danforth Global, Inc., Revolving Credit
Loan — First Lien | | | 125,000 | | | | 123,125 | | | | — | | |
Electrical Components International, Inc. (ECI),
Delayed Draw Term Loan — First Lien | | | 346,667 | | | | 339,733 | | | | — | | |
Elevate HD Parent, Inc., Delayed Draw
Term Loan B — First Lien | | | 1,733,333 | | | | 1,716,000 | | | | (6,500 | ) | |
Elevate HD Parent, Inc., Revolving Loan — First Lien | | | 585,000 | | | | 579,150 | | | | 5,119 | | |
Endo1 Partners, LLC, Seventh Amendment
DDTL — First Lien | | | 57,143 | | | | 56,715 | | | | 386 | | |
Enverus Holdings, Inc., Class A Revolving Credit
Loan — First Lien | | | 292,793 | | | | 284,009 | | | | (4,392 | ) | |
First Eagle Credit Opportunities Fund | Semiannual Report | June 30, 2024
83
Notes to Consolidated Financial Statements
Loan | | Principal
Amount | | Value | | Net Unrealized
Appreciaton
(Depreciation) | |
Enverus Holdings, Inc., Delayed Draw Term
Loan — First Lien | | $ | 192,407 | | | $ | 192,888 | | | $ | 3,367 | | |
First Steps Recovery Acquisition, LLC (True North
Detox), Delayed Draw Term Loan — First Lien | | | 743,243 | | | | 732,095 | | | | (7,432 | ) | |
First Steps Recovery Acquisition, LLC
(True North Detox), Revolver — First Lien | | | 743,243 | | | | 732,095 | | | | — | | |
Gen4 Dental Partners Opco, LLC, Closing Date
Delayed Draw Term Loan — First Lien | | | 1,833,333 | | | | 1,796,667 | | | | (18,333 | ) | |
Gen4 Dental Partners Opco, LLC, Revolving
Loan — First Lien | | | 366,667 | | | | 359,333 | | | | — | | |
Houseworks Holdings, Fourth Amendment
DDTL — First Lien | | | 1,001,435 | | | | 981,407 | | | | (10,014 | ) | |
Houseworks Holdings, Revolving Loan — First Lien | | | 408,467 | | | | 408,467 | | | | 10,413 | | |
Houseworks Holdings, Third Amendment
Delayed Draw Term Loan — First Lien | | | 1,205,620 | | | | 1,205,620 | | | | 27,126 | | |
iLending LLC, Revolving Loan — First Lien | | | 35,036 | | | | 26,277 | | | | (8,233 | ) | |
In Vitro Sciences, LLC (New IVS Holdings, LLC),
Delayed Draw Term Loan — First Lien | | | 11,366 | | | | 11,195 | | | | (114 | ) | |
In Vitro Sciences, LLC (New IVS Holdings, LLC),
Revolving Loan — First Lien | | | 284,145 | | | | 279,883 | | | | — | | |
Inflexionpoint LLC (fka Automated Control Concepts),
Revolving Credit Loan — First Lien | | | 416,667 | | | | 414,583 | | | | 4,166 | | |
Life Northwestern Pennsylvania, LLC
(FFL Pace Buyer, Inc.), Revolving Loan — First Lien | | | 268,374 | | | | 262,335 | | | | (671 | ) | |
LMSI Buyer, LLC, Revolving Credit Loan — First Lien | | | 111,576 | | | | 100,418 | | | | (11,158 | ) | |
Mammoth Holdings, LLC, Delayed Draw Term
Loan — First Lien | | | 90,909 | | | | 89,091 | | | | (909 | ) | |
Mammoth Holdings, LLC, Initial Revolving Credit
Loan — First Lien | | | 454,545 | | | | 445,455 | | | | — | | |
Medrina, LLC, Primary DDTL — First Lien | | | 1,160,000 | | | | 1,148,400 | | | | (4,350 | ) | |
Medrina, LLC, Revolving Loan — First Lien | | | 828,571 | | | | 820,286 | | | | 7,250 | | |
Mid-State Machine and Fabricating Corp.,
Revolver — First Lien | | | 1,333,333 | | | | 1,313,333 | | | | — | | |
Monarch Behavioral Therapy, LLC, Delayed Draw
Term Loan — First Lien | | | 1,752,231 | | | | 1,725,948 | | | | (17,522 | ) | |
Monarch Behavioral Therapy, LLC, Senior Secured
Revolver — First Lien | | | 1,173,182 | | | | 1,155,584 | | | | — | | |
Newcleus, LLC, Revolving Loan — First Lien | | | 34,803 | | | | 32,019 | | | | (2,262 | ) | |
First Eagle Credit Opportunities Fund | Semiannual Report | June 30, 2024
84
Notes to Consolidated Financial Statements
Loan | | Principal
Amount | | Value | | Net Unrealized
Appreciaton
(Depreciation) | |
Oak Point Partners, LLC, Revolving Loan — First Lien | | $ | 292,659 | | | $ | 289,732 | | | $ | 1,463 | | |
Point Quest Acquisition, LLC, Delayed Draw Term
Loan — First Lien | | | 1,123,899 | | | | 1,123,899 | | | | 5,620 | | |
Point Quest Acquisition, LLC, Revolving Credit
Loan — First Lien | | | 733,943 | | | | 733,943 | | | | 13,762 | | |
Project Cloud Holdings, LLC (AgroFresh Inc.),
Replacement Revolver — First Lien | | | 29,940 | | | | 29,342 | | | | 65 | | |
RL James, Inc. (HH Restore Acquisition, Inc.),
Delayed Draw Term Loan — First Lien | | | 900,831 | | | | 883,940 | | | | — | | |
RL James, Inc. (HH Restore Acquisition, Inc.),
Revolving Loan — First Lien | | | 450,415 | | | | 441,970 | | | | — | | |
RMBUS Holdco Inc. (Eclat Health Solutions Inc.),
Delayed Draw Term Loan — First Lien | | | 1,035,197 | | | | 1,017,728 | | | | (8,734 | ) | |
RMBUS Holdco Inc. (Eclat Health Solutions Inc.),
Revolving Credit Loan — First Lien | | | 517,598 | | | | 508,864 | | | | — | | |
R-Pac International Corp. (Project Radio), Initial
Revolving Loan — First Lien | | | 366,915 | | | | 357,743 | | | | (1,892 | ) | |
Sapio Sciences, LLC (Jarvis Bidco), Revolving Credit
Loan — First Lien | | | 312,500 | | | | 312,500 | | | | 4,687 | | |
Sequoia Consulting Group, LLC, Revolving
Loan — First Lien | | | 695,151 | | | | 653,442 | | | | (30,494 | ) | |
SR Landscaping, LLC, Delayed Draw Term
Loan — First Lien | | | 414,697 | | | | 410,550 | | | | (2,074 | ) | |
SR Landscaping, LLC, Revolving Loan — First Lien | | | 400,598 | | | | 396,592 | | | | 2,003 | | |
Strategy Corps., LLC, Delayed Draw Term
Loan — First Lien | | | 3,421,788 | | | | 3,410,838 | | | | — | | |
Strategy Corps., LLC, Revolver — First Lien | | | 1,710,894 | | | | 1,688,310 | | | | — | | |
SuperHero Fire Protection, LLC, Revolving
Loan — First Lien | | | 72,965 | | | | 72,965 | | | | 1,094 | | |
Technology Partners, LLC (Imagine Software),
Revolving Credit Loan — First Lien | | | 373,405 | | | | 372,472 | | | | 6,535 | | |
The Mutual Group, LLC, Revolving Loan — First Lien | | | 649,351 | | | | 639,610 | | | | — | | |
TMA Buyer, LLC, Revolving Credit Loan — First Lien | | | 107,790 | | | | 100,784 | | | | (5,389 | ) | |
Tricor, LLC, Revolving Loan — First Lien | | | 45,000 | | | | 44,775 | | | | 450 | | |
Triple Crown Consulting, Revolving Loan — First Lien | | | 217,391 | | | | 197,283 | | | | (16,032 | ) | |
TriStrux, LLC, Revolving Loan — First Lien | | | 32,175 | | | | 27,670 | | | | (4,022 | ) | |
Visante Acquisition, LLC, Revolving Credit
Loan — First Lien | | | 574,273 | | | | 565,658 | | | | — | | |
First Eagle Credit Opportunities Fund | Semiannual Report | June 30, 2024
85
Notes to Consolidated Financial Statements
Loan | | Principal
Amount | | Value | | Net Unrealized
Appreciaton
(Depreciation) | |
Waste Resource Management Inc., Delayed Draw
Term Loan — First Lien | | $ | 1,154,544 | | | $ | 1,142,999 | | | $ | (5,772 | ) | |
Waste Resource Management Inc.,
Revolving Credit Loan — First Lien | | | 620,723 | | | | 614,515 | | | | 3,103 | | |
| | | $ | 44,321,263 | | | $ | 43,815,146 | | | $ | (22,342 | ) | |
Delayed draw loan commitments are marked to market on the relevant day of the valuation in accordance with the Fund's valuation policy. Any related unrealized appreciation (depreciation) on unfunded delayed draw loan commitments is recorded on the Consolidated Statement of Assets and Liabilities and the Consolidated Statement of Operations.
Note 10 — Credit Facility
On February 5, 2021, the SPV entered into a secured credit facility (the "Credit Agreement") with Ally Bank and such other lenders that may become party to the Credit Agreement (the "Lenders"). Pursuant to the terms of the Credit Agreement, the SPV, of which the Fund is the sole member and designated manager, may borrow money from the Lenders up to a maximum aggregate outstanding amount of $75 million (the "Credit Facility"). The Credit Facility had an initial five-year term, with a three-year revolving period. The Credit Agreement, commonly referred to as an asset-backed facility, is secured by a lien on all of the SPV's assets. The Fund's borrowings under the Credit Facility will not exceed 33 1/3% of the Fund's Managed Assets at the time of borrowing. On May 18, 2022, the Credit Facility was amended to, among other things, 1) increase the commitment amount from $75 million to $150 million, subject to change by mutual agreement of the SPV and the Lenders; and 2) replace the benchmark rate. On January 3, 2024, the Credit Facility was amended to, among other things, 1) extend the maturity date to January 3, 2029, with a revolving period ending January 3, 2027; 2) increase the commitment amount from $150 million to $250 million; and 3) update the per annum rate of interest.
The per annum rate of interest is generally based on SOFR (subject to a 25 basis point floor) plus a benchmark adjustment of between 0.10% - 0.15% plus a spread of 3.00%. Commitment fees on the unused portion of the Credit Facility accrue at a rate between 0.50% and 1.00% depending on the utilization levels.
First Eagle Credit Opportunities Fund | Semiannual Report | June 30, 2024
86
Notes to Consolidated Financial Statements
The components of interest expense, average interest rates (i.e., base interest rate in effect plus the spread) and average outstanding balances for the Credit Facility for the year ended June 30, 2024 were as follows:
Stated interest expense | | $ | 5,052,379 | | |
Unused commitment fees | | | 394,721 | | |
Amortization of deferred financing costs | | | 269,997 | | |
Total interest expense | | $ | 5,717,097 | | |
Weighted average interest rate | | | 8.34 | % | |
Average borrowings | | | 116,226,923 | | |
Effective leverage* | | | 9.80 | % | |
* Effective leverage is percentage of leverage based on total assets minus the sum of liabilities (other than leveraged amount)
Note 11 — Subsequent Events
In accordance with the provision surrounding Subsequent Events adopted by the Fund, management has evaluated the possibility of subsequent events existing in the Fund's financial statements. Management has determined that there are no material events that would require disclosure in the Fund's financial statements.
First Eagle Credit Opportunities Fund | Semiannual Report | June 30, 2024
87
Fund Expenses (unaudited)
Example
As a shareholder of the Fund, you may incur two types of costs: (1) transaction costs and (2) ongoing costs, including advisory fees; distribution fees (12b-1) and/or service fees; and other Fund expenses. This example is intended to help you understand your ongoing costs (in dollars) of investing in the Fund and to compare these costs with the ongoing costs of investing in other funds.
This example is based on an investment of $1,000 invested on January 1, 2024 and held for the six-months ended June 30, 2024.
Actual Expenses
The table below titled "Based on Actual Total Return" provides information about actual account values and actual expenses. You may use the information provided in this table, together with the amount you invested, to estimate the expenses that you paid over the period. To estimate the expenses you paid on your account, divide your ending account value by $1,000 (for example, an $8,600 ending account value divided by $1,000 = 8.6), then multiply the result by the number under the heading entitled "Expenses Paid During the Period".
First Eagle Credit Opportunities Fund | Semiannual Report | June 30, 2024
88
Fund Expenses (unaudited)
Based on Actual Total Return(1)
| | | Actual Total
Return Without
Sales Charges(2) | | Beginning
Account
Date
Value | | Ending
Account
Value
6/30/24 | | Annualized
Expense | | Expenses
Paid for
the Period(3) | |
First Eagle Credit Opportunities Fund | |
Class A | | | 3.96 | % | | $ | 1,000 | | | $ | 1,039.60 | | | | 3.81 | % | | $ | 19.32 | | |
Class A-2 | | | 3.81 | | | | 1,000 | | | | 1,038.10 | | | | 4.19 | | | | 21.23 | | |
Class I | | | 4.19 | | | | 1,000 | | | | 1,041.90 | | | | 3.55 | | | | 18.02 | | |
(1) For the six-months ended June 30, 2024.
(2) Past performance does not guarantee future results. Assumes reinvestment of all dividends and capital gain distributions, if any, at net asset value. Total return is not annualized, as it may not be representative of the total return for the year.
(3) Expenses are equal to the annualized expense ratio multiplied by the average account value over the period, multiplied by 182/366 (to reflect the one-half year period).
First Eagle Credit Opportunities Fund | Semiannual Report | June 30, 2024
89
Fund Expenses (unaudited)
Hypothetical Example for Comparison Purposes
The table that follows titled "Based on Hypothetical Total Return" provides information about hypothetical account values and hypothetical expenses based on the actual expense ratios and an assumed rate of return of 5% per year before expenses, which is not the Fund's actual return. The hypothetical account values and expenses may not be used to estimate the actual ending account balance or expenses you paid for the period. You may use the information provided in this table to compare the ongoing costs of investing in the Fund and other funds. To do so, compare the 5% hypothetical example relating to the Fund with the 5% hypothetical examples that appear in the shareholder reports of other funds.
This example is based on an investment of $1,000 invested on January 1, 2024 and held for the six-months ended June 30, 2024.
Please note that the expenses shown in the table below are meant to highlight your ongoing costs only and do not reflect any transactional costs, such as front-end or back-end sales charges (loads). Therefore, the table is useful in comparing ongoing costs only, and will not help you determine the relative total costs of owning different funds. In addition, if these transaction costs were included, your costs would have been higher.
First Eagle Credit Opportunities Fund | Semiannual Report | June 30, 2024
90
Fund Expenses (unaudited)
Based on Hypothetical Total Return(1)
| | | Hypothetical
Annualized
Total
Return | | Beginning
Account
Date
Value | | Ending
Account
Value | | Annualized
Expense | | Expenses
Paid for
the Period(2) | |
First Eagle Credit Opportunities Fund | |
Class A | | | 5.00 | % | | $ | 1,000 | | | $ | 1,005.92 | | | | 3.81 | % | | $ | 19.00 | | |
Class A-2 | | | 5.00 | | | | 1,000 | | | | 1,004.03 | | | | 4.19 | | | | 20.88 | | |
Class I | | | 5.00 | | | | 1,000 | | | | 1,007.21 | | | | 3.55 | | | | 17.72 | | |
(1) For the six-months ended June 30, 2024.
(2) Expenses are equal to the annualized expense ratio multiplied by the average account value over the period, multiplied by 182/366 (to reflect the one-half year period).
First Eagle Credit Opportunities Fund | Semiannual Report | June 30, 2024
91
Form N-PORT portfolio schedule
The First Eagle Credit Opportunities Fund files its complete schedule of portfolio holdings with the Securities and Exchange Commission ("SEC") for the first and third quarters of each fiscal year on Form N-PORT. The Fund's Form N-PORT is available on the SEC's Web site at www.sec.gov. Additionally, you may obtain copies of Form N-PORT from the Fund upon request by calling 1.800.334.2143.
Proxy voting policies, procedures and record
You may obtain (1) a description of the Fund's proxy voting policies, (2) a description of the Fund's proxy voting procedures and (3) information regarding how the Fund voted any proxies related to portfolio securities during the most recent twelve-month period ended June 30 for which an SEC filing has been made, without charge, upon request by contacting the Fund directly at 1.800.334.2143 or on the EDGAR Database on the SEC's Web site at www.sec.gov.
First Eagle Credit Opportunities Fund | Semiannual Report | June 30, 2024
92
Dividend Reinvestment Plan
Pursuant to the Fund's dividend reinvestment plan (the "Plan"), all Common Shareholders will have all dividends, including any capital gain dividends, reinvested automatically in additional Common Shares by DST Systems. Inc, as agent for the Common Shareholders (the "Plan Agent"), unless the shareholder elects to receive cash. An election to receive cash may be revoked or reinstated at the option of the shareholder. In the case of record shareholders such as banks, brokers or other nominees that hold Common Shares for others who are the beneficial owners, the Plan Agent will administer the Plan on the basis of the number of Common Shares certified from time to time by the record shareholder as representing the total amount registered in such shareholder's name and held for the account of beneficial owners who are to participate in the Plan. Shareholders whose shares are held in the name of a bank, broker or nominee should contact the bank, broker or nominee for details.
Common Shares received under the Plan will be issued to you at their NAV on the ex-dividend date; there is no sales or other charge for reinvestment. You are free to withdraw from the Plan and elect to receive cash at any time by giving written notice to the Plan Agent or by contacting your broker or dealer, who will inform the Fund. Your request must be received by the Fund at least ten days prior to the payment date of the distribution to be effective for that dividend or capital gain distribution.
The Plan Agent provides written confirmation of all transactions in the shareholder accounts in the Plan, including information you may need for tax records. Any proxy you receive will include all Common Shares you have received under the Plan.
Automatically reinvested dividends and distributions are taxed in the same manner as cash dividends and distributions. See "Tax Matters" in the Fund's Prospectus for additional information.
The Fund and the Plan Agent reserve the right to amend or terminate the Plan. There is no direct service charge to participants in the Plan; however, the Fund reserves the right to amend the Plan to include a service charge payable by the participants. If the Plan is amended to include such service charges, the Plan Agent will include a notification to registered holders of Common Shares with the Plan Agent.
Additional information about the Plan may be obtained from the Plan Agent.
First Eagle Credit Opportunities Fund | Semiannual Report | June 30, 2024
93
Board Considerations for Continuation of Advisory Agreement (unaudited)
At a meeting held on June 5-6, 2024, the Board of Trustees of the Fund, including a majority of the independent trustees (the "Independent Trustees"), approved the continuation of the Fund's advisory agreement (the "Advisory Agreement").
In response to a letter sent on behalf of the Independent Trustees requesting information about the Advisory Agreement and other arrangements and plans, the Trustees received extensive materials from the Adviser, including reviews of performance and expense information compared against the Fund's benchmark and peer group compiled by an independent data provider. The Trustees also had the benefit of presentations and discussions with management throughout the year.
Prior to approving the continuation of the Advisory Agreement, the Independent Trustees met in executive session with their independent counsel to discuss management's responses to their information request and the Independent Trustees reviewed their legal and fiduciary obligations and the factors relating to their evaluation and approval. In their deliberations, Trustees attributed different weights to the various factors, and no factor alone was considered dispositive. At the conclusion of their review, the Trustees determined that the advisory fee was fair and reasonable under the circumstances and within the range of what could be negotiated at arm's length, and that the continuance of the Advisory Agreement should serve the best interests of the Fund and its shareholders. The Trustees considered the following topics in reaching their conclusion to continue the Advisory Agreement:
Nature, Quality, and Extent of Services Provided by Adviser
• The Trustees reviewed the services provided and to be provided by the Adviser to the Fund. The Adviser provides the Fund with investment research, advice and supervision, and continuously furnishes an investment portfolio for the Fund consistent with the Fund's investment objectives, policies and restrictions as set forth in the Fund's Prospectus. The Trustees were assured that service levels for the Fund, which is subject to a fee waiver, are not affected by the terms of the fee waiver. The Trustees considered the commitment of the Adviser to provide high quality services to the Fund.
• The Trustees reviewed the Fund's relationship with the Adviser and the institutional resources available to the Fund under that relationship. The Trustees, in their deliberations, recognized that, for many of the Fund's shareholders, the decision to purchase Fund shares included a decision to select the Adviser as the investment adviser and that, in the minds of Fund shareholders, there is a strong association between the Adviser and the Fund.
• The Trustees noted, based on reports by senior management, that the Adviser's ownership group continues to be strongly supportive of the business and is engaged in appropriate and thoughtful strategic planning for the future.
First Eagle Credit Opportunities Fund | Semiannual Report | June 30, 2024
94
Board Considerations for Continuation of Advisory Agreement (unaudited)
Investment Performance of Fund and Adviser
• Noting that the Fund commenced operations in 2020, the Trustees reviewed the performance of the Fund on both an absolute and a relative basis over the 1- and 3-year periods.
• Performance over these periods was noted relative to the Fund's benchmark and to the performance of peer funds. The comparative review reflected research and benchmarking by an independent data provider, with outperformance and lagging performance generally as follows (1- and 3-year periods ended as of March 31, 2024):
| | | Peer Group | | Benchmark | |
Credit Opportunities Fund | | Outperformed over trailing 3-year period | | Outperformed over trailing 3-year period | |
| | Lagged over trailing 1-year period | | Lagged over trailing 1-year period | |
• Performance for the Fund was determined to be adequate under the circumstances given the benchmark, peer comparisons and on an absolute basis, and reflective of the Fund's investment objective and philosophy.
• A memorandum provided to the Trustees with management commentary on performance was discussed.
Costs of Services To Be Provided and Profits To Be Realized by Adviser and its Affiliates From Relationship with Fund; Economies of Scale; Fall-Out Benefits
• The Trustees reviewed the total compensation received by the Adviser (including compensation paid by the Adviser to the Subadviser) and the Fund's total costs for using the Adviser's services, taking into account expenses incurred by the Adviser that are passed through to the Fund (notably under the administrative cost reimbursement program). They concluded that this compensation was commensurate with the nature, extent, and quality of the services provided and therefore fair and reasonable under the circumstances. As part of their analysis, the Trustees considered fees charged by investment advisers to peer funds for services comparable to those provided by the Adviser (and Subadviser) and referred to an independent data provider fee report, together with a management summary of the same. The Trustees noted the Adviser's representation that there are no other substantially similar accounts managed by the Adviser or Subadviser. They determined that the Adviser's fees were competitive, with the net management fee for the Fund being within the range of peers.
• A memorandum provided to the Trustees with management commentary on fees and expenses was discussed.
First Eagle Credit Opportunities Fund | Semiannual Report | June 30, 2024
95
Board Considerations for Continuation of Advisory Agreement (unaudited)
• The Trustees noted that the Subadviser is able to retain some or all of certain loan origination fees and that this represents a source of additional compensation associated with the Fund's investment program.
• While analyzing the effects of direct and indirect compensation to the Adviser and its affiliates (sometimes referred to as "fall-out benefits"), the Trustees considered the absence of affiliated broker-dealer relationships and the effects of the administrative service reimbursements paid to the Adviser.
• The Trustees reviewed the Fund's expense ratios, which were deemed reasonable both on an absolute basis and in comparison to peer funds. The Trustees considered the Fund's expense ratio, noting that over time the Fund may show decreases and increases generally attributable to an increase or decrease in average net assets. The Trustees also considered the effect of Fund asset size on particular categories of expenses. The Trustees noted the impact on expense ratios of the administrative reimbursements charged by the Adviser. While economies of scale can be complex to assess and typically are not directly measurable, the Trustees noted that the Adviser may be able to employ economies of scale in certain areas relating to the management of the Fund, potentially including investment management, trading, compliance and back-office operations. In the case of the administrative expense reimbursements, because they represent the provision of services at cost, any economies of scale realized are, by definition, for the benefit of the Fund. In considering the Fund's expense ratios to date, the Trustees noted significant subsidies and expense limitations undertaken by the Adviser and the favorable impact of those supports on performance. The Trustees observed that absent these subsidies, expenses would be higher and the Fund's performance would be lower.
• The Trustees reviewed the Adviser's financial condition and profitability. In considering profits to the Adviser associated with the Fund, they noted continued, significant entrepreneurial investment in the product. The Trustees noted the cyclical and competitive nature of the global asset management industry and the related importance of profitability (when considered across the business) in maintaining the Adviser's culture and management continuity. The Trustees also noted that the Adviser has always shown the willingness to commit resources to support investment in the business and to maintain the generally high quality of the overall shareholder experience in the Fund, such as attracting and retaining qualified personnel and investing in technology. Levels of support are not dependent on the profits realized. The Trustees noted the impact on profitability of the subsidies and expense limitation terms described above. The Trustees also considered that certain personnel participate in equity ownership and other incentives tied to the financial results of the Adviser as a whole.
First Eagle Credit Opportunities Fund | Semiannual Report | June 30, 2024
96
Board Considerations for Continuation of Subadvisory Agreement (unaudited)
At a meeting held on June 5-6, 2024, the Board of Trustees of the Fund, including a majority of the Independent Trustees, approved the continuation of the Subadvisory Agreement.
In response to a letter sent to the Subadviser on behalf of the Independent Trustees requesting information about the Subadvisory Agreement and other arrangements and plans, the Trustees were provided with background materials related to the annual review process. The Trustees also had the benefit of presentations and discussions with management of the Adviser and Subadviser throughout the year.
Prior to approving the continuation of the Subadvisory Agreement, the Independent Trustees met in executive session with their independent counsel to discuss management's responses to their information request and reviewed their legal and fiduciary obligations and the factors relating to their evaluation and approval. In their deliberations, Trustees attributed different weights to the various factors, and no factor alone was considered dispositive. At the conclusion of their review the Trustees determined that the subadvisory fee was fair and reasonable under the circumstances and within the range of what could be negotiated at arm's length, and that the approval of the agreement should serve the best interests of the Fund and its shareholders.
The Trustees considered information and views substantially similar to those described above relating to the Advisory Agreement. The Trustees considered that the Subadviser is wholly owned by the Adviser, that certain of the operations of the two entities are broadly integrated, and that the Subadviser can be considered to be the direct lending business of the Adviser. Additionally, the Board, including the Independent Trustees, considered the nature, quality, cost and extent of services provided and to be provided under the Subadvisory Agreement (and corresponding services provided by the Adviser). The Trustees commented on the background and experience of the Fund's Portfolio Managers and the quality of the Trustees' frequent meetings with them, both individually and as a group, throughout the year and in prior meetings. The Board, including the Independent Trustees, determined, among other things, that the size and nature of the Subadviser's staff that manage the Fund, and the nature and quality of advisory services provided by the Subadviser, are satisfactory and appropriate. The Board did not separately consider the profitability of the Subadviser.
First Eagle Credit Opportunities Fund | Semiannual Report | June 30, 2024
97
First Eagle Credit Opportunities Fund
Trustees
Lisa Anderson
John P. Arnhold
Candace K. Beinecke (Chair)
Peter W. Davidson
Jean D. Hamilton
William M. Kelly
Paul J. Lawler
Mehdi Mahmud
Mandakini Puri
Officers
Mehdi Mahmud
President
Robert Bruno
Senior Vice President
Brandon Webster
Chief Financial Officer
Seth Gelman
Chief Compliance Officer
David O'Connor
General Counsel
Sabrina Rusnak-Carlson
Deputy General Counsel
Sheelyn Michael
Secretary & Deputy General Counsel
Jennifer Wilson
Chief Accounting Officer
Michael Luzzatto
Vice President
William Karim
Associate General Counsel
Shuang Wu
Treasurer
Investment Adviser
First Eagle Investment Management, LLC
1345 Avenue of the Americas
New York, NY 10105
Subadviser
First Eagle Alternative Credit, LLC
1345 Avenue of the Americas
New York, NY 10105
Legal Counsel
Sidley Austin LLP
787 Seventh Avenue
New York, NY 10019
Custodian
JPMorgan Chase Bank, N.A.
4 Chase Metrotech Center, Floor 16,
Brooklyn, NY 11245
Shareholder Servicing Agent
SS&C GIDS, Inc.
330 West 9th Street
Kansas City, MO 64105
800.334.2143
Underwriter
FEF Distributors, LLC
1345 Avenue of the Americas
New York, NY 10105
Independent Registered Public
Accounting Firm
PricewaterhouseCoopers LLP
300 Madison Avenue
New York, NY 10017
Additional information about the Trustees and Officers is included in the Fund's Statement of Additional Information.
This report is not authorized for distribution to prospective investors unless preceded or accompanied by a currently effective prospectus of First Eagle Credit Opportunities Fund.
First Eagle Credit Opportunities Fund | Semiannual Report | June 30, 2024
98

First Eagle Credit Opportunities Fund is offered by
FEF Distributors, LLC
1345 Avenue of the Americas, New York, NY 10105.
First Eagle Investment Management, LLC
1345 Avenue of the Americas, New York, NY 10105-0048
800.334.2143 www.firsteagle.com
Item 2. Code of Ethics.
The Registrant has adopted a code of ethics that applies to its principal executive officer and principal financial officer. Copies of the code of ethics may be requested free of charge by calling 1-800-334-2143 (toll free).
Item 3. Audit Committee Financial Expert.
Not applicable to this semiannual report.
Item 4. Principal Accountant Fees and Services.
Not applicable to this semiannual report.
Item 5. Audit Committee of Listed Registrants
Not applicable to this semiannual report.
Item 6. Investments.
Please see the schedule of investments contained under Item 1 of this Form N-CSR.
Item 7. Financial Statements and Financial Highlights for Open-End Management Investment Companies.
Not applicable.
Item 8. Changes in and Disagreements with Accountants for Open-End Management Investment Companies.
Not applicable.
Item 9. Proxy Disclosures for Open-End Management Investment Companies.
Not applicable.
Item 10. Remuneration Paid to Directors, Officers, and Others of Open-End Management Investment Companies.
Not applicable.
Item 11. Statement Regarding Basis for Approval of Investment Advisory Contract.
Please see Approval of Investment Advisory Contract included under Item 1 of this Form N-CSR.
Item 12. Disclosure of Proxy Voting Policies and Procedures for Closed-End Management Investment Companies.
Not applicable to this semiannual report.
Item 13. Portfolio Managers of Closed-End Management Investment Companies.
Not applicable to this semiannual report.
There has been no change, as of the date of this filing, in any of the portfolio managers identified in response to paragraph (a)(1) of this Item in the registrant’s most recently filed annual report on Form N-CSR.
Item 14. Purchases of Equity Securities by Closed-End Management Investment Company and Affiliated Purchasers.
Not applicable.
Item 15. Submission of Matters to a Vote of Security Holders.
No material change to report at this time.
Item 16. Controls and Procedures.
(a) In the opinion of the principal executive officer and principal financial officer, based on their evaluation, the registrant's disclosure controls and procedures are adequately designed and are operating effectively to ensure (i) that material information relating to the registrant, including its consolidated subsidiaries, is made known to them by others within those entities, particularly during the period in which this report is being prepared; and (ii) that information required to be disclosed by the registrant on Form N-CSR is recorded, processed, summarized and reported within the time periods specified in the Securities and Exchange Commission's rules and forms.
(b) There were no changes in the registrant's internal control over financial reporting that occurred during the period covered by this report that have materially affected, or are reasonably likely to materially affect, the registrant's internal control over financial reporting.
Item 17. Disclosure of Securities Lending Activities for Closed-End Management Investment Companies.
Not applicable.
Item 18. Recovery of Erroneously Awarded Compensation.
Not applicable.
Item 19. Exhibits.
(a)(1) Code of ethics required to be disclosed under Item 2 of Form N-CSR.
(a)(2) Certifications pursuant to Rule 30a-2(a) under the Investment Company Act of 1940 (17 CFR 270.30a-2(a)): Attached hereto.
(a)(3) Not applicable
(b) Certification pursuant to Rule 30a-2(b) under the Investment Company Act of 1940 (17 CFR 270.30a-2(b)): Attached hereto.
SIGNATURES
Pursuant to the requirements of the Securities Exchange Act of 1934 and the Investment Company Act of 1940, the registrant has duly caused this report to be signed on its behalf by the undersigned, thereunto duly authorized.
| (Registrant) | First Eagle Credit Opportunities Fund |
| | |
| By (Signature and Title)* | /s/ Mehdi Mahmud |
| | Mehdi Mahmud, President |
| Date September 5, 2024 | |
Pursuant to the requirements of the Securities Exchange Act of 1934 and the Investment Company Act of 1940, this report has been signed below by the following persons on behalf of the registrant and in the capacities and on the dates indicated.
| By (Signature and Title)* | /s/ Mehdi Mahmud |
| | Mehdi Mahmud, President |
| Date September 5, 2024 | |
| By (Signature and Title)* | /s/ Brandon Webster |
| | Brandon Webster, Principal Financial Officer |
| Date September 5, 2024 | |
*Print the name and title of each signing officer under his or her signature.