| Prospectus Supplement No. 2 | Filed Pursuant to Rule 424(b)(3) |
| (to Prospectus dated November 17, 2020) | Registration No. 333-249949 |

17,715,000 Shares of Common Stock
Up to 102,359,084 Shares of Common Stock by the Selling Stockholders
465,000 Warrants by the Selling Stockholders
This prospectus supplement updates and supplements the prospectus dated November 17, 2020 (the “Prospectus”), which forms a part of our Registration Statement on Form S-1 (Registration No. 333-249949). This prospectus supplement is being filed to update and supplement the information in the Prospectus with the information contained in our Annual Report on Form 10-K, filed with the Securities and Exchange Commission on March 8, 2020 (the “Annual Report”). Accordingly, we have attached the Annual Report to this prospectus supplement.
The Prospectus relates to the offer and sale of (a) up to 17,715,000 shares of our Common Stock, upon the exercise of warrants, each exercisable for one share of Common Stock at a price of $11.50 per share (“Warrants”) and (b) the resale from time to time of (i) up to 102,359,084 shares of Common Stock, consisting of 87,894,084 shares of Common Stock, 465,000 shares of Common Stock issuable upon the exercise of Warrants and up to 14,000,000 shares of Common Stock to be issued if certain threshold price conditions are met and (ii) 465,000 Warrants by the selling security holders named in the Prospectus.
This prospectus supplement should be read in conjunction with the Prospectus. This prospectus supplement updates and supplements the information in the Prospectus. If there is any inconsistency between the information in the Prospectus and this prospectus supplement, you should rely on the information in this prospectus supplement.
Our Common Stock and Warrants are listed on the Nasdaq Capital Market under the symbols “PAYA” and “PAYAW,” respectively. On March 8, 2021, the closing sale prices of our Common Stock and Warrants were $11.60 and $3.36, respectively.
Investing in our Common Stock involves risks that are described in the “Risk Factors” section beginning on page 6 of the Prospectus and under similar headings in any further amendments or supplements to the Prospectus before you decide whether to invest in our securities.
Neither the Securities and Exchange Commission nor any state securities commission has approved or disapproved of these securities or determined if the Prospectus or this prospectus supplement is truthful or complete. Any representation to the contrary is a criminal offense.
The date of this prospectus supplement is March 9, 2021.
UNITED STATES
SECURITIES AND EXCHANGE COMMISSION
Washington, D.C. 20549

FORM 10-K
☒ ANNUAL REPORT PURSUANT TO SECTION 13 OR 15(d) OF THE SECURITIES EXCHANGE ACT OF 1934
For the fiscal year ended December 31, 2020
OR
☐ TRANSITION REPORT PURSUANT TO SECTION 13 OR 15(d) OF THE SECURITIES EXCHANGE ACT OF 1934
For the transition period from to
Commission file number 001-819881
Paya Holdings Inc.
(Exact name of registrant as specified in its charter)
| Delaware | 85-2199433 | |||||||
| (State or other jurisdiction of incorporation or organization) | (I.R.S. Employer Identification No.) | |||||||
303 Perimeter Center N, Suite 600, Atlanta, Georgia 30346
(Address, including zip code, of principal executive offices)
(800) 261-0240
(Registrant’s telephone number, including area code)
(Former name, former address and former fiscal year, if changed since last report)
Securities registered pursuant to Section 12(b) of the Act:
| Title of each class | Trading Symbol(s) | Name of each exchange on which is registered | ||||||
| Common stock, par value $0.0001 per share | PAYA | The Nasdaq Capital Market | ||||||
| Warrants to purchase common stock | PAYAW | The Nasdaq Capital Market | ||||||
Indicate by check mark if the registrant is a well-known seasoned issuer, as defined in Rule 405 of the Securities Act. Yes ☐ No ☒
Indicate by check mark if the registrant is not required to file reports pursuant to Section 13 or Section 15(d) of the Act. Yes ☐ No ☒
Indicate by check mark whether the registrant (1) has filed all reports required to be filed by Section 13 or 15 (d) of the Securities Exchange Act of 1934 during the preceding 12 months (or for such shorter period that the registrant was required to file such reports), and (2) has been subject to such filing requirements for the past 90 days. Yes ☒ No ☐
Indicate by check mark whether the registrant has submitted electronically, every Interactive Data File required to be submitted pursuant to Rule 405 of Regulation S-T during the preceding 12 months (or for such shorter period that the registrant was required to submit and post such files). Yes ☒ No ☐
Indicate by check mark whether the registrant is a large accelerated filer, an accelerated filer, a non-accelerated filer, smaller reporting company, or an emerging growth company. See the definitions of “large accelerated filer,” “accelerated filer,” “smaller reporting company,” and “emerging growth company” in Rule 12b-2 of the Exchange Act.
| Large accelerated filer ☐ | Accelerated filer ☒ | ||||
| Non-accelerated filer ☐ | Smaller reporting company ☒ | ||||
| Emerging growth company ☒ | |||||
If an emerging growth company, indicate by check mark if the registrant has elected not to use the extended transition period for complying with any new or revised financial accounting standards provided pursuant to Section 13(a) of the Exchange Act. ☐
Indicate by check mark whether the registrant has filed a report on and attestation to its management's assessment of the effectiveness of its internal control over financial reporting under Section 404(b) of the Sarbanes-Oxley Act (15 U.S.C. 7262(b)) by the registered public accounting firm that prepared or issued its audit report. ☐
Indicate by check mark whether the registrant is a shell company (as defined in Rule 12b-2 of the Exchange Act). Yes ☐ No ☒.
The aggregate market value of common shares held by non-affiliates computed by reference to the price at which the common equity was last sold, or the average bid and asked price of such common equity, as of the last business day of the registrant’s most recently completed fiscal quarter, December 31, 2020, was approximately $1.6 billion. There were 116,697,441 shares of Common Stock, par value $0.0001 per share, issued and outstanding as of December 31, 2020.
Documents Incorporated by Reference
The information required by Part III of this Report, to the extent not set forth herein, is incorporated herein by reference from the registrant's definitive proxy statement relating to the Annual Meeting of Shareholders to be held in 2021, which definitive proxy statement shall be filed with the Securities and Exchange Commission within 120 days after the end of the fiscal year to which this Report relates.
Paya Holdings Inc.
TABLE OF CONTENTS
Annual Report on FORM 10-K
December 31, 2020
Cautionary Statement Regarding Forward-Looking Statements
This Annual Report on Form 10-K includes “forward-looking statements” within the meaning of Section 27A of the Securities Act of 1933, as amended (the “Securities Act”), and Section 21E of the Securities Exchange Act of 1934, as amended (the “Exchange Act”). These forward-looking statements relate to expectations for future financial performance, business strategies or expectations for the post-combination business. Specifically, forward-looking statements may include statements relating to:
•operational, economic, political and regulatory risks;
•natural disasters and other business disruptions including outbreaks of epidemic or pandemic disease;
•changes in demand within a number of key industry end-markets and geographic regions;
•failure to retain key personnel;
•our inability to recognize deferred tax assets and tax loss carry forwards;
•our future operating results fluctuating, failing to match performance or to meet expectations;
•unanticipated changes in our tax obligations;
•our obligations under various laws and regulations;
•the effect of litigation, judgments, orders or regulatory proceedings on our business;
•our ability to successfully acquire and integrate new operations;
•global or local economic and political movements;
•our ability to effectively manage our credit risk and collect on our accounts receivable;
•our ability to fulfill our public company obligations;
•any failure of our management information systems;
•our ability to meet our debt service requirements and obligations; and
•changes in the payment processing market in which Paya competes
•changes in the vertical markets that Paya targets
•risks relating to Paya’s relationships within the payment ecosystem
•risk that Paya may not be able to execute its growth strategies
•risks relating to data security
•changes in accounting policies applicable to Paya
•the risk that Paya may not be able to develop and maintain effective internal controls and other risks and uncertainties
These forward-looking statements are based on information available as of the date of this Form 10-K and our management’s current expectations, forecasts and assumptions, and involve a number of judgments, risks and uncertainties. Accordingly, forward-looking statements should not be relied upon as representing our views as of any subsequent date. We undertake no obligation to update forward-looking statements to reflect events or circumstances after the date they were made, whether as a result of new information, future events or otherwise, except as may be required under applicable securities laws.
3
RISK FACTOR SUMMARY
Our business involves significant risks and uncertainties that make an investment in us speculative and risky. The following is a summary list of the principal risk factors that could materially adversely affect out business, financial condition, liquidity and results of operations. These are not the only risks and uncertainties we face, and you should carefully review and consider the full discussion of our risk factors in the section entitled “Risk Factors”, together with the other information in this Annual Report on Form 10-K.
•factors that affect the payment processing business, such as economic and political risk, including as a result of the coronavirus, or COVID-19, the business cycles of our merchants and distribution partners and the overall level of consumer and commercial spending, may have a material adverse effect on our business and results of operations;
•the payment processing industry is highly competitive and such competition is likely to increase, which may adversely influence the prices we can charge to merchants for our services and the compensation we must pay to our distribution partners, and as a result, our profit margins;
•potential changes in the competitive landscape, including disintermediation from other participants in the payments value chain, could harm our business;
•reliance on third parties, including our strategic relationship with Sage, distribution partners that may not serve us exclusively and are subject to attrition and merchants who may be reluctant to switch to a new merchant acquirer, which may adversely affect our growth;
•unauthorized disclosure of merchant or cardholder data, whether through breach of our computer systems, computer viruses, or otherwise, could expose us to liability, protracted and costly litigation and damage our reputation;
•degradation of the quality of the products and services we offer, including support services, could adversely impact our ability to attract and retain merchants and partners;
•increases in card network fees and other changes to fee arrangements may result in the loss of merchants or a reduction in our earnings;
•if the banks that currently provide ACH and wire transfers fail to properly transmit ACH or terminate their relationship with us or limit our ability to process funds or we are not able to increase our ACH capacity with our existing and new banks, our ability to process funds on behalf of our clients and our financial results and liquidity could be adversely affected;
•if we fail to comply with the applicable requirements of card networks and industry self-regulatory organizations, those card networks or organizations could seek to fine us, suspend us, or terminate our registrations through our bank sponsors or our merchants or sales partners may incur fines or penalties that we cannot collect from them, causing us to bear the cost;
•there may be a decline in the use of electronic payments as a payment mechanism for consumers or adverse developments with respect to the electronic payments industry in general, which could adversely affect our business, financial condition, and operating results;
•in order to remain competitive and to continue to increase our revenues and earnings, we must continually update our products and services, a process which could result in increased costs and the loss of revenues, earnings, merchants and distribution partners if the new products and services do not perform as intended or are not accepted in the marketplace;
•we may not be able to continue to expand our share of our existing vertical markets or expand into new vertical markets, which would inhibit our ability to grow and increase our profitability;
4
•our ability to grow our business will depend in part on the addition of new partners, and our inability to effectively onboard these new partners could have a material adverse effect on our business, financial condition and results of operations;
•we may not be able to successfully execute our strategy of growth through acquisitions;
•we may not be able to successfully manage our intellectual property and may be subject to infringement claims;
•a substantial portion of our merchants are middle market businesses, which may increase the impact of economic fluctuations and merchant attrition on us;
•our systems and our third-party providers’ systems may fail due to factors beyond our control, which could interrupt our service, resulting in our inability to process payments, cause us to lose business, increase our costs and expose us to liability;
•we rely on other service and technology providers. If they fail or discontinue providing their services or technology generally or to us specifically, our ability to provide services to merchants may be interrupted, and, as a result, our business, financial condition and results of operations could be adversely impacted;
•fraud by merchants or others could cause us to incur losses;
•we rely on bank sponsors, which have substantial discretion with respect to certain elements of our business practices, to process electronic payment transactions. If these sponsorships are terminated and we are not able to secure new bank sponsors, we will not be able to conduct our business;
•we incur liability when our merchants refuse or cannot reimburse us for chargebacks resolved in favor of their customers;
•our risk management policies and procedures may not be fully effective in mitigating our risk exposure in all market environments or against all types of risks;
•legal proceedings could have a material adverse effect on our business, financial condition or results of operations;
•our ability to successfully operate the business depends upon the efforts of certain key personnel and our ability to attract, recruit, retain and develop qualified employees; failures in talent recruitment and retention could adversely affect the operations and profitability of our business;
•we are subject to extensive government regulation, including the Bank Secrecy Act and limitations on consumer information among others, and any new laws and regulations, industry standards or revisions made to existing laws, regulations or industry standards affecting the electronic payments industry may have an unfavorable impact on our business, financial condition and results of operations;
•changes in tax laws or their interpretations, or becoming subject to additional U.S., state or local taxes that cannot be passed through to our clients, could negatively affect our business, financial condition and results of operations;
•changes in the method pursuant to which the London Interbank Offered Rate (“LIBOR”) is determined and the transition to other benchmarks may adversely affect our results of operations;
•certain subsidiaries have and will continue to have high levels of indebtedness and the Credit Agreement could require us to amend or refinance the existing indebtedness; and
•the other factors set forth under “Risk Factors.”
5
Part I
Item 1. Business
Unless the context otherwise requires, references to “we”, “us”, “our”, "Paya", "Paya Holdings", or “the Company” refer to Paya Holdings Inc. and its consolidated subsidiaries.
Overview
We are a leading independent integrated payments and commerce platform providing card, Automated Clearing House ("ACH"), and check payment processing solutions via software to middle-market businesses in the United States. Our solutions integrate with our customers’ core business software to enable payments acceptance, reconcile invoice detail, and post payment information to their core accounting systems. In this manner, we enable our customers to collect revenue from their consumer ("B2C") and business ("B2B") customers with a seamless experience and high-level of security across payment types. Given the focus on B2B and consumer bill payments integrated into software, 87% of our payment card volume is card-not-present and our average customer accepts $450,000 of credit and debit card volume per year. These metrics are both significantly higher than industry average according to the Nilson Report published in March 2020.
We concentrate on strategic vertical markets defined by strong secular growth and low penetration of electronic payments that are non-cyclical in nature such as B2B goods & services, healthcare, faith-based & non-profit, government & utilities, and education. Our technology, distribution, and support are tailored to the specific and complex payment needs of customers in these verticals. We have deep expertise of industry-specific considerations and believe this makes us a leading provider of integrated payment solutions in these markets with a sustainable competitive advantage.
In these strategic verticals, we deliver our payment solutions through front-end Customer Relationship Management ("CRM") and back-end accounting independent software vendors (“ISVs”) who sell or refer our integrated payments bundled with their proprietary software solutions to their customers. We enter into contracts with these ISV's where they deliver new customers to us in exchange for a portion of transaction revenue those customers generate. We refer to these ISV's as "partners" and the customers they bring to us as "customers." Our partners choose Paya because of our easy to use and feature rich technology platform, vertical expertise, and commitment to customer service. To our partners, embedding payments in their software increases customer life-time value and generates a new revenue stream through a share of Paya’s payments revenue.
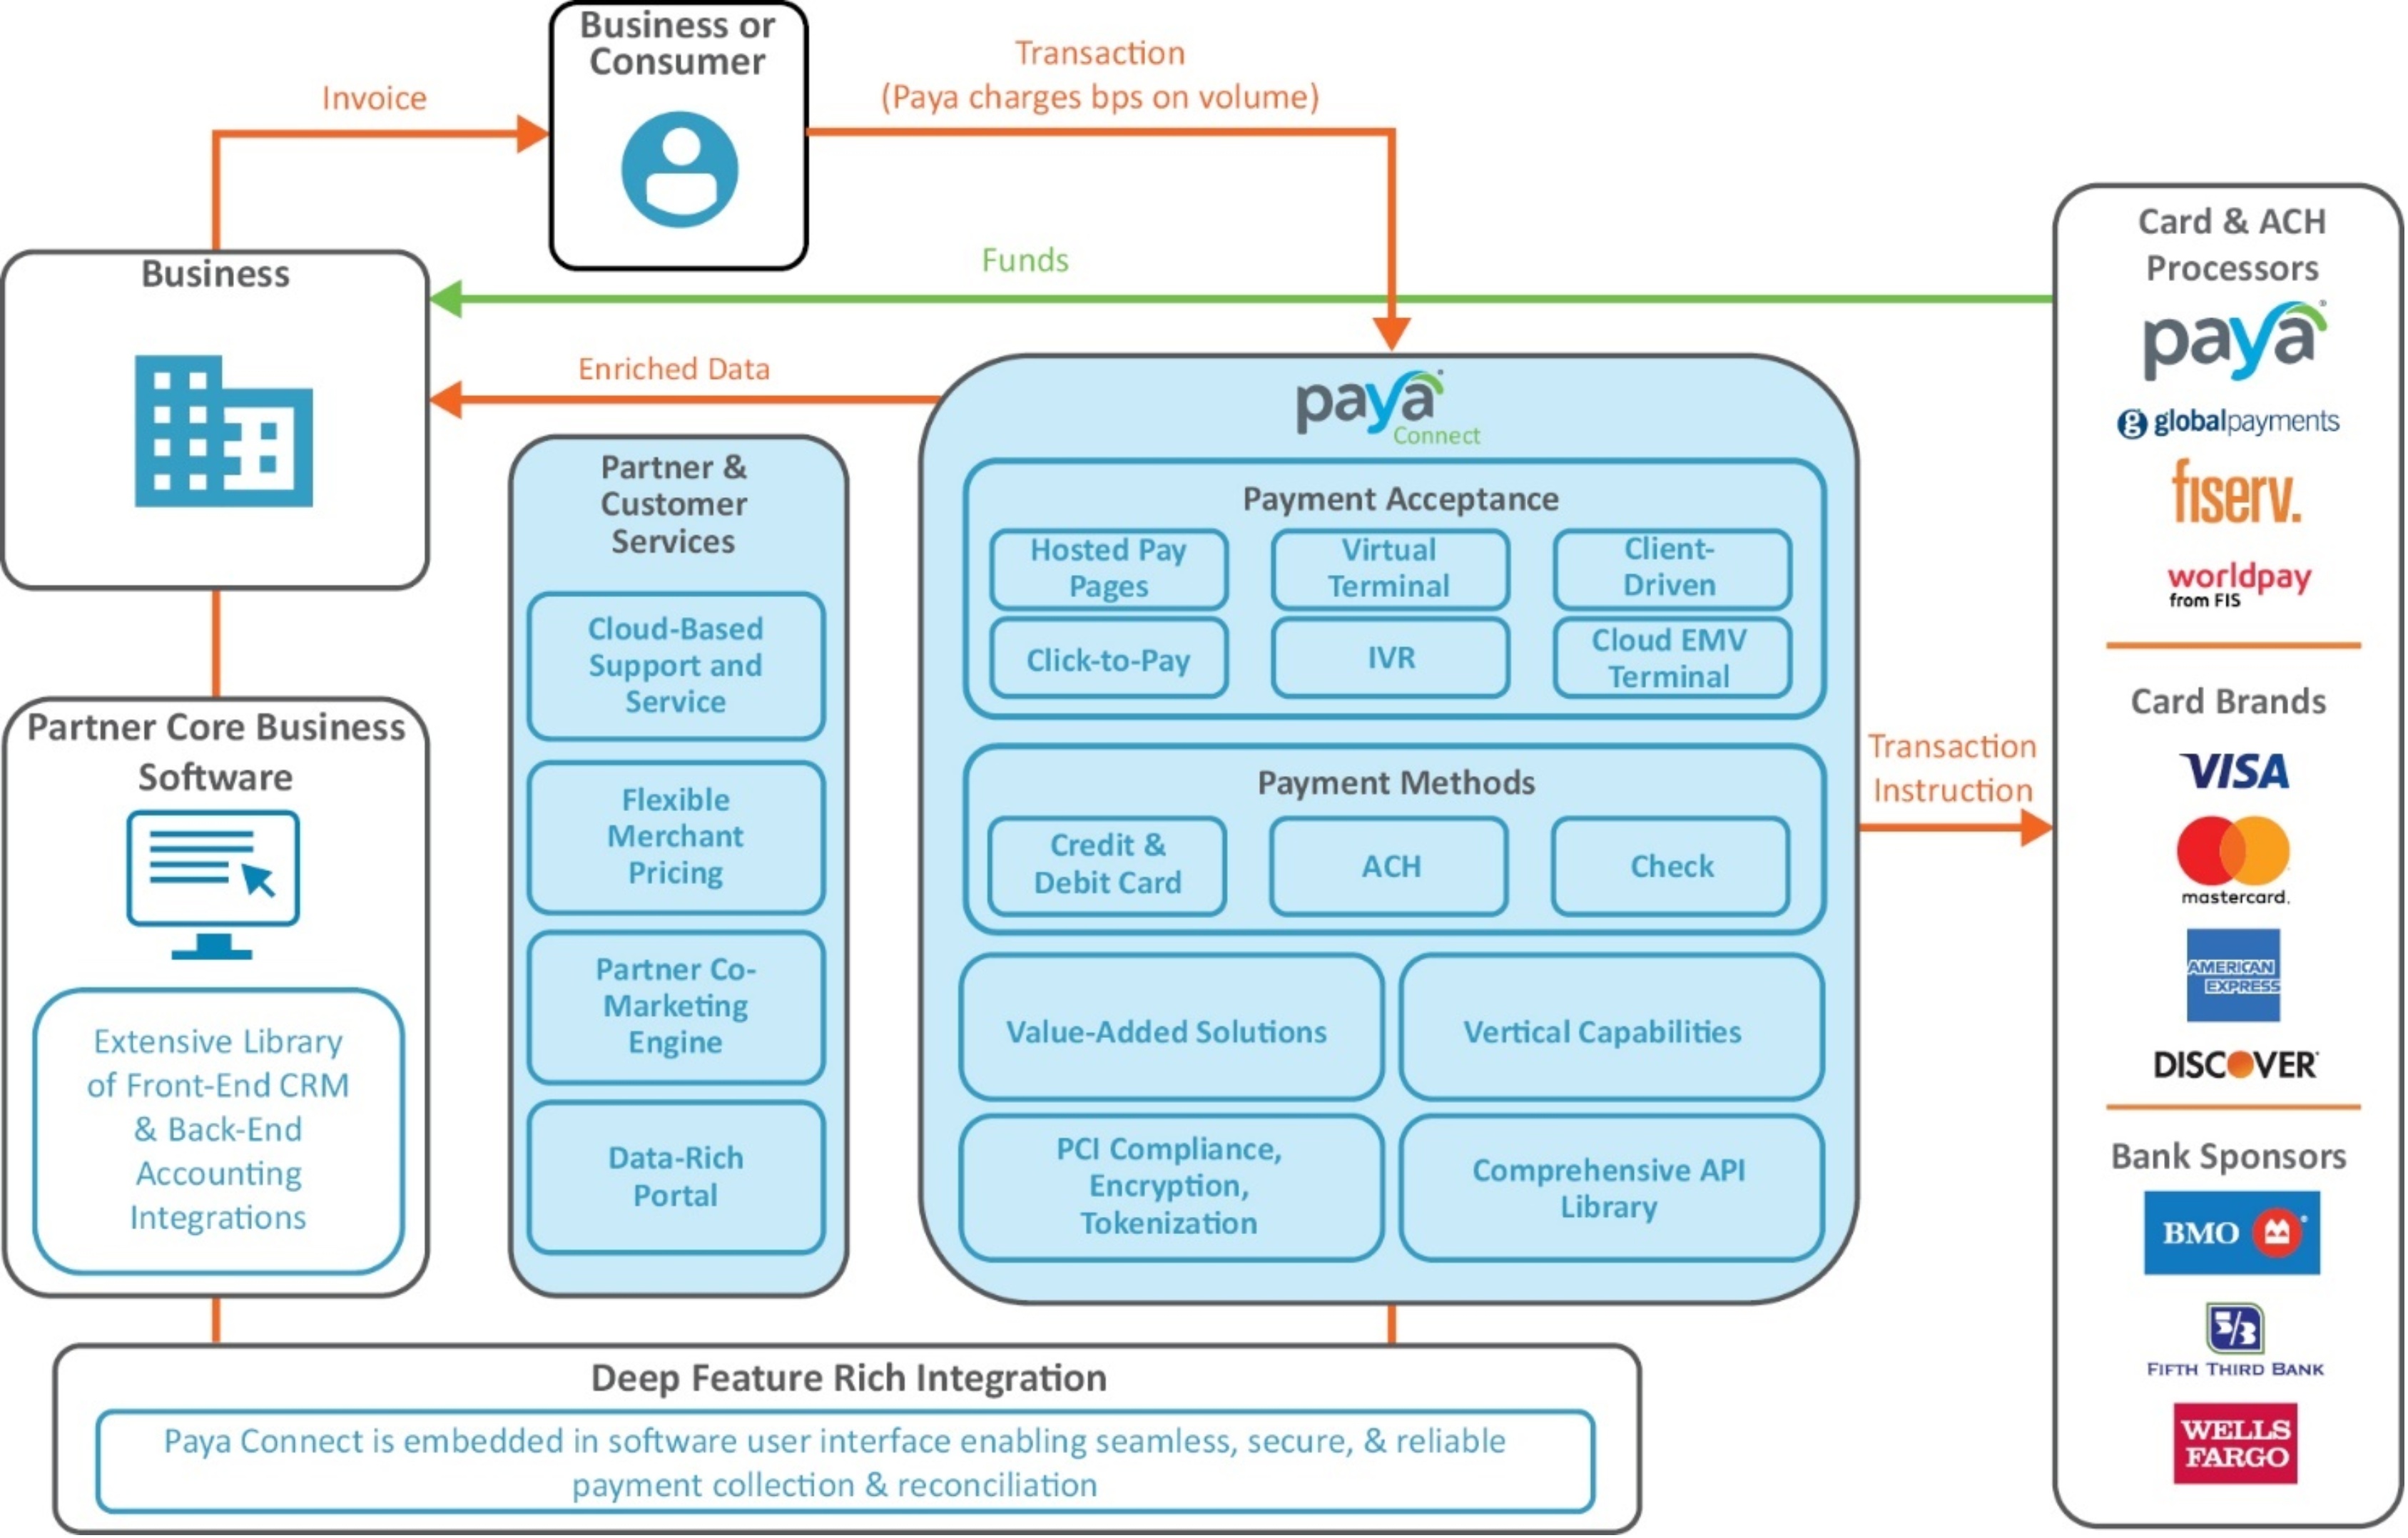
Our payment technology is centered around Paya Connect, a proprietary, API-driven and service-oriented payments platform which integrates with our customers’ front-end CRM and back-end accounting software and acts as a universal gateway which connects to multiple card processors as well as Paya’s proprietary ACH processing platform. Paya Connect also serves as the foundation for modular value-added solutions including digital boarding, flexible funding, e-invoicing, auto-billing and recurring payments, tokenized and secure transactions, and robust customer and partner reporting, which are differentiators in our key end markets. Further, Paya Connect’s architecture allows us to easily add incremental value-added services into our ecosystem through API integration.
We have built industry-leading scale with a highly diverse customer portfolio. As of December 31, 2020, we served over 100,000 businesses, representing over $33 billion in card and ACH payment volume for the twelve months ended December 31, 2020. Our customer portfolio is highly diversified with no single customer representing more than 1% of payment revenue for the year ended December 31, 2020. Average transaction size was $225 inclusive of all card and ACH payment transactions in 2020. Integrated Solutions net volume change of existing merchants from attrition and same store sales was 7% in 2020.
We derive most of our revenue from fees paid by our customers which principally include a processing fee that is charged as a percentage of total payment volume, as well as fixed interchange fees and convenience-based fees. In some cases, including card processing in our government and utilities end-market and in ACH and check
6
processing, fees are charged in the form of a fixed fee per transaction. We also derive a portion of revenue from monthly and annual fees for customers to use the Paya Connect platform and its suite of value-added services. Our revenue is re-occurring in nature because of the consistency of B2B and consumer bill payments, the mission-critical and embedded nature of the solutions we provide, and the high switching costs associated with these solutions due to complex levels of integration. We also benefit from a high degree of operating leverage given the combination of our highly scalable payments platform and low customer acquisition costs resulting from our partner-centric model.
Paya’s net revenue increased to $206.0 million for fiscal year ended December 31, 2020 from $203.4 million for fiscal year ended December 31, 2019, representing year-over-year growth of 1.3%. Our adjusted EBITDA increased to $53.0 million for fiscal year ended December 31, 2020 from $50.3 million for fiscal year ended December 31, 2019, representing year-over-year growth of 5.4%. See “Paya’s Management’s Discussion and Analysis of Financial Condition and Results of Operations — Key performance indicators and non-GAAP Measures — Adjusted EBITDA” for a reconciliation of our non-GAAP measures to the most directly comparable financial measure calculated and presented in accordance with GAAP.
Segments
We have two reportable segments, Integrated Solutions and Payment Services.
Integrated Solutions
Our Integrated Solutions segment represents the delivery of our credit and debit card payment solutions, and to a lesser extent, ACH processing solutions to customers via integrations with software partners across our strategic vertical markets. Our Integrated Solutions partners include vertical focused front-end CRM software providers as well as back-end Enterprise Resource Planning ("ERP") and accounting solutions. Integrated Solutions represented 59.4% of revenue for the year ending December 31, 2020.
Payment Services
The Payment Services segment represents the delivery of card payment processing solutions to our customers through resellers, as well as ACH, check, and gift card processing. Card payment processing solutions in this segment utilize Paya’s core technology infrastructure and do not originate through a software integration. ACH, check, and gift card processing may or may not be integrated with third-party software, however, Paya focuses on strategically cross selling these products with new software partners. Payment Services represented 40.6% of revenue for the year ending December 31, 2020.
Industry Overview
The payment processing industry enables businesses to accept and deliver credit and debit card, ACH, and other payment processing services. The industry continues to experience growth driven by broader acceptance of electronic payments methods and continued delivery of value-added functionality via payment technology and related solutions. We believe the identifiable U.S. business to business payments market to be $22 trillion based on Wall Street estimates.
Payment Processing Value Chain
We provide mission-critical services in what we believe is the most economically advantageous part of the payment processing value chain. We operate the technology behind, and facilitate the experience around, the actual acceptance of the payment transaction. We have direct relationships with both our partners and our end customers. Shown below is a graphic outlining the steps in a typical payment card or ACH transaction in the Paya ecosystem, along with descriptions of each key step.
7
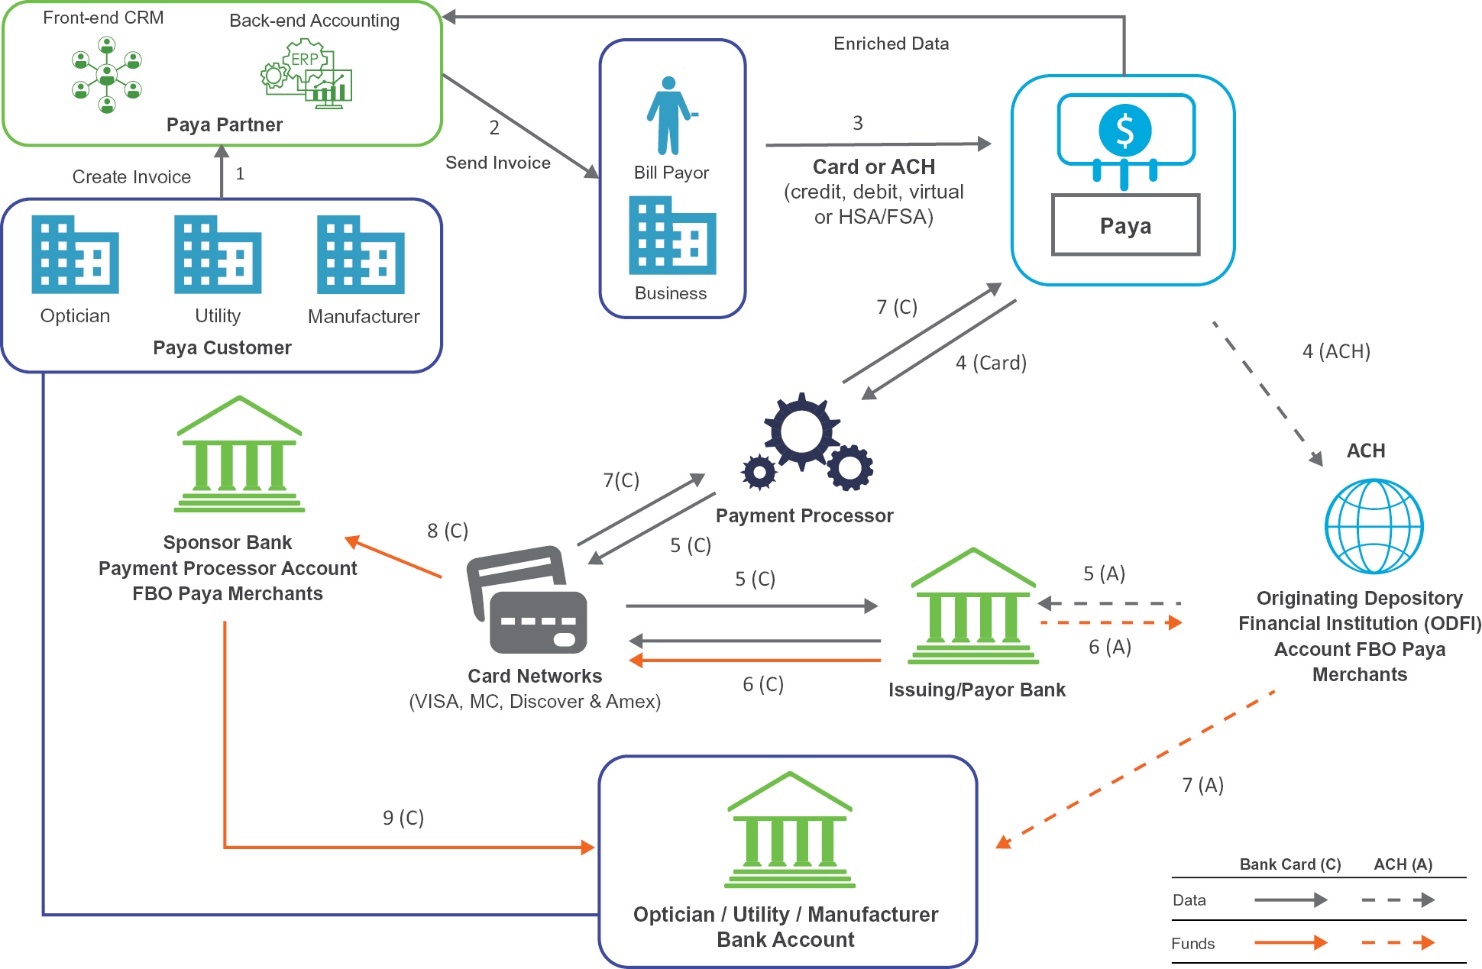
A typical transaction in one of Paya’s core verticals consists of the following steps, which demonstrates a simplified version of a card-not-present or ACH payment transaction:
1.A payment usually starts with the business creating an invoice for services rendered or goods sold. Businesses can leverage Paya Connect for this feature, but also leverage the capabilities built into their core software.
2.The business will then send the invoice through their core software to their customer, the payor, which may be either a consumer or another business.
3.The transaction process begins when the payor (consumer or business) navigates to the invoice sender’s website or payment portal, or leverages Paya’s click-to-pay functionality contained within an invoice email. The payor can choose to pay with a credit or debit card via a card-not-present transaction or with a bank account via an ACH transaction. The actual payment transaction and the experience of submitting the payment takes place on Paya’s gateway. This allows the software provider (Paya’s partner) and the business accepting the payment (Paya’s customer) to remain out of the scope of PCI-DSS compliance and enables Paya to offer other value added services alongside the transaction (e.g. encryption, tokenization, stored payment method recurring & installment payments).
4.After the payor initiates the payment, Paya routes the transaction information to a back-end payment processor. The processor provides the technology needed for transaction authorization, data transmission, and settlement of funds. In our case, we leverage multiple relationships with back-end processors for card processing and utilize Paya’s proprietary ACH platform for ACH processing.
5.For credit and debit card transactions, the processor then transmits the data to the issuing/payor bank using card network rails. The card networks, such as MasterCard or Visa, provide the rails to route transactions and data between the key parties in a card transaction: issuing/payor banks, processors, and Paya. Data is
8
transmitted in real-time over sophisticated communication networks which require compliance with various rules and regulations to use. ACH transactions are validated by Paya directly with the issuing bank through our Original Depository Financial Institution partners ("ODFIs") and are submitted by the ODFIs into the ACH network for settlement. ACH transactions do not utilize the card network rails for authorization or settlement.
6.For debit and credit card transactions, the issuing/payor bank then receives the transaction information and is responsible for authorizing the transaction (by checking for sufficient funds and fraud). After authorization, the issuing/payor bank then transfers the funds to the card network. The issuing/payor bank is the financial institution that issued the payor the debit or credit card. For ACH transactions, the issuing/payor bank (the bank that holds the payor’s deposit account) receives the transaction information and is responsible for authorizing the transaction. After authorization, the issuing/payor bank transfers the funds through the ACH network to Paya’s ODFI.
7.The debit and credit card authorization data is routed back to Paya’s gateway to accept the transaction. This entire process takes seconds.
8.For debit and credit card transactions, the card network then routes the funds to Paya’s sponsor bank. The sponsor bank, in our case BMO Harris, is a member of the card networks and ultimately provides Paya access to the card networks. In the case of ACH transactions (7A in the diagram), Paya’s ODFI funds the business’ bank account without funds flowing through any third-party payment processor.
9.Finally, for debit and credit card transactions, the sponsor bank routes the funds to the bank account of the card accepting business.
10.Paya sends enriched transaction data back to the core software to reduce manual data entry, ease the reconciliation process, and provide valuable insights to the business.
Key Trends Impacting Our Market
We specialize in delivering payment processing solutions to middle-market businesses in the United States. The middle-market has historically been reliant on banks and networks of local resellers with installation and service capabilities to provision access to payments. However, as internet access and software penetration increased, local bank partnerships became less relevant, and a new generation of high-tech, integrated payment processors emerged to serve businesses’ needs. Today, integrated-focused payments providers marry their payment acceptance capabilities and solutions with owned or third-party software to deliver differentiated solutions to customers with value-added services such as general ledger post-back capabilities, digital onboarding, and more. Traditional bank processors have had limited success in this area given gaps in technological capabilities and lack of vertical-specific knowledge. Key trends defining the market include the following:
•Businesses require electronic payment solutions (card-not-present and ACH) that are integrated with electronic invoicing, recordkeeping, and other reporting tools.
•Software vendors have become critical to payments distribution. Software vendors and payments providers have developed mutually beneficial relationships where software vendors provide unique customer leads to the payments providers and in turn are able to monetize payments.
•Proliferation of payments and software solutions catering to specific end markets with differentiated features that streamline business operations.
•Increasing demand for a unified payment processing solution that provides access to both card and ACH capabilities, including combined underwriting, pricing, and reporting.
We believe our core market opportunity is large and growing faster than the broader payments market. According to an Accenture market study conducted in 2019, the total addressable market in our five strategic vertical markets
9
(B2B goods and services, healthcare, faith-based & non-profit, government & utilities, and education) represents approximately $1 trillion in card payments volume alone and is growing at low double-digits growth rates annually.
Market Developments
We determined that we are a leading independent integrated payments and commerce platform based on data published by the Nilson Report, which is a trade publication specializing in the global card and payment industry. According to the Nilson Report, Paya was the second largest independent payments provider for U.S. Card Not Present transactions on the basis of both total number of transactions and dollar volume during 2019. We define an independent payments provider as one that is not owned by a bank or FIS. Data from the Nilson Report shows that Paya’s proportion of card-not-present transactions, volume per transaction and volume per customer are all considerably higher than other independent payment providers with which we compete. This combination of high volume and favorable card metrics demonstrates that Paya is a leading platform among integrated payment providers.
Recent Developments — COVID-19
The COVID-19 pandemic and subsequent shelter-in-place and social distancing policies, as well as the broader economic decline, had a material impact on our business in 2020. Many of our customers experienced a decline in transaction volumes from pre COVID-19 levels. However, given many of our customers leverage our payment technology to accept transactions in a card-not-present environment, their business operations were not impacted dramatically. Further, most of our recurring or contractual transactions are B2B and not tied to consumer discretionary spend and, as such, were not significantly impacted. This was evident by stable or growing volumes in our B2B Goods & Services, Government & Utilities, and Non-Profit verticals. Lastly, we benefited from our lack of concentration in end markets which saw steep declines, such as restaurants, travel, hospitality, and brick-and-mortar retail.
In response to these developments, we took precautionary measures to ensure the safety of our employees, support our customers, and mitigate the impact on our financial position and operations. We seamlessly implemented remote working capabilities for our entire organization with minimal disruption to our operations or key operating performance indicators. We also identified opportunistic expense reductions which increased operating efficiencies and provided additional profitability in the period.
While our business was impacted by the COVID-19 pandemic, we have demonstrated resilience due to our portfolio of attractive, less-cyclical end markets. The impact that COVID-19 will have on our consolidated results of operations in 2021 remains uncertain. While we have not seen a meaningful degradation in new customer enrollment or an increase in existing customer attrition as a result of COVID-19, it is possible that those business trends change if economic hardship across the country forces new or additional business closures or other detrimental actions. We will continue to evaluate the nature and extent of these potential impacts to our business, consolidated results of operations, and liquidity.
Strategies
Growth Strategies
Our growth strategy will continue to be driven by diverse organic initiatives and strategic acquisitions to help solve the most complex business challenges facing our customers. The key elements of this strategy include:
•Continue fundamental execution. We continue to make investments in our product, sales, and marketing efforts, centered around our proprietary technology-enabled payment solutions, to grow our existing software partner network and customer base. We also expect to increase customer life-time value through ongoing optimization of our customer support, retention management and pricing initiatives. Further, the company should continue to benefit from fixed cost operating leverage generated by our historical investments in a scalable platform.
10
•Penetrate existing partners. A key aspect of our value proposition is our track-record of driving penetration of our payment solutions into the underlying customer bases of our existing software partners. Our success in this area is driven by the ability of Paya and our software partners to sell payment capabilities to their existing customers that are not yet leveraging integrated payments modules. Our partners are often multi-platform software providers and we benefit from expanding our library of integrations with those partners to access additional attractive customer bases. Paya also benefits from the natural growth of its partners who themselves are typically growing franchises within their verticals, and Paya helps accelerate new customer acquisition through co-marketing and integrated sales programs.
•Drive new software partnerships. The Paya Connect platform, coupled with our deep vertical expertise, positions us well to continue winning new software partners in our core markets. We have also seen great success entering new verticals organically or through acquisition and will continue to identify attractive end markets that could benefit from Paya’s unique payment solutions. We have an extensive pipeline of partnership opportunities that we will continue to convert.
•Leverage proprietary ACH. The Paya Connect platform seamlessly integrates card and ACH processing and reporting, a differentiated feature proving to be a winning factor in our strategic vertical markets as customers prefer to offer a consistent payment experience, regardless of form factor. Cross-selling ACH into our existing base of integrated card customers is a large opportunity to increase payment volumes and revenues.
•Pursue strategic M&A. We will continue to opportunistically make strategic acquisitions to enhance our scale, expand into new verticals, add product capabilities and embed payments in vertical software. Our success with First Billing Services (“FBS” or “First Billing”), Stewardship Technology, Inc. (“Stewardship”), and The Payment Group ("TPG") and our dedicated M&A team position us for success in this area.
Strategic Vertical Markets
We are a leading provider of integrated payment solutions in attractive vertical markets where we have a sustainable competitive advantage. Our technology solutions are tailored to the specific, complex needs of customers in these verticals, and we have deep expertise of industry-specific considerations. Strategic vertical markets include:
B2B Goods & Services
We have a leading presence in the B2B goods and services end market given our beginnings as part of Sage and deep expertise in accounting software integrations. We offer integrations into back-end ERP and accounting solutions, including Sage Intacct, X3, 50, 100, 300, and 500, as well as Acumatica and Intuit Quickbooks. In this vertical, we leverage value-added resellers as distribution, in addition to receiving referrals directly from our software partners. We also integrate with ISVs that focus on sub-verticals such as manufacturing and construction. This end market is characterized by under-penetration of electronic payments and high retention due to the required levels of integration.
Healthcare
Our healthcare portfolio is primarily comprised of ambulatory providers and healthcare practices that we serve through ISV partners. Our differentiated solutions in this end market are HIPAA compliant and include flexible funding, pre-authorization, and reporting capabilities, acceptance of health savings account ("HSA") & flexible spening account ("FSA") cards, and multi-layer location management. While our existing customers focus on these sub-verticals, our core capabilities are broadly applicable to software providers focused on specialty medicine. The healthcare end market is characterized by underlying secular growth and complex payment functionality needs that serve as a barrier to entry for competitors.
11
Faith-based & Non-profit
Our faith-based and non-profit customers, which utilize our payments technology for donation collection and fundraising, have unique feature requirements including recurring billing, event management, and integrated e-Commerce. In this end market, we utilize both ISV partner and direct distribution models. Our direct distribution model was acquired as part of our acquisition of Stewardship, which delivers payment processing solutions via a proprietary donation management software platform. The non-profit market is characterized by late adoption of electronic payments, with adoption accelerating in recent years due to advances in payment technology.
Government & Utilities
Like the faith-based and non-profit vertical, our government and utilities portfolio consists of both ISV partner and direct distribution models. Our direct distribution model was developed through our acquisition of First Billing Services and further enhanced through our acquisition of TPG, which provides e-billing and payment portal software. Since acquisition, we have also found success selling First Billing’s software through partnerships in this vertical. Electronic payment methods in this end market are significantly underpenetrated, providing attractive underlying customer growth and high retention, while also benefiting from low cyclicality given the nature of these services. TPG provides municipalities and courts with a completely automated payment system for receiving payments online and processing them instantly. New competitor entry into this vertical is challenging given the importance of track-record and reference clients servicing government and municipal entities effectively.
Education
The education vertical represents a high growth area for us, with increasingly strong relationships with education-specific ISVs that deliver tuition collection tools, cafeteria and school store management software, and other administrative solutions. Education is generally non-cyclical and benefits from attractive levels of electronic payment adoption and the need for flexible settlement solutions.
Paya End Market Revenue Composition by Vertical
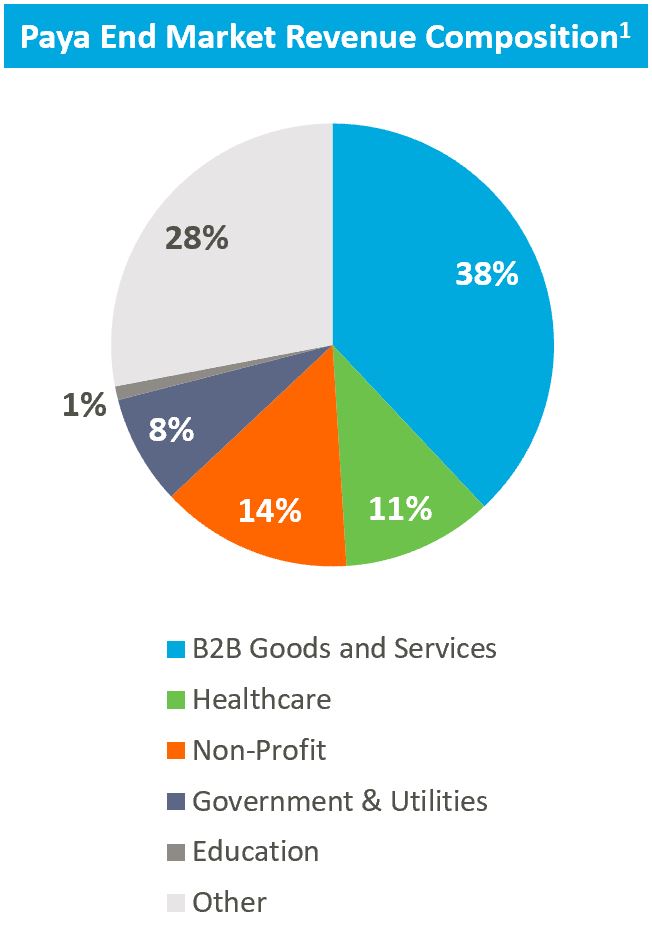
(1) Excludes ACH.
12
Partner-centric Distribution
Paya’s overall strategy is built with our partner-centric distribution model in mind, including our technology roadmap, customer service capabilities, and sales focus. This results in an attractive integrated experience of software and payments for the customers of our partners. Our approach allows us to flexibly and scalably address multiple attractive verticals at once and invest in technology rather than a “feet on the street” direct salesforce.
To understand our strategy requires a better understanding of our partners. We serve independent software vendors ranging from front-end CRM applications to back-end accounting solutions. These partners are typically differentiated in their vertical markets and serve a sophisticated, middle-market business customer, who in turn uses the software to sell their goods and services B2B or B2C. Paya’s core function is allowing these businesses to accept payments from their customers in a way that improves customer experience and automates the invoice to payment reconciliation.
The first pillar of our sales strategy is to sign new partnerships in our core markets. Our go-to-market organization utilizes a solutions-oriented approach that focuses on understanding our software partners’ payments needs and helping them craft solutions that differentiate themselves in a specific marketplace. We believe that successfully embedding payments in our partners' software greatly enhances their customer retention and provides them a substantial new revenue stream in excess of the typical monthly subscription.
In addition to signing new partnerships, we also focus on increasing the penetration of our offerings among the installed base of our existing partners. We do this effectively by selling our Paya Connect functionality to an installed base that may not be fully utilizing integrated payment capabilities.
We go-to-market via two primary partner channels: ISVs and value-added resellers. While we have existing independent sales organizations ("ISO") partners that focus primarily on reselling payments, technological advances have driven growth of the ISV and value-added reseller ("VAR") channels, which are in turn displacing the ISO channel and growing far more rapidly.
•Integrated Software Vendors. Our ISV partners strive for business growth, relying on our comprehensive, secure payments solutions to support their vertical-specific needs. We work with these software companies to provide a future-proof payments platform to their client base, constantly innovating to provide new payment functionality and maintaining compliance with evolving industry standards and regulations. Integrating their business management software seamlessly into our platform creates higher lifetime customer value and provides a more complete end-to-end experience.
Our integrations ensure seamless delivery of our full suite of payment processing capabilities to our customers. These integrations are also a critical part of our marketing strategy, as we work with partners to actively promote our preferred relationship and the advantages of an integrated payment solution to their existing base of customers.
Finally, these ISVs typically focus on a specific vertical or sub-vertical market and chose Paya because the payment functionality and support we offer is tailored to the specific needs of their given vertical.
•Value-Added Resellers. We work with VARs that bundle our suite of features and services with an existing software product and resell the package as an integrated or complete turn-key solution. This is a key channel for our B2B vertical given the prevalence of the value-added reseller distribution model among ERP and accounting software providers.
•Direct Sales. Although our sales force is primarily focused on winning channel partners, the acquisitions of First Billing Services and Stewardship have provided us with a direct sales force that brings our proprietary software solutions with embedded payments directly to customers in the government & utilities and faith-based & non-profit end markets.
13
•Independent Sales Organizations. We partner with ISOs in our Payment Services segment that have their own distribution capabilities and technologies. We provide them with the products and tools we believe are necessary to acquire new customers and grow their adoption of electronic payments. In addition to payment functionality, we deliver valuable back office support, training, and the tools necessary for independent sales organizations to manage their business.
•ACH Sales. For our ACH product, we deploy a go-to-market model leveraging ISOs and third-party resellers combined with cross-selling to our integrated partnerships to expand distribution of our capabilities. These efforts are represented in our Payment Services segment.
Products, Solutions and Technology
We provide a robust suite of proprietary technology solutions tailored to address the evolving needs of our sophisticated partners and customers. Our offerings are developed with vertical specific needs in-mind and are designed to support the end-to-end payments requirements of tech-savvy, middle market businesses. Our solutions are highly scalable, built for exceptional up-time, sustain high transaction volume, and offer a multi-channel, payment method agnostic experience.
Organization
We have significantly invested in our information technology ("IT") and product teams and capabilities. Our product management team employs a customer-centric approach. This team maintains a close connection with the sales force, a strong understanding of customer feature requirement needs in the pipeline, and a continuous assessment of market trends. The team of product management professionals is supported by an agile IT development organization and robust on-shore and off-shore development support focused on building payments applications and additional value-added services into integrated solutions. Our technology infrastructure team is focused on maintaining the integrity and security of client data and ensuring the best-in-class cyber security technology is deployed.
Paya Connect
In October 2018, we launched Paya Connect, a fully integrated payment platform that allows software developers to quickly create flexible, secure, and cost-efficient payment and commerce solutions tailored to businesses, health care providers, utilities, schools, non-profits and other entities with complex payment needs. Paya Connect’s ability to securely handle a range of payment methods from a variety of access points makes it ideal for meeting the evolving demands of sophisticated, multi-channel businesses. Paya Connect features a suite of APIs, code libraries, sandbox, and testing environments to help partners create, test, and deploy payment and commerce solutions in a quick and autonomous fashion. Paya Connect also ensures that software partners can easily consume new features and services while keeping them fully compliant with industry regulations by leveraging a service-oriented architecture.
14
Paya Connect offers the following features:
•Developer tools and integration support: Robust developer portal with a full suite of documentation, sandbox environments, and end-to-end testing capabilities.
•Customizable boarding experiences: Tailored customer acquisition through digital experiences that provide a streamlined merchant processing application and increase speed to revenue.
•Pricing Flexibility: Multiple customer pricing options for partners to choose from, including simplified swipe/non-swipe, interchange, and tiered structures. Consumer facing service and convenience fees for card and ACH, and check transactions provide flexibility for partners.
•Omni-channel payment capabilities: Ability to accept credit and debit cards, ACH or electronic funds transfer ("EFT") transactions, electronic benefit transfer ("EBT"), and FSA transactions in both card/check present and non-present use cases.
•Scheduled, Recurring, and installment payment capabilities: Support for any payment cycle, skip or defer payments based on use cases defined by customers leveraging card-on-file encryption and vaulting.
•Cloud Europay, Mastercard and Visa ("EMV") integration at the point of sale: Directly integrated terminals with no extra software or connections required at the point of sale. This streamlines the customer experience by enabling a true omni-channel commerce offering and eliminates complex device maintenance and certifications.
•Secure vaulting and updating: Secure storage and tokenization of all cardholder information to enable our customers to run recurring payments. In addition, our technology automatically updates expired credit and
15
debit cards via the Account Updater (as defined below) feature for increased approvals. The Account Updater feature provides a direct connection with card networks (Visa and MasterCard) to allow for a continuous link between cardholder and the stored payment method if a card is lost, stolen, or expired.
•Support for Level 2 and Level 3 payment processing: Data integration to enhance authorization and lower the cost of interchange for certain types of B2B transactions.
•E-Invoicing: Quick and scheduled e-Invoicing with click-to-pay functionality, helping businesses get paid faster and post back to partner's software, simplifying account reconciliation.
•Reporting to support complex organizational hierarchies: Flexible reporting for organizations large and small with complex data needs.
•Secure processing environment: Secure processing environment, allowing compliance with requirements such as PCI, PCIe, NIST and HIPAA (as defined below).
Operations
Paya’s operations division is focused on delivering commercially differentiated customer and partner support to the integrated payments ecosystem. We achieve this goal by deploying a comprehensive set of user engagement tools to facilitate continued service excellence. These include a cloud-based telephony infrastructure and CRM system with a robust ticketing module, case management, chat bots, a customer accessible knowledgebase, and targeted call routing for premium service. The operations team represents a significant competitive advantage in core markets due to (1) large acquirers lacking service and implementation efforts tailored for the middle market and (2) software providers lacking payments expertise and scale to deliver the dedicated customer support that we offer.
Business Operations
•Advanced Client Solutions: Technical personnel with advanced payment knowledge and deep-rooted expertise in our integrations and solutions help partners and customers identify the right solutions during the sales process and throughout the lifetime of the relationship as they add new products and functionality.
•Implementation: White-glove onboarding for integration partners and large ERP end customers when needed; ensuring rapid activation for all new partners and customers to maximize the revenue opportunity for all parties.
•Partner Support and Premier Accounts: Dedicated team provides personalized service to top 40 partners and 400+ premier customers.
•Card and ACH Customer Care: Experienced front-line end-customer support teams that provide phone, ticket, chat and email support to customers for all payments related questions, including integrated solutions, ACH services and card processing.
•Government & Utilities Operations: Vertical specific implementation, relationship management, and customer support resources focused on serving municipal clients and government focused software partners.
Technology Operations
•Product Development: Our product development function manages the deployment and expansion of our payments product suite, primarily consisting of Paya Connect. Our developers work closely with our
16
product managers to ensure they are actively addressing client demands and understanding trends in specific customer needs.
•Technology Infrastructure: Our technology infrastructure function ensures that systems are reliable, secure and fully operational while meeting industry and PCI-DSS security standards.
Security, Disaster Recovery and Back-up Systems
Paya has a robust technology security framework to manage and protect the large amount of information we store relating to customer transaction history and payment card information. We encrypt card information and customer data that are stored in our databases and continue to deploy the strongest commercially available encryption methods. We have relationships with several third-party security technology vendors to disrupt threats including email threat protection (anti-phishing), endpoint security (anti-virus), network next-gen security, and firewalls. Beyond that, we have an external Security Operations Center which monitors activity during the 40-hour workweek and vendor relationships which bring coverage to 24 hours a day, 7 days a week. This team is responsible for detecting intrusions, data leakage, malware, and other events that could jeopardize data integrity, availability, and confidentiality. Upon detection, they move to protect against and contain the risk. We also leverage vendors for internal and external penetration testing, and for forensic incident response. Our security processes and procedures have been evaluated and validated by several third-party compliance tests:
•Payment Card Industry Data Security Standard (“PCI-DSS”)
•Payment Application Data Security Standard (“PA-DSS”)
•Health Insurance Portability and Accountability Act (“HIPAA”)
•System and Organization Controls Report (“SOC 1”)
•Electronic Remittance Advice (“ERA”)
•National Automated Clearing House Association (“NACHA”)
•NIST Cybersecurity Framework
•Protiviti cyber assessment
In the summer of 2019, we completed a total platform modernization and infrastructure refresh. This included the relocation and upgrade of our physical infrastructure to a Tier 1 hardened location. In doing so, we significantly improved the performance of our platforms, raised our availability numbers, more efficiently satisfied current compliance mandates, and reduced our licensing profile. Within this new operating construct, we now have multiple levels of redundancy covering network, servers, storage, and applications via virtualization. We also modernized the network infrastructure of all our office locations and installed multiple redundant network paths. Our infrastructure roadmap includes further expansion into off premise Cloud infrastructure, leveraging Amazon Web Services ("AWS") and continuous dual location processing, removing the occurrence of service interruptions during scheduled maintenance periods. This will also dramatically reduce physical site risk.
Third Party Processors and Sponsor Banks
In the course of facilitating credit and debit card processing services, we rely on third parties to provide authorization, settlement and funding services in connection with our customers’ transactions. These institutions include third-party processors (such as Global Payments, FIS and Fiserv) and sponsor banks, who facilitate our access to the payment networks, such as Visa, Mastercard, and Discover. The processors and sponsor banks in turn have agreements with the payment networks, which permit them to route transaction information through their networks in exchange for fees.
17
For much of our credit and debit card payment volume, we engage Global Payments. Global Payments handles approximately two-thirds of our payment volume, providing authorization and settlement services to Paya, which include communicating with the credit card networks and providing funding instructions to the sponsor bank to facilitate the cash clearing process. Once a business accepts a payment transaction, Global Payments records the sale amount, type of transaction, location at which the transaction was processed, and other relevant information. We have built an entire value-added ecosystem around the transaction and control these aspects internally.
Our original processing agreement with Global Payments (the “Global Payments Agreement”) was entered into in April 2012. We entered into a new agreement in July 2018, which is in effect through July 2021 and automatically renews for successive one-year terms unless either party provides one-hundred eighty (180) days written notice of non-renewal to the other party.
BMO Harris is our sponsor bank for debit and credit card transactions. BMO Harris provides cash collection, and funding services for our card processing customers. Additionally, we adhere to the underwriting guidelines provided by our sponsor bank. Because we are not a “member bank” as defined by Visa and Mastercard, in order to process and settle these card transactions for our customers, we have entered into sponsorship agreements with member banks. Visa and Mastercard rules restrict us from performing funds settlement or accessing customer settlement funds.
The sponsorship agreement with BMO Harris is for a three-year term expiring in November 2022 and will automatically renew for successive one-year periods unless either party provides six months written notice of non-renewal to the other party. Our sponsorship agreement enables us to route Visa and Mastercard transactions under the member bank’s control and under the member bank’s identification numbers to clear credit and signature debit card transactions through Visa and Mastercard.
Our sponsorship agreements with the member banks require, among other things, that we abide by the bylaws and regulations of the Visa and Mastercard networks. If we were to breach these sponsorship agreements, the sponsor banks can terminate the agreement and, under the terms of the agreement, we would have 180 days to identify an alternative sponsor bank. As of December 31, 2020, we have not been notified of any such issues by our sponsor banks, Visa or Mastercard.
In addition to bankcard processing, we process EFT transactions through the ACH network. We process ACH transactions, which require requesting customer-processed funds from the bank each day, receiving the funds, and then repaying those funds to the customer. We perform this service using the Enterprise ACH system (“eACH”) and the eMagnus system, our proprietary database and transaction processing system. eMagnus automatically calculates splits with our customers and determines the pay-out schedule. Owning the ACH processing engine represents a key differentiator for us as we control the end-to-end user experience and provide a payment-method agnostic experience to our partners. We have longstanding relationships with multiple ODFIs, including Wells Fargo and Fifth Third Bank. ODFIs interface between the Federal Reserve and ACH processors to facilitate payment flows.
Customers and Competitors
Customer and Transaction Risk Management
We maintain a complete underwriting and risk monitoring management infrastructure with a dedicated team of underwriters, credit analysts, and risk and compliance management leads. Given that our core end markets are primarily focused on B2B and less focused on C2B and retail e-Commerce, we experience low levels of fraud and chargeback risk. Card brand networks generally allow chargebacks up to four months after the later of the date the transaction is processed or the delivery of the product or service to the cardholder. If the business incurring the chargeback is unable to fund the refund to the card issuing bank, we are required to do so. For the year ended December 31, 2020, Bad Debt Expense of $1.6 million represented 0.76% of revenue, which is very low compared to the broader payments industry.
18
Despite the low risk profile, we believe our security and risk offerings are differentiators in the marketplace. We utilize a comprehensive risk framework profile, which is essential in delivering low loss rates while maximizing approval rates and customer satisfaction. As such, our underwriting criteria is tailored towards our end markets and related business models. For example, we deploy vertical-specific monitoring relating to large ticket sizes and monthly patterns of utility and non-profit businesses.
Customer Underwriting
Our credit underwriting criteria consists of evaluating the nature of the business, end market, volume history, length of time between payment and delivery of goods or services, pricing, proposed transaction levels, and overall financial condition of the applicant. We may require cash or non-cash collateral as a condition for processing approval. These processes are documented and used for ongoing monitoring as the customer begins processing. Based on experience level, our underwriting staff is given various levels of autonomy to adjust transaction or volume thresholds, establish funding delays, establish daily discount funding and call-or-return collateral. These levels are originally set, reviewed, and signed off on by management. Our sponsor banks evaluate our customer underwriting policies and procedures to ensure compliance with card brand rules and regulations.
Risk Management/Transaction Monitoring
We take a sophisticated approach to risk management that involves intra-day reporting and monitoring of customer-level transaction activity to evaluate potential for credit and fraud risk. The risk management team reviews all unusual activity, which may include ticket size, rolling volume levels, refund and chargeback levels as well as authorization history. Risk management tools and reporting are reviewed daily to suspend unusual processing activity if sufficient abnormalities are observed. Accounts with suspended funds are investigated daily and the risk management team decides if any transactions should be held for further review. We believe this allows us to minimize credit and fraud risk by providing time to formally review the processing with our customer, the cardholders and the issuing banks.
Investigation and Loss Prevention
If a customer exceeds the thresholds established by our underwriting process, or if ongoing risk management processes identify suspicious activity or a potential breach of card brand rules and regulations or the terms of our customer agreement, we utilize a robust documentation and review process. The review will include the actions taken to reduce our exposure to loss and the exposure of our customer, which can start with requesting additional information and can be escalated to withholding or diverting funds, verifying delivery of merchandise or even deactivating the customer account. The financial condition of the business may also be considered during these investigations.
Collateral
As a condition for processing approval, we may require some customers to post collateral including certificates of deposits, letters of credit, cash, upfront or rolling reserves. This collateral is held in order to offset potential credit losses or risk liability that we may incur during the life of the relationship.
Competition
We compete with a variety of merchant acquirers that have different business models, go-to-market strategies and technical capabilities. Many merchant acquirers provide integrated payments solutions and/or related hardware to customers within our existing verticals. Our competition comes from a combination of niche players and horizontal acquirers which differ by individual vertical, including, EVO Payments, REPAY, i3 Verticals, Stripe, and the acquiring arms of FIS, FISERV and Global Payments. Our competitors also include banks, credit card providers, technology and ecommerce companies.
19
We believe the most significant competitive factors in the markets in which we compete are the following: (1) product offering, including depth of integration capabilities and ability to deliver differentiated value-added solutions; (2) customer service, including integration, transaction, and technology support for payors, customers, and software integration partners; (3) processing and technology reliability, and (4) transaction economics, including fees charged to customers and commission payouts to software integration partners.
Regulatory Compliance
Government Regulation and Payment Network Rules
We operate in an increasingly complex legal and regulatory environment. Our business and the products and services that we offer may be subject to a variety of federal, state and local laws and regulations, and the rules and standards of the card brand networks that we utilize to provide our electronic payment services, as more fully described below.
Dodd-Frank Act
The Dodd-Frank Act, signed into law in 2010, and the related rules and regulations have resulted in significant changes to the regulation of the financial services industry. Merchants are permitted to set minimum dollar amounts for the acceptance of credit cards and to offer discounts or incentives to entice consumers to pay with cash, checks, debit cards or credit cards, as the merchant prefers. There are certain prohibitions on card brand network exclusivity and merchant routing restrictions of debit card transactions. Additionally, the Durbin Amendment to the Dodd-Frank Act provides that the interchange fees that certain issuers charge merchants for debit transactions will be regulated by the Federal Reserve and must be “reasonable and proportional” to the cost incurred by the issuer in authorizing, clearing and settling the transactions. Rules released by the Federal Reserve in July 2011 to implement the Durbin Amendment mandate a cap on debit transaction interchange fees for issuers with assets of $10 billion or greater.
The Dodd-Frank Act also created the Consumer Financial Protection Bureau (the “CFPB”), which has assumed responsibility for most federal consumer protection laws, and the Financial Stability Oversight Council, which has the authority to determine whether any non-bank financial company, such as us, should be supervised by the Board of Governors of the Federal Reserve System because it is systemically important to the U.S. financial system. Any new rules or regulations implemented by the CFPB or the Financial Stability Oversight Council or in connection with the Dodd-Frank Act that are applicable to us, or any changes that are adverse to us resulting from litigation brought by third parties challenging such rules and regulations, could increase our cost of doing business or limit permissible activities.
Privacy and Information Security Regulations
We provide services that may be subject to privacy laws and regulations of a number of jurisdictions. Relevant federal privacy laws may include the Gramm-Leach-Bliley Act of 1999, which applies directly to a broad range of financial institutions and indirectly, or in some instances directly, to companies that provide services to financial institutions. These laws and regulations restrict the collection, processing, storage, use and disclosure of personal information, require notice to individuals of privacy practices and provide individuals with certain rights to prevent the use and disclosure of certain nonpublic or otherwise legally protected information. These laws also impose requirements for safeguarding and proper destruction of personal information through the issuance of data security standards or guidelines. Our business may also be subject to the Fair Credit Reporting Act ("FCRA") and the Fair and Accurate Credit Transactions Act of 2003 ("FACTA"), which regulate the use and reporting of consumer credit information and also impose disclosure requirements on entities who take adverse action based on information obtained from credit reporting agencies. In addition, there are state laws restricting the ability to collect and utilize certain types of personal information such as Social Security and driver’s license numbers and imposing secure disposal requirements for personal data. Certain state laws mandate businesses to implement reasonable data security measures. Massachusetts requires any business that processes the personal information of a Massachusetts resident to adopt and implement a written information security program. States are increasingly legislating data protection requirements for a broader list of personal data, such as biometric data, and are strengthening protections for
20
students’ personal information. All fifty states, Puerto Rico, and the U.S. Virgin Islands have now enacted data breach notification laws requiring businesses that experience a security breach of their computer databases that contain personal information to notify affected individuals, consumer reporting agencies and governmental agencies that possess data. In June 2018, the State of California enacted the California Consumer Privacy Act of 2018 (the “CCPA”), which went into effect on January 1, 2020. The CCPA requires companies that process personal information of California residents to make new disclosures to consumers about their data collection, use and sharing practices, will grant consumers specific access rights to their data, will allow consumers to opt out of certain data sharing with or sales to third parties and will create a new cause of action for data breaches. The CCPA has broadly defined personal information to include any information that is linked or reasonably linkable to a consumer. Each privacy law and regulation that applies to us could increase our cost of doing business or limit permissible activities.
Anti-Money Laundering and Counter-Terrorism Regulation
Our business is subject to U.S. federal anti-money laundering laws and regulations, including the Bank Secrecy Act of 1970, as amended by the USA PATRIOT Act of 2001, which we refer to collectively as the “BSA.” The BSA, among other things, requires money services businesses to develop and implement risk-based anti-money laundering programs, report large cash transactions and suspicious activity and maintain transaction records. We are also subject to certain economic and trade sanctions programs that are administered by the Office of Foreign Assets Control (“OFAC”) that prohibit or restrict transactions to or from (or transactions dealing with) specified countries, their governments and, in certain circumstances, their nationals, such as those who might be narcotics traffickers and terrorists or terrorist organizations. Similar anti-money laundering, counter terrorist financing and proceeds of crime laws apply to movements of currency and payments through electronic transactions and to dealings with persons specified on lists maintained by organizations similar to OFAC in several other countries and which may impose specific data retention obligations or prohibitions on intermediaries in the payment process. We have developed and continue to enhance compliance programs and policies to monitor and address related legal and regulatory requirements and developments.
Unfair or Deceptive Acts or Practices
We and many of our customers are subject to Section 5 of the Federal Trade Commission Act prohibiting unfair or deceptive acts or practices. In addition, laws prohibiting these activities and other laws, rules and or regulations, including the Telemarketing Sales Act, may directly impact the activities of certain of our clients, and in some cases may subject us, as the customer's payment processor or provider of certain services, to investigations, fees, fines and disgorgement of funds if we are deemed to have aided and abetted or otherwise provided the means and instrumentalities to facilitate the illegal or improper activities of the customer through our services. Various federal and state regulatory enforcement agencies, including the Federal Trade Commission and the states attorneys general, have authority to take action against non-banks that engage in unfair or deceptive acts or practices or violate other laws, rules and regulations and to the extent we are processing payments or providing services for a customer that may be in violation of laws, rules and regulations, we may be subject to enforcement actions and as a result may incur losses and liabilities that may impact our business.
In addition, the CFPB has recently attempted to extend certain provisions of the Dodd-Frank Act that prevent the employment of unfair, deceptive or abusive acts or practices (“UDAAP”) to payment processors. Though there is still litigation involving whether payment processing companies are subject to these requirements (and the extent of their application), these requirements may apply or be applicable in the future. UDAAPs could involve omissions or misrepresentations of important information to consumers or practices that take advantage of vulnerable consumers, such as elderly or low-income consumers.
Payment Network Rules and Standards
Payment networks establish their own rules and standards that allocate liabilities and responsibilities among the payment networks and their participants. These rules and standards, including the PCI-DSS, govern a variety of areas including the use of cards, the security features of cards, security standards for processing, data security and
21
allocation of liability for certain acts or omissions including liability in the event of a data breach. The payment networks may change these rules and standards from time to time as they may determine in their sole discretion and with or without advance notice to their participants. These changes may be made for any number of reasons, including as a result of changes in the regulatory environment, to maintain or attract new participants, or to serve the strategic initiatives of the networks and may impose additional costs and expenses on or be disadvantageous to certain participants. Participants are subject to audit by the payment networks to ensure compliance with applicable rules and standards. The networks may fine, penalize or suspend the registration of participants for certain acts or omissions or the failure of the participants to comply with applicable rules and standards.
To provide our electronic payment services, we must be registered as a service provider with each of the payment networks. Because we are not a bank, we are not eligible for primary membership in certain payment networks, including Visa and Mastercard, and are therefore unable to directly access these networks. The operating regulations of certain payment networks, including Visa and Mastercard, require us to be sponsored by a member bank as a service provider. We are registered with certain payment networks, including Visa and Mastercard, through various sponsor banks. The agreements with our bank sponsors give them substantial discretion in approving certain aspects of our business practices including our solicitation, application and qualification procedures for clients and the terms of our agreements with clients. We are also subject to network operating rules and guidelines promulgated by NACHA relating to payment transactions we process using the ACH Network. Like the card networks, NACHA may update its operating rules and guidelines at any time, and we will be subject to these changes. These operating rules and guidelines allocate responsibility and liabilities to the various participants in the payment network. Recently, NACHA has focused upon data security and privacy responsibilities. We are subject to audit by our partner financial institutions for compliance with the rules and guidelines. Our sponsor financial institutions have substantial discretion in approving certain aspects of our business practices, including the terms of our agreements with our ACH processing clients.
Money Transmitter Regulation
We may be subject to various U.S. federal, state, and foreign laws and regulations governing money transmission and the issuance and sale of payment instruments, including some of the prepaid products we may sell. In the future, we may be subject to money transmitter regulation and may be required to obtain additional licenses and registrations which we may not be able to obtain.
In the United States, most states license money transmitters and issuers of payment instruments. These states not only regulate and control money transmitters, but they also license entities engaged in the transmission of funds. Many states exercise authority over the operations of our services related to money transmission and payment instruments and, as part of this authority, subject us to periodic examinations. Many states require, among other things, that proceeds from money transmission activity and payment instrument sales be invested in high-quality marketable securities before the settlement of the transactions or otherwise restrict the use and safekeeping of such funds. Such licensing laws also may cover matters such as regulatory approval of consumer forms, consumer disclosures and the filing of periodic reports by the licensee and require the licensee to demonstrate and maintain specified levels of net worth. Many states also require money transmitters, issuers of payment instruments, and their agents to comply with federal and/or state anti-money laundering laws and regulations.
Stored Value Services
Stored value cards, store gift cards and electronic gift certificates are subject to various federal and state laws and regulations, which may include laws and regulations related to consumer and data protection, licensing, consumer disclosures, escheat, anti-money laundering, banking, trade practices and competition and wage and employment. The customers who utilize the gift card processing products and services that we may sell may be subject to these laws and regulations. In the future, if we seek to expand these stored value card products and services, or as a result of regulatory changes, we may be subject to additional regulation and may be required to obtain additional licenses and registrations which we may not be able to obtain.
22
The Credit Card Accountability Responsibility and Disclosure Act of 2009 (the “Card Act”) created new requirements applicable to general-use prepaid gift cards, store gift cards and electronic gift certificates. The Card Act, along with the Federal Reserve’s amended Regulation E, created new requirements with respect to these cards and electronic certificates. These include certain prohibited features and revised disclosure obligations. Prepaid services may also be subject to the rules and regulations of Visa, Mastercard, Discover and American Express and other payment networks with which our clients and the card issuers do business. The customers who utilize the gift card processing products and services that we may sell are responsible for compliance with all applicable rules and requirements relating to their gift product program.
Additionally, the Financial Crimes Enforcement Network of the U.S. Department of the Treasury, or “FinCEN”, issued a final rule in July 2011 regarding the applicability of the BSA’s regulations to “prepaid access” products and services. This rulemaking clarified the anti-money laundering obligations for entities engaged in the provision and sale of prepaid services, such as prepaid gift cards. We are not registered with FinCEN based on our determination that our current products and services do not constitute a “prepaid program” as defined in the BSA and we are not a “provider” of prepaid access. We may in the future need to register with FinCEN as a “money services business-provider of prepaid access” in accordance with the rule based on changes to our products or services.
Other Regulation
We are subject to U.S. federal and state unclaimed or abandoned property (escheat) laws which require us to turn over to certain government authorities the property of others we hold that has been unclaimed for a specified period of time such as account balances that are due to a distribution partner or client following discontinuation of its relationship with us. The Housing Assistance Tax Act of 2008 requires certain merchant acquiring entities and third-party settlement organizations to provide information returns for each calendar year with respect to payments made in settlement of electronic payment transactions and third-party payment network transactions occurring in that calendar year. Reportable transactions are also subject to backup withholding requirements.
The foregoing is not an exhaustive list of the laws and regulations to which we are subject, and the regulatory framework governing our business is changing continuously.
Intellectual Property
Certain of our products and services are based on proprietary software and related payment systems solutions. We rely on a combination of copyright, trademark, and trade secret laws, as well as employee and third-party non-disclosure, confidentiality, and other contractual arrangements to establish, maintain, and enforce our intellectual property rights in our technology, including with respect to our proprietary rights related to our products and services. In addition, we license technology from third parties that is integrated into some of our solutions.
We own several registered trademarks, including Paya, First Billing, FirstCloud, FirstUtility, and Stewardship and we have other pending applications. We also own multiple domain names, including www.paya.com.
Human Capital Management
As of December 31, 2020, we employed 281 employees across six U.S. office locations, with some employees working remotely. We are an Equal Employment Opportunity and Affirmative Action employer. All aspects of employment including the decision to hire, promote, discipline, or discharge, are based on merit, competence, performance, and business needs. We do not discriminate on the basis of race, color, religion, marital status, age, national origin, ancestry, physical or mental disability, medical condition, pregnancy, genetic information, gender, sexual orientation, gender identity or expression, veteran status, or any other status protected under federal, state, or local law.
Many of our employees are highly skilled in technical areas specific to payment technology and software solutions as well as delivery support, and many have deep knowledge of our core verticals and integrated payments. From
23
time to time, we supplement our workforce with consultants or independent contractors, primarily in the information technology area, through contracted service arrangements.
Our employees are key to our success as a company, and we are committed to attracting, developing and retaining the best talent. We leverage formal and informal programs to identify and attract top talent including social media, career fairs, and professional associations and industry groups. We develop and retain the best talent through various means including performance evaluation and goal setting as well as a robust training and development curriculum. Our online training platform provides a variety of tools and application resources for all team members to build learning experiences and skills.
We provide employees with competitive compensation and benefits consistent with positions, skill levels, experience, knowledge, and geographic location. All employees are eligible for health insurance, paid and unpaid leave, a retirement plan, and life/disability/accident coverage. We also offer a variety of voluntary benefits that allow employees to select the options that meet their needs, including, critical illness coverage, medical and dependent care flexible spending accounts, health saving accounts, paid parental leave, and an employee assistance program.
Our executive management team and Human Resources department regularly review and update our talent strategy, monitoring a variety of data, including turnover, diversity, and tenure, to design and implement effective reward/recognition, training, development, succession, and benefit programs to meet the needs of our businesses and our employees. The Compensation Committee assists our Board in its oversight of human capital management including, corporate culture, diversity and inclusion, recruiting, retention, attrition, talent management, career development and progression, succession and employee relations.
The success of our business is connected to the well-being of our team members. Accordingly, we are committed to the health, safety and wellness of our team members worldwide. In response to the COVID-19 pandemic, we implemented significant changes that we determined were in the best interest of our team members, our customers and partners, and the communities in which we operate. Because of investments in our operating environments and technology that support day-to-day execution, we were able to transition all of our employees to a remote work environment in a timely and seamless manner. We continue to keep our employees informed and supported through regular communication and adjusted leave policies.
Facilities
We maintain several offices across the United States, all of which we lease, including our corporate headquarters in Atlanta, Georgia which consists of approximately 23,000 square feet.
Organizational Structure and Corporation Information
Paya was incorporated as a Delaware corporation on July 28, 2020 in connection with the Business Combination.
We are headquartered in Atlanta, Georgia. Our business was founded as Verus Financial Management in 2003 and acquired by Sage Group plc in 2006. In August 2017, GTCR, LLC acquired the business from Sage and rebranded the Company to Paya.
24
Item 1A. Risk Factors
Risks Relating to Our Business and Operations
The recent novel coronavirus, or COVID-19, global pandemic has had and is expected to continue to have a material adverse effect on our business and results of operations.
In late 2019, COVID-19 was first detected in Wuhan, China. In March 2020, the World Health Organization declared COVID-19 a global pandemic, and governmental authorities around the world have implemented measures to reduce the spread of COVID-19. These measures, including “shelter-in-place” orders suggested or mandated by governmental authorities or otherwise elected by companies as a preventive measure, have adversely affected workforces, customers, consumer sentiment, economies, and financial markets, and, along with decreased consumer spending, have led to an economic downturn in the United States.
Numerous state and local jurisdictions, including in markets where we operate, have imposed, and others in the future may impose, “shelter-in-place” orders, quarantines, travel restrictions, executive orders and similar government orders and restrictions for their residents to control the spread of COVID-19. For example, the federal and state governments in the United States have imposed social distancing measures and restrictions on movement, only allowing essential businesses to remain open in certain areas. Such orders or restrictions have resulted in the temporary closure of many of our customers’ operations, work stoppages, slowdowns and delays, travel restrictions and cancellation of events, among other effects, any of which may materially impact our business and results of operations.
The COVID-19 pandemic and subsequent shelter-in-place and social distancing policies, as well as the broader economic decline, had a material impact on our business in 2020 and we expect it to continue to do so in 2021. Many of our customers experienced a decline in transaction volumes from pre COVID-19 levels. However, given many of our customers leverage our payment technology to accept transactions in a card-not-present environment, their business operations were not impacted dramatically. Further, most of our recurring or contractual transactions are B2B and not tied to consumer discretionary spend and, as such, were not significantly impacted. This was evident by stable or growing volumes in our B2B Goods & Services, Government & Utilities, and Non-Profit verticals. Lastly, we benefited from our lack of concentration in end markets which saw steep declines, such as restaurants, travel, hospitality, and brick-and-mortar retail.
In response to these developments, we took precautionary measures to ensure the safety of our employees, support our customers, and mitigate the impact on our financial position and operations. We seamlessly implemented remote working capabilities for our entire organization with minimal disruption to our operations or key operating performance indicators. We also identified opportunistic expenses reductions which increased operating efficiencies and provided additional profitability in the period.
25
Due to the uncertainty of COVID-19, we will continue to assess the situation, including abiding by any government-imposed restrictions, market by market. We are unable to accurately predict the ultimate impact that COVID-19 will have on our operations and marketing efforts relying on in person industry events and conferences due to the unknown duration and severity of the COVID-19 pandemic, effect of new government regulations arising in response to the pandemic, and the speed and extent to which economic and operating conditions and consumer behavior will return to normal. Even as our customers re-open their operations, we cannot accurately predict the ongoing impact of government regulations and changing consumer behavior on our business. While we have not seen a meaningful degradation in new customer enrollment or an increase in existing customer attrition as a result of COVID-19, it is possible that those business trends may change if economic hardship across the country forces business closures. Any significant reduction in consumer visits to, or spending at, our customers’ establishments would result in a loss of revenue to us. In particular, we cannot accurately forecast the potential impact of additional outbreaks as government restrictions are relaxed, further shelter-in-place or other government restrictions are implemented in response to such outbreaks, or the impact on the ability of our customers to remain in business as a result of the ongoing pandemic, which could result in additional chargeback or customer receivable losses. Further, disruptions in the business operations of our prospective partners because of their responses to COVID-19 may result in delays in the formation or implementation of new partnerships.
In addition, the global deterioration in economic conditions, which may have an adverse impact on discretionary consumer spending, could also impact our business. For instance, consumer spending may be negatively impacted by general macroeconomic conditions, including a rise in unemployment and decreased consumer confidence resulting from the COVID-19 pandemic. Changing consumer behaviors because of the COVID-19 pandemic may also have a material impact on our revenue for the foreseeable future.
In the past, governments have taken unprecedented actions in attempts to address and rectify these extreme market and economic conditions by providing liquidity and stability to financial markets. If these actions are not successful, the return of adverse economic conditions may cause a material impact on our ability to raise capital, if needed, on a timely basis and on acceptable terms or at all.
To the extent the COVID-19 pandemic adversely affects our business and financial results, it may also have the effect of heightening many of the other risks described in this “Risk Factors” section, such as those relating to our liquidity, indebtedness and our ability to comply with the covenants contained in the agreements that govern our indebtedness.
The payment processing industry is highly competitive and such competition is likely to increase, which may adversely influence the prices we can charge to merchants for our services and the compensation we must pay to our distribution partners, and as a result, our profit margins.
The payment processing industry is highly competitive. We primarily compete in the middle market merchant industry. Competition has increased recently as other providers of payment processing services have established a sizable market share in the middle market. Our primary competitors for middle market merchants include financial institutions and their affiliates and well-established payment processing companies that target middle market merchants directly and through third parties, including EVO Payments, REPAY, i3 Verticals, Stripe, and the acquiring arms of FIS, FISERV, and Global Payments. We also compete with many of these same entities for distribution partners. For example, many of our distribution partners are not exclusive to us but also have relationships with our competitors, such that we must continually expend resources to maintain those distribution partner relationships. Our growth will depend on our ability to increase our market share through successful competitive efforts to gain new merchants and distribution partners.
26
In addition, many financial institutions, subsidiaries of financial institutions or well-established payment processing companies with which we compete, have substantially greater capital, technological, and marketing resources than we have. These factors may allow our competitors to offer better pricing terms to merchants and more attractive compensation to distribution partners, which could result in a loss of our potential or current merchants and distribution partners. This competition may effectively limit the prices we can charge our merchants, cause us to increase the compensation we pay to our distribution partners and require us to control costs aggressively to maintain acceptable profit margins. Our future competitors may also develop or offer services that have price or other advantages over the services we provide.
We are also facing new competition from emerging and non-traditional payment processing companies as well as traditional companies offering alternative electronic payments services and products. Certain of these competitors integrate proprietary software and service solutions with electronic payments services and have significant financial resources and robust networks that could allow them to have access to merchants needing electronic payments services. If these new entrants gain a greater share of total electronic payments transactions, they could impact our ability to retain and grow our relationships with merchants and distribution partners. These new entrants also may compete in ways that minimize or remove the role of traditional payment gateways in the electronic payments process upon which our services are based, which could also limit our ability to retain or grow those relationships.
Degradation of the quality of the products and services we offer, including support services, could adversely impact our ability to attract and retain merchants and partners.
Our merchants and partners expect a consistent level of quality in the provision of our products and services, which are a significant element of the value proposition we offer to them. If the reliability or functionality of our products and services is compromised or the quality or support of such products and services is otherwise degraded, we could lose existing merchants and partners and find it harder to attract new merchants and partners. If we are unable to scale our support functions to address the growth of our merchant portfolio and partner network, the quality of our support may decrease, which could also adversely affect our ability to attract and retain merchants and partners.
Failing to successfully implement initiatives to grow or improve our products and services could also adversely impact our business. While we offer redundant back-up capabilities inside of our data center environments, we still have site specific risk related to physical or communication network-based outages. Additionally, we rely on Amazon Web Services (“AWS”) to operate certain aspects of our service, including providing a distributed computing infrastructure platform for business operations, or what is commonly referred to as a “cloud” computing service. While we are in the process of building out full redundancy to prevent downtime in the case of an outage, we currently may encounter disruptions or interference in connection with our use of AWS. This could have an impact on our operations and consequently, our business would be adversely impacted if our partners and merchants leave due to a downtime or disruption.
Potential distribution partners and merchants may be reluctant to switch to a new merchant acquirer, which may adversely affect our growth.
Many potential distribution partners and merchants worry about potential disadvantages associated with switching payment providers, such as a loss of accustomed functionality, increased costs, and business disruption. For our distribution partners, switching to us from another payment provider or integrating with us may constitute a significant undertaking. As a result, many distribution partners and merchants often resist change. There can be no assurance that our strategies for overcoming potential reluctance to change vendors or initiate a relationship with us will be successful, and this resistance may adversely affect our growth and performance results.
Increases in card network fees and other changes to fee arrangements may result in the loss of merchants or a reduction in our earnings.
27
From time to time, card networks, including Visa and Mastercard, increase the fees that they charge merchant service providers. At their sole discretion, our sponsoring banks have the right to pass any increases in interchange fees on to us. Our sponsoring banks may seek to increase the sponsorship fees they charge us, all of which are based upon the dollar amount of the payment transactions we process. In addition, our back-end payment processors may seek to increase the fees they charge us, which are also based upon the floor amount of the payment transactions we process as well as the number of merchants we support. We could attempt to pass these increases along to our merchants, but this strategy might result in the loss of merchants to our competitors who do not pass along the increases. If competitive practices prevent us from passing along the higher fees to our merchants in the future, we may have to absorb all or a portion of such increases, which may increase our operating costs and reduce our earnings. In addition, in certain of our markets, card issuers pay merchant acquirers fees based on debit card usage in an effort to encourage debit card use. If this practice were discontinued, our revenue and margins in jurisdictions where we receive these fees would be adversely affected.
If we fail to comply with the applicable requirements of card networks and industry self-regulatory organizations, those card networks or organizations could seek to fine us, suspend us, or terminate our registrations through our bank sponsors. If our merchants or sales partners incur fines or penalties that we cannot collect from them, we may have to bear the cost of such fines or penalties.
We do not directly access the payment card networks, such as Visa, MasterCard and Discover, which enable our acceptance of credit cards and debit cards. Instead, we rely on sponsor banks and third-party processors to access such networks and settle transactions, and we must pay fees for such services.
As such, Visa, Mastercard and other card networks set complex and evolving rules and standards with which we must comply. The payment networks and their member financial institutions routinely update, generally expand and modify requirements applicable to merchant acquirers, including rules regulating data integrity, third-party relationships (such as those with respect to sponsor banks and Independent Sales Organizations (“ISO”)), merchant chargeback standards and PCI-DSS. Under certain circumstances, we are required to report incidents to the card networks within a specified time frame.
The rules of card networks are set by their boards, which include members that are card issuers that directly or indirectly sell processing services to merchants in competition with us. There is a risk that these members could use their influence to enact changes to the card network rules or policies that are detrimental to us. Any changes in network rules or standards that increase the cost of doing business or limit our ability to provide processing services to our merchants will adversely affect the operation of our business.
If we or our bank sponsors fail to comply with the applicable rules and requirements of the Visa or Mastercard payment networks, Visa or Mastercard could suspend or terminate our registration. Further, our transaction processing capabilities, including settlement processes, could be delayed or otherwise disrupted, and recurring non-compliance could result in the payment networks seeking to fine us, or suspend or terminate our registrations which allow us to process transactions on their networks, making it impossible for us to conduct our business on its current scale. Under certain circumstances specified in the payment network rules, we may be required to submit to periodic audits, self-assessments, or other assessments of our compliance with the PCI-DSS. Such activities may reveal that we have failed to comply with the PCI-DSS. In addition, even if we comply with the PCI-DSS, there is no assurance that we will be protected from a security breach.
The termination of our registration with the payment networks, or any changes in payment network or issuer rules that limit our ability to provide merchant acquiring services, could have an adverse effect on our payment processing volumes, revenues and operating costs. If we are unable to comply with the requirements applicable to our settlement activities, the payment networks may no longer allow us to provide these services, which would require us to spend additional resources to obtain settlement services from a third-party provider. In addition, if we were precluded from processing Visa and Mastercard electronic payments, we would lose a substantial portion of our revenues.
28
In addition, if a merchant or sales partner fails to comply with the applicable requirements of the card networks, it could be subject to a variety of fines or penalties that may be levied by those card networks. We may have to bear the cost of such fines or penalties if we are unable to collect them from the applicable merchant or sales partner. The termination of our member registration, any change in our status as a service provider or merchant processor, or any changes in network rules or standards could prevent us from providing processing services relating to the affected card network and could adversely affect our business, financial condition, or results of operations.
We are also subject to the operating rules of NACHA. NACHA is a self-regulatory organization which administers and facilitates private-sector operating rules for ACH payments and defines the roles and responsibilities of financial institutions and other ACH network participants. The NACHA Rules and Operating Guidelines impose obligations on us and our partner financial institutions. These obligations include audit and oversight by the financial institutions and the imposition of mandatory corrective action, including termination, for serious violations. If an audit or self-assessment under PCI DSS or NACHA identifies any deficiencies that we need to remediate, the remediation efforts may distract our management team and be expensive and time consuming.
Similarly, our ACH sponsor banks have the right to audit our compliance with NACHA’s rules and guidelines and are given wide discretion to approve certain aspects of our business practices and terms of our agreements with ACH customers. Like the payment networks, NACHA may update its operating rules and guidelines at any time, which could require us to take more costly compliance measures or to develop more complex monitoring systems.
There may be a decline in the use of electronic payments as a payment mechanism for consumers or adverse developments with respect to the electronic payments industry in general, which could adversely affect our business, financial condition, and operating results.
Maintaining or increasing our profitability is dependent on consumers and businesses continuing to use credit cards, debit cards and make ACH payments at the same or increasing rate. If consumers do not continue to use these cards for their transactions or if there is a change in the mix of payments between cash and electronic payments which is adverse to us, our business could decline and we could incur material losses. Regulatory changes may also result in merchants seeking to charge customers additional fees for use of electronic payments. Additionally, in recent years, increased incidents of security breaches have caused some consumers to lose confidence in the ability of businesses to protect or store their information, causing consumers to discontinue use of electronic payment methods. In addition, security breaches could result in financial institutions cancelling large numbers of credit and debit cards, or consumers electing to cancel their cards following such an incident.
In order to remain competitive and to continue to increase our revenues and earnings, we must continually update our products and services, a process which could result in increased costs and the loss of revenues, earnings, merchants and distribution partners if the new products and services do not perform as intended or are not accepted in the marketplace.
The electronic payments industry in which we compete is subject to rapid technological changes and is characterized by new technology, product and service introductions, evolving industry standards, regulatory compliance, changing merchant needs and the entrance of non-traditional competitors. We are subject to the risk that our existing products and services become obsolete, and that we are unable to develop new products and services in response to industry demands. Our future success will depend in part on our ability to develop or adapt to technological changes and evolving industry trends. We are continually involved in a number of projects, such as ongoing enhancements to our Paya Connect platform and other new offerings emerging in the electronic payments industry, many of which require investment in non-revenue generating products or services that our distribution partners and merchants expect to be included in our product and service offerings. These projects carry the risks associated with any development effort, including difficulty in determining market demand and timing for delivery of new products and services, cost overruns, delays in delivery and performance problems.
29
In addition, new products and offerings may not perform as intended or generate the business or revenue growth expected. Defects in our software and errors or delays in our processing of electronic transactions could result in additional development costs, diversion of technical and other resources from our other development efforts, loss of credibility with current or potential distribution partners and merchants, harm to our reputation, fines imposed by card networks, or exposure to liability claims. Any delay in the delivery of new products or services or the failure to differentiate our products and services could render them less desirable, or possibly even obsolete, to our merchants. Additionally, the market for alternative payment processing products and services is evolving, and it may develop too rapidly or not rapidly enough for us to recover the costs we have incurred in developing new products and services.
We may not be able to continue to expand our share of our existing vertical markets or expand into new vertical markets, which would inhibit our ability to grow and increase our profitability.
Our future growth and profitability depend, in part, upon our continued expansion within the vertical markets in which we currently operate, the emergence of other vertical markets for electronic payments and our integrated solutions, and our ability to penetrate new vertical markets and our current distribution partners’ customer base. As part of our strategy to expand into new vertical markets, we look for acquisition opportunities and partnerships with other businesses that will allow us to increase our market penetration, technological capabilities, product offerings and distribution capabilities. We may not be able to successfully identify suitable acquisition or partnership candidates in the future, and if we do, they may not provide us with the benefits we anticipated.
Our expansion into new vertical markets also depends upon our ability to adapt our existing technology or to develop new technologies to meet the particular needs of each new vertical market. We may not have adequate financial or technological resources to develop effective and secure services or distribution channels that will satisfy the demands of these new vertical markets. Penetrating these new vertical markets may also prove to be more challenging or costly or take longer than we may anticipate. If we fail to expand into new vertical markets and increase our penetration into existing vertical markets, we may not be able to continue to grow our revenues and earnings.
Our ability to grow our business will depend in part on the addition of new partners. Inability to effectively onboard these new partners could have a material adverse effect on our business, financial condition and results of operations.
Our ability to grow our business will depend in part on the addition of new partners, and an inability to effectively onboard these new partners could have a material adverse effect on our business, financial condition and results of operations. We may encounter delays onboarding partners due to COVID-19, issues integrating the partner into Paya Connect, or other unforeseen circumstances. If we do not effectively onboard our new partners, including assisting such partners to quickly resolve any post-onboarding issues and provide effective ongoing support, our reputation could be damaged and our ability to add new partners and our relationships with our existing partners could be adversely affected. Additionally, if we fail to onboard these partners in a timely manner, it could lead to delays in collecting revenues that we may otherwise receive, causing our financial condition and results of operations to be adversely affected.
We may not be able to successfully execute our strategy of growth through acquisitions.
A significant part of our growth strategy is to enter new vertical markets through platform acquisitions of vertically focused integrated payment and software solutions providers and to expand within our existing vertical markets through selective tuck-in acquisitions.
Although we expect to continue to execute our acquisition strategy:
•we may not be able to identify suitable acquisition candidates or acquire additional assets on favorable terms;
30
•we may compete with others to acquire assets, and as competition increases, could result in decreased availability or increased prices for acquisition candidates;
•we may compete with others for select acquisitions and our competition may consist of larger, better-funded organizations with more resources and easier access to capital;
•we may experience difficulty in anticipating the timing and availability of acquisition candidates;
•we may not be able to obtain the necessary financing, on favorable terms or at all, to finance any of our potential acquisitions; and
•we may not be able to generate the cash necessary to execute our acquisition strategy.
•we may be unable to maintain uniform standards, controls, procedures, and policies as we attempt to integrate the acquired businesses, and this may lead to operational inefficiencies.
The occurrence of any of these factors could adversely affect our growth strategy.
Potential changes in the competitive landscape, including disintermediation from other participants in the payments value chain, could harm our business.
We expect that the competitive landscape will continue to change, including the following developments.
•Rapid and significant changes in technology may result in new and innovative payment methods and programs that could place us at a competitive disadvantage and reduce the use of our services.
•Competitors, merchants, distribution partners, and other industry participants may develop products that compete with or replace our value-added products and services.
•Participants in the financial services payments and technology industries may merge, create joint ventures, or form other business combinations that may strengthen their existing business services or create new payment services that compete with us.
Failure to compete effectively against any of these competitive threats could have a material adverse effect on our business, financial condition, and results of operations.
We are subject to economic and political risk, the business cycles of our merchants and distribution partners and the overall level of consumer and commercial spending, which could negatively impact our business, financial condition, and results of operations.
The electronic payments industry depends heavily on the overall level of consumer, commercial and government spending. We are exposed to general economic conditions that affect consumer confidence, consumer spending, consumer discretionary income and changes in consumer purchasing habits. A sustained deterioration in general economic conditions or increases in interest rates could adversely affect our financial performance by reducing the number or aggregate dollar volume of transactions made using electronic payments. If our merchants make fewer sales of their products and services using electronic payments, or consumers spend less money through electronic payments, we will have fewer transactions to process at lower dollar amounts, resulting in lower revenue. In addition, a weakening in the economy could force merchants to close at higher than historical rates, resulting in exposure to potential losses and a decline in the number of transactions that we process. We also have material fixed and semi-fixed costs, including rent, debt service, contractual minimums, and salaries, which could limit our ability to quickly adjust costs and respond to changes in our business and the economy.
A substantial portion of our merchants are middle market businesses, which may increase the impact of economic fluctuations and merchant attrition on us.
31
We market and sell our solutions to middle market merchants. Middle market merchants are typically more susceptible to the adverse effects of economic fluctuations than larger businesses. We experience attrition in merchants and merchant charge volume in the ordinary course of business resulting from several factors, including business closures, transfers of merchants’ accounts to our competitors and account closures that we initiate due to heightened credit risks relating to, or contract breaches by, a merchant. Adverse changes in the economic environment or business failures of our middle market merchants may have a greater impact on us than on our competitors who do not focus on middle market merchants to the extent that we do. We cannot accurately predict the level of middle market merchant attrition in the future. If we are unable to establish accounts with new merchants or otherwise increase our payment processing volume to counter the effect of this attrition, our revenues will decline.
Fraud by merchants or others could cause us to incur losses.
We face potential liability for fraudulent electronic payment transactions initiated by merchants or others. Merchant fraud occurs when a merchant opens a fraudulent merchant account and conducts fraudulent transactions or when a merchant, rather than a customer (though sometimes working in collusion with a customer engaged in fraudulent activities), knowingly uses a stolen or counterfeit card or card number to record a false sales transaction, or intentionally fails to deliver the merchandise or services sold in an otherwise valid transaction. Any time a merchant is unable to fund a chargeback, we are responsible for that chargeback.
Additionally, merchant fraud occurs when employees of merchants change the merchant demand deposit accounts to their personal bank account numbers, so that payments are improperly credited to the employee’s personal account. We have established systems and procedures to detect and reduce the impact of merchant fraud, but we cannot be sure that these measures are or will be effective. Failure to effectively manage risk and prevent fraud could increase our chargeback or other liability. In addition, beginning in October 2015, U.S. merchants that cannot process Europay, Mastercard and Visa (“EMV”), chip-based cards are held financially responsible for certain fraudulent transactions conducted using such cards. This has increased the risk to merchants who are not yet EMV-compliant and shifted a substantial amount of fraud to card-not-present transactions, which is the primary environment in which we operate. This increased risk and the shift to card-not-present fraud has resulted in us having to seek increased chargebacks from such merchants. Increases in chargebacks, failure to recover fraud-related losses from our merchants that have not yet complied with EMV standards or other liability could have a material adverse effect on our business, financial condition, and results of operations.
We also have potential liability for losses caused by fraudulent card-based payment transactions. Card fraud occurs when a merchant’s customer uses a stolen card (or a stolen card number in a card-not-present transaction) to purchase merchandise or services. In a card-present transaction, if the merchant swipes or dips the card, receives authorization for the transaction from the issuer and verifies the signature on the back of the card against the paper receipt signed by the customer, the issuer remains liable for any loss. In a card-not-present transaction, even if the merchant receives authorization for the transaction, the merchant is liable for any loss arising from the transaction. Many of the merchants that we serve transact a substantial percentage of their sales in card-not-present transactions over the Internet or in response to telephone or mail orders, which makes these merchants more vulnerable to fraud than merchants whose transactions are conducted largely in card-present transactions.
Criminals are using increasingly sophisticated methods to engage in illegal activities such as counterfeiting and fraud. For example, bust-out fraud is a first-party fraud scheme where legitimate business credentials are combined with legitimate personal identity credentials and used to open a merchant account. After a period of either no processing or normal processing activity, typically ranging from four to 12 months, and processing minimal volume, the criminal quickly processes a substantial volume from fraudulent cards, receives the corresponding deposits and exits before chargebacks or returns are assessed. Incidents and types of fraud and counterfeiting may increase in the future. Failure to effectively identify and manage risk and prevent fraud could increase our chargeback liability or cause us to incur other liabilities.
We incur liability when our merchants refuse or cannot reimburse us for chargebacks resolved in favor of their customers.
32
We have potential liability for chargebacks associated with the transactions we process. If a billing dispute between a merchant and a cardholder is not ultimately resolved in favor of the merchant, the disputed transaction is “charged back” to the merchant’s bank and credited or otherwise refunded to the cardholder. The risk of chargebacks is typically greater with those merchants that promise future delivery of goods and services rather than delivering goods or rendering services at the time of payment. If we or our bank sponsors are unable to collect the chargeback from the merchant’s account or reserve account (if applicable), or if the merchant refuses or is financially unable (due to bankruptcy or other reasons) to reimburse the merchant’s bank for the chargeback, we may bear the loss for the amount of the refund paid to the cardholder. Any increase in chargebacks not paid by our merchants could increase our costs and decrease our revenues. Additionally, an ACH transaction could be rejected in certain situations, including instances where we attempt to pull fees out of a bank account with insufficient funds, where an account has been closed, or where the account number is invalid. If an ACH reject occurs, we may bear the loss for the amount not pulled from the applicable account, which could increase our costs and decrease our revenues.
Our risk management policies and procedures may not be fully effective in mitigating our risk exposure in all market environments or against all types of risks.
We operate in a rapidly changing industry. Accordingly, our risk management policies and procedures may not be fully effective to identify, monitor, manage and remediate our risks. Some of our risk evaluation methods depend upon information provided by others and public information regarding markets, merchants or other matters that are otherwise inaccessible by us. In some cases, that information may not be accurate, complete, or current. Additionally, our risk detection system is subject to a high degree of “false positive” risks being detected, which makes it difficult for us to identify real risks in a timely manner. If our policies and procedures are not fully effective or we are not always successful in capturing all risks to which we are or may be exposed, we may suffer harm to our reputation or be subject to litigation or regulatory actions that materially increase our costs and subject us to reputational damage that could limit our ability to grow and cause us to lose existing merchant clients.
Legal proceedings could have a material adverse effect on our business, financial condition or results of operations.
In the ordinary course of business, we may become involved in various litigation matters, including but not limited to commercial disputes and employee claims, and from time to time may be involved in governmental or regulatory investigations or similar matters arising out of our current or future business. Any claims asserted against us, regardless of merit or eventual outcome, could harm our reputation and have an adverse impact on our relationship with our merchants, distribution partners and other third parties and could lead to additional related claims. Certain claims may seek injunctive relief, which could disrupt the ordinary conduct of our business and operations or increase our cost of doing business. Our insurance or indemnities may not cover all claims that may be asserted against us, and any claims asserted against us, regardless of merit or eventual outcome, may harm our reputation and cause us to expend resources in our defense. Furthermore, there is no guarantee that we will be successful in defending ourselves in future litigation. Should the ultimate judgments or settlements in any pending litigation or future litigation or investigation significantly exceed our insurance coverage, they could have a material adverse effect on our business, financial condition, and results of operations.
The loss of key personnel or of our ability to attract, recruit, retain and develop qualified employees could adversely affect our business, financial condition, and results of operations.
33
Our success depends upon the continued services of our senior management and other key personnel who have substantial experience in the electronic payments industry and the markets in which we offer our services. In addition, our success depends in large part upon the reputation within the industry of our senior managers who have, developed relationships with our distribution partners, payment networks and other payment processing and service providers. Further, for us to continue to successfully compete and grow, we must attract, recruit, develop and retain personnel who will provide us with expertise across the entire spectrum of our intellectual capital needs. Our success is also dependent on the skill and experience of our sales force, which we must continuously work to maintain. While we have key personnel who have substantial experience with our operations, we must also develop our personnel to provide succession plans capable of maintaining the continuity of our operations. The market for qualified personnel is competitive, and we may not succeed in recruiting additional personnel or may fail to effectively replace current personnel who depart with qualified or effective successors.
Failure to retain or attract key personnel could impede our ability to grow and could result in our inability to operate our business profitably. In addition, contractual obligations related to confidentiality, assignment of intellectual property rights, and non-solicitation may be ineffective or unenforceable and departing employees may share our proprietary information with competitors in ways that could adversely impact us, or seek to solicit our distribution partners or merchants or recruit our key personnel to competing businesses.
Our ability to successfully operate the business will depend largely upon the efforts of certain key personnel, including the key personnel of Paya. The loss of such key personnel could adversely affect the operations and profitability of our business.
Our ability to successfully operate Paya’s business depends upon the efforts of certain key personnel of Paya. Although we expect all of such key personnel to remain with us, the unexpected loss of key personnel may adversely affect our operations and profitability. In addition, our future success depends in part on our ability to identify and retain key personnel to succeed senior management. Furthermore, while we have closely scrutinized the skills, abilities and qualifications of the key Paya personnel that we will employ, our assessment may not prove to be correct. If such personnel do not possess the skills, qualifications or abilities we expect or those necessary to manage a public company, the operations and profitability of our business may be negatively impacted.
Risks Relating to Intellectual Property and Information Technology
Unauthorized disclosure of merchant or cardholder data, whether through breach of our computer systems, computer viruses, or otherwise, could expose us to liability, protracted and costly litigation and damage our reputation.
We are responsible for data security for ourselves and for third parties with whom we partner and under the rules and regulations established by the payment networks, such as Visa, MasterCard, Discover and American Express, and debit card networks and by industry regulations and standards that may be promulgated by organizations such as NACHA, which manages the governance of the ACH network. These third parties include merchants, our distribution partners and other third-party service providers and agents. We and other third parties collect, process, store and/or transmit sensitive data, such as names, addresses, social security numbers, credit or debit card numbers and expiration dates, driver’s license numbers and bank account numbers. We have ultimate liability to the payment networks and our bank that sponsors our registration with Visa or MasterCard for our failure or the failure of third parties with whom we contract to protect this data in accordance with PCI-DSS and network requirements. The loss, destruction or unauthorized modification of merchant or cardholder data by us or our contracted third parties could result in significant fines, sanctions and proceedings or actions against us by the payment networks, card issuing banks, governmental entities, consumers, or others.
34
Threats may derive from human error, fraud, or malice on the part of employees or third parties, or from accidental technological failure. For example, certain of our employees have access to sensitive data that could be used to commit identity theft or fraud. Concerns about security increase when we transmit information electronically because such transmissions can be subject to attack, interception, or loss. Also, computer viruses can be distributed and spread rapidly over the Internet and could infiltrate our systems or those of our contracted third parties. Denial of service or other attacks could be launched against us for a variety of purposes, including interfering with our services or to create a diversion for other malicious activities. These types of actions and attacks and others could disrupt our delivery of services or make them unavailable. Any such actions or attacks against us or our contracted third parties could impugn our reputation, force us to incur significant expenses in remediating the resulting impacts, expose us to uninsured liability, result in the loss of our bank sponsors or our ability to participate in the payment networks, subject us to lawsuits, fines or sanctions, distract our management or increase our costs of doing business.
We and our contracted third parties could be subject to security breaches by hackers. Our encryption of data and other protective measures may not prevent unauthorized access to or use of sensitive data. A breach of a system may subject us to material losses or liability, including payment network fines, assessments and claims for unauthorized purchases with misappropriated credit, debit or card information, impersonation, or other similar fraud claims. A misuse of such data or a cybersecurity breach could harm our reputation and deter merchants from using electronic payments generally and our services specifically, thus reducing our revenue. In addition, any such misuse or breach could cause us to incur costs to correct the breaches or failures, expose us to uninsured liability, increase our risk of regulatory scrutiny, subject us to lawsuits, and result in the imposition of material penalties and fines under state and federal laws or by the payment networks. While we maintain insurance coverage that may, subject to policy terms and conditions, cover certain aspects of cyber risks, our insurance coverage may be insufficient to cover all losses. In addition, a significant cybersecurity breach of our systems or communications could result in payment networks prohibiting us from processing transactions on their networks or the loss of our bank sponsors that facilitate our participation in the payment networks, either of which could materially impede our ability to conduct business.
Although we generally require that our agreements with distribution partners or our service providers which may have access to merchant or cardholder data include confidentiality obligations that restrict these parties from using or disclosing any merchant or cardholder data except as necessary to perform their services under the applicable agreements, we cannot guarantee that these contractual measures will prevent the unauthorized use, modification, destruction or disclosure of data or allow us to seek reimbursement from the contracted party. In addition, many of our merchants are middle market businesses that may have limited competency regarding data security and handling requirements and thus may experience data breaches. Any unauthorized use, modification, destruction, or disclosure of data could result in protracted and costly litigation, and our incurring significant losses.
In addition, our agreements with our bank sponsors and our third-party payment processors (as well as payment network requirements) require us to take certain protective measures to ensure the confidentiality of merchant and consumer data. Any failure to adequately comply with these protective measures could result in fees, penalties, litigation, or termination of our bank sponsor agreements.
Any significant unauthorized disclosure of sensitive data entrusted to us would cause significant damage to our reputation, and impair our ability to attract new distribution partners, and may cause parties with whom we already have such agreements to terminate them.
We may not be able to successfully manage our intellectual property and may be subject to infringement claims.
35
We rely on a combination of contractual rights and copyright, trademark and trade secret laws to establish and protect our proprietary technology. Third parties may challenge, circumvent, infringe or misappropriate our intellectual property, or such intellectual property may not be sufficient to permit us to take advantage of current market trends or otherwise to provide competitive advantages, which could result in costly redesign efforts, discontinuance of service offerings or other competitive harm. Others, including our competitors, may independently develop similar technology, duplicate our services or design around our intellectual property and, in such cases, we could not assert our intellectual property rights against such parties. Further, our contractual arrangements may not effectively prevent disclosure of our confidential information or provide an adequate remedy in the event of unauthorized disclosure of our confidential information. We may have to litigate to enforce or determine the scope and enforceability of our intellectual property rights and knowhow, which is expensive, could cause a diversion of resources and may not prove successful. Also, because of the rapid pace of technological change in our industry, aspects of our business and our services rely on technologies developed or licensed by third parties, and we may not be able to obtain or continue to obtain licenses and technologies from these third parties on reasonable terms or at all. The loss of intellectual property protection or the inability to license or otherwise use third-party intellectual property could harm our business and ability to compete.
We may also be subject to costly litigation if our services and technology are alleged to infringe upon or otherwise violate a third party’s proprietary rights. Third parties may have, or may eventually be issued, patents that could be infringed by our products, services, or technology. Any of these third parties could make a claim of infringement against us with respect to our products, services, or technology. We may also be subject to claims by third parties for patent, copyright or trademark infringement, breach of license or violation of other third-party intellectual property rights. Any claim from third parties may result in a limitation on our ability to use the intellectual property subject to these claims. Additionally, in recent years, individuals and groups have been purchasing intellectual property assets for the sole purpose of making claims of infringement or other violations and attempting to extract settlements from companies like ours. Even if we believe that intellectual property related claims are without merit, defending against such claims is time consuming and expensive and could result in the diversion of the time and attention of our management and employees. Claims of intellectual property infringement or violation also might require us to redesign affected products or services, enter into costly settlement or license agreements, pay costly damage awards, or face a temporary or permanent injunction prohibiting us from marketing or selling certain of our products or services. Even if we have an agreement for indemnification against such costs, the indemnifying party, if any in such circumstances, may be unable to uphold its contractual obligations. If we cannot or do not license the infringed technology on reasonable terms or substitute similar technology from another source, our revenue and earnings could be adversely impacted.
Our systems and our third-party providers’ systems may fail due to factors beyond our control, which could interrupt our service, resulting in our inability to process payments, cause us to lose business, increase our costs and expose us to liability.
We depend on the efficient and uninterrupted operation of numerous systems, including our computer network systems, software, data centers and telecommunication networks, as well as the systems and services of our bank sponsors, the payment networks, third-party providers of processing services and other third parties. Our systems and operations or those of our third-party providers, such as our provider of authorization services, or the payment networks themselves, could be exposed to damage or interruption from, among other things, fire, natural disaster, power loss, telecommunications failure, unauthorized entry, computer viruses, denial-of-service attacks, acts of terrorism, human error or sabotage, financial insolvency and similar events. Our property and business interruption insurance may not be adequate to compensate us for all losses or failures that may occur. At present, our systems are not fully redundant. Therefore, certain aspects of our operations may be subject to interruption. While we have disaster recovery policies and arrangements in place, they have not been tested under actual disasters or similar events.
36
Defects in our systems or those of third parties, errors or delays in the processing of payment transactions, delays or discrepancies in merchant funding and settlement processes, telecommunications failures or other difficulties could result in failure to process transactions, additional operating costs, diversion of technical and other resources, loss of revenue, merchants and distribution partners, loss of merchant and cardholder data, harm to our business or reputation, exposure to fraud losses or other liabilities and fines and other sanctions imposed by payment networks.
We rely on other service and technology providers. If they fail or discontinue providing their services or technology generally or to us specifically, our ability to provide services to merchants may be interrupted, and, as a result, our business, financial condition and results of operations could be adversely impacted.
We rely on third parties to provide or supplement card processing services and for infrastructure hosting services. We also rely on third parties for specific software and hardware used in providing our products and services. The termination by our service or technology providers of their arrangements with us or their failure to perform their services efficiently and effectively may adversely affect our relationships with our merchants and, if we cannot find alternate providers quickly, may cause those merchants to terminate their relationship with us.
We also rely in part on third parties for the development of and access to new technologies, or updates to existing products and services for which third parties provide ongoing support, which increases the cost associated with new and existing product and service offerings. Failure by these third-party providers to devote an appropriate level of attention to our products and services could result in delays in introducing new products or services, or delays in resolving any issues with existing products or services for which third-party providers provide ongoing support.
Risks Relating to Reliance on Third Parties
To acquire and retain a segment of our merchants, we depend in part on distribution partners that may not serve us exclusively and are subject to attrition.
We rely in significant part on the efforts of integrated software vendors and referral partners to market our services to merchants seeking to establish an integrated payment processing relationship. These distribution partners seek to introduce us, as well as our competitors, to newly established and existing middle market merchants. Generally, our agreements with distribution partners (except for a portion of our Integrated Solutions and Payment Services segments) are not exclusive and distribution partners retain the right to refer merchants to other merchant acquirers. Gaining and maintaining loyalty or exclusivity can require financial concessions to maintain current distribution partners and merchants or to attract potential distribution partners and merchants from our competitors. We have been required, and expect to be required in the future, to make concessions when renewing contracts with our distribution partners and such concessions can have a material impact on our financial condition or operating performance. If these distribution partners switch to another merchant acquirer, cease operations, or become insolvent, we will no longer receive new merchant referrals from them and we risk losing existing merchants that were originally enrolled by them. We cannot accurately predict the level of attrition of our distribution partners or merchants in the future, particularly those merchants we acquired as customers in the portfolio acquisitions we have completed in the past three years, which makes it difficult for us to forecast growth. If we are unable to establish relationships with new distribution partners or merchants, or otherwise increase our transaction processing volume to counter the effect of this attrition, our revenues will decline.
If the banks that currently provide ACH and wire transfers fail to properly transmit ACH or terminate their relationship with us or limit our ability to process funds or we are not able to increase our ACH capacity with our existing and new banks, our ability to process funds on behalf of our clients and our financial results and liquidity could be adversely affected.
37
We currently have agreements with two sponsor banks to execute ACH and wire transfers to support our processing services. If one or more of the banks fails to process ACH transfers on a timely basis, or at all, then our relationship with our clients could be harmed and we could be subject to claims by a client with respect to the failed transfers. In addition, these banks have no obligation to renew their agreements with us on commercially reasonable terms, if at all. Currently, some agreements with our bank sponsors give them substantial discretion in approving certain aspects of our business practices, including our solicitation, application and qualification procedures for clients and the terms of our agreements with clients. If these banks terminate their relationships with us or restrict the dollar amounts of funds that they will process on behalf of our clients, their doing so may impede our ability to process funds and could have an adverse impact on our financial results and liquidity.
Inability to maintain our strategic relationship with Sage could adversely affect our business.
We have a strategic relationship with Sage Group plc, a global provider of integrated accounting, payroll, and payment solutions, which previously acquired Paya in 2006 and remained a strategic partner after GTCR, LLC acquired us in 2017. As part of this strategic relationship, we offer integration into Sage Intacct, X3, and other Sage products. During 2020, 2019 and 2018, we derived approximately 8.6%, 8.5%, and 8.9%, respectively, of our net revenue from this relationship. We depend on Sage to refer new merchants to Paya and deliver an acceptable level of software functionality and service to our joint customers. There can be no assurance we will realize the expected benefits from this strategic relationship or that it will continue in the future. If successful, this relationship may be mutually beneficial and result in the continued growth in joint customers. However, such a relationship carries an element of risk given the ongoing competition for this customer base. Also, if Sage fails to perform or if the relationship fails to continue as expected, we could suffer reduced sales or other operational difficulties and our business, results of operations and financial condition could be materially adversely affected.
We rely on bank sponsors, which have substantial discretion with respect to certain elements of our business practices, to process electronic payment transactions. If these sponsorships are terminated and we are not able to secure new bank sponsors, we will not be able to conduct our business.
Because we are not a bank, we are not eligible for membership in the Visa, Mastercard, and other payment networks, and are, therefore, unable to directly access these payment networks, which are required to process transactions. These networks’ operating regulations require us to be sponsored by a member bank to process electronic payment transactions. We are currently registered with Visa and Mastercard through BMO Harris. We are also subject to network operating rules promulgated by the NACHA relating to payment transactions processed by us using the ACH Network. For ACH payments, our ACH network is sponsored by Wells Fargo and Fifth Third. The term of the agreements with Wells Fargo and Fifth Third, which automatically renew annually, do not have a termination date but are terminable with written notice. From time to time, we may enter into other sponsorship relationships as well.
The current term of our agreement with BMO Harris lasts through November 1, 2022 and will thereafter automatically renew for one year periods unless either party provides the other at least six months’ notice of its intent to terminate.
Our bank sponsors may terminate their agreements with us if we materially breach the agreements and do not cure the breach within an established cure period, if our membership with Visa and/or Mastercard terminates, if we enter bankruptcy or file for bankruptcy, or if applicable laws or regulations, including Visa and/or Mastercard regulations, change to prevent either the applicable bank or us from performing services under the agreement. If these sponsorships are terminated and we are unable to secure a replacement bank sponsor within the applicable wind down period, we will not be able to process electronic payment transactions.
38
Although we do not believe that Paya is substantially dependent on any of these agreements, bank sponsors do have discretion in these agreements and there is a possibility that the termination of a sponsorship could have an adverse impact on our business due to the need to transition services to an alternative provider. If any of these contracts were terminated, we believe we would be able to enter into alternative arrangements, although we may not be able to procure terms of an equal or more advantageous nature. Additionally, each of these agreements have wind down and de-conversion periods, which we believe would allow sufficient time for us to replace any of the aforementioned sponsors during such de-conversion periods. We are unable to predict with any certainty which terms might change in such alternative arrangements.
Furthermore, our agreements with our bank sponsors provide the bank with substantial discretion in approving certain elements of our business practices, including our solicitation, application, and underwriting procedures for merchants. We cannot guarantee that our bank sponsors’ actions under these agreements will not be detrimental to us, nor can we provide assurance that any of our bank sponsors will not terminate their sponsorship of us in the future. Our bank sponsors have broad discretion to impose new business or operational requirements on us, which may materially adversely affect our business. If our sponsorship agreements are terminated and we are unable to secure another bank sponsor, we will not be able to offer Visa or Mastercard transactions or settle transactions which would likely cause us to terminate our operations.
Our bank sponsors also provide or supplement authorization, funding, and settlement services in connection with our bankcard processing services. If our sponsorships agreements are terminated and we are unable to secure another bank sponsor, we will not be able to process Visa and MasterCard transactions, which would have a material adverse effect on our business, financial condition and results of operations.
In July 2018, the Office of the Comptroller of the Currency (“OCC”) announced that it will begin accepting special purpose national bank charter applications from financial technology companies (“FinTech Charter”). No applications for a FinTech Charter have been submitted to date, and we cannot predict which, if any, of our current or future competitors would take advantage of the charter. However, such a development could increase the competitive risks discussed above or create new competitive risks, such as our nonbank competitors being able to more easily access the payment networks without the requirement of a bank sponsor, which could provide them with a competitive advantage.
Legal and Regulatory Risks
We are subject to extensive government regulation, and any new laws and regulations, industry standards or revisions made to existing laws, regulations or industry standards affecting the electronic payments industry may have an unfavorable impact on our business, financial condition and results of operations.
In addition to those regulations discussed below that are imposed by the cards networks, NACHA and PCI-DSS, we are subject to numerous regulations that affect electronic payments including, U.S. financial services regulations, consumer protection laws, escheat regulations, the Family Educational Rights and Privacy Act (“FERPA”), the Protection of Pupil Rights Amendment (“PPRA”), the Health Insurance Portability and Accountability Act (“HIPAA”) and other privacy and information security regulations. Regulation and proposed regulation of our industry has increased significantly in recent years, with states enacting regulations in areas that have historically only been federally regulated. Changes to statutes, regulations, or industry standards, including interpretation and implementation of statutes, regulations, or standards, could increase our cost of doing business, affect our competitive balance, and significantly increase the difficulty of compliance. Failure to comply with regulations may have an adverse effect on our business, including the limitation, suspension or termination of services provided to, or by, third parties, and the imposition of penalties or fines.
39
Interchange fees, which are typically paid by the payment processor to the issuer in connection with electronic payments, are subject to increasingly intense legal, regulatory, and legislative scrutiny. In particular, the 2010 Dodd-Frank Wall Street Reform and Consumer Protection Act, (“ the Dodd-Frank Act”), significantly changed the U.S. financial regulatory system by regulating and limiting debit card fees charged by certain issuers, allowing merchants to set minimum dollar amounts for the acceptance of credit cards and allowing merchants to offer discounts or other incentives for different payment methods.
Rules implementing the Dodd-Frank Act also contain certain prohibitions on payment network exclusivity and merchant routing restrictions. These restrictions could limit the number of debit transactions, and prices charged per transaction, which would negatively affect our business. The Dodd-Frank Act also created the Consumer Financial Protection Bureau (“the CFPB”), which has assumed responsibility for most federal consumer protection laws, and the Financial Stability Oversight Council, which has the authority to determine whether any non-bank financial company, such as Paya, should be supervised by the Board of Governors of the Federal Reserve System (“the Federal Reserve”), because it is systemically important to the U.S. financial system. Because we provide data processing and other services to U.S. banks, we are subject to regular oversight and examination by the Federal Financial Institutions Examination Council (the “FFIEC”), which is an inter-agency body of federal banking regulators. Any such designation would result in increased regulatory burdens on our business, which increases our risk profile and may have an adverse impact on our business, financial condition, and results of operations.
We and many of our merchants are subject to Section 5 of the Federal Trade Commission Act prohibiting unfair or deceptive acts or practices. That statement and other laws, rules and or regulations, including the Telemarketing Sales Act, may directly impact the activities of certain of our merchants and, in some cases, may subject us, as the merchant’s electronic processor or provider of certain services, to investigations, fees, fines and disgorgement of funds if we were deemed to have improperly aided and abetted or otherwise provided the means and instrumentalities to facilitate the illegal or improper activities of the merchant through our services. Various federal and state regulatory enforcement agencies, including the Federal Trade Commission and state attorneys general, have authority to take action against non-banks that engage in unfair or deceptive practices or violate other laws, rules and regulations and to the extent we are processing payments or providing services for a merchant that may be in violation of laws, rules and regulations, we may be subject to enforcement actions and as a result may incur losses and liabilities that may impact our business.
Our business may also be subject to the Fair Credit Reporting Act (“the FCRA”), which regulates the use and reporting of consumer credit information and imposes disclosure requirements on entities that take adverse action based on information obtained from credit reporting agencies. We could be liable if our practices under the FCRA are not in compliance with the FCRA or regulations under it.
Separately, the Housing Assistance Tax Act of 2008 included an amendment to the Internal Revenue Code of 1986, as amended (the “Code”), that requires the filing of yearly information returns by payment processing entities and third-party settlement organizations with respect to payments made in settlement of electronic payment transactions and third-party payment network transactions occurring in that calendar year. Reportable transactions are also subject to backup withholding requirements. We could be liable for penalties if our information returns do not comply with these regulations.
These and other laws and regulations, even if not directed at us, may require us to make significant efforts to change our products and services and may require that we incur additional compliance costs and change how we price our services to merchants. Implementing new compliance efforts may be difficult because of the complexity of new regulatory requirements and may cause us to devote significant resources to ensure compliance. Furthermore, regulatory actions may cause changes in business practices by us and other industry participants which could affect how we market, price and distribute our products and services, which could limit our ability to grow, reduce our revenues, or increase our costs. In addition, even an inadvertent failure to comply with laws and regulations, as well as rapidly evolving social expectations of corporate fairness, could damage our business or our reputation.
We may be required to register under the Bank Secrecy Act as a money services business or to become licensed under state money transmission statutes.
40
We provide payment processing services through our Paya, Inc. subsidiary, including card processing and ACH processing services. We have taken the position that Paya, Inc. is: (i) exempt from registration under the Bank Secrecy Act of 1970, as amended by the USA PATRIOT Act of 2001 (as amended, the “BSA”), as Paya is a payment processor and therefore able to avail itself of the payment processor exemption in accordance with guidance from the Financial Crimes Enforcement Network, or FinCEN, including FinCEN Administrative Letter Ruling FIN-2014-R009; and (ii) exempt from licensure under various state money transmission laws, either expressly as a payment processor or agent of the payee, or pursuant to common law as an agent of the payee.
While we believe we have defensible arguments in support of our positions under the BSA and the state money transmission statutes, we have not expressly obtained confirmation of such positions from either FinCEN or the state banking departments who administer the state money transmission statutes. It is possible that FinCEN or certain state banking departments may determine that our activities are not exempt. Any determination that Paya, Inc. is in fact required to be registered either under the BSA or licensed under the state money transmission statutes may require substantial expenditures of time and money and could lead to liability in the nature of penalties or fines, as well as cause us to be required to cease operations in some or all of the US jurisdictions we service, which would have a materially adverse effect on our business and our financial results.
While we believe we are exempt from the BSA we are contractually required to comply with certain obligations in the BSA pursuant to our agreements with those federally-insured depository institutions that sponsor our card processing activities and our ACH activities.
In addition, we, and those federally-insured depository institutions that sponsor our card processing activities and our ACH activities, are subject to the sanctions programs enforced by the Office of Foreign Assets Control (“OFAC”). If we fail to comply with these sanctions programs or our sanctions compliance program is found to be deficient then the fines or penalties we face may be severe and our efforts to remediate our sanctions compliance program may be costly and result in diversion of management time and effort and may still not guarantee compliance.
Governmental regulations designed to protect or limit access to or use of consumer information could adversely affect our ability to effectively provide our services to merchants.
41
Governmental bodies in the United States have adopted, or are considering the adoption of, laws and regulations restricting the use, collection, storage, and transfer of, and requiring safeguarding of, non-public personal information. Our operations are subject to certain provisions of these laws. Relevant federal privacy laws include the Gramm-Leach-Bliley Act of 1999, which applies directly to a broad range of financial institutions and indirectly, or in some instances directly, to companies that provide services to financial institutions. These laws and regulations restrict the collection, processing, storage, use and disclosure of personal information, require notice to individuals of privacy practices and provide individuals with certain rights to prevent the use and disclosure of protected information. These laws also impose requirements for safeguarding and proper destruction of personal information through the issuance of data security standards or guidelines. The Federal Trade Commission’s information safeguarding rules under the Gramm-Leach-Bliley Act require us to develop, implement and maintain a written, comprehensive information security program containing safeguards that are appropriate for our size and complexity, the nature and scope of our activities and the sensitivity of any customer information at issue. Our financial institution clients are subject to similar requirements under the guidelines issued by the federal banking regulators. As part of their compliance with these requirements, each of our financial institution clients is expected to have a program in place for responding to unauthorized access to, or use of, customer information that could result in substantial harm or inconvenience to customers and they are also responsible for our compliance efforts as a major service provider. Changes in our relationships with service providers, such as our plan to use AWS to provide additional redundancy, could further complicate the applicability of these regulations to our business. In addition, regulators are proposing new laws or regulations which could require us to adopt certain cybersecurity and data handling practices. In many jurisdictions, consumers must be notified in the event of a data breach, and such notification requirements continue to increase in scope and cost. The changing privacy laws in the United States create new individual privacy rights and impose increased obligations on companies handling personal data. In addition, there are state laws restricting the ability to collect and utilize certain types of information such as Social Security and driver’s license numbers. Certain state laws impose similar privacy obligations as well as obligations to provide notification of security breaches of computer databases that contain personal information to affected individuals, state officers and consumer reporting agencies and businesses and governmental agencies that own data.
In connection with providing services to our merchants, we are required by regulations and contracts with our merchants and with our financial institution referral partners to provide assurances regarding the confidentiality and security of non-public consumer information. These contracts require periodic audits by independent companies regarding our compliance with industry standards and allow for similar audits regarding best practices established by regulatory guidelines. The compliance standards relate to our infrastructure, components and operational procedures designed to safeguard the confidentiality and security of non-public consumer personal information shared by our merchants with us. Our ability to maintain compliance with these standards and satisfy these audits will affect our ability to attract, grow and maintain business in the future.
Additionally, privacy and data security have become significant issues in the United States. With the recent increase in publicity regarding data breaches resulting in improper dissemination of consumer information, all 50 states have passed laws regulating the actions that a business must take if it experiences a data breach, such as prompt disclosure to affected customers. As we receive, collect, process, use, and store personal and confidential data, we are subject to diverse laws and regulations relating to data privacy and security, including, local state laws such as the New York Stop Hacks and Improve Data Security Act (the “SHIELD Act”), and the California Consumer Privacy Act (the “CCPA”).
The SHIELD Act requires companies to implement a written information security program that contains appropriate administrative, technical, and physical safeguards. The CCPA, which became effective on January 1, 2020, gives California residents expanded rights to access and delete their personal information, opt out of certain personal information sharing and receive detailed information about how their personal information is used. The CCPA provides for civil penalties for violations, as well as a private right of action for data breaches that is expected to increase data breach litigation. The CCPA may increase our potential liability and may require us to modify our data collection or processing practices and policies and to incur substantial costs and expenses in effort to comply. Some observers have noted that the CCPA could mark the beginning of a trend toward more stringent privacy legislation in the United States, which could increase our potential liability and adversely affect our business.
42
If we fail to comply with the laws and regulations relating to the protection of data privacy, we could be exposed to suits for breach of contract or to governmental proceedings. In addition, our relationships and reputation could be harmed, which could inhibit our ability to retain existing merchants and distribution partners and obtain new merchants and distribution partners.
If more restrictive privacy laws or rules are adopted by authorities in the future, our compliance costs may increase and our ability to perform due diligence on, and monitor the risk of, our current and potential merchants may decrease, which could create liability for us. Additionally, our opportunities for growth may be curtailed by our compliance capabilities or reputational harm, and our potential liability for security breaches may increase.
Changes in tax laws or their interpretations, or becoming subject to additional U.S., state or local taxes that cannot be passed through to our clients, could negatively affect our business, financial condition and results of operations.
We are subject to extensive tax liabilities, including federal and state and transactional taxes such as excise, sales/use, payroll, franchise, withholding, and ad valorem taxes. Changes in tax laws or their interpretations could decrease the amount of revenues we receive, the value of any tax loss carryforwards and tax credits recorded on our balance sheet and the amount of our cash flow, and have a material adverse impact on our business, financial condition and results of operations. Some of our tax liabilities are subject to periodic audits by the respective taxing authority which could increase our tax liabilities. Furthermore, companies in the payment processing industry, including us, may become subject to incremental taxation in various tax jurisdictions. Taxing jurisdictions have not yet adopted uniform positions on this topic. If we are required to pay additional taxes and are unable to pass the tax expense through to our clients, our costs would increase and our net income would be reduced, which could have a material adverse effect on our business, financial condition and results of operations.
Changes in the method pursuant to which the London Interbank Offered Rate (“LIBOR”) is determined and the transition to other benchmarks may adversely affect our results of operations.
LIBOR and certain other “benchmarks” have been the subject of continuing national, international, and other regulatory guidance and proposals for reform. These reforms may cause such benchmarks to perform differently than in the past or have other consequences which cannot be predicted. In July 2017, the United Kingdom’s Financial Conduct Authority, which regulates LIBOR, publicly announced that it intends to stop persuading or compelling banks to submit LIBOR rates after 2021. To identify a successor rate for U.S. dollar LIBOR, the Alternative Reference Rates Committee or ARRC, a U.S. based group convened by the Federal Reserve Board and the Federal Reserve Bank of New York, was formed. The ARRC is comprised of a diverse set of private sector entities and a wide array of official-sector entities, banking regulators, and other financial sector regulators. The ARRC has identified the Secured Overnight Financing Rate, or SOFR, as its preferred alternative rate for LIBOR. SOFR is a measure of the cost of borrowing cash overnight, collateralized by U.S. Treasury securities, and is based on directly observable U.S. Treasury-backed repurchase transactions. Financial regulators in the United Kingdom, the European Union, Japan, and Switzerland also have formed working groups with the aim of recommending alternatives to LIBOR denominated in their local currencies. Although SOFR appears to be the preferred replacement rate for U.S. dollar LIBOR, it is unclear if other benchmarks may emerge or if other rates will be adopted outside of the United States.
43
As of December 31, 2020, the majority of our outstanding indebtedness had interest rate payments determined directly or indirectly based on LIBOR. Uncertainty regarding the continued use and reliability of LIBOR as a benchmark interest rate could adversely affect the performance of LIBOR relative to its historic values. Even if financial instruments are transitioned to alternative benchmarks, such as SOFR, successfully, the new benchmarks are likely to differ from LIBOR, and our interest expense associated with our outstanding indebtedness or any future indebtedness we incur may increase. Further, transitioning to an alternative benchmark rate, such as SOFR, may result in us incurring significant expense and legal risks, as renegotiation and changes to documentation may be required in effecting the transition. Any alternative benchmark rate may be calculated differently than LIBOR and may increase the interest expense associated with our existing or future indebtedness. In addition, it is possible that LIBOR quotes will become unavailable after 2021, in which case risks associated with the transition away from LIBOR would be accelerated.
Any of these occurrences could materially and adversely affect our borrowing costs, financial condition, and results of operations.
Risks Relating to Indebtedness
Certain subsidiaries have and will continue to have high levels of indebtedness.
Paya Holdings III, LLC (“Paya III”), Holdings and other indirect subsidiaries of Paya are party to a Credit Agreement, dated as of August 1, 2017 (the “Credit Agreement”). As of December 31, 2020, there were no outstanding borrowings under the revolving credit facility thereunder (the “2017 Revolving Credit Facility”) and $228.7 million outstanding under the Term Loan facility thereunder (the “2017 Term Credit Facility” and together with the 2017 Revolving Credit Facility, the “2017 Credit Facility”). Because borrowings under the 2017 Credit Facility bear interest at variable rates, any increase in interest rates on debt that has not been fixed using interest rate hedges will increase interest expense, reduce cash flow or increase the cost of future borrowings or refinancings. Paya III’s indebtedness could have important consequences to our investors, including, but not limited to:
•increasing vulnerability to, and reducing its flexibility to respond to, general adverse economic and industry conditions;
•requiring the dedication of a substantial portion of cash flow from operations to the payment of principal of, and interest on, its indebtedness, thereby reducing the availability of such cash flow to fund working capital, capital expenditures, acquisitions, joint ventures or other general corporate purposes;
•limiting flexibility in planning for, or reacting to, changes in its business and the competitive environment; and
•limiting Paya III’s ability to borrow additional funds and increasing the cost of any such borrowing.
We believe our business is relatively capital intensive, which could cause revenue fluctuations in our operating results. As a result, a decline in revenue may lead to a relatively larger impact on operating results. A substantial portion of our operating expenses will be related to personnel costs, regulation and corporate overhead, none of which can be adjusted quickly and some of which cannot be adjusted at all. Our operating expense levels will be based on our expectations for future revenue. If actual revenue is below management’s expectations, or if our expenses increase before revenues do, both revenues less transaction-based expenses and operating results would be materially and adversely affected. Because of these factors, it is possible that our operating results or other operating metrics may fail to meet the expectations of stock market analysts and investors. If this happens, the market price of our common stock may be adversely affected.
The Credit Agreement contains a change of control provision that could require us to amend or refinance the existing indebtedness.
44
The Credit Agreement provides that an event of default will occur upon a Change in Control, which includes us ceasing to beneficially own directly or indirectly through wholly owned subsidiaries all of the interests of Paya III. In addition, a Change in Control event occurs if any person or group beneficially owns directly or indirectly a majority of Paya III’s voting equity interests (other than the Sponsor and certain other specified persons). Although we do not currently anticipate that any such person will beneficially own a majority of the voting equity interests prior to the amendment or refinancing of this indebtedness, no person is contractually obligated to retain the voting equity interests it holds, subject to certain forfeiture restrictions governing a limited number of shares. If we are unable to amend these agreements or refinance this indebtedness, we will be limited in our ability to issue additional equity to any person which would acquire a majority of common stock following such issuance and will need to rely on other sources of financing, including additional borrowings.
Our ability to pay dividends in the future will be subject to our subsidiaries’ ability to distribute cash to us.
Paya does not anticipate that the board of directors will declare dividends in the foreseeable future. If Paya decides to declare dividends in the future, as a holding company, we will require dividends and other payments from our subsidiaries to meet such cash requirements. Paya’s credit agreements place certain contractual restrictions on our subsidiaries’ ability to make distributions to us. See “Paya’s Management’s Discussion and Analysis of Financial Condition and Results of Operations — Liquidity and Capital Resources — Overview” for a discussion of the Credit Agreement’s restrictions on our subsidiaries’ ability to make distributions to us. In addition, minimum capital requirements may indirectly restrict the amount of dividends paid upstream, and repatriations of cash from our subsidiaries may be subject to withholding, income and other taxes in various applicable jurisdictions. If our subsidiaries are unable to distribute cash to us and we are unable to pay dividends, our common stock may become less attractive to investors and the price of our common stock may become volatile.
Risks Relating to Ownership of our Common Stock
We may issue additional common stock or other equity securities without your approval, which would dilute your ownership interests and may depress the market price of the common stock.
We may issue an aggregate of 14,000,000 shares of common stock to existing equity holders of Paya upon achievement of milestone targets. Our issuance of additional common stock or other equity securities of equal or senior rank would have the following effects:
•our existing shareholders’ proportionate ownership interest will decrease;
•the amount of cash available per share, including for payment of dividends in the future, may decrease;
•the relative voting strength of each previously outstanding share of common stock may be diminished; and
•the market price of our common stock may decline.
Paya’s only significant asset is the ownership of Paya’s business through its indirect ownership interest in Holdings. If Paya’s business is not profitably operated, Holdings may be unable to pay us dividends or make distributions or loans to enable us to pay any dividends on its common stock or satisfy its other financial obligations.
We currently have no direct operations and no significant assets other than the indirect ownership of Holdings, which will operate Paya’s business. We will depend on profits generated by Paya’s business for distributions, debt repayment and other payments to generate the funds necessary to meet its financial obligations, including its expenses as a publicly traded company, and to pay any dividends with respect to its capital stock. Legal and contractual restrictions in agreements governing the indebtedness of Paya, as well as the financial condition and operating requirements of Paya, may limit its ability to receive distributions from Holdings and the Paya business in the foreseeable future.
45
Provisions in our charter and Delaware law may inhibit a takeover, which could limit the price investors might be willing to pay in the future for its common stock and could entrench management.
Our amended and restated certificate of incorporation and bylaws will contain provisions to limit the ability of others to acquire control of us or cause us to engage in change-of-control transactions, including, among other things:
•provisions that authorize our board of directors, without action by our stockholders, to authorize by resolution the issuance of shares of preferred stock and to establish the number of shares to be included in such series, along with the preferential rights determined by our board of directors; provided that, our board of directors may also, subject to the rights of the holders of preferred stock, authorize shares of preferred stock to be increased or decreased by the approval of the board of directors and the affirmative vote of the holders of a majority in voting power of the outstanding shares of capital stock of the corporation;
•provisions that permit only a majority of our board of directors or the chairman of the board of directors at the direction of a majority of the board of directors or, for so long as Ultra and its affiliates beneficially own at least 35% of our common stock, the Chairman of the board of directors at the written request of the holders of a majority of the voting power of the then outstanding shares of voting stock, to call shareholder meetings, and therefore do not permit stockholders to call special stockholder meetings;
•provisions that impose advance notice requirements, minimum shareholding periods and ownership thresholds, and other requirements and limitations on the ability of stockholders to propose matters for consideration at stockholder meetings; provided, however, that at any time when Ultra beneficially owns, in the aggregate, at least 10% of our common stock, such advance notice procedure will not apply to it; and
•a staggered board whereby our directors are divided into three classes, with each class subject to retirement and reelection once every three years on a rotating basis.
These provisions could have the effect of depriving our stockholders of an opportunity to sell their shares at a premium over prevailing market prices by discouraging third parties from seeking to obtain control of us in a tender offer or similar transaction. With our staggered board of directors, at least two annual meetings of shareholders will generally be required in order to effect a change in a majority of our directors. Our staggered board of directors can discourage proxy contests for the election of our directors and purchases of substantial blocks of our shares by making it more difficult for a potential acquirer to gain control of our board of directors in a relatively short period of time.
Our amended and restated certificate of incorporation will provide, subject to limited exceptions, that the Court of Chancery of the State of Delaware will be the sole and exclusive forum for certain stockholder litigation matters, which could limit our stockholders’ ability to obtain a favorable judicial forum for disputes with us or our directors, officers, employees or stockholders.
Our amended and restated certificate of incorporation will require, to the fullest extent permitted by law, that derivative actions brought in our name, actions against directors, officers and employees for breach of fiduciary duty and other similar actions may be brought only in the Court of Chancery in the State of Delaware and, if brought outside of Delaware, the stockholder bringing the suit will be deemed to have consented to service of process on such stockholder’s counsel. Any person or entity purchasing or otherwise acquiring any interest in shares of our capital stock shall be deemed to have notice of and consented to the forum provisions in its amended and restated certificate of incorporation.
46
This choice of forum provision may limit a stockholder’s ability to bring a claim in a judicial forum that it finds favorable for disputes with us or any of our directors, officers, other employees or stockholders, which may discourage lawsuits with respect to such claims. Alternatively, if a court were to find the choice of forum provision contained in our amended and restated certificate of incorporation to be inapplicable or unenforceable in an action, we may incur additional costs associated with resolving such action in other jurisdictions, which could harm its business, operating results and financial condition.
A market for our securities may not develop, which would adversely affect the liquidity and price of its securities.
The price of our securities may fluctuate significantly due to general market and economic conditions. An active trading market for our securities may never develop or, if developed, it may not be sustained.
We may be unable to satisfy NASDAQ listing requirements in the future, which could limit investors’ ability to effect transactions in its securities and subject it to additional trading restrictions.
If we fail to continue to satisfy ongoing NASDAQ listing requirements, or if we are delisted, there could be significant material adverse consequences, including:
•a limited availability of market quotations for its securities;
•a limited amount of news and analyst coverage for us; and
•a decreased ability to obtain capital or pursue acquisitions by issuing additional equity or convertible securities
We will incur increased costs and obligations as a result of being a public company.
Paya is required to comply with many corporate governance and financial reporting practices and policies required of a publicly traded company. As a publicly traded company, we incur significant legal, accounting and other expenses that we were not required to incur in the recent past. These expenses will increase once we are no longer an “emerging growth company” as defined under the Jumpstart Our Business Startups Act of 2012, or the JOBS Act. In addition, new and changing laws, regulations and standards relating to corporate governance and public disclosure for public companies, including the Dodd-Frank Act, the Sarbanes-Oxley Act, regulations related thereto and the rules and regulations of the SEC and NASDAQ, have increased the costs and the time that must be devoted to compliance matters. We expect these rules and regulations will increase our legal and financial costs and lead to a diversion of management time and attention from revenue-generating activities.
For as long as we remain an “emerging growth company” as defined in the JOBS Act, we may take advantage of certain exemptions from various reporting requirements that are applicable to other public companies that are not “emerging growth companies.” We will remain an emerging growth company until the earlier of (1) the last day of the fiscal year (a) following the fifth anniversary of the completion of our initial public offering (its predecessor), (b) in which we have total annual gross revenue of at least $1.07 billion, or (c) in which we are deemed to be a large accelerated filer, which means the market value of its common stock that is held by non-affiliates exceeds $700 million as of the prior June 30th, and (2) the date on which we have issued more than $1.0 billion in non-convertible debt securities during the prior three-year period. To the extent we choose not to use exemptions from various reporting requirements under the JOBS Act, or if we no longer can be classified as an “emerging growth company,” we will incur additional compliance costs, which will reduce our ability to operate profitably.
As an “emerging growth company,” we cannot be certain if the reduced disclosure requirements applicable to “emerging growth companies” will make its common stock less attractive to investors.
47
As an “emerging growth company,” we may take advantage of certain exemptions from various reporting requirements that are applicable to other public companies, including not being required to obtain an assessment of the effectiveness of its internal controls over financial reporting from its independent registered public accounting firm pursuant to Section 404 of the Sarbanes-Oxley Act, reduced disclosure obligations regarding executive compensation in its periodic reports and proxy statements, and exemptions from the requirements of holding a nonbinding advisory vote on executive compensation and shareholder approval of any golden parachute payments not previously approved. In addition, the JOBS Act provides that an emerging growth company can take advantage of an extended transition period for complying with new or revised accounting standards, which we have elected to do.
We cannot predict if investors will find our common stock less attractive because we will rely on these exemptions. If some investors find our common stock less attractive as a result, there may be a less active market for our common stock, our share price may be more volatile and the price at which our securities trade could be less than if we did not use these exemptions.
As a public reporting company, we are subject to rules and regulations established from time to time by the SEC and Nasdaq regarding our internal control over financial reporting. If we fail to establish and maintain effective internal control over financial reporting and disclosure controls and procedures, we may not be able to accurately report our financial results, or report them in a timely manner.
We are a public reporting company subject to the rules and regulations established from time to time by the SEC and Nasdaq. These rules and regulations require, among other things, that we establish and periodically evaluate procedures with respect to our internal control over financial reporting. Public company reporting obligations place a considerable burden on our financial and management systems, processes and controls, as well as on our personnel.
In addition, as a public company we are required to document and test our internal control over financial reporting pursuant to Section 404 of the Sarbanes-Oxley Act so that our management can certify as to the effectiveness of our internal control over financial reporting. Likewise, our independent registered public accounting firm will be required to provide an attestation report on the effectiveness of our internal control over financial reporting at such time as we cease to be an “emerging growth company,” as defined in the JOBS Act, if we are an “accelerated filer” or “large accelerated filer” at such time.
We expect to incur costs related to our internal control over financial reporting in the upcoming years to further improve our internal control environment. If we identify deficiencies in our internal control over financial reporting or if we are unable to comply with the requirements applicable to us as a public company, including the requirements of Section 404 of the Sarbanes-Oxley Act, in a timely manner, we may be unable to accurately report our financial results, or report them within the timeframes required by the SEC. If this occurs, we also could become subject to sanctions or investigations by the SEC or other regulatory authorities. In addition, if we are unable to assert that our internal control over financial reporting is effective, or if our independent registered public accounting firm is unable to express an opinion as to the effectiveness of our internal control over financial reporting, or express an adverse opinion, investors may lose confidence in the accuracy and completeness of our financial reports, we may face restricted access to the capital markets and our stock price may be adversely affected.
We may issue additional shares of common stock or other equity securities without your approval, which would dilute your ownership interest and may depress the market price of our common stock.
We may issue additional shares of common stock or other equity securities in the future in connection with, among other things, future acquisitions, repayment of outstanding indebtedness or grants under the Omnibus Plan without stockholder approval in a number of circumstances.
The issuance of additional common stock or other equity securities could have one or more of the following effects:
•Our existing stockholders’ proportionate ownership interest will decrease;
48
•the amount of cash available per share, including for payment of dividends in the future, may decrease;
•the relative voting strength of each previously outstanding share of common stock may be diminished; and
•the market price of its common stock may decline.
We may redeem your unexpired warrants prior to their exercise at a time that is disadvantageous to you, thereby making your warrants worthless.
We will have the ability to redeem outstanding warrants (excluding any placement warrants held by our Sponsor or its permitted transferees) at any time after they become exercisable and prior to their expiration, at $0.01 per warrant, provided that the last reported sales price (or the closing bid price of our common stock in the event the shares of our common stock are not traded on any specific trading day) of our common stock equals or exceeds $18.00 per share for any 20 trading days within a 30 trading-day period ending on the third business day prior to the date we send proper notice of such redemption, provided that on the date we give notice of redemption and during the entire period thereafter until the time it redeems the warrants, we have an effective registration statement under the Securities Act covering the shares of our common stock issuable upon exercise of the warrants and current prospectus relating to them is available. If and when the warrants become redeemable by us, we may exercise our redemption right even if we are unable to register or qualify the underlying securities for sale under all applicable state securities laws. Redemption of the outstanding warrants could force a warrant holder: (i) to exercise your warrants and pay the exercise price therefor at a time when it may be disadvantageous for you to do so, (ii) to sell your warrants at the then-current market price when you might otherwise wish to hold your warrants or (iii) to accept the nominal redemption price which, at the time the outstanding warrants are called for redemption, will be substantially less than the market value of your warrants.
The price of our common stock may fluctuate substantially.
The market price for our common stock is likely to be volatile, in part because our common stock has been traded publicly for only a short time.
Factors affecting the trading price of our common stock may include:
•actual or anticipated fluctuations in our quarterly financial results or the quarterly financial results of companies perceived to be similar to it;
•changes in the market’s expectations about our operating results;
•success of competitors;
•our operating results failing to meet market expectations in a particular period;
•changes in financial estimates and recommendations by securities analysts concerning us or the payments industry and market in general;
•operating and stock price performance of other companies that investors deem comparable to us;
•our ability to market new and enhanced products on a timely basis;
•changes in laws and regulations affecting our business;
•commencement of, or involvement in, litigation involving us;
•changes in its capital structure, such as future issuances of securities or the incurrence of additional debt;
•the volume of shares of common stock available for public sale;
49
•any significant change in our board or management;
•sales of substantial amounts of common stock by our directors, executive officers or significant stockholders or the perception that such sales could occur; and
•general economic and political conditions such as recessions, interest rates, fuel prices, international currency fluctuations and acts of war or terrorism.
Broad market and industry factors may depress the market price of our common stock irrespective of our operating performance. The stock market in general and NASDAQ have experienced price and volume fluctuations that have often been unrelated or disproportionate to the operating performance of the particular companies affected. The trading prices and valuations of these stocks, and of our securities, may not be predictable. A loss of investor confidence in the market for financial technology stocks or the stocks of other companies which investors perceive to be similar to us could depress its stock price regardless of its business, prospects, financial conditions or results of operations. A decline in the market price of our common stock also could adversely affect its ability to issue additional securities and its ability to obtain additional financing in the future.
Our ability to meet expectations and projections in any research or reports published by securities or industry analysts, or a lack of coverage by securities or industry analysts, could result in a depressed market price and limited liquidity for our common stock.
The trading market for our common stock will be influenced by the research and reports that industry or securities analysts may publish about us, our business, our market, or our competitors. If no securities or industry analysts commence coverage of us, our stock price would likely be less than that which would be obtained if it had such coverage and the liquidity, or trading volume of our common stock may be limited, making it more difficult for a stockholder to sell shares at an acceptable price or amount. If any analysts do cover us, their projections may vary widely and may not accurately predict the results we actually achieve. Our share price may decline if our actual results do not match the projections of research analysts covering us. Similarly, if one or more of the analysts who write reports on us downgrades our stock or publishes inaccurate or unfavorable research about our business, our share price could decline. If one or more of these analysts ceases coverage of us or fails to publish reports on us regularly, our share price or trading volume could decline.
Future sales of our common stock issued to Ultra may reduce the market price of common stock that you might otherwise obtain.
In connection with the consummation of the Business Combination, Ultra received approximately 54.5 million shares of Company common stock pursuant to the Merger Agreement and an additional 0.7 million shares in connection with the concurrent private placement. The Company also entered into a registration rights agreement with Ultra and certain other stockholders, pursuant to which it granted certain registration right to Ultra and the other stockholders party thereto. Following the expiration of any lockup period applicable to shares of Company common stock held by Ultra, it or its affiliates may sell large amounts of Company common stock in the open market or in privately negotiated transactions. The registration and availability of such a significant number of shares of common stock for trading in the public market may increase the volatility in the Company’s stock price or put significant downward pressure on the price of its stock. In addition, the Company may use shares of its common stock as consideration for future acquisitions, which could further dilute its stockholders.
50
Item 1B. Unresolved Staff Comments
None
Item 2. Properties
Facilities
We maintain several offices across the United States, all of which we lease.
Our office locations include:
•Corporate headquarters in Atlanta, Georgia with approximately 23,000 leased square feet;
•Finance and Operations in Reston, Virginia with approximately 10,000 leased square feet;
•Sales and Operations in Fort Walton Beach, Florida with approximately 11,000 leased square feet;
•FBS Sales and Operations in Dayton, Ohio with approximately 6,000 leased square feet;
•Stewardship Sales and Operations in Mount Vernon, Ohio with approximately 2,000 leased square feet; and
•The Payment Group Sales and Operations in Dallas, Texas with approximately 6,000 leased square feet.
Item 3. Legal Proceedings
We are currently not a party to any legal proceedings that would be expected to have a material adverse effect on our business or financial condition. From time to time, we are subject to litigation incidental to our business, as well as other litigation of a non-material nature in the ordinary course of business.
Item 4. Mine Safety Disclosures
Not applicable
51
Part II
Item 5. Market for Registrant’s Common Equity, Related Shareholder Matters and Issuer Purchases of Equity Securities
Holders
As of December 31, 2020, there were 45 holders of record of our Common Stock.
Dividend Information
We do not currently pay any cash dividends on our Common Stock. The declaration and amount of all dividends will be at the discretion of our board of directors and will depend upon many factors, including our financial condition, results of operations, cash flows, prospects, industry conditions, capital requirements of our business, covenants associated with certain debt obligations, legal requirements, regulatory constraints, industry practice and other factors the board of directors deems relevant. We can give no assurances that we will pay a dividend in the future.
Stock Performance Graph
The following stock price performance graph should not be deemed incorporated by reference by any general statement incorporating by reference this Annual Report on Form 10-K into any filing under the Exchange Act or the Securities Act of 1933, as amended (the “Securities Act”), except to the extent that we specifically incorporate this information by reference, and shall not otherwise be deemed filed under such acts.
The graph below compares the cumulative total return of our common stock from October 19, 2020, the date on which our common shares commenced trading on the NASDAQ, through December 31, 2020, with the comparable cumulative return of two indices, the S&P 500 Total Return and the S&P Information Technology Total Return. The performance graph and table assume an initial investment of $100 on October 19, 2020. We have not paid any cash dividends and, therefore, the cumulative total return calculation for us is based solely upon the change in share price. The share price performance shown on the graph is not necessarily indicative of future price performance.
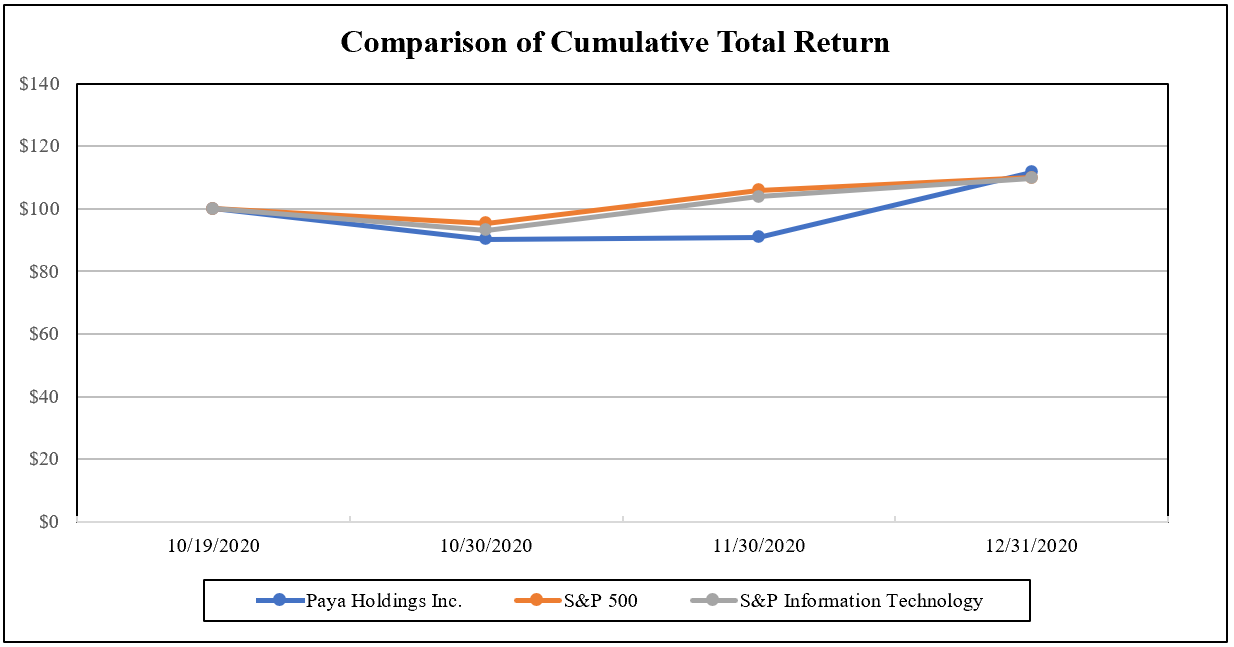
52
| Paya Holdings Inc. | S&P 500 | S&P Information Technology | ||||||||||||||||||
| October 19, 2020 | $ | 100.00 | $ | 100.00 | $ | 100.00 | ||||||||||||||
| October 30, 2020 | 90.29 | 95.45 | 93.22 | |||||||||||||||||
| November 30, 2020 | 90.86 | 105.90 | 103.83 | |||||||||||||||||
| December 31, 2020 | 111.77 | 109.97 | 109.77 | |||||||||||||||||
Unregistered Sales of Equity Securities and Use of Proceeds
None.
Issuer Purchases of Equity Securities
None.
Securities Authorized for Issuance under Equity Compensation Plans
On December 22, 2020, the Company adopted the Paya Holdings Inc. Omnibus Incentive Plan, which allows for issuance of up to 8,800,000 shares of its common stock. The purpose of the plan is to enhance the profitability and value of the Company for the benefit of its stockholders by enabling the Company to offer eligible individual stock and cash-based incentives in order to attract, retain, and reward such individuals and strengthen the mutuality of interest between such individuals and the stockholders. Under the Omnibus Incentive Plan, the Company may grant stock options, stock appreciation rights, restricted shares, performance awards, and other stock-based and cash-based awards to eligible employees, consultants or non-employee directors of the Company. As of December 31, 2020, the Company had two stock-based compensation award types granted and outstanding: restricted stock units (RSUs) and stock options.
53
Item 6. Selected Financial Data
The following selected historical financial information should be read together with the audited consolidated financial statements and accompanying notes (located in Part II, Item 8 within this Annual Report on Form 10-K) and “Management’s Discussion and Analysis of Financial Condition and Results of Operations” located in Part II, Item 7 within this Annual Report on Form 10-K. The selected historical financial information in this section is not intended to replace the Company’s consolidated financial statements and related notes. The Company’s historical results are not necessarily indicative of the Company’s future results, and the Company’s results as of the year ended December 31, 2020 are not necessarily indicative of future results.
| For the year ended | ||||||||||||||||||||
| (In thousands except shares) | December 31, 2020 | December 31, 2019 | December 31, 2018 | |||||||||||||||||
| Income Statement Data: | ||||||||||||||||||||
| Revenue | $ | 206,048 | $ | 203,374 | $ | 185,078 | ||||||||||||||
| Cost of services exclusive of depreciation and amortization | (102,119) | (101,564) | (96,027) | |||||||||||||||||
| Income (loss) from operations | 16,332 | 9,431 | 6,329 | |||||||||||||||||
| Interest expense | (17,637) | (20,043) | (13,630) | |||||||||||||||||
| Income tax benefit (expense) | (433) | 2,420 | 3,879 | |||||||||||||||||
| Net income (loss) | $ | (524) | $ | (9,024) | $ | (3,318) | ||||||||||||||
| Less: Net loss attributable to non-controlling interests | — | — | (148) | |||||||||||||||||
| Net income (loss) attributable to Paya Holdings, Inc. | $ | (524) | $ | (9,024) | $ | (3,170) | ||||||||||||||
| Balance Sheet Data (at period end): | ||||||||||||||||||||
| Cash and cash equivalents | $ | 23,617 | $ | 25,957 | $ | 14,164 | ||||||||||||||
| Total assets | 475,341 | 483,695 | 495,451 | |||||||||||||||||
| Total liabilities | 359,309 | 349,331 | 359,366 | |||||||||||||||||
| Total stockholder’s equity | 116,032 | 134,364 | 136,085 | |||||||||||||||||
54
Item 7. Management’s Discussion and Analysis of Financial Condition and Results of Operations
The following Management Discussion and Analysis of Financial Condition and Results of Operations (“MD&A”) summarizes the significant factors affecting the consolidated operating results, financial condition, liquidity and capital resources of Paya Holdings Inc. and is intended to help the reader understand Paya Holdings Inc., our operations and our present business environment. This discussion should be read in conjunction with the Company’s audited consolidated financial statements and notes to those statements included in Part II, Item 8 within this Annual Report on Form 10-K. References to “we,” “us,” “our”, “Paya”, “Paya Holdings”, or “the Company” refer to Paya Holdings Inc. and its consolidated subsidiaries.
Overview
We are a leading independent integrated payments platform providing card, ACH, and check payment processing solutions via software to middle-market businesses in the United States. Our solutions integrate with customers’ core business software to enable payments acceptance, reconcile invoice detail, and post payment information to their core accounting system. In this manner, we enable our customers to collect revenue from their B2C and B2B customers with a seamless experience and high-level of security across payment types.
Recent Developments
On October 16, 2020, we completed the previously announced business combination with FinTech Acquisition Corp III and completed the transition to becoming a publicly traded company. Our common stock began trading on the Nasdaq Capital Market on October 19, 2020.
During October 2020, we completed the previously announced acquisition of The Payment Group (“TPG”). We plan to integrate TPG’s online billing and software applications into Paya Connect. This will enhance our suite of integration tools, as well as the commerce solutions Paya Connect is able to provide to Paya’s partners and their clients.
Impact of the COVID-19 Pandemic
The COVID-19 pandemic and subsequent shelter-in-place and social distancing policies, as well as the broader economic decline, had a material impact on our business in 2020. Many of our customers experienced a decline in transaction volumes from pre COVID-19 levels. However, given many of our customers leverage our payment technology to accept transactions in a card-not-present environment, their business operations were not impacted dramatically. Further, most of our recurring or contractual transactions are B2B and not tied to consumer discretionary spend and, as such, were not significantly impacted. This was evident by stable or growing volumes in our B2B Goods & Services, Government & Utilities, and Non-Profit verticals. Lastly, we benefited from our lack of concentration in end markets which saw steep declines, such as restaurants, travel, hospitality, and brick-and-mortar retail.
In response to these developments, we took precautionary measures to ensure the safety of our employees, support our customers, and mitigate the impact on our financial position and operations. We seamlessly implemented remote working capabilities for our entire organization with minimal disruption to our operations or key operating performance indicators. We also identified opportunistic expense reductions which increased operating efficiencies and provided additional profitability in the period.
While our business was impacted by the COVID-19 pandemic, we have demonstrated resilience due to our portfolio of attractive, less-cyclical end markets. The impact that COVID-19 will have on our consolidated results of operations in 2021 remains uncertain. While we have not seen a meaningful degradation in new customer enrollment or an increase in existing customer attrition as a result of COVID-19, it is possible that those business trends change if economic hardship across the country forces new or additional business closures or other detrimental actions. We will continue to evaluate the nature and extent of these potential impacts to our business, consolidated results of operations, and liquidity.
55
Factors Affecting Results of Operations
Factors impacting our business, results of operations, and forecasts
A number of factors impact our business, results of operations, financial condition, and forecasts, including, but not limited to, the following:
•Increased adoption of integrated payments solutions. We generate revenue through volume-based rates and per item fees attributable to payment transactions between our customers and their customers. We expect to grow our customer base by bringing on new software partners, continuing to sell payment capabilities to customers of our existing software partners not yet leveraging our payment integrations, and by adding integrations within existing multi-platform software partners to access additional customer bases. Further, we expect to benefit from the natural growth of our partners who are typically growing franchises within their respective verticals.
•Acquisition, retention, and growth of software partnerships. Paya leverages a partner-first distribution network to grow our client base and payment volume. Continuing to innovate and deliver new commerce products and wraparound services is critical to our ability to attract, retain, and grow relationships with software partners in our Paya verticals and adjacent markets.
•Growth in customer life-time value. We benefit from, and aid-in, the growth of online electronic payment transactions to our customers. This is dependent on the sales growth of the customers’ businesses, the overall adoption of online payment methods by their customer bases, and the adoption of our additional integrated payment modules such as our proprietary ACH capabilities. Leveraging these solutions helps drive increased customer retention, as well as higher volume and revenue per customer.
•Pursuit and integration of strategic acquisitions. We look to opportunistically make strategic acquisitions to enhance our scale, expand into new verticals, add product capabilities, and embed payments in vertical software. These acquisitions are intended to increase the long-term growth of the business, while helping us achieve greater scale, but may increase operating expenses in the short-term until full synergies are realized.
•Economic conditions. Changes in macro-level consumer spending trends, including those related to COVID-19, could affect the amount of volumes processed on our platform, thus resulting in fluctuations to our revenue streams.
Key Components of Revenue and Expenses
The period to period comparisons of our results of operations have been prepared using the historical periods included in our consolidated financial statements. The following discussion should be read in conjunction with the consolidated financial statements and related notes included elsewhere in this document.
Revenue
The Company’s business model provides payment services, credit and debit card processing, and ACH processing to customers through enterprise or vertically focused software partners, direct sales, reseller partners, other referral partners, and a limited number of financial institutions. The Company recognizes processing revenues at the time customer transactions are processed and periodic fees over the period the service is performed. Transaction based revenue represents revenue generated from transaction fees based on volume and are recognized on a net basis. Service based fee revenue is generated from charging a service fee, a fee charged to the client for facilitating bankcard processing, which are recognized on a gross basis.
Cost of services
Cost of services includes card processing costs, ACH costs, other fees paid to card networks, and equipment expenses directly attributable to payment processing and related services to customers. These costs are recognized as incurred. Cost of services also includes revenue share amounts paid to reseller and referral partners and are calculated monthly based on monthly customer activity. These expenses are recognized as transactions are
56
processed. Accrued revenue share represents amounts earned during the month but not yet paid at the end of the period.
Selling general & administrative
Selling, general and administrative expenses consist primarily of salaries, wages, commissions, marketing costs, professional services costs, technology costs, occupancy costs of leased space, and bad debt expense. Stock based compensation expense is also included in this category.
Depreciation & Amortization
Depreciation and amortization consist primarily of amortization of intangible assets, including customer relationships, internally developed software, acquired customer lists, trade names, and to a lesser extent, depreciation on our investments in property, equipment, and software. We depreciate and amortize our assets on a straight-line basis. These lives are 3 years for computers and equipment and acquired internal-use software, 5 years for furniture, fixtures, and office equipment, and the lesser of the asset useful life or remaining lease term for leasehold improvements. Repair and maintenance costs are expensed as incurred and included in selling, general and administrative expenses on the consolidated statements of income and other comprehensive income. Customer lists are amortized over a period of 5-15 years depending on the intangible, developed technology 3-5 years, and trade names over 25 years.
Results of Operations
The period to period comparisons of our results of operations have been prepared using the historical periods included in our audited consolidated financial statements. The following discussion should be read in conjunction with the audited consolidated financial statements and related notes included elsewhere in this document.
Year Ended December 31, 2020 Compared to Year Ended December 31, 2019
| (in millions) | Amount of | % Change | |||||||||||||||||||||
| For the Years Ended | Increase | Favorable | |||||||||||||||||||||
| December 31, | (Decrease) | (Unfavorable) | |||||||||||||||||||||
| 2020 | 2019 | 2020 vs. 2019 | 2020 vs. 2019 | ||||||||||||||||||||
| Revenue | $ | 206.0 | $ | 203.4 | $ | 2.6 | 1.3 | % | |||||||||||||||
| Cost of services exclusive of depreciation and amortization | (102.1) | (101.6) | (0.5) | (0.5 | %) | ||||||||||||||||||
| Selling, general & administrative expenses | (63.0) | (69.9) | 6.9 | 9.9 | % | ||||||||||||||||||
| Depreciation and amortization | (24.6) | (22.4) | (2.2) | (9.8 | %) | ||||||||||||||||||
| Income from operations | 16.3 | 9.5 | 6.8 | 71.6 | % | ||||||||||||||||||
| Other income (expense) | |||||||||||||||||||||||
| Interest expense | (17.6) | (20.1) | 2.5 | 12.4 | % | ||||||||||||||||||
| Other income (expense) | 1.2 | (0.8) | 2.0 | 250.0 | % | ||||||||||||||||||
| Total other income (expense) | (16.4) | (20.9) | 4.5 | 21.5 | % | ||||||||||||||||||
| Loss before income taxes | (0.1) | (11.4) | 11.3 | 99.1 | % | ||||||||||||||||||
| Income tax (expense) benefit | (0.4) | 2.4 | (2.8) | 116.7 | % | ||||||||||||||||||
| Net loss | (0.5) | (9.0) | 8.5 | 94.4 | % | ||||||||||||||||||
57
Comparison of Years Ended December 31, 2020 and 2019
Revenue
Revenue increased by $2.6, or 1.3%, to $206.0 for the year ended December 31, 2020 from $203.4 for the year ended December 31, 2019. The increase was driven by the Integrated Solutions segment, increasing $2.5 or 2.1%. The increase in Integrated Solutions revenue was driven primarily by increased volume from both new and existing customers.
Cost of services exclusive of depreciation and amortization
Cost of services increased by $0.5 or 0.5%, to $102.1 for year ended December 31, 2020 from $101.6 for the year ended December 31, 2019. In addition, these expenses decreased as a percentage of revenue by 0.4% driven by lower revenue share expense as a percentage of revenue offset by higher third-party processing costs.
Selling, general & administrative
Selling, general, & administrative expenses decreased by $6.9, or 9.9%, to $63.0 for the year ended December 31, 2020 from $69.9 for the year ended December 31, 2019. The decrease is primarily due to lower transaction related expenses of $2.3, in addition to $2.0 lower restructuring costs, $2.2 lower employee compensation expense and $1.5 in lower travel related expenses compared to the year ended December 31, 2020. This decrease was offset by a $1.0 increase in technology related costs, specifically hosting, and a $0.9 increase in business combination costs.
Depreciation and amortization
Depreciation and amortization increased by $2.2, or 9.8%, to $24.6 for the year ended December 31, 2020 as compared to $22.4 for the year ended December 31, 2019. The increase is primarily attributable to capitalized internally developed software being placed in service along with increased acquisitions of customer lists in 2020.
Interest Expense
Interest expense decreased by $2.5, or 12.4%, to $17.6 for the year ended December 31, 2020 from $20.1 for the year ended December 31, 2019, primarily due to lower LIBOR based interest rates on the Revolver and Term Loan credit facilities.
Other Income (Expense)
Other income was $1.2 for the year ended December 31, 2020 and other expense was $(0.8) for the year ended December 31, 2019. The change period over period is primarily attributable to a $1.2 gain on the value of the tax receivable agreement liability in 2020 and to the write-off of liabilities related to contingent consideration from the acquisition of First Billing Services in 2019.
58
Year Ended December 31, 2019 Compared to Year Ended December 31, 2018
| (in millions) | Amount of | % Change | |||||||||||||||||||||
| For the Years Ended | Increase | Favorable | |||||||||||||||||||||
| December 31, | (Decrease) | (Unfavorable) | |||||||||||||||||||||
| 2019 | 2018 | 2019 vs. 2018 | 2019 vs. 2018 | ||||||||||||||||||||
| Revenue | $ | 203.4 | $ | 185.1 | $ | 18.3 | 9.9 | % | |||||||||||||||
| Cost of services exclusive of depreciation and amortization | (101.6) | (96.0) | (5.6) | (5.8) | % | ||||||||||||||||||
| Selling, general & administrative expenses | (69.9) | (64.5) | (5.4) | (8.4) | % | ||||||||||||||||||
| Depreciation and amortization | (22.4) | (18.3) | (4.1) | (22.4) | % | ||||||||||||||||||
| Income from operations | 9.5 | 6.3 | 3.2 | 50.8 | % | ||||||||||||||||||
| Other income (expense) | |||||||||||||||||||||||
| Interest expense | (20.1) | (13.6) | (6.5) | (47.8) | % | ||||||||||||||||||
| Other income (expense) | (0.8) | 0.1 | (0.9) | (900.0) | % | ||||||||||||||||||
| Total other income (expense) | (20.9) | (13.5) | (7.4) | (54.8) | % | ||||||||||||||||||
| Loss before income taxes | (11.4) | (7.2) | (4.2) | (58.3) | % | ||||||||||||||||||
| Income tax benefit | 2.4 | 3.9 | (1.5) | (38.5) | % | ||||||||||||||||||
| Net loss | (9.0) | (3.3) | (5.7) | (172.7) | % | ||||||||||||||||||
| Less: Net loss attributable to non-controlling interests | — | (0.1) | 0.1 | 100.0 | % | ||||||||||||||||||
| Net loss attributable to Paya Holdings, Inc. | $ | (9.0) | $ | (3.2) | $ | (5.8) | (181.3) | % | |||||||||||||||
Comparison of the Years Ended December 31, 2019 and 2018
For discussion of the comparison of our operating results for the years ended December 31, 2019 and 2018, please read section entitled “Management’s Discussion and Analysis of Financial Condition and Results of Operations” included in our Current Report on Form S-1 filed with the Securities and Exchange Commission on November 10, 2020 and is incorporated herein by reference.
Key performance indicators and non-GAAP Financial Measures
Our management uses a variety of financial and operating metrics to evaluate our business, analyze our performance, and make strategic decisions. We believe these metrics and non-GAAP financial measures provide useful information to investors and others in understanding and evaluating our operating results in the same manner as management. However, these measures are not financial measures calculated in accordance with GAAP and should not be considered as substitutes for financial measures that have been calculated in accordance with GAAP. We primarily review the following key performance indicators and non-GAAP measures when assessing our performance:
Revenue
We analyze our revenues by comparing actual revenues to our internal projections for a given period and to prior periods to assess our performance. We believe that revenues are a meaningful indicator of the demand and pricing
59
for our services. Key drivers to change in revenues are primarily by the dollar volume, basis point spread earned, and number of transactions processed in a given period.
Payment Volume
Payment volume is defined as the total dollar amount of all payments processed by our customers through our services. Volumes for the years ended December 31 are shown in the table below:
| For the years ended | |||||||||||||||||
| December 31, | |||||||||||||||||
| (in millions) | 2020 | 2019 | 2018 | ||||||||||||||
| Payment volumes | $ | 33,272.4 | $ | 31,408.0 | $ | 28,924.6 | |||||||||||
Adjusted EBITDA
Adjusted EBITDA is a non-GAAP financial measure that represents earnings before interest and other expense, income taxes, depreciation, and amortization, or EBITDA and further adjustments to EBITDA to exclude certain non-cash items and other non-recurring items that we believes are not indicative of ongoing operations to come to Adjusted EBITDA.
We disclose EBITDA, Adjusted EBITDA, and Adjusted Net Income in this document because these non-GAAP measures are key measures used by us to evaluate our business, measure our operating performance and make strategic decisions. We believe EBITDA, Adjusted EBITDA, and Adjusted Net Income are useful for investors and others in understanding and evaluating our operations results in the same manner as us. However, EBITDA, Adjusted EBITDA, and Adjusted Net Income are not financial measures calculated in accordance with GAAP and should not be considered as a substitute for net income, income before income taxes, or any other operating performance measure calculated in accordance with GAAP. Using these non-GAAP financial measures to analyze our business would have material limitations because the calculations are based on the subjective determination of management regarding the nature and classification of events and circumstances that investors may find significant. In addition, although other companies in our industry may report measures titled EBITDA, Adjusted EBITDA and Adjusted Net Income or similar measures, such non-GAAP financial measures may be calculated differently from how we calculate non-GAAP financial measures, which reduces their overall usefulness as comparative measures. Because of these limitations, you should consider EBITDA, Adjusted EBITDA, and Adjusted Net Income alongside other financial performance measures, including net income and our other financial results presented in accordance with GAAP. The following table presents a reconciliation of net income to EBITDA and Adjusted EBITDA for each of the periods indicated:
60
Adjusted EBITDA for the years ended December 31, 2020, 2019 and 2018:
| For the year ended | |||||||||||||||||
| (in millions) | December 31, 2020 | December 31, 2019 | December 31, 2018 | ||||||||||||||
| Net loss | $ | (0.5) | $ | (9.0) | $ | (3.3) | |||||||||||
| Depreciation & amortization | 24.6 | 22.4 | 18.3 | ||||||||||||||
| Income tax benefit (expense) | 0.4 | (2.4) | (3.9) | ||||||||||||||
| Interest and other expense | 16.4 | 20.9 | 13.5 | ||||||||||||||
| EBITDA | 40.9 | 31.9 | 24.6 | ||||||||||||||
Transaction-related expenses(a) | 4.6 | 6.9 | 1.0 | ||||||||||||||
Stock based compensation(b) | 1.9 | 2.3 | 1.3 | ||||||||||||||
Restructuring costs(c) | 2.0 | 4.0 | 1.6 | ||||||||||||||
Discontinued service costs(d) | 0.3 | 2.3 | 2.2 | ||||||||||||||
Management fees and expenses(e) | 0.9 | 1.1 | 1.2 | ||||||||||||||
Sage carve-out expenses(f) | — | 1.0 | 9.5 | ||||||||||||||
Business combination costs(g) | 0.9 | — | — | ||||||||||||||
Other costs(h) | 1.5 | 0.8 | 0.8 | ||||||||||||||
| Total adjustments | 12.1 | 18.4 | 17.6 | ||||||||||||||
| Adjusted EBITDA | $ | 53.0 | $ | 50.3 | $ | 42.2 | |||||||||||
(a)Represents professional service fees related to mergers and acquisitions such as legal fees, consulting fees, accounting advisory fees, and other costs.
(b)Represents non-cash charges associated with stock-based compensation expense, which has been, and will continue to be for the foreseeable future, a significant recurring expense in our business and an important part of our compensation strategy
(c)Costs associated with restructuring plans designed to streamline operations and reduce costs including costs associated with the relocation of headquarters from Reston, VA to Atlanta, GA and certain staff restructuring charges, including severance.
(d)Represents costs incurred to retire certain tools, applications and services that are no longer in use.
(e)Represents advisory fees that we will not be required to pay going forward. See notes to our consolidated financial statements included elsewhere in this document for more information about these related party transactions.
(f)Expenses related to carving out the entity from former corporate owner Sage PLC including rebranding, technology implementation, consulting and transitional service agreement expenses.
(g)Represents business combination costs.
(h)Represents non-operational gains or losses, non-standard project expense, non-operational legal expense and other.
Adjusted Net Income
Adjusted Net Income is a non-GAAP financial measure that represents net income prior to amortization and further adjustments to exclude certain non-cash items and other non-recurring items that management believes are not indicative of ongoing operations to come to Adjusted Net Income.
61
Adjusted Net Income for the years ended December 31, 2020, 2019 and 2018:
| For the year ended | |||||||||||||||||
| (in millions) | December 31, 2020 | December 31, 2019 | December 31, 2018 | ||||||||||||||
| Net loss | $ | (0.5) | $ | (9.0) | $ | (3.3) | |||||||||||
| Amortization add back | 20.7 | 19.7 | 16.9 | ||||||||||||||
Transaction-related expenses(a) | 4.6 | 6.9 | 1.0 | ||||||||||||||
Stock based compensation(b) | 1.9 | 2.3 | 1.3 | ||||||||||||||
Restructuring costs(c) | 2.0 | 4.0 | 1.6 | ||||||||||||||
Discontinued service costs(d) | 0.3 | 2.3 | 2.2 | ||||||||||||||
Management fees and expenses(e) | 0.9 | 1.1 | 1.2 | ||||||||||||||
Sage carve-out expenses(f) | — | 1.0 | 9.5 | ||||||||||||||
Business combination costs(g) | 0.9 | — | — | ||||||||||||||
Other costs(h) | 1.5 | 0.8 | 0.8 | ||||||||||||||
| Total adjustments | 32.8 | 38.1 | 34.5 | ||||||||||||||
| Adjusted Net Income | $ | 32.3 | $ | 29.1 | $ | 31.2 | |||||||||||
(a)Represents professional service fees related to mergers and acquisitions such as legal fees, consulting fees, accounting advisory fees, and other costs.
(b)Represents non-cash charges associated with stock-based compensation expense, which has been, and will continue to be for the foreseeable future, a significant recurring expense in our business and an important part of our compensation strategy.
(c)Costs associated with restructuring plans designed to streamline operations and reduce costs including costs associated with the relocation of headquarters from Reston, VA to Atlanta, GA and certain staff restructuring charges, including severance.
(d)Represents costs incurred to retire certain tools, applications and services that are no longer in use.
(e)Represents advisory fees that we will not be required to pay going forward. See notes to our consolidated financial statements included elsewhere in this document for more information about these related party transactions.
(f)Expenses related to carving out the entity from former Corporate owner Sage PLC including rebranding, technology implementation, consulting and transitional service agreement expenses.
(g)Represents business combination costs.
(h)Represents non-operational gains or losses, non-standard project expense, non-operational legal expense and other.
Segments
We provide our services through two reportable segments 1) Integrated Solutions and 2) Payment Services. The Company’s reportable segments are the same as the operating segments.
More information about our two reportable segments:
•Integrated Solutions — Our Integrated Solutions segment represents the delivery of our credit and debit card payment solutions, and to a lesser extent, ACH processing solutions to customers via integrations with software partners across our strategic vertical markets. Our Integrated Solutions partners include vertical focused front-end Customer Relationship Management software providers as well as back-end Enterprise Resource Planning and accounting solutions.
•Payment Services — Our Payment Services segment represents the delivery of card payment processing solutions to our customers through resellers, as well as ACH, check, and gift card processing. Card payment processing solutions in this segment do not originate via a software integration but still utilize Paya’s core technology infrastructure. ACH, check, and gift card processing may or may not be integrated with third-party software.
62
All segment revenue is from external customers.
The following table shows our segment income statement data and selected performance measures for the periods indicated:
Year Ended December 31, 2020 Compared to Year Ended December 31, 2019
| For the year ended | Change | |||||||||||||||||||||||||
| (in millions, except for percentages) | December 31, 2020 | December 31, 2019 | Amount | % | ||||||||||||||||||||||
| Integrated Solutions | ||||||||||||||||||||||||||
| Segment revenue | $ | 122.3 | $ | 119.8 | $ | 2.5 | 2.1 | % | ||||||||||||||||||
Segment gross profit(1) | $ | 65.3 | $ | 62.7 | $ | 2.6 | 4.1 | % | ||||||||||||||||||
| Segment gross profit margin | 53.4 | % | 52.3 | % | ||||||||||||||||||||||
| Payment Services | ||||||||||||||||||||||||||
| Segment revenue | $ | 83.7 | $ | 83.6 | $ | 0.1 | 0.1 | % | ||||||||||||||||||
Segment gross profit(1) | $ | 38.7 | $ | 39.1 | $ | (0.4) | (1.0 | %) | ||||||||||||||||||
| Segment gross profit margin | 46.2 | % | 46.8 | % | ||||||||||||||||||||||
(1)Segment gross profit is revenue less cost of services excluding depreciation and amortization
Comparison of Years Ended December 31, 2020 and 2019
Integrated Solutions
Revenue for the Integrated Solutions segment was $122.3 for the year ended December 31, 2020 as compared to $119.8 for the year ended December 31, 2019. The increase of $2.5 was due to an increase in payment volume.
Gross profit for the Integrated Solutions segment was $65.3 resulting in a gross profit margin of 53.4% for the year ended December 31, 2020 as compared to $62.7 with a gross profit margin of 52.3% for the year ended December 31, 2019. The increase of $2.6, or 1.1% improvement in segment gross profit margin, was due to revenue growth and a decrease in revenue share due to a mix shift towards lower revenue share partners, partially offset by higher transaction related processing costs.
Payment Services
Revenue for the Payment Services segment was $83.7 for the year ended December 31, 2020 as compared to $83.6 for the year ended December 31, 2019.
Gross profit for the Payment Services segment was $38.7 for the year ended December 31, 2020 as compared to $39.1 for the year ended December 31, 2019. The decrease of $0.4, or 0.6% decline in segment gross profit margin was due to lower card revenue and an increase in revenue share due to a mix shift to higher revenue share partners, partially offset by higher ACH revenue.
63
Year Ended December 31, 2019 Compared to Year Ended December 31, 2018
| For the year ended | Change | |||||||||||||||||||||||||
| (in millions, except for percentages) | December 31, 2019 | December 31, 2018 | Amount | % | ||||||||||||||||||||||
| Integrated Solutions | ||||||||||||||||||||||||||
| Segment revenue | $ | 119.8 | $ | 100.3 | $ | 19.5 | 19.4 | % | ||||||||||||||||||
Segment gross profit(1) | $ | 62.7 | $ | 49.8 | $ | 12.9 | 25.9 | % | ||||||||||||||||||
| Segment gross profit margin | 52.3 | % | 49.7 | % | ||||||||||||||||||||||
| Payment Services | ||||||||||||||||||||||||||
| Segment revenue | $ | 83.6 | $ | 84.8 | $ | (1.2) | (1.4 | %) | ||||||||||||||||||
Segment gross profit(1) | $ | 39.1 | $ | 39.2 | $ | (0.1) | (0.3 | %) | ||||||||||||||||||
| Segment gross profit margin | 46.8 | % | 46.2 | % | ||||||||||||||||||||||
(1)Segment gross profit is revenue less cost of services excluding depreciation and amortization
Comparison of the Years Ended December 31, 2019 and 2018
For discussion of the comparison of our operating results for the years ended December 31, 2019 and 2018, please read section entitled “Management’s Discussion and Analysis of Financial Condition and Results of Operations” included in our Current Report on Form S-1 filed with the Securities and Exchange Commission on November 10, 2020 and is incorporated herein by reference.
Liquidity and Capital Resources
Overview
We have historically sourced our liquidity requirements primarily with cash flow from operations and, when needed, with borrowings under our Credit Facilities. We have historically sourced our acquisitions with cash flow from operations, and when needed, with capital infusions from Ultra and borrowings under our Credit Facilities. As of December 31, 2020, we had $23.6 of cash and cash equivalents on hand and borrowing capacity of $25.0 from our revolving Credit Facility.
The following tables present a summary of cash flows from operating, investing and financing activities for the following comparative periods.
| Year ended | |||||||||||||||||
| December 31, | |||||||||||||||||
| 2020 | 2019 | 2018 | |||||||||||||||
| (in millions) | |||||||||||||||||
| Net cash provided (used) by operating activities | $ | 21.3 | $ | 23.9 | $ | 4.8 | |||||||||||
| Net cash provided (used) by investing activities | (33.1) | (8.1) | (66.0) | ||||||||||||||
| Net cash provided (used) by financing activities | 9.5 | (4.0) | 63.1 | ||||||||||||||
| Change in cash | $ | (2.3) | $ | 11.8 | $ | 1.9 | |||||||||||
64
Comparison of Years Ended December 31, 2020 and 2019
Operating Activities
Net cash provided by operating activities decreased $2.6 to $21.3 for the year ended December 31, 2020 compared to $23.9 for the year ended December 31, 2019. The decrease in operating cash in 2020 was partially driven by payments for professional services in preparation for the business combination and additional payments in the fourth quarter for additional costs as a public company.
Investing Activities
Net cash used in investing activities increased $25.0 to $33.1 in the year ended December 31, 2020 from $8.1 in the year ended December 31, 2019. The decrease was primarily due to cash paid for the purchase of The Payment Group of $19.9 net of cash received of $2.3. We used $6.6 for capital expenditures and capitalization of internal use software along with $6.6 for the purchase of customer lists in the year ended December 31, 2020. In the year ended December 31, 2019 we used $5.2 for capital expenditures and capitalization of internal use software and $2.5 for customer lists.
Financing Activities
Net cash used in financing activities increased $13.5 to a provided by of $9.5 for the year ended December 31, 2020 compared to cash used by financing activities of $4.0 in the year ended December 31, 2019. This increase was primarily due to capital contributions from Ultra of $12.2 in addition to $3.1 received from the Business Combination to fund transaction related costs, offset by $2.9 paid for debt issuance costs related to the Credit Agreement amendment in July 2020.
Comparison of the Years Ended December 31, 2019 and 2018
For discussion of the comparison of our operating results for the years ended December 31, 2019 and 2018, please read section entitled “Management’s Discussion and Analysis of Financial Condition and Results of Operations” included in our Current Report on Form S-1 filed with the Securities and Exchange Commission on November 10, 2020 and is incorporated herein by reference.
Indebtedness
On August 1, 2017, Paya, Inc., as borrower, and certain affiliates thereof entered into a credit agreement (the “Credit Agreement”) under which Paya, Inc. obtained a $150.5 term loan facility (the “Term Loan”) and a $25.0 revolving credit facility (the “Revolver”).
In December 2018, Paya, Inc. amended the Credit Agreement, and Ultra III, a wholly owned subsidiary of the Company, thereby assumed all of Paya, Inc.’s rights and obligations as “Borrower” under the Credit Agreement and related documents. Additionally, as part of the amendment, the Company incurred incremental debt, increasing the Term Loan by $85.0.
The Company makes quarterly amortization payments on the Term Loan. As of December 31, 2020, $228.7 remains outstanding under the Term Loan.
The Company’s senior secured first lien net leverage ratio, calculated pursuant to the definitions in the Credit Agreement, was 3.86x on December 31, 2020. The maximum ratio permitted by the financial covenant in the Credit Agreement is 7.25x for December 31, 2020.
On July 24, 2020, the Company amended the Credit Agreement to, among other things, extend the maturity of the Revolver to July 24, 2025 and the maturity of the Term Loan to August 1, 2027.
65
Contractual Obligations
In the ordinary course of business, we enter into various contractual obligations for varying terms and amounts. The following table sets forth our contractual obligations and commitments for the periods indicated as of December 31, 2020:
| Payments due by period | ||||||||||||||||||||||||||||||||
| (in millions) | Total | 1 year | 2 – 3 years | 4 – 5 years | More than 5 years | |||||||||||||||||||||||||||
Long-term debt(1) | $ | 228.7 | $ | 2.4 | $ | 4.7 | $ | 4.7 | $ | 216.9 | ||||||||||||||||||||||
Interest on long-term debt(2) | $ | 91.0 | $ | 14.2 | $ | 28.0 | $ | 27.5 | $ | 21.3 | ||||||||||||||||||||||
Operating leases(3) | $ | 6.3 | $ | 1.3 | $ | 2.5 | $ | 1.9 | $ | 0.6 | ||||||||||||||||||||||
(1)Reflects contractual principal payments. The Term Loan was amended on July 24, 2020, which extended the maturity from August 1, 2024 to August 1, 2027.
(2)Reflects minimum interest payable under the Term Loan. In July 2018, the interest rate was reduced to LIBOR (with a floor of 1.00%) plus a margin of 5.25% and remained unchanged at December 31, 2020. Due to historical fluctuations in the LIBOR rate, we have assumed a LIBOR rate of 1.00% for purposes of calculating interest payable on the Term Loan. Payments herein are subject to change as payments for variable rate debt have been estimated.
(3)We lease certain property and equipment for various periods under non-cancelable operating leases.
Off-Balance Sheet Arrangements
We have no off-balance sheet arrangements that have or are reasonably likely to have a current or future material effect on our financial condition, changes in financial condition, revenues or expenses, results of operations, liquidity, capital expenditures or capital resources.
During the periods presented, we did not engage in any off-balance sheet financing activities other than those reflected in the notes to our consolidated financial statements included elsewhere in this 10-K.
Critical Accounting Policies and Estimates
Our discussion and analysis of our historical financial condition and results of operations for the periods described is based on our consolidated financial statements, which have been prepared in accordance with U.S. GAAP. For a discussion of the significant accounting policies and estimates that we use in the preparation of our audited consolidated financial statements, refer to Note 1 of the notes to our audited consolidated financial statements included in Part II, Item 8 within this Annual Report on Form 10-K. The preparation of these historical financial statements in conformity with U.S. GAAP requires management to make estimates, assumptions and judgments in certain circumstances that affect the reported amounts of assets, liabilities and contingencies as of the date of the financial statements and the reported amounts of revenue and expenses during the reporting periods. We evaluate our assumptions and estimates on an ongoing basis. We base our estimates on historical experience and on various other assumptions that are believed to be reasonable under the circumstances. These estimates may change as new events occur or additional information is obtained, and we may periodically be faced with uncertainties, the outcomes of which are not within its control and may not be known for a prolonged period of time. Because the use of estimates is inherent in the financial reporting process, actual results may differ from these estimates under different assumptions or conditions. Additionally, the full impact of COVID-19 is unknown and cannot be reasonably estimated.
The following critical accounting discussion pertains to accounting policies we believe are most critical to the portrayal of our historical financial condition and results of operations and that require significant, difficult, subjective or complex judgments.
66
Revenue Recognition
Application of the accounting principles in U.S. GAAP related to the measurement and recognition of revenue requires us to make judgments and estimates. Complex arrangements with nonstandard terms and conditions may require significant contract interpretation to determine the appropriate accounting. Specifically, the determination of whether we are a principal to a transaction, or an agent, can require considerable judgment. We have concluded that we are the agent in providing merchants access to credit card networks as we are performing this service on behalf of the principal, the card companies. In addition, we are not primarily responsible for fulfilling this promise to the customer, do not bear risk or take possession of funds to be paid to issuing banks for interchange fees, and do not have discretion in setting the price for interchange fees charged by the card companies. For all other aspects of our services provided to merchants, we determined we are the principal as we control the service being provided before transfer to the customer. Additionally, our payment processing services consist of variable consideration under a stand-ready service of distinct days of service that are substantially the same with the same pattern of transfer to the customer. The variable consideration is as a result of the number or volume of transactions to be processed.
We determined to use each day as a time-based measure of progress toward satisfaction of the single performance obligation of each contract. We determined this method most accurately depicts the pattern by which services are transferred to the merchant, as performance depends on the extent of transactions processed for that merchant on a given day. Likewise, consideration to which we expect to be entitled is determined according to our efforts to provide service each day. Changes in judgments with respect to these assumptions and estimates could impact the amount of revenue recognized.
Business Combinations
Upon acquisition of a company, we determine if the transaction is a business combination, which is accounted for using the acquisition method of accounting. Under the acquisition method, once control is obtained of a business, the assets acquired, and liabilities assumed, including amounts attributed to noncontrolling interests, are recorded at fair value. We use our best estimates and assumptions to assign fair value to the tangible and intangible assets acquired and liabilities assumed at the acquisition date. One of the most significant estimates relates to the determination of the fair value of these assets and liabilities. The determination of the fair values is based on estimates and judgments made by management. Our estimates of fair value are based upon assumptions we believe to be reasonable, but which are inherently uncertain and unpredictable. Measurement period adjustments are reflected at the time identified, up through the conclusion of the measurement period, which is the time at which all information for determination of the values of assets acquired and liabilities assumed is received and is not to exceed one year from the acquisition date. We may record adjustments to the fair value of these tangible and intangible assets acquired and liabilities assumed, with the corresponding offset to goodwill.
Additionally, uncertain tax positions and tax-related valuation allowances are initially recorded in connection with a business combination as of the acquisition date. We continue to collect information and reevaluate these estimates and assumptions periodically and record any adjustments to preliminary estimates to goodwill, provided we are within the measurement period. If outside of the measurement period, any subsequent adjustments are recorded to the consolidated statement of income and other comprehensive income.
Income Taxes
Under ASC 740, “Income Taxes,” deferred tax assets and liabilities are recognized for the expected future tax consequences attributable to net operating losses, tax credits, and temporary differences between the financial statement carrying amounts of existing assets and liabilities and their respective tax bases, which will result in taxable or deductible amounts in the future. Our income tax expense/benefit, deferred tax assets and tax receivable liability reflect management’s best assessment of estimated current and future taxes. Significant judgments and estimates are required in determining the consolidated income tax expense/benefits, deferred tax assets and tax receivable agreement liability. In evaluating our ability to recover our deferred tax assets, we consider all available positive and negative evidence, including projected future taxable income and results of recent operations. Estimating future taxable income is inherently uncertain, requires judgment and is consistent with estimates we are using to manage our business. If we determine in the future that we will not be able to fully utilize all or part of the
67
deferred tax assets, we would record a valuation allowance through earnings in the period the determination was made.
Principles of Consolidation
Refer to Note 1 of the notes to our audited consolidated financial statements included in Part II, Item 8 within this Annual Report on Form 10-K for a discussion of principles of consolidation.
Recently Issued Accounting Standards
Refer to Note 1 of the notes to our audited consolidated financial statements included in Part II, Item 8 within this Annual Report on Form 10-K for our assessment of recently issued and adopted accounting standards.
Item 7A. Quantitative and Qualitative Disclosures About Market Risk
Our principal market risks are our exposure to effects of inflation and interest rates.
Effects of Inflation
While inflation may impact our revenues and cost of services, we believe the effects of inflation, if any, on our results of operations and financial condition have not been significant. However, there can be no assurance that our results of operations and financial condition will not be materially impacted by inflation in the future.
Interest Rates
Our future income, cash flows and fair values relevant to financial instruments are subject to risks relating to interest rates. We are subject to interest rate risk in connection with our Credit Facilities, which have variable interest rates. The interest rates on these facilities are based on a fixed margin plus a market interest rate, which can fluctuate accordingly but is subject to a minimum rate. Interest rate changes do not affect the market value of such debt, but could impact the amount of our interest payments, and accordingly, our future earnings and cash flows, assuming other factors are held constant.
The Company utilizes derivative instruments to manage risk from fluctuations in interest rates on its Term Loan credit agreement. On November 16, 2017 the Company entered into an interest rate cap agreement with a notional amount of $125.0 for the initial period, reducing consistent with the required quarterly debt payments, and an effective date of December 29, 2017. The Company paid a premium of $0.2 for the right to receive payments if the LIBOR rises above the cap percentage, thus effectively ensuring interest expense is capped at a maximum rate of the cap plus 6% for the duration of the agreement. The premium is recorded in other long-term assets on the consolidated balance sheet. The interest rate cap agreement is a derivative not designated as a hedging instrument for accounting purposes. The agreement terminated on December 31, 2020.
In February 2021, the Company entered into a interest rate cap agreement with a notional amount of $171.5, with an effective date of March 31, 2021, expiring on March 31, 2023. Refer to Note 17 of the notes to our audited consolidated financial statements included in Part II, Item 8 within this Annual Report on Form 10-K for more information.
We may incur additional borrowings from time to time for general corporate purposes, including working capital and capital expenditures.
68
Item 8. Financial Statements and Supplementary Data
Index to Consolidated Financial Statements
69
Report of Independent Registered Accounting Firm
To the Stockholders and the Board of Directors of Paya Holdings Inc.
Opinion on the Financial Statements
We have audited the accompanying consolidated balance sheets of Paya Holdings Inc. (the Company) as of December 31, 2020 and 2019, the related consolidated statements of income and other comprehensive income, changes in stockholders’ equity, and cash flows for each of the three years in the period ended December 31, 2020, and the related notes (collectively referred to as the “consolidated financial statements”). In our opinion, the consolidated financial statements present fairly, in all material respects, the financial position of the Company at December 31, 2020 and 2019, and the results of its operations and its cash flows for each of the three years in the period ended December 31, 2020, in conformity with U.S. generally accepted accounting principles.
Basis for Opinion
These financial statements are the responsibility of the Company’s management. Our responsibility is to express an opinion on the Company’s financial statements based on our audits. We are a public accounting firm registered with the PCAOB and are required to be independent with respect to the Company in accordance with the U.S. federal securities laws and the applicable rules and regulations of the Securities and Exchange Commission and the PCAOB.
We conducted our audits in accordance with the standards of the PCAOB. Those standards require that we plan and perform the audit to obtain reasonable assurance about whether the financial statements are free of material misstatement, whether due to error or fraud. Our audits included performing procedures to assess the risks of material misstatement of the financial statements, whether due to error or fraud, and performing procedures that respond to those risks. Such procedures included examining, on a test basis, evidence regarding the amounts and disclosures in the financial statements. Our audits also included evaluating the accounting principles used and significant estimates made by management, as well as evaluating the overall presentation of the financial statements. We believe that our audits provide a reasonable basis for our opinion.
Our audits included performing procedures to assess the risks of material misstatement of the financial statements, whether due to error or fraud, and performing procedures that respond to those risks. Such procedures included examining, on a test basis, evidence regarding the amounts and disclosures in the financial statements. Our audits also included evaluating the accounting principles used and significant estimates made by management, as well as evaluating the overall presentation of the financial statements. We believe that our audits provide a reasonable basis for our opinion.
/s/ Ernst & Young LLP
We have served as the Company’s auditor since 2014.
Tysons, Virginia
March 8, 2021
70
| Paya Holdings Inc. | |||||||||||||||||
| Consolidated Statements of Income and Other Comprehensive Income | |||||||||||||||||
| (In thousands) | |||||||||||||||||
| Year Ended December 31, | |||||||||||||||||
| 2020 | 2019 | 2018 | |||||||||||||||
| Revenue | $ | 206,048 | $ | 203,374 | $ | 185,078 | |||||||||||
| Cost of services exclusive of depreciation and amortization | (102,119) | (101,564) | (96,027) | ||||||||||||||
| Selling, general & administrative expenses | (63,035) | (69,943) | (64,383) | ||||||||||||||
| Depreciation and amortization | (24,562) | (22,436) | (18,339) | ||||||||||||||
| Income from operations | 16,332 | 9,431 | 6,329 | ||||||||||||||
| Other income (expense) | |||||||||||||||||
| Interest expense | (17,637) | (20,043) | (13,630) | ||||||||||||||
| Other income (expense) | 1,214 | (832) | 104 | ||||||||||||||
| Total other income (expense) | (16,423) | (20,875) | (13,526) | ||||||||||||||
| Loss before income taxes | (91) | (11,444) | (7,197) | ||||||||||||||
| Income tax (expense) benefit | (433) | 2,420 | 3,879 | ||||||||||||||
| Net loss | (524) | (9,024) | (3,318) | ||||||||||||||
| Less: Net loss attributable to non-controlling interests | — | — | (148) | ||||||||||||||
| Net loss attributable to Paya Holdings Inc. | $ | (524) | $ | (9,024) | $ | (3,170) | |||||||||||
| Weighted average shares outstanding of common stock | 66,294,576 | 54,534,022 | 54,534,022 | ||||||||||||||
| Basic and diluted net loss per share | $ | (0.01) | $ | (0.17) | $ | (0.06) | |||||||||||
See accompanying notes to the consolidated financial statements.
71
| Paya Holdings Inc. | |||||||||||
| Consolidated Balance Sheets | |||||||||||
| (In thousands) | |||||||||||
| December 31, | December 31, | ||||||||||
| 2020 | 2019 | ||||||||||
| Assets | |||||||||||
| Current assets: | |||||||||||
| Cash and cash equivalents | $ | 23,617 | $ | 25,957 | |||||||
| Trade receivables, net | 17,493 | 15,395 | |||||||||
| Prepaid expenses | 2,218 | 1,120 | |||||||||
| Income taxes receivable | 541 | 1,192 | |||||||||
| Receivable from affiliate | — | 24,282 | |||||||||
| Other current assets | 457 | 839 | |||||||||
| Total current assets before funds held for clients | 44,326 | 68,785 | |||||||||
| Funds held for clients | 78,505 | 73,634 | |||||||||
| Total current assets | $ | 122,831 | $ | 142,419 | |||||||
| Noncurrent assets: | |||||||||||
| Property and equipment, net | 12,805 | 10,021 | |||||||||
| Goodwill | 206,308 | 193,885 | |||||||||
| Intangible assets, net | 132,616 | 136,423 | |||||||||
| Other long-term assets | 781 | 947 | |||||||||
| Total Assets | $ | 475,341 | $ | 483,695 | |||||||
| Liabilities and stockholders' equity | |||||||||||
| Current liabilities: | |||||||||||
| Trade payables | 3,967 | 2,675 | |||||||||
| Accrued liabilities | 10,435 | 12,413 | |||||||||
| Accrued revenue share | 7,535 | 7,573 | |||||||||
| Other current liabilities | 3,071 | 3,027 | |||||||||
| Total current liabilities before client funds obligations | 25,008 | 25,688 | |||||||||
| Client funds obligations | 78,658 | 73,669 | |||||||||
| Total current liabilities | $ | 103,666 | $ | 99,357 | |||||||
| Noncurrent liabilities: | |||||||||||
| Deferred tax liability, net | 14,618 | 25,011 | |||||||||
| Long-term debt | 220,152 | 224,152 | |||||||||
| Tax receivable agreement liability | 19,627 | — | |||||||||
| Other long-term liabilities | 1,246 | 811 | |||||||||
| Total liabilities | $ | 359,309 | $ | 349,331 | |||||||
| Stockholder's Equity: | |||||||||||
| Common stock, $0.0001 par value; 500,000,000 authorized; 116,697,441 and 54,534,022 issued and outstanding as of December 31, 2020 and 2019, respectively | 12 | 5 | |||||||||
| Additional paid-in capital | 129,453 | 147,268 | |||||||||
| Accumulated deficit | (13,433) | (12,909) | |||||||||
| Total stockholders' equity | 116,032 | 134,364 | |||||||||
| Total liabilities and stockholder's equity | $ | 475,341 | $ | 483,695 | |||||||
See accompanying notes to the consolidated financial statements.
72
| Paya Holdings Inc. | |||||||||||||||||||||||||||||||||||
| Consolidated Statements of Changes in Stockholders' Equity | |||||||||||||||||||||||||||||||||||
| (In thousands) | |||||||||||||||||||||||||||||||||||
| Common stock | |||||||||||||||||||||||||||||||||||
| Shares | Amount | Additional paid-in capital | Retained earnings | Non-controlling interest | Total stockholders' equity | ||||||||||||||||||||||||||||||
| Balance at December 31, 2017 as originally reported | — | $ | — | $ | 131,073 | $ | (567) | $ | — | $ | 130,506 | ||||||||||||||||||||||||
| Retroactive application of recapitalization | 54,534,022 | 5 | (5) | — | — | — | |||||||||||||||||||||||||||||
| Adjusted Balance at December 31, 2017 | 54,534,022 | $ | 5 | $ | 131,068 | $ | (567) | $ | — | $ | 130,506 | ||||||||||||||||||||||||
| Net loss | — | — | — | (3,170) | (148) | (3,318) | |||||||||||||||||||||||||||||
| Stock based compensation - Class C incentive units | — | — | 1,309 | — | — | 1,309 | |||||||||||||||||||||||||||||
| Contribution by Ultra | — | — | 3,588 | — | 4,000 | 7,588 | |||||||||||||||||||||||||||||
| Balance at December 31, 2018 | 54,534,022 | $ | 5 | $ | 135,965 | $ | (3,737) | $ | 3,852 | $ | 136,085 | ||||||||||||||||||||||||
| Net loss | — | — | — | (9,024) | — | (9,024) | |||||||||||||||||||||||||||||
| Stock based compensation - Class C incentive units | — | — | 2,273 | — | 2,273 | ||||||||||||||||||||||||||||||
| Contribution by Ultra | — | — | 9,030 | (148) | (3,852) | 5,030 | |||||||||||||||||||||||||||||
| Balance at December 31, 2019 | 54,534,022 | $ | 5 | $ | 147,268 | $ | (12,909) | $ | — | $ | 134,364 | ||||||||||||||||||||||||
| Net loss | — | — | — | (524) | — | (524) | |||||||||||||||||||||||||||||
| Recapitalization transaction, net | 62,163,419 | 7 | (19,693) | — | — | (19,686) | |||||||||||||||||||||||||||||
| Stock based compensation - Class C incentive units | — | — | 1,850 | — | — | 1,850 | |||||||||||||||||||||||||||||
| Stock based compensation - Common stock | — | — | 28 | — | — | 28 | |||||||||||||||||||||||||||||
| Balance at December 31, 2020 | 116,697,441 | $ | 12 | $ | 129,453 | $ | (13,433) | $ | — | $ | 116,032 | ||||||||||||||||||||||||
See accompanying notes to the consolidated financial statements.
73
| Paya Holdings Inc. | |||||||||||||||||
| Consolidated Statements of Cash Flows | |||||||||||||||||
| (in thousands) | |||||||||||||||||
| Year Ended December 31, | |||||||||||||||||
| 2020 | 2019 | 2018 | |||||||||||||||
| Cash flows from operating activities: | |||||||||||||||||
| Net loss | $ | (524) | $ | (9,024) | $ | (3,318) | |||||||||||
| Depreciation & amortization expense | 24,562 | 22,436 | 18,339 | ||||||||||||||
| Loss on disposal of property and equipment | 285 | 69 | — | ||||||||||||||
| Deferred tax benefit | (1,777) | (5,130) | (4,053) | ||||||||||||||
| Bad debt expense | 1,574 | 632 | 1,391 | ||||||||||||||
| Stock based compensation | 1,878 | 2,273 | 1,309 | ||||||||||||||
| Gain on tax receivable agreement liability | (1,218) | — | — | ||||||||||||||
| Gain on contingent consideration | — | (680) | — | ||||||||||||||
| Amortization of debt issuance costs | 1,072 | 1,096 | 833 | ||||||||||||||
Changes in assets and liabilities, net of impact of business acquisitions: | |||||||||||||||||
| Trade receivables | (3,531) | (1,238) | (2,664) | ||||||||||||||
| Prepaid expenses | (643) | 1,733 | 324 | ||||||||||||||
| Other current assets | 322 | 5,101 | (282) | ||||||||||||||
| Other long-term assets | 362 | 3,474 | (1,510) | ||||||||||||||
| Trade payables | 1,291 | 1,628 | (692) | ||||||||||||||
| Accrued liabilities | (2,971) | 3,054 | (5,626) | ||||||||||||||
| Accrued revenue share | (47) | 156 | 894 | ||||||||||||||
| Income tax | 651 | 1,591 | (955) | ||||||||||||||
| Other current liabilities | 44 | 120 | 78 | ||||||||||||||
| Movements in cash held on behalf of customers, net | (8) | 28 | (115) | ||||||||||||||
| Other long-term liabilities | 31 | (3,407) | 794 | ||||||||||||||
| Net cash provided by operating activities | 21,353 | 23,912 | 4,747 | ||||||||||||||
| Cash flows from investing activities: | |||||||||||||||||
| Purchases of property and equipment, net of impact of business acquisitions | (6,603) | (5,228) | (4,608) | ||||||||||||||
| Purchases of customer lists | (6,602) | (2,503) | (354) | ||||||||||||||
| Amount paid in advance related to subsequent acquisition | — | — | (55,305) | ||||||||||||||
| Proceeds held related to subsequent acquisition | — | (343) | — | ||||||||||||||
| Acquisition of business, net of cash received | (19,940) | — | (5,753) | ||||||||||||||
| Net cash (used in) investing activities | (33,145) | (8,074) | (66,020) | ||||||||||||||
| Cash flows from financing activities: | |||||||||||||||||
| Payments on long-term debt | (2,364) | (2,364) | (1,720) | ||||||||||||||
| Payment of debt issuance costs | (2,882) | — | (1,650) | ||||||||||||||
| Proceeds from issuance of long-term debt | — | — | 85,000 | ||||||||||||||
| Distribution to Ultra | (661) | (2,211) | (22,071) | ||||||||||||||
| Capital contributions from Ultra | 12,211 | 530 | 3,588 | ||||||||||||||
| Recapitalization | 3,148 | — | — | ||||||||||||||
| Net cash provided by (used in) financing activities: | 9,452 | (4,045) | 63,147 | ||||||||||||||
74
| Net change in cash and cash equivalents | (2,340) | 11,793 | 1,874 | ||||||||||||||
| Cash and cash equivalents, beginning of period | 25,957 | 14,164 | 12,290 | ||||||||||||||
| Cash and cash equivalents, end of period | $ | 23,617 | $ | 25,957 | $ | 14,164 | |||||||||||
| Supplemental disclosures: | |||||||||||||||||
| Cash interest paid | $ | 16,362 | $ | 18,769 | $ | 12,678 | |||||||||||
| Cash taxes paid, including estimated payments | $ | 1,559 | $ | 3,507 | $ | 1,248 | |||||||||||
| Non-cash investing activity | |||||||||||||||||
| Non-cash preferred and common stock for Stewardship transaction | $ | — | $ | — | $ | 4,000 | |||||||||||
| Non-cash contribution related to the FBS acquisition and Stewardship interest | $ | — | $ | 8,500 | $ | — | |||||||||||
See accompanying notes to the consolidated financial statements.
75
Notes to Consolidated Financial Statements
(in Thousands, unless otherwise noted)
1.Organization, basis of presentation and summary of accounting policies
Organization
Paya Holdings, Inc., a Delaware corporation, conducts operations through its wholly-owned subsidiaries. These operating subsidiaries are comprised of Paya, Inc., Paya EFT, Inc., Stewardship Technology, Inc., First Mobile Trust, LLC, and The Payment Group, LLC.
On October 16, 2020, we consummated the business combination (the “Business Combination”) contemplated by that certain Agreement and Plan of Merger, dated as of August 3, 2020 (“Merger Agreement”), by and among Paya Holdings Inc. (f/k/a FinTech Acquisition Corp. III Parent Corp.) (“we,” “us,” “Paya” or the “Company”), FinTech Acquisition Corp. III (“FinTech”), FinTech III Merger Sub Corp. (“Merger Sub”), GTCR-Ultra Holdings, LLC (“Ultra”), GTCR-Ultra Holdings II, LLC (“Holdings”), GTCR/Ultra Blocker, Inc. and GTCR Fund XI/C LP ("Fund"). See Note 3, Business combination for more information.
GTCR-Ultra Holdings II, LLC was formed on November 13, 2018, and serves as the successor entity to GTCR Ultra Intermediate Holdings, Inc. (“Intermediate”), the predecessor entity. During 2018, Intermediate consolidated the results of operations of Paya, Paya EFT, and Stewardship.
Prior to formation of Holdings in November 2018, the Company operated as Intermediate, a Delaware corporation. Intermediate is a holding company that conducts operations through its wholly-owned and majority-owned subsidiaries after the acquisition of Sage Payment Solutions Inc. in 2017.
In January 2019, the ownership of Stewardship was transferred to another wholly-owned subsidiary of the Company. There was no gain or loss recognized in this common control transfer. This change resulted in the transfer of Stewardship’s assets and liabilities, including goodwill and intangibles, to Paya and the removal of the non-controlling interest from Holdings.
The Company is a leading independent integrated payments platform providing card, ACH, and check payment processing solutions via software to middle-market businesses in the United States. Paya’s solutions integrate with customers’ core business software to enable payments acceptance, reconcile invoice detail, and post payment information to their core accounting system. In this manner, Paya enables its customers to collect revenue from their B2C and B2B customers with a seamless experience and high-level of security across payment types.
The Company is headquartered in Atlanta, Georgia and also has operations in Reston, VA, Fort Walton Beach, FL, Mount Vernon, OH, Miamisburg, OH and Dallas, TX.
Basis of presentation
These financial statements reflect the consolidated results of operations, financial position and cash flows of the Company, in conformity with accounting principles generally accepted in the United States of America (“U.S. GAAP”). Certain amounts in prior years have been reclassified to conform to the current year presentation.
Emerging Growth Company
The Company is an “emerging growth company,” as defined in Section 2(a) of the Securities Act of 1933, as amended (the “Securities Act”), as modified by the Jumpstart Our Business Startups Act of 2012 (the “JOBS Act”), and it may take advantage of certain exemptions from various reporting requirements that are applicable to other public companies that are not emerging growth companies including, but not limited to, not being required to comply with the independent registered public accounting firm attestation requirements of Section 404 of the Sarbanes-Oxley Act, reduced disclosure obligations regarding executive compensation in its periodic reports and
76
proxy statements, and exemptions from the requirements of holding a nonbinding advisory vote on executive compensation and stockholder approval of any golden parachute payments not previously approved.
Further, Section 102(b)(1) of the JOBS Act exempts emerging growth companies from being required to comply with new or revised financial accounting standards until private companies (that is, those that have not had a Securities Act registration statement declared effective or do not have a class of securities registered under the Exchange Act) are required to comply with the new or revised financial accounting standards. The JOBS Act provides that a company can elect to opt out of the extended transition period and comply with the requirements that apply to non-emerging growth companies but any such election to opt out is irrevocable. The Company has elected not to opt out of such extended transition period which means that when a standard is issued or revised and it has different application dates for public or private companies, the Company, as an emerging growth company, can adopt the new or revised standard at the time private companies adopt the new or revised standard.
Use of estimates
The preparation of the financial statements in conformity with U.S. GAAP requires management to make estimates and assumptions that affect the reported amounts of assets and liabilities, the disclosure of contingent assets and liabilities as of the date of the financial statements and the reported amounts of revenues and expenses during the reporting period. Actual results could differ from these estimates. These estimates are based on management’s best knowledge of current events and actions that the Company may undertake in the future. The more significant estimates made by management relate to allowance for doubtful accounts, income taxes, tax receivable agreement liability, and impairment of intangibles and long-lived assets.
Principles of Consolidation
These consolidated financial statements include the accounts of the Company and its subsidiary companies. All significant intercompany accounts and transactions have been eliminated in consolidation.
Cash and cash equivalents
Cash and cash equivalents are short-term, highly liquid investments with a maturity of ninety days or less at the time of purchase. The fair value of our cash and cash equivalents approximates carrying value. At times, cash and cash equivalents exceed the amount insured by the Federal Deposit Insurance Corporation.
Concentration of credit risk
Our cash, cash equivalents, trade receivables, funds receivable and customer accounts are potentially subject to concentration of credit risk. The Company performs ongoing credit evaluations of its customers’ financial condition and generally requires no collateral from its customers. No individual customers represented more than 10% of the Company’s revenue.
Trade receivables, net
Trade receivables are recorded at net realizable value, which includes allowances for doubtful accounts. The Company estimates an allowance for doubtful accounts related to balances that it estimates it cannot collect from merchants. These uncollectible amounts relate to chargebacks, uncollectible merchant fees, and ACH transactions that have been rejected subsequent to the payout date. The Company uses historical write-off data to estimate losses incurred relating to uncollectible accounts. The allowance for doubtful accounts was $1.2 million and $1.2 million at December 31, 2020 and 2019, respectively.
Prepaid expenses
Prepaid expenses primarily consist of prepaid insurance, rent and supplier invoices.
77
Other current assets
Other current assets primarily consist of current deferred tax assets, current deferred debt issuance costs for the revolving credit facility (the “Revolver”), other receivables and equipment inventory.
Funds held for clients and client funds obligation
Funds held for clients and client funds obligations result from the Company’s processing services and associated settlement activities, including settlement of payment transactions. Funds held for clients are generated principally from merchant services transactions and are comprised of both settlements’ receivable and cash as of period end. Certain merchant settlement assets that relate to settlement obligations accrued by the Company are held by partner banks. The Company records corresponding settlement obligations for amounts payable to merchants and for payment instruments not yet presented for settlement. Differences in the funds held for clients and client funds obligation are due to timing differences between when transactions are settled and when payment instruments are presented for settlement and are considered to be immaterial. The changes in settlement assets and obligations are presented on a net basis within operating activities in the consolidated statements of cash flows.
Property and equipment, net
Property and equipment, is stated at cost less accumulated depreciation. Depreciation of property and equipment is computed using the straight-line method over the estimated useful lives of the assets. These lives are 3 years for computers and equipment, 5 years for furniture, fixtures, and office equipment, and the lesser of the asset useful life or remaining lease term for leasehold improvements. Also, the Company capitalizes software development costs and website development costs incurred in accordance with ASC 350-40, Internal Use Software. The useful lives are 3 to 5 years for internal-use software. Repair and maintenance costs are expensed as incurred and included in selling, general and administrative expenses on the consolidated statements of income and other comprehensive income..
Impairment of long-lived assets
The Company evaluates the recoverability of its long-lived assets in accordance with the provisions of ASC 360, Property, Plant and Equipment (“ASC 360”). ASC 360 requires that long-lived assets and certain identifiable intangibles be reviewed for impairment whenever events or changes in circumstances indicate that the carrying amount of an asset may not be recoverable. Recoverability of assets is measured by comparing the carrying amount of an asset to future undiscounted net cash flows expected to be generated by the asset. There was no impairment of long-lived assets recognized in any period presented in the consolidated financial statements.
Goodwill and other intangible assets, net
Goodwill represents the premium paid over the fair value of the net tangible and identifiable intangible assets acquired in the Company’s business combinations. The Company evaluates goodwill and intangible assets in accordance with ASC 350, Goodwill and Other Intangible Assets (“ASC 350”). ASC 350 requires goodwill to be either qualitatively or quantitatively assessed for impairment annually (or more frequently if impairment indicators arise) for each reporting unit. The Company tests goodwill annually for impairment as of September 30 of each year, and at interim periods upon a potential indication of impairment, using a qualitative approach. The Company tests goodwill for impairment by comparing the estimated fair value of the reporting units to the related carrying value. If the fair value of the reporting units is lower than its carrying amount, goodwill is written down for the amount by which the carrying amount exceeds fair value. The loss recognized cannot exceed the carrying amount of the goodwill. There was no goodwill impairment recognized in any period presented in the consolidated financial statements.
Intangible assets with finite lives consist of developed technology and customer relationships and are amortized on a straight-line basis over their estimated useful lives. From time to time, the Company acquires customer lists from sales agents in exchange for an upfront cash payment. This results in an increase in overall gross processing
78
volume to the Company. The purchase of customer lists are treated as asset acquisition, resulting in recording an intangible asset at cost on the date of acquisition. The acquired customer lists intangible assets have a useful life of 5 years. Factors that could trigger an impairment review include significant under-performance relative to expected historical or projected future operating results, significant changes in the manner of our use of the acquired assets or the strategy for our overall business or significant negative industry or economic trends. If this evaluation indicates that the value of the intangible asset may be impaired, the Company makes an assessment of the recoverability of the net book value of the asset over its remaining useful life. If this assessment indicates that the intangible asset is not recoverable, based on the estimated undiscounted future cash flows of the asset over the remaining amortization period, the Company reduces the net book value of the related intangible asset to fair value and may adjust the remaining amortization period.
The Company evaluates its intangible assets with finite lives for indications of impairment whenever events or changes in circumstances indicate that the net book value may not be recoverable. There were no indicators of impairment identified nor was impairment recognized in intangible assets in any period presented in the consolidated financial statements.
Long-term debt and issuance costs
Eligible debt issuance costs associated with the Company's credit facilities are deferred and amortized to interest expense over the term of the related debt using the effective interest method. Debt issuance costs associated with Company's term debt are presented on the Company's consolidated balance sheets as a direct reduction in the carrying value of the associated debt liability.
Revenue
The Company’s business model provides payment services, card processing, and ACH, to merchants through enterprise or vertically focused software partners, direct sales, reseller partners, other referral partners, and a limited number of financial institutions. The Company recognizes processing revenues on bankcard merchant accounts and ACH merchant accounts at the time merchant transactions are processed and periodic fees over the period the service is performed. See Note 2, Revenue recognition for more information on the Company's revenue recognition policy.
Cost of services exclusive of depreciation and amortization
Cost of services includes card processing costs, ACH costs, and other fees paid to card networks, and equipment expenses directly attributable to payment processing and related services to merchants. These costs are recognized as incurred. Cost of services also includes revenue share amounts paid to reseller and referral partners and are calculated monthly based on monthly merchant activity. These expenses are recognized as transactions are processed. Accrued revenue share represent amounts earned during the period but not yet paid at the end of the period.
Selling, general and administrative expenses
Selling, general and administrative expenses consist primarily of salaries, wages, commissions, marketing costs, professional services costs, technology costs, occupancy costs of leased space, and bad debt expense. Stock based compensation expense is also included in this category.
Depreciation & Amortization
Depreciation and amortization consist primarily of amortization of intangible assets, mainly including customer relationships, internally developed software, customer lists, trade names and to a lesser extent depreciation on our investments in property, equipment, and software. We depreciate and amortize our assets on a straight-line basis in accordance with our accounting policies. These lives are 3 years for computers and equipment and acquired internal-use software, 5 years for furniture, fixtures, and office equipment, and the lesser of the asset useful life or
79
remaining lease term for leasehold improvements. Repair and maintenance costs are expensed as incurred and included in selling, general and administrative expenses on the consolidated statements of income and other comprehensive income. Customer lists are amortized over a period of 5-15 years depending on the intangible, developed technology 3-5 years, and trade names over 25 years.
Derivative financial instruments
The Company accounts for its derivative instruments in accordance with ASC 815, Derivatives and Hedging. ASC 815 establishes accounting and reporting standards for derivative instruments requiring the recognition of all derivative instruments as assets or liabilities in the Company’s consolidated balance sheets at fair value. The Company records its derivative instruments as assets or liabilities, depending on its rights or obligations under the applicable derivative contract. Changes in fair value are recognized in earnings in the affected period.
The Company uses an interest rate cap contract to manage risk from fluctuations in interest rates on its Term Loan credit agreement. Interest rate caps involve the receipt of variable-rate amounts beyond a specified strike price over the life of the agreement without exchange of the underlying principal amount. The interest rate cap is not designated as a hedging instrument. Changes in the fair value of the interest rate cap are recorded through other income (expense) in the consolidated statement of income and other comprehensive income, other current assets and other current liabilities on the consolidated balance sheet, and in changes in other current assets in the combined statement of cash flows.
Income taxes
The Company utilizes the asset and liability method of accounting for income taxes. Under this method, deferred tax assets and liabilities are recognized principally for the expected tax consequences of temporary differences between the tax basis of assets and liabilities and their reported amounts, using currently enacted tax rates. The measurement of a deferred tax asset is reduced, if necessary, by a valuation allowance if it is more likely than not that some portion or all of the deferred tax asset will not be realized.
The Company recognizes a tax benefit for uncertain tax positions if the Company believes it is more likely than not that the position will be upheld on audit based solely on the technical merits of the tax position. The Company evaluates uncertain tax positions after the consideration of all available information. Such tax positions must initially and subsequently be estimated as the largest amount of tax benefit that has a greater than 50% likelihood of being realized upon ultimate settlement with the tax authorities, assuming full knowledge of the position and relevant facts. The Company's policy is to recognize any interest and penalties related to income taxes as income tax expense in the relevant period.
On March 27, 2020, the Coronavirus Aid, Relief, and Economic Security Act (the "CARES Act") was signed into law. The CARES Act featured significant tax provisions and other measures to assist businesses impacted by the economic effects of the COVID-19 pandemic, a number of which impacted the Company. In particular, the CARES Act increased the 30% adjusted taxable income limitation to 50% for tax years beginning in 2019 and 2020 related to the Section 163(j) interest expense limitation provisions. Additionally, the CARES Act permitted for a delay of payment of applicable 2020 employer payroll taxes from the date of enactment through December 31, 2020 and also made a technical correction to the 2017 TCJA to provide a 15-year recovery period for qualified improvement property, thus making qualified improvement property eligible for bonus depreciation. See Note 10, Income taxes, for the impact on the consolidated financial statements as a result of the TCJA.
Fair-Value Measurements
The Company follows ASC 820, Fair Value Measurements, which defines fair value as the price that would be received to sell an asset or paid to transfer a liability in an orderly transaction between market participants at the measurement date. The determination of fair value is based on the principal or most advantageous market in which the Company could participate and considers assumptions that market participants would use when pricing the
80
asset or liability, such as inherent risk, transfer restrictions, and risk of nonperformance. Also, determination of fair value assumes that market participants will consider the highest and best use of the asset.
The Company uses the hierarchy prescribed in ASC 820 for fair value measurements, based on the available inputs to the valuation and the degree to which they are observable or not observable in the market.
The three levels of the hierarchy are as follows:
Level 1 Inputs—Unadjusted quoted prices in active markets for identical assets or liabilities accessible to the reporting entity at the measurement date;
Level 2 Inputs—Other than quoted prices included in Level 1 inputs that are observable for the asset or liability, either directly or indirectly, for substantially the full term of the asset or liability; and
Level 3 Inputs—Unobservable inputs for the asset or liability used to measure fair value allowing for inputs reflecting the Company’s assumptions about what other market participants would use in pricing the asset or liability, including assumptions about risk.
Recently Issued Pronouncements Not Yet Adopted
In March 2020, the FASB issued ASU 2020-04, Reference Rate Reform (Topic 848): Facilitation of the Effects of Reference Rate Reform on Financial Reporting which provides optional expedients and exceptions for applying U.S. GAAP to contracts, hedging relationships, and other transactions affected by reference rate reform if certain criteria are met. The amendments in this ASU are effective for all entities as of March 12, 2020 through December 31, 2022. An entity may elect to apply the amendments for contract modifications by Topic or Industry Subtopic as of any date from the beginning an interim period that includes or is subsequent to March 12, 2020, or prospectively from the date that the financial statements are available to be issued. Once elected for a Topic or an Industry Subtopic, the amendments must be applied prospectively for all eligible contract modifications for that Topic or Industry Subtopic. The Company may apply ASU 2020-04 as its contracts referenced in London Interbank Offered Rate (“LIBOR”) are impacted by reference rate reform. The Company is currently evaluating the effect of ASU 2020-04 on its consolidated financial statements.
In December 2019, the FASB issued ASU 2019-12, Income Taxes (Topic 740): Simplifying the Accounting for Income Taxes, which is intended to enhance and simplify various aspects of the accounting for income taxes. The amendments in this update remove certain exceptions to the general principles in Topic 740 related to the approach for intraperiod tax allocation, the methodology for calculating income taxes in an interim period and the recognition of deferred tax liabilities for outside basis differences. ASU 2019-12 also clarifies and amends existing guidance to improve consistent application of the accounting for franchise taxes, enacted changes in tax laws or rates and transactions that result in a step-up in the tax basis of goodwill. ASU 2019-12 is effective for annual and interim periods beginning after December 15, 2021, with early adoption permitted. The Company is currently evaluating the effect of ASU 2019-12 on our consolidated financial statements.
In August 2017, the Financial Accounting Standards Board (“FASB”) issued Accounting Standards Update (“ASU”) 2017-12, Derivatives and Hedging (Topic 815), Targeted Improvements to Accounting for Hedging Activities. The new guidance amends the hedge accounting model in Accounting Standards Codification (“ASC”) 815 to better portray the economic results of an entity’s risk management activities in its financial statements and simplifies the application of hedge accounting in certain situations. The ASU eliminates the requirement to separately measure and report hedge ineffectiveness. The ASU is effective for annual periods beginning after December 15, 2019, and interim periods within fiscal years beginning after December 15, 2021. Early adoption is permitted. The Company does not expect the adoption of this ASU to have a significant impact on its consolidated financial statements.
In January 2017, the FASB issued Accounting Standards Update (“ASU”) 2017-04, Intangibles - Goodwill and Other (Topic 350): Simplifying the Test for Goodwill Impairment. The ASU simplifies how an entity is required to
81
test goodwill for impairment by eliminating Step 2 from the goodwill impairment test which measures a goodwill impairment loss by comparing the implied fair value of a reporting unit’s goodwill with the carrying amount. As a result, an impairment charge will be recorded based on the excess of a reporting unit's carrying amount over its fair value. The amendments of this ASU are effective for reporting periods beginning after December 15, 2022. Early adoption of this ASU is permitted for interim and annual impairment tests performed on testing dates after January 1, 2017. The Company does not expect the adoption of this ASU to have a significant impact on its consolidated financial statements.
In June 2016, the FASB issued ASU 2016-13, Financial Instruments – Credit Losses (Topic 326): Measurement of Credit Losses on Financial Instruments. This ASU presents a new methodology for calculating credit losses on financial instruments (e.g. trade receivables) based on expected credit losses and expands the types of information companies must use when calculating expected losses. This ASU is effective for annual periods beginning after December 15, 2021 and interim periods within those annual periods, with early adoption permitted. The Company is currently evaluating the impact of this ASU on its Consolidated Financial Statements.
In February 2016, the FASB issued ASU 2016-02, Leases (Topic 842). The ASU requires lessees to put most leases on their balance sheets. The guidance also modifies the classification criteria and the accounting for sales-type and direct financing leases for lessors and provides new presentation and disclosure requirements for both lessees and lessors. In June 2020, the FASB issued ASU 2020-05 which delayed the effective date of ASC 842. This standard is effective for fiscal years beginning after December 15, 2021, and interim periods within fiscal years beginning after December 15, 2022. Early adoption is permitted. The Company will adopt this ASU on January 1, 2022 and does not expect the adoption of this ASU to have a significant impact on its consolidated financial statements.
2.Revenue recognition
In May 2014, the FASB issued ASU 2014-09, Revenue from Contracts with Customers (Topic 606) (“ASC 606”). ASC 606 supersedes the revenue recognition requirements in Accounting Standard Codification (“ASC”) 605, Revenue Recognition (“ASC 605”). The new standard provides a five-step analysis of transactions to determine when and how revenue is recognized, based upon the core principle that revenue is recognized to depict the transfer of goods or services to customers in an amount that reflects the consideration to which the entity expects to be entitled in exchange for those goods or services. The new standard also requires additional disclosures regarding the nature, amount, timing, and uncertainty of revenue and cash flows arising from contracts with customers.
The Company adopted ASC 606 on January 1, 2019 using the modified retrospective approach. As a result of adopting the new standard, the Company did not have material changes to the timing of its revenue recognition, nor an impact to the financial statements.
At contract inception, the Company assesses the goods and services promised in its contracts with customers and identifies performance obligations for each promise to transfer to the customer a good or service that is distinct. The Company’s performance obligation relating to its payment processing services revenue is to provide continuous access to the Company’s system to process as much as its customers require. Since the number or volume of transactions to be processed is not determinable at contract inception, the Company’s payment processing services consist of variable consideration under a stand-ready service of distinct days of service that are substantially the same with the same pattern of transfer to the customer. As such, the stand-ready obligation is accounted for as a single-series performance obligation whereby the variability of the transaction value is satisfied daily as the performance obligation is performed. In addition, the Company applies the right to invoice practical expedient to payment processing services as each performance obligation is recognized over time and the amounts invoiced are reflective of the value transferred to the customer.
The Company uses each day as a time-based measure of progress toward satisfaction of the single performance obligation of each contract. This method most accurately depicts the pattern by which services are transferred to the merchant, as performance depends on the extent of transactions processed for that merchant on a given day.
82
Likewise, consideration to which the Company expects to be entitled is determined according to our efforts to provide service each day.
ASC 606 requires disclosure of the aggregate amount of the transaction price allocated to unsatisfied performance obligations; however, as permitted by the standard, the Company has elected to exclude from this disclosure any contracts with an original duration of one year or less and any variable consideration that meets specified criteria. As discussed above, the Company’s core performance obligation is a stand-ready obligation comprised of a series of distinct days of service, and revenue related to this performance obligation is generally billed and recognized as the services are performed. The variable consideration allocated to this performance obligation meets the specified criteria for disclosure exclusion. The aggregate fixed consideration portion of customer contracts with an initial contract duration greater than one year is not material.
The Company’s customers are all domestic, small to medium size businesses who are underwritten to the credit standards of the Company and who each have merchant processing agreements. The Company, through its risk informed bad debt and allowance accounting, appropriately reserves for any potential risk to its revenue and cash flows. Since the cash is collected for the majority of transactions within a month, there is not a significant time lag or risk of uncollectibility in the recognition of revenue.
We do not have any material contract assets or liabilities for any period presented and we did not recognize any impairments of any contract assets or liabilities for the years ended December 31, 2020, 2019 or 2018.
The Company generates its revenue from three revenue sources which include Transaction based revenue, Service based fee revenue and Equipment revenue and are defined below:
Transaction based revenue
Transaction based revenue represents revenue generated from transaction fees based on volume, including interchange fees and convenience based fees. The Company generates transaction based revenue from fees charged to merchants for card-based processing volume and ACH transactions. Transaction based revenues are recognized on a net basis equal to the full amount billed to the bankcard merchant, net of interchange fees and assessments. Interchange fees are fees paid to card-issuing banks and assessments paid to payment card networks. Interchange fees are set by credit card networks based on various factors, including the type of bank card, card brand, merchant transaction processing volume, the merchant’s industry and the merchant’s risk profile and are recognized at the time merchant transactions are processed. Transaction based revenue was recorded net of interchange fees and assessments of $416,043, $429,184 and $425,864 in the years ending December 31, 2020, 2019 and 2018, respectively.
Service based fee revenue
Service based fee revenue represents revenue generated from recurring and periodic service fees. The Company generates service based fee revenue from charging a service fee, a fee charged to the client for facilitating bankcard processing, which are recognized on a gross basis. The Company also generates service based fees related to ACH inclusive of monthly support fees and monthly statement fees.
Equipment revenue
Equipment revenue comprises sales of equipment which primarily consists of payment terminals.
The Company generates its revenue from two segments which include Integrated Solutions and Payment Services and are defined below:
Integrated Solutions
83
Our Integrated Solutions segment represents the delivery of our credit and debit card payment solutions, and to a lesser extent, ACH processing solutions to customers via integrations with software partners across our strategic vertical markets. Our Integrated Solutions partners include vertical focused front-end Customer Relationship Management software providers as well as back-end Enterprise Resource Planning and accounting solutions.
Payment Services
Our Payment Services segment represents the delivery of card payment processing solutions to our customers through resellers, as well as ACH, check, and gift card processing. Card payment processing solutions in this segment do not originate via a software integration but still utilize Paya’s core technology infrastructure. ACH, check, and gift card processing may or may not be integrated with third-party software.
The following table presents the Company's revenue disaggregated by segment and by source as follows:
| Integrated Solutions | |||||||||||||||||
| Year Ended December 31, | |||||||||||||||||
| 2020 | 2019 | 2018 | |||||||||||||||
| Revenue from contracts with customers | |||||||||||||||||
| Transaction based revenue | $ | 111,494 | $ | 107,947 | $ | 90,153 | |||||||||||
| Service based fee revenue | 10,676 | 11,345 | 9,978 | ||||||||||||||
| Equipment revenue | 154 | 475 | 195 | ||||||||||||||
| Total revenue | $ | 122,324 | $ | 119,767 | $ | 100,326 | |||||||||||
| Payment Services | |||||||||||||||||
| Year Ended December 31, | |||||||||||||||||
| 2020 | 2019 | 2018 | |||||||||||||||
| Revenue from contracts with customers | |||||||||||||||||
| Transaction based revenue | $ | 68,219 | $ | 67,130 | $ | 67,875 | |||||||||||
| Service based fee revenue | 15,435 | 16,197 | 16,670 | ||||||||||||||
| Equipment revenue | 70 | 280 | 207 | ||||||||||||||
| Total revenue | $ | 83,724 | $ | 83,607 | $ | 84,752 | |||||||||||
3.Business combination
On October 16, 2020, FinTech consummated the Business Combination pursuant to the terms of the Merger Agreements and acquired all of the issued and outstanding equity interests in Paya from the Seller.
Pursuant to the Merger Agreements, Fintech purchased from GTCR Fund XI-C LP ("Seller") all of the issued and outstanding equity interests of Paya for $1.045 billion, of which $500 million was paid in cash and the remaining $545 million was paid to the Seller in the form of 54,534,022 shares of Common Stock and up to an additional 14,018,188 shares of Paya’s common stock, which we refer to as the Earnout Shares, in the event that the closing sale price of Paya’s common stock exceeds certain price thresholds for 20 out of any 30 consecutive trading days during the first five years following the closing of the Transactions. None of these thresholds have been achieved as of December 31, 2020. The number of shares of the equity consideration was based on a $10.00 per share value for Paya’s common stock.
The Business Combination was accounted for as a reverse recapitalization, with no goodwill or other intangible assets recorded, in accordance with U.S. GAAP. This determination was primarily based on post Business Combination relative voting rights, composition of the governing board, management and intent of the Business Combination. Under this method of accounting, Fintech was treated as the acquired company for financial reporting
84
purposes. Accordingly, for accounting purposes, the Business Combination was accounted for as the equivalent of Paya issuing stock for the net assets of FinTech, accompanied by a recapitalization. The net assets of the Company were stated at historical cost, with no goodwill or other intangible assets recorded. Reported amounts from operations included herein prior to the Business Combination are those of Paya.
The following tables reconcile the elements of the Business Combination to the consolidated statement of cash flows for the year ended December 31, 2020.
| Recapitalization | |||||
| Cash proceeds from FinTech | $ | 277,630 | |||
| Cash proceeds from sale of equity securities | 250,000 | ||||
| Gross cash received by Paya from Business Combination | 527,630 | ||||
| Less: company transaction expenses | (24,822) | ||||
| Net cash received from Recapitalization | 502,808 | ||||
| Less: cash paid to Seller | (499,660) | ||||
| Net contributions from Recapitalization Transaction | $ | 3,148 | |||
The cash paid to Seller was funded from the proceeds from net cash received from Recapitalization (described above), offset by certain other transaction costs incurred in connection with the Business Combination.
Prior to the Business Combination, FinTech had 2,258,765 shares of Class A common stock, par value $0.0001 per share (the “Class A Shares”) outstanding and 8,857,500 shares of Class B common stock, par value $0.0001 per share (the “Class B Shares”) outstanding, which comprised of Founder Shares held by the Founders and Former FinTech Director Shares held by individuals who are not founders but were directors of FinTech.
On October 22, 2020, FinTech was renamed Paya Holdings, Inc. and each currently issued and outstanding share of FinTech Class B Shares automatically converted on a one-for-one basis, into shares of Class A common stock. Immediately thereafter, each currently issued and outstanding share of FinTech Class A Shares automatically converted on a one-for-one basis, into shares of the common stock of Paya Holdings. In connection with the Business Combination, 5,681,812 Class A Shares were redeemed.
The number of shares of Common Stock of Paya Holdings issued immediately following the consummation of the Business Combination is summarized as follows:
| Shares by Type | Number of shares by type | |||||||
| as of December 31, 2020 | ||||||||
| FinTech total shares outstanding prior to the Business Combination | 37,163,419 | |||||||
| Less: Redemption of FinTech shares | (5,681,812) | |||||||
| Class A Shares of FinTech | 31,481,607 | |||||||
| Shares issued to PIPE investors | 25,000,000 | |||||||
| Shares issued to FinTech and PIPE investors | 56,481,607 | |||||||
| Shares issued to the Sellers | 54,534,022 | |||||||
| Total Shares of Common Stock outstanding for earnings per share computation | 111,015,629 | |||||||
| Plus: Contingent shares subject to forfeiture | 5,681,812 | |||||||
| Total Shares of Common Stock outstanding | 116,697,441 | |||||||
The Company incurred transaction costs related to the Business Combination of approximately $28.0 million, of which $3.1 million are included in selling, general & administrative expenses on the consolidated statements of
85
income and other comprehensive income for the year ended December 31, 2020. The remaining $24.9 million of transaction costs are included in additional paid in capital on the consolidated balance sheet for the year ended December 31, 2020.
4.Acquisitions
The Payment Group transaction overview
Paya purchased The Payment Group, LLC ("TPG" or "The Payment Group"). on October 1, 2020 for total cash consideration of $22,270, which was accounted for as a business combination as defined by ASC 805. The assets acquired and liabilities assumed are recorded at their respective fair values as of the date of the acquisition with the excess of the purchase price over those fair values recorded as goodwill. The determination of the fair values of the acquired assets and assumed liabilities required significant judgment, including estimates impacting the determination of estimated lives of tangible and intangible assets, and their related fair values. The fair values were determined considering the income, market and cost approaches. The fair value measurement is based on significant inputs that are not observable in the market and, therefore represents a Level 3 measurement.
The following table summarizes the fair values of the assets acquired and liabilities assumed by the Company and resulting goodwill at October 1, 2020:
| Assets | |||||
| Current Assets: | |||||
| Cash and cash equivalents | $ | 2,330 | |||
| Funds held for clients | 585 | ||||
| Prepaid expenses | 57 | ||||
| Total current assets | 2,972 | ||||
| Other assets: | |||||
| Goodwill | 12,423 | ||||
| Intangible assets | 10,300 | ||||
| Other assets | 185 | ||||
| Total assets | $ | 25,880 | |||
| Liabilities | |||||
| Current liabilities: | |||||
| Other accrued expenses | $ | 1,001 | |||
| Client fund obligation | 709 | ||||
| Total current liabilities | 1,710 | ||||
| Deferred tax liability – non-current | 1,729 | ||||
| Other long-term liabilities | 171 | ||||
| Total liabilities | 3,610 | ||||
| Net assets | $ | 22,270 | |||
Intangible assets acquired consist of customer relationships of $4,300 and developed technology of $6,000. All intangibles assets are amortized on a straight-line basis in line with Company policy. Goodwill of $12,423 resulted from the acquisition and is partially deductible for tax purposes. Qualitative factors that contribute to the recognition of goodwill include certain intangible assets that are not recognized as separate identifiable intangible assets apart from goodwill. Intangible assets not recognized apart from goodwill consist primarily of the expected revenue
86
synergies. As of December 31, 2020 the measurement period remains open, primarily due to continued refinement of intangibles valuation.
Transaction costs related to the transaction totaled $561 and are recorded in selling, general & administrative expenses on the consolidated statement of income and other comprehensive income.
First Billing Services transaction overview
Paya purchased First Mobile Trust, LLC ("FBS" or "First Billing Services") on January 1, 2019 for total consideration of $56,975 which consisted of cash of $51,795, of which $343 were funds held in escrow, $680 fair value of contingent consideration to be paid based upon the achievement of certain growth metrics related to the financial performance of FBS in the 12 months from January 1, 2019 through December 31, 2019, which were not achieved, and $4,500 of preferred and common stock of Ultra which is recorded as a capital contribution, which was accounted for as a business combination as defined by ASC 805. In connection with the capital contribution, no non-controlling interest was recorded as Ultra did not own any shares of FBS at the date of acquisition or as of December 31, 2019. The assets acquired and liabilities assumed are recorded at their respective fair values as of the date of the acquisition with the excess of the purchase price over those fair values recorded as goodwill. The determination of the fair values of the acquired assets and assumed liabilities required significant judgment, including estimates impacting the determination of estimated lives of tangible and intangible assets, and their related fair values. The fair values were determined considering the income, market and cost approaches. The fair value measurement is based on significant inputs that are not observable in the market and, therefore represents a Level 3 measurement.
The following table summarizes the fair values of the assets acquired and liabilities assumed by the Company and resulting goodwill at January 1, 2019:
| Assets | |||||
| Current Assets: | |||||
| Cash and cash equivalents | $ | 1,262 | |||
| Prepaid expenses | 41 | ||||
| Other current assets | 382 | ||||
| Total current assets | 1,685 | ||||
| Other assets: | |||||
| Property and equipment, net | 32 | ||||
| Goodwill | 33,699 | ||||
| Intangible assets | 21,800 | ||||
| Other long-term assets | 126 | ||||
| Total assets | $ | 57,342 | |||
| Liabilities | |||||
| Current liabilities: | |||||
| Other accrued expenses | $ | 367 | |||
| Total current liabilities | 367 | ||||
| Total liabilities | 367 | ||||
| Net assets | $ | 56,975 | |||
Intangible assets acquired consist of customer relationships of $14,000, developed technology of $4,400, and tradename of $3,400. All intangibles assets are amortized on a straight-line basis in line with Company policy.
87
Goodwill of $33,699 resulted from the acquisition and is partially deductible for tax purposes. Qualitative factors that contribute to the recognition of goodwill include certain intangible assets that are not recognized as separate identifiable intangible assets apart from goodwill. Intangible assets not recognized apart from goodwill consist primarily of the expected revenue synergies. As of December 31, 2019, the measurement period for goodwill has closed.
Transaction costs related to the transaction totaled $3,854 and are recorded in selling, general & administrative expenses on the consolidated statement of income and other comprehensive income for 2019.
FBS contributed $11,814 and $1,210 to our revenue and net loss, respectively, for 2019.
FBS did not achieve established growth metrics in the 12 months from January 1, 2019 through December 31, 2019. Accrued liabilities related to the contingent consideration of $680 were written off to Other income (expense). The Company made no payments in 2019 for contingent consideration related to the FBS transaction.
Stewardship transaction overview
Paya purchased Stewardship Technology, Inc. ("Stewardship") on November 1, 2018 for total consideration of $9,768, which consisted of cash of $5,768 and $4,000 of preferred and common stock of Ultra, which was accounted for as a business combination as defined by ASC 805. In connection with the FBS acquisition, in 2019 Ultra contributed all of its preferred and common stock to the Company as a capital contribution. The assets acquired and liabilities assumed are recorded at their respective fair values as of the date of the acquisition with the excess of the purchase price over those fair values recorded as goodwill. The determination of the fair values of the acquired assets and assumed liabilities required significant judgment, including estimates impacting the determination of estimated lives of tangible and intangible assets, and their related fair values. The fair values were determined considering the income, market and cost approaches. The fair value measurement is based on significant inputs that are not observable in the market and, therefore represents a Level 3 measurement.
The following table summarizes the fair values of the assets acquired and liabilities assumed by the Company and resulting goodwill at November 1, 2018:
| Assets | |||||
| Current Assets: | |||||
| Cash and cash equivalents | $ | 27 | |||
| Funds held for clients | 1,255 | ||||
| Other current assets | 3 | ||||
| Total current assets | 1,285 | ||||
| Other assets: | |||||
| Goodwill | 5,405 | ||||
| Intangible assets | 5,550 | ||||
| Other assets | 46 | ||||
| Total assets | $ | 12,286 | |||
| Liabilities | |||||
| Current liabilities: | |||||
| Other accrued expenses | $ | 94 | |||
| Client fund obligation | 1,255 | ||||
| Total current liabilities | 1,349 | ||||
| Deferred tax liability – non-current | 1,169 | ||||
| Total liabilities | 2,518 | ||||
| Net assets | $ | 9,768 | |||
88
Intangible assets acquired consist of customer relationships of $1,100, developed technology of $3,660, and tradename of $790. All intangibles assets are amortized on a straight-line basis in line with Company policy. Goodwill of $5,405 resulted from the acquisition and is not deductible for tax purposes. Qualitative factors that contribute to the recognition of goodwill include certain intangible assets that are not recognized as separate identifiable intangible assets apart from goodwill. Intangible assets not recognized apart from goodwill consist primarily of the expected revenue synergies.
Transaction costs related to the transaction totaled $613 and are recorded in selling, general & administrative expenses on the consolidated statement of income and other comprehensive income.
Stewardship contributed $472 and $(339) to our revenue and net loss, respectively, for 2018. Stewardship contributed $2,964 and $(2,170) to our revenue and net loss, respectively, for 2019.
Pro Forma Results of Operations for Business Combinations
The following unaudited pro forma information presents consolidated financial information of the Company as if the Stewardship and FBS transactions occurred on January 1, 2018.
| Period | Revenue | Net loss | ||||||||||||
| 2018 Pro Forma from January 1, 2018 to December 31, 2018 | $ | 197,555 | $ | (4,814) | ||||||||||
5.Property and equipment, net
Property and equipment, net consists of the following:
| December 31, 2020 | December 31, 2019 | ||||||||||
| Computers and equipment | $ | 7,134 | $ | 5,284 | |||||||
| Internal-use software | 10,708 | 6,471 | |||||||||
| Office equipment | 130 | 130 | |||||||||
| Furniture and fixtures | 1,320 | 1,284 | |||||||||
| Leasehold improvements | 1,353 | 1,087 | |||||||||
| Other equipment | 26 | 26 | |||||||||
| Total property and equipment | 20,671 | 14,282 | |||||||||
| Less: accumulated depreciation | (7,866) | (4,261) | |||||||||
| Total property and equipment, net | $ | 12,805 | $ | 10,021 | |||||||
Depreciation and amortization expense, including depreciation of assets under capital leases and internal-use software, totaled $3,853, $2,753 and $1,433 for the years ended December 31, 2020, 2019 and 2018, respectively.
6.Goodwill and other intangible assets, net
Goodwill recorded in the consolidated financial statements was $206,308 and $193,885 at December 31, 2020 and 2019, respectively. There were no indicators of impairment noted in the periods presented.
89
The following table presents changes to goodwill for the years ended December 31, 2020 and 2019 for each reporting unit:
| Integrated Solutions | Payment Services | Total | |||||||||||||||
| Balance as of December 31, 2018 | $ | — | $ | — | $ | 160,174 | |||||||||||
| Acquisitions | — | — | 33,711 | ||||||||||||||
| Balance as of December 31, 2019 | $ | — | $ | — | $ | 193,885 | |||||||||||
| Segment reorganization | 139,985 | 53,900 | 193,885 | ||||||||||||||
| Acquisitions | 12,423 | — | 12,423 | ||||||||||||||
| Balance as of December 31, 2020 | $ | 152,408 | $ | 53,900 | $ | 206,308 | |||||||||||
Intangible assets other than goodwill at December 31, 2020 included the following:
| Weighted Average Useful Life (Years) | Useful Lives | Gross Carrying Amount at | Accumulated Amortization | Net Carrying Value as of | |||||||||||||||||||||||||
| December 31, | December 31, | ||||||||||||||||||||||||||||
| 2020 | 2020 | ||||||||||||||||||||||||||||
| Customer Relationships | 10.4 | 5-15 years | $ | 167,158 | $ | (50,477) | $ | 116,681 | |||||||||||||||||||||
| Developed Technology | 4.2 | 3-5 years | 25,520 | (13,435) | 12,085 | ||||||||||||||||||||||||
| Trade name | 25.0 | 25 years | 4,190 | (340) | 3,850 | ||||||||||||||||||||||||
| 8.6 | $ | 196,868 | $ | (64,252) | $ | 132,616 | |||||||||||||||||||||||
Intangible assets other than goodwill at December 31, 2019 included the following:
| Weighted Average Useful Life (Years) | Useful Lives | Gross Carrying Amount at | Accumulated Amortization | Net Carrying Value as of | |||||||||||||||||||||||||
| December 31, | December 31, | ||||||||||||||||||||||||||||
| 2019 | 2019 | ||||||||||||||||||||||||||||
| Customer Relationships | 10.3 | 5-15 years | $ | 156,256 | $ | (34,712) | $ | 121,544 | |||||||||||||||||||||
| Developed Technology | 4.3 | 3-5 years | 19,520 | (8,658) | 10,862 | ||||||||||||||||||||||||
| Trade name | 25.0 | 25 years | 4,190 | (173) | 4,017 | ||||||||||||||||||||||||
| 9.0 | $ | 179,966 | $ | (43,543) | $ | 136,423 | |||||||||||||||||||||||
Amortization expense totaled $20,709, $19,683 and $16,906 for the years ended December 31, 2020, 2019 and 2018, respectively.
90
The following table shows the expected future amortization expense for intangible assets at December 31, 2020:
| Expected Future Amortization Expense | |||||
| 2021 | $ | 21,676 | |||
| 2022 | 20,003 | ||||
| 2023 | 19,801 | ||||
| 2024 | 18,181 | ||||
| 2025 | 17,226 | ||||
| Thereafter | 35,729 | ||||
| Total expected future amortization expense | $ | 132,616 | |||
7.Long-term debt
The Company’s long-term debt consisted of the following for the years ended December 31, 2020 and 2019:
| December 31, 2020 | December 31, 2019 | ||||||||||
| Term loan credit agreement | $ | 228,677 | $ | 231,041 | |||||||
| Debt issuance costs, net | (6,161) | (4,525) | |||||||||
| Total debt | $ | 222,516 | $ | 226,516 | |||||||
| Less: current portion of debt | (2,364) | (2,364) | |||||||||
| Total long-term debt | $ | 220,152 | $ | 224,152 | |||||||
In August 2017, GTCR-Ultra Acquisition, Inc. entered into an initial term loan credit agreement for borrowings of $150,500, a $25,000 revolving credit facility (the “Revolver”), and a Delayed Draw Term Loan (“DDTL”) for borrowings up to $27,500. The DDTL was not utilized and was closed on September 15, 2017. After closing of the 2017 acquisition of Paya, Inc. and Paya EFT, Inc. (the “Acquisition”), GTCR-Ultra Acquisition, Inc. was dissolved and the Term Loan credit agreement was assigned to Holdings and its subsidiaries.
In December 2018, the Company amended the credit agreement and GTCR-Ultra Holdings III, LLC (“GTCR-Ultra III”), a wholly-owned subsidiary of the Company, unconditionally guaranteed all loans and commitments. The credit agreements are secured by substantially all of the assets of the Company. As a result of the amendment, the Company increased the Term Loan an additional $85,000. The Revolver matures in August 2022 and the Term Loan matures in August 2024, with quarterly payments due throughout the term.
The net leverage ratio is the ratio of the Company’s secured indebtedness to the consolidated adjusted EBITDA. The maximum ratio permitted by the financial covenant in the Credit Agreement is 7.25x for December 31, 2020.
In July 2020, the Company amended the Credit Agreement to permit the business combination transaction, among other things, extend the maturity of the Revolver to July 24, 2025 and the maturity of the Term Loan to August 1, 2027.
The current portion of debt was included within other current liabilities on the consolidated balance sheet.
The Company had $6,161 and $4,525 of unamortized Term Loan debt issuance costs that were netted against the outstanding loan balance and $457 and $283 of unamortized costs associated with the Revolver as of December 31, 2020 and 2019, respectively. The Revolver debt issuance costs are recorded in other current assets and are
91
amortized over the life of the Revolver. Amortization of the debt issuance costs are included in interest expense in the consolidated statement of income and other comprehensive income.
The interest rate for the Revolver and the Term Loan credit agreement were set at LIBOR (with a floor of 1.00%) plus a margin of 6.00% on July 1, 2017. In July 2018, the interest rate was reduced to LIBOR (with a floor of 1.00%) plus a margin of 5.25% and remained unchanged at December 31, 2020. Interest expense related to long-term debt totaled $15,671 for the year ending December 31, 2020 and $17,669 for the year ending December 31, 2019. Unused revolver borrowings incur administrative agent fees at a rate of 0.50% per annum on the daily average of the unused amount and are recorded in interest expense. Total interest expense was $17,637, $20,043, and $13,630 for the years ended December 31, 2020, 2019 and 2018, respectively. This included the long-term debt interest expense of $15,671, $17,669 and $11,911 for the years ended December 31, 2020, 2019 and 2018, and amortization of debt issuance costs of $1,072, $1,097 and $833 for the years ended December 31, 2020, December 31, 2019 and December 31, 2018, respectively.
Principal payments on Term Loan of $591 were paid quarterly for the period from January 1, 2020 to December 31, 2020. Annual principal payments on Term Loan for the following years is as follows:
| Future Principal | |||||
| Payments | |||||
| 2021 | $ | 2,364 | |||
| 2022 | 2,364 | ||||
| 2023 | 2,364 | ||||
| 2024 | 2,364 | ||||
| 2025 | 2,364 | ||||
| 2026 | 2,364 | ||||
| 2027 | 214,493 | ||||
| Total future principal payments | $ | 228,677 | |||
8.Derivatives
The Company utilizes derivative instruments to manage risk from fluctuations in interest rates on its Term Loan credit agreement. On November 16, 2017 the Company entered into an interest rate cap agreement with a notional amount of $125,000 for the initial period, reducing consistent with the required quarterly debt payments, and an effective date of December 29, 2017. The agreement terminated on December 31, 2020. The Company paid a premium of $169 for the right to receive payments if the LIBOR rises above the cap percentage, thus effectively ensuring interest expense is capped at a maximum rate of the cap plus 6% for the duration of the agreement. The premium is recorded in other long-term assets on the consolidated balance sheet. The interest rate cap agreement was a derivative not designated as a hedging instrument for accounting purposes.
92
The interest rate cap rate was as follows:
| Period rate is applicable | ||||||||||||||
| Date From | Date To | Notional Amount | Cap Rate (%) | |||||||||||
| December 29, 2017 | March 29, 2018 | 125,000 | 2.25% | |||||||||||
| March 30, 2018 | June 28, 2018 | 124,688 | 2.50% | |||||||||||
| June 29, 2018 | September 28, 2018 | 124,375 | 2.75% | |||||||||||
| September 29, 2018 | December 31, 2018 | 124,063 | 2.75% | |||||||||||
| December 31, 2018 | March 29, 2019 | 123,750 | 3.00% | |||||||||||
| March 30, 2019 | June 28, 2019 | 123,438 | 3.00% | |||||||||||
| June 29, 2019 | September 29, 2019 | 123,125 | 3.00% | |||||||||||
| September 30, 2019 | December 31, 2019 | 122,813 | 3.00% | |||||||||||
| December 31, 2019 | March 30, 2020 | 122,500 | 3.00% | |||||||||||
| March 31, 2020 | June 29, 2020 | 122,188 | 3.00% | |||||||||||
| June 30, 2020 | September 29, 2020 | 121,875 | 3.00% | |||||||||||
| September 30, 2020 | December 31, 2020 | 121,562 | 3.00% | |||||||||||
The fair value of the interest rate cap agreement was $0 and $1 at December 31, 2020 and 2019, respectively. The fair value of the interest rate cap agreement is included in other current assets on the consolidated balance sheet. Changes in fair value are recorded in earnings in other income (expense). The Company recognized $(1), $(149) and $8 in other income (expense) for the years ended December 31, 2020, 2019 and 2018, respectively.
9.Equity
Common Stock
The holders of the Company's common stock are entitled to one vote for each share of common stock held. Of the 116,697,441 shares of common stock outstanding, a total of 5,681,812 are considered contingently issuable as they require the trading price of our stock to exceed certain thresholds. In addition, should our share price exceed a series of trading price thresholds, the Company may issue an additional 14,018,188 shares of common stock, for total contingently issuable shares of 19,700,000. See Note 3, Business combination, for more information regarding the earnout shares.
Paya Holdings Inc. Omnibus Incentive Plan
On December 22, 2020, the Company adopted the Paya Holdings Inc. Omnibus Incentive Plan, which allows for issuance of up to 8,800,000 shares of its common stock. The purpose of the plan is to enhance the profitability and value of the Company for the benefit of its stockholders by enabling the Company to offer eligible individual stock and cash-based incentives in order to attract, retain, and reward such individuals and strengthen the mutuality of interest between such individuals and the stockholders. Under the Omnibus Incentive Plan, the Company may grant stock options, stock appreciation rights, restricted shares, performance awards, and other stock-based and cash-based awards to eligible employees, consultants or non-employee directors of the Company. The Company recognized $28 thousand of share-based compensation for the year ended December 31, 2020 in selling, general & administrative expenses on the consolidated statement of income and other comprehensive income on a straight-line basis over the vesting periods. As of December 31,
93
2020, the Company had two stock-based compensation award types granted and outstanding: restricted stock units (RSUs) and stock options.
RSUs represent the right to receive shares of the Company's common stock at a specified date in the future. On December 22, 2020, the Company granted 230,000 RSUs under the Omnibus Incentive Plan, consisting of 50,000 RSUs that vest over 5 years, and 180,000 RSUs that vest over 3 years. The grant date fair value of the RSUs was $3.2 million based on the price of the Company's common stock of $13.73.
On December 22, 2020, the Company granted 185,000 stock options under the Omnibus Incentive Plan. These options generally vest in five annual installments, starting on the first anniversary of the grant date and have ten-year contractual terms. The grant date fair value of the stock options was $0.8 million based on the use of the Black-Scholes option pricing model with the following assumptions: expected term of 6.5 years; risk-free interest rate of 0.57%; expected volatility of 29.9%; dividend yield of 0%; and fair value at the grant date and weighted-average strike price of $13.73.
The risk-free interest rate is based on the yield of a zero coupon United States Treasury Security with a maturity equal to the expected life of the stock option from the date of the grant. The assumption for expected volatility is based on the historical volatility of a peer group of market participants as the Company has limited historical volatility. It is the Company's intent to retain all profits for the operations of the business for the foreseeable future, as such the dividend yield assumption is zero. The Company applied the simplified method (as described in Staff Accounting Bulletin 110), which is the mid-point between the vesting date and the end of the contract term in determining the expected term of the stock options as the Company has limited historical basis upon which to determine historical exercise periods. All stock options exercised will be settled in common stock.
Class C Incentive Units
Ultra provides Class C Incentive Units as part of their incentive plan. As certain employees of the Company were recipients of the Class C Incentive Units discussed above, the related share-based compensation was recorded by the Company.
The total number of units associated with share-based compensation granted and forfeited during the period from Inception to December 31, 2020 is as follows:
| Time Vesting | Performance Vesting | Total | |||||||||||||||
| December 31, 2017 balance | 35,099,000 | 4,252,000 | 39,351,000 | ||||||||||||||
| Granted | 27,254,387 | 811,000 | 28,065,387 | ||||||||||||||
| Forfeited | (18,125,037) | (4,252,000) | (22,377,037) | ||||||||||||||
| December 31, 2018 balance | 44,228,350 | 811,000 | 45,039,350 | ||||||||||||||
| Granted | 13,050,652 | — | 13,050,652 | ||||||||||||||
| Forfeited | (13,827,845) | (811,000) | (14,638,845) | ||||||||||||||
| December 31, 2019 balance | 43,451,157 | — | 43,451,157 | ||||||||||||||
| Granted | 1,022,954 | — | 1,022,954 | ||||||||||||||
| Forfeited | (1,592,674) | — | (1,592,674) | ||||||||||||||
| December 31, 2020 balance | 42,881,437 | — | 42,881,437 | ||||||||||||||
As of December 31, 2020, 19,827,672 of the units had vested. The units vest on a straight-line basis over the terms of the agreement as described below.
94
There were 42,881,437, 43,451,157 and 45,039,350 Incentive Units issued as of December 31, 2020, 2019 and 2018, respectively. Of these units issued as of December 31, 2020, 42,583,437 units were time vesting units with a five-year vesting period (vesting date varies by employee contract), 298,000 units were time vesting units within a one-year vesting period, 0 were performance vesting units. Of these units issued as of December 31, 2019, 43,153,157 units were time vesting units with a five-year vesting period (vesting date varies by employee contract), 298,000 units were time vesting units with a one-year vesting period, and 0 units were performance vesting units. Of the units issued as of December 31, 2018, 43,930,350 units were time vesting units with a five-year vesting period (vesting date varies by employee contract), 298,000 units were time vesting units with a one-year vesting periods and 811,000 units were performance vesting units. During 2020, 1,592,674 of Class C units were forfeited due to departures of key members of management from the Company.
Units granted during the year ended December 31, 2020 had participation thresholds ranging from $0.58 to $0.64 with fair values ranging from $0.20 to $0.21 per unit.
The Company recognized $1,850, $2,273 and $1,309 of share-based compensation related to the Class C incentive units, for the years ended December 31, 2020, 2019 and 2018, respectively, in selling, general & administrative expenses on the consolidated statement of income and other comprehensive income. The Company used the fair value of the awards on the grant date to determine the share-based compensation expense. To determine the fair value of units issued in 2020, Ultra estimated its enterprise value (“EV”) and evaluated the value of units based on the distribution waterfall outlined below.
To determine the fair value of units issued in early 2020, Ultra used a third-party valuation firm to calculate an enterprise value of $574,000 as determined by discounted cash flow, guideline public company, and merger and acquisition valuation methodologies. Ultra used the aggregate implied equity value based on capital contributions and a Black-Scholes Option Pricing Model utilizing certain assumptions, such as the risk-free interest rate and equity volatility, to determine total equity value. A risk-free interest rate of 0.3% was utilized with a 5-year term. Volatility of 60.0% was utilized based on comparable companies publicly traded common stock prices and the capital structure of Ultra. A weighted average cost of capital of 12.0% was used in the discounted cash flow analysis. Multiples of 13.0x EV/Last twelve months (“LTM”) earnings before interest taxes depreciation and amortization (“EBITDA”) and 12.5x EV/2019 EBITDA and 10.5x EV / 2020 EBITDA were utilized in the guideline public company analysis. Multiples of 13.0x EV/LTM EBITDA and 12.5x EV/Next twelve months EBITDA were utilized in the merger and acquisition analysis.
To determine the fair value of units issued in 2019, Ultra used a third-party valuation firm to calculate an enterprise value of $602,000 as determined by discounted cash flow, guideline public company, and merger and acquisition valuation methodologies. Ultra used the aggregate implied equity value based on capital contributions and a Black-Scholes Option Pricing Model utilizing certain assumptions, such as the risk-free interest rate and equity volatility, to determine total equity value. A risk-free interest rate of 1.6% was utilized with a 5-year term. Volatility of 50.0% was utilized based on comparable companies publicly traded common stock prices and the capital structure of Ultra. A weighted average cost of capital of 11.5% was used in the discounted cash flow analysis. Multiples of 13.0x EV/Last twelve months (“LTM”) earnings before interest taxes depreciation and amortization (“EBITDA”) and EV/2019 EBITDA and 10.5x EV / 2020 EBITDA were utilized in the guideline public company analysis. Multiples of 13.0x EV/LTM EBITDA and 12.5x EV/Next twelve months EBITDA were utilized in the merger and acquisition analysis.
To determine the fair value of units issued in 2018, Ultra estimated its enterprise value (“EV”) and evaluated the value of units based on the distribution waterfall. Ultra selected an enterprise value of $420,000 as determined by discounted cash flow, guideline public company, and merger and acquisition valuation methodologies. A weighted average cost of capital of 11% was used in the discounted cash flow analysis. Multiples of 10.0x EV/Last twelve months (“LTM”) earnings before interest taxes depreciation and amortization (“EBITDA”) and EV/2018 EBITDA and 9.0x EV / 2019 EBITDA were utilized in the guideline public company analysis. Multiples of 10.0x EV/LTM EBITDA and 9.0x EV/Next twelve months EBITDA were utilized in the merger and acquisition analysis.
Performance vesting incentive units
95
The performance vesting incentive units shall become vested only upon the occurrence of a sale of the Company and after certain performance thresholds have been met. ASC 718, Compensation-Stock Compensation, requires a company to recognize cost for awards with performance conditions if and when the Company concludes that it is probable that the performance condition will be achieved, net of an estimate of pre-vesting forfeitures. All remaining units were forfeited in 2019 and there are no units outstanding units as of December 31, 2020.
Warrants
The Company currently has 17,715,000 warrants outstanding. Each warrant entitles the registered holder to purchase one whole share of the Company's common stock at a price of $11.50 per share. The warrants will expire on October 16, 2025 or earlier upon redemption of liquidation.
Earnings per Share
Earnings per share has been computed by dividing net loss available to common stockholders by the weighted average number of common shares outstanding during the respective period. Diluted earnings per share has been computed by dividing net loss available to common stockholders by the weighted average number of common shares and dilutive potential common shares outstanding during the respective period. Diluted earnings per share reflect the assumed exercise, settlement, and vesting of all dilutive securities, except when the effect is anti-dilutive. Potentially dilutive securities consist of shares issuable upon the exercise of stock options, issuance of earnout shares, exercise of warrants, and vesting of restricted stock awards.
The following table provides the computation of basic and diluted earnings per share:
| Year Ended December 31, | |||||||||||||||||
| 2020 | 2019 | 2018 | |||||||||||||||
| Numerator: | |||||||||||||||||
| Net loss | $ | (524) | $ | (9,024) | $ | (3,170) | |||||||||||
| Denominator: | |||||||||||||||||
| Weighted average common shares | 66,294,576 | 54,534,022 | 54,534,022 | ||||||||||||||
| Add effect of dilutive securities: | |||||||||||||||||
| Stock-based awards | — | — | — | ||||||||||||||
| Weighted average common shares assuming dilution | 66,294,576 | 54,534,022 | 54,534,022 | ||||||||||||||
| Earnings per share: | |||||||||||||||||
| Basic | $ | (0.01) | $ | (0.17) | $ | (0.06) | |||||||||||
| Diluted | $ | (0.01) | $ | (0.17) | $ | (0.06) | |||||||||||
| Anti-dilutive shares excluded from calculation of diluted EPS: | |||||||||||||||||
| Restricted stock units - granted | 230,000 | — | — | ||||||||||||||
| Stock options - granted | 185,000 | — | — | ||||||||||||||
| Warrants - outstanding | 17,715,000 | — | — | ||||||||||||||
| Earnout shares | 19,700,000 | ||||||||||||||||
| Total anti-dilutive shares | 37,830,000 | — | — | ||||||||||||||
10.Income taxes
The income tax benefits (expenses) from continuing operations were as follows:
96
| Year Ended December 31, | |||||||||||||||||
| 2020 | 2019 | 2018 | |||||||||||||||
| Current: | |||||||||||||||||
| Federal | $ | (1,346) | $ | (2,623) | $ | 261 | |||||||||||
| State | (864) | (87) | (435) | ||||||||||||||
| Total current provision | (2,210) | (2,710) | (174) | ||||||||||||||
| Deferred: | |||||||||||||||||
| Federal | $ | (510) | $ | 3,637 | $ | 1,963 | |||||||||||
| State | 2,287 | 1,493 | 2,090 | ||||||||||||||
| Total deferred benefit | 1,777 | 5,130 | 4,053 | ||||||||||||||
| Total (expense) benefit for income taxes | $ | (433) | $ | 2,420 | $ | 3,879 | |||||||||||
Prior to the Paya Holdings Business Combination, corporate income tax returns were filed by GTCR-Ultra Intermediate Holdings, Inc. and Subsidiaries, Stewardship Technology, Inc., and GTCR/Ultra Blocker, Inc., separately. The Paya Holdings Business Combination resulted in the formation of a new consolidated group for U.S. Federal tax purposes whereby the historical tax attributes of the aforementioned entities and their subsidiaries were carried over to the new consolidated group. In accordance with ASC 740-20-45-11, the Paya Holdings Business Combination is considered a transaction among or with its shareholders requiring the tax effects to be recorded through equity. The Company recorded a net deferred tax benefit of $10.3 million through equity to account for the change in deferred tax assets and liabilities. In accordance with ASC 740-10-25-32, the Paya Holdings Business Combination resulted in certain entities that used to flow through to a partnership now flowing through to a corporation. Deferred tax assets and liabilities were recognized for temporary differences as of the date of the Paya Holdings Business Combination. The Company recorded a benefit of $(0.6) million as part of deferred tax expense as a result. TPG is only included within this consolidated group post acquisition.
The provision for income taxes differs from the amount computed by applying the statutory federal income tax rate to income before provision for income taxes. The rate reconciliation for continuing operations presented below is based on the U.S. federal statutory tax rate of 21% for the years ended December 31, 2020, 2019, and 2018.
| Year Ended December 31, | |||||||||||||||||
| 2020 | 2019 | 2018 | |||||||||||||||
| Tax computed at federal statutory rate | 21.00 | % | 21.00 | % | 21.00 | % | |||||||||||
| State taxes (net of federal benefit) | 1767.39 | % | 12.44 | % | 20.56 | % | |||||||||||
| Nondeductible expenses | (5.66 | %) | (0.19 | %) | (0.48 | %) | |||||||||||
| TRA mark-to-market | 222.07 | % | 0.00 | % | 0.00 | % | |||||||||||
| Pass-through income | (531.33 | %) | (7.33 | %) | 1.27 | % | |||||||||||
| Stock compensation | (424.39 | %) | (4.17 | %) | (3.82 | %) | |||||||||||
| Transaction cost | 0.00 | % | 0.00 | % | (1.79 | %) | |||||||||||
| Deferred financing cost amortization | 0.00 | % | 0.00 | % | 14.84 | % | |||||||||||
| Uncertain tax positions - interest | 0.00 | % | (1.19 | %) | (1.25 | %) | |||||||||||
| Uncertain tax positions - liability | 0.00 | % | (0.81 | %) | 0.00 | % | |||||||||||
| Change in entity type | (574.83 | %) | 0.00 | % | 0.00 | % | |||||||||||
| Valuation allowance | (1159.80 | %) | 0.00 | % | 0.00 | % | |||||||||||
| Return to provision adjustments | 209.18 | % | 1.39 | % | 3.58 | % | |||||||||||
| Income tax (expense) benefit | (476.37 | %) | 21.14 | % | 53.91 | % | |||||||||||
97
The Company’s income tax provision was computed based on the federal statutory rate and the average state statutory rates, net of the related federal benefit. Deferred income taxes reflect the net tax effects of temporary differences between the carrying amounts of assets and liabilities for financial reporting purposes and the amounts used for income tax purposes. Significant components of the Company’s deferred tax assets and liabilities are as follows:
| December 31, 2020 | December 31, 2019 | ||||||||||
| Deferred tax assets | |||||||||||
| Accrued expenses | $ | 1,348 | $ | 1,420 | |||||||
| Bad debt reserve | 324 | 351 | |||||||||
| Deferred rent | 149 | 124 | |||||||||
| Net operating loss carryforward - federal and state | 1,393 | 830 | |||||||||
| Interest expense limitation | 1,368 | 3,247 | |||||||||
| Goodwill amortization | 16,513 | — | |||||||||
| Unrealized gain/loss on change in fair value of derivative | — | 46 | |||||||||
| Other | 7 | — | |||||||||
| Total net deferred tax assets | $ | 21,102 | $ | 6,018 | |||||||
| Deferred tax liabilities | |||||||||||
| Fixed assets | (2,519) | (2,755) | |||||||||
| Intangible amortization | (23,084) | (27,751) | |||||||||
| California 338(g) amortization | (653) | (489) | |||||||||
| Other | — | (20) | |||||||||
| Total deferred tax liabilities | (26,256) | (31,015) | |||||||||
| Valuation allowance | (9,464) | (14) | |||||||||
| Net deferred tax liability | $ | (14,618) | $ | (25,011) | |||||||
The Company had a $4.0 million and $1.8 million federal operating loss carryforward as of December 31, 2020, and December 31, 2019, respectively, which can be carried forward indefinitely. The Company had a $8.0 million and $6.7 million net operating loss carryforward for various state jurisdictions as of December 31, 2020, and December 31, 2019, respectively.
ASC 740, Income Tax requires deferred tax assets to be reduced by a valuation allowance, if, based on the weight of available positive and negative evidence, it is more likely than not that some portion or all of the deferred tax assets will not be realized. In accordance with this requirement, the Company regularly reviews the recoverability of its deferred tax assets and establishes a valuation allowance if appropriate. In determining the amount of any required valuation allowance, the Company considers the history of profitability, projections of future profitability, the reversal of future taxable temporary differences, the overall amount of deferred tax assets, and the timeframe necessary to utilize the deferred tax assets prior to their expiration. Based on the weight of all positive and negative quantitative and qualitative evidence available as outlined above, management has concluded that it is more likely than not that the Company will be able to realize a portion of its federal and state deferred tax assets in the foreseeable future and has recorded a valuation allowance of $9.5 million and $0.0 million against these assets as of December 31, 2020, and December 31, 2019, respectively.
As of December 31, 2020, the earliest tax year open to federal and state examinations is 2017 and no years are currently under examination in any jurisdiction. There are no new income tax audits open as of December 31, 2020. The Company believes based on the recognition and measurement principles of ASC 740 that the unrecognized tax benefits recorded for all remaining open years in all jurisdictions, including those currently under
98
audit, is appropriate. The Company does not expect its unrecognized tax benefits to significantly change in the next 12 months.
As of December 31, 2019, all unrecognized tax benefits were settled for $1.7 million.
The aggregate change in the balance of gross unrecognized tax benefits, which excludes interest and penalties, for 2020, 2019 and 2018 is as follows:
| Year Ended December 31, | |||||||||||||||||
| 2020 | 2019 | 2018 | |||||||||||||||
| Beginning balance | $ | — | $ | 1,730 | $ | 1,730 | |||||||||||
| Additions based on tax positions related to prior years | — | — | — | ||||||||||||||
| Additions based on tax positions related to current years | — | — | — | ||||||||||||||
| Reductions for tax positions due to lapse of statute | — | — | — | ||||||||||||||
| Other changes | — | (1,730) | — | ||||||||||||||
| Ending balance | $ | — | $ | — | $ | 1,730 | |||||||||||
Tax Receivable Agreement liability (refer to footnote 12)
The Paya Holdings Business Combination was treated for tax purposes as a tax-free reorganization under Internal Revenue Code Section 368(a)(2)(E) followed by an exchange of property, meeting the requirements of Internal Revenue Code Section 351. Ultra and Fund received a mix of equity and cash proceeds and pursuant to Internal Revenue Code Section 351(b) recognized gain to the extent of the cash proceeds, which resulted in additional tax basis in a portion of the property exchanged to the Company. Pursuant to the Tax Receivable Agreement ("TRA"), the Company is obligated to make payments to Ultra and Fund equal to 85% of the realized tax benefits that Holdings realizes or is deemed to realize as a result of the Designated Tax Attributes. Designated Tax Attributes include (i) the tax basis increases resulting from the exchange of Holdings and GTCR/Ultra Blocker, Inc. equity interests in exchange for shares of the Company’s common stock and cash pursuant to the Merger Agreement, (ii) imputed interest deemed to be paid by the Company as a result of, and additional tax basis arising from, any payments the Company makes under the TRA, (iii) tax basis of assets immediately prior to the Business Combination that are held by Holdings and its subsidiaries or GTCR/Ultra Blocker, Inc., and (iv) net operating losses and other section 163(j) carryforwards of Holdings’ subsidiaries or GTCR/Ultra Blocker, Inc. As of December 31, 2020, a liability of $19.6 million was recorded based on the amount deemed probable under ASC 450. The total TRA payment obligation assuming sufficient taxable income to recognize all Designated Tax Attributes is $31.8 million. No payments were made pursuant to the TRA during the year ended December 31, 2020. Both the TRA-related deferred tax assets and the Company’s obligation are estimates that are subject to change. Any changes in the fair value of the TRA liability are recorded in other income (expense) on the consolidated statements of income and other comprehensive income. The Company recorded a gain of $1.2 million for the year ended December 31, 2020 associated with the change in the TRA liability.
Coronavirus Aid, Relief and Economic Security Act ("CARES Act")
On March 27, 2020, President Trump signed into law the CARES Act. Intended to provide economic relief to those impacted by the COVID-19 pandemic, the CARES Act includes provisions, among others, addressing the carryback of NOLs for specific periods, refunds of alternative minimum tax credits, temporary modifications to the limitations placed on the tax deductibility of net interest expenses, and technical amendments for qualified improvement property (“QIP”). Additionally, the CARES Act, in efforts to enhance business’ liquidity, provides for refundable employee retention tax credits and the deferral of the employer-paid portion of social security taxes.
The CARES Act provides for the deferral of the employer-paid portion of social security payroll taxes. We have elected to defer the employer-paid portion of social security payroll taxes through December 31, 2020, of $0.9 million, and will remit 50% of such amounts during each calendar year 2021 and 2022, respectively.
99
The CARES Act also contains modifications on the limitation of business interest for tax years beginning in 2019 and 2020. The modifications to Section 163(j) increase the allowable business interest deduction from 30% of adjusted taxable income to 50% of adjusted taxable income. This modification significantly increased the allowable interest expense deduction of the Company in 2019 resulting in reduction to the deferred tax asset of $1.3 million.
11.Fair Value
The Company makes recurring fair value measurements of contingent liabilities arising from the FBS acquisitions using Level 3 unobservable inputs. This amount relates to expected earnout payments related to certain growth metrics related to the financial performance of FBS in the 12 months from January 1, 2019 through December 31, 2019 as laid out in the acquisition agreement. The fair value of the contingent liability was zero at December 31, 2020 and December 31, 2019, respectively.
The Company makes recurring fair value measurements for derivative instruments. Refer to Note 8. Derivatives for additional information.
There were no transfers into or out of Level 3 during the years ended December 31, 2020 and 2019.
Other financial instruments not measured at fair value on the Company’s Consolidated Balance Sheets at December 31, 2020 and 2019 include cash, trade receivable, prepaid expenses and other current assets, accounts payable, and accrued expenses and other current liabilities as their estimated fair values reasonably approximate their carrying value as reported on the Consolidated Balance Sheets. The Company’s debt obligations are carried at amortized cost less debt issuance costs. Amortized cost approximates fair value.
12.Commitments and contingencies
Operating leases
The Company leases certain property and equipment for various periods under noncancellable operating leases. The Company’s future minimum lease payments under such agreements at December 31, 2020 were approximately:
| Year ending December 31, | (In thousands) | ||||
| 2021 | $ | 1,265 | |||
| 2022 | 1,294 | ||||
| 2023 | 1,271 | ||||
| 2024 | 1,004 | ||||
| 2025 | 899 | ||||
| Thereafter | 609 | ||||
| Total | $ | 6,342 | |||
Rental expense was $1,699, $1,765 and $1,581 for the years ended December 31, 2020, December 31, 2019 and December 31, 2018, respectively.
The Company vacated a portion of its leased premises at Reston, VA in 2015. The Company accounted for the remaining lease payments attributable to the vacated portion by recording an onerous lease liability of $1,225 in other long-term liabilities. The Company entered into a sub-lease of the space in January 2018 that will provide future minimum rental income of $1,189. The Company vacated an additional portion of its leased premises at
100
Reston, VA in fiscal year 2019 and completely vacated the premises in August 2020. The Company accounted for the remaining lease payments attributable to the vacated portion by recording an onerous lease liability of $302 in 2019 in other current liabilities in accordance with ASC 420 - Exit or Disposal Cost Obligations. The obligation related to onerous leases recorded in other current liabilities was $0 and $397 as of December 31, 2020 and 2019, respectively.
Liabilities under Tax Receivable Agreement
The Company is party to the TRA under which we are contractually committed to pay Ultra 85% of the amount of any tax benefits that we actually realize, or in some cases are deemed to realize, as a result of certain transactions. The Company is not obligated to make any payments under the TRA until the tax benefits associated the transaction that gave rise to the payment are realized. Amounts payable under the TRA are contingent upon, among other things, generation of future taxable income over the term of the TRA. If the Company does not generate sufficient taxable income in the aggregate over the term of the TRA to utilize the tax benefits, then the Company would not be required to make the related TRA payments. As of December 31, 2020, the Company recognized $19,627 of liabilities relating to our obligations under the TRA, based on our estimate of the probable amount of future benefit. The total potential payments to be made under the TRA, assuming sufficient future taxable income to realize 100% of the tax benefits is $31,847. Any changes in the value of the TRA liability are recorded in other income (expense) on the consolidated statements of income and other comprehensive income.
Legal matters
From time to time the Company is a party to legal proceedings arising in the ordinary course of business. In accordance with U.S. GAAP, the Company records a liability when it is both probable that a liability has been incurred and the amount of the loss can be reasonably estimated. These provisions are reviewed regularly and adjusted to reflect the impacts of negotiations, settlements, rulings, advice of legal counsel, and other information and events pertaining to a particular case. The Company recently settled a Fair Labor Standards Act (“FLSA”) collective action lawsuit for which it was party to. As of December 31, 2019, $169 had been disbursed for settlement related payments. As of December 31, 2019 and December 31, 2020, no liability remains as the matter has been closed.
13.Related party transactions
Contributions from Ultra
In connection with the acquisition of FBS, Ultra contributed all of its shares in Stewardship valued at $4,000 as of the acquisition date of FBS to the Company as a capital contribution. Subsequent to the acquisition of FBS, Ultra also contributed all of its acquired membership interest in FBS valued at $4,500 as of the acquisition date of FBS to the Company as a capital contribution. The Company also received cash contributions from Ultra in the amounts of $12,211, $530 and $3,588 for the years ended December 31, 2020, 2019 and 2018, respectively.
Receivable from affiliate
The Company, previously as a wholly-owned subsidiary of Ultra, funded certain transactions on behalf of its parent company that result in a receivable from affiliate between the two entities. These transactions include but are not limited to, audit and tax fees and share repurchases. The Company had a related party receivable from affiliate of $0 and $24,282 as of December 31, 2020 and December 31, 2019, respectively. In the year ended December 31, 2020, Holdings settled its receivable from affiliate balance in connection with the business combination transaction, which resulted in a distribution of $24,943 to Ultra.
Advisory Agreement
The Company entered into an Advisory Agreement with GTCR Management XI LP, an affiliate of GTCR, on August 1, 2017 for business consulting services. In exchange for those services the Company will pay GTCR
101
Management XI LP an annual advisory fee of $1,000 payable in advance in quarterly installments. The Company recorded total charges of $750, $1,000, and $1,000 related to the Advisory Agreement in selling, general & administrative expenses on the consolidated statement of income and other comprehensive income for the years ended December 31, 2020, 2019, and 2018, respectively. The Company recorded no related party payable to GTCR on the consolidated balance sheet as of December 31, 2020, 2019, and 2018, respectively.
The Company reimburses GTCR for expenses incurred as a result of the Acquisition and for services related to the Advisory Agreement. The Company has recorded total charges for expenses incurred of $0, $0 and $423 for the years ended December 31, 2020, 2019, and 2018, respectively, in selling, general & administrative expenses on the consolidated statement of income and other comprehensive income. The Company recorded no related party payable to GTCR on the consolidated balance sheet as of December 31, 2020, 2019, and 2018, respectively. The Advisory Agreement was terminated on October 16, 2020 in connection with the consummation of the Business Combination.
Related party transactions – Antares
Antares is an investor in GTCR and lender of the debt incurred to fund the Acquisition and the subsequent acquisition of FBS. As such, Antares is considered a related party. The Company recorded interest expense of $15,671, $17,669 and $11,911 in expense on the consolidated statement of income and other comprehensive income for the years ended December 31, 2020, 2019, and 2018 respectively. The outstanding balance of debt at December 31, 2020 recorded on the consolidated balance sheet was $222,516, net of debt issuance costs of $6,161. As disclosed in Note 7, the Company amended the credit agreement and GTCR-Ultra III assumed all loans and commitments on December 31, 2018.
Transaction Services Agreement
The TSA provided for the continued provision of certain corporate overhead services to the Company by Sage Group and its affiliates. The services provided primarily consisted of certain accounting, information technology, human resources, and other general and administrative services associated with the Successor’s transition to a stand-alone company. The services were provided to the Successor from August 2017 through July 2018. The TSA charges are included in selling, general & administrative expenses on the consolidated statement of income and other comprehensive income. The Company recorded total charges related to the TSA of $1,242 in selling, general & administrative expenses for the year ended December 31, 2018, on the consolidated statement of income and other comprehensive income. The Company completed the TSA in July 2018.
Strategic Alliance Agreement
The SAA establishes the terms of the business relationship between Sage Software Inc. ("SSI") and Paya, including the servicing of existing or legacy customer relationships and the referral and acquisition of new customers; the maintenance requirements of the software; the payment details of revenue share by Paya to SSI for customer referrals; the respective parties’ IP rights; and Paya’s prospective entry into the Sage Partner Program as a Preferred Partner to pay a percentage of net revenues to SSI depending on the type of merchant and the number of new merchants added during the period. The Company recorded expenses related to the SAA of $6,683 for the year ended December 31, 2018, in cost of services exclusive of depreciation and amortization on the consolidated statement of income and other comprehensive income.
14.Defined contribution plan
The Company maintains a 401(k) Plan as a defined contribution retirement plan for all eligible employees. The 401(k) Plan provides for tax-deferred contributions of employees’ salaries, limited to a maximum annual amount as established by the IRS. The plan enrolls employees immediately with no age or service requirement. The Company matches 50% of employees’ contributions up to the first 7% contributed. Matching contributions made to an employee’s account are 100% vested as of the date of contribution. The 401(k) Plan employer match was $721, $696 and $486 in the years ended December 31, 2020, 2019 and 2018, respectively.
102
15.Segments
The Company determines its operating segments based on ASC 280, Segment Reporting. The Company reorganized its segments in 2020. Based on the manner in which the chief operating decision making group (“CODM”) manages and monitors the performance of the business in 2020, the Company currently has two operating and reportable segments: Integrated Solutions and Payment Services. All prior periods, are presented based on the current segment structure.
More information about our two reportable segments:
•Integrated Solutions - Our Integrated Solutions segment represents the delivery of our credit and debit card payment solutions, and to a lesser extent, ACH processing solutions to customers via integrations with software partners across our strategic vertical markets. Our Integrated Solutions partners include vertical focused front-end Customer Relationship Management software providers as well as back-end Enterprise Resource Planning and accounting solutions.
•Payment Services - Our Payment Services segment represents the delivery of card payment processing solutions to our customers through resellers, as well as ACH, check, and gift card processing. Card payment processing solutions in this segment do not originate via a software integration but still utilize Paya’s core technology infrastructure. ACH, check, and gift card processing may or may not be integrated with third-party software.
All segment revenue is from external customers.
The following tables present total revenues and segment gross profit, excluding depreciation and amortization, for each reportable segment and includes a reconciliation of segment gross profit to total U.S. GAAP operating profit, excluding depreciation and amortization, by including certain corporate-level expenses.
| Year Ended December 31, | |||||||||||||||||
| 2020 | 2019 | 2018 | |||||||||||||||
| Integrated Solutions | $ | 122,324 | $ | 119,767 | $ | 100,326 | |||||||||||
| Payment Services | 83,724 | 83,607 | 84,752 | ||||||||||||||
| Total Revenue | 206,048 | 203,374 | 185,078 | ||||||||||||||
| Integrated Solutions gross profit | 65,266 | 62,667 | 49,846 | ||||||||||||||
| Payment Services gross profit | 38,663 | 39,143 | 39,205 | ||||||||||||||
| Total segment gross profit | 103,929 | 101,810 | 89,051 | ||||||||||||||
| Selling, general & administrative expenses | (63,035) | (69,943) | (64,383) | ||||||||||||||
| Depreciation and amortization | (24,562) | (22,436) | (18,339) | ||||||||||||||
| Interest expense | (17,637) | (20,043) | (13,630) | ||||||||||||||
| Other income (expense) | 1,214 | (832) | 104 | ||||||||||||||
| Income (loss) before income taxes | $ | (91) | $ | (11,444) | $ | (7,197) | |||||||||||
Segment assets are not included in the CODM reporting package as they are not considered as part of the CODM’s allocation of resources. The Company does not have any revenue or assets outside the United States. There were no single customers from either operating segment that represented 10% or more of the Company’s consolidated revenues for the years ended December 31, 2020, 2019 and 2018, respectively. There were no transactions between reportable operating segments for the years ended December 31, 2020, 2019 and 2018, respectively.
103
16.Quarterly Financial Data (Unaudited)
The following tables present certain unaudited consolidated quarterly financial information for each of the four quarters in the years ended December 31, 2020 and 2019, respectively. This quarterly information has been prepared on the same basis as the consolidated financial statements and includes all adjustments necessary to state fairly the information for the periods presented, which management considers necessary for a fair presentation when read in conjunction with the consolidated financial statements and notes. We believe these comparisons of consolidated quarterly selected financial data are not necessarily indicative of future performance.
| Quarter Ended ($ in thousands) | |||||||||||||||||||||||
| 2020 | March 31, | June 30, | September 30, | December 31, | |||||||||||||||||||
| Total Revenue | $ | 49,139 | $ | 51,087 | $ | 51,819 | $ | 54,003 | |||||||||||||||
| Operating Income (loss) | $ | 3,065 | $ | 6,160 | $ | 5,978 | $ | 1,129 | |||||||||||||||
| Net Income (loss) | $ | (675) | $ | 625 | $ | 1,601 | $ | (2,075) | |||||||||||||||
| Quarter Ended ($ in thousands) | |||||||||||||||||||||||
| 2019 | March 31, | June 30, | September 30, | December 31, | |||||||||||||||||||
| Total Revenue | $ | 49,897 | $ | 51,735 | $ | 50,569 | $ | 51,173 | |||||||||||||||
| Operating Income (loss) | $ | 109 | $ | 5,343 | $ | 3,662 | $ | 317 | |||||||||||||||
| Net Income (loss) | $ | (3,463) | $ | 155 | $ | (633) | $ | (5,083) | |||||||||||||||
17.Subsequent Events
On February 3, 2021, the Company entered into an interest rate cap agreement with a notional amount of $171,525. The effective date is March 31, 2021 and terminates on March 31, 2023. The Company paid a premium of $67 for the right to receive payments if LIBOR rises above the cap rate of 1.00%.
104
Item 9. Changes in and Disagreements with Accountants on Accounting and Financial Disclosure
There were no changes in or disagreements on any matters of accounting principles or financial statement disclosure between us and our independent auditors during our two most recent fiscal years or any subsequent interim period.
Item 9A. Controls and Procedures
Disclosure controls and procedures are controls and other procedures that are designed to ensure that information required to be disclosed in our reports filed or submitted under the Exchange Act is recorded, processed, summarized and reported within the time periods specified in the SEC’s rules and forms. Disclosure controls and procedures include, without limitation, controls and procedures designed to ensure that information required to be disclosed in Company reports filed or submitted under the Exchange Act is accumulated and communicated to management, including our Chief Executive Officer and Chief Financial Officer, to allow timely decisions regarding required disclosure.
As required by Rules 13a-15 and 15d-15 under the Exchange Act, our Chief Executive Officer and Chief Financial Officer carried out an evaluation of the effectiveness of the design and operation of our disclosure controls and procedures as of December 31, 2020. Based upon their evaluation, our Chief Executive Officer and Chief Financial Officer concluded that our disclosure controls and procedures (as defined in Rules 13a- 15 (e) and 15d-15 (e) under the Exchange Act) were effective as of December 31, 2020.
Changes in Internal Control over Financial Reporting
In October 2020, in connection with the closing of the Business Combination, the Board approved and adopted a Code of Ethics for the Chief Executive Officer and Senior Financial Officers (the “Code of Ethics”). The Code of Ethics applies to the Company’s chief executive officer, principal financial officer, principal accounting officer, and controller (each, a “Covered Officer”). In addition to other policies and procedures adopted by the Company, the Covered Officers are subject to the Company’s Code of Business Conduct and Ethics (“Code of Conduct”) that applies to all officers, directors and employees of the Company and its subsidiaries. These replaced the Code of Ethics adopted by FinTech in connection with its initial public offering in November 2018.
The Code of Ethics reflects (among other matters) amendments, clarifications, revisions and updates in relation to (i) the general principles and standards of ethical conduct of the Covered Officers designed to deter wrongdoing, (ii) the responsibility of the Covered Officers regarding public disclosure of the Company’s public communications, including, but not limited to, the full, fair, accurate, timely and understandable disclosure in reports and documents filed with or submitted to the SEC, (iii) the Covered Officers’ internal control over financial reporting and record keeping, (iv) internal procedures for the reporting of violations of the Code of Ethics, and (v) requests for waivers and amendments of the Code of Ethics. The amendments, clarifications, revisions and updates reflected in the Code of Ethics did not relate to or result in any waiver, explicit or implicit, of any provision of the FinTech Code of Ethics.
As discussed elsewhere in this Annual Report on Form 10-K, in October 2020, we completed the Business Combination and are engaged in the process of the design and implementation of our internal control over financial reporting in a manner commensurate with the scale of our operations post-Business Combination.
Management’s Annual Report on Internal Control over Financial Reporting
Management is responsible for designing, implementing and maintaining adequate internal control over financial reporting, as such term is defined in Rules 13a-15(f) and 15d-15(f) under the Exchange Act. Internal control over financial reporting, no matter how well designed, has inherent limitations. Therefore, even those systems determined to be effective can provide only reasonable assurance with respect to financial statement preparation and presentation. Further, because of changes in conditions, the effectiveness of internal control over financial reporting may vary over time.
105
As discussed elsewhere in this report, we completed the Business Combination on October 16, 2020. Prior to the Business Combination, Paya was a private company and therefore its controls were not required to be designed or maintained in accordance with Rules 13a-15 and 15d-15 under the Exchange Act. The design and implementation of internal control over financial reporting for the Company post-Business Combination has required and will continue to require significant time and resources from management and other personnel. Because of this, the design and ongoing development of our framework for implementation and evaluation of internal control over financial reporting is in its preliminary stages. As a result, management was unable, without incurring unreasonable effort or expense to conduct an assessment of our internal control over financial reporting as of December 31, 2020. Accordingly, we are excluding management’s report on internal control over financial reporting pursuant to Section 215.02 of the SEC Division of Corporation Finance’s Regulation S-K Compliance & Disclosure Interpretations.
Item 9B. Other Information
Defaults upon Senior Securities
None
106
Part III
Item 10. Directors, Executives, Officers and Corporate Governance
The information required by Item 10 hereby is incorporated by reference to such information as set forth in the Company's Definitive Proxy Statement for the 2020 Annual Meeting of Stockholders.
Item 11. Executive Compensation
The information required by Item 11 hereby is incorporated by reference to such information as set forth in the Company's Definitive Proxy Statement for the 2020 Annual Meeting of Stockholders under the headings “Executive Compensation,” “Director Compensation,” and “Compensation Committee Interlocks and Insider Participation.”
Item 12. Security Ownership of Certain Beneficial Owners and Management Related Shareholder Matters
The information required by Item 12 hereby is incorporated by reference to such information as set forth in the Company's Definitive Proxy Statement for the 2020 Annual Meeting of Stockholders under the heading “Security Ownership of Certain Beneficial Owners and Management”.
Item 13. Certain Relationships and Related Transactions, and Director Independence
The information required by Item 13 hereby is incorporated by reference to such information as set forth in the Company's Definitive Proxy Statement for the 2020 Annual Meeting of Stockholders under the headings “Certain Relationships and Related Party Transactions” and “Director Independence”.
Item 14. Principal Accounting Fees and Services
The information required by Item 14 hereby is incorporated by reference to such information as set forth in the Company's Definitive Proxy Statement for the 2020 Annual General Meeting of Shareholders under the heading “Audit Fee Disclosure”.
107
Part IV
Item 15. Exhibits
| Exhibit No. | Description | ||||
| Agreement and Plan of Merger, dated as of August 3, 2020, by and among GTCR-Ultra Holdings, LLC, GTCR-Ultra Holdings II, LLC, FinTech III Merger Sub Corp., FinTech Acquisition Corp. III, FinTech Acquisition Corp. III Parent Corp., GTCR/Ultra Blocker, Inc., and GTCR Fund XI/C LP (included as Annex A the definitive Proxy Statement/Prospectus filed on September 23, 2020). | |||||
| Certificate of Incorporation of Paya Holdings Inc., filed with the Secretary of State of the State of Delaware on October 16, 2020 (incorporated by reference to Exhibit 3.1 to Paya Holdings Inc.’s Form 8-K filed on October 22, 2020). | |||||
| Bylaws of Paya Holdings Inc. (incorporated by reference to Exhibit 3.2 to Paya Holdings Inc.’s Form 8-K filed on October 22, 2020). | |||||
| Specimen Common Stock Certificate (incorporated by reference to Exhibit 4.1 to the Registration Statement on Form S-4 filed by FinTech Acquisition Corp. III Parent Corp. on September 16, 2020). | |||||
| Specimen Warrant Certificate (included in Exhibit 4.3) (incorporated by reference to Exhibit 4.2 to Paya Holding Inc.’s Form 8-K filed on October 22, 2020). | |||||
| Warrant Agreement, dated November 15, 2018, between Continental Stock Transfer & Trust Company and FinTech Acquisition Corp. III. (incorporated by reference to Exhibit 4.1 of FinTech Acquisition Corp. III’s Current Report on Form 8-K filed on November 21, 2018). | |||||
| Description of Paya Holdings Inc.’s Securities. | |||||
| Registration Rights Agreement, dated October 16, 2020, by and among FinTech Acquisition Corp. III Parent Corp. and certain stockholders of Parent (incorporated by reference to Exhibit 10.1 to Paya Holdings Inc.’s Form 8-K filed on October 22, 2020). | |||||
| Sponsor Support Agreement dated August 3, 2020, by and among FinTech Acquisition Corp. III, GTCR-Ultra Holdings II, LLC, FinTech Acquisition Corp. III Parent Corp., GTCR-Ultra Holdings, LLC and certain stockholders of FinTech Acquisition Corp. III (incorporated by reference to Exhibit 10.1 of FinTech Acquisition Corp. III’s Current Report on Form 8-K filed on August 3, 2020). | |||||
| Director Nomination Agreement, dated as of October 16, 2020, by and among Paya Holdings Inc., GTCR-Ultra Holdings, LLC, GTCR Fund XI/B LP and GTCR Fund XI/C LP (incorporated by reference to Exhibit 10.3 to Paya Holdings Inc.’s Form 8-K filed on October 22, 2020). | |||||
| Tax Receivable Agreement, dated as of October 16, 2020, by and among FinTech Acquisition Corp. III Parent Corp., GTCR-Ultra Holdings, LLC, GTCR Ultra-Holdings II, LLC, GTCR/Ultra Blocker, Inc., a Delaware corporation and GTCR Fund XI/C LP (incorporated by reference to Exhibit 10.3 to Paya Holdings Inc.’s Form 8-K filed on October 22, 2020). | |||||
| Form of Paya Holdings Inc. Omnibus Incentive Plan (included as Annex B to the definitive Proxy Statement/Prospectus filed on September 23, 2020). | |||||
| Form of PIPE Subscription Agreement (incorporated by reference to Exhibit 10.2 of FinTech Acquisition Corp. III’s Current Report on Form 8-K filed on August 3, 2020). | |||||
| Form of Director/Officer Indemnification Agreement (incorporated by reference to Exhibit 10.7 to Paya Holdings Inc.’s Form 8-K filed on October 22, 2020). | |||||
| Employment Agreement, dated as of October 16, 2020, by and between Paya Holdings Inc., Paya, Inc. and Jeffrey Hack (incorporated by reference to Exhibit 10.8 to Paya Holdings Inc.’s Form 8-K filed on October 22, 2020). | |||||
| Employment Agreement, dated as of October 16, 2020, by and between Paya Holdings Inc., Paya, Inc. and Glenn Renzulli (incorporated by reference to Exhibit 10.9 to Paya Holdings Inc.’s Form 8-K filed on October 22, 2020). | |||||
108
| Employment Agreement, dated as of October 16, 2020, by and between Paya Holdings Inc., Paya, Inc. and Mark Engels (incorporated by reference to Exhibit 10.10 to Paya Holdings Inc.’s Form 8-K filed on October 22, 2020). | |||||
| List of subsidiaries of Paya Holdings Inc. | |||||
| Consent of Ernst & Young. | |||||
| Certification of the Chief Executive Officer pursuant to Exchange Act Rules Rule 13a-14(a), as adopted pursuant to Section 302 of the Sarbanes-Oxley Act of 2002, filed herewith. | |||||
| Certification of the Chief Financial Officer pursuant to Exchange Act Rules Rule 13a-14(a), as adopted pursuant to Section 302 of the Sarbanes-Oxley Act of 2002, filed herewith. | |||||
| Certification of the Chief Executive Officer pursuant to 18 U.S.C. Section 1350. | |||||
| Certification of the Chief Financial Officer pursuant to 18 U.S.C. Section 1350. | |||||
-----------------
* The certifications furnished in Exhibit 32.1 and 32.2 hereto are deemed to accompany this Annual Report on Form 10-K and will not be deemed “filed” for purposes of Section 18 of the Securities Exchange Act of 1934, as amended, except to the extent that the registrant specifically incorporates it by reference.
+ Management contract or compensatory plan or arrangement
109
SIGNATURES
Pursuant to the requirements of the Section 13 or Section 15(d) of the Securities Exchange Act of 1934, as amended, the registrant has duly caused this report to be signed on its behalf by the undersigned thereunto duly authorized.
| Name | Position | Date | ||||||||||||
| /s/ Jeff Hack | Chief Executive Officer and Director | March 8, 2021 | ||||||||||||
| Jeff Hack | (Principal Executive Officer) | |||||||||||||
| /s/ Glenn Renzulli | Chief Financial Officer | March 8, 2021 | ||||||||||||
| Glenn Renzulli | (Principal Financial Officer and Principal Accounting Officer) | |||||||||||||
| /s/ Aaron Cohen | Director | March 8, 2021 | ||||||||||||
| Aaron Cohen | ||||||||||||||
| /s/ KJ McConnell | Director | March 8, 2021 | ||||||||||||
| KJ McConnell | ||||||||||||||
| /s/ Collin Roche | Director | March 8, 2021 | ||||||||||||
| Collin Roche | ||||||||||||||
| /s/ Anna May Trala | Director | March 8, 2021 | ||||||||||||
| Anna May Trala | ||||||||||||||
| /s/ Stuart Yarbrough | Director | March 8, 2021 | ||||||||||||
| Stuart Yarbrough | ||||||||||||||
| /s/ Jim Bonetti | Director | March 8, 2021 | ||||||||||||
| Jim Bonetti | ||||||||||||||
| /s/ Mike Gordon | Director | March 8, 2021 | ||||||||||||
| Mike Gordon | ||||||||||||||
| /s/ Christine Larsen | Director | March 8, 2021 | ||||||||||||
| Christine Larsen | ||||||||||||||
110