EXHIBIT 13
APPENDIX
CATERPILLAR INC.
GENERAL AND FINANCIAL INFORMATION
2003
A-1
TABLE OF CONTENTS
A-2
REPORT OF MANAGEMENT
Caterpillar Inc.
The management of Caterpillar Inc. has prepared the accompanying financial statements for the years ended December 31, 2003, 2002 and 2001, and is responsible for their integrity and objectivity. The statements were prepared in conformity with generally accepted accounting principles, applying certain estimates and judgments as required.
Management maintains a system of internal accounting controls which has been designed to provide reasonable assurance that: transactions are executed in accordance with proper authorization, transactions are properly recorded and summarized to produce reliable financial records and reports, assets are safeguarded and the accountability for assets is maintained.
The system of internal controls includes statements of policies and business practices, widely communicated to employees, which are designed to require them to maintain high ethical standards in their conduct of company affairs. The internal controls are augmented by careful selection and training of supervisory and other management personnel, by organizational arrangements that provide for appropriate delegation of authority and division of responsibility and by an extensive program of internal audit with management follow-up. The company's adoption of 6 Sigma has improved processes leading to enhanced internal controls.
The financial statements have been audited by PricewaterhouseCoopers LLP, independent auditors, in accordance with auditing standards generally accepted in the United States of America. They have made similar annual audits since the initial incorporation of our company. Their role is to render an opinion on management's financial statements. Their report appears below.
Through its Audit Committee, the board of directors reviews our financial and accounting policies, practices and reports. The Audit Committee consists exclusively of six directors who are not salaried employees and who are, in the opinion of the board of directors, free from any relationship that would interfere with the exercise of independent judgment as a committee member. The Audit Committee meets several times each year with representatives of management, including the internal auditing department and the independent auditors to review the activities of each and satisfy itself that each is properly discharging its responsibilities. Both the independent auditors and the internal auditors have free access to the Audit Committee and meet with it periodically, with and without management representatives in attendance, to discuss, among other things, their opinions as to the adequacy of internal controls and to review the quality of financial reporting.
 | ||
| Chairman of the Board | ||
 | ||
| Chief Financial Officer | ||
January 27, 2004 |
REPORT OF INDEPENDENT AUDITORS
![]()
TO THE BOARD OF DIRECTORS AND STOCKHOLDERS OF CATERPILLAR INC.:
In our opinion, the accompanying statements of consolidated financial position and the related statements of consolidated results of operations, changes in consolidated stockholders' equity and consolidated cash flow present fairly, in all material respects, the financial position of Caterpillar Inc. and its subsidiaries at December 31, 2003, 2002 and 2001, and the results of their operations and their cash flow for each of the three years in the period ended December 31, 2003 in conformity with accounting principles generally accepted in the United States of America. These financial statements are the responsibility of the Company's management; our responsibility is to express an opinion on these financial statements based on our audits. We conducted our audits of these statements in accordance with auditing standards generally accepted in the United States of America, which require that we plan and perform the audit to obtain reasonable assurance about whether the financial statements are free of material misstatement. An audit includes examining, on a test basis, evidence supporting the amounts and disclosures in the financial statements, assessing the accounting principles used and significant estimates made by management and evaluating the overall financial statement presentation. We believe that our audits provide a reasonable basis for our opinion.
As discussed in Note 9 to the consolidated financial statements, effective January 1, 2002 the Company changed the manner in which it accounts for goodwill and other intangible assets upon the adoption of Statement of Financial Accounting Standards No. 142 "Goodwill and Other Intangible Assets."
![]()
Peoria, Illinois
January 27, 2004
A-3
STATEMENT 1
Consolidated Results of Operations for the Years Ended December 31
(Dollars in millions except per share data)
| | 2003 | 2002 | 2001 | ||||||||
|---|---|---|---|---|---|---|---|---|---|---|---|
| Sales and revenues: | |||||||||||
| Sales of Machinery and Engines | $ | 21,048 | $ | 18,648 | $ | 19,027 | |||||
| Revenues of Financial Products | 1,715 | 1,504 | 1,423 | ||||||||
| Total sales and revenues | 22,763 | 20,152 | 20,450 | ||||||||
| Operating costs: | |||||||||||
| Cost of goods sold | 16,945 | 15,146 | 15,179 | ||||||||
| Selling, general and administrative expenses | 2,470 | 2,094 | 2,140 | ||||||||
| Research and development expenses | 669 | 656 | 696 | ||||||||
| Interest expense of Financial Products | 470 | 521 | 657 | ||||||||
| Other operating expenses | 521 | 411 | 467 | ||||||||
| Total operating costs | 21,075 | 18,828 | 19,139 | ||||||||
| Operating profit | 1,688 | 1,324 | 1,311 | ||||||||
| Interest expense excluding Financial Products | 246 | 279 | 285 | ||||||||
| Other income (expense) | 35 | 69 | 143 | ||||||||
| Consolidated profit before taxes | 1,477 | 1,114 | 1,169 | ||||||||
| Provision for income taxes | 398 | 312 | 367 | ||||||||
| Profit of consolidated companies | 1,079 | 802 | 802 | ||||||||
| Equity in profit (loss) of unconsolidated affiliated companies | 20 | (4 | ) | 3 | |||||||
| Profit | $ | 1,099 | $ | 798 | $ | 805 | |||||
| Profit per common share | $ | 3.18 | $ | 2.32 | $ | 2.35 | |||||
| Profit per common share—diluted(1) | $ | 3.13 | $ | 2.30 | $ | 2.32 | |||||
| Weighted-average common shares (millions) | 345.2 | 344.0 | 343.3 | ||||||||
| Weighted-average common shares—diluted (millions)(1) | 351.4 | 346.9 | 347.1 | ||||||||
| Cash dividends declared per common share | $ | 1.420 | $ | 1.400 | $ | 1.390 | |||||
- (1)
- Diluted by assumed exercise of stock options, using the treasury stock method.
See accompanying Notes to Consolidated Financial Statements.
A-4
STATEMENT 2
Changes in Consolidated Stockholders' Equity for the Years Ended December 31
(Dollars in millions)
| | 2003 | 2002 | 2001 | ||||||||||||||||||
|---|---|---|---|---|---|---|---|---|---|---|---|---|---|---|---|---|---|---|---|---|---|
| Common stock: | |||||||||||||||||||||
| Balance at beginning of year | $ | 1,034 | $ | 1,043 | $ | 1,048 | |||||||||||||||
| Shares issued from treasury stock | 25 | (9 | ) | (5 | ) | ||||||||||||||||
| Balance at year-end | 1,059 | 1,034 | 1,043 | ||||||||||||||||||
| Treasury stock: | |||||||||||||||||||||
| Balance at beginning of year | $ | (2,669 | ) | $ | (2,696 | ) | $ | (2,676 | ) | ||||||||||||
| Shares issued: 2003—4,956,973; 2002—878,623; 2001—916,634 | 160 | 27 | 23 | ||||||||||||||||||
| Treasury shares purchased: 2003—5,450,000; 2001—937,000 | (405 | ) | — | (43 | ) | ||||||||||||||||
| Balance at year-end | (2,914 | ) | (2,669 | ) | (2,696 | ) | |||||||||||||||
| Profit employed in the business: | |||||||||||||||||||||
| Balance at beginning of year | 7,849 | 7,533 | 7,205 | ||||||||||||||||||
| Profit | 1,099 | $ | 1,099 | 798 | $ | 798 | 805 | $ | 805 | ||||||||||||
| Dividends declared | (498 | ) | (482 | ) | (477 | ) | |||||||||||||||
| Balance at year-end | 8,450 | 7,849 | 7,533 | ||||||||||||||||||
| Accumulated other comprehensive income: | |||||||||||||||||||||
| Foreign currency translation adjustment: | |||||||||||||||||||||
| Balance at beginning of year | 86 | (17 | ) | 55 | |||||||||||||||||
| Aggregate adjustment for year | 262 | 262 | 103 | 103 | (72 | ) | (72 | ) | |||||||||||||
| Balance at year-end | 348 | 86 | (17 | ) | |||||||||||||||||
| Minimum pension liability adjustment—consolidated companies: | |||||||||||||||||||||
| Balance at beginning of year (net of tax of: 2003—$383; 2002—$82; 2001—$1) | (771 | ) | (161 | ) | (1 | ) | |||||||||||||||
| Aggregate adjustment for year (net of tax of: 2003—$77; 2002—$301; 2001—$81) | (163 | ) | (163 | ) | (610 | ) | (610 | ) | (160 | ) | (160 | ) | |||||||||
| Balance at year-end (net of tax of: 2003—$460; 2002—$383; 2001—$82) | (934 | ) | (771 | ) | (161 | ) | |||||||||||||||
| Minimum pension liability adjustment—unconsolidated affiliates: | |||||||||||||||||||||
| Balance at beginning of year | (37 | ) | (41 | ) | (31 | ) | |||||||||||||||
| Aggregate adjustment for year | (11 | ) | (11 | ) | 4 | 4 | (10 | ) | (10 | ) | |||||||||||
| Balance at year-end | (48 | ) | (37 | ) | (41 | ) | |||||||||||||||
| Derivative financial instruments: | |||||||||||||||||||||
| Balance at beginning of year (net of tax of: 2003—$5; 2002—$17) | 11 | (26 | ) | — | |||||||||||||||||
| Gains/(losses) deferred during year (net of tax of: 2003—$29; 2002—$10; 2001—$24) | 53 | 53 | 15 | 15 | (39 | ) | (39 | ) | |||||||||||||
| (Gains)/losses reclassified to earnings during year (net of tax of: 2003—$20; 2002—$11; 2001—$7) | 40 | 40 | 22 | 22 | 13 | 13 | |||||||||||||||
| Balance at year-end (net of tax of: 2003—$54; 2002—$4; 2001—$17) | 104 | 11 | (26 | ) | |||||||||||||||||
| Available-for-sale securities: | |||||||||||||||||||||
| Balance at beginning of year (net of tax of: 2003—$17; 2002—$13) | (31 | ) | (24 | ) | — | ||||||||||||||||
| Gains/(losses) deferred during year (net of tax of: 2003—$12; 2002—$16; 2001—$14) | 23 | 23 | (29 | ) | (29 | ) | (26 | ) | (26 | ) | |||||||||||
| (Gains)/losses reclassified to earnings during year (net of tax of: 2003—$11; 2002—$12; 2001—$1) | 21 | 21 | 22 | 22 | 2 | 2 | |||||||||||||||
| Balance at year-end (net of tax of: 2003—$7; 2002—$17; 2001—$13) | 13 | (31 | ) | (24 | ) | ||||||||||||||||
| Total accumulated other comprehensive income | (517 | ) | (742 | ) | (269 | ) | |||||||||||||||
| Comprehensive income | $ | 1,324 | $ | 325 | $ | 513 | |||||||||||||||
| Stockholders' equity at year-end | $ | 6,078 | $ | 5,472 | $ | 5,611 | |||||||||||||||
See accompanying Notes to Consolidated Financial Statements.
A-5
STATEMENT 3
Consolidated Financial Position at December 31
(Dollars in millions)
| | 2003 | 2002 | 2001 | ||||||||||
|---|---|---|---|---|---|---|---|---|---|---|---|---|---|
| Assets | |||||||||||||
| Current assets: | |||||||||||||
| Cash and short-term investments | $ | 342 | $ | 309 | $ | 400 | |||||||
| Receivables—trade and other | 3,666 | 2,838 | 2,592 | ||||||||||
| Receivables—finance | 7,605 | 6,748 | 5,849 | ||||||||||
| Deferred and refundable income taxes | 707 | 781 | 434 | ||||||||||
| Prepaid expenses | 1,424 | 1,224 | 1,139 | ||||||||||
| Inventories | 3,047 | 2,763 | 2,925 | ||||||||||
| Total current assets | 16,791 | 14,663 | 13,339 | ||||||||||
| Property, plant and equipment—net | 7,290 | 7,046 | 6,603 | ||||||||||
| Long-term receivables—trade and other | 82 | 66 | 55 | ||||||||||
| Long-term receivables—finance | 7,822 | 6,714 | 6,267 | ||||||||||
| Investments in unconsolidated affiliated companies | 800 | 747 | 787 | ||||||||||
| Deferred income taxes | 616 | 711 | 927 | ||||||||||
| Intangible assets | 239 | 281 | 274 | ||||||||||
| Goodwill | 1,398 | 1,402 | 1,397 | ||||||||||
| Other assets | 1,427 | 1,117 | 936 | ||||||||||
| Total assets | $ | 36,465 | $ | 32,747 | $ | 30,585 | |||||||
| Liabilities | |||||||||||||
| Current liabilities: | |||||||||||||
| Short-term borrowings: | |||||||||||||
| —Machinery and Engines | $ | 72 | $ | 64 | $ | 219 | |||||||
| —Financial Products | 2,685 | 2,111 | 1,961 | ||||||||||
| Accounts payable | 3,100 | 2,269 | 2,123 | ||||||||||
| Accrued expenses | 1,638 | 1,620 | 1,419 | ||||||||||
| Accrued wages, salaries and employee benefits | 1,802 | 1,779 | 1,403 | ||||||||||
| Dividends payable | 127 | 120 | 120 | ||||||||||
| Deferred and current income taxes payable | 216 | 70 | 11 | ||||||||||
| Long-term debt due within one year: | |||||||||||||
| —Machinery and Engines | 32 | 258 | 73 | ||||||||||
| —Financial Products | 2,949 | 3,654 | 3,058 | ||||||||||
| Total current liabilities | 12,621 | 11,945 | 10,387 | ||||||||||
| Long-term debt due after one year: | |||||||||||||
| —Machinery and Engines | 3,367 | 3,403 | 3,492 | ||||||||||
| —Financial Products | 10,711 | 8,193 | 7,799 | ||||||||||
| Liability for postemployment benefits | 3,172 | 3,333 | 2,920 | ||||||||||
| Deferred income taxes and other liabilities | 516 | 401 | 376 | ||||||||||
| Total liabilities | 30,387 | 27,275 | 24,974 | ||||||||||
| Contingencies (Note 21) | |||||||||||||
| Stockholders' equity | |||||||||||||
| Common stock of $1.00 par value: | |||||||||||||
| Authorized shares: 900,000,000 Issued shares (2003, 2002 and 2001—407,447,312) at paid-in amount | 1,059 | 1,034 | 1,043 | ||||||||||
| Treasury stock (2003—63,685,272 shares; 2002—63,192,245 shares; and 2001—64,070,868 shares) at cost | (2,914 | ) | (2,669 | ) | (2,696 | ) | |||||||
| Profit employed in the business | 8,450 | 7,849 | 7,533 | ||||||||||
| Accumulated other comprehensive income | (517 | ) | (742 | ) | (269 | ) | |||||||
| Total stockholders' equity | 6,078 | 5,472 | 5,611 | ||||||||||
| Total liabilities and stockholders' equity | $ | 36,465 | $ | 32,747 | $ | 30,585 | |||||||
See accompanying Notes to Consolidated Financial Statements.
A-6
STATEMENT 4
Consolidated Statement of Cash Flow for the Years Ended December 31
(Millions of dollars)
| | 2003 | 2002 | 2001 | |||||||||
|---|---|---|---|---|---|---|---|---|---|---|---|---|
| Cash flow from operating activities: | ||||||||||||
| Profit | $ | 1,099 | $ | 798 | $ | 805 | ||||||
| Adjustments for non-cash items: | ||||||||||||
| Depreciation and amortization | 1,347 | 1,220 | 1,169 | |||||||||
| Other charges | — | — | 153 | |||||||||
| Other | (15 | ) | 363 | 245 | ||||||||
| Changes in assets and liabilities: | ||||||||||||
| Receivables—trade and other | (521 | ) | (50 | ) | 99 | |||||||
| Inventories | (286 | ) | 162 | (211 | ) | |||||||
| Accounts payable and accrued expenses | 617 | 164 | (160 | ) | ||||||||
| Other—net | (175 | ) | (291 | ) | (113 | ) | ||||||
| Net cash provided by operating activities | 2,066 | 2,366 | 1,987 | |||||||||
| Cash flow from investing activities: | ||||||||||||
| Capital expenditures—excluding equipment leased to others | (682 | ) | (728 | ) | (1,100 | ) | ||||||
| Expenditures for equipment leased to others | (1,083 | ) | (1,045 | ) | (868 | ) | ||||||
| Proceeds from disposals of property, plant and equipment | 761 | 561 | 356 | |||||||||
| Additions to finance receivables | (17,146 | ) | (15,338 | ) | (16,284 | ) | ||||||
| Collections of finance receivables | 13,882 | 11,866 | 12,367 | |||||||||
| Proceeds from sale of finance receivables | 1,760 | 2,310 | 3,079 | |||||||||
| Investments and acquisitions | (36 | ) | (294 | ) | (405 | ) | ||||||
| Other—net | (17 | ) | (40 | ) | (72 | ) | ||||||
| Net cash used for investing activities | (2,561 | ) | (2,708 | ) | (2,927 | ) | ||||||
| Cash flow from financing activities: | ||||||||||||
| Dividends paid | (491 | ) | (481 | ) | (474 | ) | ||||||
| Common stock issued, including treasury shares reissued | 157 | 10 | 6 | |||||||||
| Treasury shares purchased | (405 | ) | — | (43 | ) | |||||||
| Proceeds from long-term debt issued: | ||||||||||||
| —Machinery and Engines | 128 | 248 | 681 | |||||||||
| —Financial Products | 5,274 | 3,889 | 3,381 | |||||||||
| Payments on long-term debt: | ||||||||||||
| —Machinery and Engines | (463 | ) | (225 | ) | (354 | ) | ||||||
| —Financial Products | (3,774 | ) | (3,114 | ) | (2,599 | ) | ||||||
| Short-term borrowings—net | 87 | (102 | ) | 420 | ||||||||
| Net cash provided by financing activities | 513 | 225 | 1,018 | |||||||||
| Effect of exchange rate changes on cash | 15 | 26 | (12 | ) | ||||||||
| Increase (decrease) in cash and short-term investments | 33 | (91 | ) | 66 | ||||||||
| Cash and short-term investments at beginning of period | 309 | 400 | 334 | |||||||||
| Cash and short-term investments at end of period | $ | 342 | $ | 309 | $ | 400 | ||||||
All short-term investments, which consist primarily of highly liquid investments with original maturities of three months or less, are considered to be cash equivalents.
See accompanying Notes to Consolidated Financial Statements.
A-7
NOTES TO CONSOLIDATED FINANCIAL STATEMENTS
1. Operations and summary of significant accounting policies
A. Nature of operations
We operate in three principal lines of business:
(1) Machinery—A principal line of business which includes the design, manufacture and marketing of construction, mining, agricultural and forestry machinery—track and wheel tractors, track and wheel loaders, pipelayers, motor graders, wheel tractor-scrapers, track and wheel excavators, backhoe loaders, mining shovels, log skidders, log loaders, off-highway trucks, articulated trucks, paving products, telescopic handlers, skid steer loaders and related parts. Also includes logistics services for other companies.
(2) Engines—A principal line of business including the design, manufacture and marketing of engines for Caterpillar machinery, electric power generation systems; on-highway vehicles and locomotives; marine, petroleum, construction, industrial, agricultural and other applications; and related parts. Reciprocating engines meet power needs ranging from 5 to over 22,000 horsepower (4 to over 16 200 kilowatts). Turbines range from 1,600 to 19,500 horsepower (1 000 to 14 500 kilowatts).
(3) Financial Products—A principal line of business consisting primarily of Caterpillar Financial Services Corporation (Cat Financial), Caterpillar Insurance Holdings, Inc. (Cat Insurance) and their subsidiaries. Cat Financial provides a wide range of financing alternatives for Caterpillar machinery and engines, Solar gas turbines, as well as other equipment and marine vessels. Cat Financial also extends loans to customers and dealers. Cat Insurance provides various forms of insurance to customers and dealers to help support the purchase and lease of our equipment.
Our Machinery and Engines operations are highly integrated. Throughout the Notes, Machinery and Engines represents the aggregate total of these principal lines of business.
Our products are sold primarily under the brands "Caterpillar," "Cat," "Solar Turbines," "MaK," "Perkins," "FG Wilson" and "Olympian."
We conduct operations in our Machinery and Engines lines of business under highly competitive conditions, including intense price competition. We place great emphasis on the high quality and performance of our products and our dealers' service support. Although no one competitor is believed to produce all of the same types of machines and engines that we do, there are numerous companies, large and small, which compete with us in the sale of each of our products.
Machines are distributed principally through a worldwide organization of dealers (dealer network), 56 located in the United States and 151 located outside the United States. Worldwide, these dealers serve 178 countries and operate 3,263 places of business, including 1,391 dealer rental outlets. Reciprocating engines are sold principally through the dealer network and to other manufacturers for use in products manufactured by them. Some of the reciprocating engines manufactured by Perkins are also sold through a worldwide network of 166 distributors located in 148 countries. Most of the electric power generation systems manufactured by FG Wilson are sold through a worldwide network of 250 dealers located in 170 countries. Our dealers do not deal exclusively with our products; however, in most cases sales and servicing of our products are the dealers' principal business. Turbines and large marine reciprocating engines are sold through sales forces employed by Solar and MaK, respectively. Occasionally, these employees are assisted by independent sales representatives.
Manufacturing activities of the Machinery and Engines lines of business are conducted in 44 plants in the United States; 10 in the United Kingdom; eight in Italy; five in Mexico; four in China; three each in France, India and Northern Ireland; two each in Australia, Canada, Germany, Brazil and Japan; and one each in Belgium, Hungary, Indonesia, The Netherlands, Poland, Russia, South Africa and Sweden. Fourteen parts distribution centers are located in the United States and 12 are located outside the United States.
The Financial Products line of business also conducts operations under highly competitive conditions. Financing for users of Caterpillar products is available through a variety of competitive sources, principally commercial banks and finance and leasing companies. We emphasize prompt and responsive service to meet customer requirements and offer various financing plans designed to increase the opportunity for sales of our products and generate financing income for our company. Financial Products activity is conducted primarily in the United States, with additional offices in Asia, Australia, Canada, Europe and Latin America.
B. Basis of consolidation
The financial statements include the accounts of Caterpillar Inc. and its subsidiaries. Investments in companies that are owned 20% to 50% or are less than 20% owned and for which we have significant influence are accounted for by the equity method (see Note 8 on page A-15). We consolidate all variable interest entities where Caterpillar Inc. is the primary beneficiary.
Certain amounts for prior years have been reclassified to conform with the current-year financial statement presentation. In the second quarter of 2003, we revised our policy regarding the classification of certain costs related to distributing replacement parts. Previously, these costs were included in selling, general and administrative expenses and now are included in cost of goods sold. This classification is more consistent with industry practice. The parts distribution costs include shipping and handling (including warehousing) along with related support costs such as information technology, purchasing and inventory management. Prior period amounts have been revised to conform to the new classification. In 2002 and 2001, the amounts reclassified from selling, general and administrative expenses to cost of goods sold were $437 million and $427 million, respectively. This amount was $443 million for 2003. The reclassification had no impact on operating profit.
C. Sales and revenue recognition
Sales of Machinery and Engines are recognized when title transfers and the risks and rewards of ownership have passed to customers or independently owned and operated dealers.
Our standard invoice terms are established by marketing region. The dealer is responsible for payment even if the product is not sold to an end customer and must make payment within the standard terms to avoid interest costs. Interest at or above prevailing market rates is charged on any past due balance. Interest is not forgiven. In 2003, 2002 and 2001, terms were extended to not more than one year for $54 million, $193 million and $224 million of receivables, respectively. For 2003, this amount represents less than 1% of consolidated sales. For 2002 and 2001, these amounts represent approximately 1% of consolidated sales.
A-8
Sales with payment terms of two months or more were as follows:
| | 2003 | 2002 | 2001 | |||||||||||||
|---|---|---|---|---|---|---|---|---|---|---|---|---|---|---|---|---|
| Payment Terms (months) | Sales | Percent of Sales | Sales | Percent of Sales | Sales | Percent of Sales | ||||||||||
| | (Dollars in millions) | |||||||||||||||
| 2 | $ | 116 | 0.6 | % | $ | 62 | 0.3 | % | $ | 28 | 0.2 | % | ||||
| 3 | 27 | 0.1 | % | 118 | 0.6 | % | 177 | 0.9 | % | |||||||
| 4 | 28 | 0.1 | % | 11 | 0.1 | % | 6 | 0.0 | % | |||||||
| 5 | 594 | 2.8 | % | 447 | 2.4 | % | 422 | 2.2 | % | |||||||
| 6 | 4,104 | 19.5 | % | 3,503 | 18.8 | % | 4,056 | 21.3 | % | |||||||
| 7-12 | 671 | 3.2 | % | 465 | 2.5 | % | 218 | 1.2 | % | |||||||
| $ | 5,540 | 26.3 | % | $ | 4,606 | 24.7 | % | $ | 4,907 | 25.8 | % | |||||
Revenues of Financial Products represent primarily finance and lease revenues of Cat Financial. Finance revenues are recognized over the term of the contract at a constant rate of return on the scheduled uncollected principal balance. Lease revenues are recognized in the period earned. Recognition of income is suspended when collection of future income is not probable. Accrual is resumed, and previously suspended income is recognized, when the receivable becomes contractually current and/or collection doubts are removed.
D. Inventories
Inventories are stated at the lower of cost or market. Cost is principally determined using the last-in, first-out (LIFO) method. The value of inventories on the LIFO basis represented about 80% of total inventories at December 31, 2003, 2002 and 2001.
If the FIFO (first-in, first-out) method had been in use, inventories would have been $1,863 million, $1,977 million and $1,923 million higher than reported at December 31, 2003, 2002 and 2001, respectively.
E. Securitized receivables
When finance receivables are securitized, we retain interest in the receivables in the form of interest-only strips, servicing rights, cash reserve accounts and subordinated certificates. Gains or losses on the securitization are dependent on the purchase price being allocated between the carrying value of the securitized receivables and the retained interests based on their relative fair value. We estimate fair value based on the present value of future expected cash flows using key assumptions for credit losses, pre-payment speeds, forward yield curves and discount rates (see Note 5 on pages A-13 to A-15).
F. Depreciation and amortization
Depreciation of plant and equipment is computed principally using accelerated methods. Depreciation on equipment leased to others, primarily for Financial Products, is computed using the straight-line method over the term of the lease. The depreciable basis is the original cost of the equipment less the estimated residual value of the equipment at the end of the lease term. In 2003, 2002 and 2001, Financial Products depreciation on equipment leased to others was $527 million, $415 million and $314 million, respectively, and was included in "Other operating expenses" in Statement 1. Amortization of purchased intangibles is computed using the straight-line method, generally over a period of 15 years or less. Accumulated amortization was $44 million, $47 million and $32 million at December 31, 2003, 2002 and 2001, respectively.
G. Foreign currency translation
The functional currency for most of our Machinery and Engines consolidated companies is the U.S. dollar. The functional currency for most of our Financial Products and equity basis companies is the respective local currency. Gains and losses resulting from the translation of foreign currency amounts to the functional currency are included in "Other income (expense)" in Statement 1. Gains and losses resulting from translating assets and liabilities from the functional currency to U.S. dollars are included in "Accumulated other comprehensive income."
H. Derivative financial instruments
Our earnings and cash flow are subject to fluctuations due to changes in foreign currency exchange rates, interest rates and commodity prices. Our Risk Management Policy (policy) allows for the use of derivative financial instruments to prudently manage foreign currency exchange rate, interest rate and commodity price exposure. Our policy specifies that derivatives are not to be used for speculative purposes. Derivatives that we use are primarily foreign currency forward and option contracts, interest rate swaps and commodity forward and option contracts. Our derivative activities are subject to the management, direction and control of our financial officers. Risk management practices, including the use of financial derivative instruments, are presented to the Audit Committee of the board of directors at least annually.
All derivatives are recognized on the financial position at their fair value. On the date the derivative contract is entered, we designate the derivative as (1) a hedge of the fair value of a recognized liability ("fair value" hedge), (2) a hedge of a forecasted transaction or the variability of cash flow to be paid ("cash flow" hedge), or (3) an "undesignated" instrument. Changes in the fair value of a derivative that is qualified, designated and highly effective as a fair value hedge, along with the gain or loss on the hedged liability that is attributable to the hedged risk, are recorded in current earnings. Changes in the fair value of a derivative that is qualified, designated and highly effective as a cash flow hedge are recorded in other comprehensive income until earnings are affected by the forecasted transaction or the variability of cash flow and are then reported in current earnings. Changes in the fair value of undesignated derivative instruments and the ineffective portion of designated derivative instruments are reported in current earnings.
We formally document all relationships between hedging instruments and hedged items, as well as the risk-management objective and strategy for undertaking various hedge transactions. This process includes linking all derivatives that are designated as fair value hedges to specific liabilities on the balance sheet and linking cash flow hedges to specific forecasted transactions or variability of cash flow.
We also formally assess, both at the hedge's inception and on an ongoing basis, whether the derivatives that are used in hedging transactions are highly effective in offsetting changes in fair values or cash flow of hedged items. When it is determined that a derivative is not highly effective as a hedge or that it has ceased to be a highly effective hedge, we discontinue hedge accounting prospectively, in accordance with Statement of Financial Accounting Standards No. 133 (SFAS 133). Please refer to Note 2 on pages A-11 to A-12 for more information on derivatives.
I. Impairment of available-for-sale securities
Available-for-sale securities are reviewed monthly to identify market values below cost of 20% or more. If a decline for a debt security is in excess of 20% for six months, the investment is
A-9
evaluated to determine if the decline is due to general declines in the marketplace or if the investment has been impaired and should be written down to market value pursuant to Statement of Financial Accounting Standards No. 115, "Accounting for Certain Investments in Debt and Equity Securities (SFAS 115)." After the six-month period, debt securities with declines from cost in excess of 20% are evaluated monthly for impairment. For equity securities, if a decline from cost of 20% or more continues for a 12-month period, an other than temporary impairment is recognized without continued analysis.
J. Income taxes
The provision for income taxes is determined using the asset and liability approach for accounting for income taxes. Tax laws require items to be included in tax filings at different times than the items are reflected in the financial statements. A current liability is recognized for the estimated taxes payable for the current year. Deferred taxes represent the future tax consequences expected to occur when the reported amounts of assets and liabilities are recovered or paid. Deferred taxes are adjusted for enacted changes in tax rates and tax laws. Valuation allowances are recorded to reduce deferred tax assets when it is more likely than not that a tax benefit will not be realized.
K. Estimates in financial statements
The preparation of financial statements in conformity with accounting principles generally accepted in the United States of America requires management to make estimates and assumptions that affect reported amounts. The more significant estimates include: residual values for leased assets, fair market values for goodwill impairment tests, and reserves for warranty, product liability and insurance losses, postemployment benefits, post-sale discounts, credit losses and income taxes.
L. Accounting changes
In June 2001, the Financial Accounting Standards Board (FASB) issued Statement of Financial Accounting Standards No. 143 (SFAS 143), "Accounting for Asset Retirement Obligations." SFAS 143 addresses financial accounting and reporting for obligations associated with the retirement of tangible, long-lived assets and the associated asset retirement costs. This Statement requires that the fair value of a liability for an asset retirement obligation be recognized in the period in which it is incurred by capitalizing it as part of the carrying amount of the long-lived assets. As required by SFAS 143, we adopted this new accounting standard on January 1, 2003. The adoption of SFAS 143 did not have any impact on our financial statements.
In November 2002, the FASB issued Interpretation No. 45 (FIN 45), "Guarantor's Accounting and Disclosure Requirements for Guarantees, Including Indirect Guarantees of Indebtedness of Others." FIN 45 elaborates on the disclosures to be made by a guarantor about its obligations under certain guarantees. It also clarifies that a guarantor is required to recognize, at the inception of a guarantee, a liability for the fair value of the obligation undertaken in issuing the guarantee. As required by FIN 45, on January 1, 2003, we adopted the initial recognition and measurement provisions on a prospective basis for guarantees issued or modified after December 31, 2002. The adoption of the recognition/measurement provisions did not have any impact on our financial statements.
In January 2003, the FASB issued Interpretation No. 46 (FIN 46), "Consolidation of Variable Interest Entities—an Interpretation of ARB No. 51." FIN 46 addresses consolidation by business enterprises of variable interest entities that have certain characteristics. Transferors to qualifying special-purpose entities and "grandfathered" qualifying special-purpose entities subject to the reporting requirements of SFAS 140, "Accounting for Transfers and Servicing of Financial Assets and Extinguishments of Liabilities," are excluded from the scope of FIN 46. FIN 46 is applicable immediately to variable interest entities created or obtained after January 31, 2003 (none created or obtained in 2003). For variable interest entities, which we acquired before February 1, 2003, FIN 46 is applicable to us as of December 31, 2003. In December 2003, the FASB issued Interpretation No. 46—revised 2003 (FIN 46R). We adopted FIN 46 and FIN 46R during 2003. The adoption of these interpretations did not have a material impact on our financial statements.
In April 2003, the FASB issued Statement of Financial Accounting Standards No. 149 (SFAS 149), "Amendment of Statement 133 on Derivative Instruments and Hedging Activities." SFAS 149 amends SFAS 133, "Accounting for Derivative Instruments and Hedging Activities" to provide clarification on the financial accounting and reporting for derivative instruments and hedging activities and requires similar accounting treatment for contracts with comparable characteristics. The adoption of SFAS 149, effective primarily for contracts entered into or modified after June 30, 2003, and for hedging relationships designated after June 30, 2003, had no impact on our financial statements.
In May 2003, the FASB issued Statement of Financial Accounting Standards No. 150 (SFAS 150), "Accounting for Certain Financial Instruments with Characteristics of both Liabilities and Equity." SFAS 150 addresses financial accounting and reporting for certain financial instruments with characteristics of both liabilities and equity. This statement requires that an issuer classify a financial instrument that is within its scope as a liability (or an asset in some circumstances) because that financial instrument embodies an obligation of the issuer. As required by SFAS 150, we adopted this new accounting standard effective July 1, 2003. The adoption of SFAS 150 did not have any impact on our financial statements.
In December 2003, the FASB issued Statement of Financial Accounting Standards No. 132 (revised 2003) "Employers' Disclosures about Pensions and Other Postretirement Benefits." SFAS 132 (revised 2003) retains the disclosure requirements of SFAS 132, which it replaces, and addresses the need for additional annual disclosures related to a company's pensions and other postretirement benefits. SFAS 132 (revised 2003) does not change the measurement or recognition criteria of SFAS 87, "Employers' Accounting for Pensions," SFAS 88, "Employers' Accounting for Settlements and Curtailments of Defined Benefit Pension Plans and for Termination Benefits," or SFAS 106, "Employers' Accounting for Postretirement Benefits Other Than Pensions." SFAS 132 (revised 2003) requires new annual disclosures about the types of plan assets, investment strategy, measurement date, plan obligations and cash flows related to a company's pensions and other postretirement benefits. It also requires disclosure of the components of net periodic benefit cost recognized in interim periods and, if significantly different from previously
A-10
disclosed amounts, the projected contributions to fund pension and other postretirement benefit plans. We adopted the disclosure requirements of SFAS 132 (revised 2003) in December 2003.
M. Stock based compensation
We use the intrinsic value method of accounting for stock-based employee compensation in accordance with Accounting Principles Board Opinion No. 25, "Accounting for Stock Issued to Employees." No compensation expense is recognized in association with our options. We adopted the disclosure requirements of SFAS 148, "Accounting for Stock-Based Compensation-Transition and Disclosure," in December 2002.
Pro forma net income and earnings per share were:
| | Years ended December 31, | |||||||||||
|---|---|---|---|---|---|---|---|---|---|---|---|---|
| | 2003 | 2002 | 2001 | |||||||||
| | (Dollars in millions except per share data) | |||||||||||
| Net income, as reported | $ | 1,099 | $ | 798 | $ | 805 | ||||||
| Deduct: Total stock-based employee compensation expense determined under fair value based method for all awards, net of related tax effects | (69 | ) | (65 | ) | (57 | ) | ||||||
| Pro forma net income | $ | 1,030 | $ | 733 | $ | 748 | ||||||
| Profit per share of common stock: | ||||||||||||
| As reported: | ||||||||||||
| Basic | $ | 3.18 | $ | 2.32 | $ | 2.35 | ||||||
| Assuming dilution | $ | 3.13 | $ | 2.30 | $ | 2.32 | ||||||
| Pro forma: | ||||||||||||
| Basic | $ | 2.98 | $ | 2.13 | $ | 2.18 | ||||||
| Assuming dilution | $ | 2.93 | $ | 2.13 | $ | 2.17 | ||||||
2. Derivative financial instruments and risk management
A. Adoption of SFAS 133
We adopted SFAS 133, "Accounting for Derivative Instruments and Hedging Activities," and Financial Accounting Standards No. 138 effective January 1, 2001. Adoption of these new accounting standards resulted in cumulative after-tax reductions to profit and accumulated other comprehensive income of $2 million and $12 million, respectively, in the first quarter of 2001. The adoption also immaterially impacted both assets and liabilities recorded on the balance sheet. During 2002 and 2001, we reclassified $1 million and $5 million of the transition adjustment from accumulated other comprehensive income to current earnings, respectively.
B. Foreign currency exchange rate risk
Foreign currency exchange rate movements create a degree of risk by affecting the U.S. dollar value of sales made and costs incurred in foreign currencies. Movements in foreign currency rates also affect our competitive position as these changes may affect business practices and/or pricing strategies of non-U.S.-based competitors. Additionally, we have balance sheet positions denominated in foreign currency, thereby creating exposure to movements in exchange rates.
Machinery and Engines operations purchase, manufacture and sell products in many locations around the world. As we have a diversified revenue and cost base, we manage our future foreign currency cash flow exposure on a net basis. We use foreign currency forward and option contracts to manage unmatched foreign currency cash inflow and outflow. Our objective is to minimize the risk of exchange rate movements that would reduce the U.S. dollar value of our foreign currency cash flow. Our policy allows for managing anticipated foreign currency cash flow for up to four years.
We generally designate as cash flow hedges at inception of the contract any Australian dollar, Brazilian real, British pound, Canadian dollar, euro, Japanese yen, Mexican peso or Singapore dollar forward or option contracts that exceed 90 days in duration. Designation is performed on a specific exposure basis to support hedge accounting. The remainder of Machinery and Engines foreign currency contracts are undesignated.
As of December 31, 2003, $70 million of deferred net gains included in equity ("Accumulated other comprehensive income" in Statement 3), related to Machinery and Engines foreign currency contracts, is expected to be reclassified to current earnings ["Other income (expense)"] over the next twelve months. There were no circumstances where hedge treatment was discontinued during 2003, 2002 or 2001.
In managing foreign currency risk for our Financial Products operations, our objective is to minimize earnings volatility resulting from conversion and the remeasurement of net foreign currency balance sheet positions. Our policy allows the use of foreign currency forward contracts to offset the risk of currency mismatch between our receivable and debt portfolio. All such foreign currency forward contracts are undesignated.
Gains/(losses) included in current earnings [Other income (expense)]:
| | 2003 | 2002 | 2001 | ||||||||
|---|---|---|---|---|---|---|---|---|---|---|---|
| | (Millions of dollars) | ||||||||||
| Machinery and Engines: | |||||||||||
| On undesignated contracts | $ | (1 | ) | $ | — | $ | (2 | ) | |||
| Due to changes in time and volatility value on options | — | $ | (1 | ) | $ | — | |||||
| Financial Products: | |||||||||||
| On undesignated contracts | $ | (121 | ) | $ | (96 | ) | $ | 43 | |||
| $ | (122 | ) | $ | (97 | ) | $ | 41 | ||||
Gains and losses on the Financial Products contracts above are substantially offset by balance sheet remeasurement and conversion gains and losses.
C. Interest rate risk
Interest rate movements create a degree of risk by affecting the amount of our interest payments and the value of our fixed rate debt. Our policy is to use interest rate swap agreements and forward rate agreements to manage our exposure to interest rate changes and lower the cost of borrowed funds.
Machinery and Engines operations generally use fixed rate debt as a source of funding. Our objective is to minimize the cost of borrowed funds. Our policy allows us to enter fixed-to-floating interest rate swaps and forward rate agreements to meet that objective with the intent to designate as fair value hedges at inception of the contract all fixed-to-floating interest rate swaps. Designation as a hedge of the fair value of our fixed rate debt is performed to support hedge accounting. During 2001, our Machinery and Engines operations liquidated all fixed-to-floating interest rate swaps. Deferred gains on liquidated fixed-to-floating interest rate swaps, which were previously designated as fair value hedges, are being amortized to earnings ratably over the remaining life of the hedged debt. We designate as cash flow hedges at inception of the contract all forward rate agreements. Designation as a hedge of the anticipated issuance of debt is performed to support hedge accounting. Machinery and Engines forward rate agreements are 100% effective.
Financial Products operations have a "match funding" objective whereby, within specified boundaries, the interest rate profile
A-11
(fixed rate or floating rate) of their debt portfolio largely matches the interest rate profile of their receivable, or asset, portfolio. In connection with that objective, we use interest rate derivative instruments to modify the debt structure to match the receivable portfolio. This "match funding" reduces the risk of deteriorating margins between interest-bearing assets and interest-bearing liabilities, regardless of which direction interest rates move. We also use these instruments to gain an economic and/or competitive advantage through a lower cost of borrowed funds. This is accomplished by changing the characteristics of existing debt instruments or entering into new agreements in combination with the issuance of new debt.
Our policy allows us to issue floating-to-fixed, fixed-to-floating and floating-to-floating interest rate swaps to meet the "match funding" objective. We designate as fair value hedges, at inception of the contract, all fixed-to-floating interest rate swaps. Designation as a hedge of the fair value of our fixed rate debt is performed to support hedge accounting. As Financial Products fixed-to-floating interest rate swaps are 100% effective, gains on designated interest rate derivatives were offset completely by losses on hedged debt. Financial Products policy is to designate as cash flow hedges, at inception of the contract, most floating-to-fixed interest rate swaps. Designation as a hedge of the variability of cash flow is performed to support hedge accounting. During the second quarter of 2002, Financial Products liquidated four fixed-to-floating interest rate swaps. Deferred gains on these swaps, which were previously designated as fair value hedges, are being amortized to earnings ratably over the remaining life of the hedged debt.
Gains (losses) included in current earnings [Other income (expense)]:
| | 2003 | 2002 | 2001 | |||||||||
|---|---|---|---|---|---|---|---|---|---|---|---|---|
| | (Millions of dollars) | |||||||||||
| Fixed-to-floating interest rate swaps | ||||||||||||
| Machinery and Engines: | ||||||||||||
| Gain/(loss) on designated interest rate derivatives | $ | — | $ | — | $ | 23 | ||||||
| Gain/(loss) on hedged debt | — | — | (18 | ) | ||||||||
| Gain/(loss) on liquidated swaps | 6 | 8 | 6 | |||||||||
| Financial Products: | ||||||||||||
| Gain/(loss) on designated interest rate derivatives | (20 | ) | 17 | 44 | ||||||||
| Gain/(loss) on hedged debt | 20 | (17 | ) | (44 | ) | |||||||
| Gain/(loss) on liquidated swaps—included in interest expense | 2 | 1 | — | |||||||||
| Floating-to-fixed interest rate swaps | ||||||||||||
| Financial Products: | ||||||||||||
| Gain/(loss) due to ineffectiveness | $ | — | $ | — | $ | (1 | ) | |||||
| $ | 8 | $ | 9 | $ | 10 | |||||||
As of December 31, 2003, $16 million of deferred net losses included in equity ("Accumulated other comprehensive income" in Statement 3), related to Financial Products floating-to-fixed interest rate swaps, is expected to be reclassified to current earnings ("Interest expense of Financial Products") over the next twelve months. There were no circumstances where hedge treatment was discontinued during 2003, 2002 or 2001 in either Machinery and Engines or Financial Products.
D. Commodity price risk
Commodity price movements create a degree of risk by affecting the price we must pay for certain raw material. Our policy is to use commodity forward and option contracts to manage the commodity risk and reduce the cost of purchased materials.
Our Machinery and Engines operations purchase aluminum, copper and nickel embedded in the components we purchase from suppliers. Our suppliers pass on to us price changes in the commodity portion of the component cost.
Our objective is to reduce the cost of purchased materials. Our policy allows us to enter commodity forward and option contracts to lock in the purchase price of the commodities within a four-year horizon. All such commodity forward and option contracts are undesignated. Gains/(losses) on the undesignated contracts of $27 million, $1 million and $(8) million were recorded in current earnings ["Other income (expense)"] for 2003, 2002 and 2001, respectively.
3. Other income (expense)
| | Years ended December 31, | |||||||||
|---|---|---|---|---|---|---|---|---|---|---|
| | 2003 | 2001 | 2002 | |||||||
| | (Millions of dollars) | |||||||||
| Investment and interest income | $ | 49 | $ | 31 | $ | 96 | ||||
| Foreign exchange (losses) gains | 35 | 13 | (29 | ) | ||||||
| Charge for early retirement of debt | (55 | ) | — | — | ||||||
| Miscellaneous income | 6 | 25 | 76 | |||||||
| $ | 35 | $ | 69 | $ | 143 | |||||
4. Income taxes
The components of profit before taxes were:
| | Years ended December 31, | ||||||||
|---|---|---|---|---|---|---|---|---|---|
| | 2003 | 2001 | 2002 | ||||||
| | (Millions of dollars) | ||||||||
| U.S. | $ | 489 | $ | 343 | $ | 741 | |||
| Non-U.S. | 988 | 771 | 428 | ||||||
| $ | 1,477 | $ | 1,114 | $ | 1,169 | ||||
Profit before taxes, as shown above, is based on the location of the entity to which such earnings are attributable. However, since such earnings are subject to taxation in more than one country, the income tax provision shown below as U.S. or non-U.S. may not correspond to the earnings shown above.
The components of the provision for income taxes were:
| | Years ended December 31, | ||||||||||
|---|---|---|---|---|---|---|---|---|---|---|---|
| | 2003 | 2002 | 2001 | ||||||||
| | (Millions of dollars) | ||||||||||
| Current tax provision: | |||||||||||
| U.S. Federal | $ | 24 | $ | (62 | ) | $ | 150 | ||||
| Non-U.S. | 196 | 210 | 174 | ||||||||
| State (U.S.) | 10 | 1 | 11 | ||||||||
| $ | 230 | $ | 149 | $ | 335 | ||||||
| Deferred tax provision (credit): | |||||||||||
| U.S. Federal | 182 | 172 | 65 | ||||||||
| Non-U.S. | (21 | ) | (20 | ) | (34 | ) | |||||
| State (U.S.) | 7 | 11 | 1 | ||||||||
| 168 | 163 | 32 | |||||||||
| Total provision for income taxes | $ | 398 | $ | 312 | $ | 367 | |||||
Reconciliation of the U.S. federal statutory rate to effective rate:
| | Years ended December 31, | |||||||
|---|---|---|---|---|---|---|---|---|
| | 2003 | 2002 | 2001 | |||||
| U.S. statutory rate | 35.0 | % | 35.0 | % | 35.0 | % | ||
| (Decreases) increases in taxes resulting from: | ||||||||
| Benefit of foreign sales corporation/extraterritorial income exclusion | (4.9 | )% | (4.4 | )% | (4.9 | )% | ||
| Non-U.S. subsidiaries taxed at other than 35% | (4.0 | )% | (3.4 | )% | (0.1 | )% | ||
| Other—net | 0.9 | % | 0.8 | % | 1.4 | % | ||
| Provision for income taxes | 27.0 | % | 28.0 | % | 31.4 | % | ||
A-12
We paid income taxes of $55 million, $124 million and $379 million in 2003, 2002 and 2001, respectively.
We have recorded income tax expense at U.S. tax rates on all profits, except for undistributed profits of non-U.S. companies which are considered permanently invested. Determination of the amount of unrecognized deferred tax liability related to permanently invested profits is not feasible.
Certain subsidiaries operating in China qualify for holidays from income tax, which consist of a two-year full exemption from tax followed by a three-year 50% reduction in the applicable tax rate. The tax holiday begins the first year the subsidiary generates taxable income after utilization of any carryforward losses. The dollar effect in 2003 was $10 million or $.03 per share.
Deferred income tax assets and liabilities:
| | December 31, | ||||||||||
|---|---|---|---|---|---|---|---|---|---|---|---|
| | 2003 | 2002 | 2001 | ||||||||
| | (Millions of dollars) | ||||||||||
| Deferred income tax assets: | |||||||||||
| Postemployment benefits other than pensions | $ | 1,147 | $ | 1,130 | $ | 1,112 | |||||
| Warranty reserves | 163 | 204 | 186 | ||||||||
| Unrealized profit excluded from inventories | 242 | 219 | 212 | ||||||||
| Tax carryforwards | 370 | 230 | 130 | ||||||||
| Inventory valuation method | 37 | 60 | 50 | ||||||||
| Pension | — | 39 | — | ||||||||
| Other | 133 | 128 | 275 | ||||||||
| 2,092 | 2,010 | 1,965 | |||||||||
| Deferred income tax liabilities: | |||||||||||
| Capital assets | (673 | ) | (538 | ) | (437 | ) | |||||
| Pension | (102 | ) | — | (182 | ) | ||||||
| (775 | ) | (538 | ) | (619 | ) | ||||||
| Valuation allowance for deferred tax assets | (37 | ) | (34 | ) | (27 | ) | |||||
| Deferred income taxes—net | $ | 1,280 | $ | 1,438 | $ | 1,319 | |||||
SFAS 109 requires that individual tax-paying entities of the company offset all current deferred tax liabilities and assets within each particular tax jurisdiction and present them as a single amount in the Statement of Financial Position. A similar procedure is followed for all noncurrent deferred tax liabilities and assets. Amounts in different tax jurisdictions cannot be offset against each other. The amount of deferred income taxes at December 31, included on the following lines in Statement 3, are as follows:
| | 2003 | 2002 | 2001 | |||||||
|---|---|---|---|---|---|---|---|---|---|---|
| | (Millions of dollars) | |||||||||
| Assets: | ||||||||||
| Deferred and refundable income taxes | $ | 702 | $ | 777 | $ | 434 | ||||
| Deferred income taxes | 616 | 711 | 927 | |||||||
| $ | 1,318 | $ | 1,488 | $ | 1,361 | |||||
| Liabilities: | ||||||||||
| Deferred and current income taxes payable | $ | 18 | $ | 8 | $ | 6 | ||||
| Deferred income taxes and other liabilities | 20 | 42 | 36 | |||||||
| Deferred income taxes—net | $ | 1,280 | $ | 1,438 | $ | 1,319 | ||||
A valuation allowance has been recorded at certain non-U.S. subsidiaries that have not yet demonstrated consistent and/or sustainable profitability to support the recognition of net deferred tax assets.
As of December 31, 2003, amounts and expiration dates of net operating loss carryforwards in various non-U.S. taxing jurisdictions were:
| 2004 | 2005 | 2006 | 2007 | 2008-2014 | Unlimited | Total | |||||||||||||
|---|---|---|---|---|---|---|---|---|---|---|---|---|---|---|---|---|---|---|---|
| (Millions of dollars) | |||||||||||||||||||
| $ | 7 | $ | 9 | $ | 8 | $ | 13 | $ | 123 | $ | 528 | $ | 688 | ||||||
As of December 31, 2003, approximately $365 million of state tax net operating loss carryforwards were available. Of these, 82% expire after 2014.
As of December 31, 2003, approximately $148 million of regular foreign tax credits and $18 million of credit for increasing research activities were available to carry forward in the United States. Of the foreign tax credits, $108 million will expire in 2008, and $40 million will expire in 2009. The research credits will begin to expire in 2023.
5. Finance receivables
Finance receivables are receivables of Cat Financial, which generally can be repaid or refinanced without penalty prior to contractual maturity. Total finance receivables reported in Statement 3 are net of an allowance for credit losses. The average interest rate on these receivables was 6.3%, 7.1% and 8.7% for 2003, 2002 and 2001, respectively.
Caterpillar Inc. utilizes inventory merchandising programs for its North American dealers. Certain dealer receivables, which arise from the sale of goods, are sold to Cat Financial. Some of these receivables are then securitized by Cat Financial into private-placement, revolving securitization facilities. Cat Financial services the dealer receivables, which are held in a securitization trust and receives an annual servicing fee of 1% of the average outstanding principal balance. Securitization of receivables is a cost-effective means of financing the business. Consolidated net discounts of $6 million, $10 million and $24 million were recognized on securitization of dealer receivables during 2003, 2002 and 2001, respectively, and are included in "Other income (expense)" in Statement 1. Significant assumptions used to estimate the fair value of dealer receivables securitized during 2003, 2002 and 2001 include a discount rate of 4.1%, 4.8% and 7.2%, respectively. These rates reflect declining market interest rates. Other assumptions include a one-month weighted-average maturity, a weighted-average prepayment rate of 0% and expected credit losses of 0% for 2003, 2002 and 2001. Expected credit losses are assumed to be 0% because dealer receivables have historically had no losses and none are expected in the future. The net dealer receivables retained were $1,550 million, $1,145 million and $772 million as of December 31, 2003, 2002 and 2001, respectively, and are included in "Receivables—finance" in Statement 3 and "Wholesale Notes" in Table I on page A-14.
During 2003, 2002 and 2001, Cat Financial securitized retail installment sale contracts and finance leases into public asset-backed securitization facilities. These finance receivables, which are being held in securitization trusts, are secured by new and used equipment. Cat Financial retained servicing responsibilities and subordinated interests related to these securitizations. For 2003, subordinated interests included $9 million in subordinated certificates, an interest in certain future cash flow (excess) with an initial fair value of $14 million and a reserve account with an initial fair value of $10 million. For 2002, subordinated interests included $8 million in subordinated certificates, an interest in certain future cash flow (excess) with an initial fair value of $11 million and a reserve account with an initial fair value of $10 million. For 2001, subordinated interests included $10 million in subordinated certificates, an interest in certain future cash flow (excess) with an initial fair value of $20 million and a reserve account with an initial fair value of $5 million. The company's retained interests
A-13
generally are subordinate to the investors' interests. Net gains of $22 million, $18 million and $21 million were recognized on these transactions in 2003, 2002 and 2001, respectively.
Significant assumptions used to estimate the fair value of the subordinated certificates were:
| | 2003 | 2002 | 2001 | ||||
|---|---|---|---|---|---|---|---|
| Discount rate | 5.0 | % | 4.8 | % | 6.3 | % | |
| Weighted-average prepayment rate | 14.0 | % | 14.0 | % | 14.0 | % | |
| Expected credit losses | 1.0 | % | 1.0 | % | 0.6 | % |
Significant assumptions used to estimate the fair value of the excess and the reserve accounts were:
| | 2003 | 2002 | 2001 | ||||
|---|---|---|---|---|---|---|---|
| Discount rate | 14.0 | % | 14.0 | % | 13.6 | % | |
| Weighted-average prepayment rate | 14.0 | % | 14.0 | % | 14.0 | % | |
| Expected credit losses | 1.0 | % | 1.0 | % | 0.6 | % |
The company receives annual servicing fees of approximately 1% of the unpaid note value.
As of December 31, 2003, 2002 and 2001, the subordinated retained interests in the public securitizations totaled $73 million, $47 million and $51 million, respectively. Key assumptions used to determine the fair value of the retained interests were:
| | 2003 | 2002 | 2001 | ||||
|---|---|---|---|---|---|---|---|
| Cash flow discount rates on subordinated tranches | 4.8-6.3 | % | 4.8-6.3 | % | 6.3-6.9 | % | |
| Cash flow discount rates on other retained interests | 13.6-14.0 | % | 13.6-14.0 | % | 13.6 | % | |
| Weighted-average maturity | 27 months | 29 months | 27 months | ||||
| Average prepayment rate | 14.0 | % | 14.0 | % | 14.0 | % | |
| Expected credit losses | 1.0 | % | 1.0 | % | 0.5 | % |
The investors and the securitization trusts have no recourse to Cat Financial's other assets for failure of debtors to pay when due.
TABLE I—Finance Receivables Information (Millions of dollars)
Contractual maturities of outstanding receivables:
| | December 31, 2003 | |||||||||||
|---|---|---|---|---|---|---|---|---|---|---|---|---|
| Amounts Due In | Installment Contracts | Wholesale and Retail Finance Leases | Wholesale and Retail Notes | Total | ||||||||
| 2004 | $ | 1,848 | $ | 1,664 | $ | 3,704 | $ | 7,216 | ||||
| 2005 | 1,310 | 1,136 | 918 | 3,364 | ||||||||
| 2006 | 818 | 683 | 567 | 2,068 | ||||||||
| 2007 | 399 | 345 | 303 | 1,047 | ||||||||
| 2008 | 157 | 159 | 517 | 833 | ||||||||
| Thereafter | 44 | 174 | 784 | 1,002 | ||||||||
| 4,576 | 4,161 | 6,793 | 15,530 | |||||||||
| Residual value | — | 932 | — | 932 | ||||||||
| Less: Unearned income | 287 | 467 | 40 | 794 | ||||||||
| Total | $ | 4,289 | $ | 4,626 | $ | 6,753 | $ | 15,668 | ||||
Impaired loans and leases:
| | 2003 | 2002 | 2001 | |||||||
|---|---|---|---|---|---|---|---|---|---|---|
| Average recorded investment | $ | 321 | $ | 292 | $ | 323 | ||||
| At December 31: | ||||||||||
| Recorded investment | $ | 275 | $ | 366 | $ | 259 | ||||
| Less: Impaired loans/finance leases for which there is no related allowance for credit losses (due to the fair value of underlying collateral) | 177 | 233 | 167 | |||||||
| Impaired loans/finance leases for which there is a related allowance for credit losses | $ | 98 | $ | 133 | $ | 92 | ||||
Allowance for credit loss activity:
| | 2003 | 2002 | 2001 | |||||||
|---|---|---|---|---|---|---|---|---|---|---|
| Balance at beginning of year | $ | 207 | $ | 177 | $ | 163 | ||||
| Provision for credit losses | 101 | 109 | 97 | |||||||
| Receivables written off | (104 | ) | (103 | ) | (82 | ) | ||||
| Recoveries on receivables previously written off | 22 | 18 | 10 | |||||||
| Other—net | 15 | 6 | (11 | ) | ||||||
| Balance at end of year | $ | 241 | $ | 207 | $ | 177 | ||||
In estimating the allowance for credit losses, we review accounts that are past due, non-performing or in bankruptcy.
Cat Financial's net investment in financing leases:
| | December 31, | |||||||||
|---|---|---|---|---|---|---|---|---|---|---|
| | 2003 | 2002 | 2001 | |||||||
| Total minimum lease payments receivable | $ | 4,161 | $ | 3,794 | $ | 3,607 | ||||
| Estimated residual value of leased assets: | ||||||||||
| Guaranteed | 369 | 306 | 272 | |||||||
| Unguaranteed | 563 | 604 | 682 | |||||||
| 5,093 | 4,704 | 4,561 | ||||||||
| Less: Unearned income | 467 | 479 | 514 | |||||||
| Net investment in financing leases | $ | 4,626 | $ | 4,225 | $ | 4,047 | ||||
| | 2003 | 2002 | 2001 | ||||||||||||||||
|---|---|---|---|---|---|---|---|---|---|---|---|---|---|---|---|---|---|---|---|
| | Dealer Receivables | Finance Receivables | Dealer Receivables | Finance Receivables | Dealer Receivables | Finance Receivables | |||||||||||||
| Cash flow from securitizations: | |||||||||||||||||||
| Proceeds from initial sales of receivables | $ | — | $ | 661 | $ | — | $ | 614 | $ | — | $ | 600 | |||||||
| Proceeds from subsequent sales of receivables into revolving facility | 1,099 | — | 1,696 | — | 2,479 | — | |||||||||||||
| Servicing fees received | 2 | 8 | 3 | 7 | 5 | 6 | |||||||||||||
Characteristics of securitized receivables: | |||||||||||||||||||
| At December 31: | |||||||||||||||||||
| Total securitized principal balance | $ | 240 | $ | 813 | $ | 240 | $ | 726 | $ | 500 | $ | 616 | |||||||
| Loans more than 30 days past due | — | 34 | — | 32 | — | 31 | |||||||||||||
| Weighted average maturity (in months) | 1 | 27 | 1 | 28 | 1 | 26 | |||||||||||||
| For the year ended December 31: | |||||||||||||||||||
| Average securitized principal balance | 240 | 1,073 | 324 | 619 | 504 | 836 | |||||||||||||
| Net credit losses | — | 6 | — | 5 | — | 3 | |||||||||||||
A-14
We estimated the impact of individual 10% and 20% changes to the key economic assumptions used to determine the fair value of residual cash flow in retained interests on our income. An independent, adverse change to each key assumption had an immaterial impact on the fair value of residual cash flow.
The securitization facilities involved in Cat Financial's securitizations are qualifying special purpose entities and thus, in accordance with Statement of Financial Standards No. 140 (SFAS 140), "Accounting for Transfers and Servicing of Financial Assets and Extinguishments of Liabilities," are not consolidated.
We consider an account past due if any portion of an installment is due and unpaid for more than 30 days. Recognition of income is suspended when management determines that collection of future income is not probable (generally after 120 days past due). Accrual is resumed, and previously suspended income is recognized, when the receivable becomes contractually current and/or collection doubts are removed. Investment in loans/finance leases on non-accrual status were $233 million and $370 million and past due over 90 days and still accruing were $25 million and $72 million as of December 31, 2003 and 2002, respectively.
Cat Financial provides financing only when acceptable criteria are met. Credit decisions are based on, among other things, the customer's credit history, financial strength and intended use of equipment. Cat Financial typically maintains a security interest in retail financed equipment and requires physical damage insurance coverage on financed equipment.
Please refer to Table I on page A-14 for additional finance receivables information and Note 17 and Table III on pages A-22 to A-23 for fair value information.
6. Inventories
| | December 31, | ||||||||
|---|---|---|---|---|---|---|---|---|---|
| | 2003 | 2002 | 2001 | ||||||
| | (Millions of dollars) | ||||||||
| Raw materials | $ | 1,105 | $ | 900 | $ | 954 | |||
| Work-in-process | 377 | 311 | 214 | ||||||
| Finished goods | 1,381 | 1,365 | 1,575 | ||||||
| Supplies | 184 | 187 | 182 | ||||||
| $ | 3,047 | $ | 2,763 | $ | 2,925 | ||||
We had long-term material purchase obligations of approximately $857 million at December 31, 2003.
7. Property, plant and equipment
| | | December 31, | |||||||||
|---|---|---|---|---|---|---|---|---|---|---|---|
| | Useful Lives (Years) | ||||||||||
| | 2003 | 2002 | 2001 | ||||||||
| | | (Dollars in millions) | |||||||||
| Land | — | $ | 149 | $ | 149 | $ | 149 | ||||
| Buildings and land improvements | 20-45 | 3,006 | 3,039 | 3,077 | |||||||
| Machinery, equipment and other | 3-10 | 7,039 | 7,015 | 6,658 | |||||||
| Equipment leased to others | — | 3,648 | 3,033 | 2,270 | |||||||
| Construction-in-process | — | 487 | 305 | 636 | |||||||
| Total property, plant and equipment, at cost | 14,329 | 13,541 | 12,790 | ||||||||
| Less: Accumulated depreciation | 7,039 | 6,495 | 6,187 | ||||||||
| Property, plant and equipment—net | $ | 7,290 | $ | 7,046 | $ | 6,603 | |||||
We had commitments for the purchase or construction of capital assets of approximately $218 million at December 31, 2003.
Assets recorded under capital leases(1):
| | December 31, | ||||||||
|---|---|---|---|---|---|---|---|---|---|
| | 2003 | 2002 | 2001 | ||||||
| | (Millions of dollars) | ||||||||
| Gross capital leases(2) | $ | 321 | $ | 259 | $ | 444 | |||
| Less: Accumulated depreciation | 213 | 170 | 318 | ||||||
| Net capital leases | $ | 108 | $ | 89 | $ | 126 | |||
- (1)
- Included in Property, plant and equipment table above.
- (2)
- Consists primarily of machinery and equipment.
Equipment leased to others (primarily by Financial Products):
| | December 31, | ||||||||
|---|---|---|---|---|---|---|---|---|---|
| | 2003 | 2002 | 2001 | ||||||
| | (Millions of dollars) | ||||||||
| Equipment leased to others—at original cost | $ | 3,648 | $ | 3,033 | $ | 2,270 | |||
| Less: Accumulated depreciation | 1,074 | 809 | 629 | ||||||
| Equipment leased to others—net | $ | 2,574 | $ | 2,224 | $ | 1,641 | |||
At December 31, 2003, scheduled minimum rental payments to be received for equipment leased to others were:
| 2004 | 2005 | 2006 | 2007 | 2008 | After 2008 | |||||||||||
|---|---|---|---|---|---|---|---|---|---|---|---|---|---|---|---|---|
| (Millions of dollars) | ||||||||||||||||
| $ | 565 | $ | 398 | $ | 237 | $ | 116 | $ | 47 | $ | 22 | |||||
8. Investment in unconsolidated affiliated companies
The company's investment in affiliated companies accounted for by the equity method consists primarily of a 50% interest in Shin Caterpillar Mitsubishi Ltd. (SCM) located in Japan. Combined financial information of the unconsolidated affiliated companies accounted for by the equity method (generally on a three-month lag, e.g., SCM results reflect the periods ending September 30) was as follows:
| | Years ended December 31, | |||||||||
|---|---|---|---|---|---|---|---|---|---|---|
| | 2003 | 2002 | 2001 | |||||||
| | (Millions of dollars) | |||||||||
| Results of Operations: | ||||||||||
| Sales | $ | 2,946 | $ | 2,734 | $ | 2,493 | ||||
| Cost of sales | 2,283 | 2,168 | 1,971 | |||||||
| Gross profit | 663 | 566 | 522 | |||||||
| Profit (loss) | $ | 48 | $ | (1 | ) | $ | 9 | |||
| Caterpillar's profit (loss) | $ | 20 | $ | (4 | ) | $ | 3 | |||
| | December 31, | ||||||||||
|---|---|---|---|---|---|---|---|---|---|---|---|
| | 2003 | 2002 | 2001 | ||||||||
| | (Millions of dollars) | ||||||||||
| Financial Position: | |||||||||||
| Assets: | |||||||||||
| Current assets | $ | 1,494 | $ | 1,389 | $ | 1,451 | |||||
| Property, plant and equipment—net | 961 | 1,209 | 986 | ||||||||
| Other assets | 202 | 493 | 290 | ||||||||
| 2,657 | 3,091 | 2,727 | |||||||||
| Liabilities: | |||||||||||
| Current liabilities | $ | 1,247 | $ | 1,117 | $ | 1,257 | |||||
| Long-term debt due after one year | 343 | 808 | 414 | ||||||||
| Other liabilities | 257 | 249 | 281 | ||||||||
| 1,847 | 2,174 | 1,952 | |||||||||
| Ownership | $ | 810 | $ | 917 | $ | 775 | |||||
Caterpillar's investment in unconsolidated affiliated companies:
| Investment in equity method companies | $ | 432 | $ | 437 | $ | 437 | |||
| Plus: Investment in cost method companies | 368 | 310 | 350 | ||||||
| Investment in unconsolidated affiliated companies | $ | 800 | $ | 747 | $ | 787 | |||
A-15
At December 31, 2003, consolidated "Profit employed in the business" in Statement 2 included $70 million representing undistributed profit of the unconsolidated affiliated companies. In 2003, 2002 and 2001, we received $25 million, $4 million and $4 million, respectively, in dividends from unconsolidated affiliated companies.
Certain investments in unconsolidated affiliated companies are accounted for using the cost method. During first quarter 2001, Cat Financial invested for a limited partnership interest in a venture financing structure associated with Caterpillar's rental strategy in the United Kingdom.
9. Intangible assets and goodwill
In July 2001, the Financial Accounting Standards Board issued Statement of Financial Accounting Standards No. 142 (SFAS 142), "Goodwill and Other Intangible Assets." SFAS 142 addresses financial accounting and reporting for intangible assets and goodwill. The Statement requires that goodwill and intangible assets having indefinite useful lives not be amortized, but rather be tested at least annually for impairment. Intangible assets that have finite useful lives will continue to be amortized over their useful lives. As required by SFAS 142, we adopted this new accounting standard on January 1, 2002. Upon adoption, we performed the required transitional impairment tests of goodwill and indefinite-lived intangible assets. Application of the transitional impairment provisions of SFAS 142 did not result in an impairment loss.
Intangible assets
| | 2003 | 2002 | |||||
|---|---|---|---|---|---|---|---|
| | (Millions of dollars) | ||||||
| Intellectual property | $ | 126 | $ | 137 | |||
| Pension-related | 157 | 191 | |||||
| Total intangible assets—gross | 283 | 328 | |||||
| Less: Accumulated amortization of intellectual property | (44 | ) | (47 | ) | |||
| Intangible assets—net | $ | 239 | $ | 281 | |||
Amortization expense was $15 million and $13 million for 2003 and 2002, respectively.
Amortization expense related to intangible assets is expected to be:
| 2004 | 2005 | 2006 | 2007 | 2008 | Thereafter | |||||||||||
|---|---|---|---|---|---|---|---|---|---|---|---|---|---|---|---|---|
| (Millions of dollars) | ||||||||||||||||
| $ | 15 | $ | 14 | $ | 13 | $ | 12 | $ | 8 | $ | 20 | |||||
During the years ended December 31, 2003 and 2002, no goodwill was acquired or impaired. During the year ended December 31, 2003, we disposed of assets with related goodwill of $3 million. No goodwill was disposed of during 2002. Goodwill amortization expense was $85 million for 2001. Excluding goodwill amortization expense, profit for 2001 was $863 million ($2.51 per share-basic, $2.49 per share-diluted).
10. Available-for-sale securities
Cat Insurance and Caterpillar Investment Management Ltd. had investments in certain debt and equity securities at December 31, 2003, 2002 and 2001, that have been classified as available-for-sale in accordance with Statement of Financial Accounting Standards No. 115 (SFAS 115) and recorded at fair value based upon quoted market prices. These fair values are included in "Other assets" in Statement 3. Gains and losses arising from the revaluation of available-for-sale securities are included, net of applicable deferred income taxes, in equity ("Accumulated other comprehensive income" in Statement 3). Realized gains and losses on sales of investments are determined using the average cost method for debt instruments and the FIFO method for equity securities.
| | December 31, 2003 | ||||||||
|---|---|---|---|---|---|---|---|---|---|
| | Cost Basis | Pre-Tax Net Gains (Losses) | Fair Value | ||||||
| | (Millions of dollars) | ||||||||
| Government debt | $ | 102 | $ | — | $ | 102 | |||
| Corporate bonds | 288 | 3 | 291 | ||||||
| Equity securities | 191 | 21 | 212 | ||||||
| $ | 581 | $ | 24 | $ | 605 | ||||
| | December 31, 2002 | ||||||||
|---|---|---|---|---|---|---|---|---|---|
| | Cost Basis | Pre-Tax Net Gains (Losses) | Fair Value | ||||||
| | (Millions of dollars) | ||||||||
| Government debt | $ | 89 | $ | — | $ | 89 | |||
| Corporate bonds | 208 | 1 | 209 | ||||||
| Equity securities | 220 | (51 | ) | 169 | |||||
| $ | 517 | $ | (50 | ) | $ | 467 | |||
| | December 31, 2001 | ||||||||
|---|---|---|---|---|---|---|---|---|---|
| | Cost Basis | Pre-Tax Net Gains (Losses) | Fair Value | ||||||
| | (Millions of dollars) | ||||||||
| Government debt | $ | 80 | $ | — | $ | 80 | |||
| Corporate bonds | 157 | 1 | 158 | ||||||
| Equity securities | 200 | (40 | ) | 160 | |||||
| $ | 437 | $ | (39 | ) | $ | 398 | |||
Investments in an unrealized loss position that are not other-than-temporarily impaired
| | December 31, 2003 | |||||||||||||||||||
|---|---|---|---|---|---|---|---|---|---|---|---|---|---|---|---|---|---|---|---|---|
| | Less than 12 months(1) | More than 12 months(1) | Total | |||||||||||||||||
| | Fair Value | Unrealized Losses | Fair Value | Unrealized Losses | Fair Value | Unrealized Losses | ||||||||||||||
| | (Millions of dollars) | |||||||||||||||||||
| Corporate bonds | 93 | (2 | ) | 13 | (1 | ) | 106 | (3 | ) | |||||||||||
| Equity securities | — | — | 25 | (1 | ) | 25 | (1 | ) | ||||||||||||
| Total | $ | 93 | $ | (2 | ) | $ | 38 | $ | (2 | ) | $ | 131 | $ | (4 | ) | |||||
- (1)
- Indicates length of time that individual securities have been in a continuous unrealized loss position.
The fair value of available-for-sale debt securities at December 31, 2003, by contractual maturity, is shown below. Expected maturities will differ from contractual maturities because borrowers may have the right to call or prepay obligations.
| | Fair Value | ||
|---|---|---|---|
| | (Millions of dollars) | ||
| Due in one year or less | $ | 7 | |
| Due after one year through five years | $ | 229 | |
| Due after five years through ten years | $ | 14 | |
| Due after ten years | $ | 143 | |
Proceeds from sales of investments in debt and equity securities during 2003, 2002 and 2001 were $329 million, $288 million and $246 million, respectively. Gross gains of $3 million, $9 million and $2 million and gross losses of $2 million, $2 million and $5 million have been included in current earnings as a result of these sales for 2003, 2002 and 2001, respectively.
During 2003 and 2002, we recognized pretax charges in accordance with the application of SFAS 115 for "other than temporary" declines in the market value of securities in the Cat Insurance and Caterpillar Investment Management Ltd. investment portfolios of $33 million and $41 million, respectively.
A-16
11. Postemployment benefit plans
We have both U.S. and non-U.S. pension plans covering substantially all of our employees. Our defined benefit plans provide a benefit based on years of service and/or the employee's average earnings near retirement. Our defined contribution plans allow employees to contribute a portion of their salary to help save for retirement and, in certain cases, we provide a matching contribution.
We also have defined benefit retirement health care and life insurance plans covering substantially all of our U.S. employees. Plan amendments made in 2002 included an increase in retiree cost sharing of health care benefits, elimination of company payments for Medicare part B premiums and significant reductions in retiree life insurance.
Our U.S. postretirement health care plans provide for prescription drug benefits. On December 8, 2003, the Medicare Prescription Drug, Improvement and Modernization Act of 2003 (the Act) was signed into law. The Act introduces a prescription drug benefit under Medicare (Medicare part D) as well as a federal subsidy to sponsors of retiree health care benefit plans that provide a benefit that is at least actuarially equivalent to Medicare part D. In accordance with FASB Staff Position FAS 106-1, "Accounting and Disclosure Requirements Related to the Medicare Prescription Drug, Improvement and Modernization Act of 2003" any measures of our accumulated postretirement benefit obligation or net periodic postretirement benefit cost in the financial statements and accompanying notes do not reflect the effects of the Act on the plans. Specific authoritative guidance on the accounting for the federal subsidy is pending and that guidance, when issued, could require us to change previously reported information.
We use a November 30th measurement date for our U.S. pension and other postretirement benefit plans and a September 30th measurement date for substantially all of our non-U.S. pension plans. Year-end asset and obligation amounts are disclosed as of the plan measurement dates.
A. Benefit obligations
| | U.S. Pension Benefits | Non-U.S. Pension Benefits | Other Postretirement Benefits | ||||||||||||||||||||||||||
|---|---|---|---|---|---|---|---|---|---|---|---|---|---|---|---|---|---|---|---|---|---|---|---|---|---|---|---|---|---|
| | 2003 | 2002 | 2001 | 2003 | 2002 | 2001 | 2003 | 2002 | 2001 | ||||||||||||||||||||
| | (Millions of dollars) | ||||||||||||||||||||||||||||
| Change in benefit obligation: | |||||||||||||||||||||||||||||
| Benefit obligation, beginning of year | $ | 7,844 | $ | 7,382 | $ | 6,921 | $ | 1,517 | $ | 1,229 | $ | 1,168 | $ | 4,465 | $ | 4,514 | $ | 3,869 | |||||||||||
| Service cost | 122 | 115 | 99 | 43 | 38 | 35 | 70 | 80 | 72 | ||||||||||||||||||||
| Interest cost | 554 | 529 | 516 | 83 | 70 | 65 | 298 | 292 | 289 | ||||||||||||||||||||
| Business combinations | — | — | — | — | — | 2 | — | — | — | ||||||||||||||||||||
| Plan amendments | (27 | ) | — | 2 | — | — | 2 | (6 | ) | (474 | ) | 16 | |||||||||||||||||
| Actuarial losses (gains) | 1,148 | 395 | 389 | 118 | 135 | (17 | ) | 474 | 340 | 528 | |||||||||||||||||||
| Foreign currency exchange rates | — | — | — | 137 | 100 | 21 | 4 | 2 | 2 | ||||||||||||||||||||
| Participant contributions | — | — | — | 10 | 10 | 9 | 25 | 5 | 4 | ||||||||||||||||||||
| Benefits paid | (648 | ) | (611 | ) | (545 | ) | (72 | ) | (65 | ) | (56 | ) | (326 | ) | (294 | ) | (266 | ) | |||||||||||
| Special termination benefits(1) | — | 34 | — | — | — | — | — | — | — | ||||||||||||||||||||
| Benefit obligation, end of year | $ | 8,993 | $ | 7,844 | $ | 7,382 | $ | 1,836 | $ | 1,517 | $ | 1,229 | $ | 5,004 | $ | 4,465 | $ | 4,514 | |||||||||||
| Accumulated benefit obligation, end of year | $ | 8,379 | $ | 7,482 | $ | 7,079 | $ | 1,660 | $ | 1,355 | $ | 1,107 | |||||||||||||||||
| Weighted-average assumptions used to determine benefit obligations, end of year: | |||||||||||||||||||||||||||||
| Discount rate(2) | 6.2 | % | 7.0 | % | 7.3 | % | 5.1 | % | 5.4 | % | 5.7 | % | 6.1 | % | 7.0 | % | 7.2 | % | |||||||||||
| Rate of compensation increase(2) | 4.0 | % | 4.0 | % | 4.0 | % | 3.2 | % | 3.3 | % | 3.3 | % | 4.0 | % | 4.0 | % | 4.0 | % | |||||||||||
- (1)
- Amount recognized as expense in 2001 in conjunction with the U.S. salaried and management employee reduction. Please refer to Note 23 on page A-31 for additional information.
- (2)
- End of year rates are used to determine net periodic cost for the subsequent year. See Note 11E on page A-19.
Assumed health care cost trend rates have a significant effect on the amounts reported for the health care plans. A one-percentage-point change in assumed health care cost trend rates would have the following effects:
| | One-percentage- point increase | One-percentage- point decrease | |||||
|---|---|---|---|---|---|---|---|
| | (Millions of dollars) | ||||||
| Effect on 2003 service and interest cost components of other postretirement benefit cost | $ | 24 | $ | (22 | ) | ||
| Effect on accumulated postretirement benefit obligation | $ | 251 | $ | (224 | ) | ||
B. Plan assets
| | U.S. Pension Benefits | Non-U.S. Pension Benefits | Other Postretirement Benefits | ||||||||||||||||||||||||||
|---|---|---|---|---|---|---|---|---|---|---|---|---|---|---|---|---|---|---|---|---|---|---|---|---|---|---|---|---|---|
| | 2003 | 2002 | 2001 | 2003 | 2002 | 2001 | 2003 | 2002 | 2001 | ||||||||||||||||||||
| | (Millions of dollars) | ||||||||||||||||||||||||||||
| Change in plan assets: | |||||||||||||||||||||||||||||
| Fair value of plan assets, beginning of year | $ | 6,443 | $ | 7,431 | $ | 8,203 | $ | 1,024 | $ | 1,050 | $ | 1,287 | $ | 849 | $ | 1,109 | $ | 1,324 | |||||||||||
| Actual return on plan assets | 1,290 | (512 | ) | (230 | ) | 120 | (87 | ) | (217 | ) | 140 | (113 | ) | (71 | ) | ||||||||||||||
| Business combinations | — | — | — | — | — | 2 | — | — | — | ||||||||||||||||||||
| Foreign currency exchange rates | — | — | — | 96 | 72 | 12 | — | — | — | ||||||||||||||||||||
| Company contributions | 643 | 135 | 3 | 84 | 44 | 13 | 179 | 142 | 118 | ||||||||||||||||||||
| Participant contributions | — | — | — | 10 | 10 | 9 | 25 | 5 | 4 | ||||||||||||||||||||
| Benefits paid | (648 | ) | (611 | ) | (545 | ) | (72 | ) | (65 | ) | (56 | ) | (326 | ) | (294 | ) | (266 | ) | |||||||||||
| Fair value of plan assets, end of year | $ | 7,728 | $ | 6,443 | $ | 7,431 | $ | 1,262 | $ | 1,024 | $ | 1,050 | $ | 867 | $ | 849 | $ | 1,109 | |||||||||||
A-17
The asset allocation for our pension and other postretirement benefit plans at the end of 2003, 2002 and 2001, and the target allocation for 2004, by asset category, are as follows:
| | Target Allocation | Percentage of Plan Assets at Year End | ||||||||
|---|---|---|---|---|---|---|---|---|---|---|
| | 2004 | 2003 | 2002 | 2001 | ||||||
| U.S. pension: | ||||||||||
| Equity securities | 70 | % | 75 | % | 70 | % | 72 | % | ||
| Debt securities | 30 | % | 25 | % | 29 | % | 27 | % | ||
| Real estate | — | — | 1 | % | 1 | % | ||||
| Total | 100 | % | 100 | % | 100 | % | 100 | % | ||
| Non-U.S. pension: | ||||||||||
| Equity securities | 56 | % | 56 | % | 54 | % | 60 | % | ||
| Debt securities | 38 | % | 39 | % | 41 | % | 36 | % | ||
| Real estate | 6 | % | 4 | % | 3 | % | 3 | % | ||
| Other | — | 1 | % | 2 | % | 1 | % | |||
| Total | 100 | % | 100 | % | 100 | % | 100 | % | ||
| Other postretirement benefits: | ||||||||||
| Equity securities | 80 | % | 84 | % | 79 | % | 79 | % | ||
| Debt securities | 20 | % | 16 | % | 21 | % | 21 | % | ||
| Total | 100 | % | 100 | % | 100 | % | 100 | % | ||
Our target asset allocations reflect our investment strategy of maximizing the rate of return on plan assets and the resulting funded status, within an appropriate level of risk. The U.S. plans are rebalanced to plus or minus five percentage points of the target asset allocation ranges on a monthly basis. The frequency of rebalancing for the non-U.S. plans varies depending on the plan.
Equity securities within plan assets include Caterpillar Inc. common stock in the amounts of:
| | U.S. Pension Benefits(1) | Other Postretirement Benefits | ||||||||||||||||
|---|---|---|---|---|---|---|---|---|---|---|---|---|---|---|---|---|---|---|
| | 2003 | 2002 | 2001 | 2003 | 2002 | 2001 | ||||||||||||
| | (Millions of dollars) | |||||||||||||||||
| Caterpillar Inc. common stock | $ | 245 | $ | 154 | $ | 153 | $ | 2 | $ | 1 | $ | 4 | ||||||
- (1)
- Amounts represent 3% of total plan assets for 2003 and 2% for 2002 and 2001.
C. Funded status
The funded status of the plans, reconciled to the amount reported on the Statement of Financial Position, is as follows:
| | U.S. Pension Benefits | Non-U.S. Pension Benefits | Other Postretirement Benefits | ||||||||||||||||||||||||||
|---|---|---|---|---|---|---|---|---|---|---|---|---|---|---|---|---|---|---|---|---|---|---|---|---|---|---|---|---|---|
| End of Year | |||||||||||||||||||||||||||||
| 2003 | 2002 | 2001 | 2003 | 2002 | 2001 | 2003 | 2002 | 2001 | |||||||||||||||||||||
| | (Millions of dollars) | ||||||||||||||||||||||||||||
| Fair value of plan assets | $ | 7,728 | $ | 6,443 | $ | 7,431 | $ | 1,262 | $ | 1,024 | $ | 1,050 | $ | 867 | $ | 849 | $ | 1,109 | |||||||||||
| Benefit obligations | 8,993 | 7,844 | 7,382 | 1,836 | 1,517 | 1,229 | 5,004 | 4,465 | 4,514 | ||||||||||||||||||||
| Over (under) funded status | (1,265 | ) | (1,401 | ) | 49 | (574 | ) | (493 | ) | (179 | ) | (4,137 | ) | (3,616 | ) | (3,405 | ) | ||||||||||||
| Amounts not yet recognized: | |||||||||||||||||||||||||||||
| Unrecognized prior service cost (benefit) | 202 | 278 | 327 | 31 | 33 | 36 | (280 | ) | (283 | ) | 167 | ||||||||||||||||||
| Unrecognized net actuarial loss | 2,518 | 2,009 | 318 | 677 | 547 | 198 | 1,381 | 976 | 413 | ||||||||||||||||||||
| Unrecognized net obligation existing at adoption of SFAS 87 | — | — | — | 6 | 9 | 7 | — | — | — | ||||||||||||||||||||
| Contributions made after measurement date | 1 | — | — | 14 | 22 | 4 | 57 | 20 | 17 | ||||||||||||||||||||
| Net amount recognized in financial position | $ | 1,456 | $ | 886 | $ | 694 | $ | 154 | $ | 118 | $ | 66 | $ | (2,979 | ) | $ | (2,903 | ) | $ | (2,808 | ) | ||||||||
Components of net amount recognized in financial position: | |||||||||||||||||||||||||||||
| Prepaid benefit costs | $ | 1,136 | $ | 1,071 | $ | 953 | $ | 61 | $ | 52 | $ | 34 | $ | — | $ | — | $ | — | |||||||||||
| Accrued benefit liabilities | (548 | ) | (735 | ) | (349 | ) | (127 | ) | (89 | ) | (61 | ) | (2,979 | ) | (2,903 | ) | (2,808 | ) | |||||||||||
| Intangible assets | 127 | 156 | 185 | 30 | 35 | 25 | — | — | — | ||||||||||||||||||||
| Liability for postemployment benefits | (136 | ) | (361 | ) | (233 | ) | (327 | ) | (279 | ) | (37 | ) | — | — | — | ||||||||||||||
| Accumulated other comprehensive income (pretax) | 877 | 755 | 138 | 517 | 399 | 105 | — | — | — | ||||||||||||||||||||
| Net asset (liability) recognized | $ | 1,456 | $ | 886 | $ | 694 | $ | 154 | $ | 118 | $ | 66 | $ | (2,979 | ) | $ | (2,903 | ) | $ | (2,808 | ) | ||||||||
A-18
The following amounts relate to our pension plans with projected benefit obligations in excess of plan assets:
| | U.S. Pension Benefits | Non-U.S. Pension Benefits | |||||||||||||||||
|---|---|---|---|---|---|---|---|---|---|---|---|---|---|---|---|---|---|---|---|
| | at Year-end | at Year-end | |||||||||||||||||
| | 2003 | 2002 | 2001 | 2003 | 2002 | 2001 | |||||||||||||
| | (Millions of dollars) | ||||||||||||||||||
| Projected benefit obligation | $ | (8,993 | ) | $ | (7,844 | ) | $ | (3,311 | ) | $ | (1,800 | ) | $ | (1,497 | ) | $ | (1,211 | ) | |
| Accumulated benefit obligation | $ | (8,379 | ) | $ | (7,482 | ) | $ | (3,289 | ) | $ | (1,633 | ) | $ | (1,338 | ) | $ | (1,093 | ) | |
| Fair value of plan assets | $ | 7,728 | $ | 6,443 | $ | 2,743 | $ | 1,216 | $ | 995 | $ | 1,021 | |||||||
The following amounts relate to our pension plans with accumulated benefit obligations in excess of plan assets:
| | U.S. Pension Benefits | Non-U.S. Pension Benefits | |||||||||||||||||
|---|---|---|---|---|---|---|---|---|---|---|---|---|---|---|---|---|---|---|---|
| | at Year-end | at Year-end | |||||||||||||||||
| | 2003 | 2002 | 2001 | 2003 | 2002 | 2001 | |||||||||||||
| | (Millions of dollars) | ||||||||||||||||||
| Projected benefit obligation | $ | (3,785 | ) | $ | (3,439 | ) | $ | (3,011 | ) | $ | (1,761 | ) | $ | (1,490 | ) | $ | (1,203 | ) | |
| Accumulated benefit obligation | $ | (3,751 | ) | $ | (3,416 | ) | $ | (3,010 | ) | $ | (1,601 | ) | $ | (1,334 | ) | $ | (1,088 | ) | |
| Fair value of plan assets | $ | 3,083 | $ | 2,345 | $ | 2,462 | $ | 1,181 | $ | 990 | $ | 1,015 | |||||||
The accumulated postretirement benefit obligation exceeds plan assets for all of our other postretirement benefit plans.
D. Expected cash flow
Information about the expected cash flow for the pension and other postretirement benefit plans follows:
| | U.S. Pension Benefits | Non-U.S. Pension Benefits | Other Postretirement Benefits | |||||||
|---|---|---|---|---|---|---|---|---|---|---|
| | (Millions of dollars) | |||||||||
| Employer contributions: | ||||||||||
| 2004 (expected) | $ | 500 | $ | 90 | $ | 340 | ||||
| Expected benefit payments: | ||||||||||
| 2004 | 630 | 60 | 340 | |||||||
| 2005 | 640 | 60 | 350 | |||||||
| 2006 | 650 | 70 | 360 | |||||||
| 2007 | 650 | 70 | 370 | |||||||
| 2008 | 660 | 70 | 380 | |||||||
| 2009-2013 | 3,400 | 400 | 1,920 | |||||||
| Total | $ | 6,630 | $ | 730 | $ | 3,720 | ||||
The above table reflects the total benefits expected to be paid from the plan or from company assets and does not include the participants' share of the cost.
E. Net periodic cost
| | U.S. Pension Benefits | Non-U.S. Pension Benefits | Other Postretirement Benefits | |||||||||||||||||||||||||||
|---|---|---|---|---|---|---|---|---|---|---|---|---|---|---|---|---|---|---|---|---|---|---|---|---|---|---|---|---|---|---|
| | 2003 | 2002 | 2001 | 2003 | 2002 | 2001 | 2003 | 2002 | 2001 | |||||||||||||||||||||
| | (Millions of dollars) | |||||||||||||||||||||||||||||
| Components of net periodic benefit cost: | ||||||||||||||||||||||||||||||
| Service cost | $ | 122 | $ | 115 | $ | 99 | $ | 43 | $ | 38 | $ | 35 | $ | 70 | $ | 80 | $ | 72 | ||||||||||||
| Interest cost | 554 | 529 | 516 | 83 | 70 | 65 | 298 | 292 | 289 | |||||||||||||||||||||
| Expected return on plan assets | (680 | ) | (783 | ) | (806 | ) | (94 | ) | (94 | ) | (90 | ) | (88 | ) | (115 | ) | (136 | ) | ||||||||||||
| Amortization of: | ||||||||||||||||||||||||||||||
| Net asset existing at adoption of SFAS 87 | — | — | — | 3 | (2 | ) | (1 | ) | — | — | — | |||||||||||||||||||
| Prior service cost(1) | 49 | 50 | 49 | 5 | 5 | 5 | (47 | ) | (22 | ) | 21 | |||||||||||||||||||
| Net actuarial loss (gain) | 27 | (1 | ) | (34 | ) | 14 | — | (1 | ) | 36 | 5 | (9 | ) | |||||||||||||||||
| Total cost (benefit) included in results of operations | $ | 72 | $ | (90 | ) | $ | (176 | ) | $ | 54 | $ | 17 | $ | 13 | $ | 269 | $ | 240 | $ | 237 | ||||||||||
| Weighted-average assumptions used to determine net cost: | ||||||||||||||||||||||||||||||
| Discount rate | 7.0 | % | 7.3 | % | 7.8 | % | 5.4 | % | 5.7 | % | 5.9 | % | 7.0 | % | 7.2 | % | 7.8 | % | ||||||||||||
| Expected return on plan assets(2) | 9.0 | % | 9.8 | % | 10.0 | % | 7.1 | % | 7.6 | % | 7.6 | % | 9.0 | % | 9.8 | % | 10.0 | % | ||||||||||||
| Rate of compensation increase | 4.0 | % | 4.0 | % | 4.0 | % | 3.3 | % | 3.3 | % | 3.7 | % | 4.0 | % | 4.0 | % | 4.0 | % | ||||||||||||
- (1)
- Prior service costs are amortized using the straight-line method over the average remaining service period to the full retirement eligibility date of employees expected to receive benefits from the plan amendment.
- (2)
- The weighted-average rates for 2004 are 9.0% and 7.4% for U.S. and non-U.S. plans, respectively.
A-19
Our U.S. expected long-term rate of return on plan assets is based on our estimate of long-term passive returns for equities and fixed income securities weighted by the allocation of our pension assets. Based on historical performance, we increase the passive returns due to our active management of the plan assets. To arrive at our expected long-term return, the amount added for active management was 1% for 2003, 2002 and 2001. A similar process is used to determine this rate for our non-U.S. plans.
The assumed health care trend rate represents the rate at which health care costs are assumed to increase. To calculate the 2003 benefit expense, we assumed an increase of 9.0% for 2003. This rate was assumed to decrease gradually to the ultimate health care trend rate of 4.5% in 2009. This rate represents 2.5% general inflation plus 2.0% additional health care inflation. Based on our recent expenses and our forecast of changes, we expect an increase of 8.5% during 2004 with no change to the ultimate trend rate.
F. Other postemployment benefit plans
We offer long-term disability benefits, continued health care for disabled employees, survivor income benefits insurance and supplemental unemployment benefits to substantially all eligible U.S. employees.
G. Summary of long-term liability:
| | December 31, | |||||||||
|---|---|---|---|---|---|---|---|---|---|---|
| | 2003 | 2002 | 2001 | |||||||
| | (Millions of dollars) | |||||||||
| Pensions: | ||||||||||
| U.S. pensions | $ | 136 | $ | 361 | $ | 233 | ||||
| Non-U.S. pensions | 327 | 279 | 37 | |||||||
| Total pensions | 463 | 640 | 270 | |||||||
| Postretirement benefits other than pensions | 2,638 | 2,614 | 2,578 | |||||||
| Other postemployment benefits | 71 | 79 | 72 | |||||||
| $ | 3,172 | $ | 3,333 | $ | 2,920 | |||||
H. Defined contribution plans
We have both U.S. and non-U.S. employee defined contribution plans to help employees save for retirement. In January 2003, we introduced a company match to our U.S. 401(k) plan. This plan allows eligible employees to contribute a portion of their salary to the plan on a tax-deferred basis, and we provide a matching contribution equal to 100% of employee contributions to the plan up to 6% of their compensation.
Various other U.S. and non-U.S. defined contribution plans allow eligible employees to contribute a portion of their salary to the plans and, in some cases, we provide a matching contribution to the funds.
Total company costs related to U.S. and non-U.S. defined contribution plans were the following:
| | 2003 | 2002 | 2001 | ||||||
|---|---|---|---|---|---|---|---|---|---|
| | (Millions of dollars) | ||||||||
| U.S. plans | $ | 106 | $ | 28 | $ | 35 | |||
| Non-U.S. plans | 11 | 7 | 6 | ||||||
| $ | 117 | $ | 35 | $ | 41 | ||||
12. Short-term borrowings
| | December 31, | |||||||||
|---|---|---|---|---|---|---|---|---|---|---|
| | 2003 | 2002 | 2001 | |||||||
| | (Millions of dollars) | |||||||||
| Machinery and Engines: | ||||||||||
| Notes payable to banks | $ | 72 | $ | 64 | $ | 219 | ||||
| Financial Products: | ||||||||||
| Notes payable to banks | 183 | 174 | 126 | |||||||
| Commercial paper | 2,087 | 1,682 | 1,715 | |||||||
| Other | 415 | 255 | 120 | |||||||
| 2,685 | 2,111 | 1,961 | ||||||||
| Total short-term borrowings | $ | 2,757 | $ | 2,175 | $ | 2,180 | ||||
The weighted average interest rates on external short-term borrowings outstanding were:
| | December 31, | ||||||
|---|---|---|---|---|---|---|---|
| | 2003 | 2002 | 2001 | ||||
| Notes payable to banks | 6.5 | % | 5.7 | % | 5.6 | % | |
| Commercial paper | 2.1 | % | 2.5 | % | 2.5 | % | |
| Other | 2.3 | % | 2.8 | % | 3.4 | % | |
Please refer to Note 17 on page A-22 and Table III on page A-23 for fair value information on short-term borrowings.
13. Long-term debt
| | December 31, | |||||||||
|---|---|---|---|---|---|---|---|---|---|---|
| | 2003 | 2002 | 2001 | |||||||
| | (Millions of dollars) | |||||||||
| Machinery and Engines: | ||||||||||
| Notes—6.000% due 2003 | $ | — | $ | — | $ | 253 | ||||
| Notes—6.550% due 2011 | 250 | 249 | 249 | |||||||
| Debentures—9.000% due 2006 | 208 | 209 | 211 | |||||||
| Debentures—6.000% due 2007 | — | 189 | 180 | |||||||
| Debentures—7.250% due 2009 | 315 | 318 | 321 | |||||||
| Debentures—9.375% due 2011 | 123 | 123 | 123 | |||||||
| Debentures—9.375% due 2021 | 236 | 236 | 236 | |||||||
| Debentures—8.000% due 2023 | 199 | 199 | 199 | |||||||
| Debentures—6.625% due 2028 | 299 | 299 | 299 | |||||||
| Debentures—7.300% due 2031 | 348 | 348 | 348 | |||||||
| Debentures—6.950% due 2042 | 249 | 249 | — | |||||||
| Debentures—7.375% due 2097 | 297 | 297 | 297 | |||||||
| Medium-term notes | — | 25 | 26 | |||||||
| Capital lease obligations | 611 | 538 | 467 | |||||||
| Commercial paper supported by revolving credit agreements (Note 14) | 45 | — | 130 | |||||||
| Other | 187 | 124 | 153 | |||||||
| Total Machinery and Engines | 3,367 | 3,403 | 3,492 | |||||||
| Financial Products: | ||||||||||
| Commercial paper supported by revolving credit agreements (Note 14) | $ | 1,825 | $ | 1,825 | $ | 1,755 | ||||
| Medium-term notes | 8,775 | 6,298 | 5,972 | |||||||
| Other | 111 | 70 | 72 | |||||||
| Total Financial Products | 10,711 | 8,193 | 7,799 | |||||||
| Total long-term debt due after one year | $ | 14,078 | $ | 11,596 | $ | 11,291 | ||||
All outstanding notes and debentures are unsecured. The capital lease obligations are collateralized by leased manufacturing equipment and/or security deposits.
The 6% debentures due in 2007 were sold at significant original issue discounts ($144 million). This issue was carried net of the unamortized portion of its discount, which was amortized as interest expense over the life of the issue. These debentures had a principal at maturity of $250 million and an effective annual rate of 13.3%. The debentures were redeemed in August 2003.
We may redeem the 6.55% notes and the 7.25%, 6.625%, 7.3%, 6.95% and 7.375% debentures in whole or in part at our option at any time at a redemption price equal to the greater of 100% of the principal amount of the debentures to be redeemed or the sum of the present value of the remaining scheduled payments.
A-20
The terms of other notes and debentures do not specify a redemption option prior to maturity.
The medium-term notes are offered on a continuous basis through agents and are primarily at fixed rates. At December 31, 2003, Machinery and Engines medium-term notes had a weighted average interest rate of 8.1% and mature in January 2004. Financial Products medium-term notes have a weighted average interest rate of 3.0% with remaining maturities up to 15 years at December 31, 2003.
The aggregate amounts of maturities of long-term debt during each of the years 2004 through 2008, including amounts due within one year and classified as current, are:
| | December 31, | ||||||||||||||
|---|---|---|---|---|---|---|---|---|---|---|---|---|---|---|---|
| | 2004 | 2005 | 2006 | �� | 2007 | 2008 | |||||||||
| | (Millions of dollars) | ||||||||||||||
| Machinery and Engines | $ | 32 | $ | 62 | $ | 291 | $ | 33 | $ | 20 | |||||
| Financial Products | 2,949 | 3,510 | 4,726 | 1,064 | 857 | ||||||||||
| $ | 2,981 | $ | 3,572 | $ | 5,017 | $ | 1,097 | $ | 877 | ||||||
Interest paid on short-term and long-term borrowings for 2003, 2002 and 2001 was $718 million, $815 million and $1,009 million, respectively.
Please refer to Note 17 on page A-22 and Table III on page A-23 for fair value information on long-term debt.
14. Credit commitments
| | December 31, 2003 | ||||||||||
|---|---|---|---|---|---|---|---|---|---|---|---|
| | Consolidated | Machinery and Engines | Financial Products | ||||||||
| | (Millions of dollars) | ||||||||||
| Credit lines available: | |||||||||||
| Global credit facility | $ | 4,675 | (1) | $ | 600 | (1) | $ | 4,075 | (1) | ||
| Other external | 1,549 | 683 | 866 | ||||||||
| Total credit lines available | 6,224 | 1,283 | 4,941 | ||||||||
| Less: Global credit facility supporting commercial paper | 3,957 | 45 | 3,912 | ||||||||
| Less: Utilized credit | 255 | 72 | 183 | ||||||||
| Available credit | $ | 2,012 | $ | 1,166 | $ | 846 | |||||
- (1)
- We have two global credit facilities with a syndicate of banks totaling $4,675 million available in the aggregate to both Machinery and Engines and Financial Products to support commercial paper programs. Based on management's allocation decision, which can be revised at any time during the year, the portion of the facility available to Cat Financial at December 31, 2003 was $4,075 million. The five-year facility of $2,125 million expires in September 2006. The 364-day facility of $2,550 million expires in September 2004. The facility expiring in September 2004 has a provision that allows Caterpillar or Cat Financial to obtain a one-year loan in September 2004 that would mature in September 2005.
Based on long-term credit agreements, $1,870 million, $1,825 million and $1,885 million of commercial paper outstanding at December 31, 2003, 2002 and 2001, respectively, was classified as long-term debt due after one year.
15. Capital stock
A. Stock options
In 1996, stockholders approved the Stock Option and Long-Term Incentive Plan (the Plan) providing for the granting of options to purchase common stock to officers and other key employees, as well as non-employee directors. The Plan reserves 47 million shares of common stock for issuance (39 million under the Plan and 8 million under prior stock option plans). Options vest at the rate of one-third per year over the three year period following the date of grant, and have a maximum term of 10 years. Common shares issued under stock options, including treasury shares reissued, totaled 4,925,496 for 2003, 882,580 for 2002 and 693,444 for 2001.
The Plan grants options which have exercise prices equal to the average market price on the date of grant. As required by SFAS 148, a summary of the pro forma net income and profit per share amounts is shown in Item M of Note 1 on page A-11. The fair value of each option grant is estimated at the date of grant using the Black-Scholes option-pricing model.
Please refer to Table II on page A-22 for additional financial information on our stock options.
B. Restricted stock
The Plan permits the award of restricted stock to officers and other key employees. Prior to January 1, 2002, the plan also permitted awards to non-employee directors. During 2003, 2002 and 2001, officers and other key employees were awarded 42,210 shares, 52,475 shares and 143,686 shares, respectively, of restricted stock. Restricted shares (in phantom form) awarded to officers and other key employees totaled 4,425 and 8,450 in 2003 and 2002, respectively. During 2001, non-employee directors were granted an aggregate of 9,750 shares of restricted stock.
C. Stockholders' rights plan
We are authorized to issue 5,000,000 shares of preferred stock, of which 2,000,000 shares have been designated as Series A Junior Participating Preferred Stock of $1 par value. None of the preferred shares have been issued.
Stockholders would receive certain preferred stock purchase rights if someone acquired or announced a tender offer to acquire 15% or more of outstanding Caterpillar stock. In essence, those rights would permit each holder (other than the acquiring person) to purchase one share of Caterpillar stock at a 50% discount for every share owned. The rights, designed to protect the interests of Caterpillar stockholders during a takeover attempt, expire December 11, 2006.
16. Profit per share
Computations of profit per share:
| | 2003 | 2002 | 2001 | |||||||
|---|---|---|---|---|---|---|---|---|---|---|
| | (Dollars in millions except per share data) | |||||||||
| Profit for the period (A) | $ | 1,099 | $ | 798 | $ | 805 | ||||
| Determination of shares (millions): | ||||||||||
| Weighted average number of common shares outstanding (B) | 345.2 | 344.0 | 343.3 | |||||||
| Shares issuable on exercise of stock options, net of shares assumed to be purchased out of proceeds at average market price | 6.2 | 2.9 | 3.8 | |||||||
| Average common shares outstanding for fully diluted computation (C) | 351.4 | 346.9 | 347.1 | |||||||
| Profit per share of common stock: | ||||||||||
| Assuming no dilution (A/B) | $ | 3.18 | $ | 2.32 | $ | 2.35 | ||||
| Assuming no dilution (A/C) | $ | 3.13 | $ | 2.30 | $ | 2.32 | ||||
| Shares outstanding as of December 31 (in millions) | 343.8 | 344.3 | 343.4 | |||||||
Stock options to purchase 27,881,279 and 19,886,054 shares of common stock at a weighted-average price of $54.34 and $55.79 were outstanding during 2002 and 2001, respectively, but were not included in the computation of diluted profit per share because the options' exercise price was greater than the average market price of the common shares. In 2003, all stock options were included in the computation of diluted profit per share.
A-21
TABLE II—Financial Information Related to Capital Stock
Changes in the status of common shares subject to issuance under options:
| | 2003 | 2002 | 2001 | ||||||||||||||||
|---|---|---|---|---|---|---|---|---|---|---|---|---|---|---|---|---|---|---|---|
| | Shares | Weighted- Exercise Average Price | Shares | Weighted- Average Exercise Price | Shares | Weighted- Average Exercise Price | |||||||||||||
| Fixed Options: | |||||||||||||||||||
| Outstanding at beginning of year | 38,721,364 | $ | 48.91 | 32,295,230 | $ | 47.34 | 26,336,074 | $ | 44.49 | ||||||||||
| Granted to officers and key employees | 8,418,100 | $ | 54.29 | 8,050,864 | $ | 50.72 | 7,512,206 | $ | 53.53 | ||||||||||
| Granted to outside directors | 56,000 | $ | 52.06 | 52,000 | $ | 58.87 | 52,000 | $ | 45.51 | ||||||||||
| Exercised | (7,629,020 | ) | $ | 42.04 | (1,580,754 | ) | $ | 26.41 | (1,273,361 | ) | $ | 23.64 | |||||||
| Lapsed | (66,772 | ) | $ | 50.18 | (95,976 | ) | $ | 50.28 | (331,689 | ) | $ | 47.13 | |||||||
| Outstanding at end of year | 39,499,672 | $ | 51.38 | 38,721,364 | $ | 48.91 | 32,295,230 | $ | 47.34 | ||||||||||
| Options exercisable at year-end | 23,650,987 | $ | 50.28 | 23,909,130 | $ | 48.23 | 19,062,802 | $ | 45.74 | ||||||||||
| Weighted-average fair value of options granted during the year | $ | 12.82 | $ | 14.85 | $ | 14.56 | |||||||||||||
Stock options outstanding and exercisable:
| | | Options Outstanding | Options Exercisable | |||||||||||
|---|---|---|---|---|---|---|---|---|---|---|---|---|---|---|
| | Exercise Prices | # Outstanding at 12/31/03 | Weighted-Average Remaining Contractual Life (Years) | Weighted-Average Exercise Price | # Outstanding at 12/31/03 | Weighted-Average Exercise Price | ||||||||
| $ | 26.77-$39.19 | 6,317,138 | 4.9 | $ | 36.11 | 6,317,138 | $ | 36.11 | ||||||
| $ | 43.75-$62.34 | 33,182,534 | 7.3 | $ | 54.29 | 17,333,849 | $ | 55.44 | ||||||
| 39,499,672 | 6.9 | $ | 51.38 | 23,650,987 | $ | 50.28 | ||||||||
Weighted-average assumptions used in determining fair value of option grants:
| | Grant Year | ||||||
|---|---|---|---|---|---|---|---|
| | 2003 | 2002 | 2001 | ||||
| Dividend yield | 2.75 | % | 2.55 | % | 2.49 | % | |
| Expected volatility | 29.6 | % | 35.0 | % | 30.1 | % | |
| Risk-free interest rates | 2.52 | % | 4.13 | % | 4.88 | % | |
| Expected lives | 6 years | 5 years | 5 years | ||||
17. Fair values of financial instruments
We used the following methods and assumptions to estimate the fair value of our financial instruments:
Cash and short-term investments—carrying amount approximated fair value.
Long-term investments (other than investments in unconsolidated affiliated companies)—fair value was estimated based on quoted market prices.
Foreign currency forward and option contracts—fair value of forward contracts was determined by discounting the future cash flow resulting from the differential between the contract price and the forward rate. Fair value of option contracts was determined by using the Black-Scholes model.
Finance receivables—fair value was estimated by discounting the future cash flow using current rates, representative of receivables with similar remaining maturities. Historical bad-debt experience also was considered.
Short-term borrowings—carrying amount approximated fair value.
Long-term debt—for Machinery and Engines notes and debentures, fair value was estimated based on quoted market prices. For Financial Products, fair value was estimated by discounting the future cash flow using our current borrowing rates for similar types and maturities of debt, except for floating rate notes and commercial paper supported by revolving credit agreements for which the carrying amounts were considered a reasonable estimate of fair value.
Interest rate swaps—fair value was estimated based on the amount that we would receive or pay to terminate our agreements as of year-end.
Please refer to Table III on page A-23 for the fair values of our financial instruments.
18. Concentration of credit risk
Financial instruments with potential credit risk consist primarily of trade and finance receivables and short-term and long-term investments. Additionally, to a lesser extent, we have a potential credit risk associated with counterparties to derivative contracts.
A-22
Trade receivables are primarily short-term receivables from independently owned and operated dealers which arise in the normal course of business. We perform regular credit evaluations of our dealers. Collateral generally is not required, and the majority of our trade receivables are unsecured. We do, however, when deemed necessary, make use of various devices such as security agreements and letters of credit to protect our interests. No single dealer or customer represents a significant concentration of credit risk.
Finance receivables primarily represent receivables under installment sales contracts, receivables arising from leasing transactions and notes receivable. Receivables from customers in construction-related industries made up approximately one-third of total finance receivables at December 31, 2003, 2002 and 2001. We generally maintain a secured interest in the equipment financed. No single customer or region represents a significant concentration of credit risk.
Short-term and long-term investments are held with high quality institutions and, by policy, the amount of credit exposure to any one institution is limited. Long-term investments, included in Other Assets in Statement 3, are comprised of investments which collateralize capital lease obligations (see Note 13) and investments of Cat Insurance supporting insurance reserve requirements.
Outstanding derivative instruments, with notional amounts totaling $8,625 million, $6,983 million and $5,872 million, and terms generally ranging up to five years, were held at December 31, 2003, 2002 and 2001, respectively. Collateral is not required of the counterparties or of our company. We do not anticipate nonperformance by any of the counterparties. Our exposure to credit loss in the event of nonperformance by the counterparties is limited to only those gains that we have recorded, but have not yet received cash payment. At December 31, 2003, 2002 and 2001, the exposure to credit loss was $336 million, $176 million and $80 million, respectively.
Please refer to Note 17 on page A-22 and Table III below for fair value information.
19. Operating leases
We lease certain computer and communications equipment, transportation equipment and other property through operating leases. Total rental expense for operating leases was $242 million, $240 million and $256 million for 2003, 2002 and 2001, respectively.
Minimum payments for operating leases having initial or remaining non-cancelable terms in excess of one year are:
| | Years ended December 31, | |||||||||||||||||||
|---|---|---|---|---|---|---|---|---|---|---|---|---|---|---|---|---|---|---|---|---|
| | 2004 | 2005 | 2006 | 2007 | 2008 | After 2008 | Total | |||||||||||||
| | (Millions of dollars) | |||||||||||||||||||
| $ | 194 | $ | 146 | $ | 118 | $ | 71 | $ | 54 | $ | 305 | $ | 888 | |||||||
20. Guarantees and product warranty
We have guaranteed to repurchase loans of certain Caterpillar dealers from the Dealer Capital Asset Trust (DCAT) in the event of default. These guarantees arose in conjunction with Cat Financial's relationship with third party dealers who sell Caterpillar equipment. These guarantees have terms ranging from one to four years and are secured primarily by dealer assets. At December 31, 2003 and 2002, the total amount outstanding under these guarantees was $380 million and $290 million, respectively, and the related book value was $5 million for 2003 and zero for 2002.
Our product warranty liability is determined by applying historical claim rate experience to the current field population and dealer inventory. Generally, historical claim rates are developed using a 12-month rolling average of actual warranty payments. These rates are applied to the field population and dealer inventory to determine the liability.
| | 2003 | 2002 | 2001 | |||||||
|---|---|---|---|---|---|---|---|---|---|---|
| | (Millions of dollars) | |||||||||
| Warranty liability, January 1 | $ | 693 | $ | 652 | $ | 615 | ||||
| Payments | (484 | ) | (494 | ) | (478 | ) | ||||
| Provision for warranty | 413 | 535 | 515 | |||||||
| Warranty liability, December 31 | $ | 622 | $ | 693 | $ | 652 | ||||
TABLE III—Fair Values of Financial Instruments
| | 2003 | 2002 | 2001 | | |||||||||||||||||||
|---|---|---|---|---|---|---|---|---|---|---|---|---|---|---|---|---|---|---|---|---|---|---|---|
| | Carrying Amount | Fair Value | Carrying Amount | Fair Value | Carrying Amount | Fair Value | Reference # | ||||||||||||||||
| | (Millions of dollars) | | |||||||||||||||||||||
| Asset (Liability) at December 31 | |||||||||||||||||||||||
| Cash and short-term investments | $ | 342 | $ | 342 | $ | 309 | $ | 309 | $ | 400 | $ | 400 | Statement 3, Note 18 | ||||||||||
| Long-term investments | 1,057 | 1,057 | 874 | 874 | 791 | 791 | Note 18 | ||||||||||||||||
| Foreign currency contracts | 167 | 167 | 47 | 47 | 2 | 2 | Note 2 | ||||||||||||||||
| Finance receivables—net (excluding finance type leases(1)) | 13,881 | 13,915 | 12,093 | 12,177 | 10,931 | 10,957 | Note 5 | ||||||||||||||||
| Short-term borrowings | (2,757 | ) | (2,757 | ) | (2,175 | ) | (2,175 | ) | (2,180 | ) | (2,180 | ) | Note 12 | ||||||||||
| Long-term debt (including amounts due within one year) | |||||||||||||||||||||||
| Machinery and Engines | (3,399 | ) | (3,873 | ) | (3,661 | ) | (4,185 | ) | (3,565 | ) | (3,749 | ) | Note 13 | ||||||||||
| Financial Products | (13,660 | ) | (13,846 | ) | (11,847 | ) | (12,118 | ) | (10,857 | ) | (11,048 | ) | Note 13 | ||||||||||
| Interest rate swaps Financial Products— | |||||||||||||||||||||||
| in a net receivable position | 87 | 87 | 84 | 84 | 58 | 58 | Note 2 | ||||||||||||||||
| in a net payable position | (59 | ) | (59 | ) | (85 | ) | (85 | ) | (71 | ) | (71 | ) | Note 2 | ||||||||||
- (1)
- Excluded items have a net carrying value at December 31, 2003, 2002 and 2001 of $1,546 million, $1,369 million and $1,185 million, respectively.
A-23
21. Environmental and legal matters
The company is regulated by federal, state and international environmental laws governing our use of substances and control of emissions in all our operations. Compliance with these existing laws has not had a material impact on our capital expenditures, earnings or competitive position.
We are cleaning up hazardous waste at a number of locations, often with other companies, pursuant to federal and state laws. When it is likely we will pay clean-up costs at a site and those costs can be estimated, the costs are charged against our earnings. In making that estimate, we do not consider amounts expected to be recovered from insurance companies and others.
The amount recorded for environmental cleanup is not material and is included in "Accrued expenses" in Statement 3. If a range of liability estimates is available on a particular site, we accrue the lower end of that range.
We cannot estimate costs on sites in the very early stages of cleanup. Currently, we have five sites in the very early stages of cleanup, and there is no more than a remote chance that a material amount for cleanup will be required.
Pursuant to a consent decree Caterpillar entered with the United States Environmental Protection Agency (EPA), the company was required to meet certain emission standards by October 2002. The decree provided that if engine manufacturers were unable to meet the standards at that time, they would be required to pay a non-conformance penalty (NCP) on each engine sold that did not meet the standard. The amount of the NCP would be based on how close to meeting the standard the engine came—the more out of compliance the higher the penalty. The company began shipping lower emission engines in October 2002 as a bridge until fully compliant Advanced Combustion Emission Reduction Technology (ACERT®) engines were introduced in 2003.
The consent decree also provided the ability to "bank" emissions credits prior to October 2002 that could be used to offset non-conforming engines produced after December 31, 2002. That is, if a company was able to produce and sell engines that were below the applicable standard prior to October 2002, then the company could apply the emission credits created by those engines to engines produced after December 31, 2002 that did not meet the consent decree standard. For example, an engine produced and sold prior to October 2002 that produced 3.5 grams of NOx as compared to a 4.0 gram standard would create an emissions credit. This credit would be "banked" to be used to offset the NOx deficiency of an engine produced after December 31, 2002 that did not meet the consent decree standard. Given this scenario, a company could produce and sell a 3.0 gram engine in 2003 without paying an NCP even though the engine exceeds the 2.5 gram standard. Caterpillar had a legal right, as described in the consent decree, to use its banked credits as offsets against NCPs for non-compliant engines produced after December 31, 2002. The EPA has approved the process by which the credits are calculated.
In a final report to the EPA filed during the third quarter of 2003, we identified 70,018 medium heavy-duty engines produced and sold prior to October 2002 that yielded emissions below the applicable standard for that period, resulting in 20,868 Mg of medium heavy-duty banked credits. This is 381 engines and 120 Mg less than had been identified at the end of 2002. The number of engines generating emissions credits in our final report to the EPA was lowered for a variety of reasons including a more detailed analysis of engines actually produced that were eligible to generate credits and the identification of engines shipped to customers outside the United States which were not eligible to generate emissions credits. During 2003, banked credits offset the NCPs on all but approximately 600 of the approximately 31,000 non-conforming medium heavy-duty engines we produced. We paid NCPs of $2,485 per engine, or $1.5 million, on the 600 medium heavy-duty engines produced in 2003 in excess of those for which we could use banked credits. We also identified 731 heavy-duty engines built prior to October 1, 2002, that generated banked credits totaling 969 Mg. This is 227 engines and 261 Mg less than had been identified at the end of 2002; the reasons for the reduction are similar to those resulting in the adjustments to medium heavy-duty engines and credits. Banked credits offset the NCPs on approximately 2,000 of the 45,000 non-conforming heavy-duty engines we built during 2003. We paid NCPs of approximately $3,555 per engine, or $153 million on the remaining 43,000 heavy-duty engines produced in 2003 in excess of those for which we could use banked credits.
We began production of medium heavy-duty ACERT engines that were fully-compliant with the EPA emissions standards in early 2003, and in mid-2003 began producing fully-compliant heavy-duty ACERT engines. During 2003, Caterpillar received certification from the EPA for its C7 and C9 medium heavy-duty ACERT engines and its C11, C13 and C15 heavy-duty ACERT engines. By the end of 2003 Caterpillar was producing all of these engine models, and as a result, does not expect to pay NCPs on engines built during 2004.
The certification process is described in the consent decree and the regulations, and includes the following:
- •
- The durability of the engine is established through testing to determine if the engine emissions change with time. An emissions deterioration factor is determined that represents the amount of emission deterioration that would be expected over the useful life of the engine.
- •
- An emission data engine is tested according to the regulations. Emission levels are determined on various steady state and transient tests.
- •
- The results from the emissions tests are submitted to the EPA in a certification application as proof that the engine meets the requirements along with additional information and a request that a certificate be granted.
- •
- The EPA reviews the application and if all the regulatory requirements are met, a certificate is issued.
- •
- If the engine exceeds the standard, the EPA issues a certificate for either a banked or an NCP engine. The NCP engine certificate requires Production Compliance Auditing (PCA) testing.
After receipt of the EPA certificate, manufacturing and shipment of the certified engines can begin. Each engine is labeled to indicate that it is certified.
Our expense for NCPs was $40 million in 2002 and $153 million in 2003. NCP expense recorded in 2002 was based on our engineering estimates at that time of the expected results of EPA emissions testing that began and was completed in 2003. NCP expense recorded in 2003 reflects the results of the completed tests, including a reduction of approximately 3% to the NCP expense recorded for 2002. During the fourth quarter of 2003, we re-tested one configuration of our heavy-duty bridge engine models, averaging the results with an earlier test. Our 2003 NCP expense includes a $10 million fourth-quarter benefit from the re-test related to all
A-24
bridge engines of that configuration produced since October 2002, including $1.3 million for engines produced in the fourth quarter of 2002 and $7.4 million for engines produced during the first three quarters of 2003. For 2002, we paid NCPs on approximately 6,200 heavy-duty units and 7,200 medium heavy-duty units, and for 2003 we paid NCPs on approximately 43,000 heavy-duty units and 600 medium heavy-duty units.
Aside from $142 million in customary research and development expenses, emissions standard changes negatively impacted our 2002 financial results by $24 million ($17 million after tax) as NCPs ($40 million pre-tax), product cost increases and ramp-up production costs ($4 million pre-tax) were partially offset by price increases for these engines ($20 million pre-tax). NCPs were deposited in an escrow account prior to completion of emissions testing for each engine model throughout 2003, and were paid to the EPA, either from the escrow account or directly, after completion of testing of a particular model. On January 30, 2004 Caterpillar paid NCPs to the EPA for engines built during the fourth quarter of 2003, ending its payments to the EPA for NCPs for engines built during 2002 and 2003. NCP expense for 2003 reflects this payment.
The following table reflects the 2002 impact of the emission standard changes:
| | 2002 | |||
|---|---|---|---|---|
| | (Millions of dollars) | |||
| Price (Engines sold × bridge price increase) | $ | 20 | ||
| Incremental costs (Cost of additional materials and production costs) | (4 | ) | ||
| NCPs (Engines sold × projected NCP per engine) | (40 | ) | ||
| Net effect pre-tax | $ | (24 | ) | |
| Tax | 7 | |||
| Net effect after tax | $ | (17 | ) | |
Aside from $115 million in customary research and development expenses, emissions standard changes negatively impacted our 2003 financial results by $46 million ($34 million after-tax). The net unfavorable impact of emission standard changes was greater in 2003 than in 2002 as significantly higher NCPs (approximately $153 million pre-tax), product cost increases and ramp-up production costs (approximately $84 million pre-tax), were partially offset by price increases for bridge and ACERT engines (approximately $191 million pre-tax). The following table reflects the 2003 impact of the emission standard changes:
| | 2003 | |||
|---|---|---|---|---|
| | (Millions of dollars) | |||
| Price (Engines sold × bridge or ACERT price increase) | $ | 191 | ||
| Incremental costs (Cost of additional materials and production costs) | (84 | ) | ||
| NCPs (Engines sold × NCP per engine—banked credits) | (153 | ) | ||
| Net effect pre-tax | $ | (46 | ) | |
| Tax | 12 | |||
| Net effect after tax | $ | (34 | ) | |
In addition to the above, the consent decree required Caterpillar to pay a fine of $25 million, which was expensed in 1998 and to make investments totaling $35 million in environmental-related products by July 7, 2007. Total qualifying investments to date for these projects is $29 million, of which $10 million was made in 2002 and $19 million in 2003. A future benefit is expected to be realized from these environmental projects related to Caterpillar's ability to capitalize on the technologies it developed in complying with its environmental project obligations. In short, Caterpillar expects to receive a positive net return on the environmental projects by being able to market the technology it developed.
NCPs were approximately $3,500 per heavy-duty engine subject to NCPs, based on the results of the completed EPA testing. Our net price increase for heavy-duty bridge engines was successfully implemented on October 1, 2002; this increase was competitive with price increases implemented by other engine manufacturers on that date. With the introduction of ACERT engines in 2003, we implemented an additional price increase to truck manufacturers that purchase our heavy-duty engines, and on January 1, 2004, we implemented a price increase for medium heavy-duty ACERT engines. These increases are based on the additional value that we expect truck owners to receive from ACERT engines compared to engines of our competitors as a result of better fuel economy, less maintenance and greater durability. The ultimate net price increase we are able to achieve for our ACERT engines in the future is dependent upon marketplace acceptance of these engines versus competitive alternatives.
On January 16, 2002, Caterpillar commenced an action in the Circuit Court of the Tenth Judicial Circuit of Illinois in Peoria, Illinois, against Navistar International Transportation Corporation and International Truck and Engine Corporation (collectively Navistar). The lawsuit arises out of a long-term purchase contract between Caterpillar and Navistar effective May 31, 1988, as amended from time to time (the Purchase Agreement). The pending complaint alleges that Navistar breached its contractual obligations by: (i) paying Caterpillar $8.08 less per fuel injector than the agreed upon price for new unit injectors delivered by Caterpillar; (ii) refusing to pay contractually agreed upon surcharges owed as a result of Navistar ordering less than planned volumes of replacement unit injectors; and (iii) refusing to pay contractually agreed upon interest stemming from Navistar's late payments. At December 31, 2003, the past due receivable from Navistar regarding the foregoing was $132 million. The pending complaint also has claims alleging that Franklin Power Products, Inc., Newstream Enterprises, and Navistar, collectively and individually, failed to pay the applicable price for shipments of unit injectors to Franklin and Newstream. At December 31, 2003, the past due receivables for the foregoing totaled $12 million. The pending complaint further alleges that Sturman Industries, Inc., and Sturman Engine Systems, Inc., colluded with Navistar to utilize technology that Sturman Industries, Inc., misappropriated from Caterpillar to help Navistar develop its G2 fuel system, and tortiously interfered with the Purchase Agreement and Caterpillar's prospective economic relationship with Navistar. The pending complaint further alleges that the two parties' collusion led Navistar to select Sturman Engine Systems, Inc., and another company, instead of Caterpillar, to develop and manufacture the G2 fuel system.
On May 7, 2002, International Truck and Engine Corporation (International) commenced an action against Caterpillar in the Circuit Court of DuPage County, Illinois, that alleges Caterpillar breached various aspects of a long-term agreement term sheet. In its fourth amended complaint, International seeks a declaration from the court that the term sheet constitutes a legally binding contract for the sale of heavy-duty engines at specified prices through the end of 2006, alleges that Caterpillar breached the term sheet by raising certain prices effective October 1, 2002, and also alleges that Caterpillar breached an obligation to negotiate a comprehensive long-term agreement referenced in the term sheet.
A-25
International further claims that Caterpillar improperly restricted the supply of heavy-duty engines to International from June through September 2002, and claims that Caterpillar made certain fraudulent misrepresentations with respect to the availability of engines during this time period. International seeks damages "in an amount to be determined at trial" and injunctive relief. Caterpillar filed an answer denying International's claims and has filed a counterclaim seeking a declaration that the term sheet has been effectively terminated. Caterpillar denies International's claims and will vigorously contest them. On September 24, 2003, the Appellate Court of Illinois, ruling on an interlocutory appeal, issued an order consistent with Caterpillar's position that, even if the court subsequently determines that the term sheet is a binding contract, it is indefinite in duration and was therefore terminable at will by Caterpillar after a reasonable period. Caterpillar anticipates that a trial currently scheduled for the third quarter of 2004 will address all remaining issues in this matter. This matter is not related to the breach of contract action brought by Caterpillar against Navistar currently pending in the Circuit Court of Peoria County, Illinois.
On August 30, 2002, a World Trade Organization (WTO) arbitration panel determined that the European Union (EU) may impose up to $4.04 billion per year in retaliatory tariffs if the U.S. tax code is not brought into compliance with an August 2001 WTO decision that found the extraterritorial tax (ETI) provisions of the FSC Repeal and Extraterritorial Income Exclusion Act of 2000 constitute an export subsidy prohibited by the WTO Agreement on Subsidies and Countervailing Measures. Since August 2002, the EU has developed a list of U.S. origin products on which the EU could impose tariffs as high as 100% of the value of the product. Negotiations among EU Member States, the European Commission and the private sector over which products would be listed were intense. The EU finalized the list in December 2003 and stated that in March 2004 it will begin imposing retaliatory tariffs of 5% on certain U.S. origin goods. If imposed, the tariffs would increase 1 percentage point per month to a maximum of 17% after one year. The gradual increase in tariffs is designed to place increasing pressure on the U.S. government to bring its tax laws into compliance with its WTO obligations. Given the makeup of the final retaliation list, some Caterpillar parts and components will be subjected to these additional tariffs. Based on what we know today, we do not believe these tariffs will materially impact our financial results. The company has production facilities in the EU, Russia, Asia and South America that would not be affected by a retaliatory tariff aimed at U.S. origin products. When the EU implements its proposed tariffs, increased pressure will be placed on Congress to repeal ETI, possibly during the current session. It is not possible to predict how the U.S. legislative process will affect the company's 2004 income tax liability, but based on what we know today, we do not believe the impact, if any, will be material.
22. Segment information
A. Basis for segment information
The company is organized based on a decentralized structure that has established accountabilities to continually improve business focus and increase our ability to react quickly to changes in both the global business cycle and competitors' actions. Our current structure uses a product, geographic matrix organization comprised of multiple profit and service center divisions.
Caterpillar is a highly integrated company. The majority of our profit centers are product focused. They are primarily responsible for the design, manufacture and ongoing support of their products. However, some of these product-focused profit centers also have marketing responsibilities. We also have geographically-based profit centers that are focused primarily on marketing. However, most of these profit centers also have some manufacturing responsibilities. One of our profit centers provides various financial services to our customers and dealers. The service center divisions perform corporate functions and provide centralized services.
We have developed an internal measurement system to evaluate performance and to drive continuous improvement. This measurement system, which is not based on generally accepted accounting principles (GAAP), is intended to motivate desired behavior of employees and drive performance. It is not intended to measure a division's contribution to enterprise results. The sales and cost information used for internal purposes varies significantly from our consolidated, externally reported information resulting in substantial reconciling items. Each division has specific performance targets and is evaluated and compensated based on achieving those targets. Performance targets differ from division to division; therefore, meaningful comparisons cannot be made among the profit or service center divisions. It is the comparison of actual results to budgeted results that makes our internal reporting valuable to management. Consequently, we feel that the financial information required by Statement of Financial Accounting Standards No. 131 (SFAS 131), "Disclosures about Segments of an Enterprise and Related Information" has limited value for our external readers.
Due to Caterpillar's high level of integration and our concern that segment disclosures based on SFAS 131 requirements have limited value to external readers, we are continuing to disclose financial results for our three principal lines of business (Machinery, Engines and Financial Products) in our Management's Discussion and Analysis beginning on page A-33.
B. Description of segments
The profit center divisions meet the SFAS 131 definition of "operating segments;" however, the service center divisions do not. Several of the profit centers have similar characteristics and have been aggregated. The following is a brief description of our seven reportable segments and the business activities included in theAll Other category.
Asia/Pacific Marketing: Primarily responsible for marketing products through dealers in Australia, Asia (excluding Japan) and the Pacific Rim. Also includes the regional manufacturing of some products which also are produced byConstruction & Mining Products.
Construction & Mining Products: Primarily responsible for the design, manufacture and ongoing support of small, medium and large machinery used in a variety of construction and mining applications. Also includes the design, manufacture, procurement and marketing of components and control systems that are consumed primarily in the manufacturing of our machinery.
EAME Marketing: Primarily responsible for marketing products (excludingPower Products) through dealers in Europe, Africa, the Middle East and the Commonwealth of Independent
A-26
States. Also includes the regional manufacturing of some products which are also produced byConstruction & Mining Products andPower Products.
Financing & Insurance Services: Provides financing to customers and dealers for the purchase and lease of Caterpillar and other equipment, as well as some financing for Caterpillar sales to dealers. Financing plans include operating and finance leases, installment sale contracts, working capital loans and wholesale financing plans.The division also provides various forms of insurance to customers and dealers to help support the purchase and lease of our equipment.
Latin America Marketing: Primarily responsible for marketing products through dealers in Latin America. Also includes the regional manufacturing of some products that also are produced byConstruction & Mining Products andPower Products.
Power Products: Primarily responsible for the design, manufacture, marketing and ongoing support of reciprocating and turbine engines along with related systems. These engines and related systems are used in products manufactured in other segments, on-highway trucks and locomotives; and in a variety of construction, electric power generation, marine, petroleum and industrial applications.
North America Marketing: Primarily responsible for marketing products (excludingPower Products) through dealers in the United States and Canada.
All Other: Primarily includes activities such as: service support and parts distribution to Caterpillar dealers worldwide; the design, manufacture and ongoing support of paving products; logistics services for other companies; service tools for Caterpillar dealers; and the remanufacture of Caterpillar engines and components and remanufacturing services for other companies.
C. Segment measurement and reconciliations
Please refer to Table IV on pages A-28 to A-30 for financial information regarding our segments. There are several accounting differences between our segment reporting and our GAAP-based external reporting. Our segments are measured on an accountable basis; therefore, only those items for which divisional management is directly responsible are included in the determination of segment profit/(loss) and assets. The following is a list of the more significant accounting differences:
- •
- Generally, liabilities are managed at the corporate level and are not included in segment operations. Segment accountable assets generally include inventories, receivables, property, plant and equipment.
- •
- We account for intersegment transfers using a system of market-based prices. With minor exceptions, each of the profit centers either sells or purchases virtually all of its products to or from other profit centers within the company. Our high level of integration results in our internally reported sales being approximately double that of our consolidated, externally reported sales.
- •
- Segment inventories and cost of sales are valued using a current cost methodology.
- •
- Postretirement benefit expenses are split; segments are generally responsible for service and prior services costs, with the remaining elements of net periodic benefit cost included as a methodology difference.
- •
- Interest expense is imputed (i.e., charged) to profit centers based on their level of accountable assets.
- •
- Accountable profit is determined on a pretax basis.
Reconciling items are created based on accounting differences between segment reporting and our consolidated, external reporting. Please refer to Table IV on pages A-28 to A-30 for financial information regarding significant reconciling items. Most of our reconciling items are self-explanatory given the above explanations of accounting differences. However, for the reconciliation of profit, we have grouped the reconciling items as follows:
- •
- Corporate costs: Certain corporate costs are not charged to our segments. These costs are related to corporate requirements and strategies that are considered to be for the benefit of the entire organization.
- •
- Methodology differences: See previous discussion of significant accounting differences between segment reporting and consolidated, external reporting.
A-27
TABLE IV—Segment Information
(Millions of dollars)
Business Segments:
| | Machinery and Engines | | | |||||||||||||||||||
|---|---|---|---|---|---|---|---|---|---|---|---|---|---|---|---|---|---|---|---|---|---|---|
| | Asia/ Pacific Marketing | Construction & Mining Products | EAME Marketing | Latin America Marketing | Power Products | North America Marketing | All Other | Total | Financing & Insurance Services | Total | ||||||||||||
| 2003 | ||||||||||||||||||||||
| External sales and revenues | $ | 1,990 | 274 | 3,181 | 1,284 | 6,377 | 6,433 | 1,466 | 21,005 | 2,020 | $ | 23,025 | ||||||||||
| Intersegment sales and revenues | $ | 5 | 7,497 | 2,326 | 241 | 5,654 | 205 | 1,642 | 17,570 | — | $ | 17,570 | ||||||||||
| Total sales and revenues | $ | 1,995 | 7,771 | 5,507 | 1,525 | 12,031 | 6,638 | 3,108 | 38,575 | 2,020 | $ | 40,595 | ||||||||||
| Depreciation and amortization | $ | 13 | 205 | 63 | 24 | 292 | — | 80 | 677 | 530 | $ | 1,207 | ||||||||||
| Imputed interest expense | $ | 31 | 127 | 61 | 27 | 223 | 121 | 122 | 712 | 472 | $ | 1,184 | ||||||||||
| Accountable profit (loss) | $ | 115 | 538 | 177 | 62 | (87 | ) | 177 | 350 | 1,332 | 339 | $ | 1,671 | |||||||||
| Accountable assets at Dec. 31 | $ | 637 | 2,127 | 1,114 | 548 | 3,795 | 2,198 | 2,251 | 12,670 | 20,234 | $ | 32,904 | ||||||||||
| Capital Expenditures | $ | 22 | 148 | 73 | 24 | 212 | 8 | 103 | 590 | 1,220 | $ | 1,810 | ||||||||||
| 2002 | ||||||||||||||||||||||
| External sales and revenues | $ | 1,652 | 217 | 2,825 | 1,261 | 5,800 | 5,571 | 1,257 | 18,583 | 1,779 | $ | 20,362 | ||||||||||
| Intersegment sales and revenues | $ | 4 | 6,755 | 1,981 | 182 | 4,989 | 152 | 1,585 | 15,648 | — | $ | 15,648 | ||||||||||
| Total sales and revenues | $ | 1,656 | 6,972 | 4,806 | 1,443 | 10,789 | 5,723 | 2,842 | 34,231 | 1,779 | $ | 36,010 | ||||||||||
| Depreciation and amortization | $ | 12 | 209 | 53 | 25 | 293 | — | 68 | 660 | 436 | $ | 1,096 | ||||||||||
| Imputed interest expense | $ | 26 | 142 | 59 | 28 | 222 | 98 | 125 | 700 | 539 | $ | 1,239 | ||||||||||
| Accountable profit (loss) | $ | 83 | 254 | 85 | 41 | (145 | ) | (4 | ) | 233 | 547 | 270 | $ | 817 | ||||||||
| Accountable assets at Dec. 31 | $ | 436 | 2,214 | 991 | 470 | 3,757 | 1,574 | 2,297 | 11,739 | 17,417 | $ | 29,156 | ||||||||||
| Capital Expenditures | $ | 13 | 179 | 65 | 13 | 236 | 2 | 80 | 588 | 1,177 | $ | 1,765 | ||||||||||
| 2001 | ||||||||||||||||||||||
| External sales and revenues | $ | 1,405 | 207 | 2,844 | 1,452 | 5,890 | 5,874 | 1,244 | 18,916 | 1,717 | $ | 20,633 | ||||||||||
| Intersegment sales and revenues | $ | 12 | 7,195 | 2,020 | 146 | 5,659 | 219 | 1,779 | 17,030 | 1 | $ | 17,031 | ||||||||||
| Total sales and revenues | $ | 1,417 | 7,402 | 4,864 | 1,598 | 11,549 | 6,093 | 3,023 | 35,946 | 1,718 | $ | 37,664 | ||||||||||
| Depreciation and amortization | $ | 12 | 210 | 62 | 26 | 351 | — | 65 | 726 | 335 | $ | 1,061 | ||||||||||
| Imputed interest expense | $ | 23 | 140 | 57 | 29 | 219 | 112 | 119 | 699 | 672 | $ | 1,371 | ||||||||||
| Accountable profit (loss) | $ | (1 | ) | 340 | 106 | 35 | 45 | (2 | ) | 195 | 718 | 347 | $ | 1,065 | ||||||||
| Accountable assets at Dec. 31 | $ | 441 | 2,444 | 925 | 565 | 3,694 | 1,369 | 2,290 | 11,728 | 15,437 | $ | 27,165 | ||||||||||
| Capital Expenditures | $ | 10 | 270 | 62 | 20 | 329 | — | 120 | 811 | 858 | $ | 1,669 | ||||||||||
Reconciliations:
| | Machinery and Engines | Financing & Insurance Services | Consolidating Adjustments | Consolidated Total | |||||||||
|---|---|---|---|---|---|---|---|---|---|---|---|---|---|
| Sales & Revenues | |||||||||||||
| 2003 | |||||||||||||
| Total external sales and revenues from business segments | $ | 21,005 | $ | 2,020 | $ | — | $ | 23,025 | |||||
| Other | 43 | (125 | ) | (180 | )(1) | (262 | ) | ||||||
| Total sales and revenues | $ | 21,048 | $ | 1,895 | $ | (180 | ) | $ | 22,763 | ||||
| 2002 | |||||||||||||
| Total external sales and revenues from business segments | $ | 18,583 | $ | 1,779 | $ | — | $ | 20,362 | |||||
| Other | 65 | (101 | ) | (174 | )(1) | (210 | ) | ||||||
| Total sales and revenues | $ | 18,648 | $ | 1,678 | $ | (174 | ) | $ | 20,152 | ||||
| 2001 | |||||||||||||
| Total external sales and revenues from business segments | $ | 18,916 | $ | 1,717 | $ | — | $ | 20,633 | |||||
| Other | 111 | (72 | ) | (222 | )(1) | (183 | ) | ||||||
| Total sales and revenues | $ | 19,027 | $ | 1,645 | $ | (222 | ) | $ | 20,450 | ||||
- (1)
- Elimination of Financial Product revenues from Machinery and Engines.
A-28
| | Machinery and Engines | Financing & Insurance Services | Consolidated Total | ||||||||
|---|---|---|---|---|---|---|---|---|---|---|---|
| Profit before taxes | |||||||||||
| 2003 | |||||||||||
| Total accountable profit from business segments | $ | 1,332 | $ | 339 | $ | 1,671 | |||||
| Corporate costs | (337 | ) | — | (337 | ) | ||||||
| Methodology differences: | |||||||||||
| Inventory/cost of sales | (182 | ) | — | (182 | ) | ||||||
| Postretirement benefit expense | (161 | ) | — | (161 | ) | ||||||
| Financing costs | 377 | — | 377 | ||||||||
| Other methodology differences | 27 | 32 | 59 | ||||||||
| Other | 50 | — | 50 | ||||||||
| Total profit before taxes | $ | 1,106 | $ | 371 | $ | 1,477 | |||||
| 2002 | |||||||||||
| Total accountable profit from business segments | $ | 547 | $ | 270 | $ | 817 | |||||
| Corporate costs | 18 | — | 18 | ||||||||
| Methodology differences: | |||||||||||
| Inventory/cost of sales | (313 | ) | — | (313 | ) | ||||||
| Postretirement benefit expense | 147 | — | 147 | ||||||||
| Financing costs | 325 | — | 325 | ||||||||
| Other methodology differences | 56 | 17 | 73 | ||||||||
| Other | 47 | — | 47 | ||||||||
| Total profit before taxes | $ | 827 | $ | 287 | $ | 1,114 | |||||
| 2001 | |||||||||||
| Total accountable profit from business segments | $ | 718 | $ | 347 | $ | 1,065 | |||||
| Corporate costs | (27 | ) | — | (27 | ) | ||||||
| Other charges not allocated to business segments | (153 | ) | — | (153 | ) | ||||||
| Methodology differences: | |||||||||||
| Inventory/cost of sales | (106 | ) | — | (106 | ) | ||||||
| Postretirement benefit expense | 206 | — | 206 | ||||||||
| Financing costs | 223 | — | 223 | ||||||||
| Other methodology differences | (100 | ) | (2 | ) | (102 | ) | |||||
| Other | 63 | — | 63 | ||||||||
| Total profit before taxes | $ | 824 | $ | 345 | $ | 1,169 | |||||
Machinery and Engines | Financing & Insurance Services | Consolidating Adjustments | Consolidated Total | |||||||||||
|---|---|---|---|---|---|---|---|---|---|---|---|---|---|---|
| Assets | ||||||||||||||
| 2003 | ||||||||||||||
| Total accountable assets from business segments | $ | 12,670 | $ | 20,234 | $ | — | $ | 32,904 | ||||||
| Items not included in segment assets: | ||||||||||||||
| Cash and short-term investments | 220 | 122 | — | 342 | ||||||||||
| Intercompany trade receivables | 572 | 397 | (969 | ) | — | |||||||||
| Investment in affiliated companies | 325 | — | — | 325 | ||||||||||
| Investment in Financial Products | 2,547 | — | (2,547 | ) | — | |||||||||
| Deferred income taxes and prepaids | 2,736 | 77 | (211 | ) | 2,602 | |||||||||
| Intangible assets and other assets | 1,874 | — | — | 1,874 | ||||||||||
| Service center assets | 736 | — | — | 736 | ||||||||||
| Dealer receivables double counted in segment assets | (2,352 | ) | — | — | (2,352 | ) | ||||||||
| Liabilities included in segment assets | 930 | — | — | 930 | ||||||||||
| Inventory methodology differences | (1,463 | ) | — | — | (1,463 | ) | ||||||||
| Other | 415 | 169 | (17 | ) | 567 | |||||||||
| Total assets | $ | 19,210 | $ | 20,999 | $ | (3,744 | ) | $ | 36,465 | |||||
A-29
| Assets | ||||||||||||||
| 2002 | ||||||||||||||
| Total accountable assets from business segments | $ | 11,739 | $ | 17,417 | $ | — | $ | 29,156 | ||||||
| Items not included in segment assets: | ||||||||||||||
| Cash and short-term investments | 146 | 163 | — | 309 | ||||||||||
| Intercompany trade receivables | 917 | 343 | (1,260 | ) | — | |||||||||
| Investment in affiliated companies | 283 | — | — | 283 | ||||||||||
| Investment in Financial Products | 1,961 | — | (1,961 | ) | — | |||||||||
| Deferred income taxes and prepaids | 2,698 | 75 | (133 | ) | 2,640 | |||||||||
| Intangible assets and other assets | 1,541 | — | — | 1,541 | ||||||||||
| Service center assets | 810 | — | — | 810 | ||||||||||
| Dealer receivables double counted in segment assets | (1,857 | ) | — | — | (1,857 | ) | ||||||||
| Liabilities included in segment assets | 848 | — | — | 848 | ||||||||||
| Inventory methodology differences | (1,590 | ) | — | — | (1,590 | ) | ||||||||
| Other | 493 | 149 | (35 | ) | 607 | |||||||||
| Total assets | $ | 17,989 | $ | 18,147 | $ | (3,389 | ) | $ | 32,747 | |||||
| 2001 | ||||||||||||||
| Total accountable assets from business segments | $ | 11,728 | $ | 15,437 | $ | — | $ | 27,165 | ||||||
| Items not included in segment assets: | ||||||||||||||
| Cash and short-term investments | 251 | 149 | — | 400 | ||||||||||
| Intercompany trade receivables | 405 | 355 | (760 | ) | — | |||||||||
| Investment in affiliated companies | 345 | — | — | 345 | ||||||||||
| Investment in Financial Products | 1,662 | — | (1,662 | ) | — | |||||||||
| Deferred income taxes and prepaids | 2,400 | 55 | (74 | ) | 2,381 | |||||||||
| Intangible assets and other assets | 1,445 | — | — | 1,445 | ||||||||||
| Service center assets | 844 | — | — | 844 | ||||||||||
| Dealer receivables double counted in segment assets | (1,757 | ) | — | — | (1,757 | ) | ||||||||
| Liabilities included in segment assets | 853 | — | — | 853 | ||||||||||
| Inventory methodology differences | (1,571 | ) | — | — | (1,571 | ) | ||||||||
| Other | 598 | (101 | ) | (17 | ) | 480 | ||||||||
| Total assets | $ | 17,203 | $ | 15,895 | $ | (2,513 | ) | $ | 30,585 | |||||
Enterprise-wide Disclosures:
External sales and revenues from products and services:
| | 2003 | 2002 | 2001 | ||||||
|---|---|---|---|---|---|---|---|---|---|
| Machinery | $ | 13,678 | $ | 11,975 | $ | 12,158 | |||
| Engines | 7,370 | 6,673 | 6,869 | ||||||
| Financial Products | 1,715 | 1,504 | 1,423 | ||||||
| Total consolidated | $ | 22,763 | $ | 20,152 | $ | 20,450 | |||
Information about Geographic Areas:
| | Sales & Revenues(1) | Net property, plant and equipment | ||||||||||||||||||
|---|---|---|---|---|---|---|---|---|---|---|---|---|---|---|---|---|---|---|---|---|
| | | | | December 31, | ||||||||||||||||
| | 2003 | 2002 | 2001 | 2003 | 2002 | 2001 | ||||||||||||||
| Inside United States | $ | 10,058 | $ | 9,291 | $ | 10,033 | $ | 4,315 | $ | 4,524 | $ | 4,351 | ||||||||
| Outside United States | 12,705 | 10,861 | 10,417 | 2,975 | (2) | 2,522 | (2) | 2,252 | (2) | |||||||||||
| Total | $ | 22,763 | $ | 20,152 | $ | 20,450 | $ | 7,290 | $ | 7,046 | $ | 6,603 | ||||||||
- (1)
- Sales of machinery and engines are based on dealer location. Revenues from services provided are based on where service is rendered.
- (2)
- Amount includes $675 million, $680 million and $681 million of net property, plant and equipment located in the United Kingdom as of December 31, 2003, 2002 and 2001, respectively.
A-30
23. Other Charges
| | 2001 Charge | Asset Impairments | 2002 Activity* | 12/31/02 Balance | 2003 Activity | 12/31/03 Balance | |||||||||||||
|---|---|---|---|---|---|---|---|---|---|---|---|---|---|---|---|---|---|---|---|
| | (Millions of dollars) | ||||||||||||||||||
| Challenger: | |||||||||||||||||||
| Asset impairments | $ | 32 | $ | (32 | ) | $ | — | $ | — | $ | — | $ | — | ||||||
| Exit costs | 49 | — | (38 | ) | 11 | (11 | ) | — | |||||||||||
| 81 | (32 | ) | (38 | ) | 11 | (11 | ) | — | |||||||||||
| Shrewsbury: | |||||||||||||||||||
| Asset impairments | 16 | (16 | ) | — | — | — | — | ||||||||||||
| Redundancy | 10 | — | (6 | ) | 4 | (4 | ) | — | |||||||||||
| Exit costs | 4 | — | (2 | ) | 2 | (2 | ) | — | |||||||||||
| 30 | (16 | ) | (8 | ) | 6 | (6 | ) | — | |||||||||||
| U.S. employment reduction | 34 | — | (34 | ) | — | — | — | ||||||||||||
| Other asset impairments | 8 | (8 | ) | — | — | — | — | ||||||||||||
| Total | $ | 153 | $ | (56 | ) | $ | (80 | ) | $ | 17 | $ | (17 | ) | $ | — | ||||
- *
- All amounts were paid in cash except for the U.S. employment reduction of $34 million which was reclassified to our pension accounts. Please refer to the Benefits Obligation Table in Note 11 on page A-17.
During the fourth quarter of 2001, we recorded pretax charges of $153 million related to the sale of the Challenger agricultural tractor line to AGCO, charges related to ceasing engine production at our Shrewsbury, England plant, planned U.S. salaried and management employment reductions and other asset impairment charges. These charges were recorded in the "Other operating expenses" line in Statement 1. Planned employee reductions were 495 for Shrewsbury and 433 for the U.S. employment reduction. Challenger assets were held in ourAll Other segment and Shrewsbury assets are held in ourPower Products segment.
During 2002, we reduced the Challenger exit cost reserve by $38 million, primarily for cash outlays for research and development expenses and manufacturing equipment in accordance with the contract with AGCO. We reduced the Shrewsbury redundancy reserve by $6 million for separation benefits for 225 employees. As planned, the U.S. employment reduction was achieved entirely through voluntary retirements. As a result, the reserve of $34 million was reclassified to our pension accounts upon completion of the retirement program.
During 2003, the contracts related to the Challenger were terminated. The cost of these obligations was recognized as an exit cost in 2001 as the contracts provided no benefit to Caterpillar after the sale to AGCO. Contract cancellation costs were charged to the reserve, which was reduced to zero. There will be no future cash outlays related to these contracts. Also during 2003, the Shrewsbury exit plan was completed and remaining costs were charged to the reserve, which was also reduced to zero.
24. Selected quarterly financial results (unaudited)
| | 2003 Quarter | |||||||||||
|---|---|---|---|---|---|---|---|---|---|---|---|---|
| | 1st | 2nd | 3rd | 4th | ||||||||
| | (Dollars in millions except per share data) | |||||||||||
| Sales and revenues | $ | 4,821 | $ | 5,932 | $ | 5,545 | $ | 6,465 | ||||
| Less: Revenues | 397 | 431 | 433 | 454 | ||||||||
| Sales | 4,424 | 5,501 | 5,112 | 6,011 | ||||||||
| Cost of goods sold | 3,630 | 4,329 | 4,143 | 4,843 | ||||||||
| Gross margin | 794 | 1,172 | 969 | 1,168 | ||||||||
| Profit | 129 | 399 | 222 | 349 | ||||||||
| Profit per common share | $ | .37 | $ | 1.16 | $ | .64 | $ | 1.01 | ||||
| Profit per common share —diluted | $ | .37 | $ | 1.15 | $ | .62 | $ | .97 | ||||
2002 Quarter | ||||||||||||
|---|---|---|---|---|---|---|---|---|---|---|---|---|
| | 1st | 2nd | 3rd | 4th | ||||||||
| | (Dollars in millions except per share data) | |||||||||||
| Sales and revenues | $ | 4,409 | $ | 5,291 | $ | 5,075 | $ | 5,377 | ||||
| Less: Revenues | 365 | 376 | 375 | 388 | ||||||||
| Sales | 4,044 | 4,915 | 4,700 | 4,989 | ||||||||
| Cost of goods sold | 3,307 | 3,974 | 3,798 | 4,067 | ||||||||
| Gross margin | 737 | 941 | 902 | 922 | ||||||||
| Profit | 80 | 200 | 213 | 305 | ||||||||
| Profit per common share | $ | .23 | $ | .58 | $ | .62 | $ | .89 | ||||
| Profit per common share —diluted | $ | .23 | $ | .58 | $ | .61 | $ | .88 | ||||
A-31
Five-year Financial Summary
(Dollars in millions except per share data)
| | 2003 | 2002 | 2001 | 2000 | 1999 | |||||||||
|---|---|---|---|---|---|---|---|---|---|---|---|---|---|---|
| Years ended December 31, | ||||||||||||||
| Sales and revenues | $ | 22,763 | 20,152 | 20,450 | 20,175 | 19,702 | ||||||||
| Sales | $ | 21,048 | 18,648 | 19,027 | 18,913 | 18,559 | ||||||||
| Percent inside the United States | 44 | % | 45 | % | 49 | % | 50 | % | 50 | % | ||||
| Percent outside the United States | 56 | % | 55 | % | 51 | % | 50 | % | 50 | % | ||||
| Revenues | $ | 1,715 | 1,504 | 1,423 | 1,262 | 1,143 | ||||||||
| Profit(1) | $ | 1,099 | 798 | 805 | 1,053 | 946 | ||||||||
| Profit per common share(1)(2) | $ | 3.18 | 2.32 | 2.35 | 3.04 | 2.66 | ||||||||
| Profit per common share—diluted(1)(3) | $ | 3.13 | 2.30 | 2.32 | 3.02 | 2.63 | ||||||||
| Dividends declared per share of common stock | $ | 1.420 | 1.400 | 1.390 | 1.345 | 1.275 | ||||||||
| Return on average common stockholders' equity(4) | 19.0 | % | 14.4 | % | 14.4 | % | 19.0 | % | 17.9 | % | ||||
| Capital expenditures: | ||||||||||||||
| Property, plant and equipment | $ | 682 | 728 | 1,100 | 928 | 913 | ||||||||
| Equipment leased to others | $ | 1,083 | 1,045 | 868 | 665 | 490 | ||||||||
| Depreciation and amortization | $ | 1,347 | 1,220 | 1,169 | 1,063 | 977 | ||||||||
| Research and development expenses | $ | 669 | 656 | 696 | 649 | 626 | ||||||||
| As a percent of sales and revenues | 2.9 | % | 3.3 | % | 3.4 | % | 3.2 | % | 3.2 | % | ||||
| Wages, salaries and employee benefits | $ | 4,980 | 4,360 | 4,272 | 4,029 | 4,044 | ||||||||
| Average number of employees | 67,828 | 70,973 | 70,678 | 67,200 | 66,225 | |||||||||
| December 31, | ||||||||||||||
| Total assets | $ | 36,465 | 32,747 | 30,585 | 28,464 | 26,711 | ||||||||
| Long-term debt due after one year: | ||||||||||||||
| Consolidated | $ | 14,078 | 11,596 | 11,291 | 11,334 | 9,928 | ||||||||
| Machinery and Engines | $ | 3,367 | 3,403 | 3,492 | 2,854 | 3,099 | ||||||||
| Financial Products | $ | 10,711 | 8,193 | 7,799 | 8,480 | 6,829 | ||||||||
| Total debt: | ||||||||||||||
| Consolidated | $ | 19,816 | 17,683 | 16,602 | 15,067 | 13,802 | ||||||||
| Machinery and Engines | $ | 3,471 | 3,725 | 3,784 | 3,427 | 3,317 | ||||||||
| Financial Products | $ | 16,345 | 13,958 | 12,818 | 11,640 | 10,485 | ||||||||
- (1)
- As discussed in Note 9, in 2002 we changed the manner in which we account for goodwill and other intangible assets upon the adoption of SFAS 142.
- (2)
- Computed on weighted-average number of shares outstanding.
- (3)
- Computed on weighted-average number of shares outstanding diluted by assumed exercise of stock options, using the treasury stock method.
- (4)
- Represents profit divided by average stockholders' equity (beginning of year stockholders' equity plus end of year stockholders' equity divided by two).
A-32
MANAGEMENT'S DISCUSSION AND ANALYSIS
OVERVIEW
Caterpillar had an excellent year. We took full advantage of the recovering capital goods market to make real progress on our growth objectives while continuing to lowerCore Operating Costs.* With a 13 percent sales and revenue increase this year, we are well on our way to achieving our growth target of $30 billion of sales and revenues in this decade. Our performance this year demonstrated to investors our commitment to deliver long-term profitable growth. In addition, we made significant progress on other key strategic initiatives. After an aggressive development program, we introduced ACERT® technology, earning Caterpillar the distinction of being the only engine manufacturer with a full line of 2004 EPA certified and compliant clean diesel engines.
Also in 2003, we supported our dealers' continued expansion of Cat Rental stores as they enhanced their position as the world's leading providers of rental equipment. We strengthened our long-term relationships in the Asia-Pacific region, expanding operations in China and India to serve the increasing demand in these important emerging markets. Amid this growth and change, we continued to embrace the discipline of6 Sigma, which allowed Caterpillar people to develop process improvements and discover new ways to better serve our customers. As the company grows, we will continue to rely on the proven processes of 6 Sigma to create value and develop growth opportunities. As we move into 2004, we will continue our focus on 6 Sigma and profitable growth, reinforcing the positive changes in our culture that are making Caterpillar a better company.
It is our objective to provide the most meaningful disclosures in our Management's Discussion and Analysis in order to explain significant changes in our company's results of operations and liquidity and capital resources. As discussed in Note 22 on pages A-26 to A-27, our segment financial information is not based on generally accepted accounting principles and it is not intended to measure contributions to enterprise results. Therefore, it is impractical for us to try to discuss our company's results of operations and liquidity and capital resources solely based on segment information. Where practical, we have linked our discussions to segment information provided in Note 22 and Table IV on pages A-26 to A-30 (see "Reconciliation of Machinery and Engines Sales by Geographic Region to External Sales by Marketing Segment" on page A-34). Our discussions will focus on consolidated results and our three principal lines of business as described below:
Consolidated—represents the consolidated data of Caterpillar Inc. and all its subsidiaries (affiliated companies that are more than 50 percent owned).
Machinery—A principal line of business which includes the design, manufacture and marketing of construction, mining, agricultural and forestry machinery—track and wheel tractors, track and wheel loaders, pipelayers, motor graders, wheel tractor-scrapers, track and wheel excavators, backhoe loaders, mining shovels, log skidders, log loaders, off-highway trucks, articulated trucks, paving products, telescopic handlers, skid steer loaders and related parts. Also includes logistics services for other companies.
Engines—A principal line of business including the design, manufacture and marketing of engines for Caterpillar machinery, electric power generation systems; on-highway vehicles and locomotives; marine, petroleum, construction, industrial, agricultural and other applications; and related parts. Reciprocating engines meet power needs ranging from 5 to over 22,000 horsepower (4 to over 16 200 kilowatts). Turbines range from 1,600 to 19,500 horsepower (1 000 to 14 500 kilowatts).
Financial Products—A principal line of business consisting primarily of Caterpillar Financial Services Corporation (Cat Financial), Caterpillar Insurance Holdings, Inc. (Cat Insurance) and their subsidiaries. Cat Financial provides a wide range of financing alternatives for Caterpillar machinery and engines, Solar gas turbines, as well as other equipment and marine vessels. Cat Financial also extends loans to customers and dealers. Cat Insurance provides various forms of insurance to customers and dealers to help support the purchase and lease of our equipment.
- *
- Glossary of terms included on pages A-40 to A-41; first occurrence of terms shown in bold italics.
Sales and Revenues by Geographic Region
| | Total | North America | EAME | Latin America | Asia/Pacific | ||||||||||
|---|---|---|---|---|---|---|---|---|---|---|---|---|---|---|---|
| | (Millions of dollars) | ||||||||||||||
| 2003 | |||||||||||||||
| Machinery | $ | 13,678 | $ | 7,310 | $ | 3,596 | $ | 928 | $ | 1,844 | |||||
| Engines(1) | 7,370 | 3,222 | 2,356 | 793 | 999 | ||||||||||
| Financial Products(2) | 1,715 | 1,231 | 303 | 94 | 87 | ||||||||||
| $ | 22,763 | $ | 11,763 | $ | 6,255 | $ | 1,815 | $ | 2,930 | ||||||
2002 | |||||||||||||||
| Machinery | $ | 11,975 | $ | 6,517 | $ | 3,156 | $ | 818 | $ | 1,484 | |||||
| Engines(1) | 6,673 | 2,963 | 2,022 | 780 | 908 | ||||||||||
| Financial Products(2) | 1,504 | 1,116 | 257 | 55 | 76 | ||||||||||
| $ | 20,152 | $ | 10,596 | $ | 5,435 | $ | 1,653 | $ | 2,468 | ||||||
- (1)
- Does not include internal engine transfers of $1.358 billion and $1.286 billion in 2003 and 2002, respectively. Internal engine transfers are valued at prices comparable to those for unrelated parties.
- (2)
- Does not include revenues earned from Machinery and Engines of $180 million and $174 million in 2003 and 2002, respectively.
A-33
Reconciliation of Machinery and Engine Sales by Geographic Region to External Sales by Marketing Segment
| | 2003 | 2002 | 2001 | |||||||
|---|---|---|---|---|---|---|---|---|---|---|
| | (Millions of dollars) | |||||||||
| North America Geographic Region | $ | 10,532 | $ | 9,480 | $ | 10,260 | ||||
| Engine sales included in the Power Products segment | (3,221 | ) | (2,968 | ) | (3,463 | ) | ||||
| Company owned dealer sales included in the All Other segment | (388 | ) | (350 | ) | (438 | ) | ||||
| Other* | (490 | ) | (591 | ) | (485 | ) | ||||
| North America Marketing external sales | $ | 6,433 | $ | 5,571 | $ | 5,874 | ||||
| EAME Geographic Region | $ | 5,952 | $ | 5,178 | $ | 5,114 | ||||
| Power Products sales not included in the EAME Marketing segment | (1,897 | ) | (1,613 | ) | (1,750 | ) | ||||
| Other* | (874 | ) | (740 | ) | (520 | ) | ||||
| EAME Marketing external sales | $ | 3,181 | $ | 2,825 | $ | 2,844 | ||||
| Latin America Geographic Region | $ | 1,721 | $ | 1,598 | $ | 1,639 | ||||
| Power Products sales not included in the Latin America Marketing segment | (667 | ) | (689 | ) | (327 | ) | ||||
| Other* | 230 | 352 | 140 | |||||||
| Latin America Marketing external sales | $ | 1,284 | $ | 1,261 | $ | 1,452 | ||||
| Asia/Pacific Geographic Region | $ | 2,843 | $ | 2,392 | $ | 2,014 | ||||
| Power Products sales not included in the Asia/Pacific Marketing segment | (592 | ) | (530 | ) | (351 | ) | ||||
| Other* | (261 | ) | (210 | ) | (258 | ) | ||||
| Asia/Pacific Marketing external sales | $ | 1,990 | $ | 1,652 | $ | 1,405 | ||||
- *
- Mostly represents external sales of the Construction & Mining Products and the All Other segments.
SALES AND REVENUES
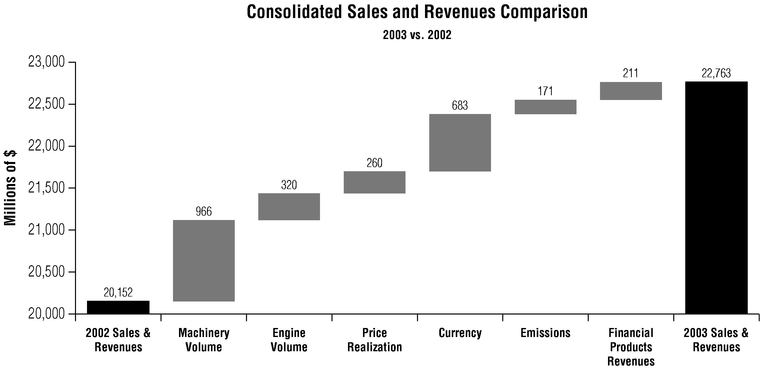
The chart above graphically illustrates reasons for the change in Consolidated Sales and Revenues between 2002 (at left) and 2003 (at right). Items favorably impacting sales and revenues appear as upward stair steps with the corresponding dollar amounts above each bar, while items negatively impacting sales and revenues, if any, appear as downward stair steps with dollar amounts reflected in parenthesis above each bar. Caterpillar management utilizes these charts internally to visually communicate with its Board and employees.
A-34
Machinery sales were $13.68 billion, an increase of $1.70 billion or 14 percent from 2002. Sales volume was up about 8 percent, the favorable impact of currency accounted for about 4 percent and improvedPrice Realization added about 2 percent. In North America, machinery sales increased 12 percent due mostly to higher volume and favorable price realization. Sales volume rose because of an 11 percent increase in dealer deliveries, the result of users (especially rental fleets) upgrading their fleets and a last half improvement in construction activity. Dealers also increased inventories to support higher delivery rates.EAME sales were up 14 percent due to the favorable impact of a stronger euro and improved price realization partially offset by lower sales volume due to weak economic conditions in Europe. InLatin America, sales were up 13 percent, benefiting from increased dealer deliveries into mining and some building of dealer inventories in anticipation of higher end-user demand. Company sales in Asia/Pacific surged 24 percent as dealer deliveries increased significantly due to strong economies in the region.
Engines sales were $7.37 billion, an increase of $697 million or 10 percent from 2002. Sales volume was up about 5 percent, the favorable impact of currency accounted for about 3 percent and emissions-related price increases added about 2 percent. North American sales rose 9 percent due to improved emissions-related price increases for truck engines and higher volume in most key engine sectors. Engine sales in EAME rose 17 percent due to the favorable effects ofCurrency and higher sales into the Middle East. Sales in Latin America rose 2 percent with all of the gain coming from higher sales of truck and bus engines. Sales in Asia/Pacific rose 10 percent due to higher volume in almost all sectors as economic growth strengthened. Worldwide Caterpillar truck engine sales rose 19 percent with a significant improvement in emissions-related price realization and higher volume of 4 percent. Worldwide sales of electric power and industrial engines rose 10 and 8 percent, respectively, benefiting from the favorable effects of currency and slight industry growth. Worldwide sales into petroleum rose 4 percent due to higher demand for engines used in gas compression and higher North American land drilling activity. Sales to the marine sector rose 2 percent, helped by slightly higher industry demand and favorable effects of currency.
Financial Products revenues were $1.72 billion, an increase of $211 million or 14 percent from 2002. The increase was due primarily to the favorable impact of $223 million from continued growth ofEarning Assets at Cat Financial and a $63 million increase in earned premiums on extended service contracts at Cat Insurance. These favorable items were partially offset by the $120 million impact of lower interest rates on new and existing finance receivables at Cat Financial.
OPERATING PROFIT
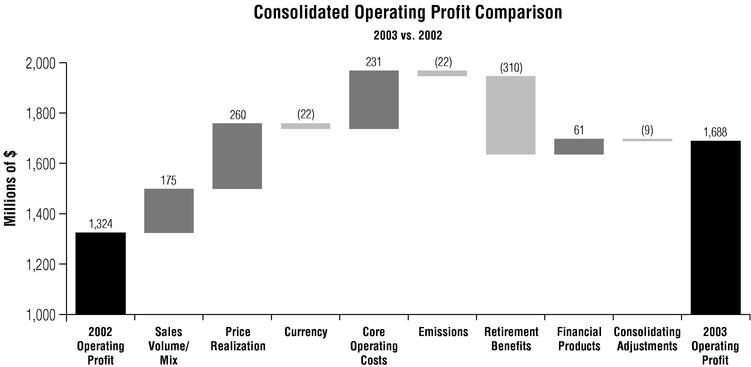
The chart above graphically illustrates reasons for the change in Consolidated Operating Profit between 2002 (at left) and 2003 (at right). Items favorably impacting operating profit appear as upward stair steps with the corresponding dollar amounts above each bar, while items negatively impacting operating profit appear as downward stair steps with dollar amounts reflected in parenthesis above each bar. Caterpillar management utilizes these charts internally to visually communicate with its Board and employees.
A-35
The favorable profit impact of additional machinery and engine sales volume was partially offset by unfavorable sales mix resulting in a net positive impact of $175 million. The unfavorable sales mix was primarily due to lower sales of higher margin fuel system components to Navistar International Transportation Corporation ("Navistar") attributable to the imminent expiration of a long-term purchase contract in 2003 between Caterpillar and Navistar as well as higher sales of lower margin small diesel engines and compact construction equipment. Improved price realization reflected the favorable impact of modest price increases taken in January 2003 on most machines and parts. Material cost reductions and quality improvements reflected in lower warranty costs were partially offset by higher incentive compensation of about $140 million for a net improvement in core operating costs of $231 million. The higher incentive compensation benefits employees at all levels as corporate financial performance improves. This reflects the structure of our compensation plans where employees have a component of their pay tied to the performance of the company.
Partially offsetting the favorable items was $310 million of higherRetirement Benefits. This increase was primarily due to the impact of previous poor performance of equity markets on pension plan assets and increased expense resulting from the introduction of a company match to our 401(k) plan in 2003.
Operating Profit Table
| | 2003 | 2002 | |||||
|---|---|---|---|---|---|---|---|
| | (Millions of dollars) | ||||||
| Machinery(1) | $ | 1,246 | $ | 947 | |||
| Engines(1) | 188 | 175 | |||||
| Financial Products | 345 | 284 | |||||
| Consolidating Adjustments | (91 | ) | (82 | ) | |||
| $ | 1,688 | $ | 1,324 | ||||
- (1)
- Caterpillar operations are highly integrated; therefore, the company uses a number of allocations to determine lines of business operating profit forMachinery and Engines.
Machinery operating profit increased 32 percent, or $299 million, from 2002. The favorable impact of improved price realization, higher sales volume (net of unfavorable sales mix) and lower core operating costs more than offset higher retirement benefits.
Engines operating profit increased 7 percent, or $13 million, from 2002 as lower core operating costs were almost entirely offset by higher retirement benefits and the unfavorable impact ofChanges in Emissions Standards. The favorable impact of volume was offset by negative sales mix resulting from lower sales of higher margin fuel system components as well as higher sales of lower margin small diesel engines.
Financial Products operating profit increased 21 percent, or $61 million, from 2002. The increase was primarily due to the impact of growth of earning assets of $59 million, higher fee income of $12 million and higher securitization income of $8 million at Cat Financial. These favorable items were partially offset by increased operating costs to support growth at Cat Financial.
OTHER PROFIT/LOSS ITEMS
Interest expense excluding Financial Products was $33 million lower compared to 2002 primarily due to lower average short-term and long-term borrowings.
Other income/expense was income of $35 million down from $69 million in 2002. The change was primarily due to a $55 million charge for early retirement of the $250 million 6 percent debentures due in 2007.
The provision for income taxes reflects an estimated annual tax rate of 27 percent for 2003 compared to 28 percent a year ago due to the geographic mix of profits and changes in the estimated tax benefits from export sales.
The equity in profit/loss of unconsolidated affiliated companies favorably impacted profit $24 million from 2002, due mostly to improved profitability of Shin Caterpillar Mitsubishi Ltd. resulting from improved export business into China and North America.
Supplemental Information
| | 2003 | 2002 | 2001 | ||||||||
|---|---|---|---|---|---|---|---|---|---|---|---|
| | (Millions of dollars) | ||||||||||
| Identifiable Assets: | |||||||||||
| Machinery | $ | 11,565 | $ | 10,689 | $ | 10,049 | |||||
| Engines | 7,645 | 7,300 | 7,154 | ||||||||
| Financial Products | 20,999 | 18,147 | 15,895 | ||||||||
| Consolidating Adjustments | (3,744 | ) | (3,389 | ) | (2,513 | ) | |||||
| Total | $ | 36,465 | $ | 32,747 | $ | 30,585 | |||||
| Capital Expenditures: | |||||||||||
| Machinery | $ | 386 | $ | 393 | $ | 616 | |||||
| Engines | 278 | 305 | 493 | ||||||||
| Financial Products | 1,101 | 1,075 | 859 | ||||||||
| Total | $ | 1,765 | $ | 1,773 | $ | 1,968 | |||||
| Depreciation and Amortization: | |||||||||||
| Machinery | $ | 453 | $ | 437 | $ | 424 | |||||
| Engines | 345 | 348 | 411 | ||||||||
| Financial Products | 549 | 435 | 334 | ||||||||
| Total | $ | 1,347 | $ | 1,220 | $ | 1,169 | |||||
Caterpillar operations are highly integrated; therefore, the company uses a number of allocations to determine lines of business financial data.
OPERATING COST RECLASSIFICATION
In the second quarter, we revised our policy regarding the classification of certain costs related to distributing replacement parts. Previously, these costs were included in SG&A and now are included in cost of goods sold. This classification is more consistent with industry practice. The parts distribution costs include shipping and handling (including warehousing) along with related support costs such as information technology, purchasing and inventory management.
The amounts reclassified from SG&A expenses to cost of goods sold were $109 million and $437 million for the three months and twelve months ended December 31, 2002, respectively. These costs were $113 million and $443 million for the three months and twelve months ended December 31, 2003, respectively. The reclassification had no impact on operating profit.
A-36
Sales and Revenues
| | Total | North America | EAME | Latin America | Asia/Pacific | ||||||||||
|---|---|---|---|---|---|---|---|---|---|---|---|---|---|---|---|
| | (Millions of dollars) | ||||||||||||||
| Fourth Quarter 2003 | |||||||||||||||
| Machinery | $ | 3,827 | $ | 2,088 | $ | 939 | $ | 291 | $ | 509 | |||||
| Engines(1) | 2,184 | 876 | 703 | 300 | 305 | ||||||||||
| Financial Products(2) | 454 | 325 | 79 | 23 | 27 | ||||||||||
| $ | 6,465 | $ | 3,289 | $ | 1,721 | $ | 614 | $ | 841 | ||||||
| Fourth Quarter 2002 | |||||||||||||||
| Machinery | $ | 3,151 | $ | 1,643 | $ | 878 | $ | 186 | $ | 444 | |||||
| Engines(1) | 1,838 | 728 | 589 | 270 | 251 | ||||||||||
| Financial Products(2) | 388 | 280 | 70 | 1 | 37 | ||||||||||
| $ | 5,377 | $ | 2,651 | $ | 1,537 | $ | 457 | $ | 732 | ||||||
- (1)
- Does not include internal engine transfers of $362 million and $316 million in fourth quarter 2003 and fourth quarter 2002, respectively. Internal engine transfers are valued at prices comparable to those for unrelated parties.
- (2)
- Does not include revenues earned from Machinery and Engines of $47 million and $43 million in fourth quarter 2003 and fourth quarter 2002, respectively.
FOURTH QUARTER 2003 COMPARED WITH FOURTH QUARTER 2002
SALES AND REVENUES
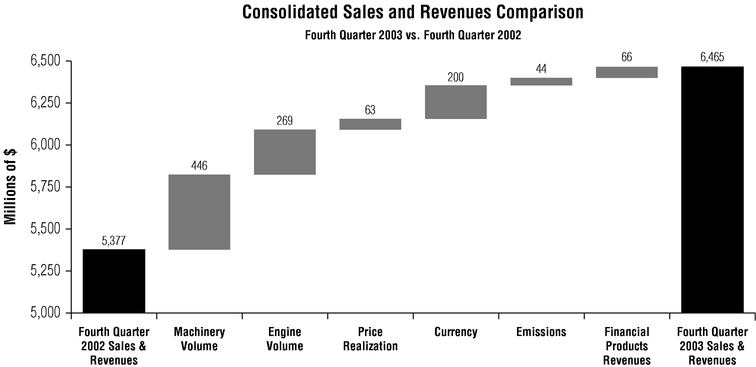
The chart above graphically illustrates reasons for the change in Consolidated Sales and Revenues between fourth quarter 2002 (at left) and fourth quarter 2003 (at right). Items favorably impacting sales and revenues appear as upward stair steps with the corresponding dollar amounts above each bar, while items negatively impacting sales and revenues appear as downward stair steps with dollar amounts reflected in parenthesis above each bar. Caterpillar management utilizes these charts internally to visually communicate with its Board and employees.
Machinery sales were $3.83 billion, an increase of $676 million or 21 percent from fourth quarter 2002. Sales volume was up about 14 percent, the favorable impact of currency accounted for about 4 percent and improved price realization added about 3 percent. North America had the strongest quarter of the year, with machinery sales 27 percent higher than fourth quarter 2002 due to higher sales volume and favorable price realization. Sales volume was up as a result of continued growth in dealer deliveries into construction, forestry, quarry and aggregates and a modest rebound in deliveries into coal mining. Sales in EAME increased 7 percent, the result of the favorable translation impact of a stronger euro, partially offset by a sales volume decline due to soft economic conditions in Europe. In Latin America, sales surged 56 percent. This gain reflects an increase in dealer inventories. Asia/Pacific sales were 15 percent higher than last year. Dealers added less to inventories than last year, offsetting some of the large gain in deliveries.
A-37
Engines sales were $2.18 billion, an increase of $346 million or 19 percent from fourth quarter 2002. Sales volume was up about 15 percent, the favorable impact of currency accounted for about 3 percent and improved emissions-related price increases (net of unfavorable price realization) added about 1 percent. Sales rose 20 percent in North America, 19 percent in EAME, 11 percent in Latin America and 22 percent in Asia/Pacific. The North American sales gain came from a doubling in quarterly sales of truck engines compared to last year's fourth quarter which was negatively impacted by truck manufacturers buying engines before the October 2002 engine emission regulations became effective. Sales in EAME rose due to the favorable effects of currency on engines sold into the electric power and industrial sectors and stronger industry demand for engines sold into the petroleum sector. In Latin America, higher sales of midrange truck engines and engines sold to the petroleum sector more than offset a 35 percent drop in sales to the electric power sector. Last year's fourth-quarter Latin American sales contained robust sales of large engines sold into Brazil to meet a hydroelectric power shortage. Stronger economic growth contributed to the increase in Asia/Pacific, where sales were higher in all major sectors. Sales into the global on-highway truck and bus engine sector doubled. Global sales of industrial and marine engines gained 15 and 7 percent, respectively, due to the favorable effects of currency and slight industry growth. Sales into the petroleum sector were up 6 percent. Global sales into the electric power sector were down 2 percent despite favorable effects of currency.
Financial Products revenues were $454 million, an increase of $66 million or 17 percent from fourth quarter 2002. The favorable impact of $56 million due to continued growth of earning assets at Cat Financial was partially offset by the $27 million impact of lower interest rates on new and existing finance receivables. Also, there was a $17 million increase in earned premiums on extended service contracts at Cat Insurance.
OPERATING PROFIT
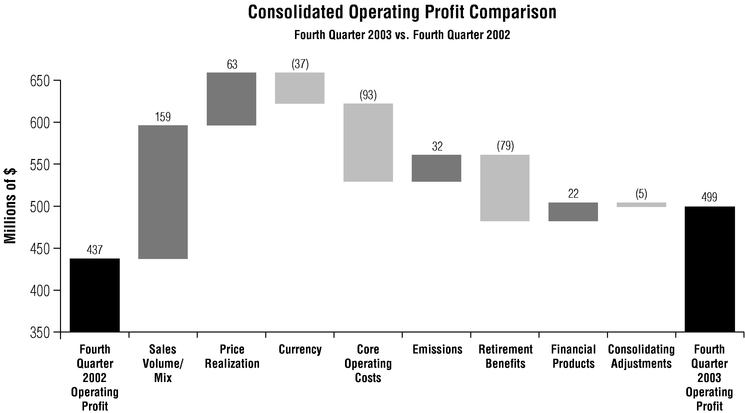
The chart above graphically illustrates reasons for the change in Consolidated Operating Profit between fourth quarter 2002 (at left) and fourth quarter 2003 (at right). Items favorably impacting operating profit appear as upward stair steps with the corresponding dollar amounts above each bar, while items negatively impacting operating profit appear as downward stair steps with dollar amounts reflected in parenthesis above each bar. Caterpillar management utilizes these charts internally to visually communicate with its Board and employees.
Higher sales volume positively impacted operating profit but was partially offset by unfavorable sales mix primarily due to lower sales of higher margin fuel system components to Navistar attributable to the imminent expiration of a long-term purchase contract in 2003 between Caterpillar and Navistar, as well as higher sales of lower margin small diesel engines. Improved price realization of $63 million reflected the favorable impact of modest price increases taken in January 2003 on most machines and parts. The impact of changes in emission standards favorably impacted operating profit by $32 million as more ACERT product was introduced in the marketplace.
Partially offsetting the favorable items were $93 million higher core operating costs and $79 million of higher retirement benefits. The retirement benefits cost increase was primarily due to the impact of previous poor performance of equity markets on
A-38
pension plan assets and increased expense resulting from the introduction of a company match to our 401(k) plan in 2003.
The increase in core operating costs reflects a lower than normal SG&A spending level in the fourth quarter 2002 due to stringent cost control reflective of business conditions, higher incentive compensation of $70 million which benefits employees at all levels, increased spending on product development programs, spending to support our volume growth and the unfavorable change of the gain/loss on disposition of assets. These unfavorable items were partially offset by the positive impact of continued material cost reductions and lower warranty costs.
Operating Profit Table
| | Fourth Quarter | ||||||
|---|---|---|---|---|---|---|---|
| | 2003 | 2002 | |||||
| | (Millions of dollars) | ||||||
| Machinery(1) | $ | 367 | $ | 366 | |||
| Engines(1) | 70 | 26 | |||||
| Financial Products | 87 | 65 | |||||
| Consolidating Adjustments | (25 | ) | (20 | ) | |||
| $ | 499 | $ | 437 | ||||
- (1)
- Caterpillar operations are highly integrated; therefore, the company uses a number of allocations to determine lines of business operating profit for Machinery and Engines.
Machinery operating profit was up $1 million compared to the fourth quarter 2002. The favorable impacts of higher volume and improved price realization were almost completely offset by higher core operating costs and retirement benefits. The increase in core operating costs was due to a lower than normal SG&A spending level in the fourth quarter 2002, higher incentive compensation, increased spending on product development programs, spending to support our volume growth and the unfavorable change of the gain/loss on disposition of assets. These unfavorable items were partially offset by the positive impact of continued material cost reductions and lower warranty costs.
Engines operating profit was up $44 million, or 169 percent, from fourth quarter 2002. The favorable impacts of higher volume (net of unfavorable sales mix) and meeting engine emissions standards with our ACERT technology were partially offset by lower price realization and higher retirement benefits.
Financial Products operating profit was up $22 million, or 34 percent, from fourth quarter 2002. The increase was primarily due to the impact of growth of earning assets of $11 million, decreased provision for credit losses of $8 million, and the favorable impact of $6 million due to lower interest rates (interest rates on debt decreased more than on the portfolio).
OTHER PROFIT/LOSS ITEMS
Interest expense excluding Financial Products was $19 million lower compared to fourth quarter 2002 primarily due to lower average long-term borrowings.
Other income/expense was income of $20 million compared with income of $51 million in fourth quarter 2002. The change was mostly due to the unfavorable impact of currency.
The provision for income taxes in the fourth quarter reflects an estimated annual tax rate of 27 percent for 2003 compared to 28 percent a year ago due to the geographic mix of profits and changes in the estimated tax benefits from export sales.
The equity in profit/loss of unconsolidated affiliated companies favorably impacted profit $3 million from fourth quarter a year ago, due in part to improved profitability of Shin Caterpillar Mitsubishi Ltd. resulting from improved export business into China and North America.
We are providing supplemental information including deliveries to users and dealer inventory levels. We sell the majority of our machines and engines to independently owned and operated dealers and original equipment manufacturers (OEMs) to meet the demands of their customers, the end users. Due to time lags between our sales and the deliveries to end users we believe this information will help readers better understand our business and the industries we serve. All information provided in the supplemental section is inConstant Dollars.
Dealer New Machine Deliveries
Worldwide dealer deliveries of new machines to end users increased 6 percent from 2002. Asia/Pacific and North America accounted for the gain, mostly in deliveries into construction. Deliveries into mining declined despite some late-year recoveries resulting from higher metals prices.
Dealer machine deliveries in North America rose 11 percent in 2003, benefiting from an exceptionally strong 24 percent gain in the fourth quarter. Throughout the year, low interest rates and rising corporate profits encouraged users to upgrade fleets. Then, in the last half, deliveries benefited further from recoveries in construction and construction-related activities.
Deliveries into North American general construction were up 18 percent from 2002. Continued low mortgage interest rates caused housing starts to surge to a 25-year high and nonresidential building construction, largely retail and hotel, improved in the second half. Dealers delivered 17 percent more new machines into heavy construction, where both highway and sewer and water construction increased. Quarry and aggregate prices were higher than in 2002, driving a 5 percent gain in dealer deliveries into that industry. Lumber prices also increased, causing deliveries into forestry to increase 24 percent. Mining remained depressed, with dealer deliveries down 21 percent for the year. Although metals prices were up significantly and coal prices improved during the year, mining companies had not yet increased production by the end of the year.
In EAME, dealers delivered 5 percent fewer machines than in 2002. Europe, where most of the key economies were weak, accounted for most of the decline. Deliveries into Africa/Middle East also decreased, almost entirely in the United Arab Emirates. Deliveries in 2002 benefited from a large infrastructure project that was not repeated in 2003. In the CIS, dealer deliveries nearly doubled as a result of continued development in energy and mining, which benefited from higher oil and metals prices.
Deliveries of new machines into Latin America dropped 11 percent. Most economies grew slowly, resulting in weak construction activity. As a result, deliveries into construction industries decreased. In contrast, higher metals prices caused a significant increase in deliveries to metals mines and dealer inventories in-transit did increase in anticipation of future deliveries.
A-39
Dealer deliveries to end users in Asia/Pacific surged 25 percent. China, where the economy and construction industry boomed, accounted for over half the growth. Economic growth was also robust in many other countries, resulting in double-digit growth in dealer deliveries in Australia, India, Indonesia, Malaysia, South Korea and Thailand.
Dealer Inventories of New Machines
Worldwide dealer inventories at the end of 2003 were higher than a year earlier in all regions. Relative to dealer delivery rates, dealer inventories were lower than a year ago. The inventory to delivery ratio declined in all regions except Latin America.
Engine Deliveries to End Users and OEMs
Worldwide engine deliveries to end users and OEMs were up 1 percent in 2003. Stronger economic growth, higher corporate profits and rising business and investor confidence supported improving investment conditions in all commercial engine sectors. Truck engine deliveries rose 4 percent with all of the gain coming from midrange engines. Worldwide deliveries to end users in the petroleum and electric power sectors rose slightly (1 to 2 percent) with growth due to stronger industry demand. Global deliveries of industrial engines fell 4 percent mostly due to weak Western European economic growth and sluggish industry conditions. Worldwide marine engine deliveries fell 9 percent due to lower demand for large reciprocating engines used in workboats and ocean-going vessels.
In North America, engine deliveries to end users and OEMs were up 2 percent from 2002. Higher deliveries into the industrial, petroleum and on-highway truck sectors more than offset lower deliveries to the electric power and marine sectors. Engine deliveries to end users and OEMs in the industrial sector increased 22 percent caused by stronger industry demand as corporate profits and business investment recovered. Engines delivered to North American truck and bus manufacturers rose 4 percent with all of the growth caused by a 16 percent gain in demand for midrange engines. Caterpillar maintained its leadership position in the North American on-highway truck and bus industry. Deliveries of engines to the petroleum sector rose 5 percent, positively impacted by rising industry profits and more favorable investment trends. Deliveries of engines to the electric power sector declined 4 percent with weaker demand for turbines compared to last year when deliveries to various colleges and universities to meet future energy needs were abnormally strong. Deliveries of engines to the marine sector declined 20 percent due to lower demand for large reciprocating engines used in workboats.
In EAME, overall deliveries to end users and OEMs rose 2 percent, with higher deliveries to the electric power and petroleum sectors up 18 and 10 percent, respectively. EAME deliveries of reciprocating engines gained from particular industry strength in the Middle East. Deliveries to the Middle East strengthened due to favorable oil prices and revenues, steadily improving regional geopolitical confidence and reconstruction efforts. EAME deliveries of engines to the industrial and marine sectors fell 11 and 17 percent, respectively, caused by weak economic growth in Western Europe and lower industry demand for workboats and ocean-going vessels.
Deliveries to end users and OEMs in Latin America fell 17 percent as gains in deliveries to the on-highway truck, industrial and marine sectors were more than offset by weaker demand for engines delivered into the electric power and petroleum sectors. Deliveries of turbines and turbine services to the Latin American electric power sector rose sharply but not enough to offset much weaker deliveries of large reciprocating engines delivered into Brazil. Deliveries of large reciprocating engines rose sharply in 2002 when Brazil had significant hydroelectric power shortages but demand fell substantially after these power shortages disappeared.
Deliveries to end users and OEMs in Asia/Pacific were up 11 percent compared to last year led by a 31 percent gain in engine deliveries to the electric power sector. Improving economic growth and rising business investment supported growth in all sectors except petroleum. Asia/Pacific demand for large engines used in the petroleum sector weakened from last year's strong levels; last year key countries in Asia/Pacific made large investments in engines to increase their oil and gas development and production.
Dealer Inventories of Engines
Worldwide dealer engine inventories at year end were slightly above last year and slightly above normal compared to selling rates. North American and Latin American dealers aggressively worked their surplus electric power engine inventories down to normal levels. EAME dealer inventories rose significantly as dealers pre-positioned inventory to support expected Middle Eastern reconstruction efforts. Dealer inventories in Asia/Pacific rose slightly as delivery trends improved.
- 1.
- Changes in Emissions Standards (Emissions)—Generally, emissions describes the financial impacts of industry emission standard changes for on-highway truck and bus engines in North America. With respect to sales and revenues, emissions represents the impact of price increases. With respect to operating profit, emissions represents the net impact of price increases, production cost increases which include incremental ramp-up production costs and non-conformance penalties (NCPs).
- 2.
- Consolidating Adjustments—Eliminations of transactions between Machinery and Engines and Financial Products.
- 3.
- Constant Dollars—The dollar value of machine and engine deliveries adjusted for changes in price and currency.
- 4.
- Core Operating Costs—Machinery and Engines operating cost change adjusted for volume. It excludes currency, retirement benefits and emissions production cost increases, ramp-up production costs and NCPs.
- 5.
- Currency—With respect to sales and revenues, currency represents the translation impact on sales resulting from changes in foreign currency exchange rates versus the U.S. dollar. With respect to operating profit, currency represents the net translation impact on sales and operating costs resulting from changes in foreign currency exchange rates versus the U.S. dollar. Currency includes the impacts on sales and operating profit for the Machinery and Engines lines of business only; currency impacts on the Financial Products line of business are included in the Financial Products portions of the respective analyses.
A-40
- 6.
- EAME—Geographic region including Europe, Africa, the Middle East and the Commonwealth of Independent States (CIS).
- 7.
- Earning Assets—These assets consist primarily of total net finance receivables plus equipment on operating leases, less accumulated depreciation at Cat Financial. Net finance receivables represent the gross receivables amount less unearned income and the allowance for credit losses.
- 8.
- Engines—A principal line of business including the design, manufacture and marketing of engines for Caterpillar machinery, electric power generation systems; on-highway vehicles and locomotives; marine, petroleum, construction, industrial, agricultural and other applications; and related parts. Reciprocating engines meet power needs ranging from 5 to over 22,000 horsepower (4 to over 16 200 kilowatts). Turbines range from 1,600 to 19,500 horsepower (1 000 to 14 500 kilowatts).
- 9.
- Financial Products—A principal line of business consisting primarily of Caterpillar Financial Services Corporation (Cat Financial), Caterpillar Insurance Holdings, Inc. (Cat Insurance) and their subsidiaries. Cat Financial provides a wide range of financing alternatives for Caterpillar machinery and engines, Solar gas turbines, as well as other equipment and marine vessels. Cat Financial also extends loans to customers and dealers. Cat Insurance provides various forms of insurance to customers and dealers to help support the purchase and lease of our equipment.
- 10.
- Latin America—Geographic region including the Central American countries and Mexico.
- 11.
- Machinery—A principal line of business which includes the design, manufacture and marketing of construction, mining, agricultural and forestry machinery—track and wheel tractors, track and wheel loaders, pipelayers, motor graders, wheel tractor-scrapers, track and wheel excavators, backhoe loaders, mining shovels, log skidders, log loaders, off-highway trucks, articulated trucks, paving products, telescopic handlers, skid steer loaders and related parts. Also includes logistics services for other companies.
- 12.
- Machinery and Engines (M&E)—Due to the highly integrated nature of operations, represents the aggregate total of the Machinery and Engines lines of business and includes primarily our manufacturing, marketing and parts distribution operations.
- 13.
- Price Realization—The impact of net price changes excluding emissions price increases and currency.
- 14.
- Retirement Benefits—Cost of defined benefit pension plans, defined contribution plans and retirement healthcare and life insurance.
- 15.
- Sales Volume/Mix—The net operating profit impact of changes in the quantities sold for machines, engines and parts combined with the net operating profit impact of changes in the relative weighting of machines, engines and parts sales with respect to total sales.
- 16.
- 6 Sigma—On a technical level, 6 Sigma represents a measure of variation that achieves 3.4 defects per million opportunities. At Caterpillar, 6 Sigma represents a much broader cultural philosophy to drive continuous improvement throughout the value chain. It is a fact-based, data-driven methodology that we are using to improve processes, enhance quality, cut costs, grow our business and deliver greater value to our customers through Black Belt-led project teams. At Caterpillar, 6 Sigma goes beyond mere process improvement; it has become the way we work as teams to process business information, solve problems and manage our business successfully.
For the full year, the company achieved sales and revenues of $20.15 billion compared to $20.45 billion in 2001. This decline of about 1 percent was due to lower sales volume of about $680 million, partially offset by the favorable impact of currency of about $150 million and improved price realization of about $150 million. The currency impact was due to the favorable impact of the weaker U.S. dollar on sales in other currencies, primarily the euro and Australian dollar.
Profit for the full year was $798 million or $2.30 per share, compared to $805 million or $2.32 per share, down less than 1 percent from 2001. Profit was favorably impacted by the absence of the $97 million after-tax charge recorded in 2001 for the sale of the Challenger agricultural tractor line, plant closing and consolidations and cost for planned employment reductions. The combined effect of favorable price realization and net favorable currency of approximately $250 million was more than offset by lower sales volume and related manufacturing inefficiencies.
Application of the goodwill non-amortization provisions of SFAS 142 resulted in a favorable before-tax impact on 2002 earnings of $85 million. This was more than offset by a $93 million before-tax increase in pension and other postretirement benefit expense. This increase was a result of lower plan asset returns in recent years, partially offset by the favorable before-tax impact of other postretirement benefit plan changes made in the second quarter of 2002. These changes impacted U.S. employees only and included an increase in retiree cost sharing of health care benefits, elimination of company payments for Medicare part B premiums and significant reductions in retiree life insurance.
MACHINERY AND ENGINES
Machinery sales were $11.98 billion, a decrease of $183 million or 2 percent from 2001. Sales volume for the year decreased 4 percent from 2001. Higher sales in Asia/Pacific were due to higher retail demand. Sales in North America, EAME and Latin America declined due to lower retail demand. Sales were also affected by changes in dealer inventories. In 2001, dealers decreased machine inventories about 7 percent. In 2002, dealer inventories increased by about 3 percent; however, year-end 2002 inventories compared to current selling rates were lower than year-earlier levels in all regions.
Engine sales were $6.67 billion, a decrease of $196 million or 3 percent from 2001. Sales volume for the year decreased 4 percent from 2001. Caterpillar truck engine sales rose 36 percent due to a surge in demand from North American truck OEMs for heavy-duty truck engines prior to the October 2002 emissions deadline and improved truck fleet operating profits. Sales into the petroleum sector increased 4 percent as higher sales of turbine engines more than offset a decline in sales of reciprocating engines. These increases were more than offset by 30 percent lower sales to the
A-41
electric power sector, where financial uncertainties and depressed operating profits within the electric utility, technology and telecommunications industries impacted demand.
Operating Profit Table
| | 2002 | 2001 | |||||
|---|---|---|---|---|---|---|---|
| | (Millions of dollars) | ||||||
| Machinery | $ | 947 | $ | 854 | |||
| Engines | 175 | 353 | |||||
| $ | 1,122 | $ | 1,207 | * | |||
- *
- Includes $153 million of charges for the sale of the Challenger agricultural tractor line, plant closing and consolidations and costs for planned employment reductions. These charges were split $98 million and $55 million to Machinery and Engines, respectively.
Caterpillar operations are highly integrated; therefore, the company uses a number of allocations to determine lines of business operating profit.
Machinery operating profit increased $93 million, or 11 percent from 2001. Operating profit was favorably impacted by the absence of the $98 million charge for the sale of the Challenger agricultural tractor line, plant closing and consolidations and cost for planned employment reductions. The favorable profit impact of price realization, net impact of currency and lower SG&A expenses were more than offset by the profit impact of lower sales volume and related manufacturing inefficiencies.
Application of the goodwill non-amortization provisions of SFAS 142 resulted in a favorable impact on 2002 machinery operating profit of approximately $10 million. This was more than offset by a $62 million before-tax increase in pension and other postretirement benefit expense.
Engine operating profit decreased $178 million, or 50 percent from 2001. Operating profit was favorably impacted by the absence of the $55 million charge for the sale of the Challenger agricultural tractor line, plant closing and consolidations and cost for planned employment reductions. Increased turbine and on-highway truck and bus engine volumes and improved price realization improved operating profit by approximately $140 million. These favorable items were more than offset by the profit impact of lower sales volume of large reciprocating engines, volume-related manufacturing inefficiencies and nonconformance penalties for on-highway truck and bus engines.
Application of the goodwill non-amortization provisions of SFAS 142 resulted in a favorable impact on 2002 engine operating profit of approximately $75 million. This was partially offset by a $31 million before-tax increase in pension and other postretirement benefit expense.
Interest expense was $6 million lower in 2002 compared to 2001 primarily due to lower interest rates on short-term borrowings.
Other income/expense improved by $82 million year-over-year primarily due to the absence of foreign currency losses and lower expenses related to the sales of receivables to Cat Financial.
FINANCIAL PRODUCTS
Financial Products revenues for 2002 were $1.68 billion, up $33 million or 2 percent compared with 2001. A favorable impact of approximately $205 million due to a $2.1 billion increase in the portfolio at Cat Financial and an increase in third party insurance premiums and fees earned of approximately $21 million at Cat Insurance was mostly offset by the impact of generally lower interest rates on finance receivables at Cat Financial.
Before-tax profit was $287 million, down $58 million or 17 percent from 2001. A $41 million before-tax charge of "other than temporary" declines in the market value of securities in the investment portfolio at Cat Insurance resulted from poor overall market performance. Also, there was less securitization-related income of approximately $28 million before tax and higher operating expenses of $17 million before tax at Cat Financial. These items were partially offset by higher rental income, net of depreciation, of $30 million before tax at Cat Financial and higher underwriting income of $7 million before tax at Cat Insurance.
INCOME TAXES
Tax expense reflects an estimated annual tax rate of 28 percent for 2002 and 32 percent for 2001 resulting from a change in the geographic mix of profits.
UNCONSOLIDATED AFFILIATED COMPANIES
The company's share of unconsolidated affiliated companies' profits decreased $7 million from a year ago, primarily due to losses at Shin Caterpillar Mitsubishi Ltd. resulting from depressed construction equipment demand in Japan.
In December 2001, we signed an agreement with AGCO to sell the design, assembly and marketing of the new MT Series of Caterpillar's Challenger high-tech farm tractors during the first quarter of 2002. By selling the Challenger we will avoid the substantial new investment in distribution that would be required to make this product profitable. The sale will also provide our distribution network the expanded line of agricultural products it needs to be successful. A total charge of $81 million was recognized for the Challenger sale. These charges reflect the provisions of the agreement with AGCO and are comprised of the following:
- •
- $32 million for write-downs of land, buildings and equipment at our DeKalb, Illinois, facility to fair market value based on the negotiated contract price with AGCO.
- •
- $49 million for exit costs. The contract with AGCO requires that we complete the design of the new Challenger tractor, ensure a successful market launch and pay for the remaining capital assets required for the production of the tractor. These amounts reflect our estimate of costs
A-42
to fulfill our contract obligations and will be incurred in 2002. Also included in exit costs are contractual obligations that will remain after the sale to AGCO but will provide no benefit to Caterpillar. These obligations range from one to seven years.
In December 2001, we announced plans to cease production of diesel engines at the Perkins Engines Shrewsbury, England, plant by the end of 2002. Production will be reallocated to other Caterpillar engine facilities to better leverage technology and capacity. Upon closure of the plant, we expect an annual benefit to cost of goods sold of approximately $16 million. This represents lower overhead and other fixed manufacturing expenses as the production moves to other existing Caterpillar locations. A total charge of $30 million was recognized for the closing and comprised the following:
- •
- $16 million for write-downs of land, buildings and equipment to fair market value as determined by third-party appraisers.
- •
- $10 million of separation costs for termination of 495 employees at the Shrewsbury plant. These benefits were communicated to impacted employees in December.
- •
- Exit costs of $4 million associated with closing the facility.
In December 2001, we announced plans to reduce U.S. salaried and management employment by 433 people at selected business units during the first half of 2002. These reductions are being made to reduce costs and improve efficiencies in support of our long-term growth and profitability goals. We expect this reduction to be achieved through voluntary early retirements but if the reduction goal is not met, we will use involuntary separations. The charge of $34 million for this program reflects the cost of retirement incentives. We expect lower annual labor costs of approximately $35 million after completion of the employment reduction.
Other charges of $8 million were for write-downs of two manufacturing buildings, one at our Decatur, Illinois, facility and one at our Kiel, Germany, facility.
During 2002, we reduced the Challenger exit cost reserve by $38 million, primarily for cash outlays for research and development expenses and manufacturing equipment in accordance with the contract with AGCO. We reduced the Shrewsbury redundancy reserve by $6 million for separation benefits for 225 employees. As planned, the U.S. employment reduction was achieved entirely through voluntary retirements. As a result, the reserve of $34 million was reclassified to our pension accounts upon completion of the retirement program.
During 2003, the contracts related to the Challenger were terminated. Contract cancellation costs were charged to the reserve, which was reduced to zero. There will be no future cash outlays related to these contracts. Also during 2003, the Shrewsbury exit plan was completed and remaining costs were charged to the reserve, which was also reduced to zero.
Other Charges
| | 2001 Charge | Asset Impairments | 2002 Activity* | 12/31/02 Balance | 2003 Activity | 12/31/03 Balance | |||||||||||||
|---|---|---|---|---|---|---|---|---|---|---|---|---|---|---|---|---|---|---|---|
| | (Millions of dollars) | ||||||||||||||||||
| Challenger: | |||||||||||||||||||
| Asset impairments | $ | 32 | $ | (32 | ) | $ | — | $ | — | $ | — | $ | — | ||||||
| Exit costs | 49 | — | (38 | ) | 11 | (11 | ) | — | |||||||||||
| 81 | (32 | ) | (38 | ) | 11 | (11 | ) | — | |||||||||||
| Shrewsbury: | |||||||||||||||||||
| Asset impairments | 16 | (16 | ) | — | — | — | — | ||||||||||||
| Redundancy | 10 | — | (6 | ) | 4 | (4 | ) | — | |||||||||||
| Exit costs | 4 | — | (2 | ) | 2 | (2 | ) | — | |||||||||||
| 30 | (16 | ) | (8 | ) | 6 | (6 | ) | — | |||||||||||
| U.S. employment reduction | 34 | — | (34 | ) | — | — | — | ||||||||||||
| Other asset impairments | 8 | (8 | ) | — | — | — | — | ||||||||||||
| Total | $ | 153 | $ | (56 | ) | $ | (80 | ) | $ | 17 | $ | (17 | ) | $ | — | ||||
- *
- All amounts were paid in cash except for the U.S. employment reduction of $34 million which was reclassified to our pension accounts. Please refer to the Benefits Obligation Table in Note 11 on page A-17.
A-43
Sources of funds
The company generates its capital resources primarily through operations. Consolidated operating cash flow was $2.07 billion for 2003, a decrease of $300 million from 2002. This decrease reflects an increase in pension contributions of $523 million ($720 million in 2003 compared with $197 million in 2002) that more than offset increased profits of $301 million. The pension contributions were made with existing cash resources. We anticipate that the majority of future capital resource requirements will be funded by operating cash flow, which is largely sourced from profits. See our "Outlook" on page A-54.
Total debt as of December 31, 2003 was $19.8 billion, an increase of $2.13 billion from year-end 2002. Debt related to Machinery and Engines decreased $254 million. Two $250 million debt retirements were partially offset by increases in capital lease obligations of $73 million and other long-term debt of $63 million. Debt related to Financial Products increased $2.39 billion due to financing a higher amount of assets at Cat Financial. We have two global credit facilities with a syndicate of banks totaling $4,675 million available in the aggregate to both Machinery and Engines and Financial Products to support commercial paper programs. Based on Management's allocation decision, which can be revised at any time during the year, the portion of the facility available to Cat Financial at December 31, 2003 was $4,075 million. The five-year facility of $2,125 million expires in September 2006. The 364-day facility of $2,550 million expires in September 2004. The facility expiring in September 2004 has a provision which allows Caterpillar or Cat Financial to obtain a one-year loan in September 2004 that would mature in September 2005. Our total credit commitments as of December 31, 2003 were:
| | Consolidated | Machinery and Engines | Financial Products | |||||||
|---|---|---|---|---|---|---|---|---|---|---|
| | (Millions of dollars) | |||||||||
| Credit lines available: | ||||||||||
| Global credit facility | $ | 4,675 | $ | 600 | $ | 4,075 | ||||
| Other external | 1,549 | 683 | 866 | |||||||
| Total credit lines available | 6,224 | 1,283 | 4,941 | |||||||
| Less: Global credit facility supporting commercial paper | 3,957 | 45 | 3,912 | |||||||
| Less: Utilized credit | 255 | 72 | 183 | |||||||
| Available credit | $ | 2,012 | $ | 1,166 | $ | 846 | ||||
We also generate funding through the securitization of receivables. In 2003, we generated $1,099 million and $693 million, of capital resources from the securitization of trade and finance receivables, respectively.
We do not generate material funding through structured finance transactions.
Committed funds
The company has committed cash outflow related to long-term debt, operating lease agreements, purchase obligations and other contractual obligations. Minimum payments for these long-term obligations are:
| | 2004 | 2005 | 2006 | 2007 | 2008 | After 2008 | Total | ||||||||||||||||
|---|---|---|---|---|---|---|---|---|---|---|---|---|---|---|---|---|---|---|---|---|---|---|---|
| | (Millions of dollars) | ||||||||||||||||||||||
| Long-term debt: | |||||||||||||||||||||||
| Machinery and Engines | $ | 32 | $ | 62 | $ | 291 | $ | 33 | $ | 20 | $ | 2,350 | $ | 2,788 | |||||||||
| Financial Products | 2,949 | 3,510 | 4,726 | 1,064 | 857 | 554 | 13,660 | ||||||||||||||||
| Total long-term debt | 2,981 | 3,572 | 5,017 | 1,097 | 877 | 2,904 | 16,448 | ||||||||||||||||
| Capital leases | 29 | 29 | 29 | 29 | 30 | 983 | 1,129 | ||||||||||||||||
| Operating leases | 194 | 146 | 118 | 71 | 54 | 305 | 888 | ||||||||||||||||
| Postretirement obligations(1) | 930 | 450 | 460 | 570 | 480 | 2,420 | 5,310 | ||||||||||||||||
| Purchase obligations: | |||||||||||||||||||||||
| Accounts payable(2) | 3,100 | — | — | — | — | — | 3,100 | ||||||||||||||||
| Purchase orders(3) | 2,634 | — | — | — | — | — | 2,634 | ||||||||||||||||
| Other contractual obligations(4) | 83 | 104 | 106 | 96 | — | 468 | 857 | ||||||||||||||||
| Total purchase obligations | 5,817 | 104 | 106 | 96 | — | 468 | 6,591 | ||||||||||||||||
| Other long-term liabilities(5) | 65 | 67 | 27 | 22 | 19 | 32 | 232 | ||||||||||||||||
| Total contractual obligations | $ | 10,016 | $ | 4,368 | $ | 5,757 | $ | 1,885 | $ | 1,460 | $ | 7,112 | $ | 30,598 | |||||||||
- (1)
- Amounts represent expected contributions to our pension and other postretirement benefit plans through 2013.
- (2)
- Amount represents invoices received and recorded as liabilities in 2003, but scheduled for payment in 2004. These represent short-term obligations made in the ordinary course of business.
- (3)
- Amount represents contractual obligations for material and services on order at December 31, 2003 but not yet delivered. These represent short-term obligations made in the ordinary course of business.
- (4)
- Amounts represent long-term commitments entered into with key suppliers for minimum purchases quantities.
- (5)
- Amounts represent contractual obligations related to software license contracts, IT consulting contracts and outsourcing contracts for benefit plan administration and software system support.
Machinery and Engines
After contributing $720 million to our pension plans, Machinery and Engines operating cash flow was $1.43 billion. The strong cash flow allowed funding for our capital expenditures, increased dividend payments and the share repurchase program while improving the strength of our financial position. Pursuant to the share repurchase program authorized by the Board of Directors in October 2003, $405 million was spent to purchase 5.45 million shares during the fourth quarter. There were 344 million shares outstanding at the end of 2003. The goal of the share repurchase program, which expires in October 2008, is to reduce the company's outstanding shares to 320 million. In the first quarter, $250 million in long-term debt was retired using available cash resources. In the third quarter, the early retirement of our $250 million 6 percent debentures due in 2007 was made using available cash and low interest commercial paper. Capital expenditures, excluding equipment leased to others, during 2003 were $654 million, a decrease of $39 million from 2002 due to tight controls on spending.
A-44
Financial Products
Operating cash flow was $639 million for 2003, compared with $649 million for 2002. The decrease was due to higher working capital requirements, largely offset by increased profit. Cash used to purchase equipment leased to others was $1.07 billion during 2003 compared to $1.04 billion for 2002. In addition, net cash used for finance receivables was $1.50 billion for 2003, compared to $1.16 billion for 2002.
Financial Products total borrowings were $16.34 billion at December 31, 2003, an increase of $2.39 billion from December 31, 2002, and primarily comprised $11.72 billion of medium-term notes, $3.91 billion of commercial paper, $415 million of money market funds, $183 million of short-term notes payable to banks, $110 million of long-term notes payable to banks and $7 million of loans from a company-owned partnership. Debt repayment in Financial Products depends primarily on timely repayment and collectibility of the receivables portfolio. At December 31, 2003, finance receivables past due over 30 days were 2.5%, compared with 3.5% at December 31, 2002. The allowance for credit losses was 1.49% of finance receivables, net of unearned income, at December 31, 2003, compared to 1.47% at December 31, 2002. Receivables written off due to uncollectibility in 2003, net of recoveries on receivables previously written off, were $82 million.
Financial Products was in compliance with all debt covenants at December 31, 2003.
Dividends paid per common share
| Quarter | 2003 | 2002 | 2001 | ||||||
|---|---|---|---|---|---|---|---|---|---|
| First | $ | .350 | $ | .350 | $ | .340 | |||
| Second | .350 | .350 | .340 | ||||||
| Third | .350 | .350 | .350 | ||||||
| Fourth | .370 | .350 | .350 | ||||||
| $ | 1.420 | $ | 1.400 | $ | 1.380 | ||||
The preparation of financial statements in conformity with generally accepted accounting principles requires management to make estimates and assumptions that affect reported amounts. The more significant estimates include: residual values for leased assets, fair market values for goodwill impairment tests, and reserves for warranty, product liability and insurance losses, postretirement benefits, post-sale discounts, credit losses and income taxes. Following are the methods and assumptions used in determining our estimates and an indication of the risks inherent in each.
Residual values for leased assets—Determined based on the product, specifications, application and hours of usage. Each product has its own model for evaluation that includes market value cycles and forecasts. Consideration is also given to the amount of assets that will be returned from lease during a given time frame. Residual values could decline due to economic factors, obsolescence or other adverse circumstances.
Fair market values for goodwill impairment tests—Determined for each reporting unit by discounting projected cash flow for five years and adding a year-five residual value based upon a market Earnings Before Interest, Taxes, Depreciation and Amortization (EBITDA) multiple. The estimated fair value could be impacted by changes in interest rates, growth rates, costs, capital expenditures and market conditions.
Warranty reserve—Determined by applying historical claim rate experience to the current field population and dealer inventory. Generally, historical claim rates are developed using a 12-month rolling average of actual warranty expense. These rates are applied to the field population and dealer inventory to determine the reserve. Warranty payments may differ from those estimated if actual claim rates are higher or lower than our historical rates.
Product liability and insurance loss reserve—Determined based upon reported claims in process of settlement and actuarial estimates for losses incurred but not reported. Loss reserves, including incurred but not reported reserves, are based on estimates and ultimate settlements may vary significantly from such estimates due to increased claims frequency or severity over historical levels.
Postretirement benefits—Primary actuarial assumptions are determined as follows: (See Tables on pages A-49 to A-50 for Sensitivity information for these assumptions.)
- •
- The U.S. expected long-term rate of return on plan assets is based on our estimate of long-term passive returns for equities and fixed income securities weighted by the allocation of our plan assets. Based on historical performance, we increase the passive returns due to our active management of the plan assets. A similar process is used to determine the rate for our non-U.S. pension plans. This rate is impacted by changes in general market conditions, but because it represents a long-term rate, it is not significantly impacted by short-term market swings. Changes in our allocation of plan assets would also impact this rate. For example, a shift to more fixed income securities would lower the rate. A decrease in the rate would increase our expense.
- •
- The assumed discount rate is used to discount future benefit obligations back to today's dollars. The U.S. discount rate is based on the Moody's Aa bond yield as of our measurement date, November 30. A similar process is used to determine the assumed discount rate for our non-U.S. plans. This rate is sensitive to changes in interest rates. A decrease in the discount rate would increase our obligation and expense.
- •
- The expected rate of compensation increase is used to develop benefit obligations using projected pay at retirement. It represents average long-term salary increases. This rate is influenced by our long-term compensation policies. An increase in the rate would increase our obligation and expense.
- •
- The assumed health care trend rate represents the rate at which health care costs are assumed to increase and is based on historical and expected experience. Changes in our projections of future health care costs due to general economic conditions and those specific to health care (e.g. technology driven cost changes) will impact this trend rate. An increase in the trend rate would increase our obligation and expense.
Post-sale discount reserve—The company extends numerous merchandising programs that provide discounts to dealers as products are sold to end users. The reserve is determined based on historical data adjusted for known changes in merchandising programs. Discounts paid may differ from those estimated if actual program usage is higher or lower than our historical or expected rates.
A-45
Credit loss reserve—The allowance for credit losses is evaluated on a regular basis and adjusted based upon management's best estimate of probable losses inherent in our finance receivables. In estimating probable losses, we review accounts that are past due, non-performing, or in bankruptcy. We also review accounts that may be at risk using information available about the customer, such as financial statements, news reports, and published credit ratings. We also use general information regarding industry trends and the general economic environment. Using an estimate of current fair market value of collateral and factoring in credit enhancements, such as additional collateral and third party guarantees, we arrive at an estimated loss for specific accounts and estimate an additional amount for the remainder of the finance receivables based upon historical trends. Adverse economic conditions or other factors that might cause deterioration of the financial health of our customers could change the timing and level of payments received and thus necessitate a change in our estimated losses.
Income tax reserve—Despite our belief that our tax return positions are consistent with applicable tax laws, we believe that certain positions are likely to be challenged by taxing authorities. Settlement of any challenge can result in no change, a complete disallowance, or some partial adjustment reached through negotiations or litigation. Significant judgment is required in evaluating our tax reserves. Our reserves are adjusted in light of changing facts and circumstances, such as the progress of our tax audits. Our income tax expense includes the impact of reserve provisions and changes to reserves that we consider appropriate, as well as related interest. Unfavorable settlement of any particular issue would require use of our cash. Favorable resolution would be recognized as a reduction to income tax expense at the time of resolution.
We have incorporated many years of data into the determination of each of these estimates and we have not historically experienced significant adjustments.
At December 31, 2003, Caterpillar's worldwide employment was 69,169 compared with 68,990 one year ago. Excluding the impact of acquiring a controlling interest in Hindustan Powerplus Ltd. and increases to support our growing Caterpillar Logistics operations—which combined added approximately 1,100 employees—employment was down about 900.
Full-Time Employees at Year End
| | 2003 | 2002 | 2001 | |||||
|---|---|---|---|---|---|---|---|---|
| Inside U.S. | 35,260 | 36,463 | 38,664 | |||||
| Outside U.S. | 33,909 | 32,527 | 33,340 | |||||
| Total | 69,169 | 68,990 | 72,004 | |||||
| By Region: | ||||||||
| North America | 35,486 | 36,667 | 38,879 | |||||
| EAME | 20,547 | 21,302 | 22,246 | |||||
| Latin America | 8,533 | 7,143 | 7,012 | |||||
| Asia/Pacific | 4,603 | 3,878 | 3,867 | |||||
| Total | 69,169 | 68,990 | 72,004 | |||||
ENVIRONMENTAL AND LEGAL MATTERS
The company is regulated by federal, state and international environmental laws governing our use of substances and control of emissions in all our operations. Compliance with these existing laws has not had a material impact on our capital expenditures, earnings or competitive position.
We are cleaning up hazardous waste at a number of locations, often with other companies, pursuant to federal and state laws. When it is likely we will pay clean-up costs at a site and those costs can be estimated, the costs are charged against our earnings. In making that estimate, we do not consider amounts expected to be recovered from insurance companies and others.
The amount recorded for environmental cleanup is not material and is included under "Accrued expenses" in Statement 3. If a range of liability estimates is available on a particular site, we accrue the lower end of that range.
We cannot estimate costs on sites in the very early stages of cleanup. Currently, we have five sites in the very early stages of cleanup, and there is no more than a remote chance that a material amount for cleanup will be required.
Pursuant to a consent decree Caterpillar entered with the United States Environmental Protection Agency (EPA), the company was required to meet certain emission standards by October 2002. The decree provides that if engine manufacturers were unable to meet the standards at that time, they would be required to pay a non-conformance penalty (NCP) on each engine sold that did not meet the standard. The amount of the NCP would be based on how close to meeting the standard the engine came—the more out of compliance the higher the penalty. The company began shipping lower emission engines in October 2002 as a bridge until fully compliant Advanced Combustion Emission Reduction Technology (ACERT) engines were introduced in 2003.
The consent decree also provided the ability to "bank" emissions credits prior to October 2002 that could be used to offset non-conforming engines produced after December 31, 2002. That is, if a company was able to produce and sell engines that were below the applicable standard prior to October 2002, then the company could apply the emission credits created by those engines to engines produced after December 31, 2002 that did not meet the consent decree standard. For example, an engine produced and sold prior to October 2002 that produced 3.5 grams of NOx as compared to a 4.0 gram standard would create an emissions credit. This credit would be "banked" to be used to offset the NOx deficiency of an engine produced after December 31, 2002 that did not meet the consent decree standard. Given this scenario, a company could produce and sell a 3.0 gram engine in 2003 without paying an NCP even though the engine exceeds the 2.5 gram standard. Caterpillar had a legal right, as described in the consent decree, to use its banked credits as offsets against NCPs for non-compliant engines produced after December 31, 2002. The EPA has approved the process by which the credits are calculated.
In a final report to the EPA filed during the third quarter of 2003, we identified 70,018 medium heavy-duty engines produced and sold prior to October 2002 that yielded emissions below the applicable standard for that period, resulting in 20,868 Mg of medium heavy-duty banked credits. This is 381 engines and 120 Mg less
A-46
than had been identified at the end of 2002. The number of engines generating emissions credits in our final report to the EPA was lowered for a variety of reasons including a more detailed analysis of engines actually produced that were eligible to generate credits and the identification of engines shipped to customers outside the United States which were not eligible to generate emissions credits. During 2003, banked credits offset the NCPs on all but approximately 600 of the approximately 31,000 non-conforming medium heavy-duty engines we produced. We paid NCPs of $2,485 per engine, or $1.5 million, on the 600 medium heavy-duty engines produced in 2003 in excess of those for which we could use banked credits. We also identified 731 heavy-duty engines built prior to October 1, 2002, that generated banked credits totaling 969 Mg. This is 227 engines and 261 Mg less than had been identified at the end of 2002; the reasons for the reduction are similar to those resulting in the adjustments to medium heavy-duty engines and credits. Banked credits offset the NCPs on approximately 2,000 of the 45,000 non-conforming heavy-duty engines we built during 2003. We paid NCP's of approximately $3,555 per engine, or $153 million on the remaining 43,000 heavy-duty engines produced in 2003 in excess of those for which we could use banked credits.
We began production of medium heavy-duty ACERT engines that were fully-compliant with the EPA emissions standards in early 2003, and in mid-2003 began producing fully-compliant heavy-duty ACERT engines. During 2003, Caterpillar received certification from the EPA for its C7 and C9 medium heavy-duty ACERT engines and its C11, C13 and C15 heavy-duty ACERT engines. By the end of 2003 Caterpillar was producing all of these engine models, and as a result, does not expect to pay NCPs on engines built during 2004.
The certification process is described in the consent decree and the regulations, and includes the following:
- •
- The durability of the engine is established through testing to determine if the engine emissions change with time. An emissions deterioration factor is determined that represents the amount of emission deterioration that would be expected over the useful life of the engine.
- •
- An emission data engine is tested according to the regulations. Emission levels are determined on various steady state and transient tests.
- •
- The results from the emissions tests are submitted to the EPA in a certification application as proof that the engine meets the requirements along with additional information and a request that a certificate be granted.
- •
- The EPA reviews the application and if all the regulatory requirements are met, a certificate is issued.
- •
- If the engine exceeds the standard, the EPA issues a certificate for either a banked or an NCP engine. The NCP engine certificate requires Production Compliance Auditing (PCA) testing.
After receipt of the EPA certificate, manufacturing and shipment of the certified engines can begin. Each engine is labeled to indicate that it is certified.
Our expense for NCPs was $40 million in 2002 and $153 million in 2003. NCP expense recorded in 2002 was based on our engineering estimates at that time of the expected results of EPA emissions testing that began and was completed in 2003. NCP expense recorded in 2003 reflects the results of the completed tests, including a reduction of approximately 3 percent to the NCP expense recorded for 2002. During the fourth quarter of 2003, we re-tested one configuration of our heavy-duty bridge engine models, averaging the results with an earlier test. Our 2003 NCP expense includes a $10 million fourth-quarter benefit from the re-test related to all bridge engines of that configuration produced since October 2002, including $1.3 million for engines produced in the fourth quarter of 2002 and $7.4 million for engines produced during the first three quarters of 2003. For 2002, we paid NCPs on approximately 6,200 heavy-duty units and 7,200 medium heavy-duty units, and for 2003 we paid NCPs on approximately 43,000 heavy-duty units and 600 medium heavy-duty units.
Aside from $142 million in customary research and development expenses, emissions standard changes negatively impacted our 2002 financial results by $24 million ($17 million after tax) as NCPs ($40 million pre-tax), product cost increases and ramp-up production costs ($4 million pre-tax) were partially offset by price increases for these engines ($20 million pre-tax). NCPs were deposited in an escrow account prior to completion of emissions testing for each engine model throughout 2003, and were paid to the EPA, either from the escrow account or directly, after completion of testing of a particular model. On January 30, 2004, Caterpillar paid NCPs to the EPA for engines built during the fourth quarter of 2003, ending its payments to the EPA for NCPs for engines built during 2002 and 2003. NCP expense for 2003 reflects this payment.
The following table reflects the 2002 impact of the emission standard changes:
| | 2002 | ||||
|---|---|---|---|---|---|
| | (Millions of dollars) | ||||
| Price (Engines sold × bridge price increase) | $ | 20 | |||
| Incremental costs | |||||
| (Cost of additional materials and production costs) | (4 | ) | |||
| NCPs (Engines sold × projected NCP per engine) | (40 | ) | |||
| Net effect pre-tax | $ | (24 | ) | ||
| Tax | 7 | ||||
| Net effect after tax | $ | (17 | ) | ||
Aside from $115 million in customary research and development expenses, emissions standard changes negatively impacted our 2003 financial results by $46 million ($34 million after-tax). The net unfavorable impact of emission standard changes was greater in 2003 than in 2002 as significantly higher NCPs (approximately $153 million pre-tax), product cost increases and ramp-up production costs (approximately $84 million pre-tax), were partially offset by price increases for bridge and ACERT engines (approximately $191 million pre-tax). The following table reflects the 2003 impact of the emission standard changes:
| | 2003 | ||||
|---|---|---|---|---|---|
| | (Millions of dollars) | ||||
| Price (Engines sold × bridge or ACERT price increase) | $ | 191 | |||
| Incremental costs | |||||
| (Cost of additional materials and production costs) | (84 | ) | |||
| NCPs (Engines sold × NCP per engine—banked credits) | (153 | ) | |||
| Net effect pre-tax | $ | (46 | ) | ||
| Tax | 12 | ||||
| Net effect after tax | $ | (34 | ) | ||
In addition to the above, the consent decree required Caterpillar to pay a fine of $25 million, which was expensed in 1998 and to make investments totaling $35 million in environmental-related
A-47
products by July 7, 2007. Total qualifying investments to date for these projects is $29 million, of which $10 million was made in 2002 and $19 million in 2003. A future benefit is expected to be realized from these environmental projects related to Caterpillar's ability to capitalize on the technologies it developed in complying with its environmental project obligations. In short, Caterpillar expects to receive a positive net return on the environmental projects by being able to market the technology it developed.
NCPs were approximately $3,500 per heavy-duty engine subject to NCPs, based on the results of the completed EPA testing. Our net price increase for heavy-duty bridge engines was successfully implemented on October 1, 2002; this increase was competitive with price increases implemented by other engine manufacturers on that date. With the introduction of ACERT engines in 2003, we implemented an additional price increase to truck manufacturers that purchase our heavy-duty engines, and on January 1, 2004, we implemented a price increase for medium heavy-duty ACERT engines. These increases are based on the additional value that we expect truck owners to receive from ACERT engines compared to engines of our competitors as a result of better fuel economy, less maintenance and greater durability. The ultimate net price increase we are able to achieve for our ACERT engines in the future is dependent upon marketplace acceptance of these engines versus competitive alternatives.
On January 16, 2002, Caterpillar commenced an action in the Circuit Court of the Tenth Judicial Circuit of Illinois in Peoria, Illinois, against Navistar International Transportation Corporation and International Truck and Engine Corporation (collectively Navistar). The lawsuit arises out of a long-term purchase contract between Caterpillar and Navistar effective May 31, 1988, as amended from time to time (the Purchase Agreement). The pending complaint alleges that Navistar breached its contractual obligations by: (i) paying Caterpillar $8.08 less per fuel injector than the agreed upon price for new unit injectors delivered by Caterpillar; (ii) refusing to pay contractually agreed upon surcharges owed as a result of Navistar ordering less than planned volumes of replacement unit injectors; and (iii) refusing to pay contractually agreed upon interest stemming from Navistar's late payments. At December 31, 2003, the past due receivable from Navistar regarding the foregoing was $132 million. The pending complaint also has claims alleging that Franklin Power Products, Inc., Newstream Enterprises, and Navistar, collectively and individually, failed to pay the applicable price for shipments of unit injectors to Franklin and Newstream. At December 31, 2003, the past due receivables for the foregoing totaled $12 million. The pending complaint further alleges that Sturman Industries, Inc., and Sturman Engine Systems, Inc., colluded with Navistar to utilize technology that Sturman Industries, Inc., misappropriated from Caterpillar to help Navistar develop its G2 fuel system, and tortiously interfered with the Purchase Agreement and Caterpillar's prospective economic relationship with Navistar. The pending complaint further alleges that the two parties' collusion led Navistar to select Sturman Engine Systems, Inc., and another company, instead of Caterpillar, to develop and manufacture the G2 fuel system.
On May 7, 2002, International Truck and Engine Corporation (International) commenced an action against Caterpillar in the Circuit Court of DuPage County, Illinois, that alleges Caterpillar breached various aspects of a long-term agreement term sheet. In its fourth amended complaint, International seeks a declaration from the court that the term sheet constitutes a legally binding contract for the sale of heavy-duty engines at specified prices through the end of 2006, alleges that Caterpillar breached the term sheet by raising certain prices effective October 1, 2002, and also alleges that Caterpillar breached an obligation to negotiate a comprehensive long-term agreement referenced in the term sheet. International further claims that Caterpillar improperly restricted the supply of heavy-duty engines to International from June through September 2002, and claims that Caterpillar made certain fraudulent misrepresentations with respect to the availability of engines during this time period. International seeks damages "in an amount to be determined at trial" and injunctive relief. Caterpillar filed an answer denying International's claims and has filed a counterclaim seeking a declaration that the term sheet has been effectively terminated. Caterpillar denies International's claims and will vigorously contest them. On September 24, 2003, the Appellate Court of Illinois, ruling on an interlocutory appeal, issued an order consistent with Caterpillar's position that, even if the court subsequently determines that the term sheet is a binding contract, it is indefinite in duration and was therefore terminable at will by Caterpillar after a reasonable period. Caterpillar anticipates that a trial currently scheduled for the third quarter of 2004 will address all remaining issues in this matter. This matter is not related to the breach of contract action brought by Caterpillar against Navistar currently pending in the Circuit Court of Peoria County, Illinois.
On August 30, 2002, a World Trade Organization (WTO) arbitration panel determined that the European Union (EU) may impose up to $4.04 billion per year in retaliatory tariffs if the U.S. tax code is not brought into compliance with an August 2001 WTO decision that found the extraterritorial tax (ETI) provisions of the FSC Repeal and Extraterritorial Income Exclusion Act of 2000 constitute an export subsidy prohibited by the WTO Agreement on Subsidies and Countervailing Measures. Since August 2002, the EU has developed a list of U.S. origin products on which the EU could impose tariffs as high as 100 percent of the value of the product. Negotiations among EU Member States, the European Commission and the private sector over which products would be listed were intense. The EU finalized the list in December 2003 and stated that in March 2004 it will begin imposing retaliatory tariffs of 5 percent on certain U.S. origin goods. If imposed, the tariffs would increase 1 percentage point per month to a maximum of 17 percent after one year. The gradual increase in tariffs is designed to place increasing pressure on the U.S. government to bring its tax laws into compliance with its WTO obligations. Given the makeup of the final retaliation list, some Caterpillar parts and components will be subjected to these additional tariffs. Based on what we know today, we do not believe these tariffs will materially impact our financial results. The company has production facilities in the EU, Russia, Asia and South America that would not be affected by a retaliatory tariff aimed at U.S. origin products. When the EU implements its proposed tariffs, increased pressure will be placed on Congress to repeal ETI, possibly during the current session. It is not possible to predict how the U.S. legislative process will affect the company's 2004 income tax liability, but based on what we know today, we do not believe the impact, if any, will be material.
A-48
POSTRETIREMENT BENEFITS
In 2003 we recognized a net pension expense of $126 million compared with a benefit of $73 million in 2002. The increase in expense was primarily a result of the impact of lower plan assets due to previous poor performance of the equity market, lower long-term return assumptions on pension plan assets and a lower assumed discount rate. SFAS 87, "Employers' Accounting for Pensions" requires companies to use an expected long-term rate of return for computing current year pension expense. Differences between the actual and expected returns are amortized into future earnings as actuarial gains and losses. At the end of 2003, unrecognized actuarial losses of $3.20 billion primarily reflect a declining discount rate and lower than expected returns on our pension plan assets.
Other postretirement benefit expense was $269 million in 2003, up $29 million from 2002. The increase in expense is the result of inflation on health care costs, a lower long-term return assumption on plan assets and a lower assumed discount rate. The increase in expense was partially offset by changes to our U.S. benefit plans implemented during the second quarter of 2002 (full year of benefit recognition in 2003 versus eight months in 2002). The plan changes included an increase in retiree cost sharing of health care benefits, elimination of company payments for Medicare part B premiums and significant reductions in retiree life insurance. In total, these changes lowered our existing benefit obligation by approximately $475 million, which will be amortized into earnings over seven years (the average remaining service period of employees affected by the plan changes) or $68 million per year. In addition to this amortization, our ongoing annual expense will decrease approximately $45 million from the plan changes. A benefit of $112 million reflecting the full year impact of the plan changes was recognized in 2003 versus a benefit of $75 million in 2002. Unrecognized actuarial losses for other postretirement plans were $1.38 billion at the end of 2003. These losses reflect a declining discount rate, higher than expected benefit costs, lower than expected plan asset returns and an increase in expected health care inflation.
The unrecognized actuarial losses for both pensions and other postretirement benefits will be impacted in future periods by actual asset returns, actual health care inflation, discount rate changes and other factors that impact these expenses. If actual experience is as assumed, we will be required to recognize significant actuarial losses in future periods as a result of declining interest rates, previous equity market performance and health care inflation. These losses will be amortized on a straight-line basis over the remaining service period of active employees expected to receive benefits under the benefit plans.
SFAS 87 requires the recognition of an Additional Minimum Liability if the market value of plan assets is less than the accumulated benefit obligation as of the measurement date. Based on these values, the company increased the Additional Minimum Liability by $206 million in the fourth quarter of 2003. This resulted in a decrease in Accumulated Other Comprehensive Income (a component of Shareholder's Equity on the Statement of Financial Position) of $163 million after tax. During 2003, the company made cash contributions of $644 million to its U.S. defined benefit pension plans, which make up approximately 85 percent of the company's total pension liability. The company continues to have adequate liquidity resources to fund plans, as it deems necessary. Future changes to the Additional Minimum Liability will be dependent on several factors including actual returns on our pension plan assets, company contributions, benefit plan changes and our assumed discount rate.
Although we have no ERISA funding requirements in 2004, we currently expect to make about $500 million of voluntary contributions to fund our U.S. pension plans. We also currently expect to make $90 million of contributions to certain non-U.S. pension plans during 2004. We have adequate liquidity resources to fund both U.S. and non-U.S. plans.
Actuarial assumptions have a significant impact on both pension and other postretirement benefit expenses. The effects of a one-percentage point change in our primary actuarial assumptions on 2003 benefit costs and year-end obligations is included in the table below.
Postretirement Benefit Plan Actuarial Assumptions Sensitivity
Following are the effects of a one percentage-point change in our primary pension and other postretirement benefit actuarial assumptions (included in the following table) on 2003 pension and other postretirement benefits costs and obligations:
| | 2003 Benefit Cost | Year-end Benefit Obligation | ||||||||||||
|---|---|---|---|---|---|---|---|---|---|---|---|---|---|---|
| | One percentage- point increase | One percentage- point decrease | One percentage- point increase | One percentage- point decrease | ||||||||||
| | (Millions of dollars) | |||||||||||||
| Pension benefits: | ||||||||||||||
| Assumed discount rate | $ | (53 | ) | $ | 88 | $ | (1,207 | ) | $ | 1,388 | ||||
| Expected rate of compensation increase | 41 | (37 | ) | 219 | (211 | ) | ||||||||
| Expected long-term rate of return on plan assets | (86 | ) | 86 | — | — | |||||||||
| Other postretirement benefits: | ||||||||||||||
| Assumed discount rate | (17 | ) | 39 | (429 | ) | 471 | ||||||||
| Expected rate of compensation increase | 1 | (1 | ) | 3 | (3 | ) | ||||||||
| Expected long-term rate of return on plan assets | (10 | ) | 10 | — | — | |||||||||
| Assumed health care cost trend rate | 45 | (36 | ) | 242 | (217 | ) | ||||||||
A-49
Primary Actuarial Assumptions
| | U.S. Pension Benefits | Non-U.S. Pension Benefits | Other Postretirement Benefits | |||||||||||||||||
|---|---|---|---|---|---|---|---|---|---|---|---|---|---|---|---|---|---|---|---|---|
| | 2003 | 2002 | 2001 | 2003 | 2002 | 2001 | 2003 | 2002 | 2001 | |||||||||||
| Weighted-average assumptions used to determine benefit obligations, end of year: | ||||||||||||||||||||
| Discount rate | 6.2 | % | 7.0 | % | 7.3 | % | 5.1 | % | 5.4 | % | 5.7 | % | 6.1 | % | 7.0 | % | 7.2 | % | ||
| Rate of compensation increase | 4.0 | % | 4.0 | % | 4.0 | % | 3.2 | % | 3.3 | % | 3.3 | % | 4.0 | % | 4.0 | % | 4.0 | % | ||
Weighted-average assumptions used todetermine net cost: | ||||||||||||||||||||
| Discount rate | 7.0 | % | 7.3 | % | 7.8 | % | 5.4 | % | 5.7 | % | 5.9 | % | 7.0 | % | 7.2 | % | 7.8 | % | ||
| Expected return on plan assets | 9.0 | % | 9.8 | % | 10.0 | % | 7.1 | % | 7.6 | % | 7.6 | % | 9.0 | % | 9.8 | % | 10.0 | % | ||
| Rate of compensation increase | 4.0 | % | 4.0 | % | 4.0 | % | 3.3 | % | 3.3 | % | 3.7 | % | 4.0 | % | 4.0 | % | 4.0 | % | ||
Health care cost trend rates at year end: | ||||||||||||||||||||
| Health care trend rate assumed for next year | 8.5 | % | 9.0 | % | 11.0 | % | ||||||||||||||
| Rate that the cost trend rate gradually declines to | 4.5 | % | 4.5 | % | 4.5 | % | ||||||||||||||
| Year that the cost trend rate reaches ultimate rate | 2009 | 2009 | 2009 | |||||||||||||||||
SENSITIVITY
Foreign Exchange Rate Sensitivity
Based on the anticipated and firmly committed cash inflow and outflow for our Machinery and Engines operations for the next 12 months and the foreign currency derivative instruments in place at year end, a hypothetical 10 percent weakening of the U.S. dollar relative to all other currencies would adversely affect our expected 2004 cash flow for our Machinery and Engines operations by $9 million. Last year, similar assumptions and calculations yielded a potential $39 million adverse impact on 2003 cash flow. We determine our net exposures by calculating the difference in cash inflow and outflow by currency and adding or subtracting outstanding foreign currency derivative instruments. We multiply these net amounts by 10 percent to determine the sensitivity.
Since our policy for Financial Products operations is to hedge the foreign exchange risk when the currency of our debt portfolio does not match the currency of our receivable portfolio, a 10 percent change in the value of the U.S. dollar relative to all other currencies would not have a material effect on our consolidated financial position, results of operations or cash flow. Neither our policy nor the effect of a 10 percent change in the value of the U.S. dollar has changed from that reported at the end of last year.
The effect of the hypothetical change in exchange rates ignores the effect this movement may have on other variables, including competitive risk. If it were possible to quantify this competitive impact, the results would probably be different from the sensitivity effects shown above. In addition, it is unlikely that all currencies would uniformly strengthen or weaken relative to the U.S. dollar. In reality, some currencies may weaken while others may strengthen.
Interest Rate Sensitivity
For our Machinery and Engines operations, we have the option to use interest rate swaps to lower the cost of borrowed funds by attaching fixed-to-floating interest rate swaps to fixed-rate debt. However, we currently do not have any interest rate swaps. A hypothetical 100 basis point adverse move (increase) in interest rates along the entire interest rate yield curve would adversely affect 2004 pretax earnings of Machinery and Engines by $4 million. Last year, similar assumptions and calculations yielded a potential $2 million adverse impact on 2003 pretax earnings. This effect is caused by the interest rate fluctuations on our short-term debt.
For our Financial Products operations, we use interest rate derivative instruments primarily to meet our match funding objectives and strategies. A hypothetical 100 basis point adverse move (increase) in interest rates along the entire interest rate yield curve would adversely affect the 2004 pretax earnings of Financial Products by $18 million. Last year, similar assumptions and calculations yielded a potential $15 million adverse impact on 2003 pretax earnings. To estimate the impact of interest rate sensitivity on our income, we compute the difference in baseline and sensitized interest expense over the next 12 months. We determine the baseline interest expense by applying a market interest rate to the unmatched portion of our debt portfolio. The unmatched portion of our debt is an estimate of fixed-rate assets funded by floating-rate liabilities. We incorporate the effects of interest rate swap agreements in the estimate of our unmatched debt. We determine the sensitized interest expense by adding 100 basis points to the market interest rate applied to baseline interest expense and apply this rate to the unmatched debt. Our analysis assumes no new fixed-rate assets were extended and no further action was taken to alter our current interest rate sensitivity.
The effect of the hypothetical change in interest rates ignores the effect this movement may have on other variables including changes in actual sales volumes that could be indirectly attributed to changes in interest rates. The actions that management would take in response to such a change are also ignored. If it were possible to quantify this impact, the results could be different than the sensitivity effects shown above.
A-50
SUPPLEMENTAL CONSOLIDATING DATA
We are providing supplemental consolidating data for the purpose of additional analysis. The data has been grouped as follows:
Consolidated—Caterpillar Inc. and its subsidiaries.
Machinery and Engines—The Machinery and Engines data contained in the schedules on pages A-51 to A-53 are "non-GAAP financial measures" as defined by the Securities and Exchange Commission in Regulation G. These non-GAAP financial measures have no standardized meaning prescribed by U.S. GAAP, and therefore, are unlikely to be comparable with the calculation of similar measures for other companies. Management does not intend these items to be considered in isolation or as a substitute for the related GAAP measures. Caterpillar defines Machinery and Engines as it is presented in the supplemental data as Caterpillar Inc. and its subsidiaries with Financial Products accounted for on the equity basis. Machinery and Engines information relates to our design, manufacturing, marketing and parts distribution operations. Financial Products information relates to the financing to customers and dealers for the purchase and lease of Caterpillar and other equipment. The nature of these businesses is different especially with regard to the financial position and cash flow items. Caterpillar management utilizes this presentation internally to highlight these differences. We also believe this presentation will assist readers in understanding our business.
Financial Products—our finance and insurance subsidiaries, primarily Cat Financial and Cat Insurance.
Consolidating Adjustments—eliminations of transactions between Machinery and Engines and Financial Products.
Pages A-51 to A-53 reconcile Machinery and Engines with Financial Products on the Equity Basis to Caterpillar Inc. Consolidated financial information.
Supplemental Data for Results of Operations
For The Years Ended December 31
(Millions of dollars)
| | | | | Supplemental consolidating data | |||||||||||||||||||||||||||||||||||
|---|---|---|---|---|---|---|---|---|---|---|---|---|---|---|---|---|---|---|---|---|---|---|---|---|---|---|---|---|---|---|---|---|---|---|---|---|---|---|---|
| | Consolidated | Machinery and Engines(1) | Financial Products | Consolidating Adjustments | |||||||||||||||||||||||||||||||||||
| | 2003 | 2002 | 2001 | 2003 | 2002 | 2001 | 2003 | 2002 | 2001 | 2003 | 2002 | 2001 | |||||||||||||||||||||||||||
| Sales and revenues: | |||||||||||||||||||||||||||||||||||||||
| Sales of Machinery and Engines | $ | 21,048 | $ | 18,648 | $ | 19,027 | $ | 21,048 | $ | 18,648 | $ | 19,027 | $ | — | $ | — | $ | — | $ | — | $ | — | $ | — | |||||||||||||||
| Revenues of Financial Products | 1,715 | 1,504 | 1,423 | — | — | — | 1,895 | 1,678 | 1,645 | (180 | )(2) | (174 | )(2) | (222 | )(2) | ||||||||||||||||||||||||
| Total sales and revenues | 22,763 | 20,152 | 20,450 | 21,048 | 18,648 | 19,027 | 1,895 | 1,678 | 1,645 | (180 | ) | (174 | ) | (222 | ) | ||||||||||||||||||||||||
Operating costs: | |||||||||||||||||||||||||||||||||||||||
| Cost of goods sold | 16,945 | 15,146 | 15,179 | 16,945 | 15,146 | 15,179 | — | — | — | — | — | — | |||||||||||||||||||||||||||
| Selling, general and administrative expenses | 2,470 | 2,094 | 2,140 | 2,009 | 1,739 | 1,802 | 538 | 430 | 389 | (77 | )(3) | (75 | )(3) | (51 | )(3) | ||||||||||||||||||||||||
| Research and development expenses | 669 | 656 | 696 | 669 | 656 | 696 | — | — | — | — | — | — | |||||||||||||||||||||||||||
| Interest expense of Financial Products | 470 | 521 | 657 | — | — | — | 482 | 538 | 685 | (12 | )(4) | (17 | )(4) | (28 | )(4) | ||||||||||||||||||||||||
| Other operating expenses | 521 | 411 | 467 | (9 | ) | (15 | ) | 143 | 530 | 426 | 324 | — | — | — | |||||||||||||||||||||||||
| Total operating costs | 21,075 | 18,828 | 19,139 | 19,614 | 17,526 | 17,820 | 1,550 | 1,394 | 1,398 | (89 | ) | (92 | ) | (79 | ) | ||||||||||||||||||||||||
Operating profit | 1,688 | 1,324 | 1,311 | 1,434 | 1,122 | 1,207 | 345 | 284 | 247 | (91 | ) | (82 | ) | (143 | ) | ||||||||||||||||||||||||
Interest expense excluding Financial Products | 246 | 279 | 285 | 259 | 279 | 285 | — | — | — | (13 | ) | — | — | ||||||||||||||||||||||||||
| Other income (expense) | 35 | 69 | 143 | (69 | ) | (16 | ) | (98 | ) | 26 | 3 | 98 | 78 | (5) | 82 | (5) | 143 | (5) | |||||||||||||||||||||
| Consolidated profit before taxes | 1,477 | 1,114 | 1,169 | 1,106 | 827 | 824 | 371 | 287 | 345 | — | — | — | |||||||||||||||||||||||||||
| Provision for income taxes | 398 | 312 | 367 | 286 | 204 | 239 | 112 | 108 | 128 | — | — | — | |||||||||||||||||||||||||||
| Profit of consolidated companies | 1,079 | 802 | 802 | 820 | 623 | 585 | 259 | 179 | 217 | — | — | — | |||||||||||||||||||||||||||
| Equity in profit (loss) of unconsolidated affiliated companies | 20 | (4 | ) | 3 | 16 | (12 | ) | (4 | ) | 4 | 8 | 7 | — | — | — | ||||||||||||||||||||||||
| Equity in profit of Financial Products' subsidiaries | — | — | — | 263 | 187 | 224 | — | — | — | (263 | )(6) | (187 | )(6) | (224 | )(6) | ||||||||||||||||||||||||
| Profit | $ | 1,099 | $ | 798 | $ | 805 | $ | 1,099 | $ | 798 | $ | 805 | $ | 263 | $ | 187 | $ | 224 | $ | (263 | ) | $ | (187 | ) | $ | (224 | ) | ||||||||||||
- (1)
- Represents Caterpillar Inc. and its subsidiaries with Financial Products accounted for on the equity basis.
- (2)
- Elimination of Financial Products revenues earned from Machinery and Engines.
- (3)
- Elimination of expenses recorded by Machinery and Engines paid to Financial Products.
- (4)
- Elimination of interest expense recorded between Financial Products and Machinery and Engines.
- (5)
- Elimination of discount recorded by Machinery and Engines on receivables sold to Financial Products and of interest earned by Machinery and Engines from Financial Products.
- (6)
- Elimination of Financial Products profit for the period reported by Machinery and Engines on the equity basis.
A-51
Supplemental Data for Financial Position
At December 31
(Millions of dollars)
| | | | Supplemental consolidating data | ||||||||||||||||||||||||
|---|---|---|---|---|---|---|---|---|---|---|---|---|---|---|---|---|---|---|---|---|---|---|---|---|---|---|---|
| | Consolidated | Machinery and Engines(1) | Financial Products | Consolidating Adjustments | |||||||||||||||||||||||
| | 2003 | 2002 | 2003 | 2002 | 2003 | 2002 | 2003 | 2002 | |||||||||||||||||||
| Assets | |||||||||||||||||||||||||||
| Current assets: | |||||||||||||||||||||||||||
| Cash and short-term investments | $ | 342 | $ | 309 | $ | 220 | $ | 146 | $ | 122 | $ | 163 | $ | — | $ | — | |||||||||||
| Receivables—trade and other | 3,666 | 2,838 | 2,993 | 2,712 | 1,642 | 1,386 | (969 | )(2) | (1,260 | )(2) | |||||||||||||||||
| Receivables—finance | 7,605 | 6,748 | — | — | 7,605 | 6,748 | — | — | |||||||||||||||||||
| Deferred and refundable income taxes | 707 | 781 | 645 | 718 | 62 | 63 | — | — | |||||||||||||||||||
| Prepaid expenses | 1,424 | 1,224 | 1,403 | 1,252 | 27 | 7 | (6 | )(3) | (35 | )(3) | |||||||||||||||||
| Inventories | 3,047 | 2,763 | 3,047 | 2,763 | — | — | — | — | |||||||||||||||||||
| Total current assets | 16,791 | 14,663 | 8,308 | 7,591 | 9,458 | 8,367 | (975 | ) | (1,295 | ) | |||||||||||||||||
| Property, plant and equipment—net | 7,290 | 7,046 | 4,682 | 4,848 | 2,608 | 2,198 | — | — | |||||||||||||||||||
| Long-term receivables—trade and other | 82 | 66 | 81 | 66 | 1 | — | — | — | |||||||||||||||||||
| Long-term receivables—finance | 7,822 | 6,714 | — | — | 7,822 | 6,714 | — | — | |||||||||||||||||||
| Investments in unconsolidated affiliated companies | 800 | 747 | 426 | 398 | 374 | 349 | — | — | |||||||||||||||||||
| Investments in Financial Products subsidiaries | — | — | 2,547 | 1,961 | — | — | (2,547 | )(4) | (1,961 | )(4) | |||||||||||||||||
| Deferred income taxes | 616 | 711 | 819 | 832 | 19 | 12 | (222 | )(5) | (133 | )(5) | |||||||||||||||||
| Intangible assets | 239 | 281 | 230 | 277 | 9 | 4 | — | — | |||||||||||||||||||
| Goodwill | 1,398 | 1,402 | 1,398 | 1,402 | — | — | — | — | |||||||||||||||||||
| Other assets | 1,427 | 1,117 | 719 | 614 | 708 | 503 | — | — | |||||||||||||||||||
| Total assets | $ | 36,465 | $ | 32,747 | $ | 19,210 | $ | 17,989 | $ | 20,999 | $ | 18,147 | $ | (3,744 | ) | $ | (3,389 | ) | |||||||||
| Liabilities | |||||||||||||||||||||||||||
| Current liabilities: | |||||||||||||||||||||||||||
| Short-term borrowings | $ | 2,757 | $ | 2,175 | $ | 72 | $ | 64 | $ | 3,160 | $ | 2,906 | $ | (475 | )(6) | $ | (795 | )(6) | |||||||||
| Accounts payable | 3,100 | 2,269 | 3,078 | 2,334 | 243 | 151 | (221 | )(7) | (216 | )(7) | |||||||||||||||||
| Accrued expenses | 1,638 | 1,620 | 857 | 840 | 802 | 806 | (21 | )(8) | (26 | )(8) | |||||||||||||||||
| Accrued wages, salaries and employee benefits | 1,802 | 1,779 | 1,788 | 1,762 | 14 | 17 | — | — | |||||||||||||||||||
| Dividends payable | 127 | 120 | 127 | 120 | — | — | — | — | |||||||||||||||||||
| Deferred and current income taxes payable | 216 | 70 | 166 | 35 | 50 | 35 | — | — | |||||||||||||||||||
| Deferred liability | — | — | — | — | 259 | 259 | (259 | )(9) | (259 | )(9) | |||||||||||||||||
| Long-term debt due within one year | 2,981 | 3,912 | 32 | 258 | 2,949 | 3,654 | — | — | |||||||||||||||||||
| Total current liabilities | 12,621 | 11,945 | 6,120 | 5,413 | 7,477 | 7,828 | (976 | ) | (1,296 | ) | |||||||||||||||||
| Long-term debt due after one year | 14,078 | 11,596 | 3,367 | 3,403 | 10,711 | 8,193 | — | — | |||||||||||||||||||
| Liability for postemployment benefits | 3,172 | 3,333 | 3,172 | 3,333 | — | — | — | — | |||||||||||||||||||
| Deferred income taxes and other liabilities | 516 | 401 | 473 | 368 | 264 | 165 | (221 | )(5) | (132 | )(5) | |||||||||||||||||
| Total liabilities | 30,387 | 27,275 | 13,132 | 12,517 | 18,452 | 16,186 | (1,197 | ) | (1,428 | ) | |||||||||||||||||
| Contingencies | |||||||||||||||||||||||||||
| Stockholders' equity | |||||||||||||||||||||||||||
| Common stock | 1,059 | 1,034 | 1,059 | 1,034 | 890 | 837 | (890 | )(4) | (837 | )(4) | |||||||||||||||||
| Treasury stock | (2,914 | ) | (2,669 | ) | (2,914 | ) | (2,669 | ) | — | — | — | — | |||||||||||||||
| Profit employed in the business | 8,450 | 7,849 | 8,450 | 7,849 | 1,495 | 1,232 | (1,495 | )(4) | (1,232 | )(4) | |||||||||||||||||
| Accumulated other comprehensive income | (517 | ) | (742 | ) | (517 | ) | (742 | ) | 162 | (108 | ) | (162 | )(4) | 108 | (4) | ||||||||||||
| Total stockholders' equity | 6,078 | 5,472 | 6,078 | 5,472 | 2,547 | 1,961 | (2,547 | ) | (1,961 | ) | |||||||||||||||||
| Total liabilities and stockholders' equity | $ | 36,465 | $ | 32,747 | $ | 19,210 | $ | 17,989 | $ | 20,999 | $ | 18,147 | $ | (3,744 | ) | $ | (3,389 | ) | |||||||||
- (1)
- Represents Caterpillar Inc. and its subsidiaries withFinancial Products accounted for on the equity basis.
- (2)
- Elimination of receivables betweenMachinery and Engines andFinancial Products.
- (3)
- Elimination ofMachinery and Engines insurance premiums which are prepaid toFinancial Products.
- (4)
- Elimination ofFinancial Products equity which is accounted for byMachinery and Engines on the equity basis.
- (5)
- Reclassification ofFinancial Products deferred tax liability to a deferred tax asset on a consolidated basis.
- (6)
- Elimination ofFinancial Products short-term borrowings fromMachinery and Engines.
- (7)
- Elimination of payables betweenMachinery and Engines andFinancial Products.
- (8)
- Elimination of prepaid insurance inFinancial Products' accrued expenses.
- (9)
- Elimination ofFinancial Products deferred liabilities withMachinery and Engines.
A-52
Supplemental Data for Statement of Cash Flow
For The Years Ended December 31
(Millions of dollars)
| | | | Supplemental consolidating data | ||||||||||||||||||||||||
|---|---|---|---|---|---|---|---|---|---|---|---|---|---|---|---|---|---|---|---|---|---|---|---|---|---|---|---|
| | Consolidated | Machinery and Engines(1) | Financial Products | Consolidating Adjustments | |||||||||||||||||||||||
| | 2003 | 2002 | 2003 | 2002 | 2003 | 2002 | 2003 | 2002 | |||||||||||||||||||
| Cash flow from operating activities: | |||||||||||||||||||||||||||
| Profit | $ | 1,099 | $ | 798 | $ | 1,099 | $ | 798 | $ | 263 | $ | 187 | $ | (263 | )(2) | $ | (187 | )(2) | |||||||||
| Adjustments for non-cash items: | |||||||||||||||||||||||||||
| Depreciation and amortization | 1,347 | 1,220 | 798 | 785 | 549 | 435 | — | — | |||||||||||||||||||
| Undistributed profit of Financial Products | — | — | (263 | ) | (187 | ) | — | — | 263 | (3) | 187 | (3) | |||||||||||||||
| Charges | — | — | — | — | — | — | — | — | |||||||||||||||||||
| Other | (15 | ) | 363 | (12 | ) | 251 | 20 | 98 | (23 | )(4) | 14 | (4) | |||||||||||||||
| Changes in assets and liabilities: | |||||||||||||||||||||||||||
| Receivables—trade and other | (521 | ) | (50 | ) | (376 | ) | 125 | (250 | ) | (138 | ) | 105 | (4) | (37 | )(4) | ||||||||||||
| Inventories | (286 | ) | 162 | (286 | ) | 162 | — | — | — | — | |||||||||||||||||
| Accounts payable and accrued expenses | 617 | 164 | 674 | 114 | (4 | ) | 25 | (53 | )(4) | 25 | (4) | ||||||||||||||||
| Other—net | (175 | ) | (291 | ) | (207 | ) | (352 | ) | 61 | 42 | (29 | )(4) | 19 | (4) | |||||||||||||
| Net cash provided by operating activities | 2,066 | 2,366 | 1,427 | 1,696 | 639 | 649 | — | 21 | |||||||||||||||||||
| Cash flow from investing activities: | |||||||||||||||||||||||||||
| Capital expenditures—excluding equipment leased to others | (682 | ) | (728 | ) | (654 | ) | (693 | ) | (28 | ) | (35 | ) | — | — | |||||||||||||
| Expenditures for equipment leased to others | (1,083 | ) | (1,045 | ) | (10 | ) | (5 | ) | (1,073 | ) | (1,040 | ) | — | — | |||||||||||||
| Proceeds from disposals of property, plant and equipment | 761 | 561 | 133 | 88 | 628 | 473 | — | — | |||||||||||||||||||
| Additions to finance receivables | (17,146 | ) | (15,338 | ) | — | — | (17,146 | ) | (15,338 | ) | — | — | |||||||||||||||
| Collections of finance receivables | 13,882 | 11,866 | — | — | 13,882 | 11,866 | — | — | |||||||||||||||||||
| Proceeds from sale of finance receivables | 1,760 | 2,310 | — | — | 1,760 | 2,310 | — | — | |||||||||||||||||||
| Net intercompany borrowings | — | — | 376 | (571 | ) | 53 | 14 | (429 | )(5) | 557 | (5) | ||||||||||||||||
| Investments and acquisitions | (36 | ) | (294 | ) | (18 | ) | (24 | ) | (18 | ) | (270 | ) | — | — | |||||||||||||
| Other—net | (17 | ) | (40 | ) | (23 | ) | (14 | ) | (47 | ) | (62 | ) | 53 | (6) | 36 | (6) | |||||||||||
| Net cash used for investing activities | (2,561 | ) | (2,708 | ) | (196 | ) | (1,219 | ) | (1,989 | ) | (2,082 | ) | (376 | ) | 593 | ||||||||||||
| Cash flow from financing activities: | |||||||||||||||||||||||||||
| Dividends paid | (491 | ) | (481 | ) | (491 | ) | (481 | ) | — | — | — | — | |||||||||||||||
| Common stock issued, including treasury shares reissued | 157 | 10 | 157 | 10 | 53 | 36 | (53 | )(6) | (36 | )(6) | |||||||||||||||||
| Treasury shares purchased | (405 | ) | — | (405 | ) | — | — | — | — | — | |||||||||||||||||
| Net intercompany borrowings | — | — | (53 | ) | (14 | ) | (376 | ) | 571 | 429 | (5) | (557 | )(5) | ||||||||||||||
| Proceeds from long-term debt issued | 5,402 | 4,137 | 128 | 248 | 5,274 | 3,889 | — | — | |||||||||||||||||||
| Payments on long-term debt | (4,237 | ) | (3,339 | ) | (463 | ) | (225 | ) | (3,774 | ) | (3,114 | ) | — | — | |||||||||||||
| Short-term borrowings—net | 87 | (102 | ) | (37 | ) | (155 | ) | 124 | 53 | — | — | ||||||||||||||||
| Net cash provided by (used for) financing activities | 513 | 225 | (1,164 | ) | (617 | ) | 1,301 | 1,435 | 376 | (593 | ) | ||||||||||||||||
| Effect of exchange rate changes on cash | 15 | 26 | 7 | 35 | 8 | 12 | — | (7) | (21 | )(7) | |||||||||||||||||
| Increase (decrease) in cash and short-term investments | 33 | (91 | ) | 74 | (105 | ) | (41 | ) | 14 | — | — | ||||||||||||||||
| Cash and short-term investments at beginning of period | 309 | 400 | 146 | 251 | 163 | 149 | — | — | |||||||||||||||||||
| Cash and short-term investments at end of period | $ | 342 | $ | 309 | $ | 220 | $ | 146 | $ | 122 | $ | 163 | $ | — | $ | — | |||||||||||
- (1)
- Represents Caterpillar Inc. and its subsidiaries withFinancial Products accounted for on the equity basis.
- (2)
- Elimination ofFinancial Products profit after tax due to equity method of consolidation.
- (3)
- Non-cash adjustment for the undistributed earnings fromFinancial Products.
- (4)
- Elimination of non-cash adjustments and changes in assets and liabilities related to consolidated reporting.
- (5)
- Net proceeds and payments to/fromMachinery and Engines andFinancial Products.
- (6)
- Change in investment and common stock related toFinancial Products.
- (7)
- Elimination of the effect of exchange on intercompany balances.
A-53
SALES AND REVENUES OUTLOOK
For the year 2004, we project company sales and revenues will increase about 12 percent compared to 2003. Machinery and Engines volume is expected to increase about 10 percent with the remainder coming from Financial Products revenues and improved price realization.
A worldwide economic recovery is now underway and we expect further strengthening in 2004. Global economic growth should exceed 3.5 percent in 2004, or about 1 percentage point higher than in 2003.
Record, or near-record, low interest rates initiated economic recoveries in 2003 and we expect interest rates will remain low throughout 2004. Most economies have considerable excess capacity, and inflation is generally within central bank targets. We expect that central bankers will be cautious about taking any actions that could jeopardize recoveries.
This environment should further benefit our businesses. Low interest rates and rising profits are expected to continue to encourage users to replace existing equipment. Low interest rates should also allow another strong year for housing construction. Nonresidential construction, which tends to parallel overall economic growth, should continue to improve. Metals mining had only a scattered recovery in 2003, but we expect that recent increases in metals prices will cause this industry's recovery to strengthen and broaden in 2004.
North America (United States and Canada)
The U.S. economy ended 2003 on a strong note and the continuation of low interest rates in 2004 should ensure a very good year for the economy. We project U.S. growth of at least 4.5 percent and the Canadian economy should rebound from 2003's slowdown, growing more than 3 percent in 2004.
We estimate that Machinery and Engines sales will increase about 18 percent in 2004. Continued low interest rates should allow further growth in construction and higher coal and metals prices should trigger substantial recoveries in mining. Petroleum and natural gas sales should continue to benefit from favorable energy prices.
EAME
European economies recovered slowly in the last half of 2003 and current low interest rates should allow further strengthening. We expect the European economies to grow 2 percent in 2004, fast enough to allow some improvement in construction activity. Favorable energy prices, plus much higher commodity prices, should result in another year of good economic growth in both Africa/Middle East and the CIS.
We estimate that Machinery and Engines sales in EAME will rise about 6 percent in 2004. Higher volume should account for about 5 percent of the increase while the ongoing favorable impact of the strong euro and improved price realization are expected to contribute the remaining 1 percent increase in sales.
Latin America
We expect economic growth will improve to about 3.5 percent in 2004 compared to 1.5 percent experienced in 2003. The region should benefit from the worldwide economic recovery and reductions in local interest rates. Foreign direct investment is also expected to recover in 2004. As a result of stronger economies, we project that sales of Machinery and Engines will be up about 5 percent in 2004.
Asia/Pacific
This region is expected to again lead the world in economic growth, improving to over 6 percent in 2004. China's booming economy should slow a bit in response to modest tightening in economic policies. This is expected to be more than offset by better growth in most other countries. Despite rising trade frictions targeted at the region, most countries should be able to increase exports as a result of faster world economic growth.
We expect sales of Machinery and Engines to increase around 7 percent in 2004. Strong domestic economies and low local interest rates are expected to boost construction and the region's sizable mining sector should benefit from higher commodity prices.
Financial Products
We expect growth in Financial Products for 2004, with revenues expected to increase approximately 10 percent versus 2003 primarily due to higher average earning assets in 2004 (beginning earning assets and new financing activity will both be higher in 2004 versus 2003). New financing activity growth is primarily due to expected improvement in Machinery and Engines sales and other growth initiatives.
PROFIT OUTLOOK
We expect 2004 profit per share to be up about 40 percent compared to 2003. The year will benefit from higher volume and the favorable impact of our ACERT technology. We anticipate an increase in retirement benefits of about $250 million, which we expect to offset with improved price realization and lower core operating costs.
* * *
The information included in the Outlook section is forward looking and involves risks and uncertainties that could significantly affect expected results. A discussion of these risks and uncertainties is contained in Form 8-K filed with the Securities & Exchange Commission (SEC) on January 27, 2004.
A-54
SUPPLEMENTAL STOCKHOLDER INFORMATION
Shareholder Services:
| Stock Transfer Agent | |||||
| Mellon Investor Services P.O. Box 3315 South Hackensack, NJ 07606-3315 | |||||
| phone: | (866) 203-6622 (U.S. and Canada) | ||||
| (201) 329-8660 (Outside U.S. and Canada) | |||||
| hearing impaired: | |||||
| (800) 231-5469 (U.S. and Canada) | |||||
| (201) 329-8354 (Outside U.S. and Canada) | |||||
| Internet home page: www.melloninvestor.com | |||||
Caterpillar Assistant Secretary | |||||
| Laurie J. Huxtable Assistant Secretary Caterpillar Inc. 100 N.E. Adams Street Peoria, IL 61629-7310 | |||||
| phone: | (309) 675-4619 | ||||
| fax: | (309) 675-6620 | ||||
| e-mail: | CATshareservices@CAT.com | ||||
Stock Purchase Plan:
Current shareholders and other interested investors may purchase Caterpillar Inc. common stock directly through the Investor Services Program sponsored and administered by our Stock Transfer Agent. Current shareholders can get more information on the program from our Stock Transfer Agent using the contact information provided above. Non-shareholders can request program materials by calling: (800) 842-7629 (United States and Canada) or (201) 329-8660 (outside the United States and Canada). The Investor Services Program materials are available on-line from Mellon's website or linked from www.CAT.com/dspp.
Investor Relations:
Institutional analysts, portfolio managers, and representatives of financial institutions seeking additional information about the Company should contact:
Director of Investor Relations
Nancy L. Snowden
Caterpillar Inc.
100 N.E. Adams Street, Peoria, IL 61629-5310
phone: (309) 675-4549
fax: (309) 675-4457
e-mail:CATir@CAT.com
Internet website: www.CAT.com/investor
Common Stock (NYSE: CAT)
Listing Information: Caterpillar common stock is listed on the New York, Pacific and Chicago stock exchanges in the United States, and on stock exchanges in Belgium, France, Germany, Great Britain and Switzerland.
Price Ranges: Quarterly price ranges of Caterpillar common stock on the New York Stock Exchange, the principal market in which the stock is traded, were:
| | 2003 | 2002 | ||||||||||
|---|---|---|---|---|---|---|---|---|---|---|---|---|
| Quarter | ||||||||||||
| High | Low | High | Low | |||||||||
| First | $ | 53.30 | $ | 41.24 | $ | 59.99 | $ | 46.75 | ||||
| Second | $ | 58.25 | $ | 48.98 | $ | 59.62 | $ | 45.90 | ||||
| Third | $ | 73.97 | $ | 53.10 | $ | 49.40 | $ | 36.33 | ||||
| Fourth | $ | 84.95 | $ | 68.90 | $ | 50.84 | $ | 33.75 | ||||
Number of Stockholders:Stockholders of record at year end totaled 38,440, compared with 38,200 at the end of 2002. Approximately 68.35% of our issued shares are held by institutions and banks, 23.97% by individuals, and 7.68% by Caterpillar benefit plans.
Employees' investment and profit-sharing plans acquired 2,052,151 shares of Caterpillar stock in 2003. Investment plans, for which membership is voluntary, held 23,106,120 shares for employee accounts at 2003 year end. Profit-sharing plans, in which membership is automatic for most U.S. and Canadian employees in eligible categories, held 424,417 shares at 2003 year end.
Company Information:
Current information:
- •
- phone our Information Hotline—(800) 228-7717 (United States and Canada) or (858) 244-2080 (outside United States and Canada) to request company publications by mail, listen to a summary of Caterpillar's latest financial results and current outlook, or to request a copy of results by fax or mail
- •
- request, view, or download materials on-line or register for email alerts by visiting www.CAT.com/materialsrequest
Historical information:
- •
- view/download on-line at www.CAT.com/historical
Annual Meeting:
On Wednesday, April 14, 2004, at 1:30 p.m., Central Time, the Annual Meeting of Stockholders will be held at the Northern Trust Building, Chicago, Illinois. Requests for proxies are being sent to stockholders with this report mailed on or about March 1, 2004.
Internet:
Visit us on the Internet at www.CAT.com.
Information contained on our website is not incorporated by reference into this document.
A-55
Directors/Committee Membership
(as of December 31, 2003)
| | Audit | Compensation | Governance | Public Policy | ||||
|---|---|---|---|---|---|---|---|---|
| Glen A. Barton(1) | ||||||||
| W. Frank Blount | X | X | ||||||
| John R. Brazil | X | X* | ||||||
| John T. Dillon | X | X* | ||||||
| Eugene V. Fife | X* | X | ||||||
| Gail D. Fosler | X | X | ||||||
| Juan Gallardo | X | X | ||||||
| David R. Goode | X | X | ||||||
| Peter A. Magowan | X | X | ||||||
| William A. Osborn | X* | X | ||||||
| James W. Owens(2) | ||||||||
| Gordon R. Parker | X | X | ||||||
| Charles D. Powell | X | X | ||||||
| Edward B. Rust, Jr. | X | X | ||||||
| Joshua I. Smith | X | X |
- *
- Chairman of Committee
| OFFICERS | ||
| Glen A. Barton(1) | Chairman and CEO | |
| James W. Owens(2) | Chairman and CEO | |
| Vito H. Baumgartner(1) | Group President | |
| Douglas R. Oberhelman | Group President | |
| Gerald L. Shaheen | Group President | |
| Richard L. Thompson | Group President | |
| Gérard R. Vittecoq(3) | Group President | |
| Steven H. Wunning(3) | Group President | |
| Ali M. Bahaj | Vice President | |
| Sidney C. Banwart | Vice President | |
| Michael J. Baunton | Vice President | |
| James S. Beard | Vice President | |
| Mary H. Bell(3) | Vice President | |
| Richard A. Benson | Vice President | |
| James B. Buda | Vice President, General Counsel and Secretary | |
| Rodney L. Bussell | Vice President | |
| Thomas A. Gales | Vice President | |
| Stephen A. Gosselin | Vice President | |
| Hans A. Haefeli(3) | Vice President | |
| Donald M. Ings | Vice President | |
| Richard P. Lavin | Vice President | |
| Stuart L. Levenick | Vice President | |
| Robert R. Macier | Vice President | |
| F. Lynn McPheeters | Vice President, Chief Financial Officer | |
| Daniel M. Murphy | Vice President | |
| Gerald Palmer | Vice President | |
| James J. Parker | Vice President | |
| Mark R. Pflederer(3) | Vice President | |
| Edward J. Rapp | Vice President | |
| Christiano V. Schena | Vice President | |
| William F. Springer | Vice President | |
| Gary A. Stroup | Vice President | |
| Sherril K. West(1) | Vice President | |
| Donald G. Western | Vice President | |
| David B. Burritt | Controller | |
| Kevin E. Colgan | Treasurer | |
| Robin D. Beran | Assistant Treasurer | |
| Tinkie E. Demmin | Assistant Secretary | |
| Laurie J. Huxtable | Assistant Secretary |
Note: All director/officer information is as of December 31, 2003, except as noted.
- (1)
- Retired effective January 31, 2004.
- (2)
- Effective January 31, 2004.
- (3)
- Effective January 1, 2004.
A-56