UNITED STATES SECURITIES AND EXCHANGE COMMISSION Washington, D.C. 20549 |
|
FORM 10-Q |
[X] QUARTERLY REPORT PURSUANT TO SECTION 13 OR 15(d) OF THE SECURITIES EXCHANGE ACT OF 1934 For the quarterly period ended September 30, 2005 OR [ ] TRANSITION REPORT PURSUANT TO SECTION 13 OR 15(d) OF THE SECURITIES EXCHANGE ACT OF 1934 For the transition period from ________________ to ________________ |
Commission File Number: 1-768 |
CATERPILLAR INC. (Exact name of registrant as specified in its charter) |
Delaware (State or other jurisdiction of incorporation) | 37-0602744 (IRS Employer I.D. No.) |
100 NE Adams Street, Peoria, Illinois (Address of principal executive offices) | 61629 (Zip Code) |
Registrant's telephone number, including area code: (309) 675-1000 |
Indicate by check mark whether the registrant is a shell company (as defined in Rule 12b-2 of the Exchange Act). [ ] Yes [ X ] No Indicate by check mark whether the Registrant (1) has filed all reports required to be filed by Section 13 or 15(d) of the Securities Exchange Act of 1934 during the preceding 12 months (or for such shorter period that the Registrant was required to file such reports), and (2) has been subject to such filing requirements for the past 90 days. Yes [ X ] No [ ]. Indicate by check mark whether the Registrant is an accelerated filer (as defined in Rule 12b-2 of the Act). Yes [ X ] No [ ] |
| At September 30, 2005, 680,208,493 shares of common stock of the Registrant were outstanding. |
Page 1
Part I. FINANCIAL INFORMATION
Item 1. Financial Statements
Caterpillar Inc. Consolidated Statement of Results of Operations (Unaudited) (Dollars in millions except per share data) |
| | Three Months Ended |
| | September 30, |
| | 2005 | | 2004 |
| |
| |
|
Sales and revenues: | | | | | | | |
| | Sales of Machinery and Engines | $ | 8,392 | | | $ | 7,175 | |
| | Revenues of Financial Products | | 585 | | | | 484 | |
| | |
|
|
| |
|
|
|
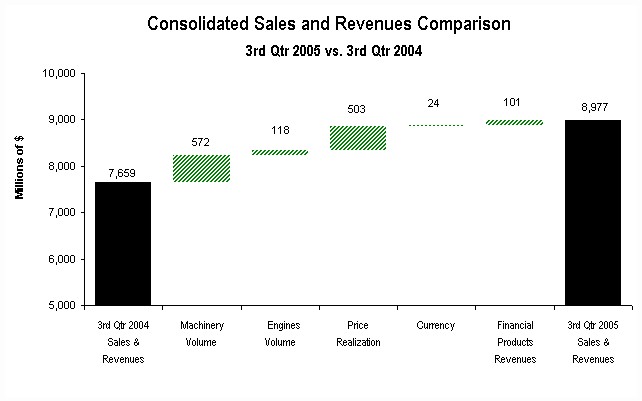
| | Total sales and revenues | | 8,977 | | | | 7,659 | |
| | | | | | | | | |
Operating costs: | | | | | | | |
| | Cost of goods sold | | 6,547 | | | | 5,745 | |
| | Selling, general and administrative expenses | | 775 | | | | 701 | |
| | Research and development expenses | | 285 | | | | 240 | |
| | Interest expense of Financial Products | | 197 | | | | 130 | |
| | Other operating expenses | | 233 | | | | 180 | |
| | |
|
|
| |
|
|
|
| | Total operating costs | | 8,037 | | | | 6,996 | |
| | |
|
|
| |
|
|
|
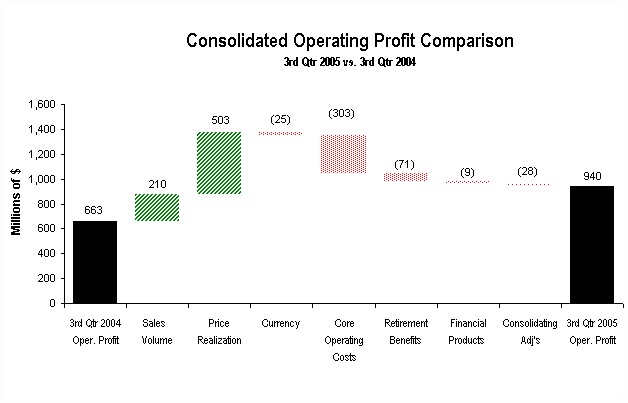
Operating profit | | 940 | | | | 663 | |
| | | | | | | | | |
| | Interest expense excluding Financial Products | | 68 | | | | 60 | |
| | Other income (expense) | | 80 | | | | 60 | |
| | |
|
|
| |
|
|
|
Consolidated profit before taxes | | 952 | | | | 663 | |
| | | | | | | | | |
| | Provision for income taxes | | 303 | | | | 182 | |
| | |
|
|
| |
|
|
|
| | Profit of consolidated companies | | 649 | | | | 481 | |
| | | | | | | | | |
| | Equity in profit (loss) of unconsolidated affiliated companies | | 18 | | | | 17 | |
| | |
|
|
| |
|
|
|
Profit | $ | 667 | | | $ | 498 | |
| |
|
|
| |
|
|
|
Profit per common share | $ | .98 | | | $ | .73 | |
| | | | | | | | | |
Profit per common share - diluted 1 | $ | .94 | | | $ | .70 | |
| | | | | | | | | |
Weighted average common shares outstanding (millions) | | | | | | | |
| | - Basic | | 678.8 | | | | 683.6 | |
| | - Diluted 1 | | 710.7 | | | | 706.0 | |
| | | | | | | | |
Cash dividends declared per common share | $ | - | | | $ | - | |
| | | | | | | | | |
| (1) Diluted by assumed exercise of stock options, using the treasury stock method. |
See accompanying notes to Consolidated Financial Statements. |
Caterpillar Inc. Consolidated Statement of Results of Operations (Unaudited) (Dollars in millions except per share data) |
| | Nine Months Ended |
| | September 30, |
| | 2005 | | 2004 |
| |
| |
|
Sales and revenues: | | | | | | | |
| | Sales of Machinery and Engines | $ | 24,965 | | | $ | 20,277 | |
| | Revenues of Financial Products | | 1,711 | | | | 1,445 | |
| | |
|
|
| |
|
|
|
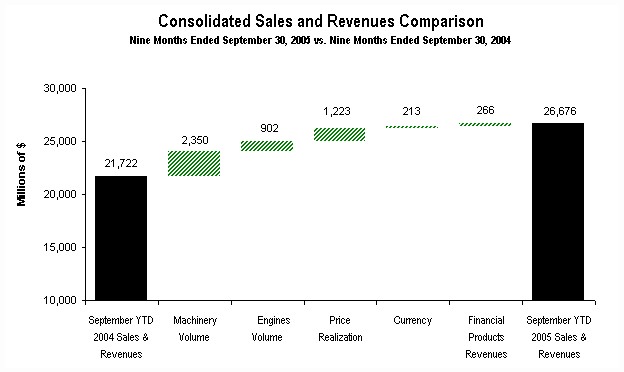
| | Total sales and revenues | | 26,676 | | | | 21,722 | |
| | | | | | | | | |
Operating costs: | | | | | | | |
| | Cost of goods sold | | 19,652 | | | | 16,009 | |
| | Selling, general and administrative expenses | | 2,308 | | | | 2,118 | |
| | Research and development expenses | | 794 | | | | 685 | |
| | Interest expense of Financial Products | | 551 | | | | 370 | |
| | Other operating expenses | | 654 | | | | 539 | |
| | |
|
|
| |
|
|
|
| | Total operating costs | | 23,959 | | | | 19,721 | |
| | |
|
|
| |
|
|
|
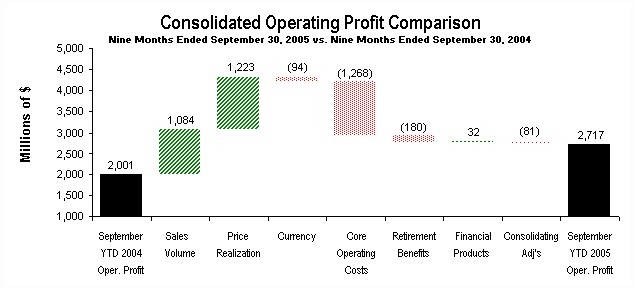
Operating profit | | 2,717 | | | | 2,001 | |
| | | | | | | | | |
| | Interest expense excluding Financial Products | | 198 | | | | 176 | |
| | Other income (expense) | | 278 | | | | 171 | |
| | |
|
|
| |
|
|
|
| | | | | | | | | |
Consolidated profit before taxes | | 2,797 | | | | 1,996 | |
| | | | | | | | | |
| | Provision for income taxes | | 850 | | | | 549 | |
| | |
|
|
| |
|
|
|
| | Profit of consolidated companies | | 1,947 | | | | 1,447 | |
| | | | | | | | | |
| | Equity in profit (loss) of unconsolidated affiliated companies | | 61 | | | | 37 | |
| | |
|
|
| |
|
|
|
Profit | $ | 2,008 | | | $ | 1,484 | |
| |
|
|
| |
|
|
|
Profit per common share | $ | 2.95 | | | $ | 2.17 | |
| | | | | | | | | |
Profit per common share - diluted 1 | $ | 2.84 | | | $ | 2.10 | |
| | | | | | | | | |
Weighted average common shares outstanding (millions) | | | | | | | |
| | - Basic | | 680.5 | | | | 684.5 | |
| | - Diluted 1 | | 707.4 | | | | 708.4 | |
| | | | | | | | |
Cash dividends declared per common share | $ | .46 | | | $ | .39 | |
| | | | | | | | | |
| (1) Diluted by assumed exercise of stock options, using the treasury stock method. |
See accompanying notes to Consolidated Financial Statements. |
Caterpillar Inc. Consolidated Statement of Changes in Stockholders' Equity For the Nine Months Ended (Unaudited) (Dollars in millions) |
| | September 30, 2005 | | September 30, 2004 |
| |
| |
|
Common stock: | | | | | | | | | | | | | | | |
| | Balance at beginning of period | $ | 1,231 | | | | | | | $ | 1,059 | | | | | |
| | Common shares issued from treasury stock | | 252 | | | | | | | | 73 | | | | | |
| | Impact of 2-for-1 stock split | | 338 | | | | | | | | - | | | | | |
| | |
|
|
| | | | | |
|
|
| | | | |
| | Balance at end of period | | 1,821 | | | | | | | | 1,132 | | | | | |
| | |
|
|
| | | | | |
|
|
| | | | |
| | | | | | | | | | | | | | | | | |
Treasury stock: | | | | | | | | | | | | | | | |
| | Balance at beginning of period | | (3,277 | ) | | | | | | | (2,914 | ) | | | | |
| | Shares issued: 2005 -16,391,795; 2004 - 5,541,832 | | 277 | | | | | | | | 76 | | | | | |
| | Shares repurchased: 2005 - 22,057,200; 2004 - 10,594,000 | | (1,039 | ) | | | | | | | (400 | ) | | | | |
| | |
|
|
| | | | | |
|
|
| | | | |
| | Balance at end of period | | (4,039 | ) | | | | | | | (3,238 | ) | | | | |
| | |
|
|
| | | | | |
|
|
| | | | |
Profit employed in the business: | | | | | | | | | | | | | | | |
| | Balance at beginning of period | | 9,937 | | | | | | | | 8,450 | | | | | |
| | Profit | | 2,008 | | | $ | 2,008 | | | | 1,484 | | | $ | 1,484 | |
| | Dividends declared | | (309 | ) | | | | | | | (267 | ) | | | | |
| | Impact of 2-for-1 stock split | | (338 | ) | | | | | | | - | | | | | |
| | |
|
|
| | | | | |
|
|
| | | | |
| | Balance at end of period | | 11,298 | | | | | | | | 9,667 | | | | | |
| | |
|
|
| | | | | |
|
|
| | | | |
Accumulated other comprehensive income: | | | | | | | | | | | | | | | |
| | Foreign currency translation adjustment: | | | | | | | | | | | | | | | |
| | | Balance at beginning of period | | 489 | | | | | | | | 348 | | | | | |
| | | Aggregate adjustment for period | | (141 | ) | | | (141 | ) | | | 5 | | | | 5 | |
| | | |
|
|
| | | | | |
|
|
| | | | |
| | | Balance at end of period | | 348 | | | | | | | | 353 | | | | | |
| | | |
|
|
| | | | | |
|
|
| | | | |
| | Minimum pension liability adjustment - consolidated companies: | | | | | | | | | | | | | | | |
| | | Balance at beginning of period
(net of tax of: 2005-$485; 2004-$460) | | (993 | ) | | | | | | | (934 | ) | | | | |
| | | Aggregate adjustment for period
(net of tax of: 2005-$24) | | (46 | ) | | | (46 | ) | | | - | | | | - | |
| | | |
|
|
| | | | | |
|
|
| | | | |
| | | Balance at end of period
(net of tax of: 2005-$509; 2004-$460) | | (1,039 | ) | | | | | | | (934 | ) | | | | |
| | | |
|
|
| | | | | |
|
|
| | | | |
| | Minimum pension liability adjustment - unconsolidated companies: | | | | | | | | | | | | | | | |
| | | Balance at beginning of period | | (48 | ) | | | | | | | (48 | ) | | | | |
| | | Aggregate adjustment for period | | 1 | | | | 1 | | | | (1 | ) | | | (1 | ) |
| | | |
|
|
| | | | | |
|
|
| | | | |
| | | Balance at end of period | | (47 | ) | | | | | | | (49 | ) | | | | |
| | | |
|
|
| | | | | |
|
|
| | | | |
| | Derivative financial instruments: | | | | | | | | | | | | | | | |
| | | Balance at beginning of period
(net of tax of: 2005-$58; 2004-$54) | | 110 | | | | | | | | 104 | | | | | |
| | | Gains/(losses) deferred during period
(net of tax of: 2005-$2; 2004-$4) | | (5 | ) | | | (5 | ) | | | 8 | | | | 8 | |
| | | (Gains)/losses reclassified to earnings during period
(net of tax of: 2005-$40; 2004-$17) | | (75 | ) | | | (75 | ) | | | (33 | ) | | | (33 | ) |
| | | |
|
|
| | | | | |
|
|
| | | | |
| | | Balance at end of period
(net of tax of: 2005-$16; 2004-$41) | | 30 | | | | | | | | 79 | | | | | |
| | | |
|
|
| | | | | |
|
|
| | | | |
| | Available-for-sale securities: | | | | | | | | | | | | | | | |
| | | Balance at beginning of period
(net of tax of: 2005-$10; 2004-$7) | | 18 | | | | | | | | 13 | | | | | |
| | | Gains/(losses) deferred during period
(net of tax of: 2005-$2; 2004-$1) | | 4 | | | | 4 | | | | (2 | ) | | | (2 | ) |
| | | (Gains)/losses reclassified to earnings during period
(net of tax of 2005-$1; 2004-$0) | | (2 | ) | | | (2 | ) | | | - | | | | | |
| | | |
|
|
| | | | | |
|
|
| | | | |
| | | Balance at end of period
(net of tax of: 2005-$11; 2004-$6) | | 20 | | | | | | | | 11 | | | | | |
| | | |
|
|
| | | | | |
|
|
| | | | |
Total accumulated other comprehensive income | | (688 | ) | | | | | | | (540 | ) | | | | |
| |
|
|
| | | | | |
|
|
| | | | |
| | Comprehensive income | | | | | $ | 1,744 | | | | | | | $ | 1,461 | |
| | | | | | |
|
|
| | | | | |
|
|
|
Stockholders' equity at end of period | $ | 8,392 | | | | | | | $ | 7,021 | | | | | |
| |
|
|
| | | | | |
|
|
| | | | |
See accompanying notes to Consolidated Financial Statements. |
Caterpillar Inc. Consolidated Statement of Financial Position (Unaudited) (Dollars in millions) |
| | | | September 30, 2005 | | December 31, 2004 |
| | | |
| |
|
Assets | | | | | | | |
| | Current assets: | | | | | | | |
| | | Cash and short-term investments | $ | 967 | | | $ | 445 | |
| | | Receivables - trade and other | | 7,319 | | | | 7,463 | |
| | | Receivables - finance | | 5,725 | | | | 5,182 | |
| | | Deferred and refundable income taxes | | 581 | | | | 398 | |
| | | Prepaid expenses | | 1,301 | | | | 1,369 | |
| | | Inventories | | 5,469 | | | | 4,675 | |
| | | |
|
|
| |
|
|
|
| | Total current assets | | 21,362 | | | | 19,532 | |
| | | | | | | | | |
| | Property, plant and equipment - net | | 7,817 | | | | 7,682 | |
| | Long-term receivables - trade and other | | 893 | | | | 764 | |
| | Long-term receivables - finance | | 10,336 | | | | 9,903 | |
| | Investments in unconsolidated affiliated companies | | 563 | | | | 517 | |
| | Deferred income taxes | | 707 | | | | 674 | |
| | Intangible assets | | 462 | | | | 315 | |
| | Goodwill | | 1,451 | | | | 1,450 | |
| | Other assets | | 2,274 | | | | 2,258 | |
| | |
|
|
| |
|
|
|
Total assets | $ | 45,865 | | | $ | 43,095 | |
| |
|
|
| |
|
|
|
Liabilities | | | | | | | |
| | Current liabilities: | | | | | | | |
| | | Short-term borrowings: | | | | | | | |
| | | | Machinery and Engines | | 603 | | | | 93 | |
| | | | Financial Products | | 5,361 | | | | 4,064 | |
| | | Accounts payable | | 3,425 | | | | 3,580 | |
| | | Accrued expenses | | 2,508 | | | | 2,261 | |
| | | Accrued wages, salaries and employee benefits | | 1,735 | | | | 1,730 | |
| | | Customer advances | | 554 | | | | 447 | |
| | | Dividends payable | | - | | | | 141 | |
| | | Deferred and current income taxes payable | | 583 | | | | 259 | |
| | | Long-term debt due within one year: | | | | | | | �� |
| | | | Machinery and Engines | | 234 | | | | 6 | |
| | | | Financial Products | | 3,850 | | | | 3,525 | |
| | |
|
|
| |
|
|
|
| | Total current liabilities | | 18,853 | | | | 16,106 | |
| | | | | | | | | | | |
| | Long-term debt due after one year: | | | | | | | |
| | | Machinery and Engines | | 3,406 | | | | 3,663 | |
| | | Financial Products | | 11,578 | | | | 12,174 | |
| | Liability for postemployment benefits | | 2,827 | | | | 2,986 | |
| | Deferred income taxes and other liabilities | | 809 | | | | 699 | |
| | |
|
|
| |
|
|
|
Total liabilities | | 37,473 | | | | 35,628 | |
| |
|
|
| |
|
|
|
Stockholders' equity | | | | | | | |
| | Common stock of $1.00 par: | | | | | | | |
| | | Authorized shares: 900,000,000 Issued shares: (9/30/05 and 12/31/04 - 814,894,624) at paid in amount | | 1,821 | | | | 1,231 | |
| | Treasury stock (9/30/05 - 134,686,131; 12/31/04 - 129,020,726) at cost | | (4,039 | ) | | | (3,277 | ) |
| | Profit employed in the business | | 11,298 | | | | 9,937 | |
| | Accumulated other comprehensive income | | (688 | ) | | | (424 | ) |
| | |
|
|
| |
|
|
|
Total stockholders' equity | | 8,392 | | | | 7,467 | |
| |
|
|
| |
|
|
|
Total liabilities and stockholders' equity | $ | 45,865 | | | $ | 43,095 | |
| |
|
|
| |
|
|
|
See accompanying notes to Consolidated Financial Statements. |
Caterpillar Inc. Consolidated Statement of Cash Flow (Unaudited) (Millions of dollars) |
| | | Nine Months Ended |
| | | September 30, |
| | | 2005 | | 2004 |
| | |
| |
|
Cash flow from operating activities: | | | | | | | |
| | Profit | $ | 2,008 | | | $ | 1,484 | |
| | Adjustments for non-cash items: | | | | | | | |
| | | Depreciation and amortization | | 1,113 | | | | 1,055 | |
| | | Other | | (89 | ) | | | (83 | ) |
| | Changes in assets and liabilities: | | | | | | | |
| | | Receivables - trade and other (see non-cash item below) | | (521 | ) | | | (7,110 | ) |
| | | Inventories | | (794 | ) | | | (1,225 | ) |
| | | Accounts payable and accrued expenses | | 313 | | | | 728 | |
| | | Other assets - net | | 69 | | | | 76 | |
| | | Other liabilities - net | | 31 | | | | (2 | ) |
| | | |
|
|
| |
|
|
|
Net cash provided by (used for) operating activities | | 2,130 | | | | (5,077 | ) |
| |
|
|
| |
|
|
|
| | | | | | | | | |
Cash flow from investing activities: | | | | | | | |
| | Capital expenditures - excluding equipment leased to others | | (709 | ) | | | (519 | ) |
| | Expenditures for equipment leased to others | | (965 | ) | | | (827 | ) |
| | Proceeds from disposals of property, plant and equipment | | 447 | | | | 378 | |
| | Additions to finance receivables | | (7,310 | ) | | | (6,423 | ) |
| | Collections of finance receivables | | 4,889 | | | | 4,617 | |
| | Proceeds from the sale of finance receivables | | 916 | | | | 647 | |
| | Collections of retained interests in securitized trade receivables | | - | | | | 5,722 | |
| | Investments and acquisitions (net of cash acquired) | | (12 | ) | | | (284 | ) |
| | Other - net | | 80 | | | | (40 | ) |
| | |
|
|
| |
|
|
|
Net cash provided by (used for) investing activities | | (2,664 | ) | | | 3,271 | |
| |
|
|
| |
|
|
|
| | | | | | | | | |
Cash flow from financing activities: | | | | | | | |
| | Dividends paid | | (449 | ) | | | (395 | ) |
| | Common stock issued, including treasury shares reissued | | 412 | | | | 137 | |
| | Treasury shares purchased | | (1,039 | ) | | | (400 | ) |
| | Proceeds from long-term debt issued | | 4,358 | | | | 4,532 | |
| | Payments on long-term debt | | (3,324 | ) | | | (2,615 | ) |
| | Short-term borrowings - net | | 1,085 | | | | 563 | |
| | |
|
|
| |
|
|
|
Net cash provided by financing activities | | 1,043 | | | | 1,822 | |
| |
|
|
| |
|
|
|
Effect of exchange rate changes on cash | | 13 | | | | 59 | |
| |
|
|
| |
|
|
|
Increase in cash and short-term investments | | 522 | | | | 75 | |
| | | | | | | | |
Cash and short-term investments at beginning of period | | 445 | | | | 342 | |
| |
|
|
| |
|
|
|
Cash and short-term investments at end of period | $ | 967 | | | $ | 417 | |
| |
|
|
| |
|
|
|
| All short-term investments, which consist primarily of highly liquid investments with original maturities of three months or less, are considered to be cash equivalents. |
Non-cash operating and investing activities:
Trade receivables of $0 and $6,786 million were exchanged for retained interests in securitized trade receivables during the nine months ended September 30, 2005 and 2004, respectively. |
See accompanying notes to Consolidated Financial Statements. |
NOTES TO CONSOLIDATED FINANCIAL STATEMENTS (Unaudited) |
1. | A. Financial Statement Presentation In the opinion of management, all adjustments, consisting only of normal recurring adjustments necessary for a fair statement of (a) the consolidated results of operations for the three and nine month periods ended September 30, 2005 and 2004, (b) the changes in stockholders' equity for the nine month periods ended September 30, 2005 and 2004, (c) the consolidated financial position at September 30, 2005 and December 31, 2004, and (d) the consolidated statement of cash flow for the nine month periods ended September 30, 2005 and 2004, have been made. Certain amounts for prior periods have been reclassified to conform to the current period financial statement presentation. In the fourth quarter of 2004, we changed how we classify cash flows related to trade receivables securitized through Cat Financial and wholesale inventory receivables financed by Cat Financial. Amounts reported in our Consolidated Statement of Cash Flow for the nine months ended September 30, 2004 have been reclassified to conform to this presentation. These reclassifications had no impact on the “Increase in Cash and Short-term Investments” on the Consolidated Statement of Cash Flow. Consolidated cash flow for the nine months ended September 30, 2004 has been reclassified as follows: |
| | | Nine Months Ended September 30, 2004
|
| | (Millions of dollars) | Previous Classification1 | | Change | | As Reclassified |
| | |
| |
| |
|
| | Consolidated Statement of Cash Flow | | | | | | | | | | | |
| | Receivables - trade and other | $ | (461 | ) | | $ | (6,649 | ) | | $ | (7,110 | ) |
| | Net cash provided by (used for) operating activities | | 1,535 | | | | (6,612 | ) | | | (5,077 | ) |
| | Additions to finance receivables | | (16,493 | ) | | | 10,070 | | | | (6,423 | ) |
| | Collections of finance receivables | | 13,010 | | | | (8,393 | ) | | | 4,617 | |
| | Proceeds from sale of finance receivables | | 1,434 | | | | (787 | ) | | | 647 | |
| | Collections of retained interests in securitized trade receivables_ | | - | | | | 5,722 | | | | 5,722 | |
| | Net cash provided by (used for) investing activities | | (3,341 | ) | | | 6,612 | | | | 3,271 | |
| | (1) Certain amounts do not agree to prior period reported amounts due to unrelated reclassifications. |
| | On June 8, 2005, Caterpillar’s Board of Directors approved a 2-for-1 stock split in the form of a 100 percent stock dividend. The stock split shares were distributed on July 13, 2005 to stockholders of record at the close of business on June 22, 2005. The capital accounts, share data, and earnings per share data in these Consolidated Financial Statements reflect the stock split, applied retroactively, to all periods presented. Comprehensive income is comprised of profit, as well as gains and losses from currency translation, derivative instruments designated as cash flow hedges and available-for-sale securities and adjustments in the minimum pension liability. Total comprehensive income for the three months ended September 30, 2005 and 2004 was $645 million and $507 million, respectively. Total comprehensive income for the nine months ended September 30, 2005 and 2004 was $1.744 billion and $1.461 billion, respectively. The difference from profit primarily consists of foreign currency translation adjustments and gains on derivative instruments that were reclassified to earnings. The December 31, 2004 financial position data included herein is derived from the audited consolidated financial statements included in the Company's annual report on Form 10-K for the year ended December 31, 2004. |
| | B. Nature of Operations We operate in three principal lines of business: |
| | (1) | Machinery - A principal line of business which includes the design, manufacture, marketing and sales of construction, mining and forestry machinery - track and wheel tractors, track and wheel loaders, pipelayers, motor graders, wheel tractor-scrapers, track and wheel excavators, backhoe loaders, log skidders, log loaders, off-highway trucks, articulated trucks, paving products, telescopic handlers, skid steer loaders and related parts. Also includes logistics services for other companies. |
| | (2) | Engines - A principal line of business including the design, manufacture, marketing and sales of engines for Caterpillar machinery, electric power generation systems; on-highway vehicles and locomotives; marine, petroleum, construction, industrial, agricultural and other applications; and related parts. Reciprocating engines meet power needs ranging from 5 to over 22,000 horsepower (4 to over 16 200 kilowatts). Turbines range from 1,200 to 20,500 horsepower (900 to 15 000 kilowatts). |
| | (3) | Financial Products - A principal line of business consisting primarily of Caterpillar Financial Services Corporation (Cat Financial), Caterpillar Insurance Holdings, Inc. (Cat Insurance), Caterpillar Power Ventures Corporation (Cat Power Ventures) and their respective subsidiaries. Cat Financial provides a wide range of financing alternatives to customers and dealers for Caterpillar machinery and engines, Solar gas turbines, as well as other equipment and marine vessels. Cat Financial also extends loans to customers and dealers. Cat Insurance provides various forms of insurance to customers and dealers to help support the purchase and lease of our equipment. Cat Power Ventures is an active investor in independent power projects using Caterpillar power generation equipment and services. |
| | Our Machinery and Engines operations are highly integrated. Throughout the Notes, Machinery and Engines represents the aggregate total of these principal lines of business. |
| | C. Stock-Based Compensation We currently use the intrinsic value method of accounting for stock-based employee compensation in accordance with Accounting Principles Board Opinion No. 25, "Accounting for Stock Issued to Employees." Therefore, no compensation expense is recognized in association with our options. In 2004, we switched from using the Black-Scholes option-pricing model to the binomial option-pricing model in order to calculate the fair value of our options. We believe this model more accurately reflects the value of the options than the Black-Scholes option-pricing model. Grants made prior to 2004 continue to be valued using the Black-Scholes model. |
| | The table below illustrates the effect on profit and earnings per share if we had applied the fair value method of Statement of Financial Accounting Standards (SFAS 123), “Accounting for Stock-Based Compensation” for the three and nine month periods ending September 30, 2005 and 2004. |
| | | Three Months Ended September 30, |
| | |
|
| | (Dollars in millions except per share data) | 2005 | | 2004 |
| | |
| |
|
| | Profit, as reported | $ | 667 | | | $ | 498 | |
| | Deduct: Total stock-based employee compensation expense determined
under fair value based method for all awards, net of related tax effects | | (6 | ) | | | (58 | ) |
| | |
|
|
| |
|
|
|
| | Pro forma profit | $ | 661 | | | $ | 440 | |
| | |
|
|
| |
|
|
|
| | Profit per share of common stock: | | | | | | | |
| | | As reported: | | | | | | | |
| | | | Basic | $ | .98 | | | $ | .73 | |
| | | | Diluted | $ | .94 | | | $ | .70 | |
| | | Pro forma: | | | | | | | |
| | | | Basic | $ | .97 | | | $ | .64 | |
| | | | Diluted | $ | .93 | | | $ | .62 | |
| | | Nine Months Ended September 30, |
| | |
|
| | (Dollars in millions except per share data) | 2005 | | 2004 |
| | |
| |
|
| | Profit, as reported | $ | 2,008 | | | $ | 1,484 | |
| | Deduct: Total stock-based employee compensation expense determined
under fair value based method for all awards, net of related tax effects | | (129 | ) | | | (103 | ) |
| | |
|
|
| |
|
|
|
| | Pro forma profit | $ | 1,879 | | | $ | 1,381 | |
| | |
|
|
| |
|
|
|
| | Profit per share of common stock: | | | | | | | |
| | | As reported: | | | | | | | |
| | | | Basic | $ | 2.95 | | | $ | 2.17 | |
| | | | Diluted | $ | 2.84 | | | $ | 2.10 | |
| | | Pro forma: | | | | | | | |
| | | | Basic | $ | 2.76 | | | $ | 2.02 | |
| | | | Diluted | $ | 2.66 | | | $ | 1.95 | |
| | Pro forma profit for the nine months ended September 30, 2005 reflects immediate vesting of the 2005 stock option grant. (See Note 3 for further discussion.) |
2. | The results for the three and nine month periods ended September 30, 2005 are not necessarily indicative of the results for the entire year 2005. |
3. | New Accounting Pronouncements |
| | In November 2004, the Financial Accounting Standards Board (FASB) issued Statement of Financial Accounting Standards No. 151 (SFAS 151), “Inventory Costs - an amendment of ARB No. 43, Chapter 4.” SFAS 151 discusses the general principles applicable to the pricing of inventory. Paragraph 5 of ARB 43, Chapter 4 provides guidance on allocating certain costs to inventory. This Statement amends ARB 43, Chapter 4, to clarify that abnormal amounts of idle facility expense, freight, handling costs, and wasted materials (spoilage) should be recognized as current-period charges. In addition, this Statement requires that allocation of fixed production overheads to the costs of conversion be based on the normal capacity of production facilities. As required by SFAS 151, we will adopt this new accounting standard on January 1, 2006. The adoption of SFAS 151 is not expected to have a material impact on our financial statements. |
| | In December 2004, the FASB issued FASB Staff Position No. 109-1, “Application of FASB Statement No. 109, Accounting for Income Taxes, to the Tax Deduction on Qualified Production Activities Provided by the American Jobs Creation Act of 2004”, (FSP 109-1). FSP 109-1 provides accounting guidance for companies that will be eligible for a tax deduction resulting from “qualified production activities income” as defined in the American Jobs Creation Act of 2004 (the Act). FSP 109-1 requires this deduction be treated as a special deduction in accordance with SFAS 109, which does not require a revaluation of our U.S. deferred tax assets. We applied the guidance in FSP 109-1 upon recognition of this tax deduction beginning January 1, 2005. The application of FSP 109-1 did not have a material impact on our financial statements. In December 2004, the FASB issued FASB Staff Position No. 109-2, “Accounting and Disclosure Guidance for the Foreign Earnings Repatriation Provision within the American Jobs Creation Act of 2004”, (FSP 109-2). FSP 109-2 provides accounting guidance for the one-time tax deduction of 85% of non-U.S. earnings that are repatriated in excess of a base amount as defined in the Act. SFAS 109 requires a company to reflect in the period of enactment the effect of a new tax law. Due to the lack of clarification on certain provisions within the Act, FSP 109-2 allowed companies time beyond the financial reporting period of enactment to evaluate the effect of the Act. In the second quarter of 2005, we completed our evaluation and recognized a provision for income taxes of $49 million under the provisions of the Act. We expect to repatriate earnings of approximately $1.4 billion in 2005, which includes $500 million subject to the preferential treatment allowed by the Act. We have provided U.S. tax on earnings of non-U.S. subsidiaries that were not considered indefinitely reinvested prior to our evaluation of the Act. In connection with our current repatriation plan, we now intend to indefinitely reinvest earnings of a few selected non-U.S. subsidiaries and have reversed the associated deferred tax liability of $38 million. The net impact of these items was an $11 million increase to our second quarter provision for income taxes. |
| | In December 2004, the FASB issued Statement of Financial Accounting Standards No. 153 (SFAS 153), “Exchanges of Non-monetary Assets - an amendment of APB Opinion No. 29.” SFAS 153 addresses the measurement of exchanges of non-monetary assets. It eliminates the exception from fair value measurement for non-monetary exchanges of similar productive assets in paragraph 21(b) of APB Opinion No. 29 “Accounting for Non-monetary Transactions” and replaces it with an exception for exchanges that do not have commercial substance. A non-monetary exchange has commercial substance if the future cash flows of the entity are expected to change significantly as a result of the exchange. As required by SFAS 153, we have adopted this new accounting standard effective July 1, 2005. The adoption of SFAS 153 did not have a material impact on our financial statements. |
| | In December 2004, the FASB issued Statement of Financial Accounting Standards No. 123R (revised 2004) “Share-Based Payment,” (SFAS 123R). SFAS 123R requires that the cost resulting from all share-based payment transactions be recognized in the financial statements. SFAS 123R also establishes fair value as the measurement method in accounting for share-based payments with employees. The FASB required the provisions of SFAS 123R be adopted for interim or annual periods beginning after June 15, 2005. In April 2005, the SEC adopted a new rule amending the compliance dates for SFAS 123R. In accordance with this rule, we will adopt this new accounting standard effective January 1, 2006. We will transition to the new guidance using the modified prospective method. In anticipation of delaying vesting until three years after the grant date for future grants, the 2004 employee stock option grant (issued in June) fully vested on December 31, 2004. In order to better align our employee stock option program with the overall market, the number of options granted in 2005 (issued in February) was significantly reduced from the previous year. In response to this decrease, we elected to immediately vest the 2005 option grant. Based on the same assumptions used to value our 2005 stock option grant (including number of options granted and exercise price of options), we expect the application of the expensing provisions of SFAS 123R will result in a pretax expense of approximately $100 million in 2006. As a result of the vesting decisions discussed above, a full complement of expense related to stock options will not be recognized in our results of operations until 2009. We estimate our pretax expense associated with our stock option grants will range from approximately $110 million in 2007 to approximately $160 million in 2009. |
| | In June 2005, the FASB issued Statement of Financial Accounting Standards No. 154 (SFAS 154), “Accounting Changes and Error Corrections.” SFAS 154 changes the requirements for the accounting for and reporting of a change in accounting principle. This Statement requires retrospective applications to prior periods’ financial statements of a voluntary change in accounting principle unless it is impracticable. In addition, this Statement requires that a change in depreciation, amortization, or depletion for long-lived, non-financial assets be accounted for as a change in accounting estimate effected by a change in accounting principle. This new accounting standard is effective January 1, 2006. The adoption of SFAS 154 is not expected to have a material impact on our financial statements. |
4. | Derivative Instruments and Hedging Activities |
| | Our earnings and cash flow are subject to fluctuations due to changes in foreign currency exchange rates, interest rates and commodity prices. Our Risk Management Policy (policy) allows for the use of derivative financial instruments to prudently manage foreign currency exchange rate, interest rate and commodity price exposure. Our policy specifies that derivatives are not to be used for speculative purposes. Derivatives that we use are primarily foreign currency forward and option contracts, interest rate swaps and commodity forward and option contracts. Our derivative activities are subject to the management, direction and control of our senior financial officers. Risk management practices, including the use of financial derivative instruments, are presented to the Audit Committee of the Board of Directors at least annually. Foreign Currency Exchange Rate Risk Foreign currency exchange rate movements create a degree of risk by affecting the U.S. dollar value of sales made and costs incurred in foreign currencies. Movements in foreign currency rates also affect our competitive position as these changes may affect business practices and/or pricing strategies of non-U.S. based competitors. Additionally, we have balance sheet positions denominated in foreign currency thereby creating exposure to movements in exchange rates. |
| | Our Machinery and Engines operations purchase, manufacture and sell products in many locations around the world. As we have a diversified revenue and cost base, we manage our future foreign currency cash flow exposure on a net basis. We use foreign currency forward and option contracts to manage unmatched foreign currency cash inflow and outflow. Our objective is to minimize the risk of exchange rate movements that would reduce the U.S. dollar value of our foreign currency cash flow. Our policy allows for managing anticipated foreign currency cash flow for up to four years. |
| | We generally designate as cash flow hedges at inception of the contract any Australian dollar, Brazilian real, British pound, Canadian dollar, euro, Japanese yen, Mexican peso, Singapore dollar, Chinese yuan, New Zealand dollar or Swiss franc forward or option contracts that exceed 90 days in duration. Designation is performed on a specific exposure basis to support hedge accounting. The remainder of Machinery and Engines foreign currency contracts are undesignated. We also designate as fair value hedges specific euro forward contracts used to hedge firm commitments. |
| | As of September 30, 2005, $10 million of deferred net gains included in equity (“Accumulated other comprehensive income” in the Consolidated Statement of Financial Position) are expected to be reclassified to current earnings (“Other income (expense)”) over the next 12 months when earnings are negatively affected by the hedged transactions. As of September 30, 2004, this projected reclassification was a gain of $62 million. These amounts were based on September 30, 2005 and September 30, 2004 exchange rates, respectively. The actual amount recorded in other income/expense will vary based on exchange rates at the time the hedged transactions impact earnings. There were no circumstances where hedge treatment was discontinued during the three or nine month periods ended September 30, 2005 or 2004. In managing foreign currency risk for our Financial Products operations, our objective is to minimize earnings volatility resulting from conversion and the re-measurement of net foreign currency balance sheet positions. Our policy allows the use of foreign currency forward contracts to offset the risk of currency mismatch between our receivables and debt. All such foreign currency forward contracts are undesignated. |
| | Gains / (losses) included in current earnings [Other income (expense)] on undesignated contracts: |
| | | Three Months Ended September 30, |
| | |
|
| | (Millions of dollars) | 2005 | | 2004 |
| | |
| |
|
| | Machinery and Engines: | | | | | | | |
| | | On undesignated contracts | $ | 9 | | | $ | - | |
| | | | | | | | | | | |
| | Financial Products: | | | | | | | |
| | | On undesignated contracts | $ | 16 | | | $ | 2 | |
| | | | | | | | | | | |
| | Gains / (losses) included in current earnings [Other income (expense)] on undesignated contracts: |
| | | Nine Months Ended September 30, |
| | |
|
| | (Millions of dollars) | 2005 | | 2004 |
| | |
| |
|
| | Machinery and Engines: | | | | | | | |
| | | On undesignated contracts | $ | 25 | | | $ | (3 | ) |
| | | | | | | | | | | |
| | Financial Products: | | | | | | | |
| | | On undesignated contracts | $ | 49 | | | $ | 19 | |
| | | | | | | | | | | |
| | Gains on the Financial Products contracts above are substantially offset by balance sheet translation losses. Interest Rate Risk Interest rate movements create a degree of risk by affecting the amount of our interest payments and the value of our fixed rate debt. Our practice is to use interest rate swap agreements and forward rate agreements to manage our exposure to interest rate changes and lower the cost of borrowed funds. Machinery and Engines operations generally use fixed rate debt as a source of funding. Our objective is to minimize the cost of borrowed funds. Our policy allows us to enter into fixed-to-floating interest rate swaps and forward rate agreements to meet that objective with the intent to designate as fair value hedges at inception of the contract all fixed-to-floating interest rate swaps. Designation as a hedge of the fair value of our fixed rate debt is performed to support hedge accounting. During 2001, our Machinery and Engines operations liquidated all fixed-to-floating interest rate swaps. Deferred gains on liquidated fixed-to-floating interest rate swaps, which were previously designated as fair value hedges, are being amortized to earnings ratably over the remaining life of the hedged debt. We designate as cash flow hedges at inception of the contract all forward rate agreements. Designation as a hedge of the anticipated issuance of debt is performed to support hedge accounting. Machinery and Engines forward rate agreements are 100% effective. |
| | Financial Products operations have a match funding policy that addresses interest rate risk by aligning the interest rate profile (fixed or floating rate) of their debt portfolio with the interest rate profile of their receivables portfolio within pre-determined ranges on an on-going basis. In connection with that policy, we use interest rate derivative instruments to modify the debt structure to match assets within the receivables portfolio. This match funding reduces the volatility of margins between interest-bearing assets and interest-bearing liabilities, regardless of which direction interest rates move. This is accomplished by changing the characteristics of existing debt instruments or entering into new agreements in combination with the issuance of new debt. Our policy allows us to use floating-to-fixed, fixed-to-floating, and floating-to-floating interest rate swaps to meet the match funding objective. To support hedge accounting, we designate fixed-to-floating interest rate swaps as fair value hedges of the fair value of our fixed rate debt at the inception of the contract. Financial Products practice is to designate most floating-to-fixed interest rate swaps as cash flow hedges of the variability of future cash flows at inception of the swap contract. Designation as a hedge of the variability of cash flow is performed to support hedge accounting. Financial Products liquidated fixed-to-floating interest rate swaps during 2005, 2004, and 2002. As a result, the gain ($16 million as of September 30, 2005) is being amortized to earnings ratably over the remaining life of the hedged debt. |
| | Gains / (losses) included in current earnings [Other income (expense)]: |
| | | Three Months Ended September 30, |
| | (Millions of dollars) | 2005 | | 2004 |
| | |
| |
|
| | Fixed-to-floating interest rate swaps | | | | | | | |
| | | Machinery and Engines: | | | | | | | |
| | | | Gain/(loss) on liquidated swaps | $ | 1 | | | $ | 1 | |
| | | Financial Products: | | | | | | | |
| | | | Gain/(loss) on designated interest rate derivatives | | (53 | ) | | | 42 | |
| | | | Gain/(loss) on hedged debt | | 53 | | | | (42 | ) |
| | | | Gain/(loss) on liquidated swaps - included in interest expense | | 1 | | | | - | |
| | | | |
|
|
| |
|
|
|
| | | | | $ | 2 | | | $ | 1 | |
| | | | |
|
|
| |
|
|
|
| | Gains / (losses) included in current earnings [Other income (expense)]: |
| | | Nine Months Ended September 30, |
| | (Millions of dollars) | 2005 | | 2004 |
| | |
| |
|
| | Fixed-to-floating interest rate swaps | | | | | | | |
| | | Machinery and Engines: | | | | | | | |
| | | | Gain/(loss) on liquidated swaps | $ | 3 | | | $ | 3 | |
| | | Financial Products: | | | | | | | |
| | | | Gain/(loss) on designated interest rate derivatives | | (50 | ) | | | 3 | |
| | | | Gain/(loss) on hedged debt | | 50 | | | | (3 | ) |
| | | | Gain/(loss) on liquidated swaps - included in interest expense | | 3 | | | | 1 | |
| | | | |
|
|
| |
|
|
|
| | | | | $ | 6 | | | $ | 4 | |
| | | | |
|
|
| |
|
|
|
| | As of September 30, 2005, $7 million of deferred net gains included in equity (“Accumulated other comprehensive income” in the Consolidated Statement of Financial Position), related to Financial Products floating-to-fixed interest rate swaps, are expected to be reclassified to current earnings (“Interest expense of Financial Products”) over the next 12 months. As of September 30, 2004, this projected reclassification was a net loss of $10 million. There were no circumstances where hedge treatment was discontinued during the three or nine months ended September 30, 2005 or 2004. |
| | Commodity Price Risk Commodity price movements create a degree of risk by affecting the price we must pay for certain raw materials. Our policy is to use commodity forward and option contracts to manage the commodity risk and reduce the cost of purchased materials. Our Machinery and Engines operations purchase aluminum, copper and nickel embedded in the components we purchase from suppliers. Our suppliers pass on to us price changes in the commodity portion of the component cost. In addition, we are also subjected to price changes on natural gas purchased for operational use. Our objective is to minimize volatility in the price of these commodities. Our policy allows us to enter into commodity forward and option contracts to lock in the purchase price of a portion of these commodities within a four-year horizon. All such commodity forward and option contracts are undesignated. Gains on the undesignated contracts of $5 million and $6 million were recorded in current earnings ("Other income (expense)") for the three and nine months ended September 30, 2005. Gains on the undesignated contracts of $6 million and $11 million were recorded in current earnings ("Other income (expense)") for the three and nine months ended September 30, 2004. |
Page 12
5. | Inventories Inventories (principally "last-in, first-out" method) are comprised of the following: |
| | (Millions of dollars) | September 30, | | December 31, |
| | | 2005 | | 2004 |
| | |
| |
|
| | Raw materials | $ | 1,628 | | | $ | 1,592 | |
| | Work-in-process | | 925 | | | | 664 | |
| | Finished goods | | 2,685 | | | | 2,209 | |
| | Supplies | | 231 | | | | 210 | |
| | |
|
|
| |
|
|
|
| | Total inventories | $ | 5,469 | | | $ | 4,675 | |
| | |
|
|
| |
|
|
|
6. | Investments in Unconsolidated Affiliated Companies |
| | Our investments in affiliated companies accounted for by the equity method consist primarily of a 50 percent interest in Shin Caterpillar Mitsubishi Ltd. (SCM) located in Japan. Combined financial information of the unconsolidated affiliated companies accounted for by the equity method (generally on a three month lag, e.g., SCM results reflect the periods ending June 30) was as follows: |
| | | Results of Operations | | Results of Operations |
| | | Three Months Ended | | Nine Months Ended |
| | | September 30, | | September 30, |
| | (Millions of dollars) | 2005 | | 2004 | | 2005 | | 2004 |
| | |
| |
| |
| |
|
| | Sales | $ | 1,077 | | | $ | 986 | | | $ | 3,100 | | | $ | 2,699 | |
| | Cost of sales | | 844 | | | | 743 | | | | 2,410 | | | | 2,070 | |
| | |
|
|
| |
|
|
| |
|
|
| |
|
|
|
| | Gross profit | $ | 233 | | | $ | 243 | | | $ | 690 | | | $ | 629 | |
| | | | | | | | | | | | | | | | | |
| | Profit (loss) | $ | 41 | | | $ | 35 | | | $ | 132 | | | $ | 81 | |
| | |
|
|
| |
|
|
| |
|
|
| |
|
|
|
| | Caterpillar's profit (loss) | $ | 18 | | | $ | 17 | | | $ | 61 | | | $ | 37 | |
| | |
|
|
| |
|
|
| |
|
|
| |
|
|
|
| | | Financial Position |
| | | September 30, | | December 31, |
| | (Millions of dollars) | 2005 | | 2004 |
| | |
| |
|
| | Assets: | | | |
| | Current assets | $ | 1,736 | | $ | 1,540 | |
| | Property, plant and equipment - net | | 1,160 | | | 1,097 | |
| | Other assets | | 225 | | | 145 | |
| | |
|
| |
|
|
|
| | | | 3,121 | | | 2,782 | |
| Liabilities: | | | | | | |
| | Current liabilities | | 1,444 | | | 1,345 | |
| | Long-term debt due after one year | | 356 | | | 276 | |
| | Other liabilities | | 223 | | | 214 | |
| | |
|
| |
|
|
|
| | | | 2,023 | | | 1,835 | |
| | |
|
| |
|
|
|
| | Ownership | $ | 1,098 | | $ | 947 | |
| | |
|
| |
|
|
|
| | Caterpillar's investments in unconsolidated affiliated companies | | | | | | |
| | Investments in equity method companies | $ | 535 | | $ | 487 | |
| | Plus: Investments in cost method companies | | 28 | | | 30 | |
| | |
|
| |
|
|
|
| | Total investments in unconsolidated affiliated companies | $ | 563 | | $ | 517 | |
| | |
|
| |
|
|
|
7. | Intangible Assets and Goodwill |
| | A. Intangible assets Intangible assets are comprised of the following: |
| | (Millions of dollars) | September 30, | | December 31, |
| | | 2005 | | 2004 |
| | |
| |
|
| | Intellectual property | $ | 212 | | | $ | 213 | |
| | Pension-related | | 283 | | | | 120 | |
| | Other | | 73 | | | | 73 | |
| |
|
|
| |
|
|
|
| | Total intangible assets - gross | | 568 | | | | 406 | |
| | Less: Accumulated amortization of finite lived intangible assets | | (106 | ) | | | (91 | ) |
| | |
|
|
| |
|
|
|
| | Intangible assets - net | $ | 462 | | | $ | 315 | |
| | |
|
|
| |
|
|
|
| | Amortization expense for the three and nine months ended September 30, 2005 was $6 million and $16 million, respectively. Amortization expense for the three and nine months ended September 30, 2004 was $5 million and $16 million, respectively. Amortization expense related to intangible assets is expected to be: |
| | (Millions of dollars) |
| | 2005 | | 2006 | | 2007 | | 2008 | | 2009 | | Thereafter |
| |
| |
| |
| |
| |
| |
|
| | $ | 23 | | | $ | 22 | | | $ | 19 | | | $ | 17 | | | $ | 16 | | | $ | 97 | |
| |
|
|
| |
|
|
| |
|
|
| |
|
|
| |
|
|
| |
|
|
|
| | B. Goodwill |
| | During the three and nine months ended September 30, 2005, no goodwill was acquired, impaired or disposed. During the third quarter of 2004 we acquired assets with related goodwill of $55 million. No goodwill was impaired or disposed of during the three or nine months ended September 30, 2004. On an annual basis, we test goodwill for impairment in accordance with Statement of Financial Accounting Standards No. 142 “Goodwill and Other Intangible Assets.” |
8. | Available-For-Sale Securities |
| | Caterpillar Insurance and Caterpillar Investment Management Ltd. have investments in certain debt and equity securities that are classified as available-for-sale in accordance with Statement of Financial Accounting Standards No. 115 (SFAS 115) and recorded at fair value based upon quoted market prices. These fair values are included in "Other assets" in the Consolidated Statement of Financial Position. Unrealized gains and losses arising from the revaluation of available-for-sale securities are included, net of applicable deferred income taxes, in equity ("Accumulated other comprehensive income" in the Consolidated Statement of Financial Position). Realized gains and losses on sales of investments are generally determined using the FIFO method for debt instruments and the specific identification method for equity securities. Realized gains and losses are included in "Other income (expense)" in the Consolidated Statement of Results of Operations. |
| | | September 30, 2005 |
| | |
|
| | | | | Unrealized | | |
| | | | | Pretax Net | | |
| | (Millions of dollars) | Cost Basis | | Gains (Losses) | | Fair Value |
| | |
| |
| |
|
| | Government debt | $ | 282 | | | $ | (4 | ) | | $ | 278 | |
| | Corporate bonds | | 415 | | | | (6 | ) | | | 409 | |
| | Equity securities | | 159 | | | | 37 | | | | 196 | |
| | |
|
|
| |
|
|
| |
|
|
|
| | Total | $ | 856 | | | $ | 27 | | | $ | 883 | |
| | |
|
|
| |
|
|
| |
|
|
|
| | | December 31, 2004 |
| | |
|
| | (Millions of dollars) | Cost Basis | | Unrealized Pretax Net Gains (Losses) | | Fair Value |
| |
| |
| | |
| |
| |
|
| | Government debt | $ | 239 | | | $ | (1 | ) | | $ | 238 | |
| | Corporate bonds | | 342 | | | | - | | | | 342 | |
| | Equity securities | | 203 | | | | 21 | | | | 224 | |
| | |
|
|
| |
|
|
| |
|
|
|
| | Total | $ | 784 | | | $ | 20 | | | $ | 804 | |
| | |
|
|
| |
|
|
| |
|
|
|
| Investments in an unrealized loss position that are not other-than-temporarily impaired: |
| | | September 30, 2005 |
| | |
|
| | | Less than 12 months (1) | | More than 12 months (1) | | Total |
| | |
| |
| |
|
| | (Millions of dollars) | Fair Value | | Unrealized Losses | | Fair Value | | Unrealized Losses | | Fair Value | | Unrealized Losses |
| | |
| |
| |
| |
| |
| |
|
| | Government debt | $ | 167 | | | $ | 2 | | | $ | 75 | | | $ | 2 | | | $ | 242 | | | $ | 4 | |
| | Corporate bonds | | 233 | | | | 3 | | | | 97 | | | | 3 | | | | 330 | | | | 6 | |
| | Equity securities | | 31 | | | | 2 | | | | 2 | | | | - | | | | 33 | | | | 2 | |
| | |
|
|
| |
|
|
| |
|
|
| |
|
|
| |
|
|
| |
|
|
|
| | Total | $ | 431 | | | $ | 7 | | | $ | 174 | | | $ | 5 | | | $ | 605 | | | $ | 12 | |
| | |
|
|
| |
|
|
| |
|
|
| |
|
|
| |
|
|
| |
|
|
|
| | (1) Indicates length of time that individual securities have been in a continuous unrealized loss position. |
| | The fair value of the available-for-sale debt securities at September 30, 2005, by contractual maturity, is shown below. Expected maturities will differ from contractual maturities because borrowers may have the right to prepay and creditors may have the right to call obligations. |
| | (Millions of dollars) | | Fair Value |
| | | |
|
| | Due in one year or less | | $ | 47 |
| | Due after one year through five years | | $ | 294 |
| | Due after five years through ten years | | $ | 75 |
| | Due after ten years | | $ | 271 |
| | | | | |
| | Proceeds from sales of investments in debt and equity securities during the three and nine months ended September 30, 2005 were $261 million and $443 million, respectively. Proceeds from sales of investments in debt and equity securities during the three and nine months ended September 30, 2004 were $208 million and $343 million, respectively. Gross gains of $5 million and $12 million, and gross losses of $2 million and $4 million, were included in current earnings for the three and nine months ended September 30, 2005, respectively. Gross gains of $2 million and $5 million, and gross losses of $2 million and $5 million, were included in current earnings for the three and nine months ended September 30, 2004, respectively. |
9. | Postretirement Benefits |
| | A. Pension and postretirement benefit costs |
| | In January 2005, amendments were made to both U.S. pension and other postretirement benefit plans due to the company and the United Auto Workers reaching a new six-year labor agreement that will expire on March 1, 2011. These plans were re-measured as of January 10, 2005 to account for the benefit changes. The result was a $7 million and $22 million increase in pension cost, and a $17 million and $52 million increase in other postretirement benefit cost for the three and nine months ended September 30, 2005, respectively. In addition, the Additional Minimum Pension Liability increased $233 million as a result of the re-measurement. The liability was offset by an increase in pension-related intangible assets of $164 million and a decrease in other comprehensive income (pre-tax) of $69 million. In April 2005, amendments were made to our U.S. salaried and management other postretirement benefit plan. The plan was re-measured, resulting in a reduction of $6 million and $12 million in other postretirement benefit cost for the three and nine months ended September 30, 2005, respectively. |
| | 2004 other postretirement benefit cost reflects the adoption of FASB Staff Position No. 106-2, “Accounting and Disclosure Requirements Related to the Medicare Prescription Drug, Improvement and Modernization Act of 2003” in the third quarter of 2004, retroactive to December 31, 2003. The impact of the anticipated federal subsidy for prescription drugs was a decrease in other postretirement benefit cost of $15 million and $37 million, for the three and nine months ended September 30, 2004, respectively. |
| | (Millions of Dollars) | U.S. Pension Benefits | | Non-U.S. Pension Benefits | | Other Postretirement Benefits |
| | |
| |
| |
|
| | | September 30, | | September 30, | | September 30, |
| | | 2005 | | 2004 | | 2005 | | 2004 | | 2005 | | 2004 |
| | |
| |
| |
| |
| |
| |
|
| | For the three months ended: | | | | | | | | | | | | | | | | | | | | | | | |
| | Components of net periodic benefit cost: | | | | | | | | | | | | | | | | | | | | | | | |
| | | Service cost | $ | 37 | | | $ | 36 | | | $ | 14 | | | $ | 12 | | | $ | 21 | | | $ | 16 | |
| | | Interest cost | | 139 | | | | 137 | | | | 26 | | | | 22 | | | | 73 | | | | 66 | |
| | | Expected return on plan assets | | (178 | ) | | | (178 | ) | | | (26 | ) | | | (24 | ) | | | (22 | ) | | | (19 | ) |
| | | Amortization of: | | | | | | | | | | | | | | | | | | | | | | | |
| | | | Net asset existing at adoption of
SFAS 87/106 | | - | | | | - | | | | 1 | | | | 1 | | | | - | | | | - | |
| | | | Prior service cost 1 | | 15 | | | | 11 | | | | 1 | | | | 2 | | | | (9 | ) | | | (12 | ) |
| | | | Net actuarial loss (gain) | | 49 | | | | 35 | | | | 12 | | | | 9 | | | | 23 | | | | 10 | |
| | | | |
|
|
| |
|
|
| |
|
|
| |
|
|
| |
|
|
| |
|
|
|
| | | Total cost included in results of operations | $ | 62 | | | $ | 41 | | | $ | 28 | | | $ | 22 | | | $ | 86 | | | $ | 61 | |
| | | |
|
|
| |
|
|
| |
|
|
| |
|
|
| |
|
|
| |
|
|
|
| | Weighted-average assumptions
used to determine net cost: | | | | | | | | | | | | | | | | | | | | | | | |
| | Discount rate 2 | | 5.8/5.9 | % | | | 6.2 | % | | | 5.2 | % | | | 5.1 | % | | | 5.7-5.9 | % | | | 6.2 | % |
| | Expected return on plan assets | | 9.0 | % | | | 9.0 | % | | | 7.2 | % | | | 7.4 | % | | | 9.0 | % | | | 9.0 | % |
| | Rate of compensation increase | | 4.0 | % | | | 4.0 | % | | | 3.5 | % | | | 3.2 | % | | | 4.0 | % | | | 4.0 | % |
| | |
| | (1) Prior service costs for both pension and other postretirement benefits are generally amortized using the straight-line method over the average remaining service period to the full retirement eligibility date of employees expected to receive benefits from the plan amendment. For other postretirement benefit plans in which all or almost all of the plan’s participants are fully eligible for benefits under the plan, prior service costs are amortized using the straight-line method over the remaining life expectancy of those participants. |
| | (2) For U.S. plans impacted by the January 2005 plan amendments, a 5.8% discount rate was utilized for valuing the plan re-measurement. For the April 2005 amendment, a 5.7% discount rate was utilized for valuing the plan re-measurement. |
| | (Millions of Dollars) | U.S. Pension Benefits | | Non-U.S. Pension Benefits | | Other Postretirement Benefits |
| | |
| |
| |
|
| | | September 30, | | September 30, | | September 30, |
| | | 2005 | | 2004 | | 2005 | | 2004 | | 2005 | | 2004 |
| | |
| |
| |
| |
| |
| |
|
| | For the nine months ended: | | | | | | | | | | | | | | | | | | | | | | | |
| | Components of net periodic benefit cost: | | | | | | | | | | | | | | | | | | | | | | | |
| | | Service cost | $ | 112 | | | $ | 108 | | | $ | 44 | | | $ | 36 | | | $ | 65 | | | $ | 49 | |
| | | Interest cost | | 416 | | | | 411 | | | | 81 | | | | 66 | | | | 223 | | | | 200 | |
| | | Expected return on plan assets | | (534 | ) | | | (519 | ) | | | (78 | ) | | | (72 | ) | | | (65 | ) | | | (55 | ) |
| | | Amortization of: | | | | | | | | | | | | | | | | | | | | | | | |
| | | | Net asset existing at adoption
of SFAS 87/106 | | - | | | | - | | | | 1 | | | | 3 | | | | 1 | | | | - | |
| | | | Prior service cost 1 | | 45 | | | | 33 | | | | 4 | | | | 6 | | | | (21 | ) | | | (36 | ) |
| | | | Net actuarial loss (gain) | | 148 | | | | 105 | | | | 37 | | | | 27 | | | | 64 | | | | 35 | |
| | | | |
|
|
| |
|
|
| |
|
|
| |
|
|
| |
|
|
| |
|
|
|
| | | Total cost included in results
of operations | $ | 187 | | | $ | 138 | | | $ | 89 | | | $ | 66 | | | $ | 267 | | | $ | 193 | |
| | | |
|
|
| |
|
|
| |
|
|
| |
|
|
| |
|
|
| |
|
|
|
| | Weighted-average assumptions used to
determine net cost: | | | | | | | | | | | | | | | | | | | | | | | |
| | Discount rate 2 | | 5.8/5.9 | % | | | 6.2 | % | | | 5.2 | % | | | 5.1 | % | | | 5.7-5.9 | % | | | 6.2 | % |
| | Expected return on plan assets | | 9.0 | % | | | 9.0 | % | | | 7.2 | % | | | 7.4 | % | | | 9.0 | % | | | 9.0 | % |
| | Rate of compensation increase | | 4.0 | % | | | 4.0 | % | | | 3.5 | % | | | 3.2 | % | | | 4.0 | % | | | 4.0 | % |
| | |
| | (1) Prior service costs for both pension and other postretirement benefits are generally amortized using the straight-line method over the average remaining service period to the full retirement eligibility date of employees expected to receive benefits from the plan amendment. For other postretirement benefit plans in which all or almost all of the plan’s participants are fully eligible for benefits under the plan, prior service costs are amortized using the straight-line method over the remaining life expectancy of those participants. |
| | (2) For U.S. plans impacted by the January 2005 plan amendments, a 5.8% discount rate was utilized for valuing the plan re-measurement. For the April 2005 amendment, a 5.7% discount rate was utilized for valuing the plan re-measurement. |
| | We have no ERISA funding requirements in 2005 and do not expect to make any significant contributions to our U.S. pension plans this year. Contributions were made to non-U.S. pension plans during the three and nine months ended September 30, 2005 of $280 million and $370 million, respectively, and we do not anticipate significant additional contributions during the year. Also during 2005, a $200 million cash contribution was made to one of our other postretirement benefit plans, in addition to our funding of ongoing cash benefit payments of approximately $360 million. |
| | B. Defined contribution benefit costs |
| | Total company costs related to U.S. and non-U.S. defined contribution plans were as follows: |
| | | Three Months Ended September 30, |
| | (Millions of dollars) | 2005 | | 2004 |
| | |
| |
|
| | U.S. Plans | $ | 42 | | $ | 21 |
| | Non-U.S. Plans | | 1 | | | 3 |
| | |
|
| |
|
|
| | | $ | 43 | | $ | 24 |
| | |
|
| |
|
|
| | | Nine Months Ended September 30, |
| | (Millions of dollars) | 2005 | | 2004 |
| | |
| |
|
| | U.S. Plans | $ | 103 | | $ | 74 |
| | Non-U.S. Plans | | 14 | | | 9 |
| | |
|
| |
|
|
| | | $ | 117 | | $ | 83 |
| | |
|
| |
|
|
10. | Guarantees and Product Warranty |
| | We have guaranteed to repurchase loans of certain Caterpillar dealers from third party lenders in the event of default. These guarantees arose in conjunction with Cat Financial's relationship with third party dealers who sell Caterpillar equipment. These guarantees generally have one-year terms and are secured, primarily by dealer assets. Cat Financial has provided a limited indemnity to a third party bank for $41 million resulting from the assignment of certain leases to that bank. The indemnity is for the remote chance that the insurers of these leases would become insolvent. The indemnity expires December 15, 2012 and is unsecured. No loss has been experienced or is anticipated under any of these guarantees. At both September 30, 2005 and December 31, 2004, the recorded liabilities for these guarantees was $10 million. The maximum potential amount of future payments (undiscounted and without reduction for any amount that may possibly be recovered under recourse or collateralized provisions) we could be required to make under the guarantees are as follows: |
| | (Millions of dollars) | September 30, | | December 31, |
| | | 2005 | | 2004 |
| | |
| |
|
| | Guarantees with Caterpillar dealers | $ | 426 | | | $ | 364 | |
| | Guarantees - other | | 86 | | | | 62 | |
| | |
|
|
| |
|
|
|
| | Total guarantees | $ | 512 | | | $ | 426 | |
| | |
|
|
| |
|
|
|
| | Our product warranty liability is determined by applying historical claim rate experience to the current field population and dealer inventory. Historical claim rates are developed using a rolling average of actual warranty payments. Our product warranty liability also includes deferred revenue related to extended warranty contracts, which is recognized in income when the related costs are incurred. The amount of this deferred revenue was $118 million and $132 million at September 30, 2005 and December 31, 2004, respectively. |
| |
|
| | (Millions of dollars) | 2005 |
| | |
|
| | Warranty liability, January 1 | $ | 914 | |
| | Reduction in liability (payments) | | (524 | ) |
| | Increase in liability (new warranties) | | 587 | |
| | |
|
|
|
| | Warranty liability, September 30 | $ | 977 | |
| | |
|
|
|
|
|
| | (Millions of dollars) | 2004 |
| | |
|
| | Warranty liability, January 1 | $ | 695 | |
| | Reduction in liability (payments) | | (586 | ) |
| | Increase in liability (new warranties) | | 772 | |
| | Additional liability from acquisition | | 33 | |
| | |
|
|
|
| | Warranty liability, December 31 | $ | 914 | |
| | |
|
|
|
11. | Computations of Profit Per Share |
| | | Three Months Ended September 30, |
| | (Dollars in millions except per share data) | 2005 | | 2004 |
| | |
| |
|
| | I. | Profit for the period (A): | $ | 667 | | $ | 498 |
| | | |
|
| |
|
|
| | II. | Determination of shares (millions): | | | | | |
| | | Weighted average number of common shares outstanding (B) | | 678.8 | | | 683.6 |
| | | Shares issuable on exercise of stock options, net of shares assumed
to be purchased out of proceeds at average market price | | 31.9 | | | 22.4 |
| | | |
|
| |
|
|
| | | Average common shares outstanding for fully diluted computation (C) | | 710.7 | | | 706.0 |
| | | |
|
| |
|
|
| | III. | Profit per share of common stock: | | | | | |
| | | Assuming no dilution (A/B) | $ | 0.98 | | $ | 0.73 |
| | | Assuming full dilution (A/C) | $ | 0.94 | | $ | 0.70 |
| | | Nine Months Ended September 30, |
| | (Dollars in millions except per share data) | 2005 | | 2004 |
| | |
| |
|
| | I. | Profit for the period (A): | $ | 2,008 | | $ | 1,484 |
| | | |
|
| |
|
|
| | II. | Determination of shares (millions): | | | | | |
| | | Weighted average number of common shares outstanding (B) | | 680.5 | | | 684.5 |
| | | Shares issuable on exercise of stock options, net of shares assumed
to be purchased out of proceeds at average market price | | 26.9 | | | 23.9 |
| | | |
|
| |
|
|
| | | Average common shares outstanding for fully diluted computation (C) | | 707.4 | | | 708.4 |
| | | |
|
| |
|
|
| | III. | Profit per share of common stock: | | | | | |
| | | Assuming no dilution (A/B) | $ | 2.95 | | $ | 2.17 |
| | | Assuming full dilution (A/C) | $ | 2.84 | | $ | 2.10 |
12. | Environmental and Legal Matters |
| | The company is regulated by federal, state, and international environmental laws governing our use of substances and control of emissions in all our operations. Compliance with these existing laws has not had a material impact on our capital expenditures or earnings. |
| | We are cleaning up hazardous waste at a number of locations, often with other companies, pursuant to federal and state laws. When it is probable we will pay cleanup costs at a site and those costs can be estimated, the costs are charged against our earnings. In formulating that estimate, we do not consider amounts expected to be recovered from insurance companies and others. |
| | The amount recorded for environmental cleanup is not material and is included in "Accrued expenses" in the Consolidated Statement of Financial Position. If a range of liability estimates is available on a particular site, we accrue at the lower end of that range. We cannot estimate costs on sites in the very early stages of cleanup. Currently, we have several sites in the very early stages of cleanup, and there is no more than a remote chance that a material amount for cleanup will be required. We have disclosed certain individual legal proceedings in this filing. Additionally, we are involved in other unresolved legal actions that arise in the normal course of business. The most prevalent of these unresolved actions involve disputes related to product design, manufacture and performance liability (including claimed asbestos and welding fumes exposure), contracts, employment issues and intellectual property rights. Although it is not possible to predict with certainty the outcome of these unresolved legal actions or the range of probable loss, we believe that these unresolved legal actions will not individually or in the aggregate have a material impact on our consolidated financial position, liquidity or results of operations. |
Page 19
| | On January 16, 2002, Caterpillar commenced an action in the Circuit Court of the Tenth Judicial Circuit of Illinois in Peoria, Illinois, against Navistar International Transportation Corporation and International Truck and Engine Corporation (collectively Navistar). The lawsuit arises out of a long-term purchase contract between Caterpillar and Navistar effective May 31, 1988, as amended from time to time (the Purchase Agreement). The pending complaint alleges, among other things, that Navistar breached its contractual obligations by: (i) paying Caterpillar $8.08 less per fuel injector than the agreed upon price for new unit injectors delivered by Caterpillar; (ii) refusing to pay contractually agreed upon surcharges owed as a result of Navistar ordering less than planned volumes of replacement unit injectors; and (iii) refusing to pay contractually agreed upon interest stemming from Navistar's late payments. As of September 30, 2005, the net past due receivable from Navistar regarding the foregoing and included in “Long-term receivables - trade and other” in the Consolidated Statement of Financial Position totaled $139 million. The pending complaint also has claims alleging that Newstream Enterprises and Navistar, collectively and individually, failed to pay the applicable price to Caterpillar for shipments of unit injectors to Newstream. As of September 30, 2005, the net past due receivables for the foregoing, included in “Long-term receivables - trade and other” in the Consolidated Statement of Financial Position totaled $12 million. The pending complaint further alleges that Sturman Industries, Inc. and Sturman Engine Systems, Inc. colluded with Navistar to utilize technology that Sturman Industries, Inc. misappropriated from Caterpillar to help Navistar develop its G2 fuel system, and tortiously interfered with the Purchase Agreement and Caterpillar's prospective economic relationship with Navistar. The pending complaint further alleges that the two parties' collusion led Navistar to select Sturman Engine Systems, Inc., and another company, instead of Caterpillar, to develop and manufacture the G2 fuel system. On September 30, 2005, International Truck and Engine Corporation (International) commenced an action against Caterpillar in the Circuit Court of the Tenth Judicial Circuit of Illinois in Peoria, Illinois. The lawsuit states that it arises out of the May 31, 1988 Purchase Agreement described above. The Complaint alleges, among other things, that Caterpillar procured the May 31, 1988 Purchase Agreement by fraudulently misrepresenting or concealing information related to the business of selling fuel injectors to International, and that Caterpillar breached the Purchase Agreement. International’s Complaint does not specify the amount of damages being sought. Caterpillar intends to defend itself vigorously in this case. On May 7, 2002, International commenced an action against Caterpillar in the Circuit Court of DuPage County, Illinois regarding a long-term agreement term sheet ("term sheet") (the “first lawsuit”). In its sixth amended complaint in the first lawsuit, International alleged that the term sheet constitutes a legally binding contract for the sale of heavy-duty engines at specified prices through the end of 2006, alleged that Caterpillar breached the term sheet by, among other things, raising certain prices effective October 1, 2002, and also alleged that Caterpillar breached an obligation to negotiate a comprehensive long-term agreement referenced in the term sheet. International sought declaratory and injunctive relief as well as damages in an amount to be determined at trial. Caterpillar denied International's claims and filed a counterclaim seeking a declaration that the term sheet had been effectively terminated. Caterpillar also asserted that pursuant to a subsequent agreement International released Caterpillar from certain of its claims. On September 24, 2003 the Appellate Court of Illinois, ruling on an interlocutory appeal, issued an order consistent with Caterpillar's position that, even if the court subsequently determines that the term sheet is a binding contract, it is indefinite in duration and was therefore terminable at will by Caterpillar upon reasonable notice. On April 12, 2005 International commenced a second, related action against Caterpillar in the Circuit Court of DuPage County, Illinois (the “second lawsuit”). The second lawsuit contained allegations similar to the allegations contained in the first lawsuit. International also alleged in the second lawsuit that Caterpillar materially breached the subsequent agreement. On June 15, 2005 International voluntarily dismissed its complaint in the first lawsuit. The second lawsuit has been consolidated with Caterpillar’s counterclaims from the first lawsuit. No trial date is currently scheduled for this case, which is not related to the breach of contract action brought by Caterpillar against Navistar which is currently pending in the Circuit Court of Peoria County, Illinois. In a letter dated November 15, 2004, the EPA proposed a civil penalty of $641,392 to Caterpillar for the alleged failure to comply with certain requirements of the Federal Clean Air Act. The EPA alleges that Caterpillar constructed a facility in Emporia, Kansas, and failed to comply with Section 112(g)(2)(B) of the Clean Air Act. Caterpillar sold the Emporia facility in December 2002. We are seeking a settlement of this matter with all concerned parties and we believe the outcome will not have a material impact on our consolidated financial position, liquidity, or results of operations. During the second quarter of 2005, the Internal Revenue Service (IRS) completed its field examination of our 1995 through 1999 U.S. tax returns. In connection with this examination, we received notices of certain adjustments proposed by the IRS, primarily related to foreign sales corporation (FSC) commissions, foreign tax credit calculations and R&D credits. We disagree with these proposed adjustments and intend to vigorously dispute this matter through applicable IRS and judicial procedures, as appropriate. Although the final resolution of the proposed adjustments is uncertain, in the opinion of our management, the ultimate disposition of these matters will not have a material adverse effect on our consolidated financial position, liquidity, or results of operations. |
Page 20
| | Caterpillar is organized based on a decentralized structure that has established accountabilities to continually improve business focus and increase our ability to react quickly to changes in both the global business cycle and competitors' actions. Our current structure uses a product, geographic matrix organization comprised of multiple profit center and service center divisions. Caterpillar is a highly integrated company. The majority of our profit centers are product focused. They are primarily responsible for the design, manufacture and ongoing support of their products. However, some of these product-focused profit centers also have marketing responsibilities. We also have geographically-based profit centers that are focused primarily on marketing. However, most of these profit centers also have some manufacturing responsibilities. One of our profit centers provides various financial services to our customers and dealers. The service center divisions perform corporate functions and provide centralized services. We have developed an internal measurement system to evaluate performance and to drive continuous improvement. This measurement system, which is not based on generally accepted accounting principles (GAAP), is intended to motivate desired behavior of employees and drive performance. It is not intended to measure a division’s contribution to enterprise results. The sales and cost information used for internal purposes varies significantly from our consolidated externally reported information, resulting in substantial reconciling items. Each division has specific performance targets and is evaluated and compensated based on achieving those targets. Performance targets differ from division to division; therefore, meaningful comparisons cannot be made among the profit or service center divisions. It is the comparison of actual results to budgeted results that makes our internal reporting valuable to management. Consequently, we feel that the financial information required by Statement of Financial Accounting Standards No. 131 (SFAS 131), "Disclosures about Segments of an Enterprise and Related Information" has limited value to our external readers. In the first quarter of 2005, we made several organizational changes that impacted our segment reporting. No individual segment was materially impacted as a result of the changes and prior period amounts have been restated to conform to the current period presentation. Due to Caterpillar’s high level of integration and our concern that segment disclosures based on SFAS 131 requirements have limited value to external readers, we are continuing to disclose financial results for our three principal lines of business (Machinery, Engines and Financial Products) in our Management’s Discussion and Analysis beginning on page 26. |
Business Segments Three Months Ended September 30, (Millions of dollars) |
|
| | Machinery and Engines | | |
2005 | Asia/ Pacific Marketing | Construction & Mining Products | EAME Marketing | Latin America Marketing | Power Products | North America Marketing | All Other | Total | Financing & Insurance Services | Consolidated Total |
|
|
|
|
|
|
|
|
|
|
|
| External sales and revenues | $ | 601 | $ | 96 | | $ | 1,060 | $ | 594 | $ | 2,579 | $ | 2,835 | $ | 574 | $ | 8,339 | $ | 723 | | $ | 9,062 | |
| Inter-segment sales & revenues | | 48 | | 3,828 | | | 986 | | 447 | | 2,077 | | 110 | | 892 | | 8,388 | | 5 | | | 8,393 | |
| |
|
|
|
|
|
|
|
|
|
|
|
|
|
|
|
|
|
|
|
|
|
|
|
| Total sales and revenues | $ | 649 | $ | 3,924 | | $ | 2,046 | $ | 1,041 | $ | 4,656 | $ | 2,945 | $ | 1,466 | $ | 16,727 | $ | 728 | | $ | 17,455 | |
| |
|
|
|
|
|
|
|
|
|
|
|
|
|
|
|
|
|
|
|
|
|
|
|
| Depreciation and amortization | $ | 3 | $ | 44 | | $ | 16 | $ | 11 | $ | 71 | $ | 1 | $ | 29 | $ | 175 | $ | 163 | | $ | 338 | |
| Imputed interest expense | $ | 4 | $ | 19 | | $ | 9 | $ | 7 | $ | 27 | $ | 2 | $ | 32 | $ | 100 | $ | 206 | | $ | 306 | |
| Accountable profit (loss) | $ | 28 | $ | 471 | | $ | 76 | $ | 52 | $ | 240 | $ | 98 | $ | 188 | $ | 1,153 | $ | 139 | | $ | 1,292 | |
| Accountable assets at September 30, 2005 | $ | 489 | $ | 2,756 | | $ | 1,211 | $ | 897 | $ | 3,845 | $ | 52 | $ | 4,151 | $ | 13,401 | $ | 26,002 | | $ | 39,403 | |
| Capital Expenditures | $ | 3 | $ | 73 | | $ | 24 | $ | 12 | $ | 93 | $ | 1 | $ | 30 | $ | 236 | $ | 362 | | $ | 598 | |
| |
|
| | Machinery and Engines | | |
2004 | Asia/ Pacific Marketing | Construction & Mining Products | EAME Marketing | Latin America Marketing | Power Products | North America Marketing | All Other | Total | Financing & Insurance Services | Consolidated Total |
|
|
|
|
|
|
|
|
|
|
|
| External sales and revenues | $ | 484 | $ | 73 | | $ | 947 | $ | 484 | $ | 2,340 | $ | 2,289 | $ | 500 | $ | 7,117 | $ | 581 | | $ | 7,698 | |
| Inter-segment sales & revenues | | 29 | | 3,122 | | | 837 | | 308 | | 1,763 | | 105 | | 735 | | 6,899 | | - | | | 6,899 | |
| |
|
|
|
|
|
|
|
|
|
|
|
|
|
|
|
|
|
|
|
|
|
|
|
| Total sales and revenues | $ | 513 | $ | 3,195 | | $ | 1,784 | $ | 792 | $ | 4,103 | $ | 2,394 | $ | 1,235 | $ | 14,016 | $ | 581 | | $ | 14,597 | |
| |
|
|
|
|
|
|
|
|
|
|
|
|
|
|
|
|
|
|
|
|
|
|
|
| Depreciation and amortization | $ | 3 | $ | 43 | | $ | 15 | $ | 11 | $ | 72 | $ | 1 | $ | 26 | $ | 171 | $ | 150 | | $ | 321 | |
| Imputed interest expense | $ | 4 | $ | 17 | | $ | 8 | $ | 5 | $ | 29 | $ | 1 | $ | 25 | $ | 89 | $ | 135 | | $ | 224 | |
| Accountable profit (loss) | $ | 10 | $ | 249 | | $ | 63 | $ | 63 | $ | 108 | $ | 113 | $ | 162 | $ | 768 | $ | 124 | | $ | 892 | |
| Accountable assets at December 31, 2004 | $ | 525 | $ | 2,572 | | $ | 1,097 | $ | 775 | $ | 3,900 | $ | 28 | $ | 3,896 | $ | 12,793 | | 24,450 | | $ | 37,243 | |
| Capital Expenditures | $ | - | $ | 46 | | $ | 19 | $ | 10 | $ | 48 | $ | 1 | $ | 38 | $ | 162 | $ | 348 | | $ | 510 | |
| |
Business Segments Nine Months Ended September 30, (Millions of dollars) |
|
| | Machinery and Engines | | |
2005 | Asia/ Pacific Marketing | Construction & Mining Products | EAME Marketing | Latin America Marketing | Power Products | North America Marketing | All Other | Total | Financing & Insurance Services | Consolidated Total |
|
|
|
|
|
|
|
|
|
|
|
| External sales and revenues | $ | 1,848 | $ | 303 | | $ | 3,377 | $ | 1,679 | $ | 7,400 | $ | 8,402 | $ | 1,780 | $ | 24,789 | $ | 2,115 | | $ | 26,904 | |
| Inter-segment sales & revenues | | 121 | | 11,512 | | | 3,155 | | 1,235 | | 6,147 | | 328 | | 2,725 | | 25,223 | | 32 | | | 25,255 | |
| |
|
|
|
|
|
|
|
|
|
|
|
|
|
|
|
|
|
|
|
|
|
|
|
| Total sales and revenues | $ | 1,969 | $ | 11,815 | | $ | 6,532 | $ | 2,914 | $ | 13,547 | $ | 8,730 | $ | 4,505 | $ | 50,012 | $ | 2,147 | | $ | 52,159 | |
| |
|
|
|
|
|
|
|
|
|
|
|
|
|
|
|
|
|
|
|
|
|
|
|
| Depreciation and amortization | $ | 10 | $ | 136 | | $ | 49 | $ | 36 | $ | 218 | $ | 1 | $ | 72 | $ | 522 | $ | 483 | | $ | 1,005 | |
| Imputed interest expense | $ | 12 | $ | 59 | | $ | 26 | $ | 19 | $ | 85 | $ | 5 | $ | 91 | $ | 297 | $ | 574 | | $ | 871 | |
| Accountable profit (loss) | $ | 100 | $ | 1,325 | | $ | 319 | $ | 167 | $ | 625 | $ | 227 | $ | 647 | $ | 3,410 | $ | 418 | | $ | 3,828 | |
| Accountable assets at September 30, 2005 | $ | 489 | $ | 2,756 | | $ | 1,211 | $ | 897 | $ | 3,845 | $ | 52 | $ | 4,151 | $ | 13,401 | $ | 26,002 | | $ | 39,403 | |
| Capital Expenditures | $ | 6 | $ | 178 | | $ | 65 | $ | 26 | $ | 213 | $ | 2 | $ | 72 | $ | 562 | $ | 931 | | $ | 1,493 | |
| |
|
| | Machinery and Engines | | |
2004 | Asia/ Pacific Marketing | Construction & Mining Products | EAME Marketing | Latin America Marketing | Power Products | North America Marketing | All Other | Total | Financing & Insurance Services | Consolidated Total |
|
|
|
|
|
|
|
|
|
|
|
| External sales and revenues | $ | 1,582 | $ | 202 | | $ | 2,802 | $ | 1,227 | $ | 6,196 | $ | 6,722 | $ | 1,405 | $ | 20,136 | $ | 1,795 | | $ | 21,931 | |
| Inter-segment sales & revenues | | 78 | | 9,098 | | | 2,626 | | 896 | | 4,859 | | 282 | | 2,130 | | 19,969 | | 1 | | | 19,970 | |
| |
|
|
|
|
|
|
|
|
|
|
|
|
|
|
|
|
|
|
|
|
|
|
|
| Total sales and revenues | $ | 1,660 | $ | 9,300 | | $ | 5,428 | $ | 2,123 | $ | 11,055 | $ | 7,004 | $ | 3,535 | $ | 40,105 | $ | 1,796 | | $ | 41,901 | |
| |
|
|
|
|
|
|
|
|
|
|
|
|
|
|
|
|
|
|
|
|
|
|
|
| Depreciation and amortization | $ | 9 | $ | 132 | | $ | 45 | $ | 33 | $ | 222 | $ | 1 | $ | 75 | $ | 517 | $ | 446 | | $ | 963 | |
| Imputed interest expense | $ | 13 | $ | 49 | | $ | 22 | $ | 15 | $ | 85 | $ | 1 | $ | 71 | $ | 256 | $ | 383 | | $ | 639 | |
| Accountable profit (loss) | $ | 99 | $ | 886 | | $ | 251 | $ | 160 | $ | 205 | $ | 345 | $ | 478 | $ | 2,424 | $ | 344 | | $ | 2,768 | |
| Accountable assets at December 31, 2004 | $ | 525 | $ | 2,572 | | $ | 1,097 | $ | 775 | $ | 3,900 | $ | 28 | $ | 3,896 | $ | 12,793 | $ | 24,450 | | $ | 37,243 | |
| Capital Expenditures | $ | 2 | $ | 104 | | $ | 39 | $ | 21 | $ | 124 | $ | 2 | $ | 76 | $ | 368 | $ | 900 | | $ | 1,268 | |
Reconciliation of Sales and Revenues:
| |
(Millions of dollars) | Machinery and Engines | | Financing & Insurance Services | | Consolidating Adjustments | | Consolidated Total |
| |
| |
| |
| |
|
Three Months Ended September 30, 2005: | | | | | | | | | | | | | | | |
| Total external sales and revenues from business segments | $ | 8,339 | | | $ | 723 | | | $ | - | | | $ | 9,062 | |
| Other | | 53 | | | | (56 | ) | | | (82 | )1 | | | (85 | ) |
| |
|
|
| |
|
|
| |
|
|
| |
|
|
|
| Total sales and revenues | $ | 8,392 | | | $ | 667 | | | $ | (82 | ) | | $ | 8,977 | |
| |
|
|
| |
|
|
| |
|
|
| |
|
|
|
Three Months Ended September 30, 2004: | | | | | | | | | | | | | | | |
| Total external sales and revenues from business segments | $ | 7,117 | | | $ | 581 | | | $ | - | | | $ | 7,698 | |
| Other | | 58 | | | | (144 | ) | | | 47 | 1 | | | (39 | ) |
| |
|
|
| |
|
|
| |
|
|
| |
|
|
|
| Total sales and revenues | $ | 7,175 | | | $ | 437 | | | $ | 47 | | | $ | 7,659 | |
| |
|
|
| |
|
|
| |
|
|
| |
|
|
|
| (1) Elimination of Financial Products revenues from Machinery and Engines. |
Reconciliation of Sales and Revenues: | |
(Millions of dollars) | Machinery and Engines | | Financing & Insurance Services | | Consolidating Adjustments | | Consolidated Total |
| |
| |
| |
| |
|
Nine Months Ended September 30, 2005: | | | | | | | | | | | | | | | |
| Total external sales and revenues from business segments | $ | 24,789 | | | $ | 2,115 | | | $ | - | | | $ | 26,904 | |
| Other | | 176 | | | | (180 | ) | | | (224 | )1 | | | (228 | ) |
| |
|
|
| |
|
|
| |
|
|
| |
|
|
|
| Total sales and revenues | $ | 24,965 | | | $ | 1,935 | | | $ | (224 | ) | | $ | 26,676 | |
| |
|
|
| |
|
|
| |
|
|
| |
|
|
|
Nine Months Ended September 30, 2004: | | | | | | | | | | | | | | | |
| Total external sales and revenues from business segments | $ | 20,136 | | | $ | 1,795 | | | $ | - | | | $ | 21,931 | |
| Other | | 141 | | | | (208 | ) | | | (142 | )1 | | | (209 | ) |
| |
|
|
| |
|
|
| |
|
|
| |
|
|
|
| Total sales and revenues | $ | 20,277 | | | $ | 1,587 | | | $ | (142 | ) | | $ | 21,722 | |
| |
|
|
| |
|
|
| |
|
|
| |
|
|
|
| (1) Elimination of Financial Products revenues from Machinery and Engines. |
Reconciliation of Profit Before Taxes:
| | | | | |
(Millions of dollars) | Machinery and Engines | | Financing & Insurance Services | | Consolidated Total |
| |
| |
| |
|
Three Months Ended September 30, 2005: | | | | | | | | | | | |
| Total accountable profit from business segments | $ | 1,153 | | | $ | 139 | | | $ | 1,292 | |
| Corporate costs | | (155 | ) | | | - | | | | (155 | ) |
| Timing | | (38 | ) | | | - | | | | (38 | ) |
| Methodology differences: | | | | | | | | | | | |
| | Inventory/cost of sales | | 2 | | | | - | | | | 2 | |
| | Postretirement benefit expense | | (97 | ) | | | - | | | | (97 | ) |
| | Financing costs | | (7 | ) | | | - | | | | (7 | ) |
| | Equity in profit of unconsolidated affiliated companies | | (16 | ) | | | (2 | ) | | | (18 | ) |
| | Currency | | (23 | ) | | | - | | | | (23 | ) |
| | Other methodology differences | | (7 | ) | | | 3 | | | | (4 | ) |
| Other | | - | | | | - | | | | - | |
| |
|
|
| |
|
|
| |
|
|
|
| Total profit before taxes | $ | 812 | | | $ | 140 | | | $ | 952 | |
| |
|
|
| |
|
|
| |
|
|
|
Three Months Ended September 30, 2004: | | | | | | | | | | | |
| Total accountable profit from business segments | $ | 768 | | | $ | 124 | | | $ | 892 | |
| Corporate costs | | (148 | ) | | | - | | | | (148 | ) |
| Timing | | (20 | ) | | | - | | | | (20 | ) |
| Methodology differences: | | | | | | | | | | | |
| | Inventory/cost of sales | | - | | | | - | | | | - | |
| | Postretirement benefit expense | | (62 | ) | | | - | | | | (62 | ) |
| | Financing costs | | 9 | | | | - | | | | 9 | |
| | Equity in profit of unconsolidated affiliated companies | | (17 | ) | | | - | | | | (17 | ) |
| | Currency | | 7 | | | | - | | | | 7 | |
| | Other methodology differences | | (20 | ) | | | 20 | | | | - | |
| Other | | 2 | | | | - | | | | 2 | |
| |
|
|
| |
|
|
| |
|
|
|
| Total profit before taxes | $ | 519 | | | $ | 144 | | | $ | 663 | |
| |
|
|
| |
|
|
| |
|
|
|
Reconciliation of Profit Before Taxes: | | | | | |
(Millions of dollars) | Machinery and Engines | | Financing & Insurance Services | | Consolidated Total |
| |
| |
| |
|
Nine Months Ended September 30, 2005: | | | | | | | | | | | |
| Total accountable profit from business segments | $ | 3,410 | | | $ | 418 | | | $ | 3,828 | |
| Corporate costs | | (542 | ) | | | - | | | | (542 | ) |
| Timing | | (105 | ) | | | - | | | | (105 | ) |
| Methodology differences: | | | | | | | | | | | |
| | Inventory/cost of sales | | (23 | ) | | | - | | | | (23 | ) |
| | Postretirement benefit expense | | (292 | ) | | | - | | | | (292 | ) |
| | Financing costs | | (5 | ) | | | - | | | | (5 | ) |
| | Equity in profit of unconsolidated affiliated companies | | (54 | ) | | | (7 | ) | | | (61 | ) |
| | Currency | | (11 | ) | | | - | | | | (11 | ) |
| | Other methodology differences | | (18 | ) | | | 12 | | | | (6 | ) |
| Other | | 14 | | | | - | | | | 14 | |
| |
|
|
| |
|
|
| |
|
|
|
| Total profit before taxes | $ | 2,374 | | | $ | 423 | | | $ | 2,797 | |
| |
|
|
| |
|
|
| |
|
|
|
Nine Months Ended September 30, 2004: | | | | | | | | | | | |
| Total accountable profit from business segments | $ | 2,424 | | | $ | 344 | | | $ | 2,768 | |
| Corporate costs | | (409 | ) | | | - | | | | (409 | ) |
| Timing | | (106 | ) | | | - | | | | (106 | ) |
| Methodology differences: | | | | | | | | | | | |
| | Inventory/cost of sales | | (54 | ) | | | - | | | | (54 | ) |
| | Postretirement benefit expense | | (209 | ) | | | - | | | | (209 | ) |
| | Financing costs | | 35 | | | | - | | | | 35 | |
| | Equity in profit of unconsolidated affiliated companies | | (35 | ) | | | (2 | ) | | | (37 | ) |
| | Currency | | 18 | | | | - | | | | 18 | |
| | Other methodology differences | | (64 | ) | | | 35 | | | | (29 | ) |
| Other | | 19 | | | | - | | | | 19 | |
| |
|
|
| |
|
|
| |
|
|
|
| Total profit before taxes | $ | 1,619 | | | $ | 377 | | | $ | 1,996 | |
| |
|
|
| |
|
|
| |
|
|
|
Reconciliation of Assets: | | | | | | | |
(Millions of dollars) | Machinery and Engines | | Financing & Insurance Services | | Consolidating Adjustments | | Consolidated Total |
| |
| |
| |
| |
|
September 30, 2005: | | | | | | | | | | | | | | | |
| Total accountable assets from business segments | $ | 13,402 | | | $ | 26,002 | | | $ | - | | | $ | 39,404 | |
| Items not included in segment assets: | | | | | | | | | | | | | | | |
| | Cash and short-term investments | | 754 | | | | 213 | | | | - | | | | 967 | |
| | Intercompany receivables | | 715 | | | | 47 | | | | (762 | ) | | | - | |
| | Trade and other receivables | | 407 | | | | - | | | | - | | | | 407 | |
| | Investment in unconsolidated affiliated companies | | 402 | | | | - | | | | (1 | ) | | | 401 | |
| | Investment in Financial Products | | 3,202 | | | | - | | | | (3,202 | ) | | | - | |
| | Deferred income taxes and prepaids | | 2,625 | | | | 104 | | | | (343 | ) | | | 2,386 | |
| | Intangible assets and other assets | | 2,255 | | | | - | | | | - | | | | 2,255 | |
| | Service center assets | | 994 | | | | - | | | | - | | | | 994 | |
| Liabilities included in segment assets | | 1,364 | | | | 10 | | | | - | | | | 1,374 | |
| Inventory methodology differences | | (2,336 | ) | | | - | | | | - | | | | (2,336 | ) |
| Other | | 79 | | | | (66 | ) | | | - | | | | 13 | |
| |
|
|
| |
|
|
| |
|
|
| |
|
|
|
| Total assets | $ | 23,863 | | | $ | 26,310 | | | $ | (4,308 | ) | | $ | 45,865 | |
| |
|
|
| |
|
|
| |
|
|
| |
|
|
|
December 31, 2004: | | | | | | | | | | | | | | | |
| Total accountable assets from business segments | $ | 12,793 | | | $ | 24,450 | | | $ | - | | | $ | 37,243 | |
| Items not included in segment assets: | | | | | | | | | | | | | | | |
| | Cash and short-term investments | | 270 | | | | 175 | | | | - | | | | 445 | |
| | Intercompany receivables | | 443 | | | | 18 | | | | (461 | ) | | | - | |
| | Trade and other receivables | | 547 | | | | - | | | | - | | | | 547 | |
| | Investment in unconsolidated affiliated companies | | 367 | | | | - | | | | (1 | ) | | | 366 | |
| | Investment in Financial Products | | 3,012 | | | | - | | | | (3,012 | ) | | | - | |
| | Deferred income taxes and prepaids | | 2,477 | | | | 92 | | | | (317 | ) | | | 2,252 | |
| | Intangible assets and other assets | | 2,158 | | | | - | | | | - | | | | 2,158 | |
| | Service center assets | | 1,001 | | | | - | | | | - | | | | 1,001 | |
| Liabilities included in segment assets | | 1,346 | | | | - | | | | - | | | | 1,346 | |
| Inventory methodology differences | | (2,235 | ) | | | - | | | | - | | | | (2,235 | ) |
| Other | | 90 | | | | (123 | ) | | | 5 | | | | (28 | ) |
| |
|
|
| |
|
|
| |
|
|
| |
|
|
|
| Total assets | $ | 22,269 | | | $ | 24,612 | | | $ | (3,786 | ) | | $ | 43,095 | |
| |
|
|
| |
|
|
| |
|
|
| |
|
|
|
Item 2. Management's Discussion and Analysis of Financial Condition and Results of Operations
A. Overview
Continuing to meet strong customer demand worldwide, we reported third-quarter sales and revenues of $8.977 billion and profit of $667 million, or $0.94 per share. Both sales and revenues and profit per share are the highest in the company’s history for a third quarter. Thanks to the hard work of our people around the world and the discipline of 6 Sigma, Team Caterpillar has again effectively responded to our customers’ needs. We met the challenges stemming from recent hurricanes with minimum disruption to our business and maximum responsiveness to the cleanup needs in the Gulf region and delivered the best third-quarter financial results in company history.
Sales and revenues of $8.977 billion were up $1.318 billion, or 17 percent, compared to $7.659 billion for the third quarter of 2004. The higher sales and revenues were driven by continued strong global demand and improved price realization. Profit of $667 million, or $0.94 a share, was up 34 percent compared to profit of $498 million in the third quarter of 2004. Machinery and Engines operating profit as a percent of sales increased substantially—7.9 percent in the third quarter of 2004 to 10.5 percent in the third quarter of 2005. The increase was the result of improved price realization, higher sales volume and effective management of our period cost structure, somewhat offset by continued pressure on variable manufacturing costs.
While we posted the best third quarter in our history, we still have opportunity to improve our operations. In particular, we have to work through capacity bottlenecks and need more focus on production processes to improve order fulfillment and supply chain efficiencies. To help move us faster along this path, we announced on October 14, 2005 a new division to drive improvements in our production processes and order fulfillment capability.
The outlook for 2005 has been revised from previously reported levels. Sales and revenues are now expected to be up about 20 percent from 2004, and the profit outlook has been adjusted to reflect an estimated profit range of $3.85 to $4.00 per share.
The previous outlook reflected sales and revenues up 18 to 20 percent and profit per share of $4.00 to $4.20.
The change in the profit outlook includes potential charges of approximately $100 million before tax that are likely to be incurred in the fourth quarter and an increase in the estimated annual tax rate to 30 percent. Potential charges of $100 million are related to changes in our dealer distribution software that are under consideration and a product portfolio change impacting telehandler products. About $20 million of the potential charges relate to telehandlers. On October 26, 2005, we signed definitive agreements to enter into a global alliance with JLG Industries, Inc. (JLG) that will transition the design and production of Cat-branded telehandlers from Caterpillar to JLG.
Sales and revenues in 2006 are expected to be up about 10 percent from 2005. The profit outlook for 2006 is an increase of 15 to 25 percent from 2005 from the middle of the profit range in the 2005 outlook.
The company is well-positioned for continued profitable growth, with selected increases in capacity, a comprehensive rollout of new products and strong growth in our service businesses. Further, we will intensify our focus on order fulfillment and cost management. Caterpillar is ready for the challenges ahead.
Note: Glossary of terms included on pages 36-37; first occurrence of terms shown in bold italics.
B. Consolidated Results of Operations
THREE MONTHS ENDED SEPTEMBER 30, 2005 COMPARED WITH THREE MONTHS ENDED SEPTEMBER 30, 2004
SALES AND REVENUES
|
| The chart above graphically illustrates reasons for the change in Consolidated Sales and Revenues between 3rd Quarter 2004 (at left) and 3rd Quarter 2005 (at right). Items favorably impacting sales and revenues appear as upward stair steps with the corresponding dollar amounts above each bar. Caterpillar management utilizes these charts internally to visually communicate with its Board and employees. |
Sales and revenues for the third quarter of 2005 were $8.977 billion, up $1.318 billion or 17 percent from third quarter 2004. Machinery volume was up $572 million, Engines volume was up $118 million, price realization improved $503 million and currency had a positive impact on sales of $24 million, due primarily to a stronger Brazilian real compared with third quarter 2004. In addition, Financial Products revenues increased $101 million.
Sales and Revenues by Geographic Region |
(Millions of dollars) | Total | | % Change | | North America | | % Change | | EAME | | % Change | | Latin America | | % Change | | Asia/ Pacific | | % Change |
| |
| |
| |
| |
| |
| |
| |
| |
| |
| |
|
3rd Quarter 2005 | | | | | | | | | | | | | | | | | | | | | | | | |
| Machinery | $ | 5,648 | | 20% | | $ | 3,198 | | 23% | | $ | 1,199 | | 8% | | $ | 551 | | 31% | | $ | 700 | | 22% |
Engines1 | | 2,744 | | 11% | | | 1,299 | | 18% | | | 816 | | 9% | | | 287 | | 34% | | | 342 | | (18%) |
Financial Products2 | | 585 | | 21% | | | 412 | | 20% | | | 85 | | 2% | | | 39 | | 56% | | | 49 | | 48% |
| |
|
| | | |
|
| | | |
|
| | | |
|
| | | |
|
| | |
| | $ | 8,977 | | 17% | | $ | 4,909 | | 22% | | $ | 2,100 | | 8% | | $ | 877 | | 33% | | $ | 1,091 | | 7% |
| |
|
| | | |
|
| | | |
|
| | | |
|
| | | |
|
| | |
3rd Quarter 2004 | | | | | | | | | | | | | | | | | | | | | | | | |
| Machinery | $ | 4,699 | | | | $ | 2,597 | | | | $ | 1,106 | | | | $ | 422 | | | | $ | 574 | | |
Engines1 | | 2,476 | | | | | 1,100 | | | | | 747 | | | | | 214 | | | | | 415 | | |
Financial Products2 | | 484 | | | | | 343 | | | | | 83 | | | | | 25 | | | | | 33 | | |
| |
|
| | | |
|
| | | |
|
| | | |
|
| | | |
|
| | |
| | $ | 7,659 | | | | $ | 4,040 | | | | $ | 1,936 | | | | $ | 661 | | | | $ | 1,022 | | |
| |
|
| | | |
|
| | | |
|
| | | |
|
| | | |
|
| | |
| (1) Does not include internal engine transfers of $451 million and $387 million in 2005 and 2004, respectively. Internal engine transfers are valued at prices comparable to those for unrelated parties. |
| (2) Does not include revenues earned from Machinery and Engines of $82 million and ($47) million in 2005 and 2004, respectively. |
Machinery sales in third quarter 2005 were $5.648 billion, an increase of $949 million or 20 percent from third quarter 2004. Sales were a record for the third quarter and were only slightly below last quarter’s record high. Sales volume accounted for $572 million of the increase, price realization added $353 million and the remaining $24 million was due to currency. Sales gains benefited from a double-digit percentage increase in deliveries to end users, with all regions and most industries contributing to growth.
Dealer machine inventories rose during the third quarter of 2005, but the gain was less than in last year’s third quarter. Worldwide machine inventories, as measured in months of deliveries, were the same as a year earlier.
| · | North America sales were up $601 million or 23 percent from third quarter 2004; sales volume increased $389 million and price realization added $212 million. Low mortgage interest rates and higher home prices pushed housing units under construction to the highest level since the early 1970s, and nonresidential construction benefited from record corporate profits. Higher output prices and increased production boosted mining. |
| · | EAME sales increased 8 percent or $93 million when compared to third quarter 2004. Improved price realization accounted for $65 million, sales volume added $26 million and the remaining $2 million came from the favorable impact of the stronger euro. Sales volume in Europe, where the economy was weak, declined slightly. Economies in Africa/Middle East (AME) and the Commonwealth of Independent States (CIS) benefited from higher commodity prices, particularly energy, and increased production of those commodities. Sales volume in both regions increased significantly. |
| · | Latin America sales rose $129 million or 31 percent from the same quarter last year—$85 million from increased volume, $28 million from improved price realization and the remaining $16 million from a stronger Brazilian real. The region benefited from low domestic interest rates, increased capital inflows and growth in both mining and construction. Sales increased rapidly in Brazil, Mexico and Venezuela, and in most applications throughout the region. |
| · | Asia/Pacific third-quarter sales were 22 percent or $126 million higher than last year—$72 million from higher volume, $48 million from improved price realization and the remaining $6 million due to currency. Fast economic growth in the region has boosted construction, and mining benefited from higher metals and coal prices. Sales in China continued to improve and were significantly above the year earlier quarter. Sales in Australia, where mining has boomed, also increased rapidly. |
Engines Sales
Engine sales were $2.744 billion in third quarter 2005, up $268 million or 11 percent from the third quarter 2004. Price realization accounted for $150 million, and sales volume added $118 million.
Dealer engine inventory declined during the third quarter of 2005, compared to an increase in inventory during the third quarter of 2004. The decline during the third quarter of 2005 reduced the company’s third-quarter sales growth compared to a year ago. Months of inventory relative to deliveries declined in all regions compared to third quarter 2004, as deliveries increased in response to market demand.
| · | North America sales were up 18 percent. Engine sales to the petroleum sector surged 57 percent, primarily from continued growth in demand for reciprocating engines as a result of higher energy prices as well as a strong increase in sales of turbines and turbine-related services driven by higher demand for gas production and transmission. Engine sales to the electric power sector were up 48 percent, with widespread increases in demand for generator sets to support business investments in standby power driven by healthy corporate profits. On-highway truck engine sales increased 3 percent, fueled by high freight demand and continued fleet replacements. Marine engine sales were up 56 percent with strong demand for workboat vessels to support petroleum production. |
| · | EAME sales increased about 9 percent. Electric power engine sales were up 16 percent with widespread strong demand for prime and standby generator sets. Engine sales into the marine sector were up 8 percent with ongoing demand for inland waterway and port support vessels. Petroleum engine sales dropped 18 percent, as decreased sales for gas transmission projects in Europe more than offset an increase in projects for offshore oil production in the AME region. Engine sales to the industrial sector decreased 2 percent, impacted by some Original Equipment Manufacturers’ (OEMs) vertical engine integration and reduced demand for agricultural equipment. |
| · | Latin America sales were up 34 percent. Petroleum engine sales increased 41 percent from increased sales of turbines and turbine-related services, primarily for Mexico offshore oil production projects. Electric power engine sales were up 27 percent, benefiting from increased investment in generator sets for electric reliability, communications applications and rental fleets. |
| · | Asia/Pacific sales were down 18 percent. Marine engine sales were up 38 percent due to continued shipbuilding growth supported by increased freight tonnage. Petroleum engine sales were up 20 percent, primarily due to growing demand for reciprocating engines to support production. Engine sales to the electric power sector dropped 46 percent, primarily due to reduced opportunity for load management generator sets in China, as improved electricity availability and demand management efforts reduced the demand for generator sets. |
Financial Products Revenues
Financial Products revenues were $585 million, up $101 million or 21 percent from third quarter 2004. The increase was due primarily to a $61 million favorable impact from continued growth of earning assets and a $26 million impact of higher interest rates on new and existing finance receivables at Cat Financial.
OPERATING PROFIT
|
| The chart above graphically illustrates reasons for the change in Consolidated Operating Profit between 3rd Quarter 2004 (at left) and 3rd Quarter 2005 (at right). Items favorably impacting operating profit appear as upward stair steps with the corresponding dollar amounts above each bar, while items negatively impacting operating profit appear as downward stair steps with dollar amounts reflected in parentheses above each bar. Caterpillar management utilizes these charts internally to visually communicate with its Board and employees. |
Third-quarter operating profit improved $277 million, or 42 percent over a year ago, driven by higher price realization and sales volume.
Partially offsetting the favorable items were $303 million in higher core operating costs, $71 million of higher retirement benefits and a $25 million unfavorable impact of currency on operating profit. Manufacturing costs represented $236 million of the total increase in core operating costs. Approximately 60 percent of the manufacturing cost increase was attributable to variable cost increases - about half of which is material and the remainder due to volume-related inefficiencies and increased freight and expediting costs. The other 40 percent of the increase in manufacturing costs was the result of a 10 percent, or approximately $90 million, increase in period manufacturing costs to support a 17 percent increase in Machinery and Engines sales volume.
Non-manufacturing related core operating costs were up $67 million—a result of higher Research and Development (R&D) and Selling, General and Administrative (SG&A) expenses to support product programs and the growth in volume. As a percent of sales, the total of SG&A and R&D expenses were lower than in the third quarter of 2004.
Operating Profit by Principal Line of Business |
(Millions of dollars) | 3rd Quarter 2004 | | 3rd Quarter 2005 | | Change $ | | Change % |
| |
| |
| |
| |
|
Machinery1 | $ | 411 | | | $ | 615 | | | $ | 204 | | | | 50% | |
Engines1 | | 155 | | | | 265 | | | | 110 | | | | 71% | |
| Financial Products | | 132 | | | | 123 | | | | (9 | ) | | | (7% | ) |
Consolidating Adjustments | | (35 | ) | | | (63 | ) | | | (28 | ) | | | | |
| |
|
|
| |
|
|
| |
|
|
| | | | |
| Consolidated Operating Profit | $ | 663 | | | $ | 940 | | | $ | 277 | | | | 42% | |
| |
|
|
| |
|
|
| |
|
|
| | | | |
| (1) Caterpillar operations are highly integrated; therefore, the company uses a number of allocations to determine lines of business operating profit for Machinery and Engines. |
Operating Profit by Principal Line of Business
| · | Machinery operating profit of $615 million was up $204 million, or 50 percent, from third quarter 2004. The favorable impact of improved price realization and higher sales volume was partially offset by higher core operating costs and higher retirement benefits. |
| · | Engines operating profit of $265 million was up $110 million, or 71 percent, from third quarter 2004. The favorable impact of improved price realization and higher sales volume was partially offset by higher core operating costs and higher retirement benefits. |
| · | Financial Products operating profit of $123 million was down $9 million, or 7 percent, from third quarter 2004. Cat Insurance experienced a $15 million decrease primarily due to less favorable reserve adjustments in 2005 than in 2004. In addition, there was a $12 million increase in operating expenses primarily related to growth, a $7 million write-down of a marine-related asset, and a $7 million write-off of investment-related income, partially offset by a $36 million favorable impact from the growth in earning assets at Cat Financial. |
Reconciliation of Machinery and Engine Sales by Geographic Region to External Sales by Marketing Segment |
| | Three months ended September 30, |
(Millions of Dollars) | 2005 | | 2004 |
| |
| |
|
North America Geographic Region | $ | 4,497 | | | $ | 3,697 | |
Engine sales included in the Power Products segment | | (1,299 | ) | | | (1,100 | ) |
Company owned dealer sales included in the All Other segment | | (216 | ) | | | (137 | ) |
| Other* | | (147 | ) | | | (171 | ) |
| |
|
|
| |
|
|
|
North America Marketing external sales | $ | 2,835 | | | $ | 2,289 | |
| |
|
|
| |
|
|
|
| EAME Geographic Region | $ | 2,015 | | | $ | 1,853 | |
| Power Products sales not included in the EAME Marketing segment | | (729 | ) | | | (735 | ) |
| Other* | | (226 | ) | | | (171 | ) |
| |
|
|
| |
|
|
|
| EAME Marketing external sales | $ | 1,060 | | | $ | 947 | |
| |
|
|
| |
|
|
|
Latin America Geographic Region | $ | 838 | | | $ | 636 | |
| Power Products sales not included in the Latin America Marketing segment | | (269 | ) | | | (211 | ) |
| Other* | | 25 | | | | 59 | |
| |
|
|
| |
|
|
|
Latin America Marketing external sales | $ | 594 | | | $ | 484 | |
| |
|
|
| |
|
|
|
Asia/Pacific Geographic Region | $ | 1,042 | | | $ | 989 | |
Power Products sales not included in the Asia/Pacific Marketing segment | | (282 | ) | | | (294 | ) |
| Other* | | (159 | ) | | | (211 | ) |
| |
|
|
| |
|
|
|
Asia/Pacific Marketing external sales | $ | 601 | | | $ | 484 | |
| |
|
|
| |
|
|
|
| * Mostly represents external sales of Construction and Mining Products and All Other segments. |
| · | Other income/expense was income of $80 million compared with income of $60 million in third quarter 2004. The improvement was due to higher interest income and the absence of a number of expense items incurred during the third quarter of 2004 that were individually not significant. |
| · | The provision for income taxes in the third quarter reflects an estimated annual tax rate of 30 percent as compared to a 27 percent rate in 2004. The increase is primarily due to a reduction in our estimated Extraterritorial Income Exclusion (ETI) benefits, partially attributable to the impact of American Jobs Creation Act (AJCA) permitting only 80 percent of ETI benefits in 2005, and also to a change in our geographic mix of profits. Our estimated annual tax rate excludes the $11 million discrete charge recorded in the second quarter for our repatriation plans including the impact of the AJCA. The third quarter 2005 provision for income taxes includes an unfavorable adjustment of $18 million related to the first six months of 2005 resulting from an increase in the estimated annual tax rate from 29 to 30 percent. The change in the estimated rate was primarily from changes in our estimated tax benefits from ETI. |
NINE MONTHS ENDED SEPTEMBER 30, 2005 COMPARED WITH NINE MONTHS ENDED SEPTEMBER 30, 2004
SALES AND REVENUES
|
| The chart above graphically illustrates reasons for the change in Consolidated Sales and Revenues between the nine months ended September 30, 2004 (at left) and nine months ended September 30, 2005 (at right). Items favorably impacting sales and revenues appear as upward stair steps with the corresponding dollar amounts above each bar. Caterpillar management utilizes these charts internally to visually communicate with its Board and employees. |
Sales and revenues for the nine months ended September 30, 2005 were $26.676 billion, up $4.954 billion or 23 percent from the nine months ended September 30, 2004. Machinery volume was up $2.350 billion, price realization improved $1.223 billion, Engines volume was up $902 million, Financial Products revenues increased $266 million and currency had a positive impact on sales of $213 million, due primarily to a stronger euro compared with the nine months ended September 30, 2004.
Sales and Revenues by Geographic Region |
(Millions of dollars) | Total | | % Change | | North America | | % Change | | EAME | | % Change | | Latin America | | % Change | | Asia/ Pacific | | % Change |
| |
| |
| |
| |
| |
| |
| |
| |
| |
| |
|
Nine months ended
September 30, 2005 | | | | | | | | | | | | | | | | | | | | | | | | |
| Machinery | $ | 17,074 | | 25% | | $ | 9,447 | | 25% | | $ | 3,984 | | 23% | | $ | 1,517 | | 43% | | $ | 2,126 | | 16% |
Engines1 | | 7,891 | | 20% | | | 3,725 | | 25% | | | 2,508 | | 23% | | | 695 | | 19% | | | 963 | | (3%) |
Financial Products2 | | 1,711 | | 18% | | | 1,212 | | 19% | | | 256 | | 2% | | | 105 | | 25% | | | 138 | | 52% |
| |
|
| | | |
|
| | | |
|
| | | |
|
| | | |
|
| | |
| | $ | 26,676 | | 23% | | $ | 14,384 | | 25% | | $ | 6,748 | | 22% | | $ | 2,317 | | 34% | | $ | 3,227 | | 10% |
| |
|
| | | |
|
| | | |
|
| | | |
|
| | | |
|
| | |
Nine months ended
September 30, 2004 | | | | | | | | | | | | | | | | | | | | | | | | |
| Machinery | $ | 13,687 | | | | $ | 7,554 | | | | $ | 3,232 | | | | $ | 1,063 | | | | $ | 1,838 | | |
Engines1 | | 6,590 | | | | | 2,971 | | | | | 2,039 | | | | | 586 | | | | | 994 | | |
Financial Products2 | | 1,445 | | | | | 1,020 | | | | | 250 | | | | | 84 | | | | | 91 | | |
| |
|
| | | |
|
| | | |
|
| | | |
|
| | | |
|
| | |
| | $ | 21,722 | | | | $ | 11,545 | | | | $ | 5,521 | | | | $ | 1,733 | | | | $ | 2,923 | | |
| |
|
| | | |
|
| | | |
|
| | | |
|
| | | |
|
| | |
| (1) Does not include internal engine transfers of $1,607 million and $1,318 million in 2005 and 2004, respectively. Internal engine transfers are valued at prices comparable to those for unrelated parties. |
| (2) Does not include revenues earned from Machinery and Engines of $224 million and $142 million in 2005 and 2004, respectively. |
Machinery Sales
Machinery sales were $17.074 billion for the nine months ended September 30, 2005, an increase of $3.387 billion or 25 percent from the nine months ended September 30, 2004. Sales through the first nine months were a record. Sales volume accounted for $2.350 billion of the increase, price realization added $887 million and the remaining $150 million was due to currency. Low interest rates and good profits encouraged businesses in many countries to increase capital expenditures. As a result, dealers increased deliveries to end users in all regions and in all industries. Dealers also increased inventories to support higher deliveries: however, worldwide machine inventories on September 30, 2005, as measured in months of deliveries, were the same as a year earlier.
| · | North America sales were up $1.893 billion or 25 percent; sales volume increased $1.369 billion and improved price realization added $524 million. Sales benefited from a continued increase in housing construction, a further recovery in nonresidential construction and gains in many commodity prices. Dealer deliveries into all industries increased from the first nine months of 2004, generally by double-digit percentage increases. |
| · | EAME sales increased 23 percent or $752 million when compared to the nine months ended September 30, 2004. Sales volume accounted for $471 million, improved price realization added $182 million and the remaining $99 million came from the favorable impact of the stronger euro. In Europe, low interest rates and rising profits encouraged businesses to increase capital spending and sales volume increased slightly. Volume increased much faster in both Africa/Middle East and the CIS, the result of healthy economic growth and high commodity prices. |
| · | Latin America sales rose $454 million or 43 percent from the nine months ended September 30, 2004—$337 million from increased volume, $85 million from improved price realization and the remaining $32 million from a stronger Brazilian real. The regional economy continued to recover, with good growth in both mining and construction. Brazil, Mexico, Venezuela and Peru, all with sales volume up by more than a third, accounted for a significant part of the growth. |
| · | Asia/Pacific sales for the first nine months of 2005 were 16 percent or $288 million higher than the year earlier period -- $173 million from volume, $96 million from improved price realization and the remaining $19 million from currency. Sales in China declined because first half results were still impacted by government actions to slow construction last year. The decline in China was more than offset by significant gains in Australia, Indonesia and India, where mining boomed. |
Engine sales were $7.891 billion in the nine months ended September 30, 2005, up $1.301 billion or 20 percent from the nine months ended September 30, 2004. Sales volume accounted for $902 million of the increase, price realization added $336 million and the remaining $63 million was due to currency.
Dealer engine inventory increased during the nine months ended September for both 2004 and 2005. The 2005 increase was less than the 2004 increase, which reduced the company’s year to date sales growth compared to a year ago. Months of inventory relative to deliveries declined in all regions compared to year to date 2004, as deliveries increased in response to market demand.
| · | North America sales were up 25 percent. Engine sales to the on-highway truck sector grew 18 percent, as the industry continued to grow capacity in response to strong freight demand, healthy carrier profits and replacements from relatively high fleet age. Engine sales to the petroleum sector surged 59 percent, primarily from continued growth in demand for reciprocating engines as a result of higher energy prices as well as a strong increase in sales of turbines and turbine-related services driven by higher demand for gas production and transmission. Electric power engine sales were up 21 percent, with widespread increases in demand for generator sets to support business investments in standby power, partially offset by reduced sales of turbines and turbine related services for power plants. Marine engine sales were up 33 percent with strong demand for workboat vessels to support petroleum production. |
| · | EAME sales increased about 23 percent. Electric power engine sales were up 46 percent with widespread strong demand for prime and standby generator sets, and incremental sales from the acquisition of Turbomach. Engine sales into the marine sector were up 35 percent with ongoing demand for inland waterway and port support vessels. Industrial engine sales increased 14 percent with widespread demand for various types of Original Equipment Manufacturers (OEMs) equipment. Petroleum engine sales dropped 24 percent, as decreased sales for gas transmission projects in Europe more than offset an increase in projects for offshore oil production in the AME region. |
| · | Latin America sales were up 19 percent. Petroleum engine sales increased 23 percent from increased sales of turbines and turbine-related services, primarily for Mexico offshore oil production projects and investments in production capacity. Electric power engine sales were up 20 percent, benefiting from increased investment in generator sets for electric reliability, communications applications and rental fleets. |
| · | Asia/Pacific sales were down 3 percent. Marine engine sales were up 39 percent due to continued shipbuilding growth supported by increased freight tonnage, as well as increased demand for workboats and pleasure craft. Petroleum engine sales were up 11 percent, due to growing demand for reciprocating engines, turbines and turbine related services to support exploration and production. Engine sales to the electric power sector dropped 20 percent, primarily due to reduced opportunity for load management generator sets in China, as improved electricity availability and demand management efforts reduced the demand for generator sets. |
Financial Products Revenues
Financial Products revenues were $1.711 billion, up $266 million or 18 percent from the nine months ended September 30, 2004. The increase was due primarily to a $169 million favorable impact from continued growth of Earning Assets and a $55 million impact of higher interest rates on new and existing finance receivables at Cat Financial.
|
| The chart above graphically illustrates reasons for the change in Consolidated Operating Profit between the nine months ended September 30, 2004 (at left) and nine months ended September 30, 2005 (at right). Items favorably impacting operating profit appear as upward stair steps with the corresponding dollar amounts above each bar, while items negatively impacting operating profit appear as downward stair steps with dollar amounts reflected in parentheses above each bar. Caterpillar management utilizes these charts internally to visually communicate with its Board and employees. |
Higher sales and revenues in almost all regions and industries resulted in a favorable operating profit impact of $716 million, or 36 percent compared to the first nine months of 2004. This increase was driven by higher price realization of $1.223 billion and higher sales volume of $1.084 billion. In addition, Financial Products contributed $32 million to the increase in operating profit.
Partially offsetting the favorable items were $1.268 billion in higher core operating costs, $180 million of higher retirement benefits and a $94 million unfavorable impact of currency on operating profit. Manufacturing costs represented $1.071 billion of the total increase in core operating costs. Roughly 70 percent of the manufacturing cost increase was attributable to variable cost increases - approximately three-fourths of which resulted from higher material costs (primarily steel) with the remainder related to supply chain inefficiencies. The remaining 30 percent of the increase in manufacturing costs was the result of a 12 percent, or approximately $320 million, increase in period manufacturing costs to support a 26 percent increase in Machinery and Engines sales. Non-manufacturing related core operating costs were up $197 million - a result of higher Selling, General and Administrative (SG&A) and Research and Development (R&D) expenses to support the growth in volume and product programs. As a percent of sales, the total of SG&A and R&D expenses were lower than the nine months ended September 30, 2004.
Operating Profit by Principal Line of Business |
(Millions of dollars) | Nine Months Ended September 30, 2004 | | Nine Months Ended September 30, 2005 | | Change $ | | Change % |
| |
| |
| |
| |
|
Machinery1 | $ | 1,390 | | | $ | 1,787 | | | $ | 397 | | | | 29% | |
Engines1 | | 345 | | | | 713 | | | | 368 | | | | 107% | |
| Financial Products | | 357 | | | | 389 | | | | 32 | | | | 9% | |
| Consolidating Adjustments | | (91 | ) | | | (172 | ) | | | (81 | ) | | | | |
| |
|
|
| |
|
|
| |
|
|
| | | | |
| Consolidated Operating Profit | $ | 2,001 | | | $ | 2,717 | | | $ | 716 | | | | 36% | |
| |
|
|
| |
|
|
| |
|
|
| | | | |
| (1) Caterpillar operations are highly integrated; therefore, the company uses a number of allocations to determine lines of business operating profit for Machinery and Engines. |
Operating Profit by Principal Line of Business
| · | Machinery operating profit of $1.787 billion was up $397 million, or 29 percent, from the nine months ended September 30, 2004. The favorable impact of improved price realization and higher sales volume was partially offset by higher core operating costs, higher retirement benefits and the unfavorable impact of currency. |
| · | Engines operating profit of $713 million was up $368 million, or 107 percent, from the nine months ended September 30, 2004. The favorable impact of improved price realization and higher sales volume was partially offset by higher core operating costs, higher retirement benefits and the unfavorable impact of currency. |
| · | Financial Products operating profit of $389 million was up $32 million, or 9 percent, from the nine months ended September 30, 2004. The increase was primarily due to a $100 million impact from the growth of earning assets and a $13 million impact of a lower provision for credit losses due to improved portfolio health at Cat Financial. These favorable items were partially offset by a $34 million increase in operating expenses primarily related to portfolio growth, a $16 million impact of lower interest spreads, and a $7 million write-down of a marine related asset at Cat Financial and a decrease of $22 million at Cat Insurance primarily due to less favorable reserve adjustments in 2005 than in 2004. |
Reconciliation of Machinery and Engine Sales by Geographic Region to External Sales by Marketing Segment |
| | Nine months ended September 30, |
(Millions of Dollars) | 2005 | | 2004 |
| |
| |
|
North America Geographic Region | $ | 13,172 | | | $ | 10,525 | |
Engine sales included in the Power Products segment | | (3,725 | ) | | | (2,971 | ) |
Company owned dealer sales included in the All Other segment | | (624 | ) | | | (393 | ) |
| Other* | | (421 | ) | | | (439 | ) |
| |
|
|
| |
|
|
|
North America Marketing external sales | $ | 8,402 | | | $ | 6,722 | |
| |
|
|
| |
|
|
|
| | | | | | | | |
| EAME Geographic Region | $ | 6,492 | | | $ | 5,271 | |
| Power Products sales not included in the EAME Marketing segment | | (2,308 | ) | | | (1,981 | ) |
| Other* | | (807 | ) | | | (488 | ) |
| |
|
|
| |
|
|
|
EAME Marketing external sales | $ | 3,377 | | | $ | 2,802 | |
| |
|
|
| |
|
|
|
Latin America Geographic Region | $ | 2,212 | | | $ | 1,649 | |
| Power Products sales not included in the Latin America Marketing segment | | (648 | ) | | | (560 | ) |
| Other* | | 115 | | | | 138 | |
| |
|
|
| |
|
|
|
Latin America Marketing external sales | $ | 1,679 | | | $ | 1,227 | |
| |
|
|
| |
|
|
|
Asia/Pacific Geographic Region | $ | 3,089 | | | $ | 2,832 | |
Power Products sales not included in the Asia/Pacific Marketing segment | | (719 | ) | | | (684 | ) |
| Other* | | (522 | ) | | | (566 | ) |
| |
|
|
| |
|
|
|
Asia/Pacific Marketing external sales | $ | 1,848 | | | $ | 1,582 | |
| |
|
|
| |
|
|
|
| * Mostly represents external sales of Construction and Mining Products and All Other segments. |
OTHER PROFIT/LOSS ITEMS
| · | Other income/expense was income of $278 million compared with income of $171 million in the nine months ended September 30, 2004. The improvement was primarily due to the favorable impact of currency gains of $74 million and higher interest income of $10 million. |
| · | The provision for income taxes in the third quarter reflects an estimated annual tax rate of 30 percent, excluding the discrete items discussed below, and compares to a 27 percent rate in 2004. The increase is primarily due to a reduction in our estimated Extraterritorial Income Exclusion (ETI) benefits partially attributable to the impact of American Jobs Creation Act (AJCA) permitting only 80 percent of ETI benefits in 2005 and also to a change in our geographic mix of profits. |
| | In the second quarter, we completed our evaluation of the repatriation provisions of the American Jobs Creation Act and recognized an income tax charge of $49 million under the provisions of the Act. We expect to repatriate earnings of approximately $1.4 billion in 2005, which includes $500 million subject to the preferential tax treatment allowed by the Act. In connection with our current repatriation plan, we have changed our intention of repatriating earnings of a few selected non-U.S. subsidiaries and have recognized an income tax benefit of $38 million. The net impact of these items was an $11 million discrete charge to our second quarter provision for income taxes. |
| · | The equity in profit/loss of unconsolidated affiliated companies favorably impacted profit by $24 million over the nine months ended September 30, 2004, primarily driven by increased profitability at Shin Caterpillar Mitsubishi Ltd. (SCM). |
GLOSSARY OF TERMS
| 1. | Consolidating Adjustments - Eliminations of transactions between Machinery and Engines and Financial Products. |
| 2. | Core Operating Costs - Machinery and Engines variable manufacturing cost change adjusted for volume and change in period costs. Excludes the impact of currency and retirement benefits. |
| 3. | Currency - With respect to sales and revenues, currency represents the translation impact on sales resulting from changes in foreign currency exchange rates versus the U.S. dollar. With respect to operating profit, currency represents the net translation impact on sales and operating costs resulting from changes in foreign currency exchange rates versus the U.S. dollar. Currency includes the impacts on sales and operating profit for the Machinery and Engines lines of business only; currency impacts on the Financial Products line of business are included in the Financial Products portions of the respective analyses. With respect to profit before tax, currency represents the net translation impact on sales, operating costs and other income/expense resulting from changes in foreign currency exchange rates versus the U.S. dollar. Also included in the currency impact on other income/expense are the effects of currency forward and option contracts entered into by the company to reduce the risk of fluctuations in exchange rates and the net effect of changes in foreign currency exchange rates on our foreign currency assets and liabilities. |
| 4. | EAME - Geographic region including Europe, Africa, the Middle East and the Commonwealth of Independent States (CIS). |
| 5. | Earning Assets - These assets consist primarily of total net finance receivables plus retained interests in securitized trade receivables, plus equipment on operating leases, less accumulated depreciation at Cat Financial. Net finance receivables represent the gross receivables amount less unearned income and the allowance for credit losses. |
| 6. | Engines - A principal line of business including the design, manufacture, marketing and sales of engines for Caterpillar machinery, electric power generation systems; on-highway vehicles and locomotives; marine, petroleum, construction, industrial, agricultural and other applications; and related parts. Reciprocating engines meet power needs ranging from 5 to over 22,000 horsepower (4 to over 16 200 kilowatts). Turbines range from 1,200 to 20,500 horsepower (900 to 15 000 kilowatts). |
| 7. | Financial Products - A principal line of business consisting primarily of Caterpillar Financial Services Corporation (Cat Financial), Caterpillar Insurance Holdings, Inc. (Cat Insurance), Caterpillar Power Ventures Corporation (Cat Power Ventures) and their respective subsidiaries. Cat Financial provides a wide range of financing alternatives to customers and dealers for Caterpillar machinery and engines, Solar gas turbines, as well as other equipment and marine vessels. Cat Financial also extends loans to customers and dealers. Cat Insurance provides various forms of insurance to customers and dealers to help support the purchase and lease of our equipment. Cat Power Ventures is an active investor in independent power projects using Caterpillar power generation equipment and services. |
| 8. | Latin America - Geographic region including the Central and South American countries and Mexico. |
| 9. | Machinery - A principal line of business which includes the design, manufacture, marketing and sales of construction, mining and forestry machinery-track and wheel tractors, track and wheel loaders, pipelayers, motor graders, wheel tractor-scrapers, track and wheel excavators, backhoe loaders, log skidders, log loaders, off-highway trucks, articulated trucks, paving products, telescopic handlers, skid steer loaders and related parts. Also includes logistics services for other companies. |
| 10. | Machinery and Engines - Due to the highly integrated nature of operations, represents the aggregate total of the Machinery and Engines lines of business and includes primarily our manufacturing, marketing and parts distribution operations. |
| 11. | Manufacturing Costs - Represents our cost of goods sold. Comprised of variable costs adjusted for volume and period manufacturing costs. Variable manufacturing costs are defined as having a direct relationship with the volume of production. This includes material costs, direct labor and other costs that vary directly with production volume such as freight, power to operate machines, and supplies that are consumed in the manufacturing process. Period manufacturing costs support production but are defined as generally not having a direct relationship to short-term changes in volume. Examples include machine and equipment repair, depreciation on manufacturing assets, facility support, procurement, factory scheduling, manufacturing planning and operations management. Excludes the impact of currency and retirement benefits. |
| 12. | Period Costs - Comprised of Machinery and Engines period manufacturing costs, SG&A expense, R&D expense and other operating costs. Excludes the impact of currency and retirement benefits. |
| 13. | Price Realization - The impact of net price changes excluding currency. |
| 14. | Retirement Benefits - Cost of defined benefit pension plans, defined contribution plans and retirement healthcare and life insurance. |
| 15. | Sales Volume - With respect to sales and revenues, sales volume represents the impact of changes in the quantities sold for machines, engines and parts. With respect to operating profit, sales volume represents the impact of changes in the quantities sold for machines, engines and parts combined with the net operating profit impact of changes in the relative weighting of machines, engines and parts sales with respect to total sales. |
| 16. | 6 Sigma - On a technical level, 6 Sigma represents a measure of variation that achieves 3.4 defects per million opportunities. At Caterpillar, 6 Sigma represents a much broader cultural philosophy to drive continuous improvement throughout the value chain. It is a fact-based, data-driven methodology that we are using to improve processes, enhance quality, cut costs, grow our business and deliver greater value to our customers through Black Belt-led project teams. At Caterpillar, 6 Sigma goes beyond mere process improvement—it has become the way we work as teams to process business information, solve problems and manage our business successfully. |
C. Liquidity & Capital Resources
Sources of funds
We generate our capital resources primarily through operations and, in 2004, through collections of certificated retained interests in trade receivables. Collections of certificated retained interests took place when Cat Financial collected cash on their portion of the securitized trade receivables they had placed in a trust. We have not had collections of certificated retained interests in trade receivables in 2005 because the trust did not meet the criteria for a qualifying special purpose entity (QSPE). From September 2004 through May 2005 we consolidated the trust and included the assets and related cash flows in “Receivables - trade and other” in the Consolidated Statement of Financial Position and the Consolidated Statement of Cash Flow, respectively. In June 2005, the trust was terminated and $240 million of receivables held by the trust were transferred back to Cat Financial, who then transferred an undivided interest in the $240 million of receivables to conduit purchasers. In accordance with Statement of Financial Accounting Standard No. 140 (SFAS 140), “Accounting for Transfers and Servicing of Financial Assets and Extinguishment of Liabilities,“ the latter transfer was accounted for as a sale.
Through the third quarter of 2005, operating cash flow was $2.13 billion. Through the third quarter of 2004, operating cash flow was negative $5.08 billion, and collections of certificated retained interests in trade receivables were $5.72 billion totaling $645 million. The increase from $645 million through the third quarter of 2004 to $2.13 billion through the third quarter of 2005 is primarily the result of higher profitability and lower working capital requirements. We anticipate that the majority of future capital resource requirements will be funded by operating cash flow, which is largely sourced from profits. See our Outlook on page 52.
Page 37
Total debt as of September 30, 2005, was $25.03 billion, an increase of $1.51 billion from year-end 2004. Debt related to Machinery and Engines increased $481 million, primarily to support the stock repurchase program and the payment of dividends. On September 13, 2005, $116 million of 9.375 percent debentures due in 2021 and $118 million of 8.00 percent debentures due in 2023 were exchanged for $307 million of 5.30 percent debentures due in 2035 and $23 million of cash. Debt related to Financial Products increased $1.03 billion due to growth at Cat Financial. We have three global credit facilities with a syndicate of banks totaling $5.75 billion available in the aggregate to both Machinery and Engines and Financial Products to support commercial paper programs. Based on management's allocation decision, which can be revised at any time, the portion of the facility available to Cat Financial at September 30, 2005 was $5.15 billion. A five-year facility of $1.63 billion expires in September 2010, and a five-year facility of $2.5 billion with four years remaining expires in September 2009. The 364-day facility of $1.63 billion expires in September 2006. The facility expiring in September 2006 has a provision that allows Caterpillar or Cat Financial to obtain a one-year loan in September 2006 that would mature in September 2007. As part of the 2005 global credit facilities renewal, Cat Financial's year-end leverage covenant has been increased to 8.5:1, from the previous level of 8:1, which aligns it with the 8.5:1 six-month moving average leverage covenant. Our total credit commitments as of September 30, 2005 were:
| | (Millions of dollars) |
| | | | Machinery | | Financial |
| | Consolidated | | and Engines | | Products |
| |
| |
| |
|
| Credit lines available: | | | | | | | | | | | |
| | Global credit facility | $ | 5,750 | | | $ | 600 | | | $ | 5,150 | |
| | Other external | | 2,210 | | | | 864 | | | | 1,346 | |
|
| |
| |
|
| Total credit lines available | | 7,960 | | | | 1,464 | | | | 6,496 | |
| Less: Global credit facility supporting commercial paper | | 5,174 | | | | 500 | | | | 4,674 | |
| Less: Utilized credit | | 720 | | | | 104 | | | | 616 | |
| |
|
|
| |
|
|
| |
|
|
|
| Available credit | $ | 2,066 | | | $ | 860 | | | $ | 1,206 | |
| |
|
|
| |
|
|
| |
|
|
|
We also generate funding through the securitization and sale of receivables/leases where the investors and/or the securitization trusts have limited or no recourse to Caterpillar or Cat Financial. During the first nine months of 2005 Cat Financial received $850 million in net proceeds from a public securitization of retail installment sale contracts and finance leases, which included cash proceeds and retained interests.
We do not generate material funding through structured finance transactions.
Machinery and Engines
Net cash provided by operating activities was $1.94 billion compared with $758 million for the same period a year ago. The favorable change is due to higher profit and lower working capital requirements, primarily inventory.
Pursuant to the share repurchase program authorized by the Board of Directors in October 2003, $1.04 billion was spent to purchase 22.1 million shares through the third quarter of 2005. There were 680 million shares outstanding at the end of September 30, 2005. The goal of the share repurchase program, which expires in October 2008, is to reduce the company’s outstanding shares to 640 million.
Capital expenditures, excluding equipment leased to others, during the nine months ended September 30, 2005 were $677 million, an increase of $217 million from the same period a year ago. The increase is a result of increased spending to support growth and new product introductions.
Financial Products
Operating cash flow was $782 million through the third quarter 2005, compared with $796 million for the same period a year ago. Cash used to purchase equipment leased to others was $965 million through the third quarter of 2005, an increase of $140 million from the same period a year ago. In addition, net cash used for finance receivables and retained interests in securitized assets was $2.13 billion through the third quarter of 2005, compared to $2.07 billion through the third quarter of 2004.
Financial Products total borrowings were $20.79 billion at September 30, 2005, an increase of $1.03 billion from December 31, 2004 due to financing a higher amount of assets. Debt repayment in Financial Products depends primarily on timely repayment and collectibility of the receivables portfolio. At September 30, 2005, finance receivables past due over 30 days were 1.65 percent, compared with 2.18 percent at the end of September 30, 2004. The allowance for credit losses was 1.37 percent of finance receivables, net of unearned income, at September 30, 2005, compared to 1.40 percent at September 30, 2004. Receivables written off due to uncollectibility, net of recoveries on receivables previously written off, were $22 million and $47 million for the nine months ended September 30, 2005 and 2004, respectively.
2004 Cash Flow Reclassification
In the fourth quarter of 2004, we changed how we classify cash flows related to trade receivables securitized through Cat Financial and wholesale inventory receivables financed by Cat Financial. Amounts reported in our Consolidated Statement of Cash Flow for the nine months ended September 30, 2004 have been reclassified to conform to this presentation. These reclassifications had no impact on the “Increase in Cash and Short-term Investments” on the Consolidated Statement of Cash Flow.
Consolidated cash flow for the nine months ended September 30, 2004 has been reclassified as follows:
| | Nine Months Ended September 30, 2004 |
(Millions of dollars) | Previous Classification1 | | Change | | As Reclassified |
| |
| |
| |
|
Consolidated Statement of Cash Flow | | | | | | | | | | | |
| Receivables - trade and other | $ | (461 | ) | | $ | (6,649 | ) | | $ | (7,110 | ) |
Net cash provided by (used for) operating activities | | 1,535 | | | | (6,612 | ) | | | (5,077 | ) |
| Additions to finance receivables | | (16,493 | ) | | | 10,070 | | | | (6,423 | ) |
| Collections of finance receivables | | 13,010 | | | | (8,393 | ) | | | 4,617 | |
| Proceeds from sale of finance receivables | | 1,434 | | | | (787 | ) | | | 647 | |
| Collections of retained interests in securitized trade receivables | | - | | | | 5,722 | | | | 5,722 | |
Net cash provided by (used for) investing activities | | (3,341 | ) | | | 6,612 | | | | 3,271 | |
| |
| (1) Certain amounts do not agree to prior period reported amounts due to unrelated reclassifications. |
D. Critical Accounting Policies
The preparation of financial statements in conformity with generally accepted accounting principles requires management to make estimates and assumptions that affect reported amounts. The more significant estimates include: residual values for leased assets, fair market values for goodwill impairment tests, warranty liability, and reserves for product liability and insurance losses, postretirement benefits, post-sale discounts, credit losses and income taxes. We have incorporated many years of data into the determination of each of these estimates and we have not historically experienced significant adjustments. These assumptions are reviewed at least annually with the Audit Committee of the Board of Directors. Following are the methods and assumptions used in determining our estimates and an indication of the risks inherent in each.
Residual values for leased assets - Determined based on the product, specifications, application and hours of usage. Each product has its own model for evaluation that includes market value cycles and forecasts. Consideration is also given to the amount of assets that will be returned from lease during a given time frame. Residual values could decline due to economic factors, obsolescence or other adverse circumstances.
Fair market values for goodwill impairment tests - Determined for each reporting unit by discounting projected cash flow for five years and adding a year-five residual value based upon a market Earnings Before Interest, Taxes, Depreciation and Amortization (EBITDA) multiple. The estimated fair value could be impacted by changes in interest rates, growth rates, costs, capital expenditures and market conditions.
Warranty liability - Determined by applying historical claim rate experience to the current field population and dealer inventory. Historical claim rates are developed using a rolling average of actual warranty payments. Effective in the third quarter of 2004, we refined our process to utilize more detailed claim rates by product. This provides more comprehensive product warranty information for management. This change did not have a material impact on our financial statements. Warranty payments may differ from those estimated if actual claim rates are higher or lower than our historical rates. Our warranty liability also includes deferred revenue related to extended warranty contracts, which is recognized in income when the related costs are incurred.
Product liability and insurance loss reserve - Determined based upon reported claims in process of settlement and actuarial estimates for losses incurred but not reported. Loss reserves, including incurred but not reported reserves, are based on estimates and ultimate settlements may vary significantly from such estimates due to increased claims frequency or severity over historical levels.
Postretirement benefits - Primary actuarial assumptions are determined as follows:
| · | The U.S. expected long-term rate of return on plan assets is based on our estimate of long-term passive returns for equities and fixed income securities weighted by the allocation of our plan assets. Based on historical performance, we increase the passive returns due to our active management of the plan assets. A similar process is used to determine the rate for our non-U.S. pension plans. This rate is impacted by changes in general market conditions, but because it represents a long-term rate, it is not significantly impacted by short-term market swings. Changes in our allocation of plan assets would also impact this rate. For example, a shift to more fixed income securities would lower the rate. A decrease in the rate would increase our expense. |
| · | The assumed discount rate is used to discount future benefit obligations back to today's dollars. The U.S. discount rate is based on the Moody's Aa bond yield as of our measurement date, November 30, and represents the rate at which our benefit obligations could effectively be settled. A similar process is used to determine the assumed discount rate for our non-U.S. plans. This rate is sensitive to changes in interest rates. A decrease in the discount rate would increase our obligation and future expense. |
| · | The expected rate of compensation increase is used to develop benefit obligations using projected pay at retirement. It represents average long-term salary increases. This rate is influenced by our long-term compensation policies. An increase in the rate would increase our obligation and expense. |
| · | The assumed health care trend rate represents the rate at which health care costs are assumed to increase and is based on historical and expected experience. Changes in our projections of future health care costs due to general economic conditions and those specific to health care (e.g. technology driven cost changes) will impact this trend rate. An increase in the trend rate would increase our obligation and expense. |
Post-sale discount reserve - The company extends numerous merchandising programs that provide discounts to dealers as products are sold to end users. The reserve is determined based on historical data adjusted for known changes in merchandising programs. Discounts paid may differ from those estimated if actual program usage is higher or lower than our historical or expected rates.
Credit loss reserve - The allowance for credit losses is evaluated on a regular basis and adjusted based upon management’s best estimate of probable losses inherent in our finance receivables. In estimating probable losses, we review accounts that are past due, non-performing, or in bankruptcy. We also review accounts that may be at risk using information available about the customer, such as financial statements, news reports, and published credit ratings. We also use general information regarding industry trends and the general economic environment. Using an estimate of current fair market value of collateral and factoring in credit enhancements, such as additional collateral and third party guarantees, we arrive at an estimated loss for specific accounts and estimate an additional amount for the remainder of the finance receivables based upon historical trends. Adverse economic conditions or other factors that might cause deterioration of the financial health of our customers could change the timing and level of payments received and thus necessitate a change in our estimated losses.
Income tax reserve - Despite our belief that our tax return positions are consistent with applicable tax law, we believe that certain positions are likely to be challenged by taxing authorities. Settlement of any challenge can result in no change, a complete disallowance, or some partial adjustment reached through negotiations or litigation. Significant judgment is required in evaluating our tax reserves. Our reserves are adjusted in light of changing facts and circumstances, such as the progress of our tax audits. Our income tax expense includes the impact of reserve provisions and changes to reserves that we consider appropriate, as well as related interest. Unfavorable settlement of any particular issue would require use of our cash. Favorable resolution would be recognized as a reduction to income tax expense at the time of resolution.
EMPLOYMENT
At the end of the third quarter, worldwide employment was 83,899 compared with 75,530 one year ago. The increase was primarily due to about 4,300 hourly labor additions to support higher volume and the conversion of about 2,000 supplemental employees to full-time employment.
OTHER MATTERS
Environmental and Legal Matters
The company is regulated by federal, state, and international environmental laws governing our use of substances and control of emissions in all our operations. Compliance with these existing laws has not had a material impact on our capital expenditures or earnings.
We are cleaning up hazardous waste at a number of locations, often with other companies, pursuant to federal and state laws. When it is probable we will pay cleanup costs at a site and those costs can be estimated, the costs are charged against our earnings. In formulating that estimate, we do not consider amounts expected to be recovered from insurance companies and others.
The amount recorded for environmental cleanup is not material and is included in "Accrued expenses" in the Consolidated Statement of Financial Position. If a range of liability estimates is available on a particular site, we accrue at the lower end of that range. We cannot estimate costs on sites in the very early stages of cleanup. Currently, we have several sites in the very early stages of cleanup, and there is no more than a remote chance that a material amount for cleanup will be required.
We have disclosed certain individual legal proceedings in this filing. Additionally, we are involved in other unresolved legal actions that arise in the normal course of business. The most prevalent of these unresolved actions involve disputes related to product design, manufacture and performance liability (including claimed asbestos and welding fumes exposure), contracts, employment issues and intellectual property rights. Although it is not possible to predict with certainty the outcome of these unresolved legal actions or the range of probable loss, we believe that these unresolved legal actions will not individually or in the aggregate have a material impact on our consolidated financial position, liquidity or results of operations.
On January 16, 2002, Caterpillar commenced an action in the Circuit Court of the Tenth Judicial Circuit of Illinois in Peoria, Illinois, against Navistar International Transportation Corporation and International Truck and Engine Corporation (collectively Navistar). The lawsuit arises out of a long-term purchase contract between Caterpillar and Navistar effective May 31, 1988, as amended from time to time (the Purchase Agreement). The pending complaint alleges, among other things, that Navistar breached its contractual obligations by: (i) paying Caterpillar $8.08 less per fuel injector than the agreed upon price for new unit injectors delivered by Caterpillar; (ii) refusing to pay contractually agreed upon surcharges owed as a result of Navistar ordering less than planned volumes of replacement unit injectors; and (iii) refusing to pay contractually agreed upon interest stemming from Navistar's late payments. As of September 30, 2005, the net past due receivable from Navistar regarding the foregoing and included in “Long-term receivables - trade and other” in the Consolidated Statement of Financial Position totaled $139 million. The pending complaint also has claims alleging that Newstream Enterprises and Navistar, collectively and individually, failed to pay the applicable price to Caterpillar for shipments of unit injectors to Newstream. As of September 30, 2005, the net past due receivables for the foregoing, included in “Long-term receivables - trade and other” in the Consolidated Statement of Financial Position totaled $12 million. The pending complaint further alleges that Sturman Industries, Inc. and Sturman Engine Systems, Inc. colluded with Navistar to utilize technology that Sturman Industries, Inc. misappropriated from Caterpillar to help Navistar develop its G2 fuel system, and tortiously interfered with the Purchase Agreement and Caterpillar's prospective economic relationship with Navistar. The pending complaint further alleges that the two parties' collusion led Navistar to select Sturman Engine Systems, Inc., and another company, instead of Caterpillar, to develop and manufacture the G2 fuel system.
On September 30, 2005, International Truck and Engine Corporation (International) commenced an action against Caterpillar in the Circuit Court of the Tenth Judicial Circuit of Illinois in Peoria, Illinois. The lawsuit states that it arises out of the May 31, 1988 Purchase Agreement described above. The Complaint alleges, among other things, that Caterpillar procured the May 31, 1988 Purchase Agreement by fraudulently misrepresenting or concealing information related to the business of selling fuel injectors to International, and that Caterpillar breached the Purchase Agreement. International’s Complaint does not specify the amount of damages being sought. Caterpillar intends to defend itself vigorously in this case.
On May 7, 2002, International commenced an action against Caterpillar in the Circuit Court of DuPage County, Illinois regarding a long-term agreement term sheet ("term sheet") (the “first lawsuit”). In its sixth amended complaint in the first lawsuit, International alleged that the term sheet constitutes a legally binding contract for the sale of heavy-duty engines at specified prices through the end of 2006, alleged that Caterpillar breached the term sheet by, among other things, raising certain prices effective October 1, 2002, and also alleged that Caterpillar breached an obligation to negotiate a comprehensive long-term agreement referenced in the term sheet. International sought declaratory and injunctive relief as well as damages in an amount to be determined at trial. Caterpillar denied International's claims and filed a counterclaim seeking a declaration that the term sheet had been effectively terminated. Caterpillar also asserted that pursuant to a subsequent agreement International released Caterpillar from certain of its claims. On September 24, 2003 the Appellate Court of Illinois, ruling on an interlocutory appeal, issued an order consistent with Caterpillar's position that, even if the court subsequently determines that the term sheet is a binding contract, it is indefinite in duration and was therefore terminable at will by Caterpillar upon reasonable notice. On April 12, 2005 International commenced a second, related action against Caterpillar in the Circuit Court of DuPage County, Illinois (the “second lawsuit”). The second lawsuit contained allegations similar to the allegations contained in the first lawsuit. International also alleged in the second lawsuit that Caterpillar materially breached the subsequent agreement. On June 15, 2005 International voluntarily dismissed its complaint in the first lawsuit. The second lawsuit has been consolidated with Caterpillar’s counterclaims from the first lawsuit. No trial date is currently scheduled for this case, which is not related to the breach of contract action brought by Caterpillar against Navistar which is currently pending in the Circuit Court of Peoria County, Illinois.
In a letter dated November 15, 2004, the EPA proposed a civil penalty of $641,392 to Caterpillar for the alleged failure to comply with certain requirements of the Federal Clean Air Act. The EPA alleges that Caterpillar constructed a facility in Emporia, Kansas, and failed to comply with Section 112(g)(2)(B) of the Clean Air Act. Caterpillar sold the Emporia facility in December 2002. We are seeking a settlement of this matter with all concerned parties and we believe the outcome will not have a material adverse effect on our consolidated financial position, liquidity, or results of operations.
During the second quarter of 2005, the Internal Revenue Service (IRS) completed its field examination of our 1995 through 1999 U.S. tax returns. In connection with this examination, we received notices of certain adjustments proposed by the IRS, primarily related to foreign sales corporation (FSC) commissions, foreign tax credit calculations and R&D credits. We disagree with these proposed adjustments and intend to vigorously dispute this matter through applicable IRS and judicial procedures, as appropriate. Although the final resolution of the proposed adjustments is uncertain, in the opinion of our management, the ultimate disposition of these matters will not have a material adverse effect on our consolidated financial position, liquidity, or results of operations.
E. Retirement Benefits
We recognized pension expense of $90 million and $276 million for the three and nine months ended September 30, 2005, as compared to $63 million and $204 million for the three months and nine months ended September 30, 2004. The increase in expense was primarily a result of both the amortization of actuarial losses resulting from a declining discount rate and plan changes from the new UAW labor agreement (discussed below), partially offset by the impact of expected asset returns on plan assets. SFAS 87, “Employers’ Accounting for Pensions” requires companies to discount future benefit obligations back to today’s dollars using a discount rate that is based on high-quality fixed-income investments. A decrease in the discount rate increases the pension benefit obligation. This increase is amortized into earnings as an actuarial loss. SFAS 87 also requires companies to use an expected long-term rate of asset return for computing current year pension expense. Differences between the actual and expected returns are amortized into earnings as actuarial gains and losses. At the end of 2004, unrecognized actuarial losses related to pension were $3.28 billion. The majority of the unrecognized actuarial losses are due to declining discount rates in recent years.
Other postretirement benefit expense was $86 million and $267 million for the three and nine months ended September 30, 2005, as compared to $61 million and $193 million for the three and nine months ended September 30, 2004. The increase in expense is primarily the result of plan changes from the new UAW labor agreement, the amortization of actuarial losses resulting from an increase in expected health care inflation and a declining discount rate, partially offset by changes to the U.S. salaried and management other postretirement benefit plan (discussed below). Unrecognized actuarial losses for other postretirement benefit plans were $1.23 billion at the end of 2004. These losses reflect a declining discount rate, an increase in expected health care inflation and higher than expected benefit costs.
The unrecognized actuarial losses for both pensions and other postretirement benefits will be impacted in future periods by actual asset returns, actual health care inflation, discount rate changes and other factors that impact these expenses. These losses will be amortized on a straight-line basis over the average remaining service period of active employees expected to receive benefits under the benefit plans. At the end of 2004, the average remaining service period of active employees was 13 years for our U.S. pension plans, 12 years for our non-U.S. pension plans and 8 years for other postretirement benefit plans. We expect our amortization of net actuarial losses to increase approximately $100 million in 2005 as compared to 2004, primarily because of a decrease in the discount rate.
SFAS 87 requires the recognition of an Additional Minimum Liability if the market value of plan assets is less than the accumulated benefit obligation as of the measurement date. Due to the continued decline in the discount rate, the funded status of our pension plans has declined during 2005. Based on quarter-end plan asset values and assumed discount rate, we would be required to increase the Additional Minimum Liability by approximately $1.5 billion at December 31, 2005, which would include an offset of the $1.0 billion prepaid asset position of certain U.S. plans. This would result in a decrease in Accumulated Other Comprehensive Income (a component of Shareholders’ Equity on the Consolidated Statement of Financial Position) of approximately $1.0 billion after-tax. Final determination of this potential adjustment will not be known until the measurement date, which is November 30, 2005. The adjustment amount is dependent on several factors including our assumed discount rate, actual returns on our pension plan assets, company contributions and benefit plan changes. The company has adequate liquidity resources to fund plans, as it deems necessary.
Page 42
The agreement reached with the UAW in January 2005 included changes to both pension and other postretirement benefits. Pension plan changes included increases in basic benefit payments, increases in the allowance provided to employees who retire before age 62 as well as annual lump-sum payments to retirees during the first three years of the contract. Other postretirement benefit changes included several changes to our retiree medical plan design that resulted in a net increase in company cost sharing with retirees.
| · | Changes to the pension plan resulted in an increase in the pension obligation of approximately $230 million. This reflects a discount rate of 5.8%. The increase will be amortized into earnings on a straight-line basis over 10 years, the average remaining service period of active employees impacted by the plan change. In addition, there will be an ongoing increase in expense as a result of the benefit changes. In total, full year 2005 pension expense (and annual expense until the plan change is fully amortized) will increase approximately $30 million. In addition to the increase in pension expense, the plan changes increased the Additional Minimum Pension Liability by approximately $230 million. |
| · | Changes to the other postretirement plan resulted in an increase in the benefit obligation of approximately $620 million. This also reflects a discount rate of 5.8%. The increase will be amortized into earnings on a straight-line basis over 16 years, the average remaining life expectancy of plan participants that are fully eligible for benefits (as they comprise almost all of the plan). In addition, there will be an ongoing increase in expense as a result of the benefit changes. In total, full year 2005 other postretirement benefit expense (and annual expense until the plan change is fully amortized) will increase approximately $70 million. |
In April 2005, amendments were made to our U.S. salaried and management other postretirement benefit plan that increase employee cost sharing and resulted in a decrease in the benefit obligation of approximately $190 million. This reflects a discount rate of 5.7%. The decrease will be amortized into earnings on a straight-line basis over 9 years, the average remaining service period of active employees impacted by the plan change. In addition, there will be an ongoing decrease in expense as a result of the benefit changes. 2005 other postretirement benefit expense will decrease approximately $18 million. After 2005, the annual expense (until the plan change is fully amortized) will decrease approximately $24 million.
We have no ERISA funding requirements in 2005 and do not expect to make any significant contributions to our U.S. pension plans this year. Contributions were made to non-U.S. pension plans during the three and nine months ended September 30, 2005 of $280 million and $370 million, respectively, and we do not anticipate significant additional contributions during the year. Also during 2005, a $200 million cash contribution was made to one of our other postretirement benefit plans, in addition to our funding of ongoing cash benefit payments of approximately $360 million. We have adequate liquidity resources to fund all U.S. and non-U.S. plans.
F. Supplemental Consolidating Data
We are providing supplemental consolidating data for the purpose of additional analysis. The data has been grouped as follows:
Consolidated - Caterpillar Inc. and its subsidiaries.
Machinery and Engines - The Machinery and Engines data contained in the schedules on pages 44 to 51 are “non-GAAP financial measures” as defined by the Securities and Exchange Commission in Regulation G. These non-GAAP financial measures have no standardized meaning prescribed by U.S. GAAP, and therefore, are unlikely to be comparable with the calculation of similar measures for other companies. Management does not intend these items to be considered in isolation or as a substitute for the related GAAP measures. Caterpillar defines Machinery and Engines as it is presented in the supplemental data as Caterpillar Inc. and its subsidiaries with Financial Products accounted for on the equity basis. Machinery and Engines information relates to our design, manufacturing, marketing and sales of our products. Financial Products information relates to the financing to customers and dealers for the purchase and lease of Caterpillar and other equipment. The nature of these businesses is different especially with regard to the financial position and cash flow items. Caterpillar management utilizes this presentation internally to highlight these differences. We also believe this presentation will assist readers in understanding our business.
Financial Products - our finance and insurance subsidiaries, primarily Cat Financial and Cat Insurance.
Consolidating Adjustments - eliminations of transactions between Machinery and Engines and Financial Products.
Pages 44 to 51 reconcile Machinery and Engines with Financial Products on the Equity Basis to Caterpillar Inc. Consolidated financial information. Certain amounts for prior periods have been reclassified to conform to the current period financial statement presentation.
Page 43
Caterpillar Inc. Supplemental Data for Results of Operations For The Three Months Ended September 30, 2005 (Unaudited) (Millions of dollars) |
| | | | | Supplemental Consolidating Data |
| | | | |
|
| | | Consolidated
| | Machinery and Engines1
| | Financial Products
| | Consolidating Adjustments
|
Sales and revenues: | | | | | | | | | | | | | | | |
| | Sales of Machinery and Engines | $ | 8,392 | | | $ | 8,392 | | | $ | - | | | $ | - | |
| | Revenues of Financial Products | | 585 | | | | - | | | | 667 | | | | (82) | 2 |
| | |
|
|
| |
|
|
| |
|
|
| |
|
|
|
| | Total sales and revenues | | 8,977 | | | | 8,392 | | | | 667 | | | | (82) | |
| | | | | | | | | | | | | | | | | |
Operating costs: | | | | | | | | | | | | | | | |
| | Cost of goods sold | | 6,547 | | | | 6,547 | | | | - | | | | - | |
| | Selling, general and administrative expenses | | 775 | | | | 676 | | | | 110 | | | | (11) | 3 |
| | Research and development expenses | | 285 | | | | 285 | | | | - | | | | - | |
| | Interest expense of Financial Products | | 197 | | | | - | | | | 203 | | | | (6) | 4 |
| | Other operating expenses | | 233 | | | | 4 | | | | 231 | | | | (2) | 3 |
| | |
|
|
| |
|
|
| |
|
|
| |
|
|
|
| | Total operating costs | | 8,037 | | | | 7,512 | | | | 544 | | | | (19) | |
| | |
|
|
| |
|
|
| |
|
|
| |
|
|
|
Operating profit | | 940 | | | | 880 | | | | 123 | | | | (63) | |
| | | | | | | | | | | | | | | | | |
| | Interest expense excluding Financial Products | | 68 | | | | 69 | | | | - | | | | (1) | 4 |
| | Other income (expense) | | 80 | | | | 1 | | | | 17 | | | | 62 | 5 |
| | |
|
|
| |
|
|
| |
|
|
| |
|
|
|
Consolidated profit before taxes | | 952 | | | | 812 | | | | 140 | | | | - | |
| | | | | | | | | | | | | | | | | |
| | Provision for income taxes | | 303 | | | | 256 | | | | 47 | | | | - | |
| | |
|
|
| |
|
|
| |
|
|
| |
|
|
|
| | Profit of consolidated companies | | 649 | | | | 556 | | | | 93 | | | | - | |
| | | | | | | | | | | | | | | | | |
| | Equity in profit (loss) of unconsolidated affiliated companies | | 18 | | | | 16 | | | | 2 | | | | - | |
| | Equity in profit of Financial Products' subsidiaries | | - | | | | 95 | | | | - | | | | (95) | 6 |
| | |
|
|
| |
|
|
| |
|
|
| |
|
|
|
Profit | $ | 667 | | | $ | 667 | | | $ | 95 | | | $ | (95) | |
| |
|
|
| |
|
|
| |
|
|
| |
|
|
|
| (1) Represents Caterpillar Inc. and its subsidiaries with Financial Products accounted for on the equity basis. |
| (2) Elimination of Financial Products revenues earned from Machinery and Engines. |
| (3) Elimination of net expenses recorded by Machinery and Engines paid to Financial Products. |
| (4) Elimination of interest expense recorded between Financial Products and Machinery and Engines. |
| (5) Elimination of discount recorded by Machinery and Engines on receivables sold to Financial Products and of interest earned between Machinery and Engines and Financial Products. |
| (6) Elimination of Financial Products profit due to equity method of accounting. |
Caterpillar Inc. Supplemental Data for Results of Operations For The Three Months Ended September 30, 2004 (Unaudited) (Millions of dollars) |
| | | | | | | Supplemental Consolidating Data |
| | | | | | |
|
| | | Consolidated
| | Machinery and Engines1
| | Financial Products
| | Consolidating Adjustments
|
Sales and revenues: | | | | | | | | | | | | | | | |
| | Sales of Machinery and Engines | $ | 7,175 | | | $ | 7,175 | | | $ | - | | | $ | - | |
| | Revenues of Financial Products | | 484 | | | | - | | | | 437 | | | | 47 | 2 |
| | |
|
|
| |
|
|
| |
|
|
| |
|
|
|
| | Total sales and revenues | | 7,659 | | | | 7,175 | | | | 437 | | | | 47 | |
| | | | | | | | | | | | | | | | | |
Operating costs: | | | | | | | | | | | | | | | |
| | Cost of goods sold | | 5,745 | | | | 5,745 | | | | - | | | | - | |
| | Selling, general and administrative expenses | | 701 | | | | 622 | | | | 98 | | | | (19) | 3 |
| | Research and development expenses | | 240 | | | | 240 | | | | - | | | | - | |
| | Interest expense of Financial Products | | 130 | | | | - | | | | 133 | | | | (3) | 4 |
| | Other operating expenses | | 180 | | | | 2 | | | | 74 | | | | 104 | 3 |
| | |
|
|
| |
|
|
| |
|
|
| |
|
|
|
| | Total operating costs | | 6,996 | | | | 6,609 | | | | 305 | | | | 82 | |
| | |
|
|
| |
|
|
| |
|
|
| |
|
|
|
Operating profit | | 663 | | | | 566 | | | | 132 | | | | (35) | |
| | | | | | | | | | | | | | | | | |
| | Interest expense excluding Financial Products | | 60 | | | | 62 | | | | - | | | | (2) | 4 |
| | Other income (expense) | | 60 | | | | 15 | | | | 12 | | | | 33 | 5 |
| | |
|
|
| |
|
|
| |
|
|
| |
|
|
|
Consolidated profit before taxes | | 663 | | | | 519 | | | | 144 | | | | - | |
| | | | | | | | | | | | | | | | | |
| | Provision for income taxes | | 182 | | | | 141 | | | | 41 | | | | - | |
| | |
|
|
| |
|
|
| |
|
|
| |
|
|
|
| | Profit of consolidated companies | | 481 | | | | 378 | | | | 103 | | | | - | |
| | | | | | | | | | | | | | | | | |
| | Equity in profit (loss) of unconsolidated
affiliated companies | | 17 | | | | 17 | | | | - | | | | - | |
| | Equity in profit of Financial Products' subsidiaries | | - | | | | 103 | | | | - | | | | (103) | 6 |
| | |
|
|
| |
|
|
| |
|
|
| |
|
|
|
Profit | $ | 498 | | | $ | 498 | | | $ | 103 | | | $ | (103) | |
| |
|
|
| |
|
|
| |
|
|
| |
|
|
|
| (1) Represents Caterpillar Inc. and its subsidiaries with Financial Products accounted for on the equity basis. |
| (2) Elimination of Financial Products revenues earned from Machinery and Engines. |
| (3) Elimination of net expenses recorded by Machinery and Engines paid to Financial Products. |
| (4) Elimination of interest expense recorded between Financial Products and Machinery and Engines. |
| (5) Elimination of discount recorded by Machinery and Engines on receivables sold to Financial Products and of interest earned between Machinery and Engines and Financial Products. |
| (6) Elimination of Financial Products profit due to equity method of accounting. |
Caterpillar Inc. Supplemental Data for Results of Operations For The Nine Months Ended September 30, 2005 (Unaudited) (Millions of dollars) |
| | | | | Supplemental Consolidating Data |
| | | | |
|
| | | Consolidated
| | Machinery and Engines1
| | Financial Products
| | Consolidating Adjustments
|
Sales and revenues: | | | | | | | | | | | | | | | |
| | Sales of Machinery and Engines | $ | 24,965 | | | $ | 24,965 | | | $ | - | | | $ | - | |
| | Revenues of Financial Products | | 1,711 | | | | - | | | | 1,935 | | | | (224) | 2 |
| | |
|
|
| |
|
|
| |
|
|
| |
|
|
|
| | Total sales and revenues | | 26,676 | | | | 24,965 | | | | 1,935 | | | | (224) | |
| | | | | | | | | | | | | | | | | |
Operating costs: | | | | | | | | | | | | | | | |
| | Cost of goods sold | | 19,652 | | | | 19,652 | | | | - | | | | - | |
| | Selling, general and administrative expenses | | 2,308 | | | | 2,013 | | | | 328 | | | | (33) | 3 |
| | Research and development expenses | | 794 | | | | 794 | | | | - | | | | - | |
| | Interest expense of Financial Products | | 551 | | | | - | | | | 565 | | | | (14) | 4 |
| | Other operating expenses | | 654 | | | | 6 | | | | 653 | | | | (5) | 3 |
| | |
|
|
| |
|
|
| |
|
|
| |
|
|
|
| | Total operating costs | | 23,959 | | | | 22,465 | | | | 1,546 | | | | (52) | |
| | |
|
|
| |
|
|
| |
|
|
| |
|
|
|
Operating profit | | 2,717 | | | | 2,500 | | | | 389 | | | | (172) | |
| | | | | | | | | | | | | | | | | |
| | Interest expense excluding Financial Products | | 198 | | | | 202 | | | | - | | | | (4) | 4 |
| | Other income (expense) | | 278 | | | | 76 | | | | 34 | | | | 168 | 5 |
| | |
|
|
| |
|
|
| |
|
|
| |
|
|
|
| | | | | | | | | | | | | | | | | |
Consolidated profit before taxes | | 2,797 | | | | 2,374 | | | | 423 | | | | - | |
| | | | | | | | | | | | | | | | | |
| | Provision for income taxes | | 850 | | | | 704 | | | | 146 | | | | - | |
| | |
|
|
| |
|
|
| |
|
|
| |
|
|
|
| | Profit of consolidated companies | | 1,947 | | | | 1,670 | | | | 277 | | | | - | |
| | | | | | | | | | | | | | | | | |
| | Equity in profit (loss) of unconsolidated affiliated companies | | 61 | | | | 54 | | | | 7 | | | | - | |
| | Equity in profit of Financial Products' subsidiaries | | - | | | | 284 | | | | - | | | | (284) | 6 |
| | |
|
|
| |
|
|
| |
|
|
| |
|
|
|
Profit | $ | 2,008 | | | $ | 2,008 | | | $ | 284 | | | $ | (284) | |
| |
|
|
| |
|
|
| |
|
|
| |
|
|
|
| (1) Represents Caterpillar Inc. and its subsidiaries with Financial Products accounted for on the equity basis. |
| (2) Elimination of Financial Products revenues earned from Machinery and Engines. |
| (3) Elimination of net expenses recorded by Machinery and Engines paid to Financial Products. |
| (4) Elimination of interest expense recorded between Financial Products and Machinery and Engines. |
| (5) Elimination of discount recorded by Machinery and Engines on receivables sold to Financial Products and of interest earned between Machinery and Engines and Financial Products. |
| (6) Elimination of Financial Products profit due to equity method of accounting. |
Page 46
Caterpillar Inc. Supplemental Data for Results of Operations For The Nine Months Ended September 30, 2004 (Unaudited) (Millions of dollars) |
| | | | | | | Supplemental Consolidating Data |
| | | | | | |
|
| | | Consolidated
| | Machinery and Engines1
| | Financial Products
| | Consolidating Adjustments
|
Sales and revenues: | | | | | | | | | | | | | | | |
| | Sales of Machinery and Engines | $ | 20,277 | | | $ | 20,277 | | | $ | - | | | $ | - | |
| | Revenues of Financial Products | | 1,445 | | | | - | | | | 1,587 | | | | (142) | 2 |
| | |
|
|
| |
|
|
| |
|
|
| |
|
|
|
| | Total sales and revenues | | 21,722 | | | | 20,277 | | | | 1,587 | | | | (142) | |
| | | | | | | | | | | | | | | | | |
Operating costs: | | | | | | | | | | | | | | | |
| | Cost of goods sold | | 16,009 | | | | 16,009 | | | | - | | | | - | |
| | Selling, general and administrative expenses | | 2,118 | | | | 1,846 | | | | 315 | | | | (43) | 3 |
| | Research and development expenses | | 685 | | | | 685 | | | | - | | | | - | |
| | Interest expense of Financial Products | | 370 | | | | - | | | | 378 | | | | (8) | 4 |
| | Other operating expenses | | 539 | | | | 2 | | | | 537 | | | | - | |
| | |
|
|
| |
|
|
| |
|
|
| |
|
|
|
| | Total operating costs | | 19,721 | | | | 18,542 | | | | 1,230 | | | | (51) | |
| | |
|
|
| |
|
|
| |
|
|
| |
|
|
|
Operating profit | | 2,001 | | | | 1,735 | | | | 357 | | | | (91) | |
| | | | | | | | | | | | | | | | | |
| | Interest expense excluding Financial Products | | 176 | | | | 180 | | | | - | | | | (4) | 4 |
| | Other income (expense) | | 171 | | | | 64 | | | | 20 | | | | 87 | 5 |
| | |
|
|
| |
|
|
| |
|
|
| |
|
|
|
Consolidated profit before taxes | | 1,996 | | | | 1,619 | | | | 377 | | | | - | |
| | | | | | | | | | | | | | | | | |
| | Provision for income taxes | | 549 | | | | 428 | | | | 121 | | | | - | |
| | |
|
|
| |
|
|
| |
|
|
| |
|
|
|
| | Profit of consolidated companies | | 1,447 | | | | 1,191 | | | | 256 | | | | - | |
| | | | | | | | | | | | | | | | | |
| | Equity in profit (loss) of unconsolidated affiliated companies | | 37 | | | | 35 | | | | 2 | | | | - | |
| | Equity in profit of Financial Products' subsidiaries | | - | | | | 258 | | | | - | | | | (258) | 6 |
| | |
|
|
| |
|
|
| |
|
|
| |
|
|
|
Profit | $ | 1,484 | | | $ | 1,484 | | | $ | 258 | | | $ | (258) | |
| |
|
|
| |
|
|
| |
|
|
| |
|
|
|
| (1) Represents Caterpillar Inc. and its subsidiaries with Financial Products accounted for on the equity basis. |
| (2) Elimination of Financial Products revenues earned from Machinery and Engines. |
| (3) Elimination of net expenses recorded by Machinery and Engines paid to Financial Products. |
| (4) Elimination of interest expense recorded between Financial Products and Machinery and Engines. |
| (5) Elimination of discount recorded by Machinery and Engines on receivables sold to Financial Products and of interest earned between Machinery and Engines and Financial Products. |
| (6) Elimination of Financial Products profit due to equity method of accounting. |
Page 47
Caterpillar Inc. Supplemental Data for Financial Position At September 30, 2005 (Unaudited) (Millions of dollars) |
| | | | | Supplemental Consolidating Data |
| | | | |
|
| | | Consolidated
| | Machinery and Engines1
| | Financial Products
| | Consolidating Adjustments
|
Assets: | | | | | | | | | | | | | | | |
| | Current assets: | | | | | | | | | | | | | | | |
| | | Cash and short-term investments | $ | 967 | | | $ | 754 | | | $ | 213 | | | $ | - | |
| | | Receivables - trade and other | | 7,319 | | | | 3,054 | | | | 427 | | | | 3,838 | 2,3 |
| | | Receivables - finance | | 5,725 | | | | - | | | | 10,290 | | | | (4,565) | 3 |
| | | Deferred and refundable income taxes | | 581 | | | | 514 | | | | 67 | | | | - | |
| | | Prepaid expenses | | 1,301 | | | | 1,283 | | | | 24 | | | | (6) | 4 |
| | | Inventories | | 5,469 | | | | 5,469 | | | | - | | | | - | |
| | | |
|
|
| |
|
|
| |
|
|
| |
|
|
|
| | Total current assets | | 21,362 | | | | 11,074 | | | | 11,021 | | | | (733) | |
| | | | | | | | | | | | | | | | | |
| | Property, plant and equipment - net | | 7,817 | | | | 4,861 | | | | 2,956 | | | | - | |
| | Long-term receivables - trade and other | | 893 | | | | 265 | | | | 36 | | | | 592 | 2,3 |
| | Long-term receivables - finance | | 10,336 | | | | - | | | | 10,963 | | | | (627) | 3 |
| | Investments in unconsolidated affiliated companies | | 563 | | | | 520 | | | | 44 | | | | (1) | 5 |
| | Investments in Financial Products subsidiaries | | - | | | | 3,202 | | | | - | | | | (3,202) | 6 |
| | Deferred income taxes | | 707 | | | | 1,007 | | | | 37 | | | | (337) | 7 |
| | Intangible assets | | 462 | | | | 455 | | | | 7 | | | | - | |
| | Goodwill | | 1,451 | | | | 1,451 | | | | - | | | | - | |
| | Other assets | | 2,274 | | | | 1,028 | | | | 1,246 | | | | - | |
| | |
|
|
| |
|
|
| |
|
|
| |
|
|
|
Total assets | $ | 45,865 | | | $ | 23,863 | | | $ | 26,310 | | | $ | (4,308) | |
| |
|
|
| |
|
|
| |
|
|
| |
|
|
|
Liabilities | | | | | | | | | | | | | | | |
| | Current liabilities: | | | | | | | | | | | | | | | |
| | | Short-term borrowings | | 5,964 | | | | 603 | | | | 5,971 | | | | (610) | 8 |
| | | Accounts payable | | 3,425 | | | | 3,310 | | | | 232 | | | | (117) | 9 |
| | | Accrued expenses | | 2,508 | | | | 1,555 | | | | 959 | | | | (6) | 10 |
| | | Accrued wages, salaries and employee benefits | | 1,735 | | | | 1,721 | | | | 14 | | | | - | |
| | | Customer advances | | 554 | | | | 554 | | | | - | | | | - | |
| | | Dividends payable | | - | | | | - | | | | - | | | | - | |
| | | Deferred and current income taxes payable | | 583 | | | | 476 | | | | 115 | | | | (8) | 7 |
| | | Long-term debt due within one year | | 4,084 | | | | 234 | | | | 3,850 | | | | - | |
| | | |
|
|
| |
|
|
| |
|
|
| |
|
|
|
| | Total current liabilities | | 18,853 | | | | 8,453 | | | | 11,141 | | | | (741) | |
| | Long-term debt due after one year | | 14,984 | | | | 3,441 | | | | 11,578 | | | | (35) | 8 |
| | Liability for postemployment benefits | | 2,827 | | | | 2,827 | | | | - | | | | - | |
| | Deferred income taxes and other liabilities | | 809 | | | | 750 | | | | 389 | | | | (330) | 7 |
| | |
|
|
| |
|
|
| |
|
|
| |
|
|
|
Total liabilities | | 37,473 | | | | 15,471 | | | | 23,108 | | | | (1,106) | |
| |
|
|
| |
|
|
| |
|
|
| |
|
|
|
Stockholders' equity | | | | | | | | | | | | | | | |
| | Common stock | | 1,821 | | | | 1,821 | | | | 888 | | | | (888) | 6 |
| | Treasury stock | | (4,039 | ) | | | (4,039 | ) | | | - | | | | - | |
| | Profit employed in the business | | 11,298 | | | | 11,298 | | | | 2,108 | | | | (2,108) | 6 |
| | Accumulated other comprehensive income | | (688 | ) | | | (688 | ) | | | 206 | | | | (206) | 6 |
| | |
|
|
| |
|
|
| |
|
|
| |
|
|
|
Total stockholders' equity | | 8,392 | | | | 8,392 | | | | 3,202 | | | | (3,202) | |
| |
|
|
| |
|
|
| |
|
|
| |
|
|
|
Total liabilities and stockholders' equity | $ | 45,865 | | | $ | 23,863 | | | $ | 26,310 | | | $ | (4,308) | |
| |
|
|
| |
|
|
| |
|
|
| |
|
|
|
| (1) Represents Caterpillar Inc. and its subsidiaries with Financial Products accounted for on the equity basis. |
| (2) Elimination of receivables between Machinery and Engines and Financial Products. |
| (3) Reclassification of Machinery and Engines trade receivables purchased by Cat Financial and Cat Financial’s wholesale inventory receivables. |
| (4) Elimination of Machinery and Engines insurance premiums that are prepaid to Financial Products. |
| (5) Elimination of Machinery and Engines investment in Financial Products subsidiary. |
| (6) Elimination of Financial Products equity which is accounted for on Machinery and Engines on the equity basis. |
| (7) Reclassification reflecting required netting of deferred tax assets / liabilities by taxing jurisdiction. |
| (8) Elimination of debt between Machinery and Engines and Financial Products. |
| (9) Elimination of payables between Machinery and Engines and Financial Products. |
| (10) Elimination of prepaid insurance in Financial Products' accrued expenses. |
Page 48
Caterpillar Inc. Supplemental Data for Financial Position At December 31, 2004 (Unaudited) (Millions of dollars) |
| | | | | Supplemental Consolidating Data |
| | | | |
|
| | | Consolidated
| | Machinery and Engines1
| | Financial Products
| | Consolidating Adjustments
|
Assets: | | | | | | | | | | | | | | | |
| | Current assets: | | | | | | | | | | | | | | | |
| | | Cash and short-term investments | $ | 445 | | | $ | 270 | | | $ | 175 | | | $ | - | |
| | | Receivables - trade and other | | 7,463 | | | | 3,276 | | | | 465 | | | | 3,722 | 2,3 |
| | | Receivables - finance | | 5,182 | | | | - | | | | 9,325 | | | | (4,143) | 3 |
| | | Deferred and refundable income taxes | | 398 | | | | 333 | | | | 65 | | | | - | |
| | | Prepaid expenses | | 1,369 | | | | 1,367 | | | | 16 | | | | (14) | 4 |
| | | Inventories | | 4,675 | | | | 4,675 | | | | - | | | | - | |
| | | |
|
|
| |
|
|
| |
|
|
| |
|
|
|
| | Total current assets | | 19,532 | | | | 9,921 | | | | 10,046 | | | | (435) | |
| | | | | | | | | | | | | | | | | |
| | Property, plant and equipment - net | | 7,682 | | | | 4,820 | | | | 2,862 | | | | - | |
| | Long-term receivables - trade and other | | 764 | | | | 255 | | | | 37 | | | | 472 | 2,3 |
| | Long-term receivables - finance | | 9,903 | | | | - | | | | 10,410 | | | | (507) | 3 |
| | Investments in unconsolidated affiliated companies | | 517 | | | | 479 | | | | 39 | | | | (1) |
5
|
| | Investments in Financial Products subsidiaries | | - | | | | 3,012 | | | | - | | | | (3,012) | 6 |
| | Deferred income taxes | | 674 | | | | 950 | | | | 27 | | | | (303) | 7 |
| | Intangible assets | | 315 | | | | 307 | | | | 8 | | | | - | |
| | Goodwill | | 1,450 | | | | 1,450 | | | | - | | | | - | |
| | Other assets | | 2,258 | | | | 1,075 | | | | 1,183 | | | | - | |
| | |
|
|
| |
|
|
| |
|
|
| |
|
|
|
Total assets | $ | 43,095 | | | $ | 22,269 | | | $ | 24,612 | | | $ | (3,786) | |
| |
|
|
| |
|
|
| |
|
|
| |
|
|
|
Liabilities | | | | | | | | | | | | | | | |
| | Current liabilities: | | | | | | | | | | | | | | | |
| | | Short-term borrowings | | 4,157 | | | | 93 | | | | 4,396 | | | | (332) | 8 |
| | | Accounts payable | | 3,580 | | | | 3,459 | | | | 205 | | | | (84) | 9 |
| | | Accrued expenses | | 2,261 | | | | 1,426 | | | | 855 | | | | (20) | 10 |
| | | Accrued wages, salaries and employee benefits | | 1,730 | | | | 1,716 | | | | 14 | | | | - | |
| | | Customer advances | | 447 | | | | 447 | | | | - | | | | - | |
| | | Dividends payable | | 141 | | | | 141 | | | | - | | | | - | |
| | | Deferred and current income taxes payable | | 259 | | | | 212 | | | | 47 | | | | - | |
| | | Long-term debt due within one year | | 3,531 | | | | 6 | | | | 3,525 | | | | - | |
| | | |
|
|
| |
|
|
| |
|
|
| |
|
|
|
| | Total current liabilities | | 16,106 | | | | 7,500 | | | | 9,042 | | | | (436) | |
| | Long-term debt due after one year | | 15,837 | | | | 3,697 | | | | 12,175 | | | | (35) | 8 |
| | Liability for postemployment benefits | | 2,986 | | | | 2,986 | | | | - | | | | - | |
| | Deferred income taxes and other liabilities | | 699 | | | | 619 | | | | 383 | | | | (303) | 7 |
| | |
|
|
| |
|
|
| |
|
|
| |
|
|
|
Total liabilities | | 35,628 | | | | 14,802 | | | | 21,600 | | | | (774) | |
| |
|
|
| |
|
|
| |
|
|
| |
|
|
|
Stockholders' equity | | | | | | | | | | | | | | | |
| | Common stock | | 1,231 | | | | 1,231 | | | | 888 | | | | (888) | 6 |
| | Treasury stock | | (3,277 | ) | | | (3,277 | ) | | | - | | | | - | |
| | Profit employed in the business | | 9,937 | | | | 9,937 | | | | 1,824 | | | | (1,824) | 6 |
| | Accumulated other comprehensive income | | (424 | ) | | | (424 | ) | | | 300 | | | | (300) | 6 |
| | |
|
|
| |
|
|
| |
|
|
| |
|
|
|
Total stockholders' equity | | 7,467 | | | | 7,467 | | | | 3,012 | | | | (3,012) | |
| |
|
|
| |
|
|
| |
|
|
| |
|
|
|
Total liabilities and stockholders' equity | $ | 43,095 | | | $ | 22,269 | | | $ | 24,612 | | | $ | (3,786) | |
| |
|
|
| |
|
|
| |
|
|
| |
|
|
|
| (1) Represents Caterpillar Inc. and its subsidiaries with Financial Products accounted for on the equity basis. |
| (2) Elimination of receivables between Machinery and Engines and Financial Products. |
| (3) Reclassification of Machinery and Engines trade receivables purchased by Cat Financial and Cat Financial’s wholesale inventory receivables. |
| (4) Elimination of Machinery and Engines insurance premiums that are prepaid to Financial Products. |
| (5) Elimination of Machinery and Engines investment in Financial Products subsidiary. |
| (6) Elimination of Financial Products equity which is accounted for on Machinery and Engines on the equity basis. |
| (7) Reclassification reflecting required netting of deferred tax assets/liabilities by taxing jurisdiction. |
| (8) Elimination of debt between Machinery and Engines and Financial Products. |
| (9) Elimination of payables between Machinery and Engines and Financial Products. |
| (10) Elimination of prepaid insurance in Financial Products' accrued expenses. |
Page 49
Caterpillar Inc. Supplemental Data for Cash Flow For the Nine Months Ended September 30, 2005 (Unaudited) (Millions of dollars) |
| | | | Supplemental Consolidating Data |
| | | |
|
| | Consolidated
| | Machinery and Engines1
| | Financial Products
| | Consolidating Adjustments
|
Cash flow from operating activities: | | | | | | | | | | | | | | | |
| | Profit | $ | 2,008 | | | $ | 2,008 | | | $ | 284 | | | $ | (284) | 2 |
| | Adjustments for non-cash items: | | | | | | | | | | | | | | | |
| | | Depreciation and amortization | | 1,113 | | | | 633 | | | | 480 | | | | - | |
| | | Undistributed profit of Financial Products | | - | | | | (284 | ) | | | - | | | | 284 | 3 |
| | | Other | | (89 | ) | | | (150 | ) | | | (141 | ) | | | 202 | 4 |
| | Changes in assets and liabilities: | | | | | | | | | | | | | | | |
| | | Receivables - trade and other | | (521 | ) | | | 248 | | | | 10 | | | | (779) | 4,5 |
| | | Inventories | | (794 | ) | | | (794 | ) | | | - | | | | - | |
| | | Accounts payable and accrued expenses | | 313 | | | | 207 | | | | 114 | | | | (8) | 4 |
| | | Other assets- net | | 69 | | | | 100 | | | | (23 | ) | | | (8) | 4 |
| | | Other liabilities - net | | 31 | | | | (26 | ) | | | 58 | | | | (1) | 4 |
| | | |
|
|
| |
|
|
| |
|
|
| |
|
|
|
| Net cash provided by (used for) operating activities | | 2,130 | | | | 1,942 | | | | 782 | | | | (594) | |
| |
|
|
| |
|
|
| |
|
|
| |
|
|
|
Cash flow from investing activities: | | | | | | | | | | | | | | | |
| | Capital expenditures - excluding equipment leased to others | | (709 | ) | | | (677 | ) | | | (32 | ) | | | - | |
| | Expenditures for equipment leased to others | | (965 | ) | | | - | | | | (965 | ) | | | - | |
| | Proceeds from disposals of property, plant and equipment | | 447 | | | | 31 | | | | 416 | | | | - | |
| | Additions to finance receivables | | (7,310 | ) | | | - | | | | (24,898 | ) | | | 17,588 | 5 |
| | Collection of finance receivables | | 4,889 | | | | - | | | | 21,589 | | | | (16,700) | 5 |
| | Proceeds from the sale of finance receivables | | 916 | | | | - | | | | 1,178 | | | | (262) | 5 |
| | Net intercompany borrowings | | - | | | | (315 | ) | | | (11 | ) | | | 326 | 6 |
| | Investments and acquisitions (net of cash acquired) | | (12 | ) | | | (12 | ) | | | - | | | | - | |
| | Other - net | | 80 | | | | (7 | ) | | | 87 | | | | - | |
| | |
|
|
| |
|
|
| |
|
|
| |
|
|
|
| Net cash provided by (used for) investing activities | | (2,664 | ) | | | (980 | ) | | | (2,636 | ) | | | 952 | |
| |
|
|
| |
|
|
| |
|
|
| |
|
|
|
Cash flow from financing activities: | | | | | | | | | | | | | | | |
| | Dividends paid | | (449 | ) | | | (449 | ) | | | - | | | | - | |
| | Common stock issued, including treasury shares reissued | | 412 | | | | 412 | | | | - | | | | - | |
| | Treasury shares purchased | | (1,039 | ) | | | (1,039 | ) | | | - | | | | - | |
| | Net intercompany borrowings | | - | | | | 11 | | | | 315 | | | | (326) | 6 |
| | Proceeds from long-term debt issued | | 4,358 | | | | 129 | | | | 4,229 | | | | - | |
| | Payments on long-term debt | | (3,324 | ) | | | (64 | ) | | | (3,260 | ) | | | - | |
| | Short-term borrowings - net | | 1,085 | | | | 470 | | | | 615 | | | | - | |
| | |
|
|
| |
|
|
| |
|
|
| |
|
|
|
| Net cash provided by (used for) financing activities | | 1,043 | | | | (530 | ) | | | 1,899 | | | | (326) | |
| |
|
|
| |
|
|
| |
|
|
| |
|
|
|
| Effect of exchange rate changes on cash | | 13 | | | | 52 | | | | (7 | ) | | | (32) | 7 |
| |
|
|
| |
|
|
| |
|
|
| |
|
|
|
Increase in cash and short-term investments | | 522 | | | | 484 | | | | 38 | | | | - | |
| Cash and short-term investments at beginning of period | | 445 | | | | 270 | | | | 175 | | | | - | |
| |
|
|
| |
|
|
| |
|
|
| |
|
|
|
| Cash and short-term investments at end of period | $ | 967 | | | $ | 754 | | | $ | 213 | | | $ | - | |
| |
|
|
| |
|
|
| |
|
|
| |
|
|
|
| (1) Represents Caterpillar Inc. and its subsidiaries with Financial Products accounted for on the equity basis. |
| (2) Elimination of Financial Products profit after tax due to equity method of accounting. |
| (3) Non-cash adjustment for the undistributed earnings from Financial Products. |
| (4) Elimination of non-cash adjustments and changes in assets and liabilities related to consolidated reporting. |
| (5) Reclassification of Cat Financial’s cash flow activity from investing to operating for receivables that arose from the sale of inventory. |
| (6) Net proceeds and payments to/from Machinery and Engines and Financial Products. |
| (7) Elimination of the effect of exchange on intercompany balances. |
Page 50
Caterpillar Inc. Supplemental Data for Cash Flow For the Nine Months Ended September 30, 2004 (Unaudited) (Millions of dollars) |
| | | | Supplemental Consolidating Data |
| | | |
|
| | Consolidated
| | Machinery and Engines1
| | Financial Products
| | Consolidating Adjustments
|
Cash flow from operating activities: | | | | | | | | | | | | | | | |
| | Profit | $ | 1,484 | | | $ | 1,484 | | | $ | 258 | | | $ | (258) | 2 |
| | Adjustments for non-cash items: | | | | | | | | | | | | | | | |
| | | Depreciation and amortization | | 1,055 | | | | 612 | | | | 443 | | | | - | |
| | | Undistributed profit of Financial Products | | - | | | | (258 | ) | | | - | | | | 258 | 3 |
| | | Other | | (83 | ) | | | (103 | ) | | | (80 | ) | | | 100 | 4 |
| | Changes in assets and liabilities: | | | | | | | | | | | | | | | |
| | | Receivables - trade and other | | (7,110 | ) | | | (284 | ) | | | 89 | | | | (6,915) | 4,5 |
| | | Inventories | | (1,225 | ) | | | (1,225 | ) | | | - | | | | - | |
| | | Accounts payable and accrued expenses | | 728 | | | | 570 | | | | (33 | ) | | | 191 | 4 |
| | | Other assets - net | | 76 | | | | 52 | | | | 30 | | | | (6) | 4 |
| | | Other liabilities- net | | (2 | ) | | | (90 | ) | | | 89 | | | | (1) | 4 |
| | | |
|
|
| |
|
|
| |
|
|
| |
|
|
|
| Net cash provided by (used for) operating activities | | (5,077 | ) | | | 758 | | | | 796 | | | | (6,631) | |
| |
|
|
| |
|
|
| |
|
|
| |
|
|
|
Cash flow from investing activities: | | | | | | | | | | | | | | | |
| | Capital expenditures - excluding equipment leased to others | | (519 | ) | | | (460 | ) | | | (59 | ) | | | - | |
| | Expenditures for equipment leased to others | | (827 | ) | | | (2 | ) | | | (825 | ) | | | - | |
| | Proceeds from disposals of property, plant and equipment | | 378 | | | | 19 | | | | 359 | | | | - | |
| | Additions to finance receivables | | (6,423 | ) | | | - | | | | (12,728 | ) | | | 6,305 | 5 |
| | Collection of finance receivables | | 4,617 | | | | - | | | | 10,313 | | | | (5,696) | 5 |
| | Proceeds from sale of finance receivables | | 647 | | | | - | | | | 1,311 | | | | (664) | 5 |
| | Additions to retained interests in securitized trade receivables | | - | | | | - | | | | (6,686 | ) | | | 6,686 |
6
|
| | Collection of retained interests in securitized trade receivables | | 5,722 | | | | - | | | | 5,722 | | | | - | |
| | Net intercompany borrowings | | - | | | | 203 | | | | 30 | | | | (233) | 7 |
| | Investments and acquisitions (net of cash acquired) | | (284 | ) | | | (284 | ) | | | - | | | | - | |
| | Other - net | | (40 | ) | | | (94 | ) | | | 54 | | | | - | |
| | |
|
|
| |
|
|
| |
|
|
| |
|
|
|
| Net cash provided by (used for) investing activities | | 3,271 | | | | (618 | ) | | | (2,509 | ) | | | 6,398 | |
| |
|
|
| |
|
|
| |
|
|
| |
|
|
|
Cash flow from financing activities: | | | | | | | | | | | | | | | |
| | Dividends paid | | (395 | ) | | | (395 | ) | | | - | | | | - | |
| | Common stock issued, including treasury shares reissued | | 137 | | | | 137 | | | | - | | | | - | |
| | Treasury shares purchased | | (400 | ) | | | (400 | ) | | | - | | | | - | |
| | Net intercompany borrowings | | - | | | | (30 | ) | | | (203 | ) | | | 233 | 7 |
| | Proceeds from long-term debt issued | | 4,532 | | | | 263 | | | | 4,269 | | | | - | |
| | Payments on long-term debt | | (2,615 | ) | | | (28 | ) | | | (2,587 | ) | | | - | |
| | Short-term borrowings - net | | 563 | | | | 264 | | | | 299 | | | | - | |
| | |
|
|
| |
|
|
| |
|
|
| |
|
|
|
| Net cash provided by financing activities | | 1,822 | | | | (189 | ) | | | 1,778 | | | | 233 | |
| |
|
|
| |
|
|
| |
|
|
| |
|
|
|
| Effect of exchange rate changes on cash | | 59 | | | | 70 | | | | (11 | ) | | | - | |
| |
|
|
| |
|
|
| |
|
|
| |
|
|
|
Increase in cash and short-term investments | | 75 | | | | 21 | | | | 54 | | | | - | |
| Cash and short-term investments at beginning of period | | 342 | | | | 220 | | | | 122 | | | | - | |
| |
|
|
| |
|
|
| |
|
|
| |
|
|
|
| Cash and short-term investments at end of period | $ | 417 | | | $ | 241 | | | $ | 176 | | | $ | - | |
| |
|
|
| |
|
|
| |
|
|
| |
|
|
|
| (1) Represents Caterpillar Inc. and its subsidiaries with Financial Products accounted for on the equity basis. |
| (2) Elimination of Financial Products profit after tax due to equity method of accounting. |
| (3) Non-cash adjustment for the undistributed earnings from Financial Products. |
(4) Elimination of non-cash adjustments and changes in assets and liabilities related to consolidated reporting. Receivables amounts include adjustment for consolidated non-cash receipt of retained interests in securitized trade receivables. |
| (5) Reclassification of Cat Financial’s cash flow activity from investing to operating for receivables that arose from the sale of inventory. |
| (6) Elimination of Cat Financial’s additions to retained interests in securitized trade receivables that arose from an intercompany purchase of receivables. |
| (7) Net proceeds and payments to/from Machinery and Engines and Financial Products. |
2005 OUTLOOK - SALES AND REVENUES
We project company sales and revenues will increase about 20 percent in 2005, setting a new record. That forecast assumes about a 12 percent increase in Machinery and Engines volume, a more than 5 percent gain from improved price realization and the rest from Financial Products revenues.
| · | Interest rates in most countries, except for the United States, have been stable this year, and economic growth has slowed only slightly from last year’s robust pace. Good economic growth, along with low interest rates, has provided an attractive investment environment. Machinery and equipment investments have increased much faster than overall economic growth in many countries, and those trends should continue for the rest of the year. |
| · | World demand for energy and most base metals has continued to grow, maintaining pressure on production capacities and inventories. As a result, prices increased over the course of 2005 and are very favorable for investment. Opportunities for mine development, oil and natural gas drilling and well servicing should remain favorable this year. |
| · | Consumers in many countries are upgrading housing, and home prices are rising. Growing incomes and favorable financing should keep residential construction strong in most regions this year. |
| · | The increase in world trade in this business cycle highlighted the inadequate condition of many countries’ infrastructure. Economic recoveries and higher commodity prices improved many governments’ finances, particularly in developing countries. As a result, several countries have boosted infrastructure spending. |
| · | Business profits are at record highs in many countries, financing is attractive and stock prices are up. Consequently, companies have started to boost spending on new structures and standby power. We expect these recoveries will accelerate. |
Sales and Revenues Outlook |
(Millions of dollars) | 2004 | | 2005 | | % |
| | Actual | | Outlook | | Change |
| |
| |
| |
|
| Machinery and Engines | | | | | | | | | | | |
| | North America | $ | 14,521 | | | $ | 17,700 | | | | 22% | |
| | EAME | | 7,505 | | | | 8,950 | | | | 19% | |
| | Latin America | | 2,372 | | | | 3,050 | | | | 29% | |
| | Asia/Pacific | | 3,938 | | | | 4,250 | | | | 8% | |
| | |
|
|
| |
|
|
| | | | |
| Total Machinery and Engines | | 28,336 | | | | 33,950 | | | | 20% | |
| |
|
|
| |
|
|
| | | | |
Financial Products1 | | 1,970 | | | | 2,350 | | | | 19% | |
| |
|
|
| |
|
|
| | | | |
| Total | $ | 30,306 | | | $ | 36,300 | | | | 20% | |
| |
|
|
| |
|
|
| | | | |
| (1) Does not include revenues earned from Machinery and Engines of $199 million and $307 million in 2004 and 2005 outlook, respectively. |
North America (United States and Canada) Machinery and Engines sales are expected to increase about 22 percent in 2005.
| · | We expect the U. S. Federal Reserve will continue increasing interest rates this year, bringing the Federal funds rate to at least 4 percent by the end of the year. Economic growth will continue to be 4 percent or less, fast enough to support demand in key industries we serve but not so fast as to cause inflation to accelerate. |
| · | Housing starts have averaged over a 2 million unit annual rate this year, and permits for new construction have averaged even higher. With 30-year mortgage rates near 6 percent, new home prices rising and inventories relatively low, housing starts in 2005 should be the highest in more than 30 years. |
| · | Investment in nonresidential structures has slowly improved over the past two years, but we expect the recovery to accelerate. Investment is well below the previous peak, businesses have record cash flows and financing terms are favorable. |
| · | Prices for metals and energy commodities increased throughout the third quarter and are attractive for producers to increase output. Production of metals increased 9 percent year to date; however, coal production was down slightly due to lower electricity generation and some transportation problems. We expect recent increases in utility output and the need to rebuild stocks will boost coal demand in coming months. |
| · | The North American truck fleet is growing in response to higher freight volume and improved profits. Demand for on-highway trucks is expected to continue strong, particularly for larger units. |
| · | Canadian economic growth has been somewhat slower than in the United States, but low interest rates and high commodity prices have benefited construction, mining and energy. Those sectors should continue doing well the rest of the year. |
EAME Machinery and Engines sales are expected to increase about 19 percent in 2005.
| · | The Euro-zone economy continued to grow slowly, and we expect no change in interest rates this year. In the United Kingdom, weaker than expected growth prompted a recent cut in interest rates. Low interest rates have encouraged somewhat faster growth in investment and construction, particularly housing. We project overall European growth will be about 2 percent this year. |
| · | Both AME and the CIS are benefiting from higher metals and energy prices, and both regions should grow more than 5 percent this year. Improved economic growth has prompted some countries to increase spending on infrastructure. |
Latin America Machinery and Engines sales are expected to increase about 29 percent in 2005.
| · | Several countries recently cut interest rates, and we expect further rate cuts this year. Direct investment into the region is increasing, and overall economic growth should exceed 4 percent. |
| · | Higher metals prices have driven significant increases in production and investment in many countries. Better economic growth and lower interest rates have allowed construction to rebound from years of underinvestment. |
Asia/Pacific Machinery and Engines sales are expected to increase about 8 percent in 2005.
| · | Interest rates edged up slightly in recent months, but economic growth this year should exceed 6 percent. Rapid growth is requiring businesses to invest in new structures. |
| · | Australia and India increased mine production, especially for coal and iron ore. Prices for those commodities continue to be high, and we project investments in new mine capacity and supporting infrastructure will grow. |
Page 53
|
| (1) The PPS outlook is between $3.85 and $4.00. The above chart illustrates operating profit at the midpoint of this profit range. Each of the stair steps in the chart may individually vary within the outlook range. |
(2) Includes the impact of currency on operating profit. Currency is a separate stair step in the actual charts. |
| (3) Includes $100 million of potential charges. |
2005 OUTLOOK - PROFIT
The profit outlook for 2005 has been adjusted to reflect an estimated profit range of $3.85 to $4.00 per share, up 34 to 39 percent. The previous outlook reflected sales and revenues up 18 to 20 percent and profit per share of $4.00 to $4.20.
The change in the profit outlook includes potential charges of approximately $100 million before tax that are likely to be incurred in the fourth quarter and an increase in the estimated annual tax rate to 30 percent. Potential charges of $100 million are related to changes in our dealer distribution software that are under consideration and a product portfolio change impacting telehandler products. About $20 million of the potential charges relate to telehandlers. On October 26, 2005, we signed definitive agreements to enter into a global alliance with JLG Industries, Inc. (JLG) that will transition the design and production of Cat-branded telehandlers from Caterpillar to JLG.
The fourth-quarter outlook for 2005 reflects sales and revenues of $9.6 billion and profit per share in a range between $1.01 and $1.16.
Preliminary 2006 Outlook
Interest rates, except in the United States, have been fairly stable, and we expect only moderate rate increases in 2006. Inflation is low in most countries, and economic growth is not exceeding potential capacity. The world economy should grow about 3.5 percent, or the same as in 2005. Growth in the United States will slow to a little over 3 percent; improvements in Europe and Japan will offset this slowing.
| · | Low interest rates, rising employment and better home prices should allow some growth in housing construction, particularly outside the United States. Hurricane damage repair in the U.S. Gulf region will be a positive catalyst for building construction in 2006. |
| · | Another year of good economic growth will leave nonresidential structures increasingly inadequate to efficiently support production. We expect businesses will use record cash flows to increase spending on construction and standby power. |
| · | Economic growth will put increasing stress on many countries’ infrastructure. Governments are expected to use improved finances to increase infrastructure spending. We expect the U.S. highway bill will increase federal funds available for highway construction. |
| · | We believe the investment in mining and energy development that has occurred so far in this cycle has not been sufficient to restore adequate production capacity worldwide. Next year should be another good year for these industries, with prices down only slightly from this year. |
| · | Our preliminary projection is for about 10 percent increase in company sales and revenues over expected 2005 results. |
| · | The profit outlook for 2006 is expected to be up 15 to 25 percent from the middle of the profit range in the 2005 outlook. |
| · | Included in the 2006 profit outlook is approximately $100 million of pretax expense for the impact of expensing stock options as required by SFAS 123R, "Share-Based Payment". In addition, our 2006 outlook assumes increased expense for employee benefits costs and a higher effective tax rate because of the continued phase-out of ETI. The American Jobs Creation Act provides for the phase-out of ETI with 80 percent of benefits in 2005, 60 percent of benefits in 2006 and complete phase-out in 2007. |
The outlook described above reflects our base case expectations. Economic risks to this outlook include: (1) excessive increases in interest rates driven by central bank inflationary concerns and (2) high energy costs that could negatively impact consumption. These developments could become severe enough to lower our outlook for 2006.
G. Safe Harbor Statement under the Securities Litigation Reform Act of 1995
Certain statements contained in our third-quarter 2005 10-Q are forward-looking and involve uncertainties that could significantly impact results. The words "believes," "expects," "estimates," "anticipates," "will be," "should" and similar words or expressions identify forward-looking statements made on behalf of Caterpillar. Uncertainties include factors that affect international businesses, as well as matters specific to the company and the markets it serves.
World Economic Factors
Our projection for about 3.5 percent growth in the world economy in 2005 assumes central banks will cautiously raise interest rates so as not to slow growth too much. Low interest rates, and continued good economic growth, should encourage further growth in construction and mining. Should central banks raise interest rates aggressively, both the world economic recovery and our Machinery and Engines sales likely would be weaker.
We expect the U.S. economy to grow over 3.5 percent in 2005, which up to now has not created an inflation problem. While the Federal Reserve has raised interest rates, we assume the continuation of moderate growth and low inflation will result in interest rates of 4 percent or slightly higher by the end of 2005. Long-term interest rates are expected to rise less than short-term rates. That environment should support further growth in construction and manufacturing, helping to keep commodity prices favorable. Should financial conditions tighten noticeably, causing economic growth to slow below 3 percent, expected improvements in Machinery and Engines sales likely would be lower than projected.
Our projection of increased sales of Machinery and Engines in Europe, Africa, Middle East (EAME) in 2005 assumes that low interest rates will allow slightly faster economic growth in Europe and that favorable commodity prices will extend healthy recoveries in both Africa and Middle East (AME) and the CIS. Key risks are a significant slowing in the European economy or a collapse in commodity prices. Those developments would likely negatively impact our results.
Favorable commodity prices, increased capital inflows and an improved foreign debt situation are expected to contribute to about 4 percent growth in Latin America in 2005. As a result, we project that both mining production and construction spending will increase, supporting an increase in Machinery and Engines sales. This forecast is vulnerable to a significant weakening in commodity prices, slowing in world economic growth, widespread increases in interest rates or political disruptions.
In Asia/Pacific, we project sales growth in 2005 will be concentrated in Australia and India. Critical assumptions are continued growth in coal demand, low domestic interest rates in most countries, further gains in exports and continued good economic growth in China. Some developments that could lower expected results include reduced demand for thermal and coking coal, significant revaluations of regional currencies, restrictions on regional exports and sharp interest rate hikes, particularly in China and Indonesia.
In 2006, we assume that interest rates will increase moderately and world economic growth will be about 3.5 percent or the same as in 2005. Should interest rates increase more rapidly such that economic growth slows, sales of Machinery and Engines could be less than anticipated. High interest rates and slower economic growth could cause housing construction to decline and worsen government budgets, thereby causing reductions in infrastructure spending. Slower economic growth could also weaken energy and metals demand, driving prices low enough to undermine new investments.
Commodity Prices
Commodities represent a significant sales opportunity, with prices and production as key drivers. Prices have improved sharply over the past three years and our outlook assumes continued growth in world industrial production will cause metals prices to remain high enough in both 2005 and 2006 to encourage further mine investment. Any unexpected weakening in world industrial production or construction, however, could cause prices to drop sharply to the detriment of our results.
Coal prices improved and our sales have benefited. We expect favorable conditions to continue in the future. Should coal prices soften, due to a slowing in world economic growth or otherwise, the ongoing sales recovery would be vulnerable.
Page 55
Oil and natural gas prices increased sharply over the past three years due to strong demand and high capacity usage. Higher energy prices have not halted economic recoveries since strong demand boosted prices and world production increased. High prices are encouraging more exploration and development. However, continued high energy prices could eventually depress spending in consuming countries sufficiently to reduce overall world economic growth. Additionally, should significant supply cuts occur, such as from OPEC production cuts or political unrest in a major producing country, the resulting oil shortages and price spikes could slow economies, potentially with a depressing impact on our sales.
Monetary and Fiscal Policies
For most companies operating in a global economy, monetary and fiscal policies implemented in the United States and abroad could have a significant impact on economic growth, and accordingly, demand for our product. In general, higher than expected interest rates, reductions in government spending, higher taxes, excessive currency movements, and uncertainty over key policies are some factors likely to lead to slower economic growth and lower industry demand.
With economic data looking more favorable, central banks in several developed countries have raised interest rates from the lowest rates in decades, with the U. S. Federal Reserve Bank being the most aggressive. Our outlook assumes that central banks will try to avoid increasing rates so much that economic recoveries stall. Should central banks raise interest rates more aggressively than anticipated, both economic growth and our sales could suffer.
Budget deficits in many countries remain higher than governments would like. Our outlook assumes that governments will not aggressively raise taxes and slash spending to deal with their budget imbalances. Such actions could disrupt growth and negatively affect our sales.
Political Factors
Political factors in the United States and abroad can impact global companies. Our outlook assumes that no major disruptive changes in economic policies occur in either the United States or other major economies. Significant changes in either taxing or spending policies could reduce activities in sectors important to our businesses, thereby reducing sales.
Our outlook assumes that there will be no additional significant military conflicts in either North Korea or the Middle East in the forecast period. Such military conflicts could severely disrupt sales into countries affected, as well as nearby countries.
Our outlook also assumes that there will be no major terrorist attacks. If there is a major terrorist attack, confidence could be undermined, potentially causing a sharp drop in economic activities and our sales. Attacks in major developed economies would be the most disruptive.
Our outlook assumes that efforts by countries to increase their exports will not result in retaliatory countermeasures by other countries to block such exports, particularly in the Asia/Pacific region. Our outlook includes a negative impact from the phase-out of the Extraterritorial Income Exclusion (ETI) as enacted by the American Jobs Creation Act of 2004 (the Act). Our outlook assumes any other tax law changes will not negatively impact our provision for income taxes.
Currency Fluctuations
The company has costs and revenues in many currencies and is therefore exposed to risks arising from currency fluctuations. Our outlook assumes no significant changes in currency values from current rates. Should currency rates change sharply, economic activity and our results could be negatively impacted.
The company's largest manufacturing presence is in the United States, so any unexpected strengthening of the dollar tends to raise the foreign currency costs to our end users and reduce our global competitiveness.
Dealer Practices
The company sells primarily through an independent dealer network. Dealers carry inventories of both new and rental equipment and adjust those inventories based on their assessments of future needs. Such adjustments can impact our results either positively or negatively. The current outlook assumes dealers will increase inventories in line with higher deliveries. Should dealers control inventories more tightly, our sales would be lower.
Financial Products Division Factors
Inherent in the operation of Cat Financial is the credit risk associated with its customers. The creditworthiness of each customer, and the rate of delinquencies, repossessions and net losses on customer obligations are directly impacted by several factors, including, but not limited to, relevant industry and economic conditions, the availability of capital, the experience and expertise of the customer's management team, commodity prices, political events, and the sustained value of the underlying collateral. Additionally, interest rate movements create a degree of risk to our operations by affecting the amount of our interest payments and the value of our fixed rate debt. Our "match funding" policy addresses interest rate risk by aligning the interest rate profile (fixed or floating rate) of our debt portfolio with the interest rate profile of our receivables portfolio (loans and leases with customers and dealers) within pre-determined ranges on an ongoing basis. To achieve our match funding objectives, we issue debt with a similar interest rate profile to our receivables and also use interest rate swap agreements to manage our interest rate risk exposure to interest rate changes and in some cases to lower our cost of borrowed funds. If interest rates move upward more sharply than anticipated, our financial results could be negatively impacted. With respect to our insurance and investment management operations, changes in the equity and bond markets could cause an impairment of the value of our investment portfolio, thus requiring a negative adjustment to earnings.
Other Factors
The rate of infrastructure spending, housing starts, commercial construction and mining plays a significant role in the company's results. Our products are an integral component of these activities and as these activities increase or decrease in the United States or abroad, demand for our products may be significantly impacted.
Projected cost savings or synergies from alliances with new partners could also be negatively impacted by a variety of factors. These factors could include, among other things, higher than expected wages, energy and/or material costs, and/or higher than expected financing costs due to unforeseen changes in tax, trade, environmental, labor, safety, payroll or pension policies in any of the jurisdictions in which the alliances conduct their operations.
Results may be impacted positively or negatively by changes in the sales mix. Our outlook assumes a certain geographic mix of sales as well as a product mix of sales. If actual results vary from this projected geographic and product mix of sales, our results could be negatively impacted.
The company operates in a highly competitive environment and our outlook depends on a forecast of the company's share of industry sales. An unexpected reduction in that share could result from pricing or product strategies pursued by competitors, unanticipated product or manufacturing difficulties, a failure to price the product competitively, or an unexpected buildup in competitors' new machine or dealer owned rental fleets, leading to severe downward pressure on machine rental rates and/or used equipment prices.
The environment remains competitive from a pricing standpoint. Our 2005 sales outlook assumes that the price increases announced in early 2005 hold in the marketplace. If needed, additional price discounting to maintain our competitive position could result in lower than anticipated price realization.
In general, our results are sensitive to changes in economic growth, particularly those originating in construction, mining and energy. Developments reducing such activities also tend to lower our sales. In addition to the factors mentioned above, our results could be negatively impacted by any of the following:
· Any sudden drop in consumer or business confidence;
· Delays in legislation needed to fund public construction;
· Regulatory or legislative changes that slow activity in key industries; and/or
· Unexpected collapses in stock markets.
This discussion of uncertainties is by no means exhaustive, but is designed to highlight important factors that may impact our outlook. Obvious factors such as general economic conditions throughout the world do not warrant further discussion, but are noted to further emphasize the myriad of contingencies that may cause the company's actual results to differ from those currently anticipated.
Item 4. Controls and Procedures
Evaluation of disclosure controls and procedures
An evaluation was performed under the supervision and with the participation of the company's management, including the Chief Executive Officer (CEO) and Chief Financial Officer (CFO), of the effectiveness of the design and operation of the company's disclosure controls and procedures as of the end of the period covered by this quarterly report. Based on that evaluation, the company's management, including the CEO and CFO, concluded that the company's disclosure controls and procedures are effective to ensure that information required to be disclosed by the company in reports that it files or submits under the Securities Exchange Act of 1934 is recorded, processed, summarized, and reported within the time periods specified in Securities and Exchange Commission rules and forms. Although the design of any system of controls is based in part upon certain assumptions about the likelihood of future events, and there can be no assurance that any design will succeed in achieving its stated goals under all potential future conditions, regardless of how remote, management's evaluation provided reasonable assurance that these controls will be effective.
Changes in internal control over financial reporting
During the last fiscal quarter, there has been no significant change in the company's internal controls over financial reporting that has materially affected, or is reasonably likely to materially affect, the company's internal control over financial reporting.
PART II. OTHER INFORMATION
Item 1. Legal Proceedings.
We have disclosed certain individual legal proceedings in this filing. Additionally, we are involved in other unresolved legal actions that arise in the normal course of business. The most prevalent of these unresolved actions involve disputes related to product design, manufacture and performance liability (including claimed asbestos and welding fumes exposure), contracts, employment issues and intellectual property rights. Although it is not possible to predict with certainty the outcome of these unresolved legal actions or the range of probable loss, we believe that these unresolved legal actions will not individually or in the aggregate have a material impact on our consolidated financial position, liquidity or results of operations.
On January 16, 2002, Caterpillar commenced an action in the Circuit Court of the Tenth Judicial Circuit of Illinois in Peoria, Illinois, against Navistar International Transportation Corporation and International Truck and Engine Corporation (collectively Navistar). The lawsuit arises out of a long-term purchase contract between Caterpillar and Navistar effective May 31, 1988, as amended from time to time (the Purchase Agreement). The pending complaint alleges, among other things, that Navistar breached its contractual obligations by: (i) paying Caterpillar $8.08 less per fuel injector than the agreed upon price for new unit injectors delivered by Caterpillar; (ii) refusing to pay contractually agreed upon surcharges owed as a result of Navistar ordering less than planned volumes of replacement unit injectors; and (iii) refusing to pay contractually agreed upon interest stemming from Navistar's late payments. As of September 30, 2005, the net past due receivable from Navistar regarding the foregoing and included in “Long-term receivables - trade and other” in the Consolidated Statement of Financial Position totaled $139 million. The pending complaint also has claims alleging that Newstream Enterprises and Navistar, collectively and individually, failed to pay the applicable price to Caterpillar for shipments of unit injectors to Newstream. As of September 30, 2005, the net past due receivables for the foregoing, included in “Long-term receivables - trade and other” in the Consolidated Statement of Financial Position totaled $12 million. The pending complaint further alleges that Sturman Industries, Inc. and Sturman Engine Systems, Inc. colluded with Navistar to utilize technology that Sturman Industries, Inc. misappropriated from Caterpillar to help Navistar develop its G2 fuel system, and tortiously interfered with the Purchase Agreement and Caterpillar's prospective economic relationship with Navistar. The pending complaint further alleges that the two parties' collusion led Navistar to select Sturman Engine Systems, Inc., and another company, instead of Caterpillar, to develop and manufacture the G2 fuel system.
Page 57
On September 30, 2005, International Truck and Engine Corporation (International) commenced an action against Caterpillar in the Circuit Court of the Tenth Judicial Circuit of Illinois in Peoria, Illinois. The lawsuit states that it arises out of the May 31, 1988 Purchase Agreement described above. The Complaint alleges, among other things, that Caterpillar procured the May 31, 1988 Purchase Agreement by fraudulently misrepresenting or concealing information related to the business of selling fuel injectors to International, and that Caterpillar breached the Purchase Agreement. International’s Complaint does not specify the amount of damages being sought. Caterpillar intends to defend itself vigorously in this case.
On May 7, 2002, International commenced an action against Caterpillar in the Circuit Court of DuPage County, Illinois regarding a long-term agreement term sheet ("term sheet") (the “first lawsuit”). In its sixth amended complaint in the first lawsuit, International alleged that the term sheet constitutes a legally binding contract for the sale of heavy-duty engines at specified prices through the end of 2006, alleged that Caterpillar breached the term sheet by, among other things, raising certain prices effective October 1, 2002, and also alleged that Caterpillar breached an obligation to negotiate a comprehensive long-term agreement referenced in the term sheet. International sought declaratory and injunctive relief as well as damages in an amount to be determined at trial. Caterpillar denied International's claims and filed a counterclaim seeking a declaration that the term sheet had been effectively terminated. Caterpillar also asserted that pursuant to a subsequent agreement International released Caterpillar from certain of its claims. On September 24, 2003 the Appellate Court of Illinois, ruling on an interlocutory appeal, issued an order consistent with Caterpillar's position that, even if the court subsequently determines that the term sheet is a binding contract, it is indefinite in duration and was therefore terminable at will by Caterpillar upon reasonable notice. On April 12, 2005 International commenced a second, related action against Caterpillar in the Circuit Court of DuPage County, Illinois (the “second lawsuit”). The second lawsuit contained allegations similar to the allegations contained in the first lawsuit. International also alleged in the second lawsuit that Caterpillar materially breached the subsequent agreement. On June 15, 2005 International voluntarily dismissed its complaint in the first lawsuit. The second lawsuit has been consolidated with Caterpillar’s counterclaims from the first lawsuit. No trial date is currently scheduled for this case, which is not related to the breach of contract action brought by Caterpillar against Navistar which is currently pending in the Circuit Court of Peoria County, Illinois.
Item 2. Changes in Securities, Use of Proceeds and Issuer Purchases of Equity Securities.
Issuer Purchases of Equity Securities
Period | | Total number of Shares Purchased | | Average Price Paid per Share | | Total Number of Shares Purchased Under the Program | | Maximum Number of Shares that May Yet Be Purchased Under the Program |
| |
| |
| |
| |
|
| July 1-31, 2005 | | 925,000 | | | $ | 54.05 | | | 925,000 | | | 38,304,732 | 1 |
| August 1-31, 2005 | | 925,000 | | | | 54.04 | | | 925,000 | | | 39,835,245 | 1 |
| September 1-30, 2005 | | 1,734,000 | | | | 57.66 | | | 1,734,000 | | | 40,208,493 | 1 |
| |
| |
| |
| | | |
Total | | 3,584,000 | | | $ | 55.79 | | | 3,584,000 | | | | |
| | |
|
| |
|
|
| |
|
| | | |
| (1) On October 8, 2003, the Board of Directors approved an extension of the share repurchase program (through October 2008) with the goal of reducing the company's outstanding shares to 320,000,000. The share repurchase program goal has been adjusted for the stock split announced on June 8, 2005 to reflect an adjusted goal of 640,000,000 shares outstanding by October 2008. Amount represents the shares outstanding at the end of the period less 640,000,000. |
|
Other Purchases of Equity Securities
Period
| | Total number of Shares Purchased1
| | Average Price Paid per Share
| | Total Number of Shares Purchased Under the Program
| | Maximum Number of Shares that May Yet Be Purchased Under the Program
|
| July 1-31, 2005 | | 4,802 | | | $ | 46.97 | | | NA | | | NA | |
| August 1-31, 2005 | | - | | | | - | | | NA | | | NA | |
| September 1-30, 2005 | | - | | | | - | | | NA | | | NA | |
| |
| |
| | | | | | |
Total | | 4,802 | | | $ | 46.97 | | | | | | | |
| | |
|
| |
|
|
| | | | | | |
| (1) Represents shares delivered back to issuer for the payment of taxes resulting from the release of restricted stock. |
Non-U.S. Employee Stock Purchase Plans
We have 28 employee stock purchase plans administered outside the United States for our non-U.S. employees. As of September 30, 2005, those plans had approximately 9,100 participants in the aggregate. During the third quarter of 2005, approximately 167,000 shares of Caterpillar common stock or foreign denominated equivalents were distributed under the plans. Participants in some non-U.S. plans have the option of receiving non-U.S. share certificates (foreign-denominated equivalents) in lieu of U.S. shares of Caterpillar Inc. common stock upon withdrawal from the plan. These equivalent certificates are tradable only on the local stock market and are included in our determination of shares outstanding.
Item 6. Exhibits |
| | | Exhibits: |
| | | 3 | Amendment to Certificate of Designation, Preferences and Rights of the Terms of the Series A Junior Participating Preferred Stock. |
| | | 31.1 | Certification of James W. Owens, Chairman and Chief Executive Officer of Caterpillar Inc., as required pursuant to Section 302 of the Sarbanes-Oxley Act of 2002. |
| | | 31.2 | Certification of David B. Burritt, Chief Financial Officer of Caterpillar Inc., as required pursuant to Section 302 of the Sarbanes-Oxley Act of 2002. |
| | | 32 | Certification of James W. Owens, Chairman and Chief Executive Officer of Caterpillar Inc. and David B. Burritt, Chief Financial Officer of Caterpillar Inc., as required pursuant to Section 906 of the Sarbanes-Oxley Act of 2002. |
SIGNATURES |
Pursuant to the requirements of the Securities Exchange Act of 1934, the Registrant has duly caused this report to be signed on its behalf by the undersigned thereunto duly authorized. |
| | | | |
| | CATERPILLAR INC. | | |
November 4, 2005 | /s/ James W. Owens | | Chairman of the Board and Chief Executive Officer |
| |
| | |
| | (James W. Owens) | | |
| | | | |
November 4, 2005 | /s/ David B. Burritt | | Vice President and Chief Financial Officer |
| |
| | |
| | (David B. Burritt) | | |
| | | | |
November 4, 2005 | /s/ Bradley M. Halverson | | Controller and Chief Accounting Officer |
| |
| | |
| | (Bradley M. Halverson) | | |
| | | | |
November 4, 2005 | /s/ James B. Buda | | Secretary |
| |
| | |
| | (James B. Buda) | | |