EXHIBIT 99.1
Caterpillar Inc.
4Q 2005 / Year-end Earnings Release
For distribution on January 26, 2006
FOR IMMEDIATE RELEASE
Caterpillar Announces Record Fourth Quarter and Record Full-Year 2005 Results;
Company Raises 2006 Profit Outlook
Caterpillar projects $40 billion in sales and revenues and profit per share between $4.65 and $5.00 for 2006 and will place even greater emphasis on employee safety, product quality and product availability
PEORIA, Ill. - Caterpillar Inc. (NYSE: CAT) effectively responded to unprecedented customer demand in 2005 and reports full-year sales and revenues of $36.339 billion and profit per share of $4.04. Sales and revenues rose 20 percent from 2004, and profit per share was up 40 percent—both were records. Fourth-quarter sales and revenues of $9.663 billion and profit per share of $1.20 were both all-time records for any quarter in Caterpillar history.
“2005 was an incredibly strong year for us,” said Caterpillar Chairman and Chief Executive Officer Jim Owens. “With the surge in customer demand and production, our employees, suppliers and dealers have responded in spectacular fashion to help us realize the opportunity. We should celebrate our 2005 accomplishments knowing Caterpillar is extremely well-positioned going forward.”
2005 sales and revenues of $36.339 billion were up $6.033 billion, or 20 percent, from 2004. The increase was a result of $3.715 billion of higher sales volume, $1.827 billion of improved price realization and a $363 million increase in Financial Products revenues.
Profit of $2.854 billion, or $4.04 a share, was up 40 percent. The improvement was primarily the result of higher price realization and sales volume, partially offset by an increase in core operating costs. The increase was a result of higher material costs, primarily steel, and costs to support higher volume and ongoing investment in new products and technology.
“Our focus this year has been on meeting customer delivery expectations while creating stockholder value. I’m gratified by what Team Caterpillar has accomplished in the face of unprecedented demand,” Owens said. “Over the past two years we’ve more than doubled production at several of our manufacturing facilities, particularly those manufacturing large machines. We’ve done this without additional bricks and mortar and with a focus on managing our period cost structure.”
(A more complete review of full year and fourth-quarter results begin on page 4.)
Page 1
Outlook
In 2006, the company expects sales and revenues of about $40 billion and profit per share between $4.65 and $5.00.
“2006 should be another year of excellent growth for Caterpillar, ” Owens said. “Most of the industries we serve are strong, and the fundamental economic picture remains positive. Our emphasis is on execution with 6 Sigma as we implement our new strategy to achieve our 2010 goals, with even greater focus on improving employee safety, product quality and product availability.”
(Complete outlook begins on page 9.)
For 80 years, Caterpillar has been building the world's infrastructure and, in partnership with our independent dealers, is driving positive and sustainable change on every continent. Caterpillar is a technology leader and the world's largest maker of construction and mining equipment, diesel and natural gas engines and industrial gas turbines. More information is available at http://www.CAT.com/.
Note: Glossary of terms included on pages 22-24; first occurrence of terms shown in bold italics.
Page 2
Key Points
Full-Year Comparison
| § | Full-year sales and revenues were the highest in company history—$36.339 billion—and were 20 percent higher than in 2004. |
| § | Machinery sales increased 22 percent, Engines sales increased 17 percent and Financial Products revenues rose 18 percent from a year ago. |
| § | Full-year profit was the highest in company history—$2.854 billion, or $4.04 per share—40 percent higher than in 2004. |
| § | Machinery and Engines operating profit as a percent of sales increased substantially—from 8.3 percent in 2004 to 10.3 percent in 2005. The increase was the result of improved price realization, higher sales volume and management of our period cost structure, somewhat offset by continued pressure on variable manufacturing costs. |
Fourth-Quarter Comparison
| § | Sales and revenues were the highest in Caterpillar history—$9.663 billion—and were 13 percent higher than the fourth quarter of 2004. |
| § | Profit per share was the highest in company history—$1.20—56 percent higher than the fourth quarter of 2004. |
| § | For Machinery and Engines the increase in operating profit was 40 percent of the increase in sales. |
Outlook
| § | Caterpillar expects 2006 sales and revenues to be about $40 billion and profit per share in the range of $4.65 to $5.00. |
| § | The profit outlook has been increased from the preliminary outlook issued with Caterpillar’s third quarter 2005 release (profit per share of $4.52 to $4.91). The outlook for sales and revenues is unchanged. |
Cash Flow
| § | 2005 was a strong year for operating cash flow—$3.113 billion on a consolidated basis and $2.810 billion for Machinery and Engines, which included about $900 million of pension contributions. For Machinery and Engines, cash was primarily used to repurchase 33.9 million shares of stock, fund $1.162 billion of capital expenditures and pay $618 million of dividends. |
| § | Shares repurchased totaled 11.9 million during the fourth quarter, bringing the full-year total to 33.9 million shares. With shares issued to cover options exercised, the net reduction of shares outstanding was 15.0 million in 2005. |
A question and answer section has been included in this release starting on page 18.
Page 3
DETAILED ANALYSIS
2005 vs. 2004
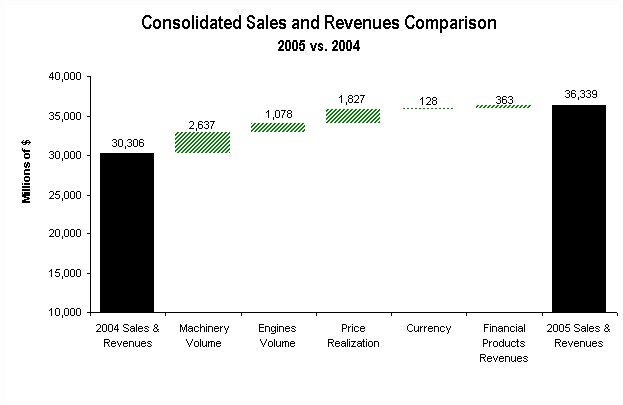 |
| The chart above graphically illustrates reasons for the change in Consolidated Sales and Revenues between 2004 (at left) and 2005 (at right). Items favorably impacting sales and revenues appear as upward stair steps with the corresponding dollar amounts above each bar. Caterpillar management utilizes these charts internally to visually communicate with its Board and employees. |
Sales and Revenues
Sales and revenues for 2005 were $36.339 billion, up $6.033 billion, or 20 percent, from 2004. Machinery volume was up $2.637 billion, Engines volume was up $1.078 billion, price realization improved $1.827 billion and currency had a positive impact on sales of $128 million. In addition, Financial Products revenues increased $363 million.
Sales and Revenues by Geographic Region | ||||||||||||||||||||||||
(Millions of dollars) | Total | % Change | North America | % Change | EAME | % Change | Latin America | % Change | Asia/ Pacific | % Change | ||||||||||||||
2004 | ||||||||||||||||||||||||
| Machinery | $ | 18,844 | $ | 10,337 | $ | 4,511 | $ | 1,510 | $ | 2,486 | ||||||||||||||
Engines1 | 9,492 | 4,184 | 2,994 | 862 | 1,452 | |||||||||||||||||||
Financial Products2 | 1,970 | 1,384 | 338 | 118 | 130 | |||||||||||||||||||
| $ | 30,306 | $ | 15,905 | $ | 7,843 | $ | 2,490 | $ | 4,068 | |||||||||||||||
2005 | ||||||||||||||||||||||||
| Machinery | $ | 22,931 | 22% | $ | 12,822 | 24% | $ | 5,222 | 16% | $ | 1,982 | 31% | $ | 2,905 | 17% | |||||||||
Engines1 | 11,075 | 17% | 4,887 | 17% | 3,638 | 22% | 1,042 | 21% | 1,508 | 4% | ||||||||||||||
Financial Products2 | 2,333 | 18% | 1,659 | 20% | 341 | 1% | 148 | 25% | 185 | 42% | ||||||||||||||
| $ | 36,339 | 20% | $ | 19,368 | 22% | $ | 9,201 | 17% | $ | 3,172 | 27% | $ | 4,598 | 13% | ||||||||||
1 Does not include internal engines transfers of $2,065 million and $1,738 million in 2005 and 2004, respectively. Internal engines transfers are valued at prices comparable to those for unrelated parties. | ||||||||||||||||||||||||
2 Does not include revenues earned from Machinery and Engines of $317 million and $199 million in 2005 and 2004, respectively. | ||||||||||||||||||||||||
Page 4
Machinery Sales
Machinery sales in 2005 were $22.931 billion, an increase of $4.087 billion, or 22 percent, from 2004. Sales were an all-time record for a year. Sales volume accounted for $2.637 billion of the increase, price realization added $1.343 billion and the remaining $107 million was due to currency.
Growth in sales volume resulted from increased shipments to dealers in response to broad-based gains in reported dealer deliveries to end users. All regions and most industries participated in this growth, which showed little sign of abating as the year ended. Worldwide, dealers reported increases to machine inventory in both 2004 and 2005. At the end of 2005, dealers reported lower machine inventory, as measured by months of supply, than at the end of 2004.
| § | North America sales were up $2.485 billion, or 24 percent, from 2004; sales volume increased $1.653 billion and price realization added $832 million. Growth in sales volume resulted largely from increased sales through our dealer network, the result of favorable metals and energy prices and increased construction spending. Dealers built machine inventories in line with deliveries so that inventories in months of deliveries were the same as at the end of 2004. |
| § | EAME sales increased 16 percent, or $711 million, compared to 2004. Sales volume accounted for $421 million, improved price realization added $253 million and the remaining $37 million came from the favorable impact of currency. Volume growth occurred as a result of increased sales through our dealer network. Low interest rates benefited housing construction in Europe, and higher metals and energy prices supported both construction and mining in Africa/Middle East (AME). Mining and energy investment in the Commonwealth of Independent States (CIS) increased and had a positive effect on Caterpillar sales. |
| § | Latin America sales rose $472 million, or 31 percent, from the same period a year ago—$304 million from increased volume, $120 million from improved price realization and the remaining $48 million due to currency, primarily related to a stronger Brazilian real. Increased sales through our dealer network into both construction and mining sectors accounted for all the sales volume growth; dealer machine inventories declined in both absolute amount and months of deliveries. |
| § | Asia/Pacific sales were up 17 percent, or $419 million, higher than last year—$259 million from higher volume, $138 million from improved price realization and the remaining $22 million due to currency. Sales volume in most of the larger countries increased, a result of very strong mining activity and continued growth in construction. In China, sales were down modestly for the year. Sales in China have been rising since early in 2005 following a steep downturn in the second half of 2004. Dealers in the Asia/Pacific region added less to their inventories than in 2004. Dealer machine inventories at December 2005, in months of deliveries, were below 2004. |
Engines Sales
Engine sales were $11.075 billion in 2005, up $1.583 billion, or 17 percent, from 2004. Volume accounted for $1.078 billion, price realization added $484 million and currency added $21 million.
Page 5
Dealer engine inventory increased during both full-year 2005 and full-year 2004. The 2005 inventory increase was less than the 2004 increase, which slightly reduced the company’s year-over-year sales growth. Months of inventory relative to deliveries declined in most regions and sectors compared to 2004.
| § | North America sales were up 17 percent. Sales of petroleum engines increased 50 percent, primarily from increased sales of reciprocating engines for drilling and gas compression and turbines and related services for gas production and transmission. High oil and gas prices were a significant factor behind the increase in sales. Sales of on-highway truck engines were up 5 percent, primarily due to expansion and replacement of truck fleets. Sales of electric power engines were up 21 percent, with widespread demand for generator sets for communications, data center and standby applications. Marine engine sales were up 33 percent, primarily from increased demand for workboats and petroleum support vessels. |
| § | EAME sales increased 22 percent. Sales into the electric power sector were up 35 percent, with widespread growth in demand for reciprocating generator sets, support from Middle East reconstruction efforts and incremental revenue from the acquisition of Turbomach, a turbine generator set packager and service provider. Marine engine sales increased 20 percent, with strong demand for oceangoing and inland waterway vessels. Sales of industrial engines were up 8 percent—a result of increases in demand from a broad range of industrial equipment customers, partially offset by lower demand from agricultural equipment manufacturers. Petroleum engine sales dropped 4 percent for the year, primarily from reduced shipments for turbines and turbine-related services for offshore oil platforms and gas transmission projects. |
| § | Latin America sales were up 21 percent. Sales of petroleum engines increased 49 percent, with nearly all of the increase from sales of turbines and turbine-related services to support increased investment in oil production. Sales of electric power engines increased 44 percent, benefiting from investments in generator sets for electricity reliability and disaster preparedness as well as demand for rental fleets. Sales of industrial engines decreased 34 percent, with reduced demand for engines for agricultural equipment. Sales of marine engines declined 37 percent, impacted by limited shipyard capacity and comparison with a high 2004 base. |
| § | Asia/Pacific sales were up 4 percent. Sales of marine engines were up 26 percent, with increased demand for oceangoing and petroleum support vessels due to strong freight and petroleum demand. Petroleum engine sales increased 12 percent, with widespread demand for reciprocating engines for petroleum site power, drilling and well support and demand for turbines and related services to support production. Electric power engine sales declined 19 percent, with most of the decline due to centralized electrical demand management actions and improved electricity reliability in China that drove reduced demand for generator sets. |
Financial Products Revenues
Financial Products revenues were $2.333 billion, up $363 million, or 18 percent, from 2004. The increase was due primarily to a $211 million favorable impact from continued growth of Earning Assets and an $89 million impact of higher interest rates on new and existing finance receivables at Cat Financial. Also, there was a $47 million increase in revenues at Cat Insurance, primarily due to an increase in earned premiums.
Page 6
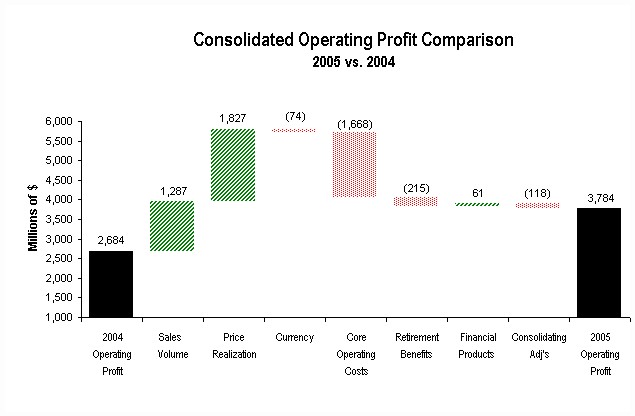 |
| The chart above graphically illustrates reasons for the change in Consolidated Operating Profit between 2004 (at left) and 2005 (at right). Items favorably impacting operating profit appear as upward stair steps with the corresponding dollar amounts above each bar, while items negatively impacting operating profit appear as downward stair steps with dollar amounts reflected in parentheses above each bar. Caterpillar management utilizes these charts internally to visually communicate with its Board and employees. |
Operating Profit
Operating profit in 2005 improved $1.100 billion, or 41 percent, from last year, driven by higher price realization and sales volume, partially offset by higher core operating costs and retirement benefits.
Core operating costs rose $1.668 billion from 2004, primarily due to a $1.296 billion increase in manufacturing costs. Approximately two-thirds of the manufacturing cost increase was attributable to variable costs—primarily higher material costs and supply chain-related inefficiencies. The remainder of the manufacturing cost increase was due to higher period manufacturing costs; the significant increase in Machinery and Engines sales volume was a key driver. Non-manufacturing-related core operating costs were up $372 million—primarily the result of higher Selling, General and Administrative (SG&A) and Research and Development (R&D) expenses to support new product programs and growth. The increase also included about $70 million of charges related to changes in our dealer distribution support software and the global telehandler alliance that was announced in the fourth quarter of 2005. As a percent of sales, both SG&A and R&D expenses were lower than in 2004.
Page 7
Operating Profit by Principal Line of Business | |||||||||||||
(Millions of dollars) | 2004 | 2005 | Change $ | Change % | |||||||||
Machinery1 | $ | 1,756 | $ | 2,431 | $ | 675 | 38% | ||||||
Engines1 | 589 | 1,071 | 482 | 82% | |||||||||
| Financial Products | 470 | 531 | 61 | 13% | |||||||||
Consolidating Adjustments | (131 | ) | (249 | ) | (118 | ) | |||||||
| Consolidated Operating Profit | $ | 2,684 | $ | 3,784 | $ | 1,100 | 41% | ||||||
1 Caterpillar operations are highly integrated; therefore, the company uses a number of allocations to determine lines of business operating profit for Machinery and Engines. | |||||||||||||
Operating Profit by Principal Line of Business
| § | Machinery operating profit of $2.431 billion was up $675 million, or 38 percent, from 2004. The favorable impact of improved price realization and higher sales volume was partially offset by higher core operating costs and higher retirement benefits. |
| § | Engines operating profit of $1.071 billion was up $482 million, or 82 percent, from 2004. The favorable impact of improved price realization and higher sales volume was partially offset by higher core operating costs and higher retirement benefits. |
| § | Financial Products operating profit of $531 million was up $61 million, or 13 percent, from 2004. The increase was primarily due to $123 million favorable impact from the continued growth of earning assets at Cat Financial. Partially offsetting this increase were $33 million in higher operating expenses, primarily related to growth at Cat Financial and a $28 million decrease in operating profit at Cat Insurance, primarily due to less favorable insurance reserve adjustments in 2005 than in 2004. |
Other Profit/Loss Items
| § | Other income/expense was income of $377 million compared with income of $253 million in 2004. The improvement was due to the favorable impact of currency, higher interest income and the absence of a number of expense items incurred during 2004 that were individually not significant. |
| § | The provision for income taxes in 2005 reflects an annual tax rate of 29.5 percent, excluding the discrete items discussed below, and compares to a 27 percent rate in 2004. The increase is primarily due to a reduction in our Extraterritorial Income Exclusion (ETI) benefits, partially attributable to the impact of the American Jobs Creation Act (AJCA) permitting only 80 percent of ETI benefits in 2005 and to a change in our geographic mix of profits. During 2005, we repatriated earnings of $1.4 billion, which includes approximately $500 million subject to preferential tax treatment allowed by the AJCA. We recognized a charge of $33 million related to this repatriation. In connection with our current repatriation plan, we changed our intention of repatriating earnings for a few selected non-U.S. subsidiaries and recognized an income tax benefit of $38 million. In addition, we recognized an income tax benefit of $26 million from the settlement of several non-U.S. tax issues. The net impact of these items is a $31 million discrete benefit to our 2005 provision for income taxes. |
Page 8
Employment
Caterpillar’s worldwide employment was 85,116 in 2005 compared with 76,920 in 2004. The increase was primarily due to about 4,200 hourly labor additions to support higher volume and the conversion of about 2,000 supplemental employees to full-time employment. In addition, about 2,000 salaried and management employees were added in 2005 to support higher volume, new product introductions and growth of our service businesses.
2006 Outlook
2006 Outlook - Sales and Revenues
Sales and revenues are expected to increase about 10 percent in 2006, which would set a new record of about $40 billion. Of the 10 percent increase, about 7 percent is from higher Machinery and Engines volume and Financial Products revenues and about 3 percent from improved price realization.
| § | Inflation remains low in most countries, which should encourage central banks to continue to be cautious in raising interest rates. We expect short-term and long-term interest rates in most countries will remain attractive for business investment. |
| § | Relatively low inflation and a low interest rate environment should support continued growth in the world economy. We forecast worldwide economic growth of around 3.5 percent in 2006, about the same as in 2005. Somewhat faster growth in Europe and Japan should offset slower growth in the United States. Relatively high commodity prices have contributed to strong growth in developing countries over the past three years, and we expect that trend to continue in 2006. |
| § | Worldwide consumption of most base metals exceeded production in 2005, driving inventories relative to consumption to the lowest level in many years. As a result, metals prices reached new highs in early 2006, resulting in the longest price upturn since the late 1970s. With mine production difficulties continuing, we expect metals prices will remain very favorable for new investments this year. |
| § | Energy industries should provide attractive sales opportunities for machines, reciprocating engines and gas turbines in 2006. The world has little surplus production capacity, and we expect both oil and gas prices to trade at or above 2005 averages. Those price levels should encourage further growth in exploration, drilling and pipeline expenditures. |
| § | Construction spending, as well as investments in standby electric power, should increase further in 2006 to support growing economies. Investments in nonresidential structures should benefit from low long-term interest rates, good corporate profits and higher office rental rates. We expect governments in the commodity-exporting countries will use earnings from high prices to further increase infrastructure spending. |
| § | Existing orders for oceangoing vessels should have shipyards producing near capacity in 2006. Deliveries of feeder container ships, port service vessels and oil and gas offshore supply vessels should increase in 2006. |
Page 9
North America (United States and Canada) Machinery and Engines sales are expected to increase about 12 percent in 2006.
| § | We believe the U.S. Federal Reserve will not raise interest rates significantly in 2006, suggesting a peak Federal Funds rate of less than 5 percent this year. Economic growth slowed in 2005, and we project a further slowing to a little over 3 percent in 2006. Some consumer-related industries likely will continue to struggle due to modest growth in personal incomes and rising imports. But factors supporting business investment—low interest rates and high corporate profits—should continue. |
| § | U.S. housing starts exceeded 2 million units in 2005, the best year since 1972. Although opinions on housing are overwhelmingly negative, a collapse in activity seems unlikely. Mortgage rates, while up some from 2005 lows, are well below those rates that prevailed in the last housing cycle. Most of the other factors that recently benefited housing construction—rising home prices, household formations, demand for second homes and a shift away from mobile homes—remained in place at the start of 2006. We expect housing starts in 2006 to be moderately below 2005 levels. |
| § | Commercial and industrial lending and architectural billings—past leading indicators of nonresidential construction—have increased. With corporate profits near a record share of national income, we expect businesses to increase investments in structures at least 5 percent in 2006, roughly matching the recovery pattern of the upturn in the 1990s. |
| § | We expect highway contracting to increase about 7 percent in 2006 as a result of increased federal funding and further improvement in state and local government budgets. |
| § | Coal production declined slightly in 2005, driving coal stocks in months of consumption to a record low. Continued high coal prices, resolution of some transportation bottlenecks and a rebuilding of coal stocks should drive a 4 percent increase in coal production in 2006. |
| § | Natural gas production has not fully recovered from the impact of Hurricane Katrina, and prices in early January were up more than 30 percent from a year earlier. Those high prices should encourage further investment in exploration and development, which should boost engine sales. |
| § | North American production of large on-highway trucks should be near capacity in 2006 and about even with 2005 levels. Positives include strong freight movements, high trucking company profits and accelerated ordering in advance of stricter 2007 emission standards. |
| § | The Bank of Canada raised interest rates three times in 2005, but inflation is below the middle of the central bank’s target range. We expect interest rates, which are below those in the United States, to remain low enough to allow slightly better economic growth in 2006. Mining, energy and nonresidential construction should do well. |
EAME Machinery and Engines sales are expected to increase about 5 percent in 2006.
| § | Economic indicators suggest economic growth improved in the last half of 2005 in several Eurozone economies, due largely to a recovery in manufacturing. Leading indicators and business surveys indicate this positive momentum is continuing into 2006. |
Page 10
| § | The European Central Bank’s (ECB) decision to raise interest rates last December was controversial, and the bank subsequently indicated a less aggressive policy on rate increases. However, inflation is above the ECB’s target, so we expect at least one more rate increase this year. The Bank of England, which cut interest rates once in 2005, probably will hold rates steady throughout 2006 since economic growth appears to be rebounding. |
| § | With economic growth improving and interest rates remaining low, the European economy should grow slightly more than 2 percent in 2006. The Central European and Nordic economies should continue to outperform the Eurozone. |
| § | Eurozone housing permits increased more than 7 percent yearly over the past three years, and home prices are increasing in many European countries. With continued low interest rates and rising personal incomes, we expect housing construction to improve further in 2006. Construction surveys suggest other types of construction spending should recover, benefiting from low long-term interest rates and rising corporate profits. |
| § | We project economic growth in AME will exceed 5 percent in 2006, the fourth consecutive year of good growth. The current period is the best for sustained growth since the 1970s. High energy and metals prices are boosting investment in those sectors as well as providing governments the funds to increase infrastructure investment. Good economic growth should encourage more investment in standby electrical power. |
| § | In the CIS, we project economic growth will slow to around 6 percent, the fourth straight year of strong growth. Recoveries in energy and metals prices contributed significantly to better economic growth. We do not anticipate that recent disputes over natural gas prices will impact energy investments in Russia this year. |
Latin America Machinery and Engines sales are expected to increase about 6 percent in 2006.
| § | Interest rate trends within the region will likely diverge in 2006. Brazil, which started cutting interest rates last year in response to some slowing in manufacturing, is forecast to further reduce interest rates this year. Mexico is also expected to cut interest rates due to slowing inflation and moderate economic growth. Most other countries should raise interest rates slightly, but from some of the lowest rates in years. |
| § | We expect economic growth in the region will slow to slightly less than 4 percent in 2006. Economic growth in all key countries should remain strong enough to support growth in construction. Mine production is increasing in most countries, which, along with high metals prices, should encourage more investment in mining. |
Asia/Pacific Machinery and Engines sales are expected to increase about 11 percent in 2006.
| § | We project the regional economy will again be the fastest growing in the world, with 2006 growth continuing slightly above 6 percent. Low interest rates, competitive exchange rates and increased international trade should support the regional economy. Faster economic growth in Australia and developing Asia should offset a modest slowing in China’s economic growth rate. |
Page 11
| § | Steaming coal prices softened in late 2005 but remained above prices that would discourage new investments. We expect contract prices for iron ore to increase again in April and coking coal prices to hold much of the increases negotiated in 2005. Investments in new mine capacity and supporting infrastructure should increase further in 2006. |
| § | We expect construction spending to increase as well. Growing populations and higher home prices should boost housing construction, and rapid economic growth will likely require businesses to invest more in structures. |
Financial Products Revenues
We expect continued growth in Financial Products for 2006. Revenues are expected to increase approximately 18 percent versus 2005, primarily due to higher average earning assets in 2006.
Sales and Revenues Outlook | |||||||||||
(Millions of dollars) | 2005 | 2006 | % | ||||||||
Actual | Outlook | Change | |||||||||
| Machinery and Engines | |||||||||||
| North America | $ | 17,709 | $ | 19,850 | 12 | % | |||||
| EAME | 8,860 | 9,300 | 5 | % | |||||||
| Latin America | 3,024 | 3,200 | 6 | % | |||||||
| Asia/Pacific | 4,413 | 4,900 | 11 | % | |||||||
| Total Machinery and Engines | 34,006 | 37,250 | 10 | % | |||||||
Financial Products1 | 2,333 | 2,750 | 18 | % | |||||||
| Total | $ | 36,339 | $ | 40,000 | 10 | % | |||||
1 Does not include revenues earned from Machinery and Engines of $350 million and $317 million in 2006 and 2005, respectively. | |||||||||||
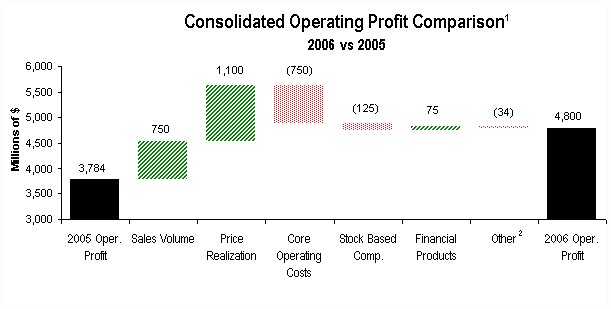 |
1 The PPS outlook is between $4.65 and $5.00. The above chart illustrates operating profit at the midpoint of this profit range. Each of the stair steps in the chart may individually vary within the outlook range. |
2 Other includes the impact of currency, consolidating adjustments and the effects of rounding. |
Page 12
2006 Outlook - Profit
We expect profit per share to be in the range of $4.65 to $5.00, up 15 percent to 24 percent from 2005. The year is expected to benefit from improved price realization and higher sales volume partially offset by core operating costs and stock-based compensation expense.
About half of the expected core operating cost increase is from manufacturing costs and about half from SG&A and R&D. Manufacturing costs are expected to be higher due to an increase of about 1 percent in material costs and an increase in manufacturing period costs to support higher volume.
The expected increase in SG&A and R&D expense is a result of labor inflation and developmental programs to support the growth envisioned by Caterpillar’s long-term strategy.
DETAILED ANALYSIS
Fourth Quarter 2005 vs. Fourth Quarter 2004
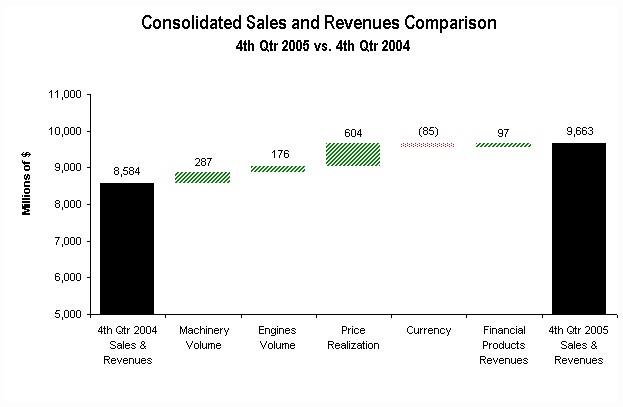 |
| The chart above graphically illustrates reasons for the change in Consolidated Sales and Revenues between 4th Quarter 2004 (at left) and 4th Quarter 2005 (at right). Items favorably impacting sales and revenues appear as upward stair steps with the corresponding dollar amounts above each bar, while items negatively impacting sales and revenues appear as downward stair steps with the corresponding dollar amount in parentheses above each bar. Caterpillar management utilizes these charts internally to visually communicate with its Board and employees. |
Page 13
Sales and Revenues
Sales and revenues for the fourth quarter of 2005 were $9.663 billion, up $1.079 billion, or 13 percent, from fourth quarter 2004. Price realization improved $604 million, Machinery volume was up $287 million, Engines volume was up $176 million and currency had an unfavorable impact on sales of $85 million due primarily to a weaker euro compared with fourth quarter 2004. In addition, Financial Products revenues increased $97 million.
Sales and Revenues by Geographic Region | ||||||||||||||||||||||||
(Millions of dollars) | Total | % Change | North America | % Change | EAME | % Change | Latin America | % Change | Asia/ Pacific | % Change | ||||||||||||||
4th Quarter 2004 | ||||||||||||||||||||||||
| Machinery | $ | 5,157 | $ | 2,783 | $ | 1,279 | $ | 447 | $ | 648 | ||||||||||||||
Engines1 | 2,902 | 1,213 | 955 | 276 | 458 | |||||||||||||||||||
Financial Products2 | 525 | 364 | 88 | 34 | 39 | |||||||||||||||||||
| $ | 8,584 | $ | 4,360 | $ | 2,322 | $ | 757 | $ | 1,145 | |||||||||||||||
4th Quarter 2005 | ||||||||||||||||||||||||
| Machinery | $ | 5,857 | 14% | $ | 3,375 | 21% | $ | 1,238 | -3% | $ | 465 | 4% | $ | 779 | 20% | |||||||||
Engines1 | 3,184 | 10% | 1,162 | -4% | 1,130 | 18% | 347 | 26% | 545 | 19% | ||||||||||||||
Financial Products2 | 622 | 18% | 447 | 23% | 85 | -3% | 43 | 26% | 47 | 21% | ||||||||||||||
| $ | 9,663 | 13% | $ | 4,984 | 14% | $ | 2,453 | 6% | $ | 855 | 13% | $ | 1,371 | 20% | ||||||||||
1 Does not include internal engines transfers of $458 million and $420 million in 2005 and 2004, respectively. Internal engines transfers are valued at prices comparable to those for unrelated parties. | ||||||||||||||||||||||||
2 Does not include revenues earned from Machinery and Engines of $93 million and $57 million in 2005 and 2004, respectively. | ||||||||||||||||||||||||
Machinery Sales
Machinery sales in fourth quarter 2005 were $5.857 billion, an increase of $700 million, or 14 percent, from fourth quarter 2004. Price realization accounted for $456 million of the increase, sales volume added $287 million and currency had an unfavorable impact of $43 million.
Dealers reported continued strong gains in deliveries to end users in most regions and industries. Dealers added much less to inventories than in the fourth quarter 2004. Worldwide machine inventories in months of deliveries, as reported by dealers, were lower than a year earlier.
| § | North America sales were up $592 million, or 21 percent, from fourth quarter 2004; price realization increased $308 million and sales volume added $284 million. The growth in sales volume resulted from increased sales through our dealer network due to continued good growth in dealer deliveries from a year earlier when activity benefited from the ending of depreciation incentives in the United States. Low long-term interest rates, good corporate profits and passage of a highway bill in the United States boosted construction spending. Higher metals and coal prices supported investment in mining. |
| § | EAME sales decreased 3 percent, or $41 million, compared to fourth quarter 2004. Currency unfavorably impacted sales by $62 million, and sales volume declined $50 million. These items were partially offset by $71 million of improved price realization. Dealers reduced inventories much more in fourth quarter 2005 than they did in the fourth quarter 2004, more than offsetting good growth in reported deliveries. The decline in sales volume was largely in Europe, where the economy just started to show some improvement in the last half of the year. Sales volume in Africa/Middle East increased significantly in response to higher commodity prices, particularly oil. |
Page 14
| § | Latin America sales rose $18 million, or 4 percent, from the same quarter last year—$35 million from improved price realization and $16 million from the impact of currency. These items were partially offset by a $33 million decline in sales volume, the result of dealers not building inventory as they did last year. Both construction and mining continued to do well in most countries. |
| § | Asia/Pacific sales were 20 percent, or $131 million, higher than last year—$86 million from higher volume, $42 million from improved price realization and the remaining $3 million due to currency. The growth in sales volume occurred largely in China, where sales through our dealer network continued to recover from last year’s sharp decline. |
Engines Sales
Engine sales were $3.184 billion in fourth quarter 2005—up 10 percent from the fourth quarter 2004. Sales volume accounted for 6 percent of the increase, while price realization accounted for 5 percent partially offset by a 1 percent unfavorable impact of currency on sales.
Dealer engine inventory increased during both fourth quarter 2005 and fourth quarter 2004. The 2005 inventory increase was less than the 2004 increase, which slightly reduced the company’s quarter-over-quarter sales growth. Months of inventory relative to deliveries declined in most regions and sectors compared to fourth quarter 2004.
| § | North America sales were down 4 percent. Sales of petroleum engines increased 32 percent, primarily from increased sales of reciprocating engines to support gas drilling and compression, supported by high gas prices and well service and frac applications. Sales of electric power engines increased 20 percent, with widespread demand for reciprocating generator sets to support data center and non residential construction activity. Sales of marine engines were up 32 percent, primarily due to increased workboat activity driven by high petroleum demand. Sales of on-highway truck engines decreased 26 percent, with the majority of the reduction due to truck original equipment manufacturers’ (OEM) decisions to reduce finished engine inventory holdings as engine availability improved. |
| § | EAME sales increased 18 percent. Sales of engines into the electric power sector were up 17 percent, with widespread growth in demand for reciprocating generator sets partially offset by reduced demand for turbines and turbine-related services. Sales of petroleum engines increased 57 percent, primarily due to increased turbine sales to support oil production in Africa. Sales of engines to the industrial sector declined 10 percent with reduced demand for agricultural equipment and some impact from vertical engine integration. Sales of marine engines declined 13 percent, driven by reduced demand for oceangoing vessel engines. |
| § | Latin America sales were up 26 percent. Sales of petroleum engines increased 89 percent from increased sales of turbines and turbine-related services to support increased investment in oil production. Sales of electric power engines doubled due to increased sales of power plant projects and widespread demand for small standby generator sets. Sales of industrial engines declined 47 percent with reduced demand for engines for agricultural equipment. Sales of marine engines declined 38 percent, impacted by shipyard capacity. |
Page 15
| § | Asia/Pacific sales were up 19 percent. Sales of engines to the petroleum sector were up 13 percent, primarily due to drill rig power applications to support oil production. Sales of industrial engines increased 59 percent with increased market preference for Caterpillar engines. Sales of marine engines remained about flat as full shipyard order books partially influenced demand for oceangoing engines. Sales of electric power engines dropped 18 percent, primarily due to reduced demand in China for generator sets to support electricity reliability and availability. |
Financial Products Revenues
Financial Products revenues were $622 million, up $97 million, or 18 percent, from fourth quarter 2004. The increase was due primarily to a $43 million favorable impact from continued growth of Earning Assets at Cat Financial and a $33 million impact of higher interest rates on new and existing finance receivables at Cat Financial. Also, there was a $19 million increase in revenues at Cat Insurance due primarily to an increase in earned premiums.
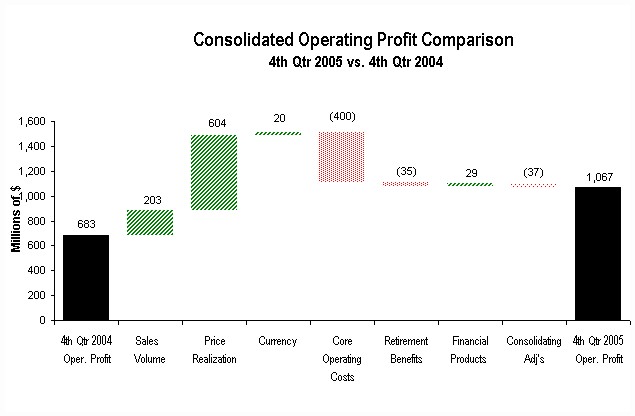 |
| The chart above graphically illustrates reasons for the change in Consolidated Operating Profit between 4th Quarter 2004 (at left) and 4th Quarter 2005 (at right). Items favorably impacting operating profit appear as upward stair steps with the corresponding dollar amounts above each bar, while items negatively impacting operating profit appear as downward stair steps with dollar amounts reflected in parentheses above each bar. Caterpillar management utilizes these charts internally to visually communicate with its Board and employees. |
Page 16
Operating Profit
Fourth-quarter operating profit improved $384 million, or 56 percent, over a year ago, driven by higher price realization and sales volume partially offset by higher core operating costs and retirement benefits.
Core operating costs rose $400 million from the fourth quarter of 2004, primarily due to a $225 million increase in manufacturing costs. Approximately two-thirds of the manufacturing cost increase was due to an increase in period manufacturing costs associated with building our products. The remainder of the manufacturing cost increase was attributable to variable costs due to volume- related inefficiencies. Non-manufacturing-related core operating costs were up $175 million—a result of higher SG&A and R&D expenses to support product programs and the growth in volume. Also included in this amount was about $70 million of charges related to changes in our dealer distribution support software and the global telehandler alliance that was announced in the fourth quarter of 2005.
Operating Profit by Principal Line of Business | |||||||||||||
(Millions of dollars) | 4th Quarter 2004 | 4th Quarter 2005 | Change $ | Change % | |||||||||
Machinery1 | $ | 366 | $ | 644 | $ | 278 | 76% | ||||||
Engines1 | 244 | 358 | 114 | 47% | |||||||||
| Financial Products | 113 | 142 | 29 | 26% | |||||||||
| Consolidating Adjustments | (40) | (77) | (37) | ||||||||||
| Consolidated Operating Profit | $ | 683 | $ | 1,067 | $ | 384 | 56% | ||||||
1 Caterpillar operations are highly integrated; therefore, the company uses a number of allocations to determine lines of business operating profit for Machinery and Engines. | |||||||||||||
Operating Profit by Principal Line of Business
| § | Machinery operating profit of $644 million was up $278 million, or 76 percent, from fourth quarter 2004. The favorable impact of improved price realization and higher sales volume was partially offset by higher core operating costs and higher retirement benefits. |
| § | Engines operating profit of $358 million was up $114 million, or 47 percent, from fourth quarter 2004. The favorable impact of improved price realization and higher sales volume was partially offset by higher core operating costs and higher retirement benefits. |
| § | Financial Products operating profit of $142 million was up $29 million, or 26 percent, from fourth quarter 2004. The increase was primarily due to a $26 million impact from the continued growth of Earning Assets at Cat Financial. |
Other Profit/Loss Items
| § | Other income/expense was income of $99 million compared with income of $82 million in fourth quarter 2004. The improvement was due to a reserve adjustment related to the termination of certain capital lease obligations, higher interest income and the absence of a number of expense items incurred during the fourth quarter of 2004 that were individually insignificant. These items were partially offset by the unfavorable impact of currency. |
Page 17
| § | The provision for income taxes in the fourth quarter reflects an estimated annual tax rate of 29.5 percent as compared to a 27 percent rate in 2004. The increase is primarily due to a reduction in our Extraterritorial Income Exclusion (ETI) benefits, partially attributable to the impact of the American Jobs Creation Act (AJCA) permitting only 80 percent of ETI benefits in 2005 and also to a change in our geographic mix of profits. A favorable adjustment of $14 million was recorded this quarter related to the first nine months of 2005 as a result of a decrease in the estimated annual tax rate from 30 to 29.5 percent, primarily due to better than expected ETI benefits. Our estimated annual tax rate excludes the impact of the discrete benefits discussed below. The fourth quarter 2005 provision for income taxes also includes a discrete benefit of $42 million resulting from a $26 million benefit from the settlement of several non-U.S. tax issues and a $16 million decrease in our charge for earnings repatriation under the provisions of the AJCA. |
Supplemental Information
Information previously located in this section is now included in tabular format at http://www.cat.com/investor under the Quarterly Supplemental Information section.
QUESTION AND ANSWER
Q1: | Can you comment on 2005 cash flows? |
| A: | 2005 was a very positive year for operating cash flow. In total, operating cash flow was $3.113 billion for the year. For Machinery and Engines, operating cash flow was $2.810 billion and included about $900 million of pension contributions. The strong cash flow in Machinery and Engines was primarily used for § Capital expenditures—$1.162 billion—primarily to support factory operations and for product programs. § Dividends—$618 million—the quarterly dividend was increased from 20.5 cents to 25 cents per share in the third quarter of 2005. § Share repurchase—$1.684 billion—33.9 million shares were repurchased. |
Q2: | Are recent price increases holding in the marketplace? |
| A: | We continue to monitor the marketplace for the impact of recent price actions. Indications are that these actions are finding their way into the commercial transactions. The degree and speed may vary for different markets, but the trends at this time are indicating improving price levels. We closely monitor price levels for our products by region, and we are determined to maintain our market position. |
Q3: | Are you seeing any evidence yet of improvement in supply chain conditions? |
| A: | Yes, for many components. Our plants are seeing improved supplier delivery performance. However, demand continues to increase, and our factories are working to raise production schedules to meet the strong growth in demand. Tires continue to have tight availability, and on a factory-by-factory basis a number of component categories are in tight supply. |
Page 18
Q4: | Is product availability improving? |
| A: | Machines - Overall, availability has not yet recovered to where it was in the first half of 2004, and increases in demand continue to pose a challenge for many of our production operations. At the end of 2005, there were 69 machine models on managed distribution in North America, a slight increase from the third quarter. Engines - Product availability improved during 2005 for our heavy-duty and midrange engines, but we are experiencing some increase in lead time for our large engine families. Currently, the 3500 and 3600 families of engines are on managed distribution and are expected to remain so through 2006. |
Q5: | Are you at capacity for large mining products? If so, what are you doing about it? |
| A: | Demand for mining products has increased at an unprecedented rate over the past two years, and our factories have responded by dramatically increasing production. Lead times on most large mining products are significantly longer than usual, primarily due to supply chain constraints—in particular a continued tire shortage. The factories continue to respond to the increasing demand and have numerous 6 Sigma teams working to increase production. |
Q6: | Can you please provide more detail on your increases in core operating costs? |
| A: | The following table summarizes the increase in core operating costs in fourth quarter 2005 versus fourth quarter 2004: |
Core Operating Cost Change (millions of dollars) | 4th Quarter 2005 vs. 4th Quarter 2004 | |||||
| Manufacturing Costs | $ | 225 | ||||
| SG&A | 77 | |||||
| R&D | 44 | |||||
| Other Operating Costs | 54 | |||||
| Total | $ | 400 | ||||
Approximately two-thirds of the manufacturing cost increase is due to period manufacturing costs, and the remaining one-third is due to variable costs. The variable cost increases resulted from volume-related inefficiencies due to operating at near capacity levels in many of our facilities. Manufacturing costs also include period manufacturing costs associated with building our products. Period manufacturing costs increased 17 percent, or approximately $150 million. The majority of the increase resulted from costs incurred to support 12 percent higher sales. These include items such as repair and maintenance and factory rearrangement. The increase also includes costs not directly related to changes in volume, such as depreciation and manufacturing process engineering to support new product introduction. For the year, period manufacturing costs increased 13 percent on a sales increase of 20 percent. |
Page 19
Full-year Machinery and Engines SG&A as a percent of sales declined from 9.0 percent to 8.2 percent but was up $77 million in the fourth quarter of 2005 versus 2004, excluding the impact of currency and retirement benefits. Full-year Machinery and Engines R&D as a percent of sales declined from 3.3 percent to 3.2 percent but was up $44 million in the fourth quarter of 2005 versus 2004, excluding the impact of currency and retirement benefits. Full-year Machinery and Engines Other Operating Costs were up $58 million. This was due primarily to about $70 million in charges related to our dealer distribution support software and the global telehandler alliance that was announced in the fourth quarter of 2005. Machinery and Engines operating margins have improved from 8.3 percent in 2004 to 10.3 percent in 2005: |
Machinery and Engines Operating Profit | |||||||||||
2004 | 2005 | ||||||||||
Actual | Actual | ||||||||||
| First quarter | 8.0 | % | 8.7 | % | |||||||
| Second quarter | 9.7 | % | 10.7 | % | |||||||
| Third quarter | 7.9 | % | 10.5 | % | |||||||
| Fourth quarter | 7.6 | % | 11.1 | % | |||||||
Full year | 8.3 | % | 10.3 | % | |||||||
Q7: | Can you comment on expensing stock options and the timing of the expense? |
| A: | Each year we target our stock-based compensation plan to be highly competitive against a comparator group of companies. As a result, we are continually modifying our plan to meet our target versus this group. We estimate the distribution of our 2006 stock-based compensation expense will be as follows: |
Stock-Based Compensation Expense | |||||||||||||||
(Millions of dollars) | |||||||||||||||
1st Qtr | 2nd Qtr | 3rd Qtr | 4th Qtr | 2006 Full Year | |||||||||||
$ | 30 | $ | 50 | $ | 30 | $ | 15 | $ | 125 | ||||||
This distribution is the result of our vesting policy for employees over 55 years old with more than 10 years of service along with the requisite service period associated with each grant. As a result of prior vesting decisions, we will not recognize a full complement of expense related to stock options until 2009. | |
Q8: | Why did the tax rate decline in the fourth quarter? |
| A: | We are required to record our provision for income taxes for interim periods using an estimated annual tax rate. The fourth quarter decline in the tax rate from 30 percent to 29.5 percent (excluding discrete items) resulted primarily from higher ETI benefits than we expected. |
Page 20
Q9: | Can you quantify incentive compensation for 2004 and 2005 and your expectations for 2006? |
| A: | 2005 results included expense of $463 million for short-term incentive compensation to be paid in early 2006. This compares with expense of $466 million in 2004, which was paid in 2005. In addition, expense related to Caterpillar’s Long-term Cash Performance Plan was $42 million compared with $36 million in 2004. |
Incentive Compensation Expense | ||||||||
2004 | 2005 | |||||||
(Millions of dollars) | Actual | Actual | ||||||
| Short-term Incentive Plan | $ | 466 | $ | 463 | ||||
| Long-term Cash Performance Plan | $ | 36 | $ | 42 | ||||
At the midpoint of our 2006 outlook, expense related to incentive compensation is expected to be 10 to 15 percent lower than in 2005. | |
Q10: | Why are core operating costs increasing in 2006? |
| A: | We expect manufacturing costs to be about 50 percent of the increase, with the remainder being primarily SG&A and R&D. Manufacturing costs are expected to be higher due to an increase in material costs of about 1 percent and an increase in manufacturing period costs to support higher volume. We are working to implement the Caterpillar Production System (CPS) in our factories. While we expect CPS to have a positive impact on costs longer-term, we are not forecasting significant improvements in efficiency in 2006. SG&A expense is expected to increase in dollars—a result of labor inflation and developmental programs to support the growth envisioned by Caterpillar’s enterprise strategy. However, we expect SG&A as a percent of sales to be flat with 2005. R&D expense is expected to increase to comply with emissions requirements, introduce new products and support future growth. |
Q11: | The “waterfall” graph related to your profit outlook stops at operating profit. Do you expect any significant changes below operating income? What do you expect for an effective tax rate in 2006? |
| A: | In 2005 and 2004, we recognized approximately $170 million of gains from Machinery and Engines long-term hedges in Other Income / Expense, which are below operating profit on our income statement. The amount was split about evenly between the two periods. These hedges expired at the end of 2005, and we do not expect similar gains in 2006. We also expect our 2006 effective tax rate to be up about one percentage point from the 2005 rate excluding discrete items because of the continued phase-out of ETI. The American Jobs Creation Act provides for the phase-out of ETI with 80 percent of benefits in 2005, 60 percent of benefits in 2006 and complete phase-out in 2007. |
Page 21
Q12: | How much do you expect to spend in 2006 on capital expenditures excluding equipment leased to others? |
| A: | Our 2006 expenditures are expected to be $1.75 billion, an increase of about $550 million, or 45 percent, from 2005. The majority of our 2006 capital spending is for capacity, growth and to support new product introduction programs. |
Q13: | Can you give us an update on your 2007 ACERT® engine program? Do all customers who need test engines have them? |
| A: | There are currently 50 C15s with a total of over 600,000 miles, 34 C13s with over 400,000 miles and five C7s with over 100,000 miles operating as customer evaluation engines in trucks in the field. Most of these trucks include the complete aftertreatment system, including the Cat differentiated regeneration system. All engines are utilizing ultra low sulfur diesel fuel (ULSDF) as provided through special arrangements for Cat engines from a few fuel suppliers. We will add a second generation of customer evaluation engines starting in April of 2006. Orders are being taken and filled for customers who want to evaluate the 2007 engines. |
Q14: | How are plans to leverage ACERT Technology into other off-road applications going? |
| A: | The ACERT launch in the machine business is well underway. Over 40 machine models using 300 to 700 horsepower engines were in production by the end of 2005 with ACERT Technology, which represents over 8,500 ACERT-powered machines shipped to dealers. Approximately 25 models using 100 to 300 horsepower engines will go into production in 2006. We have met production dates for all machine models that require the ACERT Tier 3 engines and are on track to continue to meet schedules through 2006. We have also shipped 4,000 ACERT industrial, petroleum and marine engines to a wide range of customers. ACERT engines for electric power applications will be introduced in 2006. |
GLOSSARY OF TERMS
| 1. | Consolidating Adjustments - Eliminations of transactions between Machinery and Engines and Financial Products. |
| 2. | Core Operating Costs - Machinery and Engines variable manufacturing cost change adjusted for volume and change in period costs. Excludes the impact of currency and retirement benefits for periods comparing 2005 to 2004. For periods comparing 2006 to 2005, excludes the impact of currency and stock based compensation. |
| 3. | Currency - With respect to sales and revenues, currency represents the translation impact on sales resulting from changes in foreign currency exchange rates versus the U.S. dollar. With respect to operating profit, currency represents the net translation impact on sales and operating costs resulting from changes in foreign currency exchange rates versus the U.S. dollar. Currency includes the impacts on sales and operating profit for the Machinery and Engines lines of business only; currency impacts on Financial Products revenues and operating profit are included in the Financial Products portions of the respective analyses. With respect to other income / expense, currency represents the effects of forward and option contracts entered into by the company to reduce the risk of fluctuations in exchange rates and the net effect of changes in foreign currency exchange rates on our foreign currency assets and liabilities for consolidated results. |
Page 22
| 4. | EAME - Geographic region including Europe, Africa, the Middle East and the Commonwealth of Independent States (CIS). |
| 5. | Earning Assets - These assets consist primarily of total finance receivables net of unearned income, plus retained interests in securitized trade receivables, plus equipment on operating leases, less accumulated depreciation at Cat Financial. |
| 6. | Engines - A principal line of business including the design, manufacture, marketing and sales of engines for Caterpillar machinery, electric power generation systems; on-highway vehicles and locomotives; marine, petroleum, construction, industrial, agricultural and other applications; and related parts. Reciprocating engines meet power needs ranging from 5 to over 22,000 horsepower (4 to over 16 200 kilowatts). Turbines range from 1,200 to 20,500 horsepower (900 to 15 000 kilowatts). |
| 7. | Financial Products - A principal line of business consisting primarily of Caterpillar Financial Services Corporation (Cat Financial), Caterpillar Insurance Holdings, Inc. (Cat Insurance), Caterpillar Power Ventures Corporation (Cat Power Ventures) and their respective subsidiaries. Cat Financial provides a wide range of financing alternatives to customers and dealers for Caterpillar machinery and engines, Solar gas turbines, as well as other equipment and marine vessels. Cat Financial also extends loans to customers and dealers. Cat Insurance provides various forms of insurance to customers and dealers to help support the purchase and lease of our equipment. Cat Power Ventures is an active investor in independent power projects using Caterpillar power generation equipment and services. |
| 8. | Latin America - Geographic region including the Central and South American countries and Mexico. |
| 9. | Machinery - A principal line of business which includes the design, manufacture, marketing and sales of construction, mining and forestry machinery-track and wheel tractors, track and wheel loaders, pipelayers, motor graders, wheel tractor-scrapers, track and wheel excavators, backhoe loaders, log skidders, log loaders, off-highway trucks, articulated trucks, paving products, telehandlers, skid steer loaders and related parts. Also includes logistics services for other companies. |
| 10. | Machinery and Engines - Due to the highly integrated nature of operations, represents the aggregate total of the Machinery and Engines lines of business and includes primarily our manufacturing, marketing and parts distribution operations. |
| 11. | Managed Distribution - The process to provide a fair and equitable allocation of available machine and engine production positions to worldwide dealers on models where demand exceeds factory supply. |
| 12. | Manufacturing Costs - Manufacturing costs represent the volume-adjusted change for variable costs and the absolute dollar change for period manufacturing costs. Variable manufacturing costs are defined as having a direct relationship with the volume of production. This includes material costs, direct labor and other costs that vary directly with production volume such as freight, power to operate machines, and supplies that are consumed in the manufacturing process. Period manufacturing costs support production but are defined as generally not having a direct relationship to short-term changes in volume. Examples include machine and equipment repair, depreciation on manufacturing assets, facility support, procurement, factory scheduling, manufacturing planning and operations management. For 2005, manufacturing costs exclude the impact of currency and retirement benefits for periods comparing 2005 to 2004. For periods comparing 2006 to 2005, excludes the impact of currency and stock based compensation. |
Page 23
| 13. | Period Costs - Comprised of Machinery and Engines period manufacturing costs, SG&A expense, R&D expense and other operating costs. Excludes the impact of currency and retirement benefits for periods comparing 2005 to 2004. For periods comparing 2006 to 2005, excludes the impact of currency and stock based compensation. |
| 14. | Price Realization - The impact of net price changes excluding currency. Includes the impact of changes in the relative weighting of sales between geographic regions. |
| 15. | Retirement Benefits - Cost of defined benefit pension plans, defined contribution plans and retirement healthcare and life insurance. |
| 16. | Sales Volume - With respect to sales and revenues, sales volume represents the impact of changes in the quantities sold for machines, engines and parts. With respect to operating profit, sales volume represents the impact of changes in the quantities sold for machines, engines and parts combined with the net operating profit impact of changes in the relative weighting of machines, engines and parts sales with respect to total sales. |
| 17. | Stock-Based Compensation - As required by Statement of Financial Accounting Standard 123R, we will begin expensing stock-based compensation awards in 2006. Compensation cost is based on the fair value of the award on the date of grant. |
| 18. | 6 Sigma - On a technical level, 6 Sigma represents a measure of variation that achieves 3.4 defects per million opportunities. At Caterpillar, 6 Sigma represents a much broader cultural philosophy to drive continuous improvement throughout the value chain. It is a fact-based, data-driven methodology that we are using to improve processes, enhance quality, cut costs, grow our business and deliver greater value to our customers through Black Belt-led project teams. At Caterpillar, 6 Sigma goes beyond mere process improvement—it has become the way we work as teams to process business information, solve problems and manage our business successfully. |
| 19. | 2010 Goals - The Company’s 2010 goals are a part of its enterprise strategy to achieve its “Vision 2020,” which was made public on October 31, 2005. The 2010 goals are grouped under the “3Ps” of people, performance, and profitable growth. The people goals include a highly engaged workforce and world-class safety. The performance goals are related to quality and market leadership and product and service parts availability. Profitable growth goals include the 2010 sales and revenues target and a goal for earnings per share growth. More information on Vision 2020 and the 2010 goals can be found in the Company’s 8-K filing with the SEC from October 31, 2005. A copy is available on the Caterpillar’s website under the SEC Filings section at http://www.cat.com/investor. |
Page 24
NON-GAAP FINANCIAL MEASURES
The following definition is provided for “non-GAAP financial measures” in connection with Regulation G issued by the Securities and Exchange Commission. This non-GAAP financial measure has no standardized meaning prescribed by U.S. GAAP, and therefore is unlikely to be comparable to the calculation of similar measures for other companies. Management does not intend this item to be considered in isolation or as a substitute for the related GAAP measure.
Machinery and Engines
Caterpillar defines Machinery and Engines as it is presented in the supplemental data as Caterpillar Inc. and its subsidiaries with Financial Products accounted for on the equity basis. Machinery and Engines information relates to the design, manufacture and marketing of our products. Financial Products information relates to the financing to customers and dealers for the purchase and lease of Caterpillar and other equipment. The nature of these businesses is different, especially with regard to the financial position and cash flow items. Caterpillar management utilizes this presentation internally to highlight these differences. We also believe this presentation will assist readers in understanding our business. Pages 29-34 reconcile Machinery and Engines with Financial Products on the equity basis to Caterpillar Inc. Consolidated financial information.
* * *
The information included in the Outlook section is forward-looking and involves risks and uncertainties that could significantly affect expected results. A discussion of these risks and uncertainties is contained in Form 8-K filed with the Securities & Exchange Commission (SEC) on January 26, 2006. This filing is available on our website at http://www.cat.com/sec_filings.
Caterpillar's latest financial results and current outlook are also available via:
Telephone:
(800) 228-7717 (Inside the United States and Canada)
(858) 244-2080 (Outside the United States and Canada)
Internet:
http://www.cat.com/investor
http://www.cat.com/irwebcast (live broadcast/replays of quarterly conference call)
Caterpillar contact:
Rusty Dunn
Corporate Public Affairs
(309) 675-4803
Dunn_Rusty L@cat.com
Page 25
Caterpillar Inc. Condensed Consolidated Statement of Results of Operations (Unaudited) (Dollars in millions except per share data) | ||||||||||||||||
Three Months Ended | Twelve Months Ended | |||||||||||||||
December 31, | December 31, | |||||||||||||||
2005 | 2004 | 2005 | 2004 | |||||||||||||
Sales and revenues: | ||||||||||||||||
Sales of Machinery and Engines | $ | 9,041 | $ | 8,059 | $ | 34,006 | $ | 28,336 | ||||||||
| Revenues of Financial Products | 622 | 525 | 2,333 | 1,970 | ||||||||||||
Total sales and revenues | 9,663 | 8,584 | 36,339 | 30,306 | ||||||||||||
Operating costs: | ||||||||||||||||
Cost of goods sold | 6,906 | 6,488 | 26,558 | 22,497 | ||||||||||||
Selling, general and administrative expenses | 882 | 808 | 3,190 | 2,926 | ||||||||||||
Research and development expenses | 290 | 243 | 1,084 | 928 | ||||||||||||
Interest expense of Financial Products | 217 | 154 | 768 | 524 | ||||||||||||
Other operating expenses | 301 | 208 | 955 | 747 | ||||||||||||
Total operating costs | 8,596 | 7,901 | 32,555 | 27,622 | ||||||||||||
Operating profit | 1,067 | 683 | 3,784 | 2,684 | ||||||||||||
Interest expense excluding Financial Products | 62 | 54 | 260 | 230 | ||||||||||||
Other income (expense) | 99 | 82 | 377 | 253 | ||||||||||||
Consolidated profit before taxes | 1,104 | 711 | 3,901 | 2,707 | ||||||||||||
Provision for income taxes | 270 | 182 | 1,120 | 731 | ||||||||||||
Profit of consolidated companies | 834 | 529 | 2,781 | 1,976 | ||||||||||||
Equity in profit (loss) of unconsolidated affiliated companies | 12 | 22 | 73 | 59 | ||||||||||||
Profit | $ | 846 | $ | 551 | $ | 2,854 | $ | 2,035 | ||||||||
Profit per common share | $ | 1.26 | $ | .81 | $ | 4.21 | $ | 2.97 | ||||||||
Profit per common share - diluted 1 | $ | 1.20 | $ | .77 | $ | 4.04 | $ | 2.88 | ||||||||
Weighted average common shares outstanding (millions) | ||||||||||||||||
- Basic | 673.6 | 684.0 | 678.4 | 684.5 | ||||||||||||
- Diluted 1 | 705.4 | 712.2 | 705.8 | 707.4 | ||||||||||||
Cash dividends declared per common share | $ | .50 | $ | .41 | $ | .96 | $ | .80 | ||||||||
1 Diluted by assumed exercise of stock options, using the treasury stock method. | ||||||||||||||||
Certain amounts for prior periods have been reclassified to conform to current financial statement presentation. | ||||||||||||||||
Page 26
Caterpillar Inc. | |||||||||||
Condensed Consolidated Statement of Financial Position | |||||||||||
(Unaudited) | |||||||||||
(Millions of dollars) | |||||||||||
Dec. 31, | Dec. 31, | ||||||||||
2005 | 2004 | ||||||||||
Assets | |||||||||||
Current assets: | |||||||||||
| Cash and short-term investments | $ | 1,108 | $ | 445 | |||||||
| Receivables - trade and other | 7,526 | 7,463 | |||||||||
| Receivables - finance | 6,442 | 5,182 | |||||||||
| Deferred and refundable income taxes | 344 | 398 | |||||||||
| Prepaid expenses | 2,146 | 1,369 | |||||||||
| Inventories | 5,224 | 4,675 | |||||||||
| Total current assets | 22,790 | 19,532 | |||||||||
| Property, plant and equipment - net | 7,988 | 7,682 | |||||||||
| Long-term receivables - trade and other | 1,037 | 764 | |||||||||
| Long-term receivables - finance | 10,301 | 9,903 | |||||||||
| Investments in unconsolidated affiliated companies | 565 | 517 | |||||||||
| Deferred income taxes | 768 | 674 | |||||||||
| Intangible assets | 424 | 315 | |||||||||
| Goodwill | 1,451 | 1,450 | |||||||||
| Other assets | 1,745 | 2,258 | |||||||||
Total assets | $ | 47,069 | $ | 43,095 | |||||||
Liabilities | |||||||||||
| Current liabilities: | |||||||||||
| Short-term borrowings: | |||||||||||
| -- Machinery and Engines | $ | 871 | $ | 93 | |||||||
| -- Financial Products | 4,665 | 4,064 | |||||||||
| Accounts payable | 3,471 | 3,580 | |||||||||
| Accrued expenses | 2,617 | 2,261 | |||||||||
| Accrued wages, salaries and employee benefits | 1,845 | 1,730 | |||||||||
| Customer advances | 395 | 447 | |||||||||
| Dividends payable | 168 | 141 | |||||||||
Deferred and current income taxes payable | 528 | 259 | |||||||||
| Long-term debt due within one year: | |||||||||||
| -- Machinery and Engines | 340 | 6 | |||||||||
| -- Financial Products | 4,000 | 3,525 | |||||||||
| Total current liabilities | 18,900 | 16,106 | |||||||||
| Long-term debt due after one year: | |||||||||||
| -- Machinery and Engines | 2,717 | 3,663 | |||||||||
| -- Financial Products | 13,152 | 12,174 | |||||||||
| Liability for postemployment benefits | 2,991 | 2,986 | |||||||||
| Deferred income taxes and other liabilities | 877 | 699 | |||||||||
Total liabilities | 38,637 | 35,628 | |||||||||
Stockholders' equity | |||||||||||
| Common stock | 1,859 | 1,231 | |||||||||
| Treasury stock | (4,637 | ) | (3,277 | ) | |||||||
| Profit employed in the business | 11,808 | 9,937 | |||||||||
| Accumulated other comprehensive income | (598 | ) | (424 | ) | |||||||
Total stockholders' equity | 8,432 | 7,467 | |||||||||
Total liabilities and stockholders' equity | $ | 47,069 | $ | 43,095 | |||||||
Certain amounts for prior periods have been reclassified to conform to current financial statement presentation. | |||||||||||
Page 27
Caterpillar Inc. | |||||||||
Condensed Consolidated Statement of Cash Flow | |||||||||
(Unaudited) | |||||||||
(Millions of dollars) | |||||||||
Twelve Months Ended December 31, | |||||||||
2005 | 2004 | ||||||||
Cash flow from operating activities: | |||||||||
Profit | $ | 2,854 | $ | 2,035 | |||||
| Adjustments for non-cash items: | |||||||||
Depreciation and amortization | 1,477 | 1,397 | |||||||
Other | (20 | ) | (113 | ) | |||||
| Changes in assets and liabilities: | |||||||||
Receivables - trade and other | (908 | ) | (7,616 | ) | |||||
Inventories | (568 | ) | (1,391 | ) | |||||
Accounts payable and accrued expenses | 532 | 1,457 | |||||||
Other assets - net | (866 | ) | 337 | ||||||
Other liabilities - net | 612 | (97 | ) | ||||||
Net cash provided by (used for) operating activities | 3,113 | (3,991 | ) | ||||||
Cash flow from investing activities: | |||||||||
Capital expenditures - excluding equipment leased to others | (1,201 | ) | (926 | ) | |||||
Expenditures for equipment leased to others | (1,214 | ) | (1,188 | ) | |||||
Proceeds from disposals of property, plant and equipment | 637 | 486 | |||||||
Additions to finance receivables | (10,334 | ) | (8,930 | ) | |||||
Collections of finance receivables | 7,057 | 6,216 | |||||||
Proceeds from the sale of finance receivables | 900 | 700 | |||||||
Collections of retained interests in securitized trade receivables | - | 5,722 | |||||||
Investments and acquisitions (net of cash acquired) | (13 | ) | (290 | ) | |||||
Proceeds from sale of partnership investment | - | 290 | |||||||
Proceeds from release of security deposit | 530 | - | |||||||
Proceeds from sale of available-for-sale securities | 646 | 408 | |||||||
Investments in available-for-sale securities | (727 | ) | (609 | ) | |||||
Other - net | 194 | 198 | |||||||
Net cash provided by (used for) investing activities | (3,525 | ) | 2,077 | ||||||
Cash flow from financing activities: | |||||||||
Dividends paid | (618 | ) | (534 | ) | |||||
Common stock issued, including treasury shares reissued | 482 | 317 | |||||||
Treasury shares purchased | (1,684 | ) | (539 | ) | |||||
Proceeds from long-term debt issued | 6,043 | 5,088 | |||||||
Payments on long-term debt | (4,095 | ) | (3,008 | ) | |||||
Short-term borrowings - net | 1,025 | 550 | |||||||
Net cash provided by financing activities | 1,153 | 1,874 | |||||||
Effect of exchange rate changes on cash | (78 | ) | 143 | ||||||
Increase in cash and short-term investments | 663 | 103 | |||||||
Cash and short-term investments at beginning of period | 445 | 342 | |||||||
Cash and short-term investments at end of period | $ | 1,108 | $ | 445 | |||||
All short-term investments, which consist primarily of highly liquid investments with original maturities of three months or less, are considered to be cash equivalents. | |||||||||
Certain amounts for prior periods have been reclassified to conform to current financial statement presentation. | |||||||||
Page 28
Caterpillar Inc. Supplemental Data for Results of Operations For The Three Months Ended December 31, 2005 (Unaudited) (Millions of dollars) | ||||||||||||||||
Supplemental Consolidating Data | ||||||||||||||||
Consolidated | Machinery and Engines 1 | Financial Products | Consolidating Adjustments | |||||||||||||
Sales and revenues: | ||||||||||||||||
Sales of Machinery and Engines | $ | 9,041 | $ | 9,041 | $ | - | $ | - | ||||||||
Revenues of Financial Products | 622 | - | 715 | (93 | )2 | |||||||||||
Total sales and revenues | 9,663 | 9,041 | 715 | (93 | ) | |||||||||||
Operating costs: | ||||||||||||||||
Cost of goods sold | 6,906 | 6,906 | - | - | ||||||||||||
Selling, general and administrative expenses | 882 | 773 | 118 | (9 | )3 | |||||||||||
Research and development expenses | 290 | 290 | - | - | ||||||||||||
Interest expense of Financial Products | 217 | - | 221 | (4 | )4 | |||||||||||
Other operating expenses | 301 | 70 | 234 | (3 | )3 | |||||||||||
Total operating costs | 8,596 | 8,039 | 573 | (16 | ) | |||||||||||
Operating profit | 1,067 | 1,002 | 142 | (77 | ) | |||||||||||
Interest expense excluding Financial Products | 62 | 64 | - | (2 | )4 | |||||||||||
Other income (expense) | 99 | 9 | 15 | 75 | 5 | |||||||||||
Consolidated profit before taxes | 1,104 | 947 | 157 | - | ||||||||||||
Provision for income taxes | 270 | 222 | 48 | - | ||||||||||||
Profit of consolidated companies | 834 | 725 | 109 | - | ||||||||||||
Equity in profit (loss) of unconsolidated affiliated companies | 12 | 10 | 2 | - | ||||||||||||
Equity in profit of Financial Products' subsidiaries | - | 111 | - | (111 | )6 | |||||||||||
Profit | $ | 846 | $ | 846 | $ | 111 | $ | (111 | ) | |||||||
1 Represents Caterpillar Inc. and its subsidiaries with Financial Products accounted for on the equity basis. | ||||||||||||||||
2 Elimination of Financial Products revenues earned from Machinery and Engines. | ||||||||||||||||
3 Elimination of net expenses recorded by Machinery and Engines paid to Financial Products. | ||||||||||||||||
4 Elimination of interest expense recorded between Financial Products and Machinery and Engines. | ||||||||||||||||
5 Elimination of discount recorded by Machinery and Engines on receivables sold to Financial Products and of interest earned between Machinery and Engines and Financial Products. | ||||||||||||||||
6 Elimination of Financial Products profit due to equity method of accounting. | ||||||||||||||||
Page 29
Caterpillar Inc. Supplemental Data for Results of Operations For The Three Months Ended December 31, 2004 (Unaudited) (Millions of dollars) | ||||||||||||||||
Supplemental Consolidating Data | ||||||||||||||||
Consolidated | Machinery and Engines 1 | Financial Products | Consolidating Adjustments | |||||||||||||
Sales and revenues: | ||||||||||||||||
Sales of Machinery and Engines | $ | 8,059 | $ | 8,059 | $ | - | $ | - | ||||||||
Revenues of Financial Products | 525 | - | 582 | (57 | ) 2 | |||||||||||
Total sales and revenues | 8,584 | 8,059 | 582 | (57 | ) | |||||||||||
Operating costs: | ||||||||||||||||
Cost of goods sold | 6,488 | 6,488 | - | - | ||||||||||||
Selling, general and administrative expenses | 808 | 702 | 126 | (20 | )3 | |||||||||||
Research and development expenses | 243 | 243 | - | - | ||||||||||||
Interest expense of Financial Products | 154 | - | 158 | (4 | )4 | |||||||||||
Other operating expenses | 208 | 16 | 185 | 7 | 3 | |||||||||||
Total operating costs | 7,901 | 7,449 | 469 | (17 | ) | |||||||||||
Operating profit | 683 | 610 | 113 | (40 | ) | |||||||||||
Interest expense excluding Financial Products | 54 | 55 | - | (1 | )4 | |||||||||||
Other income (expense) | 82 | 28 | 15 | 39 | 5 | |||||||||||
Consolidated profit before taxes | 711 | 583 | 128 | - | ||||||||||||
Provision for income taxes | 182 | 138 | 44 | - | ||||||||||||
Profit of consolidated companies | 529 | 445 | 84 | - | ||||||||||||
Equity in profit (loss) of unconsolidated affiliated companies | 22 | 21 | 1 | - | ||||||||||||
Equity in profit of Financial Products' subsidiaries | - | 85 | - | (85 | )6 | |||||||||||
Profit | $ | 551 | $ | 551 | $ | 85 | $ | (85 | ) | |||||||
1 Represents Caterpillar Inc. and its subsidiaries with Financial Products accounted for on the equity basis. | ||||||||||||||||
2 Elimination of Financial Products revenues earned from Machinery and Engines. | ||||||||||||||||
3 Elimination of net expenses recorded by Machinery and Engines paid to Financial Products. | ||||||||||||||||
4 Elimination of interest expense recorded between Financial Products and Machinery and Engines. | ||||||||||||||||
5 Elimination of discount recorded by Machinery and Engines on receivables sold to Financial Products and of interest earned between Machinery and Engines and Financial Products. | ||||||||||||||||
6 Elimination of Financial Products profit due to equity method of accounting. | ||||||||||||||||
| Certain amounts have been reclassified to conform to the 2005 financial statement presentation. | ||||||||||||||||
Page 30
Caterpillar Inc. Supplemental Data for Results of Operations For The Twelve Months Ended December 31, 2005 (Unaudited) (Millions of dollars) | ||||||||||||||||
Supplemental Consolidating Data | ||||||||||||||||
Consolidated | Machinery and Engines 1 | Financial Products | Consolidating Adjustments | |||||||||||||
Sales and revenues: | ||||||||||||||||
Sales of Machinery and Engines | $ | 34,006 | $ | 34,006 | $ | - | $ | - | ||||||||
Revenues of Financial Products | 2,333 | - | 2,650 | (317 | )2 | |||||||||||
Total sales and revenues | 36,339 | 34,006 | 2,650 | (317 | ) | |||||||||||
Operating costs: | ||||||||||||||||
Cost of goods sold | 26,558 | 26,558 | - | - | ||||||||||||
Selling, general and administrative expenses | 3,190 | 2,786 | 446 | (42 | )3 | |||||||||||
Research and development expenses | 1,084 | 1,084 | - | - | ||||||||||||
Interest expense of Financial Products | 768 | - | 786 | (18 | )4 | |||||||||||
Other operating expenses | 955 | 76 | 887 | (8 | )3 | |||||||||||
Total operating costs | 32,555 | 30,504 | 2,119 | (68 | ) | |||||||||||
Operating profit | 3,784 | 3,502 | 531 | (249 | ) | |||||||||||
Interest expense excluding Financial Products | 260 | 266 | - | (6 | )4 | |||||||||||
Other income (expense) | 377 | 85 | 49 | 243 | 5 | |||||||||||
Consolidated profit before taxes | 3,901 | 3,321 | 580 | - | ||||||||||||
Provision for income taxes | 1,120 | 926 | 194 | - | ||||||||||||
Profit of consolidated companies | 2,781 | 2,395 | 386 | - | ||||||||||||
Equity in profit (loss) of unconsolidated affiliated companies | 73 | 64 | 9 | - | ||||||||||||
Equity in profit of Financial Products' subsidiaries | - | 395 | - | (395 | )6 | |||||||||||
Profit | $ | 2,854 | $ | 2,854 | $ | 395 | $ | (395 | ) | |||||||
1 Represents Caterpillar Inc. and its subsidiaries with Financial Products accounted for on the equity basis. | ||||||||||||||||
2 Elimination of Financial Products revenues earned from Machinery and Engines. | ||||||||||||||||
3 Elimination of net expenses recorded by Machinery and Engines paid to Financial Products. | ||||||||||||||||
4 Elimination of interest expense recorded between Financial Products and Machinery and Engines. | ||||||||||||||||
5 Elimination of discount recorded by Machinery and Engines on receivables sold to Financial Products and of interest earned between Machinery and Engines and Financial Products. | ||||||||||||||||
6 Elimination of Financial Products profit due to equity method of accounting. | ||||||||||||||||
Page 31
Caterpillar Inc. Supplemental Data for Results of Operations For The Twelve Months Ended December 31, 2004 (Unaudited) (Millions of dollars) | ||||||||||||||||
Supplemental Consolidating Data | ||||||||||||||||
Consolidated | Machinery and Engines 1 | Financial Products | Consolidating Adjustments | |||||||||||||
Sales and revenues: | ||||||||||||||||
Sales of Machinery and Engines | $ | 28,336 | $ | 28,336 | $ | - | $ | - | ||||||||
Revenues of Financial Products | 1,970 | - | 2,169 | (199 | )2 | |||||||||||
Total sales and revenues | 30,306 | 28,336 | 2,169 | (199 | ) | |||||||||||
Operating costs: | ||||||||||||||||
Cost of goods sold | 22,497 | 22,497 | - | - | ||||||||||||
Selling, general and administrative expenses | 2,926 | 2,548 | 441 | (63 | )3 | |||||||||||
Research and development expenses | 928 | 928 | - | - | ||||||||||||
Interest expense of Financial Products | 524 | - | 536 | (12 | )4 | |||||||||||
Other operating expenses | 747 | 18 | 722 | 7 | 3 | |||||||||||
Total operating costs | 27,622 | 25,991 | 1,699 | (68 | ) | |||||||||||
Operating profit | 2,684 | 2,345 | 470 | (131 | ) | |||||||||||
Interest expense excluding Financial Products | 230 | 235 | - | (5 | )4 | |||||||||||
Other income (expense) | 253 | 92 | 35 | 126 | 5 | |||||||||||
Consolidated profit before taxes | 2,707 | 2,202 | 505 | - | ||||||||||||
Provision for income taxes | 731 | 566 | 165 | - | ||||||||||||
Profit of consolidated companies | 1,976 | 1,636 | 340 | - | ||||||||||||
Equity in profit (loss) of unconsolidated affiliated companies | 59 | 56 | 3 | - | ||||||||||||
Equity in profit of Financial Products' subsidiaries | - | 343 | - | (343 | )6 | |||||||||||
Profit | $ | 2,035 | $ | 2,035 | $ | 343 | $ | (343 | ) | |||||||
1 Represents Caterpillar Inc. and its subsidiaries with Financial Products accounted for on the equity basis. | ||||||||||||||||
2 Elimination of Financial Products revenues earned from Machinery and Engines. | ||||||||||||||||
3 Elimination of net expenses recorded by Machinery and Engines paid to Financial Products. | ||||||||||||||||
4 Elimination of interest expense recorded between Financial Products and Machinery and Engines. | ||||||||||||||||
5 Elimination of discount recorded by Machinery and Engines on receivables sold to Financial Products and of interest earned between Machinery and Engines and Financial Products. | ||||||||||||||||
6 Elimination of Financial Products profit due to equity method of accounting. | ||||||||||||||||
| Certain amounts have been reclassified to conform to the 2005 financial statement presentation. | ||||||||||||||||
Page 32
Caterpillar Inc. Supplemental Data for Cash Flow For The Twelve Months Ended December 31, 2005 | |||||||||||||||||
(Unaudited) (Millions of dollars) | |||||||||||||||||
Supplemental Consolidating Data | |||||||||||||||||
Consolidated | Machinery and Engines1 | Financial Products | Consolidating Adjustments | ||||||||||||||
Cash flow from operating activities: | |||||||||||||||||
Profit | $ | 2,854 | $ | 2,854 | $ | 395 | $ | (395 | )2 | ||||||||
| Adjustments for non-cash items: | |||||||||||||||||
Depreciation and amortization | 1,477 | 835 | 642 | - | |||||||||||||
Undistributed profit of Financial Products | - | (373 | ) | - | 373 | 3 | |||||||||||
Other | (20 | ) | 7 | (205 | ) | 178 | 4 | ||||||||||
| Changes in assets and liabilities: | |||||||||||||||||
Receivables - trade and other | (908 | ) | (39 | ) | 7 | (876 | )4/5 | ||||||||||
Inventories | (568 | ) | (568 | ) | - | - | |||||||||||
Accounts payable and accrued expenses | 532 | 353 | 238 | (59 | )4 | ||||||||||||
Other assets - net | (866 | ) | (854 | ) | (34 | ) | 22 | 4 | |||||||||
Other liabilities - net | 612 | 595 | 34 | (17 | )4 | ||||||||||||
Net cash provided by (used for) operating activities | 3,113 | 2,810 | 1,077 | (774 | ) | ||||||||||||
Cash flow from investing activities: | |||||||||||||||||
Capital expenditures - excluding equipment leased to others | (1,201 | ) | (1,162 | ) | (39 | ) | - | ||||||||||
Expenditures for equipment leased to others | (1,214 | ) | - | (1,265 | ) | 51 | 4 | ||||||||||
Proceeds from disposals of property, plant and equipment | 637 | 45 | 592 | - | |||||||||||||
Additions to finance receivables | (10,334 | ) | - | (33,961 | ) | 23,627 | 5 | ||||||||||
Collections of finance receivables | 7,057 | - | 29,449 | (22,392 | )5 | ||||||||||||
Proceeds from the sale of finance receivables | 900 | - | 1,430 | (530 | )5 | ||||||||||||
Net intercompany borrowings | - | 111 | - | (111 | )6 | ||||||||||||
Investments and acquisitions (net of cash acquired) | (13 | ) | (13 | ) | - | - | |||||||||||
Proceeds from release of security deposit | 530 | 530 | - | - | |||||||||||||
Proceeds from sale of available-for-sale securities | 646 | 29 | 617 | - | |||||||||||||
Investments in available-for-sale securities | (727 | ) | (34 | ) | (693 | ) | - | ||||||||||
Other - net | 194 | 10 | 197 | (13 | )7 | ||||||||||||
Net cash provided by (used for) investing activities | (3,525 | ) | (484 | ) | (3,673 | ) | 632 | ||||||||||
Cash flow from financing activities: | |||||||||||||||||
Dividends paid | (618 | ) | (618 | ) | (22 | ) | 22 | 8 | |||||||||
| Common stock issued, including treasury shares reissued | 482 | 482 | (14 | ) | 14 | 7 | |||||||||||
Treasury shares purchased | (1,684 | ) | (1,684 | ) | - | - | |||||||||||
Net intercompany borrowings | - | - | (111 | ) | 111 | 6 | |||||||||||
Proceeds from long-term debt issued | 6,043 | 130 | 5,913 | - | |||||||||||||
Payments on long-term debt | (4,095 | ) | (631 | ) | (3,464 | ) | - | ||||||||||
Short-term borrowings - net | 1,025 | 738 | 287 | - | |||||||||||||
Net cash provided by (used for) financing activities | 1,153 | (1,583 | ) | 2,589 | 147 | ||||||||||||
Effect of exchange rate changes on cash | (78 | ) | (62 | ) | (11 | ) | (5 | )9 | |||||||||
Increase (decrease) in cash and short-term investments | 663 | 681 | (18 | ) | - | ||||||||||||
Cash and short-term investments at beginning of period | 445 | 270 | 175 | - | |||||||||||||
Cash and short-term investments at end of period | $ | 1,108 | $ | 951 | $ | 157 | $ | - | |||||||||
1 Represents Caterpillar Inc. and its subsidiaries with Financial Products accounted for on the equity basis. | |||||||||||||||||
2 Elimination of Financial Products profit after tax due to equity method of accounting. | |||||||||||||||||
3 Non-cash adjustment for the undistributed earnings from Financial Products. | |||||||||||||||||
4 Elimination of non-cash adjustments and changes in assets and liabilities related to consolidated reporting. | |||||||||||||||||
5 Reclassification of Cat Financial’s cash flow activity from investing to operating for receivables that arose from the sale of inventory. | |||||||||||||||||
6 Net proceeds and payments to/from Machinery and Engines and Financial Products. | |||||||||||||||||
7 Change in investment and common stock related to Financial Products. | |||||||||||||||||
8 Elimination of dividend from Financial Products to Machinery and Engines. | |||||||||||||||||
9 Elimination of the effect of exchange on intercompany balances. | |||||||||||||||||
Page 33
Caterpillar Inc. Supplemental Data for Cash Flow For The Twelve Months Ended December 31, 2004 | ||||||||||||||||||
(Unaudited) (Millions of dollars) | ||||||||||||||||||
Supplemental Consolidating Data | ||||||||||||||||||
Consolidated | Machinery and Engines1 | Financial Products | Consolidating Adjustments | |||||||||||||||
Cash flow from operating activities: | ||||||||||||||||||
Profit | $ | 2,035 | $ | 2,035 | $ | 343 | $ | (343 | )2 | |||||||||
| Adjustments for non-cash items: | ||||||||||||||||||
Depreciation and amortization | 1,397 | 795 | 602 | - | ||||||||||||||
Undistributed profit of Financial Products | - | (328 | ) | - | 328 | 3 | ||||||||||||
Other | (113 | ) | (111 | ) | (145 | ) | 143 | 4 | ||||||||||
| Changes in assets and liabilities: | ||||||||||||||||||
Receivables - trade and other | (7,616 | ) | (531 | ) | 43 | (7,128 | )4/5 | |||||||||||
Inventories | (1,391 | ) | (1,391 | ) | - | - | ||||||||||||
Accounts payable and accrued expenses | 1,457 | 1,325 | 11 | 121 | 4 | |||||||||||||
Other assets - net | 337 | 240 | 7 | 90 | 4 | |||||||||||||
Other liabilities - net | (97 | ) | (116 | ) | 101 | (82 | )4 | |||||||||||
Net cash provided by (used for) operating activities | (3,991 | ) | 1,918 | 962 | (6,871 | ) | ||||||||||||
Cash flow from investing activities: | ||||||||||||||||||
Capital expenditures - excluding equipment leased to others | (926 | ) | (841 | ) | (85 | ) | - | |||||||||||
Expenditures for equipment leased to others | (1,188 | ) | (2 | ) | (1,186 | ) | - | |||||||||||
Proceeds from disposals of property, plant and equipment | 486 | 27 | 459 | - | ||||||||||||||
Additions to finance receivables | (8,930 | ) | - | (20,515 | ) | 11,585 | 5 | |||||||||||
Collections of finance receivables | 6,216 | - | 16,963 | (10,747 | )5 | |||||||||||||
Proceeds from the sale of finance receivables | 700 | - | 1,363 | (663 | )5 | |||||||||||||
Additions to retained interests in securitized trade receivables | - | - | (6,686 | ) | 6,686 | 10 | ||||||||||||
Collections of retained interests in securitized trade receivables | 5,722 | - | 5,722 | - | ||||||||||||||
Net intercompany borrowings | - | 159 | 209 | (368 | )6 | |||||||||||||
Investments and acquisitions (net of cash acquired) | (290 | ) | (295 | ) | - | 5 | 4 | |||||||||||
Proceeds from sale of partnership investments | 290 | - | 290 | - | ||||||||||||||
Proceeds from sale of available-for-sale securities | 408 | 13 | 395 | - | ||||||||||||||
Investments in available-for-sale securities | (609 | ) | (107 | ) | (502 | ) | - | |||||||||||
Other - net | 198 | 12 | 192 | (6 | ) 7 | |||||||||||||
Net cash provided by (used for) investing activities | 2,077 | (1,034 | ) | (3,381 | ) | 6,492 | ||||||||||||
Cash flow from financing activities: | ||||||||||||||||||
| Dividends paid | (534 | ) | (534 | ) | (15 | ) | 15 | 8 | ||||||||||
| Common stock issued, including treasury shares reissued | 317 | 317 | (2 | ) | 2 | 7 | ||||||||||||
Treasury shares purchased | (539 | ) | (539 | ) | - | - | ||||||||||||
Net intercompany borrowings | - | (209 | ) | (159 | ) | 368 | 6 | |||||||||||
Proceeds from long-term debt issued | 5,088 | 9 | 5,079 | - | ||||||||||||||
Payments on long-term debt | (3,008 | ) | (35 | ) | (2,973 | ) | - | |||||||||||
Short-term borrowings - net | 550 | 21 | 529 | - | ||||||||||||||
Net cash provided by (used for) financing activities | 1,874 | (970 | ) | 2,459 | 385 | |||||||||||||
Effect of exchange rate changes on cash | 143 | 136 | 13 | (6 | ) 9 | |||||||||||||
Increase in cash and short-term investments | 103 | 50 | 53 | - | ||||||||||||||
Cash and short-term investments at beginning of period | 342 | 220 | 122 | - | ||||||||||||||
Cash and short-term investments at end of period | $ | 445 | $ | 270 | $ | 175 | $ | - | ||||||||||
1 Represents Caterpillar Inc. and its subsidiaries with Financial Products accounted for on the equity basis. | ||||||||||||||||||
2 Elimination of Financial Products profit after tax due to equity method of accounting. | ||||||||||||||||||
3 Non-cash adjustment for the undistributed earnings from Financial Products. | ||||||||||||||||||
4 Elimination of non-cash adjustments and changes in assets and liabilities related to consolidated reporting. Receivables amounts include adjustment for consolidated non-cash receipt of retained interests in securitized trade receivables. | ||||||||||||||||||
5 Reclassification of Cat Financial’s cash flow activity from investing to operating for receivables that arose from the sale of inventory. | ||||||||||||||||||
6 Net proceeds and payments to/from Machinery and Engines and Financial Products. | ||||||||||||||||||
7 Change in investment and common stock related to Financial Products. | ||||||||||||||||||
8 Elimination of dividend from Financial Products to Machinery and Engines. | ||||||||||||||||||
9 Elimination of the effect of exchange on intercompany balances. | ||||||||||||||||||
10 Elimination of Cat Financial’s additions to retained interests in securitized trade receivables that arose from an intercompany purchase of receivables. | ||||||||||||||||||
| Certain amounts have been reclassified to conform to the 2005 financial statement presentation. | ||||||||||||||||||
Page 34
Safe Harbor Statement under the Securities Litigation Reform Act of 1995
Certain statements contained in our fourth-quarter 2005 results release and prepared statements from the related results webcast are forward-looking and involve uncertainties that could significantly impact results. The words "believes," "expects," "estimates," "anticipates," "will be," "should" and similar words or expressions identify forward-looking statements made on behalf of Caterpillar. Uncertainties include factors that affect international businesses, as well as matters specific to the company and the markets it serves.
World Economic Factors
Our projection for about 3.5 percent growth in the world economy in 2006 assumes central banks will cautiously raise interest rates so as not to slow growth too much. Low interest rates, and continued good economic growth, should encourage further growth in construction and mining. Should central banks raise interest rates aggressively, both world economic growth and our Machinery and Engines sales likely would be weaker.
We expect the U. S. Federal Reserve will soon end its policy of raising interest rates and that the Federal Funds rate will end the year below 5 percent. Somewhat higher interest rates should cause a further slowing in economic growth to slightly over 3 percent in 2006. Other financial factors - long-term interest rates, corporate bond spreads - are expected to remain sufficiently favorable to support further growth in business investment. Should financial conditions tighten noticeably, causing economic growth to slow below 3 percent, expected improvements in Machinery and Engines sales likely would be lower than projected.
Our projection of increased sales of Machinery and Engines in Europe, Africa, Middle East (EAME) in 2006 assumes that continued low interest rates will allow slightly faster economic growth in Europe and that favorable commodity prices will extend healthy recoveries in both Africa and Middle East (AME) and the CIS. Key risks are significant interest rate increases in the Eurozone that would slow the European economy or a worldwide collapse in commodity prices. Those developments would likely negatively impact our results.
Somewhat higher local interest rates in Latin America in 2006 and slower economic growth in the United States are expected to contribute to a further slowing in Latin American economic growth to slightly less than 4 percent. That rate of growth should support further increases in construction spending, and high metals prices should benefit investment in mining, both contributing to an increase in Machinery and Engines sales. This forecast is vulnerable to a significant weakening in commodity prices, widespread increases in interest rates or political disruptions.
In Asia/Pacific, we project economic growth will remain slightly below 6.5 percent in 2006, with faster growth in Australia and developing Asia offsetting a slight slowing in China. The projected increase in Machinery and Engines sales assumes that coal and metals prices will contribute to increased mine investment, growing populations and rising home prices will benefit housing construction, and rapid economic growth will prompt businesses to invest more in structures. Some developments that could lower expected results include reduced demand for thermal and coking coal, significant revaluations of regional currencies, restrictions on regional exports and sharp interest rate hikes, particularly in China and Indonesia.
Commodity Prices
Commodities represent a significant sales opportunity, with prices and production as key drivers. Prices have improved sharply over the past three years and our outlook assumes that continued growth in world industrial production, low inventories and some difficulties in increasing production will cause metals prices to remain high enough in 2006 to encourage further mine investment. Any unexpected weakening in world industrial production, however, could cause prices to drop sharply to the detriment of our results.
Coal prices showed softness in some regions late in 2005 but remained well above prices that make mine investment attractive. We expect that the need to rebuild some coal stocks as well as increased electricity generation will support demand for coal in 2006 and prices will remain favorable. Should coal prices soften, due to a slowing in world economic growth or otherwise, the ongoing sales recovery would be vulnerable.
Page 35
Oil and natural gas prices increased sharply over the past three years due to strong demand and high capacity usage. Higher energy prices have not halted economic recoveries since strong demand boosted prices and world production increased. High prices are encouraging more exploration and development. However, should significant supply cuts occur, such as from OPEC production cuts or political unrest in a major producing country, the resulting oil shortages and price spikes could slow economies, potentially with a depressing impact on our sales.
Monetary and Fiscal Policies
For most companies operating in a global economy, monetary and fiscal policies implemented in the United States and abroad could have a significant impact on economic growth, and accordingly, demand for our product. In general, higher than expected interest rates, reductions in government spending, higher taxes, excessive currency movements, and uncertainty over key policies are some factors likely to lead to slower economic growth and lower industry demand.
With economic data looking more favorable, central banks in several developed countries have raised interest rates from the lowest rates in decades, with the U. S. Federal Reserve Bank being the most aggressive. Our outlook assumes that central banks will try to avoid increasing rates so much that economic recoveries stall. Should central banks raise interest rates more aggressively than anticipated, both economic growth and our sales could suffer.
Budget deficits in many countries remain higher than governments would like. Our outlook assumes that governments will not aggressively raise taxes and slash spending to deal with their budget imbalances. Such actions could disrupt growth and negatively affect our sales.
Political Factors
Political factors in the United States and abroad can impact global companies. Our outlook assumes that no major disruptive changes in economic policies occur in either the United States or other major economies. Significant changes in either taxing or spending policies could reduce activities in sectors important to our businesses, thereby reducing sales.
Our outlook assumes that there will be no additional significant military conflicts in either North Korea or the Middle East in the forecast period. Such military conflicts could severely disrupt sales into countries affected, as well as nearby countries.
Our outlook also assumes that there will be no major terrorist attacks. If there is a major terrorist attack, confidence could be undermined, potentially causing a sharp drop in economic activities and our sales. Attacks in major developed economies would be the most disruptive.
Our outlook assumes that efforts by countries to increase their exports will not result in retaliatory countermeasures by other countries to block such exports, particularly in the Asia/Pacific region. Our outlook includes a negative impact from the phase-out of the Extraterritorial Income Exclusion (ETI) as enacted by the American Jobs Creation Act of 2004 (the Act). Our outlook assumes any other tax law changes will not negatively impact our provision for income taxes.
Currency Fluctuations
The company has costs and revenues in many currencies and is therefore exposed to risks arising from currency fluctuations. Our outlook assumes no significant currency crises occur that could disrupt international trade or the competitiveness of our facilities. Should such a crisis develop, economic activity and our results could be negatively impacted.
The company's largest manufacturing presence is in the United States, so any unexpected strengthening of the dollar tends to raise the foreign currency costs to our end users and reduce our global competitiveness.
Dealer/Original Equipment Manufacturers Inventory Practices
The company sells finished products through an independent dealer network or directly to Original Equipment Manufacturers (OEM). Both carry inventories of finished products as part of ongoing operations and adjust those inventories based on their assessments of future needs. Such adjustments can impact our results either positively or negatively. The current outlook assumes no major changes in either dealer or OEM inventory practices. Should dealers or OEMs decide to control inventories more tightly, our sales would be lower.
Page 36
Financial Products Division Factors
Inherent in the operation of Cat Financial is the credit risk associated with its customers. The creditworthiness of each customer, and the rate of delinquencies, repossessions and net losses on customer obligations are directly impacted by several factors, including, but not limited to, relevant industry and economic conditions, the availability of capital, the experience and expertise of the customer's management team, commodity prices, political events, and the sustained value of the underlying collateral. Additionally, interest rate movements create a degree of risk to our operations by affecting the amount of our interest payments and the value of our fixed rate debt. Our "match funding" policy addresses interest rate risk by aligning the interest rate profile (fixed or floating rate) of our debt portfolio with the interest rate profile of our receivables portfolio (loans and leases with customers and dealers) within pre-determined ranges on an ongoing basis. To achieve our match funding objectives, we issue debt with a similar interest rate profile to our receivables and also use interest rate swap agreements to manage our interest rate risk exposure to interest rate changes and in some cases to lower our cost of borrowed funds. If interest rates move upward more sharply than anticipated, our financial results could be negatively impacted. With respect to our insurance and investment management operations, changes in the equity and bond markets could cause an impairment of the value of our investment portfolio, thus requiring a negative adjustment to earnings.
Other Factors
The rate of infrastructure spending, housing starts, commercial construction and mining plays a significant role in the company's results. Our products are an integral component of these activities and as these activities increase or decrease in the United States or abroad, demand for our products may be significantly impacted.
Projected cost savings or synergies from alliances with new partners could also be negatively impacted by a variety of factors. These factors could include, among other things, higher than expected wages, energy and/or material costs, and/or higher than expected financing costs due to unforeseen changes in tax, trade, environmental, labor, safety, payroll or pension policies in any of the jurisdictions in which the alliances conduct their operations.
Results may be impacted positively or negatively by changes in the sales mix. Our outlook assumes a certain geographic mix of sales as well as a product mix of sales. If actual results vary from this projected geographic and product mix of sales, our results could be negatively impacted.
The company operates in a highly competitive environment and our outlook depends on a forecast of the company's share of industry sales. An unexpected reduction in that share could result from pricing or product strategies pursued by competitors, unanticipated product or manufacturing difficulties, a failure to price the product competitively, or an unexpected buildup in competitors' new machine or dealer owned rental fleets, leading to severe downward pressure on machine rental rates and/or used equipment prices.
The environment remains competitive from a pricing standpoint. Our 2006 sales outlook assumes that the company is successful in implementing worldwide machine price increases communicated to dealers with an effective date of January 2006. While we expect that the environment will absorb these price actions, delays in the marketplace acceptance would negatively impact our results. Moreover, additional price discounting to maintain our competitive position could result in lower than anticipated realization.
Our sales and results are generally sensitive to changes in economic growth, particularly those originating in construction, mining and energy. Developments reducing such activities also tend to lower our sales. In addition to the factors mentioned above, our sales and results could be negatively impacted by any of the following:
· Any sudden drop in consumer or business confidence;
· Delays in legislation needed to fund public construction;
· Regulatory or legislative changes that slow activity in key industries; and/or
· Unexpected collapses in stock markets.
This discussion of uncertainties is by no means exhaustive, but is designed to highlight important factors that may impact our outlook. Obvious factors such as general economic conditions throughout the world do not warrant further discussion, but are noted to further emphasize the myriad of contingencies that may cause the company's actual results to differ from those currently anticipated.
Page 37