Exhibit 99.1
Caterpillar Inc.
2Q 2006 Earnings Release
For distribution on July 21, 2006
FOR IMMEDIATE RELEASE
Caterpillar Profit Per Share 41 Percent Higher than Second Quarter 2005;
Full-Year Outlook Increased
Second-quarter sales and revenues and profit were the highest for any quarter in Caterpillar’s history
Strong demand continues in key industries
PEORIA, Ill. - Today, Caterpillar Inc. (NYSE: CAT) reported a 41 percent increase in profit per share on a 13 percent increase in sales and revenues compared with the second quarter 2005. Sales and revenues in the quarter were $10.605 billion, and profit was $1.046 billion, or $1.52 per share—all were the highest for any quarter in Caterpillar’s history.
“We had a spectacular second quarter with the strongest financial performance we’ve reported since the 1960s. I couldn’t be prouder of Team Caterpillar,” said Caterpillar Chairman and Chief Executive Officer Jim Owens. “The fundamentals remained strong in the industries we serve. We are hitting on all cylinders and are again raising our full-year outlook. Customers have confidence in our products, and sales continued to increase. Our performance in the quarter was made possible by the hard work of our employees, dealers and suppliers who are focused on meeting the needs of our customers.”
Sales and revenues increased $1.245 billion from second quarter 2005. The increase was a result of $809 million of higher sales volume, $384 million of improved price realization and a $73 million increase in Financial Products revenues.
Second-quarter profit increased $286 million, or $0.44 per share, from second quarter 2005. The increase was largely due to improved price realization and higher sales volume, partially offset by higher core operating costs to support our growth.
First-half 2006 sales and revenues of $19.997 billion and profit of $1.886 billion, or $2.72 per share, were also records. Operating cash flow in the first half of 2006 was $1.948 billion, up $952 million from the first half of 2005. This strong cash flow allowed us to increase capital expenditures to $552 million, acquire Progress Rail, keep our benefit plans well-funded, announce a 20 percent dividend increase and repurchase 33.3 million shares.
“I am delighted with what has been accomplished, but we still have work to do. From an operational perspective, record demand has resulted in longer delivery times for many of our products than we, or our customers, would like,” commented Owens. “We’re continuing to work with suppliers and within our factories to remove bottlenecks and increase production for a number of our products. The entire Caterpillar supply chain has responded over the past three years to support our unprecedented growth. 6 Sigma has been a significant positive factor for ramping up production, managing our cost structure and delivering record profitability.”
Page 1
Outlook
We are raising our outlook for 2006 from previously reported levels. Sales and revenues are now expected to be up 12 to 15 percent from 2005, including about $600 million from the acquisition of Progress Rail. The profit outlook has been adjusted to reflect an estimated profit range of $5.25 to $5.50 per share. The previous outlook reflected sales and revenues up about 10 percent and profit per share of $4.85 to $5.20.
“We are entering the fourth year of a recovery that began in mid-2003. The industries we serve continue to be very strong throughout the world, particularly mining, energy and infrastructure development. While it’s tough to predict the future, historically global industry recoveries have lasted six to eight years, and a variety of factors, particularly past under investment, should help sustain this recovery,” Owens said. “We are continuing to invest in growth, and the acquisition of Progress Rail and expanding capacity for large engines are great examples. We are working hard to execute our new strategy, and I am very confident in Caterpillar’s future.”
(Complete outlook begins on page 10.)
For more than 80 years, Caterpillar Inc. has been making progress possible and driving positive and sustainable change on every continent. With 2005 sales and revenues of $36.339 billion, Caterpillar is the world’s leading manufacturer of construction and mining equipment, diesel and natural gas engines, industrial gas turbines and a wide and growing offering of related services. More information is available at http://www.cat.com.
Caterpillar contact:
Rusty Dunn
Corporate Public Affairs
(309) 675-4803
Dunn_Rusty_L@cat.com
Note: Glossary of terms included on pages 21-22; first occurrence of terms shown in bold italics.
Page 2
Key Points
Second Quarter
| § | Second-quarter sales and revenues of $10.605 billion were the highest in company history and were 13 percent higher than second quarter 2005. |
| § | Machinery sales increased 14 percent, Engines sales increased 12 percent and Financial Products revenues rose 13 percent from a year ago. |
| § | Second-quarter profit was the highest in company history—$1.046 billion, or $1.52 per share—41 percent higher than second quarter 2005. |
| § | Machinery and Engines operating profit as a percent of sales increased substantially—from 11 percent in second quarter 2005 to 14 percent in second quarter 2006. The increase was a result of improved price realization and higher sales volume, partially offset by an increase in core operating costs. |
| § | Machinery and Engines “operating profit pull through”—the change in operating profit divided by the change in sales—was 41 percent. |
| § | Shares repurchased totaled 22.8 million during the quarter. With shares issued to cover options exercised and the acquisition of Progress Rail, the net reduction of shares outstanding was 13.9 million. |
First Half
| § | First-half sales and revenues were $19.997 billion, up 13 percent from first half 2005. Profit was $1.886 billion, or $2.72 per share, up over 40 percent from first half 2005. |
| § | Machinery and Engines operating profit as a percent of sales increased substantially—from 10 percent in first half 2005 to 14 percent in first half 2006. |
| § | Operating cash flow in the first half of 2006 was $1.948 billion, up $952 million from the first half of 2005. This strong cash flow allowed us to increase capital expenditures to $552 million, acquire Progress Rail, keep our benefit plans well-funded, announce a 20 percent dividend increase and repurchase 33.3 million shares. With shares issued to offset stock option exercises and the acquisition of Progress Rail, the net reduction of shares outstanding was 15.1 million. |
Outlook
| § | We expect 2006 sales and revenues to be up 12 to 15 percent from 2005. The outlook for profit per share is a range of $5.25 to $5.50, up from $4.04 in 2005 and the previous outlook for 2006 of $4.85 to $5.20. The complete outlook begins on page 10. |
A question and answer section has been included in this release starting on page 15.
Page 3
DETAILED ANALYSIS
Second Quarter 2006 vs. Second Quarter 2005
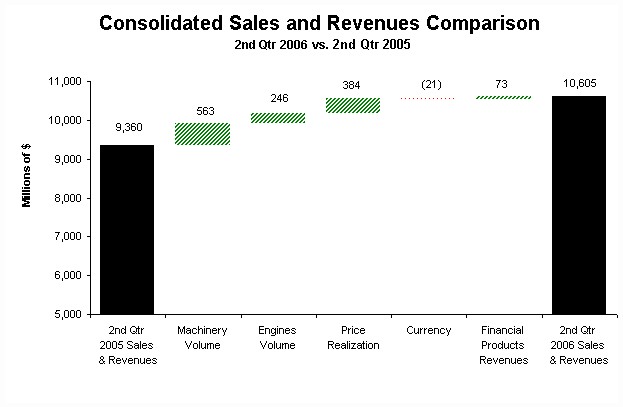 |
| The chart above graphically illustrates reasons for the change in Consolidated Sales and Revenues between second quarter 2005 (at left) and second quarter 2006 (at right). Items favorably impacting sales and revenues appear as upward stair steps with the corresponding dollar amounts above each bar, while items negatively impacting sales and revenues appear as downward stair steps with dollar amounts reflected in parentheses above each bar. Caterpillar management utilizes these charts internally to visually communicate with its Board and employees. |
Sales and Revenues
Sales and revenues for second quarter 2006 were $10.605 billion, up $1.245 billion, or 13 percent, from second quarter 2005. Machinery volume was up $563 million, Engines volume was up $246 million, price realization improved $384 million and currency had a negative impact on sales of $21 million, primarily due to a weaker Euro. In addition, Financial Products revenues increased $73 million.
Sales and Revenues by Geographic Region | ||||||||||||||||||||||||
(Millions of dollars) | Total | % Change | North America | % Change | EAME | % Change | Latin America | % Change | Asia/ Pacific | % Change | ||||||||||||||
Second Quarter 2005 | ||||||||||||||||||||||||
| Machinery | $ | 6,026 | $ | 3,321 | $ | 1,430 | $ | 526 | $ | 749 | ||||||||||||||
Engines1 | 2,758 | 1,226 | 949 | 229 | 354 | |||||||||||||||||||
Financial Products2 | 576 | 410 | 84 | 35 | 47 | |||||||||||||||||||
| $ | 9,360 | $ | 4,957 | $ | 2,463 | $ | 790 | $ | 1,150 | |||||||||||||||
Second Quarter 2006 | ||||||||||||||||||||||||
| Machinery | $ | 6,875 | 14% | $ | 3,764 | 13% | $ | 1,680 | 17% | $ | 667 | 27% | $ | 764 | 2% | |||||||||
Engines1 | 3,081 | 12% | 1,447 | 18% | 998 | 5% | 233 | 2% | 403 | 14% | ||||||||||||||
Financial Products2 | 649 | 13% | 458 | 12% | 95 | 13% | 48 | 37% | 48 | 2% | ||||||||||||||
| $ | 10,605 | 13% | $ | 5,669 | 14% | $ | 2,773 | 13% | $ | 948 | 20% | $ | 1,215 | 6% | ||||||||||
1 Does not include internal engines transfers of $599 million and $494 million in second quarter 2006 and 2005, respectively. Internal engines transfers are valued at prices comparable to those for unrelated parties. | ||||||||||||||||||||||||
2 Does not include revenues earned from Machinery and Engines of $119 million and $80 million in second quarter 2006 and 2005, respectively. | ||||||||||||||||||||||||
Page 4
Machinery Sales were $6.875 billion, an increase of $849 million, or 14 percent, from second quarter 2005.
| § | Sales volume increased $563 million. |
| § | Price realization increased $296 million. |
| § | Currency reduced sales $10 million. |
| § | Worldwide, and for most geographic regions, dealer reported inventories were up, but inventories in months of supply were down. |
| § | Sales volume increased for the fifteenth consecutive quarter. |
| § | Sales increased in North America, with nonresidential building and highway construction more than offsetting the effects of lower housing construction. |
| § | Strengthening economic conditions in Europe contributed to sales growth in the Europe, Africa, Middle East (EAME) region, which had been the slowest growing region over the past few years. |
| § | Overall, mining activity continued to be very strong as commodity prices remain at levels attractive to investment. |
| § | The volume decline in Asia/Pacific was largely in Indonesia, where higher interest rates, some currency turmoil and higher fuel prices created some uncertainty about the economy. |
| § | Improved price realization resulted largely from price increases implemented in the second quarter 2005 and first quarter of 2006. |
North America - Sales increased $443 million, or 13 percent.
| § | Sales volume increased $253 million. |
| § | Price realization increased $190 million. |
| § | Most industries we serve continued to do well. Nonresidential building and highway construction increased at more than double-digit rates. |
| § | Mining benefited from metals prices that were more than 60 percent higher than a year ago and coal production that increased almost 11 percent. |
| § | Available data for the second quarter suggests that U.S. economic growth slowed to about a 3 percent rate. |
| § | Employment growth moderated during the quarter, and housing construction declined from a year earlier. |
EAME - Sales increased $250 million, or 17 percent.
| § | Sales volume increased $255 million. |
| § | Price realization increased $18 million. |
| § | Currency reduced sales $23 million. |
| § | Higher energy, metals and commodity prices have improved incomes in many countries in Africa/Middle East, creating the best economic growth in years; investments in infrastructure, energy and mining continued to increase machine demand. |
| § | Significant sales volume growth occurred in the Commonwealth of Independent States (CIS), the result of higher commodity prices and low domestic interest rates. |
| § | Economic growth and construction activity strengthened in Europe, allowing better sales volume growth. |
| § | Sales benefited from a catch up in shipments of models delayed in the first quarter due to New Product Introductions (NPI). |
Page 5
Latin America - Sales increased $141 million, or 27 percent.
| § | Sales volume increased $80 million. |
| § | Price realization increased $48 million. |
| § | Currency benefited sales by $13 million. |
| § | Sales gains in the second quarter were strongest in Brazil and Mexico, where interest rates declined over the past year. |
| § | Sales volume increased in most countries in response to good economic growth, increased construction, higher metals and energy prices and low domestic interest rates. |
Asia/Pacific - Sales increased $15 million, or 2 percent.
| § | Sales volume decreased $25 million. |
| § | Price realization increased $40 million. |
| § | The decline in sales volume occurred largely in Indonesia; high interest rates, some currency turmoil and higher fuel prices increased uncertainty among end users about prospects for their business. |
| § | Sales volume in Australia and China increased. Australia is benefiting from a mining boom and China from rapid growth in construction. |
| § | Economic growth remained strong in most countries, with construction and mining continuing to do well. |
Engines Sales were $3.081 billion, an increase of $323 million, or 12 percent, from second quarter 2005.
| § | Sales volume increased $246 million. |
| § | Price realization increased $88 million. |
| § | Currency reduced sales $11 million. |
| § | Worldwide, and for most geographic regions, dealer reported inventories were up, but inventories in months of supply were down. |
| § | The improvement in price realization was largely a result of price increases in the second quarter of 2005 and the first quarter of 2006. |
North America - Sales increased $221 million, or 18 percent.
| § | Sales volume increased $193 million. |
| § | Price realization increased $28 million. |
| § | Sales for petroleum applications increased 45 percent with strong growth in sales of turbines and turbine-related services for pipeline compression as well as reciprocating engines for gas drilling and compression applications. |
| § | Sales for on-highway truck applications increased 5 percent with ongoing investment in new truck fleets. |
| § | Sales for industrial applications increased 15 percent with strong demand for auxiliary power unit engines for on-highway trucks as well as various types of Original Equipment Manufacturer (OEM) equipment. |
| § | Sales for electric power applications increased 2 percent with ongoing demand for data center applications and rental fleets, partially offset by reduced demand for power plants. |
| § | Sales for marine applications increased 1 percent with ongoing demand for workboat engines. |
Page 6
EAME - Sales increased $49 million, or 5 percent.
| § | Sales volume increased $24 million. |
| § | Price realization increased $35 million. |
| § | Currency reduced sales $10 million. |
| § | Sales for petroleum applications increased 24 percent with increased demand for turbines and turbine-related services for oil production in Africa/Middle East and gas transmission in Europe. |
| § | Sales for marine applications increased 13 percent from higher demand for oceangoing vessels. |
| § | Sales for electric power applications declined 3 percent, as timing of turbine power plant projects more than offset higher sales of reciprocating engine generator sets for rental fleets and Middle East infrastructure. |
| § | Sales for industrial applications declined 4 percent with lower demand for agricultural equipment. |
Latin America - Sales increased $4 million, or 2 percent.
| § | Sales volume increased $2 million. |
| § | Price realization increased $2 million. |
| § | Sales for electric power applications increased 23 percent from ongoing demand for standby generator sets to support business growth and disaster preparedness. |
| § | Sales for petroleum applications increased 15 percent with strong demand for turbines and turbine-related services to support oil production in Brazil. |
| § | Sales for on-highway truck applications increased 16 percent with continued investment in trucks and strong market acceptance of Caterpillar engines. |
| § | Sales for industrial applications decreased 21 percent with lower sales of engines for agricultural equipment. |
Asia/Pacific - Sales increased $49 million, or 14 percent.
| § | Sales volume increased $27 million. |
| § | Price realization increased $23 million. |
| § | Currency reduced sales $1 million. |
| § | Sales for petroleum applications increased 73 percent, primarily from demand for turbines and turbine-related services in Southeast Asia as well as increased demand for drill rigs. |
| § | Sales for electric power applications increased 2 percent as rising demand for generator sets to support manufacturing and peaking were partially offset by reduced power plant sales. |
| § | Sales for industrial applications increased 9 percent with growing demand for air compressor and rail applications. |
| § | Sales for marine applications declined 7 percent, primarily from reduced demand for workboat and pleasure craft engines. |
Financial Products Revenues - Financial Products revenues were $649 million, an increase of $73 million, or 13 percent, from second quarter 2005.
| § | Growth in earning assets increased revenues $57 million. |
| § | Other revenues declined $29 million as a result of a $16 million write-down of a marine-related asset and lower net gains on the sales of receivables of $8 million. |
| § | The impact of higher interest rates on new and existing finance receivables at Cat Financial added $31 million. |
| § | Cat Insurance revenues increased about $10 million due to general growth. |
Page 7
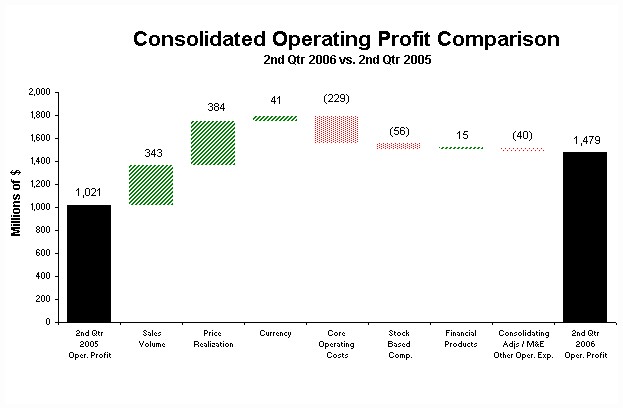 |
| The chart above graphically illustrates reasons for the change in Consolidated Operating Profit between second quarter 2005 (at left) and second quarter 2006 (at right). Items favorably impacting operating profit appear as upward stair steps with the corresponding dollar amounts above each bar, while items negatively impacting operating profit appear as downward stair steps with dollar amounts reflected in parentheses above each bar. Caterpillar management utilizes these charts internally to visually communicate with its Board and employees. |
Operating Profit
Operating profit in second quarter 2006 improved $458 million, or 45 percent, from last year, driven by higher price realization and sales volume, partially offset by higher core operating costs to support our growth.
Core operating costs rose $229 million from second quarter 2005. Of this increase, $102 million was attributable to higher manufacturing costs. The majority of the manufacturing cost increase was attributable to higher period manufacturing costs. Non-manufacturing core operating costs were up $127 million as a result of higher Selling, General and Administrative (SG&A) and Research and Development (R&D) expenses to support significant new product programs and growth.
Operating Profit by Principal Line of Business | |||||||||||||
(Millions of dollars) | Second Quarter 2005 | Second Quarter 2006 | $ Change | % Change | |||||||||
Machinery1 | $ | 676 | $ | 986 | $ | 310 | 46% | ||||||
Engines1 | 265 | 435 | 170 | 64% | |||||||||
| Financial Products | 142 | 157 | 15 | 11% | |||||||||
Consolidating Adjustments | (62 | ) | (99 | ) | (37 | ) | |||||||
| Consolidated Operating Profit | $ | 1,021 | $ | 1,479 | $ | 458 | 45% | ||||||
1 Caterpillar operations are highly integrated; therefore, the company uses a number of allocations to determine lines of business operating profit for Machinery and Engines. | |||||||||||||
Page 8
Operating Profit by Principal Line of Business
| § | Machinery operating profit of $986 million was up $310 million, or 46 percent, from second quarter 2005. The favorable impact of improved price realization and higher sales volume was partially offset by higher core operating costs and stock-based compensation expense. |
| § | Engines operating profit of $435 million was up $170 million, or 64 percent, from second quarter 2005. The favorable impact of improved price realization, higher sales volume and currency was partially offset by higher core operating costs and stock-based compensation expense. |
| § | Financial Products operating profit of $157 million was up $15 million, or 11 percent, from second quarter 2005. The increase was primarily due to a $26 million impact from the continued growth of earning assets and a $17 million impact from improved net yield on earning assets at Cat Financial. This favorable impact was partially offset by a $16 million write-down of a marine-related asset and lower net gains on the sales of receivables of $8 million. |
Other Profit/Loss Items
| § | Other income/expense was income of $50 million compared with income of $90 million in second quarter 2005. The decrease is due to an unfavorable impact of foreign currency, partially offset by higher investment income at Cat Insurance. |
| § | The provision for income taxes in the second quarter reflects an estimated annual tax rate of 31 percent for 2006 compared to 29 percent for the second quarter 2005 and 29.5 percent for the full year 2005 (excluding discrete items). The increase is primarily due to a change in our geographic mix of profits as well as the impact of the phase-out provision of the American Jobs Creation Act permitting only 60 percent of Extraterritorial Income Exclusion (ETI) benefits in 2006. The second quarter 2006 provision for income taxes also includes a discrete benefit of $5 million for net changes in tax reserves. This compares to an $11 million discrete charge to our second quarter 2005 provision for income taxes related to 2005 repatriation plans. |
Employment
Caterpillar’s worldwide employment was 92,314 in second quarter 2006 compared with 82,248 in second quarter 2005. The increase was due to about 5,200 employee additions through acquisitions, primarily due to Progress Rail, about 2,900 hourly labor additions to support higher volume and approximately 1,900 salaried and management additions to support higher volume, new product introductions and growth of our services.
Page 9
Sales & Revenues Outlook
We project company sales and revenues will increase 12 percent to 15 percent compared to 2005.
| § | During the second quarter, sentiment concerning the health of the world economy eroded. However, a deeper look at the economic factors that have supported Caterpillar’s growth over the past few years finds them still largely in place in most key markets. |
| § | Interest rates are high enough in several countries—the United States, the United Kingdom and Australia—to create some risk to the pace of economic growth. However, incomes have shifted from consumers to businesses, so any slowing in growth should fall more heavily on consumer spending than business investment. Interest rates in Europe, Japan and most developing countries remain low. |
| § | We project that world economic growth will exceed 3.5 percent this year, slightly faster than in 2005. Improved growth in both Europe and Japan should offset some slowing in the United States. Strong economic growth should continue in most developing countries. Since 2002, higher prices and increased production raised revenues to commodity producers by more than $1.5 trillion. That increase contributed to better economic growth in developing countries and did not prevent improved growth in the major consuming countries—European countries, Japan and the United States. |
| § | We expect increased construction spending in 2006; however, growth will be more concentrated in nonresidential building and infrastructure. Housing is declining in the United States but should benefit from rising home prices and low interest rates in many other countries. |
| § | Demand for metals is up due to increased industrial production—3 percent or more in the industrial countries and 5 percent or more in many developing countries. At the same time, producers have struggled to increase production, and inventories are near critical lows. While we expect modest commodity price declines in the coming months, prices are expected to remain above levels that encourage continued investment in new mining capacity. |
| § | International coal prices rebounded from a late 2005 slump and recently traded near year-earlier prices. Last year, coal was the world’s fastest growing source of energy; coal’s price advantage over oil and natural gas should keep demand growing. |
| § | Ocean shipping rates have improved, and increased offshore petroleum activity is requiring more support and supply vessels. Shipyards have healthy order backlogs, which should increase marine engine sales. |
| § | Concerns about oil supplies likely will keep crude oil prices trading above $70 per barrel the rest of the year. Growth in exploration, drilling, pipeline expenditures and oil sands development should benefit both machinery and engines sales. We believe that as long as oil production continues to increase, as it has this year, the world can cope with current high oil prices. However, a significant reduction in oil supplies would likely interrupt the world economic recovery. |
Page 10
North America (United States and Canada) Machinery and Engines sales are expected to increase about 15 percent in 2006.
| § | At its June 30 meeting, the U.S. Federal Reserve raised interest rates to 5.25 percent and became more ambiguous about future actions. We assume the Fed is still more concerned about inflation than an economic slowdown and will raise interest rates again this year. |
| § | We believe that past Fed actions were sufficient to slow economic growth to near 3 percent in the second quarter and that growth will be below 3 percent in the second half. However, the strong first quarter will bring full year 2006 growth to almost 3.5 percent. |
| § | The business investment sector has fared much better than consumer industries during this recovery, and that disparity should continue. Factors supporting investment—record corporate profits, favorable financing, attractive output prices and aged or inadequate capacity in basic industries—remain in place today. |
| § | Housing starts averaged over a 2 million unit rate so far this year, and building permits were even higher. However, mortgage interest rates reached a four-year high, which will likely reduce starts for the year to about 1.9 million units—the third best year since 1978. |
| § | Investment in nonresidential structures increased at a 12 percent rate in the first quarter, and a surge in new contracts issued should allow for over 10 percent growth for the year. |
| § | States used increased federal funding to award 13 percent more highway contracts in the first five months of 2006. We expect contracting will increase about 10 percent in 2006. |
| § | Mine production of metals in the United States increased only 2.5 percent in the first six months of this year, suggesting further large investment increases will be needed to reverse capacity reductions made in the late 1990s. A tripling in exploration and development spending the past three years has so far increased mine capacity by only 2 percent. |
| § | Coal production in the second quarter increased almost 11 percent from a year earlier, benefiting from increased electricity production and the rebuilding of utility coal stockpiles. Mine capacity is about the same as in early 1994, so the operating rate rose to 95 percent. Coal prices remain attractive for investing in new capacity. |
| § | High oil and natural gas prices led to a 20 percent increase in operating drill rigs this year, the highest level since early 1986. Growth in energy demand should keep pressure on supplies, further boosting investment in capacity. |
| § | Production of on-highway trucks should be up more than 5 percent this year, the result of better trucking company profits and ordering in advance of 2007 emission standards. Order backlogs at truck manufacturers currently cover nearly all production slots available through year-end. |
| § | The Bank of Canada decided not to raise interest rates at its last meeting since inflation is on target. We forecast the Canadian economy will grow more than 3 percent this year, housing will continue to be strong and nonresidential construction should increase more than 5 percent. |
| § | Metals production in Canada declined more than 10 percent year to date despite a near tripling in exploration and development spending the past three years. We expect further large increases in capacity-related investments. Production of oil and natural gas increased more than 6 percent, benefiting from oil sands development and a record number of drill rigs operating. |
| § | The acquisition of Progress Rail will add approximately $600 million in sales the last half of 2006. |
Page 11
EAME Machinery and Engines sales are expected to increase about 11 percent in 2006.
| § | The European Union (EU) economy grew at a 2.5 percent annual rate in the first quarter, the fastest in two years. Forward-looking indicators suggest the current rebound should continue, and we forecast economic growth of more than 2 percent in 2006. |
| § | EU residential building permits rose 8 percent year to date, the fourth consecutive year of good growth. Factors that should continue to support housing include higher home prices, an inadequate housing stock, low long-term interest rates and growing employment. |
| § | Nonresidential construction has begun to increase from year-earlier levels, although at a slower pace than housing. Record corporate profits, rising office rents and increased industrial production should strengthen the recovery. |
| § | Headline inflation is above the European Central Bank’s target, so we expect the bank will raise interest rates from the current 2.75 percent to 3.25 percent by year-end. The Bank of England is expected to hold rates steady the rest of the year. |
| § | We forecast over 5 percent growth in the Africa/Middle East region in 2006, the fourth year of good growth. High commodity prices and low interest rates in key countries should lead to growth in construction and both metals and energy investment. |
| § | Economic growth in the CIS should be close to 6 percent this year, continuing the recovery from the 1998 Russian debt crisis. Construction in Russia increased more than 10 percent in the second quarter, and oil production rose almost 5 percent this year. High commodity prices and low interest rates should allow good growth in construction, metals and energy investment this year. |
Latin America Machinery and Engines sales are expected to increase about 12 percent in 2006.
| § | The Brazilian Central Bank has reduced the short-term interest rate eight times, more than reversing the tightening cycle started in 2004. As a result, the largest economy in the region is rebounding from some weakness in late 2005. |
| § | Mexico's interest rates have also declined since mid-2005, and first-quarter growth was the best in over a year. Forward-looking indicators suggest this improvement in the economy should continue. |
| § | We project regional economic growth will exceed 4.5 percent this year, slightly faster than last year. Good economic growth and favorable interest rates should allow strong growth in construction this year. Major countries reported year-to-date increases in construction spending ranging from 5 to 20 percent. |
| § | Metals exploration and development spending more than doubled the past three years, and mine production is generally increasing—up 10 percent in Brazil and 5 percent in Peru. However, Chile, the world’s largest producer of copper, has experienced production declines. High metals prices indicate mining investment in the region should continue to grow. |
Asia/Pacific Machinery and Engines are expected to increase about 11 percent in 2006.
| § | We expect regional growth will exceed 7 percent this year, slightly faster than last year. Most countries are maintaining low interest rates, and competitive exchange rates are prolonging fast export growth. The region is also benefiting from the increasing importance of the Indian economy, where industrial production increased 10 percent in the second quarter. |
Page 12
| § | Rapid economic growth and low interest rates are benefiting construction. Data on construction spending in Indonesia, China and Australia indicate growth of 5 percent or more. However, housing construction in Australia is declining in response to high interest rates. |
| § | Coal mining should remain a growth area this year. Regional spot prices have rebounded, and Indonesia, the world’s largest exporter of thermal coal, could have a capacity expansion of more than 15 percent. Increased port congestion could limit Australia’s ability to increase coal exports. |
| § | Australia increased expenditures for mineral exploration 17 percent in the first quarter, the eighth consecutive quarter of large increases. Despite those increased investments, production declined in the first quarter. We expect mining companies will continue to increase investments. |
Financial Products Revenues
| § | We expect continued growth in Financial Products for 2006. Revenues are expected to increase approximately 18 percent versus 2005, primarily due to higher average earning assets in 2006. |
Sales and Revenues Outlook - Midpoint of Range1 | |||||||||||
(Millions of dollars) | 2005 | 2006 | % | ||||||||
Actual | Outlook | Change | |||||||||
| Machinery and Engines | |||||||||||
| North America | $ | 17,709 | $ | 20,400 | 15 | % | |||||
| EAME | 8,860 | 9,800 | 11 | % | |||||||
| Latin America | 3,024 | 3,400 | 12 | % | |||||||
| Asia/Pacific | 4,413 | 4,900 | 11 | % | |||||||
Total Machinery and Engines | 34,006 | 38,500 | 13 | % | |||||||
Financial Products2 | 2,333 | 2,750 | 18 | % | |||||||
| Total | $ | 36,339 | $ | 41,250 | 13.5 | % | |||||
1 The Consolidated Operating Profit chart on page 14 reflects sales and revenues at the midpoint of the range. | |||||||||||
2 Does not include revenues earned from Machinery and Engines of $421 million and $317 million in 2006 and 2005, respectively. | |||||||||||
Page 13
 |
1 The PPS outlook is between $5.25 and $5.50. The above chart illustrates operating profit at the midpoint of this profit range. Each of the stair steps in the chart may individually vary within the outlook range. |
2 Other includes the impact of currency, consolidating adjustments, M&E other operating expenses, operating profit of Progress Rail and the effects of rounding. |
2006 Outlook - Profit
We expect profit per share to be in the range of $5.25 to $5.50—between 30 percent and 36 percent higher than 2005. The year is expected to benefit from improved price realization and higher sales volume, partially offset by core operating cost increases and stock-based compensation expense.
About half of the expected core operating cost increase is from manufacturing costs and about half from SG&A and R&D. Manufacturing costs are expected to be higher due to an increase of about 1 percent in material costs and an increase in period manufacturing costs.
SG&A and R&D are expected to be higher in support of growth and new product programs to support the growth envisioned by Caterpillar’s long-term strategy.
Page 14
QUESTION AND ANSWER
QUESTION AND ANSWER
Price Realization | |
Q1: | Price realization in the first half of the year was higher than might have been expected based on your full-year outlook. Can you explain why? |
| A: | Price realization in the first and second quarters of 2006 benefited from price increases implemented in the second quarter of 2005 and in January of 2006. With respect to the rate of improvement being lower during the remainder of the year, the benefit of last year’s second-quarter price increases will not be a significant factor as we compare second half 2006 to second half 2005. In addition, the industries we serve are very competitive, and we intend to defend our market position. |
Demand | |
Q2: | Do you expect that 2006 is the peak year in this business cycle for Caterpillar? |
| A: | No. While it’s tough to predict the future, recent industry recoveries have lasted six to eight years. This recovery started in the second half of 2003, so it’s entering its fourth year. Fundamentals for the industries we serve remain very strong, with housing in the U.S. and on-highway engines for 2007 being areas where we see weakness. While we don’t expect sales and revenues in 2006 to be a peak, the rate of growth will be slower. Sales and revenues in 2006 are expected to be more than double full year 2002. |
Q3: | What are you assuming the U.S. Federal Reserve will do with interest rates, and what’s the likely impact of higher interest rates on Caterpillar? |
| A: | We are assuming one more rate hike this year, from the current 5.25 percent to 5.50 percent. We believe higher rates have already started to slow the U.S. economy and reduce housing starts. Beyond that, we see limited impact on Caterpillar sales in 2006 since economic growth should be high enough to benefit key industries. Federal highway funding is on the rise, nonresidential building contracts are increasing, coal production is rising to rebuild depleted utility stocks and metals prices are attractive for investment in mining. These factors create a forward momentum that should carry through the year. |
Q4: | Do you expect housing construction to collapse? |
| A: | No. Housing has increased steadily in the U.S. since the early 1990s and continues to benefit from some positive underlying factors. Household formations have been increasing, demand for second homes is growing, mobile home shipments remain low and replacement demand for housing appears strong. We expect starts in the U.S. will ease to about 1.9 million units in 2006 compared with 2.06 million in 2005. In the mid-1990s and again in the late 1990s, mortgage rates increased more than the current increase. In those earlier periods, annual housing starts declined less than 100,000 units. Overall, housing outside the U.S. is likely to show an improvement in 2006 compared with 2005. |
Page 15
Q5: | Commodity prices have declined from recent peaks. Can you comment on how this has affected, or likely will affect, your sales of mining products? |
| A: | Metal prices are off their highs, but they are still at levels that are significantly higher than recent years. Copper prices are near record highs, and nickel prices are at record highs. Demand is strong, inventories are quite low and producers are struggling to maintain output. Investment has increased for three years, but in the case of metals, it has just returned to the previous peak. More investment in metals and energy is still needed. That said, prices could drop from current levels and still be at levels attractive for investment. |
Q6: | Many who follow the heavy-duty truck industry expect a significant drop in demand in 2007 as a result of new emissions requirements. Do you agree, and what are your expectations? |
| A: | We are seeing indications that fleets may be engaging in a pre-buy prior to the 2007 regulations. The 2007 Class 8 North American heavy-duty truck industry is anticipated to drop from about 315,000 units in 2006 to about 190,000 to 220,000 units in 2007. The industry drop is expected to be more concentrated in the first quarter of the year, with demand increasing somewhat in the remainder of 2007 as freight demand is expected to continue to be strong. |
Q7: | What actions do you expect to take in your heavy-duty engine business as you prepare for the likely drop in demand for truck engines in 2007? |
| A: | We are currently reviewing several alternatives to manage our cost structure for the short-term decrease in heavy-duty truck engine demand. These include specific plans related to manufacturing, support and sales and marketing costs. Although these cost actions will reduce the impact of the lower volumes in 2007, we anticipate the first quarter to be hit harder than the remainder of the year. Continued strength in our petroleum, electric power and marine engine business should help reduce the impact of the lower truck engine volumes. |
Q8: | What actions do you expect to take in your engine business as a result of the significant reduction in mid-range engine demand due to the loss of Freightliner and PACCAR business? |
| A: | We are evaluating several alternatives to adjust our cost structure as a result of this longer term drop in mid-range engine volume. These actions include, but are not limited to, product rationalization, continued expansion into new applications and redeployment of productive assets. Continued strength in the non-truck engine applications over time will offset a portion of the lost business. We are converting part of our mid-range engine assembly plant into a marine engine packaging center to capitalize on the growing demand for marine product while better utilizing shared production assets. Customers will continue to be offered high-quality mid-range truck engines using ACERT® Technology. We are currently working with end users to demonstrate the long-term advantages of using ACERT Technology. |
Page 16
Q9: | Will you be ready with your 2007 emissions certified truck engines, and how are your plans going for transitioning your production to the new engines? |
| A: | Yes. We are ready for the marketplace with 2007 ACERT Technology. Since March of 2005, Caterpillar has been building and validating the next generation ACERT Technology that meets 2007 requirements. We’ve tested over 160 2007 engines operating on ultra low sulfur diesel fuel in a wide spectrum of mid-range and heavy-duty applications. To date, we have accumulated over seven million miles of validation. Design optimization is ongoing, and we continue to take and fill orders for customers who want to evaluate the 2007 engines. In terms of readiness for production, our component supplies and production processes are being validated and are on track for production transition during fourth quarter. Production and shipment will begin the transition to 2007 engines during the fourth quarter, with full implementation early in 2007. |
Q10: | Are dealer reported inventories for machines and engines at levels you think are appropriate overall? |
| A: | While low by historic standards, in terms of months of supply, we think dealer reported machine and engine inventories are about right. However, improving velocity is a key element of our long-term strategy, and over time we expect this to help our dealers reduce inventory. |
Q11: | You mention energy as an industry that's doing very well. From a Caterpillar perspective how are you participating? |
| A: | Caterpillar’s equipment plays a key role in a number of energy-related areas, and today’s high energy prices indicate a need to increase output to meet the needs of a growing world economy. The long-term investments that will be required to develop adequate energy offer excellent growth opportunities for Caterpillar. |
Our machines are important to energy production: · We are a key supplier of machines to coal mining—products like large trucks, track-type tractors, and wheel loaders. · We are the leading supplier of large mining trucks in the Canadian oil sands where most of the oil is mined. · We supply pipelayers and other equipment used to build pipelines for oil and gas. | |
Our engines—diesel and gas reciprocating engines and gas turbines—are important to producers of oil and gas worldwide: · Solar Turbines Incorporated, our wholly owned subsidiary, is a leader in industrial gas turbines. Gas compression, transmission, and power for off shore rigs are significant energy-related applications. · Our industry-leading reciprocating engines are used for gas compression, pumping oil, powering drill rigs and servicing wells to increase output. · We are a major producer of generator sets for distributed power, dedicated primary power and standby applications. |
Page 17
Product Availability | |
Q12: | We’ve heard from dealers and customers that delivery times for large engines for marine, petroleum and electric power applications are very long. Can you update us on the situation? |
| A: | Demand for our larger 3500 and 3600 families of engines has grown substantially since 2004 for most applications and continues to run at record levels. Since early 2004, we have roughly doubled 3500 engine deliveries and increased 3600 engine output by over 50 percent. Lean with 6 Sigma initiatives continue to be applied to constraints across the supply chain to further increase output. In addition, we are investing in manufacturing and supply chain capability to further increase 3500 and 3600 engine output during the latter part of 2007 and early part of 2008. It is important to note that large engine capacity constraints are common to the industry and are being experienced by both Caterpillar and our competitors. |
Q13: | How many machine models do you have on managed distribution? |
| A: | There are 65 machine models currently on managed distribution in North America. In general, medium and large machines are expected to remain "tight" and will likely be on managed distribution throughout 2006. |
Q14: | How will your 2007 on-highway truck engine compare with your current on-highway product? |
| A: | Building on our current 2004 ACERT Technology engines, we will add clean gas induction (CGI) and a diesel particulate filter (DPF) to meet the 2007 on-highway regulations. Our 2007 engines will deliver equal fuel economy, durability and reliability as today's industry-leading product. The DPF will require a periodic maintenance procedure to clean the ash out of the device. All OEMs will have a similar maintenance procedure, but the Caterpillar procedure should be much quicker due to a unique cleaning process. |
Q15: | Are Caterpillar machines with emissions-compliant ACERT engines at year end being released as you had expected, and will all machines that need to meet new regulations be ready? |
| A: | Yes. Since launching ACERT Technology in October 2004, 52 machine models are using 300-700 horsepower engines with this technology. An additional 25 models using 100-300 horsepower engines will go into production in 2006. We have met production dates for all machine models that require the ACERT Tier 3 engines and are on track to continue to meet schedules through 2006. |
Page 18
Costs | |
Q16: | Can you break down your core operating costs in more detail? |
| A: | The following table summarizes the increase in core operating costs in second quarter 2006 versus second quarter 2005: |
Core Operating Cost Change | 2nd Quarter 2006 | |||||
vs. | ||||||
(millions of dollars) | 2nd Quarter 2005 | |||||
| Manufacturing Costs | $ | 102 | ||||
| SG&A | 59 | |||||
| R&D | 68 | |||||
| Total | $ | 229 | ||||
Manufacturing costs include both period and variable costs associated with building our products. Period manufacturing costs that naturally increase with volume represent approximately 95 percent of the $102 million increase in manufacturing costs. Period manufacturing costs increased about 10 percent primarily to support 13 percent higher sales. The increase includes items such as machine and equipment repair and maintenance, facility support including energy costs, operations management and durable tooling. The increase also includes costs not directly related to changes in volume such as depreciation of manufacturing assets. Machinery and Engines operating margins have improved from 10.7 percent in the second quarter of 2005 to 14.3 percent in the second quarter of 2006. |
Machinery and Engines Operating Profit as a Percent of Sales | |||||||||
Q2 '05 | Q3 '05 | Q4 '05 | Q1 '06 | Q2 '06 | |||||
| 10.7% | 10.5% | 11.1% | 12.9% | 14.3% | |||||
The increase in SG&A is due largely to increased employment to support higher volumes, new product introductions, order fulfillment/velocity initiatives, growth of our services and development in China. The increase in R&D is due to a significant number of new product introduction programs. |
Q17: | Many industrial companies are reporting higher material costs. Steel scrap, copper and iron ore prices have continued to rise during the second quarter. Can you comment on what happened to Caterpillar’s material costs in the second quarter and the full-year expectation in your outlook? |
| A: | Material costs in the second quarter were about flat versus 2005. As reflected in our 2006 outlook, we expect material costs to be up about 1 percent compared with 2005. |
Page 19
Q18: | Can you update your expectations for stock-based compensation for 2006? |
| A: | Based on the final binomial valuation of our 2006 employee grant, we expect our 2006 consolidated stock-based compensation expense to be about $135 million ($130 million for Machinery and Engines and $5 million for Financial Products). We estimate the distribution of the expense will be as follows: |
Consolidated Stock-Based Compensation Expense (Millions of dollars) | |||||||||||||||
1st Qtr | 2nd Qtr | 3rd Qtr | 4th Qtr | 2006 Full Year | |||||||||||
| $ | 34 | $ | 58 | $ | 30 | $ | 13 | $ | 135 | ||||||
The distribution by quarter is the result of our policy to immediately vest awards upon retirement for employees who are 55 years old or older, have 10 or more years of service and who have completed six months of service after the grant date (i.e. the fair value of awards for employees who have met these age/years of service requirements is expensed over six months rather than the normal three year vesting period). As the 2006 award was granted on February 17, the impact is higher expense in the second and third quarters. In addition, expense for the third and fourth quarters is lower because expense for the final months of vesting for the 2003 grant was included in the first two quarters. As a result of prior decisions that resulted in full vesting of the 2004 and 2005 awards prior to 2006, a full complement of stock-based compensation expense will not be recognized until 2009. |
Cash Flow | |
Q19: | Can you comment on first-half cash flow? |
| A: | The first half of 2006 operating cash flow was outstanding—$1.948 billion. Cash flow highlights include: · Capital expenditures—$552 million—primarily to support new product programs and add capacity. · Acquisitions—$419 million—primarily for Progress Rail (see question 20 for more information). · Dividends—$335 million—the quarterly dividend for the first half of the year was 25 cents per share. On June 14, 2006, we increased the quarterly cash dividend 20 percent to 30 cents per share, payable August 19, 2006, to stockholders of record at the close of business on July 20, 2006. · Share repurchase—$2.411 billion—33.3 million shares were repurchased. |
Q20: | Can you describe the effect of Progress Rail on your second quarter financial statements? |
| A: | We acquired Progress Rail Services on June 19, 2006, for approximately $1 billion. The purchase price was comprised of approximately $425 million of cash, $380 million (5.3 million shares) of stock and the assumption of $200 million of debt. The primary assets acquired were inventories ($260 million), property, plant and equipment ($250 million), intangible assets ($220 million), receivables ($170 million) and goodwill ($400 million). The cash payment portion of the acquisition has been reflected in the investing section of the Statement of Cash Flow. As the stock portion was a non-cash transaction, it did not impact the Statement of Cash Flow. |
Page 20
GLOSSARY OF TERMS
| 1. | Consolidating Adjustments - Eliminations of transactions between Machinery and Engines and Financial Products. |
| 2. | Core Operating Costs - Machinery and Engines variable manufacturing cost change adjusted for volume and change in period costs. Excludes the impact of currency and stock-based compensation. |
| 3. | Currency - With respect to sales and revenues, currency represents the translation impact on sales resulting from changes in foreign currency exchange rates versus the U.S. dollar. With respect to operating profit, currency represents the net translation impact on sales and operating costs resulting from changes in foreign currency exchange rates versus the U.S. dollar. Currency includes the impacts on sales and operating profit for the Machinery and Engines lines of business only; currency impacts on Financial Products revenues and operating profit are included in the Financial Products portions of the respective analyses. With respect to other income/expense, currency represents the effects of forward and option contracts entered into by the company to reduce the risk of fluctuations in exchange rates and the net effect of changes in foreign currency exchange rates on our foreign currency assets and liabilities for consolidated results. |
| 4. | EAME - Geographic region including Europe, Africa, the Middle East and the Commonwealth of Independent States (CIS). |
| 5. | Earning Assets - These assets consist primarily of total finance receivables net of unearned income, plus equipment on operating leases, less accumulated depreciation at Cat Financial. |
| 6. | Engines - A principal line of business including the design, manufacture, marketing and sales of engines for Caterpillar machinery; electric power generation systems; on-highway vehicles and locomotives; marine, petroleum, construction, industrial, agricultural and other applications; and related parts. Reciprocating engines meet power needs ranging from 5 to 21,500 horsepower (4 to over 16 000 kilowatts). Turbines range from 1,600 to 20,500 horsepower (1 200 to 15 000 kilowatts). |
| 7. | Financial Products - A principal line of business consisting primarily of Caterpillar Financial Services Corporation (Cat Financial), Caterpillar Insurance Holdings, Inc. (Cat Insurance), Caterpillar Power Ventures Corporation (Cat Power Ventures) and their respective subsidiaries. Cat Financial provides a wide range of financing alternatives to customers and dealers for Caterpillar machinery and engines, Solar gas turbines as well as other equipment and marine vessels. Cat Financial also extends loans to customers and dealers. Cat Insurance provides various forms of insurance to customers and dealers to help support the purchase and lease of our equipment. Cat Power Ventures is an investor in independent power projects using Caterpillar power generation equipment and services. |
| 8. | Latin America - Geographic region including Central and South American countries and Mexico. |
| 9. | Machinery - A principal line of business which includes the design, manufacture, marketing and sales of construction, mining and forestry machinery--track and wheel tractors, track and wheel loaders, pipelayers, motor graders, wheel tractor-scrapers, track and wheel excavators, backhoe loaders, log skidders, log loaders, off-highway trucks, articulated trucks, paving products, telehandlers, skid steer loaders and related parts. Also includes logistics services for other companies and rail-related products and services. |
Page 21
| 10. | Machinery and Engines (M&E) - Due to the highly integrated nature of operations, it represents the aggregate total of the Machinery and Engines lines of business and includes primarily our manufacturing, marketing and parts distribution operations. |
| 11. | Managed Distribution - The process to provide a fair and equitable allocation of available machine and engine production positions to worldwide dealers on models where demand exceeds factory supply. |
| 12. | Manufacturing Costs - Manufacturing costs represent the volume-adjusted change for variable costs and the absolute dollar change for period manufacturing costs. Variable manufacturing costs are defined as having a direct relationship with the volume of production. This includes material costs, direct labor and other costs that vary directly with production volume such as freight, power to operate machines and supplies that are consumed in the manufacturing process. Period manufacturing costs support production but are defined as generally not having a direct relationship to short-term changes in volume. Examples include machine and equipment repair, depreciation on manufacturing assets, facility support, procurement, factory scheduling, manufacturing planning and operations management. Excludes the impact of currency and stock-based compensation. |
| 13. | M&E Other Operating Expenses - Comprised primarily of gains (losses) on disposal of long-lived assets, long-lived asset impairment charges and impairment of goodwill. |
| 14. | Period Costs - Comprised of Machinery and Engines period manufacturing costs, SG&A expense and R&D expense. Excludes the impact of currency and stock-based compensation. |
| 15. | Price Realization - The impact of net price changes excluding currency. Includes the impact of changes in the relative weighting of sales between geographic regions. |
| 16. | Sales Volume - With respect to sales and revenues, sales volume represents the impact of changes in the quantities sold for machines, engines and parts. With respect to operating profit, sales volume represents the impact of changes in the quantities sold for machines, engines and parts combined with the net operating profit impact of changes in the relative weighting of machines, engines and parts sales with respect to total sales. |
| 17. | Stock-Based Compensation - As required by Statement of Financial Accounting Standards 123R, we began expensing stock-based compensation awards in 2006. Compensation cost is based on the fair value of the award on the date of grant. Our awards consist of stock options and stock-settled stock appreciation rights (SARs). |
| 18. | 6 Sigma - On a technical level, 6 Sigma represents a measure of variation that achieves 3.4 defects per million opportunities. At Caterpillar, 6 Sigma represents a much broader cultural philosophy to drive continuous improvement throughout the value chain. It is a fact-based, data-driven methodology that we are using to improve processes, enhance quality, cut costs, grow our business and deliver greater value to our customers through Black Belt-led project teams. At Caterpillar, 6 Sigma goes beyond mere process improvement—it has become the way we work as teams to process business information, solve problems and manage our business successfully. |
Page 22
NON-GAAP FINANCIAL MEASURES
The following definition is provided for “non-GAAP financial measures” in connection with Regulation G issued by the Securities and Exchange Commission. This non-GAAP financial measure has no standardized meaning prescribed by U.S. GAAP and therefore is unlikely to be comparable to the calculation of similar measures for other companies. Management does not intend this item to be considered in isolation or as a substitute for the related GAAP measure.
Machinery and Engines
Caterpillar defines Machinery and Engines as it is presented in the supplemental data as Caterpillar Inc. and its subsidiaries with Financial Products accounted for on the equity basis. Machinery and Engines information relates to the design, manufacture and marketing of our products. Financial Products information relates to the financing to customers and dealers for the purchase and lease of Caterpillar and other equipment. The nature of these businesses is different, especially with regard to the financial position and cash flow items. Caterpillar management utilizes this presentation internally to highlight these differences. We also believe this presentation will assist readers in understanding our business. Pages 27-32 reconcile Machinery and Engines with Financial Products on the equity basis to Caterpillar Inc. Consolidated financial information.
* * *
The information included in the Outlook section is forward-looking and involves risks and uncertainties that could significantly affect expected results. A discussion of these risks and uncertainties is contained in Form 8-K filed with the Securities & Exchange Commission (SEC) on July 21, 2006. This filing is available on our website at http://www.cat.com/sec_filings.
Caterpillar's latest financial results and current outlook are also available via:
Telephone:
(800) 228-7717 (Inside the United States and Canada)
(858) 244-2080 (Outside the United States and Canada)
Internet:
http://www.cat.com/investor
http://www.cat.com/irwebcast (live broadcast/replays of quarterly conference call)
Caterpillar contact:
Rusty Dunn
Corporate Public Affairs
(309) 675-4803
Dunn_Rusty_L@cat.com
Page 23
Caterpillar Inc. Condensed Consolidated Statement of Results of Operations (Unaudited) (Dollars in millions except per share data) | ||||||||||||||||
Three Months Ended | Six Months Ended | |||||||||||||||
June 30, | June 30, | |||||||||||||||
2006 | 2005 | 2006 | 2005 | |||||||||||||
Sales and revenues: | ||||||||||||||||
Sales of Machinery and Engines | $ | 9,956 | $ | 8,784 | $ | 18,699 | $ | 16,573 | ||||||||
| Revenues of Financial Products | 649 | 576 | 1,298 | 1,126 | ||||||||||||
Total sales and revenues | 10,605 | 9,360 | 19,997 | 17,699 | ||||||||||||
Operating costs: | ||||||||||||||||
Cost of goods sold | 7,416 | 6,890 | 13,968 | 13,105 | ||||||||||||
Selling, general and administrative expenses | 881 | 789 | 1,702 | 1,533 | ||||||||||||
Research and development expenses | 343 | 268 | 650 | 509 | ||||||||||||
Interest expense of Financial Products | 256 | 184 | 488 | 354 | ||||||||||||
Other operating expenses | 230 | 208 | 492 | 421 | ||||||||||||
Total operating costs | 9,126 | 8,339 | 17,300 | 15,922 | ||||||||||||
Operating profit | 1,479 | 1,021 | 2,697 | 1,777 | ||||||||||||
Interest expense excluding Financial Products | 66 | 65 | 134 | 130 | ||||||||||||
Other income (expense) | 50 | 90 | 93 | 198 | ||||||||||||
Consolidated profit before taxes | 1,463 | 1,046 | 2,656 | 1,845 | ||||||||||||
Provision for income taxes | 449 | 315 | 819 | 547 | ||||||||||||
Profit of consolidated companies | 1,014 | 731 | 1,837 | 1,298 | ||||||||||||
Equity in profit (loss) of unconsolidated affiliated companies | 32 | 29 | 49 | 43 | ||||||||||||
Profit | $ | 1,046 | $ | 760 | $ | 1,886 | $ | 1,341 | ||||||||
Profit per common share | $ | 1.58 | $ | 1.12 | $ | 2.83 | $ | 1.97 | ||||||||
Profit per common share - diluted 1 | $ | 1.52 | $ | 1.08 | $ | 2.72 | $ | 1.89 | ||||||||
Weighted average common shares outstanding (millions) | ||||||||||||||||
- Basic | 662.1 | 678.3 | 666.7 | 680.9 | ||||||||||||
- Diluted 1 | 688.5 | 705.1 | 693.8 | 707.9 | ||||||||||||
Cash dividends declared per common share | $ | .55 | $ | .46 | $ | .55 | $ | .46 | ||||||||
1 Diluted by assumed exercise of stock options and SARS, using the treasury stock method. | ||||||||||||||||
Page 24
Caterpillar Inc. | |||||||||||
Condensed Consolidated Statement of Financial Position | |||||||||||
(Unaudited) | |||||||||||
(Millions of dollars) | |||||||||||
Jun. 30, | Dec. 31, | ||||||||||
2006 | 2005 | ||||||||||
Assets | |||||||||||
| Current assets: | |||||||||||
| Cash and short-term investments | $ | 648 | $ | 1,108 | |||||||
| Receivables - trade and other | 8,679 | 7,526 | |||||||||
| Receivables - finance | 6,221 | 6,442 | |||||||||
| Deferred and refundable income taxes | 368 | 344 | |||||||||
| Prepaid expenses | 2,161 | 2,146 | |||||||||
| Inventories | 6,254 | 5,224 | |||||||||
| Total current assets | 24,331 | 22,790 | |||||||||
| Property, plant and equipment - net | 8,281 | 7,988 | |||||||||
| Long-term receivables - trade and other | 970 | 1,037 | |||||||||
| Long-term receivables - finance | 10,801 | 10,301 | |||||||||
| Investments in unconsolidated affiliated companies | 571 | 565 | |||||||||
| Deferred income taxes | 692 | 768 | |||||||||
| Intangible assets | 655 | 424 | |||||||||
| Goodwill | 1,834 | 1,451 | |||||||||
| Other assets | 1,770 | 1,745 | |||||||||
Total assets | $ | 49,905 | $ | 47,069 | |||||||
Liabilities | |||||||||||
| Current liabilities: | |||||||||||
| Short-term borrowings: | |||||||||||
| -- Machinery and Engines | $ | 1,689 | $ | 871 | |||||||
| -- Financial Products | 5,205 | 4,698 | |||||||||
| Accounts payable | 3,936 | 3,412 | |||||||||
| Accrued expenses | 2,782 | 2,617 | |||||||||
| Accrued wages, salaries and employee benefits | 1,541 | 1,845 | |||||||||
| Customer advances | 677 | 454 | |||||||||
| Dividends payable | 197 | 168 | |||||||||
Deferred and current income taxes payable | 641 | 528 | |||||||||
| Long-term debt due within one year: | |||||||||||
| -- Machinery and Engines | 129 | 340 | |||||||||
| -- Financial Products | 4,330 | 4,159 | |||||||||
| Total current liabilities | 21,127 | 19,092 | |||||||||
| Long-term debt due after one year: | |||||||||||
| -- Machinery and Engines | 2,736 | 2,717 | |||||||||
| -- Financial Products | 13,203 | 12,960 | |||||||||
| Liability for post-employment benefits | 3,247 | 2,991 | |||||||||
| Deferred income taxes and other liabilities | 959 | 877 | |||||||||
Total liabilities | 41,272 | 38,637 | |||||||||
Stockholders' equity | |||||||||||
| Common stock | 2,393 | 1,859 | |||||||||
| Treasury stock | (6,613 | ) | (4,637 | ) | |||||||
| Profit employed in the business | 13,330 | 11,808 | |||||||||
| Accumulated other comprehensive income | (477 | ) | (598 | ) | |||||||
Total stockholders' equity | 8,633 | 8,432 | |||||||||
Total liabilities and stockholders' equity | $ | 49,905 | $ | 47,069 | |||||||
Page 25
Caterpillar Inc. | |||||||||
Condensed Consolidated Statement of Cash Flow | |||||||||
(Unaudited) | |||||||||
(Millions of dollars) | |||||||||
Six Months Ended June 30, | |||||||||
2006 | 2005 | ||||||||
Cash flow from operating activities: | |||||||||
Profit | $ | 1,886 | $ | 1,341 | |||||
| Adjustments for non-cash items: | |||||||||
Depreciation and amortization | 802 | 744 | |||||||
Other | 94 | (113 | ) | ||||||
| Changes in assets and liabilities: | |||||||||
Receivables - trade and other | (762 | ) | (742 | ) | |||||
Inventories | (755 | ) | (674 | ) | |||||
Accounts payable and accrued expenses | 356 | 236 | |||||||
Other assets - net | 23 | (24 | ) | ||||||
Other liabilities - net | 304 | 228 | |||||||
Net cash provided by (used for) operating activities | 1,948 | 996 | |||||||
Cash flow from investing activities: | |||||||||
Capital expenditures - excluding equipment leased to others | (552 | ) | (402 | ) | |||||
Expenditures for equipment leased to others | (532 | ) | (608 | ) | |||||
Proceeds from disposals of property, plant and equipment | 319 | 304 | |||||||
Additions to finance receivables | (5,114 | ) | (5,159 | ) | |||||
Collections of finance receivables | 4,079 | 3,444 | |||||||
Proceeds from the sale of finance receivables | 980 | 859 | |||||||
Investments and acquisitions (net of cash acquired) | (419 | ) | (8 | ) | |||||
Proceeds from sale of available-for-sale securities | 219 | 182 | |||||||
Investments in available-for-sale securities | (296 | ) | (239 | ) | |||||
Other - net | 167 | 108 | |||||||
Net cash provided by (used for) investing activities | (1,149 | ) | (1,519 | ) | |||||
Cash flow from financing activities: | |||||||||
Dividends paid | (335 | ) | (280 | ) | |||||
Common stock issued, including treasury shares reissued | 349 | 278 | |||||||
Treasury shares purchased | (2,411 | ) | (839 | ) | |||||
Excess tax benefit from stock-based compensation | 120 | - | |||||||
Proceeds from debt issued (original maturities greater than three months) | 5,033 | 6,318 | |||||||
Payments on debt (original maturities greater than three months) | (5,595 | ) | (4,197 | ) | |||||
Short-term borrowings (original maturities three months or less)--net | 1,564 | (467 | ) | ||||||
Net cash provided by (used for) financing activities | (1,275 | ) | 813 | ||||||
Effect of exchange rate changes on cash | 16 | 14 | |||||||
Increase (Decrease) in cash and short-term investments | (460 | ) | 304 | ||||||
Cash and short-term investments at beginning of period | 1,108 | 445 | |||||||
Cash and short-term investments at end of period | $ | 648 | $ | 749 | |||||
All short-term investments, which consist primarily of highly liquid investments with original maturities of three months or less, are considered to be cash equivalents. | |||||||||
Page 26
Caterpillar Inc. Supplemental Data for Results of Operations For The Three Months Ended June 30, 2006 (Unaudited) (Millions of dollars) | ||||||||||||||||
Supplemental Consolidating Data | ||||||||||||||||
Consolidated | Machinery and Engines 1 | Financial Products | Consolidating Adjustments | |||||||||||||
Sales and revenues: | ||||||||||||||||
Sales of Machinery and Engines | $ | 9,956 | $ | 9,956 | $ | - | $ | - | ||||||||
Revenues of Financial Products | 649 | - | 768 | (119 | )2 | |||||||||||
Total sales and revenues | 10,605 | 9,956 | 768 | (119 | ) | |||||||||||
Operating costs: | ||||||||||||||||
Cost of goods sold | 7,416 | 7,416 | - | - | ||||||||||||
Selling, general and administrative expenses | 881 | 777 | 113 | (9 | )3 | |||||||||||
Research and development expenses | 343 | 343 | - | - | ||||||||||||
Interest expense of Financial Products | 256 | - | 259 | (3 | )4 | |||||||||||
Other operating expenses | 230 | (1 | ) | 239 | (8 | )3 | ||||||||||
Total operating costs | 9,126 | 8,535 | 611 | (20 | ) | |||||||||||
Operating profit | 1,479 | 1,421 | 157 | (99 | ) | |||||||||||
Interest expense excluding Financial Products | 66 | 70 | - | (4 | )4 | |||||||||||
Other income (expense) | 50 | (80 | ) | 35 | 95 | 5 | ||||||||||
Consolidated profit before taxes | 1,463 | 1,271 | 192 | - | ||||||||||||
Provision for income taxes | 449 | 384 | 65 | - | ||||||||||||
Profit of consolidated companies | 1,014 | 887 | 127 | - | ||||||||||||
Equity in profit (loss) of unconsolidated affiliated companies | 32 | 32 | - | - | ||||||||||||
Equity in profit of Financial Products' subsidiaries | - | 127 | - | (127 | )6 | |||||||||||
Profit | $ | 1,046 | $ | 1,046 | $ | 127 | $ | (127 | ) | |||||||
1 Represents Caterpillar Inc. and its subsidiaries with Financial Products accounted for on the equity basis. | ||||||||||||||||
2 Elimination of Financial Products revenues earned from Machinery and Engines. | ||||||||||||||||
3 Elimination of net expenses recorded by Machinery and Engines paid to Financial Products. | ||||||||||||||||
4 Elimination of interest expense recorded between Financial Products and Machinery and Engines. | ||||||||||||||||
5 Elimination of discount recorded by Machinery and Engines on receivables sold to Financial Products and of interest earned between Machinery and Engines and Financial Products. | ||||||||||||||||
6 Elimination of Financial Products profit due to equity method of accounting. | ||||||||||||||||
Page 27
Caterpillar Inc. Supplemental Data for Results of Operations For The Three Months Ended June 30, 2005 (Unaudited) (Millions of dollars) | ||||||||||||||||
Supplemental Consolidating Data | ||||||||||||||||
Consolidated | Machinery and Engines 1 | Financial Products | Consolidating Adjustments | |||||||||||||
Sales and revenues: | ||||||||||||||||
Sales of Machinery and Engines | $ | 8,784 | $ | 8,784 | $ | - | $ | - | ||||||||
Revenues of Financial Products | 576 | - | 656 | (80 | )2 | |||||||||||
Total sales and revenues | 9,360 | 8,784 | 656 | (80 | ) | |||||||||||
Operating costs: | ||||||||||||||||
Cost of goods sold | 6,890 | 6,890 | - | - | ||||||||||||
Selling, general and administrative expenses | 789 | 689 | 111 | (11 | )3 | |||||||||||
Research and development expenses | 268 | 268 | - | - | ||||||||||||
Interest expense of Financial Products | 184 | - | 189 | (5 | )4 | |||||||||||
Other operating expenses | 208 | (4 | ) | 214 | (2 | )3 | ||||||||||
Total operating costs | 8,339 | 7,843 | 514 | (18 | ) | |||||||||||
Operating profit | 1,021 | 941 | 142 | (62 | ) | |||||||||||
Interest expense excluding Financial Products | 65 | 67 | - | (2 | )4 | |||||||||||
Other income (expense) | 90 | 21 | 9 | 60 | 5 | |||||||||||
Consolidated profit before taxes | 1,046 | 895 | 151 | - | ||||||||||||
Provision for income taxes | 315 | 262 | 53 | - | ||||||||||||
Profit of consolidated companies | 731 | 633 | 98 | - | ||||||||||||
Equity in profit (loss) of unconsolidated affiliated companies | 29 | 26 | 3 | - | ||||||||||||
Equity in profit of Financial Products' subsidiaries | - | 101 | - | (101 | )6 | |||||||||||
Profit | $ | 760 | $ | 760 | $ | 101 | $ | (101 | ) | |||||||
1 Represents Caterpillar Inc. and its subsidiaries with Financial Products accounted for on the equity basis. | ||||||||||||||||
2 Elimination of Financial Products revenues earned from Machinery and Engines. | ||||||||||||||||
3 Elimination of net expenses recorded by Machinery and Engines paid to Financial Products. | ||||||||||||||||
4 Elimination of interest expense recorded between Financial Products and Machinery and Engines. | ||||||||||||||||
5 Elimination of discount recorded by Machinery and Engines on receivables sold to Financial Products and of interest earned between Machinery and Engines and Financial Products. | ||||||||||||||||
6 Elimination of Financial Products profit due to equity method of accounting. | ||||||||||||||||
Page 28
Caterpillar Inc. Supplemental Data for Results of Operations For The Six Months Ended June 30, 2006 (Unaudited) (Millions of dollars) | ||||||||||||||||
Supplemental Consolidating Data | ||||||||||||||||
Consolidated | Machinery and Engines 1 | Financial Products | Consolidating Adjustments | |||||||||||||
Sales and revenues: | ||||||||||||||||
Sales of Machinery and Engines | $ | 18,699 | $ | 18,699 | $ | - | $ | - | ||||||||
Revenues of Financial Products | 1,298 | - | 1,514 | (216 | )2 | |||||||||||
Total sales and revenues | 19,997 | 18,699 | 1,514 | (216 | ) | |||||||||||
Operating costs: | ||||||||||||||||
Cost of goods sold | 13,968 | 13,968 | - | - | ||||||||||||
Selling, general and administrative expenses | 1,702 | 1,501 | 216 | (15 | )3 | |||||||||||
Research and development expenses | 650 | 650 | - | - | ||||||||||||
Interest expense of Financial Products | 488 | - | 492 | (4 | )4 | |||||||||||
Other operating expenses | 492 | 28 | 479 | (15 | )3 | |||||||||||
Total operating costs | 17,300 | 16,147 | 1,187 | (34 | ) | |||||||||||
Operating profit | 2,697 | 2,552 | 327 | (182 | ) | |||||||||||
Interest expense excluding Financial Products | 134 | 138 | - | (4 | )4 | |||||||||||
Other income (expense) | 93 | (131 | ) | 46 | 178 | 5 | ||||||||||
Consolidated profit before taxes | 2,656 | 2,283 | 373 | - | ||||||||||||
Provision for income taxes | 819 | 693 | 126 | - | ||||||||||||
Profit of consolidated companies | 1,837 | 1,590 | 247 | - | ||||||||||||
Equity in profit (loss) of unconsolidated affiliated companies | 49 | 48 | 1 | - | ||||||||||||
Equity in profit of Financial Products' subsidiaries | - | 248 | - | (248 | )6 | |||||||||||
Profit | $ | 1,886 | $ | 1,886 | $ | 248 | $ | (248 | ) | |||||||
1 Represents Caterpillar Inc. and its subsidiaries with Financial Products accounted for on the equity basis. | ||||||||||||||||
2 Elimination of Financial Products revenues earned from Machinery and Engines. | ||||||||||||||||
3 Elimination of net expenses recorded by Machinery and Engines paid to Financial Products. | ||||||||||||||||
4 Elimination of interest expense recorded between Financial Products and Machinery and Engines. | ||||||||||||||||
5 Elimination of discount recorded by Machinery and Engines on receivables sold to Financial Products and of interest earned between Machinery and Engines and Financial Products. | ||||||||||||||||
6 Elimination of Financial Products profit due to equity method of accounting. | ||||||||||||||||
Page 29
Caterpillar Inc. Supplemental Data for Results of Operations For The Six Months Ended June 30, 2005 (Unaudited) (Millions of dollars) | ||||||||||||||||
Supplemental Consolidating Data | ||||||||||||||||
Consolidated | Machinery and Engines 1 | Financial Products | Consolidating Adjustments | |||||||||||||
Sales and revenues: | ||||||||||||||||
Sales of Machinery and Engines | $ | 16,573 | $ | 16,573 | $ | - | $ | - | ||||||||
Revenues of Financial Products | 1,126 | - | 1,268 | (142 | )2 | |||||||||||
Total sales and revenues | 17,699 | 16,573 | 1,268 | (142 | ) | |||||||||||
Operating costs: | ||||||||||||||||
Cost of goods sold | 13,105 | 13,105 | - | - | ||||||||||||
Selling, general and administrative expenses | 1,533 | 1,337 | 218 | (22 | )3 | |||||||||||
Research and development expenses | 509 | 509 | - | - | ||||||||||||
Interest expense of Financial Products | 354 | - | 362 | (8 | )4 | |||||||||||
Other operating expenses | 421 | 2 | 422 | (3 | )3 | |||||||||||
Total operating costs | 15,922 | 14,953 | 1,002 | (33 | ) | |||||||||||
Operating profit | 1,777 | 1,620 | 266 | (109 | ) | |||||||||||
Interest expense excluding Financial Products | 130 | 133 | - | (3 | )4 | |||||||||||
Other income (expense) | 198 | 75 | 17 | 106 | 5 | |||||||||||
Consolidated profit before taxes | 1,845 | 1,562 | 283 | - | ||||||||||||
Provision for income taxes | 547 | 448 | 99 | - | ||||||||||||
Profit of consolidated companies | 1,298 | 1,114 | 184 | - | ||||||||||||
Equity in profit (loss) of unconsolidated affiliated companies | 43 | 38 | 5 | - | ||||||||||||
Equity in profit of Financial Products' subsidiaries | - | 189 | - | (189 | )6 | |||||||||||
Profit | $ | 1,341 | $ | 1,341 | $ | 189 | $ | (189 | ) | |||||||
1 Represents Caterpillar Inc. and its subsidiaries with Financial Products accounted for on the equity basis. | ||||||||||||||||
2 Elimination of Financial Products revenues earned from Machinery and Engines. | ||||||||||||||||
3 Elimination of net expenses recorded by Machinery and Engines paid to Financial Products. | ||||||||||||||||
4 Elimination of interest expense recorded between Financial Products and Machinery and Engines. | ||||||||||||||||
5 Elimination of discount recorded by Machinery and Engines on receivables sold to Financial Products and of interest earned between Machinery and Engines and Financial Products. | ||||||||||||||||
6 Elimination of Financial Products profit due to equity method of accounting. | ||||||||||||||||
Page 30
Caterpillar Inc. Supplemental Data for Cash Flow For The Six Months Ended June 30, 2006 | |||||||||||||||||
(Unaudited) (Millions of dollars) | |||||||||||||||||
Supplemental Consolidating Data | |||||||||||||||||
Consolidated | Machinery and Engines1 | Financial Products | Consolidating Adjustments | ||||||||||||||
Cash flow from operating activities: | |||||||||||||||||
Profit | $ | 1,886 | $ | 1,886 | $ | 248 | $ | (248 | )2 | ||||||||
| Adjustments for non-cash items: | |||||||||||||||||
Depreciation and amortization | 802 | 470 | 332 | - | |||||||||||||
Undistributed profit of Financial Products | - | (248 | ) | - | 248 | 3 | |||||||||||
Other | 94 | 90 | (186 | ) | 190 | 4 | |||||||||||
| Changes in assets and liabilities: | |||||||||||||||||
Receivables - trade and other | (762 | ) | (53 | ) | 7 | (716 | )4/5 | ||||||||||
Inventories | (755 | ) | (755 | ) | - | - | |||||||||||
Accounts payable and accrued expenses | 356 | 271 | 72 | 13 | 4 | ||||||||||||
Other assets - net | 23 | 9 | (5 | ) | 19 | 4 | |||||||||||
Other liabilities - net | 304 | 300 | 31 | (27 | )4 | ||||||||||||
Net cash provided by (used for) operating activities | 1,948 | 1,970 | 499 | (521 | ) | ||||||||||||
Cash flow from investing activities: | |||||||||||||||||
Capital expenditures - excluding equipment leased to others | (552 | ) | (536 | ) | (27 | ) | 11 | 4 | |||||||||
Expenditures for equipment leased to others | (532 | ) | - | (548 | ) | 16 | 4 | ||||||||||
Proceeds from disposals of property, plant and equipment | 319 | 20 | 310 | (11 | )4 | ||||||||||||
Additions to finance receivables | (5,114 | ) | - | (18,013 | ) | 12,899 | 5 | ||||||||||
Collections of finance receivables | 4,079 | - | 15,969 | (11,890 | )5 | ||||||||||||
Proceeds from the sale of finance receivables | 980 | - | 1,484 | (504 | )5 | ||||||||||||
Net intercompany borrowings | - | 36 | (383 | ) | 347 | 6 | |||||||||||
Investments and acquisitions (net of cash acquired) | (419 | ) | (419 | ) | - | - | |||||||||||
Proceeds from sale of available-for-sale securities | 219 | 13 | 206 | - | |||||||||||||
Investments in available-for-sale securities | (296 | ) | (30 | ) | (266 | ) | - | ||||||||||
Other - net | 167 | 13 | 166 | (12 | )7 | ||||||||||||
Net cash provided by (used for) investing activities | (1,149 | ) | (903 | ) | (1,102 | ) | 856 | ||||||||||
Cash flow from financing activities: | |||||||||||||||||
Dividends paid | (335 | ) | (335 | ) | - | - | |||||||||||
| Common stock issued, including treasury shares reissued | 349 | 349 | (12 | ) | 12 | 7 | |||||||||||
Treasury shares purchased | (2,411 | ) | (2,411 | ) | - | - | |||||||||||
Excess tax benefit from stock-based compensation | 120 | 120 | - | - | |||||||||||||
Net intercompany borrowings | - | 383 | (36 | ) | (347 | )6 | |||||||||||
Proceeds from debt issued (original maturities greater than three months) | 5,033 | 102 | 4,931 | - | |||||||||||||
Payments on debt (original maturities greater than three months) | (5,595 | ) | (501 | ) | (5,094 | ) | - | ||||||||||
Short-term borrowings (original maturities three months or less)--net | 1,564 | 721 | 843 | - | |||||||||||||
Net cash provided by (used for) financing activities | (1,275 | ) | (1,572 | ) | 632 | (335 | ) | ||||||||||
Effect of exchange rate changes on cash | 16 | 9 | 7 | - | |||||||||||||
Increase (decrease) in cash and short-term investments | (460 | ) | (496 | ) | 36 | - | |||||||||||
Cash and short-term investments at beginning of period | 1,108 | 951 | 157 | - | |||||||||||||
Cash and short-term investments at end of period | $ | 648 | $ | 455 | $ | 193 | $ | - | |||||||||
1 Represents Caterpillar Inc. and its subsidiaries with Financial Products accounted for on the equity basis. | |||||||||||||||||
2 Elimination of Financial Products profit after tax due to equity method of accounting. | |||||||||||||||||
3 Non-cash adjustment for the undistributed earnings from Financial Products. | |||||||||||||||||
4 Elimination of non-cash adjustments and changes in assets and liabilities related to consolidated reporting. | |||||||||||||||||
5 Reclassification of Cat Financial’s cash flow activity from investing to operating for receivables that arose from the sale of inventory. | |||||||||||||||||
6 Net proceeds and payments to/from Machinery and Engines and Financial Products. | |||||||||||||||||
7 Change in investment and common stock related to Financial Products. | |||||||||||||||||
Page 31
Caterpillar Inc. Supplemental Data for Cash Flow For The Six Months Ended June 30, 2005 | ||||||||||||||||||
(Unaudited) (Millions of dollars) | ||||||||||||||||||
Supplemental Consolidating Data | ||||||||||||||||||
Consolidated | Machinery and Engines1 | Financial Products | Consolidating Adjustments | |||||||||||||||
Cash flow from operating activities: | ||||||||||||||||||
Profit | $ | 1,341 | $ | 1,341 | $ | 189 | $ | (189 | )2 | |||||||||
| Adjustments for non-cash items: | ||||||||||||||||||
Depreciation and amortization | 744 | 426 | 318 | - | ||||||||||||||
Undistributed profit of Financial Products | - | (189 | ) | - | 189 | 3 | ||||||||||||
Other | (113 | ) | (129 | ) | (94 | ) | 110 | 4 | ||||||||||
| Changes in assets and liabilities: | ||||||||||||||||||
Receivables - trade and other | (742 | ) | (256 | ) | 19 | (505 | )4/5 | |||||||||||
Inventories | (674 | ) | (674 | ) | - | - | ||||||||||||
Accounts payable and accrued expenses | 236 | 118 | 131 | (13 | )4 | |||||||||||||
Other assets - net | (24 | ) | (46 | ) | (4 | ) | 26 | 4 | ||||||||||
Other liabilities - net | 228 | 262 | (3 | ) | (31 | )4 | ||||||||||||
Net cash provided by (used for) operating activities | 996 | 853 | 556 | (413 | ) | |||||||||||||
Cash flow from investing activities: | ||||||||||||||||||
Capital expenditures - excluding equipment leased to others | (402 | ) | (385 | ) | (17 | ) | - | |||||||||||
Expenditures for equipment leased to others | (608 | ) | - | (608 | ) | - | ||||||||||||
| Proceeds from disposals of property, plant and equipment | 304 | 18 | 286 | - | ||||||||||||||
Additions to finance receivables | (5,159 | ) | - | (16,035 | ) | 10,876 | 5 | |||||||||||
Collections of finance receivables | 3,444 | - | 13,894 | (10,450 | )5 | |||||||||||||
Proceeds from the sale of finance receivables | 859 | - | 859 | - | ||||||||||||||
Net intercompany borrowings | - | (67 | ) | (9 | ) | 76 | 6 | |||||||||||
Investments and acquisitions (net of cash acquired) | (8 | ) | (8 | ) | - | - | ||||||||||||
Proceeds from sale of available-for-sale securities | 182 | 8 | 174 | - | ||||||||||||||
Investments in available-for-sale securities | (239 | ) | (9 | ) | (230 | ) | - | |||||||||||
Other - net | 108 | 14 | 94 | - | ||||||||||||||
Net cash provided by (used for) investing activities | (1,519 | ) | (429 | ) | (1,592 | ) | 502 | |||||||||||
Cash flow from financing activities: | ||||||||||||||||||
| Dividends paid | (280 | ) | (280 | ) | - | - | ||||||||||||
Common stock issued, including treasury shares reissued | 278 | 278 | - | - | ||||||||||||||
Treasury shares purchased | (839 | ) | (839 | ) | - | - | ||||||||||||
Net intercompany borrowings | - | 9 | 67 | (76 | )6 | |||||||||||||
Proceeds from debt issued (original maturities greater than three months) | 6,318 | 147 | 6,171 | - | ||||||||||||||
Payments on debt (original maturities greater than three months) | (4,197 | ) | (51 | ) | (4,146 | ) | - | |||||||||||
Short-term borrowings (original maturities three months or less)--net | (467 | ) | 483 | (950 | ) | - | ||||||||||||
Net cash provided by (used for) financing activities | 813 | (253 | ) | 1,142 | (76 | ) | ||||||||||||
Effect of exchange rate changes on cash | 14 | 23 | 4 | (13 | )7 | |||||||||||||
Increase (Decrease) in cash and short-term investments | 304 | 194 | 110 | - | ||||||||||||||
Cash and short-term investments at beginning of period | 445 | 270 | 175 | - | ||||||||||||||
Cash and short-term investments at end of period | $ | 749 | $ | 464 | $ | 285 | $ | - | ||||||||||
1 Represents Caterpillar Inc. and its subsidiaries with Financial Products accounted for on the equity basis. | ||||||||||||||||||
2 Elimination of Financial Products profit after tax due to equity method of accounting. | ||||||||||||||||||
3 Non-cash adjustment for the undistributed earnings from Financial Products. | ||||||||||||||||||
4 Elimination of non-cash adjustments and changes in assets and liabilities related to consolidated reporting. | ||||||||||||||||||
5 Reclassification of Cat Financial’s cash flow activity from investing to operating for receivables that arose from the sale of inventory. | ||||||||||||||||||
6 Net proceeds and payments to/from Machinery and Engines and Financial Products. | ||||||||||||||||||
7 Elimination of the effect of exchange on intercompany balances. | ||||||||||||||||||
Page 32
Safe Harbor Statement under the Securities Litigation Reform Act of 1995
Certain statements contained in our second-quarter 2006 results release and related results conference call transcript are forward-looking and involve uncertainties that could significantly impact results. The words "believes", "expects", "estimates", "anticipates", "will be", "should" and similar words or expressions identify forward-looking statements made on behalf of Caterpillar. Uncertainties include factors that affect international businesses, as well as matters specific to the company and the markets it serves.
World Economic Factors
Our projection for over 3.5 percent growth in the world economy in 2006 assumes central banks will cautiously raise interest rates so as not to slow growth too much. Low interest rates, good economic growth and favorable commodity prices should encourage further growth in both construction and mining. Factors that could reduce expected growth in Machinery and Engines sales include high interest rates, reductions in crude oil availability, lower commodity prices and declines in home prices.
We expect the U.S. Federal Reserve will raise the Federal Funds rate to 5.5 percent this year, causing economic growth later in the year to slow below its potential. However, good corporate profits, lower interest rates than in the past cycle and a need to replace aged capital stocks should support continued good growth in investment. Should financial conditions tighten sufficiently to slow economic growth below three percent, corporate profits weaken or housing starts decline more than expected, expected improvements in Machinery and Engines sales likely would be lower than projected.
Our projection of increased sales of Machinery and Engines in Europe, Africa, Middle East (EAME) in 2006 assumes the economic recovery that has started in Europe strengthens further, maintaining good growth in housing and accelerating a recovery in nonresidential construction. The European Central Bank has already raised interest rates and more increases are likely. Our forecast assumes those rate increases do not undermine either the economic recovery or growth in Machinery and Engines sales. In both Africa and Middle East (AME) and the Commonwealth of Independent States (CIS), good economic growth and high commodity prices should support growth in construction and mining. Key risks are worsening turmoil in the Middle East and a worldwide collapse in commodity prices. Those developments would likely negatively impact our results.
We expect that low interest rates, increased capital inflows, and favorable commodity prices will maintain Latin American economic growth at over four percent, benefiting both Machinery and Engines sales. Good growth underway in both construction and mining is expected to continue. This forecast is vulnerable to a significant weakening in commodity prices, widespread increases in interest rates, lower inflows of foreign investment or political disruptions.
In Asia/Pacific, we project economic growth will be over 7 percent in 2006, the result of low interest rates, competitive exchange rates and growing world trade. Fast economic growth and increased property prices should support construction and favorable coal and metals prices should encourage increased mining investment. The projected increase in Machinery and Engines sales is vulnerable to reduced demand for coal and iron ore, significant revaluations of regional currencies, restrictions on regional exports and sharp interest rate hikes.
Commodity Prices
Commodities represent a significant sales opportunity, with prices and production as key drivers. Prices have improved sharply over the past four years and our outlook assumes that continued growth in world industrial production, low inventories and some difficulties in increasing production will cause metals prices to remain high enough in 2006 to encourage further mine investment. Any unexpected weakening in world industrial production, however, could cause prices to drop sharply to the detriment of our results.
Page 33
International coal prices recovered from some weakness in late 2005 but prices in the United States softened in the second quarter. We expect that the need to rebuild some coal stocks as well as increased electricity generation will support demand for coal in 2006 and prices will remain favorable for new investment. The outlook for continued growth in coal mining is vulnerable to mine permitting problems, transportation difficulties, weak utility demand and steep declines in oil and natural gas prices.
Oil and natural gas prices increased sharply over the past four years due to strong demand and high capacity usage. Higher energy prices have not halted economic recoveries since strong demand boosted prices and world production increased. High prices are encouraging more exploration and development. However, should significant supply cuts occur, such as from OPEC production cuts or political unrest in a major producing country, the resulting oil shortages and price spikes could slow economies, potentially with a depressing impact on our sales.
Monetary and Fiscal Policies
For most companies operating in a global economy, monetary and fiscal policies implemented in the United States and abroad could have a significant impact on economic growth, and accordingly, demand for our product. In general, higher than expected interest rates, reductions in government spending, higher taxes, excessive currency movements and uncertainty over key policies are some factors likely to lead to slower economic growth and lower industry demand.
With economic data looking more favorable, central banks in several developed countries have raised interest rates from the lowest rates in decades, with the U. S. Federal Reserve Bank being the most aggressive. Our outlook assumes that central banks will try to avoid increasing rates so much that economic recoveries stall. Should central banks raise interest rates more aggressively than anticipated or underestimate the impact of rate increases on economies, both economic growth and our sales could suffer.
Budget deficits in many countries remain higher than governments would like. Our outlook assumes that governments will not aggressively raise taxes and slash spending to deal with their budget imbalances. Such actions could disrupt growth and negatively affect our sales.
Political Factors
Political factors in the United States and abroad can impact global companies. Our outlook assumes that no major disruptive changes in economic policies occur in either the United States or other major economies. Significant changes in either taxing or spending policies could reduce activities in sectors important to our businesses, thereby reducing sales.
Our outlook assumes that there will be no widespread military conflicts in either North Korea or the Middle East in the forecast period. Such military conflicts could severely disrupt sales into countries affected, as well as nearby countries.
Our outlook also assumes that there will be no major terrorist attacks. If there is a major terrorist attack, confidence could be undermined, potentially causing a sharp drop in economic activities and our sales. Attacks in major developed economies would be the most disruptive.
Our outlook assumes that efforts by countries to increase their exports will not result in retaliatory countermeasures by other countries to block such exports, particularly in the Asia/Pacific region. Our outlook includes a negative impact from the phase-out of the Extraterritorial Income Exclusion as enacted by the American Jobs Creation Act of 2004. Our outlook assumes any other tax law changes will not negatively impact our provision for income taxes.
Currency Fluctuations
The company has costs and revenues in many currencies and is therefore exposed to risks arising from currency fluctuations. Our outlook assumes no significant currency crises occur that could disrupt international trade or the competitiveness of our facilities. Should any crisis develop, economic activity and our results could be negatively impacted.
The company's largest manufacturing presence is in the United States, so any unexpected strengthening of the dollar tends to raise the foreign currency costs to our end users and reduce our global competitiveness.
Page 34
Dealer/Original Equipment Manufacturers Inventory Practices
The company sells finished products through an independent dealer network or directly to Original Equipment Manufacturers (OEM). Both carry inventories of finished products as part of ongoing operations and adjust those inventories based on their assessments of future needs. Such adjustments can impact our results either positively or negatively. The current outlook assumes no major changes in either dealer or OEM inventory practices. Should dealers or OEMs decide to control inventories more tightly, our sales would be lower.
Financial Products Division Factors
Inherent in the operation of Cat Financial is the credit risk associated with its customers. The creditworthiness of each customer, and the rate of delinquencies, repossessions and net losses on customer obligations are directly impacted by several factors, including, but not limited to, relevant industry and economic conditions, the availability of capital, the experience and expertise of the customer's management team, commodity prices, political events and the sustained value of the underlying collateral. Additionally, interest rate movements create a degree of risk to our operations by affecting the amount of interest expense associated with our debt portfolio. Our "match funding" policy addresses interest rate risk by aligning the interest rate profile (fixed or floating rate) of our debt portfolio with the interest rate profile of our receivables portfolio (loans and leases with customers and dealers) within pre-determined ranges on an ongoing basis. To achieve our match funding objectives, we issue debt with a similar interest rate profile to our receivables and also use interest rate swap agreements to manage our interest rate risk exposure to interest rate changes and in some cases to lower our cost of borrowed funds. If interest rates move upward more sharply than anticipated, our financial results could be negatively impacted. Cat Financial's results are also dependent upon the demand for Caterpillar machinery and engines; our marketing, operational and administrative support; and competition from other finance companies. With respect to our insurance and investment management operations, changes in the equity and bond markets could cause an impairment of the value of our investment portfolio, thus requiring a negative adjustment to earnings.
Other Factors
The rates of infrastructure spending, housing starts, commercial construction and mining play a significant role in the company's results. Our products are an integral component of these activities and as these activities increase or decrease in the United States or abroad, demand for our products may be significantly impacted.
Projected cost savings or synergies from alliances with new partners could also be negatively impacted by a variety of factors. These factors could include, among other things, higher than expected wages, energy and/or material costs, and/or higher than expected financing costs due to unforeseen changes in tax, trade, environmental, labor, safety, payroll or pension policies in any of the jurisdictions in which the alliances conduct their operations.
Results may be impacted positively or negatively by changes in the sales mix. Our outlook assumes a certain geographic mix of sales as well as a product mix of sales. If actual results vary from this projected geographic and product mix of sales, our results could be negatively impacted.
The company operates in a highly competitive environment and our outlook depends on a forecast of the company's share of industry sales. An unexpected reduction in that share could result from pricing or product strategies pursued by competitors, unanticipated product or manufacturing difficulties, a failure to price the product competitively or an unexpected buildup in competitors' new machine or dealer owned rental fleets, leading to severe downward pressure on machine rental rates and/or used equipment prices.
The environment remains competitive from a pricing standpoint. Our 2006 sales outlook assumes that the company continues to recognize worldwide machine price actions communicated to dealers with an effective date of January 2006. While we expect that the environment will continue to absorb these price actions, changes in the marketplace acceptance would negatively impact our results. Moreover, additional price discounting to maintain our competitive position could result in lower than anticipated realization.
Page 35
Our sales and results are generally sensitive to changes in economic growth, particularly those originating in construction, mining and energy. Developments reducing such activities also tend to lower our sales. In addition to the factors mentioned above, our sales and results could be negatively impacted by any of the following:
| · | Any sudden drop in consumer or business confidence; |
| · | Delays in legislation needed to fund public construction; |
| · | Regulatory or legislative changes that slow activity in key industries; and/or |
| · | Unexpected collapses in stock markets. |
This discussion of uncertainties is by no means exhaustive, but is designed to highlight important factors that may impact our outlook. Obvious factors such as general economic conditions throughout the world do not warrant further discussion, but are noted to further emphasize the myriad of contingencies that may cause the company's actual results to differ from those currently anticipated.
Page 36