Exhibit 99.1
Caterpillar Inc.
4Q 2007 Earnings Release
January 25, 2008
FOR IMMEDIATE RELEASE
Global Strength Powers Caterpillar to Record Sales and Profit;
Company Reaffirms 2008 Outlook for Another Year of Record Sales and Profit
2008 outlook: sales and revenues up 5 to 10 percent,
profit per share up 5 to 15 percent
PEORIA, Ill.— Caterpillar Inc. (NYSE: CAT) today announced the fifth straight year of record sales and revenues and the fourth consecutive year of record profit. For 2007, sales and revenues were $44.958 billion, up 8 percent, and profit per share was $5.37, up 4 percent from 2006. The company also reported record fourth-quarter sales and revenues of $12.144 billion, 10 percent higher than the fourth quarter of 2006, and profit per share of $1.50, up 14 percent from a year ago.
“Our broad global footprint has enabled us to benefit from strong economic growth outside the United States, as global markets for mining, energy and infrastructure development are booming,” said Chairman and Chief Executive Officer Jim Owens. “I’m very pleased with our overall 8 percent growth in sales and revenues in a year when end markets in the United States were so weak. When you consider that North American dealers took machine inventories down $1.1 billion in 2007, our sales story is even more impressive.”
For the year, sales and revenues increased $3.441 billion—$1.271 billion from higher sales volume including $775 million from the acquisition of Progress Rail, $932 million from improved price realization, $890 million from the effects of currency and $348 million from higher Financial Products revenues. 2007 profit reflected price realization and higher sales volume offset by higher core operating costs. Machinery and Engines operating cash flow of $5.446 billion was up 18 percent from 2006 and was an all time record. As a result of record Machinery and Engines operating cash flows over the past three years, our financial position remained very strong with a year-end debt-to-capital ratio for Machinery and Engines of 31.2 percent.
For the fourth quarter, sales and revenues increased $1.141 billion—$392 million from improved price realization, $334 million from the effects of currency, $306 million from higher sales volume and $109 million from higher Financial Products revenues. Fourth-quarter profit increased $93 million. The increase was due to improved price realization and higher volume, partially offset by higher core operating costs.
Page 1
Outlook
In 2008, the company expects another record year with sales and revenues increasing 5 to 10 percent and profit per share increasing 5 to 15 percent from 2007.
“It’s gratifying to be able to maintain an outlook for 2008 that reflects continued growth and all-time records for sales and revenues and profit at a time when we’re expecting recessionary conditions to persist in key markets we serve in the United States. We’re starting 2008 with a very strong order backlog, particularly for larger products like industrial gas turbines, large reciprocating engines and mining trucks,” Owens commented. “While we expect anemic growth in the U.S. economy, we continue to see positive conditions for our sales in most of the rest of the world.
“In 2008, we’ll be stepping up Research and Development (R&D) for new products and capital investment to increase capacity around the world. We expect the world’s robust investment in infrastructure to continue well into the next decade, and we’ll need more capacity to serve our customers. Our internal focus will be on continuing our global deployment of the Caterpillar Production System (CPS) with 6 Sigma. While we’ll face challenges in 2008, I’m confident Team Caterpillar will continue to drive us toward our 2010 goals.”
Note: Glossary of terms included on pages 28-29; first occurrence of terms shown in bold italics.
For more than 80 years, Caterpillar Inc. has been making progress possible and driving positive and sustainable change on every continent. With 2007 sales and revenues of $44.958 billion, Caterpillar is the world’s leading manufacturer of construction and mining equipment, diesel and natural gas engines and industrial gas turbines. The company also is a leading services provider through Caterpillar Financial Services, Caterpillar Remanufacturing Services, Caterpillar Logistics Services and Progress Rail Services. More information is available at: http://www.cat.com.
Caterpillar contact: Jim Dugan, Corporate Public Affairs, (309) 494-4100 (Office) or (309) 360-7311 (Mobile)
SAFE HARBOR
Certain statements in this release relate to future events and expectations and as such constitute forward-looking statements involving known and unknown factors that may cause actual results of Caterpillar Inc. to be different from those expressed or implied in the forward-looking statements. In this context, words such as "will,” "expect,” “anticipate” or other similar words and phrases often identify forward-looking statements made on behalf of Caterpillar. It is important to note that actual results of the company may differ materially from those described or implied in such forward-looking statements based on a number of factors and uncertainties, including, but not limited to, changes in economic conditions; currency exchange or interest rates; political stability; market acceptance of the company's products and services; significant changes in the competitive environment; epidemic diseases; changes in law, regulations and tax rates; and other general economic, business and financing conditions and factors described in more detail in the company's Form 10-K filed with the Securities and Exchange Commission on February 23, 2007. This filing is available on our website at www.cat.com/sec_filings. We do not undertake to update our forward-looking statements.
Page 2
Key Points
Fourth Quarter 2007
| § | Fourth-quarter sales and revenues of $12.144 billion were 10 percent higher than fourth quarter of 2006. |
| § | Driven by the continued strength outside North America, Machinery sales increased 13 percent, Engines sales increased 5 percent and Financial Products revenues rose 16 percent from a year ago. |
| § | Profit was $975 million, or $1.50 per share—14 percent higher than the fourth quarter of 2006. |
Full Year 2007 (Dollars in millions except per share data) | |||||||||||||||
2006 | 2007 | $ Change | % Change | ||||||||||||
| Machinery and Engines Sales | $ | 38,869 | $ | 41,962 | $ | 3,093 | 8 | % | |||||||
| Financial Products Revenues | 2,648 | 2,996 | 348 | 13 | % | ||||||||||
| Total Sales and Revenues | 41,517 | 44,958 | 3,441 | 8 | % | ||||||||||
Profit After Tax | $ | 3,537 | $ | 3,541 | $ | 4 | - | ||||||||
| Profit per common share - diluted | $ | 5.17 | $ | 5.37 | $ | 0.20 | 4 | % | |||||||
Machinery and Engines sales improved $3.093 billion despite the impact of the severe drop in demand for on-highway truck engines and weakness in North American construction sales. The strength of economies outside the United States, our broad global footprint and growth in integrated service businesses contributed to an 8 percent growth in sales. The diversity and strength of our full range of engine products more than offset the impact of the severe decline in on-highway truck engines.
Profit per share improved 4 percent as a result of stock repurchases in 2007 and the increase in profit.
Machinery and Engines operating cash flow of $5.446 billion was the highest in company history, up $833 million from 2006. This strong cash flow allowed us to increase capital expenditures, make strategic acquisitions, increase the quarterly dividend by 20 percent and aggressively repurchase shares.
2008 Outlook (Dollars in billions except per share data) | |||||||||||
2006 | 2007 | 2008 Outlook | |||||||||
| Sales and Revenues | $ | 41.5 | $ | 45.0 | Up 5 – 10 % | ||||||
| Profit per common share - diluted | $ | 5.17 | $ | 5.37 | Up 5 – 15 % | ||||||
| § | We are maintaining our 2008 outlook of sales and revenues up 5 to 10 percent and profit per share up 5 to 15 percent, as compared to 2007. |
| § | We are forecasting 2008 to be the sixth consecutive year of record sales and revenues driven by strength in the economies outside North America, strong worldwide engine demand and a slight rebound in on-highway truck engine sales. These factors will more than offset continued weakness in the North American machinery market. |
| § | We expect 2008 to be the fifth consecutive year of record profit per share, a reflection of our broad global footprint and diverse products and services. |
A question and answer section has been included in this release starting on page 22.
Page 3
DETAILED ANALYSIS
2007 vs. 2006
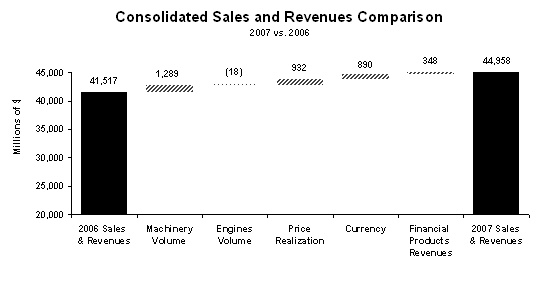 |
| The chart above graphically illustrates reasons for the change in Consolidated Sales and Revenues between 2006 (at left) and 2007 (at right). Items favorably impacting sales and revenues appear as upward stair steps with the corresponding dollar amounts above each bar, while items negatively impacting sales and revenues appear as downward stair steps with dollar amounts reflected in parentheses above each bar. The bar entitled Machinery Volume includes the change in Progress Rail sales. Caterpillar management utilizes these charts internally to visually communicate with the company’s Board of Directors and employees. |
Sales and Revenues
Sales and revenues for 2007 were $44.958 billion, up $3.441 billion, or 8 percent, from 2006. 2007 machinery sales were up 9 percent as strong growth outside North America and a full year of Progress Rail more than offset a weak U.S. construction market. Machinery volume was up $1.289 billion. Excluding Progress Rail, machinery volume was up $514 million. Although sales volume increased moderately, the geographic shift in sales was significant. North American machinery sales were down 11 percent; machinery sales outside of North America were up 33 percent.
Engines sales increased 6 percent despite the 59 percent decline in North American on-highway truck engines. Sales volume was down slightly as growth in engines sales to industries like oil and gas, electric power, industrial and marine nearly offset the volume decline in on-highway truck engines.
In addition, price realization was more than 2 percent despite an unfavorable geographic mix. Currency had a positive impact on sales of $890 million driven primarily by the stronger euro. Financial Products revenues were up 13 percent.
Page 4
Sales and Revenues by Geographic Region | ||||||||||||||||||||||||
(Millions of dollars) | Total | % Change | North America | % Change | EAME | % Change | Latin America | % Change | Asia/ Pacific | % Change | ||||||||||||||
2006 | ||||||||||||||||||||||||
| Machinery | $ | 26,062 | $ | 14,215 | $ | 6,223 | $ | 2,544 | $ | 3,080 | ||||||||||||||
Engines1 | 12,807 | 5,940 | 4,064 | 1,102 | 1,701 | |||||||||||||||||||
Financial Products2 | 2,648 | 1,852 | 377 | 195 | 224 | |||||||||||||||||||
| $ | 41,517 | $ | 22,007 | $ | 10,664 | $ | 3,841 | $ | 5,005 | |||||||||||||||
2007 | ||||||||||||||||||||||||
| Machinery | $ | 28,359 | 9% | 12,596 | (11%) | 8,588 | 38% | 3,149 | 24% | 4,026 | 31% | |||||||||||||
Engines1 | 13,603 | 6% | 5,092 | (14%) | 5,245 | 29% | 1,130 | 3% | 2,136 | 26% | ||||||||||||||
Financial Products2 | 2,996 | 13% | 2,007 | 8% | 479 | 27% | 270 | 38% | 240 | 7% | ||||||||||||||
| $ | 44,958 | 8% | 19,695 | (11%) | 14,312 | 34% | 4,549 | 18% | 6,402 | 28% | ||||||||||||||
1Does not include internal engines transfers of $2.549 billion and $2.310 billion in 2007 and 2006, respectively. Internal engines transfers are valued at prices comparable to those for unrelated parties. | ||||||||||||||||||||||||
2Does not include revenues earned from Machinery and Engines of $400 million and $466 million in 2007 and 2006, respectively. | ||||||||||||||||||||||||
Machinery Sales
Sales of $28.359 billion were an increase of $2.297 billion, or 9 percent, from 2006.
| § | Excluding Progress Rail, machinery volume increased $514 million. Sales volume decreased in North America but increased in all other regions. |
| § | Price realization increased $410 million. |
| § | Currency benefited sales by $598 million. |
| § | Geographic mix between regions (included in price realization) was $182 million unfavorable. |
| § | The acquisition of Progress Rail added $775 million. |
| § | North American dealers reduced reported inventories substantially in 2007, taking them well below a year earlier in months of supply. Inventories in months of supply declined in most other regions as well. |
| § | Economic factors, primarily in the United States, contributed to lower sales volume in North America. These factors included the collapse in housing construction, weakness in nonresidential construction contracts in the last half of 2007 and a decline in quarry and aggregate production. |
| § | Sales volume increased in the rest of the world, offsetting weakness in North America. Positives included relatively low interest rates, good economic growth and continued growth in construction. |
| § | Metals mining was positive in many countries throughout the world. Metals prices increased, and mining companies increased exploration spending by more than 40 percent. |
| § | Oil prices increased about 10 percent, and natural gas prices increased 4 percent. Production and drilling increased in many regions, and pipeline construction increased. |
| § | Transportation problems, particularly in Australia, contributed to a significant increase in international coal prices. The impact on sales volume varied—negative for Australia and the United States but positive elsewhere. |
Page 5
North America– Sales decreased $1,619 million, or 11 percent.
| § | Sales volume excluding Progress Rail decreased $2,540 million. |
| § | Price realization increased $146 million. |
| § | Progress Rail increased sales $775 million. |
| § | Dealers reduced their reported inventories by about $1.1 billion in 2007 compared to a $300 million increase in 2006. Dealer inventories at the end of the year were well below a year earlier in both dollars and months of supply. |
| § | An unfavorable economic environment caused output to decline in many key industries in the United States, prompting users to curtail fleet expansions. In addition, dealers added fewer units to their rental fleets and let existing fleets age. |
| § | Output prices for some industries, such as housing and coal mining, softened. Reduced profitability and tighter credit likely caused some users to delay replacement purchases. |
| § | The housing industry weakened throughout the year, with starts down 26 percent in 2007. Tighter lending standards, a large number of unsold homes and a sharp drop in home sales caused builders to reduce construction. |
| § | Nonresidential construction spending increased 18 percent, however, contracts awarded for new construction declined about 2 percent. Employment in nonresidential construction also weakened in the last half of the year. Factors that contributed to this weakening included tighter standards for commercial and industrial loans, higher corporate bond spreads and a decline in business cash flows. |
| § | Spot coal prices declined leading to a 3 percent decline in coal production. Electric utilities reduced coal usage, and stockpiles increased. More positively, coal exports rebounded more than 15 percent as a result of U.S. prices falling well below international prices. |
| § | Metals mining, oil sands and pipeline construction remained positive. Average metals prices increased more than 40 percent, and mines in both Canada and the United States increased production. Canada increased crude oil production 7 percent. Shipments of line pipe in the United States increased 14 percent. |
EAME– Sales increased $2,365 million, or 38 percent.
| § | Sales volume increased $1,729 million. |
| § | Price realization increased $202 million. |
| § | Currency benefited sales by $434 million. |
| § | Dealers reported significant increases in demand and increased inventories to support that stronger demand—a positive for sales volume. Dealer inventories in months of supply ended the year slightly higher than a year earlier. |
| § | Sales volume increased in Europe in response to positive economic growth and large gains in both nonresidential building and infrastructure construction. These sectors benefited from increased business profits, a 13 percent increase in business borrowing and higher government capital expenditures. However, housing permits declined 8 percent due to higher lending rates for home purchases and some moderation in home prices. |
| § | Africa/Middle East turned in another year of very positive volume growth. Interest rates changed little over the past year, and most stock markets boomed. Exports increased significantly, allowing the region to increase its foreign exchange holdings 22 percent. Higher oil prices encouraged increased drilling in both Africa and the Middle East, and both Turkey and South Africa experienced more than 10 percent growth in construction. |
| § | Sales volume in the Commonwealth of Independent States (CIS) increased rapidly for the seventh consecutive year, with large gains occurring in Russia, Ukraine and Kazakhstan. All three governments increased spending more than 20 percent, and monetary policies were extremely expansive. Regional oil production increased more than 4 percent, and Russia increased construction 23 percent. |
Page 6
Latin America– Sales increased $605 million, or 24 percent.
| § | Sales volume increased $466 million. |
| § | Price realization increased $87 million. |
| § | Currency benefited sales by $52 million. |
| § | Dealers reported much higher demand and built inventory to support that demand. Reported inventories increased in dollars but declined in months of supply. |
| § | Sales volume increased significantly in Brazil, the result of a 200 basis point reduction in interest rates and an improvement in economic growth. Better economic growth contributed to an increase of about 4 percent in construction spending, and higher metals prices led to a 4 percent increase in mine production. |
| § | Most other countries raised interest rates slightly, and economic growth was near 5 percent. As a result, construction increased 9 percent in Chile, 12 percent in both Colombia and Venezuela and 16 percent in Peru. |
| § | Mines increased exploration spending 38 percent in response to higher metals prices and increased production. |
| § | Higher oil prices and declining production caused increased drilling, a positive for sales volume. |
Asia/Pacific– Sales increased $946 million, or 31 percent.
| § | Sales volume increased $677 million. |
| § | Price realization increased $157 million. |
| § | Currency benefited sales by $112 million. |
| § | Dealers reported higher demand for machines and inventories declined. As a result, inventories in months of supply were well below those at the end of 2006. |
| § | Central banks kept interest rates low, and many governments increased spending. These developments produced more than 8 percent economic growth, and stock markets boomed. Construction increased more than 20 percent in China, 11 percent in India and 9 percent in Australia. |
| § | Australian thermal coal spot prices increased 30 percent due to continued strong demand and supply problems. Increased coal production and prices contributed to a substantial sales gain in Indonesia. China increased coal production 12 percent. |
| § | Higher metals prices and a 56 percent increase in mine exploration spending benefited sales volume growth. Mine production increased almost 11 percent in Indonesia, 6 percent in India and 5 percent in Australia. |
Page 7
Engines Sales
Sales of $13.603 billion were an increase of $796 million, or 6 percent, from 2006.
| § | Sales volume decreased $18 million. |
| § | Price realization increased $522 million. |
| § | Currency benefited sales $292 million. |
| § | Geographic mix between regions (included in price realization) was $29 million favorable. |
| § | Dealer reported inventories in dollars were up; months of supply were down as the inventories were supported by strong delivery rates. |
North America– Sales decreased $848 million, or 14 percent.
| § | Sales volume decreased $1.037 billion. |
| § | Price realization increased $189 million. |
| § | Sales for on-highway truck applications declined 59 percent with less than anticipated demand for the 2007 model-year engines. This was due to the reduction in tonnage hauled and freight rates realized by on-highway carriers. This has also been impacted by the transition of several Original Equipment Manufacturers (OEMs) to the 2007 emissions technology engines. |
| § | Sales for petroleum applications increased 39 percent due to strong demand in gas compression and exploration, along with success from gas pipeline and storage construction projects. The increase in turbines and turbine-related services reflects additional customer spending for natural gas pipelines and compression equipment. |
| § | Sales for electric power applications increased 22 percent as demand for large generator sets increased to support data center installations, which offset a slight decline in smaller units. |
EAME – Sales increased $1.181 billion, or 29 percent.
| § | Sales volume increased $756 million. |
| § | Price realization increased $186 million. |
| § | Currency benefited sales by $239 million. |
| § | Sales for electric power applications increased 29 percent, with strong demand for gas units in Russia, expanded scope of project business and growth in power modules. Turbines and turbine-related services increased to support power generation. |
| § | Sales for petroleum applications increased 42 percent based on widespread demand for engines used in drilling and production applications. Turbines and turbine-related services increased to support rising oil production and gas transmission demand. |
| § | Sales for industrial applications increased 20 percent, with widespread demand for agriculture and other types of OEM equipment driven by good economic conditions. |
| § | Sales for marine applications increased 30 percent, with increased demand for workboats, commercial oceangoing vessels and cruise ships. |
Page 8
Latin America – Sales increased $28 million, or 3 percent.
| § | Sales volume decreased $5 million. |
| § | Price realization increased $32 million. |
| § | Currency benefited sales by $1 million. |
| § | Sales for electric power engines increased 35 percent from strong growth across Latin America, driven by high oil and gas prices and investment in infrastructure as energy shortages continued in several key markets. |
| § | Sales into truck applications declined 44 percent with reduced demand. Latin American truck facilities decreased exports of trucks destined for the United States. |
Asia/Pacific– Sales increased $435 million, or 26 percent.
| § | Sales volume increased $297 million. |
| § | Price realization increased $86 million. |
| § | Currency benefited sales by $52 million. |
| § | Sales for petroleum applications increased 34 percent as Chinese drill rig builders continue to manufacture at record levels for domestic and export use. Turbines and turbine-related services increased to support oil production and gas pipeline compression demand. |
| § | Sales for marine applications increased 47 percent, with continued strong demand for workboat and offshore shipbuilding. Large diesel demand grew in the offshore and general cargo applications. |
| § | Sales of electric power engines increased 6 percent due to shipments of larger generator sets into Asia. |
Financial Products Revenues
Revenues of $2.996 billion were an increase of $348 million, or 13 percent, from 2006.
| § | Growth in average earning assets increased revenues $234 million. |
| § | Revenues from earned premiums at Cat Insurance increased $64 million. |
| § | The impact of higher interest rates on new and existing finance receivables added $58 million. |
Page 9
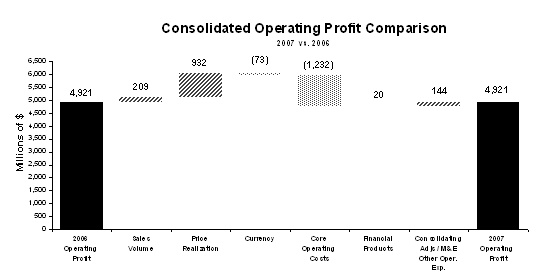 |
The chart above graphically illustrates reasons for the change in Consolidated Operating Profit between 2006 (at left) and 2007 (at right). Items favorably impacting operating profit appear as upward stair steps with the corresponding dollar amounts above each bar, while items negatively impacting operating profit appear as downward stair steps with dollar amounts reflected in parentheses above each bar. Caterpillar management utilizes these charts internally to visually communicate with the company’s Board of Directors and employees. The bar entitled Consolidating Adjustments/M&E Other Operating Expense includes the operating profit impact of Progress Rail. |
Operating Profit
Operating profit in 2007 of $4.921 billion was equal to 2006 as higher price realization and sales volume were offset by higher core operating costs.
Core operating costs rose $1.232 billion from 2006. Of this increase, $1.225 billion was attributable to higher manufacturing costs. The increase in manufacturing costs was primarily due to operating inefficiencies and higher material costs. Operating inefficiencies were the result of supply chain challenges, capacity increases, factory repair and maintenance and a significant decline in on-highway truck engine production. Also, we incurred additional costs for new product introductions and costs to enhance customer-delivered quality. Wage and benefit increases as well as increased warranty and depreciation also contributed to higher manufacturing costs. In 2007, Selling, General and Administrative (SG&A) and R&D expenses were essentially flat with 2006. The impact of higher wage and benefit costs was offset by the absence of approximately $70 million of 2006 expense related to a settlement of various legal disputes with Navistar.
Currency had a $73 million unfavorable impact on operating profit as the benefit to sales was more than offset by the negative impact on costs.
Operating Profit by Principal Line of Business | ||||||||||||||
(Millions of dollars) | 2006 | 2007 | $ Change | % Change | ||||||||||
Machinery1 | $ | 3,027 | $ | 2,758 | $ | (269 | ) | (9 | %) | |||||
Engines1 | 1,630 | 1,826 | 196 | 12 | % | |||||||||
| Financial Products | 670 | 690 | 20 | 3 | % | |||||||||
| Consolidating Adjustments | (406 | ) | (353 | ) | 53 | |||||||||
| Consolidated Operating Profit | $ | 4,921 | $ | 4,921 | $ | - | - | |||||||
1Caterpillar operations are highly integrated; therefore, the company uses a number of allocations to determine lines of business operating profit for Machinery and Engines. | ||||||||||||||
Page 10
Operating Profit by Principal Line of Business
| § | Machinery operating profit of $2.758 billion was down $269 million, or 9 percent, from 2006. Higher core operating costs were partially offset by improved price realization, higher sales volume and the addition of Progress Rail. The geographic mix of sales had an unfavorable impact on price realization. |
| § | Engines operating profit of $1.826 billion was up $196 million, or 12 percent, from 2006. The favorable impacts of improved price realization and positive mix of product were partially offset by higher core operating costs and the unfavorable impacts of currency. Growth in demand for electric power, petroleum, marine and industrial applications more than offset the profit decline related to the drop in demand for on-highway truck engines. |
§ | Financial Products operating profit of $690 million was up $20 million, or 3 percent, from 2006. The increase was primarily attributable to a $42 million impact from improved net yield on average earning assets and a $34 million impact from higher average earning assets, partially offset by a $29 million increase in the provision for credit losses at Cat Financial and a $24 million decrease in operating profit at Cat Insurance due to higher claims experience. |
Other Profit/Loss Items
§ | Other income/expense was income of $320 million compared with income of $214 million in 2006. The change was primarily driven by a $46 million gain on the sale of a security, the favorable impacts of currency and other items that were individually insignificant. |
| § | The provision for income taxes for 2007 reflects an annual tax rate of 30 percent compared to a 29 percent rate in 2006. The increase over 2006 is primarily due to the repeal of Extraterritorial Income Exclusion (ETI) benefits in 2007 partially offset by a more favorable geographic mix of profits from a tax perspective. |
Employment
Caterpillar’s worldwide employment was 101,333 in 2007, up 6,740 from 94,593 in 2006. Of the increase, about 3,400 employees were added via acquisitions, and about 1,800 hourly and 1,500 salaried and management employees were added to support higher volumes, growth and new product introductions.
Page 11
2008 Outlook
Economic Outlook
We expect 2008 economic growth in most of the world outside the United States to be slightly slower than 2007. We expect growth in the United States to remain weak, with recession a definite threat. Recent economic data and Federal Reserve Board comments confirm this growing concern.
Specific economic and industry assumptions include:
U.S. interest rates: The Fed recently indicated that a weakening economy is more of a threat than inflation and that it is prepared to move aggressively on interest rates. We assume the federal funds rate will end the year below 3 percent.
U.S. economic growth: We forecast the economy will grow 1 percent in 2008, slow enough that the National Bureau of Economic Research may eventually decide that a recession occurred. We expect construction will likely remain distressed in 2008. If the Fed continues to cut interest rates as we expect and the U.S. government takes action to stimulate economic growth, 2008 could be the bottom of this U.S. machinery cycle.
U.S. housing: Housing starts should slow from 1.35 million in 2007 to 1.1 million in 2008. We expect continued downward pressure on the industry from a large inventory of unsold homes, tighter lending standards, increased home repossessions and lower home prices.
U.S. nonresidential construction: New contracts awarded should decline more than 4 percent in 2008, continuing a weakness that developed in the last half of 2007. Negatives include tighter lending standards, reduced corporate cash flows, rising vacancy rates and a smaller increase in federal highway funding.
U.S. coal: This sector showed some improvement in fourth quarter 2007, and further recovery should occur in 2008. We expect the recent rebound in coal prices and increased coal exports to drive the turnaround.
European interest rates: Financial markets are unsettled in Europe, and we expect this will prompt the European Central Bank to hold interest rates at 4 percent for the rest of the year and the Bank of England to cut interest rates again to 5.25 percent.
European economic growth: Our forecast is for 2.3 percent growth in 2008, down from 2.7 percent in 2007. Both nonresidential building and infrastructure construction should improve, however housing declined in 2007 and should do so again in 2008.
Developing economies: The robust recoveries in these economies should last throughout 2008. Our forecasts are for 5.5 percent growth in Africa/Middle East, 7 percent in the CIS, 4.5 percent in Latin America and 7.5 percent in Asia/Pacific. Those growth rates are close to those of the past two years and should encourage further growth in construction.
Metals mining: World demand for metals should increase, and inventories remain tight. We expect prices for most metals will remain attractive for new investment.
Oil and Gas: The world’s spare oil production capacity remains low, and oil prices should average higher in 2008. Higher prices should drive increased exploration, drilling, pipeline expenditures and tar sands development, which should benefit both machinery and engine sales.
Electric Power: Rapid growth in oil producing and commodity exporting nations should drive generator set demand. Increased business investment in Europe should benefit demand for standby power.
Marine: Demand should benefit from increased world trade and favorable freight rates. Shipyards are already contracting for 2009 and later berths.
Page 12
Sales and Revenues Outlook
We’re expecting 2008 to be another record year with sales and revenues up 5 to 10 percent from 2007. From a geographic perspective, we expect continued strength outside North America and below average growth in North America.
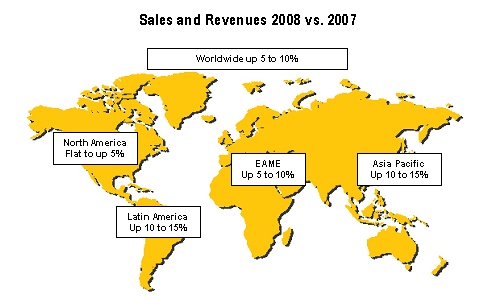
North America is expected to be the weakest region for growth in 2008. A weak U.S. economy in general and the hard-hit housing sector in particular are key negative drivers. However, there are areas where we expect improvement in North America in 2008.
| § | Sales related to energy and metals mining remain strong and are expected to improve again in 2008. |
| § | While sales to U.S. coal mines were depressed in 2007, rising coal prices and increasing exports are driving expected improvements in 2008. |
| § | In 2007, dealers reduced their machine inventories by about $1.1 billion, resulting in company sales to North American dealers lower than dealer sales to end customers. While we expect dealer sales to end users to decline again in 2008, company sales will benefit as a result of substantially lower forecasted changes to dealer inventories than we experienced in 2007. |
| § | While the industry for on-highway truck engines is still very weak as a result of very slow growth in the U.S. economy, we expect our sales to improve from the depressed levels of 2007. |
| § | Canada remains strong, driven by high commodity prices |
Sales are expected to increase in the range of 8 to 13 percent outside North America. Strong rest of world sales are being driven by solid economic growth in most regions, commodity prices for metals, minerals and energy at levels that encourage our customers to invest and continued investment in infrastructure throughout much of the world.
The sales outlook for 2008 includes improved price realization of about 2 percent and about 1.5 percent positive impact related to currency as a result of further weakening of the U.S. dollar.
Page 13
We expect continued growth in Financial Products for 2008. Revenues are expected to increase approximately 8 percent versus 2007, primarily due to higher average earning assets at Cat Financial and increased premiums at Cat Insurance.
Profit Outlook
The 2008 profit outlook is an increase in profit per share in the range of 5 to 15 percent from 2007. Key elements of the change in profit per share include:
| § | Price realization improving about 2 percent |
| § | Higher sales volume, driven by continued growth outside North America |
| § | An overall increase in core operating costs of 2 to 2.5 percent—in line with our estimate of inflation |
| § | Material costs are expected to increase 1 to 1.5 percent—below our estimate of inflation. |
| § | R&D expenses are forecast to increase 15 to 20 percent to support a significant investment in new products for the future, most notably new products to meet Tier IV emissions requirements. |
| § | Period manufacturing, including depreciation expense, will be higher as a result of additional capital installations to support increased production capacity and the replacement of aging equipment. Machinery and Engines capital expenditures are expected to be about $2.3 billion in 2008. |
| § | SG&A expenses are expected to increase as a result of inflation and continued growth, but at a slower rate than sales. |
| § | Variable manufacturing labor and overhead costs are expected to be relatively flat with 2007 as inflationary cost increases should be about offset by modest improvements in operating efficiency driven by our continued implementation of CPS. We expect that deployment of CPS will have a positive impact on costs that will continue to grow over the next few years. |
| § | Currency is expected to have a slightly negative impact on operating profit as the benefit to sales will be offset by the negative impact on costs. |
| § | The tax rate is expected to be about 31.5 percent in 2008, a 1.5 percentage point increase from 2007, due in large part to the expiration of the U.S. research and development tax credit. |
Page 14
DETAILED ANALYSIS
Fourth Quarter 2007 vs. Fourth Quarter 2006
 |
| The chart above graphically illustrates reasons for the change in Consolidated Sales and Revenues between fourth quarter 2006 (at left) and fourth quarter 2007 (at right). Items favorably impacting sales and revenues appear as upward stair steps with the corresponding dollar amounts above each bar, while items negatively impacting sales and revenues appear as downward stair steps with dollar amounts reflected in parentheses above each bar. The bar entitled Machinery Volume includes the change in Progress Rail sales. Caterpillar management utilizes these charts internally to visually communicate with the company’s Board of Directors and employees. |
Sales and Revenues
Sales and revenues for fourth quarter 2007 were $12.144 billion, up $1.141 billion, or 10 percent, from fourth quarter 2006. Weakness in the U.S. construction market and volume declines in the on-highway truck engine market were more than offset by Machinery sales growth outside North America and Engines sales growth in oil and gas, electric power, industrial and marine markets. While sales in North America were down 11 percent, sales outside of North America were up 31 percent.
In addition, price realization contributed $392 million. Currency had a positive impact on sales of $334 million driven primarily by the stronger euro. Financial Products revenues were up 16 percent.
Sales and Revenues by Geographic Region | |||||||||||||||||||||||||||||
(Millions of dollars) | Total | % Change | North America | % Change | EAME | % Change | Latin America | % Change | Asia/ Pacific | % Change | |||||||||||||||||||
Fourth Quarter 2006 | |||||||||||||||||||||||||||||
| Machinery | $ | 6,603 | $ | 3,353 | $ | 1,753 | $ | 645 | $ | 852 | |||||||||||||||||||
Engines1 | 3,725 | 1,650 | 1,193 | 384 | 498 | ||||||||||||||||||||||||
Financial Products2 | 675 | 468 | 97 | 53 | 57 | ||||||||||||||||||||||||
| $ | 11,003 | $ | 5,471 | $ | 3,043 | $ | 1,082 | $ | 1,407 | ||||||||||||||||||||
Fourth Quarter 2007 | |||||||||||||||||||||||||||||
| Machinery | $ | 7,460 | 13 | % | $ | 3,112 | ( 7 | %) | $ | 2,322 | 32 | % | $ | 832 | 29 | % | $ | 1,194 | 40 | % | |||||||||
Engines1 | 3,900 | 5 | % | 1,275 | (23 | %) | 1,617 | 36 | % | 354 | ( 8 | %) | 654 | 31 | % | ||||||||||||||
Financial Products2 | 784 | 16 | % | 494 | 6 | % | 150 | 55 | % | 78 | 47 | % | 62 | 9 | % | ||||||||||||||
| $ | 12,144 | 10 | % | $ | 4,881 | (11 | %) | $ | 4,089 | 34 | % | $ | 1,264 | 17 | % | $ | 1,910 | 36 | % | ||||||||||
1Does not include internal engines transfers of $652 million and $577 million in fourth quarter 2007 and 2006, respectively. Internal engines transfers are valued at prices comparable to those for unrelated parties. | |||||||||||||||||||||||||||||
2Does not include internal revenues earned from Machinery and Engines of $104 million and $124 million in fourth quarter 2007 and 2006, respectively. | |||||||||||||||||||||||||||||
Page 15
Machinery Sales
Sales were $7.460 billion in fourth quarter 2007, an increase of $857 million, or 13 percent, from fourth quarter 2006.
| § | Sales volume increased $429 million. |
| § | Price realization increased $205 million. |
| § | Currency benefited sales by $223 million. |
| § | Geographic mix between regions (included in price realization) was $28 million unfavorable. |
| § | Reported changes in dealer inventories were overall a slight negative for sales volume. Dealers in most regions increased inventories but not as much as in fourth quarter 2006. |
| § | As has been the case in recent quarters, unfavorable economic factors caused a sizable decline in sales volume in North America. These declines were largely the result of weaknesses in housing and nonresidential construction. Coal mining showed some improvement in the fourth quarter, and metals, oil and natural gas industries continued to be positive. |
| § | Sales volume in other regions increased sufficiently to offset the decline in North America. Sales in Europe continued to increase in response to good growth in nonresidential construction. |
| § | Developing countries continued to account for most of the sales volume growth outside North America. Brazil’s past interest rate cuts have strengthened the economy and allowed a significant gain in sales. Russia was another major contributor, with sales benefiting from increased investments in energy, metals and construction. Strong sales growth continued in China despite reported government actions to slow the economy. |
| § | Higher oil prices contributed to sizable sales growth in a number of oil producing countries in Africa/Middle East. |
North America– Sales decreased $241 million, or 7 percent.
| § | Sales volume decreased $327 million. |
| § | Price realization increased $86 million. |
| § | Dealer-reported inventories increased slightly in the fourth quarter, ending three quarters of significant reductions. Dealer inventories at the end of the quarter were well below a year earlier in both dollars and months of supply. |
| § | The decline in sales volume was a result of unfavorable economic conditions in key industries. Output declines prompted users to curtail fleet expansions, and dealers added fewer units to their rental fleets. |
| § | Housing construction was a negative, with starts down 26 percent from a year earlier. The inventory of unsold new homes increased by almost three months to more than nine months, and the median new home price declined more than 4 percent. |
| § | New contracts awarded for nonresidential construction dropped more than 15 percent in the fourth quarter, and the number of workers employed in nonresidential construction declined almost 1 percent. |
| § | The Central Appalachian spot coal price increased almost 17 percent from a year earlier, and coal production increased slightly. Coal exports in October, the latest month available, were 28 percent higher than a year earlier. These improvements led to a recovery in sales of some products used in coal mining such as large track-type tractors. |
| § | Metals prices increased more than 30 percent from a year earlier, and crude oil prices approached $100 per barrel. As a result, mining investment, pipeline construction and oil sands investment benefited sales volumes. |
Page 16
EAME– Sales increased $569 million, or 32 percent.
| § | Sales volume increased $360 million. |
| § | Price realization increased $62 million. |
| § | Currency benefited sales by $147 million. |
| § | Dealer-reported inventories increased in the fourth quarter; inventories in months of supply ended the quarter slightly higher than a year earlier. |
| § | In Europe, strength in nonresidential construction offset softness in housing permits. The credit crisis forced the European Central Bank to inject liquidity and halted plans to raise interest rates. Business sentiment remained sufficiently positive to allow higher sales in most key countries. |
| § | Sales volume increased in Africa/Middle East in response to high oil prices, good economic growth and increased construction activity. Significant sales growth occurred in South Africa in response to a large increase in construction, and there were also increases in a number of oil-producing countries. |
| § | Sales volume also grew significantly in the CIS, largely in Russia. Sales in that country benefited from low interest rates, much higher government spending, increased oil production and more coal production. Construction in the fourth quarter increased 19 percent from the year earlier quarter. |
Latin America– Sales increased $187 million, or 29 percent.
| § | Sales volume increased $135 million. |
| § | Price realization increased $27 million. |
| § | Currency benefited sales by $25 million. |
| § | Dealers reported a decline in inventories in the fourth quarter, which took inventories in months of supply below a year earlier. |
| § | Much of the sales volume growth occurred in Brazil. Sizable interest rate reductions over the past two years improved economic growth and construction spending. Mining, particularly iron ore, benefited sales. |
| § | Gains occurred in other countries in response to more construction or increased mining investment. |
Asia/Pacific– Sales increased $342 million, or 40 percent.
| § | Sales volume increased $233 million. |
| § | Price realization increased $58 million. |
| § | Currency benefited sales by $51 million. |
| § | Dealer-reported inventories increased slightly more than a year earlier. Dollar inventories were lower than 2006, so inventories in months of supply were well below those at the end of 2006. |
| § | China was the largest contributor to sales growth. Despite numerous actions taken to slow the economy, growth continued to be strong and construction increased more than 20 percent relative to 2006. Mining was also strong, with coal mining up 9 percent and iron ore production up 8 percent. |
| § | Indonesia reduced interest rates and continued to develop its coal mining industry, leading to much higher sales. |
| § | Sizable sales volume gains occurred in India. Positives included rapid economic growth, an 11 percent increase in construction and an 8 percent increase in mining. |
Page 17
Engines Sales
Sales were $3.900 billion in fourth quarter 2007, an increase of $175 million, or 5 percent, from fourth quarter 2006.
| § | Sales volume decreased $123 million. |
| § | Price realization increased $187 million. |
| § | Currency benefited sales by $111 million. |
| § | Geographic mix between regions (included in price realization) was $12 million favorable. |
| § | Dealer reported inventories in dollars were up; months of supply were down as the inventories were supported by strong delivery rates. |
North America– Sales decreased $375 million, or 23 percent.
| § | Sales volume decreased $441 million. |
| § | Price realization increased $66 million. |
| § | Sales for on-highway truck applications declined 67 percent as the truck industry demand for new trucks was down due to the reduction in tonnage hauled and freight rates realized by on-highway carriers. |
| § | Sales for petroleum applications increased 37 percent due to strong demand in gas compression, which overcame a small reduction in new drill rig build rates. Turbine sales benefited from increased customer spending for natural gas pipelines and compression equipment. |
| § | Sales for industrial applications decreased 21 percent as the demand for small construction equipment was adversely affected by the severe decline in the U.S. housing market. |
EAME – Sales increased $424 million, or 36 percent.
| § | Sales volume increased $268 million. |
| § | Price realization increased $68 million. |
| § | Currency benefited sales by $88 million. |
| § | Sales for electric power applications increased 46 percent with strong demand for medium-sized units selling into Africa/Middle East and Russia. Turbines and turbine-related services increased to support power generation. |
| § | Sales for industrial applications increased 27 percent with strong demand for agriculture and other types of OEM equipment. This demand has been driven by good economic conditions. |
| § | Sales for marine applications increased 40 percent with higher demand for workboats, commercial oceangoing vessels and cruise ships. |
| § | Sales for petroleum applications increased 27 percent based on strong demand for engines used in drilling and production. Turbine-related services increased to support rising oil production and gas transmission demand. |
Page 18
Latin America – Sales decreased $30 million, or 8 percent.
| § | Sales volume decreased $40 million. |
| § | Price realization increased $10 million. |
| § | Sales into truck applications declined 58 percent reflecting reduced demand. Latin American truck facilities decreased exports of trucks destined for the United States. |
| § | Sales for petroleum applications increased 4 percent as turbine-related services increased to support rising oil production. |
| § | Sales for electric power engines decreased 6 percent due to timing of shipments of product into Latin America. |
Asia/Pacific– Sales increased $156 million, or 31 percent.
| § | Sales volume increased $102 million. |
| § | Price realization increased $31 million. |
| § | Currency benefited sales by $23 million. |
| § | Sales for marine applications increased 58 percent, with continued strong demand for workboat and offshore shipbuilding. Large diesel demand grew in the offshore and general cargo industries. |
| § | Sales for petroleum applications increased 38 percent as Chinese drill rig builders continue to manufacture at record high levels for domestic and export use. Turbines and turbine-related services increased to support oil production and natural gas pipeline compression demand. |
| § | Sales of electric power engines increased 18 percent with the successful launch of new medium-sized units and increased demand in India. |
Financial Products Revenues
Revenues were $784 million in fourth quarter 2007, an increase of $109 million, or 16 percent, from fourth quarter 2006.
| § | Growth in average earning assets increased revenues $85 million. |
| § | Revenues from earned premiums at Cat Insurance increased $26 million. |
Page 19
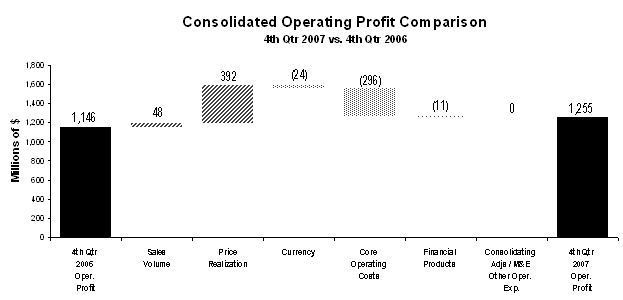 |
The chart above graphically illustrates reasons for the change in Consolidated Operating Profit between fourth quarter 2006 (at left) and fourth quarter 2007 (at right). Items favorably impacting operating profit appear as upward stair steps with the corresponding dollar amounts above each bar, while items negatively impacting operating profit appear as downward stair steps with dollar amounts reflected in parentheses above each bar. Caterpillar management utilizes these charts internally to visually communicate with its Board and employees. The bar titled Consolidating Adjustments/M&E Other Operating Expense includes the operating profit impact of Progress Rail. |
Operating Profit
Operating profit in fourth quarter 2007 increased $109 million, or 10 percent, from 2006, driven by higher price realization and sales volume, partially offset by increased core operating costs.
Core operating costs rose $296 million from fourth quarter 2006 driven by higher manufacturing costs. The increase in manufacturing costs was primarily due to operating inefficiencies, higher material costs and increased depreciation. Operating inefficiencies were the result of supply chain challenges, capacity increases, factory repair and maintenance and costs to enhance customer delivered quality. SG&A and R&D were down $59 million from fourth quarter 2006. Lower spending more than offset the impact of higher wage and benefits.
Currency had a $24 million unfavorable impact on operating profit, as the benefit to sales was more than offset by the negative impact on costs.
Operating Profit by Principal Line of Business | |||||||||||||||
(Millions of dollars) | Fourth Quarter 2006 | Fourth Quarter 2007 | $ Change | % Change | |||||||||||
Machinery1 | $ | 579 | $ | 619 | $ | 40 | 7 | % | |||||||
Engines1 | 502 | 571 | 69 | 14 | % | ||||||||||
| Financial Products | 172 | 161 | (11 | ) | (6 | %) | |||||||||
| Consolidating Adjustments | (107 | ) | (96 | ) | 11 | ||||||||||
| Consolidated Operating Profit | $ | 1,146 | $ | 1,255 | $ | 109 | 10 | % | |||||||
1Caterpillar operations are highly integrated; therefore, the company uses a number of allocations to determine lines of business operating profit for Machinery and Engines. | |||||||||||||||
Page 20
Operating Profit by Principal Line of Business
| § | Machinery operating profit of $619 million was up $40 million, or 7 percent, from fourth quarter 2006. Price realization and higher sales volume were partially offset by higher core operating costs. |
| § | Engines operating profit of $571 million was up $69 million, or 14 percent, from fourth quarter 2006. The favorable impacts of improved price realization and positive mix of product were partially offset by higher core operating costs and lower sales volume. |
| § | Financial Products operating profit of $161 million decreased $11 million, or 6 percent, from fourth quarter 2006. The decrease was primarily attributable to an $18 million increase in the provision for credit losses and a $6 million decrease in miscellaneous revenue items, partially offset by a $14 million impact from higher average earning assets at Cat Financial. |
Other Profit/Loss Items
| § | Other income/(expense) was $88 million of income compared with $49 million of income in fourth quarter 2006. The change was primarily due to the favorable impacts of currency and other items that were individually insignificant. |
| § | The provision for income taxes in the fourth quarter reflects an annual tax rate of 30 percent as compared to a 29 percent rate in 2006. The increase over 2006 is primarily due to the repeal of ETI benefits in 2007 offset by a more favorable geographic mix of profits from a tax perspective. A favorable adjustment of $55 million was recorded this quarter related to the first nine months of 2007 as a result of a decrease in the estimated annual tax rate from 31.5 to 30 percent, primarily due to changes in our geographic mix of profits. This compares to a favorable adjustment of $75 million in the fourth quarter of 2006. |
Page 21
Questions and Answers
Sales and Revenues / Economy and Industry
Q1: | Are you seeing any significant changes in your sales related to U.S. housing? What are you expecting for 2008 housing starts? |
| A: | Available indicators suggest the housing downturn will continue in 2008, and we project starts will decline to 1.1 million units, down from 1.35 million in 2007. New problems for the housing industry that will emerge in 2008 include a high level of mortgage resets, an increase in home repossessions and the likelihood of a significant decrease in home prices. |
Q2: | Can you comment on your machinery sales related to non-residential construction, both in the United States and outside the United States? |
| A: | Machinery sales related to nonresidential construction declined throughout 2007 in the United States, and economic factors impacting the industry worsened in the last half. Banks tightened lending standards, contracts for new construction declined at a faster pace, vacancy rates started to increase and employment in nonresidential construction declined relative to a year earlier. Slower economic growth, a smaller increase in federal highway funding and reduced corporate cash flows should cause the nonresidential construction sector to weaken further in 2008. Nonresidential construction should continue to do well outside the United States. Low interest rates and good economic growth will allow businesses to invest more in facilities and allow many governments to invest more in infrastructure. |
Q3: | Your 2007 sales and revenues, your view of the world economy in 2008, and your sales outlook for 2008 continue to be positive despite weak conditions in the United States. Can you comment on why your sales are expected to be up with weakness in the United States? |
| A: | The U.S. economy accounts for less than 30 percent of the world economy and has been underperforming the rest of the world since early 2006. There are several factors that lead us to believe that our growth will continue in 2008 despite weakness in the U.S. economy. First, European countries continued to turn in good economic growth in 2007, and we believe interest rates in the Euro-zone will remain at 4 percent for the rest of the year. We expect good growth in European economies that should average 2.3 percent in 2008, down a little from 2007. Exports to the United States account for a little more than 2 percent of Euro-zone output; slower U.S. growth does not have a large impact on the European economy. Second, developing economies collectively are experiencing the best growth in years. Factors contributing to that performance—low inflation, low interest rates, highly competitive exports, high commodity prices and much improved government budgets—remain in place. Improved economic conditions have allowed these countries to correct some past underinvestment in infrastructure, but more work remains. In addition, growing populations are increasing the demand for new housing units and infrastructure. |
Page 22
Third, metals mining and energy industries curtailed investments throughout the 1980s and 1990s. The current worldwide economic recovery revealed that production capacities were inadequate. Producers have increased investment but have not yet caught up with needs. More than 90 percent of both worldwide metals exploration spending and oil production occurs outside the United States. Fourth, even in North America, we expect flat to slightly higher sales despite weakness in the U.S. economy. |
| § | In 2007, dealers reduced their machine inventories by about $1.1 billion resulting in company sales to North American dealers lower than dealer sales to end customers. While we expect dealer sales to end users to decline again in 2008, company sales will benefit as a result of substantially lower forecasted changes to dealer inventories than we experienced in 2007. |
| § | Sales to U.S. coal mines were depressed in 2007; rising coal prices and increasing exports are driving expected improvements in 2008. |
| § | While the industry for on-highway truck engines is still very weak as a result of very slow growth in the U.S. economy, we expect our sales to improve from the depressed levels of 2007. |
| § | Sales in Canada remain strong, driven by high commodity prices. |
Q4: | Mining, and Oil and Gas have been very strong industries for the past few years. Can you comment on your expectations going forward from here? |
| A: | Both metals and energy prices increased in 2007, and we expect that prices will remain attractive for investing in 2008. Demand is increasing, particularly in the developing economies, and producers continue to struggle to meet demand. Worldwide metals inventories remain low, and spare oil production capacity is tight. Our outlook assumes these industries will remain positive for both machinery and engine sales in 2008. |
Q5: | Are you expecting an improvement in sales related to U.S. coal mining? |
| A: | In the fourth quarter of 2007, Central Appalachian coal prices (a benchmark price for Eastern coal) averaged more than $53 per ton, almost 17 percent higher than a year earlier. Powder River Basin coal prices (Western coal) averaged $10.40 per ton, or 18 percent higher. U.S. prices have been at a discount to international prices, and that has led to a 16 percent increase in exports through year-to-date October. As a result, we experienced increased demand for some machines used in coal mining such as large track-type tractors in fourth-quarter 2007. We expect that recovery will continue in 2008. |
Q6: | You mention the possibility of a U.S. recession. If this happens, what would the impact be on Caterpillar? |
| A: | Over time, weakness in the economy has spread from housing to nonresidential construction and more recently to employment and manufacturing. A recession is defined as a broad downturn in the economy, a development that seems to be taking place. Many of our businesses are very economically sensitive and have been declining in the United States since early 2006. With or without an officially defined recession, we expect North American sales to remain depressed in 2008. A recession or the potential for a recession would likely lead to actions such as significant interest rate cuts or fiscal measures, which would speed recovery. If the Fed continues to cut interest rates in 2008 as we expect and the U.S. government takes action to stimulate economic growth, 2008 could be the bottom of this U.S. machinery cycle. |
Page 23
Q7: | Can you comment on how dealer inventory changed in the fourth quarter and the full year 2007? |
| A: | Worldwide dealer machine inventories were fairly steady in the fourth quarter (overall, dealer inventories increased less than $50 million), and changes by region were relatively small. No region changed up or down more than $50 million in the quarter. For the full year 2007, North American dealers lowered inventories about $1.1 billion. By comparison, North American dealers increased inventories about $300 million in 2006. This change had a negative impact on Caterpillar sales in North America in 2007. Outside North America, dealers increased inventories about $500 million in 2007 as compared with an increase of about half that much in 2006. |
Engines
Q8: | Can you update your expectations for the 2008 heavy-duty on-highway truck industry? |
| A: | In 2008, we expect slow economic growth in the United States. This slower growth will keep freight tonnage below 2006 levels and, given adequate freight capacity, cause carriers to make only replacement purchases. For 2008, we project the North American heavy-duty truck industry will be 185,000 to 195,000 vehicles, up from an estimated 172,000 units in 2007. This small recovery will occur after current vehicle inventory is reduced to desired levels beginning in the second half of 2008. |
Q9: | Can you comment on how your program to increase production of large 3500 series engines is coming? |
| A: | The capacity increase program continues to be on schedule. Capacity began to increase in the third quarter of 2007 and will continue to increase in 2008. |
Q10: | You’ve said that you are facing an important decision on the future of your on-highway truck engine business. When will you be ready to talk about your plans? |
| A: | In light of the clear movement to vertical integration by North American truck manufacturers, we are continuing to investigate our full range of strategic options going forward. We should soon be able to make this direction clear. |
Page 24
Costs / Profit
Q11: | Can you comment on why core operating costs were higher than you expected in 2007? |
| A: | Our 2007 core operating costs increased $1.2 billion over 2006. Manufacturing inefficiencies related to supply chain disruptions, our focus on improving order-to-delivery processes and capacity expansion initiatives have resulted in higher costs than we forecast. Higher sales were also a factor and were more than $2 billion above our original outlook. Many facilities are operating at or near capacity, putting additional pressure on costs. In addition, volume declined more than we anticipated in on-highway truck engine facilities and negatively impacted costs. Our initial assessment of 2007 core operating costs assumed flat material costs. Instead, increasing commodity prices resulted in about $300 million of additional material cost for the year. |
Q12: | Can you break down your change in core operating costs for the fourth quarter and for the full year in more detail? |
| A: | The following table summarizes the increase in core operating costs in fourth quarter 2007 versus fourth quarter 2006. |
Core Operating Cost Change (Millions of dollars) | Fourth Quarter 2007 vs. 2006 | |||||
| Manufacturing Costs | $ | 355 | ||||
| SG&A | (43 | ) | ||||
| R&D | (16 | ) | ||||
| Total | $ | 296 | ||||
The following table summarizes the increase in core operating costs in 2007 versus 2006.
Core Operating Cost Change (Millions of dollars) | Full Year 2007 vs. 2006 | |||||
| Manufacturing Costs | $ | 1,225 | ||||
| SG&A | (30 | ) | ||||
| R&D | 37 | |||||
| Total | $ | 1,232 | ||||
Cash Flow / Financing
Q13: | Can you comment on the strength of your financial position? |
| A: | We are in a very strong financial position with a Machinery and Engines debt-to-capital ratio of 31.2 percent. Going forward, we have the capacity to fund growth, maintain our benefit plans at a well-funded level, continue to increase our dividend and repurchase stock when it is attractive. |
Page 25
Q14: | Can you comment on 2007 operating cash flow? |
| A: | For Machinery and Engines, 2007 operating cash flow was $5.446 billion. This was $833 million, or 18 percent higher than full year 2006. The strong cash flow from Machinery and Engines was primarily used for: |
| § | Share Repurchase - $2.405 billion—used to repurchase 33.5 million shares |
| § | Capital Expenditures - $1.683 billion— primarily to replace and upgrade existing production assets, support new product programs and facilitate additional expansion of manufacturing capacity |
| § | Dividends - $845 million—an increase of $119 million compared to 2006 |
| § | Acquisitions - $244 million—primarily for Franklin Power Products, Inc. & International Fuel Systems, Inc. |
Q15: | How much stock was repurchased in the fourth quarter and for the year? Also, how many shares were outstanding at year-end? |
| A: | Our continued stock buy back is in support of our Board authorized $7.5 billion stock repurchase program to be completed by 2011. In the fourth quarter we repurchased 12.6 million shares at a cost of $920 million. For the full year we repurchased 33.5 million shares at a cost of $2.405 billion. Basic shares outstanding at the end of the year were 624 million. |
Q16: | Are credit markets having any significant negative impact at Cat Financial Services? Has Cat Financial’s past due ratio increased much this year? How about credit losses? |
| A: | No. Due to Caterpillar’s strong credit rating we were able to maintain normal operations and fund all our needs. We've been able to continue to fund growth at Cat Financial without significant impact from the credit markets. Investor interest has been strong, validating the quality of our debt issuance program. At the end of the fourth quarter, past dues were 2.36 percent, compared with 1.71 percent at the end of the fourth quarter of 2006. Most of this increase is related to North America and the downturn in the housing market. Notably, past dues have improved during this past quarter—from 2.52 percent at the end of the third quarter to the current level of 2.36 percent. Write-offs net of recoveries were $68 million in 2007 compared with $47 million in 2006. This increase has also been driven by the downturn in the U.S. housing market. Although past dues and write-offs have increased from 2006, by historical standards Cat Financial's portfolio continues to perform well. |
Page 26
Other
Q17: | Can you comment on your progress in implementing the Cat Production System and your expectations for 2008? |
| A: | Extensive benchmarking of world-class production systems completed in 2006 enabled us to define the Caterpillar Production System (CPS) recipe for more than 300 manufacturing facilities throughout the world. This recipe was rolled out to all our manufacturing operations during the first half of 2007; the first year of the CPS journey. The CPS rollout included extensive training of 6 Sigma black belts to conduct value stream mapping and rapid improvement workshops. In our benchmarking we learned that safety improvements usually precede quality, velocity and cost benefits. We have been pleased with steadily improving safety and quality across the Company. We expect safety and quality to continue to improve and expect modest improvements in velocity and costs in 2008, with more to be realized in 2009 and 2010. |
Page 27
GLOSSARY OF TERMS
| 1. | Cat Production System (CPS) – The Caterpillar Production System is the common Order-to-Delivery process being implemented enterprise-wide to achieve our safety, quality, velocity, earnings and growth goals for 2010 and beyond. |
| 2. | Consolidating Adjustments – Eliminations of transactions between Machinery and Engines and Financial Products. |
| 3. | Core Operating Costs – Machinery and Engines variable manufacturing cost change [adjusted for volume] and changes in period manufacturing costs, SG&A expenses and R&D expenses. Excludes the impact of currency. |
| 4. | Currency – With respect to sales and revenues, currency represents the translation impact on sales resulting from changes in foreign currency exchange rates versus the U.S. dollar. With respect to operating profit, currency represents the net translation impact on sales and operating costs resulting from changes in foreign currency exchange rates versus the U.S. dollar. Currency includes the impacts on sales and operating profit for the Machinery and Engines lines of business only; currency impacts on Financial Products revenues and operating profit are included in the Financial Products portions of the respective analyses. With respect to other income/expense, currency represents the effects of forward and option contracts entered into by the company to reduce the risk of fluctuations in exchange rates and the net effect of changes in foreign currency exchange rates on our foreign currency assets and liabilities for consolidated results. |
| 5. | Debt to Capital Ratio – A key measure of financial strength used by both management and our credit rating agencies. The metric is a ratio of Machinery and Engines debt (short-term borrowings plus long-term debt) to the sum of Machinery and Engines debt and stockholders' equity. |
| 6. | EAME – Geographic region including Europe, Africa, the Middle East and the Commonwealth of Independent States (CIS). |
| 7. | Earning Assets – Assets consisting primarily of total finance receivables net of unearned income, plus equipment on operating leases, less accumulated depreciation at Cat Financial. |
| 8. | Engines – A principal line of business including the design, manufacture, marketing and sales of engines for Caterpillar machinery; electric power generation systems; on-highway vehicles and locomotives; marine, petroleum, construction, industrial, agricultural and other applications and related parts. Also includes remanufacturing of Caterpillar engines and a variety of Caterpillar machinery and engine components and remanufacturing services for other companies. Reciprocating engines meet power needs ranging from 5 to 21,500 horsepower (4 to more than 16 000 kilowatts). Turbines range from 1,600 to 20,500 horsepower (1 200 to 15 000 kilowatts). |
| 9. | Financial Products – A principal line of business consisting primarily of Caterpillar Financial Services Corporation (Cat Financial), Caterpillar Insurance Holdings, Inc. (Cat Insurance), Caterpillar Power Ventures Corporation (Cat Power Ventures) and their respective subsidiaries. Cat Financial provides a wide range of financing alternatives to customers and dealers for Caterpillar machinery and engines, Solar gas turbines as well as other equipment and marine vessels. Cat Financial also extends loans to customers and dealers. Cat Insurance provides various forms of insurance to customers and dealers to help support the purchase and lease of our equipment. Cat Power Ventures is an investor in independent power projects using Caterpillar power generation equipment and services. |
| 10. | Integrated Service Businesses – A service business or a business containing an important service component. These businesses include, but are not limited to, aftermarket parts, Cat Financial, Cat Insurance, Cat Logistics, Cat Reman, Progress Rail, OEM Solutions and Solar Turbine Customer Services. |
Page 28
| 11. | Latin America – Geographic region including Central and South American countries and Mexico. |
| 12. | Machinery – A principal line of business which includes the design, manufacture, marketing and sales of construction, mining and forestry machinery—track and wheel tractors, track and wheel loaders, pipelayers, motor graders, wheel tractor-scrapers, track and wheel excavators, backhoe loaders, log skidders, log loaders, off-highway trucks, articulated trucks, paving products, skid steer loaders and related parts. Also includes logistics services for other companies and the design, manufacture, remanufacture, maintenance and services of rail-related products. |
| 13. | Machinery and Engines (M&E) – Due to the highly integrated nature of operations, it represents the aggregate total of the Machinery and Engines lines of business and includes primarily our manufacturing, marketing and parts distribution operations. |
| 14. | Manufacturing Costs – Manufacturing costs represent the volume-adjusted change for variable costs and the absolute dollar change for period manufacturing costs. Variable manufacturing costs are defined as having a direct relationship with the volume of production. This includes material costs, direct labor and other costs that vary directly with production volume such as freight, power to operate machines and supplies that are consumed in the manufacturing process. Period manufacturing costs support production but are defined as generally not having a direct relationship to short-term changes in volume. Examples include machinery and equipment repair, depreciation on manufacturing assets, facility support, procurement, factory scheduling, manufacturing planning and operations management. |
| 15. | M&E Other Operating Expenses – Comprised primarily of gains (losses) on disposal of long-lived assets, long-lived asset impairment charges and impairment of goodwill. |
| 16. | Operating Profit – Sales and revenues minus operating costs. |
| 17. | Price Realization – The impact of net price changes excluding currency and new product introductions. Consolidated price realization includes the impact of changes in the relative weighting of sales between geographic regions. |
| 18. | Profit – Consolidated profit before taxes less provision for income taxes plus equity in profit (loss) of unconsolidated affiliated companies. |
| 19. | Sales Volume – With respect to sales and revenues, sales volume represents the impact of changes in the quantities sold for machinery and engines as well as the incremental revenue impact of new product introductions. With respect to operating profit, sales volume represents the impact of changes in the quantities sold for machinery and engines combined with product mix—the net operating profit impact of changes in the relative weighting of machinery and engines sales with respect to total sales. |
| 20. | 6 Sigma – On a technical level, 6 Sigma represents a measure of variation that achieves 3.4 defects per million opportunities. At Caterpillar, 6 Sigma represents a much broader cultural philosophy to drive continuous improvement throughout the value chain. It is a fact-based, data-driven methodology that we are using to improve processes, enhance quality, cut costs, grow our business and deliver greater value to our customers through Black Belt-led project teams. At Caterpillar, 6 Sigma goes beyond mere process improvement—it has become the way we work as teams to process business information, solve problems and manage our business successfully. |
Page 29
NON-GAAP FINANCIAL MEASURES
The following definition is provided for “non-GAAP financial measures” in connection with Regulation G issued by the Securities and Exchange Commission. This non-GAAP financial measure has no standardized meaning prescribed by U.S. GAAP and therefore is unlikely to be comparable to the calculation of similar measures for other companies. Management does not intend this item to be considered in isolation or as a substitute for the related GAAP measure.
MACHINERY AND ENGINES
Caterpillar defines Machinery and Engines as it is presented in the supplemental data as Caterpillar Inc. and its subsidiaries with Financial Products accounted for on the equity basis. Machinery and Engines information relates to the design, manufacture and marketing of our products. Financial Products information relates to the financing to customers and dealers for the purchase and lease of Caterpillar and other equipment. The nature of these businesses is different, especially with regard to the financial position and cash flow items. Caterpillar management utilizes this presentation internally to highlight these differences. We also believe this presentation will assist readers in understanding our business. Pages 34-39 reconcile Machinery and Engines with Financial Products on the equity basis to Caterpillar Inc. Consolidated financial information.
Caterpillar's latest financial results and current outlook are also available via:
Telephone:
(800) 228-7717 (Inside the United States and Canada)
(858) 244-2080 (Outside the United States and Canada)
Internet:
http://www.cat.com/investor
http://www.cat.com/irwebcast (live broadcast/replays of quarterly conference call)
Caterpillar contact:
Jim Dugan
Corporate Public Affairs
(309) 494-4100 (Office) or (309) 360-7311 (Mobile)
mail to: Dugan_Jim@cat.com
Page 30
Caterpillar Inc. Condensed Consolidated Statement of Results of Operations (Unaudited) (Dollars in millions except per share data) | ||||||||||||||||
Three Months Ended | Twelve Months Ended | |||||||||||||||
December 31, | December 31, | |||||||||||||||
2007 | 2006 | 2007 | 2006 | |||||||||||||
Sales and revenues: | ||||||||||||||||
| Sales of Machinery and Engines | $ | 11,360 | $ | 10,328 | $ | 41,962 | $ | 38,869 | ||||||||
| Revenues of Financial Products | 784 | 675 | 2,996 | 2,648 | ||||||||||||
| Total sales and revenues | 12,144 | 11,003 | 44,958 | 41,517 | ||||||||||||
Operating costs: | ||||||||||||||||
| Cost of goods sold | 8,920 | 7,971 | 32,626 | 29,549 | ||||||||||||
| Selling, general and administrative expenses | 1,025 | 1,016 | 3,821 | 3,706 | ||||||||||||
| Research and development expenses | 357 | 368 | 1,404 | 1,347 | ||||||||||||
| Interest expense of Financial Products | 293 | 269 | 1,132 | 1,023 | ||||||||||||
| Other operating expenses | 294 | 233 | 1,054 | 971 | ||||||||||||
| Total operating costs | 10,889 | 9,857 | 40,037 | 36,596 | ||||||||||||
Operating profit | 1,255 | 1,146 | 4,921 | 4,921 | ||||||||||||
| Interest expense excluding Financial Products | 60 | 68 | 288 | 274 | ||||||||||||
| Other income (expense) | 88 | 49 | 320 | 214 | ||||||||||||
Consolidated profit before taxes | 1,283 | 1,127 | 4,953 | 4,861 | ||||||||||||
| Provision for income taxes | 330 | 252 | 1,485 | 1,405 | ||||||||||||
| Profit of consolidated companies | 953 | 875 | 3,468 | 3,456 | ||||||||||||
| Equity in profit (loss) of unconsolidated affiliated companies | 22 | 7 | 73 | 81 | ||||||||||||
Profit | $ | 975 | $ | 882 | $ | 3,541 | $ | 3,537 | ||||||||
Profit per common share | $ | 1.55 | $ | 1.36 | $ | 5.55 | $ | 5.37 | ||||||||
Profit per common share – diluted 1 | $ | 1.50 | $ | 1.32 | $ | 5.37 | $ | 5.17 | ||||||||
Weighted average common shares outstanding (millions) | ||||||||||||||||
- Basic | 630.4 | 647.6 | 638.2 | 658.7 | ||||||||||||
- Diluted 1 | 650.8 | 669.5 | 659.5 | 683.8 | ||||||||||||
Cash dividends declared per common share | $ | .72 | $ | .60 | $ | 1.38 | $ | 1.15 | ||||||||
1 Diluted by assumed exercise of stock-based compensation awards using the treasury stock method. | ||||||||||||||||
Page 31
Caterpillar Inc. Condensed Consolidated Statement of Financial Position (Unaudited) (Millions of dollars) | |||||||||||
December 31, | December 31, | ||||||||||
2007 | 2006 | ||||||||||
Assets | |||||||||||
| Current assets: | |||||||||||
| Cash and short-term investments | $ | 1,122 | $ | 530 | |||||||
| Receivables - trade and other | 8,249 | 8,607 | |||||||||
| Receivables - finance | 7,503 | 6,804 | |||||||||
| Deferred and refundable income taxes | 816 | 733 | |||||||||
| Prepaid expenses and other current assets | 583 | 638 | |||||||||
| Inventories | 7,204 | 6,351 | |||||||||
| Total current assets | 25,477 | 23,663 | |||||||||
| Property, plant and equipment – net | 9,997 | 8,851 | |||||||||
| Long-term receivables - trade and other | 685 | 860 | |||||||||
| Long-term receivables - finance | 13,462 | 11,531 | |||||||||
| Investments in unconsolidated affiliated companies | 598 | 562 | |||||||||
| Noncurrent deferred and refundable income taxes | 1,553 | 1,949 | |||||||||
| Intangible assets | 475 | 387 | |||||||||
| Goodwill | 1,963 | 1,904 | |||||||||
| Other assets | 1,922 | 1,742 | |||||||||
Total assets | $ | 56,132 | $ | 51,449 | |||||||
Liabilities | |||||||||||
| Current liabilities: | |||||||||||
| Short-term borrowings: | |||||||||||
| -- Machinery and Engines | $ | 187 | $ | 165 | |||||||
| -- Financial Products | 5,281 | 4,990 | |||||||||
| Accounts payable | 4,723 | 4,085 | |||||||||
| Accrued expenses | 3,178 | 2,923 | |||||||||
| Accrued wages, salaries and employee benefits | 1,126 | 938 | |||||||||
| Customer advances | 1,442 | 921 | |||||||||
| Dividends payable | 225 | 194 | |||||||||
| Other current liabilities | 951 | 1,145 | |||||||||
| Long-term debt due within one year: | |||||||||||
| -- Machinery and Engines | 180 | 418 | |||||||||
| -- Financial Products | 4,952 | 4,043 | |||||||||
| Total current liabilities | 22,245 | 19,822 | |||||||||
| Long-term debt due after one year: | |||||||||||
| -- Machinery and Engines | 3,639 | 3,694 | |||||||||
| -- Financial Products | 14,190 | 13,986 | |||||||||
| Liability for postemployment benefits | 5,059 | 5,879 | |||||||||
| Other liabilities | 2,116 | 1,209 | |||||||||
Total liabilities | 47,249 | 44,590 | |||||||||
Stockholders' equity | |||||||||||
| Common stock | 2,744 | 2,465 | |||||||||
| Treasury stock | (9,451 | ) | (7,352 | ) | |||||||
| Profit employed in the business | 17,398 | 14,593 | |||||||||
| Accumulated other comprehensive income | (1,808 | ) | (2,847 | ) | |||||||
Total stockholders' equity | 8,883 | 6,859 | |||||||||
Total liabilities and stockholders' equity | $ | 56,132 | $ | 51,449 | |||||||
Certain amounts for prior periods have been reclassified to conform to the current period financial statement presentation. | |||||||||||
Page 32
Caterpillar Inc. Condensed Consolidated Statement of Cash Flow (Unaudited) (Millions of dollars) | |||||||||
Twelve Months Ended | |||||||||
December 31, | |||||||||
2007 | 2006 | ||||||||
Cash flow from operating activities: | |||||||||
| Profit | $ | 3,541 | $ | 3,537 | |||||
| Adjustments for non-cash items: | |||||||||
| Depreciation and amortization | 1,797 | 1,602 | |||||||
| Other | 199 | 197 | |||||||
| Changes in assets and liabilities: | |||||||||
| Receivables – trade and other | 899 | (148 | ) | ||||||
| Inventories | (745 | ) | (827 | ) | |||||
| Accounts payable and accrued expenses | 618 | 670 | |||||||
| Customer advances | 576 | 511 | |||||||
| Other assets – net | 66 | (262 | ) | ||||||
| Other liabilities – net | 984 | 519 | |||||||
| Net cash provided by (used for) operating activities | 7,935 | 5,799 | |||||||
Cash flow from investing activities: | |||||||||
| Capital expenditures – excluding equipment leased to others | (1,700 | ) | (1,593 | ) | |||||
| Expenditures for equipment leased to others | (1,340 | ) | (1,082 | ) | |||||
| Proceeds from disposals of property, plant and equipment | 408 | 572 | |||||||
| Additions to finance receivables | (13,946 | ) | (10,522 | ) | |||||
| Collections of finance receivables | 10,985 | 8,094 | |||||||
| Proceeds from the sale of finance receivables | 866 | 1,067 | |||||||
| Investments and acquisitions (net of cash acquired) | (229 | ) | (513 | ) | |||||
| Proceeds from release of security deposit | 290 | - | |||||||
| Proceeds from sale of available-for-sale securities | 282 | 539 | |||||||
| Investments in available-for-sale securities | (485 | ) | (681 | ) | |||||
| Other – net | 461 | 323 | |||||||
| Net cash provided by (used for) investing activities | (4,408 | ) | (3,796 | ) | |||||
Cash flow from financing activities: | |||||||||
| Dividends paid | (845 | ) | (726 | ) | |||||
| Common stock issued, including treasury shares reissued | 328 | 414 | |||||||
| Payment for stock repurchase derivative contracts | (56 | ) | - | ||||||
| Treasury shares purchased | (2,405 | ) | (3,208 | ) | |||||
| Excess tax benefit from stock-based compensation | 155 | 169 | |||||||
| Proceeds from debt issued (original maturities greater than three months) | 11,039 | 11,269 | |||||||
| Payments on debt (original maturities greater than three months) | (10,888 | ) | (10,375 | ) | |||||
| Short-term borrowings (original maturities three months or less)-net | (297 | ) | (136 | ) | |||||
| Net cash provided by (used for) financing activities | (2,969 | ) | (2,593 | ) | |||||
| Effect of exchange rate changes on cash | 34 | 12 | |||||||
Increase (decrease) in cash and short-term investments | 592 | (578 | ) | ||||||
| Cash and short-term investments at beginning of period | 530 | 1,108 | |||||||
| Cash and short-term investments at end of period | $ | 1,122 | $ | 530 | |||||
Certain amounts for prior periods have been reclassified to conform to the current period financial statement presentation. | |||||||||
All short-term investments, which consist primarily of highly liquid investments with original maturities of three months or less, are considered to be cash equivalents. | |||||||||
Page 33
Caterpillar Inc. Supplemental Data for Results of Operations For The Three Months Ended December 31, 2007 (Unaudited) (Millions of dollars) | ||||||||||||||||
Supplemental Consolidating Data | ||||||||||||||||
Consolidated | Machinery and Engines 1 | Financial Products | Consolidating Adjustments | |||||||||||||
Sales and revenues: | ||||||||||||||||
| Sales of Machinery and Engines | $ | 11,360 | $ | 11,360 | $ | - | $ | - | ||||||||
| Revenues of Financial Products | 784 | - | 888 | (104 | )2 | |||||||||||
| Total sales and revenues | 12,144 | 11,360 | 888 | (104 | ) | |||||||||||
Operating costs: | ||||||||||||||||
| Cost of goods sold | 8,920 | 8,920 | - | - | ||||||||||||
| Selling, general and administrative expenses | 1,025 | 887 | 138 | - | ||||||||||||
| Research and development expenses | 357 | 357 | - | - | ||||||||||||
| Interest expense of Financial Products | 293 | - | 295 | (2 | )4 | |||||||||||
| Other operating expenses | 294 | 6 | 294 | (6 | )3 | |||||||||||
| Total operating costs | 10,889 | 10,170 | 727 | (8 | ) | |||||||||||
Operating profit | 1,255 | 1,190 | 161 | (96 | ) | |||||||||||
| Interest expense excluding Financial Products | 60 | 61 | - | (1 | )4 | |||||||||||
| Other income (expense) | 88 | (27 | ) | 20 | 95 | 5 | ||||||||||
Consolidated profit before taxes | 1,283 | 1,102 | 181 | - | ||||||||||||
| Provision for income taxes | 330 | 254 | 76 | - | ||||||||||||
| Profit of consolidated companies | 953 | 848 | 105 | - | ||||||||||||
| Equity in profit (loss) of unconsolidated affiliated companies | 22 | 21 | 1 | - | ||||||||||||
| Equity in profit of Financial Products' subsidiaries | - | 106 | - | (106 | )6 | |||||||||||
Profit | $ | 975 | $ | 975 | $ | 106 | $ | (106 | ) | |||||||
1 Represents Caterpillar Inc. and its subsidiaries with Financial Products accounted for on the equity basis. | ||||||||||||||||
2 Elimination of Financial Products’ revenues earned from Machinery and Engines. | ||||||||||||||||
3 Elimination of net expenses recorded by Machinery and Engines paid to Financial Products. | ||||||||||||||||
4 Elimination of interest expense recorded between Financial Products and Machinery and Engines. | ||||||||||||||||
5 Elimination of discount recorded by Machinery and Engines on receivables sold to Financial Products and of interest earned between Machinery and Engines and Financial Products. | ||||||||||||||||
6 Elimination of Financial Products’ profit due to equity method of accounting. | ||||||||||||||||
Page 34
Caterpillar Inc. Supplemental Data for Results of Operations For The Three Months Ended December 31, 2006 (Unaudited) (Millions of dollars) | ||||||||||||||||
Supplemental Consolidating Data | ||||||||||||||||
Consolidated | Machinery and Engines 1 | Financial Products | Consolidating Adjustments | |||||||||||||
Sales and revenues: | ||||||||||||||||
| Sales of Machinery and Engines | $ | 10,328 | $ | 10,328 | $ | - | $ | - | ||||||||
| Revenues of Financial Products | 675 | - | 799 | (124 | )2 | |||||||||||
| Total sales and revenues | 11,003 | 10,328 | 799 | (124 | ) | |||||||||||
Operating costs: | ||||||||||||||||
| Cost of goods sold | 7,971 | 7,971 | - | - | ||||||||||||
| Selling, general and administrative expenses | 1,016 | 916 | 120 | (20 | )3 | |||||||||||
| Research and development expenses | 368 | 368 | - | - | ||||||||||||
| Interest expense of Financial Products | 269 | - | 272 | (3 | )4 | |||||||||||
| Other operating expenses | 233 | (8 | ) | 235 | 6 | 3 | ||||||||||
| Total operating costs | 9,857 | 9,247 | 627 | (17 | ) | |||||||||||
Operating profit | 1,146 | 1,081 | 172 | (107 | ) | |||||||||||
| Interest expense excluding Financial Products | 68 | 71 | - | (3 | )4 | |||||||||||
| Other income (expense) | 49 | (62 | ) | 7 | 104 | 5 | ||||||||||
Consolidated profit before taxes | 1,127 | 948 | 179 | - | ||||||||||||
| Provision for income taxes | 252 | 196 | 56 | - | ||||||||||||
| Profit of consolidated companies | 875 | 752 | 123 | - | ||||||||||||
| Equity in profit (loss) of unconsolidated affiliated companies | 7 | 7 | - | - | ||||||||||||
| Equity in profit of Financial Products' subsidiaries | - | 123 | - | (123 | )6 | |||||||||||
Profit | $ | 882 | $ | 882 | $ | 123 | $ | (123 | ) | |||||||
1 Represents Caterpillar Inc. and its subsidiaries with Financial Products accounted for on the equity basis. | ||||||||||||||||
2 Elimination of Financial Products’ revenues earned from Machinery and Engines. | ||||||||||||||||
3 Elimination of net expenses recorded by Machinery and Engines paid to Financial Products. | ||||||||||||||||
4 Elimination of interest expense recorded between Financial Products and Machinery and Engines. | ||||||||||||||||
5 Elimination of discount recorded by Machinery and Engines on receivables sold to Financial Products and of interest earned between Machinery and Engines and Financial Products. | ||||||||||||||||
6 Elimination of Financial Products’ profit due to equity method of accounting. | ||||||||||||||||
Page 35
Caterpillar Inc. Supplemental Data for Results of Operations For The Twelve Months Ended December 31, 2007 (Unaudited) (Millions of dollars) | ||||||||||||||||
Supplemental Consolidating Data | ||||||||||||||||
Consolidated | Machinery and Engines 1 | Financial Products | Consolidating Adjustments | |||||||||||||
Sales and revenues: | ||||||||||||||||
| Sales of Machinery and Engines | $ | 41,962 | $ | 41,962 | $ | - | $ | - | ||||||||
| Revenues of Financial Products | 2,996 | - | 3,396 | (400 | )2 | |||||||||||
| Total sales and revenues | 44,958 | 41,962 | 3,396 | (400 | ) | |||||||||||
Operating costs: | ||||||||||||||||
| Cost of goods sold | 32,626 | 32,626 | - | - | ||||||||||||
| Selling, general and administrative expenses | 3,821 | 3,356 | 480 | (15 | )3 | |||||||||||
| Research and development expenses | 1,404 | 1,404 | - | - | ||||||||||||
| Interest expense of Financial Products | 1,132 | - | 1,137 | (5 | )4 | |||||||||||
| Other operating expenses | 1,054 | (8 | ) | 1,089 | (27 | )3 | ||||||||||
| Total operating costs | 40,037 | 37,378 | 2,706 | (47 | ) | |||||||||||
Operating profit | 4,921 | 4,584 | 690 | (353 | ) | |||||||||||
| Interest expense excluding Financial Products | 288 | 294 | - | (6 | )4 | |||||||||||
| Other income (expense) | 320 | (104 | ) | 77 | 347 | 5 | ||||||||||
Consolidated profit before taxes | 4,953 | 4,186 | 767 | - | ||||||||||||
| Provision for income taxes | 1,485 | 1,220 | 265 | - | ||||||||||||
| Profit of consolidated companies | 3,468 | 2,966 | 502 | - | ||||||||||||
| Equity in profit (loss) of unconsolidated affiliated companies | 73 | 69 | 4 | - | ||||||||||||
| Equity in profit of Financial Products' subsidiaries | - | 506 | - | (506 | )6 | |||||||||||
Profit | $ | 3,541 | $ | 3,541 | $ | 506 | $ | (506 | ) | |||||||
1 Represents Caterpillar Inc. and its subsidiaries with Financial Products accounted for on the equity basis. | ||||||||||||||||
2 Elimination of Financial Products’ revenues earned from Machinery and Engines. | ||||||||||||||||
3 Elimination of net expenses recorded by Machinery and Engines paid to Financial Products. | ||||||||||||||||
4 Elimination of interest expense recorded between Financial Products and Machinery and Engines. | ||||||||||||||||
5 Elimination of discount recorded by Machinery and Engines on receivables sold to Financial Products and of interest earned between Machinery and Engines and Financial Products. | ||||||||||||||||
6 Elimination of Financial Products’ profit due to equity method of accounting. | ||||||||||||||||
Page 36
Caterpillar Inc. Supplemental Data for Results of Operations For The Twelve Months Ended December 31, 2006 (Unaudited) (Millions of dollars) | ||||||||||||||||
Supplemental Consolidating Data | ||||||||||||||||
Consolidated | Machinery and Engines 1 | Financial Products | Consolidating Adjustments | |||||||||||||
Sales and revenues: | ||||||||||||||||
| Sales of Machinery and Engines | $ | 38,869 | $ | 38,869 | $ | - | $ | - | ||||||||
| Revenues of Financial Products | 2,648 | - | 3,114 | (466 | )2 | |||||||||||
| Total sales and revenues | 41,517 | 38,869 | 3,114 | (466 | ) | |||||||||||
Operating costs: | ||||||||||||||||
| Cost of goods sold | 29,549 | 29,549 | - | - | ||||||||||||
| Selling, general and administrative expenses | 3,706 | 3,294 | 446 | (34 | )3 | |||||||||||
| Research and development expenses | 1,347 | 1,347 | - | - | ||||||||||||
| Interest expense of Financial Products | 1,023 | - | 1,033 | (10 | )4 | |||||||||||
| Other operating expenses | 971 | 22 | 965 | (16 | )3 | |||||||||||
| Total operating costs | 36,596 | 34,212 | 2,444 | (60 | ) | |||||||||||
Operating profit | 4,921 | 4,657 | 670 | (406 | ) | |||||||||||
| Interest expense excluding Financial Products | 274 | 285 | - | (11 | )4 | |||||||||||
| Other income (expense) | 214 | (256 | ) | 75 | 395 | 5 | ||||||||||
Consolidated profit before taxes | 4,861 | 4,116 | 745 | - | ||||||||||||
| Provision for income taxes | 1,405 | 1,158 | 247 | - | ||||||||||||
| Profit of consolidated companies | 3,456 | 2,958 | 498 | - | ||||||||||||
| Equity in profit (loss) of unconsolidated affiliated companies | 81 | 79 | 2 | - | ||||||||||||
| Equity in profit of Financial Products' subsidiaries | - | 500 | - | (500 | )6 | |||||||||||
Profit | $ | 3,537 | $ | 3,537 | $ | 500 | $ | (500 | ) | |||||||
1 Represents Caterpillar Inc. and its subsidiaries with Financial Products accounted for on the equity basis. | ||||||||||||||||
2 Elimination of Financial Products’ revenues earned from Machinery and Engines. | ||||||||||||||||
3 Elimination of net expenses recorded by Machinery and Engines paid to Financial Products. | ||||||||||||||||
4 Elimination of interest expense recorded between Financial Products and Machinery and Engines. | ||||||||||||||||
5 Elimination of discount recorded by Machinery and Engines on receivables sold to Financial Products and of interest earned between Machinery and Engines and Financial Products. | ||||||||||||||||
6 Elimination of Financial Products’ profit due to equity method of accounting. | ||||||||||||||||
Page 37
Caterpillar Inc. Supplemental Data for Cash Flow For The Twelve Months Ended December 31, 2007 (Unaudited) (Millions of dollars) | |||||||||||||||||
Supplemental Consolidating Data | |||||||||||||||||
Consolidated | Machinery and Engines1 | Financial Products | Consolidating Adjustments | ||||||||||||||
Cash flow from operating activities: | |||||||||||||||||
| Profit | $ | 3,541 | $ | 3,541 | $ | 506 | $ | (506 | )2 | ||||||||
| Adjustments for non-cash items: | |||||||||||||||||
| Depreciation and amortization | 1,797 | 1,093 | 704 | - | |||||||||||||
| Undistributed profit of Financial Products | - | (256 | ) | - | 256 | 3 | |||||||||||
| Other | 199 | 114 | (267 | ) | 352 | 4 | |||||||||||
| Changes in assets and liabilities: | |||||||||||||||||
| Receivables - trade and other | 899 | (317 | ) | (105 | ) | 1,321 | 4/5 | ||||||||||
| Inventories | (745 | ) | (745 | ) | - | - | |||||||||||
| Accounts payable and accrued expenses | 618 | 408 | 216 | (6 | )4 | ||||||||||||
| Customer advances | 576 | 576 | - | - | |||||||||||||
| Other assets - net | 66 | 63 | (9 | ) | 12 | 4 | |||||||||||
| Other liabilities - net | 984 | 969 | 40 | (25 | )4 | ||||||||||||
| Net cash provided by (used for) operating activities | 7,935 | 5,446 | 1,085 | 1,404 | |||||||||||||
Cash flow from investing activities: | |||||||||||||||||
| Capital expenditures - excluding equipment leased to others | (1,700 | ) | (1,683 | ) | (17 | ) | - | ||||||||||
| Expenditures for equipment leased to others | (1,340 | ) | - | (1,349 | ) | 9 | 4 | ||||||||||
| Proceeds from disposals of property, plant and equipment | 408 | 14 | 398 | (4 | )4 | ||||||||||||
| Additions to finance receivables | (13,946 | ) | - | (36,251 | ) | 22,305 | 5 | ||||||||||
| Collections of finance receivables | 10,985 | - | 33,456 | (22,471 | )5 | ||||||||||||
| Proceeds from sale of finance receivables | 866 | - | 2,378 | (1,512 | )5 | ||||||||||||
| Net intercompany borrowings | - | (177 | ) | 3 | 174 | 6 | |||||||||||
| Investments and acquisitions (net of cash acquired) | (229 | ) | (244 | ) | - | 15 | 7 | ||||||||||
| Proceeds from release of security deposit | 290 | 290 | - | - | |||||||||||||
| Proceeds from sale of available-for-sale securities | 282 | 23 | 259 | - | |||||||||||||
| Investments in available-for-sale securities | (485 | ) | (29 | ) | (456 | ) | - | ||||||||||
| Other - net | 461 | 122 | 341 | (2 | )7 | ||||||||||||
| Net cash provided by (used for) investing activities | (4,408 | ) | (1,684 | ) | (1,238 | ) | (1,486 | ) | |||||||||
Cash flow from financing activities: | |||||||||||||||||
| Dividends paid | (845 | ) | (845 | ) | (254 | ) | 254 | 8 | |||||||||
| Common stock issued, including treasury shares reissued | 328 | 328 | (2 | ) | 2 | 7 | |||||||||||
| Payment for stock repurchase derivative contracts | (56 | ) | (56 | ) | - | - | |||||||||||
| Treasury shares purchased | (2,405 | ) | (2,405 | ) | - | - | |||||||||||
| Excess tax benefit from stock-based compensation | 155 | 155 | - | - | |||||||||||||
| Net intercompany borrowings | - | (3 | ) | 177 | (174 | )6 | |||||||||||
| Proceeds from debt issued (original maturities greater than three months) | 11,039 | 224 | 10,815 | - | |||||||||||||
| Payments on debt (original maturities greater than three months) | (10,888 | ) | (598 | ) | (10,290 | ) | - | ||||||||||
| Short-term borrowings (original maturities three months or less)-net | (297 | ) | (41 | ) | (256 | ) | - | ||||||||||
| Net cash provided by (used for) financing activities | (2,969 | ) | (3,241 | ) | 190 | 82 | |||||||||||
| Effect of exchange rate changes on cash | 34 | 22 | 12 | - | |||||||||||||
Increase (decrease) in cash and short-term investments | 592 | 543 | 49 | - | |||||||||||||
| Cash and short-term investments at beginning of period | 530 | 319 | 211 | - | |||||||||||||
| Cash and short-term investments at end of period | $ | 1,122 | $ | 862 | $ | 260 | $ | - | |||||||||
1 Represents Caterpillar Inc. and its subsidiaries with Financial Products accounted for on the equity basis. | |||||||||||||||||
2 Elimination of Financial Products’ profit after tax due to equity method of accounting. | |||||||||||||||||
3 Non-cash adjustment for the undistributed earnings from Financial Products. | |||||||||||||||||
4 Elimination of non-cash adjustments and changes in assets and liabilities related to consolidated reporting. | |||||||||||||||||
5 Reclassification of Cat Financial’s cash flow activity from investing to operating for receivables that arose from the sale of inventory. | |||||||||||||||||
6 Net proceeds and payments to/from Machinery and Engines and Financial Products. | |||||||||||||||||
7 Change in investment and common stock related to Financial Products. | |||||||||||||||||
8 Elimination of dividends from Financial Products to Machinery and Engines. | |||||||||||||||||
Page 38
Caterpillar Inc. Supplemental Data for Cash Flow For The Twelve Months Ended December 31, 2006 (Unaudited) (Millions of dollars) | |||||||||||||||||
| �� | |||||||||||||||||
Supplemental Consolidating Data | |||||||||||||||||
Consolidated | Machinery and Engines1 | Financial Products | Consolidating Adjustments | ||||||||||||||
Cash flow from operating activities: | |||||||||||||||||
| Profit | $ | 3,537 | $ | 3,537 | $ | 500 | $ | (500 | )2 | ||||||||
| Adjustments for non-cash items: | |||||||||||||||||
| Depreciation and amortization | 1,602 | 943 | 659 | - | |||||||||||||
| Undistributed profit of Financial Products | - | (128 | ) | - | 128 | 3 | |||||||||||
| Other | 197 | 140 | (330 | ) | 387 | 4 | |||||||||||
| Changes in assets and liabilities: | |||||||||||||||||
| Receivables - trade and other | (148 | ) | (351 | ) | 6 | 197 | 4,5 | ||||||||||
| Inventories | (827 | ) | (827 | ) | - | - | |||||||||||
| Accounts payable and accrued expenses | 670 | 507 | 185 | (22 | )4 | ||||||||||||
| Customer advances | 511 | 511 | - | - | |||||||||||||
| Other assets – net | (262 | ) | (205 | ) | (44 | ) | (13 | )4 | |||||||||
| Other liabilities – net | 519 | 486 | 30 | 3 | 4 | ||||||||||||
| Net cash provided by (used for) operating activities | 5,799 | 4,613 | 1,006 | 180 | |||||||||||||
Cash flow from investing activities: | |||||||||||||||||
| Capital expenditures - excluding equipment leased to others | (1,593 | ) | (1,580 | ) | (41 | ) | 28 | 4 | |||||||||
| Expenditures for equipment leased to others | (1,082 | ) | - | (1,111 | ) | 29 | 4 | ||||||||||
| Proceeds from disposals of property, plant and equipment | 572 | 29 | 581 | (38 | )4 | ||||||||||||
| Additions to finance receivables | (10,522 | ) | - | (35,561 | ) | 25,039 | 5 | ||||||||||
| Collections of finance receivables | 8,094 | - | 32,670 | (24,576 | )5 | ||||||||||||
| Proceeds from the sale of finance receivables | 1,067 | - | 2,110 | (1,043 | )5 | ||||||||||||
| Net intercompany borrowings | - | 123 | (2 | ) | (121 | )6 | |||||||||||
| Investments and acquisitions (net of cash acquired) | (513 | ) | (513 | ) | - | - | |||||||||||
| Proceeds from sale of available-for-sale securities | 539 | 26 | 513 | - | |||||||||||||
| Investments in available-for-sale securities | (681 | ) | (35 | ) | (646 | ) | - | ||||||||||
| Other - net | 323 | 33 | 294 | (4 | )7 | ||||||||||||
| Net cash provided by (used for) investing activities | (3,796 | ) | (1,917 | ) | (1,193 | ) | (686 | ) | |||||||||
Cash flow from financing activities: | |||||||||||||||||
| Dividends paid | (726 | ) | (726 | ) | (372 | ) | 372 | 8 | |||||||||
| Common stock issued, including treasury shares reissued | 414 | 414 | (13 | ) | 13 | 7 | |||||||||||
| Treasury shares purchased | (3,208 | ) | (3,208 | ) | - | - | |||||||||||
| Excess tax benefit from stock-based compensation | 169 | 169 | - | - | |||||||||||||
| Net intercompany borrowings | - | 2 | (123 | ) | 121 | 6 | |||||||||||
| Proceeds from debt issued (original maturities greater than three months) | 11,269 | 1,445 | 9,824 | - | |||||||||||||
| Payments on debt (original maturities greater than three months) | (10,375 | ) | (839 | ) | (9,536 | ) | - | ||||||||||
| Short-term borrowings (original maturities three months or less)-net | (136 | ) | (593 | ) | 457 | - | |||||||||||
| Net cash provided by (used for) financing activities | (2,593 | ) | (3,336 | ) | 237 | 506 | |||||||||||
| Effect of exchange rate changes on cash | 12 | 8 | 4 | - | |||||||||||||
Increase (decrease) in cash and short-term investments | (578 | ) | (632 | ) | 54 | - | |||||||||||
| Cash and short-term investments at beginning of period | 1,108 | 951 | 157 | - | |||||||||||||
| Cash and short-term investments at end of period | $ | 530 | $ | 319 | $ | 211 | $ | - | |||||||||
1 Represents Caterpillar Inc. and its subsidiaries with Financial Products accounted for on the equity basis. | |||||||||||||||||
2 Elimination of Financial Products’ profit after tax due to equity method of accounting. | |||||||||||||||||
3 Non-cash adjustments for the undistributed earnings from Financial Products. | |||||||||||||||||
4 Elimination of non-cash adjustments and changes in assets and liabilities related to consolidated reporting. | |||||||||||||||||
5 Reclassification of Cat Financial’s cash flow activity from investing to operating for receivables that arose from the sale of inventory. | |||||||||||||||||
6 Net proceeds and payments to/from Machinery and Engines and Financial Products. | |||||||||||||||||
7 Change in investment and common stock related to Financial Products. | |||||||||||||||||
8 Elimination of dividends from Financial Products to Machinery and Engines. | |||||||||||||||||
Page 39