Exhibit 99.1
Caterpillar Inc.
1Q 2008 Earnings Release
April 18, 2008
FOR IMMEDIATE RELEASE
Caterpillar Reports Record First-Quarter Sales and Profit
Led by Strong Demand Outside North America
Sales and revenues up 18 percent and profit per share up 18 percent;
Financial Products reports record first-quarter revenues and profit
PEORIA, Ill.— Caterpillar Inc. (NYSE: CAT) today reported record first-quarter profit per share of $1.45, an 18 percent increase from $1.23 per share in the first quarter of 2007. Sales and revenues of $11.796 billion were also a first-quarter record and 18 percent higher than 2007 first-quarter sales and revenues of $10.016 billion.
“I am pleased to be able to report record results this quarter, particularly given the tough economic conditions we’re experiencing in the United States,” said Chairman and Chief Executive Officer Jim Owens. “The sales increase was the result of a tremendous effort by our employees, dealers and suppliers to support customers. We continue to see robust demand for products used in the global mining and energy industries and for machines used by our customers to build infrastructure, particularly in emerging markets. These record results are a remarkable testament to our global strength, the diversity of the end-markets we serve and the strength of our integrated service businesses. Particularly notable, our Financial Products business had their best first-quarter ever for revenues and profit, despite credit market challenges—our long standing and consistent credit practices have served us well,” Owens said.
Sales and revenues were up $1.780 billion from the first quarter of 2007. Sales volume improved $1.087 billion, the impact of currency added $310 million, price realization was up $261 million and Financial Products revenues were $122 million higher. The geographic mix of sales continued to shift with sales and revenues increasing 30 percent outside North America and 4 percent inside North America. Sales and revenues outside North America represented 58 percent of total sales and revenues in the first quarter—up from 53 percent of the total a year ago.
“Even though North America, our largest geographic market, is depressed, we are investing for growth. We are significantly increasing capital expenditures for improved productivity and higher capacity, and our research and development is focused on sustainability and innovative new products. Over the past year we’ve strengthened our balance sheet, and the business strength we’re enjoying has allowed us to reward our stockholders with higher dividends and stock repurchases while maintaining our strong credit rating,” Owens said.
Profit of $922 million was up $106 million, or 13 percent, from $816 million in the first quarter 2007. The improvement was a result of better price realization and higher sales volume, partially offset by higher costs. Profit per share of $1.45 was up $0.22 from $1.23 per share in the first quarter of 2007.
Outlook
The company continues to expect another record year with sales and revenues increasing 5 to 10 percent and profit per share increasing 5 to 15 percent from 2007 despite further weakening in North America.
“We are pleased to be able to maintain an outlook for 2008 that reflects all-time records for sales and revenues and profit,” Owens commented. “Even though we’re currently weathering a recessionary storm in the United States, we expect the rest of the world to continue to invest in infrastructure growth well into the next decade. With the best and broadest line of products and services and the best dealer network in our industry, we are ideally suited to serve our customers wherever they live and work. We will continue to invest in capacity, new products and our global deployment of the Caterpillar Production System (CPS) with 6 Sigma. First and foremost, our commitment to customers is to drive continuous improvement with a focus on quality. While 2008 will undoubtedly be a very challenging year, I’m confident Team Caterpillar with our diversified business model will continue to drive us toward our 2010 goals.”
Note: Glossary of terms included on pages 20-21; first occurrence of terms shown in bold italics.
For more than 80 years, Caterpillar Inc. has been making progress possible and driving positive and sustainable change on every continent. With 2007 sales and revenues of $44.958 billion, Caterpillar is the world’s leading manufacturer of construction and mining equipment, diesel and natural gas engines and industrial gas turbines. The company also is a leading services provider through Caterpillar Financial Services, Caterpillar Remanufacturing Services, Caterpillar Logistics Services and Progress Rail Services. More information is available at: http://www.cat.com.
Caterpillar contact: Jim Dugan, Corporate Public Affairs, (309) 494-4100 (Office) or (309) 360-7311 (Mobile)
SAFE HARBOR
Certain statements in this release relate to future events and expectations and as such constitute forward-looking statements involving known and unknown factors that may cause actual results of Caterpillar Inc. to be different from those expressed or implied in the forward-looking statements. In this context, words such as "will," "expect," "anticipate" or other similar words and phrases often identify forward-looking statements made on behalf of Caterpillar. It is important to note that actual results of the company may differ materially from those described or implied in such forward-looking statements based on a number of factors and uncertainties, including, but not limited to, changes in economic conditions; currency exchange or interest rates; political stability; market acceptance of the company's products and services; significant changes in the competitive environment; epidemic diseases; changes in law, regulations and tax rates; and other general economic, business and financing conditions and factors described in more detail in the company's Form 10-K filed with the Securities and Exchange Commission on February 22, 2008. This filing is available on our website at www.cat.com/sec_filings. We do not undertake to update our forward-looking statements.
-2-
Key Points
First Quarter 2008
| § | First-quarter sales and revenues of $11.796 billion were the highest in company history for a first quarter and 18 percent higher than first quarter of 2007. |
| § | Driven by the continued strength outside North America, Machinery sales increased 16 percent, Engines sales increased 22 percent and Financial Products revenues rose 18 percent from a year ago. |
| § | Profit of $1.45 per share was up 18 percent from the first quarter of 2007. |
| § | The percent of sales and revenues outside North America continued to increase with 58 percent of total sales and revenues outside North America this quarter compared with 53 percent in the first quarter last year. |
(Dollars in millions except per share data) | |||||||||||||
| First Quarter 2007 | First Quarter 2008 | $ Change | % Change | ||||||||||
Machinery and Engines Sales | $ | 9,321 | $ | 10,979 | $ | 1,658 | 18% | ||||||
| Financial Products Revenues | 695 | 817 | 122 | 18% | |||||||||
| Total Sales and Revenues | 10,016 | 11,796 | 1,780 | 18% | |||||||||
Profit After Tax | $ | 816 | $ | 922 | $ | 106 | 13% | ||||||
| Profit per common share - diluted | $ | 1.23 | $ | 1.45 | $ | 0.22 | 18% | ||||||
Machinery and Engines sales improved $1.658 billion on continued robust demand for products used in the global mining and energy industries and for machines used by our customers to build infrastructure, particularly in emerging markets. The strength of economies outside the United States, our broad global footprint and growth in integrated service businesses contributed to the growth in sales.
Profit per share improved 18 percent.
Machinery and Engines operating cash flow of $408 million was up $184 million from first quarter 2007. During the quarter we spent $692 million to repurchase 10.3 million shares.
2008 Outlook
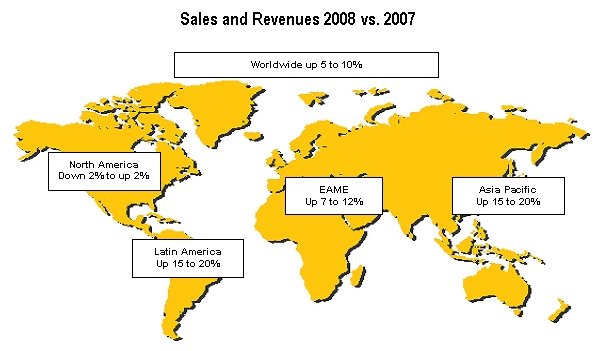
| § | We are maintaining our 2008 outlook for an increase in sales and revenues of 5 to 10 percent and profit per share up 5 to 15 percent from 2007 despite further weakening in North America. While sales and revenues in North America are now expected to be in a range of down 2 percent to up 2 percent compared to a range of flat to up 5 percent in our original outlook, strong demand outside North America is expected to offset this weakness. |
| § | We are forecasting 2008 to be the sixth consecutive year of record sales and revenues driven by strength in the economies of the developing world and robust global demand related to mining and energy. |
| § | We expect 2008 to be the fifth consecutive year of record profit per share, a reflection of our broad global footprint and diverse products and services. |
A question and answer section has been included in this release starting on page 14.
-3-
DETAILED ANALYSIS
First Quarter 2008 vs. First Quarter 2007
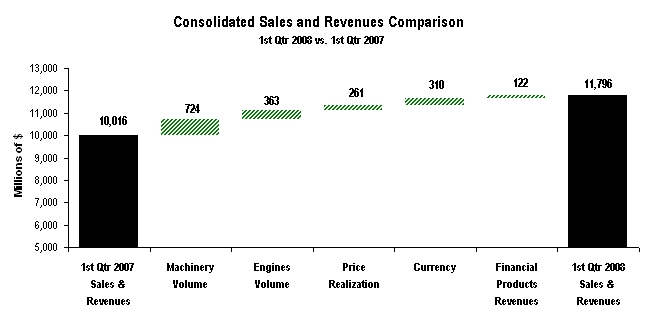 |
| The chart above graphically illustrates reasons for the change in Consolidated Sales and Revenues between first quarter 2007 (at left) and first quarter 2008 (at right). Items favorably impacting sales and revenues appear as upward stair steps with the corresponding dollar amounts above each bar, while items negatively impacting sales and revenues appear as downward stair steps with dollar amounts reflected in parentheses above each bar. Caterpillar management utilizes these charts internally to visually communicate with the company’s Board of Directors and employees. |
Sales and Revenues
Sales and revenues for first quarter 2008 were $11.796 billion, up $1.780 billion, or 18 percent, from first quarter 2007. Machinery volume was up $724 million, and Engines volume was up $363 million, both driven by strength in economies outside the United States. Price realization improved $261 million and currency had a positive impact on sales of $310 million, primarily due to a stronger euro. In addition, Financial Products revenues increased $122 million.
Sales and Revenues by Geographic Region | ||||||||||||||||||||||||
(Millions of dollars) | Total | % Change | North America | % Change | EAME | % Change | Asia/ Pacific | % Change | Latin America | % Change | ||||||||||||||
| First Quarter 2008 | ||||||||||||||||||||||||
| Machinery | $ | 7,548 | 16% | $ | 3,180 | 3% | $ | 2,344 | 27% | $ | 1,206 | 35% | $ | 818 | 18% | |||||||||
Engines (1) | 3,431 | 22% | 1,208 | 3% | 1,331 | 33% | 559 | 40% | 333 | 33% | ||||||||||||||
| Financial Products (2) | 817 | 18% | 514 | 6% | 139 | 36% | 82 | 49% | 82 | 55% | ||||||||||||||
| $ | 11,796 | 18% | $ | 4,902 | 4% | $ | 3,814 | 30% | $ | 1,847 | 37% | $ | 1,233 | 24% | ||||||||||
| First Quarter 2007 | ||||||||||||||||||||||||
| Machinery | $ | 6,501 | $ | 3,078 | $ | 1,840 | $ | 891 | $ | 692 | ||||||||||||||
| Engines (1) | 2,820 | 1,168 | 1,003 | 399 | 250 | |||||||||||||||||||
| Financial Products (2) | 695 | 485 | 102 | 55 | 53 | |||||||||||||||||||
| $ | 10,016 | $ | 4,731 | $ | 2,945 | $ | 1,345 | $ | 995 | |||||||||||||||
| (1) Does not include internal engines transfers of $690 million and $621 million in first quarter 2008 and 2007, respectively. Internal engines transfers are valued at prices comparable to those for unrelated parties. | ||||||||||||||||||||||||
(2) Does not include internal revenues earned from Machinery and Engines of $95 million and $104 million in first quarter 2008 and 2007, respectively. | ||||||||||||||||||||||||
-4-
Machinery Sales
Sales of $7.548 billion were an increase of $1.047 billion, or 16 percent, from first quarter 2007.
| § | Machinery volume increased $724 million. |
| § | Price realization increased $101 million. |
| § | Currency benefited sales by $222 million. |
| § | Geographic mix between regions (included in price realization) was $9 million unfavorable. |
| § | Overall, dealer-reported inventories increased from year-end. This is the normal practice for dealers as they prepare for higher deliveries in the spring and summer. Dealer inventories at the end of the quarter were lean and were below the first quarter of 2007 in terms of months of supply. |
| § | Dealer reports indicate customer demand in North America weakened further during the quarter. Problems were widespread, with coal mining one of the few bright spots. Much higher coal prices and increased exports drove that improvement. |
| § | Sales outside North America increased 28 percent, largely in the developing economies. Developing countries maintained expansive economic policies, which allowed good economic growth to continue. Exports increased, contributing to a 34 percent gain in foreign exchange reserves. As a result, construction increased significantly in many countries. |
| § | Oil prices rose about 70 percent compared to the first quarter of 2007 and production increased. The resulting higher revenues drove increased drilling and exploration in many oil-producing countries and supported increased construction. |
| § | Metals prices increased 32 percent from a year earlier, encouraging increased output and investment. Coal prices also increased sharply, helping increase sales of products used in mining. |
North America – Sales increased $102 million, or 3 percent.
| § | Sales volume increased $66 million. |
| § | Price realization increased $36 million. |
| § | Dealers reported an increase in inventory from year-end 2007. However, inventories were substantially lower than the first quarter of 2007 in both dollars and months of supply. |
| § | Economic conditions during the quarter were very unfavorable, causing dealers to report significantly lower deliveries than in first quarter 2007. The year-on-year percent decline was the steepest reported in the current downturn, which started in 2006. |
| § | Housing starts averaged a little more than 1 million units during the quarter, 29 percent lower than last year. Prices for both new and existing homes declined, banks tightened mortgage lending standards and homebuilders held almost a 10-month supply of homes. |
| § | Economic factors impacting nonresidential construction were unfavorable. Prices of commercial property declined, banks tightened standards for commercial and industrial lending and vacancy rates increased. Orders for new construction declined 1 percent, and employment in nonresidential construction dropped 3 percent. |
| § | Quarry and aggregate production declined 15 percent from last year, reflecting weakness in construction. |
| § | The Central Appalachian spot coal price averaged 77 percent higher during the quarter than a year earlier, reflecting strength in international markets. Coal exports have increased sharply and likely accounted for the 3 percent increase in coal production during the quarter. These improvements led to a recovery in sales of products used in coal mining. |
-5-
EAME – Sales increased $504 million, or 27 percent.
| § | Sales volume increased $300 million. |
| § | Price realization increased $47 million. |
| § | Currency benefited sales by $157 million. |
| § | Dealers reported inventories were up to manage a large increase in their deliveries. Inventories in months of supply ended the quarter about the same as a year earlier. |
| § | Sales volume in Europe was about the same as a year earlier. The Euro-zone economy has slowed, and European housing permits declined 10 percent last year. Nonresidential building and infrastructure construction increased. |
| § | Sales volume increased significantly in Africa/Middle East. In South Africa, plans for new construction increased sharply, and exports of coal and metals increased 20 percent. In the oil producing countries, oil production increased 4 percent. This increase, along with 70 percent higher oil prices, allowed construction booms to continue. |
| § | Sales volume also grew significantly in the Commonwealth of Independent States (CIS), largely in Russia and Kazakhstan. In Russia, low interest rates and good economic growth contributed to a 30 percent increase in construction. Kazakhstan increased natural gas production 18 percent, coal production 21 percent and oil production 10 percent. |
Asia/Pacific – Sales increased $315 million, or 35 percent.
| § | Sales volume increased $251 million. |
| § | Price realization increased $16 million. |
| § | Currency benefited sales by $48 million. |
| § | Dealers reported lower inventories than a year ago in terms of months of supply. |
| § | Sales volume in China increased substantially. The economy continued to grow rapidly despite repeated tightening in economic policies. Housing construction increased 30 percent, and nonresidential building construction was up 23 percent. Coal mines produced 13 percent more, and iron ore production increased 21 percent. |
| § | Indonesia raised interest rates slightly, but economic policies remained expansive. Both the economy and construction appeared to increase in the first quarter. Higher coal prices encouraged growth in the coal mining industry. As a result of these favorable factors, sales increased significantly. |
| § | Sizable sales growth occurred in India. The central bank allowed good growth in liquidity, and the central government significantly increased capital expenditures. Expansive policies boosted construction, which increased more than 10 percent per year the last 5 years. Mining benefited from higher iron ore and coal prices. |
Latin America – Sales increased $126 million, or 18 percent.
| § | Sales volume increased $98 million. |
| § | Price realization increased $11 million. |
| § | Currency benefited sales by $17 million. |
| § | Dealers reported lower inventories than a year ago in terms of months of supply. |
| § | Economic policies in most countries were very expansive, which boosted construction activity well above a year earlier. Exports increased significantly, and foreign exchange reserves increased 36 percent from last year. |
| § | Oil production declined 2 percent, but much higher prices increased revenues. The number of operating drill rigs increased 5 percent. |
| § | Metals mining was another positive for the region. Brazil increased output 8 percent, with iron ore production up 13 percent. Chile increased production 2 percent. |
-6-
Engines Sales
Sales of $3.431 billion were an increase of $611 million, or 22 percent, from first quarter 2007.
| § | Sales volume increased $363 million. |
| § | Price realization increased $160 million. |
| § | Currency benefited sales $88 million. |
| § | Geographic mix between regions (included in price realization) was $10 million favorable. |
| § | Dealer-reported inventories were up; months of supply were flat as the inventories were supported by strong delivery rates. |
North America – Sales increased $40 million, or 3 percent.
| § | Sales volume decreased $27 million. |
| § | Price realization increased $67 million. |
| § | Sales for on-highway truck applications increased 18 percent compared to a very weak first quarter 2007. The industry and our shipments remain below historic norms due to the slowing U.S. economy that has resulted in a reduction in freight tonnage. |
| § | Sales for electric power applications decreased 21 percent resulting from a gradual decline in the construction of light commercial facilities. |
| § | Sales for marine applications increased 16 percent with strong demand for supply vessels in support of the offshore petroleum industry. |
EAME – Sales increased $328 million, or 33 percent.
| § | Sales volume increased $214 million. |
| § | Price realization increased $43 million. |
| § | Currency benefited sales by $71 million. |
| § | Sales for petroleum applications increased 106 percent based on strong demand for engines used in drilling and production. Turbine and turbine-related services increased to support gas transmission applications in Europe and the Middle East and oil and gas applications in Africa. |
§ | Sales for electric power applications increased 25 percent with strong demand for small to medium-sized units selling into Africa/Middle East and Russia. Turbine sales increased as a result of large power plant projects. |
| § | Sales for marine applications increased 31 percent with higher demand for workboats and commercial vessels. |
| § | Sales for industrial applications increased 13 percent with strong demand for agriculture and other types of Original Equipment Manufacturers (OEMs) machines. This demand has been driven by good economic conditions. |
-7-
Asia/Pacific – Sales increased $160 million, or 40 percent.
| § | Sales volume increased $115 million. |
| § | Price realization increased $28 million. |
| § | Currency benefited sales by $17 million. |
| § | Sales for petroleum applications increased 58 percent as Chinese drill rig builders continued to manufacture at record high levels for domestic and export use. |
| § | Sales for marine applications increased 29 percent with continued strong demand for workboat and offshore shipbuilding. Large diesel demand grew in the offshore and general cargo industries. |
| § | Sales for industrial applications increased 100 percent driven by sales in Australia into mining and irrigation sectors and by sales in New Zealand into compressed natural gas applications. Smaller product benefited from sales into Chinese and Korean industrial OEMs. |
| § | Sales of electric power engines increased 11 percent with the start of a large rental power project in Bangladesh and with growth in Australia due to strong telecom and rental business. |
Latin America – Sales increased $83 million, or 33 percent.
| § | Sales volume increased $71 million. |
| § | Price realization increased $12 million. |
| § | Sales for petroleum applications increased 48 percent as turbines and turbine-related services increased for gas transmission applications in Brazil and Argentina and for oil and gas production applications in Brazil and Mexico. |
| § | Sales for electric power engines increased 24 percent due to growth in sales of medium-sized product into Brazil, Argentina and Chile. |
| § | Sales for on-highway truck applications increased 19 percent as industry demand strengthened in advance of the mid-year 2008 emissions changes in the region. |
Financial Products Revenues
Revenues of $817 million were an increase of $122 million, or 18 percent, from the first quarter 2007.
| § | Growth in average earning assets increased revenues $102 million. |
| § | Revenues from earned premiums at Cat Insurance increased $19 million. |
-8-
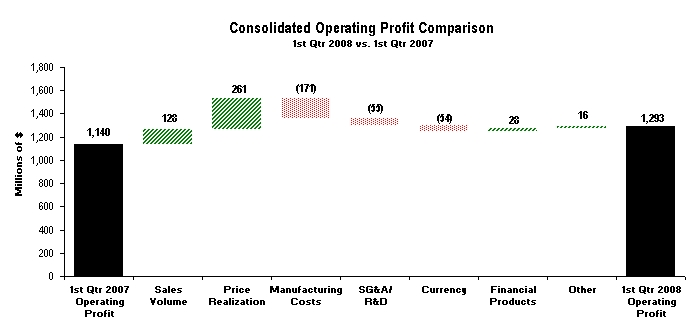 |
The chart above graphically illustrates reasons for the change in Consolidated Operating Profit between first quarter 2007 (at left) and first quarter 2008 (at right). Items favorably impacting operating profit appear as upward stair steps with the corresponding dollar amounts above each bar, while items negatively impacting operating profit appear as downward stair steps with dollar amounts reflected in parentheses above each bar. Caterpillar management utilizes these charts internally to visually communicate with the company’s Board of Directors and employees. The bar entitled Other includes the operating profit impact of consolidating adjustments and Machinery and Engines other operating expenses. |
Operating Profit
Operating profit in first quarter 2008 of $1.293 billion was $153 million higher than first quarter 2007 as improved price realization and higher sales volume were partially offset by higher costs and the unfavorable impact of currency. Sales volume includes the impact of a negative mix of product.
Manufacturing costs rose $171 million or about 2 percent compared with first quarter 2007. The increase was primarily due to inflation on material, labor and overhead costs. However, we continue to experience supply chain and capacity related challenges in our manufacturing operations.
Selling, General and Administrative (SG&A) and Research and Development (R&D) costs were up $55 million to support order fulfillment/velocity initiatives, significant new product programs and growth.
Currency had a $54 million unfavorable impact on operating profit as the benefit to sales was more than offset by the negative impact on costs.
Operating Profit by Principal Line of Business | |||||||||||||
| (Millions of dollars) | First Quarter 2007 | First Quarter 2008 | $ Change | % Change | |||||||||
| Machinery (1) | $ | 717 | $ | 626 | $ | (91) | (13%) | ||||||
| Engines (1) | 347 | 554 | 207 | 60% | |||||||||
| Financial Products | 167 | 195 | 28 | 17% | |||||||||
| Consolidating Adjustments | (91) | (82) | 9 | ||||||||||
| Consolidated Operating Profit | $ | 1,140 | $ | 1,293 | $ | 153 | 13% | ||||||
| (1) Caterpillar operations are highly integrated; therefore, the company uses a number of allocations to determine lines of business operating profit for Machinery and Engines. | |||||||||||||
-9-
Operating Profit by Principal Line of Business
| § | Machinery operating profit of $626 million was down $91 million, or 13 percent, from first quarter 2007. The positive impact of improved price realization and higher sales volume was more than offset by higher costs. Sales volume includes the impact of a negative mix of product. |
| § | Engines operating profit of $554 million was up $207 million, or 60 percent, from first quarter 2007. The favorable impacts of improved price realization and higher sales volume were partially offset by higher costs. |
| § | Financial Products operating profit of $195 million was up $28 million, or 17 percent, from first quarter 2007. The increase was primarily attributable to a $29 million impact from higher average earning assets and a $13 million impact from improved net yield on average earning assets, partially offset by a $19 million increase in the provision for credit losses at Cat Financial. |
Other Profit/Loss Items
| § | Other income/expense was income of $112 million compared with income of $111 million in first quarter 2007. First quarter 2008 other income/expense included a $60 million gain on the sale of our equity investment in ASV and several favorable miscellaneous items. These were offset by the absence of a $46 million gain on the sale of a cost-basis investment in first quarter 2007 and the unfavorable impacts of currency. |
| § | The provision for income taxes in the first quarter reflects an estimated annual tax rate of 31.5 percent for 2008 compared to 32 percent for the first quarter 2007 and 30 percent for the full-year 2007. The increase over 2007 is attributable to expected changes in our geographic mix of profits from a tax perspective and the expiration of the U.S. research and development tax credit. |
Employment
Caterpillar's worldwide employment was 102,623 in first quarter 2008, up 7,289 from 95,334 in first quarter 2007. Of the increase, approximately 3,000 were the result of acquisitions. The remaining increase of approximately 4,300 employees primarily supported increased volumes, growth and new product introductions.
-10-
2008 Outlook
We are expecting worldwide economic growth to average less than 3 percent in 2008, the slowest growth rate since 2003. The U.S. economy accounts for much of the slowdown with developing economies continuing strong growth, but at a slower rate than 2007.
| § | Most developed countries will likely lower interest rates, while many developing economies are likely to tighten economic policies to slow growth and reduce inflation. However, developing countries currently have very expansive policies in place. |
| § | The West Texas Intermediate oil price should average more than $95 per barrel, and that should continue to encourage increased drilling activity and pipeline construction. |
| § | Spot thermal coal prices should average more than 70 percent higher than last year, and annual contract prices should more than double. The first annual contract for coking coal tripled prices, effective April 1, 2008. Demand remains strong, and supply and transport difficulties are expected to continue. |
| § | Base metals inventories are extremely low, and demand in the developing economies remains strong. We expect most metals prices to remain very attractive for new investment this year. |
North American economies should grow a little over 0.5 percent in 2008 with Canada continuing to outperform the United States.
| § | The deluge of unfavorable economic news in the first quarter indicates that a U.S. recession is likely. We expect the U.S. economy will grow about 0.5 percent in 2008. Our dealer-reported deliveries, which have been a reliable leading indicator of the economy’s health, continue to decline. |
| § | Elevated interest rate spreads, a yield curve that is still too flat for economic recovery and extremely slow growth in the monetary base indicate that the Fed needs to cut interest rates further. Our outlook assumes a 1.5 percent Fed Funds rate by year-end. |
| § | We forecast housing starts will average one million units this year, the lowest since 1945. |
| § | Nonresidential construction orders are expected to decline. Unfavorable factors include rising vacancy rates and declining property prices. |
| § | Declines in construction should drive a reduction in quarry and aggregate production. |
Economic growth should average about 4 percent outside North America, about half a percentage point lower than last year.
| § | Economic growth could slow to about 2 percent in Europe. As a result, we project the European Central Bank will cut its interest rate from 4 to 3.75 percent, and the Bank of England will likely take one more reduction, dropping its rate to 4.75 percent. |
| § | Housing permits have declined in Europe, and home prices are decreasing in several countries. Housing construction should decline this year, but nonresidential building and infrastructure construction should increase. Positives include high capacity utilization, readily available credit and increased government spending. |
-11-
§ | Growth in Africa/Middle East should be about 6 percent, slightly higher than last year. We expect the CIS economy will increase about 7 percent, slower than in the past two years. Russian inflation is above target, which should lead to some tightening in economic policies. High commodity prices should continue to benefit mining, energy development and construction in both Africa/Middle East and CIS. |
| § | Latin American economies should grow about 5 percent, a half percentage point lower than last year. Inflation has increased in several countries, which should prompt further interest rate increases. However, we expect that both construction and mining will do well. |
| § | We expect 7.5 percent economic growth in Asia/Pacific, more than a half percentage slower than last year. Growth should slow in most countries but not enough to disrupt construction. |
| § | Asia/Pacific is the world’s largest consumer of most mined commodities as well as the world’s largest producer. The high rate of economic growth in the region should keep commodity demand high, benefiting mine production and development. |
Sales and Revenues Outlook
We are maintaining our forecast of 5 to 10 percent growth in sales and revenues, which would make 2008 another record year. However, the geographic make up of the outlook has changed. North America is expected to be weaker, with sales and revenues in a range of down 2 percent to up 2 percent for the year as compared with our original outlook, which expected sales to be flat to up 5 percent from 2007. Sales and revenues in all regions outside of North America are expected to be higher than the previous outlook.
-12-
We expect that North America will be the weakest region for growth this year with sales and revenues down 2 percent to up 2 percent. The overall economy and construction activity will likely be weaker than we had previously expected. We expect that dealer sales of new machines will decline substantially in 2008. The factors that are helping offset the impact of very difficult economic conditions in the United States are:
| § | In 2007, dealers reduced their machine inventories by about $1.1 billion, resulting in company sales to North American dealers lower than dealer sales to end customers. While we expect dealer sales to end users to decline again in 2008, company sales will benefit as a result of substantially lower forecasted changes to dealer inventories than we experienced in 2007. |
| § | Sales related to energy and metals mining remain strong and are expected to improve again in 2008. |
| § | While sales to U.S. coal mines were depressed in 2007, rising coal prices and increasing exports are driving improvements in 2008. |
| § | While the industry for on-highway truck engines is still very weak as a result of very slow growth in the U.S. economy, we expect our sales to improve from the depressed levels of 2007. |
Sales are expected to increase in the range of 10 to 15 percent outside North America. Strong rest of world sales are being driven by solid economic growth in most regions, continued investment in infrastructure throughout much of the world and commodity prices for metals, minerals and energy at levels that encourage our customers to invest.
Profit Outlook
We are maintaining the outlook for profit per share—up 5 to 15 percent from 2007—our fifth consecutive year of record profit per share. While the profit per share outlook has not changed, some elements of the forecast have. While price realization expectations have improved, we expect the benefit to be about offset by increased pressure on material costs and the impact of currency on profit.
-13-
Questions and Answers
Sales and Revenues / Economy and Industry
| Q1: | Have you changed your outlook for the U.S. economy in general and housing construction in particular? |
| A: | We have been pessimistic about the U.S. economy since our preliminary 2008 outlook last October, and our year-end financial release forecast U.S. economic growth at about 1.0 percent this year. Since our January release, we have become slightly more negative and have lowered our U.S. economic growth expectation for the full year to 0.5 percent. We have also lowered our forecast for housing starts from 1.1 million units to 1.0 million, and we also expect nonresidential construction to be weaker. |
| Q2: | It appears that parts of Europe are showing signs of economic weakness. Have your expectations for sales in the EAME region declined for 2008? |
| A. | Our last outlook expected European economic growth to slow to 2.3 percent in 2008. We have lowered the first quarter forecast to about 2 percent growth. We expect sales growth in Europe to slow in response to tighter financial conditions, declining housing permits and some slowing in nonresidential construction. We believe the European Central Bank will take one 25-basis point rate cut rather than hold rates steady as previously expected. The Bank of England is expected to cut rates further. Offsetting that modest deterioration in Europe, sales in Africa/Middle East and the CIS should do better. First-quarter sales in those two areas were very strong. |
| Q3: | Your outlook reflects slower world economic growth and a more negative view of the U.S. economy in particular, yet your outlook for 2008 sales and revenues expects growth from 2007. Can you comment on why your sales are expected to be up from last year in this economic environment? |
| A: | Several factors explain our expectations for higher sales: |
| - | North American dealers reduced their reported machine inventories by about $1.1 billion last year, which contributed to the sales decline in North America. We expect North American dealers will reduce inventories by a much smaller amount in 2008, so the impact on company sales will be less severe. |
| - | The North American heavy-duty on-highway truck industry should increase slightly this year, a sharp contrast from the severe decline last year. |
| - | Developing economies should continue to grow rapidly, which has been very positive for growth in construction. |
| - | Coal, metals, oil and natural gas prices are much higher than a year earlier. These higher prices should encourage more investment in these industries. |
-14-
| Q4: | Mining as well as oil and gas have been very strong industries for the past few years. Can you comment on your expectations for 2008? |
| A: | We expect these industries to remain very healthy in 2008. Spare capacity and inventories are low, and demand is benefiting from fast economic growth in the developing economies. Production in these industries has been less than expected, and prices have continued to increase. Insufficient investment in the 1980s and 1990s left production capacity in the energy and mining industries inadequate for current needs; correcting that shortfall could require more time and significantly more investment. |
| Q5: | In your year-end 2007 financial release you said that you expected an improvement in sales related to U.S. coal mining. Are you seeing that actually happen? |
| A: | Yes. Dealers reported higher deliveries to coal mines in the first quarter. The Central Appalachian coal price increased 77 percent in the first quarter compared to a year earlier, and Powder River prices (Western coal) rose 62 percent. Contract prices for coal for the new fiscal year, which started April 1, 2008, should be up substantially, possibly more than double last year’s prices. Those contract prices should support U.S. spot prices and encourage more U.S. coal exports. Exports in fourth quarter 2007 rose 33 percent from a year earlier. |
Q6: Can you comment on how dealer inventory changed in the first quarter?
| A: | Worldwide dealer machine inventories increased about $700 million from year-end levels—about 60 percent of the increase was in North America. Seasonally, it is common for dealers to increase inventories in the first quarter in preparation for spring and summer when sales to end users are usually higher. |
Compared with the end of first quarter 2007, overall dealer inventories were about flat with North American inventory down about $600 million and inventory outside North America up about $650 million.
| Q7: | Can you discuss how the weakening U.S. dollar is impacting your Machinery and Engines business? Does a weaker dollar help or hurt your results? |
| A: | Changing exchange rates generally impact Machinery and Engines as follows: |
| 1. | Sales that are denominated in non-U.S. currency translate into more dollars when the dollar weakens—that’s a positive and contributed $310 million to higher sales in the first quarter compared with the first quarter last year. |
| 2. | Operating costs denominated in non-U.S. currency translate into more dollars when the U.S. dollar weakens—this has a negative impact on costs. First-quarter manufacturing costs were $343 million higher, and SG&A and R&D costs were $21 million higher as a result of a weaker U.S. dollar. | |
| 3. | To reduce the risk and impact of fluctuations in exchange rates, we enter into currency forward and option contracts. The net effect of these hedge contracts appears in Other Income/Expense (below Operating Profit). Other Income/Expense also includes currency gains and losses on asset and liability positions denominated in non-U.S. currencies. We have a net liability position in non-U.S. currencies, and thus the weaker dollar results in a negative translation impact on profit. The combined currency-related effects on Other Income/Expense were $47 million unfavorable compared to first quarter 2007. |
-15-
| 4. | A weaker dollar has a favorable competitive impact in areas where pricing is in or directly linked to U.S. dollars, our competitors have a non-dollar cost base and we are sourcing from the United States. This competitive impact is one of the factors that enabled our recently announced mid-year price increase. The impact is very difficult to quantify, and the timing generally lags currency movement. |
| Engines |
| Q8: | Can you update your expectations for the 2008 heavy-duty on-highway truck industry? |
| A: | We expect very weak U.S. economic growth will result in freight tonnage below 2007 levels. This, coupled with surging diesel fuel prices, should impact on-highway carriers’ operating profits. Truck fleets have adequate freight capacity, and most carriers will likely make only replacement purchases. For 2008, we project the North American heavy-duty truck industry will be 175,000 to 185,000 vehicles, compared to 174,000 units in 2007. |
| Q9: | What is the progress on capacity expansion at Lafayette, Indiana for large engines? |
| A: | Our large engine capacity increase program continues to be on schedule, and capacity has increased this year as expected. Expansion will continue through 2010. |
| Q10: | You’ve said that you are facing an important decision on the future of your on-highway truck engine business. When will you be ready to talk about your plans? |
| A: | Coming to a conclusion is taking longer than anticipated. We will communicate our strategy to the market as soon as possible. |
Costs / Profit
| Q11: | Are increasing steel prices expected to impact your material costs in 2008 more than you expected in the 2008 outlook you provided in January? |
| A: | Yes. We are continuing to experience increased pressure on material costs due largely to very high steel and iron-related material prices. Some of the key elements that impact iron-based materials are energy, iron ore, steel scrap, nickel and metallurgical coals (also known as coking coals). In recent months, there have been a variety of economic factors that have driven up these costs. |
| Q12: | You changed the layout of your analysis of the change in operating profit (the waterfall chart). Why the change and what is different? |
| A: | We changed the layout of our quarter over quarter analysis in order to improve the linkage to the financial statements. The new layout should make it easier to isolate the change in Machinery and Engines gross margin as shown on the Results of Operations statement. |
-16-
| Q13: | Can you break down your gross margin in more detail? |
| A: | The following table summarizes the change in gross margin in first quarter 2008 versus first quarter 2007. |
Gross Margin Change (Millions of dollars) | |||||
| First Quarter 2007 Gross Margin | $ | 2,185 | |||
| Change due to: | |||||
| Volume | $ | 128 | |||
| Price Realization | 261 | ||||
| Manufacturing Costs | (171) | ||||
| Currency | (33) | ||||
| Total Change | 185 | ||||
| First Quarter 2008 Gross Margin | $ | 2,370 |
| Q14: | Can you comment on the currency change in Machinery and Engines SG&A and R&D? |
| A: | The following table summarizes the currency impact on Machinery and Engines SG&A and R&D in first quarter 2008 versus first quarter 2007. |
SG&A and R&D Change (Millions of dollars) | |||||||||
| SG&A | R&D | Total | |||||||
| First Quarter 2007 | $ | 785 | $ | 340 | $ | 1,125 | |||
| Change due to: | |||||||||
| Cost increase | 29 | 26 | 55 | ||||||
| Cost increase due to Currency | 18 | 3 | 21 | ||||||
| First Quarter 2008 | $ | 832 | $ | 369 | $ | 1,201 | |||
Cash Flow / Financing
| Q15: | Can you comment on the strength of your financial position? |
| A: | The debt-to-capital ratio for Machinery and Engines was 31.2 percent at the end of first quarter, better than our current target range of 35 to 45 percent. We are in a strong financial position that provides us flexibility to take advantage of future opportunities. |
-17-
| Q16: | Can you comment on 2008 operating cash flow? |
| A: | For Machinery and Engines, first quarter operating cash flow was $408 million. This was $184 million, or 82 percent, higher than first quarter 2007 operating cash flow of $224 million. The strong cash flow from Machinery and Engines helped support the following: |
| - | Capital Expenditures - $340 million— primarily to replace and upgrade existing production assets, facilitate additional expansion of manufacturing capacity and support new product programs. |
| - | Dividends - $223 million—an increase of $30 million compared to first quarter 2007. The quarterly dividend is currently 36 cents per share, up 20 percent from a year ago. |
| - | Stock Repurchase - $692 million—used to repurchase 10.3 million shares. |
| Q17: | How much stock was repurchased in the first quarter? Also, how many shares were outstanding at quarter-end? |
| A: | Our continued stock buy back is in support of our Board-authorized $7.5 billion stock repurchase program. In the first quarter we repurchased 10.3 million shares at a cost of $692 million. Basic shares outstanding at the end of the quarter were 615 million. |
| Q18: | Are credit markets having any significant negative impact at Cat Financial Services? Has Cat Financial's past due ratio increased much this year? How about credit losses? |
| A: | Recent global credit market conditions have not had a significant impact on Cat Financial’s access to liquidity but have resulted in market-wide increased credit spreads on new term debt issuance. Recent term debt issuance has met with strong investor demand. Commercial paper market access has remained favorable overall, with consistent demand and attractive pricing for our issuance in the United States. Internationally, Cat Financial commercial paper demand and overall pricing levels have been acceptable. |
At the end of the first quarter, past dues were 2.81 percent compared with 2.36 percent at the end of 2007 and 2.06 percent at the end of first quarter 2007. Most of the increase continues to be related to the downturn in the U.S. housing industry. We expect there will be continued upward pressure on U.S. past dues throughout 2008. However, our international market portfolio continues to perform well.
Write-offs net of recoveries were $20 million in the first quarter, compared with $15 million in 2007. This increase has been driven by the downturn in the U.S. housing industry and 17 percent growth in Cat Financial's average retail finance receivable portfolio. We expect that write-offs through the remainder of 2008 will be higher than 2007 but near historical averages.
At the end of the first quarter 2008, Cat Financial's allowance for credit losses totaled $374 million, an increase of $51 million from the first quarter of 2007. The increase is mostly attributable to growth in the retail finance receivable portfolio and also includes $5 million from increasing the allowance from 1.39 percent to 1.41 percent of net finance receivables in the first quarter.
-18-
| Shin Caterpillar Mitsubishi (SCM) |
| Q19: | Can you comment on how the share redemption and your increase in ownership at SCM from 50 to 67 percent will impact sales and revenues? |
| A: | The following table illustrates the impact on Caterpillar sales had the share redemption and increase in ownership taken place in 2007: |
| (Billions of dollars) | ||||
| Total 2007 SCM Sales | $ | 3.2 | ||
| Less: | ||||
| SCM sales to Caterpillar | (1.7) | |||
| Caterpillar sales to SCM | (0.3) | |||
| Increase in Caterpillar sales | $ | 1.2 | ||
| Q20: | What would the impact of increased ownership in SCM have been on your operating profit as a percent of sales? |
| A: | After inter-company sales and profit eliminations and estimated impacts related to accounting for the share redemption, the impact on Caterpillar’s 2007 operating profit as a percent of sales would have been minimal had SCM been consolidated. |
| Q21: | How will the consolidation of SCM impact your after tax profit? |
| A: | We expect the increase in ownership of SCM to have very little impact on Caterpillar’s profit after tax in the short-term. The share redemption by SCM will increase Caterpillar’s ownership of SCM from 50 to 67 percent. Profit related to Caterpillar’s 50 percent ownership was already included in profit after tax, on the “Equity in Profit of Unconsolidated Affiliates” line in Caterpillar’s Results of Operations. The transaction has not closed, and the accounting work to consolidate SCM is not complete, but we expect that the impact of higher depreciation, amortization and interest expense related to the share redemption are expected to about offset profit from the additional 17 percent of ownership. |
| Q22: | How will the consolidation of SCM impact your Machinery and Engines debt? |
| A: | The consolidation of SCM’s financial position will increase Caterpillar’s Machinery and Engines debt, partly from SCM’s existing debt and partly from additional borrowing by SCM to complete the share redemption. |
-19-
GLOSSARY OF TERMS
| 1. | Caterpillar Production System (CPS) – The Caterpillar Production System is the common Order-to-Delivery process being implemented enterprise-wide to achieve our safety, quality, velocity, earnings and growth goals for 2010 and beyond. |
| 2. | Consolidating Adjustments – Eliminations of transactions between Machinery and Engines and Financial Products. |
| 3. | Currency – With respect to sales and revenues, currency represents the translation impact on sales resulting from changes in foreign currency exchange rates versus the U.S. dollar. With respect to operating profit, currency represents the net translation impact on sales and operating costs resulting from changes in foreign currency exchange rates versus the U.S. dollar. Currency includes the impacts on sales and operating profit for the Machinery and Engines lines of business only; currency impacts on Financial Products revenues and operating profit are included in the Financial Products portions of the respective analyses. With respect to other income/expense, currency represents the effects of forward and option contracts entered into by the company to reduce the risk of fluctuations in exchange rates and the net effect of changes in foreign currency exchange rates on our foreign currency assets and liabilities for consolidated results. |
| 4. | Debt-to-Capital Ratio – A key measure of financial strength used by both management and our credit rating agencies. The metric is a ratio of Machinery and Engines debt (short-term borrowings plus long-term debt) to the sum of Machinery and Engines debt and stockholders' equity. |
| 5. | EAME – Geographic region including Europe, Africa, the Middle East and the Commonwealth of Independent States (CIS). |
| 6. | Earning Assets – Assets consisting primarily of total finance receivables net of unearned income, plus equipment on operating leases, less accumulated depreciation at Cat Financial. |
| 7. | Engines – A principal line of business including the design, manufacture, marketing and sales of engines for Caterpillar machinery; electric power generation systems; on-highway vehicles and locomotives; marine, petroleum, construction, industrial, agricultural and other applications and related parts. Also includes remanufacturing of Caterpillar engines and a variety of Caterpillar machinery and engine components and remanufacturing services for other companies. Reciprocating engines meet power needs ranging from 5 to 21,500 horsepower (4 to more than 16 000 kilowatts). Turbines range from 1,600 to 30,000 horsepower (1 200 to 22 000 kilowatts). |
| 8. | Financial Products – A principal line of business consisting primarily of Caterpillar Financial Services Corporation (Cat Financial), Caterpillar Insurance Holdings, Inc. (Cat Insurance), Caterpillar Power Ventures Corporation (Cat Power Ventures) and their respective subsidiaries. Cat Financial provides a wide range of financing alternatives to customers and dealers for Caterpillar machinery and engines, Solar gas turbines as well as other equipment and marine vessels. Cat Financial also extends loans to customers and dealers. Cat Insurance provides various forms of insurance to customers and dealers to help support the purchase and lease of our equipment. Cat Power Ventures is an investor in independent power projects using Caterpillar power generation equipment and services. |
| 9. | Gross Margin – Sales of machinery and engines minus cost of goods sold. |
| 10. | Integrated Service Businesses – A service business or a business containing an important service component. These businesses include, but are not limited to, aftermarket parts, Cat Financial, Cat Insurance, Cat Logistics, Cat Reman, Progress Rail, OEM Solutions and Solar Turbine Customer Services. |
-20-
| 11. | Latin America – Geographic region including Central and South American countries and Mexico. |
| 12. | Machinery – A principal line of business which includes the design, manufacture, marketing and sales of construction, mining and forestry machinery—track and wheel tractors, track and wheel loaders, pipelayers, motor graders, wheel tractor-scrapers, track and wheel excavators, backhoe loaders, log skidders, log loaders, off-highway trucks, articulated trucks, paving products, skid steer loaders and related parts. Also includes logistics services for other companies and the design, manufacture, remanufacture, maintenance and services of rail-related products. |
| 13. | Machinery and Engines (M&E) – Due to the highly integrated nature of operations, it represents the aggregate total of the Machinery and Engines lines of business and includes primarily our manufacturing, marketing and parts distribution operations. |
| 14. | Manufacturing Costs – Represent the volume-adjusted change for manufacturing costs. Manufacturing costs are defined as material costs and labor and overhead costs related to the production process. Excludes the impact of currency. |
| 15. | Machinery and Engines Other Operating Expenses – Comprised primarily of gains (losses) on disposal of long-lived assets and long-lived asset impairment charges. |
| 16. | Price Realization – The impact of net price changes excluding currency and new product introductions. Consolidated price realization includes the impact of changes in the relative weighting of sales between geographic regions. |
| 17. | Sales Volume – With respect to sales and revenues, sales volume represents the impact of changes in the quantities sold for machinery and engines as well as the incremental revenue impact of new product introductions. With respect to operating profit, sales volume represents the impact of changes in the quantities sold for machinery and engines combined with product mix—the net operating profit impact of changes in the relative weighting of machinery and engines sales with respect to total sales. |
| 18. | 6 Sigma – On a technical level, 6 Sigma represents a measure of variation that achieves 3.4 defects per million opportunities. At Caterpillar, 6 Sigma represents a much broader cultural philosophy to drive continuous improvement throughout the value chain. It is a fact-based, data-driven methodology that we are using to improve processes, enhance quality, cut costs, grow our business and deliver greater value to our customers through Black Belt-led project teams. At Caterpillar, 6 Sigma goes beyond mere process improvement—it has become the way we work as teams to process business information, solve problems and manage our business successfully. |
-21-
NON-GAAP FINANCIAL MEASURES
The following definition is provided for “non-GAAP financial measures” in connection with Regulation G issued by the Securities and Exchange Commission. This non-GAAP financial measure has no standardized meaning prescribed by U.S. GAAP and therefore is unlikely to be comparable to the calculation of similar measures for other companies. Management does not intend this item to be considered in isolation or as a substitute for the related GAAP measure.
MACHINERY AND ENGINES
Caterpillar defines Machinery and Engines as it is presented in the supplemental data as Caterpillar Inc. and its subsidiaries with Financial Products accounted for on the equity basis. Machinery and Engines information relates to the design, manufacture and marketing of our products. Financial Products information relates to the financing to customers and dealers for the purchase and lease of Caterpillar and other equipment. The nature of these businesses is different, especially with regard to the financial position and cash flow items. Caterpillar management utilizes this presentation internally to highlight these differences. We also believe this presentation will assist readers in understanding our business. Pages 26-29 reconcile Machinery and Engines with Financial Products on the equity basis to Caterpillar Inc. Consolidated financial information.
Caterpillar's latest financial results and current outlook are also available via:
Telephone:
(800) 228-7717 (Inside the United States and Canada)
(858) 244-2080 (Outside the United States and Canada)
Internet:
http://www.cat.com/investor
http://www.cat.com/irwebcast (live broadcast/replays of quarterly conference call)
Caterpillar contact:
Jim Dugan
Corporate Public Affairs
(309) 494-4100 (Office) or (309) 360-7311 (Mobile)
mailto:Dugan_Jim@cat.com
-22-
Caterpillar Inc. Condensed Consolidated Statement of Results of Operations (Unaudited) (Dollars in millions except per share data) | ||||||||||||||||||
| Three Months Ended | ||||||||||||||||||
| March 31, | ||||||||||||||||||
| 2008 | 2007 | |||||||||||||||||
| Sales and revenues: | ||||||||||||||||||
| Sales of Machinery and Engines | $ | 10,979 | $ | 9,321 | ||||||||||||||
| Revenues of Financial Products | 817 | 695 | ||||||||||||||||
| Total sales and revenues | 11,796 | 10,016 | ||||||||||||||||
| Operating costs: | ||||||||||||||||||
| Cost of goods sold | 8,609 | 7,136 | ||||||||||||||||
| Selling, general and administrative expenses | 959 | 890 | ||||||||||||||||
| Research and development expenses | 369 | 340 | ||||||||||||||||
| Interest expense of Financial Products | 284 | 271 | ||||||||||||||||
| Other operating expenses | 282 | 239 | ||||||||||||||||
| Total operating costs | 10,503 | 8,876 | ||||||||||||||||
| Operating profit | 1,293 | 1,140 | ||||||||||||||||
| Interest expense excluding Financial Products | 74 | 79 | ||||||||||||||||
| Other income (expense) | 112 | 111 | ||||||||||||||||
| Consolidated profit before taxes | 1,331 | 1,172 | ||||||||||||||||
| Provision for income taxes | 420 | 375 | ||||||||||||||||
| Profit of consolidated companies | 911 | 797 | ||||||||||||||||
| Equity in profit (loss) of unconsolidated affiliated companies | 11 | 19 | ||||||||||||||||
| Profit | $ | 922 | $ | 816 | ||||||||||||||
| Profit per common share | $ | 1.49 | $ | 1.27 | ||||||||||||||
| Profit per common share – diluted (1) | $ | 1.45 | $ | 1.23 | ||||||||||||||
| Weighted average common shares outstanding (millions) | ||||||||||||||||||
| - Basic | 617.5 | 643.9 | ||||||||||||||||
| - Diluted (1) | 637.9 | 665.2 | ||||||||||||||||
| Cash dividends declared per common share | $ | — | $ | — | ||||||||||||||
| (1) Diluted by assumed exercise of stock-based compensation awards using the treasury stock method. | ||||||||||||||||||
-23-
Caterpillar Inc. | |||||||||||
| Condensed Consolidated Statement of Financial Position | |||||||||||
| (Unaudited) | |||||||||||
(Millions of dollars) | |||||||||||
| Assets | March 31, | December 31, | |||||||||
| Current assets: | 2008 | 2007 | |||||||||
| Cash and short-term investments | $ | 777 | $ | 1,122 | |||||||
| Receivables - trade and other | 9,021 | 8,249 | |||||||||
| Receivables - finance | 7,810 | 7,503 | |||||||||
| Deferred and refundable income taxes | 671 | 816 | |||||||||
| Prepaid expenses and other current assets | 546 | 583 | |||||||||
| Inventories | 8,082 | 7,204 | |||||||||
| Total current assets | 26,907 | 25,477 | |||||||||
| Property, plant and equipment – net | 10,050 | 9,997 | |||||||||
| Long-term receivables - trade and other | 565 | 685 | |||||||||
| Long-term receivables - finance | 14,134 | 13,462 | |||||||||
| Investments in unconsolidated affiliated companies | 563 | 598 | |||||||||
| Noncurrent deferred and refundable income taxes | 1,582 | 1,553 | |||||||||
| Intangible assets | 454 | 475 | |||||||||
| Goodwill | 1,963 | 1,963 | |||||||||
| Other assets | 1,986 | 1,922 | |||||||||
| Total assets | $ | 58,204 | $ | 56,132 | |||||||
| Liabilities | |||||||||||
| Current liabilities: | |||||||||||
| Short-term borrowings: | |||||||||||
| -- Machinery and Engines | $ | 331 | $ | 187 | |||||||
| -- Financial Products | 6,321 | 5,281 | |||||||||
| Accounts payable | 5,156 | 4,723 | |||||||||
| Accrued expenses | 3,378 | 3,178 | |||||||||
| Accrued wages, salaries and employee benefits | 799 | 1,126 | |||||||||
| Customer advances | 1,651 | 1,442 | |||||||||
| Dividends payable | - | 225 | |||||||||
| Other current liabilities | 1,181 | 951 | |||||||||
| Long-term debt due within one year: | |||||||||||
| -- Machinery and Engines | 173 | 180 | |||||||||
| -- Financial Products | 5,326 | 4,952 | |||||||||
| Total current liabilities | 24,316 | 22,245 | |||||||||
| Long-term debt due after one year: | |||||||||||
| -- Machinery and Engines | 3,640 | 3,639 | |||||||||
| -- Financial Products | 14,014 | 14,190 | |||||||||
| Liability for postemployment benefits | 4,954 | 5,059 | |||||||||
| Other liabilities | 2,062 | 2,116 | |||||||||
| Total liabilities | 48,986 | 47,249 | |||||||||
| Stockholders' equity | |||||||||||
| Common stock | 2,754 | 2,744 | |||||||||
| Treasury stock | (10,115 | ) | (9,451 | ) | |||||||
| Profit employed in the business | 18,289 | 17,398 | |||||||||
| Accumulated other comprehensive income | (1,710 | ) | (1,808 | ) | |||||||
| Total stockholders' equity | 9,218 | 8,883 | |||||||||
| Total liabilities and stockholders' equity | $ | 58,204 | $ | 56,132 | |||||||
-24-
| Caterpillar Inc. | |||||||||||
| Condensed Consolidated Statement of Cash Flow | |||||||||||
| (Unaudited) | |||||||||||
| (Millions of dollars) | |||||||||||
| Three Months Ended | |||||||||||
| March 31, | |||||||||||
| Cash flow from operating activities: | 2008 | 2007 | |||||||||
| Profit | $ | 922 | $ | 816 | |||||||
| Adjustments for non-cash items: | |||||||||||
| Depreciation and amortization | 472 | 412 | |||||||||
| Other | 128 | 1 | |||||||||
| Changes in assets and liabilities: | |||||||||||
| Receivables - trade and other | (455 | ) | 739 | ||||||||
| Inventories | (864 | ) | (734 | ) | |||||||
| Accounts payable and accrued expenses | 463 | (141 | ) | ||||||||
| Customer advances | 165 | 165 | |||||||||
| Other assets - net | 78 | (71 | ) | ||||||||
| Other liabilities - net | (203 | ) | 162 | ||||||||
| Net cash provided by (used for) operating activities | 706 | 1,349 | |||||||||
| Cash flow from investing activities: | |||||||||||
| Capital expenditures - excluding equipment leased to others | (343 | ) | (252 | ) | |||||||
| Expenditures for equipment leased to others | (302 | ) | (252 | ) | |||||||
Proceeds from disposals of property, plant and equipment | 122 | 106 | |||||||||
| Additions to finance receivables | (3,062 | ) | (2,553 | ) | |||||||
| Collections of finance receivables | 2,301 | 2,359 | |||||||||
| Proceeds from the sale of finance receivables | 46 | 40 | |||||||||
| Investments and acquisitions (net of cash acquired) | (19 | ) | (153 | ) | |||||||
| Proceeds from sale of available-for-sale securities | 104 | 62 | |||||||||
| Investments in available-for-sale securities | (160 | ) | (124 | ) | |||||||
| Other - net | 192 | 140 | |||||||||
| Net cash provided by (used for) investing activities | (1,121 | ) | (627 | ) | |||||||
| Cash flow from financing activities: | |||||||||||
| Dividends paid | (223 | ) | (193 | ) | |||||||
| Common stock issued, including treasury shares reissued | 27 | 73 | |||||||||
| Payment for stock repurchase derivative contracts | (38 | ) | - | ||||||||
| Treasury shares purchased | (692 | ) | (511 | ) | |||||||
| Excess tax benefit from stock-based compensation | 13 | 26 | |||||||||
| Proceeds from debt issued (original maturities greater than three months) | 3,920 | 1,875 | |||||||||
| Payments on debt (original maturities greater than three months) | (3,520 | ) | (3,028 | ) | |||||||
| Short-term borrowings (original maturities three months or less)-net | 554 | 1,107 | |||||||||
| Net cash provided by (used for) financing activities | 41 | (651 | ) | ||||||||
| Effect of exchange rate changes on cash | 29 | 6 | |||||||||
| Increase (decrease) in cash and short-term investments | (345 | ) | 77 | ||||||||
| Cash and short-term investments at beginning of period | 1,122 | 530 | |||||||||
| Cash and short-term investments at end of period | $ | 777 | $ | 607 | |||||||
Certain amounts for prior periods have been reclassified to conform to the current period financial statement presentation. All short-term investments, which consist primarily of highly liquid investments with original maturities of three months or less, are considered to be cash equivalents. | |||||||||||
-25-
Caterpillar Inc. Supplemental Data for Results of Operations For The Three Months Ended March 31, 2008 (Unaudited) (Millions of dollars) | ||||||||||||||||
| Supplemental Consolidating Data | ||||||||||||||||
| Consolidated | Machinery and Engines (1) | Financial Products | Consolidating Adjustments | |||||||||||||
| Sales and revenues: | ||||||||||||||||
| Sales of Machinery and Engines | $ | 10,979 | $ | 10,979 | $ | — | $ | — | ||||||||
| Revenues of Financial Products | 817 | —- | 912 | (95 | )2 | |||||||||||
| Total sales and revenues | 11,796 | 10,979 | 912 | (95 | ) | |||||||||||
| Operating costs: | ||||||||||||||||
| Cost of goods sold | 8,609 | 8,609 | — | — | ||||||||||||
| Selling, general and administrative expenses | 959 | 832 | 134 | (7 | )3 | |||||||||||
| Research and development expenses | 369 | 369 | — | — | ||||||||||||
| Interest expense of Financial Products | 284 | — | 286 | (2 | )4 | |||||||||||
| Other operating expenses | 282 | (11 | ) | 297 | (4 | )3 | ||||||||||
| Total operating costs | 10,503 | 9,799 | 717 | (13 | ) | |||||||||||
| Operating profit | 1,293 | 1,180 | 195 | (82 | ) | |||||||||||
| Interest expense excluding Financial Products | 74 | 74 | — | — | ||||||||||||
| Other income (expense) | 112 | 16 | 14 | 82 | 5 | |||||||||||
| Consolidated profit before taxes | 1,331 | 1,122 | 209 | — | ||||||||||||
| Provision for income taxes | 420 | 350 | 70 | — | ||||||||||||
| Profit of consolidated companies | 911 | 772 | 139 | — | ||||||||||||
| Equity in profit (loss) of unconsolidated affiliated companies | 11 | 11 | — | — | ||||||||||||
Equity in profit of Financial Products' subsidiaries | —- | 139 | — | (139 | )6 | |||||||||||
| Profit | $ | 922 | $ | 922 | $ | 139 | $ | (139 | ) | |||||||
1 Represents Caterpillar Inc. and its subsidiaries with Financial Products accounted for on the equity basis. | ||||||||||||||||
2 Elimination of Financial Products’ revenues earned from Machinery and Engines. | ||||||||||||||||
3 Elimination of net expenses recorded by Machinery and Engines paid to Financial Products. | ||||||||||||||||
4 Elimination of interest expense recorded between Financial Products and Machinery and Engines. | ||||||||||||||||
5 Elimination of discount recorded by Machinery and Engines on receivables sold to Financial Products and of interest earned between Machinery and Engines and Financial Products. | ||||||||||||||||
6 Elimination of Financial Products’ profit due to equity method of accounting. | ||||||||||||||||
-26-
Caterpillar Inc. Supplemental Data for Results of Operations For The Three Months Ended March 31, 2007 (Unaudited) (Millions of dollars) | |||||||||||||||||
| Supplemental Consolidating Data | |||||||||||||||||
| Consolidated | Machinery and Engines (1) | Financial Products | Consolidating Adjustments | ||||||||||||||
| Sales and revenues: | |||||||||||||||||
| Sales of Machinery and Engines | $ | 9,321 | $ | 9,321 | $ | — | $ | — | |||||||||
| Revenues of Financial Products | 695 | — | 799 | (104 | )2 | ||||||||||||
| Total sales and revenues | 10,016 | 9,321 | 799 | (104 | ) | ||||||||||||
| Operating costs: | |||||||||||||||||
| Cost of goods sold | 7,136 | 7,136 | — | — | |||||||||||||
| Selling, general and administrative expenses | 890 | 785 | 110 | (5 | )3 | ||||||||||||
| Research and development expenses | 340 | 340 | — | — | |||||||||||||
| Interest expense of Financial Products | 271 | — | 272 | (1 | )4 | ||||||||||||
| Other operating expenses | 239 | (4 | ) | 250 | (7 | )3 | |||||||||||
| Total operating costs | 8,876 | 8,257 | 632 | (13 | ) | ||||||||||||
| Operating profit | 1,140 | 1,064 | 167 | (91 | ) | ||||||||||||
| Interest expense excluding Financial Products | 79 | 80 | —- | (1 | )4 | ||||||||||||
| Other income (expense) | 111 | — | 21 | 90 | 5 | ||||||||||||
| Consolidated profit before taxes | 1,172 | 984 | 188 | — | |||||||||||||
| Provision for income taxes | 375 | 313 | 62 | — | |||||||||||||
| Profit of consolidated companies | 797 | 671 | 126 | — | |||||||||||||
| Equity in profit (loss) of unconsolidated affiliated companies | 19 | 18 | 1 | — | |||||||||||||
Equity in profit of Financial Products' subsidiaries | — | 127 | — | (127 | )6 | ||||||||||||
| Profit | $ | 816 | $ | 816 | $ | 127 | $ | (127 | ) | ||||||||
1 Represents Caterpillar Inc. and its subsidiaries with Financial Products accounted for on the equity basis. | |||||||||||||||||
2 Elimination of Financial Products’ revenues earned from Machinery and Engines. | |||||||||||||||||
3 Elimination of net expenses recorded by Machinery and Engines paid to Financial Products. | |||||||||||||||||
4 Elimination of interest expense recorded between Financial Products and Machinery and Engines. | |||||||||||||||||
5 Elimination of discount recorded by Machinery and Engines on receivables sold to Financial Products and of interest earned between. Machinery and Engines and Financial Products. | |||||||||||||||||
6 Elimination of Financial Products’ profit due to equity method of accounting. | |||||||||||||||||
-27-
Caterpillar Inc. Supplemental Data for Cash Flow For The Three Months Ended March 31, 2008 | |||||||||||||||||
(Unaudited) (Millions of dollars) | |||||||||||||||||
| Supplemental Consolidating Data | |||||||||||||||||
| Consolidated | Machinery and Engines1 | Financial Products | Consolidating Adjustments | ||||||||||||||
| Cash flow from operating activities: | |||||||||||||||||
| Profit | $ | 922 | $ | 922 | $ | 139 | $ | (139 | )2 | ||||||||
| Adjustments for non-cash items: | |||||||||||||||||
| Depreciation and amortization | 472 | 283 | 189 | — | |||||||||||||
| Undistributed profit of Financial Products | — | (139 | ) | — | 139 | 3 | |||||||||||
| Other | 128 | 100 | (70 | ) | 98 | 4 | |||||||||||
| Changes in assets and liabilities: | |||||||||||||||||
| Receivables - trade and other | (455 | ) | (289 | ) | 44 | (210 | )4/5 | ||||||||||
| Inventories | (864 | ) | (864 | ) | — | — | |||||||||||
| Accounts payable and accrued expenses | 463 | 342 | 34 | 87 | 4 | ||||||||||||
| Customer advances | 165 | 165 | — | — | |||||||||||||
| Other assets - net | 78 | 128 | (13 | ) | (37 | )4 | |||||||||||
| Other liabilities - net | (203 | ) | (240 | ) | 5 | 32 | 4 | ||||||||||
| Net cash provided by (used for) operating activities | 706 | 408 | 328 | (30 | ) | ||||||||||||
| Cash flow from investing activities: | |||||||||||||||||
| Capital expenditures - excluding equipment leased to others | (343 | ) | (340 | ) | (3 | ) | — | ||||||||||
| Expenditures for equipment leased to others | (302 | ) | — | (303 | ) | 1 | 4 | ||||||||||
| Proceeds from disposals of property, plant and equipment | 122 | 9 | 113 | — | |||||||||||||
| Additions to finance receivables | (3,062 | ) | — | (8,846 | ) | 5,784 | 5 | ||||||||||
| Collections of finance receivables | 2,301 | — | 7,664 | (5,363 | )5 | ||||||||||||
| Proceeds from sale of finance receivables | 46 | — | 442 | (396 | )5 | ||||||||||||
| Net intercompany borrowings | — | 190 | 2 | (192 | )6 | ||||||||||||
| Investments and acquisitions (net of cash acquired) | (19 | ) | (23 | ) | — | 4 | 7 | ||||||||||
| Proceeds from sale of available-for-sale securities | 104 | 7 | 97 | — | |||||||||||||
| Investments in available-for-sale securities | (160 | ) | (5 | ) | (155 | ) | — | ||||||||||
| Other - net | 192 | 118 | 74 | — | |||||||||||||
| Net cash provided by (used for) investing activities | (1,121 | ) | (44 | ) | (915 | ) | (162 | ) | |||||||||
| Cash flow from financing activities: | |||||||||||||||||
| Dividends paid | (223 | ) | (223 | ) | — | — | |||||||||||
| Common stock issued, including treasury shares reissued | 27 | 27 | — | — | |||||||||||||
| Payment for stock repurchase derivative contracts | (38 | ) | (38 | ) | — | — | |||||||||||
| Treasury shares purchased | (692 | ) | (692 | ) | — | — | |||||||||||
| Excess tax benefit from stock-based compensation | 13 | 13 | — | - | |||||||||||||
| Net intercompany borrowings | —- | (2 | ) | (190 | ) | 192 | 6 | ||||||||||
| Proceeds from debt issued (original maturities greater than three months) | 3,920 | 62 | 3,858 | — | |||||||||||||
| Payments on debt (original maturities greater than three months) | (3,520 | ) | (98 | ) | (3,422 | ) | — | ||||||||||
| Short-term borrowings (original maturities three months or less)-net | 554 | 164 | 390 | — | |||||||||||||
| Net cash provided by (used for) financing activities | 41 | (787 | ) | 636 | 192 | ||||||||||||
| Effect of exchange rate changes on cash | 29 | 25 | 4 | — | |||||||||||||
| Increase (decrease) in cash and short-term investments | (345 | ) | (398 | ) | 53 | — | |||||||||||
| Cash and short-term investments at beginning of period | 1,122 | 862 | 260 | — | |||||||||||||
| Cash and short-term investments at end of period | $ | 777 | $ | 464 | $ | 313 | $ | — | |||||||||
| (1) Represents Caterpillar Inc. and its subsidiaries with Financial Products accounted for on the equity basis. | |||||||||||||||||
| (2) Elimination of Financial Products’ profit after tax due to equity method of accounting. | |||||||||||||||||
| (3) Non-cash adjustment for the undistributed earnings from Financial Products. | |||||||||||||||||
| (4) Elimination of non-cash adjustments and changes in assets and liabilities related to consolidated reporting. | |||||||||||||||||
| (5) Reclassification of Cat Financial’s cash flow activity from investing to operating for receivables that arose from the sale of inventory. | |||||||||||||||||
| (6) Net proceeds and payments to/from Machinery and Engines and Financial Products. | |||||||||||||||||
| (7) Change in investment and common stock related to Financial Products. | |||||||||||||||||
-28-
Caterpillar Inc. Supplemental Data for Cash Flow For The Three Months Ended March 31, 2007 | ||||||||||||||||||||
| (Unaudited) | ||||||||||||||||||||
| (Millions of dollars) | Supplemental Consolidating Data | |||||||||||||||||||
| Consolidated | Machinery and Engines (1) | Financial Products | Consolidating Adjustments | |||||||||||||||||
| Cash flow from operating activities: | ||||||||||||||||||||
| Profit | $ | 816 | $ | 816 | $ | 127 | $ | (127 | )2 | |||||||||||
| Adjustments for non-cash items: | ||||||||||||||||||||
| Depreciation and amortization | 412 | 248 | 164 | — | ||||||||||||||||
| Undistributed profit of Financial Products | — | (127 | ) | — | 127 | 3 | ||||||||||||||
| Other | 1 | (25 | ) | (57 | ) | 83 | 4 | |||||||||||||
| Changes in assets and liabilities: | ||||||||||||||||||||
| Receivables - trade and other | 739 | (49 | ) | 45 | 743 | 4/5 | ||||||||||||||
| Inventories | (734 | ) | (734 | ) | — | — | ||||||||||||||
| Accounts payable and accrued expenses | (141 | ) | (168 | ) | (28 | ) | 55 | 4 | ||||||||||||
| Customer advances | 165 | 165 | —- | —- | ||||||||||||||||
| Other assets – net | (71 | ) | (64 | ) | 4 | (11 | )4 | |||||||||||||
| Other liabilities – net | 162 | 162 | (11 | ) | 11 | 4 | ||||||||||||||
| Net cash provided by (used for) operating activities | 1,349 | 224 | 244 | 881 | ||||||||||||||||
| Cash flow from investing activities: | ||||||||||||||||||||
| Capital expenditures - excluding equipment leased to others | (252 | ) | (249 | ) | (3 | ) | — | |||||||||||||
| Expenditures for equipment leased to others | (252 | ) | — | (255 | ) | 3 | 4 | |||||||||||||
| Proceeds from disposals of property, plant and equipment | 106 | 13 | 93 | — | ||||||||||||||||
| Additions to finance receivables | (2,553 | ) | — | (7,910 | ) | 5,357 | 5 | |||||||||||||
| Collections of finance receivables | 2,359 | — | 8,281 | (5,922 | )5 | |||||||||||||||
| Proceeds from the sale of finance receivables | 40 | — | 359 | (319 | )5 | |||||||||||||||
| Net intercompany borrowings | — | 33 | (222 | ) | 189 | 6 | ||||||||||||||
| Investments and acquisitions (net of cash acquired) | (153 | ) | (153 | ) | — | — | ||||||||||||||
| Proceeds from sale of available-for-sale securities | 62 | 3 | 59 | — | ||||||||||||||||
| Investments in available-for-sale securities | (124 | ) | (4 | ) | (120 | ) | — | |||||||||||||
| Other - net | 140 | 50 | 92 | (2 | )7 | |||||||||||||||
| Net cash provided by (used for) investing activities | (627 | ) | (307 | ) | 374 | (694 | ) | |||||||||||||
| Cash flow from financing activities: | ||||||||||||||||||||
| Dividends paid | (193 | ) | (193 | ) | — | — | ||||||||||||||
| Common stock issued, including treasury shares reissued | 73 | 73 | (2 | ) | 2 | 7 | ||||||||||||||
| Treasury shares purchased | (511 | ) | (511 | ) | — | — | ||||||||||||||
| Excess tax benefit from stock-based compensation | 26 | 26 | — | — | ||||||||||||||||
| Net intercompany borrowings | — | 222 | (33 | ) | (189 | )6 | ||||||||||||||
| Proceeds from debt issued (original maturities greater than three months) | 1,875 | 26 | 1,849 | — | ||||||||||||||||
| Payments on debt (original maturities greater than three months) | (3,028 | ) | (28 | ) | (3,000 | ) | — | |||||||||||||
| Short-term borrowings (original maturities three months or less)-net | 1,107 | 482 | 625 | — | ||||||||||||||||
| Net cash provided by (used for) financing activities | (651 | ) | 97 | (561 | ) | (187 | ) | |||||||||||||
| Effect of exchange rate changes on cash | 6 | 4 | 2 | — | ||||||||||||||||
| Increase (decrease) in cash and short-term investments | 77 | 18 | 59 | — | ||||||||||||||||
| Cash and short-term investments at beginning of period | 530 | 319 | 211 | — | ||||||||||||||||
| Cash and short-term investments at end of period | $ | 607 | $ | 337 | $ | 270 | $ | — | ||||||||||||
| Certain amounts for prior periods have been reclassified to conform to the current period financial statement presentation. | ||||||||||||||||||||
| (1) Represents Caterpillar Inc. and its subsidiaries with Financial Products accounted for on the equity basis. | ||||||||||||||||||||
| (2) Elimination of Financial Products’ profit after tax due to equity method of accounting. | ||||||||||||||||||||
| (3) Non-cash adjustments for the undistributed earnings from Financial Products. | ||||||||||||||||||||
| (4) Elimination of non-cash adjustments and changes in assets and liabilities related to consolidated reporting. | ||||||||||||||||||||
| (5) Reclassification of Cat Financial's cash flow activity from investing to operating for receivables that arose from the sale of inventory. | ||||||||||||||||||||
| (6) Net proceeds and payments to/from Machinery and Engines and Financial Products. | ||||||||||||||||||||
| (7) Change in investment and common stock related to Financial Products. | ||||||||||||||||||||
-29-