Exhibit 99.1
Caterpillar Inc.
3Q 2008 Earnings Release
Caterpillar Reports Record Third-Quarter Sales and Revenues;
Reaffirms Full-Year Outlook
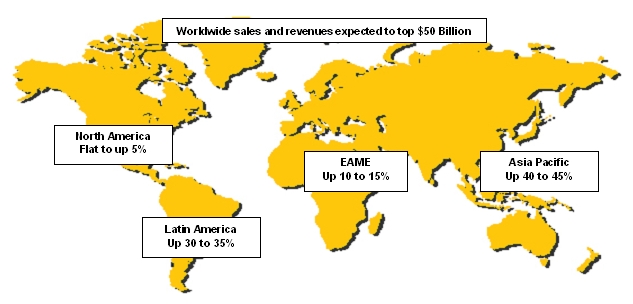
Company maintains 2008 outlook of sales and revenues topping $50 billion
and profit of about $6.00 per share
PEORIA, Ill.— Caterpillar Inc. (NYSE: CAT) today announced record third-quarter sales and revenues of $12.981 billion, 13 percent higher than third quarter 2007 sales and revenues of $11.442 billion. Profit per share for the third quarter 2008 was $1.39, down $0.01 from profit per share of $1.40 in the third quarter of 2007.
“We are pleased to have set a new third-quarter sales and revenues record, particularly considering the recessionary conditions in North America and growing weakness in Europe and Japan,” said Chairman and Chief Executive Officer Jim Owens. “Demand in emerging markets and commodity prices at levels that encourage investment in mining and energy have helped offset negative economic conditions in much of the developed world,” Owens added.
“Recent financial market turbulence has focused attention on the financial strength of businesses of all kinds,” Owens said. “Caterpillar has a strong balance sheet, a solid credit rating and we’ve had access to the capital we need to run our business. That includes our captive finance company, Caterpillar Financial Services Corporation (Cat Financial). We are pleased to report that despite difficult market conditions, Cat Financial has had good access to capital and continues to offer lending options to our customers. It’s a tough environment, but we have a conservative business model which prudently manages risk and a great team that’s executing well at Cat Financial. When the dust settles, I’m confident that our customers and stockholders will be well served by Cat Financial’s long-standing, sound lending practices,” Owens said.
Sales and revenues of $12.981 billion increased $1.539 billion from the third quarter of last year, $833 million from sales volume, $385 million from improved price realization, $262 million from the effects of currency and $59 million from higher Financial Products revenues. The geographic mix of sales continued to shift outside North America with sales and revenues increasing 22 percent in other regions compared to 3 percent inside North America. Sales and revenues outside North America represent 60 percent of total sales and revenues in the third quarter—up from 56 percent of the total one year ago.
Page 1
Profit of $868 million was down $59 million from $927 million in the third quarter of 2007, a 6 percent decline, and profit per share was $1.39, a decrease of $0.01 from profit per share of $1.40 for the third quarter of 2007. The decrease was the result of higher manufacturing costs, primarily for materials.
“We expected that material and freight costs would increase in the second half of 2008, and they did in the third quarter. Higher material costs, especially for steel, were the most significant headwind we faced in the quarter,” said Owens.
Outlook
Caterpillar is maintaining its full-year outlook for 2008. The company expects sales and revenues to top $50 billion, up from $44.958 billion in 2007, and profit per share of about $6.00 per share, up from $5.37 per share in 2007.
“The 2009 economic outlook is extremely uncertain at this time, with substantial turmoil in financial markets and unprecedented government intervention around the world,” Owens said. “Our current outlook for 2009 calls for sales and revenues to be about flat with our full-year 2008 results. In 2009 we expect pockets of strength in global mining, energy markets and in the area of emerging market infrastructure development to offset acute weakness in North America, Europe and Japan. Further, we are confident that our integrated service businesses, which have grown significantly this year, will offer revenue and earnings support in the coming year. That said, given the recent economic turmoil, we will issue our 2009 profit per share outlook with our year-end release in January. The world has experienced significant turbulence in financial markets, and we expect this will slow world economic growth over the next three or four quarters. While we are encouraged by the coordinated response by governments and central banks around the world and believe the actions they’ve taken will restore global liquidity, the depth and duration of economic decline and the timing and strength of the recovery are very uncertain. Caterpillar is prepared for volatility, and we remain very positive about our longer-term growth prospects. With our financial strength, global manufacturing and distribution network, our focus on the Caterpillar Production System powered by 6 Sigma and our diversified business portfolio, Caterpillar is poised to strengthen its global leadership position during this challenging period,” Owens added.
Note: Glossary of terms included on pages 23-24; first occurrence of terms shown in bold italics.
For more than 80 years, Caterpillar Inc. has been making progress possible and driving positive and sustainable change on every continent. With 2007 sales and revenues of $44.958 billion, Caterpillar is the world’s leading manufacturer of construction and mining equipment, diesel and natural gas engines and industrial gas turbines. The company also is a leading services provider through Caterpillar Financial Services, Caterpillar Remanufacturing Services, Caterpillar Logistics Services and Progress Rail Services. More information is available at: http://www.cat.com.
Caterpillar contact: Jim Dugan, Corporate Public Affairs, (309) 494-4100 (Office) or (309) 360-7311 (Mobile)
Page 2
SAFE HARBOR
Certain statements in this release relate to future events and expectations and as such constitute forward-looking statements involving known and unknown factors that may cause actual results of Caterpillar Inc. to be different from those expressed or implied in the forward-looking statements. In this context, words such as "will," “would,” "expect," "anticipate," “should” or other similar words and phrases often identify forward-looking statements made on behalf of Caterpillar. It is important to note that actual results of the company may differ materially from those described or implied in such forward-looking statements based on a number of factors and uncertainties, including, but not limited to, (i) adverse change in general economic conditions; (ii) adverse change in the industries Caterpillar serves including construction, infrastructure, mining, energy, marine and electric power generation; (iii) Caterpillar’s ability to manage material, including steel, and freight costs; (iv) Caterpillar’s ability to generate cash from operations, secure external funding for its operations and manage its liquidity needs; (v) material adverse change in customers’ access to liquidity and capital; (vi) currency exchange or interest rates changes; (vii) political stability; (viii) market acceptance of the company's products and services; (ix) significant changes in the competitive environment; (x) epidemic diseases; (xi) severe change in weather conditions negatively impacting operations; (xii) changes in law, regulations and tax rates; and (xiii) other general economic, business and financing conditions and factors described in more detail in the company's Form 10-Q filed with the Securities and Exchange Commission on August 1, 2008. This filing is available on our website at www.cat.com/sec_filings. We do not undertake to update our forward-looking statements.
Page 3
Key Points
Third Quarter 2008
| § | Third-quarter sales and revenues of $12.981 billion were the highest third quarter on record and 13 percent higher than the third quarter of 2007. |
| § | Third-quarter profit was $868 million, and profit per share of $1.39 was $0.01 less than the third quarter of 2007. |
| § | The percent of sales and revenues outside North America continued to increase, with 60 percent of total sales and revenues outside North America this quarter compared with 56 percent in the third quarter last year. |
| (Dollars in millions except per share data) | |||||||||||||||
| Third Quarter 2008 | Third Quarter 2007 | $ Change | % Change | ||||||||||||
Machinery and Engines Sales | $ | 12,148 | $ | 10,668 | $ | 1,480 | 14 | % | |||||||
| Financial Products Revenues | 833 | 774 | 59 | 8 | % | ||||||||||
| Total Sales and Revenues | 12,981 | 11,442 | 1,539 | 13 | % | ||||||||||
Profit After Tax | $ | 868 | $ | 927 | $ | (59 | ) | (6 | ) | % | |||||
| Profit per common share - diluted | $ | 1.39 | $ | 1.40 | $ | (0.01 | ) | (1 | ) | % | |||||
Machinery and Engines (M&E) sales improved $1.480 billion despite the weakening in developed economies. The strength of emerging markets, our broad global footprint in industries like mining and energy and growth in integrated service businesses were positive. Machinery sales increased 13 percent, and Engines sales increased 16 percent.
Profit per share declined $0.01, primarily driven by higher costs partially offset by improved price realization and higher sales volume.
Machinery and Engines operating cash flow was $2.343 billion for the first nine months of 2008.
Outlook
| § | Caterpillar is maintaining its full-year outlook for 2008. The company expects sales and revenues to top $50 billion, up from $44.958 billion in 2007, and profit per share of about $6.00 per share, up from $5.37 per share in 2007. |
| § | Our preliminary outlook for 2009 reflects sales and revenues at about the same level as 2008. |
| § | We will provide an outlook for 2009 profit per share in January 2009. |
A question and answer section has been included in this release starting on page 17.
Page 4
DETAILED ANALYSIS
Third Quarter 2008 vs. Third Quarter 2007
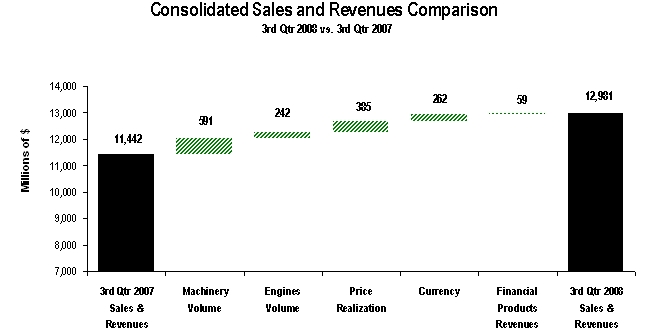 | ||
| The chart above graphically illustrates reasons for the change in Consolidated Sales and Revenues between third quarter 2007 (at left) and third quarter 2008 (at right). Items favorably impacting sales and revenues appear as upward stair steps with the corresponding dollar amounts above each bar, while items negatively impacting sales and revenues appear as downward stair steps with dollar amounts reflected in parentheses above each bar. Caterpillar management utilizes these charts internally to visually communicate with the company’s Board of Directors and employees. | ||
Sales and Revenues
Sales and revenues for third quarter 2008 were $12.981 billion, up $1.539 billion, or 13 percent, from third quarter 2007. Machinery volume was up $591 million, and Engines volume was up $242 million, both driven by growth in emerging markets and our broad global footprint in industries like mining and energy. Price realization improved $385 million, and currency had a positive impact on sales of $262 million. In addition, Financial Products revenues increased $59 million.
| Sales and Revenues by Geographic Region | |||||||||||||||||||||||||||||||||||||||||||
(Millions of dollars) | Total | % Change | North America | % Change | EAME | % Change | Asia/ Pacific | % Change | Latin America | % Change | |||||||||||||||||||||||||||||||||
| Third Quarter 2007 | |||||||||||||||||||||||||||||||||||||||||||
| Machinery | $ | 7,123 | $ | 3,156 | $ | 2,166 | $ | 999 | $ | 802 | |||||||||||||||||||||||||||||||||
| Engines | 1 | 3,545 | 1,311 | 1,362 | 608 | 264 | |||||||||||||||||||||||||||||||||||||
| Financial Products | 2 | 774 | 520 | 118 | 63 | 73 | |||||||||||||||||||||||||||||||||||||
| $ | 11,442 | $ | 4,987 | $ | 3,646 | $ | 1,670 | $ | 1,139 | ||||||||||||||||||||||||||||||||||
| Third Quarter 2008 | |||||||||||||||||||||||||||||||||||||||||||
| Machinery | $ | 8,051 | 13 | % | $ | 3,245 | 3 | % | $ | 2,270 | 5 | % | $ | 1,437 | 44 | % | $ | 1,099 | 37 | % | |||||||||||||||||||||||
| Engines | 1 | 4,097 | 16 | % | 1,400 | 7 | % | 1,617 | 19 | % | 757 | 25 | % | 323 | 22 | % | |||||||||||||||||||||||||||
| Financial Products | 2 | 833 | 8 | % | 491 | (6 | ) | % | 150 | 27 | % | 108 | 71 | % | 84 | 15 | % | ||||||||||||||||||||||||||
| $ | 12,981 | 13 | % | $ | 5,136 | 3 | % | $ | 4,037 | 11 | % | $ | 2,302 | 38 | % | $ | 1,506 | 32 | % | ||||||||||||||||||||||||
| 1 | Does not include internal engines transfers of $738 million and $629 million in third quarter 2008 and 2007, respectively. Internal engines transfers are valued at prices comparable to those for unrelated parties. |
| 2 | Does not include internal revenues earned from Machinery and Engines of $64 million and $89 million in third quarter 2008 and 2007, respectively. |
Page 5
Machinery Sales
Sales of $8.051 billion increased $928 million, or 13 percent, from third quarter 2007.
| § | Sales volume increased $591 million, with the gain coming from developing economies. Most developed economies were weak, with several entering into recession. |
| § | Price realization increased $164 million. |
| § | Currency benefited sales by $173 million. |
| § | Geographic mix between regions (included in price realization) was $3 million favorable. |
| § | Dealers reported higher inventories in all regions, which was a positive for sales volume. Inventories in months of supply were slightly higher than a year earlier, with Asia Pacific the only region to show a decrease. |
| § | In North America, sales volume declined in response to weak U.S. construction and quarrying. Higher coal and crude oil prices benefited coal mining and oil sands development. |
| § | Sales volume in Europe declined sharply from a year earlier as economies in the euro-zone and the United Kingdom were very weak. Both residential and nonresidential construction declined. |
| § | Sales increased in the developing regions of Africa/Middle East, the Commonwealth of Independent States (CIS), Asia/Pacific and Latin America where most countries maintained healthy economic growth and increased exports. Higher commodity prices and increased production of these commodities boosted government revenues resulting in continued construction spending and investment in oil, coal and metals production capacity. |
North America – Sales increased $89 million, or 3 percent.
| § | Sales volume decreased $18 million. |
| § | Price realization increased $107 million. |
| § | Sales volume declined in response to lower demand from end users, particularly in the United States. Dealers reported higher inventories than a year earlier in both dollars and months of supply. |
| § | The decline in sales volume resulted from ongoing weaknesses in construction and construction-related industries such as quarrying and forestry. Energy-related industries, such as coal mining and oil sands, contributed positively. |
| § | U.S. housing starts declined 32 percent from a year earlier, and the median price of new homes dropped more than 5 percent. Lower employment, high mortgage interest rates, declining home prices and excessive stocks of unsold homes caused the decline in new construction. |
| § | Orders for nonresidential construction declined 12 percent. Negatives included rising vacancy rates, declining property prices, tighter credit conditions for businesses and increased pressure on state and local government budgets. |
| § | The decline in construction in the United States caused nonmetals mining and quarry production to drop almost 16 percent from third quarter 2007. |
| § | Coal prices more than doubled from a year earlier following price increases in Asia. U.S. coal production increased 3 percent, largely to accommodate substantial increases in exports which rose more than 50 percent in the first half of the year. Higher coal prices are encouraging Canadian miners to increase capital expenditures more than 70 percent this year. |
| § | Oil prices averaged more than $115 per barrel in the quarter, which made further development of Canada’s oil sands attractive. Capital expenditures should increase about 23 percent this year, the fifth consecutive year with an increase in excess of 20 percent. |
Page 6
EAME – Sales increased $104 million, or 5 percent.
| § | Sales volume decreased $17 million. Lower volume in Europe offset gains in both Africa/Middle East and the CIS. |
| § | Price realization increased $17 million. |
| § | Currency benefited sales by $104 million. |
| § | Dealers reduced inventories during the quarter, which is normal, but inventories at the end of the quarter were higher than a year earlier in both dollars and months of supply. |
| § | Sales declined significantly in both the euro-zone and the United Kingdom. The combination of financial market turmoil, high interest rates and strong currencies caused these economies to slow abruptly. Some economies within the euro-zone were in recession. |
| § | Slower growth and high interest rates weakened construction. Housing permits in the euro-zone were down 22 percent in the first half, and in the United Kingdom third-quarter housing orders fell 44 percent from a year earlier. Third-quarter infrastructure construction in the euro-zone declined almost 4 percent. |
| § | The sales increase in Africa/Middle East occurred largely in the oil producing countries. Oil production increased almost 5 percent from a year earlier, and prices were up more than 70 percent. Higher oil revenues enabled countries to spend more on construction and increase the drill rig count by 3 percent. |
| § | Sales volume expanded in most countries in the CIS region. The increase in oil prices offset a decline in production, allowing governments to spend more for construction. Other positives included higher metals and coal prices. |
Asia/Pacific – Sales increased $438 million, or 44 percent.
| § | Sales volume increased $382 million. |
| § | Price realization increased $20 million. |
| § | Currency benefited sales by $36 million. |
| § | Dealers reported much higher inventories, which benefited sales. However, months of supply were slightly lower than a year earlier. |
| § | Sales also benefited from higher customer demand as reported by dealers. Good economic growth and favorable commodity prices led to increased demand, with most of the gain concentrated in China, Indonesia and Australia. |
| § | Sales volume increased substantially in China, the result of the introduction of locally produced wheel loaders this year and growth in both construction and mining. Spending increased 33 percent for housing construction and 18 percent for commercial construction. Coal production was up 14 percent, and iron ore production rose 3 percent. |
| § | Indonesia, the world’s largest thermal coal exporter, benefited from much higher coal prices. Construction has been increasing at about an 8 percent annual rate. |
| § | High interest rates in Australia slowed economic growth and caused the housing sector to decline. However, higher coal and iron ore prices led to more than 50 percent increases in exploration expenditures for both these commodities. In addition, infrastructure construction increased 11 percent in the first half, in part to alleviate transportation problems resulting from increased mine output. |
Page 7
Latin America – Sales increased $297 million, or 37 percent.
| § | Sales volume increased $247 million. |
| § | Price realization rose $17 million. |
| § | Currency benefited sales by $33 million. |
| § | Dealers reported significant additions to inventories during the quarter, which contributed to the gain in sales volume. Inventories were higher than a year ago in both dollars and months of supply. Inventories had been low, so the increase returned months of supply to more normal rates and supports future growth in dealer deliveries. |
| § | Brazil was the biggest contributor to sales volume growth. Although interest rates increased this year, the economy continued to benefit from the large rate reductions during the past two years. As a result, construction increased over 9 percent in the first half. The country’s large commodity sector grew rapidly, with oil production up more than 5 percent and mining output up more than 8 percent. |
| § | In Mexico, energy revenues rose substantially due to higher oil prices and a 14 percent increase in natural gas production. These higher revenues, along with some growth in construction, led to a large gain in sales volume. |
| § | Sales volume increased in Colombia, largely as a result of much higher coal prices. |
Page 8
Engines Sales
Sales of $4.097 billion increased $552 million, or 16 percent, from third quarter 2007.
| § | Sales volume increased $242 million. |
| § | Price realization increased $221 million. |
| § | Currency benefited sales $89 million. |
| § | Geographic mix between regions (included in price realization) was $2 million favorable. |
| § | Dealer-reported inventories were up, and months of supply were up slightly, supporting stronger delivery rates. |
North America – Sales increased $89 million, or 7 percent.
| § | Sales volume increased $9 million. |
| § | Price realization increased $80 million. |
| § | Sales for marine applications increased 68 percent, with strong demand for petroleum supply vessels to support offshore drilling. |
| § | Sales for industrial applications increased 30 percent in small- and medium-sized product due to increased demand in agricultural and mining applications as a result of high commodity prices. |
| § | Sales for on-highway truck applications increased 7 percent, which resulted from a slight improvement in the North American on-highway heavy-duty truck market compared with a very weak third quarter 2007. |
| § | Sales for petroleum engine applications declined 3 percent due to a temporary pause in North American drill rig production. Turbine sales for gas transmission projects were down due to timing of customer project schedules. This was partially offset by an increase in turbine-related services. |
| § | Sales for electric power applications were about the same as the third quarter of 2007. |
EAME – Sales increased $255 million, or 19 percent.
| § | Sales volume increased $95 million. |
| § | Price realization increased $85 million. |
| § | Currency benefited sales by $75 million. |
| § | Sales for electric power applications increased 20 percent, with strong demand in Africa/Middle East offsetting weaker demand in Europe and the CIS. |
| § | Sales for marine applications increased 49 percent to support higher demand for workboats and commercial vessels. |
| § | Sales for industrial applications increased 12 percent, with strong demand for agriculture and mining support equipment. |
| § | Sales for petroleum applications increased 8 percent based on strong demand for engines used in drilling and production. Turbine-related services were up as well but were offset by a decline in shipments of turbines for oil and gas production projects in the Middle East due to timing of customer project schedules. |
Page 9
Asia/Pacific – Sales increased $149 million, or 25 percent.
| § | Sales volume increased $88 million. |
| § | Price realization increased $47 million. |
| § | Currency benefited sales by $14 million. |
| § | Sales for marine applications increased 49 percent, with continued strong demand for workboat and offshore shipbuilding. |
| § | Sales of electric power engines increased 32 percent, with strong demand in gas generator sets for industrial power in Bangladesh and with demand for data and telecommunication centers in China. |
| § | Sales for petroleum applications increased 11 percent in support of Chinese drill rig builders that continue to manufacture at record levels and to support increased demand from Asian shipyards in support of offshore drilling. Sales of turbine-related services increased but were offset by a decline in shipments of turbines for oil and gas production projects due to timing of customer project schedules. |
Latin America – Sales increased $59 million, or 22 percent.
| § | Sales volume increased $52 million. |
| § | Price realization increased $7 million. |
| § | Sales for petroleum applications increased 44 percent driven by strong demand for on-site power generation to support oil production across the region and to support drilling in Venezuela. Turbines and turbine-related services increased for oil and gas production applications in Mexico. |
| § | Sales of electric power engines increased 24 percent as strong demand was driven by high commodity prices and infrastructure investment. |
| § | Sales for on-highway truck applications decreased 57 percent as a result of Original Equipment Manufacturer (OEM) customers working down inventory that was accumulated prior to emission law changes in the region. |
Financial Products Revenues
Revenues of $833 million increased $59 million, or 8 percent, from the third quarter 2007.
| § | Growth in average earning assets increased revenues $101 million, which was partially offset by a decrease of $59 million due to lower interest rates on new and existing finance receivables. |
| § | Revenues from earned premiums at Cat Insurance increased $20 million. |
Page 10
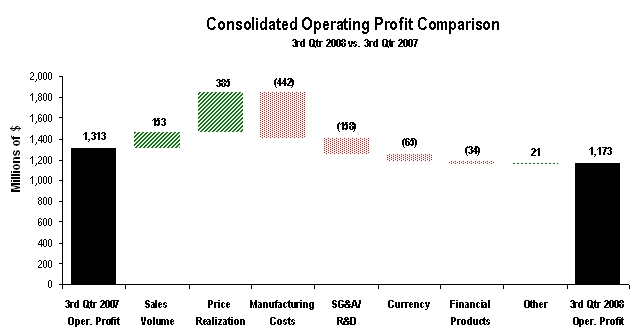 | ||
The chart above graphically illustrates reasons for the change in Consolidated Operating Profit between third quarter 2007 (at left) and third quarter 2008 (at right). Items favorably impacting operating profit appear as upward stair steps with the corresponding dollar amounts above each bar, while items negatively impacting operating profit appear as downward stair steps with dollar amounts reflected in parentheses above each bar. Caterpillar management utilizes these charts internally to visually communicate with the company’s Board of Directors and employees. The bar entitled Other includes the operating profit impact of consolidating adjustments and Machinery and Engines other operating expenses. | ||
Operating Profit
Operating profit in third quarter 2008 of $1.173 billion was $140 million lower than third quarter 2007 as improved price realization and higher sales volume were more than offset by higher costs and the unfavorable impact of currency.
Manufacturing costs rose $442 million compared with third quarter 2007. The majority of the manufacturing cost increase was driven by higher material and freight costs. Material costs increased due to higher steel and commodity prices, and freight costs increased primarily due to higher fuel prices. In addition, manufacturing labor and overhead costs increased to support capacity expansion and velocity initiatives.
Selling, General and Administrative (SG&A) and Research and Development (R&D) costs were up $158 million to support significant new product programs and growth.
Currency had a $65 million unfavorable impact on operating profit as the benefit to sales was more than offset by the negative impact on costs.
Operating Profit by Principal Line of Business | |||||||||||||||||||
| (Millions of dollars) | Third Quarter 2008 | Third Quarter 2007 | $ Change | % Change | |||||||||||||||
| Machinery | 1 | $ | 464 | $ | 681 | $ | (217 | ) | (32 | ) | % | ||||||||
| Engines | 1 | 616 | 529 | 87 | 16 | % | |||||||||||||
| Financial Products | 144 | 178 | (34 | ) | (19 | ) | % | ||||||||||||
| Consolidating Adjustments | (51 | ) | (75 | ) | 24 | ||||||||||||||
| Consolidated Operating Profit | $ | 1,173 | $ | 1,313 | $ | (140 | ) | (11 | ) | % | |||||||||
| 1 | Caterpillar operations are highly integrated; therefore, the company uses a number of allocations to determine lines of business operating profit for Machinery and Engines. |
Page 11
Operating Profit by Principal Line of Business
| § | Machinery operating profit of $464 million was down $217 million, or 32 percent, from third quarter 2007. Improved price realization and higher sales volume were more than offset by higher costs and the unfavorable impact of currency. |
| § | Engines operating profit of $616 million was up $87 million, or 16 percent, from third quarter 2007. Improved price realization and higher sales volume were partially offset by higher costs. |
| § | Financial Products operating profit of $144 million was down $34 million, or 19 percent, from third quarter 2007. The decrease was primarily attributable to a $38 million impact from decreased net yield on average earnings assets, a $17 million increase in SG&A expenses and a $13 million increase in the provision for credit losses at Cat Financial, partially offset by a $40 million favorable impact from higher average earning assets. |
Other Profit/Loss Items
| § | Other income/expense was income of $138 million compared with income of $51 million in third quarter 2007. The increase was primarily due to the favorable impacts of currency. |
| § | The provision for income taxes in the third quarter of 2008 reflects an estimated annual tax rate of 31.5 percent compared to an actual rate of 30.5 percent for the third quarter 2007 and 30 percent for the full-year 2007. The increase over 2007 is attributable to expected changes in our geographic mix of profits from a tax perspective and the expiration of the U.S. research and development tax credit. The renewal of the U.S. research and development tax credit in October 2008 will be reflected in the fourth quarter as a reduction of approximately one percentage point in the estimated annual tax rate. |
| § | Equity in profit/(loss) of unconsolidated affiliated companies was income of $11 million compared with income of $27 million in the third quarter of 2007. The decline reflects lower profit at Shin Caterpillar Mitsubishi Ltd. (SCM) and the absence of profit due to the sale of our investment in A.S.V. Inc. during the first quarter 2008. On August 1, 2008, SCM redeemed one-half of Mitsubishi Heavy Industries Ltd.’s (MHI’s) shares in SCM for $464 million. Caterpillar now owns 67 percent of the renamed entity, Caterpillar Japan Ltd. We consolidated Cat Japan’s balance sheet on September 30, 2008. We will begin consolidating Cat Japan’s results of operations in the fourth quarter. |
Employment
Caterpillar’s worldwide employment was 112,104 at the end of the third quarter 2008, up 12,327 from a year ago. Of the increase, approximately 4,700 were the result of consolidating Cat Japan and about 1,500 were the result of acquisitions. The remaining increase of approximately 6,100 employees primarily supported increased volumes, growth and new product introductions.
Page 12
Outlook
Economic Outlook
The financial crisis, which has been ongoing for more than a year, intensified significantly in September. The developed economies of North America, Europe and Japan were already struggling, and recent tightening in credit conditions indicate that developed economies will deteriorate further in the coming months. Recent coordinated interest rate cuts in both North America and Europe suggest that governments and central banks are replacing anti-inflation policies with actions to address financial turmoil and slowing economies.
Developing economies have been largely immune to the financial crisis, but some problems are emerging. Financing difficulties stopped several infrastructure projects, and some banking systems, such as in Russia, experienced disruptions. These impacts, along with some policy tightening, point to slower growth in these countries as well.
The current financial crisis is the worst in years, and the factors driving it are different than previous recessions. This uniqueness means very little historical experience is available to guide our planning. While we are outlining our preliminary economic outlook below, we are monitoring events closely and new developments may require adjustments to our assumptions and conclusions in the future.
Overall, we expect world economic growth will slow from 3.8 percent in 2007 to 2.8 percent in 2008. Our preliminary projection for 2009 is for less than 2.5 percent growth, the slowest since 2002.
North American economies should grow a little less than 1.5 percent in 2008 and less than 1 percent in 2009.
| § | U.S. gross domestic product (GDP) may have increased slightly during the third quarter, but employment has declined all year. Declining employment and growing weaknesses in consumer spending lead us to believe the National Bureau of Economic Research will eventually declare a recession is underway. |
| § | Credit markets are not functioning properly, with commercial paper outstanding declining rapidly, key interest rate spreads reaching the highest in years and banks tightening lending standards. These disruptions almost certainly mean the economy will slow sharply in coming quarters. |
| § | The government enacted a comprehensive plan, which will allow the U.S. Treasury Department to buy distressed assets, inject capital into banks and support the Fed in directly providing credit. Government spending should increase substantially and eventually benefit economic growth. |
| § | The Fed is now aggressively addressing financial problems. Most important, it cut its interest rate target to 1.5 percent and injected significant funding into the banking system. We believe the Fed will soon cut interest rates to 1 percent or lower and provide even more funds to banks. |
| § | In the meantime, the Fed indicated it would provide credit directly, helping to offset disruptions. It announced it would buy commercial paper, and other actions are likely. |
| § | The adoption of highly expansive economic policies should correct current financial and economic problems. However, these policies will take time to work, and we do not expect meaningful improvement before late 2009. |
| § | The Canadian economy is near recession, and the Bank of Canada participated in the recent round of coordinated interest rate reductions. We expect further interest rate reductions, but the economy will remain weak throughout 2009. |
Page 13
Economic growth in Europe should slow to near 1.5 percent this year and drop close to 1 percent in 2009.
| § | The euro-zone economy declined in the second quarter, and survey data indicated further deterioration in the third quarter. The U.K. economy is also weakening. We believe much of Europe will be in recession by the end of the year. |
| § | Many European governments reacted to banking crises by taking capital positions in banks and guaranteeing bank deposits. Several central banks also participated in the coordinated 50 basis point interest rate reduction. |
| § | Despite those positive moves, European interest rates are well above levels that were needed to start the last recovery in Europe. Moving rates much lower, which we think will be necessary, could take considerable time. |
| § | We are not planning on an economic recovery in Europe in 2009. |
The Japanese economy should grow about 0.5 percent in both 2008 and 2009.
| § | The Bank of Japan tightened economic policies last year, adopting a more severe position than existed prior to the last recovery in Japan. As a result, the economy declined in the second quarter and is now probably in recession. |
| § | Despite a weak economy, the central bank has not eased policy significantly. As a result, we do not expect a recovery in Japan in 2009. |
Economic growth in the developing economies should average about 6 percent in 2008 and then slow to 5.5 percent in 2009.
| § | Developing economies have experienced significant growth over the past few years as a result of much lower inflation, substantially lower interest rates, very competitive exports and favorable commodity prices. Many of those factors remain in place today. |
| § | Commodity prices declined sharply over the past few weeks from very high levels. We assume prices will ease further but not so low that producers will sharply curtail investments. Most governments did not increase spending nearly as much as revenues increased, so they will not be forced to cut infrastructure spending simply because commodity prices are lower. |
| § | Many developing countries had been tightening economic policies to slow inflation. Some, such as China, have already reversed policies, and we believe the ongoing financial crisis will cause others to slow, or even reverse policies. As a result, domestic economies should hold up fairly well, helping offset weaknesses in exports. |
| § | In the past, these developing economies encountered problems in paying for imports since they ran deficits with developed countries. This is not likely in the coming year since these countries have been running large surpluses with developed countries and have accumulated large reserves. |
| § | We expect that most developing economies will respond to internal financial difficulty by using reserves and sovereign wealth funds to maintain economic growth. Russia has already responded in that way to internal financial challenges. |
Based on the above factors, we expect developing economies will have fewer problems in 2009 than developed economies.
Page 14
2008 Sales and Revenues and Profit Outlook
Sales and revenues in the first three quarters of 2008 have been well above last year, and the order board supports continued sales growth in the fourth quarter. In addition, Cat Japan’s sales will be consolidated in the fourth quarter.
We continue to expect full year 2008 sales and revenues to be more than $50 billion and profit per share to be about $6.00.
Preliminary 2009 Outlook
For 2009, our preliminary forecast is for sales and revenues to be about the same as in 2008. The positive factors related to our preliminary 2009 outlook include:
| § | Rapid growth in the developing countries’ industry opportunities over the past seven years means this opportunity is now larger than that in the developed economies. We expect that industry opportunity in developing economies, while slowing, will still grow in 2009, helping to offset sharp declines in the developed economies. |
| § | For several years, the mining and energy sectors have demanded more large machines, engines and turbines than manufacturers could provide. As a result, equipment fleets have aged. We believe that planned investments by mining and energy companies, coupled with the need to replace aged equipment, should support continuing strong demand for mining and energy-related products in 2009. |
| § | Most dealers are reporting inventories that are appropriate for their deliveries. We do not anticipate a need for dealers to sharply reduce inventories in 2009. |
| § | 2009 will include a full year of Cat Japan sales. |
| § | Growth opportunities in service areas, like Progress Rail and Cat Logistics, should increase in 2009. |
| § | Price increases announced for 2009 are also expected to be positive for sales next year. |
Page 15
Our 2009 preliminary outlook for sales and revenues is subject to the uncertainty of the current global economic environment, and we expect the positive factors noted above to be about offset by continuing sharp declines in industry demand in all developed economies—particularly in construction and construction-related sectors.
As a result of the uncertainties associated with current global economic circumstances we will provide an outlook for 2009 profit per share in our January 2009 release.
Page 16
Questions and Answers
| Economy / Sales / Outlook |
| Q1: | When do you predict a recovery in U.S. housing? |
| A: | Housing sales have shown signs of stabilizing, and the inventory of unsold new homes has been declining. We expect that Fed interest rate reductions and the U.S. Treasury’s plans to buy bank preferred shares will help lower mortgage interest rates and encourage banks to ease lending standards. Those changes should make a recovery in housing possible in late 2009. |
| Q2: | Commodity prices have tumbled over the past quarter. How is that affecting 2008 sales, and what are the implications for next year and beyond? |
| A: | Since the end of second quarter 2008, West Texas Intermediate oil prices dropped from over $135 per barrel to near $70; copper prices dropped from almost $3.90 per pound to under $2.20. Those declines are large but are from historically high levels. The current investment cycle was already underway in early 2005 when the oil price was a little over $40 and copper was $1.40. As such, current prices remain favorable for investment. A weakening world economy could continue to push prices down and impact producers’ investment plans. However, we believe production capacities remain below long-term needs for most energy commodities and metals, and our data suggests equipment used in these industries has aged. As a result, we expect most commodity prices will remain attractive for investment and that most producers will continue to invest to meet long-term needs. |
| Q3: | European economies have declined rapidly. What does that mean for Caterpillar sales this year and next? |
| A: | Our sales volume in Europe declined below year-earlier levels in both the second and third quarters of this year. We believe that many European economies will be in recession by the end of the year and will remain depressed throughout 2009. So, we expect sales volume in Europe will decline in 2009. |
| Q4: | Are you expecting a worldwide recession in 2009? |
| A: | Currently we believe much of the developed world will be in recession but that the developing economies will continue to grow at a rate that would be positive for our sales and revenues. Therefore, despite recession in the developed world, we do not anticipate a worldwide economic collapse as occurred in the early 1980s. |
Page 17
| Q5: | Sales to emerging market countries in Asia, Latin America, the Middle East and Africa have been very positive for Caterpillar. Can that continue in this economic environment? Do you expect growth to slow? |
| A: | Up until now, developing countries have been largely immune from the financial crisis that has swept the developed economies. Our sales growth in these countries was robust through the third quarter, and our near-term order position is strong. Several factors leave us cautiously optimistic about 2009 prospects: (1) these countries have not focused as intensely on fighting inflation as have the developed countries, (2) some countries have eased monetary policy, and we expect others will follow, (3) developing countries have increased infrastructure spending well within the limits of income growth, (4) many of these countries have accumulated sizeable savings in official reserves or sovereign wealth funds, and (5) collectively they are in a stronger financial position than in advance of past downturns. However, recessions in developed countries will slow developing country exports, and the financial crisis will cause some delays or cancellations of infrastructure projects. After assessing these factors, we are forecasting a slowing in both economic growth and our sales but not recessionary conditions in developing countries. |
| Q6: | Can you comment on your expectations for China’s economy over the next year? |
| A: | China started tightening economic policy in 2006, and growth is slowing from almost 12 percent last year to a little over 10 percent this year. The government has begun easing policies, and we expect that to help. We expect growth will slow somewhat next year but at a level that supports an increase in our sales in China. |
| Q7: | Why aren’t you providing a profit outlook for 2009? |
| A: | The economic environment has changed significantly over the past month. At this point in our planning process, we develop our preliminary outlook for the coming year using a comprehensive bottoms-up, business unit forecast. We’ve taken the recent events into account in developing our outlook for sales and revenues, but we have more work to do in operational planning for 2009. We expect to provide a profit outlook with our year-end release in January. |
| Costs / Margin |
| Q8: | What do you expect for material costs next year? How about the fourth quarter of 2008? |
| A: | While we expect the rate of increase to slow or to reverse for some commodities given the third quarter's record highs, we still expect to experience cost increases in fourth quarter 2008 and on average for 2009. We plan to continue to minimize the impact of these increases as much as possible through cost reduction and other efforts to help offset sustained commodity driven price increases. |
Page 18
| Q9: | Do you expect that the Cat Production System (CPS) will result in manufacturing cost reductions that we will clearly see in 2009 results? |
| A: | We are very confident that we are on the right path with CPS and that it will provide significant improvements in safety, quality, velocity and costs. That said, we’ve not provided an outlook for 2009 profit. We expect to be in a better position to do that with our year-end release in January. |
| Q10: | What cost actions are you taking in response to turmoil in credit markets and the potential for a difficult recession in much of the world? |
| A: | We will continue to monitor the current economic situation and assess its impact on Caterpillar. Each of our divisions has specific trough action plans to prioritize spending and investment in uncertain times with declining volume. Some divisions within Caterpillar are already executing these plans as their markets are already in recession. We are closely watching the business environment and are ready to execute plans in other divisions if the situation requires it. |
| Engines |
| Q11: | What’s the status of your various initiatives with Navistar? |
| A: | We are continuing to work cooperatively with Navistar on a broad range of strategic initiatives since the announcement of our strategic alliance in June 2008. |
| Cat Financial |
| Q12: | Give us an update on the quality of your asset portfolio. How are past dues, credit losses and allowances? |
| A: | At the end of the third quarter, past dues were 3.64 percent compared with 2.36 percent at the end of 2007 and 2.52 percent at the end of third quarter 2007. The increase in past dues began with the downturn in the U.S. housing market, but has recently spread to Europe as global credit challenges continue. We expect there will be continued upward pressure on past dues throughout the remainder of 2008. Bad debt write-offs net of recoveries were $22 million for the third quarter of 2008 compared with $15 million for the third quarter of 2007. This increase has been driven by economic conditions in North America and a 17 percent growth in Cat Financial's average retail finance receivable portfolio. For the first nine months of 2008, bad debt write-offs net of recoveries were $61 million compared with $41 million for the first nine months of 2007. As a percentage of Cat Financial's retail portfolio, we expect that bad debt write-offs through the remainder of 2008 will be higher than 2007, but near historical averages. At the end of the third quarter 2008, Cat Financial's allowance for credit losses totaled $390 million, an increase of $52 million from the third quarter of 2007. Of the increase, $46 million is attributable to growth in the retail finance receivable portfolio while $6 million resulted from the increase in the allowance rate from 1.39 percent to 1.41 percent of net finance receivables. |
Page 19
| Q13: | How do these asset quality metrics compare with prior recessions? |
| A: | As a historical comparison, total Cat Financial past dues during the last U.S. recession were 4.78 percent at their peak at the end of the first quarter of 2002. Total write-offs net of recoveries for the full-year of 2002 were 0.69 percent of our average retail portfolio, or more than double the annualized September 2008 year-to-date rate of 0.32 percent. Cat Financial's allowance for credit losses, totaling $390 million at the end of the third quarter of 2008, is appropriate for the current and expected global economic environment. |
| Q14: | Describe your access to debt markets over the past quarter, particularly over the past 6 weeks? |
| A: | Cat Financial has maintained access to commercial paper markets throughout the recent credit market disruption to fund ongoing operations. Over the last 6 weeks, commercial paper maturities have typically ranged from overnight to 1 and 2 months. Global term debt market conditions have been challenging, however Cat Financial has been able to fund its portfolio needs. |
| Q15: | How much commercial paper do you have, and do you have commercial paper with maturities beyond a few days? |
| A: | At the end of the third quarter, Cat Financial had approximately $5.0 billion in commercial paper outstanding. Of this amount, 86 percent, or $4.3 billion, had maturities beyond one week. |
| Q16: | Are you backing up your commercial paper with bank lines? If so, how much? |
| A: | Cat Financial shares a $6.85 billion revolving credit facility with Caterpillar Inc. that was increased in September 2008 by $0.3 billion. The majority of this facility, totaling $5.85 billion, is allocated to Cat Financial and serves to provide 100 percent backup for commercial paper issuance globally. |
| Q17: | I know you’ve been in the market recently with medium term notes. Can you describe market interest in your offering—were the notes oversubscribed? Can you discuss your recent experience with credit spreads and how that compares with rates over the past year? |
| A: | In September, Cat Financial successfully demonstrated access to the U.S. term debt market during a period of highly volatile market conditions. The Medium Term Note (MTN) transaction was originally targeted at $500 million and was increased to $1.3 billion after strong investor interest that totaled nearly $3 billion. This Cat Financial funding transaction, which occurred on September 23, 2008, represented the first investment grade transaction in the U.S. bond market in nearly two weeks. Credit spreads and all-in coupon rates achieved for this 5- and 10-year fixed rate MTN issuance were higher than historical levels and reflected the broader market conditions. Subsequent U.S. corporate investment-grade MTN issuances in late September and early October have reflected comparatively wider credit spreads and higher interest rate coupon levels than the recent Cat Financial transaction. As a historical comparison, Cat Financial’s credit spread over applicable U.S. Treasuries for 10-year MTN issuance in August 2007 to September 2008 has increased 195 basis points (from 130bps to 325bps). During this same period, the Merrill Lynch single-A rated bond index increased 331 basis points (133bps to 464bps). |
Page 20
| Q18: | “Credit Default Swaps” for captive finance companies have been in the news. What are they and how have they impacted Cat Financial? |
| A: | A credit default swap (CDS) is a derivative that allows investors to “insure” against credit loss on a transaction. This credit risk protection is purchased from a selling counterparty to cover risk exposure in the event of default by a third-party. Investors may choose to purchase protection against issuer default on underlying investments utilizing these credit derivatives. Issuers of corporate debt have recently experienced elevated CDS levels due to the broader concerns related to credit market conditions. This impact has been seen across all industries and has been a factor in the wider credit spreads required by investors on new term debt investments. Likewise, higher CDS pricing levels have been a factor in the wider credit spreads Cat Financial has recently experienced on term debt issuance. In general, Cat Financial CDS levels have remained lower than other finance companies and banks in the recent market. |
| Q19: | Are used equipment prices falling and what impact could this have on Cat Financial? |
| A: | Cat Financial has had a consistent approach to underwriting over a number of years and has a very diversified portfolio serving multiple industries. Residuals are established by model based on a range of factors including: the application, expected usage, lease term and past remarketing experience. While used equipment prices are continuing to trend lower, we believe that residual values are appropriate. Over the past ten years Cat Financial's gain or loss on terminations has not been significant to profitability and has averaged about 1 percent of Cat Financial's profit before tax. In addition, Cat Financial's recent experience is consistent with its historical performance. |
| Cash / Capacity / Capital Expenditures |
| Q20: | How much Caterpillar stock did you repurchase in the third quarter? |
| A: | In the third quarter we repurchased 5.9 million shares at a cost of $388 million. Through September 2008, we have spent $3.65 billion of the $7.5 billion authorized. We repurchase stock as part of our cash deployment process under our Board-authorized $7.5 billion stock repurchase program which expires on December 31, 2011. |
| Q21: | When did SCM execute its share repurchase, when did you begin consolidating SCM and what’s the impact on your third-quarter financial statements? |
| A: | On August 1, 2008, SCM redeemed one-half of Mitsubishi Heavy Industries Ltd.’s (MHI’s) shares in SCM for $464 million. Caterpillar now owns 67 percent of the renamed entity, Caterpillar Japan Ltd. We consolidated Cat Japan’s balance sheet on September 30, 2008. The consolidation resulted in a net increase in assets of approximately $2.4 billion (primarily $1.3 billion of property, plant and equipment, $0.6 billion of receivables, $0.6 billion of inventory and $0.3 billion of goodwill and intangibles, partially offset by a $0.5 billion reduction in investment in unconsolidated affiliates) and a net increase in liabilities of $2.1 billion, including $1.4 billion in debt. We will begin consolidating Cat Japan’s results of operations in the fourth quarter. This will result in higher Caterpillar sales in the fourth quarter, but we expect it will have little impact on fourth quarter profit. |
Page 21
| Q22: | Given the uncertainty in global markets, how will you manage your liquidity and cash deployment going forward? |
| A: | We have a strong balance sheet. Our debt-to-capital ratio is in the middle of our target range. We have capacity to fund growth, contribute to our benefit plans, pay dividends and repurchase stock. We have a well-established cash deployment strategy that maintains our financial strength. We are constantly evaluating business and economic conditions and will flex our use of cash as needed to maximize long-term stockholder value. |
| Q23: | Outside of Cat Financial, what has been Caterpillar’s recent experience with debt markets? Do you have access to capital? |
| A: | The problems in the credit markets have had limited impact on Caterpillar due to our strong credit rating. We have been able to maintain normal operations and fund our needs. We have had consistent demand for our commercial paper and believe we can issue long-term debt as needed. |
| Q24: | What’s your M&E debt-to-capital ratio and where is it relative to your target range? |
| A: | The debt-to-capital ratio for Machinery and Engines was 40 percent at the end of the third quarter, within our current target range of 35 to 45 percent. The consolidation of Cat Japan added $1.4 billion of debt and increased the debt-to-capital ratio 6 percentage points. We are positioned in the middle of our target range and have capacity in our debt-to-capital ratio to accommodate our 2009 needs. |
Page 22
GLOSSARY OF TERMS
1. | A.S.V. Inc. – A company in which Caterpillar previously held a 23 percent equity investment. This investment was sold in February 2008. |
2. | Caterpillar Production System (CPS) – The Caterpillar Production System is the common Order-to-Delivery process being implemented enterprise-wide to achieve our safety, quality, velocity, earnings and growth goals for 2010 and beyond. |
3. | Consolidating Adjustments – Eliminations of transactions between Machinery and Engines and Financial Products. |
4. | Currency – With respect to sales and revenues, currency represents the translation impact on sales resulting from changes in foreign currency exchange rates versus the U.S. dollar. With respect to operating profit, currency represents the net translation impact on sales and operating costs resulting from changes in foreign currency exchange rates versus the U.S. dollar. Currency includes the impacts on sales and operating profit for the Machinery and Engines lines of business only; currency impacts on Financial Products revenues and operating profit are included in the Financial Products portions of the respective analyses. With respect to other income/expense, currency represents the effects of forward and option contracts entered into by the company to reduce the risk of fluctuations in exchange rates and the net effect of changes in foreign currency exchange rates on our foreign currency assets and liabilities for consolidated results. |
5. | Debt-to-Capital Ratio – A key measure of financial strength used by both management and our credit rating agencies. The metric is a ratio of Machinery and Engines debt (short-term borrowings plus long-term debt) to the sum of Machinery and Engines debt and stockholders' equity. |
6. | EAME – Geographic region including Europe, Africa, the Middle East and the Commonwealth of Independent States (CIS). |
7. | Earning Assets – Assets consisting primarily of total finance receivables net of unearned income, plus equipment on operating leases, less accumulated depreciation at Cat Financial. |
8. | Engines – A principal line of business including the design, manufacture, marketing and sales of engines for Caterpillar machinery; electric power generation systems; on-highway vehicles and locomotives; marine, petroleum, construction, industrial, agricultural and other applications and related parts. Also includes remanufacturing of Caterpillar engines and a variety of Caterpillar machinery and engine components and remanufacturing services for other companies. Reciprocating engines meet power needs ranging from 5 to 21,500 horsepower (4 to more than 16 000 kilowatts). Turbines range from 1,600 to 30,000 horsepower (1 200 to 22 000 kilowatts). |
9. | Financial Products – A principal line of business consisting primarily of Caterpillar Financial Services Corporation (Cat Financial), Caterpillar Insurance Holdings, Inc. (Cat Insurance), Caterpillar Power Ventures Corporation (Cat Power Ventures) and their respective subsidiaries. Cat Financial provides a wide range of financing alternatives to customers and dealers for Caterpillar machinery and engines, Solar gas turbines as well as other equipment and marine vessels. Cat Financial also extends loans to customers and dealers. Cat Insurance provides various forms of insurance to customers and dealers to help support the purchase and lease of our equipment. Cat Power Ventures is an investor in independent power projects using Caterpillar power generation equipment and services. |
10. | Integrated Service Businesses – A service business or a business containing an important service component. These businesses include, but are not limited to, aftermarket parts, Cat Financial, Cat Insurance, Progress Rail, Solar Turbines Customer Services, Cat Logistics, OEM Solutions and Cat Reman. |
Page 23
11. | Latin America – Geographic region including Central and South American countries and Mexico. |
12. | Machinery – A principal line of business which includes the design, manufacture, marketing and sales of construction, mining and forestry machinery—track and wheel tractors, track and wheel loaders, pipelayers, motor graders, wheel tractor-scrapers, track and wheel excavators, backhoe loaders, log skidders, log loaders, off-highway trucks, articulated trucks, paving products, skid steer loaders and related parts. Also includes logistics services for other companies and the design, manufacture, remanufacture, maintenance and services of rail-related products. |
13. | Machinery and Engines (M&E) – Due to the highly integrated nature of operations, it represents the aggregate total of the Machinery and Engines lines of business and includes primarily our manufacturing, marketing and parts distribution operations. |
14. | Machinery and Engines Other Operating Expenses – Comprised primarily of gains (losses) on disposal of long-lived assets and long-lived asset impairment charges. |
15. | Manufacturing Costs – Represent the volume-adjusted change for manufacturing costs. Manufacturing costs are defined as material costs and labor and overhead costs related to the production process. Excludes the impact of currency. |
16. | Price Realization – The impact of net price changes excluding currency and new product introductions. Consolidated price realization includes the impact of changes in the relative weighting of sales between geographic regions. |
17. | Sales Volume – With respect to sales and revenues, sales volume represents the impact of changes in the quantities sold for machinery and engines as well as the incremental revenue impact of new product introductions. With respect to operating profit, sales volume represents the impact of changes in the quantities sold for machinery and engines combined with product mix—the net operating profit impact of changes in the relative weighting of machinery and engines sales with respect to total sales. |
18. | Shin Caterpillar Mitsubishi Ltd. (SCM) – Formerly a 50/50 joint venture between Caterpillar and Mitsubishi Heavy Industries Ltd. (MHI). On August 1, 2008, SCM redeemed one-half of MHI's shares. Caterpillar now owns 67 percent of the renamed entity, Caterpillar Japan Ltd. |
19. | 6 Sigma – On a technical level, 6 Sigma represents a measure of variation that achieves 3.4 defects per million opportunities. At Caterpillar, 6 Sigma represents a much broader cultural philosophy to drive continuous improvement throughout the value chain. It is a fact-based, data-driven methodology that we are using to improve processes, enhance quality, cut costs, grow our business and deliver greater value to our customers through Black Belt-led project teams. At Caterpillar, 6 Sigma goes beyond mere process improvement—it has become the way we work as teams to process business information, solve problems and manage our business successfully. |
Page 24
NON-GAAP FINANCIAL MEASURES
The following definition is provided for “non-GAAP financial measures” in connection with Regulation G issued by the Securities and Exchange Commission. This non-GAAP financial measure has no standardized meaning prescribed by U.S. GAAP and therefore is unlikely to be comparable to the calculation of similar measures for other companies. Management does not intend this item to be considered in isolation or as a substitute for the related GAAP measure: | ||
Machinery and Engines - Caterpillar defines Machinery and Engines as it is presented in the supplemental data as Caterpillar Inc. and its subsidiaries with Financial Products accounted for on the equity basis. Machinery and Engines information relates to the design, manufacture and marketing of our products. Financial Products information relates to the financing to customers and dealers for the purchase and lease of Caterpillar and other equipment. The nature of these businesses is different, especially with regard to the financial position and cash flow items. Caterpillar management utilizes this presentation internally to highlight these differences. We also believe this presentation will assist readers in understanding our business. Pages 29-34 reconcile Machinery and Engines with Financial Products on the equity basis to Caterpillar Inc. consolidated financial information. | ||
Caterpillar's latest financial results and current outlook are also available via:
Telephone:
(800) 228-7717 (Inside the United States and Canada)
(858) 244-2080 (Outside the United States and Canada)
Internet:
http://www.cat.com/investor
http://www.cat.com/irwebcast (live broadcast/replays of quarterly conference call)
Caterpillar contact:
Jim Dugan
Corporate Public Affairs
(309) 494-4100 (Office) or (309) 360-7311 (Mobile)
mailto:Dugan_Jim@cat.com
Page 25
Caterpillar Inc. Condensed Consolidated Statement of Results of Operations (Unaudited) (Dollars in millions except per share data) | |||||||||||||||||||||||||
| Three Months Ended | Nine Months Ended | ||||||||||||||||||||||||
| September 30, | September 30, | ||||||||||||||||||||||||
| 2008 | 2007 | 2008 | 2007 | ||||||||||||||||||||||
| Sales and revenues: | |||||||||||||||||||||||||
| Sales of Machinery and Engines | $ | 12,148 | $ | 10,668 | $ | 35,924 | $ | 30,602 | |||||||||||||||||
| Revenues of Financial Products | 833 | 774 | 2,477 | 2,212 | |||||||||||||||||||||
| Total sales and revenues | 12,981 | 11,442 | 38,401 | 32,814 | |||||||||||||||||||||
| Operating costs: | |||||||||||||||||||||||||
| Cost of goods sold | 9,704 | 8,270 | 28,349 | 23,706 | |||||||||||||||||||||
| Selling, general and administrative expenses | 1,061 | 938 | 3,094 | 2,796 | |||||||||||||||||||||
| Research and development expenses | 437 | 357 | 1,221 | 1,047 | |||||||||||||||||||||
| Interest expense of Financial Products | 291 | 289 | 854 | 839 | |||||||||||||||||||||
| Other operating expenses | 315 | 275 | 892 | 760 | |||||||||||||||||||||
| Total operating costs | 11,808 | 10,129 | 34,410 | 29,148 | |||||||||||||||||||||
| Operating profit | 1,173 | 1,313 | 3,991 | 3,666 | |||||||||||||||||||||
| Interest expense excluding Financial Products | 59 | 69 | 203 | 228 | |||||||||||||||||||||
| Other income (expense) | 138 | 51 | 325 | 232 | |||||||||||||||||||||
| Consolidated profit before taxes | 1,252 | 1,295 | 4,113 | 3,670 | |||||||||||||||||||||
| Provision for income taxes | 395 | 395 | 1,249 | 1,155 | |||||||||||||||||||||
| Profit of consolidated companies | 857 | 900 | 2,864 | 2,515 | |||||||||||||||||||||
| Equity in profit (loss) of unconsolidated affiliated companies | 11 | 27 | 32 | 51 | |||||||||||||||||||||
| Profit | $ | 868 | $ | 927 | $ | 2,896 | $ | 2,566 | |||||||||||||||||
| Profit per common share | $ | 1.43 | $ | 1.45 | $ | 4.72 | $ | 4.00 | |||||||||||||||||
| Profit per common share – diluted | 1 | $ | 1.39 | $ | 1.40 | $ | 4.57 | $ | 3.87 | ||||||||||||||||
Weighted average common shares outstanding (millions) | |||||||||||||||||||||||||
| - Basic | 607.0 | 638.3 | 613.2 | 641.0 | |||||||||||||||||||||
| - Diluted | 1 | 624.8 | 660.0 | 633.2 | 662.7 | ||||||||||||||||||||
| Cash dividends declared per common share | $ | — | $ | — | $ | .78 | $ | .66 | |||||||||||||||||
| 1 | Diluted by assumed exercise of stock-based compensation awards using the treasury stock method. |
Page 26
Caterpillar Inc. Condensed Consolidated Statement of Financial Position (Unaudited) (Millions of dollars) | ||||||||||||
| September 30, | December 31, | |||||||||||
| 2008 | 2007 | |||||||||||
| Assets | ||||||||||||
| Current assets: | ||||||||||||
| Cash and short-term investments | $ | 2,138 | $ | 1,122 | ||||||||
| Receivables - trade and other | 9,580 | 8,249 | ||||||||||
| Receivables - finance | 8,094 | 7,503 | ||||||||||
| Deferred and refundable income taxes | 839 | 816 | ||||||||||
| Prepaid expenses and other current assets | 583 | 583 | ||||||||||
| Inventories | 9,290 | 7,204 | ||||||||||
| Total current assets | 30,524 | 25,477 | ||||||||||
| Property, plant and equipment – net | 11,817 | 9,997 | ||||||||||
| Long-term receivables - trade and other | 685 | 685 | ||||||||||
| Long-term receivables - finance | 15,024 | 13,462 | ||||||||||
| Investments in unconsolidated affiliated companies | 100 | 598 | ||||||||||
| Noncurrent deferred and refundable income taxes | 1,337 | 1,553 | ||||||||||
| Intangible assets | 536 | 475 | ||||||||||
| Goodwill | 2,234 | 1,963 | ||||||||||
| Other assets | 1,972 | 1,922 | ||||||||||
| Total assets | $ | 64,229 | $ | 56,132 | ||||||||
| Liabilities | ||||||||||||
| Current liabilities: | ||||||||||||
| Short-term borrowings: | ||||||||||||
| -- Machinery and Engines | $ | 1,858 | $ | 187 | ||||||||
| -- Financial Products | 6,315 | 5,281 | ||||||||||
| Accounts payable | 5,149 | 4,723 | ||||||||||
| Accrued expenses | 3,668 | 3,178 | ||||||||||
| Accrued wages, salaries and employee benefits | 1,115 | 1,126 | ||||||||||
| Customer advances | 1,946 | 1,442 | ||||||||||
| Dividends payable | — | 225 | ||||||||||
| Other current liabilities | 1,112 | 951 | ||||||||||
| Long-term debt due within one year: | ||||||||||||
| -- Machinery and Engines | 353 | 180 | ||||||||||
| -- Financial Products | 5,844 | 4,952 | ||||||||||
| Total current liabilities | 27,360 | 22,245 | ||||||||||
| Long-term debt due after one year: | ||||||||||||
| -- Machinery and Engines | 4,265 | 3,639 | ||||||||||
| -- Financial Products | 15,529 | 14,190 | ||||||||||
| Liability for postemployment benefits | 4,796 | 5,059 | ||||||||||
| Other liabilities | 2,170 | 2,116 | ||||||||||
| Total liabilities | 54,120 | 47,249 | ||||||||||
| Redeemable noncontrolling interest | 464 | — | ||||||||||
| Stockholders' equity | ||||||||||||
| Common stock | 2,993 | 2,744 | ||||||||||
| Treasury stock | (11,109 | ) | (9,451 | ) | ||||||||
| Profit employed in the business | 19,673 | 17,398 | ||||||||||
| Accumulated other comprehensive income | (1,912 | ) | (1,808 | ) | ||||||||
| Total stockholders' equity | 9,645 | 8,883 | ||||||||||
| Total liabilities, redeemable noncontrolling interest and stockholders' equity | $ | 64,229 | $ | 56,132 | ||||||||
Page 27
Caterpillar Inc. Condensed Consolidated Statement of Cash Flow (Unaudited) (Millions of dollars) | |||||||||||
| Nine Months Ended | |||||||||||
| September 30, | |||||||||||
| 2008 | 2007 | ||||||||||
| Cash flow from operating activities: | |||||||||||
| Profit | $ | 2,896 | $ | 2,566 | |||||||
| Adjustments for non-cash items: | |||||||||||
| Depreciation and amortization | 1,453 | 1,301 | |||||||||
| Other | 84 | 38 | |||||||||
| Changes in assets and liabilities: | |||||||||||
| Receivables – trade and other | (676 | ) | 850 | ||||||||
| Inventories | (1,380 | ) | (715 | ) | |||||||
| Accounts payable and accrued expenses | 790 | 268 | |||||||||
| Customer advances | 321 | 541 | |||||||||
| Other assets – net | 154 | (89 | ) | ||||||||
| Other liabilities – net | (372 | ) | 670 | ||||||||
| Net cash provided by (used for) operating activities | 3,270 | 5,430 | |||||||||
| Cash flow from investing activities: | |||||||||||
| Capital expenditures – excluding equipment leased to others | (1,362 | ) | (969 | ) | |||||||
| Expenditures for equipment leased to others | (1,082 | ) | (971 | ) | |||||||
Proceeds from disposals of property, plant and equipment | 754 | 302 | |||||||||
| Additions to finance receivables | (11,168 | ) | (9,797 | ) | |||||||
| Collections of finance receivables | 7,402 | 7,908 | |||||||||
| Proceeds from the sale of finance receivables | 710 | 800 | |||||||||
| Investments and acquisitions (net of cash acquired) | (139 | ) | (130 | ) | |||||||
| Proceeds from sale of available-for-sale securities | 292 | 196 | |||||||||
| Investments in available-for-sale securities | (270 | ) | (286 | ) | |||||||
| Other – net | 116 | 336 | |||||||||
| Net cash provided by (used for) investing activities | (4,747 | ) | (2,611 | ) | |||||||
| Cash flow from financing activities: | |||||||||||
| Dividends paid | (700 | ) | (617 | ) | |||||||
| Common stock issued, including treasury shares reissued | 128 | 311 | |||||||||
| Payment for stock repurchase derivative contracts | (38 | ) | — | ||||||||
| Treasury shares purchased | (1,716 | ) | (1,485 | ) | |||||||
| Excess tax benefit from stock-based compensation | 55 | 143 | |||||||||
| Proceeds from debt issued (original maturities greater than three months) | 14,020 | 7,506 | |||||||||
| Payments on debt (original maturities greater than three months) | (10,888 | ) | (7,923 | ) | |||||||
| Short-term borrowings (original maturities three months or less)-net | 1,646 | (374 | ) | ||||||||
| Net cash provided by (used for) financing activities | 2,507 | (2,439 | ) | ||||||||
| Effect of exchange rate changes on cash | (14 | ) | — | ||||||||
| Increase (decrease) in cash and short-term investments | 1,016 | 380 | |||||||||
| Cash and short-term investments at beginning of period | 1,122 | 530 | |||||||||
| Cash and short-term investments at end of period | $ | 2,138 | $ | 910 | |||||||
| Certain amounts for prior periods have been reclassified to conform to the current period financial statement presentation. |
| All short-term investments, which consist primarily of highly liquid investments with original maturities of three months or less, are considered to be cash equivalents. |
Page 28
Caterpillar Inc. Supplemental Data for Results of Operations For The Three Months Ended September 30, 2008 (Unaudited) (Millions of dollars) | ||||||||||||||||||||
| Supplemental Consolidating Data | ||||||||||||||||||||
| Machinery | Financial | Consolidating | ||||||||||||||||||
| Consolidated | and Engines | 1 | Products | Adjustments | ||||||||||||||||
| Sales and revenues: | ||||||||||||||||||||
| Sales of Machinery and Engines | $ | 12,148 | $ | 12,148 | $ | — | $ | — | ||||||||||||
| Revenues of Financial Products | 833 | — | 897 | (64 | ) | 2 | ||||||||||||||
| Total sales and revenues | 12,981 | 12,148 | 897 | (64 | ) | |||||||||||||||
| Operating costs: | ||||||||||||||||||||
| Cost of goods sold | 9,704 | 9,704 | — | — | ||||||||||||||||
| Selling, general and administrative expenses | 1,061 | 924 | 142 | (5 | ) | 3 | ||||||||||||||
| Research and development expenses | 437 | 437 | — | — | ||||||||||||||||
| Interest expense of Financial Products | 291 | — | 292 | (1 | ) | 4 | ||||||||||||||
| Other operating expenses | 315 | 3 | 319 | (7 | ) | 3 | ||||||||||||||
| Total operating costs | 11,808 | 11,068 | 753 | (13 | ) | |||||||||||||||
| Operating profit | 1,173 | 1,080 | 144 | (51 | ) | |||||||||||||||
| Interest expense excluding Financial Products | 59 | 59 | — | — | 4 | |||||||||||||||
| Other income (expense) | 138 | 63 | 24 | 51 | 5 | |||||||||||||||
| Consolidated profit before taxes | 1,252 | 1,084 | 168 | — | ||||||||||||||||
| Provision for income taxes | 395 | 353 | 42 | — | ||||||||||||||||
| Profit of consolidated companies | 857 | 731 | 126 | — | ||||||||||||||||
| Equity in profit (loss) of unconsolidated affiliated companies | 11 | 12 | (1 | ) | — | |||||||||||||||
Equity in profit of Financial Products' subsidiaries | — | 125 | — | (125 | ) | 6 | ||||||||||||||
| Profit | $ | 868 | $ | 868 | $ | 125 | $ | (125 | ) | |||||||||||
| 1 | Represents Caterpillar Inc. and its subsidiaries with Financial Products accounted for on the equity basis. |
| 2 | Elimination of Financial Products’ revenues earned from Machinery and Engines. |
| 3 | Elimination of net expenses recorded by Machinery and Engines paid to Financial Products. |
| 4 | Elimination of interest expense recorded between Financial Products and Machinery and Engines. |
| 5 | Elimination of discount recorded by Machinery and Engines on receivables sold to Financial Products and of interest earned between Machinery and Engines and Financial Products. |
| 6 | Elimination of Financial Products’ profit due to equity method of accounting. |
Page 29
Caterpillar Inc. Supplemental Data for Results of Operations For The Three Months Ended September 30, 2007 (Unaudited) (Millions of dollars) | ||||||||||||||||||||
| Supplemental Consolidating Data | ||||||||||||||||||||
| Machinery | Financial | Consolidating | ||||||||||||||||||
| Consolidated | and Engines | 1 | Products | Adjustments | ||||||||||||||||
| Sales and revenues: | ||||||||||||||||||||
| Sales of Machinery and Engines | $ | 10,668 | $ | 10,668 | $ | — | $ | — | ||||||||||||
| Revenues of Financial Products | 774 | — | 863 | (89 | ) | 2 | ||||||||||||||
| Total sales and revenues | 11,442 | 10,668 | 863 | (89 | ) | |||||||||||||||
| Operating costs: | ||||||||||||||||||||
| Cost of goods sold | 8,270 | 8,270 | — | — | ||||||||||||||||
| Selling, general and administrative expenses | 938 | 831 | 112 | (5 | ) | 3 | ||||||||||||||
| Research and development expenses | 357 | 357 | — | — | ||||||||||||||||
| Interest expense of Financial Products | 289 | — | 291 | (2 | ) | 4 | ||||||||||||||
| Other operating expenses | 275 | — | 282 | (7 | ) | 3 | ||||||||||||||
| Total operating costs | 10,129 | 9,458 | 685 | (14 | ) | |||||||||||||||
| Operating profit | 1,313 | 1,210 | 178 | (75 | ) | |||||||||||||||
| Interest expense excluding Financial Products | 69 | 70 | — | (1 | ) | 4 | ||||||||||||||
| Other income (expense) | 51 | (41 | ) | 18 | 74 | 5 | ||||||||||||||
| Consolidated profit before taxes | 1,295 | 1,099 | 196 | — | ||||||||||||||||
| Provision for income taxes | 395 | 337 | 58 | — | ||||||||||||||||
| Profit of consolidated companies | 900 | 762 | 138 | — | ||||||||||||||||
| Equity in profit (loss) of unconsolidated affiliated companies | 27 | 26 | 1 | — | ||||||||||||||||
Equity in profit of Financial Products' subsidiaries | — | 139 | — | (139 | ) | 6 | ||||||||||||||
| Profit | $ | 927 | $ | 927 | $ | 139 | $ | (139 | ) | |||||||||||
| 1 | Represents Caterpillar Inc. and its subsidiaries with Financial Products accounted for on the equity basis. |
| 2 | Elimination of Financial Products’ revenues earned from Machinery and Engines. |
| 3 | Elimination of net expenses recorded by Machinery and Engines paid to Financial Products. |
| 4 | Elimination of interest expense recorded between Financial Products and Machinery and Engines. |
| 5 | Elimination of discount recorded by Machinery and Engines on receivables sold to Financial Products and of interest earned between Machinery and Engines and Financial Products. |
| 6 | Elimination of Financial Products’ profit due to equity method of accounting. |
Page 30
Caterpillar Inc. Supplemental Data for Results of Operations For The Nine Months Ended September 30, 2008 (Unaudited) (Millions of dollars) | ||||||||||||||||||||
| Supplemental Consolidating Data | ||||||||||||||||||||
| Machinery | Financial | Consolidating | ||||||||||||||||||
| Consolidated | and Engines | 1 | Products | Adjustments | ||||||||||||||||
| Sales and revenues: | ||||||||||||||||||||
| Sales of Machinery and Engines | $ | 35,924 | $ | 35,924 | $ | — | $ | — | ||||||||||||
| Revenues of Financial Products | 2,477 | — | 2,719 | (242 | ) | 2 | ||||||||||||||
| Total sales and revenues | 38,401 | 35,924 | 2,719 | (242 | ) | |||||||||||||||
| Operating costs: | ||||||||||||||||||||
| Cost of goods sold | 28,349 | 28,349 | — | — | ||||||||||||||||
| Selling, general and administrative expenses | 3,094 | 2,681 | 430 | (17 | ) | 3 | ||||||||||||||
| Research and development expenses | 1,221 | 1,221 | — | — | ||||||||||||||||
| Interest expense of Financial Products | 854 | — | 857 | (3 | ) | 4 | ||||||||||||||
| Other operating expenses | 892 | (17 | ) | 927 | (18 | ) | 3 | |||||||||||||
| Total operating costs | 34,410 | 32,234 | 2,214 | (38 | ) | |||||||||||||||
| Operating profit | 3,991 | 3,690 | 505 | (204 | ) | |||||||||||||||
| Interest expense excluding Financial Products | 203 | 203 | — | — | 4 | |||||||||||||||
| Other income (expense) | 325 | 61 | 60 | 204 | 5 | |||||||||||||||
| Consolidated profit before taxes | 4,113 | 3,548 | 565 | — | ||||||||||||||||
| Provision for income taxes | 1,249 | 1,089 | 160 | — | ||||||||||||||||
| Profit of consolidated companies | 2,864 | 2,459 | 405 | — | ||||||||||||||||
| Equity in profit (loss) of unconsolidated affiliated companies | 32 | 33 | (1 | ) | — | |||||||||||||||
Equity in profit of Financial Products' subsidiaries | — | 404 | — | (404 | ) | 6 | ||||||||||||||
| Profit | $ | 2,896 | $ | 2,896 | $ | 404 | $ | (404 | ) | |||||||||||
| 1 | Represents Caterpillar Inc. and its subsidiaries with Financial Products accounted for on the equity basis. |
| 2 | Elimination of Financial Products’ revenues earned from Machinery and Engines. |
| 3 | Elimination of net expenses recorded by Machinery and Engines paid to Financial Products. |
| 4 | Elimination of interest expense recorded between Financial Products and Machinery and Engines. |
| 5 | Elimination of discount recorded by Machinery and Engines on receivables sold to Financial Products and of interest earned between Machinery and Engines and Financial Products. |
| 6 | Elimination of Financial Products’ profit due to equity method of accounting. |
Page 31
Caterpillar Inc. Supplemental Data for Results of Operations For The Nine Months Ended September 30, 2007 (Unaudited) (Millions of dollars) | ||||||||||||||||||||
| Supplemental Consolidating Data | ||||||||||||||||||||
| Machinery | Financial | Consolidating | ||||||||||||||||||
| Consolidated | and Engines | 1 | Products | Adjustments | ||||||||||||||||
| Sales and revenues: | ||||||||||||||||||||
| Sales of Machinery and Engines | $ | 30,602 | $ | 30,602 | $ | — | $ | — | ||||||||||||
| Revenues of Financial Products | 2,212 | — | 2,508 | (296 | ) | 2 | ||||||||||||||
| Total sales and revenues | 32,814 | 30,602 | 2,508 | (296 | ) | |||||||||||||||
| Operating costs: | ||||||||||||||||||||
| Cost of goods sold | 23,706 | 23,706 | — | — | ||||||||||||||||
| Selling, general and administrative expenses | 2,796 | 2,469 | 342 | (15 | ) | 3 | ||||||||||||||
| Research and development expenses | 1,047 | 1,047 | — | — | ||||||||||||||||
| Interest expense of Financial Products | 839 | — | 842 | (3 | ) | 4 | ||||||||||||||
| Other operating expenses | 760 | (14 | ) | 795 | (21 | ) | 3 | |||||||||||||
| Total operating costs | 29,148 | 27,208 | 1,979 | (39 | ) | |||||||||||||||
| Operating profit | 3,666 | 3,394 | 529 | (257 | ) | |||||||||||||||
| Interest expense excluding Financial Products | 228 | 233 | — | (5 | ) | 4 | ||||||||||||||
| Other income (expense) | 232 | (77 | ) | 57 | 252 | 5 | ||||||||||||||
| Consolidated profit before taxes | 3,670 | 3,084 | 586 | — | ||||||||||||||||
| Provision for income taxes | 1,155 | 966 | 189 | — | ||||||||||||||||
| Profit of consolidated companies | 2,515 | 2,118 | 397 | — | ||||||||||||||||
| Equity in profit (loss) of unconsolidated affiliated companies | 51 | 48 | 3 | — | ||||||||||||||||
Equity in profit of Financial Products' subsidiaries | — | 400 | — | (400 | ) | 6 | ||||||||||||||
| Profit | $ | 2,566 | $ | 2,566 | $ | 400 | $ | (400 | ) | |||||||||||
| 1 | Represents Caterpillar Inc. and its subsidiaries with Financial Products accounted for on the equity basis. |
| 2 | Elimination of Financial Products’ revenues earned from Machinery and Engines. |
| 3 | Elimination of net expenses recorded by Machinery and Engines paid to Financial Products. |
| 4 | Elimination of interest expense recorded between Financial Products and Machinery and Engines. |
| 5 | Elimination of discount recorded by Machinery and Engines on receivables sold to Financial Products and of interest earned between Machinery and Engines and Financial Products. |
| 6 | Elimination of Financial Products’ profit due to equity method of accounting. |
Page 32
Caterpillar Inc. Supplemental Data for Cash Flow For The Nine Months Ended September 30, 2008 (Unaudited) (Millions of dollars) | |||||||||||||||||||||
| Supplemental Consolidating Data | |||||||||||||||||||||
| Machinery | Financial | Consolidating | |||||||||||||||||||
| Consolidated | and Engines | 1 | Products | Adjustments | |||||||||||||||||
| Cash flow from operating activities: | |||||||||||||||||||||
| Profit | $ | 2,896 | $ | 2,896 | $ | 404 | $ | (404 | ) | 2 | |||||||||||
| Adjustments for non-cash items: | |||||||||||||||||||||
| Depreciation and amortization | 1,453 | 879 | 574 | — | |||||||||||||||||
| Undistributed profit of Financial Products | — | (404 | ) | — | 404 | 3 | |||||||||||||||
| Other | 84 | 151 | (199 | ) | 132 | 4 | |||||||||||||||
| Changes in assets and liabilities: | |||||||||||||||||||||
| Receivables - trade and other | (676 | ) | (489 | ) | (30 | ) | (157 | ) | 4,5 | ||||||||||||
| Inventories | (1,380 | ) | (1,380 | ) | — | — | |||||||||||||||
| Accounts payable and accrued expenses | 790 | 557 | 161 | 72 | 4 | ||||||||||||||||
| Customer advances | 321 | 321 | — | — | |||||||||||||||||
| Other assets - net | 154 | 52 | (26 | ) | 128 | 4 | |||||||||||||||
| Other liabilities - net | (372 | ) | (240 | ) | (13 | ) | (119 | ) | 4 | ||||||||||||
| Net cash provided by (used for) operating activities | 3,270 | 2,343 | 871 | 56 | |||||||||||||||||
| Cash flow from investing activities: | |||||||||||||||||||||
| Capital expenditures - excluding equipment leased to others | (1,362 | ) | (1,345 | ) | (17 | ) | — | ||||||||||||||
| Expenditures for equipment leased to others | (1,082 | ) | — | (1,101 | ) | 19 | 4 | ||||||||||||||
| Proceeds from disposals of property, plant and equipment | 754 | 27 | 727 | — | 4 | ||||||||||||||||
| Additions to finance receivables | (11,168 | ) | — | (29,272 | ) | 18,104 | 5 | ||||||||||||||
| Collections of finance receivables | 7,402 | — | 24,430 | (17,028 | ) | 5 | |||||||||||||||
| Proceeds from sale of finance receivables | 710 | — | 1,861 | (1,151 | ) | 5 | |||||||||||||||
| Net intercompany borrowings | — | 239 | (6 | ) | (233 | ) | 6 | ||||||||||||||
| Investments and acquisitions (net of cash acquired) | (139 | ) | (139 | ) | — | — | 7 | ||||||||||||||
| Proceeds from sale of available-for-sale securities | 292 | 20 | 272 | — | |||||||||||||||||
| Investments in available-for-sale securities | (270 | ) | (14 | ) | (256 | ) | — | ||||||||||||||
| Other - net | 116 | 151 | (35 | ) | — | 7 | |||||||||||||||
| Net cash provided by (used for) investing activities | (4,747 | ) | (1,061 | ) | (3,397 | ) | (289 | ) | |||||||||||||
| Cash flow from financing activities: | |||||||||||||||||||||
| Dividends paid | (700 | ) | (700 | ) | — | — | 8 | ||||||||||||||
| Common stock issued, including treasury shares reissued | 128 | 128 | — | — | 7 | ||||||||||||||||
| Payment for stock repurchase derivative contracts | (38 | ) | (38 | ) | — | — | |||||||||||||||
| Treasury shares purchased | (1,716 | ) | (1,716 | ) | — | — | |||||||||||||||
| Excess tax benefit from stock-based compensation | 55 | 55 | — | — | |||||||||||||||||
| Net intercompany borrowings | — | 6 | (239 | ) | 233 | 6 | |||||||||||||||
| Proceeds from debt issued (original maturities greater than three months) | 14,020 | 49 | 13,971 | — | |||||||||||||||||
| Payments on debt (original maturities greater than three months) | (10,888 | ) | (173 | ) | (10,715 | ) | — | ||||||||||||||
| Short-term borrowings (original maturities three months or less)-net | 1,646 | 1,219 | 427 | — | |||||||||||||||||
| Net cash provided by (used for) financing activities | 2,507 | (1,170 | ) | 3,444 | 233 | ||||||||||||||||
| Effect of exchange rate changes on cash | (14 | ) | (9 | ) | (5 | ) | — | ||||||||||||||
| Increase (decrease) in cash and short-term investments | 1,016 | 103 | 913 | — | |||||||||||||||||
| Cash and short-term investments at beginning of period | 1,122 | 862 | 260 | — | |||||||||||||||||
| Cash and short-term investments at end of period | $ | 2,138 | $ | 965 | $ | 1,173 | $ | — | |||||||||||||
| 1 | Represents Caterpillar Inc. and its subsidiaries with Financial Products accounted for on the equity basis. |
| 2 | Elimination of Financial Products’ profit after tax due to equity method of accounting. |
| 3 | Non-cash adjustment for the undistributed earnings from Financial Products. |
| 4 | Elimination of non-cash adjustments and changes in assets and liabilities related to consolidated reporting. |
| 5 | Reclassification of Cat Financial’s cash flow activity from investing to operating for receivables that arose from the sale of inventory. |
| 6 | Net proceeds and payments to/from Machinery and Engines and Financial Products. |
| 7 | Change in investment and common stock related to Financial Products. |
| 8 | Elimination of dividends from Financial Products to Machinery and Engines. |
Page 33
Caterpillar Inc. Supplemental Data for Cash Flow For The Nine Months Ended September 30, 2007 (Unaudited) (Millions of dollars) | |||||||||||||||||||||
| Supplemental Consolidating Data | |||||||||||||||||||||
| Machinery | Financial | Consolidating | |||||||||||||||||||
| Consolidated | and Engines | 1 | Products | Adjustments | |||||||||||||||||
| Cash flow from operating activities: | |||||||||||||||||||||
| Profit | $ | 2,566 | $ | 2,566 | $ | 400 | $ | (400 | ) | 2 | |||||||||||
| Adjustments for non-cash items: | |||||||||||||||||||||
| Depreciation and amortization | 1,301 | 784 | 517 | — | |||||||||||||||||
| Undistributed profit of Financial Products | — | (400 | ) | — | 400 | 3 | |||||||||||||||
| Other | 38 | 88 | (276 | ) | 226 | 4 | |||||||||||||||
| Changes in assets and liabilities: | |||||||||||||||||||||
| Receivables - trade and other | 850 | (448 | ) | 5 | 1,293 | 4,5 | |||||||||||||||
| Inventories | (715 | ) | (715 | ) | — | — | |||||||||||||||
| Accounts payable and accrued expenses | 268 | 30 | 202 | 36 | 4 | ||||||||||||||||
| Customer advances | 541 | 541 | — | — | |||||||||||||||||
| Other assets - net | (89 | ) | (59 | ) | (12 | ) | (18 | ) | 4 | ||||||||||||
| Other liabilities - net | 670 | 630 | 47 | (7 | ) | 4 | |||||||||||||||
| Net cash provided by (used for) operating activities | 5,430 | 3,017 | 883 | 1,530 | |||||||||||||||||
| Cash flow from investing activities: | |||||||||||||||||||||
| Capital expenditures - excluding equipment leased to others | (969 | ) | (956 | ) | (13 | ) | — | ||||||||||||||
| Expenditures for equipment leased to others | (971 | ) | — | (978 | ) | 7 | 4 | ||||||||||||||
| Proceeds from disposals of property, plant and equipment | 302 | 14 | 292 | (4 | ) | 4 | |||||||||||||||
| Additions to finance receivables | (9,797 | ) | — | (26,452 | ) | 16,655 | 5 | ||||||||||||||
| Collections of finance receivables | 7,908 | — | 25,020 | (17,112 | ) | 5 | |||||||||||||||
| Proceeds from sale of finance receivables | 800 | — | 1,888 | (1,088 | ) | 5 | |||||||||||||||
| Net intercompany borrowings | — | 13 | 1 | (14 | ) | 6 | |||||||||||||||
| Investments and acquisitions (net of cash acquired) | (130 | ) | (138 | ) | — | 8 | 7 | ||||||||||||||
| Proceeds from sale of available-for-sale securities | 196 | 17 | 179 | — | |||||||||||||||||
| Investments in available-for-sale securities | (286 | ) | (19 | ) | (267 | ) | — | ||||||||||||||
| Other - net | 336 | 101 | 237 | (2 | ) | 7 | |||||||||||||||
| Net cash provided by (used for) investing activities | (2,611 | ) | (968 | ) | (93 | ) | (1,550 | ) | |||||||||||||
| Cash flow from financing activities: | |||||||||||||||||||||
| Dividends paid | (617 | ) | (617 | ) | (4 | ) | 4 | 8 | |||||||||||||
| Common stock issued, including treasury shares reissued | 311 | 311 | (2 | ) | 2 | 7 | |||||||||||||||
| Payment for stock repurchase derivative contracts | — | — | — | — | |||||||||||||||||
| Treasury shares purchased | (1,485 | ) | (1,485 | ) | — | — | |||||||||||||||
| Excess tax benefit from stock-based compensation | 143 | 143 | — | — | |||||||||||||||||
| Net intercompany borrowings | — | (1 | ) | (13 | ) | 14 | 6 | ||||||||||||||
| Proceeds from debt issued (original maturities greater than three months) | 7,506 | 125 | 7,381 | — | |||||||||||||||||
| Payments on debt (original maturities greater than three months) | (7,923 | ) | (169 | ) | (7,754 | ) | — | ||||||||||||||
| Short-term borrowings (original maturities three months or less)-net | (374 | ) | (84 | ) | (290 | ) | — | ||||||||||||||
| Net cash provided by (used for) financing activities | (2,439 | ) | (1,777 | ) | (682 | ) | 20 | ||||||||||||||
| Effect of exchange rate changes on cash | — | (9 | ) | 9 | — | ||||||||||||||||
| Increase (decrease) in cash and short-term investments | 380 | 263 | 117 | — | |||||||||||||||||
| Cash and short-term investments at beginning of period | 530 | 319 | 211 | — | |||||||||||||||||
| Cash and short-term investments at end of period | $ | 910 | $ | 582 | $ | 328 | $ | — | |||||||||||||
| 1 | Represents Caterpillar Inc. and its subsidiaries with Financial Products accounted for on the equity basis. |
| 2 | Elimination of Financial Products’ profit after tax due to equity method of accounting. |
| 3 | Non-cash adjustment for the undistributed earnings from Financial Products. |
| 4 | Elimination of non-cash adjustments and changes in assets and liabilities related to consolidated reporting. |
| 5 | Reclassification of Cat Financial’s cash flow activity from investing to operating for receivables that arose from the sale of inventory. |
| 6 | Net proceeds and payments to/from Machinery and Engines and Financial Products. |
| 7 | Change in investment and common stock related to Financial Products. |
| 8 | Elimination of dividends from Financial Products to Machinery and Engines. |
Page 34