CATERPILLAR INC.
CONSOLIDATED FINANCIAL STATEMENTS
Page A-1
TABLE OF CONTENTS | |
Page A-2
To the Board of Directors and Stockholders of Caterpillar Inc.:
In our opinion, the accompanying consolidated statement of financial position and the related consolidated statements of results of operations, changes in stockholders' equity, and cash flow, including pages A-4 through A-59, present fairly, in all material respects, the financial position of Caterpillar Inc. and its subsidiaries at December 31, 2008, 2007 and 2006, and the results of their operations and their cash flows for each of the three years in the period ended December 31, 2008 in conformity with accounting principles generally accepted in the United States of America. Also in our opinion, the Company maintained, in all material respects, effective internal control over financial reporting as of December 31, 2008, based on criteria established in Internal Control - Integrated Framework issued by the Committee of Sponsoring Organizations of the Treadway Commission (COSO). The Company's management is responsible for these financial statements, for maintaining effective internal control over financial reporting and for its assessment of the effectiveness of internal control over financial reporting, included in Management's Report on Internal Control Over Financial Reporting (not included herein). Our responsibility is to express opinions on these financial statements and on the Company's internal control over financial reporting based on our integrated audits. We conducted our audits in accordance with the standards of the Public Company Accounting Oversight Board (United States). Those standards require that we plan and perform the audits to obtain reasonable assurance about whether the financial statements are free of material misstatement and whether effective internal control over financial reporting was maintained in all material respects. Our audits of the financial statements included examining, on a test basis, evidence supporting the amounts and disclosures in the financial statements, assessing the accounting principles used and significant estimates made by management, and evaluating the overall financial statement presentation. Our audit of internal control over financial reporting included obtaining an understanding of internal control over financial reporting, assessing the risk that a material weakness exists, and testing and evaluating the design and operating effectiveness of internal control based on the assessed risk. Our audits also included performing such other procedures as we considered necessary in the circumstances. We believe that our audits provide a reasonable basis for our opinions.
As discussed in Notes 1K and 29 to the consolidated financial statements, the Company changed the manner in which it accounts for noncontrolling interests as of January 1, 2009, the manner in which it measures certain assets and liabilities at fair value in 2008, the manner in which it accounts for uncertainty in income taxes in 2007, and the manner in which it accounts for defined benefit pension and other postretirement plans, effective December 31, 2006.
A company’s internal control over financial reporting is a process designed to provide reasonable assurance regarding the reliability of financial reporting and the preparation of financial statements for external purposes in accordance with generally accepted accounting principles. A company’s internal control over financial reporting includes those policies and procedures that (i) pertain to the maintenance of records that, in reasonable detail, accurately and fairly reflect the transactions and dispositions of the assets of the company; (ii) provide reasonable assurance that transactions are recorded as necessary to permit preparation of financial statements in accordance with generally accepted accounting principles, and that receipts and expenditures of the company are being made only in accordance with authorizations of management and directors of the company; and (iii) provide reasonable assurance regarding prevention or timely detection of unauthorized acquisition, use, or disposition of the company’s assets that could have a material effect on the financial statements.
Because of its inherent limitations, internal control over financial reporting may not prevent or detect misstatements. Also, projections of any evaluation of effectiveness to future periods are subject to the risk that controls may become inadequate because of changes in conditions, or that the degree of compliance with the policies or procedures may deteriorate.
As described in Management's Report on Internal Control Over Financial Reporting (not included herein), management has excluded Caterpillar Japan Ltd. from its assessment of internal control over financial reporting as of December 31, 2008 because Caterpillar Japan Ltd. was consolidated by the Company on August 1, 2008. We have also excluded Caterpillar Japan Ltd. from our audit of internal control over financial reporting. Caterpillar Japan Ltd. is a 67 percent owned subsidiary of the Company with total assets and total revenues representing 5% and less than 1%, respectively, of the related consolidated financial statement amounts as of and for the year ended December 31, 2008. Prior to consolidation, the Company accounted for its investment in this entity under the equity method.
/s/ PricewaterhouseCoopers LLP
Peoria, Illinois
February 19, 2009, except as to Note 29
which is as of May 14, 2009
Page A-3
| STATEMENT 1 | Caterpillar Inc. | ||||||||||||
Consolidated Results of Operations for the Years Ended December 31 (Dollars in millions except per share data) | |||||||||||||
2008 | 2007 | 2006 | |||||||||||
| Sales and revenues: | |||||||||||||
| Sales of Machinery and Engines | $ | 48,044 | $ | 41,962 | $ | 38,869 | |||||||
| Revenues of Financial Products | 3,280 | 2,996 | 2,648 | ||||||||||
| Total sales and revenues | 51,324 | 44,958 | 41,517 | ||||||||||
| Operating costs: | |||||||||||||
| Cost of goods sold | 38,415 | 32,626 | 29,549 | ||||||||||
| Selling, general and administrative expenses | 4,399 | 3,821 | 3,706 | ||||||||||
| Research and development expenses | 1,728 | 1,404 | 1,347 | ||||||||||
| Interest expense of Financial Products | 1,153 | 1,132 | 1,023 | ||||||||||
| Other operating (income) expenses | 1,181 | 1,054 | 971 | ||||||||||
| Total operating costs | 46,876 | 40,037 | 36,596 | ||||||||||
| Operating profit | 4,448 | 4,921 | 4,921 | ||||||||||
| Interest expense excluding Financial Products | 274 | 288 | 274 | ||||||||||
| Other income (expense) | 327 | 357 | 243 | ||||||||||
| Consolidated profit before taxes | 4,501 | 4,990 | 4,890 | ||||||||||
| Provision for income taxes | 953 | 1,485 | 1,405 | ||||||||||
| Profit of consolidated companies | 3,548 | 3,505 | 3,485 | ||||||||||
| Equity in profit (loss) of unconsolidated affiliated companies | 37 | 73 | 81 | ||||||||||
| Profit of consolidated and affiliated companies | 3,585 | 3,578 | 3,566 | ||||||||||
| Less: Profit attributable to noncontrolling interests | 28 | 37 | 29 | ||||||||||
| Profit 1 | $ | 3,557 | $ | 3,541 | $ | 3,537 | |||||||
| Profit per common share | $ | 5.83 | $ | 5.55 | $ | 5.37 | |||||||
| Profit per common share – diluted 2 | $ | 5.66 | $ | 5.37 | $ | 5.17 | |||||||
| Weighted-average common shares outstanding (millions) | |||||||||||||
| - Basic | 610.5 | 638.2 | 658.7 | ||||||||||
| - Diluted 2 | 627.9 | 659.5 | 683.8 | ||||||||||
| Cash dividends declared per common share | $ | 1.62 | $ | 1.38 | $ | 1.15 | |||||||
1 | Profit attributable to common stockholders. |
| 2 | Diluted by assumed exercise of stock-based compensation awards, using the treasury stock method. |
| See accompanying notes to Consolidated Financial Statements. | |
Page A-4
| STATEMENT 2 | Caterpillar Inc. | ||||||||||||||
Consolidated Financial Position at December 31 (Dollars in millions) | |||||||||||||||
| 2008 | 2007 | 2006 | |||||||||||||
| Assets | |||||||||||||||
| Current assets: | |||||||||||||||
| Cash and short-term investments | $ | 2,736 | $ | 1,122 | $ | 530 | |||||||||
| Receivables – trade and other | 9,397 | 8,249 | 8,607 | ||||||||||||
| Receivables – finance | 8,731 | 7,503 | 6,804 | ||||||||||||
| Deferred and refundable income taxes | 1,223 | 816 | 733 | ||||||||||||
| Prepaid expenses and other current assets | 765 | 583 | 638 | ||||||||||||
| Inventories | 8,781 | 7,204 | 6,351 | ||||||||||||
| Total current assets | 31,633 | 25,477 | 23,663 | ||||||||||||
| Property, plant and equipment – net | 12,524 | 9,997 | 8,851 | ||||||||||||
| Long-term receivables – trade and other | 1,479 | 685 | 860 | ||||||||||||
| Long-term receivables – finance | 14,264 | 13,462 | 11,531 | ||||||||||||
| Investments in unconsolidated affiliated companies | 94 | 598 | 562 | ||||||||||||
| Noncurrent deferred and refundable income taxes | 3,311 | 1,553 | 1,949 | ||||||||||||
| Intangible assets | 511 | 475 | 387 | ||||||||||||
| Goodwill | 2,261 | 1,963 | 1,904 | ||||||||||||
| Other assets | 1,705 | 1,922 | 1,742 | ||||||||||||
| Total assets | $ | 67,782 | $ | 56,132 | $ | 51,449 | |||||||||
| Liabilities | |||||||||||||||
| Current liabilities: | |||||||||||||||
| Short-term borrowings: | |||||||||||||||
| Machinery and Engines | $ | 1,632 | $ | 187 | $ | 165 | |||||||||
| Financial Products | 5,577 | 5,281 | 4,990 | ||||||||||||
| Accounts payable | 4,827 | 4,723 | 4,085 | ||||||||||||
| Accrued expenses | 4,121 | 3,178 | 2,923 | ||||||||||||
| Accrued wages, salaries and employee benefits | 1,242 | 1,126 | 938 | ||||||||||||
| Customer advances | 1,898 | 1,442 | 921 | ||||||||||||
| Dividends payable | 253 | 225 | 194 | ||||||||||||
| Other current liabilities | 1,027 | 951 | 1,145 | ||||||||||||
| Long-term debt due within one year: | |||||||||||||||
| Machinery and Engines | 456 | 180 | 418 | ||||||||||||
| Financial Products | 5,036 | 4,952 | 4,043 | ||||||||||||
| Total current liabilities | 26,069 | 22,245 | 19,822 | ||||||||||||
| Long-term debt due after one year: | |||||||||||||||
| Machinery and Engines | 5,736 | 3,639 | 3,694 | ||||||||||||
| Financial Products | 17,098 | 14,190 | 13,986 | ||||||||||||
| Liability for postemployment benefits | 9,975 | 5,059 | 5,879 | ||||||||||||
| Other liabilities | 2,190 | 2,003 | 1,131 | ||||||||||||
| Total liabilities | 61,068 | 47,136 | 44,512 | ||||||||||||
| Commitments and contingencies (Notes 22 and 23) | |||||||||||||||
| Redeemable noncontrolling interest (Note 25) | 524 | — | — | ||||||||||||
| Stockholders’ equity | |||||||||||||||
| Common stock of $1.00 par: | |||||||||||||||
Authorized shares: 900,000,000 Issued shares: (2008, 2007 and 2006 – 814,894,624) at paid-in amount | 3,057 | 2,744 | 2,465 | ||||||||||||
Treasury stock (2008 – 213,367,983 shares; 2007 – 190,908,490 shares and 2006 – 169,086,448 shares) at cost | (11,217 | ) | (9,451 | ) | (7,352 | ) | |||||||||
| Profit employed in the business | 19,826 | 17,398 | 14,593 | ||||||||||||
| Accumulated other comprehensive income | (5,579 | ) | (1,808 | ) | (2,847 | ) | |||||||||
| Noncontrolling interests | 103 | 113 | 78 | ||||||||||||
| Total stockholders’ equity | 6,190 | 8,996 | 6,937 | ||||||||||||
| Total liabilities, redeemable noncontrolling interest and stockholders’ equity | $ | 67,782 | $ | 56,132 | $ | 51,449 | |||||||||
| See accompanying notes to Consolidated Financial Statements. |
Page A-5
| STATEMENT 3 | Caterpillar Inc. | |||||||||||||||||||||||||||||
Changes in Consolidated Stockholders’ Equity for the Years Ended December 31 | ||||||||||||||||||||||||||||||
| (Dollars in millions) | ||||||||||||||||||||||||||||||
Common stock | Treasury stock | Profit employed in the business | Accumulated other comprehensive income (loss) 1 | Noncontrolling interests | Total | Comprehensive income (loss) | ||||||||||||||||||||||||
| Balance at December 31, 2005 | $ | 1,859 | $ | (4,637 | ) | $ | 11,808 | $ | (598 | ) | $ | 59 | $ | 8,491 | ||||||||||||||||
| Profit | — | — | 3,537 | — | 29 | 3,566 | $ | 3,566 | ||||||||||||||||||||||
| Foreign currency translation | — | — | — | 169 | 2 | 171 | 171 | |||||||||||||||||||||||
| Minimum pension liability adjustment, net of tax of $97 | — | — | — | 229 | — | 229 | 229 | |||||||||||||||||||||||
| Derivative financial instruments and other | ||||||||||||||||||||||||||||||
| Gains (losses) deferred, net of tax of $40 | — | — | — | 73 | — | 73 | 73 | |||||||||||||||||||||||
| (Gains) losses reclassified to earnings, net of tax of $26 | — | — | — | (43 | ) | — | (43 | ) | (43 | ) | ||||||||||||||||||||
| Available-for-sale securities | ||||||||||||||||||||||||||||||
| Gains (losses) deferred, net of tax of $8 | — | — | — | 17 | — | 17 | 17 | |||||||||||||||||||||||
| (Gains) losses reclassified to earnings, net of tax of $12 | — | — | — | (23 | ) | — | (23 | ) | (23 | ) | ||||||||||||||||||||
| Incremental adjustment to adopt SFAS158, net of tax of $1,494 | — | — | — | (2,671 | ) | — | (2,671 | ) | — | |||||||||||||||||||||
| Dividends declared | — | — | (752 | ) | — | — | (752 | ) | — | |||||||||||||||||||||
| Distributions to noncontrolling interests | — | — | — | — | (10 | ) | (10 | ) | — | |||||||||||||||||||||
Common shares issued from treasury stock for stock-based compensation: 15,207,055 | 73 | 341 | — | — | — | 414 | — | |||||||||||||||||||||||
| Stock-based compensation expense | 137 | — | — | — | — | 137 | — | |||||||||||||||||||||||
| Tax benefits from stock-based compensation | 170 | — | — | — | — | 170 | — | |||||||||||||||||||||||
| Shares repurchased: 45,608,000 | — | (3,208 | ) | — | — | — | (3,208 | ) | — | |||||||||||||||||||||
| Shares issued for Progress Rail Services, Inc. Acquisition: 5,341,902 | 226 | 152 | — | — | — | 378 | — | |||||||||||||||||||||||
| Change in ownership for noncontrolling interests | — | — | — | — | (2 | ) | (2 | ) | — | |||||||||||||||||||||
| Balance at December 31, 2006 | $ | 2,465 | $ | (7,352 | ) | $ | 14,593 | $ | (2,847 | ) | $ | 78 | $ | 6,937 | $ | 3,990 | ||||||||||||||
| Adjustment to adopt FIN 48 | — | — | 141 | — | — | 141 | ||||||||||||||||||||||||
| Balance at January 1, 2007 | $ | 2,465 | $ | (7,352 | ) | $ | 14,734 | $ | (2,847 | ) | $ | 78 | $ | 7,078 | ||||||||||||||||
| Profit | — | — | 3,541 | — | 37 | 3,578 | $ | 3,578 | ||||||||||||||||||||||
| Foreign currency translation | — | — | — | 278 | 1 | 279 | 279 | |||||||||||||||||||||||
| Pension and other postretirement benefits | ||||||||||||||||||||||||||||||
| Current year actuarial gain (loss), net of tax of $271 | — | — | — | 537 | — | 537 | 537 | |||||||||||||||||||||||
| Amortization of actuarial (gain) loss, net of tax of $123 | — | — | — | 228 | — | 228 | 228 | |||||||||||||||||||||||
| Current year prior service cost, net of tax of $1 | — | — | — | (2 | ) | — | (2 | ) | (2 | ) | ||||||||||||||||||||
| Amortization of prior service cost, net of tax of $10 | — | — | — | 17 | — | 17 | 17 | |||||||||||||||||||||||
| Amortization of transition asset/obligation, net of tax of $1 | — | — | — | 2 | — | 2 | 2 | |||||||||||||||||||||||
| Derivative financial instruments and other | ||||||||||||||||||||||||||||||
| Gains (losses) deferred, net of tax of $27 | — | — | — | 51 | — | 51 | 51 | |||||||||||||||||||||||
| (Gains) losses reclassified to earnings, net of tax of $45 | — | — | — | (80 | ) | — | (80 | ) | (80 | ) | ||||||||||||||||||||
| Available-for-sale securities | ||||||||||||||||||||||||||||||
| Gains (losses) deferred, net of tax of $8 | — | — | — | 14 | — | 14 | 14 | |||||||||||||||||||||||
| (Gains) losses reclassified to earnings, net of tax of $3 | — | — | — | (6 | ) | — | (6 | ) | (6 | ) | ||||||||||||||||||||
| Dividends declared | — | — | (877 | ) | — | (877 | ) | — | ||||||||||||||||||||||
| Distributions to noncontrolling interests | — | — | — | — | (20 | ) | (20 | ) | — | |||||||||||||||||||||
Common shares issued from treasury stock for stock-based compensation: 11,710,958 | 22 | 306 | — | — | — | 328 | — | |||||||||||||||||||||||
| Stock-based compensation expense | 146 | — | — | — | — | 146 | — | |||||||||||||||||||||||
| Tax benefits from stock-based compensation | 167 | — | — | — | — | 167 | — | |||||||||||||||||||||||
| Shares repurchased: 33,533,000 | — | (2,405 | ) | — | — | — | (2,405 | ) | — | |||||||||||||||||||||
| Shares repurchase derivative contracts | (56 | ) | — | — | — | — | (56 | ) | — | |||||||||||||||||||||
| Change in ownership for noncontrolling interests | — | — | — | — | 17 | 17 | — | |||||||||||||||||||||||
| Balance at December 31, 2007 | $ | 2,744 | $ | (9,451 | ) | $ | 17,398 | $ | (1,808 | ) | $ | 113 | $ | 8,996 | $ | 4,618 | ||||||||||||||
(Continued)
Page A-6
STATEMENT 3 | Caterpillar Inc. | ||||||||||||||||||||||||||||
Changes in Consolidated Stockholders’ Equity for the Years Ended December 31 | |||||||||||||||||||||||||||||
| (Dollars in millions) | |||||||||||||||||||||||||||||
Common stock | Treasury stock | Profit employed in the business | Accumulated other comprehensive income (loss) 1 | Noncontrolling interests | Total | Comprehensive income (loss) | |||||||||||||||||||||||
| Balance at December 31, 2007 | $ | 2,744 | $ | (9,451 | ) | $ | 17,398 | $ | (1,808 | ) | $ | 113 | $ | 8,996 | |||||||||||||||
Adjustment to adopt measurement date provisions of FAS 158, net of tax 2 | — | — | (33 | ) | 17 | — | (16 | ) | |||||||||||||||||||||
| Balance at January 1, 2008 | $ | 2,744 | $ | (9,451 | ) | $ | 17,365 | $ | (1,791 | ) | $ | 113 | $ | 8,980 | |||||||||||||||
| Profit | — | — | 3,557 | — | 28 | 3,585 | $ | 3,585 | |||||||||||||||||||||
| Foreign currency translation, net of tax of $133 | — | — | — | (488 | ) | 23 | (465 | ) | (465 | ) | |||||||||||||||||||
| Pension and other postretirement benefits | |||||||||||||||||||||||||||||
| Current year actuarial gain (loss), net of tax of $1,854 | — | — | — | (3,415 | ) | (30 | ) | (3,445 | ) | (3,445 | ) | ||||||||||||||||||
| Amortization of actuarial (gain) loss, net of tax of $84 | — | — | — | 150 | 1 | 151 | 151 | ||||||||||||||||||||||
| Current year prior service cost, net of tax of $5 | — | — | — | (9 | ) | — | (9 | ) | (9 | ) | |||||||||||||||||||
| Amortization of transition asset/obligation, net of tax of $1 | — | — | — | 2 | — | 2 | 2 | ||||||||||||||||||||||
| Derivative financial instruments and other | |||||||||||||||||||||||||||||
| Gains (losses) deferred, net of tax of $54 | — | — | — | 78 | — | 78 | 78 | ||||||||||||||||||||||
| (Gains) losses reclassified to earnings, net of tax of $6 | — | — | — | (9 | ) | 2 | (7 | ) | (7 | ) | |||||||||||||||||||
| Available-for-sale securities | |||||||||||||||||||||||||||||
| Gains (losses) deferred, net of tax of $67 | — | — | — | (125 | ) | — | (125 | ) | (125 | ) | |||||||||||||||||||
| (Gains) losses reclassified to earnings, net of tax of $15 | — | — | — | 28 | — | 28 | 28 | ||||||||||||||||||||||
| Dividends declared | — | — | (981 | ) | — | — | (981 | ) | — | ||||||||||||||||||||
| Distributions to noncontrolling interests | — | — | — | — | (10 | ) | (10 | ) | — | ||||||||||||||||||||
Common shares issued from treasury stock for stock-based compensation: 4,807,533 | 7 | 128 | — | — | — | 135 | — | ||||||||||||||||||||||
| Stock-based compensation expense | 194 | — | — | — | — | 194 | — | ||||||||||||||||||||||
| Tax benefits from stock-based compensation | 56 | — | — | — | — | 56 | — | ||||||||||||||||||||||
Shares repurchased: 27,267,026 3 | — | (1,894 | ) | — | — | — | (1,894 | ) | — | ||||||||||||||||||||
| Stock repurchase derivative contracts | 56 | — | — | — | — | 56 | — | ||||||||||||||||||||||
Cat Japan share redemption 4 | — | — | (115 | ) | — | 2 | (113 | ) | — | ||||||||||||||||||||
| Change in ownership for noncontrolling interests | — | — | — | — | (26 | ) | (26 | ) | — | ||||||||||||||||||||
| Balance at December 31, 2008 | $ | 3,057 | $ | (11,217 | ) | $ | 19,826 | $ | (5,579 | ) | $ | 103 | $ | 6,190 | $ | (207 | ) | ||||||||||||
| 1 | Pension and other postretirement benefits include net adjustments for Cat Japan Ltd, while they were an unconsolidated affiliate, of $(9) million and $(6) million in 2007 and 2006, respectively. The ending balances are $(52) million and $(43) million as of December 31, 2007 and 2006, respectively. See Note 25 regarding the Cat Japan share redemption. |
| 2 | Adjustments to profit employed in the business and pension and other postemployment benefits were net of tax of $(17) million and $9 million, respectively. |
| 3 | Amount consists of $1,800 million of cash-settled purchases and $94 million of derivative contracts. |
| 4 | See Note 25 regarding the Cat Japan share redemption. |
| See accompanying notes to Consolidated Financial Statements. | |
Page A-7
| STATEMENT 4 | Caterpillar Inc. | |||||||||||||||
Consolidated Statement of Cash Flow for the Years Ended December 31 (Millions of dollars) | ||||||||||||||||
| 2008 | 2007 | 2006 | ||||||||||||||
| Cash flow from operating activities: | ||||||||||||||||
| Profit | $ | 3,557 | $ | 3,541 | $ | 3,537 | ||||||||||
| Adjustments for non-cash items: | ||||||||||||||||
| Depreciation and amortization | 1,980 | 1,797 | 1,602 | |||||||||||||
| Other | 383 | 199 | 197 | |||||||||||||
| Changes in assets and liabilities: | ||||||||||||||||
Receivables – trade and other | (545 | ) | 899 | (148 | ) | |||||||||||
| Inventories | (833 | ) | (745 | ) | (827 | ) | ||||||||||
| Accounts payable and accrued expenses | 656 | 618 | 670 | |||||||||||||
| Customer advances | 286 | 576 | 511 | |||||||||||||
| Other assets – net | (470 | ) | 66 | (262 | ) | |||||||||||
| Other liabilities – net | (217 | ) | 1,004 | 529 | ||||||||||||
| Net cash provided by (used for) operating activities | 4,797 | 7,955 | 5,809 | |||||||||||||
| Cash flow from investing activities: | ||||||||||||||||
| Capital expenditures – excluding equipment leased to others | (2,445 | ) | (1,700 | ) | (1,593 | ) | ||||||||||
| Expenditures for equipment leased to others | (1,566 | ) | (1,340 | ) | (1,082 | ) | ||||||||||
Proceeds from disposals of property, plant and equipment | 982 | 408 | 572 | |||||||||||||
| Additions to finance receivables | (14,031 | ) | (13,946 | ) | (10,522 | ) | ||||||||||
| Collections of finance receivables | 9,717 | 10,985 | 8,094 | |||||||||||||
| Proceeds from sale of finance receivables | 949 | 866 | 1,067 | |||||||||||||
| Investments and acquisitions (net of cash acquired) | (117 | ) | (229 | ) | (513 | ) | ||||||||||
| Proceeds from release of security deposit | — | 290 | — | |||||||||||||
| Proceeds from sale of available-for-sale securities | 357 | 282 | 539 | |||||||||||||
| Investments in available-for-sale securities | (339 | ) | (485 | ) | (681 | ) | ||||||||||
| Other – net | 197 | 461 | 323 | |||||||||||||
| Net cash provided by (used for) investing activities | (6,296 | ) | (4,408 | ) | (3,796 | ) | ||||||||||
| Cash flow from financing activities: | ||||||||||||||||
| Dividends paid | (953 | ) | (845 | ) | (726 | ) | ||||||||||
| Distribution to noncontrolling interests | (10 | ) | (20 | ) | (10 | ) | ||||||||||
| Common stock issued, including treasury shares reissued | 135 | 328 | 414 | |||||||||||||
| Payment for stock repurchase derivative contracts | (38 | ) | (56 | ) | — | |||||||||||
| Treasury shares purchased | (1,800 | ) | (2,405 | ) | (3,208 | ) | ||||||||||
| Excess tax benefit from stock-based compensation | 56 | 155 | 169 | |||||||||||||
| Proceeds from debt issued (original maturities greater than three months): | ||||||||||||||||
| — Machinery and Engines | 1,673 | 224 | 1,445 | |||||||||||||
| — Financial Products | 16,257 | 10,815 | 9,824 | |||||||||||||
| Payments on debt (original maturities greater than three months): | ||||||||||||||||
| — Machinery and Engines | (296 | ) | (598 | ) | (839 | ) | ||||||||||
| — Financial Products | (14,143 | ) | (10,290 | ) | (9,536 | ) | ||||||||||
Short-term borrowings (original maturities three months or less) – net | 2,074 | (297 | ) | (136 | ) | |||||||||||
| Net cash provided by (used for) financing activities | 2,955 | (2,989 | ) | (2,603 | ) | |||||||||||
| Effect of exchange rate changes on cash | 158 | 34 | 12 | |||||||||||||
| Increase (decrease) in cash and short-term investments | 1,614 | 592 | (578 | ) | ||||||||||||
| Cash and short-term investments at beginning of period | 1,122 | 530 | 1,108 | |||||||||||||
| Cash and short-term investments at end of period | $ | 2,736 | $ | 1,122 | $ | 530 | ||||||||||
| All short-term investments, which consist primarily of highly liquid investments with original maturities of three months or less, are considered to be cash equivalents. | |
| Non-cash activities: | |
| On June 19, 2006, Caterpillar acquired 100 percent of the equity in Progress Rail Services, Inc. A portion of the acquisition was financed with 5.3 million shares of Caterpillar stock with a fair value of $379 million as of the acquisition date. See Note 25 for further discussion. | |
| See accompanying notes to Consolidated Financial Statements. | |
Page A-8
NOTES TO CONSOLIDATED FINANCIAL STATEMENTS | ||
1. | Operations and summary of significant accounting policies | |
A. | Nature of operations | |
We operate in three principal lines of business: | ||
(1) | Machinery— A principal line of business which includes the design, manufacture, marketing and sales of construction, mining and forestry machinery—track and wheel tractors, track and wheel loaders, pipelayers, motor graders, wheel tractor-scrapers, track and wheel excavators, backhoe loaders, log skidders, log loaders, off-highway trucks, articulated trucks, paving products, skid steer loaders and related parts. Also includes logistics services for other companies and the design, manufacture, remanufacture, maintenance and services of rail-related products. | |
(2) | Engines— A principal line of business including the design, manufacture, marketing and sales of engines for Caterpillar machinery; electric power generation systems; on-highway vehicles and locomotives; marine, petroleum, construction, industrial, agricultural and other applications; and related parts. Also includes remanufacturing of Caterpillar engines and a variety of Caterpillar machine and engine components and remanufacturing services for other companies. Reciprocating engines meet power needs ranging from 10 to 21,700 horsepower (8 to over 16 000 kilowatts). Turbines range from 1,600 to 30,000 horsepower (1 200 to 22 000 kilowatts). | |
(3) | Financial Products— A principal line of business consisting primarily of Caterpillar Financial Services Corporation (Cat Financial), Caterpillar Insurance Holdings, Inc. (Cat Insurance), Caterpillar Power Ventures Corporation (Cat Power Ventures) and their respective subsidiaries. Cat Financial provides a wide range of financing alternatives to customers and dealers for Caterpillar machinery and engines, Solar gas turbines as well as other equipment and marine vessels. Cat Financial also extends loans to customers and dealers. Cat Insurance provides various forms of insurance to customers and dealers to help support the purchase and lease of our equipment. Cat Power Ventures is an investor in independent power projects using Caterpillar power generation equipment and services. | |
Our Machinery and Engines operations are highly integrated. Throughout the Notes, Machinery and Engines represents the aggregate total of these principal lines of business. Our products are sold primarily under the brands "Caterpillar," "CAT," design versions of "CAT" and "Caterpillar," "Solar Turbines," “MaK," "Perkins," "FG Wilson," "Olympian" and “Progress Rail.” We conduct operations in our Machinery and Engines lines of business under highly competitive conditions, including intense price competition. We place great emphasis on the high quality and performance of our products and our dealers' service support. Although no one competitor is believed to produce all of the same types of machines and engines that we do, there are numerous companies, large and small, which compete with us in the sale of each of our products. Machines are distributed principally through a worldwide organization of dealers (dealer network), 52 located in the United States and 128 located outside the United States. Worldwide, these dealers serve 182 countries and operate 3,537 places of business, including 1,467 dealer rental outlets. Reciprocating engines are sold principally through the dealer network and to other manufacturers for use in products manufactured by them. Some of the reciprocating engines manufactured by Perkins are also sold through a worldwide network of 131 distributors located in 172 countries. The FG Wilson branded electric power generation systems are sold through a worldwide network of 157 dealers located in 180 countries. Our dealers do not deal exclusively with our products; however, in most cases sales and servicing of our products are the dealers' principal business. Turbines and large medium speed reciprocating engines are sold through sales forces employed by the company. At times, these employees are assisted by independent sales representatives. Manufacturing activities of the Machinery and Engines lines of business are conducted in 99 plants in the United States; 13 in the United Kingdom; nine in Italy; eight in China and Mexico; five each in Canada and France; four in Brazil; three each in Australia, India and Poland; two each in Germany, Indonesia, Japan, the Netherlands and Northern Ireland; and one each in Belgium, Hungary, Malaysia, Nigeria, Russia, South Africa, Sweden, Switzerland and Tunisia. Thirteen parts distribution centers are located in the United States and 16 are located outside the United States. The Financial Products line of business also conducts operations under highly competitive conditions. Financing for users of Caterpillar products is available through a variety of competitive sources, principally commercial banks and finance and leasing companies. We emphasize prompt and responsive service to meet customer requirements and offer various financing plans designed to increase the opportunity for sales of our products and generate financing income for our company. Financial Products activity is conducted primarily in the United States, with additional offices in Asia, Australia, Canada, Europe and Latin America. | ||
Page A-9
B. | Basis of consolidation |
The financial statements include the accounts of Caterpillar Inc. and its subsidiaries. Investments in companies that are owned 20% to 50% or are less than 20% owned and for which we have significant influence are accounted for by the equity method (see Note 11). We consolidate all variable interest entities where Caterpillar Inc. is the primary beneficiary. For variable interest entities, we assess whether we are the primary beneficiary as prescribed by FASB Interpretation 46R, “Consolidation of Variable Interest Entities, an Interpretation of Accounting Research Bulletin No. 51” (FIN 46R). The primary beneficiary of a variable interest entity is the party that absorbs a majority of the entity’s expected losses, receives a majority of its expected residual returns, or both. Certain amounts for prior years have been reclassified to conform with the current-year financial statement presentation. Shipping and handling costs are included in Cost of goods sold in Statement 1. Other operating expense primarily includes Cat Financial's depreciation of equipment leased to others, Cat Insurance’s underwriting expenses, gains (losses) on disposal of long-lived assets, long-lived asset impairment charges and employee separation charges. Prepaid expenses and other current assets in Statement 2 include prepaid rent, prepaid insurance and other prepaid items. In addition, at December 31, 2008, this line included a security deposit of $232 million related to a deposit obligation due in 2009, while at December 31, 2006, this line included a security deposit of $249 million related to a deposit obligation due in 2007. See Note 16 for further discussion. | |
C. | Sales and revenue recognition |
Sales of Machinery and Engines are generally recognized when title transfers and the risks and rewards of ownership have passed to customers or independently owned and operated dealers. Typically, where product is produced and sold in the same country, title and risk of ownership transfer when the product is shipped. Products that are exported from a country for sale typically pass title and risk of ownership at the border of the destination country. No right of return exists on sales of equipment. Replacement part returns are estimable and accrued at the time a sale is recognized. We provide discounts to dealers and original equipment manufacturers (OEM) through merchandising programs that are administered by our marketing divisions. We have numerous programs that are designed to promote the sale of our products. The most common dealer programs provide a discount when the dealer sells a product to a targeted end user. OEM programs provide discounts designed to encourage the use of our engines. The cost of these discounts is estimated based on historical experience and known changes in merchandising programs and is reported as a reduction to sales when the product sale is recognized. Our standard invoice terms are established by marketing region. When a sale is made to a dealer, the dealer is responsible for payment even if the product is not sold to an end customer and must make payment within the standard terms to avoid interest costs. Interest at or above prevailing market rates is charged on any past due balance. Our policy is to not forgive this interest. In 2008 terms were extended to not more than one year for $544 million of receivables, which represent approximately 1% of consolidated sales. In 2007 and 2006, terms were extended to not more than one year for $219 million and $49 million of receivables, respectively, which represent less than 1% of consolidated sales. |
| Sales with payment terms of two months or more were as follows: | |||||||||||||||||||||||||
| (Dollars in millions) | |||||||||||||||||||||||||
| 2008 | 2007 | 2006 | |||||||||||||||||||||||
| Payment Terms (months) | Sales | Percent of Sales | Sales | Percent of Sales | Sales | Percent of Sales | |||||||||||||||||||
| 2 | $ | 4,130 | 8.6 | % | $ | 2,830 | 6.8 | % | $ | 2,557 | 6.6 | % | |||||||||||||
| 3 | 2,786 | 5.8 | % | 2,067 | 4.9 | % | 711 | 1.8 | % | ||||||||||||||||
| 4 | 866 | 1.8 | % | 526 | 1.3 | % | 336 | 0.9 | % | ||||||||||||||||
| 5 | 1,062 | 2.2 | % | 965 | 2.3 | % | 1,222 | 3.1 | % | ||||||||||||||||
| 6 | 561 | 1.2 | % | 4,549 | 10.8 | % | 8,583 | 22.1 | % | ||||||||||||||||
| 7-12 | 4,469 | 9.3 | % | 293 | 0.7 | % | 274 | 0.7 | % | ||||||||||||||||
| $ | 13,874 | 28.9 | % | $ | 11,230 | 26.8 | % | $ | 13,683 | 35.2 | % | ||||||||||||||
Page A-10
Revenues of Financial Products primarily represent the following Cat Financial revenues: | ||
| · | Retail (end-customer) finance revenue on finance leases and installment sale contracts is recognized over the term of the contract at a constant rate of return on the scheduled outstanding principal balance. Revenue on retail notes is recognized based on the daily balance of retail receivables outstanding and the applicable effective interest rate. | |
| · | Operating lease revenue is recorded on a straight-line basis in the period earned over the life of the contract. | |
| · | Wholesale (dealer) finance revenue on installment contracts and finance leases is recognized over the term of the contract at a constant rate of return on the scheduled outstanding principal balance. Revenue on wholesale notes is recognized based on the daily balance of wholesale receivables outstanding and the applicable effective interest rate. | |
| · | Loan origination and commitment fees are deferred and then amortized to revenue using the interest method over the life of the finance receivables. | |
Recognition of income is suspended when collection of future income is not probable. Accrual is resumed, and previously suspended income is recognized, when the receivable becomes contractually current and/or collection doubts are removed. Cat Financial provides wholesale inventory financing to dealers. See Notes 7 and 8 for more information. Sales and revenue recognition items are presented net of sales and other related taxes. | ||
D. | Inventories | |
Inventories are stated at the lower of cost or market. Cost is principally determined using the last-in, first-out (LIFO) method. The value of inventories on the LIFO basis represented about 70% of total inventories at December 31, 2008, and about 75% of total inventories at December 31, 2007 and 2006. If the FIFO (first-in, first-out) method had been in use, inventories would have been $3,183 million, $2,617 million and $2,403 million higher than reported at December 31, 2008, 2007 and 2006, respectively. | ||
E. | Securitized receivables | |
We periodically sell finance receivables in securitization transactions. When finance receivables are securitized, we retain interests in the receivables in the form of subordinated certificates, an interest in future cash flows (excess), reserve accounts and servicing rights. The retained interests are recorded in “Other assets” at fair value. We estimate fair value based on the present value of future expected cash flows using key assumptions for credit losses, prepayment rates and discount rates. See Note 8 and Note 19 for more information. | ||
F. | Depreciation and amortization | |
Depreciation of plant and equipment is computed principally using accelerated methods. Depreciation on equipment leased to others, primarily for Financial Products, is computed using the straight-line method over the term of the lease. The depreciable basis is the original cost of the equipment less the estimated residual value of the equipment at the end of the lease term. In 2008, 2007 and 2006, Cat Financial depreciation on equipment leased to others was $724 million, $671 million and $631 million, respectively, and was included in "Other operating expenses" in Statement 1. In 2008, 2007 and 2006 consolidated depreciation expense was $1,907 million, $1,725 million and $1,554 million, respectively. Amortization of purchased intangibles is computed principally using the straight-line method, generally not to exceed a period of 20 years. | ||
G. | Foreign currency translation | |
| The functional currency for most of our Machinery and Engines consolidated companies is the U.S. dollar. The functional currency for most of our Financial Products and equity basis companies is the respective local currency. Gains and losses resulting from the translation of foreign currency amounts to the functional currency are included in "Other income (expense)" in Statement 1. Gains and losses resulting from translating assets and liabilities from the functional currency to U.S. dollars are included in "Accumulated other comprehensive income" in Statement 2. | ||
Page A-11
H. | Derivative financial instruments |
Our earnings and cash flow are subject to fluctuations due to changes in foreign currency exchange rates, interest rates and commodity prices. In addition, the amount of Caterpillar stock that can be repurchased under our stock repurchase program is impacted by movements in the price of the stock. Our Risk Management Policy (policy) allows for the use of derivative financial instruments to prudently manage foreign currency exchange rate, interest rate, commodity price and Caterpillar stock price exposures. Our policy specifies that derivatives are not to be used for speculative purposes. Derivatives that we use are primarily foreign currency forward and option contracts, interest rate swaps, commodity forward and option contracts and stock repurchase contracts. Our derivative activities are subject to the management, direction and control of our senior financial officers. Risk management practices, including the use of financial derivative instruments, are presented to the Audit Committee of the Board of Directors at least annually. Payments for stock repurchase derivatives are accounted for as a reduction in stockholders’ equity. All other derivatives are recognized on the Consolidated Financial Position at their fair value. On the date the derivative contract is entered, we designate the derivative as (1) a hedge of the fair value of a recognized asset or liability ("fair value" hedge), (2) a hedge of a forecasted transaction or the variability of cash flow to be paid ("cash flow" hedge), or (3) an "undesignated" instrument. Changes in the fair value of a derivative that is qualified, designated and highly effective as a fair value hedge, along with the gain or loss on the hedged liability that is attributable to the hedged risk, are recorded in current earnings. Changes in the fair value of a derivative that is qualified, designated and highly effective as a cash flow hedge are recorded in other comprehensive income until earnings are affected by the forecasted transaction or the variability of cash flow and are then reported in current earnings. Changes in the fair value of undesignated derivative instruments and the ineffective portion of designated derivative instruments are reported in current earnings. Cash flows from designated derivative financial instruments are classified within the same category as the item being hedged on Statement 4. Cash flows from undesignated derivative financial instruments are included in the investing category on Statement 4. We formally document all relationships between hedging instruments and hedged items, as well as the risk-management objective and strategy for undertaking various hedge transactions. This process includes linking all derivatives that are designated as fair value hedges to specific assets and liabilities on the Consolidated Financial Position and linking cash flow hedges to specific forecasted transactions or variability of cash flow. We also formally assess, both at the hedge's inception and on an ongoing basis, whether the derivatives that are used in hedging transactions are highly effective in offsetting changes in fair values or cash flow of hedged items. When it is determined that a derivative is not highly effective as a hedge or that it has ceased to be a highly effective hedge, we discontinue hedge accounting prospectively, in accordance with Statement of Financial Accounting Standards No. 133 (SFAS 133), "Accounting for Derivative Instruments and Hedging Activities." See Note 3 for more information. | |
I. | Income taxes |
The provision for income taxes is determined using the asset and liability approach for accounting for income taxes in accordance with Statement of Financial Accounting Standards No. 109 (SFAS 109), "Accounting for Income Taxes." Tax laws require items to be included in tax filings at different times than the items are reflected in the financial statements. A current liability is recognized for the estimated taxes payable for the current year. Deferred taxes represent the future tax consequences expected to occur when the reported amounts of assets and liabilities are recovered or paid. Deferred taxes are adjusted for enacted changes in tax rates and tax laws. Valuation allowances are recorded to reduce deferred tax assets when it is more likely than not that a tax benefit will not be realized. | |
J. | Estimates in financial statements |
The preparation of financial statements in conformity with accounting principles generally accepted in the United States of America requires management to make estimates and assumptions that affect reported amounts. The more significant estimates include: residual values for leased assets, fair values for goodwill impairment tests, impairment of available-for-sale securities, warranty liability, stock-based compensation and reserves for product liability and insurance losses, postemployment benefits, post-sale discounts, credit losses and income taxes. |
K. | New accounting standards |
SFAS 155 – In February 2006, the Financial Accounting Standards Board (FASB) issued Statement of Financial Accounting Standards No. 155 (SFAS 155), “Accounting for Certain Hybrid Financial Instruments – an amendment of FASB Statements No. 133 and 140.” SFAS 155 allows financial instruments that have embedded derivatives to be accounted for as a whole, eliminating the need to separate the derivative from its host, if the holder elects to account for the whole instrument on a fair value basis. This new accounting standard was effective January 1, 2007. The adoption of SFAS 155 did not have a material impact on our financial statements. |
Page A-12
SFAS 156 – In March 2006, the FASB issued Statement of Financial Accounting Standards No. 156 (SFAS 156), “Accounting for Servicing of Financial Assets – an amendment of FASB Statement No. 140.” SFAS 156 requires that all separately recognized servicing rights be initially measured at fair value, if practicable. In addition, this Statement permits an entity to choose between two measurement methods (amortization method or fair value measurement method) for each class of separately recognized servicing assets and liabilities. This new accounting standard was effective January 1, 2007. The adoption of SFAS 156 did not have a material impact on our financial statements. FIN 48 – In June 2006, the FASB issued FIN 48 “Accounting for Uncertainty in Income Taxes – an interpretation of FASB Statement No. 109” to create a single model to address accounting for uncertainty in tax positions. FIN 48 clarifies that a tax position must be more likely than not of being sustained before being recognized in the financial statements. As required, we adopted the provisions of FIN 48 as of January 1, 2007. The following table summarizes the effect of the initial adoption of FIN 48. See Note 5 for additional information. | ||||||||||||
| Initial adoption of FIN 48 | ||||||||||||
| (Millions of dollars) | January 1, 2007 Prior to FIN 48 Adjustment | FIN 48 Adjustment | January 1, 2007 Post FIN 48 Adjustment | |||||||||
| Deferred and refundable income taxes | $ | 733 | $ | 82 | $ | 815 | ||||||
| Noncurrent deferred and refundable income taxes | 1,949 | 211 | 2,160 | |||||||||
| Other current liabilities | 1,145 | (530 | ) | 615 | ||||||||
| Other liabilities | 1,131 | 682 | 1,813 | |||||||||
| Profit employed in the business | 14,593 | 141 | 14,734 | |||||||||
SFAS 157 – In September 2006, the FASB issued Statement of Financial Accounting Standards No. 157 (SFAS 157), “Fair Value Measurements.” SFAS 157 provides a common definition of fair value and a framework for measuring assets and liabilities at fair values when a particular standard prescribes it. In addition, the Statement expands disclosures about fair value measurements. In February 2008, the FASB issued final Staff Positions that (1) deferred the effective date of this Statement for one year for certain nonfinancial assets and nonfinancial liabilities (see below) and (2) removed certain leasing transactions from the scope of the Statement. We applied this new accounting standard to all other fair value measurements effective January 1, 2008. The adoption of SFAS 157 did not have a material impact on our financial statements. See Note 19 for additional information. FSP 157-2 – In February 2008, the FASB issued FASB Staff Position on Statement 157 "Effective Date of FASB Statement No. 157" (FSP 157-2). FSP 157-2 delays the effective date of SFAS 157 for nonfinancial assets and nonfinancial liabilities, except those that are recognized or disclosed on a recurring basis, to fiscal years beginning after November 15, 2008. Our significant nonfinancial assets and liabilities that could be impacted by this deferral include assets and liabilities initially measured at fair value in a business combination and goodwill tested annually for impairment. The adoption of FSP 157-2 is not expected to have a material impact on our financial statements. FSP 157-3 – In October 2008, the FASB issued FASB Staff Position on Statement 157 "Determining the Fair Value of a Financial Asset When the Market for That Asset Is Not Active” (FSP 157-3). FSP 157-3 clarifies how SFAS 157 should be applied when valuing securities in markets that are not active by illustrating key considerations in determining fair value. It also reaffirms the notion of fair value as the exit price as of the measurement date. FSP 157-3 was effective upon issuance, which included periods for which financial statements have not yet been issued. This new accounting standard has been adopted for our financial statements starting July 1, 2008. The adoption of FSP 157-3 did not have a material impact on our financial statements. SFAS 158 – In September 2006, the FASB issued Statement of Financial Accounting Standards No. 158 (SFAS 158), “Employers’ Accounting for Defined Benefit Pension and Other Postretirement Plans – an amendment of FASB Statements No. 87, 88, 106 and 132R.” SFAS 158 requires recognition of the overfunded or underfunded status of pension and other postretirement benefit plans on the balance sheet. Under SFAS 158, gains and losses, prior service costs and credits and any remaining transition amounts under SFAS 87 and SFAS 106 that have not yet been recognized through net periodic benefit cost are recognized in Accumulated other comprehensive income (loss), net of tax effects, until they are amortized as a component of net periodic benefit cost. Also, the measurement date – the date at which the benefit obligation and plan assets are measured – is required to be the company’s fiscal year-end. As required by SFAS 158, we adopted the balance sheet recognition provisions at December 31, 2006. SFAS 87 required the recognition of an additional minimum liability (AML) if the market value of plan assets was less than the accumulated benefit obligation at the end of the measurement date. The AML was eliminated upon the adoption of SFAS 158. The following summarizes the effect of the required changes in the AML, as well as the impact of the initial adoption of SFAS 158, as of December 31, 2006. See Note 14 for additional information regarding postemployment benefits. | ||||||||||||
Page A-13
| Initial adoption of SFAS 158 | ||||||||||||||||
| (Millions of dollars) | December 31, 2006 Prior to AML and SFAS 158 Adjustments | AML Adjustment per SFAS 87 | SFAS 158 Adjustment | December 31, 2006 Post AML and SFAS 158 Adjustments | ||||||||||||
| Prepaid expenses and other current assets | $ | 2,467 | $ | — | $ | (1,829 | ) | $ | 638 | |||||||
| Investments in unconsolidated affiliated companies | 568 | — | (6 | ) | 562 | |||||||||||
| Deferred income taxes | 552 | (97 | ) | 1,494 | 1,949 | |||||||||||
| Intangible assets | 639 | (60 | ) | (192 | ) | 387 | ||||||||||
| Accrued wages, salaries and employee benefits | 1,440 | — | (502 | ) | 938 | |||||||||||
| Liability for postemployment benefits | 3,625 | (386 | ) | 2,640 | 5,879 | |||||||||||
| Accumulated other comprehensive income | (405 | ) | 229 | (2,671 | ) | (2,847 | ) | |||||||||
| We adopted the year-end measurement date effective January 1, 2008 using the “one measurement” approach. Under the one measurement approach, net periodic benefit cost for the period between any early measurement date and the end of the fiscal year that the measurement provisions are applied is allocated proportionately between amounts to be recognized as an adjustment of Profit employed in the business and net periodic benefit cost for the fiscal year. Previously, we used a November 30th measurement date for our U.S. pension and other postretirement benefit plans and September 30th for our non-U.S. plans. The following summarizes the effect of adopting the year-end measurement date provisions as of January 1, 2008. See Note 14 for additional information. |
| Adoption of SFAS 158 year-end measurement date | January 1, 2008 | January 1, 2008 | ||||||||||
| (Millions of dollars) | Prior to SFAS 158 Adjustment | SFAS 158 Adjustment | Post SFAS 158 Adjustment | |||||||||
| Noncurrent deferred and refundable income taxes | $ | 1,553 | $ | 8 | $ | 1,561 | ||||||
| Liability for postemployment benefits | 5,059 | 24 | 5,083 | |||||||||
| Accumulated other comprehensive income | (1,808 | ) | 17 | (1,791 | ) | |||||||
| Profit employed in the business | 17,398 | (33 | ) | 17,365 | ||||||||
SFAS 159 – In February 2007, the FASB issued Statement of Financial Accounting Standards No. 159 (SFAS 159), “The Fair Value Option for Financial Assets and Financial Liabilities – including an amendment of SFAS No. 115.” SFAS 159 creates a fair value option under which an entity may irrevocably elect fair value as the initial and subsequent measurement attribute for certain financial assets and liabilities on a contract by contract basis, with changes in fair values recognized in earnings as these changes occur. We adopted this new accounting standard on January 1, 2008. We have not elected to measure any financial assets or financial liabilities at fair value which were not previously required to be measured at fair value. Therefore, the adoption of SFAS 159 did not have a material impact on our financial statements. |
SFAS 141R and SFAS 160 – In December 2007, the FASB issued Statement of Financial Accounting Standards No. 141 (revised 2007) (SFAS 141R), “Business Combinations,” and No. 160 (SFAS 160), “Noncontrolling Interests in Consolidated Financial Statements – an amendment of ARB No. 51.” SFAS 141R requires the acquiring entity in a business combination to recognize the assets acquired and liabilities assumed. Further, SFAS 141R also changes the accounting for acquired in-process research and development assets, contingent consideration, partial acquisitions and transaction costs. Under SFAS 160, all entities are required to report noncontrolling (minority) interests in subsidiaries as equity in the consolidated financial statements. In addition, transactions between an entity and noncontrolling interests will be treated as equity transactions. SFAS 141R and SFAS 160 will become effective for fiscal years beginning after December 15, 2008. We will adopt these new accounting standards on January 1, 2009. We do not expect the adoption to have a material impact on our financial statements. See Note 29 for further details. |
SFAS 161 – In March 2008, the FASB issued Statement of Financial Accounting Standards No. 161 (SFAS 161), “Disclosures about Derivative Instruments and Hedging Activities – an amendment of FASB Statement No. 133.” SFAS 161 expands disclosures for derivative instruments by requiring entities to disclose the fair value of derivative instruments and their gains or losses in tabular format. SFAS 161 also requires disclosure of information about credit risk-related contingent features in derivative agreements, counterparty credit risk, and strategies and objectives for using derivative instruments. SFAS 161 will become effective for fiscal years beginning after November 15, 2008. We will adopt this new accounting standard on January 1, 2009. We do not expect the adoption to have a material impact on our financial statements. |
Page A-14
SFAS 162 – In May 2008, the FASB issued Statement of Financial Accounting Standards No. 162 (SFAS 162), “The Hierarchy of Generally Accepted Accounting Principles.” SFAS 162 identifies the sources of accounting principles and the framework for selecting the principles to be used in the preparation of financial statements of nongovernmental entities that are presented in conformity with U.S. GAAP. SFAS 162 was effective November 16, 2008. This Statement did not result in a change in our current practice. |
SFAS 163 – In May 2008, the FASB issued Statement of Financial Accounting Standards No. 163 (SFAS 163), “Accounting for Financial Guarantee Insurance Contracts – an interpretation of FASB Statement No. 60.” SFAS 163 requires that an insurance enterprise recognize a claim liability prior to an event of default (insured event) when there is evidence that credit deterioration has occurred in an insured financial obligation. It also requires disclosure about (1) the risk-management activities used by an insurance enterprise to evaluate credit deterioration in its insured financial obligations and (2) the insurance enterprise’s surveillance or watch list. SFAS 163 will become effective for fiscal years beginning after December 15, 2008. We will adopt this new accounting standard on January 1, 2009. We do not expect the adoption to have a material impact on our financial statements. |
FSP FAS 140-4 and FIN 46R-8 – In December 2008, the FASB issued FASB Staff Position on Statement 140 and FIN 46R "Disclosures by Public Entities (Enterprises) about Transfers of Financial Assets and Interests in Variable Interest Entities" (FSP FAS 140-4 and FIN 46R-8). This FSP expands the disclosure requirements in SFAS 140 and FIN 46R by requiring additional information about companies’ involvement with variable interest entities (VIEs) and their continuing involvement with transferred financial assets. This new accounting standard has been adopted for our financial statements ended December 31, 2008. The adoption of FSP FAS 140-4 and FIN 46R-8 did not have a material impact on our financial statements. |
FSP FAS 132R-1 – In December 2008, the FASB issued FASB Staff Position on Statement 132R, "Employers’ Disclosures about Postretirement Benefit Plan Assets" (FSP FAS 132(R)-1). This FSP expands the disclosure set forth in SFAS 132R by adding required disclosures about (1) how investment allocation decisions are made by management, (2) major categories of plan assets, and (3) significant concentration of risk. Additionally, the FSP requires an employer to disclose information about the valuation of plan assets similar to that required under SFAS 157. This new accounting standard will become effective for fiscal years ending after December 15, 2009. We will adopt this new accounting standard on January 1, 2009. We do not expect the adoption to have a material impact on our financial statements. |
FSP EITF 99-20-1 – In January 2009, the FASB issued FASB Staff Position on EITF Issue No. 99-20, "Amendments to the Impairment Guidance of EITF Issue No. 99-20" (FSP EITF 99-20-1). FSP EITF 99-20-1 aligns the impairment guidance in EITF Issue No. 99-20 with that in Statement of Financial Accounting Standards No. 115 (SFAS 115), "Accounting for Certain Investments in Debt and Equity Securities." It changes how companies determine whether an other-than-temporary impairment exists for certain beneficial interests by allowing management to exercise more judgment. This new accounting standard has been adopted for our financial statements ended December 31, 2008. The adoption of FSP EITF 99-20-1 did not have a material impact on our financial statements. |
L. | Goodwill |
Goodwill represents the excess of the cost of an acquisition over the fair value of the net assets acquired. We account for goodwill in accordance with Statement of Financial Accounting Standards No. 142 "Goodwill and Other Intangible Assets," which requires that we test goodwill for impairment, at the reporting unit level, annually and when events or circumstances indicate the fair value of a reporting unit may be below its carrying value. A reporting unit is an operating segment or sub-segment to which goodwill is assigned when initially recorded. We assign goodwill to reporting units based on our integration plans and the expected synergies resulting from the business combination. Because Caterpillar is a highly integrated company, the businesses we acquire are sometimes combined with or integrated into existing reporting units. We perform our annual goodwill impairment test as of October 1 and monitor for interim triggering events on an ongoing basis. Goodwill is reviewed for impairment utilizing a two-step process. The first step requires us to compare the fair value of each reporting unit, which we compute using a discounted cash flow analysis, to the respective carrying value, which includes goodwill. If the fair value of the reporting unit exceeds its carrying value, the goodwill is not considered impaired. If the carrying value is higher than the fair value, there is an indication that an impairment may exist and the second step is required. In step two, the implied fair value of goodwill is calculated as the excess of the fair value of a reporting unit over the fair values assigned to its assets and liabilities. If the implied fair value of goodwill is less than the carrying value of the reporting unit’s goodwill, the difference is recognized as an impairment loss. |
M. | Stock-based compensation |
| On January 1, 2006, we adopted Statement of Financial Accounting Standards No. 123 (revised 2004) (SFAS 123R), “Share-Based Payment” using the modified prospective transition method. SFAS 123R requires all stock–based payments to be recognized in the financial statements based on the grant date fair value of the award. Under the modified prospective transition method, we were required to record stock-based compensation expense for all awards granted after the date of adoption and for the unvested portion of previously granted awards outstanding as of the date of adoption. See Note 2 for additional information regarding stock-based compensation. |
Page A-15
2. | Stock-based compensation |
Stock Incentive Plans In 1996, stockholders approved the Stock Option and Long-Term Incentive Plan (the 1996 Plan), which expired in April of 2006. The 1996 Plan reserved 144 million shares of common stock for issuance (128 million under this plan and 16 million under prior plans). On June 14, 2006, stockholders approved the 2006 Caterpillar Long-Term Incentive Plan (the 2006 Plan). The 2006 non-employee Directors’ grant was issued from this plan. The 2006 Plan reserves 37.6 million shares for issuance (20 million under the 2006 Plan and 17.6 million transferred from the 1996 Plan). The plans primarily provide for the granting of stock options, stock-settled stock appreciation rights (SARs) and restricted stock units (RSUs) to Officers and other key employees, as well as non-employee Directors. Stock options permit a holder to buy Caterpillar stock at the stock's price when the option was granted. SARs permit a holder the right to receive the value in shares of the appreciation in Caterpillar stock that occurred from the date the right was granted up to the date of exercise. A restricted stock unit (RSU) is an agreement to issue shares of Caterpillar stock at the time of vesting. | |
Our long-standing practices and policies specify all stock-based compensation awards are approved by the Compensation Committee (the Committee) of the Board of Directors on the date of grant. The stock-based award approval process specifies the number of awards granted, the terms of the award and the grant date. The same terms and conditions are consistently applied to all employee grants, including Officers. The Committee approves all individual Officer grants. The number of stock-based compensation awards included in an individual’s award is determined based on the methodology approved by the Committee. Prior to 2007, the terms of the 1996 Stock Option and Long-Term Incentive Plan (which expired in April of 2006) provided for the exercise price methodology to be the average of the high and low price of our stock on the date of grant. In 2007, under the terms of the Caterpillar Inc. 2006 Long-Term Incentive Plan (approved by stockholders in June of 2006), the Compensation Committee approved the exercise price methodology to be the closing price of the Company stock on the date of the grant. Common stock issued from Treasury stock under the plans totaled 4,807,533 for 2008, 11,710,958 for 2007 and 15,207,055 for 2006. In 2007, in order to align our stock award program with the overall market, we adjusted our 2007 grant by reducing the overall number of employee awards and utilizing RSUs in addition to the SARs and option awards. The 2008, 2007 and 2006 awards generally vest three years after the date of grant. At grant, SARs and option awards have a term life of ten years. Upon separation from service, if the participant is 55 years of age or older with more than ten years of service, the participant meets the criteria for a “Long Service Separation." If the “Long Service Separation” criteria are met, the vested options/SARs will have a life that is the lesser of 10 years from the original grant date or five years from the separation date. Our stock-based compensation plans allow for the immediate vesting upon separation for employees who meet the criteria for a “Long Service Separation” and who have fulfilled the requisite service period of six months. With the adoption of SFAS 123R, compensation expense is recognized over the period from the grant date to the end date of the requisite service period for employees who meet the immediate vesting upon retirement requirements. For those employees who become eligible for immediate vesting upon retirement subsequent to the requisite service period and prior to the completion of the vesting period, compensation expense is recognized over the period from grant date to the date eligibility is achieved. | |
| SFAS 123R requires companies to estimate the fair value of options/SARs on the date of grant using an option-pricing model. In 2008, 2007 and 2006, the fair value of the option/SAR grant was estimated using a lattice-based option-pricing model. The lattice-based option-pricing model considers a range of assumptions related to volatility, risk-free interest rate and historical employee behavior. Expected volatility was based on historical and current implied volatilities from traded options on our stock. The risk-free rate was based on U.S. Treasury security yields at the time of grant. The weighted-average dividend yield was based on historical information. The expected life was determined from the lattice-based model. The lattice-based model incorporated exercise and post vesting forfeiture assumptions based on analysis of historical data. The following table provides the assumptions used in determining the fair value of the stock-based awards for the years ended December 31, 2008, 2007 and 2006, respectively. |
| Grant Year | ||||||||||||
| 2008 | 2007 | 2006 | ||||||||||
| Weighted-average dividend yield | 1.89 | % | 1.68 | % | 1.79 | % | ||||||
| Weighted-average volatility | 27.14 | % | 26.04 | % | 26.79 | % | ||||||
| Range of volatilities | 27.13-28.99 | % | 26.03-26.62 | % | 26.56-26.79 | % | ||||||
| Range of risk-free interest rates | 1.60-3.64 | % | 4.40-5.16 | % | 4.34-4.64 | % | ||||||
| Weighted-average expected lives | 8 years | 8 years | 8 years | |||||||||
| The fair value of the RSU grant was determined by reducing the stock price on the day of grant by the present value of the estimated dividends to be paid during the vesting period. The estimated dividends are based on Caterpillar’s weighted-average dividend yield. |
Page A-16
The amount of stock-based compensation expense capitalized for the years ended December 31, 2008, 2007 and 2006 did not have a significant impact on our financial statements. At December 31, 2008, there was $136 million of total unrecognized compensation cost from stock-based compensation arrangements granted under the plans, which is related to non-vested stock-based awards. The compensation expense is expected to be recognized over a weighted-average period of approximately 1.8 years. Please refer to Tables I and II below for additional information on our stock-based awards. |
TABLE I—Financial Information Related to Stock-based Compensation | |||||||||||||||||||||||||
| 2008 | 2007 | 2006 | |||||||||||||||||||||||
| Shares | Weighted- Average Exercise Price | Shares | Weighted- Average Exercise Price | Shares | Weighted- Average Exercise Price | ||||||||||||||||||||
| Stock options/SARs activity: | |||||||||||||||||||||||||
| Outstanding at beginning of year | 60,855,854 | $ | 42.18 | 68,880,667 | $ | 38.60 | 74,860,582 | $ | 32.23 | ||||||||||||||||
Granted to officers and key employees1 | 4,886,601 | $ | 73.20 | 4,350,974 | $ | 63.04 | 9,720,340 | $ | 72.05 | ||||||||||||||||
Granted to outside directors1 | — | $ | — | 75,829 | $ | 63.04 | 91,000 | $ | 66.77 | ||||||||||||||||
| Exercised | (5,006,435 | ) | $ | 30.04 | (12,062,847 | ) | $ | 29.41 | (15,491,627 | ) | $ | 28.66 | |||||||||||||
| Forfeited / expired | (337,946 | ) | $ | 46.45 | (388,769 | ) | $ | 41.64 | (299,628 | ) | $ | 54.13 | |||||||||||||
| Outstanding at end of year | 60,398,074 | $ | 45.68 | 60,855,854 | $ | 42.18 | 68,880,667 | $ | 38.60 | ||||||||||||||||
| Exercisable at year-end | 43,083,319 | $ | 35.81 | 47,533,561 | $ | 34.65 | 59,374,295 | $ | 33.27 | ||||||||||||||||
| RSUs activity: | |||||||||||||||||||||||||
| Outstanding at beginning of year | 1,253,326 | N/A | 2 | N/A | |||||||||||||||||||||
| Granted to officers and key employees | 1,490,645 | 1,282,020 | N/A | ||||||||||||||||||||||
| Granted to outside directors | 20,878 | — | N/A | ||||||||||||||||||||||
| Vested | (61,158 | ) | (9,715 | ) | N/A | ||||||||||||||||||||
| Forfeited | (30,217 | ) | (18,979 | ) | N/A | ||||||||||||||||||||
| Outstanding at end of year | 2,673,474 | 1,253,326 | N/A | ||||||||||||||||||||||
| Stock options/SARs outstanding and exercisable: | |||||||||||||||||||||||||||||
| Outstanding | Exercisable | ||||||||||||||||||||||||||||
| Exercise | # Outstanding | Weighted- Average Remaining Contractual | Weighted- Average Exercise | Aggregate Intrinsic | # Outstanding | Weighted- Average Remaining Contractual | Weighted- Average Exercise | Aggregate Intrinsic | |||||||||||||||||||||
| Prices | at 12/31/08 | Life (Years) | Price | Value3 | at 12/31/08 | Life (Years) | Price | Value3 | |||||||||||||||||||||
| $ | 19.20 - 22.76 | 1,712,753 | 1.47 | $ | 19.36 | $ | 43 | 1,712,753 | 1.47 | $ | 19.36 | $ | 43 | ||||||||||||||||
| $ | 25.36 - 26.77 | 7,540,290 | 3.08 | $ | 25.90 | 139 | 7,540,290 | 3.08 | $ | 25.90 | 139 | ||||||||||||||||||
| $ | 27.14 - 29.43 | 8,561,614 | 4.42 | $ | 27.16 | 148 | 8,561,614 | 4.42 | $ | 27.16 | 148 | ||||||||||||||||||
| $ | 31.17 - 45.64 | 23,950,025 | 5.50 | $ | 41.31 | 74 | 23,950,025 | 5.50 | $ | 41.31 | 74 | ||||||||||||||||||
| $ | 63.04 - 73.20 | 18,633,392 | 7.91 | $ | 70.22 | — | 1,318,637 | 7.41 | $ | 70.19 | — | ||||||||||||||||||
| 60,398,074 | $ | 45.68 | $ | 404 | 43,083,319 | $ | 35.81 | $ | 404 | ||||||||||||||||||||
| 1 | Of the 4,886,601 awards granted during the year ended December 31, 2008, 4,476,095 were SARs. Of the 4,426,803 awards granted during the year ended December 31, 2007, 4,195,188 were SARs. Of the 9,811,340 awards granted during the year ended December 31, 2006, 9,479,534 were SARs. | ||||||||||||||||||||||||||||
| 2 | 2007 was the first year stock-based compensation awards included RSUs. | ||||||||||||||||||||||||||||
| 3 | The difference between a stock award's exercise price and the underlying stock's market price at December 31, 2008, for awards with market price greater than the exercise price. Amounts are in millions of dollars. | ||||||||||||||||||||||||||||
| The computations of weighted-average exercise prices and aggregate intrinsic values are not applicable to RSUs since an RSU represents an agreement to issue shares of stock at the time of vesting. At December 31, 2008, there were 2,673,474 outstanding RSUs with a weighted average remaining contractual life of 1.7 years. |
Page A-17
| TABLE II— Additional Stock-based Award Information | |||||||||||||
| (Dollars in millions except per share data) | 2008 | 2007 | 2006 | ||||||||||
| Stock Options/SARs activity: | |||||||||||||
| Weighted-average fair value per share of stock awards granted | $ | 22.32 | $ | 20.73 | $ | 23.44 | |||||||
| Intrinsic value of stock awards exercised | $ | 232 | $ | 547 | $ | 637 | |||||||
| Fair value of stock awards vested | $ | 30 | $ | 14 | $ | 40 | |||||||
| Cash received from stock awards exercised | $ | 130 | $ | 322 | $ | 411 | |||||||
| RSUs activity: | |||||||||||||
| Weighted-average fair value per share of stock awards granted | $ | 69.17 | $ | 59.94 | N/A | ||||||||
| Fair value of stock awards vested | $ | 4 | $ | 1 | N/A | ||||||||
| The following table summarizes the effect of the adoption of SFAS 123R: |
| (Dollars in millions except per share data) | 2006 | |||
| Stock-based compensation expense, before tax | $ | 137 | ||
| Stock-based compensation expense, after tax | $ | 92 | ||
| Income tax benefit recognized in net income | $ | 45 | ||
| Decrease in profit per share of common stock, basic | $ | .14 | ||
| Decrease in profit per share of common stock, diluted | $ | .09 | ||
Before tax stock-based compensation expense for 2008 and 2007 was $194 million and $146 million, with a corresponding income tax benefit of $62 million and $48 million, respectively. In accordance with Staff Accounting Bulletin No. 107 “Share-based payment,” we classify stock-based compensation within cost of goods sold, selling, general and administrative expenses and research and development expenses corresponding to the same line item as the cash compensation paid to respective employees, officers and non-employee directors. We currently use shares that have been repurchased through our stock repurchase program to satisfy share award exercises. In November 2005, the FASB issued FASB Staff Position No. FAS 123R-3 “Transition Election Related to Accounting for Tax Effects of Share-Based Payment Awards.” In the third quarter of 2006, we elected to adopt the alternative transition method provided in the FASB Staff Position for calculating the tax effects of stock-based compensation. The alternative transition method includes simplified methods to determine the beginning balance of the additional paid-in capital (APIC) pool related to the tax effects of stock-based compensation, and to determine the subsequent impact on the APIC pool and the Statement of Cash Flow of the tax effects of stock-based awards that were fully vested and outstanding upon the adoption of SFAS 123R. The tax benefits realized from stock awards exercised for December 31, 2008, 2007 and 2006 were $60 million, $167 million and $170 million, respectively. We use the direct only method and tax law ordering approach to calculate the tax effects of stock-based compensation. In certain jurisdictions, tax deductions for exercises of stock-based awards did not generate a cash benefit. A tax benefit of approximately $24 million will be recorded in APIC when these deductions reduce our future income taxes payable. |
| 3. | Derivative financial instruments and risk management |
A. | Foreign currency exchange rate risk |
| Foreign currency exchange rate movements create a degree of risk by affecting the U.S. dollar value of sales made and costs incurred in foreign currencies. Movements in foreign currency rates also affect our competitive position as these changes may affect business practices and/or pricing strategies of non-U.S.-based competitors. Additionally, we have balance sheet positions denominated in foreign currency, thereby creating exposure to movements in exchange rates. |
Page A-18
Our Machinery and Engines operations purchase, manufacture and sell products in many locations around the world. As we have a diversified revenue and cost base, we manage our future foreign currency cash flow exposure on a net basis. We use foreign currency forward and option contracts to manage unmatched foreign currency cash inflow and outflow. Our objective is to minimize the risk of exchange rate movements that would reduce the U.S. dollar value of our foreign currency cash flow. Our policy allows for managing anticipated foreign currency cash flow for up to five years. We generally designate as cash flow hedges at inception of the contract any Australian dollar, Brazilian real, British pound, Canadian dollar, Chinese yuan, euro, Japanese yen, Mexican peso, Singapore dollar, New Zealand dollar or Swiss franc forward or option contracts that meet the requirements for hedge accounting. Designation is performed on a specific exposure basis to support hedge accounting. The remainder of Machinery and Engines foreign currency contracts are undesignated. We designate as fair value hedges specific euro forward contracts used to hedge firm commitments. As of December 31, 2008, $43 million (net of tax) of deferred net gains included in equity (“Accumulated other comprehensive income (loss)” in Statement 2), are expected to be reclassified to current earnings (“Other income (expense)” in Statement 1) over the next twelve months. The actual amount recorded in “Other income (expense)” will vary based on exchange rates at the time the hedged transactions impact earnings. In managing foreign currency risk for our Financial Products operations, our objective is to minimize earnings volatility resulting from conversion and the remeasurement of net foreign currency balance sheet positions. Our policy allows the use of foreign currency forward and option contracts to offset the risk of currency mismatch between our receivables and debt. All such foreign currency forward and option contracts are undesignated. |
| Gains (losses) included in current earnings [Other income (expense)] on undesignated contracts: | ||||||||||||
(Millions of dollars) | 2008 | 2007 | 2006 | |||||||||
| Machinery and Engines | $ | 26 | $ | 24 | $ | 23 | ||||||
| Financial Products | 33 | (89 | ) | (19 | ) | |||||||
| $ | 59 | $ | (65 | ) | $ | 4 | ||||||
| Gains and losses on the Financial Products contracts above are designed to offset balance sheet translation gains and losses. |
| B. | Interest rate risk |
Interest rate movements create a degree of risk by affecting the amount of our interest payments and the value of our fixed-rate debt. Our practice is to use interest rate swap agreements to manage our exposure to interest rate changes and, in some cases, lower the cost of borrowed funds. Machinery and Engines operations generally use fixed rate debt as a source of funding. Our objective is to minimize the cost of borrowed funds. Our policy allows us to enter into fixed-to-floating interest rate swaps and forward rate agreements to meet that objective with the intent to designate as fair value hedges at inception of the contract all fixed-to-floating interest rate swaps. Designation as a hedge of the fair value of our fixed rate debt is performed to support hedge accounting. During 2001, our Machinery and Engines operations liquidated all existing fixed-to-floating interest rate swaps. The gain ($2 million at December 31, 2008) is being amortized to earnings ratably over the remaining life of the hedged debt. During 2006 and 2007, we entered into $400 million (notional amount) of interest rate swaps designated as fair value hedges of our fixed rate long-term debt. During the first quarter 2008, our Machinery and Engines operations liquidated all of these fixed-to-floating interest rate swaps. The gain ($18 million remaining at December 31, 2008) is being amortized to earnings ratably over the remaining life of the hedged debt. During the fourth quarter 2008, we entered into $750 million (notional amount) of forward starting swaps designated as cash flow hedges of our anticipated long-term debt offering which occurred in December 2008. At the issuance of the debt, Caterpillar settled the forward starting swaps. The loss ($29 million at December 31, 2008) is being amortized to earnings ratably over the remaining term of the debt (10 years). Financial Products operations have a match-funding policy that addresses interest rate risk by aligning the interest rate profile (fixed or floating rate) of Cat Financial’s debt portfolio with the interest rate profile of their receivables portfolio within predetermined ranges on an ongoing basis. In connection with that policy, we use interest rate derivative instruments to modify the debt structure to match assets within the receivables portfolio. This match funding reduces the volatility of margins between interest-bearing assets and interest-bearing liabilities, regardless of which direction interest rates move. |
Page A-19
Our policy allows us to use fixed-to-floating, floating-to-fixed and floating-to-floating interest rate swaps to meet the match-funding objective. To support hedge accounting, we designate fixed-to-floating interest rate swaps as fair value hedges of the fair value of our fixed-rate debt at the inception of the swap contract. Financial Products' practice is to designate most floating-to-fixed interest rate swaps as cash flow hedges of the variability of future cash flows at the inception of the swap contract. Financial Products liquidated fixed-to-floating interest rate swaps during 2006, 2005 and 2004, which resulted in deferred net gains. These gains ($4 million remaining at December 31, 2008) are being amortized to earnings ratably over the remaining term of the hedged debt. |
Gains (losses) included in current earnings [Other income (expense)]: | ||||||||||||||
| (Millions of dollars) | 2008 | 2007 | 2006 | |||||||||||
| Fixed-to-floating interest rate swaps | ||||||||||||||
| Machinery and Engines: | ||||||||||||||
| Gain (loss) on designated interest rate derivatives | $ | 18 | $ | 26 | $ | 2 | ||||||||
| Gain (loss) on hedged debt | (9 | ) | (10 | ) | (1 | ) | ||||||||
| Gain (loss) amortization on liquidated swaps | 5 | 3 | 3 | |||||||||||
| Financial Products: | ||||||||||||||
| Gain (loss) on designated interest rate derivatives | 471 | 103 | (44 | ) | ||||||||||
| Gain (loss) on hedged debt | (474 | ) | (103 | ) | 44 | |||||||||
| Gain (loss) amortization on liquidated swaps—included in interest expense | 1 | 2 | 6 | |||||||||||
| $ | 12 | $ | 21 | $ | 10 | |||||||||
| As of December 31, 2008, $51 million (net of tax) of deferred net losses included in equity ("Accumulated other comprehensive income (loss)" in Statement 2), related to Financial Products floating-to-fixed interest rate swaps, are expected to be reclassified to current earnings ("Interest expense of Financial Products" in Statement 1) over the next 12 months. |
C. | Commodity price risk |
Commodity price movements create a degree of risk by affecting the price we must pay for certain raw material. Our policy is to use commodity forward and option contracts to manage the commodity risk and reduce the cost of purchased materials. Our Machinery and Engines operations purchase aluminum, copper and nickel embedded in the components we purchase from suppliers. Our suppliers pass on to us price changes in the commodity portion of the component cost. In addition, we are also subject to price changes on natural gas purchased for operational use. Our objective is to minimize volatility in the price of these commodities. Our policy allows us to enter into commodity forward and option contracts to lock in the purchase price of a portion of these commodities within a four-year horizon. All such commodity forward and option contracts are undesignated. There were no net gains or losses on undesignated contracts in 2007, and no contracts were outstanding during 2008. Gains on undesignated contracts of $1 million were recorded in current earnings ("Other income (expense)" in Statement 1) in 2006. |
D. | Stock repurchase risk |
In February 2007, the Board of Directors authorized a $7.5 billion stock repurchase program, expiring on December 31, 2011. The amount of Caterpillar stock that can be repurchased under the authorization is impacted by the movements in the price of the stock. In August 2007, the Board of Directors authorized the use of derivative contracts to reduce stock repurchase volatility. In connection with our stock repurchase program, we entered into capped call transactions (“call”) with a major bank for an aggregate of 6.0 million shares. A call permits us to reduce share repurchase price volatility by providing a floor and cap on the price at which the shares can be repurchased. During 2007, we paid the bank premiums of $56 million for the establishment of calls for 3.5 million shares, which was accounted for as a reduction to stockholders’ equity. During 2008, we paid the bank premiums of $38 million for the establishment of calls for 2.5 million shares. The floor, cap and strike prices for the calls were based upon the average purchase price paid by the bank to purchase our common stock to hedge these transactions. Each call matured and was exercised within one year after the call was established. If we exercised a call, we could elect to settle the transaction with the bank by physical settlement (paying cash and receiving shares), cash settlement (receiving a net amount of cash) or net share settlement (receiving a net amount of shares). |
Page A-20
| For the year ended December 31, 2008, $268 million of cash was used to repurchase 5.0 million shares pursuant to calls exercised under this program. Premiums previously paid associated with these exercised calls were $78 million. In December 2008, a call for 1.0 million shares matured, but was not exercised. Premiums previously paid associated with this unexercised call were $16 million. As of December 31, 2008, there were no outstanding calls. |
4. | Other income (expense) | |||||||||||
| Years ended December 31, | ||||||||||||
| (Millions of dollars) | 2008 | 2007 | 2006 | |||||||||
| Investment and interest income | $ | 101 | $ | 99 | $ | 83 | ||||||
| Foreign exchange gains | 100 | 21 | 9 | |||||||||
| License fee income | 73 | 66 | 61 | |||||||||
| Gains (losses) on sale of securities and affiliated companies | 55 | 70 | 35 | |||||||||
| Impairment of available-for-sale securities | (37 | ) | — | — | ||||||||
| Miscellaneous income (loss) | 35 | 101 | 55 | |||||||||
| $ | 327 | $ | 357 | $ | 243 | |||||||
| 5. | Income taxes |
| The components of profit before taxes were: | ||||||||||||
| Years ended December 31, | ||||||||||||
| (Millions of dollars) | 2008 | 2007 | 2006 | |||||||||
| U.S. | $ | 2,146 | $ | 2,155 | $ | 2,642 | ||||||
| Non-U.S. | 2,355 | 2,835 | 2,248 | |||||||||
| $ | 4,501 | $ | 4,990 | $ | 4,890 | |||||||
| Profit before taxes, as shown above, is based on the location of the entity to which such earnings are attributable. Where an entity’s earnings are subject to taxation, however, may not correlate solely to where an entity is located. Thus, the income tax provision shown below as U.S. or non-U.S. may not correspond to the earnings shown above. |
| The components of the provision for income taxes were: | |||||||||||||
| Years ended December 31, | |||||||||||||
| (Millions of dollars) | 2008 | 2007 | 2006 | ||||||||||
| Current tax provision (credit): | |||||||||||||
| U.S. | $ | 673 | $ | 515 | $ | 1,342 | |||||||
| Non-U.S. | 446 | 464 | 373 | ||||||||||
| State (U.S.) | 41 | 92 | 49 | ||||||||||
| 1,160 | 1,071 | 1,764 | |||||||||||
| Deferred tax provision (credit): | |||||||||||||
| U.S. | (335 | ) | 403 | (381 | ) | ||||||||
| Non-U.S. | 99 | 21 | 23 | ||||||||||
| State (U.S.) | 29 | (10 | ) | (1 | ) | ||||||||
| (207 | ) | 414 | (359 | ) | |||||||||
| Total provision for income taxes | $ | 953 | $ | 1,485 | $ | 1,405 | |||||||
| We paid income taxes of $1,318 million, $821 million and $1,465 million in 2008, 2007 and 2006, respectively. |
Page A-21
| Reconciliation of the U.S. federal statutory rate to effective rate: | |||||||||||||
| Years ended December 31, | |||||||||||||
| 2008 | 2007 | 2006 | |||||||||||
| U.S. statutory rate | 35.0 | % | 35.0 | % | 35.0 | % | |||||||
| (Decreases) increases in taxes resulting from: | |||||||||||||
| Benefit of extraterritorial income exclusion | — | — | (2.1 | )% | |||||||||
| Non-U.S. subsidiaries taxed at other than 35% | (2.8 | )% | (4.9 | )% | (3.7 | )% | |||||||
| Other—net | (0.9 | )% | (0.3 | )% | (0.4 | )% | |||||||
| 31.3 | % | 29.8 | % | 28.8 | % | ||||||||
| Discrete items | (10.1 | )% | — | (0.1 | )% | ||||||||
| Provision for income taxes | 21.2 | % | 29.8 | % | 28.7 | % | |||||||
The provision for income taxes for 2008 includes tax benefits of $456 million recorded discretely in the quarter of occurrence. Repatriation of non-U.S. earnings resulted in a tax benefit of $409 million due to available foreign tax credits in excess of the U.S. tax liability on the dividend. A benefit of $47 million was also recorded in 2008 due to a change in tax status of a non-U.S. subsidiary allowing indefinite reinvestment of undistributed profits and reversal of U.S. tax previously recorded. The 2006 provision for income taxes includes a benefit of $5 million for net changes in tax reserves. Favorable settlement of a non-U.S. tax issue resulted in a $25 million decrease in reserves. This was partially offset by a $20 million increase in U.S. tax reserves related to transfer pricing adjustments for tax years 1992 to 1994, which we continue to dispute. We have recorded income tax expense at U.S. tax rates on all profits, except for undistributed profits of non-U.S. subsidiaries of approximately $8 billion which are considered indefinitely reinvested. Determination of the amount of unrecognized deferred tax liability related to indefinitely reinvested profits is not feasible. A deferred tax asset is recognized only if we have definite plans to generate a U.S. tax benefit by repatriating earnings in the foreseeable future. |
| Deferred income tax assets and liabilities: | |||||||||||||
| December 31, | |||||||||||||
| (Millions of dollars) | 2008 | 2007 | 2006 | ||||||||||
| Deferred income tax assets: | |||||||||||||
| Pension | $ | 1,888 | $ | 270 | $ | 577 | |||||||
| Postemployment benefits other than pensions | 1,530 | 1,490 | 1,593 | ||||||||||
| Tax carryforwards | 712 | 366 | 646 | ||||||||||
| Warranty reserves | 312 | 266 | 234 | ||||||||||
| Unrealized profit excluded from inventories | 275 | 210 | 192 | ||||||||||
| Post sale discounts | 140 | 116 | 103 | ||||||||||
| Allowance for credit losses | 134 | 102 | 83 | ||||||||||
| Deferred compensation | 78 | 104 | 83 | ||||||||||
| Other—net | 442 | 420 | 270 | ||||||||||
| 5,511 | 3,344 | 3,781 | |||||||||||
| Deferred income tax liabilities: | |||||||||||||
| Capital and intangible assets | (1,233 | ) | (938 | ) | (906 | ) | |||||||
| Undistributed profits of non-U.S. subs | — | (113 | ) | (65 | ) | ||||||||
| (1,233 | ) | (1,051 | ) | (971 | ) | ||||||||
| Valuation allowance for deferred tax assets | (334 | ) | (257 | ) | (192 | ) | |||||||
| Deferred income taxes—net | $ | 3,944 | $ | 2,036 | $ | 2,618 | |||||||
| SFAS 109 requires that individual tax-paying entities of the company offset all current deferred tax liabilities and assets within each particular tax jurisdiction and present them as a single amount in the Consolidated Financial Position. A similar procedure is followed for all noncurrent deferred tax liabilities and assets. Amounts in different tax jurisdictions cannot be offset against each other. The amount of deferred income taxes at December 31, included on the following lines in Statement 2, are as follows: |
Page A-22
| December 31, | |||||||||||||
| (Millions of dollars) | 2008 | 2007 | 2006 | ||||||||||
| Assets: | |||||||||||||
| Deferred and refundable income taxes | $ | 785 | $ | 612 | $ | 733 | |||||||
| Noncurrent deferred and refundable income taxes | 3,298 | 1,539 | 1,949 | ||||||||||
| 4,083 | 2,151 | 2,682 | |||||||||||
| Liabilities: | |||||||||||||
| Other current liabilities | 9 | 8 | 9 | ||||||||||
| Other liabilities | 130 | 107 | 55 | ||||||||||
| Deferred income taxes—net | $ | 3,944 | $ | 2,036 | $ | 2,618 | |||||||
| At December 31, 2008, we had U.S. foreign tax credits of approximately $250 million to carry forward for up to ten years. |
| At December 31, 2008, amounts and expiration dates of net operating loss carryforwards in various non-U.S. taxing jurisdictions were: |
| (Millions of dollars) | |||||||||||||||||||||||||||
| 2009 | 2010 | 2011 | 2012 | 2013-2023 | Unlimited | Total | |||||||||||||||||||||
| $ | 2 | $ | 3 | $ | 4 | $ | 6 | $ | 219 | $ | 654 | $ | 888 | ||||||||||||||
A valuation allowance has been recorded at certain non-U.S. subsidiaries that have not yet demonstrated consistent and/or sustainable profitability to support the recognition of net deferred tax assets. At December 31, 2008, approximately $288 million of state tax net operating losses (NOLs) and $128 million of state tax credit carryforwards were available. Of the NOLs, over three-fourths expire after 2018. The state tax credit carryforwards expire over the next ten years. We established a valuation allowance for those NOLs and credit carryforwards likely to expire prior to utilization. | |
| We adopted FIN 48, “Accounting for Uncertainty in Income Taxes” as of January 1, 2007. A reconciliation of the beginning and ending amount of gross unrecognized tax benefits for uncertain tax positions, including positions impacting only the timing of tax benefits, follows. |
Reconciliation of unrecognized tax benefits: 1 | |||||||||
| Years ended December 31, | |||||||||
| (Millions of dollars) | 2008 | 2007 | |||||||
| Balance at January 1, | $ | 703 | $ | 742 | |||||
| Additions for tax positions related to current year | 126 | 62 | |||||||
| Additions for tax positions related to prior years | 38 | 24 | |||||||
| Reductions for tax positions related to prior years | (48 | ) | (109 | ) | |||||
| Reductions for settlements | (4 | ) | (7 | ) | |||||
| Reductions for expiration of statute of limitations | (12 | ) | (9 | ) | |||||
| Balance at December 31, | $ | 803 | $ | 703 | |||||
| 1 | Foreign currency translation amounts are included within each line as applicable. | ||||||||
At adoption, the amount of unrecognized tax benefits that, if recognized, would impact the effective tax rate was $486 million. The corresponding amounts for the years ended December 31, 2008 and 2007 were $646 million and $537 million, respectively. We classify interest and penalties on tax uncertainties as a component of the provision for income taxes. We recognized interest and penalties of $18 million and $36 million during the years ended December 31, 2008 and 2007, respectively. The total amount of interest and penalties accrued was $116 million and $98 million for the years ended December 31, 2008 and 2007, respectively. It is expected that the amount of unrecognized tax benefits will change in the next 12 months. However, we do not expect the change to have a significant impact on our results of operations or financial position. |
Page A-23
The Internal Revenue Service (IRS) is currently examining U.S. tax returns for 2005 and 2006 and has completed its field examination of our tax returns for 1992 to 2004. For tax years 1992 to 1994, we expect to litigate the unagreed adjustments related to transfer pricing. We anticipate the appeals process for tax years 1995 to 1999, primarily related to foreign sales corporation commissions, foreign tax credit calculations and research and development credits, will be settled within the next 12 months. For tax years 2000 to 2004, we are in the appeals process for unagreed adjustments primarily related to export tax benefits. In the opinion of management, the ultimate disposition of these matters will not have a material adverse effect on our consolidated financial position, liquidity or results of operations. In our major non-U.S. jurisdictions, tax years are typically subject to examination for three to six years. | |
6. | Sales and servicing of trade receivables |
Our Machinery and Engines operations generate trade receivables from the sale of inventory to dealers and customers. Certain of these receivables are sold to Cat Financial. Cat Financial has sold interests in a certain pool of trade receivables through a revolving structure to third-party commercial paper conduits, asset-backed commercial paper issuers that are special purpose entities (SPEs) of the sponsor bank and are not consolidated by Cat Financial. In accordance with SFAS 140, the transfers to the conduits are accounted for as sales. Cat Financial services the sold trade receivables and receives an annual servicing fee of approximately 0.5% of the average outstanding principal balance. Consolidated expenses of $10 million, $15 million and $15 million related to the sale of trade receivables were recognized during 2008, 2007 and 2006, respectively, and are included in "Other income (expense)" in Statement 1. As of December 31, 2008, 2007 and 2006, the outstanding principal balance of the sold trade receivables was $240 million. Cat Financial’s remaining interest in the pool of trade receivables as of December 31, 2008, 2007 and 2006 of $1,432 million, $1,233 million and $2,718 million, respectively, is included in "Receivables—trade and other" in Statement 2. The carrying amount approximated fair value due to the short-term nature of these receivables. The cash collections from these receivables held by Cat Financial, including those attributable to the third-party conduits, are first applied to satisfy any obligations of Cat Financial to the third-party conduits. The third-party conduits have no recourse to Cat Financial's assets, other than the remaining interest, for failure of debtors to pay when due. |
| Cash flows from sale of trade receivables: | ||||||||||||
| Years ended December 31, | ||||||||||||
| (Millions of dollars) | 2008 | 2007 | 2006 | |||||||||
| Cash proceeds from sales of receivables to the conduit | $ | 1,510 | $ | 1,512 | $ | 1,043 | ||||||
| Servicing fees received | 1 | 1 | 1 | |||||||||
| Cash flows received on the interests that continue to be held | 11,270 | 13,680 | 15,168 | |||||||||
7. | Wholesale inventory receivables |
| Wholesale inventory receivables are receivables of Cat Financial that arise when Cat Financial provides financing for a dealer's purchase of inventory. These receivables are included in "Receivables—trade and other" and "Long-term receivables—trade and other" in Statement 2 and were $1,555 million, $1,496 million, and $1,215 million at December 31, 2008, 2007 and 2006, respectively. Please refer to Note 19 and Table IV for fair value information. |
Page A-24
| Contractual maturities of outstanding wholesale inventory receivables: | |||||||||||||||||
| (Millions of dollars) | December 31, 2008 | ||||||||||||||||
| Amounts Due In | Wholesale Installment Contracts | Wholesale Finance Leases | Wholesale Notes | Total | |||||||||||||
| 2009 | $ | 210 | $ | 114 | $ | 615 | $ | 939 | |||||||||
| 2010 | 10 | 50 | 204 | 264 | |||||||||||||
| 2011 | 15 | 32 | 143 | 190 | |||||||||||||
| 2012 | 13 | 6 | 12 | 31 | |||||||||||||
| 2013 | 24 | 2 | 1 | 27 | |||||||||||||
| Thereafter | — | 1 | 1 | 2 | |||||||||||||
| 272 | 205 | 976 | 1,453 | ||||||||||||||
| Guaranteed residual value | — | 133 | — | 133 | |||||||||||||
| Less: Unearned income | (7 | ) | (15 | ) | (9 | ) | (31 | ) | |||||||||
| Total | $ | 265 | $ | 323 | $ | 967 | $ | 1,555 | |||||||||
8. | Finance receivables |
Finance receivables are receivables of Cat Financial, which generally can be repaid or refinanced without penalty prior to contractual maturity. Total finance receivables reported in Statement 2 are net of an allowance for credit losses. During 2008, 2007 and 2006, Cat Financial sold certain finance receivables related to retail installment sale contracts and finance leases to special purpose entities (SPEs) as part of their asset-backed securitization program. The SPEs have limited purposes and generally are only permitted to purchase the finance receivables, issue asset-backed securities and make payments on the securities. The SPEs only issue a single series of securities and generally are dissolved when those securities have been paid in full. The SPEs, typically trusts, are considered to be qualifying special purpose entities (QSPEs) and thus, in accordance with SFAS 140, are not consolidated. The QSPEs issue debt to pay for the finance receivables they acquire from Cat Financial. The primary source for repayment of the debt is the cash flows generated from the finance receivables owned by the QSPEs. The assets of the QSPEs are legally isolated and are not available to pay the creditors of Cat Financial or any other affiliate of Cat Financial. For bankruptcy analysis purposes, Cat Financial has sold the finance receivables to the QSPEs in a true sale and the QSPEs are separate legal entities. Cat Financial retained interests in the finance receivables that were sold through their asset-backed securitization program. Retained interests include subordinated certificates, an interest in future cash flows (excess) and reserve accounts. Retained interests in securitized assets are classified as available-for-sale securities and are included in “Other assets” in Statement 2 at fair value in accordance with SFAS 115. Cat Financial estimates fair value based on the present value of the future expected cash flows using key assumptions for credit losses, prepayment rates and discount rates. These assumptions are based on historical experience, market trends and anticipated performance relative to the particular assets securitized. Cat Financial periodically reviews the key assumptions and estimates used in determining the fair value of their retained interests with unrealized gains and losses recorded in Statement 2 as part of “Accumulated other comprehensive income”. If based on current information and events, it is probable that there has been an adverse change in estimated cash flows, an “other-than-temporary” impairment is recorded and included in profit to write down the retained interest to estimated fair value. Cat Financial retains credit risk in the retail finance receivables that are sold through Cat Financial’s asset-backed securitizations because Cat Financial’s retained interests are subordinate to the investors’ interests. Any credit losses in the pool of securitized assets would be limited to Cat Financial’s retained interests. For 2008, subordinated interests included subordinated certificates with an initial fair value of $27 million, an interest in certain future cash flow (excess) with an initial fair value of $8 million and a reserve account with an initial fair value of $9 million. For 2007, subordinated interests included subordinated certificates with an initial fair value of zero, an interest in certain future cash flow (excess) with an initial fair value of $2 million and a reserve account with an initial fair value of $9 million. For 2006, subordinated interests included subordinated certificates with an initial fair value of $4 million, an interest in certain future cash flow (excess) with an initial fair value of $3 million and a reserve account with an initial fair value of $10 million. Net gains of $12 million, $4 million and $7 million were recognized on these transactions in 2008, 2007 and 2006, respectively. |
Page A-25
| Significant assumptions used to estimate the fair value of the retained interests and subordinated certificates at the time of the transaction were: |
| 2008 | 2007 | 2006 | |||||||
| Discount rate | 7.2 | % | 8.4 | % | 11.2 | % | |||
| Weighted-average prepayment rate | 14.5 | % | 14.0 | % | 14.0 | % | |||
| Expected credit losses | 1.6 | % | 1.5 | % | 1.5 | % | |||
The company receives annual servicing fees of approximately 1% of the unpaid note value. As of December 31, 2008, 2007 and 2006, the subordinated retained interests in the public securitizations totaled $52 million, $49 million and $68 million, respectively. Key assumptions used to determine the fair value of the retained interests were: |
| 2008 | 2007 | 2006 | |||||||
| Cash flow weighted average discount rates on retained interests | 16.7 to 23.3 | % | 8.3 to 11.5 | % | 5.9 to 9.1 | % | |||
| Weighted-average maturity | 28 months | 30 months | 31 months | ||||||
| Expected prepayment rate | 19.0 | % | 14.0 | % | 14.0 | % | |||
| Expected credit losses | 1.7 to 3.1 | % | .6 to 1.3 | % | .5 to 1.3 | % | |||
The investors and the securitization trusts have no recourse to Cat Financial's other assets for failure of debtors to pay when due. We estimated the impact of individual 10% and 20% changes to the key economic assumptions used to determine the fair value of residual cash flow in retained interests on our income. An independent, adverse change to each key assumption used to calculate the fair value of all our retained interests as of December 31, 2008, 2007 and 2006 would be $8 million or less, $2 million or less, and $3 million or less, respectively. During 2008, the assumptions used to determine the fair value of Cat Financial’s retained interests in the securitization transactions were reviewed. The most significant change was an increase in the credit loss assumption due to the continued softening of industries related to the U.S. housing market. This resulted in a $27 million impairment charge to the retained interests for the year ended December 31, 2008. The impairment charge was recorded in “Revenues of Financial Products” on Statement 1. To maintain competitiveness in the capital markets and to have effective and efficient use of alternative funding sources, Cat Financial may from time to time provide additional reserve support to previously issued asset-backed securitizations. During the third quarter of 2008, Cat Financial deposited $19 million into a supplemental reserve account for the 2007 securitization transaction to maintain the credit ratings assigned to the transaction, as loss experiences were higher than anticipated primarily due to the softening of industries related to the U.S. housing market. This resulted in an increase in Cat Financial’s retained interests. We consider an account past due if any portion of an installment is due and unpaid for more than 30 days. Recognition of income is suspended when management determines that collection of future income is not probable (generally after 120 days past due). Accrual is resumed, and previously suspended income is recognized, when the receivable becomes contractually current and/or collection doubts are removed. Cash receipts on impaired loans or finance leases are recorded against the receivable and then to any unrecognized income. Investment in loans/finance leases on nonaccrual status were $422 million, $232 million and $190 million and past due over 90 days and still accruing were $119 million, $47 million and $18 million as of December 31, 2008, 2007 and 2006, respectively. |
Cat Financial provides financing only when acceptable criteria are met. Credit decisions are based on, among other things, the customer's credit history, financial strength and intended use of equipment. Cat Financial typically maintains a security interest in retail financed equipment and requires physical damage insurance coverage on financed equipment. Please refer to Table III for additional finance receivables information and Note 19 and Table IV for fair value information. |
Page A-26
TABLE III—Finance Receivables Information (Millions of dollars) | |||||||||||||||||
| Contractual maturities of outstanding finance receivables: | |||||||||||||||||
| December 31, 2008 | |||||||||||||||||
| Amounts Due In | Retail Installment Contracts | Retail Finance Leases | Retail Notes | Total | |||||||||||||
| 2009 | $ | 2,950 | $ | 3,374 | $ | 2,937 | $ | 9,261 | |||||||||
| 2010 | 1,989 | 2,397 | 1,481 | 5,867 | |||||||||||||
| 2011 | 1,249 | 1,450 | 1,095 | 3,794 | |||||||||||||
| 2012 | 642 | 652 | 729 | 2,023 | |||||||||||||
| 2013 | 241 | 239 | 743 | 1,223 | |||||||||||||
| Thereafter | 129 | 213 | 1,224 | 1,566 | |||||||||||||
| 7,200 | 8,325 | 8,209 | 23,734 | ||||||||||||||
| Residual value | — | 1,387 | — | 1,387 | |||||||||||||
| Less: Unearned income | (674 | ) | (953 | ) | (108 | ) | (1,735 | ) | |||||||||
| Total | $ | 6,526 | $ | 8,759 | $ | 8,101 | $ | 23,386 | |||||||||
| Impaired loans and leases: | 2008 | 2007 | 2006 | ||||||||||
| Average recorded investment | $ | 306 | $ | 200 | $ | 168 | |||||||
| At December 31: | |||||||||||||
| Recorded investment | $ | 479 | $ | 219 | $ | 193 | |||||||
| Impaired loans/finance leases for which there is a related allowance for credit losses | 258 | 1 | 166 | 133 | |||||||||
| Related allowance for credit losses on impaired loans/finance leases | 59 | 1 | 35 | 26 | |||||||||
| Impaired loans/finance leases for which there is no related allowance for credit losses | 221 | 53 | 60 | ||||||||||
| Allowance for credit loss activity: | 2008 | 2007 | 2006 | ||||||||||
| Balance at beginning of year | $ | 351 | $ | 315 | $ | 302 | |||||||
| Provision for credit losses | 192 | 97 | 68 | ||||||||||
| Receivables written off | (144 | ) | (91 | ) | (63 | ) | |||||||
| Recoveries on receivables previously written off | 23 | 23 | 16 | ||||||||||
| Other—net | (31 | ) | 7 | (8 | ) | ||||||||
| Balance at end of year | $ | 391 | $ | 351 | $ | 315 | |||||||
| In estimating the allowance for credit losses, we review accounts that are past due, non-performing or in bankruptcy. |
| Cat Financial's net retail finance leases: | December 31, | ||||||||||||
| 2008 | 2007 | 2006 | |||||||||||
| Total minimum lease payments receivable | $ | 8,325 | $ | 7,756 | $ | 6,577 | |||||||
| Estimated residual value of leased assets: | |||||||||||||
| Guaranteed | 658 | 638 | 483 | ||||||||||
| Unguaranteed | 729 | 746 | 674 | ||||||||||
| 9,712 | 9,140 | 7,734 | |||||||||||
| Less: Unearned income | (953 | ) | (938 | ) | (806 | ) | |||||||
| Net retail finance leases | $ | 8,759 | $ | 8,202 | $ | 6,928 | |||||||
| Cash flow from securitizations: | 2008 | 2007 | 2006 | ||||||||||
| Proceeds from initial sales of receivables | $ | 600 | $ | 650 | $ | 947 | |||||||
| Purchases of contracts through clean-up calls | 81 | 64 | 63 | ||||||||||
| Servicing fees received | 12 | 11 | 12 | ||||||||||
| Cash flows received on retained interests | 25 | 35 | 41 | ||||||||||
| Characteristics of securitized receivables: | |||||||||||||
| At December 31: | |||||||||||||
| Total securitized principal balance | $ | 909 | $ | 1,159 | $ | 1,227 | |||||||
| Loans more than 30 days past due | 98 | 65 | 34 | ||||||||||
| Weighted-average maturity (in months) | 28 | 30 | 31 | ||||||||||
For the year ended December 31: | |||||||||||||
| Average securitized principal balance | $ | 1,147 | $ | 1,064 | $ | 1,162 | |||||||
| Net credit losses | 23 | 9 | 5 | ||||||||||
| 1 | Includes impaired loans of $108 million primarily reflecting the fair value of the loan’s associated collateral. See Note 19 for more information. |
Page A-27
| 9. | Inventories |
| Inventories (principally using the “last-in, first-out” method) are comprised of the following: |
| December 31, | ||||||||||||
| (Millions of dollars) | 2008 | 2007 | 2006 | |||||||||
| Raw materials | $ | 2,678 | $ | 2,240 | $ | 1,850 | ||||||
| Work-in-process | 1,508 | 1,206 | 1,189 | |||||||||
| Finished goods | 4,316 | 3,512 | 3,085 | |||||||||
| Supplies | 279 | 246 | 227 | |||||||||
| Total inventories | $ | 8,781 | $ | 7,204 | $ | 6,351 | ||||||
| We had long-term material purchase obligations of approximately $363 million at December 31, 2008. |
| 10. | Property, plant and equipment |
| December 31, | ||||||||||||||||
| (Millions of dollars) | Useful Lives (Years) | 2008 | 2007 | 2006 | ||||||||||||
| Land | — | $ | 575 | $ | 189 | $ | 184 | |||||||||
| Buildings and land improvements | 20-45 | 4,647 | 3,625 | 3,407 | ||||||||||||
| Machinery, equipment and other | 3-10 | 12,173 | 9,756 | 8,694 | ||||||||||||
| Equipment leased to others | 1-10 | 4,561 | 4,556 | 3,957 | ||||||||||||
| Construction-in-process | — | 1,531 | 1,082 | 1,036 | ||||||||||||
| Total property, plant and equipment, at cost | 23,487 | 19,208 | 17,278 | |||||||||||||
| Less: Accumulated depreciation | (10,963 | ) | (9,211 | ) | (8,427 | ) | ||||||||||
| Property, plant and equipment—net | $ | 12,524 | $ | 9,997 | $ | 8,851 | ||||||||||
| We had commitments for the purchase or construction of capital assets of approximately $579 million at December 31, 2008. |
Assets recorded under capital leases: 1 | ||||||||||||||
| December 31, | ||||||||||||||
| (Millions of dollars) | 2008 | 2007 | 2006 | |||||||||||
Gross capital leases 2 | $ | 565 | 3 | $ | 96 | $ | 96 | |||||||
| Less: Accumulated depreciation | (221 | ) | 3 | (75 | ) | (65 | ) | |||||||
| Net capital leases | $ | 344 | $ | 21 | $ | 31 | ||||||||
| 1 | Included in Property, plant and equipment table above. | |||||||||||||
| 2 | Consists primarily of machinery and equipment. | |||||||||||||
| 3 | Increase in 2008 due to consolidation of Cat Japan. See Note 25 for additional details. | |||||||||||||
| Equipment leased to others (primarily by Cat Financial): | ||||||||||||
| December 31, | ||||||||||||
| (Millions of dollars) | 2008 | 2007 | 2006 | |||||||||
| Equipment leased to others—at original cost | $ | 4,561 | $ | 4,556 | $ | 3,957 | ||||||
| Less: Accumulated depreciation | (1,416 | ) | (1,487 | ) | (1,299 | ) | ||||||
| Equipment leased to others—net | $ | 3,145 | $ | 3,069 | $ | 2,658 | ||||||
Page A-28
| At December 31, 2008, scheduled minimum rental payments to be received for equipment leased to others were: |
| (Millions of dollars) | |||||||||||||||||||||||
| 2009 | 2010 | 2011 | 2012 | 2013 | After 2013 | ||||||||||||||||||
| $ | 715 | $ | 523 | $ | 321 | $ | 170 | $ | 70 | $ | 27 | ||||||||||||
| 11. | Investments in unconsolidated affiliated companies |
Our investments in affiliated companies accounted for by the equity method have historically consisted primarily of a 50 percent interest in Shin Caterpillar Mitsubishi Ltd. (SCM) located in Japan. On August 1, 2008, SCM redeemed half of Mitsubishi Heavy Industries Ltd.’s (MHI’s) shares in SCM. As a result, Caterpillar now owns 67 percent of the renamed entity, Caterpillar Japan Ltd. (Cat Japan). Because Cat Japan is accounted for on a lag, Cat Japan’s August 1, 2008 financial position was consolidated on September 30, 2008. Cat Japan’s results of operations were consolidated in the fourth quarter. See Note 25 for details on this share redemption. In February 2008, we sold our 23 percent equity investment in A.S.V. Inc. (ASV) resulting in a $60 million pretax gain. Accordingly, the December 31, 2008 financial position and equity investment amounts noted below do not include ASV or Cat Japan. Combined financial information of the unconsolidated affiliated companies accounted for by the equity method (generally on a lag of 3 months or less) was as follows: |
| Results of Operations of unconsolidated affiliated companies: | |||||||||||||
| Years ended December 31, | |||||||||||||
| (Millions of dollars) | 2008 | 2007 | 2006 | ||||||||||
| Results of Operations: | |||||||||||||
| Sales | $ | 3,727 | $ | 4,007 | $ | 4,420 | |||||||
| Cost of sales | 3,082 | 3,210 | 3,526 | ||||||||||
| Gross profit | $ | 645 | $ | 797 | $ | 894 | |||||||
| Profit (loss) | $ | 55 | $ | 157 | $ | 187 | |||||||
| Sales from SCM, while an unconsolidated affiliate, to Caterpillar of approximately $1.67 billion, $1.67 billion and $1.81 billion in 2008, 2007 and 2006, respectively, are included in the affiliated company sales. In addition, SCM purchases of Caterpillar product, while an unconsolidated affiliate, were $353 million, $268 million and $273 million in 2008, 2007 and 2006, respectively. |
| Financial Position of unconsolidated affiliated companies: | ||||||||||||||
| December 31, | ||||||||||||||
| (Millions of dollars) | 2008 | 2007 | 2006 | |||||||||||
| Financial Position: | ||||||||||||||
| Assets: | ||||||||||||||
| Current assets | $ | 209 | $ | 2,062 | $ | 1,807 | ||||||||
| Property, plant and equipment—net | 227 | 1,286 | 1,119 | |||||||||||
| Other assets | 26 | 173 | 176 | |||||||||||
| 462 | 3,521 | 3,102 | ||||||||||||
| Liabilities: | ||||||||||||||
| Current liabilities | 173 | 1,546 | 1,394 | |||||||||||
| Long-term debt due after one year | 110 | 269 | 309 | |||||||||||
| Other liabilities | 35 | 393 | 145 | |||||||||||
| 318 | 2,208 | 1,848 | ||||||||||||
| Ownership | $ | 144 | $ | 1,313 | $ | 1,254 | ||||||||
Page A-29
| Caterpillar's investments in unconsolidated affiliated companies: | ||||||||||||
| December 31, | ||||||||||||
| (Millions of dollars) | 2008 | 2007 | 2006 | |||||||||
| Investments in equity method companies | $ | 66 | $ | 582 | $ | 542 | ||||||
| Plus: Investments in cost method companies | 28 | 16 | 20 | |||||||||
| Total investments in unconsolidated affiliated companies | $ | 94 | $ | 598 | $ | 562 | ||||||
| At December 31, 2008, consolidated "Profit employed in the business" in Statement 2 included $10 million representing undistributed profit of the unconsolidated affiliated companies. |
| 12. | Intangible assets and goodwill |
| A. | Intangible assets | |||||||||||||||
| Intangible assets are comprised of the following: | ||||||||||||||||
Weighted Amortizable Life (Years) | December 31, | |||||||||||||||
| (Millions of dollars) | 2008 | 2007 | 2006 | |||||||||||||
| Customer relationships | 18 | $ | 397 | $ | 366 | $ | 242 | |||||||||
| Intellectual property | 10 | 211 | 195 | 211 | ||||||||||||
| Other | 11 | 112 | 81 | 73 | ||||||||||||
| Total finite-lived intangible assets—gross | 15 | 720 | 642 | 526 | ||||||||||||
| Less: Accumulated amortization | (209 | ) | (167 | ) | (139 | ) | ||||||||||
| Intangible assets—net | $ | 511 | $ | 475 | $ | 387 | ||||||||||
During 2008, the Cat Japan share redemption resulted in additional finite-lived intangible assets of $54 million. In 2008, we acquired finite-lived intangible assets of $17 million due to the purchase of Lovat Inc. See Note 25 for details on these business combinations. Also in 2008, we acquired finite-lived intangible assets of $32 million from other acquisitions. During 2007, we acquired finite-lived intangible assets of $89 million as part of the purchase of Franklin Power Products. In 2007, we also acquired finite-lived intangible assets of $24 million due to the purchase of the Forestry Division of Blount International, Inc. During 2006 we acquired finite-lived intangible assets of $223 million due to the purchase of Progress Rail Services, Inc. (Progress Rail). See Note 25 for details on the acquisition of these assets. Amortization expense related to intangible assets was $61 million, $52 million and $34 million for 2008, 2007 and 2006, respectively. Amortization expense related to intangible assets is expected to be: |
| (Millions of dollars) | |||||||||||||||||||||||
| 2009 | 2010 | 2011 | 2012 | 2013 | Thereafter | ||||||||||||||||||
| $ | 59 | $ | 56 | $ | 49 | $ | 41 | $ | 30 | $ | 276 | ||||||||||||
B. | Goodwill |
During 2008, the Cat Japan share redemption resulted in $206 million of goodwill. In 2008, we acquired net assets with related goodwill of $41 million as part of the purchase of Gremada Industries, Inc. In 2008, we also acquired net assets with related goodwill of $22 million as part of the purchase of Lovat Inc. See Note 25 for details on these business combinations. Also during 2008, we acquired net assets with related goodwill of $8 million from other acquisitions. During 2007, we acquired assets with related goodwill of $37 million as part of the purchase of Franklin Power Products. In 2007, we also acquired assets with related goodwill of $22 million as part of the purchase of the Forestry Division of Blount International, Inc. During 2006, we acquired assets with related goodwill of $431 million as part of the purchase of Progress Rail. During 2006, we also acquired assets with related goodwill of $39 million as part of the purchase of the large components business of Royal Oak Industries, Inc. See Note 25 for details on the acquisition of these assets. |
Page A-30
During 2006, we determined that the business outlook for the parts and accessories distribution business of MG Rover, acquired in 2004, required a specific impairment evaluation. The declining outlook of this business resulted from MG Rover’s cessation of vehicle production and warranties resulting from their bankruptcy in 2005. Although the MG Rover parts business continues to provide parts to the existing population of vehicles, the unit’s sales will continue to decline as production of new vehicles has ceased. In determining if there was impairment, we first compared the fair value of the reporting unit (calculated by discounting projected cash flows) to the carrying value. Because the carrying value exceeded the fair value, we then allocated the fair value to the assets and liabilities of the unit and determined the fair value of the implied goodwill was zero. Accordingly, a goodwill impairment charge of $18 million, representing the entire goodwill associated with the MG Rover parts and accessories business at that date, was included in “Other operating expenses” in Statement 1 and reported in the “All Other” category in Note 24. No goodwill was impaired or disposed of during the years ended December 31, 2008 or 2007. |
| The changes in carrying amount of goodwill by reportable segment for the years ended December 31, 2008, 2007 and 2006 were as follows: |
| Balance at | 2008 Activity | Balance at | 2007 Activity | Balance at | 2006 Activity | Balance at | ||||||||||||||||||||||||||||||
| (Millions of dollars) | December 31, 2008 | Business Combinations | Other adjustments 2 | December 31, 2007 | Business Combinations | December 31, 2006 | Business Combinations | Impairments | January 1, 2006 | |||||||||||||||||||||||||||
| Building Construction Products | $ | 26 | $ | — | $ | — | $ | 26 | $ | 22 | $ | 4 | $ | — | $ | — | $ | 4 | ||||||||||||||||||
| Cat Japan | 233 | 206 | 27 | — | — | — | — | — | — | |||||||||||||||||||||||||||
| Earthmoving | 43 | — | — | 43 | — | 43 | — | — | 43 | |||||||||||||||||||||||||||
| Excavation | 39 | — | — | 39 | — | 39 | — | — | 39 | |||||||||||||||||||||||||||
| Electric Power | 203 | — | — | 203 | — | 203 | — | — | 203 | |||||||||||||||||||||||||||
| Large Power Systems | 569 | — | — | 569 | — | 569 | 39 | — | 530 | |||||||||||||||||||||||||||
| Marine & Petroleum Power | 60 | — | — | 60 | — | 60 | — | — | 60 | |||||||||||||||||||||||||||
| Mining | 27 | 22 | (3 | ) | 8 | — | 8 | — | — | 8 | ||||||||||||||||||||||||||
All Other 1 | 1,061 | 49 | (3 | ) | 1,015 | 37 | 978 | 432 | (18 | ) | 564 | |||||||||||||||||||||||||
| Consolidated Total | $ | 2,261 | $ | 277 | $ | 21 | $ | 1,963 | $ | 59 | $ | 1,904 | $ | 471 | $ | (18 | ) | $ | 1,451 | |||||||||||||||||
| 1 | All Other includes operating segments included in “All Other” category (See Note 24). | |
| 2 | Other adjustments are comprised of foreign currency translation. | |
| 13. | Available-for-sale securities |
| Financial Products, primarily Cat Insurance, has investments in certain debt and equity securities at December 31, 2008, 2007 and 2006, that have been classified as available-for-sale in accordance with SFAS 115 and recorded at fair value based upon quoted market prices. These fair values are included in "Other assets" in Statement 2. Unrealized gains and losses arising from the revaluation of available-for-sale securities are included, net of applicable deferred income taxes, in equity ("Accumulated other comprehensive income" in Statement 2). Realized gains and losses on sales of investments are generally determined using the FIFO method for debt instruments and the specific identification method for equity securities. Realized gains and losses are included in "Other income (expense)" in Statement 1. |
| December 31, 2008 | ||||||||||||
| (Millions of dollars) | Cost Basis | Unrealized Pre-Tax Net Gains (Losses) | Fair Value | |||||||||
| Government debt | $ | 333 | $ | 6 | $ | 339 | ||||||
| Corporate bonds | 778 | (116 | ) | 662 | ||||||||
| Equity securities | 146 | (15 | ) | 131 | ||||||||
| $ | 1,257 | $ | (125 | ) | $ | 1,132 | ||||||
December 31, 2007 | ||||||||||||
| (Millions of dollars) | Cost Basis | Unrealized Pre-Tax Net Gains (Losses) | Fair Value | |||||||||
| Government debt | $ | 319 | $ | 1 | $ | 320 | ||||||
| Corporate bonds | 775 | (4 | ) | 771 | ||||||||
| Equity securities | 168 | 28 | 196 | |||||||||
| $ | 1,262 | $ | 25 | $ | 1,287 | |||||||
Page A-31
| December 31, 2006 | ||||||||||||
| (Millions of dollars) | Cost Basis | Unrealized Pre-Tax Net Gains (Losses) | Fair Value | |||||||||
| Government debt | $ | 355 | $ | (5 | ) | $ | 350 | |||||
| Corporate bonds | 541 | (6 | ) | 535 | ||||||||
| Equity securities | 154 | 26 | 180 | |||||||||
| $ | 1,050 | $ | 15 | $ | 1,065 | |||||||
| During 2008, we recognized a pretax charge in accordance with the application of SFAS 115 for “other-than-temporary” declines in the fair values of equity securities in the Cat Insurance investment portfolios of $37 million. This charge was accounted for as a realized loss and was included in the “Other income (expense)” in Statement 1. The cost basis of the impacted securities was adjusted to reflect this charge. During 2007 and 2006, there were no charges for "other-than-temporary" declines in the market value of securities. |
Investments in an unrealized loss position that are not other-than-temporarily impaired: | |||||||||||||||||||||||||
| December 31, 2008 | |||||||||||||||||||||||||
Less than 12 months1 | 12 months or more 1 | Total | |||||||||||||||||||||||
| (Millions of dollars) | Fair Value | Unrealized Losses | Fair Value | Unrealized Losses | Fair Value | Unrealized Losses | |||||||||||||||||||
| Government debt | $ | 7 | $ | — | $ | 19 | $ | 1 | $ | 26 | $ | 1 | |||||||||||||
| Corporate bonds | 380 | 55 | 157 | 63 | 537 | 118 | |||||||||||||||||||
| Equity securities | 67 | 15 | 5 | 2 | 72 | 17 | |||||||||||||||||||
| Total | $ | 454 | $ | 70 | $ | 181 | $ | 66 | $ | 635 | $ | 136 | |||||||||||||
| December 31, 2007 | |||||||||||||||||||||||||
Less than 12 months 1 | 12 months or more 1 | Total | |||||||||||||||||||||||
| (Millions of dollars) | Fair Value | Unrealized Losses | Fair Value | Unrealized Losses | Fair Value | Unrealized Losses | |||||||||||||||||||
| Government debt | $ | 22 | $ | — | $ | 96 | $ | 1 | $ | 118 | $ | 1 | |||||||||||||
| Corporate bonds | 269 | 4 | 163 | 4 | 432 | 8 | |||||||||||||||||||
| Equity securities | 55 | 5 | 1 | — | 56 | 5 | |||||||||||||||||||
| Total | $ | 346 | $ | 9 | $ | 260 | $ | 5 | $ | 606 | $ | 14 | |||||||||||||
| December 31, 2006 | |||||||||||||||||||||||||
Less than 12 months 1 | 12 months or more 1 | Total | |||||||||||||||||||||||
| (Millions of dollars) | Fair Value | Unrealized Losses | Fair Value | Unrealized Losses | Fair Value | Unrealized Losses | |||||||||||||||||||
| Government debt | $ | 116 | $ | — | $ | 199 | $ | 4 | $ | 315 | $ | 4 | |||||||||||||
| Corporate bonds | 198 | 1 | 233 | 5 | 431 | 6 | |||||||||||||||||||
| Equity securities | 22 | 1 | 1 | — | 23 | 1 | |||||||||||||||||||
| Total | $ | 336 | $ | 2 | $ | 433 | $ | 9 | $ | 769 | $ | 11 | |||||||||||||
| 1 | Indicates length of time that individual securities have been in a continuous unrealized loss position. | ||||||||||||||||||||||||
Government Debt. The unrealized losses on our investments in U.S. Treasury obligations, direct obligations of U.S. governmental agencies and federal agency mortgage-backed securities, are the result of an increase in the volatility in the financial markets. We intend to, and have the ability to hold our investments to fair value or maturity. We do not consider these investments to be other-than-temporarily impaired as of December 31, 2008. Corporate Bonds. The unrealized losses on our investments in corporate bonds and asset-backed securities relate primarily to an increase in credit-related yield spreads, risk aversion, and heightened volatility in the financial markets. We intend to, and have the ability to hold these investments that are less than book value until recovery to fair value or maturity. We do not consider these investments to be other-than-temporarily impaired as of December 31, 2008. |
Page A-32
Equity Securities. Cat Insurance maintains a well-diversified equity portfolio consisting of three specific mandates: large cap value stocks, small and mid cap growth stocks and international growth and income stocks. The individual securities in these portfolios support cash flow, asset allocation, surplus growth and other investment objectives. Some of these losses are attributable to the continued overall weak equity market conditions, especially those in the financial sector. In each case where unrealized losses exist, company management is taking corrective action to increase shareholder value. We currently believe it is probable that we will be able to recover all amounts due and do not consider these investments to be other-than-temporarily impaired as of December 31, 2008. The fair value of available-for-sale debt securities at December 31, 2008, by contractual maturity, is shown below. Expected maturities will differ from contractual maturities because borrowers may have the right to prepay and creditors may have the right to call obligations. |
| (Millions of dollars) | Fair Value | |||
| Due in one year or less | $ | 51 | ||
| Due after one year through five years | $ | 230 | ||
| Due after five years through ten years | $ | 195 | ||
| Due after ten years | $ | 525 | ||
| Proceeds from sales of investments in debt and equity securities during 2008, 2007 and 2006 were $357 million, $282 million and $539 million, respectively. Gross gains of $17 million, $16 million and $43 million and gross losses of $23 million, $7 million and $8 million have been included in current earnings as a result of these sales for 2008, 2007 and 2006, respectively. |
| 14. | Postemployment benefit plans |
We have both U.S. and non-U.S. pension plans covering substantially all of our U.S. employees and a portion of our non-U.S. employees, primarily in our European and Japanese facilities. Our defined benefit plans provide a benefit based on years of service and/or the employee's average earnings near retirement. Our defined contribution plans allow employees to contribute a portion of their salary to help save for retirement, and in certain cases, we provide a matching contribution. We also have defined-benefit retirement health care and life insurance plans covering substantially all of our U.S. employees. As discussed in Note 1K, we adopted the balance sheet recognition provisions of SFAS 158 at December 31, 2006, and adopted the year-end measurement date effective January 1, 2008 using the “one measurement” approach. Under the one measurement approach, net periodic benefit cost for the period between any early measurement date and the end of the fiscal year that the measurement provisions are applied is allocated proportionately between amounts to be recognized as an adjustment of Profit employed in the business and net periodic benefit cost for the fiscal year. Previously, we used a November 30th measurement date for our U.S. pension and other postretirement benefit plans and September 30th for our non-U.S. plans. Year-end asset and obligation amounts are disclosed as of the plan measurement dates. |
Page A-33
| A. | Benefit Obligations | ||||||||||||||||||||||||||||||||||||
| U.S. Pension Benefits | Non-U.S. Pension Benefits | Other Postretirement Benefits | |||||||||||||||||||||||||||||||||||
| (Millions of dollars) | 2008 | 2007 | 2006 | 2008 | 2007 | 2006 | 2008 | 2007 | 2006 | ||||||||||||||||||||||||||||
| Change in benefit obligation: | |||||||||||||||||||||||||||||||||||||
| Benefit obligation, beginning of year | $ | 11,132 | $ | 11,174 | $ | 10,679 | $ | 3,012 | $ | 2,719 | $ | 2,361 | $ | 5,455 | $ | 5,661 | $ | 5,818 | |||||||||||||||||||
Effect of eliminating early measurement date 1 | 11 | N/A | N/A | 26 | N/A | N/A | — | N/A | N/A | ||||||||||||||||||||||||||||
| Service cost | 199 | 187 | 160 | 92 | 80 | 67 | 87 | 101 | 95 | ||||||||||||||||||||||||||||
| Interest cost | 629 | 595 | 575 | 156 | 139 | 111 | 307 | 295 | 302 | ||||||||||||||||||||||||||||
| Plan amendments | 13 | — | 4 | — | 1 | (18 | ) | — | 2 | — | |||||||||||||||||||||||||||
| Actuarial losses (gains) | 222 | (146 | ) | 447 | (18 | ) | (118 | ) | 110 | (522 | ) | (294 | ) | (224 | ) | ||||||||||||||||||||||
| Foreign currency exchange rates | — | — | — | (534 | ) | 246 | 121 | (19 | ) | 4 | 1 | ||||||||||||||||||||||||||
| Participant contributions | — | — | — | 14 | 14 | 11 | 41 | 35 | 29 | ||||||||||||||||||||||||||||
| Benefits paid - gross | (713 | ) | (722 | ) | (699 | ) | (155 | ) | (126 | ) | (103 | ) | (351 | ) | (369 | ) | (369 | ) | |||||||||||||||||||
| Less federal subsidy on benefits paid | — | — | — | — | — | — | 19 | 15 | 9 | ||||||||||||||||||||||||||||
Acquisitions / other 2 | — | — | 8 | 626 | 57 | 59 | — | 5 | — | ||||||||||||||||||||||||||||
Adjustment for subsidiary pension plan 3 | — | 44 | — | — | — | — | — | — | — | ||||||||||||||||||||||||||||
| Benefit obligation, end of year | $ | 11,493 | $ | 11,132 | $ | 11,174 | $ | 3,219 | $ | 3,012 | $ | 2,719 | $ | 5,017 | $ | 5,455 | $ | 5,661 | |||||||||||||||||||
| Accumulated benefit obligation, end of year | $ | 10,681 | $ | 10,460 | $ | 10,587 | $ | 2,938 | $ | 2,629 | $ | 2,333 | |||||||||||||||||||||||||
Weighted-average assumptions used to determine benefit obligation: | |||||||||||||||||||||||||||||||||||||
Discount rate 4 | 6.1 | % | 5.8 | % | 5.5 | % | 4.1 | % | 5.3 | % | 4.7 | % | 6.0 | % | 5.8 | % | 5.5 | % | |||||||||||||||||||
Rate of compensation increase 4 | 4.5 | % | 4.5 | % | 4.0 | % | 4.1 | % | 4.1 | % | 4.0 | % | 4.4 | % | 4.4 | % | 4.0 | % | |||||||||||||||||||
| 1 | Change in benefit obligation during the period from the early measurement date to December 31, 2007. | ||||||||||||||||||||||||||||||||||||
| 2 | See Note 25 regarding the 2008 Cat Japan share redemption. | ||||||||||||||||||||||||||||||||||||
| 3 | 2007 charge to recognize previously unrecorded liabilities related to a subsidiary pension plan. | ||||||||||||||||||||||||||||||||||||
| 4 | End of year rates are used to determine net periodic cost for the subsequent year. See Note 14E. | ||||||||||||||||||||||||||||||||||||
| Assumed health care cost trend rates have a significant effect on the amounts reported for the health care plans. A one-percentage-point change in assumed health care cost trend rates would have the following effects: |
| (Millions of dollars) | One-percentage- point increase | One-percentage- point decrease | ||||||
| Effect on 2008 service and interest cost components of other postretirement benefit cost | $ | 32 | $ | (28 | ) | |||
| Effect on accumulated postretirement benefit obligation | $ | 350 | $ | (309 | ) | |||
| B. | Plan Assets | ||||||||||||||||||||||||||||||||||||
| U.S. Pension Benefits | Non-U.S. Pension Benefits | Other Postretirement Benefits | |||||||||||||||||||||||||||||||||||
| (Millions of dollars) | 2008 | 2007 | 2006 | 2008 | 2007 | 2006 | 2008 | 2007 | 2006 | ||||||||||||||||||||||||||||
| Change in plan assets: | |||||||||||||||||||||||||||||||||||||
| Fair value of plan assets, beginning of year | $ | 10,441 | $ | 10,087 | $ | 9,441 | $ | 2,773 | $ | 2,304 | $ | 2,024 | $ | 1,584 | $ | 1,509 | $ | 1,311 | |||||||||||||||||||
Effect of eliminating early measurement date 1 | 17 | N/A | N/A | 23 | N/A | N/A | 15 | N/A | N/A | ||||||||||||||||||||||||||||
| Actual return on plan assets | (3,288 | ) | 1,064 | 1,329 | (751 | ) | 290 | 238 | (587 | ) | 158 | 207 | |||||||||||||||||||||||||
| Foreign currency exchange rates | — | — | — | (407 | ) | 208 | 100 | — | — | — | |||||||||||||||||||||||||||
| Company contributions | 288 | 12 | 9 | 134 | 46 | 34 | 340 | 251 | 331 | ||||||||||||||||||||||||||||
| Participant contributions | — | — | — | 14 | 14 | 11 | 41 | 35 | 29 | ||||||||||||||||||||||||||||
| Benefits paid | (713 | ) | (722 | ) | (699 | ) | (155 | ) | (126 | ) | (103 | ) | (351 | ) | (369 | ) | (369 | ) | |||||||||||||||||||
Acquisitions / other 2 | — | — | 7 | 544 | 37 | — | — | — | — | ||||||||||||||||||||||||||||
| Fair value of plan assets, end of year | $ | 6,745 | $ | 10,441 | $ | 10,087 | $ | 2,175 | $ | 2,773 | $ | 2,304 | $ | 1,042 | $ | 1,584 | $ | 1,509 | |||||||||||||||||||
| 1 | Change in plan assets during the period from the early measurement date to December 31, 2007. | ||||||||||||||||||||||||||||||||||||
| 2 | See Note 25 regarding the 2008 Cat Japan share redemption. | ||||||||||||||||||||||||||||||||||||
| The asset allocation for our pension and other postretirement benefit plans at the end of 2008, 2007 and 2006, and the target allocation for 2009, by asset category, are as follows: |
Page A-34
Target Allocation | Percentage of Plan Assets at Year-end | ||||||||||||||||
| 2009 | 2008 | 2007 | 2006 | ||||||||||||||
| U.S. pension: | |||||||||||||||||
| Equity securities | 70 | % | 70 | % | 70 | % | 74 | % | |||||||||
| Debt securities | 25 | % | 30 | % | 27 | % | 26 | % | |||||||||
| Real estate | 5 | % | — | — | — | ||||||||||||
| Cash | — | — | 3 | % | — | ||||||||||||
| Total | 100 | % | 100 | % | 100 | % | 100 | % | |||||||||
| Non-U.S. pension: | |||||||||||||||||
| Equity securities | 54 | % | 50 | % | 60 | % | 59 | % | |||||||||
| Debt securities | 37 | % | 41 | % | 30 | % | 30 | % | |||||||||
| Real estate | 6 | % | 6 | % | 7 | % | 8 | % | |||||||||
| Other | 3 | % | 3 | % | 3 | % | 3 | % | |||||||||
| Total | 100 | % | 100 | % | 100 | % | 100 | % | |||||||||
| Other postretirement benefits: | |||||||||||||||||
| Equity securities | 80 | % | 78 | % | 81 | % | 84 | % | |||||||||
| Debt securities | 20 | % | 22 | % | 19 | % | 15 | % | |||||||||
| Cash | — | — | — | 1 | % | ||||||||||||
| Total | 100 | % | 100 | % | 100 | % | 100 | % | |||||||||
Our target asset allocations reflect our investment strategy of maximizing the long-term rate of return on plan assets and the resulting funded status, within an appropriate level of risk. The U.S. plans are rebalanced to plus or minus five percentage points of the target asset allocation ranges on a monthly basis. The frequency of rebalancing for the non-U.S. plans varies depending on the plan. The use of certain derivative instruments is permitted where appropriate and necessary for achieving overall investment policy objectives. The U.S. plans currently utilize futures contracts to offset current equity positions in order to rebalance the total portfolio to the target asset allocation. During 2008, approximately 5% of the U.S. pension plans’ assets were rebalanced from equity to fixed income positions through the use of futures contracts as compared to approximately 10% in 2007 and 2006. The actual asset allocation percentages above represent this rebalancing effort. The plans do not engage in futures contracts for speculative purposes. Equity securities within plan assets include Caterpillar Inc. common stock in the amounts of: |
| (Millions of dollars) | U.S. Pension Benefits1 | Non-U.S. Pension Benefits | Other Postretirement Benefits | |||||||||||||||||||||||||||||||||
| 2008 | 2007 | 2006 | 2008 | 2007 | 2006 | 2008 | 2007 | 2006 | ||||||||||||||||||||||||||||
| Caterpillar Inc. common stock | $ | 11 | $ | 24 | $ | 197 | $ | 1 | $ | 2 | $ | 2 | $ | 2 | $ | 3 | $ | 2 | ||||||||||||||||||
| 1 | Amounts represent less than 1% of total plan assets for 2008 and 2007, and 2% for 2006. |
Page A-35
| C. | Funded status | ||||||||||||||||||||||||||||||||||||
The funded status of the plans, reconciled to the amount reported on the Consolidated Financial Position, is as follows: | |||||||||||||||||||||||||||||||||||||
| (Millions of dollars) | U.S. Pension Benefits | Non-U.S. Pension Benefits | Other Postretirement Benefits | ||||||||||||||||||||||||||||||||||
| 2008 | 2007 | 2006 | 2008 | 2007 | 2006 | 2008 | 2007 | 2006 | |||||||||||||||||||||||||||||
| End of Year | |||||||||||||||||||||||||||||||||||||
| Fair value of plan assets | $ | 6,745 | $ | 10,441 | $ | 10,087 | $ | 2,175 | $ | 2,773 | $ | 2,304 | $ | 1,042 | $ | 1,584 | $ | 1,509 | |||||||||||||||||||
| Benefit obligations | 11,493 | 11,132 | 11,174 | 3,219 | 3,012 | 2,719 | 5,017 | 5,455 | 5,661 | ||||||||||||||||||||||||||||
| Over (under) funded status | (4,748 | ) | (691 | ) | (1,087 | ) | (1,044 | ) | (239 | ) | (415 | ) | (3,975 | ) | (3,871 | ) | (4,152 | ) | |||||||||||||||||||
| Amounts not yet recognized: | |||||||||||||||||||||||||||||||||||||
| Contributions made after measurement date | N/A | 1 | 2 | N/A | 3 | 2 | N/A | 37 | 20 | ||||||||||||||||||||||||||||
| Net amount recognized in financial position | $ | (4,748 | ) | $ | (690 | ) | $ | (1,085 | ) | $ | (1,044 | ) | $ | (236 | ) | $ | (413 | ) | $ | (3,975 | ) | $ | (3,834 | ) | $ | (4,132 | ) | ||||||||||
| Components of net amount recognized in financial position: | |||||||||||||||||||||||||||||||||||||
| Accrued wages, salaries and employee benefits (current liability) | $ | (14 | ) | $ | (2 | ) | $ | (9 | ) | $ | (2 | ) | $ | — | $ | (2 | ) | $ | (29 | ) | $ | (14 | ) | $ | (13 | ) | |||||||||||
| Liability for postemployment benefits (non-current liability) | (4,734 | ) | (688 | ) | (1,076 | ) | (1,042 | ) | (236 | ) | (411 | ) | (3,946 | ) | (3,820 | ) | (4,119 | ) | |||||||||||||||||||
| Net liability recognized | $ | (4,748 | ) | $ | (690 | ) | $ | (1,085 | ) | $ | (1,044 | ) | $ | (236 | ) | $ | (413 | ) | $ | (3,975 | ) | $ | (3,834 | ) | $ | (4,132 | ) | ||||||||||
| Amounts recognized in accumulated other comprehensive income (pre-tax) consist of: | |||||||||||||||||||||||||||||||||||||
| Net actuarial loss (gain) | $ | 6,419 | $ | 2,172 | $ | 2,754 | $ | 1,319 | $ | 544 | $ | 742 | $ | 881 | $ | 759 | $ | 1,159 | |||||||||||||||||||
| Prior service cost (credit) | 170 | 191 | 249 | 13 | 22 | 16 | 320 | 282 | 244 | ||||||||||||||||||||||||||||
| Transition obligation (asset) | — | — | — | — | 1 | 1 | 10 | 12 | 13 | ||||||||||||||||||||||||||||
| Total | $ | 6,589 | $ | 2,363 | $ | 3,003 | $ | 1,332 | $ | 567 | $ | 759 | $ | 1,211 | $ | 1,053 | $ | 1,416 | |||||||||||||||||||
| N/A (Not Applicable): The adoption of the year-end measurement date provisions of SFAS 158 (see Note 1K) eliminated contributions between the measurement date and the end of the fiscal year. | |||||||||||||||||||||||||||||||||||||
| The estimated amounts that will be amortized from “Accumulated other comprehensive income" at December 31, 2008 into net periodic benefit cost (pre-tax) in 2009 are as follows: |
| (Millions of dollars) | U.S. Pension | Non-U.S. Pension | Other Postretirement Benefits | |||||||||
| Actuarial (gain) loss | $ | 245 | $ | 51 | $ | 25 | ||||||
| Prior service (credit) cost | 30 | 1 | 2 | |||||||||
| Transition (asset) obligation | — | — | 2 | |||||||||
| Total | $ | 275 | $ | 52 | $ | 29 | ||||||
| The following amounts relate to our pension plans with projected benefit obligations in excess of plan assets: |
| U.S. Pension Benefits | Non-U.S. Pension Benefits | |||||||||||||||||||||||
| at Year-end | at Year-end | |||||||||||||||||||||||
| (Millions of dollars) | 2008 | 2007 | 2006 | 2008 | 2007 | 2006 | ||||||||||||||||||
| Projected benefit obligation | $ | (11,493 | ) | $ | (10,862 | ) | $ | (11,174 | ) | $ | (3,194 | ) | $ | (2,792 | ) | $ | (2,719 | ) | ||||||
| Accumulated benefit obligation | $ | (10,681 | ) | $ | (10,197 | ) | $ | (10,587 | ) | $ | (2,917 | ) | $ | (2,442 | ) | $ | (2,333 | ) | ||||||
| Fair value of plan assets | $ | 6,745 | $ | 10,159 | $ | 10,087 | $ | 2,151 | $ | 2,548 | $ | 2,304 | ||||||||||||
Page A-36
| The following amounts relate to our pension plans with accumulated benefit obligations in excess of plan assets: | ||||||||||||||||||||||||
| U.S. Pension Benefits | Non-U.S. Pension Benefits | |||||||||||||||||||||||
| at Year-end | at Year-end | |||||||||||||||||||||||
| (Millions of dollars) | 2008 | 2007 | 2006 | 2008 | 2007 | 2006 | ||||||||||||||||||
| Projected benefit obligation | $ | (11,493 | ) | $ | (3,982 | ) | $ | (4,491 | ) | $ | (3,040 | ) | $ | (146 | ) | $ | (121 | ) | ||||||
| Accumulated benefit obligation | $ | (10,681 | ) | $ | (3,967 | ) | $ | (4,460 | ) | $ | (2,796 | ) | $ | (128 | ) | $ | (106 | ) | ||||||
| Fair value of plan assets | $ | 6,745 | $ | 3,580 | $ | 3,805 | $ | 2,022 | $ | 28 | $ | 19 | ||||||||||||
| The accumulated postretirement benefit obligation exceeds plan assets for all of our other postretirement benefit plans. |
| D. | Expected cash flow | ||||||||||||
| Information about the expected cash flow for the pension and other postretirement benefit plans is as follows: | |||||||||||||
(Millions of dollars) | U.S. Pension Benefits | Non-U.S. Pension Benefits | Other Postretirement Benefits | ||||||||||
| Employer contributions: | |||||||||||||
| 2009 (expected) | $ | 800 | $ | 200 | $ | 370 | |||||||
| Expected benefit payments: | |||||||||||||
| 2009 | $ | 740 | $ | 160 | $ | 380 | |||||||
| 2010 | 760 | 160 | 400 | ||||||||||
| 2011 | 780 | 170 | 410 | ||||||||||
| 2012 | 800 | 160 | 430 | ||||||||||
| 2013 | 820 | 160 | 440 | ||||||||||
| 2014-2018 | 4,300 | 810 | 2,350 | ||||||||||
| Total | $ | 8,200 | $ | 1,620 | $ | 4,410 | |||||||
| The above table reflects the total employer contributions and benefits expected to be paid from the plan or from company assets and does not include the participants' share of the cost. The expected benefit payments for our other postretirement benefits include payments for prescription drug benefits. Medicare Part D subsidy amounts expected to be received by the company which will offset other postretirement benefit payments are as follows: |
| (Millions of dollars) | 2009 | 2010 | 2011 | 2012 | 2013 | 2014-2018 | Total | |||||||||||||||||||||
| Other postretirement benefits | $ | 30 | $ | 30 | $ | 30 | $ | 30 | $ | 40 | $ | 210 | $ | 370 | ||||||||||||||
Page A-37
| E. | Net periodic cost | |||||||||||||||||||||||||||||||||||||
| (Millions of dollars) | U.S. Pension Benefits | Non-U.S. Pension Benefits | Other Postretirement Benefits | |||||||||||||||||||||||||||||||||||
| 2008 | 2007 | 2006 | 2008 | 2007 | 2006 | 2008 | 2007 | 2006 | ||||||||||||||||||||||||||||||
| Components of net periodic benefit cost: | ||||||||||||||||||||||||||||||||||||||
| Service cost | $ | 199 | $ | 187 | $ | 160 | $ | 92 | $ | 80 | $ | 67 | $ | 87 | $ | 101 | $ | 95 | ||||||||||||||||||||
| Interest cost | 629 | 595 | 575 | 156 | 139 | 111 | 307 | 295 | 302 | |||||||||||||||||||||||||||||
| Expected return on plan assets | (882 | ) | (841 | ) | (798 | ) | (201 | ) | (178 | ) | (142 | ) | (138 | ) | (130 | ) | (116 | ) | ||||||||||||||||||||
| Termination benefits | — | — | — | 1 | 1 | 1 | — | — | — | |||||||||||||||||||||||||||||
| Amortization of: | ||||||||||||||||||||||||||||||||||||||
| Net asset existing at adoption of SFAS 87/106 | — | — | — | 1 | 1 | 1 | 2 | 2 | 2 | |||||||||||||||||||||||||||||
Prior service cost/(credit) 1 | 32 | 58 | 58 | 3 | 5 | 5 | (35 | ) | (36 | ) | (33 | ) | ||||||||||||||||||||||||||
| Net actuarial loss | 134 | 214 | 232 | 36 | 56 | 56 | 64 | 79 | 113 | |||||||||||||||||||||||||||||
Adjustment for subsidiary pension plan 2 | — | 44 | — | — | — | — | — | — | — | |||||||||||||||||||||||||||||
| Total cost included in operating profit | $ | 112 | $ | 257 | $ | 227 | $ | 88 | $ | 104 | $ | 99 | $ | 287 | $ | 311 | $ | 363 | ||||||||||||||||||||
| Other changes in plan assets and benefit obligations recognized in other comprehensive income (pre-tax) | ||||||||||||||||||||||||||||||||||||||
Effect of eliminating early measurement date 3 | $ | (14 | ) | N/A | N/A | $ | (9 | ) | N/A | N/A | $ | (3 | ) | N/A | N/A | |||||||||||||||||||||||
| Current year actuarial (gain)/loss | 4,401 | (368 | ) | N/A | 696 | (131 | ) | N/A | 172 | (320 | ) | N/A | ||||||||||||||||||||||||||
| Amortization of actuarial gain/(loss) | (134 | ) | (214 | ) | N/A | (36 | ) | (56 | ) | N/A | (64 | ) | (79 | ) | N/A | |||||||||||||||||||||||
| Current year prior service cost | 16 | — | N/A | 1 | 1 | N/A | (3 | ) | 2 | N/A | ||||||||||||||||||||||||||||
| Amortization of prior service (cost)/credit | (32 | ) | (58 | ) | N/A | (3 | ) | (5 | ) | N/A | 35 | 36 | N/A | |||||||||||||||||||||||||
| Amortization of transition asset/(obligation) | — | — | N/A | (1 | ) | (1 | ) | N/A | (2 | ) | (2 | ) | N/A | |||||||||||||||||||||||||
| Total recognized in other comprehensive income | 4,237 | (640 | ) | N/A | 648 | (192 | ) | N/A | 135 | (363 | ) | N/A | ||||||||||||||||||||||||||
| Total recognized in net periodic cost and other comprehensive income | $ | 4,349 | $ | (383 | ) | N/A | $ | 736 | $ | (88 | ) | N/A | $ | 422 | $ | (52 | ) | N/A | ||||||||||||||||||||
Weighted-average assumptions used to determine net cost: | ||||||||||||||||||||||||||||||||||||||
| Discount rate | 5.8 | % | 5.5 | % | 5.6 | % | 5.3 | % | 4.7 | % | 4.6 | % | 5.8 | % | 5.5 | % | 5.6 | % | ||||||||||||||||||||
Expected return on plan assets 4 | 9.0 | % | 9.0 | % | 9.0 | % | 7.6 | % | 7.7 | % | 7.5 | % | 9.0 | % | 9.0 | % | 9.0 | % | ||||||||||||||||||||
| Rate of compensation increase | 4.5 | % | 4.0 | % | 4.0 | % | 4.0 | % | 4.0 | % | 3.5 | % | 4.4 | % | 4.0 | % | 4.0 | % | ||||||||||||||||||||
| 1 | Prior service costs for both pension and other postretirement benefits are generally amortized using the straight-line method over the average remaining service period to the full retirement eligibility date of employees expected to receive benefits from the plan amendment. For other postretirement benefit plans in which all or almost all of the plan's participants are fully eligible for benefits under the plan, prior service costs are amortized using the straight-line method over the remaining life expectancy of those participants. | |||||||||||||||||||||||||||||||||||||
| 2 | 2007 charge to recognize previously unrecorded liabilities related to a subsidiary pension plan. | |||||||||||||||||||||||||||||||||||||
| 3 | Amortization during the period from the early measurement date to December 31, 2007. | |||||||||||||||||||||||||||||||||||||
| 4 | The weighted-average rates for 2009 are 8.5% and 6.6% for U.S. and non-U.S. plans, respectively. | |||||||||||||||||||||||||||||||||||||
The assumed discount rate is used to discount future benefit obligations back to today's dollars. For 2008, the U.S. discount rate was based on a benefit cash flow-matching approach and represents the rate at which our benefit obligations could effectively be settled as of our measurement date, December 31. The benefit cash flow-matching approach involves analyzing Caterpillar's projected cash flows against a high quality bond yield curve, calculated using a wide population of corporate Aa bonds available on the measurement date. The very highest and lowest yielding bonds (top and bottom 10%) are excluded from the analysis. Previously, we used the Moody's Aa bond yield as of our measurement date, November 30, and validated the discount rate using the benefit cash flow-matching approach. A similar change was made in determining the assumed discount rate for our most significant non-U.S. plans. This rate is sensitive to changes in interest rates. A decrease in the discount rate would increase our obligation and future expense. Our U.S. expected long-term rate of return on plan assets is based on our estimate of long-term passive returns for equities and fixed income securities weighted by the allocation of our pension assets. Based on historical performance, we increase the passive returns due to our active management of the plan assets. To arrive at our expected long-term return, the amount added for active management was 1% for 2008, 2007 and 2006. A similar process is used to determine this rate for our non-U.S. plans. |
Page A-38
The assumed health care trend rate represents the rate at which health care costs are assumed to increase. To calculate the 2008 benefit expense, we assumed an increase of 7.9% for 2008. We expect an increase of 7.4% during 2009. The 2008 and 2009 rates are assumed to decrease gradually to the ultimate health care trend rate of 5.0% in 2016. This rate represents 3.0% general inflation plus 2.0% additional health care inflation. We determined that most of our U.S. retiree health care plans are at least actuarially equivalent to Medicare Part D and will qualify for the federal subsidy. |
| F. | Other postemployment benefit plans |
| We offer long-term disability benefits, continued health care for disabled employees, survivor income benefit insurance and supplemental unemployment benefits to substantially all eligible U.S. employees. |
| G. | Defined contribution plans |
We have both U.S. and non-U.S. employee defined contribution plans to help employees save for retirement. Our U.S. 401(k) plan allows eligible employees to contribute a portion of their salary to the plan on a tax-deferred basis, and we provide a matching contribution equal to 100% of employee contributions to the plan up to 6% of their compensation. Various other U.S. and non-U.S. defined contribution plans allow eligible employees to contribute a portion of their salary to the plans, and in some cases, we provide a matching contribution to the funds. Total company costs related to U.S. and non-U.S. defined contribution plans were as follows: |
| (Millions of dollars) | 2008 | 2007 | 2006 | |||||||||
| U.S. plans | $ | 107 | $ | 172 | $ | 157 | ||||||
| Non-U.S. plans | 34 | 30 | 23 | |||||||||
| $ | 141 | $ | 202 | $ | 180 | |||||||
| H. | Summary of long-term liability: | ||||||||||||
| December 31, | |||||||||||||
| (Millions of dollars) | 2008 | 2007 | 2006 | ||||||||||
| Pensions: | |||||||||||||
| U.S. pensions | $ | 4,734 | $ | 688 | $ | 1,076 | |||||||
| Non-U.S. pensions | 1,042 | 236 | 411 | ||||||||||
| Total pensions | 5,776 | 924 | 1,487 | ||||||||||
| Postretirement benefits other than pensions | 3,946 | 3,820 | 4,119 | ||||||||||
| Other postemployment benefits | 73 | 72 | 73 | ||||||||||
| Defined contribution | 180 | 243 | 200 | ||||||||||
| $ | 9,975 | $ | 5,059 | $ | 5,879 | ||||||||
| 15. | Short-term borrowings |
| December 31, | ||||||||||||||
| (Millions of dollars) | 2008 | 2007 | 2006 | |||||||||||
| Machinery and Engines: | ||||||||||||||
| Notes payable to banks | $ | 668 | 1 | $ | 187 | $ | 77 | |||||||
| Commercial paper | 964 | — | 88 | |||||||||||
| 1,632 | 187 | 165 | ||||||||||||
| Financial Products: | ||||||||||||||
| Notes payable to banks | 817 | 550 | 251 | |||||||||||
| Commercial paper | 4,217 | 4,032 | 4,149 | |||||||||||
| Demand notes | 543 | 699 | 590 | |||||||||||
| 5,577 | 5,281 | 4,990 | ||||||||||||
| Total short-term borrowings | $ | 7,209 | $ | 5,468 | $ | 5,155 | ||||||||
| 1 | Increase in 2008 due to the consolidation of Cat Japan. See Note 25 for additional details. | |||||||||||||
Page A-39
| The weighted-average interest rates on short-term borrowings outstanding were: |
| December 31, | ||||||||||||
| 2008 | 2007 | 2006 | ||||||||||
| Notes payable to banks | 5.5 | % | 7.0 | % | 6.2 | % | ||||||
| Commercial paper | 2.0 | % | 4.3 | % | 4.5 | % | ||||||
| Demand notes | 3.6 | % | 5.1 | % | 5.4 | % | ||||||
| Please refer to Note 19 and Table IV for fair value information on short-term borrowings. |
| 16. | Long-term debt |
| December 31, | |||||||||||||
| (Millions of dollars) | 2008 | 2007 | 2006 | ||||||||||
| Machinery and Engines: | |||||||||||||
| Notes—6.550% due 2011 | $ | 250 | $ | 250 | $ | 250 | |||||||
| Notes—5.700% due 2016 | 517 | 510 | 500 | ||||||||||
| Debentures—7.250% due 2009 | — | 305 | 307 | ||||||||||
| Debentures—9.375% due 2011 | 123 | 123 | 123 | ||||||||||
| Debentures—7.000% due 2013 | 350 | — | — | ||||||||||
| Debentures—7.900% due 2018 | 898 | — | — | ||||||||||
| Debentures—9.375% due 2021 | 120 | 120 | 120 | ||||||||||
| Debentures—8.000% due 2023 | 82 | 82 | 82 | ||||||||||
| Debentures—6.625% due 2028 | 299 | 299 | 299 | ||||||||||
| Debentures—7.300% due 2031 | 349 | 348 | 348 | ||||||||||
| Debentures—5.300% due 2035 | 203 | 202 | 201 | ||||||||||
| Debentures—6.050% due 2036 | 748 | 748 | 747 | ||||||||||
| Debentures—8.250% due 2038 | 248 | — | — | ||||||||||
| Debentures—6.950% due 2042 | 249 | 249 | 249 | ||||||||||
| Debentures—7.375% due 2097 | 297 | 297 | 297 | ||||||||||
| Capital lease obligations | 293 | 68 | 72 | ||||||||||
| Other | 710 | 1 | 38 | 99 | |||||||||
| Total Machinery and Engines | 5,736 | 3,639 | 3,694 | ||||||||||
| Financial Products: | |||||||||||||
| Commercial paper | 1,500 | 903 | 408 | ||||||||||
| Medium-term notes | 15,073 | 12,678 | 12,857 | ||||||||||
| Deposit obligations | — | 232 | 232 | ||||||||||
| Other | 525 | 377 | 489 | ||||||||||
| Total Financial Products | 17,098 | 14,190 | 13,986 | ||||||||||
| Total long-term debt due after one year | $ | 22,834 | $ | 17,829 | $ | 17,680 | |||||||
| 1 | Increase in 2008 due to consolidation of Cat Japan. See Note 25 for additional details. | ||||||||||||
All outstanding notes and debentures are unsecured. The deposit obligations have a corresponding security deposit that relates to a finance arrangement, which provides us a return. This finance arrangement requires that we commit to certain long-term obligations and provide a security deposit, which will fulfill these obligations when they become due. In 2006 and 2007, the security deposit associated with the outstanding deposit obligations for Financial Products was included in "Other assets" in Statement 2. In 2008, this security deposit was included in “Prepaid expenses and other current assets” and the deposit obligations were included in short-term borrowings. On December 3, 2008, Caterpillar Inc. issued $350 million of 7.00% debentures due in 2013, $900 million of 7.90% debentures due in 2018 and $250 million of 8.25% debentures due in 2038. On August 8, 2006, Caterpillar Inc. issued $500 million of 5.70% notes due in 2016 and $750 million of 6.05% debentures due in 2036. |
Page A-40
On September 13, 2005, $116 million of 9.375% debentures due in 2021 and $117 million of 8.00% debentures due in 2023 were exchanged for $307 million of 5.30% debentures due in 2035 and $23 million of cash. At December 31, 2008, the book value of the 5.30% debentures due in 2035 was $203 million with an effective yield to maturity of 8.55%. We may redeem the 6.55% and 5.70% notes and the 7.25%, 6.625%, 7.30%, 5.30%, 6.05%, 6.95% and 7.375% debentures in whole or in part at our option at any time at a redemption price equal to the greater of 100% of the principal amount of the debentures to be redeemed or the sum of the present value of the remaining scheduled payments. The terms of other notes and debentures do not specify a redemption option prior to maturity. Based on Cat Financial’s medium-term note issuances subsequent to year-end, $1,500 million, $903 million and $408 million of Financial Products’ commercial paper outstanding at December 31, 2008, 2007 and 2006, respectively, was classified as long-term debt due after one year. Medium-term notes are offered by prospectus and are issued through agents at fixed and floating rates. These notes have a weighted average interest rate of 4.2% with remaining maturities up to 20 years at December 31, 2008. The aggregate amounts of maturities of long-term debt during each of the years 2009 through 2013, including amounts due within one year and classified as current, are: |
| December 31, | ||||||||||||||||||||
| (Millions of dollars) | 2009 | 2010 | 2011 | 2012 | 2013 | |||||||||||||||
| Machinery and Engines | $ | 456 | $ | 276 | $ | 626 | $ | 202 | $ | 528 | ||||||||||
| Financial Products | 5,036 | 4,734 | 2,326 | 1,562 | 1,800 | |||||||||||||||
| $ | 5,492 | $ | 5,010 | $ | 2,952 | $ | 1,764 | $ | 2,328 | |||||||||||
The above table includes $2,182 million of medium-term notes that can be called at par. Interest paid on short-term and long-term borrowings for 2008, 2007 and 2006 was $1,451 million, $1,418 million and $1,256 million, respectively. Please refer to Note 19 and Table IV for fair value information on long-term debt. |
| 17. | Credit commitments |
| December 31, 2008 | |||||||||||||
| (Millions of dollars) | Consolidated | Machinery and Engines | Financial Products | ||||||||||
| Credit lines available: | |||||||||||||
| Global credit facilities | $ | 6,853 | $ | 1,000 | $ | 5,853 | |||||||
| Other external | 4,475 | 1,453 | 3,022 | ||||||||||
| Total credit lines available | 11,328 | 2,453 | 8,875 | ||||||||||
| Less: Global credit facilities supporting commercial paper | (6,681 | ) | (964 | ) | (5,717 | ) | |||||||
| Less: Utilized credit | (1,977 | ) | (406 | ) | (1,571 | ) | |||||||
| Available credit | $ | 2,670 | $ | 1,083 | $ | 1,587 | |||||||
We have three global credit facilities with a syndicate of banks totaling $6.85 billion (Credit Facility) available in the aggregate to both Machinery and Engines and Financial Products to support commercial paper programs in the event the programs become unavailable to us. During 2008, based on management’s allocation decision, which can be revised at any time, the portion of the credit facility allocated to Cat Financial was increased from $5.55 billion to $5.85 billion. The five-year facility of $1.62 billion expires in September 2012. The five-year facility of $2.98 billion expires in September 2011. The 364-day facility was increased from $1.95 billion to $2.25 billion and will expire in September 2009. As part of the 2008 global credit facilities renewal, Cat Financial’s year-end and six-month moving average leverage covenants were increased from 8.5:1 to 10:1. In 2008, Cat Financial entered into a new 364-day facility of $300 million with a syndicate of banks, which expires in July 2009. The overall increase in the credit facilities was to support Cat Financial’s portfolio growth. At December 31, 2008, there were no borrowings under these lines. Consolidated credit lines with banks as of December 31, 2008 total $4.48 billion. These credit lines, which are eligible for renewal at various future dates or have no specified expiration date, are used primarily by our subsidiaries for local funding requirements. Caterpillar Inc. or Cat Financial generally guarantees subsidiary borrowings under these lines. |
Page A-41
At December 31, 2008, Caterpillar’s annual consolidated net worth dropped below the level stipulated in the Credit Facility. This covenant requires Caterpillar to maintain a consolidated net worth of not less than 75% of the consolidated net worth as of the end of its immediately preceding fiscal year. The decrease was largely driven by a significant decline in pension asset returns, resulting in a $3.4 billion year-end charge to other comprehensive income. In addition, at December 31, 2008, Cat Financial’s quarterly interest coverage ratio for the fourth quarter dropped below the level stipulated in the Credit Facility. This covenant requires Cat Financial to maintain a ratio of (1) earnings before interest expense and income taxes to (2) interest expense of not less than 1.15 to 1 for each fiscal quarter. The ratio was negatively impacted in the fourth quarter of 2008 by, among other things, deteriorating economic conditions. This, in addition to Caterpillar’s drop in consolidated net worth, also resulted in Cat Financial falling below or failing to meet similar covenant requirements in other loan agreements. The associated bank group under the Credit Facility has consented to Caterpillar’s lower annual consolidated net worth of $6.087 billion as of December 31, 2008, and to Cat Financial’s lower quarterly interest coverage ratio of 0.97 as of December 31, 2008. The bank group also agreed that any failure to comply with consolidated net worth and interest coverage ratio requirements would not constitute an actual or potential event of default under the Credit Facility. In consideration of these agreements, the upper range of interest rate applicable to certain amounts that may be drawn by us under the Credit Facility was increased by approximately 1.00 to 1.50 percentage points. The lenders under Cat Financial’s other loan agreements also have agreed that Caterpillar and Cat Financial will not be required to comply with the covenant ratios for the fourth quarter 2008. In consideration of those agreements, the upper range of interest rate applicable to certain amounts that may be drawn by us under those loan agreements were increased by approximately 1.00 percentage point. As noted above, the actions by the bank group and other lenders only apply to the fourth quarter of 2008. In the event Caterpillar or Cat Financial does not meet one or more of their respective financial covenants under the Credit Facility in the future (and are unable to obtain a consent or waiver), the bank group may terminate the commitments allocated to the non-compliant party or the commitments could be, depending on the circumstances, reallocated among Caterpillar and/or Cat Financial. Additionally, in such event, certain of Cat Financial’s other lenders under other loan agreements where such financial covenants are applicable may, at their election, choose to pursue remedies under such loan agreements, including accelerating outstanding borrowings. At December 31, 2008, there were no borrowings under the Credit Facility. |
| 18. | Profit per share |
| Computations of profit per share: | |||||||||||||
| (Dollars in millions except per share data) | 2008 | 2007 | 2006 | ||||||||||
Profit for the period (A) 1 | $ | 3,557 | $ | 3,541 | $ | 3,537 | |||||||
| Determination of shares (in millions): | |||||||||||||
| Weighted average number of common shares outstanding (B) | 610.5 | 638.2 | 658.7 | ||||||||||
| Shares issuable on exercise of stock awards, net of shares assumed to be purchased out of proceeds at average market price | 17.4 | 21.3 | 25.1 | ||||||||||
| Average common shares outstanding for fully diluted computation (C) | 627.9 | 659.5 | 683.8 | ||||||||||
| Profit per share of common stock: | |||||||||||||
| Assuming no dilution (A/B) | $ | 5.83 | $ | 5.55 | $ | 5.37 | |||||||
| Assuming full dilution (A/C) | $ | 5.66 | $ | 5.37 | $ | 5.17 | |||||||
| Shares outstanding as of December 31 (in millions) | 601.5 | 624.0 | 645.8 | ||||||||||
| 1 | Profit attributable to common stockholders. | |
| SARs and stock options to purchase 5,468,512, 543,971 and 9,626,940 common shares were outstanding in 2008, 2007 and 2006, respectively, but were not included in the computation of diluted earnings per share because the effect would have been antidilutive. |
| 19. | Fair value disclosures |
| A. | Fair value measurements |
| As discussed in Note 1K, we adopted SFAS 157 as of January 1, 2008. SFAS 157 defines fair value as the exchange price that would be received for an asset or paid to transfer a liability (an exit price) in the principal or most advantageous market for the asset or liability in an orderly transaction between market participants. SFAS 157 also specifies a fair value hierarchy based upon the observability of inputs used in valuation techniques. Observable inputs (highest level) reflect market data obtained from independent sources, while unobservable inputs (lowest level) reflect internally-developed market assumptions. In accordance with SFAS 157, fair value measurements are classified under the following hierarchy: |
Page A-42
§ | Level 1 – Quoted prices for identical instruments in active markets. | |
§ | Level 2 – Quoted prices for similar instruments in active markets; quoted prices for identical or similar instruments in markets that are not active; and model-derived valuations in which all significant inputs or significant value-drivers are observable in active markets. | |
| § | Level 3 – Model-derived valuations in which one or more significant inputs or significant value-drivers are unobservable. |
| When available, we use quoted market prices to determine fair value and we classify such measurements within Level 1. In some cases where market prices are not available, we make use of observable market based inputs to calculate fair value, in which case the measurements are classified within Level 2. If quoted or observable market prices are not available, fair value is based upon internally developed models that use, where possible, current market-based parameters such as interest rates, yield curves and currency rates. These measurements are classified within Level 3. |
| Fair value measurements are classified according to the lowest level input or value-driver that is significant to the valuation. A measurement may therefore be classified within Level 3 even though there may be significant inputs that are readily observable. |
| SFAS 157 expanded the definition of fair value to include the consideration of nonperformance risk. Nonperformance risk refers to the risk that an obligation (either by a counterparty or Caterpillar) will not be fulfilled. For our financial assets traded in an active market (Level 1 and certain Level 2), the nonperformance risk is included in the market price. For certain other financial assets and liabilities (Level 2 and 3), our fair value calculations have been adjusted accordingly. |
Available-for-sale securities Our available-for-sale securities, primarily at Cat Insurance, include a mix of equity and debt instruments (see Note 13 for additional information). Fair values for our government debt and equity securities are based upon valuations for identical instruments in active markets. Fair values for corporate bonds are based upon models that take into consideration such market-based factors as recent sales, risk-free yield curves and prices of similarly rated bonds. |
Derivative financial instruments The fair value of interest rate swap derivatives is primarily based on models that utilize the appropriate market-based forward swap curves and zero-coupon interest rates to determine the discounted cash flows. The fair value of foreign currency forward and option contracts is based on a valuation model that discounts cash flows resulting from the differential between the contract price and the market-based forward rate. |
Securitized retained interests The fair value of securitized retained interests is based upon a valuation model that calculates the present value of future expected cash flows using key assumptions for credit losses, prepayment rates and discount rates. These assumptions are based on our historical experience, market trends and anticipated performance relative to the particular assets securitized. Guarantees The fair value of guarantees is based upon the premium we would require to issue the same guarantee in a stand-alone arm’s-length transaction with an unrelated party. If quoted or observable market prices are not available, fair value is based upon internally developed models that utilize current market-based assumptions. |
| Assets and liabilities measured at fair value, primarily related to Financial Products, included in our Consolidated Statement of Financial Position as of December 31, 2008 are summarized below: |
| (Millions of dollars) | December 31, 2008 | |||||||||||||||||
| Level 1 | Level 2 | Level 3 | Total Assets / Liabilities, at Fair Value | |||||||||||||||
| Assets | ||||||||||||||||||
| Available-for-sale securities (long-term investments) | $ | 140 | $ | 992 | $ | — | $ | 1,132 | ||||||||||
| Derivative financial instruments | — | 625 | — | 625 | ||||||||||||||
| Securitized retained interests | — | — | 52 | 52 | ||||||||||||||
| Total assets | $ | 140 | $ | 1,617 | $ | 52 | $ | 1,809 | ||||||||||
| Liabilities | ||||||||||||||||||
| Guarantees | $ | — | $ | — | $ | 14 | $ | 14 | ||||||||||
| Total liabilities | $ | — | $ | — | $ | 14 | $ | 14 | ||||||||||
Page A-43
| Below is a roll-forward of assets and liabilities measured at fair value using Level 3 inputs for the year ended December 31, 2008. These instruments, primarily related to Cat Financial, were valued using pricing models that, in management’s judgment, reflect the assumptions a marketplace participant would use. |
| (Millions of dollars) | Securitized Retained Interests | Guarantees | ||||||||
| Balance at December 31, 2007 | $ | 49 | $ | 12 | ||||||
| Total gains or losses (realized / unrealized) | ||||||||||
| Included in earnings | (21 | ) | 7 | |||||||
| Included in other comprehensive income (loss) | (13 | ) | — | |||||||
| Purchases, issuances and settlements | 37 | (5 | ) | |||||||
| Balance at December 31, 2008 | $ | 52 | $ | 14 | ||||||
The amount of unrealized losses on securitized retained interests recognized in earnings for the year ended December 31, 2008 related to assets still held at December 31, 2008 were $23 million. These losses were reported in Revenues of Financial Products in Statement 1. The amount of unrealized losses on guarantees recognized in earnings for the year ended December 31, 2008 related to liabilities still held at December 31, 2008 were $8 million. These losses were reported in Selling, general and administrative expenses in Statement 1. In addition to the amounts above, we have impaired loans of $108 million as of December 31, 2008. A loan is considered impaired when management determines that collection of future income is not probable. In these cases, an allowance for loan losses is established based primarily on the fair value of associated collateral. As the collateral’s fair value is based on observable market prices and/or current appraised values, the impaired loans are classified as Level 2 measurements. See Table III for further details. |
| B. | Fair values of financial instruments |
In addition to the methods and assumptions we use to record the fair value of financial instruments as discussed in the Fair value measurements section above, we used the following methods and assumptions to estimate the fair value of our financial instruments as required by SFAS 107 “Disclosures about Fair Values of Financial Instruments.” Cash and short-term investments Carrying amount approximated fair value. Long-term investments (other than investments in unconsolidated affiliated companies) Fair value for available-for-sale securities was estimated based on quoted market prices. Fair value for security deposits (included in long-term investments in 2007 and 2006) approximated carrying value. In 2008 the security deposit is classified in “Prepaid expenses and other current assets” in Statement 2. Finance receivables Fair value was estimated by discounting the future cash flow using current rates, representative of receivables with similar remaining maturities. Wholesale inventory receivables Fair value was estimated by discounting the future cash flows using current rates, representative of receivables with similar remaining maturities. Short-term borrowings Carrying amount approximated fair value. Long-term debt Fair value for Machinery and Engines and Financial Products fixed rate debt was estimated based on quoted market prices. For Financial Products, floating rate notes and commercial paper carrying amounts were considered a reasonable estimate of fair value. For deposit obligations, carrying value approximated fair value. Please refer to Table IV for the fair values of our financial instruments. |
Page A-44
TABLE IV—Fair Values of Financial Instruments | |||||||||||||||||||||||||||||
| 2008 | 2007 | 2006 | |||||||||||||||||||||||||||
| (Millions of dollars) | Carrying Amount | Fair Value | Carrying Amount | Fair Value | Carrying Amount | Fair Value | Reference | ||||||||||||||||||||||
| Asset (liability) at December 31 | |||||||||||||||||||||||||||||
| Cash and short-term investments | $ | 2,736 | $ | 2,736 | $ | 1,122 | $ | 1,122 | $ | 530 | $ | 530 | Statement 2 | ||||||||||||||||
| Long-term investments | 1,132 | 1,132 | 1,519 | 1,519 | 1,296 | 1,296 | Notes 13 and 20 | ||||||||||||||||||||||
| Foreign currency contracts | 254 | 254 | 35 | 35 | 56 | 56 | Notes 3 and 20 | ||||||||||||||||||||||
Finance receivables—net (excluding finance leases1) | 14,367 | 13,483 | 12,883 | 12,814 | 11,497 | 11,506 | Note 8 | ||||||||||||||||||||||
| Wholesale inventory receivables— | |||||||||||||||||||||||||||||
net (excluding finance leases1) | 1,232 | 1,154 | 1,066 | 1,036 | 958 | 931 | Note 7 | ||||||||||||||||||||||
| Short-term borrowings | (7,209 | ) | (7,209 | ) | (5,468 | ) | (5,468 | ) | (5,155 | ) | (5,155 | ) | Note 15 | ||||||||||||||||
| Long-term debt (including amounts due within one year) | |||||||||||||||||||||||||||||
| Machinery and Engines | (6,192 | ) | (6,290 | ) | (3,819 | ) | (4,118 | ) | (4,112 | ) | (4,397 | ) | Note 16 | ||||||||||||||||
| Financial Products | (22,134 | ) | (21,259 | ) | (19,142 | ) | (19,287 | ) | (18,029 | ) | (17,911 | ) | Note 16 | ||||||||||||||||
| Interest rate swaps | |||||||||||||||||||||||||||||
| Machinery and Engines— | |||||||||||||||||||||||||||||
| in a net receivable position | — | — | 28 | 28 | 2 | 2 | Note 3 | ||||||||||||||||||||||
| in a net payable position | (3 | ) | (3 | ) | — | — | — | — | Note 3 | ||||||||||||||||||||
| Financial Products— | |||||||||||||||||||||||||||||
| in a net receivable position | 501 | 501 | 75 | 75 | 52 | 52 | Note 3 | ||||||||||||||||||||||
| in a net payable position | (127 | ) | (127 | ) | (46 | ) | (46 | ) | (99 | ) | (99 | ) | Note 3 | ||||||||||||||||
| Securitized retained interests | 52 | 52 | 49 | 49 | 68 | 68 | Notes 8 and 19 | ||||||||||||||||||||||
| Guarantees | (14 | ) | (14 | ) | (12 | ) | (12 | ) | (10 | ) | (10 | ) | Notes 19 and 22 | ||||||||||||||||
| 1 | Total excluded items have a net carrying value at December 31, 2008, 2007 and 2006 of $8,951 million, $8,511 million and $7,091 million, respectively. | ||||||||||||||||||||||||||||
| 20. | Concentration of credit risk |
Financial instruments with potential credit risk consist primarily of trade and finance receivables and short-term and long-term investments. Additionally, to a lesser extent, we have a potential credit risk associated with counterparties to derivative contracts. Trade receivables are primarily short-term receivables from independently owned and operated dealers and customers which arise in the normal course of business. We perform regular credit evaluations of our dealers and customers. Collateral generally is not required, and the majority of our trade receivables are unsecured. We do, however, when deemed necessary, make use of various devices such as security agreements and letters of credit to protect our interests. No single dealer or customer represents a significant concentration of credit risk. Finance receivables and wholesale inventory receivables primarily represent receivables under installment sales contracts, receivables arising from leasing transactions and notes receivable. We generally maintain a secured interest in the equipment financed. No single customer or dealer represents a significant concentration of credit risk. Short-term and long-term investments are held with high quality institutions and, by policy, the amount of credit exposure to any one institution is limited. Long-term investments, included in "Other assets" in Statement 2, are comprised primarily of investments of Cat Insurance supporting insurance reserve requirements. For derivative contracts, collateral is generally not required of the counterparties or of our company. We do not anticipate nonperformance by any of the counterparties. Our exposure to credit loss in the event of nonperformance by the counterparties is limited to only those gains that we have recorded, but have not yet received cash payment. At December 31, 2008, 2007 and 2006, the exposure to credit loss was $1,051 million, $204 million, and $149 million, respectively. The significant 2008 increase is a result of favorable rate movement on interest rate swaps at Cat Financial and favorable exchange rate movement on foreign exchange contracts in Machinery and Engines. Please refer to Note 19 and Table IV above for fair value information. |
Page A-45
| 21. | Operating leases |
We lease certain computer and communications equipment, transportation equipment and other property through operating leases. Total rental expense for operating leases was $402 million, $362 million and $319 million for 2008, 2007 and 2006, respectively. Minimum payments for operating leases having initial or remaining non-cancelable terms in excess of one year are: |
| Years ended December 31, | |||||||||||||||||||||||||||
| (Millions of dollars) | |||||||||||||||||||||||||||
| 2009 | 2010 | 2011 | 2012 | 2013 | After 2013 | Total | |||||||||||||||||||||
| $ | 223 | $ | 183 | $ | 149 | $ | 119 | $ | 99 | $ | 487 | $ | 1,260 | ||||||||||||||
| 22. | Guarantees and product warranty |
We have provided an indemnity to a third-party insurance company for potential losses related to performance bonds issued on behalf of Caterpillar dealers. The bonds are issued to insure governmental agencies against nonperformance by certain Caterpillar dealers. We provide loan guarantees to third-party lenders for financing associated with machinery purchased by customers. These guarantees have varying terms and are secured by the machinery. In addition, Cat Financial participates in standby letters of credit issued to third parties on behalf of their customers. These standby letters of credit have varying terms and beneficiaries and are secured by customer assets. Cat Financial has provided a limited indemnity to a third-party bank for $25 million resulting from the assignment of certain leases to that bank. The indemnity is for the possibility that the insurers of these leases would become insolvent. The indemnity expires December 15, 2012 and is unsecured. No loss has been experienced or is anticipated under any of these guarantees. At December 31, 2008, 2007 and 2006, the related liability was $14 million, $12 million and $10 million, respectively. The maximum potential amount of future payments (undiscounted and without reduction for any amounts that may possibly be recovered under recourse or collateralized provisions) we could be required to make under the guarantees at December 31 are as follows: |
(Millions of dollars) | 2008 | 2007 | 2006 | |||||||||
| Guarantees with Caterpillar dealers | $ | 100 | $ | 363 | $ | 527 | ||||||
| Guarantees with customers | 136 | 53 | 48 | |||||||||
| Limited indemnity | 25 | 30 | 35 | |||||||||
| Guarantees—other | 43 | 39 | 21 | |||||||||
| Total guarantees | $ | 304 | $ | 485 | $ | 631 | ||||||
We provide guarantees to repurchase certain loans of Caterpillar dealers from a financial trust (“Trust”) that qualifies as a variable interest entity under FIN 46R. The purpose of the Trust is to provide short-term working capital loans to Caterpillar dealers. This Trust issues commercial paper and uses the proceeds to fund its loan program. We have a loan purchase agreement with the Trust that obligates us to purchase certain loans that are not paid at maturity. We receive a fee for providing this guarantee, which provides a source of liquidity for the Trust. Prior to December 2008, the loan purchase agreement was treated as a guarantee and disclosed in the table above as Guarantees with Caterpillar dealers. At December 31, 2008, we determined that we were the primary beneficiary of the Trust as our guarantee would require us to absorb a majority of the entity’s expected losses, and therefore consolidated the financial position of the Trust in Statement 2. The Trust’s assets of $477 million are primarily comprised of loans to dealers and the liabilities of $477 million are primarily comprised of commercial paper. No loss has been experienced or is anticipated under this loan purchase agreement. Our assets are not available to pay creditors of the Trust, except to the extent we may be obligated to perform under the guarantee, and assets of the Trust are not available to pay our creditors. Cat Financial is party to agreements in the normal course of business with selected customers and Caterpillar dealers in which we commit to provide a set dollar amount of financing on a pre-approved basis. We also provide lines of credit to selected customers and Caterpillar dealers, of which a portion remains unused as of the end of the period. Commitments and lines of credit generally have fixed expiration dates or other termination clauses. It has been our experience that not all commitments and lines of credit will be used. Management applies the same credit policies when making commitments and granting lines of credit as it does for any other financing. |
Page A-46
We do not require collateral for these commitments/lines, but if credit is extended, collateral may be required upon funding. The amount of the unused commitments and lines of credit for dealers as of December 31, 2008, 2007 and 2006 was $8,918 million, $8,249 million and $6,519 million, respectively. The amount of the unused commitments and lines of credit for customers as of December 31, 2008, 2007 and 2006 was $3,085 million, $3,001 million and $2,279 million, respectively. Our product warranty liability is determined by applying historical claim rate experience to the current field population and dealer inventory. Generally, historical claim rates are based on actual warranty experience for each product by machine model/engine size. Specific rates are developed for each product build month and are updated monthly based on actual warranty claim experience. |
| (Millions of dollars) | 2008 | 2007 | 2006 | |||||||||
| Warranty liability, January 1 | $ | 1,045 | $ | 953 | $ | 879 | ||||||
| Reduction in liability (payments) | (1,074 | ) | (906 | ) | (745 | ) | ||||||
| Increase in liability (new warranties) | 1,230 | 998 | 819 | |||||||||
| Warranty liability, December 31 | $ | 1,201 | $ | 1,045 | $ | 953 | ||||||
| 23. | Environmental and legal matters |
The company is regulated by federal, state and international environmental laws governing our use, transport and disposal of substances and control of emissions. In addition to governing our manufacturing and other operations, these laws often impact the development of our products, including, but not limited to, required compliance with air emissions standards applicable to internal combustion engines. Compliance with these existing laws has not had a material impact on our capital expenditures, earnings or global competitive position. We are engaged in remedial activities at a number of locations, often with other companies, pursuant to federal and state laws. When it is reasonably probable we will pay remedial costs at a site and those costs can be reasonably estimated, the costs are charged against our earnings. In formulating that estimate, we do not consider amounts expected to be recovered from insurance companies or others. The amount recorded for environmental remediation is not material and is included in “Accrued expenses” in the Consolidated Statement of Financial Position. We cannot reasonably estimate costs at sites in the very early stages of remediation. Currently, we have a few sites in the very early stages of remediation and there is no more than a remote chance that a material amount for remedial activities at any individual site, or at all sites in the aggregate, will be required. On May 14, 2007, the U.S. Environmental Protection Agency (EPA) issued a Notice of Violation to Caterpillar Inc., alleging various violations of Clean Air Act Sections 203, 206 and 207. EPA claims that Caterpillar violated such sections by shipping engines and catalytic converter after-treatment devices separately, introducing into commerce a number of uncertified and/or misbuilt engines and failing to timely report emissions-related defects. Caterpillar is currently engaging in negotiations with EPA to resolve these issues, but we are unable at this time to place precise estimates on the potential exposure to penalties. However, Caterpillar is cooperating with EPA and, based upon initial discussions and although penalties could potentially exceed $100,000, management does not believe that this issue will have a material adverse impact on our financial position. We have disclosed certain individual legal proceedings in this filing. Additionally, we are involved in other unresolved legal actions that arise in the normal course of business. The most prevalent of these unresolved actions involve disputes related to product design, manufacture and performance liability (including claimed asbestos and welding fumes exposure), contracts, employment issues or intellectual property rights. Although it is not possible to predict with certainty the outcome of these unresolved legal actions, we believe that these actions will not individually or in the aggregate have a material adverse effect on our consolidated financial position, liquidity or results of operations. On September 29, 2004, Kruse Technology Partnership (Kruse) filed a lawsuit against Caterpillar in the United States District Court for the Central District of California alleging that certain Caterpillar engines built from October 2002 to the present infringe upon certain claims of three of Kruse's patents on engine fuel injection timing and combustion strategies. Caterpillar denied Kruse's allegations and filed a counterclaim seeking a declaration from the court that Caterpillar is not infringing upon Kruse's patents and that the patents are invalid and unenforceable. On December 20, 2008, Caterpillar and Kruse entered into a confidential settlement agreement whereby all pending claims with regard to the lawsuit were settled. The settlement, which did not have a material impact on our financial statements, included an agreement by both parties to not bring any future actions in the matter. Subsequent to the agreement, the court entered an order dismissing the case. |
Page A-47
| 24. | Segment information |
| A. | Basis for segment information Caterpillar is organized based on a decentralized structure that has established responsibilities to continually improve business focus and increase our ability to react quickly to changes in the global business cycle, customer needs and competitors' actions. Our current structure uses a matrix organization comprised of multiple profit and cost center divisions. |
| In the first quarter of 2009, our organizational responsibilities were changed significantly to align the machine product, manufacturing and marketing organizations. The new divisional structure and revised set of responsibilities are as follows: |
| § | Machine business divisions are profit centers primarily responsible for product management, development, marketing, sales and product support. Machine business divisions also have select manufacturing responsibilities. These activities were previously included within product and component divisions, manufacturing divisions and machinery marketing divisions. Inter-segment sales of components may also be a source of revenue for these divisions. | |
| § | Engine business divisions are profit centers primarily responsible for product management, development, manufacturing, marketing, sales and product support. Inter-segment sales of engines and/or components may also be a source of revenue for these divisions. | |
| § | Component business divisions are profit centers primarily responsible for product management, development, manufacturing, marketing and product support for internal and external customers. Some of these activities were previously included within product and manufacturing divisions. Inter-segment sales of components are a source of revenue for these divisions. | |
| § | Service business divisions are profit centers primarily responsible for various services and service-related products to customers including financial, logistics, remanufacturing and rail services. Inter-segment sales of services and service-related products are a source of revenue for some of these divisions. | |
| § | Manufacturing services divisions are cost centers primarily responsible for the manufacture of products and/or components within the geographic regions of the Americas and EAME. Previously manufacturing divisions were profit centers with inter-segment sales of components, machines and/or engines to product divisions as the primary sources of revenue. | |
| § | Corporate services divisions are cost centers primarily responsible for the performance of certain support functions globally (e.g., Finance, Human Resources, Information Technology, Legal and Purchasing) and to provide centralized services. | |
| § | Regional distribution services divisions are cost centers primarily responsible for the total portfolio of business with each dealer, the dealer relationship, dealer development and ensuring the most efficient and effective distribution of machines, engines and parts. Previously these functions were primarily performed by machinery marketing divisions. | |
| § | Centers of excellence divisions are cost centers primarily responsible for Caterpillar’s most critical/differentiating processes in the areas of Marketing and Product Support, Production and Product Development. Previously these organizations were considered service divisions. |
| Our measurement system is complex and is designed to evaluate performance and to drive continuous improvement. We have chosen to disclose financial results by our three principal lines of business (Machinery, Engines and Financial Products) in our Management’s Discussion and Analysis rather than by reportable segment based on the following: | ||
| § | Our Machinery and Engines businesses are vertically integrated and there are a significant amount of inter-segment transactions that make information for individual segments less meaningful. | |
| § | A significant amount of corporate and other costs ($1,333 million for 2008) are allocated to Machinery and Engines business divisions based on budgeted external and inter-segment sales. It would be difficult to provide meaningful information by reportable segment for these costs as the allocation method does not directly reflect the benefited segment and the allocation is done in total, not by financial statement line item. In addition, the budgeted amount is allocated to segments; any differences from budget are treated as a reconciling item between reportable segment and consolidated results. | |
| § | As discussed below, there are various methodology differences between our segment reporting and U.S. GAAP. This results in numerous reconciling items between reportable segment and consolidated results. | |
| § | We have nineteen operating segments, of which eleven are reportable segments. Reporting financial information for this number of businesses, especially considering our level of vertical integration, would not be meaningful to our financial statement users. | |
| In summary, due to Caterpillar's high level of integration and our concern that segment disclosures based on SFAS 131, “Disclosures about Segments of an Enterprise and Related Information” has limited value for our external readers, we are continuing to disclose financial results for our three principal lines of business (Machinery, Engines and Financial Products) in our Management's Discussion and Analysis. |
Page A-48
| B. | Description of segments |
Profit center divisions meet the SFAS 131 definition of “operating segments”; however, the cost center divisions do not. Following is a brief description of our eleven reportable segments and the business activities included in all other operating segments: Building Construction Products: A machine business division primarily responsible for product management, development, manufacture, marketing, sales and product support of light construction machines, forestry machines and select work tools. | |
Cat Japan: A business division primarily responsible for the development of small, medium and large hydraulic excavators, manufacturing of select machinery and components, marketing, sales and product support of machinery, engines and components in Japan. Earthmoving: A machine business division primarily responsible for product management, development, marketing, sales and product support of medium wheel loaders, medium track-type tractors, track-type loaders, motor graders and pipelayers. Also responsible for manufacturing of select machines in Asia. Electric Power: An engine business division primarily responsible for product management, development, manufacture, marketing, sales and product support of reciprocating engine powered generator sets as well as integrated systems used in the electric power generation industry. Excavation: A machine business division primarily responsible for product management, development, marketing, sales and product support of small, medium and large excavators, wheeled excavators and articulated trucks. Also responsible for manufacturing of select machines in Asia and articulated trucks. Large Power Systems: An engine business division primarily responsible for product management, development, manufacture and product support of reciprocating engines supplied to Caterpillar machinery and the electric power, on-highway vehicle, petroleum, marine and industrial industries. Also responsible for engine component manufacturing and the marketing and sales of on-highway vehicle engines. Logistics: A service business division primarily responsible for logistics services for Caterpillar and other companies. Marine & Petroleum Power: An engine business division primarily responsible for product management, development, marketing, sales and product support of reciprocating engines supplied to the marine and petroleum industries. Also responsible for manufacturing of certain reciprocating engines for marine, petroleum and electric power applications. |
Mining: A machine business division primarily responsible for product management, development, marketing, sales and product support of large track-type tractors, large mining trucks, underground mining equipment and tunnel boring equipment. Also responsible for manufacturing of underground mining equipment and tunnel boring equipment. Turbines: An engine business division primarily responsible for product management, development, manufacture, marketing, sales and product support of turbines and turbine-related services. Financing & Insurance Services: Provides financing to customers and dealers for the purchase and lease of Caterpillar and other equipment, as well as some financing for Caterpillar sales to dealers. Financing plans include operating and finance leases, installment sale contracts, working capital loans and wholesale financing plans. The division also provides various forms of insurance to customers and dealers to help support the purchase and lease of our equipment. |
All Other: Primarily includes activities such as: the product management, development, marketing, sales and product support of large wheel loaders, quarry and construction trucks, wheel tractor scrapers, wheel dozers, compactors and select work tools. Also responsible for manufacturing of select machines in Asia; the product management, development, manufacture, marketing, sales and product support of reciprocating engines used in industrial applications; the product management, development, manufacture, marketing, sales and product support of machinery and engine components, electronics and control systems; the product management, development, manufacture, remanufacture, maintenance and service of rail-related products and services; remanufacturing of Caterpillar engines and components and remanufacturing services for other companies; the product management, development, manufacture, marketing, sales and product support of paving products. Results for all other operating segments are included as reconciling items between reportable segments and consolidated, external reporting. |
| C. | Segment measurement and reconciliations |
| Effective the first quarter of 2009, we made the following changes to our segment reporting methodology: |
Page A-49
| § | Machine business divisions include actual manufacturing costs and assets from manufacturing service divisions. Previously these costs were valued on a manufacturing fee or transfer price basis and manufacturing assets were included in manufacturing divisions. | |
| § | Business divisions receive actual costs and assets from corporate services divisions, regional distribution services divisions and centers of excellence. Previously these costs were either charged to or excluded from profit center accountable profit while assets were included in service divisions. Costs for regional distribution services divisions and Marketing and Product Support Center of Excellence are allocated to business divisions based on budgeted external and inter-segment sales. | |
| § | The majority of other income and expense items are excluded from segment results. Previously they had been included. | |
| § | Certain corporate and other costs are allocated and included in the business division’s accountable profit at budgeted levels. Any differences from budget are treated as reconciling items. Previously all these costs were excluded from accountable profit. The allocation is based on budgeted external and inter-segment sales and costs are not assigned to individual financial statement line items. | |
| § | Interest expense is not included in Machinery and Engines segment results. Previously interest expense was imputed (i.e, charged) to profit centers based on their level of accountable assets. | |
| § | Certain corporate assets are allocated and included in the business division’s assets. Previously they were reconciling items between segment and consolidated reporting. |
There are several methodology differences between our segment reporting and our external reporting. The following is a list of the more significant methodology differences: | ||
| § | Generally, liabilities are managed at the corporate level and are not included in segment operations. Segment accountable assets generally include inventories, receivables and property, plant and equipment. | |
| § | Segment inventories and cost of sales are valued using a current cost methodology. | |
| § | Currency exposures are generally managed at the corporate level and the effects of changes in exchange rates on results of operations within the year are not included in segment results. The net difference created in the translation of revenues and costs between exchange rates used for U.S. GAAP reporting and exchange rates used for segment reporting are recorded as a methodology difference. | |
| § | Postretirement benefits are split; service and prior service costs are included in segment results based on plan participation. The remaining elements of net periodic benefit costs (at budget levels) are allocated to business divisions based on budgeted external and inter-segment sales (as part of the corporate cost allocation). Any differences from budget for the remaining elements are treated as reconciling items. | |
| § | Interest expense is not included in Machinery and Engines segment results. | |
| § | Accountable profit is determined on a pretax basis. | |
Reconciling items are created based on accounting differences between segment reporting and our consolidated, external reporting. Please refer to pages 51 to 54 for financial information regarding significant reconciling items. Most of our reconciling items are self-explanatory given the above explanations. For the reconciliation of profit (loss), we have grouped the reconciling items as follows: | ||
| § | Corporate costs: Certain corporate costs are allocated and included in the business division’s accountable profit at budgeted levels. Any differences are treated as reconciling items. Previously all these costs were excluded from accountable profit. These costs are related to corporate requirements and strategies that are considered to be for the benefit of the entire organization. | |
| § | Redundancy costs: Redundancy costs include employee separation charges and are a reconciling item between accountable profit and consolidated profit before tax. | |
| § | Methodology differences: See previous discussion of significant accounting differences between segment reporting and consolidated external reporting. | |
| § | Timing: Timing differences in the recognition of costs between segment reporting and consolidated external reporting. | |
Page A-50
Table V – Segment Information (Millions of dollars) | |||||||||||||||||||||||||||||
| Reportable Segments | |||||||||||||||||||||||||||||
2008 | External sales and revenues | Inter-segment sales & revenues | Total sales and revenues | Depreciation and amortization | Accountable profit (loss) | Accountable assets at December 31 | Capital expenditures | ||||||||||||||||||||||
| Building Construction Products | $ | 3,229 | $ | 57 | $ | 3,286 | $ | 35 | $ | (99 | ) | $ | 878 | $ | 63 | ||||||||||||||
| Cat Japan | 345 | 774 | 1,119 | 14 | (28 | ) | 3,165 | 99 | |||||||||||||||||||||
| Earthmoving | 7,467 | 144 | 7,611 | 85 | 435 | 2,477 | 315 | ||||||||||||||||||||||
| Electric Power | 3,634 | 24 | 3,658 | 24 | 253 | 1,068 | 75 | ||||||||||||||||||||||
| Excavation | 5,918 | 115 | 6,033 | 54 | 19 | 1,646 | 132 | ||||||||||||||||||||||
| Large Power Systems | 3,220 | 5,469 | 8,689 | 194 | 582 | 3,055 | 375 | ||||||||||||||||||||||
| Logistics | 850 | 1,570 | 2,420 | 111 | 388 | 971 | 125 | ||||||||||||||||||||||
| Marine & Petroleum Power | 4,066 | 85 | 4,151 | 15 | 421 | 758 | 80 | ||||||||||||||||||||||
| Mining | 4,270 | 226 | 4,496 | 63 | 590 | 1,339 | 71 | ||||||||||||||||||||||
| Turbines | 3,413 | 17 | 3,430 | 55 | 625 | 943 | 94 | ||||||||||||||||||||||
| Total Machinery & Engines | $ | 36,412 | $ | 8,481 | $ | 44,893 | $ | 650 | $ | 3,186 | $ | 16,300 | $ | 1,429 | |||||||||||||||
| Financing & Insurance Services | 3,812 | 7 | 3,819 | 755 | 547 | 33,090 | 1,608 | ||||||||||||||||||||||
| Total | $ | 40,224 | $ | 8,488 | $ | 48,712 | $ | 1,405 | $ | 3,733 | $ | 49,390 | $ | 3,037 | |||||||||||||||
| 2007 | |||||||||||||||||||||||||||||
| Building Construction Products | $ | 2,973 | $ | 53 | $ | 3,026 | $ | 37 | $ | (128 | ) | $ | 946 | $ | 49 | ||||||||||||||
| Earthmoving | 6,474 | 124 | 6,598 | 73 | 694 | 2,034 | 182 | ||||||||||||||||||||||
| Electric Power | 3,129 | 21 | 3,150 | 23 | 272 | 1,018 | 34 | ||||||||||||||||||||||
| Excavation | 5,364 | 104 | 5,468 | 46 | 266 | 1,323 | 100 | ||||||||||||||||||||||
| Large Power Systems | 2,973 | 4,586 | 7,559 | 181 | 431 | 2,590 | 236 | ||||||||||||||||||||||
| Logistics | 899 | 1,270 | 2,169 | 96 | 377 | 912 | 110 | ||||||||||||||||||||||
| Marine & Petroleum Power | 2,939 | 62 | 3,001 | 14 | 132 | 579 | 36 | ||||||||||||||||||||||
| Mining | 3,294 | 174 | 3,468 | 29 | 514 | 1,026 | 57 | ||||||||||||||||||||||
| Turbines | 2,880 | 14 | 2,894 | 57 | 424 | 862 | 77 | ||||||||||||||||||||||
| Total Machinery & Engines | $ | 30,925 | $ | 6,408 | $ | 37,333 | $ | 556 | $ | 2,982 | $ | 11,290 | $ | 881 | |||||||||||||||
| Financing & Insurance Services | 3,670 | 8 | 3,678 | 673 | 783 | 30,571 | 1,367 | ||||||||||||||||||||||
| Total | $ | 34,595 | $ | 6,416 | $ | 41,011 | $ | 1,229 | $ | 3,765 | $ | 41,861 | $ | 2,248 | |||||||||||||||
| 2006 | |||||||||||||||||||||||||||||
| Building Construction Products | $ | 2,855 | $ | 51 | $ | 2,906 | $ | 37 | $ | (34 | ) | $ | 850 | $ | 45 | ||||||||||||||
| Earthmoving | 5,821 | 112 | 5,933 | 58 | 742 | 1,599 | 122 | ||||||||||||||||||||||
| Electric Power | 2,564 | 17 | 2,581 | 22 | 100 | 919 | 52 | ||||||||||||||||||||||
| Excavation | 5,308 | 102 | 5,410 | 39 | 450 | 1,262 | 91 | ||||||||||||||||||||||
| Large Power Systems | 4,555 | 3,752 | 8,307 | 157 | 707 | 2,396 | 266 | ||||||||||||||||||||||
| Logistics | 861 | 1,164 | 2,025 | 79 | 295 | 981 | 92 | ||||||||||||||||||||||
| Marine & Petroleum Power | 2,164 | 46 | 2,210 | 20 | 32 | 644 | 23 | ||||||||||||||||||||||
| Mining | 3,337 | 176 | 3,513 | 25 | 656 | 990 | 60 | ||||||||||||||||||||||
| Turbines | 2,228 | 11 | 2,239 | 52 | 271 | 916 | 73 | ||||||||||||||||||||||
| Total Machinery & Engines | $ | 29,693 | $ | 5,431 | $ | 35,124 | $ | 489 | $ | 3,219 | $ | 10,557 | $ | 824 | |||||||||||||||
| Financing & Insurance Services | 3,359 | 7 | 3,366 | 642 | 720 | 28,406 | 1,153 | ||||||||||||||||||||||
| Total | $ | 33,052 | $ | 5,438 | $ | 38,490 | $ | 1,131 | $ | 3,939 | $ | 38,963 | $ | 1,977 | |||||||||||||||
Page A-51
Reconciliation of Sales and Revenues: | ||||||||||||||||
| (Millions of dollars) | Machinery and Engines | Financing & Insurance Services | Consolidating Adjustments | Consolidated Total | ||||||||||||
| 2008 | ||||||||||||||||
| Total external sales and revenues from reportable segments | $ | 36,412 | $ | 3,812 | $ | — | $ | 40,224 | ||||||||
| All other operating segments | 11,430 | — | — | 11,430 | ||||||||||||
| Other | 202 | (224 | ) | (308 | ) | 1 | (330 | ) | ||||||||
| Total sales and revenues | $ | 48,044 | $ | 3,588 | $ | (308 | ) | $ | 51,324 | |||||||
| 2007 | ||||||||||||||||
| Total external sales and revenues from reportable segments | $ | 30,925 | $ | 3,670 | $ | — | $ | 34,595 | ||||||||
| All other operating segments | 10,617 | — | — | 10,617 | ||||||||||||
| Other | 420 | (274 | ) | (400 | ) | 1 | (254 | ) | ||||||||
| Total sales and revenues | $ | 41,962 | $ | 3,396 | $ | (400 | ) | $ | 44,958 | |||||||
| 2006 | ||||||||||||||||
| Total external sales and revenues from reportable segments | $ | 29,693 | $ | 3,359 | $ | — | $ | 33,052 | ||||||||
| All other operating segments | 8,741 | — | — | 8,741 | ||||||||||||
| Other | 435 | (245 | ) | (466 | ) | 1 | (276 | ) | ||||||||
| Total sales and revenues | $ | 38,869 | $ | 3,114 | $ | (466 | ) | $ | 41,517 | |||||||
| 1 | Elimination of Financial Products revenues from Machinery and Engines. |
| Reconciliation of Profit Before Taxes: | ||||||||||||
| (Millions of dollars) | Machinery and Engines | Financing & Insurance Services | Consolidated Total | |||||||||
| 2008 | ||||||||||||
| Total accountable profit from reportable segments | $ | 3,186 | $ | 547 | $ | 3,733 | ||||||
| All other operating segments | 1,252 | — | 1,252 | |||||||||
| Cost centers | 65 | — | 65 | |||||||||
| Corporate costs | (195 | ) | — | (195 | ) | |||||||
| Timing | (30 | ) | — | (30 | ) | |||||||
| Employee separation charges | (30 | ) | — | (30 | ) | |||||||
| Methodology differences: | ||||||||||||
| Inventory/cost of sales | (30 | ) | — | (30 | ) | |||||||
| Postretirement benefit expense | 53 | — | 53 | |||||||||
| Financing costs | (268 | ) | — | (268 | ) | |||||||
| Equity in profit of unconsolidated affiliated companies | (38 | ) | 1 | (37 | ) | |||||||
| Currency | (48 | ) | — | (48 | ) | |||||||
| Other methodology differences | 30 | 6 | 36 | |||||||||
| Total profit before taxes | $ | 3,947 | $ | 554 | $ | 4,501 | ||||||
| 2007 | ||||||||||||
| Total accountable profit from reportable segments | $ | 2,982 | $ | 783 | $ | 3,765 | ||||||
| All other operating segments | 1,793 | — | 1,793 | |||||||||
| Cost centers | (4 | ) | — | (4 | ) | |||||||
| Corporate costs | (225 | ) | — | (225 | ) | |||||||
| Timing | (25 | ) | — | (25 | ) | |||||||
| Methodology differences: | ||||||||||||
| Inventory/cost of sales | (44 | ) | — | (44 | ) | |||||||
| Postretirement benefit expense | 62 | — | 62 | |||||||||
| Financing costs | (292 | ) | — | (292 | ) | |||||||
| Equity in profit of unconsolidated affiliated companies | (69 | ) | (4 | ) | (73 | ) | ||||||
| Currency | 50 | — | 50 | |||||||||
| Other methodology differences | (13 | ) | (4 | ) | (17 | ) | ||||||
| Total profit before taxes | $ | 4,215 | $ | 775 | $ | 4,990 | ||||||
Page A-52
| 2006 | ||||||||||||
| Total accountable profit from reportable segments | $ | 3,219 | $ | 720 | $ | 3,939 | ||||||
| All other operating segments | 1,480 | — | 1,480 | |||||||||
| Cost centers | 19 | — | 19 | |||||||||
| Corporate costs | (171 | ) | — | (171 | ) | |||||||
| Timing | 10 | — | 10 | |||||||||
| Methodology differences: | ||||||||||||
| Inventory/cost of sales | (78 | ) | — | (78 | ) | |||||||
| Postretirement benefit expense | 27 | — | 27 | |||||||||
| Financing costs | (281 | ) | — | (281 | ) | |||||||
| Equity in profit of unconsolidated affiliated companies | (79 | ) | (2 | ) | (81 | ) | ||||||
| Currency | 15 | — | 15 | |||||||||
| Other methodology differences | (20 | ) | 31 | 11 | ||||||||
| Total profit before taxes | $ | 4,141 | $ | 749 | $ | 4,890 | ||||||
| Reconciliation of Assets: | ||||||||||||||||
(Millions of dollars) | Machinery and Engines | Financing & Insurance Services | Consolidating Adjustments | Consolidated Total | ||||||||||||
| 2008 | ||||||||||||||||
| Total accountable assets from reportable segments | $ | 16,300 | $ | 33,090 | $ | — | $ | 49,390 | ||||||||
| All other operating segments | 9,055 | — | — | 9,055 | ||||||||||||
| Items not included in segment assets: | ||||||||||||||||
| Cash and short-term investments | 1,517 | 1,219 | — | 2,736 | ||||||||||||
| Intercompany receivables | 540 | 76 | (616 | ) | — | |||||||||||
| Investment in Financial Products | 3,788 | — | (3,788 | ) | — | |||||||||||
| Deferred income taxes and prepaids | 4,759 | 244 | (474 | ) | 4,529 | |||||||||||
| Intangible assets and other assets | 1,224 | 29 | — | 1,253 | ||||||||||||
| Liabilities included in segment assets | 2,967 | — | — | 2,967 | ||||||||||||
| Inventory methodology differences | (2,747 | ) | — | — | (2,747 | ) | ||||||||||
| Other | 876 | (277 | ) | — | 599 | |||||||||||
| Total assets | $ | 38,279 | $ | 34,381 | $ | (4,878 | ) | $ | 67,782 | |||||||
| 2007 | ||||||||||||||||
| Total accountable assets from reportable segments | $ | 11,290 | $ | 30,571 | $ | — | $ | 41,861 | ||||||||
| All other operating segments | 8,442 | — | — | 8,442 | ||||||||||||
| Items not included in segment assets: | ||||||||||||||||
| Cash and short-term investments | 862 | 260 | — | �� | 1,122 | |||||||||||
| Intercompany receivables | 366 | 113 | (479 | ) | — | |||||||||||
| Investment in Affiliates | 461 | — | — | 461 | ||||||||||||
| Investment in Financial Products | 3,996 | — | (3,996 | ) | — | |||||||||||
| Deferred income taxes and prepaids | 2,701 | 138 | (339 | ) | 2,500 | |||||||||||
| Intangible assets and other assets | 1,195 | 63 | — | 1,258 | ||||||||||||
| Liabilities included in segment assets | 2,664 | — | — | 2,664 | ||||||||||||
| Inventory methodology differences | (2,483 | ) | — | — | (2,483 | ) | ||||||||||
| Other | 582 | (275 | ) | — | 307 | |||||||||||
| Total assets | $ | 30,076 | $ | 30,870 | $ | (4,814 | ) | $ | 56,132 | |||||||
| 2006 | ||||||||||||||||
| Total accountable assets from reportable segments | $ | 10,557 | $ | 28,406 | $ | — | $ | 38,963 | ||||||||
| All other operating segments | 7,499 | — | — | 7,499 | ||||||||||||
| Items not included in segment assets: | ||||||||||||||||
| Cash and short-term investments | 319 | 211 | — | 530 | ||||||||||||
| Intercompany receivables | 205 | 85 | (290 | ) | — | |||||||||||
| Investment in Affiliates | 439 | — | — | 439 | ||||||||||||
| Investment in Financial Products | 3,543 | — | (3,543 | ) | — | |||||||||||
| Deferred income taxes and prepaids | 3,167 | 116 | (327 | ) | 2,956 | |||||||||||
| Intangible assets and other assets | 1,270 | (1 | ) | — | 1,269 | |||||||||||
| Liabilities included in segment assets | 1,768 | — | — | 1,768 | ||||||||||||
| Inventory methodology differences | (2,418 | ) | — | — | (2,418 | ) | ||||||||||
| Other | 667 | (224 | ) | — | 443 | |||||||||||
| Total assets | $ | 27,016 | $ | 28,593 | $ | (4,160 | ) | $ | 51,449 | |||||||
Page A-53
| Reconciliation of Depreciation and amortization | ||||||||||||||||
(Millions of dollars) | Machinery and Engines | Financing & Insurance Services | Consolidating Adjustments | Consolidated Total | ||||||||||||
| 2008 | ||||||||||||||||
| Total accountable depreciation and amortization from reportable segments | $ | 650 | $ | 755 | $ | — | $ | 1,405 | ||||||||
| Items not included in segment depreciation and amortization: | ||||||||||||||||
| All other operating segments | 425 | — | — | 425 | ||||||||||||
| Cost centers | 168 | — | — | 168 | ||||||||||||
| Other | (18 | ) | — | — | (18 | ) | ||||||||||
| Total depreciation and amortization | $ | 1,225 | $ | 755 | $ | — | $ | 1,980 | ||||||||
| 2007 | ||||||||||||||||
| Total accountable depreciation and amortization from reportable segments | $ | 556 | $ | 673 | $ | — | $ | 1,229 | ||||||||
| Items not included in segment depreciation and amortization: | ||||||||||||||||
| All other operating segments | 383 | — | — | 383 | ||||||||||||
| Cost centers | 169 | — | — | 169 | ||||||||||||
| Other | (15 | ) | 31 | — | 16 | |||||||||||
| Total depreciation and amortization | $ | 1,093 | $ | 704 | $ | — | $ | 1,797 | ||||||||
| 2006 | ||||||||||||||||
| Total accountable depreciation and amortization from reportable segments | $ | 489 | $ | 642 | $ | — | $ | 1,131 | ||||||||
| Items not included in segment depreciation and amortization: | ||||||||||||||||
| All other operating segments | 310 | — | — | 310 | ||||||||||||
| Cost centers | 155 | — | — | 155 | ||||||||||||
| Other | (11 | ) | 17 | — | 6 | |||||||||||
| Total depreciation and amortization | $ | 943 | $ | 659 | $ | — | $ | 1,602 | ||||||||
| Reconciliation of Capital expenditures | ||||||||||||||||
(Millions of dollars) | Machinery and Engines | Financing & Insurance Services | Consolidating Adjustments | Consolidated Total | ||||||||||||
| 2008 | ||||||||||||||||
| Total accountable capital expenditures from reportable segments | $ | 1,429 | $ | 1,608 | $ | — | $ | 3,037 | ||||||||
| Items not included in segment capital expenditures: | ||||||||||||||||
| All other operating segments | 749 | — | — | 749 | ||||||||||||
| Cost centers | 242 | — | — | 242 | ||||||||||||
| Other | 1 | 4 | (22 | ) | (17 | ) | ||||||||||
| Total capital expenditures | $ | 2,421 | $ | 1,612 | $ | (22 | ) | $ | 4,011 | |||||||
| 2007 | ||||||||||||||||
| Total accountable capital expenditures from reportable segments | $ | 881 | $ | 1,367 | $ | — | $ | 2,248 | ||||||||
| Items not included in segment capital expenditures: | ||||||||||||||||
| All other operating segments | 576 | — | — | 576 | ||||||||||||
| Cost centers | 221 | — | — | 221 | ||||||||||||
| Other | 5 | (1 | ) | (9 | ) | (5 | ) | |||||||||
| Total capital expenditures | $ | 1,683 | $ | 1,366 | $ | (9 | ) | $ | 3,040 | |||||||
| 2006 | ||||||||||||||||
| Total accountable capital expenditures from reportable segments | $ | 824 | $ | 1,153 | $ | — | $ | 1,977 | ||||||||
| Items not included in segment capital expenditures: | ||||||||||||||||
| All other operating segments | 459 | — | — | 459 | ||||||||||||
| Cost centers | 244 | — | — | 244 | ||||||||||||
| Other | 53 | (1 | ) | (57 | ) | (5 | ) | |||||||||
| Total capital expenditures | $ | 1,580 | $ | 1,152 | $ | (57 | ) | $ | 2,675 | |||||||
Page A-54
| Enterprise-wide Disclosures: | ||||||||||||
| External sales and revenues from products and services: | ||||||||||||
| 2008 | 2007 | 2006 | ||||||||||
| Machinery | $ | 31,804 | $ | 28,359 | $ | 26,062 | ||||||
| Engines | 16,240 | 13,603 | 12,807 | |||||||||
| Financial Products | 3,280 | 2,996 | 2,648 | |||||||||
| Total consolidated | $ | 51,324 | $ | 44,958 | $ | 41,517 | ||||||
| Information about Geographic Areas: | ||||||||||||||||||||||||
| Net property, plant and equipment | ||||||||||||||||||||||||
External Sales & Revenues 1 | December 31, | |||||||||||||||||||||||
| 2008 | 2007 | 2006 | 2008 | 2007 | 2006 | |||||||||||||||||||
| Inside United States | $ | 17,291 | $ | 17,091 | $ | 19,636 | $ | 6,426 | $ | 5,754 | $ | 5,424 | ||||||||||||
| Outside United States | 34,033 | 27,867 | 21,881 | 6,098 | 2 | 4,243 | 2 | 3,427 | 2 | |||||||||||||||
| Total | $ | 51,324 | $ | 44,958 | $ | 41,517 | $ | 12,524 | $ | 9,997 | $ | 8,851 | ||||||||||||
| 1 | Sales of machinery and engines are based on dealer or customer location. Revenues from services provided are based on where service is rendered. | |||||||||||||||||||||||
| 2 | Amount includes $791 million, $786 million and $725 million of net property, plant and equipment located in the United Kingdom as of December 31, 2008, 2007 and 2006, respectively. | |||||||||||||||||||||||
| 25. | Business combinations |
Lovat Inc. In April 2008, we acquired 100 percent of the equity in privately held Lovat Inc. (Lovat) for approximately $49 million. Based in Toronto, Canada, Lovat is a leading manufacturer of tunnel boring machines used globally in the construction of subway, railway, road, sewer, water main, mine access and high voltage cable and telecommunications tunnels. Expansion into the tunnel boring business is a strong fit with our strategic direction and the customers we serve around the world. The transaction was financed with available cash and commercial paper borrowings. Net tangible assets acquired and liabilities assumed of $10 million were recorded at their fair values. Finite-lived intangible assets acquired of $17 million related to customer relationships, intellectual property and trade names are being amortized on a straight-line basis over a weighted-average amortization period of approximately 6 years. Goodwill of $22 million, non-deductible for income tax purposes, represents the excess of cost over the fair value of net tangible and finite-lived intangible assets acquired. These values represent a preliminary allocation of the purchase price subject to finalization of fair value appraisals and other post-closing procedures. The results of the acquired business for the period from the acquisition date are included in the accompanying consolidated financial statements and reported in the “Mining” segment in Note 24. Assuming this transaction had been made at the beginning of any period presented, the consolidated pro forma results would not be materially different from reported results. Gremada Industries Inc. In July 2008, we acquired certain assets and assumed certain liabilities of Gremada Industries, Inc. (Gremada), a supplier to our remanufacturing business. The cost of the acquisition was $62 million, consisting of $60 million paid at closing and an additional $2 million post-closing adjustment paid in August 2008. Gremada is a remanufacturer of transmissions, torque converters, final drives and related components. This acquisition increases our product and service offerings for our existing customers, while providing a platform for further growth opportunities. This transaction was financed with available cash and commercial paper borrowings. Net tangible assets acquired and liabilities assumed of $21 million were recorded at their fair values. Goodwill of $41 million, deductible for income tax purposes, represents the excess cost over the fair value of net tangible and finite-lived intangible assets acquired. The results of the acquired business for the period from the acquisition date are included in the accompanying consolidated financial statements and are reported in the “All Other” category in Note 24. Assuming this transaction had been made at the beginning of any period presented, the consolidated pro forma results would not be materially different from reported results. |
Page A-55
Shin Caterpillar Mitsubishi Ltd. (SCM) On August 1, 2008, SCM completed the first phase of a share redemption plan whereby SCM redeemed half of MHI’s shares in SCM for $464 million. This resulted in Caterpillar owning 67 percent of the outstanding shares of SCM and MHI owning the remaining 33 percent. As part of the share redemption, SCM was renamed Caterpillar Japan Ltd. (Cat Japan). Both Cat Japan and MHI have options, exercisable after five years, to require the redemption of the remaining shares owned by MHI, which if exercised, would make Caterpillar the sole owner of Cat Japan. The share redemption plan is part of our comprehensive business strategy for expansion in the emerging markets of Asia and the Commonwealth of Independent States and will allow Cat Japan’s manufacturing, design and process expertise to be fully leveraged across the global Caterpillar enterprise. The change in Caterpillar’s ownership interest from 50 percent to 67 percent was accounted for as a business combination. The $464 million redemption price was assigned to 17 percent of Cat Japan’s assets and liabilities based upon their respective fair values as of the transaction date. The revaluation resulted in an increase in property, plant and equipment of $78 million and an increase in inventory of $8 million over the book value of these assets. Finite-lived intangible assets of $54 million were recognized and related primarily to customer relationships, intellectual property and trade names. These intangibles are being amortized on a straight-line basis over a weighted-average amortization period of approximately 9 years. Deferred tax liabilities of $57 million were also recognized as part of the business combination. Goodwill of $206 million, non-deductible for income tax purposes, represents the excess of the redemption price over the 17 percent of Cat Japan’s net tangible and finite-lived intangible assets that were reported at their fair values. Because Cat Japan is accounted for on a lag, we consolidated Cat Japan’s August 1, 2008 financial position on September 30, 2008. We began consolidating Cat Japan’s results of operations in the fourth quarter of 2008. Including the amounts assigned as part of the business combination, the initial consolidation of Cat Japan’s financial position resulted in a net increase in assets of $2,396 million (primarily property, plant and equipment of $1,279 million, inventory of $640 million, receivables of $612 million, and goodwill and intangibles of $260 million partially offset by a $528 million reduction in investment in unconsolidated affiliates) and a net increase in liabilities of $2,045 million (including $1,388 million in debt). Cat Japan’s functional currency is the Japanese Yen. Additionally, the remaining 33 percent of Cat Japan owned by MHI has been reported as redeemable noncontrolling interest and classified as mezzanine equity (temporary equity) in the Consolidated Statement of Financial Position. On September 30, 2008, the redeemable noncontrolling interest was reported at its estimated future redemption value of $464 million with the difference between the $351 million book value of the 33 percent interest and the redemption value reported as a $113 million reduction of Profit employed in the business. In subsequent reporting periods, the redeemable noncontrolling interest will continue to be reported at its estimated redemption value. Any adjustment to the redemption value will impact Profit employed in the business, but will not impact Profit. If the fair value of the redeemable noncontrolling interest falls below the redemption value, profit available to common stockholders would be reduced by the difference between the redemption value and the fair value. This would result in lower profit in the profit per common share computation in that period. Reductions impacting the profit per common share computation may be partially or fully reversed in subsequent periods if the fair value of the redeemable noncontrolling interest increases relative to the redemption value. Such increases in profit per common share would be limited to cumulative prior reductions. As of December 31, 2008, there has been no change to the estimated future redemption value, and the fair value of the redeemable noncontrolling interest has remained greater than the redemption value. With the consolidation of Cat Japan’s results of operations, 33 percent of Cat Japan’s comprehensive income or loss is attributed to the redeemable noncontrolling interest, impacting its carrying value. Because the redeemable noncontrolling interest must be reported at its estimated future redemption value, the impact from attributing the comprehensive income or loss is offset by adjusting the carrying value to the redemption value. This adjustment impacts Profit employed in the business, but not Profit. In 2008, we adjusted the carrying value by $2 million resulting in a corresponding reduction to Profit employed in the business. As Cat Japan’s functional currency is the Japanese Yen, changes in exchange rates affect the reported amount of the redeemable noncontrolling interest. At December 31, 2008, the redeemable noncontrolling interest was $524 million. Cat Japan was included in the “Cat Japan” segment in Note 24. Assuming this transaction had been made at the beginning of any period presented, the consolidated pro forma results would not be materially different from reported results. |
Forestry Division of Blount International, Inc. In November 2007, we acquired substantially all of the assets and assumed certain liabilities of Blount International’s Forestry Division. The cost of the acquisition was $82 million, consisting of $79 million in cash and a net employee benefit liability incurred of $3 million. Blount’s Forestry Division manufactures, markets and supports timber harvesting and processing equipment, loaders and attachments. The acquisition supports our corporate objective to be the forestry market leader and enables us to offer the broadest product line in the industry with a full range of products and services for logging, millyard, road-building and land management. |
Page A-56
| This transaction was financed with available cash and commercial paper borrowings. Net tangible assets acquired and liabilities assumed of $36 million were recorded at their fair values. Finite-lived intangible assets acquired of $24 million related to customer relationships, intellectual property and trade names are being amortized on a straight-line basis over a weighted-average amortization period of approximately 9 years. Goodwill of $22 million, deductible for income tax purposes, represents the excess of cost over the fair value of net tangible and finite-lived intangible assets acquired. The results of the acquired business for the period from the acquisition date are included in the accompanying consolidated financial statements and reported in the “Building Construction Products” segment in Note 24. Assuming this transaction had been made at the beginning of any period presented, the consolidated pro forma results would not be materially different from reported results. |
Franklin Power Products In February 2007, we acquired certain assets and assumed certain liabilities of Franklin Power Products, Inc. (FPP) and International Fuel Systems, Inc. (IFS), subsidiaries of Remy International. In June 2007, pursuant to the acquisition agreement, additional assets were purchased from Remy International for $7 million which increased the total purchase price to approximately $165 million, consisting of $160 million paid at the closings and an additional $5 million post closing adjustment paid in July 2007. FPP is a remanufacturer of on-highway light and medium duty truck diesel engines and engine components. IFS provides remanufactured diesel components such as high-pressure fuel pumps, fuel injectors and turbochargers. This acquisition represents a strategic expansion of our engine and engine component remanufacturing operations. This transaction was financed with available cash and commercial paper borrowings. Net tangible assets acquired and liabilities assumed of $39 million were recorded at their fair values. Finite-lived intangible assets acquired of $89 million related to customer relationships are primarily being amortized on a straight-line basis over 20 years. Goodwill of $37 million, deductible for income tax purposes, represents the excess of cost over the fair value of net tangible and finite-lived intangible assets acquired. The results of the acquired business for the period from the acquisition date are included in the accompanying consolidated financial statements and reported in the “All Other” category in Note 24. Assuming this transaction had been made at the beginning of any period presented, the consolidated pro forma results would not be materially different from reported results. |
Large Components Business of Royal Oak Industries, Inc. In August 2006, we acquired the large components business of Royal Oak Industries, Inc. (Royal Oak), a supplier to our engines business, for $97 million, consisting of $92 million at closing and $5 million plus accrued interest paid in December 2008. The business acquired provides machining of engine cylinder blocks, heads, manifolds and bearing caps. This acquisition expands our machining operations in our engine manufacturing business. The transaction was financed with available cash and commercial paper borrowings. Net tangible assets acquired of $58 million, consisting of property, plant and equipment, accounts receivable and inventory, were recorded at their fair values. No intangible assets were acquired. Goodwill of $39 million, deductible for income tax purposes, represents the excess of cost over the fair value of the acquired net tangible assets. The results of the acquired business for the period from the acquisition date are included in the accompanying consolidated financial statements and reported in the “Large Power Systems” segment in Note 24. Assuming this transaction had been made at the beginning of any period presented, the consolidated pro forma results would not be materially different from reported results. |
Progress Rail Services, Inc. In June 2006, Caterpillar acquired 100 percent of the equity in privately held Progress Rail Services, Inc. (Progress Rail) for approximately $1 billion, including the assumption of $200 million in debt. Based in Albertville, Alabama, Progress Rail is a leading provider of remanufactured locomotive, railcar and track products and services to the North American railroad industry. The company also has one of the most extensive rail service and supply networks in North America. When acquired, Progress Rail operated more than 90 facilities in 29 states in the United States, Canada and Mexico, with about 3,700 employees. Expansion into the railroad aftermarket business is a strong fit with our strategic direction and will leverage Caterpillar's remanufacturing capabilities. The transaction was financed with available cash and commercial paper borrowings of $427 million and Caterpillar stock of $379 million (5.3 million shares). Net tangible assets acquired, recorded at their fair values, primarily were inventories of $257 million, receivables of $169 million and property, plant and equipment of $260 million. Liabilities acquired, recorded at their fair values, primarily consisted of assumed debt of $200 million, accounts payable of $148 million and net deferred tax liabilities of $115 million. Finite-lived intangible assets acquired of $223 million related primarily to customer relationships are being amortized on a straight-line basis over 20 years. Goodwill of $431 million, non-deductible for income tax purposes, represents the excess of cost over the fair value of net tangible and finite-lived intangible assets acquired. The results of the acquired business for the period from the acquisition date are included in the accompanying consolidated financial statements and reported in the “All Other” category in Note 24. Assuming this transaction had been made at the beginning of any period presented, the consolidated pro forma results would not be materially different from reported results. |
Page A-57
| 26. | Employee separation charges |
During 2008, we recognized employee separation charges of $30 million in Other operating expenses in Statement 1 related to various voluntary and involuntary separation programs. These programs, impacting approximately 3,000 production and support and management employees world-wide, are in response to a sharp decline in sales volume due to the current global recession. Our accounting for separations is dependent upon how the particular program is designed. For voluntary programs, eligible separation costs are recognized at the time of employee acceptance. For involuntary programs, eligible costs are recognized when management has approved the program, the affected employees have been properly identified and the costs are estimable. The separation charges, which will be made up primarily of cash severance payments, were not assigned to operating segments and are included in the reconciliation of total accountable profit from reportable segments to total profit before taxes. See Note 24 for further details. The following table summarizes the separation charges by geographic region: |
| (Millions of dollars) | North America | EAME | Latin America | Total | |||||||||||||
| 2008 Separation charges | $ | 4 | $ | 17 | $ | 9 | $ | 30 | |||||||||
| 2008 Separation payments | — | (12 | ) | (7 | ) | (19 | ) | ||||||||||
| Liability balance at December 31, 2008 | $ | 4 | $ | 5 | $ | 2 | $ | 11 | |||||||||
| As of December 31, 2008, approximately 1,600 employees had separated, with the remaining separations expected by the end of first quarter 2009. The majority of the remaining costs will be paid by the end of the first quarter 2009. |
| 27. | Selected quarterly financial results (unaudited) |
| 2008 Quarter | ||||||||||||||||
| (Dollars in millions except per share data) | 1st | 2nd | 3rd | 4th | ||||||||||||
| Sales and revenues | $ | 11,796 | $ | 13,624 | $ | 12,981 | $ | 12,923 | ||||||||
| Less: Revenues | (817 | ) | (827 | ) | (833 | ) | (803 | ) | ||||||||
| Sales | 10,979 | 12,797 | 12,148 | 12,120 | ||||||||||||
| Cost of goods sold | 8,609 | 10,036 | 9,704 | 10,066 | ||||||||||||
| Gross margin | 2,370 | 2,761 | 2,444 | 2,054 | ||||||||||||
Profit 1 | $ | 922 | $ | 1,106 | $ | 868 | $ | 661 | ||||||||
| Profit per common share | $ | 1.49 | $ | 1.80 | $ | 1.43 | $ | 1.10 | ||||||||
| Profit per common share—diluted | $ | 1.45 | $ | 1.74 | $ | 1.39 | $ | 1.08 | ||||||||
| 2007 Quarter | ||||||||||||||||
1st | 2nd | 3rd | 4th | |||||||||||||
| Sales and revenues | $ | 10,016 | $ | 11,356 | $ | 11,442 | $ | 12,144 | ||||||||
| Less: Revenues | (695 | ) | (743 | ) | (774 | ) | (784 | ) | ||||||||
| Sales | 9,321 | 10,613 | 10,668 | 11,360 | ||||||||||||
| Cost of goods sold | 7,136 | 8,300 | 8,270 | 8,920 | ||||||||||||
| Gross margin | 2,185 | 2,313 | 2,398 | 2,440 | ||||||||||||
Profit 1 | $ | 816 | $ | 823 | $ | 927 | $ | 975 | ||||||||
| Profit per common share | $ | 1.27 | $ | 1.28 | $ | 1.45 | $ | 1.55 | ||||||||
| Profit per common share—diluted | $ | 1.23 | $ | 1.24 | $ | 1.40 | $ | 1.50 | ||||||||
| 1 | Profit attributable to common stockholders. | ||||||||||||||||
Page A-58
| 28. | Subsequent events |
Employee Separation Programs In response to the expected sharp decline in 2009 sales volume, Caterpillar implemented the following employee separation programs during 2009: U.S. Voluntary Separation Program - During December 2008, we announced a voluntary separation program for certain support and management employees based in the United States. Eligible employees had until January 12, 2009 to sign-up for the plan, and generally until January 31, 2009 to make a final decision. Participating employees will receive severance pay based on current salary level and years of service. As of January 31, 2009, approximately 2,200 employees had accepted the program and are generally expected to separate from Caterpillar by March 31, 2009. We are currently estimating the costs associated with this program. Other U.S. Separation Programs - During 2009, we initiated plans to reduce U.S. based production and support and management positions through a variety of programs. For support and management employees, these include involuntary separation programs. For production employees, these include both involuntary and voluntary separation programs. We are currently estimating the costs associated with these programs. Non-U.S. Separation Programs - We have initiated several other separation programs during 2009. These programs, designed specific to the laws and regulations of the individual countries, represent voluntary and involuntary plans for production and support and management employees. We are currently estimating the costs associated with these programs. We will continue to monitor the economic environment and, depending on business conditions, more voluntary and involuntary workforce reductions may be required as 2009 unfolds. Cat Financial Debt Issuance On February 12, 2009, Cat Financial issued $350 million of 5.75% notes due in 2012, $1.65 billion of 6.125% notes due in 2014 and $1.0 billion of 7.15% notes due in 2019. The net proceeds from the issuance will be used to reduce short-term debt and for general corporate purposes. |
| 29. | Retrospective adjustment |
These consolidated financial statements include the following retrospective adjustments that have been made to the consolidated financial statements that we filed in our Annual Report on Form 10-K for the year ended December 31, 2008: | ||
· | We adopted SFAS 160 effective January 1, 2009 and the accompanying consolidated financial statements have been retrospectively adjusted for all periods presented. | |
· | We implemented a reorganization effective January 1, 2009 which changed our operating and reportable segments and the accompanying consolidated financial statements have been retrospectively adjusted for all periods presented. | |
Page A-59
(Dollars in millions except per share data) | |||||||||||||||||||||
2008 | 2007 | 2006 | 20054 | 20044 | |||||||||||||||||
| Years ended December 31, | |||||||||||||||||||||
| Sales and revenues | $ | 51,324 | $ | 44,958 | $ | 41,517 | $ | 36,339 | $ | 30,306 | |||||||||||
| Sales | $ | 48,044 | $ | 41,962 | $ | 38,869 | $ | 34,006 | $ | 28,336 | |||||||||||
| Percent inside the United States | 33 | % | 37 | % | 46 | % | 47 | % | 46 | % | |||||||||||
| Percent outside the United States | 67 | % | 63 | % | 54 | % | 53 | % | 54 | % | |||||||||||
| Revenues | $ | 3,280 | $ | 2,996 | $ | 2,648 | $ | 2,333 | $ | 1,970 | |||||||||||
Profit 6, 7, 8 | $ | 3,557 | $ | 3,541 | $ | 3,537 | $ | 2,854 | $ | 2,035 | |||||||||||
Profit per common share 1, 6, 7 | $ | 5.83 | $ | 5.55 | $ | 5.37 | $ | 4.21 | $ | 2.97 | |||||||||||
Profit per common share—diluted 2, 6, 7 | $ | 5.66 | $ | 5.37 | $ | 5.17 | $ | 4.04 | $ | 2.88 | |||||||||||
| Dividends declared per share of common stock | $ | 1.620 | $ | 1.380 | $ | 1.150 | $ | 0.955 | $ | 0.800 | |||||||||||
Return on average common stockholders' equity 3, 5, 7, 9 | 46.8 | % | 44.4 | % | 45.9 | % | 35.7 | % | 29.9 | % | |||||||||||
| Capital expenditures: | |||||||||||||||||||||
| Property, plant and equipment | $ | 2,445 | $ | 1,700 | $ | 1,593 | $ | 1,201 | $ | 926 | |||||||||||
| Equipment leased to others | $ | 1,566 | $ | 1,340 | $ | 1,082 | $ | 1,214 | $ | 1,188 | |||||||||||
| Depreciation and amortization | $ | 1,980 | $ | 1,797 | $ | 1,602 | $ | 1,477 | $ | 1,397 | |||||||||||
| Research and development expenses | $ | 1,728 | $ | 1,404 | $ | 1,347 | $ | 1,084 | $ | 928 | |||||||||||
| As a percent of sales and revenues | 3.4 | % | 3.1 | % | 3.2 | % | 3.0 | % | 3.1 | % | |||||||||||
| Wages, salaries and employee benefits | $ | 9,076 | $ | 8,331 | $ | 7,512 | $ | 6,928 | $ | 6,025 | |||||||||||
| Average number of employees | 106,518 | 97,444 | 90,160 | 81,673 | 73,033 | ||||||||||||||||
December 31, | |||||||||||||||||||||
Total assets 5, 7 | $ | 67,782 | $ | 56,132 | $ | 51,449 | $ | 47,553 | $ | 43,501 | |||||||||||
| Long-term debt due after one year: | |||||||||||||||||||||
| Consolidated | $ | 22,834 | $ | 17,829 | $ | 17,680 | $ | 15,677 | $ | 15,837 | |||||||||||
| Machinery and Engines | $ | 5,736 | $ | 3,639 | $ | 3,694 | $ | 2,717 | $ | 3,663 | |||||||||||
| Financial Products | $ | 17,098 | $ | 14,190 | $ | 13,986 | $ | 12,960 | $ | 12,174 | |||||||||||
| Total debt: | |||||||||||||||||||||
| Consolidated | $ | 35,535 | $ | 28,429 | $ | 27,296 | $ | 25,745 | $ | 23,525 | |||||||||||
| Machinery and Engines | $ | 7,824 | $ | 4,006 | $ | 4,277 | $ | 3,928 | $ | 3,762 | |||||||||||
| Financial Products | $ | 27,711 | $ | 24,423 | $ | 23,019 | $ | 21,817 | $ | 19,763 | |||||||||||
| 1 | Computed on weighted-average number of shares outstanding. |
| 2 | Computed on weighted-average number of shares outstanding diluted by assumed exercise of stock-based compensation awards, using the treasury stock method. |
| 3 | Represents profit divided by average stockholders' equity (beginning of year stockholders' equity plus end of year stockholders' equity divided by two). |
| 4 | The per share data reflects the 2005 2-for-1 stock split. |
| 5 | As discussed in Note 1K, effective December 31, 2006 we changed the manner in which we accounted for postemployment benefits upon the adoption of SFAS 158. |
| 6 | As discussed in Note 1M, in 2006 we changed the manner in which we accounted for stock-based compensation upon the adoption of SFAS 123R. |
| 7 | As discussed in Note 1K, in 2007 we changed the manner in which we accounted for uncertain tax positions upon the adoption of FIN 48. |
| 8 | Profit attributable to common stockholders. |
| 9 | As discussed in Note 29, effective January 1, 2009, we changed the manner in which we accounted for noncontrolling interests. |
Page A-60
MANAGEMENT'S DISCUSSION AND ANALYSIS OF FINANCIAL CONDITION AND RESULTS OF OPERATIONS
Management's Discussion and Analysis of Financial Condition and Results of Operations which follows has been retrospectively adjusted for the Company's adoption of SFAS 160 and changes to its operating and reportable segments. See Note 29 to the Consolidated Financial Statements for additional details.
2008 sales and revenues were $51.324 billion, up 14 percent from 2007. Profit per share was $5.66, up 5 percent and profit after tax of $3.557 billion was about flat with 2007. Fourth-quarter sales and revenues were $12.923 billion, 6 percent higher than the fourth quarter of 2007. Profit per share for the quarter was $1.08, down 28 percent from the fourth quarter of 2007.
While 2008 was our sixth consecutive year of record sales and revenues, it was an extraordinarily challenging year. Through the first three quarters we experienced booming demand from key global industries, notably mining and energy, and most emerging market countries. Delivery times for many products were extended, and we were focused on increasing production and expediting shipments to meet customer needs. Then we were whipsawed in the fourth quarter as key industries were hit by a rapidly deteriorating global economy and plunging commodity prices. In anticipation of lower demand we encouraged dealers to align inventory with declining volume, and they responded with significant order cancellations, particularly in December.
For the year, sales and revenues increased $6.366 billion— $3.816 billion from higher sales volume, $1.352 billion from improved price realization, $653 million from the effects of currency, $284 million from higher Financial Products revenues and $261 million from the consolidation of Caterpillar Japan Ltd. (Cat Japan). Profit for 2008 was about flat with 2007, with the positive impact of higher price realization, improved sales volume and lower income tax expense about offset by higher operating costs, especially material and freight costs.
Fourth-quarter sales and revenues of $12.923 billion increased $779 million from the fourth quarter of last year. Higher sales volume of $494 million, improved price realization of $308 million, $261 million related to the consolidation of Cat Japan and $19 million from higher Financial Products revenues were partially offset by $303 million of lower sales from the effects of currency. Fourth-quarter profit of $661 million decreased $314 million as significantly higher Machinery and Engines operating costs and a sharp decline in profit related to Financial Products, more than offset a $409 million favorable tax item and favorable price realization.
Fourth-quarter profit was disappointing, particularly in light of record fourth-quarter sales and revenues and a significant favorable tax adjustment. Fourth-quarter costs included transitional expenses as we moved to lower volumes and initiated production cuts. In addition, Financial Products results were impaired by financial market turbulence. It is now clear that we need to sharply lower our production and costs, and aggressive actions were triggered in December.
Global economic conditions and key commodity prices have continued to decline significantly. Financial markets remain under stress, and our expectations for 2009 have deteriorated. Uncertainty around the depth and duration of this recession makes it very difficult to forecast sales and revenues. As a result, we are rapidly executing strategic “trough” plans and implementing actions throughout the company to deal with a very challenging global business environment. We have initiated actions which will remove about 20,000 workers from our business and every indirect spend dollar will be heavily scrutinized. These actions support lowering our production costs in line with a 25-percent decline in sales volume and reducing Selling, General and Administrative (SG&A) and Research and Development (R&D) costs supporting our Machinery and Engines business by about 15 percent. We are encouraged by government stimulus programs and actions taken by central banks around the world to spur growth. However, economic conditions remain uncertain, and we are planning for 2009 sales and revenues to be in a range of plus or minus 10 percent from $40 billion. At $40 billion in 2009 sales and revenues, the company expects to achieve profit of about $2.00 per share, or $2.50 per share excluding redundancy costs.
These are very uncertain times, and it’s imperative that we focus Team Caterpillar on dramatically reducing production schedules and costs in light of poor economic conditions throughout the world. While it’s painful for our employees and suppliers, it’s absolutely necessary given economic circumstances. We expect to have most of the actions needed to lower employment and cost levels in place by the end of the first quarter.
Page A-61
Without a doubt, 2009 will be a very tough year, but it is important to remember that economic cycles are not new, and we will emerge from this even stronger than we are today. Throughout our 83-year history Caterpillar has successfully managed through the Great Depression, several recessions, a world war and numerous other adversities. We’re a strong company with a management team that’s been through tough times before. We are the global leader, with an unparalleled dealer network. We’ve strengthened our market position in past recessions, and we have done so over the past few months. In addition, we will continue to invest in product technology and operational efficiency through these tough times. When the economy does recover, the need for better housing, roads and capacity for energy and mining will still be there, and we will be prepared to respond.
*Glossary of terms included on pages A-81 to A-82; first occurrence of terms shown in bold italics.
SALES AND REVENUES
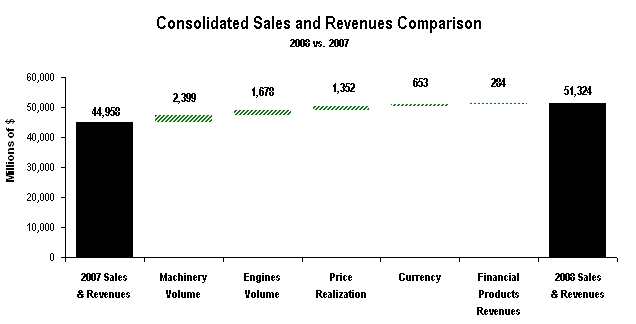 | ||
| The chart above graphically illustrates reasons for the change in Consolidated Sales and Revenues between 2007 (at left) and 2008 (at right). Items favorably impacting sales and revenues appear as upward stair steps with the corresponding dollar amounts above each bar, while items negatively impacting sales and revenues appear as downward stair steps with dollar amounts reflected in parentheses above each bar. The bar entitled Machinery Volume includes the impact of consolidation of Cat Japan sales. Caterpillar management utilizes these charts internally to visually communicate with the company’s Board of Directors and employees. | ||
Sales and revenues for 2008 were $51.324 billion, up $6.366 billion, 14 percent, from 2007. Machinery sales volume was up $2.399 billion, driven by strength in developing economies. Engines sales volume increased $1.678 billion due to growth in all major industries, with particular strength in petroleum.
In addition, price realization contributed $1.352 billion, currency had a positive impact on sales of $653 million driven primarily by the stronger euro and Financial Products revenues increased 9 percent.
Page A-62
Sales and Revenues by Geographic Region | |||||||||||||||||||||||||||||||||||
(Millions of dollars) | Total | % Change | North America | % Change | EAME | % Change | Asia/ Pacific | % Change | Latin America | % Change | |||||||||||||||||||||||||
| 2008 | |||||||||||||||||||||||||||||||||||
| Machinery | $ | 31,804 | 12 | % | $ | 12,769 | 1 | % | $ | 9,220 | 7 | % | $ | 5,709 | 42 | % | $ | 4,106 | 30 | % | |||||||||||||||
Engines 1 | 16,240 | 19 | % | 5,445 | 7 | % | 6,311 | 20 | % | 2,910 | 36 | % | 1,574 | 39 | % | ||||||||||||||||||||
Financial Products 2 | 3,280 | 9 | % | 2,001 | — | 590 | 23 | % | 361 | 50 | % | 328 | 21 | % | |||||||||||||||||||||
| $ | 51,324 | 14 | % | $ | 20,215 | 3 | % | $ | 16,121 | 13 | % | $ | 8,980 | 40 | % | $ | 6,008 | 32 | % | ||||||||||||||||
| 2007 | |||||||||||||||||||||||||||||||||||
| Machinery | $ | 28,359 | $ | 12,596 | $ | 8,588 | $ | 4,026 | $ | 3,149 | |||||||||||||||||||||||||
Engines 1 | 13,603 | 5,092 | 5,245 | 2,136 | 1,130 | ||||||||||||||||||||||||||||||
Financial Products 2 | 2,996 | 2,007 | 479 | 240 | 270 | ||||||||||||||||||||||||||||||
| $ | 44,958 | $ | 19,695 | $ | 14,312 | $ | 6,402 | $ | 4,549 | ||||||||||||||||||||||||||
| 1 | Does not include internal engine transfers of $2.822 billion and $2.549 billion in 2008 and 2007, respectively. Internal engine transfers are valued at prices comparable to those for unrelated parties. | ||||||||||||||||||||||||||||||||||
| 2 | Does not include revenues earned from Machinery and Engines of $308 million and $400 million in 2008 and 2007, respectively. | ||||||||||||||||||||||||||||||||||
Machinery Sales
Sales of $31.804 billion increased $3.445 billion, or 12 percent, from 2007.
| § | Excluding the consolidation of Cat Japan, sales volume increased $2.138 billion, with the gain occurring in the developing economies of Africa/Middle East, Commonwealth of Independent States (CIS), Asia/Pacific and Latin America. |
| § | Price realization increased $541 million. |
| § | Currency benefited sales by $505 million. |
| § | Geographic mix between regions (included in price realization) was $2 million favorable. |
| § | The consolidation of Cat Japan added $261 million to 2008 sales. |
| § | Dealers in all regions reported higher inventories than year-end 2007 in both dollars and months of supply. |
| § | The U.S. economy was in recession throughout 2008, which contributed to weaknesses in both construction and quarrying. Coal mining and oil sands development were about the only positives for North America. |
| § | The euro-zone entered recession in the second quarter and the United Kingdom in the third quarter. As a result of these recessions, housing construction declined sharply, nonresidential construction weakened and sales volume declined. |
| § | Sales improved in the developing regions of Africa/Middle East, CIS, Asia/Pacific and Latin America through the first three quarters of 2008. However, growth slowed sharply in the fourth quarter in response to weakening economies. |
North America – Sales increased $173 million, or 1 percent.
| § | Sales volume decreased $143 million. |
| § | Price realization increased $316 million. |
| § | Dealers added slightly to reported inventories this year, a contrast to more than a billion-dollar reduction in 2007. Dealers reported higher inventories than a year earlier in both dollars and months of supply. |
| § | Dealers reported significantly lower deliveries to end users, a result of the recession in the United States that persisted throughout the year. That recession led to lower sales in most key industries other than coal mining and the Canadian oil sands. |
| § | U.S. housing starts declined to 904 thousand units, the lowest since 1945. Negatives for housing included a severe tightening in mortgage lending standards, sharp declines in home prices and more than an 11-month supply of unsold new homes. Canadian housing starts declined 6 percent. |
| § | Spending for U.S. nonresidential construction increased in response to the surge in new orders over the past few years. However, new orders for commercial construction declined 18 percent in 2008. Problems for building construction included increased vacancy rates, declines in property prices and tighter credit conditions for businesses. |
Page A-63
| § | New orders for highway construction declined almost 7 percent. Unfavorable factors included limited growth in Federal highway funding, state and local government budget difficulties and a sharp increase in material input prices. |
| § | Nonmetals mining and quarry production dropped almost 14 percent in response to lower construction activity. |
| § | The Central Appalachian coal price rose 90 percent, driven by a 43-percent increase in U.S. coal exports. U.S. coal production increased 2.2 percent, and Canadian production rose 1.2 percent. As a result, sales of the large tractors used in coal mining surged. |
| § | Investment in Canadian oil sands increased 23 percent, benefiting from a 38-percent increase in crude oil prices. |
EAME – Sales increased $632 million, or 7 percent.
| § | Sales volume increased $196 million. |
| § | Price realization increased $66 million. |
| § | Currency benefited sales by $370 million. |
| § | Dealers reported year-end 2008 inventories that were significantly higher than a year earlier in both dollars and months of supply. |
| § | Sales volume dropped in both the euro-zone and the United Kingdom, due to recessions and a slowing in construction. |
| § | Housing permits in the euro-zone dropped 22 percent, and U.K. housing orders fell 35 percent. High interest rates and home price declines in several European countries contributed to weakness in housing. |
| § | Mining and energy development, as well as increased construction, caused sales volume to increase in Africa/Middle East. Oil prices increased 37 percent, and production rose more than 4 percent from a year earlier, which led to an increase in drilling. |
| § | Sales volume increased significantly in the CIS region, despite economic problems that developed in the fourth quarter. Positive factors included low interest rates, increased government spending, increased energy prices and higher production of most energy commodities. |
Asia/Pacific – Sales increased $1,683 million, or 42 percent.
| § | Sales volume excluding the consolidation of Cat Japan increased $1,254 million. |
| § | Price realization increased $91 million. |
| § | Currency benefited sales by $77 million. |
| § | The consolidation of Cat Japan added $261 million to 2008 sales. |
| § | Dealers reported year-end 2008 inventories that were significantly higher than a year earlier in both dollars and months of supply. |
| § | The largest gain in sales volume occurred in China, the result of higher sales of locally produced wheel loaders and increased construction activity. |
| § | Another large gain in sales volume occurred in Indonesia, largely due to much higher coal prices. Indonesia is the world’s largest exporter of thermal coal, and coal supplies in Asia were very tight for most of the year. |
| § | Sales volume increased in Australia, primarily due to high metals and energy prices. Capital expenditures for mineral development increased 37 percent, and expenditures for coal increased 46 percent. Rapid growth in the mining industry stretched infrastructure capacity so investment in infrastructure increased 13 percent. |
| § | In India, 11-percent growth in construction and 4 percent higher mining output contributed to an increase in sales volume. |
Latin America – Sales increased $957 million, or 30 percent.
| § | Sales volume increased $833 million. |
| § | Price realization increased $66 million. |
| § | Currency benefited sales by $58 million. |
| § | Dealers reported year-end 2008 inventories that were significantly higher than a year earlier in both dollars and months of supply. |
Page A-64
| § | Brazil had the largest increase in sales volume. Economic growth continued to benefit from interest rate reductions taken in 2007, resulting in a 10-percent increase in construction. Iron ore exports increased 62 percent, due to increased production and much higher prices. |
| § | Sales volume increased sharply in Mexico. Positives included much higher oil prices, increased natural gas production and 3-percent growth in construction. |
| § | Sales volume growth in Colombia occurred in response to much higher coal prices. In Chile, high copper prices led to an increase in sales volume. |
Engines Sales
Sales of $16.240 billion increased $2.637 billion, or 19 percent, from 2007.
| § | Sales volume increased $1.678 billion. |
| § | Price realization increased $811 million. |
| § | Currency benefited sales $148 million. |
| § | Geographic mix between regions (included in price realization) was $36 million favorable. |
| § | Dealer-reported inventories were up, and months of supply were up slightly, supporting strong delivery rates. |
North America – Sales increased $353 million, or 7 percent.
| § | Sales volume increased $62 million. |
| § | Price realization increased $291 million. |
| § | Sales for on-highway truck applications increased 10 percent compared to a very weak 2007. Demand remained below historic norms due to the slowing U.S. economy that resulted in a reduction in freight tonnage. Also, the impact of the decision to exit the on-highway truck business was starting to be felt as Original Equipment Manufacturer (OEM) customers reduced their reliance on Caterpillar products. |
| § | Sales for petroleum engine applications increased 5 percent, driven by a slight increase in natural gas and drilling applications. |
| § | Sales for marine applications increased 37 percent, with strong demand early in the year for supply vessels that support offshore drilling. This more than offset a decline in engine sales for pleasure craft. |
| § | Sales for industrial applications increased 11 percent. |
| § | Sales for electric power applications decreased 2 percent due to economic uncertainty and tightening credit conditions. |
EAME – Sales increased $1,066 million, or 20 percent.
| § | Sales volume increased $639 million. |
| § | Price realization increased $293 million. |
| § | Currency benefited sales by $134 million. |
| § | Sales for petroleum applications increased 46 percent based on strong demand for engines used in drilling and production. Turbines and turbine-related services increased in support of gas transmission and oil and gas production applications in Africa, Europe and the Middle East. |
| § | Sales for electric power applications increased 18 percent, with strong demand for large- and mid-sized generator sets into Africa and the Middle East. Mid-sized generator sets also benefited from successful rental development. |
| § | Sales for marine applications increased 30 percent in workboats and commercial vessels. |
| § | Sales for industrial applications increased 6 percent, with strong demand for small engines used in the telecom sector. In addition, demand for agricultural applications also improved as a result of high agricultural commodity prices. |
Asia/Pacific – Sales increased $774 million, or 36 percent.
| § | Sales volume increased $603 million. |
| § | Price realization increased $157 million. |
| § | Currency benefited sales by $14 million. |
Page A-65
| § | Sales for petroleum applications increased 54 percent to support record Chinese drill rig activity and increased demand for Asian shipyards in support of offshore drilling. |
| § | Sales for marine applications increased 30 percent, with strong demand for workboats and offshore shipbuilding. Large diesel demand grew in the offshore and general cargo industries. |
| § | Sales of electric power engines increased 18 percent, with increased demand from Bangladesh industrial customers, and continued success with Chinese coal mine methane customers, for large gas generator sets. Diesel demand resulted from data and telecommunication center demand in China, and utility, mining and paper mill demand from Indonesia. |
| § | Sales for industrial applications increased 62 percent driven by sales in Australia into mining and irrigation sectors and by sales in New Zealand. |
Latin America – Sales increased $444 million, or 39 percent.
| § | Sales volume increased $410 million. |
| § | Price realization increased $34 million. |
| § | Sales for petroleum applications increased 61 percent driven by the heightened demand for power to support drilling and production in Argentina, Venezuela, Mexico and Peru. Turbines and turbine-related services increased for oil and gas production and gas transmission applications in South America. |
| § | Sales of electric power engines increased 37 percent driven by high commodity prices and infrastructure investment. |
| § | Sales for industrial applications increased 29 percent. This demand was driven by good economic conditions and higher agricultural commodity prices. |
| § | Sales for on-highway truck applications decreased 7 percent as a result of a loss of OEM business in this region. |
Financial Products Revenues
Revenues of $3.280 billion increased $284 million, or 9 percent, from 2007.
| § | Growth in average earning assets increased revenues $368 million, which was partially offset by a decrease of $175 million due to lower interest rates on new and existing finance receivables. |
| § | Revenues from earned premiums at Cat Insurance increased $84 million. |
Page A-66
OPERATING PROFIT
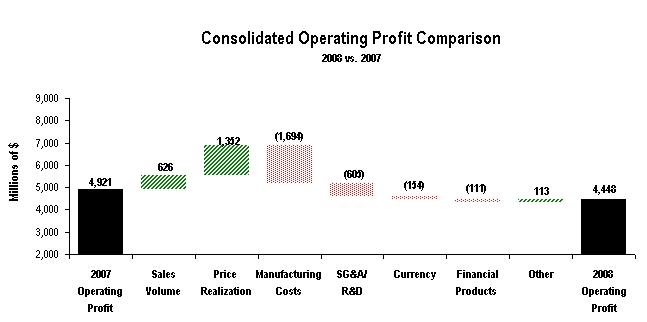 | ||
| The chart above graphically illustrates reasons for the change in Consolidated Operating Profit between 2007 (at left) and 2008 (at right). Items favorably impacting operating profit appear as upward stair steps with the corresponding dollar amounts above each bar, while items negatively impacting operating profit appear as downward stair steps with dollar amounts reflected in parentheses above each bar. Caterpillar management utilizes these charts internally to visually communicate with the company’s Board of Directors and employees. The bar entitled Other includes the operating profit impact of consolidating adjustments, consolidation of Cat Japan and Machinery and Engines other operating expenses. | ||
2008 operating profit of $4.448 billion was down $473 million from 2007 as improved price realization and higher sales volume were more than offset by higher costs and the unfavorable impact of currency.
Manufacturing costs increased $1.694 billion compared with 2007. The majority of the manufacturing cost increase was driven by higher material and freight costs. Material costs increased due to higher steel and commodity prices, and freight costs increased primarily due to higher fuel prices, and expediting costs related to higher production volume. In addition, manufacturing labor and overhead costs increased to support capacity expansion and velocity initiatives.
SG&A and R&D costs were up $605 million to support significant new product programs and growth.
Currency had a $154 million unfavorable impact on operating profit as the benefit to sales was more than offset by the negative impact on costs.
Operating Profit by Principal Line of Business | ||||||||||||||||
| (Millions of dollars) | 2008 | 2007 | $ Change | % Change | ||||||||||||
Machinery 1 | $ | 1,803 | $ | 2,758 | $ | (955 | ) | (35 | )% | |||||||
Engines 1 | 2,319 | 1,826 | 493 | 27 | % | |||||||||||
| Financial Products | 579 | 690 | (111 | ) | (16 | )% | ||||||||||
| Consolidating Adjustments | (253 | ) | (353 | ) | 100 | |||||||||||
| Consolidated Operating Profit | $ | 4,448 | $ | 4,921 | $ | (473 | ) | (10 | )% | |||||||
| 1 | Caterpillar operations are highly integrated; therefore, the company uses a number of allocations to determine lines of business operating profit for Machinery and Engines. | |||||||||||||||
| § | Machinery operating profit of $1.803 billion was down $955 million, or 35 percent, from 2007. Improved price realization and higher sales volume were more than offset by higher costs and the unfavorable impact of currency. Although machinery operating profit has declined in 2008, operating profit for the Mining segment improved primarily due to higher sales volumes and was a higher proportion of total machinery operating profit. |
Page A-67
| § | Engines operating profit of $2.319 billion was up $493 million, or 27 percent, from 2007. The favorable impacts of improved price realization and higher sales volume were partially offset by higher costs. |
| § | Financial Products operating profit of $579 million was down $111 million, or 16 percent, from 2007. The decrease was attributable to a $136 million increase in SG&A expenses due primarily to a $95 million increase in the provision for credit losses at Cat Financial, a $105 million impact from decreased net yield of average earning assets, partially offset by a $130 million favorable impact from higher average earning assets. |
OTHER PROFIT/LOSS ITEMS
| § | Other income/expense was income of $327 million compared with income of $357 million in 2007. The favorable currency impacts of $79 million were more than offset by a $50 million unfavorable change in mark-to-market adjustments on interest rate derivative contracts at Cat Financial and a $37 million impairment of investments in Cat Insurance’s portfolio as a result of poor market performance. In addition, a 2008 gain of $60 million on the sale of our equity investment in ASV was partially offset by the absence of a $46 million gain on the sale of a cost-basis investment in 2007. |
| § | The provision for income taxes for 2008 reflects an annual tax rate of 31.3 percent, excluding the discrete items discussed below, compared to a 29.8-percent rate in 2007. The increase in the tax rate excluding discrete items over 2007 is attributable to changes in our geographic mix of profits from a tax perspective. The provision for income taxes for 2008 also includes discrete benefits of $456 million. Repatriation of non-U.S. earnings resulted in a tax benefit of $409 million due to available foreign tax credits in excess of the U.S. tax liability on the dividend. A benefit of $47 million was also recorded in 2008 due to a change in tax status of a non-U.S. subsidiary allowing indefinite reinvestment of undistributed profits and reversal of U.S. tax previously recorded. |
| § | Equity in profit/(loss) of unconsolidated affiliated companies was income of $37 million compared with income of $73 million in 2007. The decrease is primarily related to lower profit at Shin Caterpillar Mitsubishi Ltd. (SCM) through the first nine months and the absence of profit after the consolidation of Cat Japan. On August 1, 2008, SCM redeemed one-half of Mitsubishi Heavy Industries Ltd.’s (MHI’s) shares in SCM for $464 million. Caterpillar now owns 67 percent of the renamed entity, Caterpillar Japan Ltd. We consolidated Cat Japan’s balance sheet on September 30, 2008. We began consolidating Cat Japan’s results of operations in the fourth quarter. |
Supplemental Information | |||||||||||||
| (Millions of dollars) | 2008 | 2007 | 2006 | ||||||||||
| Identifiable Assets: | |||||||||||||
| Machinery | $ | 24,607 | $ | 18,291 | $ | 16,748 | |||||||
| Engines | 13,672 | 11,785 | 10,268 | ||||||||||
| Financial Products | 34,381 | 30,870 | 28,593 | ||||||||||
| Consolidating Adjustments | (4,878 | ) | (4,814 | ) | (4,160 | ) | |||||||
| Total | $ | 67,782 | $ | 56,132 | $ | 51,449 | |||||||
| Capital Expenditures: | |||||||||||||
| Machinery | $ | 1,617 | $ | 1,090 | $ | 906 | |||||||
| Engines | 782 | 584 | 617 | ||||||||||
| Financial Products | 1,612 | 1,366 | 1,152 | ||||||||||
| Total | $ | 4,011 | $ | 3,040 | $ | 2,675 | |||||||
| Depreciation and Amortization: | |||||||||||||
| Machinery | $ | 839 | $ | 655 | $ | 550 | |||||||
| Engines | 386 | 438 | 393 | ||||||||||
| Financial Products | 755 | 704 | 659 | ||||||||||
| Total | $ | 1,980 | $ | 1,797 | $ | 1,602 | |||||||
| Caterpillar operations are highly integrated; therefore, the company uses a number of allocations to determine lines of business financial data. | |||||||||||||
Page A-68
SALES AND REVENUES
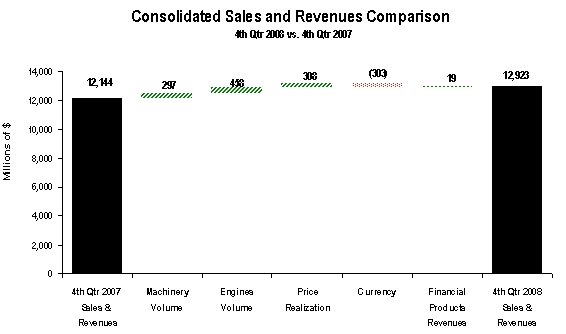 | ||
| The chart above graphically illustrates reasons for the change in Consolidated Sales and Revenues between fourth quarter 2007 (at left) and fourth quarter 2008 (at right). Items favorably impacting sales and revenues appear as upward stair steps with the corresponding dollar amounts above each bar, while items negatively impacting sales and revenues appear as downward stair steps with dollar amounts reflected in parentheses above each bar. The bar entitled Machinery Volume includes the impact of consolidation of Cat Japan sales. Caterpillar management utilizes these charts internally to visually communicate with the company’s Board of Directors and employees. | ||
Sales and revenues for fourth quarter 2008 were $12.923 billion, up $779 million, or 6 percent, from fourth quarter 2007. Machinery volume was up $297 million. Excluding Cat Japan, machinery volume was up $36 million. Engines volume was up $458 million, as growth in developing economies more than offset significant weakness in developed economies. Price realization improved $308 million. Financial Products revenues increased $19 million. Currency had a negative impact on sales of $303 million due to the strengthening of the U.S. dollar against most major currencies.
| Sales and Revenues by Geographic Region | ||||||||||||||||||||||||||||||||||||||||
| (Millions of dollars) | Total | % Change | North America | % Change | EAME | % Change | Asia/ Pacific | % Change | Latin America | % Change | ||||||||||||||||||||||||||||||
| Fourth Quarter 2008 | ||||||||||||||||||||||||||||||||||||||||
| Machinery | $ | 7,675 | 3 | % | $ | 2,833 | (9 | )% | $ | 2,013 | (13 | )% | $ | 1,652 | 38 | % | $ | 1,177 | 41 | % | ||||||||||||||||||||
Engines 1 | 4,445 | 14 | % | 1,379 | 8 | % | 1,670 | 3 | % | 849 | 30 | % | 547 | 55 | % | |||||||||||||||||||||||||
Financial Products 2 | 803 | 2 | % | 490 | (1 | )% | 144 | (4 | )% | 89 | 44 | % | 80 | 3 | % | |||||||||||||||||||||||||
| $ | 12,923 | 6 | % | $ | 4,702 | (4 | )% | $ | 3,827 | (6 | )% | $ | 2,590 | 36 | % | $ | 1,804 | 43 | % | |||||||||||||||||||||
| Fourth Quarter 2007 | ||||||||||||||||||||||||||||||||||||||||
| Machinery | $ | 7,460 | $ | 3,112 | $ | 2,322 | $ | 1,194 | $ | 832 | ||||||||||||||||||||||||||||||
Engines 1 | 3,900 | 1,275 | 1,617 | 654 | 354 | |||||||||||||||||||||||||||||||||||
Financial Products 2 | 784 | 494 | 150 | 62 | 78 | |||||||||||||||||||||||||||||||||||
| $ | 12,144 | $ | 4,881 | $ | 4,089 | $ | 1,910 | $ | 1,264 | |||||||||||||||||||||||||||||||
| 1 | Does not include internal engine transfers of $646 million and $652 million in fourth quarter 2008 and 2007, respectively. Internal engine transfers are valued at prices comparable to those for unrelated parties. | |||||||||||||||||||||||||||||||||||||||
| 2 | Does not include revenues earned from Machinery and Engines of $66 million and $104 million in fourth quarter 2008 and 2007, respectively. | |||||||||||||||||||||||||||||||||||||||
Page A-69
Machinery Sales
Sales $7.675 billion increased $215 million, or 3 percent, from fourth quarter 2007.
| § | Sales volume increased $36 million, with the gain occurring in the developing economies of Africa/Middle East, CIS, Asia/Pacific and Latin America. |
| § | Price realization increased $85 million. |
| § | Currency decreased sales by $167 million. |
| § | Geographic mix between regions (included in price realization) was $14 million favorable. |
| § | The consolidation of Cat Japan sales added $261 million to 2008 sales. |
| § | Dealers in all regions reported higher inventories than year-end 2007 in both dollars and months of supply. |
| § | The financial crisis intensified after the collapse of Lehman Brothers in mid September. Recessions in the developed countries worsened, and growth in the developing economies slowed abruptly. As a result, dealers reported lower deliveries to end users than a year earlier. |
| § | The U.S. economy probably declined at the fastest rate in more than 25 years. Construction, nonmetals mining and quarrying weakened further. Coal mining and oil sands development were about the only positives for North America. |
| § | The European economy declined, putting additional downward pressure on construction. |
| § | Sales volume increased in the developing regions of Africa/Middle East, CIS, Asia/Pacific and Latin America, although at a slower rate than earlier in the year. Higher interest rates, the credit crisis, lower commodity prices and reduced exports to developed countries were the major factors causing this slowing. |
North America – Sales decreased $279 million, or 9 percent.
| § | Sales volume decreased $354 million. |
| § | Price realization increased $75 million. |
| § | Sales volume declined in line with lower reported dealer deliveries to end users. Dealers added slightly to inventories, leaving them higher than a year earlier in both dollars and months of supply. |
| § | The U.S. economy was in recession and the bankruptcy of Lehman Brothers caused a severe tightening in financial markets. As a result, economic output dropped sharply, and key industries reduced machine purchases. |
| § | U.S. housing starts fell below a 700 thousand unit annual rate, the lowest this cycle, and permits for new construction were even lower. Housing starts were depressed by relatively high mortgage interest rates, a further tightening in credit, a 10-percent decline in new home prices and more than an 11-month supply of unsold new homes. |
| § | Orders for U.S. nonresidential construction fell 28 percent below a year earlier. Negatives included limited growth in Federal highway funding, higher material input costs, and declines in commercial property prices. Banks further tightened credit standards on commercial real estate loans in response to rising delinquencies and financial stresses. |
| § | Sharp declines in construction caused a 13-percent drop in nonmetals mining and quarry production. |
| § | Metals mining production increased sharply, but much lower metals prices prompted mines to reduce machine purchases. |
| § | Coal production increased almost 3 percent, benefiting from increased exports and much higher coal prices. Sales of machines used in coal mining increased. |
| § | Crude oil prices declined, but to levels that were still attractive for investment. |
EAME – Sales decreased $309 million, or 13 percent.
| § | Sales volume decreased $199 million. |
| § | Price realization decreased $19 million. |
| § | Currency impact decreased sales by $91 million. |
| § | Dealers in all regions reported higher inventories than year-end 2007 in both dollars and months of supply. |
| § | Preliminary data suggest recessions in both the euro-zone and the United Kingdom worsened in fourth quarter 2008, and dealers reported sizable declines in deliveries. |
Page A-70
| § | Interest rates remained relatively high, contributing to weakness in construction. Housing permits in the euro-zone were probably down more than 20 percent, and U.K. housing orders plunged more than 50 percent. Heavy construction in the euro-zone declined 6 percent. |
| § | Sales volume increased slightly in Africa/Middle East, ending more than 5 years of strong year-on-year growth. |
| § | In the CIS, sales volume increased, although at a slower rate than earlier in the year. Russia’s economy slowed due to higher interest rates, a credit crisis and lower oil revenues. |
| § | In both Africa/Middle East and CIS, sales volume in December was lower than a year earlier. |
Asia/Pacific – Sales increased $458 million, or 38 percent.
| § | Sales volume increased $235 million. |
| § | Price realization increased $17 million. |
| § | Currency impact decreased sales by $55 million. |
| § | The consolidation of Cat Japan sales added $261 million to 2008 sales. |
| § | Dealers in all regions reported higher inventories than year-end 2007 in both dollars and months of supply. |
| § | Recessions in developed economies caused export growth to slow or decline for most countries. In addition, several countries had raised interest rates, which helped slow economic growth. |
| § | China’s economy slowed, which sharply curtailed growth in sales volume. |
| § | Higher coal prices contributed to sizable sales volume growth in Indonesia. |
| § | Mine output expanded in Australia as mining employment increased 30 percent. Higher production, along with commodity prices that were still attractive for investment, led to increased sales volume. |
| § | India had tightened economic policies to cope with inflation and the economy slowed in the fourth quarter. Sales volume increased slightly, ending several years of rapid growth. |
Latin America – Sales increased $345 million, or 41 percent.
| § | Sales volume increased $368 million. |
| § | Price realization decreased $2 million. |
| § | Currency impact decreased sales by $21 million. |
| § | Dealers reported higher inventories than year-end 2007 in both dollars and months of supply. |
| § | The largest gain in sales volume occurred in Chile. Positives were efforts to expand mine production and increased construction. |
| § | Higher coal prices boosted sales volume in Colombia. |
| § | Although the Mexican economy was sluggish, construction and the energy industries expanded. Sales volume increased sharply. |
| § | Interest rate increases in Brazil caused the economy to slow sharply in the fourth quarter, with industrial production declining. The world steel industry reduced production in the last half of 2008, causing Brazil’s iron ore production to drop 5 percent. As a result, growth in sales volume slowed significantly from rates experienced during the first three quarters. |
Engines Sales
Sales of $4.445 billion increased $545 million, or 14 percent, from fourth quarter 2007.
| § | Sales volume increased $458 million. |
| § | Price realization increased $223 million. |
| § | Currency impact decreased sales $136 million. |
| § | Geographic mix between regions (included in price realization) was $2 million favorable. |
| § | Dealer-reported inventories were up, and months of supply were up slightly, supporting strong delivery rates. |
Page A-71
North America – Sales increased $104 million, or 8 percent.
| § | Sales volume increased $22 million. |
| § | Price realization increased $82 million. |
| § | Sales for petroleum engine applications increased 14 percent due to strong demand for gas compression, drilling and well service applications. Turbine sales for gas transmission projects were down due to timing of customer project schedules. This was partially offset by an increase in turbine-related services. |
| § | Sales for electric power applications increased 8 percent, driven by increases in turbine sales to support power plant projects. |
| § | Sales for on-highway truck applications increased 3 percent, when compared with a very weak fourth quarter 2007 in the North American on-highway heavy-duty truck market. Demand remained below historic norms due to the slow U.S. economy that resulted in a reduction in freight tonnage. Also, the impact of the decision to exit the on-highway truck business was starting to be felt as OEM customers reduced their reliance on Caterpillar products. |
| § | Sales for industrial applications decreased 3 percent due to substantially lower demand in construction, material handling and auxiliary power units. |
EAME – Sales increased $53 million, or 3 percent.
| § | Sales volume increased $85 million. |
| § | Price realization increased $72 million. |
| § | Currency impact decreased sales by $104 million. |
| § | Sales for industrial applications decreased 16 percent, as demand in the construction segments slowed with reduced spending on infrastructure development. This was partially offset by increases in agricultural applications. |
| § | Sales for marine applications increased 27 percent in workboats and commercial vessels to support projects that were driven by high commodity prices. |
| § | Sales for petroleum applications increased 16 percent based on strong demand for engines used in drilling and production. Turbine sales increased for gas transmission and oil and gas production applications. |
| § | Sales for electric power applications increased 6 percent, with strong demand in Africa/Middle East offsetting weaker demand in Europe and the CIS and a decrease in turbine sales, which were the result of timing of large power plant projects. |
Asia/Pacific – Sales increased $195 million, or 30 percent.
| § | Sales volume increased $170 million. |
| § | Price realization increased $57 million. |
| § | Currency impact decreased sales by $32 million. |
| § | Sales for petroleum applications increased 79 percent to support Chinese drill rig activity and increased demand for Asian shipyards in support of offshore drilling. Turbine sales increased for gas transmission and oil and gas production applications. |
| § | Sales for marine applications increased 34 percent, with continued strong demand for workboat, offshore and general cargo vessels. |
| § | Sales for industrial applications increased 39 percent, as a result of higher sales into mining and irrigation sectors in Australia and increased sales in New Zealand. |
| § | Sales of electric power engines decreased 2 percent. |
Latin America – Sales increased $193 million, or 55 percent.
| § | Sales volume increased $183 million. |
| § | Price realization increased $10 million. |
| § | Sales for petroleum applications increased 60 percent as turbines and turbine-related services increased for gas transmission and oil and gas production applications. |
| § | Sales of electric power engines increased 82 percent to support infrastructure investment. |
| § | Sales for on-highway truck applications decreased 42 percent as a result of OEM customers working down inventory and a loss of OEM business. |
Page A-72
Financial Products Revenues
Revenues of $803 million increased $19 million, or 2 percent, from the fourth quarter 2007.
| § | Growth in average earning assets increased revenues $56 million, which was partially offset by a decrease of $46 million due to lower interest rates on new and existing finance receivables. |
| § | Revenues from earned premiums at Cat Insurance increased $24 million. |
OPERATING PROFIT
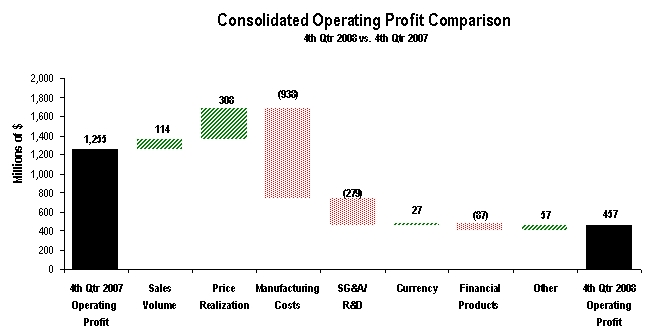 | ||
| The chart above graphically illustrates reasons for the change in Consolidated Operating Profit between fourth quarter 2007 (at left) and fourth quarter 2008 (at right). Items favorably impacting operating profit appear as upward stair steps with the corresponding dollar amounts above each bar, while items negatively impacting operating profit appear as downward stair steps with dollar amounts reflected in parentheses above each bar. Caterpillar management utilizes these charts internally to visually communicate with the company’s Board of Directors and employees. The bar entitled Other includes the operating profit impact of consolidating adjustments, consolidation of Cat Japan and Machinery and Engines other operating expenses. | ||
Operating profit in fourth quarter 2008 of $457 million was $798 million lower than fourth quarter 2007 as improved price realization and higher sales volume were more than offset by higher costs.
Manufacturing costs increased $938 million compared with fourth quarter 2007. The increase was driven by higher material and freight costs, along with manufacturing inefficiencies as costs did not drop in line with a sharp decline in production volume.
SG&A and R&D costs were up $279 million to support significant new product programs and growth initiatives.
Financial Products operating profit decreased $87 million.
Operating Profit by Principal Line of Business | ||||||||||||||||
| (Millions of dollars) | Fourth Quarter 2008 | Fourth Quarter 2007 | $ Change | % Change | ||||||||||||
Machinery 1 | $ | (6 | ) | $ | 619 | $ | (625 | ) | (101 | )% | ||||||
Engines 1 | 438 | 571 | (133 | ) | (23 | )% | ||||||||||
| Financial Products | 74 | 161 | (87 | ) | (54 | )% | ||||||||||
| Consolidating Adjustments | (49 | ) | (96 | ) | 47 | |||||||||||
| Consolidated Operating Profit | $ | 457 | $ | 1,255 | $ | (798 | ) | (64 | )% | |||||||
| 1 | Caterpillar operations are highly integrated; therefore, the company uses a number of allocations to determine lines of business operating profit for Machinery and Engines. | |||||||||||||||
Page A-73
| § | Machinery operating loss was $6 million compared to an operating profit of $619 million in the fourth quarter of 2007. Substantially all of the change was the result of higher manufacturing costs. |
| § | Engines operating profit of $438 million was down $133 million, or 23 percent, from fourth quarter 2007. Higher costs were partially offset by improved price realization and higher sales volume. |
| § | Financial Products operating profit of $74 million was down $87 million, or 54 percent, from fourth quarter 2007. The decrease was primarily attributable to a $57 million impact from decreased net yield on average earning assets and a $42 million increase in the provision for credit losses at Cat Financial, partially offset by a $22 million favorable impact from higher average earning assets. |
OTHER PROFIT/LOSS ITEMS
| § | Other income/expense was expense of $24 million compared with income of $101 million in fourth quarter 2007. The decrease was primarily due to a $47 million unfavorable change in mark-to-market adjustments on interest rate derivative contracts at Cat Financial and a $37 million impairment of investments in Cat Insurance’s portfolio as a result of poor market performance |
| § | The provision for income taxes in the fourth quarter of 2008 reflects an annual tax rate of 31.3 percent, excluding the discrete item discussed below, compared to a 29.8-percent rate in 2007. The increase in the tax rate excluding discrete items over 2007 is primarily attributable to a less favorable geographic mix of profits from a tax perspective. Although we expected to lower our annual tax rate by approximately one percentage point in the fourth quarter due to the renewal of the U.S. research and development tax credit in October 2008, this benefit was offset by less favorable fourth quarter geographic mix of profits from a tax perspective resulting in no change in the estimated tax rate from third quarter 2008. The provision for income taxes in the fourth quarter of 2008 also includes a discrete benefit of $409 million related to repatriation of non-U.S. earnings with available foreign tax credits in excess of the U.S. tax liability on the dividend. This compares to a favorable adjustment of $55 million in the fourth quarter 2007 related to a decrease in the estimated tax rate. |
| § | Equity in profit/(loss) of unconsolidated affiliated companies was income of $5 million compared with income of $22 million in fourth quarter 2007. The decline reflects the absence of profit at Shin Caterpillar Mitsubishi Ltd. (SCM) due to the redemption, on August 1, 2008, of one-half of Mitsubishi Heavy Industries Ltd.’s (MHI’s) shares in SCM. |
Page A-74
SALES AND REVENUES
 | ||
| The chart above graphically illustrates reasons for the change in Consolidated Sales and Revenues between 2006 (at left) and 2007 (at right). Items favorably impacting sales and revenues appear as upward stair steps with the corresponding dollar amounts above each bar, while items negatively impacting sales and revenues appear as downward stair steps with dollar amounts reflected in parentheses above each bar. The bar entitled Machinery Volume includes the change in Progress Rail sales. Caterpillar management utilizes these charts internally to visually communicate with the company’s Board of Directors and employees. | ||
Sales and revenues for 2007 were $44.958 billion, up $3.441 billion, or 8 percent, from 2006. 2007 machinery sales were up 9 percent as strong growth outside North America and a full year of Progress Rail more than offset a weak U.S. construction market. Machinery volume was up $1.289 billion. Excluding Progress Rail, machinery volume was up $514 million. Although sales volume increased moderately, the geographic shift in sales was significant. North American machinery sales were down 11 percent; machinery sales outside of North America were up 33 percent.
Engines sales increased 6 percent despite the 59 percent decline in North American on-highway truck engines. Sales volume was down slightly as growth in engines sales to industries like oil and gas, electric power, industrial and marine nearly offset the volume decline in on-highway truck engines.
In addition, price realization was more than 2 percent despite an unfavorable geographic mix. Currency had a positive impact on sales of $890 million driven primarily by the stronger euro. Financial Products revenues were up 13 percent.
Sales and Revenues by Geographic Region | |||||||||||||||||||||||||||||||||||
(Millions of dollars) | Total | % Change | North America | % Change | EAME | % Change | Latin America | % Change | Asia/ Pacific | % Change | |||||||||||||||||||||||||
| 2007 | |||||||||||||||||||||||||||||||||||
| Machinery | $ | 28,359 | 9 | % | $ | 12,596 | (11 | )% | $ | 8,588 | 38 | % | $ | 3,149 | 24 | % | $ | 4,026 | 31 | % | |||||||||||||||
Engines 1 | 13,603 | 6 | % | 5,092 | (14 | )% | 5,245 | 29 | % | 1,130 | 3 | % | 2,136 | 26 | % | ||||||||||||||||||||
Financial Products 2 | 2,996 | 13 | % | 2,007 | 8 | % | 479 | 27 | % | 270 | 38 | % | 240 | 7 | % | ||||||||||||||||||||
| $ | 44,958 | 8 | % | $ | 19,695 | (11 | )% | $ | 14,312 | 34 | % | $ | 4,549 | 18 | % | $ | 6,402 | 28 | % | ||||||||||||||||
| 2006 | |||||||||||||||||||||||||||||||||||
| Machinery | $ | 26,062 | $ | 14,215 | $ | 6,223 | $ | 2,544 | $ | 3,080 | |||||||||||||||||||||||||
Engines 1 | 12,807 | 5,940 | 4,064 | 1,102 | 1,701 | ||||||||||||||||||||||||||||||
Financial Products 2 | 2,648 | 1,852 | 377 | 195 | 224 | ||||||||||||||||||||||||||||||
| $ | 41,517 | $ | 22,007 | $ | 10,664 | $ | 3,841 | $ | 5,005 | ||||||||||||||||||||||||||
| 1 | Does not include internal engine transfers of $2.549 billion and $2.310 billion in 2007 and 2006, respectively. Internal engine transfers are valued at prices comparable to those for unrelated parties. | ||||||||||||||||||||||||||||||||||
| 2 | Does not include revenues earned from Machinery and Engines of $400 million and $466 million in 2007 and 2006, respectively. | ||||||||||||||||||||||||||||||||||
Page A-75
Machinery sales of $28.359 billion were an increase of $2.297 billion, or 9 percent, from 2006. Excluding Progress Rail, machinery volume increased $514 million. Sales volume decreased in North America but increased in all other regions. Price realization increased $410 million. Currency benefited sales by $598 million. Geographic mix between regions (included in price realization) was $182 million unfavorable. The acquisition of Progress Rail added $775 million. North American dealers reduced reported inventories substantially in 2007, taking them well below a year earlier in months of supply. Inventories in months of supply declined in most other regions as well. Economic factors, primarily in the United States, contributed to lower sales volume in North America. These factors included the collapse in housing construction, weakness in nonresidential construction contracts in the last half of 2007 and a decline in quarry and aggregate production. Sales volume increased in the rest of the world, offsetting weakness in North America. Positives included relatively low interest rates, good economic growth and continued growth in construction. Metals mining was positive in many countries throughout the world. Metals prices increased, and mining companies increased exploration spending by more than 40 percent. Oil prices increased about 10 percent, and natural gas prices increased 4 percent. Production and drilling increased in many regions, and pipeline construction increased. Transportation problems, particularly in Australia, contributed to a significant increase in international coal prices. The impact on sales volume varied—negative for Australia and the United States but positive elsewhere.
| · | North America sales decreased $1,619 million, or 11 percent. Sales volume excluding Progress Rail decreased $2,540 million. Price realization increased $146 million. Progress Rail increased sales $775 million. Dealers reduced their reported inventories by about $1.1 billion in 2007 compared to a $300 million increase in 2006. Dealer inventories at the end of the year were well below a year earlier in both dollars and months of supply. An unfavorable economic environment caused output to decline in many key industries in the United States, prompting users to curtail fleet expansions. In addition, dealers added fewer units to their rental fleets and let existing fleets age. Output prices for some industries, such as housing and coal mining, softened. Reduced profitability and tighter credit likely caused some users to delay replacement purchases. The housing industry weakened throughout the year, with starts down 26 percent in 2007. Tighter lending standards, a large number of unsold homes and a sharp drop in home sales caused builders to reduce construction. Nonresidential construction spending increased 18 percent, however, contracts awarded for new construction declined about 2 percent. Employment in nonresidential construction also weakened in the last half of the year. Factors that contributed to this weakening included tighter standards for commercial and industrial loans, higher corporate bond spreads and a decline in business cash flows. Spot coal prices declined leading to a 3 percent decline in coal production. Electric utilities reduced coal usage, and stockpiles increased. More positively, coal exports rebounded more than 15 percent as a result of U.S. prices falling well below international prices. Metals mining, oil sands and pipeline construction remained positive. Average metals prices increased more than 40 percent, and mines in both Canada and the United States increased production. Canada increased crude oil production 7 percent. Shipments of line pipe in the United States increased 14 percent. |
| · | EAME sales increased $2,365 million, or 38 percent. Sales volume increased $1,729 million. Price realization increased $202 million. Currency benefited sales by $434 million. Dealers reported significant increases in demand and increased inventories to support that stronger demand—a positive for sales volume. Dealer inventories in months of supply ended the year slightly higher than a year earlier. Sales volume increased in Europe in response to positive economic growth and large gains in both nonresidential building and infrastructure construction. These sectors benefited from increased business profits, a 13 percent increase in business borrowing and higher government capital expenditures. However, housing permits declined 8 percent due to higher lending rates for home purchases and some moderation in home prices. Africa/Middle East turned in another year of very positive volume growth. Interest rates changed little over the past year, and most stock markets boomed. Exports increased significantly, allowing the region to increase its foreign exchange holdings 22 percent. Higher oil prices encouraged increased drilling in both Africa and the Middle East, and both Turkey and South Africa experienced more than 10 percent growth in construction. Sales volume in the Commonwealth of Independent States (CIS) increased rapidly for the seventh consecutive year, with large gains occurring in Russia, Ukraine and Kazakhstan. All three governments increased spending more than 20 percent, and monetary policies were extremely expansive. Regional oil production increased more than 4 percent, and Russia increased construction 23 percent. |
| · | Latin America sales increased $605 million, or 24 percent. Sales volume increased $466 million. Price realization increased $87 million. Currency benefited sales by $52 million. Dealers reported much higher demand and built inventory to support that demand. Reported inventories increased in dollars but declined in months of supply. Sales volume increased significantly in Brazil, the result of a 200 basis point reduction in interest rates and an improvement in economic growth. Better economic growth contributed to an increase of about 4 percent in construction spending, and higher metals prices led to a 4 percent increase in mine production. Most other countries raised interest rates slightly, and economic growth was near 5 percent. As a result, construction increased 9 percent in Chile, 12 percent in both Colombia and Venezuela and 16 percent in Peru. Mines increased exploration spending 38 percent in response to higher metals prices and increased production. Higher oil prices and declining production caused increased drilling, a positive for sales volume. |
Page A-76
| · | Asia/Pacific sales increased $946 million, or 31 percent. Sales volume increased $677 million. Price realization increased $157 million. Currency benefited sales by $112 million. Dealers reported higher demand for machines and inventories declined. As a result, inventories in months of supply were well below those at the end of 2006. Central banks kept interest rates low, and many governments increased spending. These developments produced more than 8 percent economic growth, and stock markets boomed. Construction increased more than 20 percent in China, 11 percent in India and 9 percent in Australia. Australian thermal coal spot prices increased 30 percent due to continued strong demand and supply problems. Increased coal production and prices contributed to a substantial sales gain in Indonesia. China increased coal production 12 percent. Higher metals prices and a 56 percent increase in mine exploration spending benefited sales volume growth. Mine production increased almost 11 percent in Indonesia, 6 percent in India and 5 percent in Australia. |
Engines Sales of $13.603 billion were an increase of $796 million, or 6 percent, from 2006. Sales volume decreased $18 million. Price realization increased $522 million. Currency benefited sales $292 million. Geographic mix between regions (included in price realization) was $29 million favorable. Dealer reported inventories in dollars were up; months of supply were down as the inventories were supported by strong delivery rates.
| · | North America sales decreased $848 million, or 14 percent. Sales volume decreased $1.037 billion. Price realization increased $189 million. Sales for on-highway truck applications declined 59 percent with less than anticipated demand for the 2007 model-year engines. This was due to the reduction in tonnage hauled and freight rates realized by on-highway carriers. This has also been impacted by the transition of several Original Equipment Manufacturers (OEMs) to the 2007 emissions technology engines. Sales for petroleum applications increased 39 percent due to strong demand in gas compression and exploration, along with success from gas pipeline and storage construction projects. The increase in turbines and turbine-related services reflects additional customer spending for natural gas pipelines and compression equipment. Sales for electric power applications increased 22 percent as demand for large generator sets increased to support data center installations, which offset a slight decline in smaller units. |
| · | EAME sales increased $1.181 billion, or 29 percent. Sales volume increased $756 million. Price realization increased $186 million. Currency benefited sales by $239 million. Sales for electric power applications increased 29 percent, with strong demand for gas units in Russia, expanded scope of project business and growth in power modules. Turbines and turbine-related services increased to support power generation. Sales for petroleum applications increased 42 percent based on widespread demand for engines used in drilling and production applications. Turbines and turbine-related services increased to support rising oil production and gas transmission demand. Sales for industrial applications increased 20 percent, with widespread demand for agriculture and other types of OEM equipment driven by good economic conditions. Sales for marine applications increased 30 percent, with increased demand for workboats, commercial oceangoing vessels and cruise ships. |
| · | Latin America sales increased $28 million, or 3 percent. Sales volume decreased $5 million. Price realization increased $32 million. Currency benefited sales by $1 million. Sales for electric power engines increased 35 percent from strong growth across Latin America, driven by high oil and gas prices and investment in infrastructure as energy shortages continued in several key markets. Sales into truck applications declined 44 percent with reduced demand. Latin American truck facilities decreased exports of trucks destined for the United States. |
| · | Asia/Pacific sales increased $435 million, or 26 percent. Sales volume increased $297 million. Price realization increased $86 million. Currency benefited sales by $52 million. Sales for petroleum applications increased 34 percent as Chinese drill rig builders continue to manufacture at record levels for domestic and export use. Turbines and turbine-related services increased to support oil production and gas pipeline compression demand. Sales for marine applications increased 47 percent, with continued strong demand for workboat and offshore shipbuilding. Large diesel demand grew in the offshore and general cargo applications. Sales of electric power engines increased 6 percent due to shipments of larger generator sets into Asia. |
Financial Products Revenues of $2.996 billion were an increase of $348 million, or 13 percent, from 2006. Growth in average earning assets increased revenues $234 million. Revenues from earned premiums at Cat Insurance increased $64 million. The impact of higher interest rates on new and existing finance receivables added $58 million.
Page A-77
OPERATING PROFIT
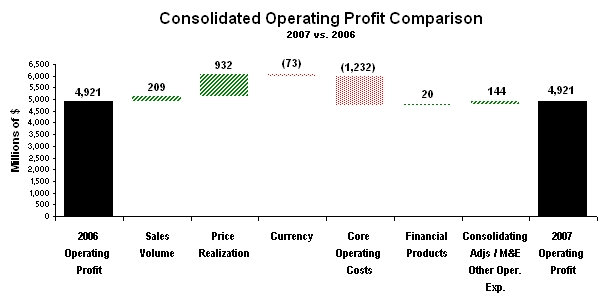 | ||
| The chart above graphically illustrates reasons for the change in Consolidated Operating Profit between 2006 (at left) and 2007 (at right). Items favorably impacting operating profit appear as upward stair steps with the corresponding dollar amounts above each bar, while items negatively impacting operating profit appear as downward stair steps with dollar amounts reflected in parentheses above each bar. Caterpillar management utilizes these charts internally to visually communicate with the company’s Board of Directors and employees. The bar entitled Consolidating Adjustments/M&E Other Operating Expense includes the operating profit impact of Progress Rail. | ||
Operating profit in 2007 of $4.921 billion was equal to 2006 as higher price realization and sales volume were offset by higher core operating costs.
Core operating costs rose $1.232 billion from 2006. Of this increase, $1.225 billion was attributable to higher manufacturing costs. The increase in manufacturing costs was primarily due to operating inefficiencies and higher material costs. Operating inefficiencies were the result of supply chain challenges, capacity increases, factory repair and maintenance and a significant decline in on-highway truck engine production. Also, we incurred additional costs for new product introductions and costs to enhance customer-delivered quality. Wage and benefit increases as well as increased warranty and depreciation also contributed to higher manufacturing costs. In 2007, Selling, General and Administrative (SG&A) and R&D expenses were essentially flat with 2006. The impact of higher wage and benefit costs was offset by the absence of approximately $70 million of 2006 expense related to a settlement of various legal disputes with Navistar.
Currency had a $73 million unfavorable impact on operating profit as the benefit to sales was more than offset by the negative impact on costs.
Operating Profit by Principal Line of Business | |||||||||||||||||
| (Millions of dollars) | 2007 | 2006 | $ Change | % Change | |||||||||||||
Machinery 1 | $ | 2,758 | $ | 3,027 | $ | (269 | ) | (9 | ) | % | |||||||
Engines 1 | 1,826 | 1,630 | 196 | 12 | % | ||||||||||||
| Financial Products | 690 | 670 | 20 | 3 | % | ||||||||||||
| Consolidating Adjustments | (353 | ) | (406 | ) | 53 | ||||||||||||
| Consolidated Operating Profit | $ | 4,921 | $ | 4,921 | $ | — | — | ||||||||||
| 1 | Caterpillar operations are highly integrated; therefore, the company uses a number of allocations to determine lines of business operating profit for Machinery and Engines. | ||||||||||||||||
Machinery operating profit of $2.758 billion was down $269 million, or 9 percent, from 2006. Higher core operating costs were partially offset by improved price realization, higher sales volume and the addition of Progress Rail. The geographic mix of sales had an unfavorable impact on price realization.
Page A-78
Engines operating profit of $1.826 billion was up $196 million, or 12 percent, from 2006. The favorable impacts of improved price realization and positive mix of product were partially offset by higher core operating costs and the unfavorable impacts of currency. Growth in demand for electric power, petroleum, marine and industrial applications more than offset the profit decline related to the drop in demand for on-highway truck engines.
Financial Products operating profit of $690 million was up $20 million, or 3 percent, from 2006. The increase was primarily attributable to a $42 million impact from improved net yield on average earning assets and a $34 million impact from higher average earning assets, partially offset by a $29 million increase in the provision for credit losses at Cat Financial and a $24 million decrease in operating profit at Cat Insurance due to higher claims experience.
OTHER PROFIT/LOSS ITEMS
Other income/expense was income of $357 million compared with income of $243 million in 2006. The change was primarily driven by a $46 million gain on the sale of a cost-basis investment, the favorable impacts of currency and other items that were individually insignificant.
The provision for income taxes for 2007 reflects an annual tax rate of 29.8 percent compared to a 28.8 percent rate in 2006. The increase over 2006 is primarily due to the repeal of Extraterritorial Income Exclusion benefits in 2007 partially offset by a more favorable geographic mix of profits from a tax perspective.
Employee Separation Charges
During 2008, we recognized employee separation charges of $30 million in Other operating expenses related to various voluntary and involuntary separation programs. These programs, impacting approximately 3,000 production and support and management employees world-wide, are in response to a sharp decline in sales volume due to the current global recession. Our accounting for separations is dependent upon how the particular program is designed. For voluntary programs, eligible separation costs are recognized at the time of employee acceptance. For involuntary programs, eligible costs are recognized when management has approved the program, the affected employees have been properly identified and the costs are estimable.
The separation charges, which will be made up primarily of cash severance payments, were not assigned to operating segments and are included in the reconciliation of total accountable profit from reportable segments to total profit before taxes. The following table summarizes the separation charges by geographic region:
| (Millions of dollars) | North America | EAME | Latin America | Total | |||||||||||
| 2008 Separation charges | $ | 4 | $ | 17 | $ | 9 | $ | 30 | |||||||
| 2008 Separation payments | — | (12 | ) | (7 | ) | (19 | ) | ||||||||
| Liability balance at December 31, 2008 | $ | 4 | $ | 5 | $ | 2 | $ | 11 | |||||||
As of December 31, 2008, approximately 1,600 employees had separated, with the remaining separations expected by the end of first quarter 2009. The majority of the remaining costs will be paid by the end of the first quarter 2009.
Subsequent Events
Employee Separation Programs
In response to the expected sharp decline in 2009 sales volume, Caterpillar implemented the following employee separation programs during 2009:
U.S. Voluntary Separation Program - During December 2008, we announced a voluntary separation program for certain support and management employees based in the United States. Eligible employees had until January 12, 2009 to sign-up for the plan, and generally until January 31, 2009 to make a final decision. Participating employees will receive severance pay based on current salary level and years of service. As of January 31, 2009, approximately 2,200 employees had accepted the program and are generally expected to separate from Caterpillar by March 31, 2009. We are currently estimating the costs associated with this program.
Page A-79
Other U.S. Separation Programs - - During 2009, we initiated plans to reduce U.S. based production and support and management positions through a variety of programs. For support and management employees, these include involuntary separation programs. For production employees, these include both involuntary and voluntary separation programs. We are currently estimating the costs associated with these programs.
Non-U.S. Separation Programs - We have initiated several other separation programs during 2009. These programs, designed specific to the laws and regulations of the individual countries, represent voluntary and involuntary plans for production and support and management employees. We are currently estimating the costs associated with these programs.
We will continue to monitor the economic environment and, depending on business conditions, more voluntary and involuntary workforce reductions may be required as 2009 unfolds.
Cat Financial Debt Issuance
On February 12, 2009, Cat Financial issued $350 million of 5.75% notes due in 2012, $1.65 billion of 6.125% notes due in 2014 and $1.0 billion of 7.15% notes due in 2019. The net proceeds from the issuance will be used to reduce short-term debt and for general corporate purposes.
Shin Caterpillar Mitsubishi Ltd. (SCM)
On August 1, 2008, SCM completed the first phase of a share redemption plan whereby SCM redeemed half of MHI’s shares in SCM for $464 million. This resulted in Caterpillar owning 67 percent of the outstanding shares of SCM and MHI owning the remaining 33 percent. As part of the share redemption, SCM was renamed Caterpillar Japan Ltd. (Cat Japan). Both Cat Japan and MHI have options, exercisable after five years, to require the redemption of the remaining shares owned by MHI, which if exercised, would make Caterpillar the sole owner of Cat Japan. The share redemption plan is part of our comprehensive business strategy for expansion in the emerging markets of Asia and the Commonwealth of Independent States and will allow Cat Japan’s manufacturing, design and process expertise to be fully leveraged across the global Caterpillar enterprise.
The change in Caterpillar’s ownership interest from 50 percent to 67 percent was accounted for as a business combination. The $464 million redemption price was assigned to 17 percent of Cat Japan’s assets and liabilities based upon their respective fair values as of the transaction date. The revaluation resulted in an increase in property, plant and equipment of $78 million and an increase in inventory of $8 million over the book value of these assets. Finite-lived intangible assets of $54 million were recognized and related primarily to customer relationships, intellectual property and trade names. These intangibles are being amortized on a straight-line basis over a weighted-average amortization period of approximately 9 years. Deferred tax liabilities of $57 million were also recognized as part of the business combination. Goodwill of $206 million, non-deductible for income tax purposes, represents the excess of the redemption price over the 17 percent of Cat Japan’s net tangible and finite-lived intangible assets that were reported at their fair values.
Because Cat Japan is accounted for on a lag, we consolidated Cat Japan’s August 1, 2008 financial position on September 30, 2008. We began consolidating Cat Japan’s results of operations in the fourth quarter of 2008. Including the amounts assigned as part of the business combination, the initial consolidation of Cat Japan’s financial position resulted in a net increase in assets of $2,396 million (primarily property, plant and equipment of $1,279 million, inventory of $640 million, receivables of $612 million, and goodwill and intangibles of $260 million partially offset by a $528 million reduction in investment in unconsolidated affiliates) and a net increase in liabilities of $2,045 million (including $1,388 million in debt). Cat Japan’s functional currency is the Japanese Yen.
Additionally, the remaining 33 percent of Cat Japan owned by MHI has been reported as redeemable noncontrolling interest and classified as mezzanine equity (temporary equity) in the Consolidated Statement of Financial Position. On September 30, 2008, the redeemable noncontrolling interest was reported at its estimated future redemption value of $464 million with the difference between the $351 million book value of the 33 percent interest and the redemption value reported as a $113 million reduction of Profit employed in the business.
In subsequent reporting periods, the redeemable noncontrolling interest will continue to be reported at its estimated redemption value. Any adjustment to the redemption value will impact Profit employed in the business, but will not impact Profit. If the fair value of the redeemable noncontrolling interest falls below the redemption value, profit available to common stockholders would be reduced by the difference between the redemption value and the fair value. This would result in lower profit in the profit per common share computation in that period. Reductions impacting the profit per common share computation may be partially or fully reversed in subsequent periods if the fair value of the redeemable noncontrolling interest increases relative to the redemption value. Such increases in profit per common share would be limited to cumulative prior reductions. As of December 31, 2008, there has been no change to the estimated future redemption value, and the fair value of the redeemable noncontrolling interest has remained greater than the redemption value.
Page A-80
With the consolidation of Cat Japan’s results of operations, 33 percent of Cat Japan’s comprehensive income or loss is attributed to the redeemable noncontrolling interest, impacting its carrying value. Because the redeemable noncontrolling interest must be reported at its estimated future redemption value, the impact from attributing the comprehensive income or loss is offset by adjusting the carrying value to the redemption value. This adjustment impacts Profit employed in the business, but not Profit. In 2008, we adjusted the carrying value by $2 million resulting in a corresponding reduction to Profit employed in the business. As Cat Japan’s functional currency is the Japanese Yen, changes in exchange rates affect the reported amount of the redeemable noncontrolling interest. At December 31, 2008, the redeemable noncontrolling interest was $524 million.
Cat Japan was included in the “Cat Japan” segment in Note 24. Assuming this transaction had been made at the beginning of any period presented, the consolidated pro forma results would not be materially different from reported results.
Progress Rail Services, Inc.
In June 2006, Caterpillar acquired 100 percent of the equity in privately held Progress Rail Services, Inc. (Progress Rail) for approximately $1 billion, including the assumption of $200 million in debt. Based in Albertville, Alabama, Progress Rail is a leading provider of remanufactured locomotive, railcar and track products and services to the North American railroad industry. The company also has one of the most extensive rail service and supply networks in North America. When acquired, Progress Rail operated more than 90 facilities in 29 states in the United States, Canada and Mexico, with about 3,700 employees. Expansion into the railroad aftermarket business is a strong fit with our strategic direction and will leverage Caterpillar's remanufacturing capabilities.
The transaction was financed with available cash and commercial paper borrowings of $427 million and Caterpillar stock of $379 million (5.3 million shares). Net tangible assets acquired, recorded at their fair values, primarily were inventories of $257 million, receivables of $169 million and property, plant and equipment of $260 million. Liabilities acquired, recorded at their fair values, primarily consisted of assumed debt of $200 million, accounts payable of $148 million and net deferred tax liabilities of $115 million. Finite-lived intangible assets acquired of $223 million related primarily to customer relationships are being amortized on a straight-line basis over 20 years. Goodwill of $431 million, non-deductible for income tax purposes, represents the excess of cost over the fair value of net tangible and finite-lived intangible assets acquired. The results of the acquired business for the period from the acquisition date are included in the accompanying consolidated financial statements and reported in the “All Other” category in Note 24. Assuming this transaction had been made at the beginning of any period presented, the consolidated pro forma results would not be materially different from reported results.
1. | Cat Production System (CPS) – The Cat Production System is the common Order-to-Delivery process being implemented enterprise-wide to achieve our safety, quality, velocity, earnings and growth goals for 2010 and beyond. |
2. | Consolidating Adjustments – Eliminations of transactions between Machinery and Engines and Financial Products. |
3. | Core Operating Costs – For the purpose of 2007 vs. 2006 consolidated operating profit comparison, core operating costs represent Machinery and Engines variable manufacturing cost change (adjusted for volume) and changes in period manufacturing costs, SG&A expenses and R&D expenses. Excludes the impact of currency. |
4. | Currency – With respect to sales and revenues, currency represents the translation impact on sales resulting from changes in foreign currency exchange rates versus the U.S. dollar. With respect to operating profit, currency represents the net translation impact on sales and operating costs resulting from changes in foreign currency exchange rates versus the U.S. dollar. Currency includes the impacts on sales and operating profit for the Machinery and Engines lines of business only; currency impacts on Financial Products revenues and operating profit are included in the Financial Products portions of the respective analyses. With respect to other income/expense, currency represents the effects of forward and option contracts entered into by the company to reduce the risk of fluctuations in exchange rates and the net effect of changes in foreign currency exchange rates on our foreign currency assets and liabilities for consolidated results. |
5. | Debt-to-Capital Ratio – A key measure of financial strength used by both management and our credit rating agencies. The metric is a ratio of Machinery and Engines debt (short-term borrowings plus long-term debt) and redeemable noncontrolling interest to the sum of Machinery and Engines debt, redeemable noncontrolling interest, and stockholders' equity. |
6. | EAME – Geographic region including Europe, Africa, the Middle East and the Commonwealth of Independent States (CIS). |
| 7. | Earning Assets – Assets consisting primarily of total finance receivables net of unearned income, plus equipment on operating leases, less accumulated depreciation at Cat Financial. |
Page A-81
8. | Engines – A principal line of business including the design, manufacture, marketing and sales of engines for Caterpillar machinery; electric power generation systems; on-highway vehicles and locomotives; marine, petroleum, construction, industrial, agricultural and other applications and related parts. Also includes remanufacturing of Caterpillar engines and a variety of Caterpillar machinery and engine components and remanufacturing services for other companies. Reciprocating engines meet power needs ranging from 10 to 21,700 horsepower (8 to more than 16 000 kilowatts). Turbines range from 1,600 to 30,000 horsepower (1 200 to 22 000 kilowatts). | |
9. | Financial Products – A principal line of business consisting primarily of Caterpillar Financial Services Corporation (Cat Financial), Caterpillar Insurance Holdings, Inc. (Cat Insurance), Caterpillar Power Ventures Corporation (Cat Power Ventures) and their respective subsidiaries. Cat Financial provides a wide range of financing alternatives to customers and dealers for Caterpillar machinery and engines, Solar gas turbines as well as other equipment and marine vessels. Cat Financial also extends loans to customers and dealers. Cat Insurance provides various forms of insurance to customers and dealers to help support the purchase and lease of our equipment. Cat Power Ventures is an investor in independent power projects using Caterpillar power generation equipment and services. | |
10. | Integrated Service Businesses – A service business or a business containing an important service component. These businesses include, but are not limited to, aftermarket parts, Cat Financial, Cat Insurance, Progress Rail, Solar Turbines Customer Services, Cat Logistics, OEM Solutions and Cat Reman. | |
11. | Latin America – Geographic region including Central and South American countries and Mexico. | |
12. | Machinery – A principal line of business which includes the design, manufacture, marketing and sales of construction, mining and forestry machinery—track and wheel tractors, track and wheel loaders, pipelayers, motor graders, wheel tractor-scrapers, track and wheel excavators, backhoe loaders, log skidders, log loaders, off-highway trucks, articulated trucks, paving products, skid steer loaders and related parts. Also includes logistics services for other companies and the design, manufacture, remanufacture, maintenance and services of rail-related products. | |
13. | Machinery and Engines (M&E) – Due to the highly integrated nature of operations, it represents the aggregate total of the Machinery and Engines lines of business and includes primarily our manufacturing, marketing and parts distribution operations. | |
14. | Machinery and Engines Other Operating Expenses – Comprised primarily of gains (losses) on disposal of long-lived assets, long-lived asset impairment charges and employee severance charges. | |
15. | Manufacturing Costs – Manufacturing costs have been defined differently in the consolidated operating profit comparison for periods presented as follows: | |
§ | For the purpose of 2008 vs. 2007 consolidated operating profit comparison, manufacturing costs represent the volume-adjusted change for manufacturing costs. Manufacturing costs are defined as material costs and labor and overhead costs related to the production process. Excludes the impact of currency. | |
§ | For the purpose of 2007 vs. 2006 consolidated operating profit comparison, manufacturing costs exclude the impacts of currency and represent the volume-adjusted change for variable costs and the absolute dollar change for period manufacturing costs. Variable manufacturing costs are defined as having a direct relationship with the volume of production. This includes material costs, direct labor and other costs that vary directly with production volume such as freight, power to operate machines and supplies that are consumed in the manufacturing process. Period manufacturing costs support production but are defined as generally not having a direct relationship to short-term changes in volume. Examples include machinery and equipment repair, depreciation on manufacturing assets, facility support, procurement, factory scheduling, manufacturing planning and operations management. | |
16. | Price Realization – The impact of net price changes excluding currency and new product introductions. Consolidated price realization includes the impact of changes in the relative weighting of sales between geographic regions. | |
17. | Sales Volume – With respect to sales and revenues, sales volume represents the impact of changes in the quantities sold for machinery and engines as well as the incremental revenue impact of new product introductions. With respect to operating profit, sales volume represents the impact of changes in the quantities sold for machinery and engines combined with product mix—the net operating profit impact of changes in the relative weighting of machinery and engines sales with respect to total sales. | |
18. | Shin Caterpillar Mitsubishi Ltd. (SCM) – Formerly a 50/50 joint venture between Caterpillar and Mitsubishi Heavy Industries Ltd. (MHI). On August 1, 2008, SCM redeemed one-half of MHI's shares. Caterpillar now owns 67 percent of the renamed entity, Caterpillar Japan Ltd. | |
Page A-82
Sources of funds
We generate significant capital resources from operating activities, which are the primary source of funding for our Machinery and Engines operations. Funding for these businesses is also provided by commercial paper and long-term debt issuances. Financial Products operations are funded primarily from their existing retail portfolio and commercial paper and term debt issuances. Despite recent credit market conditions, we have continued to have access to liquidity in both our Machinery and Engines and Financial Products operations. Given global recessionary conditions and sharply declining sales volume we are executing our strategic “trough” plans. Most of our trough actions will result in lower cash needs in 2009.
Consolidated operating cash flow for 2008 was $4.80 billion, compared with $7.96 billion in 2007. The decrease of $3.16 billion is primarily the result of the absence of a 2007 benefit from reduced terms for North American receivables, a $497 million increase in taxes paid, and a $453 million increase in contributions to pension and other postretirement benefit plans. In addition, working capital requirements, particularly inventory, increased in 2008, negatively impacting operating cash flow. See further discussion of operating cash flow under Machinery and Engines and Financial Products. Although we expect profit to decline in 2009, we expect operating cash flow to benefit from a significant decline in inventory and receivables.
Total debt as of December 31, 2008 was $35.54 billion, an increase of $7.11 billion from year-end 2007. Debt related to Machinery and Engines increased $3.82 billion due to the consolidation of Cat Japan and also to provide for a higher cash position in the event that short-term credit markets become disrupted. Debt related to Financial Products increased $3.29 billion due to growth in Cat Financial's portfolio and also to provide for an appropriate cash position given uncertain market conditions.
We have three global credit facilities with a syndicate of banks totaling $6.85 billion (Credit Facility) available in the aggregate to both Machinery and Engines and Financial Products to support commercial paper programs in the event the programs become unavailable to us. During 2008, based on management’s allocation decision, which can be revised at any time, the portion of the Credit Facility allocated to Cat Financial was increased from $5.55 billion to $5.85 billion. The five-year facility of $1.62 billion expires in September 2012. The five-year facility of $2.98 billion expires in September 2011. The 364-day facility was increased from $1.95 billion to $2.25 billion and will expire in September 2009. As part of the 2008 Credit Facility renewal, Cat Financial’s year-end and six-month moving average leverage covenants have been increased from 8.5:1 to 10:1. In 2008, Cat Financial entered into a new 364-day facility of $300 million with a syndicate of banks, which expires in July 2009. The overall increase in the credit facilities was to support Cat Financial’s portfolio growth.
At December 31, 2008, Caterpillar’s annual consolidated net worth dropped below the level stipulated in the Credit Facility. This covenant requires Caterpillar to maintain a consolidated net worth of not less than 75% of the consolidated net worth as of the end of its immediately preceding fiscal year. The decrease was largely driven by a significant decline in pension asset returns, resulting in a $3.4 billion year-end charge to other comprehensive income.
In addition, at December 31, 2008, Cat Financial’s quarterly interest coverage ratio for the fourth quarter dropped below the level stipulated in the Credit Facility. This covenant requires Cat Financial to maintain a ratio of (1) earnings before interest expense and income taxes to (2) interest expense of not less than 1.15 to 1 for each fiscal quarter. The ratio was negatively impacted in the fourth quarter of 2008 by, among other things, deteriorating economic conditions. This, in addition to Caterpillar’s drop in consolidated net worth, also resulted in Cat Financial falling below or failing to meet similar covenant requirements in other loan agreements.
The associated bank group under the Credit Facility has consented to Caterpillar’s lower annual consolidated net worth of $6.087 billion as of December 31, 2008, and to Cat Financial’s lower quarterly interest coverage ratio of 0.97 as of December 31, 2008. The bank group also agreed that any failure to comply with consolidated net worth and interest coverage ratio requirements would not constitute an actual or potential event of default under the Credit Facility. In consideration of these agreements, the upper range of interest rate applicable to certain amounts that may be drawn by us under the Credit Facility was increased by approximately 1.00 to 1.50 percentage points.
The lenders under Cat Financial’s other loan agreements also have agreed that Caterpillar and Cat Financial will not be required to comply with the covenant ratios for the fourth quarter 2008. In consideration of those agreements, the upper range of interest rate applicable to certain amounts that may be drawn by us under those loan agreements were increased by approximately 1.00 percentage point.
As noted above, the actions by the bank group and other lenders only apply to the fourth quarter of 2008. In the event Caterpillar or Cat Financial does not meet one or more of their respective financial covenants under the Credit Facility in the future (and are unable to obtain a consent or waiver), the bank group may terminate the commitments allocated to the non-compliant party or the commitments could be, depending on the circumstances, reallocated among Caterpillar and/or Cat Financial. Additionally, in such event, certain of Cat Financial’s other lenders under other loan agreements where such financial covenants are applicable, may, at their election, choose to pursue remedies under such loan agreements, including accelerating outstanding borrowings. At December 31, 2008, there were no borrowings under the Credit Facility.
Page A-83
Our total credit commitments as of December 31, 2008 were:
| (Millions of dollars) | Consolidated | Machinery and Engines | Financial Products | |||||||||
| Credit lines available: | ||||||||||||
| Global credit facilities | $ | 6,853 | $ | 1,000 | $ | 5,853 | ||||||
| Other external | 4,475 | 1,453 | 3,022 | |||||||||
| Total credit lines available | 11,328 | 2,453 | 8,875 | |||||||||
| Less: Global credit facilities supporting commercial paper | (6,681 | ) | (964 | ) | (5,717 | ) | ||||||
| Less: Utilized credit | (1,977 | ) | (406 | ) | (1,571 | ) | ||||||
| Available credit | $ | 2,670 | $ | 1,083 | $ | 1,587 | ||||||
Consolidated credit lines with banks as of December 31, 2008 total $4.48 billion. These credit lines, which are eligible for renewal at various future dates or have no specified expiration date, are used primarily by our subsidiaries for local funding requirements. Caterpillar Inc. or Cat Financial generally guarantees subsidiary borrowings under these lines.
The generally deteriorating economic conditions, our 2009 outlook and the condition of credit markets increase the risk that one or more of the credit rating agencies may decrease their credit rating for Caterpillar, Cat Financial or their debt securities. In the event that Caterpillar or Cat Financial, or any of their debt securities, experiences a credit rating downgrade it would likely result in an increase in our borrowing costs and make access to certain credit markets more difficult.
If global conditions deteriorate so significantly that access to debt market becomes unavailable, our Machinery and Engines operations would rely on cash flow from operations, use of existing cash balances ($1.52 billion at year-end 2008), borrowings from Cat Financial and access to our revolving credit facility. Our Financial Products operations would rely on cash flow from its existing retail portfolio of approximately $1 billion per month, utilization of existing cash balances ($1.22 billion at year-end 2008), access to our revolving credit facility and other credit line facilities held by Cat Financial and potential borrowings from Caterpillar.
Machinery and Engines
Operating cash flow was $3.57 billion in 2008 compared to $5.47 billion in 2007. Operating cash flow decreased primarily due to an increase in taxes paid and higher contributions to pension and other postretirement benefit plans. In addition, working capital requirements, particularly inventory, increased in 2008, negatively impacting Machinery and Engines operating cash flow. Net cash used for investing activities in 2008 was $2.56 billion compared to $1.68 billion in 2007. The increase was primarily due to higher capital expenditures. Net cash used for financing activities in 2008 was $529 million compared with $3.26 billion in 2007. The change is primarily the result of a $1.5 billion long-term debt issuance in December 2008 and a reduction in common stock repurchases. The long-term debt offering generated strong investor demand. Proceeds were used to reduce short-term borrowings and to provide a cash position appropriate for market conditions. We also have strong demand for our commercial paper and we have benefited from very low commercial paper interest rates.
Our priorities for the use of cash remain unchanged -- a strong financial position that helps protect our credit rating, capital to support growth, appropriately funded employee benefit plans, modestly increasing dividends and common stock repurchases with excess cash.
Strong financial position - A key measure of Machinery and Engines financial strength used by both management and our credit rating agencies is Machinery and Engines’ debt-to-capital ratio. Debt-to-capital is defined as short-term borrowings, long-term debt due within one year, redeemable noncontrolling interest and long-term debt due after one year (debt) divided by the sum of debt (including redeemable noncontrolling interest) and stockholders’ equity. Debt also includes borrowings from Financial Products. The debt-to-capital ratio for Machinery and Engines was 57.5 percent at December 31, 2008 compared to 31.0 percent at the end of 2007, above our target range of 35 to 45 percent. A $3.4 billion after-tax charge to Accumulated other comprehensive income(loss) to recognize the change in funded status of our pension and other postretirement benefit plans during 2008 increased the debt-to-capital ratio 11 percentage points. The consolidation of Cat Japan increased the debt-to-capital ratio about 7 percentage points. Additionally, our higher cash position increased short-term debt and added 3 percentage points to the debt-to-capital ratio. In addition to the debt-to-capital ratios, certain rating agencies have increased their focus on the extent to which Caterpillar and Cat Financial have cash and cash equivalents and unused credit lines available to meet short-term debt requirements. Caterpillar and Cat Financial have been taking this focus into account when planning for 2009 liquidity needs. This focus may result in higher cash balances and corresponding increases in the net cost of funds for Caterpillar Inc. and Cat Financial. |
Page A-84
Capital to support growth - Capital expenditures during 2008 were $2.42 billion, an increase of $738 million compared to 2007. The expenditures were primarily used to replace and upgrade existing production assets, facilitate additional expansion of manufacturing capacity and support new product programs. Cash used for investments and acquisitions (net of cash acquired) was $148 million. We expect capital expenditures to be about $1.5 billion in 2009, a decline of about 38 percent from 2008. Appropriately funded employee benefit plans - The funded status of our defined benefit pension plans declined significantly in 2008 due to plan asset losses. As a result, we expect to contribute approximately $1 billion to those plans in 2009 versus $422 million that was contributed in 2008. Modestly increasing dividends - Dividends paid totaled $953 million for 2008, representing 36 cents per share paid in the first and second quarters and 42 cents per share paid in the third and fourth quarters. 2008 marks the fifteenth consecutive year our annual dividend per share has increased. We anticipate modestly increasing dividends in 2009. Common stock repurchases - Pursuant to the February 2007 Board-authorized stock repurchase program, which expires on December 31, 2011, 27.3 million shares were repurchased at a cost of $1.88 billion during 2008. Through December 2008, $3.8 billion of the $7.5 billion authorized has been spent. Basic shares outstanding as of December 31, 2008 were 601.5 million. As a result of current economic conditions, we have temporarily put our stock repurchase program on hold. |
Financial Products
Financial Products 2008 operating cash flow of $1.10 billion was about the same as 2007. Net cash used for investing activities in 2008 was $3.75 billion compared to $1.24 billion in 2007. This increased use of cash was primarily due to the growth in finance receivables and the absence of higher collections in 2007 related to reduced terms for trade receivables purchased by Cat Financial. Net cash provided by financing activities in 2008 was $3.62 billion compared with $190 million in 2007, primarily due to increased funding requirements related to the increased portfolio growth, as well as to provide cash position appropriate for market conditions.
The allowance for credit losses was 1.44 percent of finance receivables, net of unearned income, at December 31, 2008, compared to 1.39 percent at December 31, 2007. Receivables written off due to uncollectibility, net of recoveries on receivables previously written off, were $121 million and $68 million for 2008 and 2007, respectively. The increase in write-offs is attributable to economic conditions primarily in North America. From a historical perspective, total write-offs, net of recoveries, for the last U.S. recessionary period in 2002 were 0.69 percent of our average retail portfolio compared to the year-to-date rate of 0.48 percent. Consistent with our economic outlook and expected further weakening of the global economy, we expect past dues and write-offs will likely be higher in 2009 compared with 2008.
At the end of 2008, Cat Financial's allowance for credit losses totaled $395 million, an increase of $42 million from the end of 2007. Of the increase, $28 million is attributable to growth in the retail finance receivable portfolio, while $14 million resulted from increasing the allowance rate from 1.39 percent to 1.44 percent of net finance receivables
Despite recent credit market conditions, Cat Financial continued to have access to liquidity, although at increased credit spreads on new term debt issuance. Cat Financial was able to issue commercial paper throughout the year. U.S. commercial paper issuance experienced consistent demand and attractive pricing although maturity conditions fluctuated as the year drew to a close. Throughout the year, demand and liquidity varied in non-U.S. markets and certain non-U.S. credit markets were periodically closed to Cat Financial and similarly situated issuers as a result of the volatile credit market conditions in 2008, particularly in the second half of the year. Cat Financial’s access to these non-U.S. markets has improved as credit market conditions have improved. As the global liquidity situation evolves, Cat Financial will continue to monitor and adapt their funding approach accordingly. As mentioned above, certain rating agencies have increased their focus on the extent to which Caterpillar and Cat Financial have cash and cash equivalents and unused credit lines available to meet short-term debt requirements. Caterpillar and Cat Financial have been taking this focus into account when planning for 2009 liquidity needs. This focus may result in higher cash balances and corresponding increases in the net cost of funds.
Financial Products total borrowings were $27.71 billion at December 31, 2008, an increase of $3.29 billion from December 31, 2007. Debt repayment in Financial Products depends primarily on timely repayment and collectibility of the receivables portfolio. At December 31, 2008, finance receivables past due over 30 days were 3.88 percent, compared with 2.36 percent at December 31, 2007. This increase began with the downturn in the U.S. economy and has spread to other geographic locations.
Page A-85
To maintain an alternative funding source, Cat Financial periodically (generally once a year) sells certain finance receivables relating to retail installment sale contracts and finance leases. In each of these transactions, the applicable finance receivables are sold to a special purpose entity (SPE). The SPEs have limited purposes and generally are only permitted to purchase the finance receivables, issue asset-backed securities and make payments on the securities. The SPEs only issue a single series of securities and generally are dissolved when those securities have been paid in full. The SPEs, typically trusts, are considered to be qualifying special-purpose entities (QSPEs) and thus, in accordance with Statement of Financial Accounting Standard No. 140 (SFAS 140), "Accounting for Transfers and Servicing of Financial Assets and Extinguishment of Liabilities," are not consolidated. The QSPEs issue debt to pay for the finance receivables they acquire from Cat Financial. The primary source for repayment of the debt is the cash flows generated from the finance receivables owned by the QSPEs. The assets of the QSPEs are legally isolated and are not available to pay the creditors of Cat Financial or any other affiliate of Cat Financial. The QSPEs held total assets of $909 million related to these securitizations as of December 31, 2008. We use QSPEs in a manner consistent with conventional practices in the securitization industry to isolate these finance receivables, which are secured by new and used equipment, for the benefit of securitization investors.
The use of the QSPEs enables us to access the U.S. securitization market for the sale of these types of financial assets. The amounts of funding from securitizations reflect such factors as capital market accessibility, relative costs of funding sources and assets available for securitization. Cat Financial had cash proceeds from initial sales of these receivables of $600 million and $650 million in 2008 and 2007, respectively, and recognized a pre-tax gain of $12 million and $4 million for 2008 and 2007, respectively. The fair value of the retained interests in all securitizations of retail finance receivables outstanding, totaling $52 million and $49 million as of December 31, 2008 and 2007, respectively, are included in Other assets. Our sensitivity analysis indicated that the impact of a 20 percent adverse change in individual assumptions used to calculate the fair value of all our retained interests as of December 31, 2008, would be $8 million or less.
Dividends paid per common share | |||||||||||
| Quarter | 2008 | 2007 | 2006 | ||||||||
| First | $ | .360 | $ | .300 | $ | .250 | |||||
| Second | .360 | .300 | .250 | ||||||||
| Third | .420 | .360 | .300 | ||||||||
| Fourth | .420 | .360 | .300 | ||||||||
| $ | 1.560 | $ | 1.320 | $ | 1.100 | ||||||
Contractual obligations
| The company has committed cash outflow related to long-term debt, operating lease agreements, postretirement obligations, purchase obligations, interest on long-term debt and other long-term contractual obligations. Minimum payments for these obligations are: | ||||||||||||||||||||||||||||||
| (Millions of dollars) | 2009 | 2010 | 2011 | 2012 | 2013 | After 2013 | Total | |||||||||||||||||||||||
| Long-term debt: | ||||||||||||||||||||||||||||||
| Machinery and Engines (excluding capital leases) | $ | 325 | $ | 151 | $ | 561 | $ | 176 | $ | 494 | $ | 4,061 | $ | 5,768 | ||||||||||||||||
| Machinery and Engines-capital leases | 131 | 125 | 65 | 26 | 34 | 43 | 424 | |||||||||||||||||||||||
| Financial Products | 5,036 | 4,734 | 2,326 | 1,562 | 1,800 | 6,676 | 22,134 | |||||||||||||||||||||||
| Total long-term debt | 5,492 | 5,010 | 2,952 | 1,764 | 2,328 | 10,780 | 28,326 | |||||||||||||||||||||||
| Operating leases | 223 | 183 | 149 | 119 | 99 | 487 | 1,260 | |||||||||||||||||||||||
Postretirement obligations 1 | 1,340 | 1,380 | 2,350 | 1,400 | 1,420 | 6,080 | 13,970 | |||||||||||||||||||||||
| Purchase obligations: | ||||||||||||||||||||||||||||||
Accounts payable 2 | 4,827 | — | — | — | — | — | 4,827 | |||||||||||||||||||||||
Purchase orders 3 | 3,733 | — | — | — | — | — | 3,733 | |||||||||||||||||||||||
Other contractual obligations 4 | 226 | 63 | 37 | 25 | 12 | — | 363 | |||||||||||||||||||||||
| Total purchase obligations | 8,786 | 63 | 37 | 25 | 12 | — | 8,923 | |||||||||||||||||||||||
Interest on long-term debt 5 | 1,107 | 851 | 744 | 664 | 612 | 6,916 | 10,894 | |||||||||||||||||||||||
Other long-term obligations 6 | 172 | 153 | 115 | 80 | 12 | 30 | 562 | |||||||||||||||||||||||
| Total contractual obligations | $ | 17,120 | $ | 7,640 | $ | 6,347 | $ | 4,052 | $ | 4,483 | $ | 24,293 | $ | 63,935 | ||||||||||||||||
| 1 | Amounts represent expected contributions to our pension and other postretirement benefit plans through 2018, offset by expected Medicare Part D subsidy receipts. | |||||||||||||||||||||||||||||
| 2 | Amount represents invoices received and recorded as liabilities in 2008, but scheduled for payment in 2009. These represent short-term obligations made in the ordinary course of business. | |||||||||||||||||||||||||||||
| 3 | Amount represents contractual obligations for material and services on order at December 31, 2008 but not yet delivered. These represent short-term obligations made in the ordinary course of business. | |||||||||||||||||||||||||||||
| 4 | Amounts represent long-term commitments entered into with key suppliers for minimum purchases quantities. | |||||||||||||||||||||||||||||
| 5 | Amounts represent estimated contractual interest payments on long-term debt. | |||||||||||||||||||||||||||||
| 6 | Amounts represent contractual obligations primarily related to software license contracts, IT consulting contracts and outsourcing contracts for benefit plan administration and software system support. | |||||||||||||||||||||||||||||
Page A-86
We adopted FIN 48, “Accounting for Uncertainty in Income Taxes” as of January 1, 2007. The total amount of gross unrecognized tax benefits for uncertain tax positions, including positions impacting only the timing of tax benefits, was $803 million at December 31, 2008. Payment of these obligations would result from settlements with taxing authorities. Due to the difficulty in determining the timing of settlements, FIN 48 obligations are not included in the table above. We do not expect a significant tax payment related to these obligations within the next year.
The preparation of financial statements in conformity with generally accepted accounting principles requires management to make estimates and assumptions that affect reported amounts. The more significant estimates include: residual values for leased assets, fair market values for goodwill impairment tests, warranty liability, stock-based compensation, reserves for product liability and insurance losses, postretirement benefits, post-sale discounts, credit losses and income taxes. We have incorporated many years of data into the determination of each of these estimates and we have not historically experienced significant adjustments. These assumptions are reviewed at least annually with the Audit Committee of the Board of Directors. Following are the methods and assumptions used in determining our estimates and an indication of the risks inherent in each.
Residual values for leased assets — The residual values for Cat Financial’s leased assets, which are based upon the estimated wholesale market value of leased equipment at the time of the expiration of the lease, represent a careful analysis of historical wholesale market sales prices, projected forward on a level trend line without consideration for inflation or possible future pricing action. At the inception of the lease, residual values are derived from consideration of the following critical factors: market size and demand, any known significant market/product trends, total expected hours of usage, machine configuration, application, location, model changes, quantities and past re-marketing experience, third party residual guarantees and contractual customer purchase options. During the term of the leases, residual amounts are monitored. If estimated market values reflect a non-temporary impairment due to economic factors, obsolescence or other adverse circumstances, the residuals are adjusted to the lower estimated values by a charge to earnings. For equipment on operating leases, the charge is recognized through depreciation expense. For finance leases, it is recognized through a reduction of finance revenue.
Fair values for goodwill impairment tests — We test goodwill for impairment annually, at the reporting unit level, and whenever events or circumstances make it likely that an impairment may have occurred, such as a significant adverse change in the business climate or a decision to sell all or a portion of a reporting unit. We perform our annual goodwill impairment test as of October 1 and monitor for interim triggering events on an ongoing basis.
Determining whether an impairment has occurred requires valuation of the respective reporting unit, which we estimate using a discounted five year forecasted cash flow with a year-five residual value based upon a comparative market Earnings Before Interest, Taxes, Depreciation and Amortization (EBITDA) multiple. The assumptions about future cash flows and growth rates are based on each reporting unit’s long-term forecast and are subject to review and approval of our senior management. The market EBITDA multiple is based on market transactions in the reporting unit’s industry. The discount rate is based on our weighted average cost of capital, which we believe approximates the rate from a market participant’s perspective. The estimated fair value could be impacted by changes in interest rates, growth rates, costs, pricing, capital expenditures and market conditions.
The 2008 annual impairment test indicated the fair value of each of our reporting units exceeded its respective carrying value, including goodwill. In the fourth quarter of 2008, economic and market conditions deteriorated, affecting the outlook of our various businesses. Although our businesses have been impacted by the economic downturn, Caterpillar’s market capitalization has remained significantly above its book value and an evaluation of our reporting units indicated that it was unlikely the fair value of any reporting unit fell below its carrying value. Accordingly, we did not perform an interim goodwill impairment test subsequent to the annual impairment test.
A prolonged economic downturn resulting in lower EBITDA multiples, lower long-term growth rates and reduced long-term profitability may reduce the fair value of our reporting units. Industry specific events or circumstances that have a negative impact to the valuation assumptions may also reduce the fair value of our reporting units. Should such events occur and it becomes more likely than not that a reporting unit’s fair value has fallen below its carrying value, we will perform an interim goodwill impairment test(s), in addition to the annual impairment test. Future impairment tests may result in a goodwill impairment, depending on the outcome of both step one and step two of the impairment review process. A goodwill impairment would be reported as a non-cash charge to earnings.
Impairment of available-for-sale securities — Available-for-sale securities, primarily at Cat Insurance, are reviewed at least quarterly to identify fair values below cost which may indicate that a security is impaired and should be written down to fair value.
Page A-87
For debt securities, once a security’s fair value is below cost we utilize data gathered by investment managers, external sources and internal research to monitor the performance of the security to determine whether an other-than-temporary impairment has occurred. These reviews consist of both quantitative and qualitative analysis and require a degree of management judgment. Securities in a loss position are monitored and assessed at least quarterly based on severity of loss and may be deemed other-than-temporarily impaired at any time. Once a security’s fair value has been twenty percent or more below its original cost for six consecutive months, the security will be other-than-temporarily impaired unless there are sufficient facts and circumstances supporting otherwise.
For equity securities in a loss position, determining whether the security is other-than-temporarily impaired requires an analysis of the securities’ historical sector returns and volatility. This information is utilized to estimate the security’s future fair value to assess whether the security has the ability to recover to its original cost over a reasonable period of time as follows:
| · | Historical annualized sector returns over a two-year period are analyzed to estimate the securities’ fair value over the next two years. |
| · | The volatility factor for the security is applied to the sector historical returns to further estimate the fair value of the security over the next two years. |
In the event the estimated future fair value is less than the original cost, qualitative factors are then considered in determining whether a security is other-than-temporarily impaired, which includes reviews of the following: significant changes in the regulatory, economic or technological environment of the investee, significant changes in the general market condition of either the geographic area or the industry in which the investee operates, and length of time and the extent to which the fair value has been less than cost. These qualitative factors are subjective and require a degree of management judgment.
Warranty liability — At the time a sale is recognized, we record estimated future warranty costs. The warranty liability is determined by applying historical claim rate experience to the current field population and dealer inventory. Generally, historical claim rates are based on actual warranty experience for each product by machine model/engine size. Specific rates are developed for each product build month and are updated monthly based on actual warranty claim experience. Warranty costs may differ from those estimated if actual claim rates are higher or lower than our historical rates.
Stock-based compensation — We use a lattice-based option-pricing model to calculate the fair value of our stock option and SARs. The calculation of the fair value of the awards using the lattice-based option-pricing model is affected by our stock price on the date of grant as well as assumptions regarding the following:
| · | Volatility is a measure of the amount by which the stock price is expected to fluctuate each year during the expected life of the award and is based on historical and current implied volatilities from traded options on Caterpillar stock. The implied volatilities from traded options are impacted by changes in market conditions. An increase in the volatility would result in an increase in our expense. |
| · | The expected term represents the period of time that awards granted are expected to be outstanding and is an output of the lattice-based option-pricing model. In determining the expected term of the award, future exercise and forfeiture patterns are estimated from Caterpillar employee historical exercise behavior. These patterns are also affected by the vesting conditions of the award. Changes in the future exercise behavior of employees or in the vesting period of the award could result in a change in the expected term. An increase in the expected term would result in an increase to our expense. |
| · | The weighted-average dividend yield is based on Caterpillar's historical dividend yields. As holders of stock-based awards do not receive dividend payments, this could result in employees retaining the award for a longer period of time if dividend yields decrease or exercising the award sooner if dividend yields increase. A decrease in the dividend yield would result in an increase in our expense. |
| · | The risk-free interest rate is based on the U.S. Treasury yield curve in effect at time of grant. As the risk-free interest rate increases, the expected term increases, resulting in an increase in our expense. |
The fair value of our RSUs is determined by reducing the stock price on the date of grant by the present value of the estimated dividends to be paid during the vesting period. The estimated dividends are based on Caterpillar’s weighted-average dividend yields. A decrease in the dividend yield would result in an increase in our expense.
Stock-based compensation expense recognized during the period is based on the value of the number of awards that are expected to vest. In determining the stock-based compensation expense to be recognized, a forfeiture rate is applied to the fair value of the award. This rate represents the number of awards that are expected to be forfeited prior to vesting and is based on Caterpillar employee historical behavior. Changes in the future behavior of employees could impact this rate. A decrease in this rate would result in an increase in our expense.
Page A-88
Product liability and insurance loss reserve — We determine these reserves based upon reported claims in process of settlement and actuarial estimates for losses incurred but not reported. Loss reserves, including incurred but not reported reserves, are based on estimates and ultimate settlements may vary significantly from such estimates due to increased claims frequency or severity over historical levels.
Postretirement benefits — Primary actuarial assumptions were determined as follows:
| · | The U.S. expected long-term rate of return on plan assets is based on our estimate of long-term passive returns for equities and fixed income securities weighted by the allocation of our plan assets. Based on historical performance, we increase the passive returns due to our active management of the plan assets. A similar process is used to determine the rate for our non-U.S. pension plans. This rate is impacted by changes in general market conditions, but because it represents a long-term rate, it is not significantly impacted by short-term market swings. Changes in our allocation of plan assets would also impact this rate. For example, a shift to more fixed income securities would lower the rate. A decrease in the rate would increase our expense. |
| · | The assumed discount rate is used to discount future benefit obligations back to today's dollars. For 2008, the U.S. discount rate is based on a benefit cash flow-matching approach and represents the rate at which our benefit obligations could effectively be settled as of our measurement date, December 31. The benefit cash flow-matching approach involves analyzing Caterpillar's projected cash flows against a high quality bond yield curve, calculated using a wide population of corporate Aa bonds available on the measurement date. The very highest and lowest yielding bonds (top and bottom 10%) are excluded from the analysis. Previously, we used the Moody's Aa bond yield as of our measurement date, November 30, and validated the discount rate using the benefit cash flow-matching approach. A similar change was made to determine the assumed discount rate for our most significant non-U.S. plans. This rate is sensitive to changes in interest rates. A decrease in the discount rate would increase our obligation and future expense. |
| · | The expected rate of compensation increase is used to develop benefit obligations using projected pay at retirement. It represents average long-term salary increases. This rate is influenced by our long-term compensation policies. An increase in the rate would increase our obligation and expense. |
| · | The assumed health care trend rate represents the rate at which health care costs are assumed to increase and is based on historical and expected experience. Changes in our projections of future health care costs due to general economic conditions and those specific to health care (e.g., technology driven cost changes) will impact this trend rate. An increase in the trend rate would increase our obligation and expense. |
Post-sale discount reserve — We provide discounts to dealers and OEMs through merchandising programs that are administered by our marketing groups. We have numerous programs that are designed to promote the sale of our products. The most common dealer programs provide a discount when the dealer sells a product to a targeted end user. OEM programs provide discounts designed to encourage the use of our engines. The cost of discounts is estimated based on historical experience and planned changes in merchandising programs and is reported as a reduction to sales when the product sale is recognized. The amount of accrued post-sale discounts was $828 million, $669 million and $726 million as of December 31, 2008, 2007 and 2006, respectively. The reserve represents discounts that we expect to pay on previously sold units and is reviewed at least quarterly. The reserve is adjusted if discounts paid differ from those estimated. Historically, those adjustments have not been material.
Credit loss reserve — Management's ongoing evaluation of the adequacy of the allowance for credit losses considers both impaired and unimpaired finance receivables and takes into consideration past loss experience, known and inherent risks in the portfolio, adverse situations that may affect the borrower's ability to repay, estimated value of underlying collateral and current economic conditions. In estimating probable losses we review accounts that are past due, non-performing, in bankruptcy or otherwise identified as at risk for potential credit loss. Accounts are identified as at risk for potential credit loss using information available about the customer, such as financial statements, news reports and published credit ratings as well as general information regarding industry trends and the general economic environment.
The allowance for credit losses attributable to specific accounts is based on the most probable source of repayment, which is normally the liquidation of collateral. In determining collateral value we estimate current fair market value of collateral and factor in credit enhancements such as additional collateral and third party guarantees. The allowance for credit losses attributable to the remaining accounts is a general allowance based upon the risk in the portfolio, primarily using probabilities of default and an estimate of associated losses. In addition, qualitative factors not able to be fully captured in previous analysis including industry trends, macroeconomic factors and model imprecision are considered in the evaluation of the adequacy of the allowance for credit losses. These qualitative factors are subjective and require a degree of management judgment.
While management believes it has exercised prudent judgment and applied reasonable assumptions which have resulted in an allowance presented in accordance with generally accepted accounting principles, there can be no assurance that in the future, changes in economic conditions or other factors might cause changes in the financial health of our customers which could change the timing and level of payments received thus necessitating a change to our estimated losses.
Page A-89
Income tax reserve — Despite our belief that our tax return positions are consistent with applicable tax laws, we believe that certain positions are likely to be challenged by taxing authorities. Settlement of any challenge can result in no change, a complete disallowance, or some partial adjustment reached through negotiations or litigation. Our tax reserves reflect the difference between the tax benefit claimed on tax returns and the amount recognized in financial statements in accordance with FIN 48. FIN 48 requires that tax benefits recognized in the financial statements must be at least more likely than not of being sustained based on technical merits. The amount of benefit recorded for these positions is measured as the largest benefit more likely than not to be sustained. Significant judgment is required in making these determinations. As the examination process progresses with tax authorities, adjustments to tax reserves may be necessary to reflect taxes payable upon settlement. Tax reserve adjustments related to positions impacting the effective tax rate affect the provision for income taxes. Tax reserve adjustments related to positions impacting the timing of deductions impact deferred tax assets and liabilities.
Caterpillar’s worldwide employment was 112,887 at the end of 2008, up 11,554 from a year ago. Of the increase, approximately 5,500 were the result of consolidating Cat Japan and about 1,300 were the result of acquisitions. The remaining increase of 4,800 employees primarily supported growth and new product introductions.
| Full-Time Employees at Year-End | |||||||||||||
| 2008 | 2007 | 2006 | |||||||||||
| Inside U.S. | 53,509 | 50,545 | 48,709 | ||||||||||
| Outside U.S. | 59,378 | 50,788 | 45,884 | ||||||||||
| Total | 112,887 | 101,333 | 94,593 | ||||||||||
| By Region: | |||||||||||||
| North America | 54,284 | 50,901 | 49,018 | ||||||||||
| EAME | 26,983 | 26,168 | 24,845 | ||||||||||
| Latin America | 14,403 | 13,930 | 13,231 | ||||||||||
| Asia/Pacific | 17,217 | 10,334 | 7,499 | ||||||||||
| Total | 112,887 | 101,333 | 94,593 | ||||||||||
ENVIRONMENTAL AND LEGAL MATTERS
The company is regulated by federal, state and international environmental laws governing our use, transport and disposal of substances and control of emissions. In addition to governing our manufacturing and other operations, these laws often impact the development of our products, including, but not limited to, required compliance with air emissions standards applicable to internal combustion engines. Compliance with these existing laws has not had a material impact on our capital expenditures, earnings or global competitive position.
We are engaged in remedial activities at a number of locations, often with other companies, pursuant to federal and state laws. When it is reasonably probable we will pay remedial costs at a site and those costs can be reasonably estimated, the costs are charged against our earnings. In formulating that estimate, we do not consider amounts expected to be recovered from insurance companies or others. The amount recorded for environmental remediation is not material and is included in “Accrued expenses” in the Consolidated Statement of Financial Position.
We cannot reasonably estimate costs at sites in the very early stages of remediation. Currently, we have a few sites in the very early stages of remediation and there is no more than a remote chance that a material amount for remedial activities at any individual site, or at all sites in the aggregate, will be required.
On May 14, 2007, the U.S. Environmental Protection Agency (EPA) issued a Notice of Violation to Caterpillar Inc., alleging various violations of Clean Air Act Sections 203, 206 and 207. EPA claims that Caterpillar violated such sections by shipping engines and catalytic converter after-treatment devices separately, introducing into commerce a number of uncertified and/or misbuilt engines and failing to timely report emissions-related defects. Caterpillar is currently engaging in negotiations with EPA to resolve these issues, but we are unable at this time to place precise estimates on the potential exposure to penalties. However, Caterpillar is cooperating with EPA and, based upon initial discussions and although penalties could potentially exceed $100,000, management does not believe that this issue will have a material adverse impact on our financial position.
Page A-90
We have disclosed certain individual legal proceedings in this filing. Additionally, we are involved in other unresolved legal actions that arise in the normal course of business. The most prevalent of these unresolved actions involve disputes related to product design, manufacture and performance liability (including claimed asbestos and welding fumes exposure), contracts, employment issues or intellectual property rights. Although it is not possible to predict with certainty the outcome of these unresolved legal actions, we believe that these actions will not individually or in the aggregate have a material adverse effect on our consolidated financial position, liquidity or results of operations.
On September 29, 2004, Kruse Technology Partnership (Kruse) filed a lawsuit against Caterpillar in the United States District Court for the Central District of California alleging that certain Caterpillar engines built from October 2002 to the present infringe upon certain claims of three of Kruse's patents on engine fuel injection timing and combustion strategies. Caterpillar denied Kruse's allegations and filed a counterclaim seeking a declaration from the court that Caterpillar is not infringing upon Kruse's patents and that the patents are invalid and unenforceable. On December 20, 2008, Caterpillar and Kruse entered into a confidential settlement agreement whereby all pending claims with regard to the lawsuit were settled. The settlement, which did not have a material impact on our financial statements, included an agreement by both parties to not bring any future actions in the matter. Subsequent to the agreement, the court entered an order dismissing the case.
STOCK-BASED COMPENSATION
On January 1, 2006, we adopted the provisions of Statement of Financial Accounting Standards No. 123 (revised 2004), "Share-Based Payment," (SFAS 123R) using the modified prospective transition method. The modified prospective transition method requires compensation expense to be recognized in the financial statements for all awards granted after the date of adoption as well as for the unvested portion of previously granted awards outstanding as of the date of adoption. Prior to the date of adoption of SFAS 123R, we used the intrinsic-value based method, as described in Accounting Principles Board No. 25, to account for stock options and no compensation expense was recognized in association with our stock awards.
In anticipation of the adoption of SFAS 123R, we did not modify the terms of any previously granted options. Our stock incentive plans provide for the granting of nonqualified options, stock-settled stock appreciation rights (SARs) and restricted stock units (RSUs) to officers, directors and key employees of the company. In 2007, in order to align our stock award program with the overall market, we adjusted our 2007 grant by reducing the overall number of employee awards and utilizing RSUs in addition to the SARs and option awards. The 2008, 2007 and 2006 awards generally vest three years after the date of grant. At grant, SARs and option awards have a term life of ten years. Upon separation from service, if the participant is 55 years of age or older with more than ten years of service, the participant meets the criteria for a “Long Service Separation". If the “Long Service Separation” criteria are met, the vested options/SARs will have a life that is the lesser of 10 years from the original grant date or five years from the separation date.
We use a lattice-based option-pricing model to estimate the fair value of options and SARs granted. We use the stock price on the day of grant reduced by the present value of the estimated dividends to be paid during the vesting period to estimate the fair value of the RSUs granted. The adoption of SFAS 123R reduced operating profit for the year ended December 31, 2006 by $137 million and reduced profit after-tax by $92 million ($.14 per share basic and $.09 per share diluted). 2008 and 2007 stock-based compensation expense was $194 million and $146 million, respectively. At December 31, 2008, $136 million of expense with respect to unvested stock-based awards has yet to be recognized and will be expensed over a weighted-average period of approximately 1.8 years.
RETIREMENT BENEFITS
In September 2006, the FASB issued Statement of Financial Accounting Standards No. 158 (SFAS 158), "Employers' Accounting for Defined Benefit Pension and Other Postretirement Plans – an amendment of FASB Statements No. 87, 88, 106 and 132(R)." SFAS 158 requires the recognition of the overfunded or underfunded status of pension and other postretirement benefit plans on the balance sheet. Under SFAS 158, gains and losses, prior service costs and credits and any remaining transition amounts under SFAS 87 and SFAS 106 that have not yet been recognized through net periodic benefit cost are recognized in Accumulated other comprehensive income (loss), net of tax effects, until they are amortized as a component of net periodic cost. Also, the measurement date – the date at which the benefit obligation and plan assets are measured – is required to be the company's fiscal year-end. We adopted the balance sheet recognition provisions at December 31, 2006, and adopted the year-end measurement date effective January 1, 2008 using the “one measurement” approach. Under the one measurement approach, net periodic benefit cost for the period between any early measurement date and the end of the fiscal year that the measurement provisions are applied is allocated proportionately between amounts to be recognized as an adjustment of Profit employed in the business and net periodic benefit cost for the fiscal year. Previously, we used a November 30th measurement date for our U.S. pension and other postretirement benefit plans and September 30th for our non-U.S. plans. The adoption of the balance sheet recognition provisions reduced December 31, 2006 assets by approximately $500 million, increased liabilities by approximately $2.20 billion and reduced stockholders' equity by approximately $2.70 billion. Also, we reclassified approximately $500 million from current liabilities to long-term liabilities based on the classification guidelines provided in SFAS 158. The adoption of the year-end measurement date provisions increased January 1, 2008 assets by $8 million, increased liabilities by $24 million and reduced stockholders’ equity by $16 million. The adoption of this Statement did not impact our results of operations.
Page A-91
We recognized pension expense of $200 million in 2008 as compared to $361 million in 2007. The decrease in expense was primarily a result of lower amortization of net actuarial losses due to higher discount rates and better than expected asset returns. In addition, pension expense for 2007 included a $44 million charge to recognize previously unrecorded liabilities related to a subsidiary pension plan. SFAS 87, "Employers' Accounting for Pensions," as amended by SFAS 158, requires companies to discount future benefit obligations back to today's dollars using a discount rate that is based on high-quality fixed-income investments. A decrease in the discount rate increases the pension benefit obligation, while an increase in the discount rate decreases the pension benefit obligation. This increase or decrease in the pension benefit obligation is recognized in Accumulated other comprehensive income (loss) and subsequently amortized into earnings as an actuarial gain or loss. SFAS 87 also requires companies to use an expected long-term rate of return on plan assets for computing current year pension expense. Differences between the actual and expected asset returns are also recognized in Accumulated other comprehensive income (loss) and subsequently amortized into earnings as actuarial gains and losses. At the end of 2008, total actuarial losses recognized in Accumulated other comprehensive income (loss) were $7.74 billion, as compared to $2.72 billion in 2007. The majority of the actuarial losses are due to significant asset losses during 2008 in addition to losses from other demographic and economic assumptions over the past several years. The $5.02 billion increase from 2007 to 2008 was primarily the result of asset losses during 2008, partially offset by an increase in discount rate and foreign exchange rate gains for non-U.S. plans.
In 2008, we recognized other postretirement benefit expense of $287 million compared to $311 million in 2007. The decrease in expense was primarily the result of lower amortization of actuarial losses due to higher discount rates. Actuarial losses recognized in Accumulated other comprehensive income (loss) for other postretirement benefit plans were $881 million at the end of 2008. These losses mainly reflect significant asset losses during 2008, an increase in expected health care inflation and several years of declining discount rates. The losses were $122 million higher at the end of 2008 as compared to 2007 due to asset losses during 2008, partially offset by lower than expected health care costs.
Actuarial losses for both pensions and other postretirement benefits will be impacted in future periods by actual asset returns, actual health care inflation, discount rate changes, actual demographic experience and other factors that impact these expenses. These losses, reported in Accumulated other comprehensive income (loss), will be amortized as a component of net periodic benefit cost on a straight-line basis over the average remaining service period of active employees expected to receive benefits under the benefit plans. At the end of 2008, the average remaining service period of active employees was 10 years for our U.S. pension plans, 13 years for our non-U.S. pension plans and 7 years for other postretirement benefit plans. We expect our amortization of net actuarial losses to increase approximately $87 million in 2009 as compared to 2008, primarily due to asset losses during 2008. We expect our total pension and other postretirement benefits expense to increase approximately $250 million in 2009, excluding any impact from redundancy charges.
For our U.S. pension plans, our 2008 asset allocation was 70 percent equity securities and 30 percent debt securities, and our target allocation for 2009 is 70 percent equity securities, 25 percent debt securities and 5 percent real estate. The 2008 asset allocation for our non-U.S. pension plans was 50 percent equity securities, 41 percent debt securities, 6 percent real estate and 3 percent other. The 2009 target allocation for our non-U.S. pension plans is 54 percent equity securities, 37 percent debt securities, 6 percent real estate and 3 percent other. Our target asset allocations reflect our investment strategy of maximizing the rate of return on plan assets and the resulting funded status, within an appropriate level of risk. The U.S. plans are rebalanced to plus or minus five percentage points of the target asset allocation ranges on a monthly basis. The frequency of rebalancing for the non-U.S. plans varies depending on the plan.
The use of certain derivative instruments is permitted where appropriate and necessary for achieving overall investment policy objectives. The U.S. plans currently utilize futures contracts to offset current equity positions in order to rebalance the total portfolio to the target asset allocation. During 2008, approximately 5 percent of the U.S. pension plans’ assets were rebalanced from equity to fixed income positions through the use of futures contracts, as compared to 10 percent for 2007 and 2006. The actual asset allocation percentages above represent this rebalancing effort. The plans do not engage in futures contracts for speculative purposes.
During 2008, we made cash contributions of $288 million to our U.S. defined benefit pension plans and $134 million to our non-U.S. pension plans. We expect to make approximately $1 billion of contributions during 2009, most of which are required. We have adequate liquidity resources to fund both U.S. and non-U.S. pension plans.
Actuarial assumptions have a significant impact on both pension and other postretirement benefit expenses. The effects of a one percentage point change in our primary actuarial assumptions on 2008 benefit costs and year-end obligations are included in the table below.
Page A-92
| Postretirement Benefit Plan Actuarial Assumptions Sensitivity | ||||||||||||||||
Following are the effects of a one percentage-point change in our primary pension and other postretirement benefit actuarial assumptions (included in the following table) on 2008 pension and other postretirement benefits costs and obligations: | ||||||||||||||||
| 2008 Benefit Cost | Year-end Benefit Obligation | |||||||||||||||
| (Millions of dollars) | One percentage- point increase | One percentage- point decrease | One percentage- point increase | One percentage- point decrease | ||||||||||||
| Pension benefits: | ||||||||||||||||
| Assumed discount rate | $ | (156 | ) | $ | 165 | $ | (1,652 | ) | $ | 1,873 | ||||||
| Expected rate of compensation increase | 88 | (83 | ) | 437 | (406 | ) | ||||||||||
| Expected long-term rate of return on plan assets | (126 | ) | 126 | — | — | |||||||||||
| Other postretirement benefits: | ||||||||||||||||
| Assumed discount rate | (31 | ) | 30 | (476 | ) | 527 | ||||||||||
| Expected rate of compensation increase | — | — | 1 | (1 | ) | |||||||||||
| Expected long-term rate of return on plan assets | (15 | ) | 15 | — | — | |||||||||||
| Assumed health care cost trend rate | 55 | (49 | ) | 350 | (309 | ) | ||||||||||
Primary Actuarial Assumptions | ||||||||||||||||||||||||||||||||||||
| U.S. Pension Benefits | Non-U.S. Pension Benefits | Other Postretirement Benefits | ||||||||||||||||||||||||||||||||||
| 2008 | 2007 | 2006 | 2008 | 2007 | 2006 | 2008 | 2007 | 2006 | ||||||||||||||||||||||||||||
Weighted-average assumptions used to determine benefit obligations, end of year: | ||||||||||||||||||||||||||||||||||||
| Discount rate | 6.1 | % | 5.8 | % | 5.5 | % | 4.1 | % | 5.3 | % | 4.7 | % | 6.0 | % | 5.8 | % | 5.5 | % | ||||||||||||||||||
| Rate of compensation increase | 4.5 | % | 4.5 | % | 4.0 | % | 4.1 | % | 4.1 | % | 4.0 | % | 4.4 | % | 4.4 | % | 4.0 | % | ||||||||||||||||||
Weighted-average assumptions used to determine net cost: | ||||||||||||||||||||||||||||||||||||
| Discount rate | 5.8 | % | 5.5 | % | 5.6 | % | 5.3 | % | 4.7 | % | 4.6 | % | 5.8 | % | 5.5 | % | 5.6 | % | ||||||||||||||||||
| Expected return on plan assets | 9.0 | % | 9.0 | % | 9.0 | % | 7.6 | % | 7.7 | % | 7.5 | % | 9.0 | % | 9.0 | % | 9.0 | % | ||||||||||||||||||
| Rate of compensation increase | 4.5 | % | 4.0 | % | 4.0 | % | 4.0 | % | 4.0 | % | 3.5 | % | 4.4 | % | 4.0 | % | 4.0 | % | ||||||||||||||||||
| Health care cost trend rates at year-end: | ||||||||||||||||||||||||||||||||||||
| Health care trend rate assumed for next year | 7.4 | % | 7.9 | % | 7.5 | % | ||||||||||||||||||||||||||||||
| Rate that the cost trend rate gradually declines to | 5.0 | % | 5.0 | % | 5.0 | % | ||||||||||||||||||||||||||||||
| Year that the cost trend rate reaches ultimate rate | 2016 | 2016 | 2013 | |||||||||||||||||||||||||||||||||
Page A-93
SENSITIVITY
Foreign Exchange Rate Sensitivity
Machinery and Engines use foreign currency forward and option contracts to manage unmatched foreign currency cash inflow and outflow. Our objective is to minimize the risk of exchange rate movements that would reduce the U.S. dollar value of our foreign currency cash flow. Our policy allows for managing anticipated foreign currency cash flow for up to five years. Based on the anticipated and firmly committed cash inflow and outflow for our Machinery and Engines operations for the next 12 months and the foreign currency derivative instruments in place at year-end, a hypothetical 10 percent weakening of the U.S. dollar relative to all other currencies would adversely affect our expected 2009 cash flow for our Machinery and Engines operations by approximately $378 million. Last year similar assumptions and calculations yielded a potential $100 million adverse impact on 2008 cash flow. We determine our net exposures by calculating the difference in cash inflow and outflow by currency and adding or subtracting outstanding foreign currency derivative instruments. We multiply these net amounts by 10 percent to determine the sensitivity.
Since our policy for Financial Products operations is to hedge the foreign exchange risk when the currency of our debt portfolio does not match the currency of our receivable portfolio, a 10 percent change in the value of the U.S. dollar relative to all other currencies would not have a material effect on our consolidated financial position, results of operations or cash flow. Neither our policy nor the effect of a 10 percent change in the value of the U.S. dollar has changed from that reported at the end of last year.
The effect of the hypothetical change in exchange rates ignores the effect this movement may have on other variables, including competitive risk. If it were possible to quantify this competitive impact, the results would probably be different from the sensitivity effects shown above. In addition, it is unlikely that all currencies would uniformly strengthen or weaken relative to the U.S. dollar. In reality, some currencies may weaken while others may strengthen. Our primary exposure (excluding competitive risk) is to exchange rate movements in the British pound, Japanese yen and euro.
Interest Rate Sensitivity
For our Machinery and Engines operations, we have the option to use interest rate swaps to lower the cost of borrowed funds by attaching fixed-to-floating interest rate swaps to fixed-rate debt. A hypothetical 100 basis point adverse move (increase) in interest rates along the entire interest rate yield curve would adversely affect 2009 pretax earnings of Machinery and Engines by $16 million. Last year, similar assumptions and calculations yielded a potential $9 million adverse impact on 2008 pretax earnings. This effect is caused by the interest rate fluctuations on our short-term debt and fixed-to-floating interest rate swaps.
For our Financial Products operations, we use interest rate derivative instruments primarily to meet our match-funding objectives and strategies. We have a match-funding policy whereby the interest rate profile (fixed or floating rate) of our debt portfolio is matched to the interest rate profile of our earning asset portfolio (finance receivables and operating leases) within certain parameters. In connection with that policy, we use interest rate swap agreements to modify the debt structure. Match funding assists us in maintaining our interest rate spreads, regardless of the direction interest rates move.
In order to properly manage sensitivity to changes in interest rates, Financial Products measures the potential impact of different interest rate assumptions on pretax earnings. All on-balance sheet positions, including derivative financial instruments, are included in the analysis. The primary assumptions included in the analysis are that there are no new fixed rate assets or liabilities, the proportion of fixed rate debt to fixed rate assets remains unchanged and the level of floating rate assets and debt remain constant. Based on the December 31, 2008 balance sheet under these assumptions, the analysis estimates the impact of a 100 basis point immediate and sustained parallel rise in interest rates to be a $28 million decrease to pretax earnings for 2009. Last year, similar assumptions and calculations yielded a potential $19 million adverse impact on 2008 pretax earnings.
This analysis does not necessarily represent our current outlook of future market interest rate movement, nor does it consider any actions management could undertake in response to changes in interest rates. Accordingly, no assurance can be given that actual results would be consistent with the results of our estimate.
Page A-94
Profit Per Share Excluding Redundancy Costs
Caterpillar has historically provided a profit per share outlook for the following year in our Annual Report on Form 10-K. In 2009, we expect to incur significant redundancy costs related to employment reductions as a result of company actions to reduce costs in response to an expected significant decline in sales volume and so we provided an outlook for profit per share of $2.50 excluding redundancy costs, a non-GAAP measure. We believe it is important to separately quantify the expected amount of redundancy charges in order for our outlook to be meaningful to our readers.
Reconciliation of profit per share excluding redundancy costs to the most directly comparable GAAP measure, profit per share:
| 2009 Outlook | ||
| Profit per share | $ | 2.00 |
| Per share redundancy costs | $ | 0.50 |
| Profit per share excluding redundancy costs | $ | 2.50 |
Supplemental Consolidating Data
We are providing supplemental consolidating data for the purpose of additional analysis. The data has been grouped as follows:
Consolidated—Caterpillar Inc. and its subsidiaries.
Machinery and Engines—The Machinery and Engines data contained in the schedules on pages A-96 to A-98 are "non-GAAP financial measures" as defined by the Securities and Exchange Commission in Regulation G. These non-GAAP financial measures have no standardized meaning prescribed by U.S. GAAP, and therefore, are unlikely to be comparable with the calculation of similar measures for other companies. Management does not intend these items to be considered in isolation or as a substitute for the related GAAP measures. Caterpillar defines Machinery and Engines as it is presented in the supplemental data as Caterpillar Inc. and its subsidiaries with Financial Products accounted for on the equity basis. Machinery and Engines information relates to our design, manufacturing, marketing and parts distribution operations. Financial Products information relates to the financing to customers and dealers for the purchase and lease of Caterpillar and other equipment. The nature of these businesses is different, especially with regard to the financial position and cash flow items. Caterpillar management utilizes this presentation internally to highlight these differences. We also believe this presentation will assist readers in understanding our business.
Financial Products— primarily our finance and insurance subsidiaries, Cat Financial and Cat Insurance.
Consolidating Adjustments—eliminations of transactions between Machinery and Engines and Financial Products.
Pages A-96 to A-98 reconcile Machinery and Engines with Financial Products on the equity basis to Caterpillar Inc. consolidated financial information.
Page A-95
Supplemental Data for Results of Operations For The Years Ended December 31 | |||||||||||||||||||||||||||||||||||||||||||||||||||
Supplemental consolidating data | |||||||||||||||||||||||||||||||||||||||||||||||||||
| (Millions of dollars) | Consolidated | Machinery & Engines 1 | Financial Products | Consolidating Adjustments | |||||||||||||||||||||||||||||||||||||||||||||||
2008 | 2007 | 2006 | 2008 | 2007 | 2006 | 2008 | 2007 | 2006 | 2008 | 2007 | 2006 | ||||||||||||||||||||||||||||||||||||||||
| Sales and revenues: | |||||||||||||||||||||||||||||||||||||||||||||||||||
| Sales of Machinery and Engines | $ | 48,044 | $ | 41,962 | $ | 38,869 | $ | 48,044 | $ | 41,962 | $ | 38,869 | $ | — | $ | — | $ | — | $ | — | $ | — | $ | — | |||||||||||||||||||||||||||
| Revenues of Financial Products | 3,280 | 2,996 | 2,648 | — | — | — | 3,588 | 3,396 | 3,114 | (308 | ) | 2 | (400 | ) | 2 | (466 | ) | 2 | |||||||||||||||||||||||||||||||||
| Total sales and revenues | 51,324 | 44,958 | 41,517 | 48,044 | 41,962 | 38,869 | 3,588 | 3,396 | 3,114 | (308 | ) | (400 | ) | (466 | ) | ||||||||||||||||||||||||||||||||||||
| Operating costs: | |||||||||||||||||||||||||||||||||||||||||||||||||||
| Cost of goods sold | 38,415 | 32,626 | 29,549 | 38,415 | 32,626 | 29,549 | — | — | — | — | — | — | |||||||||||||||||||||||||||||||||||||||
| Selling, general and administrative expenses | 4,399 | 3,821 | 3,706 | 3,812 | 3,356 | 3,294 | 616 | 480 | 446 | (29 | ) | 3 | (15 | ) | 3 | (34 | ) | 3 | |||||||||||||||||||||||||||||||||
| Research and development expenses | 1,728 | 1,404 | 1,347 | 1,728 | 1,404 | 1,347 | — | — | — | — | — | — | |||||||||||||||||||||||||||||||||||||||
| Interest expense of Financial Products | 1,153 | 1,132 | 1,023 | — | — | — | 1,162 | 1,137 | 1,033 | (9 | ) | 4 | (5 | ) | 4 | (10 | ) | 4 | |||||||||||||||||||||||||||||||||
| Other operating (income) expenses | 1,181 | 1,054 | 971 | (33 | ) | (8 | ) | 22 | 1,231 | 1,089 | 965 | (17 | ) | 3 | (27 | ) | 3 | (16 | ) | 3 | |||||||||||||||||||||||||||||||
| Total operating costs | 46,876 | 40,037 | 36,596 | 43,922 | 37,378 | 34,212 | 3,009 | 2,706 | 2,444 | (55 | ) | (47 | ) | (60 | ) | ||||||||||||||||||||||||||||||||||||
| Operating profit | 4,448 | 4,921 | 4,921 | 4,122 | 4,584 | 4,657 | 579 | 690 | 670 | (253 | ) | (353 | ) | (406 | ) | ||||||||||||||||||||||||||||||||||||
| Interest expense excluding Financial Products | 274 | 288 | 274 | 270 | 294 | 285 | — | — | — | 4 | 4 | (6 | ) | 4 | (11 | ) | 4 | ||||||||||||||||||||||||||||||||||
| Other income (expense) | 327 | 357 | 243 | 95 | (75 | ) | (231 | ) | (25 | ) | 85 | 79 | 257 | 5 | 347 | 5 | 395 | 5 | |||||||||||||||||||||||||||||||||
| Consolidated profit before taxes | 4,501 | 4,990 | 4,890 | 3,947 | 4,215 | 4,141 | 554 | 775 | 749 | — | — | — | |||||||||||||||||||||||||||||||||||||||
| Provision for income taxes | 953 | 1,485 | 1,405 | 822 | 1,220 | 1,158 | 131 | 265 | 247 | — | — | — | |||||||||||||||||||||||||||||||||||||||
| Profit of consolidated companies | 3,548 | 3,505 | 3,485 | 3,125 | 2,995 | 2,983 | 423 | 510 | 502 | — | — | — | |||||||||||||||||||||||||||||||||||||||
Equity in profit (loss) of unconsolidated affiliated companies | 37 | 73 | 81 | 38 | 69 | 79 | (1 | ) | 4 | 2 | — | — | — | ||||||||||||||||||||||||||||||||||||||
Equity in profit of Financial Products' subsidiaries | — | — | — | 409 | 506 | 500 | — | — | — | (409 | ) | 6 | (506 | ) | 6 | (500 | ) | 6 | |||||||||||||||||||||||||||||||||
| Profit of consolidated and affiliated companies | 3,585 | 3,578 | 3,566 | 3,572 | 3,570 | 3,562 | 422 | 514 | 504 | (409 | ) | (506 | ) | (500 | ) | ||||||||||||||||||||||||||||||||||||
| Less: Profit attributable to noncontrolling interests | 28 | 37 | 29 | 15 | 29 | 25 | 13 | 8 | 4 | — | — | — | |||||||||||||||||||||||||||||||||||||||
Profit 7 | $ | 3,557 | $ | 3,541 | $ | 3,537 | $ | 3,557 | $ | 3,541 | $ | 3,537 | $ | 409 | $ | 506 | $ | 500 | $ | (409 | ) | $ | (506 | ) | $ | (500 | ) | ||||||||||||||||||||||||
1 | Represents Caterpillar Inc. and its subsidiaries with Financial Products accounted for on the equity basis. |
| 2 | Elimination of Financial Products’ revenues earned from Machinery and Engines. |
| 3 | Elimination of net expenses recorded by Machinery and Engines paid to Financial Products. |
| 4 | Elimination of interest expense recorded between Financial Products and Machinery and Engines. |
| 5 | Elimination of discount recorded by Machinery and Engines on receivables sold to Financial Products and of interest earned between Machinery and Engines and Financial Products. |
| 6 | Elimination of Financial Products’ profit due to equity method of accounting. |
| 7 | Profit attributable to common stockholders. |
Page A-96
Supplemental Data for Financial Position At December 31 | |||||||||||||||||||||||||||||||||||
| Supplemental consolidating data | |||||||||||||||||||||||||||||||||||
| (Millions of dollars) | Consolidated | Machinery & Engines1 | Financial Products | Consolidating Adjustments | |||||||||||||||||||||||||||||||
2008 | 2007 | 2008 | 2007 | 2008 | 2007 | 2008 | 2007 | ||||||||||||||||||||||||||||
| Assets | |||||||||||||||||||||||||||||||||||
| Current assets: | |||||||||||||||||||||||||||||||||||
| Cash and short-term investments | $ | 2,736 | $ | 1,122 | $ | 1,517 | $ | 862 | $ | 1,219 | $ | 260 | $ | — | $ | — | |||||||||||||||||||
| Receivables - trade and other | 9,397 | 8,249 | 6,032 | 4,715 | 545 | 525 | 2,820 | 2,3 | 3,009 | 2,3 | |||||||||||||||||||||||||
| Receivables - finance | 8,731 | 7,503 | — | — | 12,137 | 10,961 | (3,406 | ) | 3 | (3,458 | ) | 3 | |||||||||||||||||||||||
| Deferred and refundable income taxes | 1,223 | 816 | 1,014 | 746 | 209 | 70 | — | — | |||||||||||||||||||||||||||
| Prepaid expenses and other current assets | 765 | 583 | 510 | 565 | 280 | 39 | (25 | ) | 4 | (21 | ) | 4 | |||||||||||||||||||||||
| Inventories | 8,781 | 7,204 | 8,781 | 7,204 | — | — | — | — | |||||||||||||||||||||||||||
| Total current assets | 31,633 | 25,477 | 17,854 | 14,092 | 14,390 | 11,855 | (611 | ) | (470 | ) | |||||||||||||||||||||||||
| Property, plant and equipment – net | 12,524 | 9,997 | 9,380 | 6,782 | 3,144 | 3,215 | — | — | |||||||||||||||||||||||||||
| Long-term receivables - trade and other | 1,479 | 685 | 357 | 90 | 549 | 30 | 573 | 2,3 | 565 | 2,3 | |||||||||||||||||||||||||
| Long-term receivables - finance | 14,264 | 13,462 | — | — | 14,867 | 14,057 | (603 | ) | 3 | (595 | ) | 3 | |||||||||||||||||||||||
| Investments in unconsolidated | |||||||||||||||||||||||||||||||||||
affiliated companies | 94 | 598 | 94 | 586 | — | 12 | — | — | |||||||||||||||||||||||||||
| Investments in Financial Products subsidiaries | — | — | 3,788 | 3,996 | — | — | (3,788 | ) | 5 | (3,996 | ) | 5 | |||||||||||||||||||||||
| Noncurrent deferred and refundable | |||||||||||||||||||||||||||||||||||
| income taxes | 3,311 | 1,553 | 3,725 | 1,803 | 35 | 68 | (449 | ) | 6 | (318 | ) | 6 | |||||||||||||||||||||||
| Intangible assets | 511 | 475 | 510 | 471 | 1 | 4 | — | — | |||||||||||||||||||||||||||
| Goodwill | 2,261 | 1,963 | 2,261 | 1,963 | — | — | — | — | |||||||||||||||||||||||||||
| Other assets | 1,705 | 1,922 | 310 | 293 | 1,395 | 1,629 | — | — | |||||||||||||||||||||||||||
| Total assets | $ | 67,782 | $ | 56,132 | $ | 38,279 | $ | 30,076 | $ | 34,381 | $ | 30,870 | $ | (4,878 | ) | $ | (4,814 | ) | |||||||||||||||||
| Liabilities | |||||||||||||||||||||||||||||||||||
| Current liabilities: | |||||||||||||||||||||||||||||||||||
| Short-term borrowings | $ | 7,209 | $ | 5,468 | $ | 1,632 | $ | 187 | $ | 6,012 | $ | 5,556 | $ | (435 | ) | 7 | $ | (275 | ) | 7 | |||||||||||||||
| Accounts payable | 4,827 | 4,723 | 4,654 | 4,518 | 323 | 373 | (150 | ) | 8 | (168 | ) | 8 | |||||||||||||||||||||||
| Accrued expenses | 4,121 | 3,178 | 2,621 | 1,932 | 1,526 | 1,273 | (26 | ) | 9 | (27 | ) | 9 | |||||||||||||||||||||||
| Accrued wages, salaries and | |||||||||||||||||||||||||||||||||||
| employee benefits | 1,242 | 1,126 | 1,228 | 1,108 | 14 | 18 | — | — | |||||||||||||||||||||||||||
| Customer advances | 1,898 | 1,442 | 1,898 | 1,442 | — | — | — | — | |||||||||||||||||||||||||||
| Dividends payable | 253 | 225 | 253 | 225 | — | — | — | — | |||||||||||||||||||||||||||
| Other current liabilities | 1,027 | 951 | 1,002 | 867 | 29 | 105 | (4 | ) | 6 | (21 | ) | 6 | |||||||||||||||||||||||
| Long-term debt due within one year | 5,492 | 5,132 | 456 | 180 | 5,036 | 4,952 | — | — | |||||||||||||||||||||||||||
| Total current liabilities | 26,069 | 22,245 | 13,744 | 10,459 | 12,940 | 12,277 | (615 | ) | (491 | ) | |||||||||||||||||||||||||
| Long-term debt due after one year | 22,834 | 17,829 | 5,766 | 3,669 | 17,098 | 14,190 | (30 | ) | 7 | (30 | ) | 7 | |||||||||||||||||||||||
| Liability for postemployment benefits | 9,975 | 5,059 | 9,975 | 5,058 | — | 1 | — | — | |||||||||||||||||||||||||||
| Other liabilities | 2,190 | 2,003 | 2,080 | 1,894 | 555 | 406 | (445 | ) | 6 | (297 | ) | 6 | |||||||||||||||||||||||
| Total liabilities | 61,068 | 47,136 | 31,565 | 21,080 | 30,593 | 26,874 | (1,090 | ) | (818 | ) | |||||||||||||||||||||||||
| Commitments and contingencies | |||||||||||||||||||||||||||||||||||
| Redeemable noncontrolling interest | 524 | — | 524 | — | — | — | — | — | |||||||||||||||||||||||||||
| Stockholders’ equity | |||||||||||||||||||||||||||||||||||
| Common stock | 3,057 | 2,744 | 3,057 | 2,744 | 860 | 860 | (860 | ) | 5 | (860 | ) | 5 | |||||||||||||||||||||||
| Treasury stock | (11,217 | ) | (9,451 | ) | (11,217 | ) | (9,451 | ) | — | — | — | — | |||||||||||||||||||||||
| Profit employed in the business | 19,826 | 17,398 | 19,826 | 17,398 | 2,975 | 2,566 | (2,975 | ) | 5 | (2,566 | ) | 5 | |||||||||||||||||||||||
| Accumulated other comprehensive income | (5,579 | ) | (1,808 | ) | (5,579 | ) | (1,808 | ) | (108 | ) | 522 | 108 | 5 | (522 | ) | 5 | |||||||||||||||||||
| Noncontrolling interests | 103 | 113 | 103 | 113 | 61 | 48 | (61 | ) | 5 | (48 | ) | 5 | |||||||||||||||||||||||
| Total stockholders’ equity | 6,190 | 8,996 | 6,190 | 8,996 | 3,788 | 3,996 | (3,788 | ) | (3,996 | ) | |||||||||||||||||||||||||
Total liabilities, redeemable noncontrolling interest and stockholders’ equity | $ | 67,782 | $ | 56,132 | $ | 38,279 | $ | 30,076 | $ | 34,381 | $ | 30,870 | $ | (4,878 | ) | $ | (4,814 | ) | |||||||||||||||||
| 1 | Represents Caterpillar Inc. and its subsidiaries with Financial Products accounted for on the equity basis. |
| 2 | Elimination of receivables between Machinery and Engines and Financial Products. |
| 3 | Reclassification of Machinery and Engines’ trade receivables purchased by Cat Financial and Cat Financial's wholesale inventory receivables. |
| 4 | Elimination of Machinery and Engines’ insurance premiums that are prepaid to Financial Products. |
| 5 | Elimination of Financial Products’ equity which is accounted for on Machinery and Engines on the equity basis. |
| 6 | Reclassification reflecting required netting of deferred tax assets/liabilities by taxing jurisdiction. |
| 7 | Elimination of debt between Machinery and Engines and Financial Products. |
| 8 | Elimination of payables between Machinery and Engines and Financial Products. |
| 9 | Elimination of prepaid insurance in Financial Products' accrued expenses. |
Page A-97
Supplemental Data for Statement of Cash Flow For the Years Ended December 31 | ||||||||||||||||||||||||||||||||||||
Supplemental consolidating data | ||||||||||||||||||||||||||||||||||||
| (Millions of dollars) | Consolidated | Machinery & Engines1 | Financial Products | Consolidating Adjustments | ||||||||||||||||||||||||||||||||
2008 | 2007 | 2008 | 2007 | 2008 | 2007 | 2008 | 2007 | |||||||||||||||||||||||||||||
| Cash flow from operating activities: | ||||||||||||||||||||||||||||||||||||
| Profit | $ | 3,557 | $ | 3,541 | $ | 3,557 | $ | 3,541 | $ | 409 | $ | 506 | $ | (409 | ) | 2 | $ | (506 | ) | 2 | ||||||||||||||||
| Adjustments for non-cash items: | ||||||||||||||||||||||||||||||||||||
| Depreciation and amortization | 1,980 | 1,797 | 1,225 | 1,093 | 755 | 704 | — | — | ||||||||||||||||||||||||||||
| Undistributed profit of Financial Products | — | — | (409 | ) | (256 | ) | — | — | 409 | 3 | 256 | 3 | ||||||||||||||||||||||||
| Other | 383 | 199 | 194 | 114 | 55 | (267 | ) | 134 | 4 | 352 | 4 | |||||||||||||||||||||||||
| Changes in assets and liabilities: | ||||||||||||||||||||||||||||||||||||
| Receivables - trade and other | (545 | ) | 899 | (471 | ) | (317 | ) | (49 | ) | (105 | ) | (25 | ) | 4,5 | 1,321 | 4,5 | ||||||||||||||||||||
| Inventories | (833 | ) | (745 | ) | (833 | ) | (745 | ) | — | — | — | — | ||||||||||||||||||||||||
| Accounts payable and accrued expenses | 656 | 618 | 574 | 408 | 69 | 216 | 13 | 4 | (6 | ) | 4 | |||||||||||||||||||||||||
| Customer advances | 286 | 576 | 286 | 576 | — | — | — | — | ||||||||||||||||||||||||||||
| Other assets—net | (470 | ) | 66 | (503 | ) | 63 | (102 | ) | (9 | ) | 135 | 4 | 12 | 4 | ||||||||||||||||||||||
| Other liabilities—net | (217 | ) | 1,004 | (50 | ) | 989 | (33 | ) | 40 | (134 | ) | 4 | (25 | ) | 4 | |||||||||||||||||||||
| Net cash provided by (used for) operating activities | 4,797 | 7,955 | 3,570 | 5,466 | 1,104 | 1,085 | 123 | 1,404 | ||||||||||||||||||||||||||||
| Cash flow from investing activities: | ||||||||||||||||||||||||||||||||||||
| Capital expenditures—excluding | ||||||||||||||||||||||||||||||||||||
| equipment leased to others | (2,445 | ) | (1,700 | ) | (2,421 | ) | (1,683 | ) | (24 | ) | (17 | ) | — | 4 | — | 4 | ||||||||||||||||||||
| Expenditures for equipment leased to others | (1,566 | ) | (1,340 | ) | — | — | (1,588 | ) | (1,349 | ) | 22 | 4 | 9 | 4 | ||||||||||||||||||||||
| Proceeds from disposals | ||||||||||||||||||||||||||||||||||||
| of property, plant and equipment | 982 | 408 | 30 | 14 | 952 | 398 | — | 4 | (4 | ) | 4 | |||||||||||||||||||||||||
| Additions to finance receivables | (14,031 | ) | (13,946 | ) | — | — | (37,811 | ) | (36,251 | ) | 23,780 | 5 | 22,305 | 5 | ||||||||||||||||||||||
| Collections of finance receivables | 9,717 | 10,985 | — | — | 32,135 | 33,456 | (22,418 | ) | 5 | (22,471 | ) | 5 | ||||||||||||||||||||||||
| Proceeds from sale of finance receivables | 949 | 866 | — | — | 2,459 | 2,378 | (1,510 | ) | 5 | (1,512 | ) | 5 | ||||||||||||||||||||||||
| Net intercompany borrowings | — | — | (168 | ) | (177 | ) | 33 | 3 | 135 | 6 | 174 | 6 | ||||||||||||||||||||||||
| Investments and acquisitions (net of cash acquired) | (117 | ) | (229 | ) | (148 | ) | (244 | ) | 28 | — | 3 | 7 | 15 | 7 | ||||||||||||||||||||||
| Proceeds from release of security deposit | — | 290 | — | 290 | — | — | — | — | ||||||||||||||||||||||||||||
| Proceeds from sale of available-for-sale securities | 357 | 282 | 23 | 23 | 334 | 259 | — | — | ||||||||||||||||||||||||||||
| Investments in available-for-sale securities | (339 | ) | (485 | ) | (18 | ) | (29 | ) | (321 | ) | (456 | ) | — | — | ||||||||||||||||||||||
| Other—net | 197 | 461 | 139 | 122 | 58 | 341 | — | 7 | (2 | ) | 7 | |||||||||||||||||||||||||
| Net cash provided by (used for) investing activities | (6,296 | ) | (4,408 | ) | (2,563 | ) | (1,684 | ) | (3,745 | ) | (1,238 | ) | 12 | (1,486 | ) | |||||||||||||||||||||
| Cash flow from financing activities: | ||||||||||||||||||||||||||||||||||||
| Dividends paid | (953 | ) | (845 | ) | (953 | ) | (845 | ) | — | (254 | ) | — | 8 | 254 | 8 | |||||||||||||||||||||
| Distribution to noncontrolling interests | (10) | (20 | ) | (10 | ) | (20 | ) | — | — | — | — | |||||||||||||||||||||||||
| Common stock issued, | ||||||||||||||||||||||||||||||||||||
| including treasury shares reissued | 135 | 328 | 135 | 328 | — | (2 | ) | — | 7 | 2 | 7 | |||||||||||||||||||||||||
| Payment for stock repurchases derivative contracts | (38 | ) | (56 | ) | (38 | ) | (56 | ) | — | — | — | — | ||||||||||||||||||||||||
| Treasury shares purchased | (1,800 | ) | (2,405 | ) | (1,800 | ) | (2,405 | ) | — | — | — | — | ||||||||||||||||||||||||
| Excess tax benefit from stock-based compensation | 56 | 155 | 56 | 155 | — | — | — | — | ||||||||||||||||||||||||||||
| Net intercompany borrowings | — | — | (33 | ) | (3 | ) | 168 | 177 | (135 | ) | 6 | (174 | ) | 6 | ||||||||||||||||||||||
Proceeds from debt issued (original maturities greater than three months) | 17,930 | 11,039 | 1,673 | 224 | 16,257 | 10,815 | — | — | ||||||||||||||||||||||||||||
Payments on debt (original maturities greater than three months) | (14,439 | ) | (10,888 | ) | (296 | ) | (598 | ) | (14,143 | ) | (10,290 | ) | — | — | ||||||||||||||||||||||
Short-term borrowings (original maturities three months or less)—net | 2,074 | (297 | ) | 737 | (41 | ) | 1,337 | (256 | ) | — | — | |||||||||||||||||||||||||
| Net cash provided by (used for) financing activities | 2,955 | (2,989 | ) | (529 | ) | (3,261 | ) | 3,619 | 190 | (135 | ) | 82 | ||||||||||||||||||||||||
| Effect of exchange rate changes on cash | 158 | 34 | 177 | 22 | (19 | ) | 12 | — | — | |||||||||||||||||||||||||||
| Increase (decrease) in cash and short-term investments | 1,614 | 592 | 655 | 543 | 959 | 49 | — | — | ||||||||||||||||||||||||||||
| Cash and short-term investments at beginning of period | 1,122 | 530 | 862 | 319 | 260 | 211 | — | — | ||||||||||||||||||||||||||||
| Cash and short-term investments at end of period | $ | 2,736 | $ | 1,122 | $ | 1,517 | $ | 862 | $ | 1,219 | $ | 260 | $ | — | $ | — | ||||||||||||||||||||
| 1 | Represents Caterpillar Inc. and its subsidiaries with Financial Products accounted for on the equity basis. |
| 2 | Elimination of Financial Products’ profit after tax due to equity method of accounting. |
| 3 | Non-cash adjustment for the undistributed earnings from Financial Products. |
| 4 | Elimination of non-cash adjustments and changes in assets and liabilities related to consolidated reporting. |
| 5 | Reclassification of Cat Financial's cash flow activity from investing to operating for receivables that arose from the sale of inventory. |
| 6 | Net proceeds and payments to/from Machinery and Engines and Financial Products. |
| 7 | Change in investment and common stock related to Financial Products. |
| 8 | Elimination of dividends from Financial Products to Machinery and Engines. |
Page A-98