Exhibit 99.1
Caterpillar Inc.
2Q 2010 Earnings Release
July 22, 2010
FOR IMMEDIATE RELEASE
Caterpillar Second-Quarter Profit up 91 Percent, Sales and Revenues Increase 31 Percent;
Raises 2010 Outlook for Sales and Revenues and Profit
PEORIA, Ill.— Caterpillar Inc. (NYSE: CAT) today reported a second-quarter profit of $1.09 per share, an increase of $0.49 per share from a profit of $0.60 per share in the second quarter of 2009. Profit of $707 million was 91 percent higher than second-quarter 2009 profit of $371 million. Sales and revenues of $10.409 billion were up 31 percent from $7.975 billion in the second quarter of 2009.
“We’ve been highly focused on three things this year—significantly increasing production in response to higher demand from our customers, particularly in developing economies, aggressively managing costs and driving better cash flow,” said Caterpillar CEO Doug Oberhelman. “You can see the results in our second quarter—sales and revenues increased substantially, operating profit as a percent of sales more than doubled, and Machinery and Engines operating cash flow and our debt-to-capital ratio strengthened. Our e mployees, dealers and suppliers are doing a great job ramping up to support customers. The increase in our sales from first to second quarter 2010 was one of the most significant quarter-to-quarter increases in our history,” Oberhelman added.
Sales and revenues were up $2.434 billion from the second quarter of 2009. Sales volume improved $2.259 billion, price realization was favorable $187 million, and the impact of currency added $23 million. Financial Products revenues were down $35 million. Profit was up $336 million from the second quarter of 2009. The increase was primarily the result of higher sales volume, improved operating efficiencies and favorable price realization, partially offset by higher taxes, provisions for incentive compensation and the absence of $110 million of LIFO inventory decrement benefits from the second quarter of 2009.
Page 1
Outlook
The company is improving its outlook for 2010 by raising the sales and revenues range and increasing profit expectations. Sales and revenues are now expected to be in a range of $39 to $42 billion, with a midpoint of $40.5 billion. The increased 2010 profit outlook is a range of $3.15 to $3.85 per share, with a midpoint of $3.50 per share. The previous sales and revenues outlook was a range of $38 to $42 billion, and the previous profit outlook range was $2.50 to $3.25 per share.
“We’re very pleased to increase our outlook for 2010. It reflects an increase in sales and revenues and a more significant increase in profit—a result of our continuing focus on cost management and profit improvement,” Oberhelman said. “While there are significant economic concerns around the world that we are watching closely, orders have continued to outpace our shipments, and we expect to increase production in the second half of the year,” Oberhelman added.
“We continue to be very positive about the longer-term prospects for many of the industries we serve—like mining, energy, infrastructure, electric power and rail. This year we have made several announcements related to increasing capacity and expanding our line-up of products and services,” Oberhelman said.
The strategic initiatives announced include:
| § | A new excavator facility to increase production capacity in the United States. |
| § | An agreement to acquire Electro-Motive Diesel (EMD), which has the largest installed base of diesel-electric locomotives in the world, for $820 million. |
| § | A multi-year investment of nearly $700 million supporting mining customers, including a full line of mining shovels and capacity expansion for mining trucks made in the United States and India. |
| § | A 400-percent increase in excavator production capacity over the next several years in Xuzhou, China. |
| § | A new facility for small wheel loader and backhoe loader manufacturing in Brazil. |
“We expect these investments will position the company for continued global leadership and growth,” added Oberhelman.
Page 2
Notes:
| - | Glossary of terms is included on pages 21- 22; first occurrence of terms shown in bold italics. |
| - | Information on non-GAAP financial measures, including the treatment of redundancy costs, is included on page 23. |
For more than 85 years, Caterpillar Inc. has been making progress possible and driving positive and sustainable change on every continent. With 2009 sales and revenues of $32.396 billion, Caterpillar is the world’s leading manufacturer of construction and mining equipment, diesel and natural gas engines and industrial gas turbines. The company also is a leading services provider through Caterpillar Financial Services, Caterpillar Remanufacturing Services, Caterpillar Logistics Services and Progress Rail Services. More information is available at: http://www.cat.com.
Caterpillar contact: Jim Dugan, Corporate Public Affairs, (309) 494-4100 (Office) or (309) 360-7311 (Mobile)
Page 3
FORWARD-LOOKING STATEMENTS
Certain statements in this release relate to future events and expectations and, as such, constitute forward-looking statements within the meaning of the Private Securities Litigation Reform Act of 1995. These statements are subject to known and unknown factors that may cause actual results of Caterpillar Inc. to be different from those expressed or implied in the forward-looking statements. Words such as “believe,” “estimate,” “will be,” “will,” “would,” “expect,” “anticipate,” “plan,” “project,” “intend,” “could,” “should” or other similar words or expressions often identify forward-looking statements. All statements other than statements of historical fact are forw ard-looking statements, including, without limitation, statements regarding our outlook, projections, forecasts or trend descriptions. These statements do not guarantee future performance, and Caterpillar does not undertake to update its forward-looking statements.
It is important to note that actual results of the company may differ materially from those described or implied in such forward-looking statements based on a number of factors, including, but not limited to: (i) economic volatility in the global economy generally and in capital and credit markets; (ii) Caterpillar’s ability to generate cash from operations, secure external funding for operations and manage liquidity needs; (iii) adverse changes in the economic conditions of the industries or markets Caterpillar serves; (iv) government regulations or policies, including those affecting interest rates, liquidity, access to capital and government spending on infrastructure development; (v) commodity price increases and/or limited availability of raw materials and component products, including steel; (v i) compliance costs associated with environmental laws and regulations; (vii) Caterpillar’s and Cat Financial’s ability to maintain their respective credit ratings, material increases in either company’s cost of borrowing or an inability of either company to access capital markets; (viii) financial condition and credit worthiness of Cat Financial’s customers; (ix) material adverse changes in our customers’ access to liquidity and capital; (x) market acceptance of Caterpillar’s products and services; (xi) effects of changes in the competitive environment, which may include decreased market share, lack of acceptance of price increases, and/or negative changes to our geographic and product mix of sales; (xii) Caterpillar’s ability to successfully implement Caterpillar Production System or other productivity initiatives; (xiii) international trade and investment policies, such as import quotas, capital controls or tariffs; (xiv) 60;failure of Caterpillar or Cat Financial to comply with financial covenants in their respective credit facilities; (xv) adverse changes in sourcing practices for our dealers or original equipment manufacturers; (xvi) additional tax expense or exposure; (xvii) political and economic risks associated with our global operations, including changes in laws, regulations or government policies, currency restrictions, restrictions on repatriation of earnings, burdensome tariffs or quotas, national and international conflict, including terrorist acts and political and economic instability or civil unrest in the countries in which Caterpillar operates; (xviii) currency fluctuations, particularly increases and decreases in the U.S. dollar against other currencies; (xix) increased payment obligations under our pension plans; (xx) inability to successfully integrate and realize expected benefits from acquisitions; (xxi) significant legal proceedings, claims, lawsuits or investigations ; (xxii) imposition of significant costs or restrictions due to the enactment and implementation of health care reform legislation and proposed financial regulation legislation; (xxiii) changes in accounting standards or adoption of new accounting standards; (xxiv) adverse effects of natural disasters; and (xxv) other factors described in more detail under “Item 1A. Risk Factors” in Part I of our Form 10-K filed with the SEC on February 19, 2010 for the year ended December 31, 2009 and in Part II of our Form 10-Q filed with the SEC on May 3, 2010 for the quarter ended March 31, 2010. These filings are available on our website at www.cat.com/sec_filings.
Page 4
Key Points
Second Quarter 2010 (Dollars in millions except per share data) | |||||||||||||||
Second Quarter 2010 | Second Quarter 2009 | $ Change | % Change | ||||||||||||
| Machinery and Engines Sales | $ | 9,723 | $ | 7,254 | $ | 2,469 | 34 | % | |||||||
| Financial Products Revenues | 686 | 721 | (35 | ) | (5 | ) | % | ||||||||
| Total Sales and Revenues | $ | 10,409 | $ | 7,975 | $ | 2,434 | 31 | % | |||||||
| Profit | $ | 707 | $ | 371 | $ | 336 | 91 | % | |||||||
Profit per common share - diluted | $ | 1.09 | $ | 0.60 | * | $ | 0.49 | 82 | % | ||||||
* Profit per share excluding redundancy costs was $0.72 per share in the second quarter of 2009.
| § | Second-quarter sales and revenues of $10.409 billion were 31 percent higher than the second quarter of 2009, led by strong growth in developing economies. |
| § | Machinery sales increased 55 percent due to absence of dealer inventory reductions that occurred in the second quarter of 2009, higher end-user demand and better price realization. |
| § | Engines sales increased 3 percent, and Financial Products revenues declined 5 percent from the second quarter of 2009. |
| § | Manufacturing costs improved $316 million. Excluding LIFO inventory decrement benefits of $110 million in the second quarter of 2009, manufacturing costs improved $426 million. |
| § | Machinery and Engines operating cash flow was $2.357 billion through the first half of 2010, compared with $583 million through the first half of 2009. |
| § | Machinery and Engines debt-to-capital ratio was 41.9 percent at the end of the second quarter of 2010, compared to 53.1 percent at the end of the second quarter of 2009 and 47.2 percent at year-end 2009. |
2010 Outlook
| § | Caterpillar is raising its 2010 outlook for both sales and revenues and profit. |
| § | 2010 sales and revenues are now expected to be in the range of $39 to $42 billion, with a midpoint of $40.5 billion. The previous range was $38 to $42 billion, with a midpoint of $40 billion. The increase in the sales and revenues outlook is a result of continuing improvement in end-user demand partially offset by the unfavorable impact of currency. |
| § | The revised 2010 profit outlook is a range of $3.15 to $3.85 per share, with a midpoint of $3.50 per share—an increase of 22 percent from the midpoint of the previous outlook. The previous range was $2.50 to $3.25 per share, with a midpoint of $2.88 per share. |
Page 5
DETAILED ANALYSIS
Second Quarter 2010 vs. Second Quarter 2009
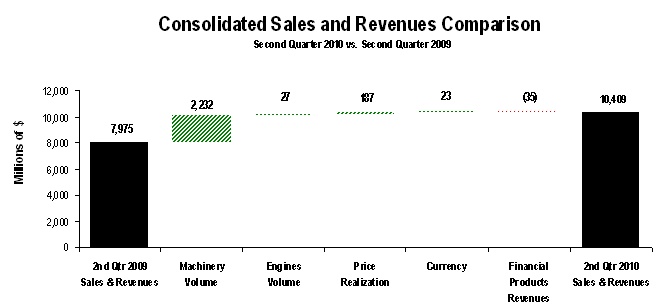 |
| The chart above graphically illustrates reasons for the change in Consolidated Sales and Revenues between second quarter 2009 (at left) and second quarter 2010 (at right). Items favorably impacting sales and revenues appear as upward stair steps with the corresponding dollar amounts above each bar, while items negatively impacting sales and revenues appear as downward stair steps with dollar amounts reflected in parentheses above each bar. Caterpillar management utilizes these charts internally to visually communicate with the company’s Board of Directors and employees. |
Sales and Revenues
Sales and revenues for the second quarter of 2010 were $10.409 billion, up $2.434 billion, or 31 percent, from the second quarter of 2009. Machinery sales volume was up $2.232 billion due to the absence of dealer inventory reductions that occurred in the second quarter of 2009 and higher end-user demand. Engines volume increased $27 million. Price realization improved $187 million, and currency had a positive impact on sales of $23 million. Financial Products revenues decreased $35 million.
Our integrated service businesses tend to be more stable through the business cycle than new machines and engines. Second-quarter sales and revenues for these businesses were higher compared to the second quarter of 2009. However, with the increase in sales of new machines this quarter, integrated service businesses represented a lower percent of total company sales and revenues than the prior period. These businesses represented about 40 percent of total company sales and revenues in the second quarter of 2010, down from about 46 percent in the second quarter of 2009.
Page 6
| Sales and Revenues by Geographic Region | ||||||||||||||||||||||||||||||||||||||||
| (Millions of dollars) | Total | % Change | North America | % Change | Latin America | % Change | EAME | % Change | Asia/ Pacific | % Change | ||||||||||||||||||||||||||||||
| Second Quarter 2010 | ||||||||||||||||||||||||||||||||||||||||
| Machinery | $ | 6,733 | 55 | % | $ | 2,478 | 43 | % | $ | 1,158 | 116 | % | $ | 1,374 | 36 | % | $ | 1,723 | 62 | % | ||||||||||||||||||||
Engines 1 | 2,990 | 3 | % | 1,059 | 4 | % | 361 | 42 | % | 924 | (15 | ) | % | 646 | 17 | % | ||||||||||||||||||||||||
Financial Products 2 | 686 | (5 | ) | % | 402 | (7 | ) | % | 71 | (5 | ) | % | 107 | (14 | ) | % | 106 | 16 | % | |||||||||||||||||||||
| $ | 10,409 | 31 | % | $ | 3,939 | 24 | % | $ | 1,590 | 83 | % | $ | 2,405 | 8 | % | $ | 2,475 | 45 | % | |||||||||||||||||||||
| Second Quarter 2009 | ||||||||||||||||||||||||||||||||||||||||
| Machinery | $ | 4,338 | $ | 1,730 | $ | 537 | $ | 1,010 | $ | 1,061 | ||||||||||||||||||||||||||||||
Engines 1 | 2,916 | 1,020 | 255 | 1,090 | 551 | |||||||||||||||||||||||||||||||||||
Financial Products 2 | 721 | 431 | 75 | 124 | 91 | |||||||||||||||||||||||||||||||||||
| $ | 7,975 | $ | 3,181 | $ | 867 | $ | 2,224 | $ | 1,703 | |||||||||||||||||||||||||||||||
| 1 | Does not include internal engines transfers of $602 million and $319 million in second quarter 2010 and second quarter 2009, respectively. Internal engines transfers are valued at prices comparable to those for unrelated parties. |
| 2 | Does not include internal revenues earned from Machinery and Engines of $67 million and $93 million in second quarter 2010 and second quarter 2009, respectively. |
Machinery Sales
Sales were $6.733 billion, an increase of $2.395 billion, or 55 percent, from the second quarter of 2009.
| § | Sales volume increased $2.232 billion. |
| § | Price realization increased $131 million. |
| § | Currency increased sales by $32 million. |
| § | Geographic mix between regions (included in price realization) was $4 million unfavorable. |
| § | Dealer-reported inventories were about flat during the quarter compared with a reduction of almost $1.2 billion in the second quarter of 2009. Absence of the 2009 inventory change was a contributor to higher sales volume. Dealer inventory levels were well below the second quarter of 2009, and months of supply were the lowest in at least 10 years. |
| § | For the first time since the second quarter of 2008, dealers reported increased deliveries to end users. Factors underlying this change included low interest rates, continued economic recoveries in most countries, increased construction in some countries and higher metals and energy prices. |
| § | Reported deliveries in the developed economies showed an increasing trend during the quarter, even though most economic recoveries were modest. We believe this improvement reflects a willingness by end users to resume fleet replacements after significantly lowering purchases over the last two years. |
| § | Overall sales volume grew in all regions and most countries within those regions. |
Page 7
North America – Sales increased $748 million, or 43 percent.
| § | Sales volume increased $683 million. |
| § | Price realization increased $64 million. |
| § | Currency increased sales by $1 million. |
| § | Dealers reduced reported inventories during the second quarter of 2010, but at a lower rate than in the second quarter of 2009. This change contributed to higher sales volume. Dealer inventories were about half the second quarter 2009 levels, and months of supply were the lowest in at least 10 years. |
| § | An increase in deliveries to end users, as reported by dealers, was the most significant contributor to the growth in sales volume. Economic recoveries in both the United States and Canada led to increased output in some key industries, which we believe encouraged buying. |
| § | Increases in dealer deliveries were greater than the modest increases in economic activity might suggest. We believe that low interest rates and increased confidence encouraged users to moderate the shrinking and aging of fleets that started in early 2006. |
| § | Housing starts in the United States were 12 percent higher than last year and new single-family units available for sale were the lowest since 1970. Canadian housing starts were up 54 percent. Increased housing construction and some signs that home prices are stabilizing contributed to increased sales of smaller machines. |
| § | U.S. nonresidential building contracting, which tends to lag economic recoveries, fell 27 percent from the second quarter of 2009. Lower commercial property prices and low industrial capacity utilization were contributing factors. Nonresidential construction in Canada declined 3 percent. |
| § | Spending for highway construction increased slightly in the second quarter compared to the second quarter of 2009. Funding provided by the U.S. government’s recovery program helped offset pressure on state and local government budgets. |
| § | U.S. nonmetals mining and quarry production increased 6 percent, and Canadian producers increased quarry output 2 percent. Modest production gains benefited sales of quarry products. |
| § | Metals prices were 50 percent higher than last year, causing U.S. metals mines to increase production 8 percent. These factors helped increase sales of mining equipment. |
| § | Central Appalachian coal prices averaged almost $63 per ton during the quarter and were 27 percent higher than the second quarter of 2009. U.S. coal production increased 3 percent during the quarter, and Canadian production has risen significantly so far this year. An improved coal sector further increased mining sales. |
| § | Lumber prices rose 56 percent, encouraging a 20-percent increase in U.S. production and a 29-percent gain in Canadian production. Sales of forestry products increased to support this demand. |
Latin America – Sales increased $621 million, or 116 percent.
| § | Sales volume increased $547 million. |
| § | Price realization increased $38 million. |
| § | Currency increased sales by $36 million. |
| § | Dealers reported increases in their inventories during the quarter compared with a drawdown in the second quarter of 2009. This change, taken to prepare for a better economic environment, accounted for most of the growth in sales volume. |
| § | Dealer inventories were about the same as a year earlier. Inventories in months of supply were the lowest in at least 10 years. |
| § | Dealers also reported higher deliveries to end users, a result of continuing economic recoveries and higher commodity prices. Industrial production increased in most countries, mining output rose and oil production was up 2 percent. |
| § | Brazil had the largest increase in sales volume in Latin America. Interest rates averaged lower than last year, a major factor in the 16-percent increase in industrial production. Mining output increased 17 percent, driven by a 44-percent gain in iron ore. |
| § | Sales volume increased significantly in Chile, despite the recent earthquake’s unfavorable impact on some sectors of the economy. Interest rates were lower than last year, and significantly higher copper prices contributed to higher copper export revenues. |
Page 8
EAME – Sales increased $364 million, or 36 percent.
| § | Sales volume increased $402 million. |
| § | Price realization decreased $13 million. |
| § | Currency decreased sales by $25 million. |
| § | Dealer-reported inventories were about flat during the quarter compared with a reduction in the second quarter of 2009. This change accounted for most of the sales volume growth. |
| § | Both inventories and months of supply were well below last year. Months of supply was also slightly below the historical average. |
| § | European economies reflected some strengthening, as indicated by faster growth in industrial production and favorable surveys of business expectations. Housing starts also improved in several countries. |
| § | Dealers in Europe reported an increase in deliveries in the second quarter of 2010 compared to the second quarter of 2009. |
| § | The economic environment was favorable in Africa/Middle East. Recoveries were underway in the large economies of Turkey and South Africa, favorable metals prices benefited mining production and regional oil revenues increased in response to higher oil prices and production. |
| § | Economic activity in the Commonwealth of Independent States (CIS) is improving. Positive factors included increased government spending, higher mining output and 3-percent growth in crude oil production. |
Asia/Pacific – Sales increased $662 million, or 62 percent.
| § | Sales volume increased $596 million. |
| § | Price realization increased $46 million. |
| § | Currency increased sales by $20 million. |
| § | Dealer-reported inventories were about flat during the quarter compared to a reduction in the second quarter of 2009. This change positively benefited sales volume. Inventories were below last year in both dollars and months of supply; months of supply was also below the historical average. |
| § | Most of the increase in sales volume resulted from dealers reporting higher deliveries to end users. Asian economies were recovering, which benefited construction, and higher metals prices encouraged investment in the mining industry. |
| § | China had a large increase in sales volume, and deliveries remained near record highs. Although the government acted to control the recovery, lending increased 21 percent, and industrial production was up 16 percent. Both construction spending and coal production increased more than 20 percent. |
| § | Lower interest rates in Indonesia contributed to economic growth. Construction spending increased, leading to a gain in sales volume. |
| § | Australian coal prices rose 50 percent, prompting mines to expand production. In response to economic growth, housing permits increased 31 percent. These factors contributed to the growth in sales volume. |
| § | In Japan, industrial production was 23 percent higher than last year, and orders for new housing rose 5 percent. |
Page 9
Engines Sales
Sales were $2.990 billion, an increase of $74 million, or 3 percent, from the second quarter of 2009.
| § | Sales volume increased $27 million. |
| § | Price realization increased $56 million. |
| § | Currency decreased sales by $9 million. |
| § | Geographic mix between regions (included in price realization) was $7 million favorable. |
| § | Dealer inventories and months of supply were down from the second quarter of 2009. |
North America – Sales increased $39 million, or 4 percent.
| § | Sales volume increased $54 million. |
| § | Price realization decreased $15 million. |
| § | Sales volume in North America was relatively flat. Engine sales for industrial applications were the most significant positive contributor, coming off depressed levels in the second quarter of 2009. |
Latin America – Sales increased $106 million, or 42 percent.
| § | Sales volume increased $95 million. |
| § | Price realization increased $7 million. |
| § | Currency increased sales by $4 million. |
| § | Sales for petroleum applications increased 16 percent due to higher turbine sales. |
| § | Sales of electric power applications increased 109 percent due to higher turbine sales and modest improvements in industry demand. |
EAME – Sales decreased $166 million, or 15 percent.
| § | Sales volume decreased $189 million. |
| § | Price realization increased $32 million. |
| § | Currency decreased sales by $9 million. |
| § | Sales for electric power applications increased 11 percent primarily due to increased turbine sales. |
| § | Sales for petroleum applications decreased 44 percent primarily due to lower turbine sales and a slowdown in demand for engines used in production applications and land-based drilling. |
| § | Sales for marine applications decreased 36 percent due to weak industry demand and a declining order backlog. |
| § | Sales for industrial applications increased 8 percent due to higher demand in construction and agricultural applications. |
Page 10
Asia/Pacific – Sales increased $95 million, or 17 percent.
| § | Sales volume increased $74 million. |
| § | Price realization increased $25 million. |
| § | Currency decreased sales by $4 million. |
| § | Sales for petroleum applications increased 16 percent primarily due to higher turbine sales. |
| § | Sales for electric power applications increased 64 percent primarily due to higher turbine sales and increased demand throughout the region. |
| § | Sales for marine applications decreased 15 percent due to weak industry demand, partially offset by higher sales for workboat and general cargo vessels. |
Financial Products Revenues
Revenues were $686 million, a decrease of $35 million, or 5 percent, from the second quarter of 2009.
| § | Revenues decreased $59 million due to a decrease in average earning assets, partially offset by an increase of $14 million due to the favorable impact of higher interest rates on new and existing finance receivables. |
| § | Other revenues at Cat Financial increased $8 million. The increase was due to a $12 million favorable impact from returned and repossessed equipment and the absence of a $9 million write-down on retained interests related to the securitized asset portfolio in the second quarter of 2009, partially offset by the unfavorable impact from various other revenue items. |
Page 11
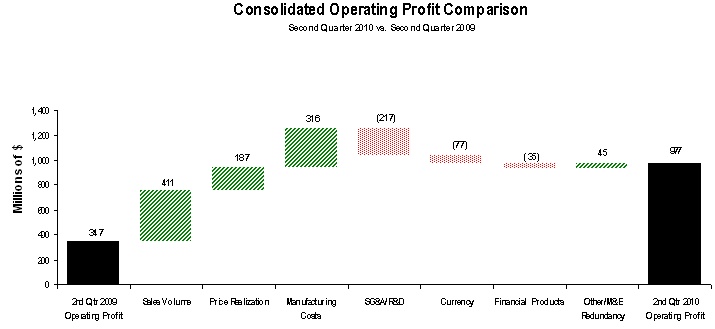 |
The chart above graphically illustrates reasons for the change in Consolidated Operating Profit between second quarter 2009 (at left) and second quarter 2010 (at right). Items favorably impacting operating profit appear as upward stair steps with the corresponding dollar amounts above each bar, while items negatively impacting operating profit appear as downward stair steps with dollar amounts reflected in parentheses above each bar. Caterpillar management utilizes these charts internally to visually communicate with the company’s Board of Directors and employees. The bar entitled Other/M&E Redundancy includes the operating profit impact of consolidating adjustments and Machinery and Engines other operating (income) expenses, which include Machinery and Engines redundancy costs. |
Operating Profit
Operating profit in the second quarter of 2010 was $977 million compared to $347 million in the second quarter of 2009. The improvement was primarily the result of higher sales volume, which includes the impact of an unfavorable mix of products, lower manufacturing costs and better price realization. The improvements were partially offset by higher selling, general and administrative (SG&A) and research and development (R&D) expenses and an unfavorable impact of currency.
Manufacturing costs improved $316 million primarily due to variable labor and burden efficiencies and lower warranty and material costs, partially offset by the absence of $110 million of LIFO inventory decrement benefits.
SG&A and R&D expenses increased by $217 million primarily due to provisions related to incentive pay and increased expense to support product development programs related to EPA Tier 4 emissions requirements.
Currency had a $77 million negative impact on operating profit as the negative impact on costs more than offset the benefit to sales.
Redundancy costs were $85 million in the second quarter of 2009.
| Operating Profit (Loss) by Principal Line of Business | |||||||||||||||
| (Millions of dollars) | Second Quarter 2010 | Second Quarter 2009 | $ Change | % Change | |||||||||||
Machinery 1 | $ | 477 | $ | (252 | ) | $ | 729 | — | |||||||
Engines 1 | 462 | 555 | (93 | ) | (17 | ) | % | ||||||||
| Financial Products | 92 | 127 | (35 | ) | (28 | ) | % | ||||||||
| Consolidating Adjustments | (54 | ) | (83 | ) | 29 | ||||||||||
| Consolidated Operating Profit (Loss) | $ | 977 | $ | 347 | $ | 630 | 182 | % | |||||||
| 1 | Caterpillar operations are highly integrated; therefore, the company uses a number of allocations to determine lines of business operating profit for Machinery and Engines. |
Page 12
Operating Profit/Loss by Principal Line of Business
| § | Machinery operating profit was $477 million compared to an operating loss of $252 million in the second quarter of 2009. Positive factors included higher sales volume, which includes the impact of an unfavorable mix of products, lower manufacturing costs (despite the absence of LIFO decrement benefits) and improved price realization. These improvements were partially offset by higher SG&A and R&D expenses. |
| § | Engines operating profit of $462 million was down $93 million from the second quarter of 2009. Higher SG&A and R&D expenses and lower sales volume, which includes the impact of an unfavorable mix of products, were partially offset by lower manufacturing costs and improved price realization. |
| § | Financial Products operating profit of $92 million was down $35 million, or 28 percent, from the second quarter of 2009. The decrease was primarily attributable to a $26 million unfavorable impact from lower average earning assets and a $12 million increase in SG&A expenses (excluding the provision for credit losses). |
Other Profit/Loss Items
| § | Interest expense excluding Financial Products decreased $28 million from the second quarter of 2009. |
| § | Other income/expense was income of $50 million compared with income of $163 million in the second quarter of 2009. The decrease was primarily driven by an unfavorable impact from currency exchange gains and losses. |
| § | The provision for income taxes in the second quarter reflects an estimated annual effective tax rate of 29 percent, excluding the items discussed below, compared to an actual tax rate of 10 percent for the second quarter of 2009. The 2010 estimated annual tax rate is expected to be less than the U.S. tax rate of 35 percent primarily due to profits in tax jurisdictions with rates lower than the U.S. rate. The 2010 estimated annual tax rate is based on current tax law and therefore does not include the U.S. research and development tax credit and other benefits that have not been extended past 2009. |
| The provision for income taxes in the second quarter of 2010 also includes benefits of $65 million due to refund claims for prior tax years, the release of a valuation allowance against the deferred tax assets of certain non-U.S. entities and a decrease in the 2010 estimated annual tax rate from 30 to 29 percent. |
| § | Profit/loss attributable to noncontrolling interests negatively impacted profit by $37 million from the second quarter of 2009, primarily due to improved financial performance of Caterpillar Japan Ltd. (Cat Japan). We own two-thirds of Cat Japan, meaning one-third of its profits or losses are attributable to our partner, Mitsubishi Heavy Industries. |
Page 13
Employment
Caterpillar's worldwide employment was 97,487 at the end of the second quarter of 2010. Year to date in 2010 we have added about 3,650 employees, primarily due to increases in production. About 1,250 of the additional employees were in the United States, and about 2,400 were outside the United States.
2010 Outlook
Economic Outlook
The worldwide economic recovery continued with strong growth in developing economies. We expect recovery to continue with worldwide economic growth of about 3.5 percent for 2010.
| § | Economic news in Europe and the United States has been less favorable recently, and concerns about a “double-dip” recession increased. However, this type of recession typically results from significant policy tightening very early in a recovery. We do not believe such a policy shift has occurred. |
| § | Increased concern about the economic recovery should encourage central bankers to become even more cautious about tightening economic policies. As a result, we no longer expect central bankers to increase interest rates this year in the United States or the Euro-zone. |
| § | Credit spreads have widened but remain well below averages sustained during the credit crisis. Spreads are generally consistent with continued economic recovery. |
| § | We expect that developing economies will continue to drive the recovery and are forecasting economic growth in those regions of almost 7 percent in 2010. We also expect that developed economies will continue to lag and are forecasting economic growth of less than 2.5 percent in 2010. |
Commodities
| § | Metals demand is increasingly concentrated in the developing economies, and their strong growth should keep prices favorable for increased production and investment. Our forecast is that copper prices will average more than $3.00 per pound this year. |
| § | Increases in oil prices have resulted in about 3 percent higher world oil production and a significant increase in active drill rigs. We project the West Texas Intermediate crude oil price will average about $80 per barrel. |
| § | The vigorous economic recovery in Asia, particularly China, has increased coal demand and supported a 40-percent increase in Australian coal prices compared to the first half of 2009. We forecast Australian thermal coal prices will average more than $95 per metric ton, and Central Appalachian coal prices will average more than $60 per ton. Coal prices at those levels should be high enough to encourage further increases in production. |
Developing Economies
| § | Over the past several years, many developing countries have managed their economies well, achieving rapid economic growth without creating significant inflation problems. Most resumed economic growth in the second quarter of 2009, and we expect these countries to maintain continued growth through the end of the year. |
| § | Asia/Pacific economies should continue to grow at the fastest pace, with growth of about 8.5 percent expected this year. Our forecast assumes China will grow 10.5 percent, India 8.5 percent and the remaining economies will average more than 6-percent growth. |
Page 14
| § | In response to concerns about slowing economic growth, China recently announced a program of more than $100 billion of infrastructure development. We also expect China’s central bank will hold interest rates steady this year. |
| § | Consumer price inflation has increased in India, and India’s central bank has raised interest rates three times so far this year. We expect two more rate increases in 2010, but expect only a moderate slowing in economic growth and construction spending. |
| § | We forecast the Africa/Middle East economies will grow 4.5 percent in 2010. Positives include favorable metals and energy prices, low interest rates and strengthening recoveries in both South Africa and Turkey. |
| § | The CIS economy should grow 4.5 percent this year. Interest rates have dropped sharply over the past year, helping the recovery to strengthen. The region should also benefit from higher commodity prices. |
| § | Recovery in Latin American economies continued to strengthen through the first half of 2010, and we expect the regional economy will grow 4.5 percent this year. Both construction and mining should continue to expand. |
Developed Economies
| § | Very low inflation, weak credit demand, high unemployment and low capacity utilization indicate a low risk of growing inflation or asset price bubbles. As a result, we expect that central banks in the United States, the Euro-zone, the United Kingdom and Japan will hold interest rates steady for the remainder of the year. |
| § | Our forecast of U.S. economic growth is 3 percent, and our estimate of housing starts is 675,000 units. Starts of that amount would be the second lowest since 1945. Nonresidential construction, which typically lags the economy, is expected to decline for the third consecutive year. Mining, largely benefiting from global commodity demand, should increase. |
| § | We expect the Euro-zone will continue to lag behind other economies, with growth of more than 1 percent this year. While the government debt crisis has led to widening credit spreads, the European Central Bank appears to be providing enough liquidity to avoid a downturn. Construction, which peaked in late 2006, likely will be down for the year. |
| § | The Bank of Japan continued to increase liquidity in the banking system, and the economy has grown 4.2 percent since the recession ended in the first quarter of 2009. That growth rate was the highest in nearly 20 years. We expect the central bank will increase liquidity further, fostering economic growth of more than 3 percent in 2010. |
2010 Sales and Revenues Outlook
The outlook for sales and revenues is a range of $39 to $42 billion, up from the previous forecast of $38 to $42 billion. The increase in the sales outlook is a result of continuing improvement in end-user demand partially offset by the unfavorable impact of currency. Key elements of the 2010 sales and revenues outlook compared with 2009 include:
| § | At the midpoint of the revised 2010 sales and revenues range, we expect little change in dealer inventories. In 2009, dealers reduced inventories of new Caterpillar machines and engines by nearly $4 billion. The absence of this reduction will result in higher sales for Caterpillar in 2010. |
| § | Economic improvement in the developing economies of Asia/Pacific and Latin America is improving construction spending and increasing end-user demand for Machinery. |
Page 15
| § | Growth in the world economy is driving improved demand for commodities. Higher demand coupled with favorable commodity prices should be positive for mining-related sales in 2010. Mining-related order activity has remained robust, and we expect to increase production and sales as the year progresses. |
| § | We expect that price realization will be positive by more than 1 percent in 2010. |
| § | While Machinery sales are expected to increase in 2010, at the midpoint of the outlook range, Engines sales are expected to be about flat. Turbine sales in 2010 are expected to be near the record levels of 2009. |
2010 Profit Outlook
Profit is expected to be in a range of $3.15 to $3.85 per share. The previous outlook expected profit in a range of $2.50 to $3.25 per share.
Key positive elements of the profit outlook for 2010 compared to 2009 include:
| § | Higher sales volume. |
| § | In 2009, employee redundancy costs were $706 million, or $0.75 per share. We do not anticipate significant redundancy costs in 2010. |
| § | We expect that price realization will be positive by more than 1 percent in 2010. |
| § | Improved operating efficiency—resulting from higher production volume and continuing improvement from the Caterpillar Production System with 6 Sigma. |
| § | Material costs are expected to be favorable in 2010. |
| § | Financial Products’ profit before tax is expected to be up slightly from 2009. |
The key positive elements of the 2010 profit outlook are expected to be partially offset by:
| § | Product mix is expected to be unfavorable. |
| § | Higher income taxes. We are forecasting income taxes to be an expense of about 29 percent of profit before tax plus the $90 million charge in the first quarter related to signing of the U.S. health care legislation and discrete benefits of about $60 million in the second quarter. |
| § | Higher costs of about $600 million related to incentive compensation due to improving financial performance. |
| § | R&D expense is expected to increase primarily to support product development programs related to EPA Tier 4 emissions requirements. |
| § | We are not forecasting LIFO inventory decrement benefits for 2010. LIFO decrement benefits in 2009 were $300 million. |
| § | We do not expect the favorable impact of currency that was in 2009’s other income/expense to recur in 2010. |
| § | Pension expense is expected to be higher in 2010. |
| § | Depreciation expense is expected to increase. Machinery and Engines capital expenditures are expected to be about $1.8 billion in 2010, up from $1.3 billion in 2009. |
| § | Diluted shares outstanding are expected to be higher than the 2009 full-year average. This is a result of stock contributed to our employee benefit plans, as well as increased dilution related to the increase in the share price. |
During the second quarter of 2010, we signed a definitive agreement to acquire Electro-Motive Diesel (EMD) for $820 million. As this acquisition has not yet closed, our 2010 outlook does not include any sales and revenues or profit impact related to EMD.
Page 16
QUESTIONS AND ANSWERS
| Q1: | You continue to be optimistic about growth in the emerging market countries of Asia and Latin America. With reports of slowing economic growth in China, have you seen a weakening of your business in China? |
| A: | Our dealers reported some flattening in their dealer deliveries in the second quarter, but at a rate well above the 2008 peak. On a volume basis, their deliveries were about 50 percent higher than in the second quarter of 2009. The government expressed some concern about the world economy and announced it would maintain a moderately easy monetary policy. As a result, we removed interest rate increases from our 2010 forecast. The government also announced the Great Western Development Program, which will provide about $100 billion for infrastructure development in western China. These developments highlight the emphasis the Chinese government places on economic growth and its willingness to alter economic policies quickly to support growth. This stance has resulted in China becoming the country that presents the largest single opportunity for construction machinery in the world, a position we think it will continue to maintain. |
| Q2: | Economic growth in Europe has also been a concern as a result of sovereign debt issues and the potential for tighter fiscal policy in some European countries. Have you seen deterioration in your sales in Europe over the past quarter? |
| A: | We expect continued weak growth for the Euro-zone economy. Since the formation of the euro in 1999, economic growth has averaged 1.5 percent yearly, and unemployment is currently about 10 percent. Our forecast for economic growth of more than 1 percent for 2010 reflects continued weakness. However, our machine sales in Europe improved significantly in the second quarter from very depressed levels a year ago. Sales in Europe, while above the low levels of 2009, are still well below the levels of 2007 and 2008. |
| Q3: | What does your revised 2010 outlook assume for U.S. housing starts? |
| A: | Repeated downward revisions to first-quarter Gross Domestic Product (GDP) caused us to lower our 2010 forecast. We now expect 2010 housing starts of about 675,000 units. Starts averaged a 610,000 annual rate in the first 6 months of this year so that forecast implies a small improvement in the second half of the year. Our assumptions underlying this recovery include continued low mortgage interest rates (recently at a 40-year low), a need to rebuild the stock of unsold new homes from a 40-year low and expected gains in employment. This forecast implies that 2010 housing starts will be the second worst year since 1945, with only 2009 being lower. In fact, housing starts for 2009 and 2010 combined would fall short of annual starts in 42 of the prior 50 years. |
| Q4: | Given the extent of inventory declines in 2009 and your outlook for higher sales in 2010, how is the supply base responding? Do you expect problems in 2010 keeping up with demand? |
| A: | Our production of new equipment increased significantly from the first to the second quarter of 2010. In general, our suppliers have done a good job supporting the ramp up in production. While we expect further increases in production levels in the second half of the year, the rate of increase should be less dramatic than between the first and second quarters, and we expect that suppliers will be able to support production levels reflected in our outlook. |
Page 17
| Q5: | Can you comment specifically on the status of your 2010 production ramp up for mining products? Were you able to raise production in the second quarter, and do you expect production in the second half of the year to continue to increase? |
| A: | Factory production of our mining and related support equipment increased substantially from the first quarter of 2010 to the second quarter, and we expect to continue to increase production during the second half of 2010. |
| Q6: | You’ve mentioned before that sales of aftermarket service parts can be a leading indicator of improving demand. What’s the current trend? |
| A: | Sales of aftermarket service parts, which are reported in both the Machinery and Engines lines of business, bottomed in the second quarter of 2009. While all regions have improved, recovery has been the most robust in Asia/Pacific and Latin America. Full-year expectations have improved since the end of the first quarter, and higher parts sales are an element of the improvement in the full-year 2010 outlook for sales and revenues. |
| Q7: | Inventory changes related to new machines and engines had a significant negative impact on your sales in 2009. What happened to dealer inventories in the second quarter, and what are your expectations for the full year of 2010? |
| A: | Dealer machine inventories have remained about flat throughout 2010. Inventories at the end of the second quarter were about the same as year-end 2009 and at the end of the first quarter of 2010. In contrast, dealers reduced new machine inventories $1.2 billion during the second quarter of 2009. At the midpoint of our 2010 outlook for sales and revenues we are not expecting significant changes to dealer inventories. However, the higher sales are in the outlook range, the more likely it is that dealers may want to increase inventory levels. |
| Q8: | What drove the improvement in manufacturing costs during the second quarter? |
| A: | Manufacturing costs were favorable $316 million in the second quarter of 2010 compared with the second quarter of 2009. Excluding LIFO inventory decrement benefits from the second quarter of 2009, the improvement was $426 million. The improvement was driven by the Caterpillar Production System, including a well-executed ramp up in production by our suppliers and our factories, favorable warranty and lower material costs. |
| Q9: | Can you discuss tax expense in the second quarter? |
| A: | The 2010 estimated annual tax rate of 29 percent is expected to be less than the U.S. tax rate of 35 percent primarily due to profits in tax jurisdictions with rates lower than the U.S. rate. The estimated annual tax rate is based on current tax law and therefore does not include the U.S. research and development tax credit and other benefits that have not been extended past 2009. The second-quarter tax provision includes benefits of $65 million due to refund claims for prior tax years, the release of a valuation allowance against the deferred tax assets of certain non-U.S. entities and a decrease in the 2010 estimated annual tax rate from 30 to 29 percent. |
Page 18
| Q10: | As your outlook improves, will that result in higher expense related to incentive compensation? |
| A: | Yes, short-term incentive compensation expense will increase as our financial performance improves. As a result of aggressive financial performance targets in 2009 and the impact of the global recession, short-term incentive compensation plans that were tied to corporate results did not meet the earnings threshold, and no expense was incurred. The midpoint of the current profit outlook would result in about $600 million of short-term incentive compensation in 2010. That’s an increase from the previous estimate of about $350 million. Half of the $600 million was recorded in the first half of 2010 — about $90 million in the first quarter and about $210 million the second quarter. |
| Q11: | Have you increased employment levels as a result of improving business conditions? Do you plan to increase employment in 2010? |
| A: | Employment needs are linked to business conditions and production volume. We have raised production schedules in most facilities, and we would expect to selectively increase employment in 2010 as a result. Year to date in 2010 we added about 3,650 employees. The strength of recovery will vary significantly among product type, industry served and geography. Currently we are seeing faster recovery in Asia and Latin America. So, prospects for employment increases in 2010 are best for facilities in those regions. In addition, we expect to add employees at several facilities in the United States where a substantial portion of their production is exported. |
| Q12: | Can you comment on your financial position at the end of the second quarter? |
| A: | Caterpillar's financial position continued to strengthen during the second quarter. The M&E debt-to-capital ratio was 41.9 percent at the end of the second quarter, compared to 53.1 percent at the end of the second quarter of 2009, and 45.2 percent at the end of the first quarter of 2010. On a consolidated basis, we ended the quarter with $3.6 billion of cash, very similar to our position at the end of March. This strengthening financial position was a significant factor in the recent decision to increase our dividend by 5 percent. In addition, our solid financial position and good cash flow are important elements in funding growth initiatives like the recently announced agreement to acquire EMD. |
Page 19
| Q13: | Give us an update on the quality of Cat Financial’s asset portfolio. How are past dues, credit losses and allowances? |
| A: | During the second quarter, overall portfolio quality began to show signs of improvement, as economic conditions around the world continued to improve. At the end of the second quarter of 2010, past dues were 5.33 percent, down from 6.06 percent at the end of the first quarter and 5.54 percent at the end of 2009. At the end of the second quarter of 2009, past dues were 5.53 percent. The reduction in past dues from year end is primarily due to the general improvement in global economic conditions. We expect gradual improvement in past dues during the remainder of 2010. Bad debt write-offs, net of recoveries, were $52 million for the second quarter of 2010, down $3 million from the second quarter of 2009. Second-quarter 2010 annualized losses were 0.91 percent of the average retail portfolio, compared to 0.89 percent for the second quarter of 2009, and 1.03 percent for the full-year 2009. At the end of the second quarter of 2010, Cat Financial's allowance for credit losses was 1.70 percent of net finance receivables, increasing from 1.64 percent on December 31, 2009, and 1.55 percent at the end of the second quarter of 2009. As a result of new accounting guidance implemented during the first quarter, Cat Financial began consolidating securitized assets which had previously been off balance sheet. On January 1, 2010, the consolidation of these assets had the impact of increasing the allowance for credit losses by $18 million and the total allowance as a percent of net finance receivables by 6 basis points. At the end of the second quarter of 2010, the allowance for credit losses totaled $383 million, compared with $377 million on December 31, 2009, and $378 million at the end of the second quarter of 2009. The increase of $5 million in allowance for credit losses yea r-over-year reflected a $34 million increase associated with the higher allowance rate, partially offset by a $29 million decrease due to a reduction in the overall net finance receivable portfolio. |
Page 20
GLOSSARY OF TERMS
| 1. | Caterpillar Japan Ltd. (Cat Japan) – A Caterpillar subsidiary formerly known as Shin Caterpillar Mitsubishi Ltd. (SCM). SCM was a 50/50 joint venture between Caterpillar and Mitsubishi Heavy Industries Ltd. (MHI) until SCM redeemed one half of MHI's shares on August 1, 2008. Caterpillar now owns 67 percent of the renamed entity. We began consolidating Cat Japan in the fourth quarter of 2008. |
| 2. | Caterpillar Production System – The Caterpillar Production System is the common Order-to-Delivery process being implemented enterprise-wide to achieve our safety, quality, velocity, earnings and growth goals for 2010 and beyond. |
| 3. | Consolidating Adjustments – Eliminations of transactions between Machinery and Engines and Financial Products. |
| 4. | Currency – With respect to sales and revenues, currency represents the translation impact on sales resulting from changes in foreign currency exchange rates versus the U.S. dollar. With respect to operating profit, currency represents the net translation impact on sales and operating costs resulting from changes in foreign currency exchange rates versus the U.S. dollar. Currency includes the impact on sales and operating profit for the Machinery and Engines lines of business only; currency impacts on Financial Products revenues and operating profit are included in the Financial Products portions of the respective analyses. With respect to other income/expense, currency represents the effects of forward and option contracts entered into by the company to reduce the risk of fluctuations in exchange rates and the net effect of changes in foreign currency exchange rates on our foreign currency assets and liabilities for consolidated results. |
| 5. | Debt-to-Capital Ratio – A key measure of financial strength used by both management and our credit rating agencies. The metric is a ratio of Machinery and Engines debt (short-term borrowings plus long-term debt) and redeemable noncontrolling interest to the sum of Machinery and Engines debt, redeemable noncontrolling interest and stockholders' equity. |
| 6. | EAME – Geographic region including Europe, Africa, the Middle East and the Commonwealth of Independent States (CIS). |
| 7. | Earning Assets – Assets consisting primarily of total finance receivables net of unearned income, plus equipment on operating leases, less accumulated depreciation at Cat Financial. |
| 8. | Engines – A principal line of business including the design, manufacture, marketing and sales of engines for Caterpillar machinery; electric power generation systems; locomotives; marine, petroleum, construction, industrial, agricultural and other applications and related parts. Also includes remanufacturing of Caterpillar engines and a variety of Caterpillar machinery and engine components and remanufacturing services for other companies. Reciprocating engines meet power needs ranging from 10 to 21,800 horsepower (8 to more than 16 000 kilowatts). Turbines range from 1,600 to 30,000 horsepower (1 200 to 22 000 kilowatts). |
| 9. | Financial Products – A principal line of business consisting primarily of Caterpillar Financial Services Corporation (Cat Financial), Caterpillar Insurance Holdings, Inc. (Cat Insurance) and their respective subsidiaries. Cat Financial provides a wide range of financing alternatives to customers and dealers for Caterpillar machinery and engines, Solar gas turbines as well as other equipment and marine vessels. Cat Financial also extends loans to customers and dealers. Cat Insurance provides various forms of insurance to customers and dealers to help support the purchase and lease of our equipment. |
| 10. | Integrated Service Businesses – A service business or a business containing an important service component. These businesses include, but are not limited to, aftermarket parts, Cat Financial, Cat Insurance, Cat Logistics, Cat Reman, Progress Rail, OEM Solutions and Solar Turbine Customer Services. |
Page 21
| 11. | Latin America – Geographic region including Central and South American countries and Mexico. |
| 12. | LIFO Inventory Decrement Benefits – A significant portion of Caterpillar's inventory is valued using the last-in, first-out (LIFO) method. With this method, the cost of inventory is comprised of "layers" at cost levels for years when inventory increases occurred. A LIFO decrement occurs when inventory decreases, depleting layers added in earlier, generally lower cost, years. A LIFO decrement benefit represents the impact on profit of charging cost of goods sold with prior-year cost levels rather than current period costs. |
| 13. | Machinery – A principal line of business which includes the design, manufacture, marketing and sales of construction, mining and forestry machinery—track and wheel tractors, track and wheel loaders, pipelayers, motor graders, wheel tractor-scrapers, track and wheel excavators, backhoe loaders, log skidders, log loaders, off-highway trucks, articulated trucks, paving products, skid steer loaders, underground mining equipment, tunnel boring equipment and related parts. Also includes logistics services for other companies and the design, manufacture, remanufacture, maintenance and services of rail-related products. |
| 14. | Machinery and Engines (M&E) – Due to the highly integrated nature of operations, it represents the aggregate total of the Machinery and Engines lines of business and includes primarily our manufacturing, marketing and parts distribution operations. |
| 15. | Machinery and Engines Other Operating (Income) Expenses – Comprised primarily of gains/losses on disposal of long-lived assets, long-lived asset impairment charges and employee redundancy costs. |
| 16. | Manufacturing Costs – Manufacturing costs exclude the impacts of currency and represent the volume-adjusted change for variable costs and the absolute dollar change for period manufacturing costs. Variable manufacturing costs are defined as having a direct relationship with the volume of production. This includes material costs, direct labor and other costs that vary directly with production volume such as freight, power to operate machines and supplies that are consumed in the manufacturing process. Period manufacturing costs support production but are defined as generally not having a direct relationship to short-term changes in volume. Examples include machinery and equipment repair, depreciation on manufacturing asse ts, facility support, procurement, factory scheduling, manufacturing planning and operations management. |
| 17. | Price Realization – The impact of net price changes excluding currency and new product introductions. Consolidated price realization includes the impact of changes in the relative weighting of sales between geographic regions. |
| 18. | Redundancy Costs – Costs related to employment reduction including employee severance charges, pension and other postretirement benefit plan curtailments and settlements and health care and supplemental unemployment benefits. |
| 19. | Sales Volume – With respect to sales and revenues, sales volume represents the impact of changes in the quantities sold for machinery and engines as well as the incremental revenue impact of new product introductions. With respect to operating profit, sales volume represents the impact of changes in the quantities sold for machinery and engines combined with product mix—the net operating profit impact of changes in the relative weighting of machinery and engines sales with respect to total sales. |
| 20. | 6 Sigma – On a technical level, 6 Sigma represents a measure of variation that achieves 3.4 defects per million opportunities. At Caterpillar, 6 Sigma represents a much broader cultural philosophy to drive continuous improvement throughout the value chain. It is a fact-based, data-driven methodology that we are using to improve processes, enhance quality, cut costs, grow our business and deliver greater value to our customers through black belt-led project teams. At Caterpillar, 6 Sigma goes beyond mere process improvement—it has become the way we work as teams to process business information, solve problems and manage our business successfully. |
Page 22
NON-GAAP FINANCIAL MEASURES
The following definitions are provided for “non-GAAP financial measures” in connection with Regulation G issued by the Securities and Exchange Commission. These non-GAAP financial measures have no standardized meaning prescribed by U.S. GAAP and therefore are unlikely to be comparable to the calculation of similar measures for other companies. Management does not intend these items to be considered in isolation or substitutes for the related GAAP measures.
Profit Per Share Excluding Redundancy Costs
During the second quarter of 2009, we incurred redundancy costs of $85 million before tax related to employment reductions in response to the global recession. Full-year 2009 redundancy costs were $706 million before tax. We believe it is important to separately quantify the profit-per-share impact of redundancy costs in order for our 2009 results to be meaningful to our readers. Reconciliation of profit per share excluding redundancy costs to the most directly comparable GAAP measure, profit per share, is as follows:
Second Quarter 2009 | Full Year 2009 | |||||||
| Profit per share | $ | 0.60 | $ | 1.43 | ||||
| Per share redundancy costs | $ | 0.12 | $ | 0.75 | ||||
| Profit per share excluding redundancy costs | $ | 0.72 | $ | 2.18 | ||||
Machinery and Engines
Caterpillar defines Machinery and Engines as it is presented in the supplemental data as Caterpillar Inc. and its subsidiaries with Financial Products accounted for on the equity basis. Machinery and Engines information relates to the design, manufacture and marketing of our products. Financial Products information relates to the financing to customers and dealers for the purchase and lease of Caterpillar and other equipment. The nature of these businesses is different, especially with regard to the financial position and cash flow items. Caterpillar management utilizes this presentation internally to highlight these differences. We also believe this presentation will assist readers in understanding our business. Pages 28-33 reconcile Machinery and Engines with Fin ancial Products on the equity basis to Caterpillar Inc. Consolidated financial information.
Page 23
Caterpillar's latest financial results and current outlook are also available via:
| Telephone: | |
| (800) 228-7717 (Inside the United States and Canada) | |
| (858) 244-2080 (Outside the United States and Canada) | |
| Internet: | |
| http://www.cat.com/investor | |
http://www.cat.com/irwebcast (live broadcast/replays of quarterly conference call) | |
| Caterpillar contact: | |
| Jim Dugan | |
| Corporate Public Affairs | |
| (309) 494-4100 (Office) or (309) 360-7311 (Mobile) | |
| mail to: Dugan_Jim@cat.com | |
Page 24
Caterpillar Inc. Condensed Consolidated Statement of Results of Operations (Unaudited) (Dollars in millions except per share data) | |||||||||||||||||||||
| Three Months Ended | Six Months Ended | ||||||||||||||||||||
| June 30, | June 30, | ||||||||||||||||||||
| 2010 | 2009 | 2010 | 2009 | ||||||||||||||||||
| Sales and revenues: | |||||||||||||||||||||
| Sales of Machinery and Engines | $ | 9,723 | $ | 7,254 | $ | 17,274 | $ | 15,764 | |||||||||||||
| Revenues of Financial Products | 686 | 721 | 1,373 | 1,436 | |||||||||||||||||
| Total sales and revenues | 10,409 | 7,975 | 18,647 | 17,200 | |||||||||||||||||
| Operating costs: | |||||||||||||||||||||
| Cost of goods sold | 7,372 | 5,752 | 13,266 | 12,779 | |||||||||||||||||
| Selling, general and administrative expenses | 1,059 | 914 | 1,991 | 1,796 | |||||||||||||||||
| Research and development expenses | 450 | 351 | 852 | 739 | |||||||||||||||||
| Interest expense of Financial Products | 234 | 272 | 467 | 551 | |||||||||||||||||
| Other operating (income) expenses | 317 | 339 | 586 | 1,163 | |||||||||||||||||
| Total operating costs | 9,432 | 7,628 | 17,162 | 17,028 | |||||||||||||||||
| Operating profit | 977 | 347 | 1,485 | 172 | |||||||||||||||||
| Interest expense excluding Financial Products | 81 | 109 | 183 | 210 | |||||||||||||||||
| Other income (expense) | 50 | 163 | 113 | 227 | |||||||||||||||||
| Consolidated profit before taxes | 946 | 401 | 1,415 | 189 | |||||||||||||||||
| Provision (benefit) for income taxes | 209 | 40 | 440 | (40 | ) | ||||||||||||||||
| Profit of consolidated companies | 737 | 361 | 975 | 229 | |||||||||||||||||
| Equity in profit (loss) of unconsolidated affiliated companies | (4 | ) | (1 | ) | (6 | ) | — | ||||||||||||||
| Profit of consolidated and affiliated companies | 733 | 360 | 969 | 229 | |||||||||||||||||
| Less: Profit (loss) attributable to noncontrolling interests | 26 | (11 | ) | 29 | (30 | ) | |||||||||||||||
Profit 1 | $ | 707 | $ | 371 | $ | 940 | $ | 259 | |||||||||||||
| Profit per common share | $ | 1.12 | $ | 0.61 | $ | 1.50 | $ | 0.43 | |||||||||||||
Profit per common share – diluted 2 | $ | 1.09 | $ | 0.60 | $ | 1.46 | $ | 0.42 | |||||||||||||
Weighted average common shares outstanding (millions) | |||||||||||||||||||||
| - Basic | 629.8 | 611.8 | 628.1 | 607.6 | |||||||||||||||||
- Diluted 2 | 647.0 | 619.8 | 645.2 | 614.0 | |||||||||||||||||
| Cash dividends declared per common share | $ | 0.86 | $ | 0.84 | $ | 0.86 | $ | 0.84 | |||||||||||||
| 1 | Profit attributable to common stockholders. |
| 2 | Diluted by assumed exercise of stock-based compensation awards using the treasury stock method. |
Page 25
Caterpillar Inc. Condensed Consolidated Statement of Financial Position (Unaudited) (Millions of dollars) | ||||||||||||
| June 30, | December 31, | |||||||||||
| 2010 | 2009 | |||||||||||
| Assets | ||||||||||||
| Current assets: | ||||||||||||
| Cash and short-term investments | $ | 3,597 | $ | 4,867 | ||||||||
| Receivables - trade and other | 6,348 | 5,611 | ||||||||||
| Receivables - finance | 8,086 | 8,301 | ||||||||||
| Deferred and refundable income taxes | 1,041 | 1,216 | ||||||||||
| Prepaid expenses and other current assets | 965 | 862 | ||||||||||
| Inventories | 7,339 | 6,360 | ||||||||||
| Total current assets | 27,376 | 27,217 | ||||||||||
| Property, plant and equipment – net | 11,763 | 12,386 | ||||||||||
| Long-term receivables - trade and other | 1,150 | 971 | ||||||||||
| Long-term receivables - finance | 11,585 | 12,279 | ||||||||||
| Investments in unconsolidated affiliated companies | 154 | 105 | ||||||||||
| Noncurrent deferred and refundable income taxes | 2,464 | 2,714 | ||||||||||
| Intangible assets | 485 | 465 | ||||||||||
| Goodwill | 2,292 | 2,269 | ||||||||||
| Other assets | 1,524 | 1,632 | ||||||||||
| Total assets | $ | 58,793 | $ | 60,038 | ||||||||
| Liabilities | ||||||||||||
| Current liabilities: | ||||||||||||
| Short-term borrowings: | ||||||||||||
| -- Machinery and Engines | $ | 217 | $ | 433 | ||||||||
| -- Financial Products | 3,430 | 3,650 | ||||||||||
| Accounts payable | 3,975 | 2,993 | ||||||||||
| Accrued expenses | 3,083 | 3,351 | ||||||||||
| Accrued wages, salaries and employee benefits | 1,182 | 797 | ||||||||||
| Customer advances | 1,404 | 1,217 | ||||||||||
| Dividends payable | 277 | 262 | ||||||||||
| Other current liabilities | 936 | 888 | ||||||||||
| Long-term debt due within one year: | ||||||||||||
| -- Machinery and Engines | 434 | 302 | ||||||||||
| -- Financial Products | 4,846 | 5,399 | ||||||||||
| Total current liabilities | 19,784 | 19,292 | ||||||||||
| Long-term debt due after one year: | ||||||||||||
| -- Machinery and Engines | 4,828 | 5,652 | ||||||||||
| -- Financial Products | 15,398 | 16,195 | ||||||||||
| Liability for postemployment benefits | 6,977 | 7,420 | ||||||||||
| Other liabilities | 2,102 | 2,179 | ||||||||||
| Total liabilities | 49,089 | 50,738 | ||||||||||
| Redeemable noncontrolling interest | 432 | 477 | ||||||||||
| Stockholders' equity | ||||||||||||
| Common stock | 3,636 | 3,439 | ||||||||||
| Treasury stock | (10,539 | ) | (10,646 | ) | ||||||||
| Profit employed in the business | 20,133 | 19,711 | ||||||||||
| Accumulated other comprehensive income (loss) | (4,045 | ) | (3,764 | ) | ||||||||
| Noncontrolling interests | 87 | 83 | ||||||||||
| Total stockholders' equity | 9,272 | 8,823 | ||||||||||
| Total liabilities, redeemable noncontrolling interest and stockholders' equity | $ | 58,793 | $ | 60,038 | ||||||||
Page 26
Caterpillar Inc. Condensed Consolidated Statement of Cash Flow (Unaudited) (Millions of dollars) | |||||||||||
| Six Months Ended | |||||||||||
| June 30, | |||||||||||
| 2010 | 2009 | ||||||||||
| Cash flow from operating activities: | |||||||||||
| Profit of consolidated and affiliated companies | $ | 969 | $ | 229 | |||||||
| Adjustments for non-cash items: | |||||||||||
| Depreciation and amortization | 1,116 | 1,072 | |||||||||
| Other | 176 | 59 | |||||||||
| Changes in assets and liabilities: | |||||||||||
| Receivables – trade and other | (1,096 | ) | 3,133 | ||||||||
| Inventories | (1,020 | ) | 1,631 | ||||||||
| Accounts payable | 1,151 | (2,181 | ) | ||||||||
| Accrued expenses | (91 | ) | (536 | ) | |||||||
| Customer advances | 171 | (338 | ) | ||||||||
| Other assets – net | 288 | 168 | |||||||||
| Other liabilities – net | 79 | (434 | ) | ||||||||
| Net cash provided by (used for) operating activities | 1,743 | 2,803 | |||||||||
| Cash flow from investing activities: | |||||||||||
| Capital expenditures – excluding equipment leased to others | (484 | ) | (443 | ) | |||||||
| Expenditures for equipment leased to others | (372 | ) | (441 | ) | |||||||
| Proceeds from disposals of property, plant and equipment | 755 | 454 | |||||||||
| Additions to finance receivables | (4,017 | ) | (3,800 | ) | |||||||
| Collections of finance receivables | 4,161 | 5,119 | |||||||||
| Proceeds from sale of finance receivables | 5 | 93 | |||||||||
| Investments and acquisitions (net of cash acquired) | (170 | ) | — | ||||||||
| Proceeds from sale of available-for-sale securities | 90 | 170 | |||||||||
| Investments in available-for-sale securities | (81 | ) | (251 | ) | |||||||
| Other – net | 6 | (53 | ) | ||||||||
| Net cash provided by (used for) investing activities | (107 | ) | 848 | ||||||||
| Cash flow from financing activities: | |||||||||||
| Dividends paid | (527 | ) | (505 | ) | |||||||
| Common stock issued, including treasury shares reissued | 84 | 31 | |||||||||
| Excess tax benefit from stock-based compensation | 39 | 2 | |||||||||
| Acquisitions of noncontrolling interests | (26 | ) | (6 | ) | |||||||
| Proceeds from debt issued (original maturities greater than three months) | 4,251 | 9,029 | |||||||||
| Payments on debt (original maturities greater than three months) | (6,471 | ) | (7,570 | ) | |||||||
| Short-term borrowings - net (original maturities three months or less) | (136 | ) | (3,365 | ) | |||||||
| Net cash provided by (used for) financing activities | (2,786 | ) | (2,384 | ) | |||||||
| Effect of exchange rate changes on cash | (120 | ) | (12 | ) | |||||||
| Increase (decrease) in cash and short-term investments | (1,270 | ) | 1,255 | ||||||||
| Cash and short-term investments at beginning of period | 4,867 | 2,736 | |||||||||
| Cash and short-term investments at end of period | $ | 3,597 | $ | 3,991 | |||||||
| All short-term investments, which consist primarily of highly liquid investments with original maturities of three months or less, are considered to be cash equivalents. |
Page 27
Caterpillar Inc. Supplemental Data for Results of Operations For The Three Months Ended June 30, 2010 (Unaudited) (Millions of dollars) | ||||||||||||||||||||
| Supplemental Consolidating Data | ||||||||||||||||||||
| Machinery | Financial | Consolidating | ||||||||||||||||||
| Consolidated | and Engines 1 | Products | Adjustments | |||||||||||||||||
| Sales and revenues: | ||||||||||||||||||||
| Sales of Machinery and Engines | $ | 9,723 | $ | 9,723 | $ | — | $ | — | ||||||||||||
| Revenues of Financial Products | 686 | — | 753 | (67 | ) | 2 | ||||||||||||||
| Total sales and revenues | 10,409 | 9,723 | 753 | (67 | ) | |||||||||||||||
| Operating costs: | ||||||||||||||||||||
| Cost of goods sold | 7,372 | 7,372 | — | — | ||||||||||||||||
| Selling, general and administrative expenses | 1,059 | 918 | 145 | (4 | ) | 3 | ||||||||||||||
| Research and development expenses | 450 | 450 | — | — | ||||||||||||||||
| Interest expense of Financial Products | 234 | — | 234 | — | 4 | |||||||||||||||
| Other operating (income) expenses | 317 | 44 | 282 | (9 | ) | 3 | ||||||||||||||
| Total operating costs | 9,432 | 8,784 | 661 | (13 | ) | |||||||||||||||
| Operating profit | 977 | 939 | 92 | (54 | ) | |||||||||||||||
| Interest expense excluding Financial Products | 81 | 102 | — | (21 | ) | 4 | ||||||||||||||
| Other income (expense) | 50 | — | 17 | 33 | 5 | |||||||||||||||
| Consolidated profit before taxes | 946 | 837 | 109 | — | ||||||||||||||||
| Provision for income taxes | 209 | 193 | 16 | — | ||||||||||||||||
| Profit of consolidated companies | 737 | 644 | 93 | — | ||||||||||||||||
| Equity in profit (loss) of unconsolidated affiliated companies | (4 | ) | (4 | ) | — | — | ||||||||||||||
| Equity in profit of Financial Products' subsidiaries | — | 90 | — | (90 | ) | 6 | ||||||||||||||
| Profit of consolidated and affiliated companies | 733 | 730 | 93 | (90 | ) | |||||||||||||||
| Less: Profit (loss) attributable to noncontrolling interests | 26 | 23 | 3 | — | ||||||||||||||||
Profit 7 | $ | 707 | $ | 707 | $ | 90 | $ | (90 | ) | |||||||||||
| 1 | Represents Caterpillar Inc. and its subsidiaries with Financial Products accounted for on the equity basis. |
| 2 | Elimination of Financial Products’ revenues earned from Machinery and Engines. |
| 3 | Elimination of net expenses recorded by Machinery and Engines paid to Financial Products. |
| 4 | Elimination of interest expense recorded between Financial Products and Machinery and Engines. |
| 5 | Elimination of discount recorded by Machinery and Engines on receivables sold to Financial Products and of interest earned between Machinery and Engines and Financial Products. |
| 6 | Elimination of Financial Products’ profit due to equity method of accounting. |
| 7 | Profit attributable to common stockholders. |
Page 28
Caterpillar Inc. Supplemental Data for Results of Operations For The Three Months Ended June 30, 2009 (Unaudited) (Millions of dollars) | ||||||||||||||||||||
| Supplemental Consolidating Data | ||||||||||||||||||||
| Machinery | Financial | Consolidating | ||||||||||||||||||
| Consolidated | and Engines 1 | Products | Adjustments | |||||||||||||||||
| Sales and revenues: | ||||||||||||||||||||
| Sales of Machinery and Engines | $ | 7,254 | $ | 7,254 | $ | — | $ | — | ||||||||||||
| Revenues of Financial Products | 721 | — | 814 | (93 | ) | 2 | ||||||||||||||
| Total sales and revenues | 7,975 | 7,254 | 814 | (93 | ) | |||||||||||||||
| Operating costs: | ||||||||||||||||||||
| Cost of goods sold | 5,752 | 5,752 | — | — | ||||||||||||||||
| Selling, general and administrative expenses | 914 | 789 | 129 | (4 | ) | 3 | ||||||||||||||
| Research and development expenses | 351 | 351 | — | — | ||||||||||||||||
| Interest expense of Financial Products | 272 | — | 272 | — | 4 | |||||||||||||||
| Other operating (income) expenses | 339 | 59 | 286 | (6 | ) | 3 | ||||||||||||||
| Total operating costs | 7,628 | 6,951 | 687 | (10 | ) | |||||||||||||||
| Operating profit | 347 | 303 | 127 | (83 | ) | |||||||||||||||
| Interest expense excluding Financial Products | 109 | 139 | — | (30 | ) | 4 | ||||||||||||||
| Other income (expense) | 163 | 97 | 13 | 53 | 5 | |||||||||||||||
| Consolidated profit before taxes | 401 | 261 | 140 | — | ||||||||||||||||
| Provision for income taxes | 40 | 6 | 34 | — | ||||||||||||||||
| Profit of consolidated companies | 361 | 255 | 106 | — | ||||||||||||||||
| Equity in profit (loss) of unconsolidated affiliated companies | (1 | ) | (1 | ) | — | — | ||||||||||||||
| Equity in profit of Financial Products' subsidiaries | — | 102 | — | (102 | ) | 6 | ||||||||||||||
| Profit of consolidated and affiliated companies | 360 | 356 | 106 | (102 | ) | |||||||||||||||
| Less: Profit (loss) attributable to noncontrolling interests | (11 | ) | (15 | ) | 4 | — | ||||||||||||||
Profit 7 | $ | 371 | $ | 371 | $ | 102 | $ | (102 | ) | |||||||||||
| 1 | Represents Caterpillar Inc. and its subsidiaries with Financial Products accounted for on the equity basis. |
| 2 | Elimination of Financial Products’ revenues earned from Machinery and Engines. |
| 3 | Elimination of net expenses recorded by Machinery and Engines paid to Financial Products. |
| 4 | Elimination of interest expense recorded between Financial Products and Machinery and Engines. |
| 5 | Elimination of discount recorded by Machinery and Engines on receivables sold to Financial Products and of interest earned between Machinery and Engines and Financial Products. |
| 6 | Elimination of Financial Products’ profit due to equity method of accounting. |
| 7 | Profit attributable to common stockholders. |
Page 29
Caterpillar Inc. Supplemental Data for Results of Operations For The Six Months Ended June 30, 2010 (Unaudited) (Millions of dollars) | ||||||||||||||||||||
| Supplemental Consolidating Data | ||||||||||||||||||||
| Machinery | Financial | Consolidating | ||||||||||||||||||
| Consolidated | and Engines 1 | Products | Adjustments | |||||||||||||||||
| Sales and revenues: | ||||||||||||||||||||
| Sales of Machinery and Engines | $ | 17,274 | $ | 17,274 | $ | — | $ | — | ||||||||||||
| Revenues of Financial Products | 1,373 | — | 1,499 | (126 | ) | 2 | ||||||||||||||
| Total sales and revenues | 18,647 | 17,274 | 1,499 | (126 | ) | |||||||||||||||
| Operating costs: | ||||||||||||||||||||
| Cost of goods sold | 13,266 | 13,266 | — | — | ||||||||||||||||
| Selling, general and administrative expenses | 1,991 | 1,716 | 289 | (14 | ) | 3 | ||||||||||||||
| Research and development expenses | 852 | 852 | — | — | ||||||||||||||||
| Interest expense of Financial Products | 467 | — | 468 | (1 | ) | 4 | ||||||||||||||
| Other operating (income) expenses | 586 | 43 | 553 | (10 | ) | 3 | ||||||||||||||
| Total operating costs | 17,162 | 15,877 | 1,310 | (25 | ) | |||||||||||||||
| Operating profit | 1,485 | 1,397 | 189 | (101 | ) | |||||||||||||||
| Interest expense excluding Financial Products | 183 | 224 | — | (41 | ) | 4 | ||||||||||||||
| Other income (expense) | 113 | 23 | 30 | 60 | 5 | |||||||||||||||
| Consolidated profit before taxes | 1,415 | 1,196 | 219 | — | ||||||||||||||||
| Provision for income taxes | 440 | 395 | 45 | — | ||||||||||||||||
| Profit of consolidated companies | 975 | 801 | 174 | — | ||||||||||||||||
| Equity in profit (loss) of unconsolidated affiliated companies | (6 | ) | (6 | ) | — | — | ||||||||||||||
| Equity in profit of Financial Products' subsidiaries | — | 169 | — | (169 | ) | 6 | ||||||||||||||
| Profit of consolidated and affiliated companies | 969 | 964 | 174 | (169 | ) | |||||||||||||||
| Less: Profit (loss) attributable to noncontrolling interests | 29 | 24 | 5 | — | ||||||||||||||||
Profit 7 | $ | 940 | $ | 940 | $ | 169 | $ | (169 | ) | |||||||||||
| 1 | Represents Caterpillar Inc. and its subsidiaries with Financial Products accounted for on the equity basis. |
| 2 | Elimination of Financial Products’ revenues earned from Machinery and Engines. |
| 3 | Elimination of net expenses recorded by Machinery and Engines paid to Financial Products. |
| 4 | Elimination of interest expense recorded between Financial Products and Machinery and Engines. |
| 5 | Elimination of discount recorded by Machinery and Engines on receivables sold to Financial Products and of interest earned between Machinery and Engines and Financial Products. |
| 6 | Elimination of Financial Products’ profit due to equity method of accounting. |
| 7 | Profit attributable to common stockholders. |
Page 30
Caterpillar Inc. Supplemental Data for Results of Operations For The Six Months Ended June 30, 2009 (Unaudited) (Millions of dollars) | ||||||||||||||||||||
| Supplemental Consolidating Data | ||||||||||||||||||||
| Machinery | Financial | Consolidating | ||||||||||||||||||
| Consolidated | and Engines 1 | Products | Adjustments | |||||||||||||||||
| Sales and revenues: | ||||||||||||||||||||
| Sales of Machinery and Engines | $ | 15,764 | $ | 15,764 | $ | — | $ | — | ||||||||||||
| Revenues of Financial Products | 1,436 | — | 1,610 | (174 | ) | 2 | ||||||||||||||
| Total sales and revenues | 17,200 | 15,764 | 1,610 | (174 | ) | |||||||||||||||
| Operating costs: | ||||||||||||||||||||
| Cost of goods sold | 12,779 | 12,779 | — | — | ||||||||||||||||
| Selling, general and administrative expenses | 1,796 | 1,549 | 254 | (7 | ) | 3 | ||||||||||||||
| Research and development expenses | 739 | 739 | — | — | ||||||||||||||||
| Interest expense of Financial Products | 551 | — | 554 | (3 | ) | 4 | ||||||||||||||
| Other operating (income) expenses | 1,163 | 605 | 576 | (18 | ) | 3 | ||||||||||||||
| Total operating costs | 17,028 | 15,672 | 1,384 | (28 | ) | |||||||||||||||
| Operating profit | 172 | 92 | 226 | (146 | ) | |||||||||||||||
| Interest expense excluding Financial Products | 210 | 253 | — | (43 | ) | 4 | ||||||||||||||
| Other income (expense) | 227 | 131 | (7 | ) | 103 | 5 | ||||||||||||||
| Consolidated profit before taxes | 189 | (30 | ) | 219 | — | |||||||||||||||
| Provision (benefit) for income taxes | (40 | ) | (93 | ) | 53 | — | ||||||||||||||
| Profit of consolidated companies | 229 | 63 | 166 | — | ||||||||||||||||
| Equity in profit (loss) of unconsolidated affiliated companies | — | — | — | — | ||||||||||||||||
| Equity in profit of Financial Products' subsidiaries | — | 158 | — | (158 | ) | 6 | ||||||||||||||
| Profit of consolidated and affiliated companies | 229 | 221 | 166 | (158 | ) | |||||||||||||||
| Less: Profit (loss) attributable to noncontrolling interests | (30 | ) | (38 | ) | 8 | — | ||||||||||||||
Profit 7 | $ | 259 | $ | 259 | $ | 158 | $ | (158 | ) | |||||||||||
| 1 | Represents Caterpillar Inc. and its subsidiaries with Financial Products accounted for on the equity basis. |
| 2 | Elimination of Financial Products’ revenues earned from Machinery and Engines. |
| 3 | Elimination of net expenses recorded by Machinery and Engines paid to Financial Products. |
| 4 | Elimination of interest expense recorded between Financial Products and Machinery and Engines. |
| 5 | Elimination of discount recorded by Machinery and Engines on receivables sold to Financial Products and of interest earned between Machinery and Engines and Financial Products. |
| 6 | Elimination of Financial Products’ profit due to equity method of accounting. |
| 7 | Profit attributable to common stockholders. |
Page 31
Caterpillar Inc. Supplemental Data for Cash Flow For The Six Months Ended June 30, 2010 (Unaudited) (Millions of dollars) | |||||||||||||||||||||
| Supplemental Consolidating Data | |||||||||||||||||||||
| Machinery | Financial | Consolidating | |||||||||||||||||||
| Consolidated | and Engines 1 | Products | Adjustments | ||||||||||||||||||
| Cash flow from operating activities: | |||||||||||||||||||||
| Profit of consolidated and affiliated companies | $ | 969 | $ | 964 | $ | 174 | $ | (169 | ) | 2 | |||||||||||
| Adjustments for non-cash items: | |||||||||||||||||||||
| Depreciation and amortization | 1,116 | 750 | 366 | — | |||||||||||||||||
| Other | 176 | 201 | (95 | ) | 70 | 4 | |||||||||||||||
| Financial Products’ dividend in excess of profit | — | 431 | — | (431 | ) | 3 | |||||||||||||||
| Changes in assets and liabilities: | |||||||||||||||||||||
| Receivables - trade and other | (1,096 | ) | (701 | ) | 64 | (459 | ) | 4,5 | |||||||||||||
| Inventories | (1,020 | ) | (1,018 | ) | — | (2 | ) | 4 | |||||||||||||
| Accounts payable | 1,151 | 1,153 | (9 | ) | 7 | 4 | |||||||||||||||
| Accrued expenses | (91 | ) | (12 | ) | (93 | ) | 14 | 4 | |||||||||||||
| Customer advances | 171 | 171 | — | — | |||||||||||||||||
| Other assets - net | 288 | 142 | 8 | 138 | 4 | ||||||||||||||||
| Other liabilities - net | 79 | 276 | (45 | ) | (152 | ) | 4 | ||||||||||||||
| Net cash provided by (used for) operating activities | 1,743 | 2,357 | 370 | (984 | ) | ||||||||||||||||
| Cash flow from investing activities: | |||||||||||||||||||||
| Capital expenditures - excluding equipment leased to others | (484 | ) | (492 | ) | (1 | ) | 9 | 4 | |||||||||||||
| Expenditures for equipment leased to others | (372 | ) | — | (397 | ) | 25 | 4 | ||||||||||||||
| Proceeds from disposals of property, plant and equipment | 755 | 47 | 724 | (16 | ) | 4 | |||||||||||||||
| Additions to finance receivables | (4,017 | ) | — | (11,689 | ) | 7,672 | 5 | ||||||||||||||
| Collections of finance receivables | 4,161 | — | 11,467 | (7,306 | ) | 5 | |||||||||||||||
| Proceeds from sale of finance receivables | 5 | — | 5 | — | |||||||||||||||||
| Net intercompany borrowings | — | (574 | ) | 286 | 288 | 6 | |||||||||||||||
| Investments and acquisitions (net of cash acquired) | (170 | ) | (138 | ) | (32 | ) | — | ||||||||||||||
Proceeds from sale of available-for-sale securities | 90 | 3 | 87 | — | |||||||||||||||||
| Investments in available-for-sale securities | (81 | ) | (1 | ) | (80 | ) | — | ||||||||||||||
| Other - net | 6 | 2 | (16 | ) | 20 | 7 | |||||||||||||||
| Net cash provided by (used for) investing activities | (107 | ) | (1,153 | ) | 354 | 692 | |||||||||||||||
| Cash flow from financing activities: | |||||||||||||||||||||
| Dividends paid | (527 | ) | (527 | ) | (600 | ) | 600 | 8 | |||||||||||||
| Common stock issued, including treasury shares reissued | 84 | 84 | 20 | (20 | ) | 7 | |||||||||||||||
| Excess tax benefit from stock-based compensation | 39 | 39 | — | — | |||||||||||||||||
| Acquisitions of noncontrolling interests | (26 | ) | (26 | ) | — | — | |||||||||||||||
| Net intercompany borrowings | — | (286 | ) | 574 | (288 | ) | 6 | ||||||||||||||
| Proceeds from debt issued (original maturities greater than three months) | 4,251 | 126 | 4,125 | — | |||||||||||||||||
| Payments on debt (original maturities greater than three months) | (6,471 | ) | (889 | ) | (5,582 | ) | — | ||||||||||||||
| Short-term borrowings - net (original maturities three months or less) | (136 | ) | (30 | ) | (106 | ) | — | ||||||||||||||
| Net cash provided by (used for) financing activities | (2,786 | ) | (1,509 | ) | (1,569 | ) | 292 | ||||||||||||||
| Effect of exchange rate changes on cash | (120 | ) | (34 | ) | (86 | ) | — | ||||||||||||||
| Increase (decrease) in cash and short-term investments | (1,270 | ) | (339 | ) | (931 | ) | — | ||||||||||||||
| Cash and short-term investments at beginning of period | 4,867 | 2,239 | 2,628 | — | |||||||||||||||||
| Cash and short-term investments at end of period | $ | 3,597 | $ | 1,900 | $ | 1,697 | $ | — | |||||||||||||
| 1 | Represents Caterpillar Inc. and its subsidiaries with Financial Products accounted for on the equity basis. |
| 2 | Elimination of Financial Products’ profit after tax due to equity method of accounting. |
| 3 | Elimination of Financial Products’ dividend to Machinery and Engines in excess of Financial Products’ profit. |
| 4 | Elimination of non-cash adjustments and changes in assets and liabilities related to consolidated reporting. |
| 5 | Reclassification of Cat Financial’s cash flow activity from investing to operating for receivables that arose from the sale of inventory. |
| 6 | Elimination of net proceeds and payments to/from Machinery and Engines and Financial Products. |
| 7 | Elimination of change in investment and common stock related to Financial Products. |
| 8 | Elimination of dividend from Financial Products to Machinery and Engines. |
Page 32
Caterpillar Inc. Supplemental Data for Cash Flow For The Six Months Ended June 30, 2009 (Unaudited) (Millions of dollars) | |||||||||||||||||||||
| Supplemental Consolidating Data | |||||||||||||||||||||
| Machinery | Financial | Consolidating | |||||||||||||||||||
| Consolidated | and Engines 1 | Products | Adjustments | ||||||||||||||||||
| Cash flow from operating activities: | |||||||||||||||||||||
| Profit of consolidated and affiliated companies | $ | 229 | $ | 221 | $ | 166 | $ | (158 | ) | 2 | |||||||||||
| Adjustments for non-cash items: | |||||||||||||||||||||
| Depreciation and amortization | 1,072 | 710 | 362 | — | |||||||||||||||||
| Undistributed profit of Financial Products | — | (158 | ) | — | 158 | 3 | |||||||||||||||
| Other | 59 | 258 | (270 | ) | 71 | 4 | |||||||||||||||
| Changes in assets and liabilities: | |||||||||||||||||||||
| Receivables - trade and other | 3,133 | 1,446 | 102 | 1,585 | 4,5 | ||||||||||||||||
| Inventories | 1,631 | 1,631 | — | — | |||||||||||||||||
| Accounts payable | (2,181 | ) | (2,151 | ) | (74 | ) | 44 | 4 | |||||||||||||
| Accrued expenses | (536 | ) | (512 | ) | (33 | ) | 9 | 4 | |||||||||||||
| Customer advances | (338 | ) | (338 | ) | — | — | |||||||||||||||
| Other assets - net | 168 | (50 | ) | 241 | (23 | ) | 4 | ||||||||||||||
| Other liabilities - net | (434 | ) | (474 | ) | 24 | 16 | 4 | ||||||||||||||
| Net cash provided by (used for) operating activities | 2,803 | 583 | 518 | 1,702 | |||||||||||||||||
| Cash flow from investing activities: | |||||||||||||||||||||
| Capital expenditures - excluding equipment leased to others | (443 | ) | (442 | ) | (1 | ) | — | ||||||||||||||
| Expenditures for equipment leased to others | (441 | ) | — | (442 | ) | 1 | 4 | ||||||||||||||
| Proceeds from disposals of property, plant and equipment | 454 | 41 | 413 | — | |||||||||||||||||
| Additions to finance receivables | (3,800 | ) | — | (10,939 | ) | 7,139 | 5 | ||||||||||||||
| Collections of finance receivables | 5,119 | — | 13,170 | (8,051 | ) | 5 | |||||||||||||||
| Proceeds from sale of finance receivables | 93 | — | 884 | (791 | ) | 5 | |||||||||||||||
| Net intercompany borrowings | — | 430 | (1,016 | ) | 586 | 6 | |||||||||||||||
| Investments and acquisitions (net of cash acquired) | — | — | — | — | |||||||||||||||||
Proceeds from sale of available-for-sale securities | 170 | 3 | 167 | — | |||||||||||||||||
| Investments in available-for-sale securities | (251 | ) | (4 | ) | (247 | ) | — | ||||||||||||||
| Other - net | (53 | ) | (63 | ) | (10 | ) | 20 | 7 | |||||||||||||
| Net cash provided by (used for) investing activities | 848 | (35 | ) | 1,979 | (1,096 | ) | |||||||||||||||
| Cash flow from financing activities: | |||||||||||||||||||||
| Dividends paid | (505 | ) | (505 | ) | — | — | |||||||||||||||
| Common stock issued, including treasury shares reissued | 31 | 31 | 20 | (20 | ) | 7 | |||||||||||||||
| Excess tax benefit from stock-based compensation | 2 | 2 | — | — | |||||||||||||||||
| Acquisitions of noncontrolling interests | (6 | ) | (6 | ) | — | — | |||||||||||||||
| Net intercompany borrowings | — | 1,016 | (430 | ) | (586 | ) | 6 | ||||||||||||||
| Proceeds from debt issued (original maturities greater than three months) | 9,029 | 872 | 8,157 | — | |||||||||||||||||
| Payments on debt (original maturities greater than three months) | (7,570 | ) | (915 | ) | (6,655 | ) | — | ||||||||||||||
| Short-term borrowings - net (original maturities three months or less) | (3,365 | ) | (873 | ) | (2,492 | ) | — | ||||||||||||||
| Net cash provided by (used for) financing activities | (2,384 | ) | (378 | ) | (1,400 | ) | (606 | ) | |||||||||||||
| Effect of exchange rate changes on cash | (12 | ) | (12 | ) | — | — | |||||||||||||||
| Increase (decrease) in cash and short-term investments | 1,255 | 158 | 1,097 | — | |||||||||||||||||
| Cash and short-term investments at beginning of period | 2,736 | 1,517 | 1,219 | — | |||||||||||||||||
| Cash and short-term investments at end of period | $ | 3,991 | $ | 1,675 | $ | 2,316 | $ | — | |||||||||||||
| 1 | Represents Caterpillar Inc. and its subsidiaries with Financial Products accounted for on the equity basis. |
| 2 | Elimination of Financial Products’ profit after tax due to equity method of accounting. |
| 3 | Elimination of non-cash adjustment for the undistributed earnings from Financial Products. |
| 4 | Elimination of non-cash adjustments and changes in assets and liabilities related to consolidated reporting. |
| 5 | Reclassification of Cat Financial’s cash flow activity from investing to operating for receivables that arose from the sale of inventory. |
| 6 | Elimination of net proceeds and payments to/from Machinery and Engines and Financial Products. |
| 7 | Elimination of change in investment and common stock related to Financial Products. |
Page 33