Exhibit 99.1
Caterpillar Inc.
3Q 2010 Earnings Release
October 21, 2010
FOR IMMEDIATE RELEASE
Caterpillar Third-Quarter Profit up 96 Percent, Sales and Revenues up 53 Percent;
Raises 2010 Outlook and Expects 2011 Sales and Revenues to Approach $50 Billion
PEORIA, Ill.— Caterpillar Inc. (NYSE: CAT) today reported a third-quarter profit of $792 million, 96 percent higher than the third-quarter 2009 profit of $404 million. Profit per share was $1.22, an increase from $0.64 per share in the third quarter of 2009. Sales and revenues of $11.134 billion were up 53 percent from $7.298 billion in the third quarter of 2009.
“Third-quarter results continue to demonstrate our focus on aggressively managing costs and improving cash flow, while continuing to ramp up production to meet customer demand. Continuing economic growth in the developing world has been key to improving sales. In addition, sales in developed countries have improved substantially after deep declines in 2009. While demand has increased, dealer new machine inventories and rental fleets have remained relatively flat, and the age of rental fleets hasn’t improved, and that should be positive for us as we move forward,” said Caterpillar CEO Doug Oberhelman.
“As business continues to improve, we are investing in growth to support our customers and reward our stockholders. We serve industries with significant growth potential and are investing in our products, capacity and new businesses. We’re updating our product line for Tier 4 emissions, we’re expanding our mining products with shovels and electric-drive trucks, we’re adding capacity around the world, and we’re growing into new areas such as locomotives, with our acquisition of Electro-Motive Diesel,” Oberhelman added.
Sales and revenues were up $3.836 billion from the third quarter of 2009. Sales volume improved $3.714 billion, price realization was favorable $262 million, and currency had an unfavorable impact of $107 million. Financial Products revenues were down $33 million from the third quarter of 2009. Profit was up $388 million, with the increase primarily the result of higher sales volume, favorable price realization and improved manufacturing costs driven by the Caterpillar Production System, partially offset by higher taxes, incentive compensation and higher research and development expenses.
Page 1
Revised 2010 Outlook
The outlook for 2010 sales and revenues is a range of $41 to $42 billion, an increase of 28 percent from 2009 at the midpoint of the range. The previous outlook range was $39 to $42 billion. The 2010 profit outlook is a range of $3.80 to $4.00 per share, an increase of 173 percent from 2009 at the midpoint of the range. The previous outlook range was $3.15 to $3.85 per share. 2010 is shaping up to be one of the most significant year-over-year increases in sales and revenues in our history.
Preliminary 2011 Outlook
Our preliminary outlook for 2011 reflects sales and revenues approaching $50 billion. Developing economies are leading our growth in 2010, and we expect them to continue to grow in 2011. We are expecting developed countries to grow in 2011 as well, but at a slower pace than the developing world.
“So far this year, due to higher demand, we have increased our workforce by more than 15,000 people globally, including more than 6,000 full-time employees and 9,000 people added to our flexible workforce. I am pleased that we have put so many people back to work this year, and with continued global economic growth, we will add people in 2011 but remain keenly focused on cost control. While we are expecting positive economic growth in the United States, the recovery is weaker than we’ve seen historically, particularly given the depth of the 2009 recession. To drive economic growth, we encourage government policy makers to advance pro-business initiatives and a growth agenda. In addition, they should avoid policy decisions that may create trade tensions between the United Sta tes and other key trading partners and avoid tax policy that puts U.S. multinationals, like Caterpillar, at a competitive disadvantage compared with non-U.S. competitors,” Oberhelman added.
Page 2
Notes:
| - | Glossary of terms is included on pages 22-23; first occurrence of terms shown in bold italics. |
| - | Information on non-GAAP financial measures is included on page 24. |
For more than 85 years, Caterpillar Inc. has been making progress possible and driving positive and sustainable change on every continent. With 2009 sales and revenues of $32.396 billion, Caterpillar is the world’s leading manufacturer of construction and mining equipment, diesel and natural gas engines, industrial gas turbines and diesel-electric locomotives. The company also is a leading services provider through Caterpillar Financial Services, Caterpillar Remanufacturing Services, Caterpillar Logistics Services and Progress Rail Services. More information is available at: http://www.cat.com.
Caterpillar contact: Jim Dugan, Corporate Public Affairs, (309) 494-4100 (Office) or (309) 360-7311 (Mobile)
Page 3
FORWARD-LOOKING STATEMENTS
Certain statements in this release relate to future events and expectations and, as such, constitute forward-looking statements within the meaning of the Private Securities Litigation Reform Act of 1995. These statements are subject to known and unknown factors that may cause actual results of Caterpillar Inc. to be different from those expressed or implied in the forward-looking statements. Words such as “believe,” “estimate,” “will be,” “will,” “would,” “expect,” “anticipate,” “plan,” “project,” “intend,” “could,” “should” or other similar words or expressions often identify forward-looking statements. All statements other than statements of historical fact are for ward-looking statements, including, without limitation, statements regarding our outlook, projections, forecasts or trend descriptions. These statements do not guarantee future performance, and Caterpillar does not undertake to update its forward-looking statements.
It is important to note that actual results of the company may differ materially from those described or implied in such forward-looking statements based on a number of factors, including, but not limited to: (i) economic volatility in the global economy generally and in capital and credit markets; (ii) Caterpillar’s ability to generate cash from operations, secure external funding for operations and manage liquidity needs; (iii) adverse changes in the economic conditions of the industries or markets Caterpillar serves; (iv) government regulations or policies, including those affecting interest rates, liquidity, access to capital and government spending on infrastructure development; (v) commodity price increases and/or limited availability of raw materials and component products, including steel; ( vi) compliance costs associated with environmental laws and regulations; (vii) Caterpillar’s and Cat Financial’s ability to maintain their respective credit ratings, material increases in either company’s cost of borrowing or an inability of either company to access capital markets; (viii) financial condition and credit worthiness of Cat Financial’s customers; (ix) material adverse changes in our customers’ access to liquidity and capital; (x) market acceptance of Caterpillar’s products and services; (xi) effects of changes in the competitive environment, which may include decreased market share, lack of acceptance of price increases, and/or negative changes to our geographic and product mix of sales; (xii) Caterpillar’s ability to successfully implement Caterpillar Production System or other productivity initiatives; (xiii) international trade and investment policies, such as import quotas, capital controls or tariffs; (xiv)&# 160;failure of Caterpillar or Cat Financial to comply with financial covenants in their respective credit facilities; (xv) adverse changes in sourcing practices for our dealers or original equipment manufacturers; (xvi) additional tax expense or exposure; (xvii) political and economic risks associated with our global operations, including changes in laws, regulations or government policies, currency restrictions, restrictions on repatriation of earnings, burdensome tariffs or quotas, national and international conflict, including terrorist acts and political and economic instability or civil unrest in the countries in which Caterpillar operates; (xviii) currency fluctuations, particularly increases and decreases in the U.S. dollar against other currencies; (xix) increased payment obligations under our pension plans; (xx) inability to successfully integrate and realize expected benefits from acquisitions; (xxi) significant legal proceedings, claims, lawsuits or investigation s; (xxii) imposition of significant costs or restrictions due to the enactment and implementation of health care reform legislation and proposed financial regulation legislation; (xxiii) changes in accounting standards or adoption of new accounting standards; (xxiv) adverse effects of natural disasters; and (xxv) other factors described in more detail under “Item 1A. Risk Factors” in Part I of our Form 10-K filed with the SEC on February 19, 2010 for the year ended December 31, 2009 and in Part II of our Form 10-Q filed with the SEC on May 3, 2010 for the quarter ended March 31, 2010. These filings are available on our website at www.cat.com/sec_filings.
Page 4
Key Points
Third Quarter 2010 (Dollars in millions except per share data) | |||||||||||||||
Third Quarter 2010 | Third Quarter 2009 | $ Change | % Change | ||||||||||||
| Machinery and Engines Sales | $ | 10,452 | $ | 6,583 | $ | 3,869 | 59 | % | |||||||
| Financial Products Revenues | 682 | 715 | (33 | ) | (5 | ) | % | ||||||||
| Total Sales and Revenues | $ | 11,134 | $ | 7,298 | $ | 3,836 | 53 | % | |||||||
| Profit | $ | 792 | $ | 404 | $ | 388 | 96 | % | |||||||
Profit per common share - diluted | $ | 1.22 | $ | 0.64 | $ | 0.58 | 91 | % | |||||||
| § | Third-quarter sales and revenues of $11.134 billion were 53 percent higher than the third quarter of 2009. The improvement is a result of economic growth in the developing world and improvement from low levels of machine demand in 2009 in developed countries. |
| § | Machinery sales increased 84 percent due to higher end-user demand, absence of dealer inventory reductions that occurred in the third quarter of 2009 and better price realization. |
| § | Engines sales increased 21 percent, and Financial Products revenues declined 5 percent from the third quarter of 2009 primarily due to lower average earning assets. |
| § | Manufacturing costs improved $142 million. Excluding pre-tax LIFO inventory decrement benefits of $120 million in the third quarter of 2009, manufacturing costs improved $262 million. |
| § | Machinery and Engines (M&E) operating cash flow was $3.215 billion through the first three quarters of 2010, compared with $1.535 billion through the first three quarters of 2009. |
| § | The acquisition of Electro-Motive Diesel (EMD) was completed on August 2, 2010, and added $216 million to sales in the quarter but had little impact on profit. |
| § | Machinery and Engines debt-to-capital ratio was 39.1 percent at the end of the third quarter of 2010, compared to 49.5 percent at the end of the third quarter of 2009 and 47.2 percent at year-end 2009. |
2010 Outlook
| § | Caterpillar is raising its 2010 outlook for both sales and revenues and profit. |
| § | 2010 sales and revenues are now expected to be in the range of $41 to $42 billion, with a midpoint of $41.5 billion. The previous range was $39 to $42 billion, with a midpoint of $40.5 billion. The increase in the sales and revenues outlook is a result of the inclusion of EMD and continuing improvement in sales volume. |
| § | The revised 2010 profit outlook is a range of $3.80 to $4.00 per share, with a midpoint of $3.90 per share—an increase of 11 percent from the midpoint of the previous outlook. The previous range was $3.15 to $3.85 per share, with a midpoint of $3.50 per share. |
| § | The increase in the profit outlook is primarily due to the improvement in sales (excluding EMD), the continuing focus on cost management and lower taxes, partially offset by higher provisions for incentive pay. |
Preliminary Outlook for 2011 Sales and Revenues
| § | Economic growth in developing countries and weak, but continued, growth in the developed world should result in Caterpillar sales and revenues that approach $50 billion in 2011. |
Page 5
DETAILED ANALYSIS
Third Quarter 2010 vs. Third Quarter 2009
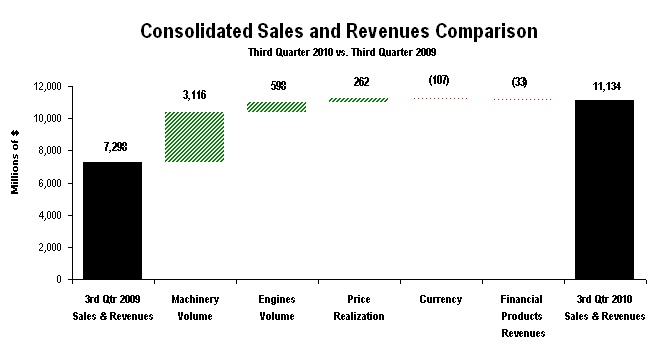 |
| The chart above graphically illustrates reasons for the change in Consolidated Sales and Revenues between third quarter 2009 (at left) and third quarter 2010 (at right). Items favorably impacting sales and revenues appear as upward stair steps with the corresponding dollar amounts above each bar, while items negatively impacting sales and revenues appear as downward stair steps with dollar amounts reflected in parentheses above each bar. The bar entitled Machinery Volume includes EMD sales. Caterpillar management utilizes these charts internally to visually communicate with the company’s Board of Directors and employees. |
Sales and Revenues
Sales and revenues for the third quarter of 2010 were $11.134 billion, up $3.836 billion, or 53 percent, from the third quarter of 2009. Machinery sales volume was up $3.116 billion due to higher end-user demand and the absence of dealer inventory reductions that occurred in the third quarter of 2009. Engines sales volume increased $598 million. Price realization improved $262 million, and currency had a negative impact on sales of $107 million. Financial Products revenues decreased $33 million primarily due to lower average earning assets.
Our integrated service businesses tend to be more stable through the business cycle than new machines and engines. Third-quarter 2010 sales and revenues for these businesses were higher compared to the third quarter of 2009. However, with the increase in sales of new machines and engines this quarter, integrated service businesses represented a lower percent of total company sales and revenues than the prior period. These businesses represented about 39 percent of total company sales and revenues in the third quarter of 2010, down from about 50 percent in the third quarter of 2009.
Page 6
Sales and Revenues by Geographic Region | ||||||||||||||||||||||||||||||||||||||||
(Millions of dollars) | Total | % Change | North America | % Change | Latin America | % Change | EAME | % Change | Asia/ Pacific | % Change | ||||||||||||||||||||||||||||||
| Third Quarter 2010 | ||||||||||||||||||||||||||||||||||||||||
| Machinery | $ | 7,201 | 84 | % | $ | 2,811 | 89 | % | $ | 1,165 | 121 | % | $ | 1,409 | 60 | % | $ | 1,816 | 81 | % | ||||||||||||||||||||
Engines 1 | 3,251 | 21 | % | 1,044 | 26 | % | 519 | 71 | % | 1,059 | 11 | % | 629 | 6 | % | |||||||||||||||||||||||||
Financial Products 2 | 682 | (5 | ) | % | 393 | (6 | ) | % | 75 | 6 | % | 102 | (17 | ) | % | 112 | 9 | % | ||||||||||||||||||||||
| $ | 11,134 | 53 | % | $ | 4,248 | 55 | % | $ | 1,759 | 95 | % | $ | 2,570 | 31 | % | $ | 2,557 | 51 | % | |||||||||||||||||||||
| Third Quarter 2009 | ||||||||||||||||||||||||||||||||||||||||
| Machinery | $ | 3,904 | $ | 1,490 | $ | 527 | $ | 882 | $ | 1,005 | ||||||||||||||||||||||||||||||
Engines 1 | 2,679 | 828 | 303 | 957 | 591 | |||||||||||||||||||||||||||||||||||
Financial Products 2 | 715 | 418 | 71 | 123 | 103 | |||||||||||||||||||||||||||||||||||
| $ | 7,298 | $ | 2,736 | $ | 901 | $ | 1,962 | $ | 1,699 | |||||||||||||||||||||||||||||||
| 1 | Does not include internal engines transfers of $669 million and $370 million in third quarter 2010 and third quarter 2009, respectively. Internal engines transfers are valued at prices comparable to those for unrelated parties. |
| 2 | Does not include internal revenues earned from Machinery and Engines of $67 million and $73 million in third quarter 2010 and third quarter 2009, respectively. |
Machinery Sales
Sales were $7.201 billion, an increase of $3.297 billion, or 84 percent, from the third quarter of 2009.
| § | Excluding EMD sales of $216 million, sales volume increased $2.900 billion. |
| § | Price realization increased $229 million. |
| § | Currency decreased sales by $48 million. |
| § | Geographic mix between regions (included in price realization) was $21 million favorable. |
| § | Dealers reported a small increase in inventories during the quarter compared to about a $1.1 billion reduction in the third quarter of 2009. |
| § | Deliveries to end users, as reported by dealers, was the most significant factor in our growth in sales volume. The improvement was from depressed levels in 2009. |
| § | Inventories were lower than last year in both dollars and months of supply. Months of supply were also below the historical average. |
| § | Developing countries accounted for about half the growth in sales volume. Construction increased in many countries in response to continuing economic recoveries. Higher metals and energy prices led to increased output of those commodities which was positive for mining-related sales. |
| § | Dealer deliveries in developed countries improved even though construction activity remained weak. We believe the improvement is a result of customers replacing some aging equipment. This follows a weak 2009, when end users reduced machine purchases below historic fleet replenishment rates. However, despite higher deliveries this year, we estimate existing fleet capabilities continued to deteriorate. |
| § | Machine sales to dealers for use in rental fleets increased. However, the average age of rental fleets has not improved, and rental utilization has continued to increase. |
Page 7
North America – Sales increased $1.321 billion, or 89 percent.
| § | Excluding EMD sales of $77 million, sales volume increased $1.147 billion. |
| § | Price realization increased $97 million. |
| § | Dealer-reported inventories were about flat during the quarter, compared with a nearly $500 million reduction in the third quarter of 2009. Dealer inventories in dollars were well below last year, and months of supply were below the historical average. |
| § | An increase in deliveries to end users, as reported by dealers, accounted for more than half the volume growth. More favorable economic environments in both the United States and Canada, including increased output in some key mining industries, encouraged buying. |
| § | We do not believe that reported deliveries, although higher than last year’s depressed levels, offset the depletion rates of end-user and dealer-rental fleets. |
| § | Sales of machines typically used in housing and nonresidential building more than doubled from the third quarter of 2009, despite weak construction activity in the United States. |
| § | Construction in Canada was stronger, with housing starts up 22 percent and nonresidential permits up 22 percent. Unemployment declined, and new home prices rebounded to near the 2008 peak. |
| § | Spending and contracting for highway construction declined in the United States as increased government funding did not offset reductions in state and local government investment spending. |
| § | Sales of large mining machines increased significantly from last year’s depressed levels, benefiting from better metals and coal prices. Copper prices increased 24 percent, gold rose 28 percent, and Central Appalachian coal was up 37 percent. |
| § | In the United States, metals mining increased 12 percent and coal production increased 2 percent. Coal exports were up 55 percent in July, and an increase in electricity production of 6 percent resulted in higher coal consumption. |
| § | In Canada, coal production increased 14 percent in July, and metals mining was up 34 percent. |
| § | U.S. nonmetals mining and quarrying increased 7 percent, and Canadian production increased 1 percent. These production gains helped increase sales of quarry products. |
Page 8
Latin America – Sales increased $638 million, or 121 percent.
| § | Excluding EMD sales of $2 million, sales volume increased $574 million. |
| § | Price realization increased $49 million. |
| § | Currency benefited sales by $13 million. |
| § | Dealers reported stable inventories during the quarter compared to a drawdown last year. This change contributed to the growth in sales volume. |
| § | Dollar inventories and months of supply ended the quarter higher than a year earlier. Months of supply were below the historical average. |
| § | Dealers reported higher deliveries to end users, which accounted for most of the sales volume growth. Low interest rates in many countries allowed economic recoveries to develop, and industrial production returned to near pre-recession peaks. |
| § | Higher commodity prices benefited both oil and mining production. Regional oil production increased more than 3 percent, and drill rig activity grew 10 percent. Brazil increased mining output 10 percent, Chile 4 percent and Mexico 6 percent. |
| § | Economic recoveries led to increased construction. Permits rose 4 percent in Argentina, 11 percent in Chile and 20 percent in Colombia. Brazilian construction employment increased 27 percent. |
EAME – Sales increased $527 million, or 60 percent.
| § | Excluding EMD sales of $97 million, sales volume increased $490 million. |
| § | Price realization increased $5 million. |
| § | Currency decreased sales by $65 million. |
| § | Dealer-reported inventories were about flat during the quarter, compared with a reduction of about $250 million in the third quarter of 2009. This change contributed to sales volume growth. |
| § | Both dollar inventories and the months of supply were well below the third quarter of 2009. Months of supply were below the historical average. |
| § | Sales volume increased in Europe largely due to increased deliveries to end users, as reported by dealers. The European economy continued to recover in the third quarter, with industrial production up 4 percent in the Euro-zone and 7 percent in the United Kingdom. Construction increased in response to low interest rates, increased lending for home purchases and higher capacity utilization. |
| § | Africa/Middle East was the largest contributor to sales volume growth. Sales to oil producing countries increased in response to increases in oil production and oil prices. |
| § | Economic recoveries led to volume growth in both South Africa and Turkey. Residential building construction improved in South Africa, and construction spending increased in Turkey. |
| § | Volume growth in the CIS was concentrated in Russia. Positive factors included lower interest rates, increased government spending on housing and transportation and higher oil revenues. |
Page 9
Asia/Pacific – Sales increased $811 million, or 81 percent.
| § | Excluding EMD sales of $40 million, sales volume increased $710 million. |
| § | Price realization increased $57 million. |
| § | Currency benefited sales by $4 million. |
| § | Dealer-reported inventories increased, which contrasted with a drawdown during the third quarter of 2009. This change accounted for more than half the growth in sales volume. |
| § | Inventories were higher than a year earlier in dollars, but months of supply declined. Months of supply were below the historical average. |
| § | Most countries continued economic recoveries, the result of low interest rates, increased liquidity and growing exports. Industrial production has surpassed pre-recession peaks in Australia, China, India, Indonesia, South Korea and the Philippines. Sales increased in nearly all countries in the region. |
| § | China had a large increase in sales volume, benefiting from more than 10-percent growth in the economy and 18-percent credit growth. Coal mining, housing construction and nonresidential construction were all up. Home prices increased 12 percent despite government restrictions on home ownership. |
| § | The mining industry was a major contributor to volume growth in Australia. Coal prices rose 31 percent, and metals prices increased 8 percent. Mining companies increased employment 20 percent to improve output. |
| § | Sales volume increased in Indonesia due to growth in construction and mining. Indonesia, the world’s largest thermal coal exporter, is increasing production in response to higher prices. |
| § | India increased interest rates to slow inflation, but liquidity expanded by 18 percent. As a result, construction increased 8 percent, and mining output rose 8 percent, leading to higher sales volume. |
Page 10
Engines Sales
Sales were $3.251 billion, an increase of $572 million, or 21 percent, from the third quarter of 2009.
| § | Sales volume increased $598 million. |
| § | Price realization increased $33 million. |
| § | Currency decreased sales by $59 million. |
| § | Geographic mix between regions (included in price realization) was $3 million favorable. |
| § | Dealer inventories and months of supply were down from the third quarter of 2009. |
North America – Sales increased $216 million, or 26 percent.
| § | Sales volume increased $199 million. |
| § | Price realization increased $17 million. |
| § | Sales for industrial applications increased 56 percent due to higher sales to Original Equipment Manufacturers (OEMs) and higher demand in construction. |
| § | Sales for electric power applications increased 81 percent primarily due to increased sales into dealer rental fleets and dealer inventory replenishment. |
| § | Sales for petroleum applications decreased 6 percent as lower turbine sales were partially offset by increased sales into well service. |
Latin America – Sales increased $216 million, or 71 percent.
| § | Sales volume increased $211 million. |
| § | Price realization increased $2 million. |
| § | Currency increased sales by $3 million. |
| § | Sales for petroleum applications increased 72 percent due to higher turbine sales from one large order. |
| § | Sales of electric power applications increased 118 percent due to higher turbine sales from one large order and improvements in industry demand. |
| § | Sales for marine and industrial applications were about flat. |
EAME – Sales increased $102 million, or 11 percent.
| § | Sales volume increased $136 million. |
| § | Price realization increased $16 million. |
| § | Currency decreased sales by $50 million. |
| § | Sales for electric power applications increased 33 percent primarily due to higher demand throughout the region, partially offset by lower turbine sales. |
| § | Sales for industrial applications increased 62 percent due to higher demand in construction and agricultural applications. |
| § | Sales for petroleum applications decreased 13 percent primarily due to lower turbine sales partially offset by slightly higher demand for engines used in production applications and land-based drilling. |
| § | Sales for marine applications decreased 45 percent due to weak industry demand and a declining order backlog. |
Page 11
Asia/Pacific – Sales increased $38 million, or 6 percent.
| § | Sales volume increased $55 million. |
| § | Price realization decreased $5 million. |
| § | Currency decreased sales by $12 million. |
| § | Sales for electric power applications increased 29 percent primarily due to higher demand throughout the region, partially offset by lower turbine sales. |
| § | Sales for industrial applications increased 85 percent primarily due to higher demand from OEMs. |
| § | Sales for petroleum applications were about flat as higher sales into China land-based drilling offset lower turbine sales. |
| § | Sales for marine applications decreased 24 percent due to weak industry demand, partially offset by higher sales for workboat and general cargo vessels. |
Financial Products Revenues
Revenues were $682 million, a decrease of $33 million, or 5 percent, from the third quarter of 2009.
| § | Revenues decreased $44 million due to a decrease in average earning assets and $9 million due to the unfavorable impact of lower interest rates on new and existing finance receivables. |
| § | Other revenues at Cat Financial increased $25 million, driven by a $24 million favorable change from returned and repossessed equipment. |
Page 12
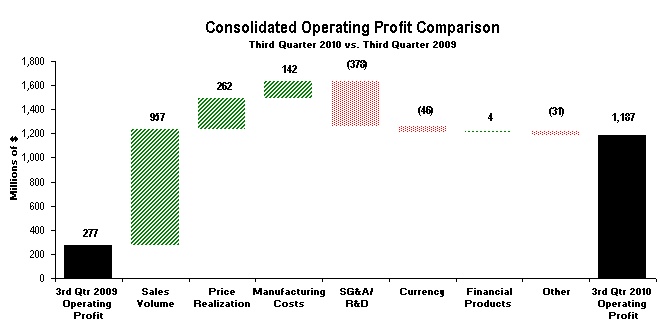 |
The chart above graphically illustrates reasons for the change in Consolidated Operating Profit between third quarter 2009 (at left) and third quarter 2010 (at right). Items favorably impacting operating profit appear as upward stair steps with the corresponding dollar amounts above each bar, while items negatively impacting operating profit appear as downward stair steps with dollar amounts reflected in parentheses above each bar. Caterpillar management utilizes these charts internally to visually communicate with the company’s Board of Directors and employees. The bar entitled Other includes the operating profit impact of EMD and consolidating adjustments and Machinery and Engines other operating (income) expenses. |
Operating Profit
Operating profit in the third quarter of 2010 was $1,187 million compared to $277 million in the third quarter of 2009. The improvement was primarily the result of higher sales volume, which includes the impact of an unfavorable mix of products, better price realization and lower manufacturing costs. The improvements were partially offset by higher selling, general and administrative (SG&A) and research and development (R&D) expenses and an unfavorable impact of currency.
Manufacturing costs improved $142 million primarily due to variable labor and burden efficiencies and lower warranty and material costs, partially offset by the absence of $120 million of LIFO inventory decrement benefits.
SG&A and R&D expenses increased by $378 million primarily due to provisions related to incentive pay and increased expense to support new product development programs, including those related to emissions requirements.
Currency had a $46 million negative impact on operating profit as the negative impact on sales more than offset the benefit to costs.
| Operating Profit (Loss) by Principal Line of Business | |||||||||||||||
| (Millions of dollars) | Third Quarter 2010 | Third Quarter 2009 | $ Change | % Change | |||||||||||
Machinery 1 | $ | 615 | $ | (124 | ) | $ | 739 | — | 2 | ||||||
Engines 1 | 531 | 370 | 161 | 44 | % | ||||||||||
| Financial Products | 96 | 92 | 4 | 4 | % | ||||||||||
| Consolidating Adjustments | (55 | ) | (61 | ) | 6 | ||||||||||
| Consolidated Operating Profit (Loss) | $ | 1,187 | $ | 277 | $ | 910 | 329 | % | |||||||
| 1 | Caterpillar operations are highly integrated; therefore, the company uses a number of allocations to determine lines of business operating profit for Machinery and Engines. |
| 2 | Because the third quarter of 2009 was a loss for Machinery, the percent change is not meaningful. |
Page 13
Operating Profit/Loss by Principal Line of Business
| § | Machinery operating profit was $615 million compared to an operating loss of $124 million in the third quarter of 2009. Positive factors included higher sales volume, which included the impact of an unfavorable mix of products, improved price realization and lower manufacturing costs (despite the absence of LIFO decrement benefits). These improvements were partially offset by higher SG&A and R&D expenses. |
| § | Engines operating profit of $531 million was up $161 million from the third quarter of 2009. Higher sales volume and improved manufacturing costs were partially offset by higher SG&A and R&D expenses. |
| § | Financial Products operating profit of $96 million was up $4 million, or 4 percent, from the third quarter of 2009. The increase was primarily attributable to a $24 million favorable change from returned or repossessed equipment and an $8 million decrease in the provision for credit losses at Cat Financial, partially offset by a $17 million unfavorable impact from lower average earning assets and $9 million due to incentive pay. |
Other Profit/Loss Items
| § | Interest expense excluding Financial Products decreased $6 million from the third quarter of 2009. |
| § | Other income/expense was income of $1 million compared with income of $66 million in the third quarter of 2009. The decrease was primarily driven by an unfavorable impact from currency exchange gains and losses. |
| § | The provision for income taxes of $295 million in the third quarter of 2010 reflects an estimated annual effective tax rate of 28 percent, which is expected to be less than the U.S. tax rate of 35 percent primarily due to profits in tax jurisdictions with rates lower than the U.S. rate. The provision for income taxes in the third quarter of 2010 also includes a $14 million benefit related to the decrease in the 2010 estimated annual tax rate from 29 to 28 percent. The 2010 estimated annual tax rate is based on current tax law and therefore does not include the U.S. research and development tax credit and other benefits that have not been extended past 2009. The benefit for income taxes in the third quarter of 2009 was $139 million, which included $129 million of benefits related to prior-year tax returns. |
| § | Equity in profit/loss of unconsolidated affiliated companies was a loss of $7 million compared with profit of $1 million in the third quarter of 2009. The change is primarily related to start-up expenses from NC2 Global LLC, our joint venture with Navistar. |
| § | Profit/loss attributable to noncontrolling interests negatively impacted profit by $21 million from the third quarter of 2009, primarily due to improved financial performance of Caterpillar Japan Ltd. (Cat Japan). We own two-thirds of Cat Japan, meaning one-third of its profits or losses are attributable to our partner, Mitsubishi Heavy Industries. |
Page 14
Employment
Caterpillar's worldwide employment was 102,336 at the end of the third quarter of 2010, including about 2,300 full-time employees from our acquisition of EMD. Year to date we have added about 6,200 full-time employees primarily due to increases in production.
In addition to the increase in full-time employees, our flexible workforce, made up of agency workers and part-time and temporary Caterpillar employees, has increased by about 9,000 people so far this year.
Outlook
2010 Economic Outlook
Global industrial production continued strong growth in the third quarter, and we expect few changes in the fourth quarter. Metals prices have strengthened, with some hitting new highs for the year. Crude oil and coal prices also trended upward. We anticipate that commodity prices will remain attractive for new investment this year.
Overall, we expect the world economy will grow more than 3.5 percent in 2010 with developing economies at about 7 percent and developed economies slightly more than 2 percent.
Developed Economies
| § | The major developed economies—United States, Euro-zone and Japan—are recovering slowly from the worst postwar recession. Economic growth has been insufficient to offset productivity gains, and unemployment remains a serious concern. |
| § | With unemployment high and inflation near historical lows, central banks are reluctantly considering additional stimulus. The Bank of Japan has recently announced new stimulus measures, and we expect the U.S. Federal Reserve Bank will increase liquidity in the fourth quarter. We anticipate the European Central Bank will hold its current policy through year end, although turmoil in government debt markets could result in additional government bond purchases. |
| § | Business investment has generally fared better than consumer spending due to profit growth and the need to restore investment that was cut during the recession. We expect business investment, particularly in equipment, to continue in the fourth quarter. |
| § | For 2010 we expect the U.S. economy to grow 2.5 percent, Europe slightly more than 1.5 percent and Japan almost 3 percent. |
Developing Economies
| § | Industrial production has grown rapidly in 2010, and for many countries it has increased more than 10 percent. Several countries, primarily in Asia, have already exceeded pre-recession peaks. |
| § | While robust growth has increased inflation, it is well below peaks reached before the recession in nearly all countries. We do not believe inflation is a serious threat to growth in 2010. |
| § | Less than half of major developing countries have raised interest rates, and most rate increases were less than one percentage point and have left rates well below pre-recession peaks. |
| § | We anticipate few changes in interest rates in the fourth quarter. Low rates, along with recoveries in exports, should result in the best year for growth in developing economies since 2007. |
Page 15
| § | Asia/Pacific economies are expected to continue as the fastest growing in the world, with growth of 8.5 percent this year. The outlook incorporates 10.5 percent growth in China, 8.5 percent in India and about 6 percent in Indonesia. |
| § | In other regions, our outlook assumes 4.5 percent growth in both Africa/Middle East and CIS and 5.5 percent in Latin America. |
2011 Preliminary Economic Outlook
We anticipate the world economy will continue its recovery in 2011, with growth exceeding 3.5 percent.
| § | We expect growth in the world’s developed economies to be about 2.5 percent in 2011. Such growth is unlikely to be sufficient to generate significant job growth, so we expect that unemployment will persist as the dominant economic problem in developed economies. |
| § | Bank lending in the United States and the Euro-zone generally declined throughout 2010 as a result of tight lending standards and the desire by both consumers and businesses to reduce debt. Central bank liquidity additions should enable banks to ease credit standards and increase lending. These central bank policies, coupled with continued low interest rates, should improve economic growth in 2011. Our outlook reflects 3-percent growth in the United States, almost 2 percent in Europe and 2.5 percent in Japan. |
| § | Overall, developing economies are expected to continue to grow in 2011. Many will likely raise interest rates further but keep them well below 2008 highs. Overall, we expect growth in developing economies to be about 6.5 percent. |
| § | Asia/Pacific is likely to continue as the fastest growing region in the world with growth at about 7.5 percent. We expect growth in China to moderate in 2011 to about 9.5 percent, reflecting government efforts to reduce inflation. Growth in the other two large economies in the region, India and Indonesia, should average about 8.5 percent and 6 percent, respectively—about the same as in 2010. |
| § | Latin American countries, particularly Brazil, have been more aggressive in raising interest rates, and we expect further increases in 2011. As a result, economic growth should slow to slightly more than 4 percent, but is expected to remain favorable for our business. |
| § | Both Africa/Middle East and CIS were somewhat slower to recover than other developing regions. Few countries raised interest rates in 2010, and some countries reduced rates in 2010. As a result, we expect growth in both regions to improve to about 5 percent. |
| § | Demand for metals, coal, gas and oil should increase, with some upward pressure on prices. Our assumptions for average 2011 prices are $3.50 per pound for copper, $85 per barrel for West Texas Intermediate crude oil, $67 per ton for Central Appalachian coal and $5.20 per million BTUs for natural gas. These prices, as well as prices for most other commodities, will encourage companies to expand production and investment. |
| § | Construction spending is expected to increase in developing economies to keep pace with economic growth, and construction activity in developed economies is also expected to begin to recover. |
Economic Risks
| § | Our major concern is that central banks in developed countries will remain too cautious, either by providing too little liquidity or trying to remove it too quickly. We believe these economies are fragile and will need a long period of growth to repair damage from the severe downturn. |
| § | High unemployment is undermining public support for open trade. If recognizable progress does not occur in reducing unemployment, governments may impose restrictions on imports that would disrupt world trade. |
Page 16
| § | Governments in several developed countries have started pursuing deep reductions in budget deficits. Those actions could disrupt economic recoveries, particularly if central banks begin tightening their policies. Not much more than a year ago, governments launched massive spending programs to help cope with their worst postwar recessions. Recoveries from those recessions are far from complete. |
2010 Outlook for Sales and Revenues and Profit per Share
The outlook for sales and revenues is a range of $41 to $42 billion, up from the previous forecast of $39 to $42 billion. The increase in the midpoint of the outlook is a result of the acquisition of EMD, which added about $500 million, continuing improvement in end-user demand and higher price realization.
Profit is expected to be in a range of $3.80 to $4.00 per share, with a midpoint of $3.90. The previous outlook anticipated profit in a range of $3.15 to $3.85 per share with a midpoint of $3.50 per share. The increase in the profit outlook is primarily due to the improvement in sales (excluding EMD), the continuing focus on cost management and lower taxes, partially offset by higher provisions for incentive pay.
2011 Preliminary Outlook for Sales and Revenues
Good economic growth in developing countries and weak, but continued, growth in the developed world should result in Caterpillar sales and revenues that approach $50 billion in 2011. Key points related to our preliminary outlook for sales and revenues include:
| § | Demand has outpaced sales in 2010, with production and sales ramping up throughout the year. At the midpoint of the 2010 outlook, sales and revenues for the second half are expected to be about $23 billion. That reflects an annualized run rate for the second half of 2010 near $46 billion. |
| § | Demand for new machines is expected to continue with strong growth in developing countries and moderate growth in the developed world. |
| § | Demand for engines is also expected to improve, but at a slower rate than machines. |
| § | Dealers will likely need to add to new machine and rental inventories as the overall industry improves. |
| § | The full-year impact of EMD sales is expected to add about $1.0 billion. |
| § | Emissions-related price increases will begin in 2011 for machines in the United States and Europe. However, price realization, excluding emissions, will be modest and will likely be less than one percent. |
QUESTIONS AND ANSWERS
| Q1: | Much of the increase in your 2010 sales has been driven by growth in the developing world. Can you comment on what you've seen recently and expectations for the remainder of 2010 and in 2011? |
| A: | The latest economic data indicates that developing countries continue to grow strongly, with both construction and mining activity increasing. Interest rate increases so far have been modest and have left rates well below prior peaks. We expect economic growth in these countries will continue, but at a somewhat slower pace than 2010, and sectors important for our businesses will continue to improve. |
Page 17
| Q2: | You’ve recently reported dealer statistics that indicate significant increases in dealer machine sales to end users in North America. How can sales to end customers be up so much at a time when economic growth in North America is weak? |
| A: | Replacement of worn-out equipment is an important driver of new machine sales, which have been declining in North America since mid-2006. In 2009, customers cut purchases sharply causing deterioration of their fleets. Fleets shrank in size, and average ages of machines increased. This year, users are increasing purchases to slow the rate of deterioration. In addition, mine output has been increasing in response to better prices, largely a result of better economic growth outside North America. |
| Q3: | Over the past quarter there has been continuing concern about economic growth in Europe as a result of sovereign debt issues and the potential for tighter fiscal policy in some European countries. What have you seen in your business in Europe, and what do you expect over the next year? |
| A: | The economies of the 27 countries in the European Union grew at a 4.2 percent annual rate in the second quarter and surveys, leading indicators and industrial production indicate further growth in the third quarter and beyond. Our sales in Europe improved from the second quarter. We expect the European economy to continue modest growth through 2011, with construction spending improving. |
| Q4: | Can you comment on your 2010 and 2011 expectations for housing construction in the United States? What does your revised 2010 outlook assume for U.S. housing starts? |
| A: | Housing starts in the United States averaged a 603,000 unit annual rate in the first nine months of 2010, up 9 percent from the same 2009 period. Permits averaged slightly higher. Housing units available for sale, along with those under construction, are the lowest since at least 1970. Housing affordability is near a record high, and we expect additional U.S. Federal Reserve actions to support economic growth will help the housing construction market. We expect starts will range from 600,000 to 620,000 units this year and could be up to 800,000 units in 2011. |
| Q5: | Given the extent of inventory declines in 2009 and your outlook for higher sales in 2010, how is the supply base responding? |
| A: | Our production of new equipment has increased significantly in 2010. In general, our suppliers have done a good job supporting the ramp up in production. Our production of new machines in the third quarter of 2010 was more than double the third quarter of 2009. Many of our suppliers have seen even more dramatic increases as a result of declining Caterpillar inventory levels in 2009. It has been a significant effort for suppliers to ramp up production to meet the needs of Caterpillar and our customers. We anticipated significant increases for 2010 and began actively collaborating with major suppliers late in 2009, and given the magnitude of the volume increase, the ramp up has gone well. |
| Q6: | Can you comment on the status of your 2010 production ramp up for mining products? Were you able to raise production in the third quarter? Also, will your recently announced mining capacity expansions have an impact on production in 2011? |
| A: | Factory production of our mining and related support equipment increased by more than 25 percent in the third quarter compared with the second quarter of 2010. We are implementing capital investment plans as previously announced, which will increase our production capability in 2011 relative to 2010. |
Page 18
| Q7: | Inventory changes related to new machines and engines had a significant negative impact on your sales in 2009. What’s happened to dealer inventories so far this year, and what are your expectations for the fourth quarter and in 2011? |
| A: | Dealer-machine inventories have remained about flat through the first half of 2010 and increased slightly in the third quarter. Dealer-machine inventories at the end of the third quarter were up about $120 million from year-end 2009. Based on the outlook for 2010 and the preliminary outlook for 2011 it is likely that dealers will need to add some new machine inventory. |
| Q8: | Does your preliminary outlook for 2011 sales and revenues include price increases for products designed to meet emissions regulations? |
| A: | Yes. We've announced price increases for products designed to meet EPA Tier 4 Interim emissions requirements in the United States and Stage IIIB in the European Union. The increases impact products over 130KW in the United States and between 130KW and 560KW in Europe. Price increases are a result of additional costs related to achieving these standards. While we are implementing emissions-related price increases, the majority of our sales are not being impacted in 2011. For example, products below 130KW, all sales outside the United States and Europe and almost all of our integrated services businesses are not affected. In 2011, emissions-related increases will vary by product in a range from 2 to 6 percent, including those products using transitional provisions. On February 11, 2010, we announced that Tier 4 Interim emissions-related increases could be as much as 12 percent for machines, and to minimize the impact on dealers and customers, the increase would be spread across product families and over multiple years. |
| Q9: | Can you comment on expense related to your short-term incentive compensation plans? Did it increase in the third quarter because you raised the full-year profit outlook? |
| A: | Yes. Short-term incentive compensation expense increases as our financial performance improves. As a result of aggressive financial performance targets in 2009 and the impact of the global recession, short-term incentive compensation plans that were tied to corporate results did not meet the earnings threshold for payouts, and no expense was incurred last year. The midpoint of the current profit outlook for 2010 would result in about $700 million of short-term incentive compensation in 2010. That’s an increase from the previous estimate of about $600 million. About three quarters of the $700 million was recorded through the third quarter of 2010. About $90 million was recorded in the first quarter, $210 million in the second quarter and about $225 million in the third quarter. The midpoint of the 2010 profit outlook would result in approximate ly $175 million of expense in the fourth quarter. |
| Q10: | Can you discuss tax expense in the third quarter of 2010? Also, does your outlook reflect an extension of the U.S. R&D tax credit? |
| A: | The third-quarter provision for income taxes reflects an estimated annual effective tax rate of 28 percent, a decrease from the second quarter rate of 29 percent. The decrease is primarily attributable to a more favorable expected geographic mix of profits from a tax perspective. Our outlook and estimated annual effective tax rate are based on currently enacted tax law. An extension of U.S. tax benefits that expired at the end of 2009, including the research and development tax credit, would be reflected in our outlook and estimated annual tax rate only upon enactment. The U.S. active finance exception for interest earned offshore also expired at the end of 2009, but will have a more significant impact on our 2011 tax rate. Without extension of this legislation, we are forecasting an increase in our 2011 tax rate due to higher U.S. taxes on interest earned outside the United States. |
Page 19
| Q11: | Have you increased employment levels as a result of improving business conditions? Do you plan to continue to increase employment in 2010 and 2011? |
| A: | Employment needs are linked to business conditions and production volume. We have raised production schedules in most facilities, and we expect to selectively increase employment in 2010 and 2011 as a result. Year to date, we have added about 6,200 full-time employees primarily due to increases in production. In addition, we have added about 2,300 full-time employees from our acquisition of EMD. Our flexible workforce, made up of agency workers as well as part-time and temporary Caterpillar employees, has increased by about 9,000 people so far this year. The strength of recovery will vary significantly among product type, industry served and geography. Currently we are seeing faster recovery in Asia and Latin America. So, prospects for employment increases in 2010 and 2011 are best for facilities in those regions. In addition, we expect t o add employees at several facilities in the United States where a substantial portion of the production is exported. |
| Q12: | You provided a preliminary 2011 outlook for sales and revenues, but not profit. Why not? |
| A: | Our annual planning process starts with our view of the economy and the industries we serve. Our sales and revenues outlook is based on that and is a key input in operational planning—production, resource needs and costs. We are far enough along in our annual planning process to provide an economic and sales and revenues outlook, but have more work to do to complete our profit outlook for 2011. That said, we do expect some cost headwinds as we move into 2011. We expect increased pension and retiree medical expense primarily as a result of lower discount rates and higher R&D expense related to emissions, and we expect our effective tax rate will increase. |
| Q13: | Can you comment on your financial position at the end of the third quarter? |
| A: | Caterpillar's financial position continued to strengthen in the third quarter. The M&E debt-to-capital ratio was 39.1 percent at the end of the third quarter, compared to 49.5 percent at the end of the third quarter of 2009 and 41.9 percent at the end of the second quarter of 2010. The liquidity position also remained strong with total cash on a consolidated basis of $2.3 billion. The consolidated quarter-end cash position of $2.3 billion is after M&E cash of $0.9 billion was used to fund the acquisition of EMD during the quarter. |
| Q14: | You announced pension plan changes in the third quarter. How did the changes impact your financial position? Do you expect more equity adjustments by year-end 2010? |
| A: | Due to the announced change to Caterpillar’s U.S. support and management pension plan designed to migrate from a defined benefit to a defined contribution plan, accounting rules require that we remeasure the liability for this plan. Although the plan change itself had little impact, a decrease in the discount rate and lower than expected asset returns resulted in a reduction to equity of approximately $800 million in the third quarter. Every year, all pension and retiree medical plans are remeasured at year end. Based on discount rates and plan asset values as of September 30, 2010, we anticipate an additional equity reduction of approximately $1.0 billion at year end. The actual adjustment will depend on several factors including the discount rate and actual return on plan assets as of December 31, 2010. |
Page 20
| Q15: | You announced the completion of your acquisition of Electro-Motive Diesel (EMD). What impact did that have on your third quarter? |
| A: | We acquired Electro-Motive Diesel on August 2, 2010, for approximately $925 million. The primary assets acquired were inventories ($550 million), intangible assets ($345 million), goodwill ($320 million), receivables ($185 million) and property, plant and equipment ($130 million). The primary liabilities assumed were accrued expenses ($160 million) and accounts payable ($125 million). The cash payment for the acquisition is reflected in the investing section of the Statement of Cash Flow. The consolidation of EMD added $216 million to third-quarter sales but was about neutral to profit. |
| Q16: | Give us an update on the quality of Cat Financial’s asset portfolio. How are past dues, credit losses and allowances? |
| A: | During the third quarter, overall portfolio quality continued to show signs of improvement. At the end of the third quarter of 2010, past dues were 4.88 percent, down from 5.33 percent at the end of the second quarter and 5.54 percent at the end of 2009. At the end of the third quarter of 2009, past dues were 5.79 percent. The reduction in past dues from year end is primarily due to the general improvement in global economic conditions. We expect past dues to gradually trend lower during the remainder of 2010. Bad debt write-offs, net of recoveries, were $78 million for the third quarter of 2010, up $13 million from the third quarter of 2009. The increase in write-offs reflects the lingering effect the economic downturn has had on some of our customers, most notably U.S. and European customers in the housing and general construction industries. Third quarter year-to-date 2010 annualized losses were 1.03 percent of the average retail portfolio, compared to 0.90 percent for the same period in 2009 and 1.03 percent for the full-year 2009. During the third quarter, Cat Financial's allowance for credit losses was reduced from 1.70 to 1.61 percent of net finance receivables. The reduction was the result of write-downs taken during the quarter for accounts that had been specifically identified as potential credit losses and included in the allowance account. By comparison, Cat Financial's allowance for credit losses was 1.62 percent of net finance receivables at the end of the third quarter of 2009 and 1.64 percent of net finance receivables at the end of 2009. The year-on-year allowance comparisons are impacted by new accounting guidance implemented during the first quarter of 2010 under which Cat Financial began consolidating securitized assets that had previously been off-balance sheet. On January 1, 2010, the consolidation of these assets had the impact of increasing the allowance for credit losses by $18 million and the total allowance as a percent of net finance receivables by 6 basis points. At the end of the third quarter of 2010, the allowance for credit losses totaled $367 million, compared with $377 million at December 31, 2009, and $381 million at the end of the third quarter of 2009. The decrease of $14 million in allowance for credit losses year-over-year reflected an $11 million decrease due to a reduction in the overall net finance receivable portfolio and a $3 million decrease associated with the lower allowance rate. |
Page 21
GLOSSARY OF TERMS
| 1. | Caterpillar Japan Ltd. (Cat Japan) – A Caterpillar subsidiary formerly known as Shin Caterpillar Mitsubishi Ltd. (SCM). SCM was a 50/50 joint venture between Caterpillar and Mitsubishi Heavy Industries Ltd. (MHI) until SCM redeemed one half of MHI's shares on August 1, 2008. Caterpillar now owns 67 percent of the renamed entity. We began consolidating Cat Japan in the fourth quarter of 2008. |
| 2. | Caterpillar Production System – The Caterpillar Production System is the common Order-to-Delivery process being implemented enterprise-wide to achieve our safety, quality, velocity, earnings and growth goals for 2010 and beyond. |
| 3. | Consolidating Adjustments – Eliminations of transactions between Machinery and Engines and Financial Products. |
| 4. | Currency – With respect to sales and revenues, currency represents the translation impact on sales resulting from changes in foreign currency exchange rates versus the U.S. dollar. With respect to operating profit, currency represents the net translation impact on sales and operating costs resulting from changes in foreign currency exchange rates versus the U.S. dollar. Currency includes the impact on sales and operating profit for the Machinery and Engines lines of business only; currency impacts on Financial Products revenues and operating profit are included in the Financial Products portions of the respective analyses. With respect to other income/expense, currency represents the effects of forward and option contracts entered in to by the company to reduce the risk of fluctuations in exchange rates and the net effect of changes in foreign currency exchange rates on our foreign currency assets and liabilities for consolidated results. |
| 5. | Debt-to-Capital Ratio – A key measure of financial strength used by both management and our credit rating agencies. The metric is a ratio of Machinery and Engines debt (short-term borrowings plus long-term debt) and redeemable noncontrolling interest to the sum of Machinery and Engines debt, redeemable noncontrolling interest and stockholders' equity. |
| 6. | EAME – Geographic region including Europe, Africa, the Middle East and the Commonwealth of Independent States (CIS). |
| 7. | Earning Assets – Assets consisting primarily of total finance receivables net of unearned income, plus equipment on operating leases, less accumulated depreciation at Cat Financial. |
| 8. | Engines – A principal line of business including the design, manufacture, marketing and sales of engines for Caterpillar machinery; electric power generation systems; marine, petroleum, construction, industrial, agricultural and other applications and related parts. Also includes remanufacturing of Caterpillar engines and a variety of Caterpillar machinery and engine components and remanufacturing services for other companies. Reciprocating engines meet power needs ranging from 10 to 21,800 horsepower (8 to more than 16 000 kilowatts). Turbines range from 1,600 to 30,000 horsepower (1 200 to 22 000 kilowatts). |
| 9. | Financial Products – A principal line of business consisting primarily of Caterpillar Financial Services Corporation (Cat Financial), Caterpillar Insurance Holdings, Inc. (Cat Insurance) and their respective subsidiaries. Cat Financial provides a wide range of financing alternatives to customers and dealers for Caterpillar machinery and engines, Solar gas turbines as well as other equipment and marine vessels. Cat Financial also extends loans to customers and dealers. Cat Insurance provides various forms of insurance to customers and dealers to help support the purchase and lease of our equipment. |
| 10. | Integrated Service Businesses – A service business or a business containing an important service component. These businesses include, but are not limited to, aftermarket parts, Cat Financial, Cat Insurance, Cat Logistics, Cat Reman, Progress Rail, OEM Solutions and Solar Turbine Customer Services. |
Page 22
| 11. | Latin America – Geographic region including Central and South American countries and Mexico. |
| 12. | LIFO Inventory Decrement Benefits – A significant portion of Caterpillar's inventory is valued using the last-in, first-out (LIFO) method. With this method, the cost of inventory is comprised of "layers" at cost levels for years when inventory increases occurred. A LIFO decrement occurs when inventory decreases, depleting layers added in earlier, generally lower cost, years. A LIFO decrement benefit represents the impact on profit of charging cost of goods sold with prior-year cost levels rather than current period costs. |
| 13. | Machinery – A principal line of business which includes the design, manufacture, marketing and sales of construction, mining and forestry machinery—track and wheel tractors, track and wheel loaders, pipelayers, motor graders, wheel tractor-scrapers, track and wheel excavators, backhoe loaders, log skidders, log loaders, off-highway trucks, articulated trucks, paving products, skid steer loaders, underground mining equipment, tunnel boring equipment and related parts. Also includes the design, manufacture, remanufacture, maintenance and services of rail-related products and logistics services for other companies. |
| 14. | Machinery and Engines (M&E) – Due to the highly integrated nature of operations, it represents the aggregate total of the Machinery and Engines lines of business and includes primarily our manufacturing, marketing and parts distribution operations. |
| 15. | Machinery and Engines Other Operating (Income) Expenses – Comprised primarily of gains/losses on disposal of long-lived assets, long-lived asset impairment charges, pension curtailment charges and employee redundancy costs. |
| 16. | Manufacturing Costs – Manufacturing costs exclude the impacts of currency and represent the volume-adjusted change for variable costs and the absolute dollar change for period manufacturing costs. Variable manufacturing costs are defined as having a direct relationship with the volume of production. This includes material costs, direct labor and other costs that vary directly with production volume such as freight, power to operate machines and supplies that are consumed in the manufacturing process. Period manufacturing costs support production but are defined as generally not having a direct relationship to short-term changes in volume. Examples include machinery and equipment repair, depreciation on manufacturing assets , facility support, procurement, factory scheduling, manufacturing planning and operations management. |
| 17. | Price Realization – The impact of net price changes excluding currency and new product introductions. Consolidated price realization includes the impact of changes in the relative weighting of sales between geographic regions. |
| 18. | Redundancy Costs – Costs related to employment reduction including employee severance charges, pension and other postretirement benefit plan curtailments and settlements and health care and supplemental unemployment benefits. |
| 19. | Sales Volume – With respect to sales and revenues, sales volume represents the impact of changes in the quantities sold for machinery and engines as well as the incremental revenue impact of new product introductions. With respect to operating profit, sales volume represents the impact of changes in the quantities sold for machinery and engines combined with product mix—the net operating profit impact of changes in the relative weighting of machinery and engines sales with respect to total sales. |
| 20. | 6 Sigma – On a technical level, 6 Sigma represents a measure of variation that achieves 3.4 defects per million opportunities. At Caterpillar, 6 Sigma represents a much broader cultural philosophy to drive continuous improvement throughout the value chain. It is a fact-based, data-driven methodology that we are using to improve processes, enhance quality, cut costs, grow our business and deliver greater value to our customers through black belt-led project teams. At Caterpillar, 6 Sigma goes beyond mere process improvement—it has become the way we work as teams to process business information, solve problems and manage our business successfully. |
Page 23
NON-GAAP FINANCIAL MEASURES
The following definition is provided for “non-GAAP financial measures” in connection with Regulation G issued by the Securities and Exchange Commission. These non-GAAP financial measures have no standardized meaning prescribed by U.S. GAAP and therefore are unlikely to be comparable to the calculation of similar measures for other companies. Management does not intend these items to be considered in isolation or substitutes for the related GAAP measures.
Machinery and Engines
Caterpillar defines Machinery and Engines as it is presented in the supplemental data as Caterpillar Inc. and its subsidiaries with Financial Products accounted for on the equity basis. Machinery and Engines information relates to the design, manufacture and marketing of our products. Financial Products information relates to the financing to customers and dealers for the purchase and lease of Caterpillar and other equipment. The nature of these businesses is different, especially with regard to the financial position and cash flow items. Caterpillar management utilizes this presentation internally to highlight these differences. We also believe this presentation will assist readers in understanding our business. Pages 28-33 reconcile Machinery and Engines wit h Financial Products on the equity basis to Caterpillar Inc. Consolidated financial information.
Caterpillar's latest financial results and current outlook are also available via:
| Telephone: | |
| (800) 228-7717 (Inside the United States and Canada) | |
| (858) 244-2080 (Outside the United States and Canada) | |
| Internet: | |
| http://www.cat.com/investor | |
http://www.cat.com/irwebcast (live broadcast/replays of quarterly conference call) | |
| Caterpillar contact: | |
| Jim Dugan | |
| Corporate Public Affairs | |
| (309) 494-4100 (Office) or (309) 360-7311 (Mobile) | |
mail to: Dugan_Jim@cat.com | |
Page 24
Caterpillar Inc. Condensed Consolidated Statement of Results of Operations (Unaudited) (Dollars in millions except per share data) | |||||||||||||||||||||
| Three Months Ended | Nine Months Ended | ||||||||||||||||||||
| September 30, | September 30, | ||||||||||||||||||||
| 2010 | 2009 | 2010 | 2009 | ||||||||||||||||||
| Sales and revenues: | |||||||||||||||||||||
| Sales of Machinery and Engines | $ | 10,452 | $ | 6,583 | $ | 27,726 | $ | 22,347 | |||||||||||||
| Revenues of Financial Products | 682 | 715 | 2,055 | 2,151 | |||||||||||||||||
| Total sales and revenues | 11,134 | 7,298 | 29,781 | 24,498 | |||||||||||||||||
| Operating costs: | |||||||||||||||||||||
| Cost of goods sold | 7,752 | 5,255 | 21,018 | 18,034 | |||||||||||||||||
| Selling, general and administrative expenses | 1,148 | 907 | 3,139 | 2,703 | |||||||||||||||||
| Research and development expenses | 510 | 327 | 1,362 | 1,066 | |||||||||||||||||
| Interest expense of Financial Products | 227 | 256 | 694 | 807 | |||||||||||||||||
| Other operating (income) expenses | 310 | 276 | 896 | 1,439 | |||||||||||||||||
| Total operating costs | 9,947 | 7,021 | 27,109 | 24,049 | |||||||||||||||||
| Operating profit | 1,187 | 277 | 2,672 | 449 | |||||||||||||||||
| Interest expense excluding Financial Products | 85 | 91 | 268 | 301 | |||||||||||||||||
| Other income (expense) | 1 | 66 | 114 | 293 | |||||||||||||||||
| Consolidated profit before taxes | 1,103 | 252 | 2,518 | 441 | |||||||||||||||||
| Provision (benefit) for income taxes | 295 | (139 | ) | 735 | (179 | ) | |||||||||||||||
| Profit of consolidated companies | 808 | 391 | 1,783 | 620 | |||||||||||||||||
| Equity in profit (loss) of unconsolidated affiliated companies | (7 | ) | 1 | (13 | ) | 1 | |||||||||||||||
| Profit of consolidated and affiliated companies | 801 | 392 | 1,770 | 621 | |||||||||||||||||
| Less: Profit (loss) attributable to noncontrolling interests | 9 | (12 | ) | 38 | (42 | ) | |||||||||||||||
Profit 1 | $ | 792 | $ | 404 | $ | 1,732 | $ | 663 | |||||||||||||
| Profit per common share | $ | 1.25 | $ | 0.65 | $ | 2.75 | $ | 1.08 | |||||||||||||
Profit per common share – diluted 2 | $ | 1.22 | $ | 0.64 | $ | 2.68 | $ | 1.07 | |||||||||||||
| Weighted-average common shares outstanding (millions) | |||||||||||||||||||||
| - Basic | 632.6 | 622.4 | 629.6 | 612.1 | |||||||||||||||||
- Diluted 2 | 651.6 | 635.5 | 647.0 | 620.6 | |||||||||||||||||
| Cash dividends declared per common share | $ | — | $ | — | $ | 0.86 | $ | 0.84 | |||||||||||||
| 1 | Profit attributable to common stockholders. |
| 2 | Diluted by assumed exercise of stock-based compensation awards using the treasury stock method. |
Page 25
Caterpillar Inc. Condensed Consolidated Statement of Financial Position (Unaudited) (Millions of dollars) | ||||||||||||
| September 30, | December 31, | |||||||||||
| 2010 | 2009 | |||||||||||
| Assets | ||||||||||||
| Current assets: | ||||||||||||
| Cash and short-term investments | $ | 2,265 | $ | 4,867 | ||||||||
| Receivables - trade and other | 7,395 | 5,611 | ||||||||||
| Receivables - finance | 7,933 | 8,301 | ||||||||||
| Deferred and refundable income taxes | 1,007 | 1,216 | ||||||||||
| Prepaid expenses and other current assets | 971 | 862 | ||||||||||
| Inventories | 9,006 | 6,360 | ||||||||||
| Total current assets | 28,577 | 27,217 | ||||||||||
| Property, plant and equipment – net | 12,065 | 12,386 | ||||||||||
| Long-term receivables - trade and other | 956 | 971 | ||||||||||
| Long-term receivables - finance | 11,966 | 12,279 | ||||||||||
| Investments in unconsolidated affiliated companies | 160 | 105 | ||||||||||
| Noncurrent deferred and refundable income taxes | 2,909 | 2,714 | ||||||||||
| Intangible assets | 824 | 465 | ||||||||||
| Goodwill | 2,634 | 2,269 | ||||||||||
| Other assets | 1,551 | 1,632 | ||||||||||
| Total assets | $ | 61,642 | $ | 60,038 | ||||||||
| Liabilities | ||||||||||||
| Current liabilities: | ||||||||||||
| Short-term borrowings: | ||||||||||||
| -- Machinery and Engines | $ | 223 | $ | 433 | ||||||||
| -- Financial Products | 3,384 | 3,650 | ||||||||||
| Accounts payable | 4,970 | 2,993 | ||||||||||
| Accrued expenses | 2,633 | 2,538 | ||||||||||
| Accrued wages, salaries and employee benefits | 1,471 | 797 | ||||||||||
| Customer advances | 1,470 | 1,217 | ||||||||||
| Dividends payable | — | 262 | ||||||||||
| Other current liabilities | 1,363 | 1,206 | ||||||||||
| Long-term debt due within one year: | ||||||||||||
| -- Machinery and Engines | 500 | 302 | ||||||||||
| -- Financial Products | 4,164 | 5,399 | ||||||||||
| Total current liabilities | 20,178 | 18,797 | ||||||||||
| Long-term debt due after one year: | ||||||||||||
| -- Machinery and Engines | 4,537 | 5,652 | ||||||||||
| -- Financial Products | 15,800 | 16,195 | ||||||||||
| Liability for postemployment benefits | 8,117 | 7,420 | ||||||||||
| Other liabilities | 2,678 | 2,674 | ||||||||||
| Total liabilities | 51,310 | 50,738 | ||||||||||
| Redeemable noncontrolling interest | 457 | 477 | ||||||||||
| Stockholders' equity | ||||||||||||
| Common stock | 3,757 | 3,439 | ||||||||||
| Treasury stock | (10,463 | ) | (10,646 | ) | ||||||||
| Profit employed in the business | 20,955 | 19,711 | ||||||||||
| Accumulated other comprehensive income (loss) | (4,412 | ) | (3,764 | ) | ||||||||
| Noncontrolling interests | 38 | 83 | ||||||||||
| Total stockholders' equity | 9,875 | 8,823 | ||||||||||
| Total liabilities, redeemable noncontrolling interest and stockholders' equity | $ | 61,642 | $ | 60,038 | ||||||||
Page 26
Caterpillar Inc. Condensed Consolidated Statement of Cash Flow (Unaudited) (Millions of dollars) | |||||||||||
| Nine Months Ended | |||||||||||
| September 30, | |||||||||||
| 2010 | 2009 | ||||||||||
| Cash flow from operating activities: | |||||||||||
| Profit of consolidated and affiliated companies | $ | 1,770 | $ | 621 | |||||||
| Adjustments for non-cash items: | |||||||||||
| Depreciation and amortization | 1,681 | 1,633 | |||||||||
| Other | 345 | 62 | |||||||||
| Changes in assets and liabilities: | |||||||||||
| Receivables – trade and other | (1,337 | ) | 3,964 | ||||||||
| Inventories | (2,086 | ) | 1,985 | ||||||||
| Accounts payable | 1,851 | (2,352 | ) | ||||||||
| Accrued expenses | 7 | (520 | ) | ||||||||
| Customer advances | 183 | (606 | ) | ||||||||
| Other assets – net | 131 | 102 | |||||||||
| Other liabilities – net | 287 | (371 | ) | ||||||||
| Net cash provided by (used for) operating activities | 2,832 | 4,518 | |||||||||
| Cash flow from investing activities: | |||||||||||
| Capital expenditures – excluding equipment leased to others | (842 | ) | (751 | ) | |||||||
| Expenditures for equipment leased to others | (708 | ) | (747 | ) | |||||||
| Proceeds from disposals of property, plant and equipment | 1,101 | 799 | |||||||||
| Additions to finance receivables | (6,121 | ) | (5,255 | ) | |||||||
| Collections of finance receivables | 6,424 | 7,343 | |||||||||
| Proceeds from sale of finance receivables | 13 | 69 | |||||||||
| Investments and acquisitions (net of cash acquired) | (1,111 | ) | (9 | ) | |||||||
| Proceeds from sale of available-for-sale securities | 141 | 232 | |||||||||
| Investments in available-for-sale securities | (129 | ) | (312 | ) | |||||||
| Other – net | 130 | (89 | ) | ||||||||
| Net cash provided by (used for) investing activities | (1,102 | ) | 1,280 | ||||||||
| Cash flow from financing activities: | |||||||||||
| Dividends paid | (804 | ) | (766 | ) | |||||||
| Common stock issued, including treasury shares reissued | 193 | 50 | |||||||||
| Excess tax benefit from stock-based compensation | 89 | 8 | |||||||||
| Acquisitions of noncontrolling interests | (132 | ) | (6 | ) | |||||||
| Proceeds from debt issued (original maturities greater than three months) | 5,928 | 10,869 | |||||||||
| Payments on debt (original maturities greater than three months) | (9,216 | ) | (10,816 | ) | |||||||
| Short-term borrowings - net (original maturities three months or less) | (330 | ) | (3,686 | ) | |||||||
| Net cash provided by (used for) financing activities | (4,272 | ) | (4,347 | ) | |||||||
| Effect of exchange rate changes on cash | (60 | ) | 1 | ||||||||
| Increase (decrease) in cash and short-term investments | (2,602 | ) | 1,452 | ||||||||
| Cash and short-term investments at beginning of period | 4,867 | 2,736 | |||||||||
| Cash and short-term investments at end of period | $ | 2,265 | $ | 4,188 | |||||||
| All short-term investments, which consist primarily of highly liquid investments with original maturities of three months or less, are considered to be cash equivalents. |
Page 27
Caterpillar Inc. Supplemental Data for Results of Operations For The Three Months Ended September 30, 2010 (Unaudited) (Millions of dollars) | ||||||||||||||||||||
| Supplemental Consolidating Data | ||||||||||||||||||||
| Machinery | Financial | Consolidating | ||||||||||||||||||
| Consolidated | and Engines 1 | Products | Adjustments | |||||||||||||||||
| Sales and revenues: | ||||||||||||||||||||
| Sales of Machinery and Engines | $ | 10,452 | $ | 10,452 | $ | — | $ | — | ||||||||||||
| Revenues of Financial Products | 682 | — | 749 | (67 | ) | 2 | ||||||||||||||
| Total sales and revenues | 11,134 | 10,452 | 749 | (67 | ) | |||||||||||||||
| Operating costs: | ||||||||||||||||||||
| Cost of goods sold | 7,752 | 7,752 | — | — | ||||||||||||||||
| Selling, general and administrative expenses | 1,148 | 999 | 152 | (3 | ) | 3 | ||||||||||||||
| Research and development expenses | 510 | 510 | — | — | ||||||||||||||||
| Interest expense of Financial Products | 227 | — | 228 | (1 | ) | 4 | ||||||||||||||
| Other operating (income) expenses | 310 | 45 | 273 | (8 | ) | 3 | ||||||||||||||
| Total operating costs | 9,947 | 9,306 | 653 | (12 | ) | |||||||||||||||
| Operating profit | 1,187 | 1,146 | 96 | (55 | ) | |||||||||||||||
| Interest expense excluding Financial Products | 85 | 101 | — | (16 | ) | 4 | ||||||||||||||
| Other income (expense) | 1 | (52 | ) | 14 | 39 | 5 | ||||||||||||||
| Consolidated profit before taxes | 1,103 | 993 | 110 | — | ||||||||||||||||
| Provision (benefit) for income taxes | 295 | 275 | 20 | — | ||||||||||||||||
| Profit of consolidated companies | 808 | 718 | 90 | — | ||||||||||||||||
| Equity in profit (loss) of unconsolidated affiliated companies | (7 | ) | (7 | ) | — | — | ||||||||||||||
| Equity in profit of Financial Products' subsidiaries | — | 87 | — | (87 | ) | 6 | ||||||||||||||
| Profit of consolidated and affiliated companies | 801 | 798 | 90 | (87 | ) | |||||||||||||||
| Less: Profit (loss) attributable to noncontrolling interests | 9 | 6 | 3 | — | ||||||||||||||||
Profit 7 | $ | 792 | $ | 792 | $ | 87 | $ | (87 | ) | |||||||||||
| 1 | Represents Caterpillar Inc. and its subsidiaries with Financial Products accounted for on the equity basis. |
| 2 | Elimination of Financial Products’ revenues earned from Machinery and Engines. |
| 3 | Elimination of net expenses recorded by Machinery and Engines paid to Financial Products. |
| 4 | Elimination of interest expense recorded between Financial Products and Machinery and Engines. |
| 5 | Elimination of discount recorded by Machinery and Engines on receivables sold to Financial Products and of interest earned between Machinery and Engines and Financial Products. |
| 6 | Elimination of Financial Products’ profit due to equity method of accounting. |
| 7 | Profit attributable to common stockholders. |
Page 28
Caterpillar Inc. Supplemental Data for Results of Operations For The Three Months Ended September 30, 2009 (Unaudited) (Millions of dollars) | ||||||||||||||||||||
| Supplemental Consolidating Data | ||||||||||||||||||||
| Machinery | Financial | Consolidating | ||||||||||||||||||
| Consolidated | and Engines 1 | Products | Adjustments | |||||||||||||||||
| Sales and revenues: | ||||||||||||||||||||
| Sales of Machinery and Engines | $ | 6,583 | $ | 6,583 | $ | — | $ | — | ||||||||||||
| Revenues of Financial Products | 715 | — | 788 | (73 | ) | 2 | ||||||||||||||
| Total sales and revenues | 7,298 | 6,583 | 788 | (73 | ) | |||||||||||||||
| Operating costs: | ||||||||||||||||||||
| Cost of goods sold | 5,255 | 5,255 | — | — | ||||||||||||||||
| Selling, general and administrative expenses | 907 | 765 | 146 | (4 | ) | 3 | ||||||||||||||
| Research and development expenses | 327 | 327 | — | — | ||||||||||||||||
| Interest expense of Financial Products | 256 | — | 256 | — | 4 | |||||||||||||||
| Other operating (income) expenses | 276 | (10 | ) | 294 | (8 | ) | 3 | |||||||||||||
| Total operating costs | 7,021 | 6,337 | 696 | (12 | ) | |||||||||||||||
| Operating profit | 277 | 246 | 92 | (61 | ) | |||||||||||||||
| Interest expense excluding Financial Products | 91 | 112 | — | (21 | ) | 4 | ||||||||||||||
| Other income (expense) | 66 | 22 | 4 | 40 | 5 | |||||||||||||||
| Consolidated profit before taxes | 252 | 156 | 96 | — | ||||||||||||||||
| Provision (benefit) for income taxes | (139 | ) | (146 | ) | 7 | — | ||||||||||||||
| Profit of consolidated companies | 391 | 302 | 89 | — | ||||||||||||||||
| Equity in profit (loss) of unconsolidated affiliated companies | 1 | 1 | — | — | ||||||||||||||||
| Equity in profit of Financial Products' subsidiaries | — | 85 | — | (85 | ) | 6 | ||||||||||||||
| Profit of consolidated and affiliated companies | 392 | 388 | 89 | (85 | ) | |||||||||||||||
| Less: Profit (loss) attributable to noncontrolling interests | (12 | ) | (16 | ) | 4 | — | ||||||||||||||
Profit 7 | $ | 404 | $ | 404 | $ | 85 | $ | (85 | ) | |||||||||||
| 1 | Represents Caterpillar Inc. and its subsidiaries with Financial Products accounted for on the equity basis. |
| 2 | Elimination of Financial Products’ revenues earned from Machinery and Engines. |
| 3 | Elimination of net expenses recorded by Machinery and Engines paid to Financial Products. |
| 4 | Elimination of interest expense recorded between Financial Products and Machinery and Engines. |
| 5 | Elimination of discount recorded by Machinery and Engines on receivables sold to Financial Products and of interest earned between Machinery and Engines and Financial Products. |
| 6 | Elimination of Financial Products’ profit due to equity method of accounting. |
| 7 | Profit attributable to common stockholders. |
Page 29
Caterpillar Inc. Supplemental Data for Results of Operations For The Nine Months Ended September 30, 2010 (Unaudited) (Millions of dollars) | ||||||||||||||||||||
| Supplemental Consolidating Data | ||||||||||||||||||||
| Machinery | Financial | Consolidating | ||||||||||||||||||
| Consolidated | and Engines 1 | Products | Adjustments | |||||||||||||||||
| Sales and revenues: | ||||||||||||||||||||
| Sales of Machinery and Engines | $ | 27,726 | $ | 27,726 | $ | — | $ | — | ||||||||||||
| Revenues of Financial Products | 2,055 | — | 2,248 | (193 | ) | 2 | ||||||||||||||
| Total sales and revenues | 29,781 | 27,726 | 2,248 | (193 | ) | |||||||||||||||
| Operating costs: | ||||||||||||||||||||
| Cost of goods sold | 21,018 | 21,018 | — | — | ||||||||||||||||
| Selling, general and administrative expenses | 3,139 | 2,715 | 441 | (17 | ) | 3 | ||||||||||||||
| Research and development expenses | 1,362 | 1,362 | — | — | ||||||||||||||||
| Interest expense of Financial Products | 694 | — | 696 | (2 | ) | 4 | ||||||||||||||
| Other operating (income) expenses | 896 | 88 | 826 | (18 | ) | 3 | ||||||||||||||
| Total operating costs | 27,109 | 25,183 | 1,963 | (37 | ) | |||||||||||||||
| Operating profit | 2,672 | 2,543 | 285 | (156 | ) | |||||||||||||||
| Interest expense excluding Financial Products | 268 | 325 | — | (57 | ) | 4 | ||||||||||||||
| Other income (expense) | 114 | (29 | ) | 44 | 99 | 5 | ||||||||||||||
| Consolidated profit before taxes | 2,518 | 2,189 | 329 | — | ||||||||||||||||
| Provision (benefit) for income taxes | 735 | 670 | 65 | — | ||||||||||||||||
| Profit of consolidated companies | 1,783 | 1,519 | 264 | — | ||||||||||||||||
| Equity in profit (loss) of unconsolidated affiliated companies | (13 | ) | (13 | ) | — | — | ||||||||||||||
| Equity in profit of Financial Products' subsidiaries | — | 256 | — | (256 | ) | 6 | ||||||||||||||
| Profit of consolidated and affiliated companies | 1,770 | 1,762 | 264 | (256 | ) | |||||||||||||||
| Less: Profit (loss) attributable to noncontrolling interests | 38 | 30 | 8 | — | ||||||||||||||||
Profit 7 | $ | 1,732 | $ | 1,732 | $ | 256 | $ | (256 | ) | |||||||||||
| 1 | Represents Caterpillar Inc. and its subsidiaries with Financial Products accounted for on the equity basis. |
| 2 | Elimination of Financial Products’ revenues earned from Machinery and Engines. |
| 3 | Elimination of net expenses recorded by Machinery and Engines paid to Financial Products. |
| 4 | Elimination of interest expense recorded between Financial Products and Machinery and Engines. |
| 5 | Elimination of discount recorded by Machinery and Engines on receivables sold to Financial Products and of interest earned between Machinery and Engines and Financial Products. |
| 6 | Elimination of Financial Products’ profit due to equity method of accounting. |
| 7 | Profit attributable to common stockholders. |
Page 30
Caterpillar Inc. Supplemental Data for Results of Operations For The Nine Months Ended September 30, 2009 (Unaudited) (Millions of dollars) | ||||||||||||||||||||
| Supplemental Consolidating Data | ||||||||||||||||||||
| Machinery | Financial | Consolidating | ||||||||||||||||||
| Consolidated | and Engines 1 | Products | Adjustments | |||||||||||||||||
| Sales and revenues: | ||||||||||||||||||||
| Sales of Machinery and Engines | $ | 22,347 | $ | 22,347 | $ | — | $ | — | ||||||||||||
| Revenues of Financial Products | 2,151 | — | 2,398 | (247 | ) | 2 | ||||||||||||||
| Total sales and revenues | 24,498 | 22,347 | 2,398 | (247 | ) | |||||||||||||||
| Operating costs: | ||||||||||||||||||||
| Cost of goods sold | 18,034 | 18,034 | — | — | ||||||||||||||||
| Selling, general and administrative expenses | 2,703 | 2,314 | 400 | (11 | ) | 3 | ||||||||||||||
| Research and development expenses | 1,066 | 1,066 | — | — | ||||||||||||||||
| Interest expense of Financial Products | 807 | — | 810 | (3 | ) | 4 | ||||||||||||||
| Other operating (income) expenses | 1,439 | 595 | 870 | (26 | ) | 3 | ||||||||||||||
| Total operating costs | 24,049 | 22,009 | 2,080 | (40 | ) | |||||||||||||||
| Operating profit | 449 | 338 | 318 | (207 | ) | |||||||||||||||
| Interest expense excluding Financial Products | 301 | 365 | — | (64 | ) | 4 | ||||||||||||||
| Other income (expense) | 293 | 153 | (3 | ) | 143 | 5 | ||||||||||||||
| Consolidated profit before taxes | 441 | 126 | 315 | — | ||||||||||||||||
| Provision (benefit) for income taxes | (179 | ) | (239 | ) | 60 | — | ||||||||||||||
| Profit of consolidated companies | 620 | 365 | 255 | — | ||||||||||||||||
| Equity in profit (loss) of unconsolidated affiliated companies | 1 | 1 | — | — | ||||||||||||||||
| Equity in profit of Financial Products' subsidiaries | — | 243 | — | (243 | ) | 6 | ||||||||||||||
| Profit of consolidated and affiliated companies | 621 | 609 | 255 | (243 | ) | |||||||||||||||
| Less: Profit (loss) attributable to noncontrolling interests | (42 | ) | (54 | ) | 12 | — | ||||||||||||||
Profit 7 | $ | 663 | $ | 663 | $ | 243 | $ | (243 | ) | |||||||||||
| 1 | Represents Caterpillar Inc. and its subsidiaries with Financial Products accounted for on the equity basis. |
| 2 | Elimination of Financial Products’ revenues earned from Machinery and Engines. |
| 3 | Elimination of net expenses recorded by Machinery and Engines paid to Financial Products. |
| 4 | Elimination of interest expense recorded between Financial Products and Machinery and Engines. |
| 5 | Elimination of discount recorded by Machinery and Engines on receivables sold to Financial Products and of interest earned between Machinery and Engines and Financial Products. |
| 6 | Elimination of Financial Products’ profit due to equity method of accounting. |
| 7 | Profit attributable to common stockholders. |
Page 31
Page 32
Caterpillar Inc. Supplemental Data for Cash Flow For The Nine Months Ended September 30, 2010 (Unaudited) (Millions of dollars) | |||||||||||||||||||||
| Supplemental Consolidating Data | |||||||||||||||||||||
| Machinery | Financial | Consolidating | |||||||||||||||||||
| Consolidated | and Engines 1 | Products | Adjustments | ||||||||||||||||||
| Cash flow from operating activities: | |||||||||||||||||||||
| Profit of consolidated and affiliated companies | $ | 1,770 | $ | 1,762 | $ | 264 | $ | (256 | ) | 2 | |||||||||||
| Adjustments for non-cash items: | |||||||||||||||||||||
| Depreciation and amortization | 1,681 | 1,138 | 543 | — | |||||||||||||||||
| Other | 345 | 363 | (106 | ) | 88 | 4 | |||||||||||||||
| Financial Products’ dividend in excess of profit | — | 344 | — | (344 | ) | 3 | |||||||||||||||
| Changes in assets and liabilities: | |||||||||||||||||||||
| Receivables - trade and other | (1,337 | ) | (906 | ) | 42 | (473 | ) | 4,5 | |||||||||||||
| Inventories | (2,086 | ) | (2,084 | ) | — | (2 | ) | 4 | |||||||||||||
| Accounts payable | 1,851 | 1,855 | 14 | (18 | ) | 4 | |||||||||||||||
| Accrued expenses | 7 | 37 | (44 | ) | 14 | 4 | |||||||||||||||
| Customer advances | 183 | 183 | — | — | |||||||||||||||||
| Other assets - net | 131 | 93 | (3 | ) | 41 | 4 | |||||||||||||||
| Other liabilities - net | 287 | 430 | (87 | ) | (56 | ) | 4 | ||||||||||||||
| Net cash provided by (used for) operating activities | 2,832 | 3,215 | 623 | (1,006 | ) | ||||||||||||||||
| Cash flow from investing activities: | |||||||||||||||||||||
| Capital expenditures - excluding equipment leased to others | (842 | ) | (847 | ) | (4 | ) | 9 | 4 | |||||||||||||
| Expenditures for equipment leased to others | (708 | ) | (62 | ) | (691 | ) | 45 | 4 | |||||||||||||
| Proceeds from disposals of property, plant and equipment | 1,101 | 101 | 1,037 | (37 | ) | 4 | |||||||||||||||
| Additions to finance receivables | (6,121 | ) | — | (19,168 | ) | 13,047 | 5 | ||||||||||||||
| Collections of finance receivables | 6,424 | — | 19,082 | (12,658 | ) | 5 | |||||||||||||||
| Proceeds from sale of finance receivables | 13 | — | 13 | — | |||||||||||||||||
| Net intercompany borrowings | — | (574 | ) | 447 | 127 | 6 | |||||||||||||||
| Investments and acquisitions (net of cash acquired) | (1,111 | ) | (1,079 | ) | (32 | ) | — | ||||||||||||||
| Proceeds from sale of available-for-sale securities | 141 | 6 | 135 | — | |||||||||||||||||
| Investments in available-for-sale securities | (129 | ) | (3 | ) | (126 | ) | — | ||||||||||||||
| Other - net | 130 | 10 | 100 | 20 | 7 | ||||||||||||||||
| Net cash provided by (used for) investing activities | (1,102 | ) | (2,448 | ) | 793 | 553 | |||||||||||||||
| Cash flow from financing activities: | |||||||||||||||||||||
| Dividends paid | (804 | ) | (804 | ) | (600 | ) | 600 | 8 | |||||||||||||
| Common stock issued, including treasury shares reissued | 193 | 193 | 20 | (20 | ) | 7 | |||||||||||||||
| Excess tax benefit from stock-based compensation | 89 | 89 | — | — | |||||||||||||||||
| Acquisitions of noncontrolling interests | (132 | ) | (132 | ) | — | — | |||||||||||||||
| Net intercompany borrowings | — | (447 | ) | 574 | (127 | ) | 6 | ||||||||||||||
| Proceeds from debt issued (original maturities greater than three months) | 5,928 | 190 | 5,738 | — | |||||||||||||||||
| Payments on debt (original maturities greater than three months) | (9,216 | ) | (1,185 | ) | (8,031 | ) | — | ||||||||||||||
| Short-term borrowings - net (original maturities three months or less) | (330 | ) | (60 | ) | (270 | ) | — | ||||||||||||||
| Net cash provided by (used for) financing activities | (4,272 | ) | (2,156 | ) | (2,569 | ) | 453 | ||||||||||||||
| Effect of exchange rate changes on cash | (60 | ) | (15 | ) | (45 | ) | — | ||||||||||||||
| Increase (decrease) in cash and short-term investments | (2,602 | ) | (1,404 | ) | (1,198 | ) | — | ||||||||||||||
| Cash and short-term investments at beginning of period | 4,867 | 2,239 | 2,628 | — | |||||||||||||||||
| Cash and short-term investments at end of period | $ | 2,265 | $ | 835 | $ | 1,430 | $ | — | |||||||||||||
| 1 | Represents Caterpillar Inc. and its subsidiaries with Financial Products accounted for on the equity basis. |
| 2 | Elimination of Financial Products’ profit after tax due to equity method of accounting. |
| 3 | Elimination of Financial Products’ dividend to Machinery and Engines in excess of Financial Products’ profit. |
| 4 | Elimination of non-cash adjustments and changes in assets and liabilities related to consolidated reporting. |
| 5 | Reclassification of Cat Financial’s cash flow activity from investing to operating for receivables that arose from the sale of inventory. |
| 6 | Elimination of net proceeds and payments to/from Machinery and Engines and Financial Products. |
| 7 | Elimination of change in investment and common stock related to Financial Products. |
| 8 | Elimination of dividend from Financial Products to Machinery and Engines. |
Page 32
Caterpillar Inc. Supplemental Data for Cash Flow For The Nine Months Ended September 30, 2009 (Unaudited) (Millions of dollars) | |||||||||||||||||||||
| Supplemental Consolidating Data | |||||||||||||||||||||
| Machinery | Financial | Consolidating | |||||||||||||||||||
| Consolidated | and Engines 1 | Products | Adjustments | ||||||||||||||||||
| Cash flow from operating activities: | |||||||||||||||||||||
| Profit of consolidated and affiliated companies | $ | 621 | $ | 609 | $ | 255 | $ | (243 | ) | 2 | |||||||||||
| Adjustments for non-cash items: | |||||||||||||||||||||
| Depreciation and amortization | 1,633 | 1,083 | 550 | — | |||||||||||||||||
| Undistributed profit of Financial Products | — | (243 | ) | — | 243 | 3 | |||||||||||||||
| Other | 62 | 60 | (137 | ) | 139 | 4 | |||||||||||||||
| Changes in assets and liabilities: | |||||||||||||||||||||
| Receivables - trade and other | 3,964 | 1,910 | 147 | 1,907 | 4,5 | ||||||||||||||||
| Inventories | 1,985 | 1,985 | — | — | |||||||||||||||||
| Accounts payable | (2,352 | ) | (2,251 | ) | (157 | ) | 56 | 4 | |||||||||||||
| Accrued expenses | (520 | ) | (448 | ) | (64 | ) | (8 | ) | 4 | ||||||||||||
| Customer advances | (606 | ) | (606 | ) | — | — | |||||||||||||||
| Other assets - net | 102 | (135 | ) | 252 | (15 | ) | 4 | ||||||||||||||
| Other liabilities - net | (371 | ) | (429 | ) | 37 | 21 | 4 | ||||||||||||||
| Net cash provided by (used for) operating activities | 4,518 | 1,535 | 883 | 2,100 | |||||||||||||||||
| Cash flow from investing activities: | |||||||||||||||||||||
| Capital expenditures - excluding equipment leased to others | (751 | ) | (749 | ) | (2 | ) | — | ||||||||||||||
| Expenditures for equipment leased to others | (747 | ) | — | (751 | ) | 4 | 4 | ||||||||||||||
| Proceeds from disposals of property, plant and equipment | 799 | 74 | 725 | — | |||||||||||||||||
| Additions to finance receivables | (5,255 | ) | — | (15,518 | ) | 10,263 | 5 | ||||||||||||||
| Collections of finance receivables | 7,343 | — | 18,796 | (11,453 | ) | 5 | |||||||||||||||
| Proceeds from sale of finance receivables | 69 | — | 983 | (914 | ) | 5 | |||||||||||||||
| Net intercompany borrowings | — | 427 | (965 | ) | 538 | 6 | |||||||||||||||
| Investments and acquisitions (net of cash acquired) | (9 | ) | (9 | ) | — | — | |||||||||||||||
Proceeds from sale of available-for-sale securities | 232 | 5 | 227 | — | |||||||||||||||||
| Investments in available-for-sale securities | (312 | ) | (4 | ) | (308 | ) | — | ||||||||||||||
| Other - net | (89 | ) | 123 | (232 | ) | 20 | 7 | ||||||||||||||
| Net cash provided by (used for) investing activities | 1,280 | (133 | ) | 2,955 | (1,542 | ) | |||||||||||||||
| Cash flow from financing activities: | |||||||||||||||||||||
| Dividends paid | (766 | ) | (766 | ) | — | — | |||||||||||||||
| Common stock issued, including treasury shares reissued | 50 | 50 | 20 | (20 | ) | 7 | |||||||||||||||
| Excess tax benefit from stock-based compensation | 8 | 8 | — | — | |||||||||||||||||
| Acquisitions of noncontrolling interests | (6 | ) | (6 | ) | — | — | |||||||||||||||
| Net intercompany borrowings | — | 965 | (427 | ) | (538 | ) | 6 | ||||||||||||||
| Proceeds from debt issued (original maturities greater than three months) | 10,869 | 1,036 | 9,833 | — | |||||||||||||||||
| Payments on debt (original maturities greater than three months) | (10,816 | ) | (1,396 | ) | (9,420 | ) | — | ||||||||||||||
| Short-term borrowings - net (original maturities three months or less) | (3,686 | ) | (966 | ) | (2,720 | ) | — | ||||||||||||||
| Net cash provided by (used for) financing activities | (4,347 | ) | (1,075 | ) | (2,714 | ) | (558 | ) | |||||||||||||
| Effect of exchange rate changes on cash | 1 | (18 | ) | 19 | — | ||||||||||||||||
| Increase (decrease) in cash and short-term investments | 1,452 | 309 | 1,143 | — | |||||||||||||||||
| Cash and short-term investments at beginning of period | 2,736 | 1,517 | 1,219 | — | |||||||||||||||||
| Cash and short-term investments at end of period | $ | 4,188 | $ | 1,826 | $ | 2,362 | $ | — | |||||||||||||
| 1 | Represents Caterpillar Inc. and its subsidiaries with Financial Products accounted for on the equity basis. |
| 2 | Elimination of Financial Products’ profit after tax due to equity method of accounting. |
| 3 | Elimination of non-cash adjustment for the undistributed earnings from Financial Products. |
| 4 | Elimination of non-cash adjustments and changes in assets and liabilities related to consolidated reporting. |
| 5 | Reclassification of Cat Financial’s cash flow activity from investing to operating for receivables that arose from the sale of inventory. |
| 6 | Elimination of net proceeds and payments to/from Machinery and Engines and Financial Products. |
| 7 | Elimination of change in investment and common stock related to Financial Products. |
Page 33