EXHIBIT 13
CATERPILLAR INC.
GENERAL AND FINANCIAL INFORMATION
2013
TABLE OF CONTENTS
MANAGEMENT’S REPORT ON
INTERNAL CONTROL OVER FINANCIAL REPORTING
The management of Caterpillar Inc. (company) is responsible for establishing and maintaining adequate internal control over financial reporting as such term is defined in Rule 13a-15(f) under the Exchange Act. Our internal control over financial reporting is a process designed to provide reasonable assurance regarding the reliability of our financial reporting and the preparation of financial statements for external purposes in accordance with generally accepted accounting principles. Our internal control over financial reporting includes those policies and procedures that (i) pertain to the maintenance of records that, in reasonable detail, accurately and fairly reflect the transactions and dispositions of the assets of the company; (ii) provide reasonable assurance that transactions are recorded as necessary to permit preparation of financial statements in accordance with generally accepted accounting principles, and that receipts and expenditures of the company are being made only in accordance with authorizations of management and directors of the company; and (iii) provide reasonable assurance regarding prevention or timely detection of unauthorized acquisition, use, or disposition of the company’s assets that could have a material effect on the financial statements.
Because of its inherent limitations, internal control over financial reporting may not prevent or detect misstatements. Also, projections of any evaluation of effectiveness to future periods are subject to the risk that controls may become inadequate because of changes in conditions, or that the degree of compliance with the policies or procedures may deteriorate.
Management assessed the effectiveness of the company’s internal control over financial reporting as of December 31, 2013. In making this assessment, we used the criteria set forth by the Committee of Sponsoring Organizations of the Treadway Commission (COSO) in Internal Control—Integrated Framework (1992). Based on our assessment we concluded that, as of December 31, 2013, the company’s internal control over financial reporting was effective based on those criteria.
The effectiveness of the company’s internal control over financial reporting as of December 31, 2013 has been audited by PricewaterhouseCoopers LLP, an independent registered public accounting firm. Their report appears on page A-4.
|
| | |
| | /s/Douglas R. Oberhelman | |
| | Douglas R. Oberhelman | |
| | Chairman of the Board | |
| | and Chief Executive Officer | |
| | |
| | | |
| | /s/Bradley M. Halverson | |
| | Bradley M. Halverson | |
| | Group President | |
| | and Chief Financial Officer | |
| | | |
| | | |
| | February 18, 2014 | |
REPORT OF INDEPENDENT REGISTERED PUBLIC ACCOUNTING FIRM
To the Board of Directors and Stockholders of Caterpillar Inc.:
In our opinion, the accompanying consolidated statement of financial position and the related consolidated statements of results of operations, comprehensive income, changes in stockholders' equity, and of cash flow, including pages A-5 through A-101, present fairly, in all material respects, the financial position of Caterpillar Inc. and its subsidiaries at December 31, 2013, 2012 and 2011, and the results of their operations and their cash flows for each of the three years in the period ended December 31, 2013 in conformity with accounting principles generally accepted in the United States of America. Also in our opinion, the Company maintained, in all material respects, effective internal control over financial reporting as of December 31, 2013, based on criteria established in Internal Control - Integrated Framework (1992) issued by the Committee of Sponsoring Organizations of the Treadway Commission (COSO). The Company's management is responsible for these financial statements, for maintaining effective internal control over financial reporting and for its assessment of the effectiveness of internal control over financial reporting, included in Management's Report on Internal Control Over Financial Reporting appearing on page A-3. Our responsibility is to express opinions on these financial statements and on the Company's internal control over financial reporting based on our integrated audits. We conducted our audits in accordance with the standards of the Public Company Accounting Oversight Board (United States). Those standards require that we plan and perform the audits to obtain reasonable assurance about whether the financial statements are free of material misstatement and whether effective internal control over financial reporting was maintained in all material respects. Our audits of the financial statements included examining, on a test basis, evidence supporting the amounts and disclosures in the financial statements, assessing the accounting principles used and significant estimates made by management, and evaluating the overall financial statement presentation. Our audit of internal control over financial reporting included obtaining an understanding of internal control over financial reporting, assessing the risk that a material weakness exists, and testing and evaluating the design and operating effectiveness of internal control based on the assessed risk. Our audits also included performing such other procedures as we considered necessary in the circumstances. We believe that our audits provide a reasonable basis for our opinions.
A company’s internal control over financial reporting is a process designed to provide reasonable assurance regarding the reliability of financial reporting and the preparation of financial statements for external purposes in accordance with generally accepted accounting principles. A company’s internal control over financial reporting includes those policies and procedures that (i) pertain to the maintenance of records that, in reasonable detail, accurately and fairly reflect the transactions and dispositions of the assets of the company; (ii) provide reasonable assurance that transactions are recorded as necessary to permit preparation of financial statements in accordance with generally accepted accounting principles, and that receipts and expenditures of the company are being made only in accordance with authorizations of management and directors of the company; and (iii) provide reasonable assurance regarding prevention or timely detection of unauthorized acquisition, use, or disposition of the company’s assets that could have a material effect on the financial statements.
Because of its inherent limitations, internal control over financial reporting may not prevent or detect misstatements. Also, projections of any evaluation of effectiveness to future periods are subject to the risk that controls may become inadequate because of changes in conditions, or that the degree of compliance with the policies or procedures may deteriorate.
/s/PricewaterhouseCoopers LLP
Peoria, Illinois
February 18, 2014
|
| | | | | | | | | | | |
| STATEMENT 1 | | | Caterpillar Inc. | |
| Consolidated Results of Operations for the Years Ended December 31 | | | | | |
| (Dollars in millions except per share data) | | | | | |
| | 2013 | | 2012 | | 2011 |
| Sales and revenues: | |
| | |
| | |
|
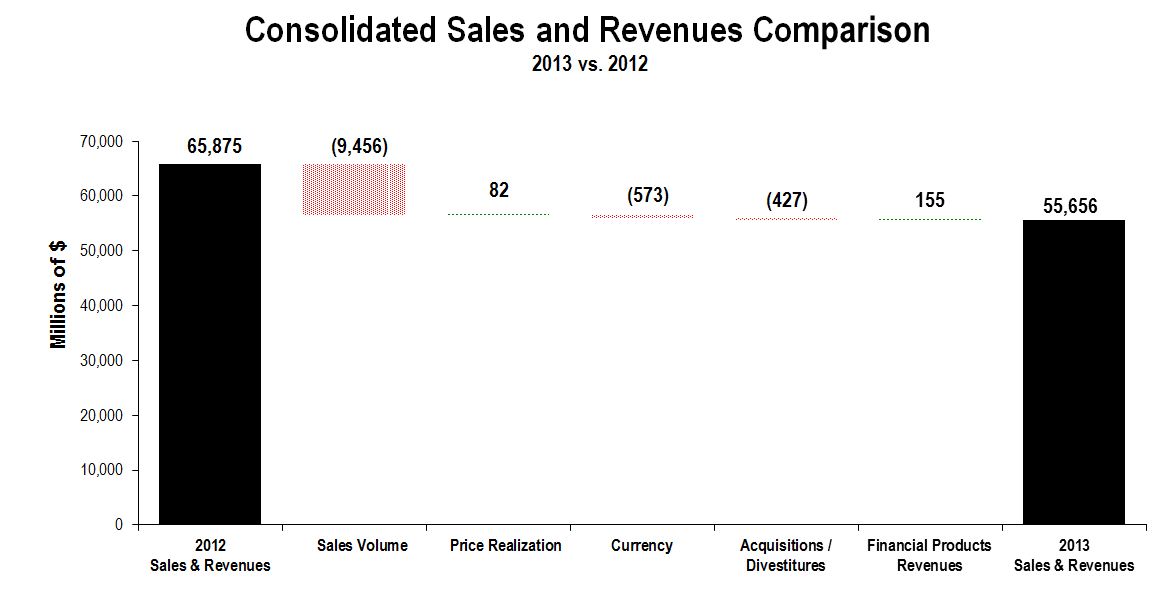
| Sales of Machinery and Power Systems | $ | 52,694 |
| | $ | 63,068 |
| | $ | 57,392 |
|
| Revenues of Financial Products | 2,962 |
| | 2,807 |
| | 2,746 |
|
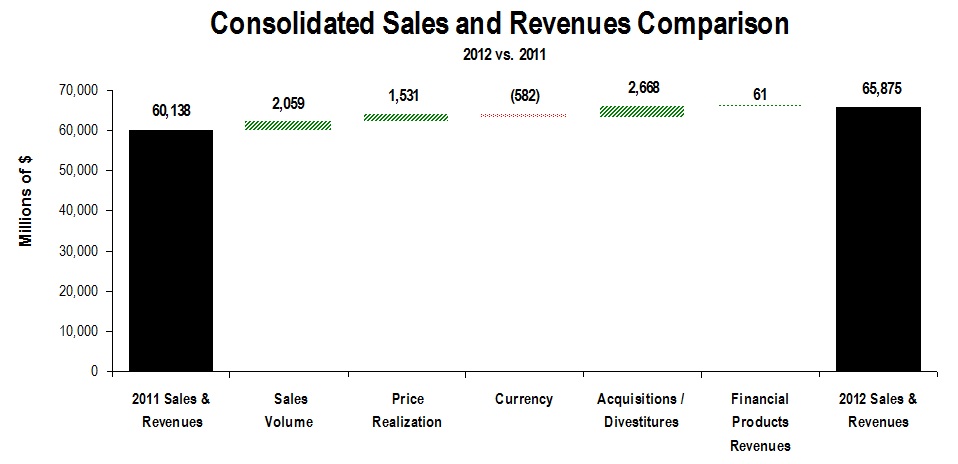
| Total sales and revenues | 55,656 |
| | 65,875 |
| | 60,138 |
|
| | | | | | |
| Operating costs: | |
| | |
| | |
|
| Cost of goods sold | 40,727 |
| | 47,055 |
| | 43,578 |
|
| Selling, general and administrative expenses | 5,547 |
| | 5,919 |
| | 5,203 |
|
| Research and development expenses | 2,046 |
| | 2,466 |
| | 2,297 |
|
| Interest expense of Financial Products | 727 |
| | 797 |
| | 826 |
|
| Goodwill impairment charge | — |
| | 580 |
| | — |
|
| Other operating (income) expenses | 981 |
| | 485 |
| | 1,081 |
|
| Total operating costs | 50,028 |
| | 57,302 |
| | 52,985 |
|
| | | | | | |
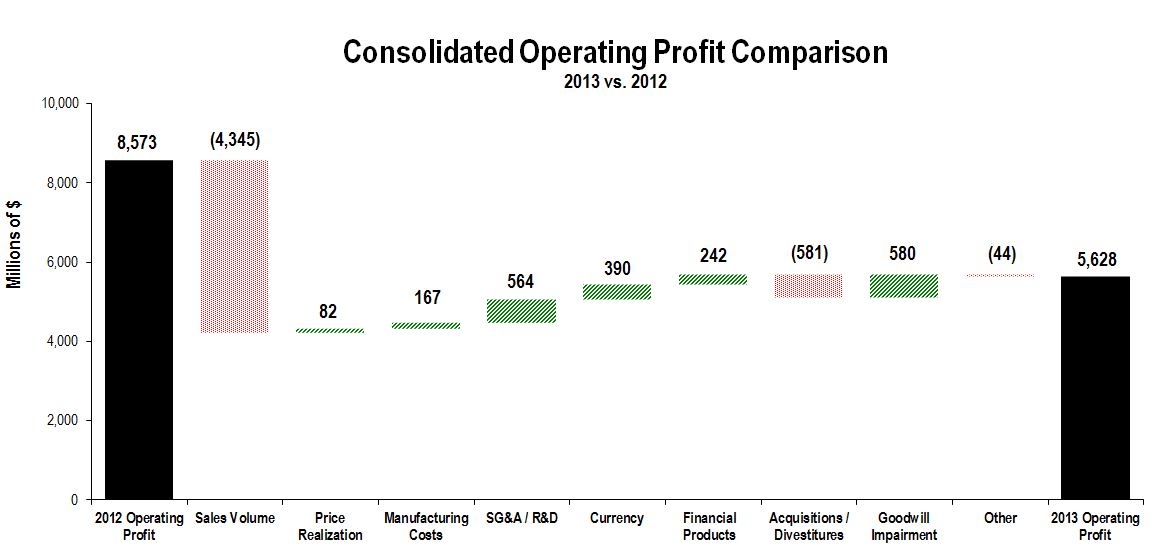
| Operating profit | 5,628 |
| | 8,573 |
| | 7,153 |
|
| | | | | | |
| Interest expense excluding Financial Products | 465 |
| | 467 |
| | 396 |
|
| Other income (expense) | (35 | ) | | 130 |
| | (32 | ) |
| | | | | | |
| Consolidated profit before taxes | 5,128 |
| | 8,236 |
| | 6,725 |
|
| | | | | | |
| Provision (benefit) for income taxes | 1,319 |
| | 2,528 |
| | 1,720 |
|
| Profit of consolidated companies | 3,809 |
| | 5,708 |
| | 5,005 |
|
| | | | | | |
| Equity in profit (loss) of unconsolidated affiliated companies | (6 | ) | | 14 |
| | (24 | ) |
| | | | | | |
| Profit of consolidated and affiliated companies | 3,803 |
| | 5,722 |
| | 4,981 |
|
| | | | | | |
| Less: Profit (loss) attributable to noncontrolling interests | 14 |
| | 41 |
| | 53 |
|
| | | | | | |
Profit 1 | $ | 3,789 |
| | $ | 5,681 |
| | $ | 4,928 |
|
| | | | | | |
| Profit per common share | $ | 5.87 |
| | $ | 8.71 |
| | $ | 7.64 |
|
| | | | | | |
Profit per common share — diluted 2 | $ | 5.75 |
| | $ | 8.48 |
| | $ | 7.40 |
|
| | | | | | |
| Weighted-average common shares outstanding (millions) | |
| | |
| | |
|
| - Basic | 645.2 |
| | 652.6 |
| | 645.0 |
|
- Diluted 2 | 658.6 |
| | 669.6 |
| | 666.1 |
|
| | | | | | |
| Cash dividends declared per common share | $ | 2.32 |
| | $ | 2.02 |
| | $ | 1.82 |
|
| |
1 | Profit attributable to common stockholders. |
| |
2 | Diluted by assumed exercise of stock-based compensation awards, using the treasury stock method. |
|
| | | | |
| See accompanying notes to Consolidated Financial Statements. |
|
| | | | | | | | | | | |
| STATEMENT 2 | | | Caterpillar Inc. | |
| Consolidated Comprehensive Income for the Years Ended December 31 |
| (Millions of dollars) | | | | | |
| | 2013 | | 2012 | | 2011 |
| | | | | | |
| Profit of consolidated and affiliated companies | $ | 3,803 |
| | $ | 5,722 |
| | $ | 4,981 |
|
| Other comprehensive income (loss), net of tax: | | | | | |
| Foreign currency translation, net of tax (provision)/benefit of: 2013 - $57; 2012 - $9; 2011 - $3 | (277 | ) | | 60 |
| | (312 | ) |
| | | | | | |
| Pension and other postretirement benefits: | | | | | |
| Current year actuarial gain (loss), net of tax (provision)/benefit of: 2013 - $(1,232); 2012 - $372; 2011 - $1,276 | 2,277 |
| | (731 | ) | | (2,364 | ) |
| Amortization of actuarial (gain) loss, net of tax (provision)/benefit of: 2013 - $(265); 2012 - $(243); 2011 - $(221) | 516 |
| | 458 |
| | 412 |
|
| Current year prior service credit (cost), net of tax (provision)/benefit of: 2013 - $(2); 2012 - $(12); 2011 - $(51) | 3 |
| | 23 |
| | 95 |
|
| Amortization of prior service (credit) cost, net of tax (provision)/benefit of: 2013 - $19; 2012 - $17; 2011 - $11 | (35 | ) | | (31 | ) | | (21 | ) |
| Amortization of transition (asset) obligation, net of tax (provision)/benefit of: 2013 - $(1); 2012 - $(1); 2011 - $(1) | 1 |
| | 1 |
| | 1 |
|
| | | | | | |
| Derivative financial instruments: | | | | | |
| Gains (losses) deferred, net of tax (provision)/benefit of: 2013 - $2; 2012 - $29; 2011 - $12 | (4 | ) | | (48 | ) | | (21 | ) |
| (Gains) losses reclassified to earnings, net of tax (provision)/benefit of: 2013 - $(25); 2012 - $(10); 2011 - $21 | 41 |
| | 16 |
| | (34 | ) |
| | | | | | |
| Available-for-sale securities: | | | | | |
| Gains (losses) deferred, net of tax (provision)/benefit of: 2013 - $(15); 2012 - $(13); 2011 - $2 | 29 |
| | 26 |
| | (5 | ) |
| (Gains) losses reclassified to earnings, net of tax (provision)/benefit of: 2013 - $6; 2012 - $1; 2011 - $(1) | (13 | ) | | (3 | ) | | 1 |
|
| Total other comprehensive income (loss), net of tax | 2,538 |
| | (229 | ) | | (2,248 | ) |
| Comprehensive income | 6,341 |
| | 5,493 |
| | 2,733 |
|
| Less: comprehensive income attributable to the noncontrolling interests | (17 | ) | | (24 | ) | | (82 | ) |
| Comprehensive income attributable to stockholders | $ | 6,324 |
| | $ | 5,469 |
| | $ | 2,651 |
|
| | | | | | |
|
| | | | |
| See accompanying notes to Consolidated Financial Statements. |
|
| | | | | | | | | | | |
| STATEMENT 3 | | | Caterpillar Inc. | |
| Consolidated Financial Position at December 31 | | | | | |
| (Dollars in millions) | | | | | |
| | 2013 | | 2012 | | 2011 |
| Assets | |
| | |
| | |
|
| Current assets: | |
| | |
| | |
|
| Cash and short-term investments | $ | 6,081 |
| | $ | 5,490 |
| | $ | 3,057 |
|
| Receivables - trade and other | 8,413 |
| | 9,706 |
| | 10,057 |
|
| Receivables - finance | 8,763 |
| | 8,860 |
| | 7,668 |
|
| Deferred and refundable income taxes | 1,553 |
| | 1,547 |
| | 1,580 |
|
| Prepaid expenses and other current assets | 900 |
| | 988 |
| | 994 |
|
| Inventories | 12,625 |
| | 15,547 |
| | 14,544 |
|
| Total current assets | 38,335 |
| | 42,138 |
| | 37,900 |
|
| | | | | | |
| Property, plant and equipment - net | 17,075 |
| | 16,461 |
| | 14,395 |
|
| Long-term receivables - trade and other | 1,397 |
| | 1,316 |
| | 1,130 |
|
| Long-term receivables - finance | 14,926 |
| | 14,029 |
| | 11,948 |
|
| Investments in unconsolidated affiliated companies | 272 |
| | 272 |
| | 133 |
|
| Noncurrent deferred and refundable income taxes | 594 |
| | 2,011 |
| | 2,157 |
|
| Intangible assets | 3,596 |
| | 4,016 |
| | 4,368 |
|
| Goodwill | 6,956 |
| | 6,942 |
| | 7,080 |
|
| Other assets | 1,745 |
| | 1,785 |
| | 2,107 |
|
| Total assets | $ | 84,896 |
| | $ | 88,970 |
| | $ | 81,218 |
|
| | | | | | |
| Liabilities | |
| | |
| | |
|
| Current liabilities: | |
| | |
| | |
|
| Short-term borrowings: | |
| | |
| | |
|
| Machinery and Power Systems | $ | 16 |
| | $ | 636 |
| | $ | 93 |
|
| Financial Products | 3,663 |
| | 4,651 |
| | 3,895 |
|
| Accounts payable | 6,560 |
| | 6,753 |
| | 8,161 |
|
| Accrued expenses | 3,493 |
| | 3,667 |
| | 3,386 |
|
| Accrued wages, salaries and employee benefits | 1,622 |
| | 1,911 |
| | 2,410 |
|
| Customer advances | 2,360 |
| | 2,638 |
| | 2,487 |
|
| Dividends payable | 382 |
| | — |
| | 298 |
|
| Other current liabilities | 1,849 |
| | 2,055 |
| | 1,967 |
|
| Long-term debt due within one year: | |
| | |
| | |
|
| Machinery and Power Systems | 760 |
| | 1,113 |
| | 558 |
|
| Financial Products | 6,592 |
| | 5,991 |
| | 5,102 |
|
| Total current liabilities | 27,297 |
| | 29,415 |
| | 28,357 |
|
| Long-term debt due after one year: | |
| | |
| | |
|
| Machinery and Power Systems | 7,999 |
| | 8,666 |
| | 8,415 |
|
| Financial Products | 18,720 |
| | 19,086 |
| | 16,529 |
|
| Liability for postemployment benefits | 6,973 |
| | 11,085 |
| | 10,956 |
|
| Other liabilities | 3,029 |
| | 3,136 |
| | 3,559 |
|
| Total liabilities | 64,018 |
| | 71,388 |
| | 67,816 |
|
| Commitments and contingencies (Notes 21 and 22) |
|
| |
|
| |
|
|
| Redeemable noncontrolling interest (Note 25) | — |
| | — |
| | 473 |
|
| Stockholders’ equity | |
| | |
| | |
|
| Common stock of $1.00 par: | |
| | |
| | |
|
Authorized shares: 2,000,000,000
Issued shares: (2013, 2012 and 2011 – 814,894,624) at paid-in amount | 4,709 |
| | 4,481 |
| | 4,273 |
|
| Treasury stock: (2013 – 177,072,282; 2012 – 159,846,131 shares; and 2011 – 167,361,280 shares) at cost | (11,854 | ) | | (10,074 | ) | | (10,281 | ) |
| Profit employed in the business | 31,854 |
| | 29,558 |
| | 25,219 |
|
| Accumulated other comprehensive income (loss) | (3,898 | ) | | (6,433 | ) | | (6,328 | ) |
| Noncontrolling interests | 67 |
| | 50 |
| | 46 |
|
| Total stockholders’ equity | 20,878 |
| | 17,582 |
| | 12,929 |
|
| Total liabilities, redeemable noncontrolling interest and stockholders’ equity | $ | 84,896 |
| | $ | 88,970 |
| | $ | 81,218 |
|
| | | | | | |
|
| | | | |
| See accompanying notes to Consolidated Financial Statements. |
|
| | | | | | | | | | | | | | | | | | | | | | | | |
| STATEMENT 4 | | Caterpillar Inc. | | |
| Changes in Consolidated Stockholders’ Equity for the Years Ended December 31 | |
| (Dollars in millions) | | | | | | | | | | | | |
| | Common stock | | Treasury stock | | Profit employed in the business | | Accumulated other comprehensive income (loss) | | Noncontrolling interests | | Total | |
| Balance at January 1, 2011 | $ | 3,888 |
| | $ | (10,397 | ) | | $ | 21,384 |
| | $ | (4,051 | ) | | $ | 40 |
| | $ | 10,864 |
| |
| Profit of consolidated and affiliated companies | — |
| | — |
| | 4,928 |
| | — |
| | 53 |
| | 4,981 |
| |
| Foreign currency translation, net of tax | — |
| | — |
| | — |
| | (345 | ) | | 33 |
| | (312 | ) | |
| Pension and other postretirement benefits, net of tax | — |
| | — |
| | — |
| | (1,873 | ) | | (4 | ) | | (1,877 | ) | |
| Derivative financial instruments, net of tax | — |
| | — |
| | — |
| | (55 | ) | | — |
| | (55 | ) | |
| Available-for-sale securities, net of tax | — |
| | — |
| | — |
| | (4 | ) | | — |
| | (4 | ) | |
| Change in ownership from noncontrolling interests | (1 | ) | | — |
| | — |
| | — |
| | (7 | ) | | (8 | ) | |
| Dividends declared | — |
| | — |
| | (1,176 | ) | | — |
| | — |
| | (1,176 | ) | |
| Distribution to noncontrolling interests | — |
| | — |
| | — |
| | — |
| | (3 | ) | | (3 | ) | |
| Common shares issued from treasury stock for stock-based compensation: 8,710,630 | 7 |
| | 116 |
| | — |
| | — |
| | — |
| | 123 |
| |
| Stock-based compensation expense | 193 |
| | — |
| | — |
| | — |
| | — |
| | 193 |
| |
| Net excess tax benefits from stock-based compensation | 186 |
| | — |
| | — |
| | — |
| | — |
| | 186 |
| |
Cat Japan share redemption 1 | — |
| | — |
| | 83 |
| | — |
| | (66 | ) | | 17 |
| |
| Balance at December 31, 2011 | $ | 4,273 |
| | $ | (10,281 | ) | | $ | 25,219 |
| | $ | (6,328 | ) | | $ | 46 |
| | $ | 12,929 |
| |
| Profit of consolidated and affiliated companies | — |
| | — |
| | 5,681 |
| | — |
| | 41 |
| | 5,722 |
| |
| Foreign currency translation, net of tax | — |
| | — |
| | — |
| | 83 |
| | (23 | ) | | 60 |
| |
| Pension and other postretirement benefits, net of tax | — |
| | — |
| | — |
| | (285 | ) | | 5 |
| | (280 | ) | |
| Derivative financial instruments, net of tax | — |
| | — |
| | — |
| | (32 | ) | | — |
| | (32 | ) | |
| Available-for-sale securities, net of tax | — |
| | — |
| | — |
| | 22 |
| | 1 |
| | 23 |
| |
| Change in ownership from noncontrolling interests | — |
| | — |
| | — |
| | — |
| | (4 | ) | | (4 | ) | |
| Dividends declared | — |
| | — |
| | (1,319 | ) | | — |
| | — |
| | (1,319 | ) | |
| Distribution to noncontrolling interests | — |
| | — |
| | — |
| | — |
| | (6 | ) | | (6 | ) | |
| Common shares issued from treasury stock for stock-based compensation: 7,515,149 | (155 | ) | | 207 |
| | — |
| | — |
| | — |
| | 52 |
| |
| Stock-based compensation expense | 245 |
| | — |
| | — |
| | — |
| | — |
| | 245 |
| |
| Net excess tax benefits from stock-based compensation | 192 |
| | — |
| | — |
| | — |
| | — |
| | 192 |
| |
Cat Japan share redemption 1 | (74 | ) | | — |
| | (23 | ) | | 107 |
| | (10 | ) | | — |
| |
| Balance at December 31, 2012 | $ | 4,481 |
| | $ | (10,074 | ) | | $ | 29,558 |
| | $ | (6,433 | ) | | $ | 50 |
| | $ | 17,582 |
| |
(Continued)
|
| | | | | | | | | | | | | | | | | | | | | | | | |
| STATEMENT 4 | | Caterpillar Inc. | | |
| Changes in Consolidated Stockholders’ Equity for the Years Ended December 31 | |
| (Dollars in millions) | | | | | | | | | | | | |
| | Common stock | | Treasury stock | | Profit employed in the business | | Accumulated other comprehensive income (loss) | | Noncontrolling interests | | Total | |
| Balance at December 31, 2012 | $ | 4,481 |
| | $ | (10,074 | ) | | $ | 29,558 |
| | $ | (6,433 | ) | | $ | 50 |
| | $ | 17,582 |
| |
| Profit of consolidated and affiliated companies | — |
| | — |
| | 3,789 |
| | — |
| | 14 |
| | 3,803 |
| |
| Foreign currency translation, net of tax | — |
| | — |
| | — |
| | (280 | ) | | 3 |
| | (277 | ) | |
| Pension and other postretirement benefits, net of tax | — |
| | — |
| | — |
| | 2,762 |
| | — |
| | 2,762 |
| |
| Derivative financial instruments, net of tax | — |
| | — |
| | — |
| | 37 |
| | — |
| | 37 |
| |
| Available-for-sale securities, net of tax | — |
| | — |
| | — |
| | 16 |
| | — |
| | 16 |
| |
| Change in ownership from noncontrolling interests | (6 | ) | | — |
| | — |
| | — |
| | 13 |
| | 7 |
| |
| Dividends declared | — |
| | — |
| | (1,493 | ) | | — |
| | — |
| | (1,493 | ) | |
| Distribution to noncontrolling interests | — |
| | — |
| | — |
| | — |
| | (13 | ) | | (13 | ) | |
| Common shares issued from treasury stock for stock-based compensation: 6,258,692 | (92 | ) | | 220 |
| | — |
| | — |
| | — |
| | 128 |
| |
| Stock-based compensation expense | 231 |
| | — |
| | — |
| | — |
| | — |
| | 231 |
| |
| Net excess tax benefits from stock-based compensation | 95 |
| | — |
| | — |
| | — |
| | — |
| | 95 |
| |
Common shares repurchased: 23,484,843 2 | — |
| | (2,000 | ) | | — |
| | — |
| | — |
| | (2,000 | ) | |
| Balance at December 31, 2013 | $ | 4,709 |
| | $ | (11,854 | ) | | $ | 31,854 |
| | $ | (3,898 | ) | | $ | 67 |
| | $ | 20,878 |
| |
| |
1 | See Note 25 regarding the Cat Japan share redemption. |
| |
2 | See Note 16 regarding shares repurchased. |
|
| | | | |
| See accompanying notes to Consolidated Financial Statements. |
|
| | | | | | | | | | | |
| STATEMENT 5 | | Caterpillar Inc. | |
| Consolidated Statement of Cash Flow for the Years Ended December 31 | | | | | |
| (Millions of dollars) | | | | | |
| | 2013 | | 2012 | | 2011 |
| Cash flow from operating activities: | |
| | |
| | |
|
| Profit of consolidated and affiliated companies | $ | 3,803 |
| | $ | 5,722 |
| | $ | 4,981 |
|
| Adjustments for non-cash items: | |
| | |
| | |
|
| Depreciation and amortization | 3,087 |
| | 2,813 |
| | 2,527 |
|
| Net gain from sale of businesses and investments | (68 | ) | | (630 | ) | | (128 | ) |
| Goodwill impairment charge | — |
| | 580 |
| | — |
|
| Other | 550 |
| | 439 |
| | 585 |
|
| Changes in assets and liabilities, net of acquisitions and divestitures: | |
| | |
| | |
|
| Receivables - trade and other | 835 |
| | (15 | ) | | (1,409 | ) |
| Inventories | 2,658 |
| | (1,149 | ) | | (2,927 | ) |
| Accounts payable | 134 |
| | (1,868 | ) | | 1,555 |
|
| Accrued expenses | (108 | ) | | 126 |
| | 255 |
|
| Accrued wages, salaries and employee benefits | (279 | ) | | (490 | ) | | 619 |
|
| Customer advances | (301 | ) | | 83 |
| | 237 |
|
| Other assets - net | (49 | ) | | 252 |
| | (91 | ) |
| Other liabilities - net | (71 | ) | | (679 | ) | | 753 |
|
| Net cash provided by (used for) operating activities | 10,191 |
| | 5,184 |
| | 6,957 |
|
| | | | | | |
| Cash flow from investing activities: | |
| | |
| | |
|
| Capital expenditures - excluding equipment leased to others | (2,522 | ) | | (3,350 | ) | | (2,515 | ) |
| Expenditures for equipment leased to others | (1,924 | ) | | (1,726 | ) | | (1,409 | ) |
| Proceeds from disposals of leased assets and property, plant and equipment | 844 |
| | 1,117 |
| | 1,354 |
|
| Additions to finance receivables | (11,422 | ) | | (12,010 | ) | | (10,001 | ) |
| Collections of finance receivables | 9,567 |
| | 8,995 |
| | 8,874 |
|
| Proceeds from sale of finance receivables | 220 |
| | 132 |
| | 207 |
|
| Investments and acquisitions (net of cash acquired) | (195 | ) | | (618 | ) | | (8,184 | ) |
| Proceeds from sale of businesses and investments (net of cash sold) | 365 |
| | 1,199 |
| | 376 |
|
| Proceeds from sale of available-for-sale securities | 449 |
| | 306 |
| | 247 |
|
| Investments in available-for-sale securities | (402 | ) | | (402 | ) | | (336 | ) |
| Other - net | (26 | ) | | 167 |
| | (40 | ) |
| Net cash provided by (used for) investing activities | (5,046 | ) | | (6,190 | ) | | (11,427 | ) |
| | | | | | |
| Cash flow from financing activities: | |
| | |
| | |
|
| Dividends paid | (1,111 | ) | | (1,617 | ) | | (1,159 | ) |
| Distribution to noncontrolling interests | (13 | ) | | (6 | ) | | (3 | ) |
| Common stock issued, including treasury shares reissued | 128 |
| | 52 |
| | 123 |
|
| Treasury shares purchased | (2,000 | ) | | — |
| | — |
|
| Excess tax benefit from stock-based compensation | 96 |
| | 192 |
| | 189 |
|
| Acquisitions of redeemable noncontrolling interests | — |
| | (444 | ) | | — |
|
| Acquisitions of noncontrolling interests | — |
| | (5 | ) | | (8 | ) |
| Proceeds from debt issued (original maturities greater than three months): | |
| | |
| | |
|
| - Machinery and Power Systems | 195 |
| | 2,209 |
| | 4,587 |
|
| - Financial Products | 9,133 |
| | 13,806 |
| | 10,873 |
|
| Payments on debt (original maturities greater than three months): | |
| | |
| | |
|
| - Machinery and Power Systems | (1,769 | ) | | (1,107 | ) | | (2,269 | ) |
| - Financial Products | (9,101 | ) | | (9,940 | ) | | (8,277 | ) |
| Short-term borrowings - net (original maturities three months or less) | (69 | ) | | 466 |
| | (37 | ) |
| Net cash provided by (used for) financing activities | (4,511 | ) | | 3,606 |
| | 4,019 |
|
| Effect of exchange rate changes on cash | (43 | ) | | (167 | ) | | (84 | ) |
| Increase (decrease) in cash and short-term investments | 591 |
| | 2,433 |
| | (535 | ) |
| Cash and short-term investments at beginning of period | 5,490 |
| | 3,057 |
| | 3,592 |
|
| Cash and short-term investments at end of period | $ | 6,081 |
| | $ | 5,490 |
| | $ | 3,057 |
|
All short-term investments, which consist primarily of highly liquid investments with original maturities of three months or less, are considered to be cash equivalents.
Non-cash activities: In 2012, $1,325 million of debentures with varying interest rates and maturity dates were exchanged for $1,722 million of 3.803% debentures due in 2042 and $179 million of cash. The $179 million of cash paid is included in Other liabilities – net in the operating activities section of the Consolidated Statement of Cash Flow.
|
| | | | |
| See accompanying notes to Consolidated Financial Statements. |
NOTES TO CONSOLIDATED FINANCIAL STATEMENTS
| |
| 1. | Operations and summary of significant accounting policies |
Information in our financial statements and related commentary are presented in the following categories:
Machinery and Power Systems – Represents the aggregate total of Construction Industries, Resource Industries, Power Systems, and the All Other segment and related corporate items and eliminations.
Financial Products – Primarily includes the company’s Financial Products Segment. This category includes Caterpillar Financial Services Corporation (Cat Financial), Caterpillar Financial Insurance Services (Insurance Services) and their respective subsidiaries.
Our products are sold primarily under the brands “Caterpillar,” “CAT,” design versions of “CAT” and “Caterpillar,” “Electro-Motive,” “FG Wilson,” “MaK,” “MWM,” “Perkins,” “Progress Rail,” “SEM” and “Solar Turbines”.
We conduct operations in our Machinery and Power Systems lines of business under highly competitive conditions, including intense price competition. We place great emphasis on the high quality and performance of our products and our dealers’ service support. Although no one competitor is believed to produce all of the same types of machines and engines that we do, there are numerous companies, large and small, which compete with us in the sale of each of our products.
Our machines are distributed principally through a worldwide organization of dealers (dealer network), 48 located in the United States and 130 located outside the United States, serving 182 countries and operating 3,454 places of business, including 1,202 dealer rental outlets. Reciprocating engines are sold principally through the dealer network and to other manufacturers for use in products. Some of the reciprocating engines manufactured by our subsidiary Perkins Engines Company Limited, are also sold through a worldwide network of 100 distributors located in 180 countries. Most of the electric power generation systems manufactured by our subsidiary Caterpillar Northern Ireland Limited, formerly known as F.G. Wilson Engineering Limited, are sold through its worldwide network of 264 distributors located in 145 countries. Some of the large, medium speed reciprocating engines are also sold under the MaK brand through a worldwide network of 19 distributors located in 130 countries. Our dealers do not deal exclusively with our products; however, in most cases sales and servicing of our products are the dealers’ principal business. Turbines, locomotives and certain global mining products are sold directly to end customers through sales forces employed by the company. At times, these employees are assisted by independent sales representatives.
The Financial Products line of business also conducts operations under highly competitive conditions. Financing for users of Caterpillar products is available through a variety of competitive sources, principally commercial banks and finance and leasing companies. We emphasize prompt and responsive service to meet customer requirements and offer various financing plans designed to increase the opportunity for sales of our products and generate financing income for our company. A significant portion of Financial Products activity is conducted in North America, with additional offices in Asia/Pacific, Europe and Latin America.
The consolidated financial statements include the accounts of Caterpillar Inc. and its subsidiaries where we have a controlling financial interest.
We consolidate all variable interest entities (VIEs) where Caterpillar Inc. is the primary beneficiary. For VIEs, we assess whether we are the primary beneficiary as prescribed by the accounting guidance on the consolidation of VIEs. The primary beneficiary of a VIE is the party that has both the power to direct the activities that most significantly impact the entity’s economic performance, and the obligation to absorb losses or the right to receive benefits that could potentially be significant to the VIE.
Investments in companies that are owned 20 percent to 50 percent or are less than 20 percent owned and for which we have significant influence are accounted for by the equity method. See Note 9 for further discussion.
Certain amounts for prior years have been reclassified to conform with the current-year financial statement presentation.
We have revised previously reported cash flows from operating and financing activities on Statement 5 for the years ended December 31, 2012 and 2011 to correct for the impact of interest payments on certain Cat Financial bank borrowings. Cash provided by operating activities decreased from the amounts previously reported by $57 million and $53 million for the years ended December 31, 2012 and 2011, respectively. Cash provided by financing activities increased by the same amounts for the respective periods. Management has concluded that the impact was not material to any annual period.
We have also revised previously reported balances on Statement 3 as of December 31, 2012 and 2011 to correct for customer advances invoiced but not yet paid. Receivables - trade and other decreased from the amounts previously reported by $386 million and $228 million as of December 31, 2012 and 2011, respectively. Customer advances decreased from the amounts previously reported by $340 million and $204 million as of December 31, 2012 and 2011, respectively. Other (long-term) liabilities also decreased from the amounts previously reported by $46 million and $24 million as of December 31, 2012 and 2011, respectively. Although the revision did not impact Net cash provided by (used for) operating activities on Statement 5, we have revised the impacted operating cash flow line items for the years ended December 31, 2012 and 2011. Management has concluded that the impact was not material to any period presented.
Shipping and handling costs are included in Cost of goods sold in Statement 1. Other operating (income) expenses primarily include Cat Financial’s depreciation of equipment leased to others, Insurance Services’ underwriting expenses, gains (losses) on disposal of long-lived assets and business divestitures, long-lived asset impairment charges, legal settlements, employee separation charges and benefit plan curtailment, settlement and contractual termination benefits.
Prepaid expenses and other current assets in Statement 3 include prepaid rent, prepaid insurance, assets held for sale, core to be returned for remanufacturing, restricted cash and other short-term investments, and other prepaid items.
| |
| C. | Sales and revenue recognition |
Sales of Machinery and Power Systems are recognized and earned when all the following criteria are satisfied: (a) persuasive evidence of a sales arrangement exists; (b) price is fixed and determinable; (c) collectability is reasonably assured; and (d) delivery has occurred. Persuasive evidence of an arrangement and a fixed or determinable price exist once we receive an order or contract from a customer or independently owned and operated dealer. We assess collectability at the time of the sale and if collectability is not reasonably assured, the sale is deferred and not recognized until collectability is probable or payment is received. Typically, where product is produced and sold in the same country, title and risk of ownership transfer when the product is shipped. Products that are exported from a country for sale typically pass title and risk of ownership at the border of the destination country.
Sales of certain turbine machinery units, draglines, large shovels and long wall roof supports are recognized under accounting for construction-type contracts, primarily using the percentage-of-completion method. Revenue is recognized based upon progress towards completion, which is estimated and continually updated over the course of construction. We provide for any loss that we expect to incur on these contracts when that loss is probable.
Our remanufacturing operations are primarily focused on the remanufacture of Cat engines and components and rail related products. In this business, used engines and related components (core) are inspected, cleaned and remanufactured. In connection with the sale of most of our remanufactured product, we collect a deposit from the dealer that is repaid if the dealer returns an acceptable core within a specified time period. Caterpillar owns and has title to the cores when they are returned from dealers. The rebuilt engine or component (the core plus any new content) is then sold as a remanufactured product to dealers and customers. Revenue is recognized pursuant to the same criteria as machinery and power systems sales noted above (title to the entire remanufactured product passes to the dealer upon sale). At the time of sale, the deposit is recognized in Other current liabilities in Statement 3. In addition, the core to be returned is recognized as an asset in Prepaid expenses and other current assets in Statement 3 at the estimated replacement cost (based on historical experience with useable cores). Upon receipt of an acceptable core, we repay the deposit and relieve the liability. The returned core is then included in inventory. In the event that the deposit is forfeited (i.e. upon failure by the dealer to return an acceptable core in the specified time period), we recognize the core deposit and the cost of the core in Sales and Cost of goods sold, respectively.
No right of return exists on sales of equipment. Replacement part returns are estimable and accrued at the time a sale is recognized.
We provide discounts to dealers through merchandising programs. We have numerous programs that are designed to promote the sale of our products. The most common dealer programs provide a discount when the dealer sells a product to a targeted end user. The cost of these discounts is estimated based on historical experience and known changes in merchandising programs and is reported as a reduction to sales when the product sale is recognized.
Our standard dealer invoice terms are established by marketing region. Our invoice terms for end-user customer sales are established by the responsible business unit. When a sale is made to a dealer, the dealer is responsible for payment even if the product is not sold to an end customer. Dealers and customers must make payment within the established invoice terms to avoid potential interest costs. Interest at or above prevailing market rates may be charged on any past due balance, and generally our practice is to not forgive this interest. In 2013, terms were extended to not more than one year for $706 million of receivables, which represent approximately 1 percent of consolidated sales. In 2012 and 2011, terms were extended to not more than one year for $354 million and $341 million of receivables, respectively, which represent less than 1 percent of consolidated sales.
We establish a bad debt allowance for Machinery and Power Systems receivables when it becomes probable that the receivable will not be collected. Our allowance for bad debts is not significant.
Revenues of Financial Products primarily represent the following Cat Financial revenues:
| |
| • | Retail finance revenue on finance leases and installment sale contracts is recognized over the term of the contract at a constant rate of return on the scheduled outstanding principal balance. Revenue on retail notes is recognized based on the daily balance of retail receivables outstanding and the applicable effective interest rate. |
| |
| • | Operating lease revenue is recorded on a straight-line basis in the period earned over the life of the contract. |
| |
| • | Cat Financial provides wholesale inventory financing to dealers. Wholesale finance revenue on installment sale contracts and finance leases related to financing dealer inventory and rental fleets is recognized over the term of the contract at a constant rate of return on the scheduled outstanding principal balance. Revenue on wholesale notes is recognized based on the daily balance of wholesale receivables outstanding and the applicable effective interest rate. |
| |
| • | Loan origination and commitment fees are deferred and amortized to revenue using the interest method over the life of the finance receivables. |
Recognition of income is suspended and the loan or finance lease is placed on non-accrual status when management determines that collection of future income is not probable (generally after 120 days past due except in locations where local regulatory requirements dictate a different method, or instances in which relevant information is known that warrants placing the loan or finance lease on non-accrual status). Accrual is resumed, and previously suspended income is recognized, when the receivable becomes contractually current and/or collection doubts are removed. See Note 6 for more information.
Sales and revenues are presented net of sales and other related taxes.
Inventories are stated at the lower of cost or market. Cost is principally determined using the last-in, first-out (LIFO) method. The value of inventories on the LIFO basis represented about 60 percent of total inventories at December 31, 2013 and 2012, and about 65 percent at December 31, 2011.
If the FIFO (first-in, first-out) method had been in use, inventories would have been $2,504 million, $2,750 million and $2,422 million higher than reported at December 31, 2013, 2012 and 2011, respectively.
| |
| E. | Depreciation and amortization |
Depreciation of plant and equipment is computed principally using accelerated methods. Depreciation on equipment leased to others, primarily for Financial Products, is computed using the straight-line method over the term of the lease. The depreciable basis is the original cost of the equipment less the estimated residual value of the equipment at the end of the lease term. In 2013, 2012 and 2011, Cat Financial depreciation on equipment leased to others was $768 million, $688 million and $690 million, respectively, and was included in Other operating (income) expenses in Statement 1. In 2013, 2012 and 2011, consolidated depreciation expense was $2,710 million, $2,421 million and $2,240 million, respectively. Amortization of purchased finite-lived intangibles is computed principally using the straight-line method, generally not to exceed a period of 20 years.
| |
| F. | Foreign currency translation |
The functional currency for most of our Machinery and Power Systems consolidated companies is the U.S. dollar. The functional currency for most of our Financial Products and affiliates accounted for under the equity method is the respective local currency. Gains and losses resulting from the remeasurement of foreign currency amounts to the functional currency are included in Other income (expense) in Statement 1. Gains and losses resulting from translating assets and liabilities from the functional currency to U.S. dollars are included in Accumulated other comprehensive income (loss) in Statement 3.
| |
| G. | Derivative financial instruments |
Our earnings and cash flow are subject to fluctuations due to changes in foreign currency exchange rates, interest rates and commodity prices. Our Risk Management Policy (policy) allows for the use of derivative financial instruments to prudently manage foreign currency exchange rate, interest rate and commodity price exposures. Our policy specifies that derivatives are not to be used for speculative purposes. Derivatives that we use are primarily foreign currency forward, option, and cross currency contracts, interest rate swaps, and commodity forward and option contracts. All derivatives are recorded at fair value. See Note 3 for more information.
The provision for income taxes is determined using the asset and liability approach taking into account guidance related to uncertain tax positions. Tax laws require items to be included in tax filings at different times than the items are reflected in the financial statements. A current liability is recognized for the estimated taxes payable for the current year. Deferred taxes represent the future tax consequences expected to occur when the reported amounts of assets and liabilities are recovered or paid. Deferred taxes are adjusted for enacted changes in tax rates and tax laws. Valuation allowances are recorded to reduce deferred tax assets when it is more likely than not that a tax benefit will not be realized.
| |
| I. | Estimates in financial statements |
The preparation of financial statements in conformity with accounting principles generally accepted in the United States of America requires management to make estimates and assumptions that affect reported amounts. The more significant estimates include: residual values for leased assets, fair values for goodwill impairment tests, impairment of available-for-sale securities, warranty liability, stock-based compensation and reserves for product liability and insurance losses, postretirement benefits, post-sale discounts, credit losses and income taxes.
| |
| J. | New accounting guidance |
Presentation of comprehensive income – In June 2011, the Financial Accounting Standards Board (FASB) issued accounting guidance on the presentation of comprehensive income. The guidance provides two options for presenting net income and other comprehensive income. The total of comprehensive income, the components of net income, and the components of other comprehensive income may be presented in either a single continuous statement of comprehensive income or in two separate but consecutive statements. We elected to present two separate statements. This guidance was effective January 1, 2012.
Goodwill impairment testing – In September 2011, the FASB issued accounting guidance on the testing of goodwill for impairment. The guidance allows entities testing goodwill for impairment the option of performing a qualitative assessment to determine the likelihood of goodwill impairment and whether it is necessary to perform the two-step impairment test currently required. This guidance was effective for annual and interim goodwill impairment tests performed for fiscal years beginning after December 15, 2011. Early adoption was permitted. We elected to early adopt this guidance for the year ended December 31, 2011 and the guidance did not have a material impact on our financial statements.
Disclosures about offsetting assets and liabilities – In December 2011, the FASB issued accounting guidance on disclosures about offsetting assets and liabilities. The guidance requires entities to disclose both gross and net information about instruments and transactions that are offset in the statement of financial position, as well as instruments and transactions that are subject to an enforceable master netting arrangement or similar agreement. In January 2013, the FASB issued guidance clarifying the scope of the disclosures to apply only to derivatives, including bifurcated embedded derivatives, repurchase and reverse repurchase agreements, and securities lending and securities borrowing transactions. This guidance was effective January 1, 2013, with retrospective application required. The guidance did not have a material impact on our financial statements. See Note 3 for additional information.
Indefinite-lived intangible assets impairment testing – In July 2012, the FASB issued accounting guidance on the testing of indefinite-lived intangible assets for impairment. The guidance allows entities to first perform a qualitative assessment to determine the likelihood of an impairment for an indefinite-lived intangible asset and whether it is necessary to perform the quantitative impairment assessment currently required. This guidance was effective January 1, 2013 and did not have a material impact on our financial statements.
Reporting of amounts reclassified out of accumulated other comprehensive income – In February 2013, the FASB issued accounting guidance on the reporting of reclassifications out of accumulated other comprehensive income. The guidance requires an entity to present, either on the face of the statement where net income is presented or in the notes, significant amounts reclassified out of accumulated other comprehensive income by the respective line items of net income if the amount is reclassified to net income in its entirety in the same reporting period. For other amounts not required to be reclassified in their entirety to net income in the same reporting period, a cross reference to other disclosures that provide additional detail about the reclassification amounts is required. This guidance was effective January 1, 2013 and did not have a material impact on our financial statements. See Note 17 for additional information.
Joint and several liability arrangements – In February 2013, the FASB issued accounting guidance on the recognition, measurement and disclosure of obligations resulting from joint and several liability arrangements. The guidance requires an entity to measure obligations resulting from joint and several liability arrangements for which the total amount of the obligation within the scope of this guidance is fixed at the reporting date, as the sum of the amount the reporting entity agreed to pay on the basis of its arrangement among its co-obligors and any additional amount the reporting entity expects to pay on behalf of its co-obligors. The entity is also required to disclose the nature and amount of the obligation as well as any other information about those obligations. This guidance is effective January 1, 2014, with retrospective application required. We do not expect the adoption to have a material impact on our financial statements.
Parent's accounting for the cumulative translation adjustment upon derecognition of certain subsidiaries or groups of assets within a foreign entity or of an investment in a foreign entity – In March 2013, the FASB issued accounting guidance on the parent's accounting for the cumulative translation adjustment (CTA) upon derecognition of certain subsidiaries or groups of assets within a foreign entity or of an investment in a foreign entity. The new standard clarifies existing guidance regarding when the CTA should be released into earnings upon various deconsolidation and consolidation transactions. This guidance is effective January 1, 2014. We do not expect the adoption to have a material impact on our financial statements.
Presentation of an unrecognized tax benefit when a net operating loss carryforward, a similar tax loss, or a tax credit carryforward exists – In July 2013, the FASB issued accounting guidance on the financial statement presentation of an unrecognized tax benefit when a net operating loss carryforward, a similar tax loss, or a tax credit carryforward exists. The guidance requires an unrecognized tax benefit, or a portion of an unrecognized tax benefit, to be presented as a reduction to a deferred tax asset for a net operating loss carryforward, a similar tax loss, or a tax credit carryforward in the financial statements if available under the applicable tax jurisdiction. The guidance is effective January 1, 2014. We do not expect the adoption to have a material impact on our financial statements.
For acquisitions accounted for as a business combination, goodwill represents the excess of the cost over the fair value of the net assets acquired. We are required to test goodwill for impairment, at the reporting unit level, annually and when events or circumstances indicate the fair value of a reporting unit may be below its carrying value. A reporting unit is an operating segment or one level below an operating segment (referred to as a component) to which goodwill is assigned when initially recorded. We assign goodwill to reporting units based on our integration plans and the expected synergies resulting from the acquisition. Because Caterpillar is a highly integrated company, the businesses we acquire are sometimes combined with or integrated into existing reporting units. When changes occur in the composition of our operating segments or reporting units, goodwill is reassigned to the affected reporting units based on their relative fair values.
We test goodwill for impairment annually and whenever events or circumstances make it more likely than not that an impairment may have occurred. We perform our annual goodwill impairment test as of October 1 and monitor for interim triggering events on an ongoing basis. Goodwill is reviewed for impairment utilizing a qualitative assessment or a two-step process. We have an option to make a qualitative assessment of a reporting unit’s goodwill for impairment. If we choose to perform a qualitative assessment and determine the fair value more likely than not exceeds the carrying value, no further evaluation is necessary. For reporting units where we perform the two-step process, the first step requires us to compare the fair value of each reporting unit, which we primarily determine using an income approach based on the present value of discounted cash flows, to the respective carrying value, which includes goodwill. If the fair value of the reporting unit exceeds its carrying value, the goodwill is not considered impaired. If the carrying value is higher than the fair value, there is an indication that an impairment may exist and the second step is required. In step two, the implied fair value of goodwill is calculated as the excess of the fair value of a reporting unit over the fair values assigned to its assets and liabilities. If the implied fair value of goodwill is less than the carrying value of the reporting unit’s goodwill, the difference is recognized as an impairment loss. See Note 10 for further details.
For those businesses where management has committed to a plan to divest, which is typically demonstrated by approval from the Board of Directors or Group President, each business is valued at the lower of its carrying amount or estimated fair value less cost to sell. If the carrying amount of the business exceeds its estimated fair value, an impairment loss is recognized. The fair values are estimated using accepted valuation techniques such as a discounted cash flow model, valuations performed by third parties, or indicative bids, when available. A number of significant estimates and assumptions are involved in the application of these techniques, including the forecasting of markets and market share, sales volumes and prices, costs and expenses, and multiple other factors. Management considers historical experience and all available information at the time the estimates are made; however, the fair values that are ultimately realized upon the sale of the businesses to be divested may differ from the estimated fair values reflected in the Consolidated Financial Statements.
| |
| 2. | Stock-based compensation |
Our stock-based compensation plans primarily provide for the granting of stock options, stock-settled stock appreciation rights (SARs) and restricted stock units (RSUs) to Officers and other key employees, as well as non-employee Directors. Stock options permit a holder to buy Caterpillar stock at the stock’s price when the option was granted. SARs permit a holder the right to receive the value in shares of the appreciation in Caterpillar stock that occurred from the date the right was granted up to the date of exercise. A restricted stock unit (RSU) is an agreement to issue shares of Caterpillar stock at the time of vesting.
Our long-standing practices and policies specify all stock-based compensation awards are approved by the Compensation Committee (the Committee) of the Board of Directors on the date of grant. The stock-based award approval process specifies the number of awards granted, the terms of the award and the grant date. The same terms and conditions are consistently applied to all employee grants, including Officers. The Committee approves all individual Officer grants. The number of stock-based compensation awards included in an individual’s award is determined based on the methodology approved by the Committee. In 2007, under the terms of the Caterpillar Inc. 2006 Long-Term Incentive Plan (approved by stockholders in June of 2006), the Compensation Committee approved the exercise price methodology to be the closing price of the Company stock on the date of the grant.
Common stock issued from Treasury stock under the plans totaled 6,258,692 for 2013, 7,515,149 for 2012 and 8,710,630 for 2011.
Awards generally vest three years after the date of grant. At grant, SARs and option awards have a term life of ten years. Upon separation from service, if the participant is 55 years of age or older with more than five years of service, the participant meets the criteria for a “Long Service Separation”. If the “Long Service Separation” criteria are met, the vested options/SARs will have a life that is the lesser of ten years from the original grant date or five years from the separation date.
Our stock-based compensation plans allow for the immediate vesting upon separation for employees who meet the criteria for a “Long Service Separation” and who have fulfilled the requisite service period of six months. Compensation expense is recognized over the period from the grant date to the end date of the requisite service period for employees who meet the immediate vesting upon retirement requirements. For those employees who become eligible for immediate vesting upon retirement subsequent to the requisite service period and prior to the completion of the vesting period, compensation expense is recognized over the period from grant date to the date eligibility is achieved.
Accounting guidance on share-based payments requires companies to estimate the fair value of options/SARs on the date of grant using an option-pricing model. The fair value of the option/SAR grant was estimated using a lattice-based option-pricing model. The lattice-based option-pricing model considers a range of assumptions related to volatility, risk-free interest rate and historical employee behavior. Expected volatility was based on historical and current implied volatilities from traded options on our stock. The risk-free rate was based on U.S. Treasury security yields at the time of grant. The weighted-average dividend yield was based on historical information. The expected life was determined from the lattice-based model. The lattice-based model incorporated exercise and post vesting forfeiture assumptions based on analysis of historical data. The following table provides the assumptions used in determining the fair value of the stock-based awards for the years ended December 31, 2013, 2012 and 2011, respectively.
|
| | | | | | | | |
| | | | | | |
| | Grant Year |
| | 2013 | | 2012 | | 2011 |
| Weighted-average dividend yield | 2.1 | % | | 2.2 | % | | 2.2 | % |
| Weighted-average volatility | 30.6 | % | | 35.0 | % | | 32.7 | % |
| Range of volatilities | 23.4-40.6% |
| | 33.3-40.4% |
| | 20.9-45.4% |
|
| Range of risk-free interest rates | 0.16-1.88% |
| | 0.17-2.00% |
| | 0.25-3.51% |
|
| Weighted-average expected lives | 8 years |
| | 7 years |
| | 8 years |
|
| | | | | | |
The fair value of the RSU grant was determined by reducing the stock price on the day of grant by the present value of the estimated dividends to be paid during the vesting period. The estimated dividends are based on Caterpillar’s weighted-average dividend yield.
The amount of stock-based compensation expense capitalized for the years ended December 31, 2013, 2012 and 2011 did not have a significant impact on our financial statements.
At December 31, 2013, there was $193 million of total unrecognized compensation cost from stock-based compensation arrangements granted under the plans, which is related to non-vested stock-based awards. The compensation expense is expected to be recognized over a weighted-average period of approximately 1.8 years.
Please refer to Tables I and II below for additional information on our stock-based awards.
|
| | | | | | | | | | | | | | | | | | | | |
| TABLE I — Financial Information Related to Stock-based Compensation |
| | 2013 | | 2012 | | 2011 |
| | Shares | | Weighted- Average Exercise Price | | Shares | | Weighted- Average Exercise Price | | Shares | | Weighted- Average Exercise Price |
| Stock options/SARs activity: | |
| | |
| | |
| | |
| | |
| | |
|
| Outstanding at beginning of year | 45,827,599 |
| | $ | 59.45 |
| | 50,372,991 |
| | $ | 53.01 |
| | 57,882,998 |
| | $ | 48.50 |
|
Granted to officers and key employees 1 | 4,276,060 |
| | $ | 89.75 |
| | 3,318,188 |
| | $ | 110.09 |
| | 2,960,595 |
| | $ | 102.13 |
|
| Exercised | (6,476,082 | ) | | $ | 41.10 |
| | (7,708,343 | ) | | $ | 38.73 |
| | (10,149,476 | ) | | $ | 41.78 |
|
| Forfeited / expired | (251,830 | ) | | $ | 84.64 |
| | (155,237 | ) | | $ | 67.50 |
| | (321,126 | ) | | $ | 48.02 |
|
| Outstanding at end of year | 43,375,747 |
| | $ | 65.03 |
| | 45,827,599 |
| | $ | 59.45 |
| | 50,372,991 |
| | $ | 53.01 |
|
| Exercisable at year-end | 34,200,054 |
| | $ | 55.93 |
| | 33,962,000 |
| | $ | 51.75 |
| | 35,523,057 |
| | $ | 52.66 |
|
| | | | | | | | | | | | |
| RSUs activity: | |
| | |
| | |
| | |
| | |
| | |
|
| Outstanding at beginning of year | 3,580,220 |
| | |
| | 4,281,490 |
| | |
| | 4,650,241 |
| | |
|
| Granted to officers and key employees | 1,614,870 |
| | |
| | 1,429,939 |
| | |
| | 1,082,032 |
| | |
|
| Vested | (1,286,934 | ) | | |
| | (2,077,485 | ) | | |
| | (1,382,539 | ) | | |
|
| Forfeited | (84,828 | ) | | |
| | (53,724 | ) | | |
| | (68,244 | ) | | |
|
| Outstanding at end of year | 3,823,328 |
| | |
| | 3,580,220 |
| | |
| | 4,281,490 |
| | |
|
|
| | | | | | | | | | | | | | | | | | | | | | | | | | |
| Stock options/SARs outstanding and exercisable: |
| | | Outstanding | | Exercisable |
| Exercise Prices | | Shares Outstanding at 12/31/13 | | Weighted- Average Remaining Contractual Life (Years) | | Weighted- Average Exercise Price | | Aggregate Intrinsic Value 2 | | Shares Outstanding at 12/31/13 | | Weighted- Average Remaining Contractual Life (Years) | | Weighted- Average Exercise Price | | Aggregate Intrinsic Value 2 |
| $22.17 – 38.63 | | 7,775,953 |
| | 3.20 | | $ | 29.03 |
| | $ | 481 |
| | 7,775,953 |
| | 3.20 | | $ | 29.03 |
| | $ | 481 |
|
| $40.64 – 57.85 | | 11,656,943 |
| | 4.06 | | $ | 52.71 |
| | 444 |
| | 11,656,943 |
| | 4.06 | | $ | 52.71 |
| | 444 |
|
| $63.04 – 72.05 | | 9,687,583 |
| | 2.48 | | $ | 69.05 |
| | 211 |
| | 9,687,583 |
| | 2.48 | | $ | 69.05 |
| | 211 |
|
| $73.20 – 89.75 | | 8,280,894 |
| | 6.69 | | $ | 81.70 |
| | 75 |
| | 4,174,124 |
| | 4.37 | | $ | 73.86 |
| | 71 |
|
| $102.13 – 110.09 | | 5,974,374 |
| | 7.71 | | $ | 106.28 |
| | — |
| | 905,451 |
| | 7.62 | | $ | 105.59 |
| | — |
|
| | | 43,375,747 |
| | | | $ | 65.03 |
| | $ | 1,211 |
| | 34,200,054 |
| | | | $ | 55.93 |
| | $ | 1,207 |
|
| |
1 | No SARS were granted during the years ended December 31, 2013 or 2012. Of the 2,960,595 awards granted during the year ended December 31, 2011, 2,722,689 were SARs. |
| |
2 | The difference between a stock award’s exercise price and the underlying stock’s market price at December 31, 2013, for awards with market price greater than the exercise price. Amounts are in millions of dollars. |
The computations of weighted-average exercise prices and aggregate intrinsic values are not applicable to RSUs since an RSU represents an agreement to issue shares of stock at the time of vesting. At December 31, 2013, there were 3,823,328 outstanding RSUs with a weighted average remaining contractual life of 1.3 years.
|
| | | | | | | | | | | | |
| TABLE II— Additional Stock-based Award Information |
| | | | | | | |
| (Dollars in millions except per share data) | | 2013 | | 2012 | | 2011 |
| Stock Options/SARs activity: | | |
| | |
| | |
|
| Weighted-average fair value per share of stock awards granted | | $ | 28.34 |
| | $ | 39.20 |
| | $ | 36.73 |
|
| Intrinsic value of stock awards exercised | | $ | 312 |
| | $ | 488 |
| | $ | 618 |
|
| Fair value of stock awards vested | | $ | 167 |
| | $ | 66 |
| | $ | 96 |
|
| Cash received from stock awards exercised | | $ | 152 |
| | $ | 112 |
| | $ | 161 |
|
| | | | | | | |
| RSUs activity: | | |
| | |
| | |
|
| Weighted-average fair value per share of stock awards granted | | $ | 84.05 |
| | $ | 104.61 |
| | $ | 97.51 |
|
| Fair value of stock awards vested | | $ | 117 |
| | $ | 229 |
| | $ | 143 |
|
| | | | | | | |
Before tax, stock-based compensation expense for 2013, 2012 and 2011 was $231 million, $245 million and $193 million, respectively, with a corresponding income tax benefit of $73 million, $78 million and $61 million, respectively.
In accordance with guidance on share-based payments, we classify stock-based compensation within Cost of goods sold, Selling, general and administrative expenses and Research and development expenses corresponding to the same line item as the cash compensation paid to respective employees, officers and non-employee directors.
We currently use shares in treasury stock to satisfy share award exercises.
The cash tax benefits realized from stock awards exercised for 2013, 2012 and 2011 were $127 million, $217 million and $235 million, respectively. We use the direct only method and tax law ordering approach to calculate the tax effects of stock-based compensation. In certain jurisdictions, tax deductions for exercises of stock-based awards did not generate a cash benefit. A tax benefit of approximately $39 million will be recorded in additional paid-in capital when these deductions reduce our future income taxes payable.
| |
| 3. | Derivative financial instruments and risk management |
Our earnings and cash flow are subject to fluctuations due to changes in foreign currency exchange rates, interest rates and commodity prices. Our Risk Management Policy (policy) allows for the use of derivative financial instruments to prudently manage foreign currency exchange rate, interest rate and commodity price exposures. Our policy specifies that derivatives are not to be used for speculative purposes. Derivatives that we use are primarily foreign currency forward, option and cross currency contracts, interest rate swaps and commodity forward and option contracts. Our derivative activities are subject to the management, direction and control of our senior financial officers. Risk management practices, including the use of financial derivative instruments, are presented to the Audit Committee of the Board of Directors at least annually.
All derivatives are recognized in Statement 3 at their fair value. On the date the derivative contract is entered into, we designate the derivative as (1) a hedge of the fair value of a recognized asset or liability (fair value hedge), (2) a hedge of a forecasted transaction or the variability of cash flow to be paid (cash flow hedge), or (3) an undesignated instrument. Changes in the fair value of a derivative that is qualified, designated and highly effective as a fair value hedge, along with the gain or loss on the hedged recognized asset or liability that is attributable to the hedged risk, are recorded in current earnings. Changes in the fair value of a derivative that is qualified, designated and highly effective as a cash flow hedge are recorded in Accumulated other comprehensive income (loss) (AOCI), to the extent effective, in Statement 3 until they are reclassified to earnings in the same period or periods during which the hedged transaction affects earnings. Changes in the fair value of undesignated derivative instruments and the ineffective portion of designated derivative instruments are reported in current earnings. Cash flow from designated derivative financial instruments are classified within the same category as the item being hedged on Statement 5. Cash flow from undesignated derivative financial instruments are included in the investing category on Statement 5.
We formally document all relationships between hedging instruments and hedged items, as well as the risk-management objective and strategy for undertaking various hedge transactions. This process includes linking all derivatives that are designated as fair value hedges to specific assets and liabilities in Statement 3 and linking cash flow hedges to specific forecasted transactions or variability of cash flow.
We also formally assess, both at the hedge’s inception and on an ongoing basis, whether the designated derivatives that are used in hedging transactions are highly effective in offsetting changes in fair values or cash flow of hedged items. When a derivative is determined not to be highly effective as a hedge or the underlying hedged transaction is no longer probable, we discontinue hedge accounting prospectively, in accordance with the derecognition criteria for hedge accounting.
| |
| A. | Foreign currency exchange rate risk |
Foreign currency exchange rate movements create a degree of risk by affecting the U.S. dollar value of sales made and costs incurred in foreign currencies. Movements in foreign currency rates also affect our competitive position as these changes may affect business practices and/or pricing strategies of non-U.S.-based competitors. Additionally, we have balance sheet positions denominated in foreign currencies, thereby creating exposure to movements in exchange rates.
Our Machinery and Power Systems operations purchase, manufacture and sell products in many locations around the world. As we have a diversified revenue and cost base, we manage our future foreign currency cash flow exposure on a net basis. We use foreign currency forward and option contracts to manage unmatched foreign currency cash inflow and outflow. Our objective is to minimize the risk of exchange rate movements that would reduce the U.S. dollar value of our foreign currency cash flow. Our policy allows for managing anticipated foreign currency cash flow for up to five years.
We generally designate as cash flow hedges at inception of the contract any Australian dollar, Brazilian real, British pound, Canadian dollar, Chinese yuan, euro, Indian rupee, Japanese yen, Mexican peso, Singapore dollar, or Swiss franc forward or option contracts that meet the requirements for hedge accounting and the maturity extends beyond the current quarter-end. Designation is performed on a specific exposure basis to support hedge accounting. The remainder of Machinery and Power Systems foreign currency contracts are undesignated, including any hedges designed to protect our competitive exposure.
As of December 31, 2013, $9 million of deferred net gains, net of tax, included in equity (AOCI in Statement 3), are expected to be reclassified to current earnings (Other income (expense) in Statement 1) over the next twelve months when earnings are affected by the hedged transactions. The actual amount recorded in Other income (expense) will vary based on exchange rates at the time the hedged transactions impact earnings.
In managing foreign currency risk for our Financial Products operations, our objective is to minimize earnings volatility resulting from conversion and the remeasurement of net foreign currency balance sheet positions, and future transactions denominated in foreign currencies. Our policy allows the use of foreign currency forward, option and cross currency contracts to offset the risk of currency mismatch between our receivables and debt, and exchange rate risk associated with future transactions denominated in foreign currencies. Substantially all such foreign currency forward, option and cross currency contracts are undesignated.
Interest rate movements create a degree of risk by affecting the amount of our interest payments and the value of our fixed-rate debt. Our practice is to use interest rate derivatives to manage our exposure to interest rate changes and, in some cases, lower the cost of borrowed funds.
Our Machinery and Power Systems operations generally use fixed rate debt as a source of funding. Our objective is to minimize the cost of borrowed funds. Our policy allows us to enter into fixed-to-floating interest rate swaps and forward rate agreements to meet that objective with the intent to designate as fair value hedges at inception of the contract all fixed-to-floating interest rate swaps. Designation as a hedge of the fair value of our fixed rate debt is performed to support hedge accounting.
Financial Products operations has a match-funding policy that addresses interest rate risk by aligning the interest rate profile (fixed or floating rate) of Cat Financial’s debt portfolio with the interest rate profile of their receivables portfolio within predetermined ranges on an ongoing basis. In connection with that policy, we use interest rate derivative instruments to modify the debt structure to match assets within the receivables portfolio. This matched funding reduces the volatility of margins between interest-bearing assets and interest-bearing liabilities, regardless of which direction interest rates move.
Our policy allows us to use fixed-to-floating, floating-to-fixed, and floating-to-floating interest rate swaps to meet the match-funding objective. We designate fixed-to-floating interest rate swaps as fair value hedges to protect debt against changes in fair value due to changes in the benchmark interest rate. We designate most floating-to-fixed interest rate swaps as cash flow hedges to protect against the variability of cash flows due to changes in the benchmark interest rate.
As of December 31, 2013, $3 million of deferred net losses, net of tax, included in equity (AOCI in Statement 3), related to Financial Products floating-to-fixed interest rate swaps, are expected to be reclassified to current earnings (Interest expense of Financial Products in Statement 1) over the next twelve months. The actual amount recorded in Interest expense of Financial Products will vary based on interest rates at the time the hedged transactions impact earnings.
We have, at certain times, liquidated fixed-to-floating and floating-to-fixed interest rate swaps at both Machinery and Power Systems and Financial Products. The gains or losses associated with these swaps at the time of liquidation are amortized into earnings over the original term of the previously designated hedged item.
In anticipation of issuing debt for the planned acquisition of Bucyrus International, Inc., we entered into interest rate swaps to manage our exposure to interest rate changes. For the year ended December 31, 2011, we recognized a net loss of $149 million, included in Other income (expense) in Statement 1. The contracts were liquidated in conjunction with the debt issuance in May 2011. These contracts were not designated as hedging instruments, and therefore, did not receive hedge accounting treatment.
Commodity price movements create a degree of risk by affecting the price we must pay for certain raw material. Our policy is to use commodity forward and option contracts to manage the commodity risk and reduce the cost of purchased materials.
Our Machinery and Power Systems operations purchase base and precious metals embedded in the components we purchase from suppliers. Our suppliers pass on to us price changes in the commodity portion of the component cost. In addition, we are subject to price changes on energy products such as natural gas and diesel fuel purchased for operational use.
Our objective is to minimize volatility in the price of these commodities. Our policy allows us to enter into commodity forward and option contracts to lock in the purchase price of a portion of these commodities within a five-year horizon. All such commodity forward and option contracts are undesignated.
The location and fair value of derivative instruments reported in Statement 3 are as follows:
|
| | | | | | | | | | | | | |
| (Millions of dollars) | Consolidated Statement of Financial Position Location | | Asset (Liability) Fair Value |
| | | | Years ended December 31, |
| | | | 2013 | | 2012 | | 2011 |
| Designated derivatives | | | |
| | |
| | |
|
| Foreign exchange contracts | | | |
| | |
| | |
|
| Machinery and Power Systems | Receivables — trade and other | | $ | 54 |
| | $ | 28 |
| | $ | 54 |
|
| Machinery and Power Systems | Long-term receivables — trade and other | | — |
| | — |
| | 19 |
|
| Machinery and Power Systems | Accrued expenses | | (39 | ) | | (66 | ) | | (73 | ) |
| Machinery and Power Systems | Other liabilities | | — |
| | — |
| | (10 | ) |
| Interest rate contracts | | | |
| | |
| | |
|
| Financial Products | Receivables — trade and other | | 7 |
| | 17 |
| | 15 |
|
| Financial Products | Long-term receivables — trade and other | | 115 |
| | 209 |
| | 233 |
|
| Financial Products | Accrued expenses | | (6 | ) | | (8 | ) | | (6 | ) |
| | | | $ | 131 |
| | $ | 180 |
| | $ | 232 |
|
| | | | | | | | |
| Undesignated derivatives | | | |
| | |
| | |
|
| Foreign exchange contracts | | | |
| | |
| | |
|
| Machinery and Power Systems | Receivables — trade and other | | $ | 19 |
| | $ | 31 |
| | $ | 27 |
|
| Machinery and Power Systems | Accrued expenses | | (1 | ) | | (63 | ) | | (12 | ) |
| Machinery and Power Systems | Other liabilities | | — |
| | — |
| | (85 | ) |
| Financial Products | Receivables — trade and other | | 7 |
| | 10 |
| | 7 |
|
| Financial Products | Accrued expenses | | (4 | ) | | (6 | ) | | (16 | ) |
| Financial Products | Long-term receivables — trade and other | | 9 |
| | — |
| | — |
|
| Interest rate contracts | | | |
| | |
| | |
|
| Financial Products | Receivables — trade and other | | — |
| | 2 |
| | — |
|
| Financial Products | Accrued expenses | | — |
| | (1 | ) | | (1 | ) |
| Commodity contracts | | | |
| | |
| | |
|
| Machinery and Power Systems | Receivables — trade and other | | — |
| | 1 |
| | 2 |
|
| Machinery and Power Systems | Accrued expenses | | — |
| | — |
| | (9 | ) |
| | | | $ | 30 |
| | $ | (26 | ) | | $ | (87 | ) |
| | | | | | | | |
The effect of derivatives designated as hedging instruments on Statement 1 is as follows:
|
| | | | | | | | | | |
| Fair Value Hedges | | | | Year ended December 31, 2013 |
| (Millions of dollars) | | Classification | | Gains (Losses) on Derivatives | | Gains (Losses) on Borrowings |
| Interest rate contracts | | | | |
| | |
|
| Financial Products | | Other income (expense) | | $ | (107 | ) | | $ | 114 |
|
| | | | | $ | (107 | ) | | $ | 114 |
|
| | | | | | | |
| | | | | Year ended December 31, 2012 |
| | | Classification | | Gains (Losses) on Derivatives | | Gains (Losses) on Borrowings |
| Interest rate contracts | | | | |
| | |
|
| Financial Products | | Other income (expense) | | $ | (20 | ) | | $ | 36 |
|
| | | | | $ | (20 | ) | | $ | 36 |
|
| | | | | | | |
| | | | | Year ended December 31, 2011 |
| | | Classification | | Gains (Losses) on Derivatives | | Gains (Losses) on Borrowings |
| Interest rate contracts | | | | |
| | |
|
| Machinery and Power Systems | | Other income (expense) | | $ | (1 | ) | | $ | 1 |
|
| Financial Products | | Other income (expense) | | 39 |
| | (44 | ) |
| | | | | $ | 38 |
| | $ | (43 | ) |
| | | | | | | |
|
| | | | | | | | | | | | | | | |
| Cash Flow Hedges | | | | | | | | | |
| (Millions of dollars) | | Year ended December 31, 2013 | |
| | | | | Recognized in Earnings | |
| | | Amount of
Gains (Losses) Recognized in AOCI (Effective Portion) | | Classification of Gains (Losses) | | Amount of Gains (Losses) Reclassified from AOCI to Earnings | | Recognized in Earnings (Ineffective Portion) | |
| Foreign exchange contracts | | |
| | | | |
| | |
| |
| Machinery and Power Systems | | $ | (4 | ) | | Other income (expense) | | $ | (57 | ) | 2 | $ | — |
| |
| Interest rate contracts | | |
| | | | |
| | |
| |
| Machinery and Power Systems | | — |
| | Other income (expense) | | (3 | ) | | — |
| |
| Financial Products | | (2 | ) | | Interest expense of Financial Products | | (6 | ) | | 1 |
| 1 |
| | | $ | (6 | ) | | | | $ | (66 | ) | | $ | 1 |
| |
| | | | | | | | | | |
| | | Year ended December 31, 2012 | |
| | | | | Recognized in Earnings | |
| | | Amount of
Gains (Losses) Recognized in AOCI (Effective Portion) | | Classification of Gains (Losses) | | Amount of Gains (Losses) Reclassified from AOCI to Earnings | | Recognized in Earnings (Ineffective Portion) | |
| Foreign exchange contracts | | |
| | | | |
| | |
| |
| Machinery and Power Systems | | $ | (78 | ) | | Other income (expense) | | $ | (30 | ) | 2 | $ | — |
| |
| Interest rate contracts | | |
| | | | |
| | |
| |
| Financial Products | | 1 |
| | Interest expense of Financial Products | | 4 |
| | (1 | ) | 1 |
| | | $ | (77 | ) | | | | $ | (26 | ) | | $ | (1 | ) | |
| | | | | | | | | | |
| | | Year ended December 31, 2011 | |
| | | | | Recognized in Earnings | |
| | | Amount of
Gains (Losses) Recognized in AOCI (Effective Portion) | | Classification of Gains (Losses) | | Amount of Gains (Losses) Reclassified from AOCI to Earnings | | Recognized in Earnings (Ineffective Portion) | |
| Foreign exchange contracts | | | | | | | | | |
| Machinery and Power Systems | | $ | (34 | ) | | Other income (expense) | | $ | 70 |
| | $ | — |
| |
| Interest rate contracts | | |
| | | | |
| | |
| |
| Machinery and Power Systems | | — |
| | Other income (expense) | | (3 | ) | | — |
| |
| Financial Products | | 1 |
| | Interest expense of Financial Products | | (12 | ) | | (2 | ) | 1 |
| | | $ | (33 | ) | | | | $ | 55 |
| | $ | (2 | ) | |
| | | | | | | | | | |
| |
1 | The ineffective portion recognized in earnings is included in Other income (expense). |
| |
2 | Includes $3 million and $7 million of losses reclassified from AOCI to Other income (expense) in 2013 and 2012, respectively as certain derivatives were dedesignated as the related transactions are no longer probable to occur. |
The effect of derivatives not designated as hedging instruments on Statement 1 is as follows:
|
| | | | | | | | | | | | | | |
| | | | | Years ended December 31, |
| (Millions of dollars) | | Classification of Gains (Losses) | | 2013 | | 2012 | | 2011 |
| Foreign exchange contracts | | | | |
| | |
| | |
|
| Machinery and Power Systems | | Other income (expense) | | $ | 17 |
| | $ | 62 |
| | $ | 62 |
|
| Financial Products | | Other income (expense) | | 8 |
| | 6 |
| | (15 | ) |
| Interest rate contracts | | | | |
| | |
| | |
|
| Machinery and Power Systems | | Other income (expense) | | (1 | ) | | 2 |
| | (149 | ) |
| Financial Products | | Other income (expense) | | (3 | ) | | — |
| | — |
|
| Commodity contracts | | | | |
| | |
| | |
|
| Machinery and Power Systems | | Other income (expense) | | (3 | ) | | 2 |
| | (17 | ) |
| | | | | $ | 18 |
| | $ | 72 |
| | $ | (119 | ) |
| | | | | | | | | |
We enter into International Swaps and Derivatives Association (ISDA) master netting agreements within Machinery & Power Systems and Financial Products that permit the net settlement of amounts owed under their respective derivative contracts. Under these master netting agreements, net settlement generally permits the company or the counterparty to determine the net amount payable for contracts due on the same date and in the same currency for similar types of derivative transactions. The master netting agreements generally also provide for net settlement of all outstanding contracts with a counterparty in the case of an event of default or a termination event.
Collateral is generally not required of the counterparties or of our company under the master netting agreements. As of December 31, 2013, 2012 and 2011, no cash collateral was received or pledged under the master netting agreements.
The effect of the net settlement provisions of the master netting agreements on our derivative balances upon an event of default or termination event is as follows:
|
| | | | | | | | | | | | | | | | | | | | | | | | | |
| December 31, 2013 | | | | | | | | Gross Amounts Not Offset in the Statement of Financial Position | | | |
| (Millions of dollars) | | Gross Amount of Recognized Assets | | Gross Amounts Offset in the Statement of Financial Position | | Net Amount of Assets Presented in the Statement of Financial Position | | Financial Instruments | | Cash Collateral Received | | Net Amount of Assets | |
| Derivatives | | | | | | | | | | | | | |
| Machinery & Power Systems | | $ | 73 |
| | $ | — |
| | $ | 73 |
| | $ | (32 | ) | | $ | — |
| | $ | 41 |
| |
| Financial Products | | 138 |
| | — |
| | 138 |
| | (9 | ) | | — |
| | 129 |
| |
| Total | | $ | 211 |
| | $ | — |
| | $ | 211 |
| | $ | (41 | ) | | $ | — |
| | $ | 170 |
| |
|
| | | | | | | | | | | | | | | | | | | | | | | | | |
| December 31, 2013 | | | | | | | | Gross Amounts Not Offset in the Statement of Financial Position | | | |
| (Millions of dollars) | | Gross Amount of Recognized Liabilities | | Gross Amounts Offset in the Statement of Financial Position | | Net Amount of Liabilities Presented in the Statement of Financial Position | | Financial Instruments | | Cash Collateral Pledged | | Net Amount of Liabilities | |
| Derivatives | | | | | | | | | | | | | |
| Machinery & Power Systems | | $ | (40 | ) | | $ | — |
| | $ | (40 | ) | | $ | 32 |
| | $ | — |
| | $ | (8 | ) | |
| Financial Products | | (10 | ) | | — |
| | (10 | ) | | 9 |
| | — |
| | (1 | ) | |
| Total | | $ | (50 | ) | | $ | — |
| | $ | (50 | ) | | $ | 41 |
| | $ | — |
| | $ | (9 | ) | |
|
| | | | | | | | | | | | | | | | | | | | | | | | | |
| December 31, 2012 | | | | | | | | Gross Amounts Not Offset in the Statement of Financial Position | | | |
| (Millions of dollars) | | Gross Amount of Recognized Assets | | Gross Amounts Offset in the Statement of Financial Position | | Net Amount of Assets Presented in the Statement of Financial Position | | Financial Instruments | | Cash Collateral Received | | Net Amount of Assets | |
| Derivatives | | | | | | | | | | | | | |
| Machinery & Power Systems | | $ | 60 |
| | $ | — |
| | $ | 60 |
| | $ | (59 | ) | | $ | — |
| | $ | 1 |
| |
| Financial Products | | 238 |
| | — |
| | 238 |
| | (12 | ) | | — |
| | 226 |
| |
| Total | | $ | 298 |
| | $ | — |
| | $ | 298 |
| | $ | (71 | ) | | $ | — |
| | $ | 227 |
| |
|
| | | | | | | | | | | | | | | | | | | | | | | | | |
| December 31, 2012 | | | | | | | | Gross Amounts Not Offset in the Statement of Financial Position | | | |
| (Millions of dollars) | | Gross Amount of Recognized Liabilities | | Gross Amounts Offset in the Statement of Financial Position | | Net Amount of Liabilities Presented in the Statement of Financial Position | | Financial Instruments | | Cash Collateral Pledged | | Net Amount of Liabilities | |
| Derivatives | | | | | | | | | | | | | |
| Machinery & Power Systems | | $ | (129 | ) | | $ | — |
| | $ | (129 | ) | | $ | 59 |
| | $ | — |
| | $ | (70 | ) | |
| Financial Products | | (15 | ) | | — |
| | (15 | ) | | 12 |
| | — |
| | (3 | ) | |
| Total | | $ | (144 | ) | | $ | — |
| | $ | (144 | ) | | $ | 71 |
| | $ | — |
| | $ | (73 | ) | |
|
| | | | | | | | | | | | | | | | | | | | | | | | | |
| December 31, 2011 | | | | | | | | Gross Amounts Not Offset in the Statement of Financial Position | | | |
| (Millions of dollars) | | Gross Amount of Recognized Assets | | Gross Amounts Offset in the Statement of Financial Position | | Net Amount of Assets Presented in the Statement of Financial Position | | Financial Instruments | | Cash Collateral Received | | Net Amount of Assets | |
| Derivatives | | | | | | | | | | | | | |
| Machinery & Power Systems | | $ | 102 |
| | $ | — |
| | $ | 102 |
| | $ | (102 | ) | | $ | — |
| | $ | — |
| |
| Financial Products | | 255 |
| | — |
| | 255 |
| | (11 | ) | | — |
| | 244 |
| |
| Total | | $ | 357 |
| | $ | — |
| | $ | 357 |
| | $ | (113 | ) | | $ | — |
| | $ | 244 |
| |
|
| | | | | | | | | | | | | | | | | | | | | | | | | |
| December 31, 2011 | | | | | | | | Gross Amounts Not Offset in the Statement of Financial Position | | | |
| (Millions of dollars) | | Gross Amount of Recognized Liabilities | | Gross Amounts Offset in the Statement of Financial Position | | Net Amount of Liabilities Presented in the Statement of Financial Position | | Financial Instruments | | Cash Collateral Pledged | | Net Amount of Liabilities | |
| Derivatives | | | | | | | | | | | | | |
| Machinery & Power Systems | | $ | (189 | ) | | $ | — |
| | $ | (189 | ) | | $ | 102 |
| | $ | — |
| | $ | (87 | ) | |
| Financial Products | | (23 | ) | | — |
| | (23 | ) | | 11 |
| | — |
| | (12 | ) | |
| Total | | $ | (212 | ) | | $ | — |
| | $ | (212 | ) | | $ | 113 |
| | $ | — |
| | $ | (99 | ) | |
| | | | | | | | | | | | | | |
|
| | | | | | | | | | | | | |
| | | Years ended December 31, | |
| (Millions of dollars) | | 2013 | | 2012 | | 2011 | |
| Investment and interest income | | $ | 84 |
| | $ | 82 |
| | $ | 85 |
| |
Foreign exchange gains (losses) 1 | | (254 | ) | | (116 | ) | | 21 |
| |
| License fee income | | 114 |
| | 99 |
| | 80 |
| |
| Gains (losses) on sale of securities and affiliated companies | | 21 |
| | 4 |
| | 17 |
| |
| Impairment of available-for-sale securities | | (1 | ) | | (2 | ) | | (5 | ) | |
| Miscellaneous income (loss) | | 1 |
| | 63 |
|
| (230 | ) | 2 |
| | | $ | (35 | ) | | $ | 130 |
| | $ | (32 | ) | |
| |
1 | Includes gains (losses) from foreign exchange derivative contracts. See Note 3 for further details. |
| |
2 | Miscellaneous income (loss) in 2011 includes forward starting swap costs of $149 million (see Note 3) and bridge financing costs of $54 million (see Note 24), both related to the acquisition of Bucyrus. |
|
| | | | | | | | | | | | |
| The components of profit before taxes were: | | | | | | |
| | | Years ended December 31, |
| (Millions of dollars) | | 2013 | | 2012 | | 2011 |
| U.S. | | $ | 1,938 |
| | $ | 4,090 |
| | $ | 2,250 |
|
| Non-U.S. | | 3,190 |
| | 4,146 |
| | 4,475 |
|
| | | $ | 5,128 |
| | $ | 8,236 |
| | $ | 6,725 |
|
| | | | | | | |
Profit before taxes, as shown above, is based on the location of the entity to which such earnings are attributable. Where an entity’s earnings are subject to taxation, however, may not correlate solely to where an entity is located. Thus, the income tax provision shown below as U.S. or non-U.S. may not correspond to the earnings shown above.
|
| | | | | | | | | | | | |
| The components of the provision (benefit) for income taxes were: | | | | | | |
| | | Years ended December 31, |
| (Millions of dollars) | | 2013 | | 2012 | | 2011 |
| Current tax provision (benefit): | | |
| | |
| | |
|
| U.S. | | $ | 407 |
| | $ | 971 |
| | $ | 750 |
|
| Non-U.S. | | 805 |
| | 1,250 |
| | 1,014 |
|
| State (U.S.) | | 33 |
| | 56 |
| | 72 |
|
| | | 1,245 |
| | 2,277 |
| | 1,836 |
|
| | | | | | | |
| Deferred tax provision (benefit): | | |
| | |
| | |
|
| U.S. | | 79 |
| | 332 |
| | 2 |
|
| Non-U.S. | | (7 | ) | | (89 | ) | | (92 | ) |
| State (U.S.) | | 2 |
| | 8 |
| | (26 | ) |
| | | 74 |
| | 251 |
| | (116 | ) |
| Total provision (benefit) for income taxes | | $ | 1,319 |
| | $ | 2,528 |
| | $ | 1,720 |
|
| | | | | | | |
We paid net income tax and related interest of $1,544 million, $2,396 million and $1,369 million in 2013, 2012 and 2011, respectively.
Reconciliation of the U.S. federal statutory rate to effective rate:
|
| | | | | | | | | | | | | | | | | | | | | |
| (Millions of dollars) | | Years ended December 31, |
| | | 2013 | | 2012 | | 2011 |
| Taxes at U.S. statutory rate | | $ | 1,795 |
| | 35.0 | % | | $ | 2,882 |
| | 35.0 | % | | $ | 2,354 |
| | 35.0 | % |
| (Decreases) increases in taxes resulting from: | | |
| | |
| | |
| | |
| | |
| | |
|
| Non-U.S. subsidiaries taxed at other than 35% | | (268 | ) | | (5.2 | )% | | (342 | ) | | (4.2 | )% | | (467 | ) | | (6.9 | )% |
| State and local taxes, net of federal | | 23 |
| | 0.4 | % | | 55 |
| | 0.7 | % | | 30 |
| | 0.4 | % |
| Interest and penalties, net of tax | | 4 |
| | 0.1 | % | | 22 |
| | 0.3 | % | | 25 |
| | 0.4 | % |
| U.S. research and production incentives | | (91 | ) | | (1.8 | )% | | (80 | ) | | (1.0 | )% | | (152 | ) | | (2.3 | )% |
| Other—net | | (2 | ) | | — | % | | (27 | ) | | (0.3 | )% | | (7 | ) | | (0.1 | )% |
| | | 1,461 |
| | 28.5 | % | | 2,510 |
| | 30.5 | % | | 1,783 |
| | 26.5 | % |
| | | | | | | | | | | | | |
| Prior year tax and interest adjustments | | (55 | ) | | (1.1 | )% | | (300 | ) | | (3.7 | )% | | 41 |
| | 0.6 | % |
| Nondeductible goodwill | | — |
| | — | % | | 318 |
| | 3.9 | % | | 33 |
| | 0.5 | % |
| Release of valuation allowances | | — |
| | — | % | | — |
| | — | % | | (24 | ) | | (0.3 | )% |
| Non-U.S. earnings reinvestment changes | | — |
| | — | % | | — |
| | — | % | | (113 | ) | | (1.7 | )% |
| Tax law changes |
| (87 | ) |
| (1.7 | )% |
| — |
|
| — | % |
| — |
|
| — | % |
| Provision (benefit) for income taxes | | $ | 1,319 |
| | 25.7 | % | | $ | 2,528 |
| | 30.7 | % | | $ | 1,720 |
| | 25.6 | % |
| | | | | | | | | | | | | |
The provision for income taxes for 2013 included a $87 million benefit primarily related to the research and development tax credit that was retroactively extended in 2013 for 2012 and a benefit of $55 million resulting from true-up of estimated amounts used in the tax provision to the 2012 U.S. tax return as filed in September 2013.
The provision for income taxes for 2012 included a $300 million benefit for adjusting prior year taxes and interest primarily to reflect a settlement reached with the U.S. Internal Revenue Service (IRS) for tax years 2000 to 2006. The largest drivers of the settlement benefit were a $188 million benefit to remeasure and recognize previously unrecognized tax benefits and a $96 million benefit to adjust related interest and penalties, net of tax. This benefit was offset by a negative impact from nondeductible goodwill of $203 million related to the ERA Mining Machinery Limited (Siwei) goodwill impairment and $115 million related to the divestiture of portions of the Bucyrus distribution business. See Note 10 and Note 26 for more information.
The provision for income taxes for 2011 included a $113 million benefit due to repatriation of non-U.S. earnings with available foreign tax credits in excess of the U.S. tax liability on the dividends and a $24 million benefit for the release of a valuation allowance against the deferred tax assets of certain non-U.S. entities due to tax planning actions implemented in 2011. These benefits were offset by a charge of $41 million due to an increase in prior year unrecognized tax benefits and a negative impact of $33 million from nondeductible goodwill primarily related to the divestiture of a portion of the Bucyrus distribution business.
We have recorded income tax expense at U.S. tax rates on all profits, except for undistributed profits of non-U.S. subsidiaries of approximately $17 billion which are considered indefinitely reinvested. Determination of the amount of unrecognized deferred tax liability related to indefinitely reinvested profits is not feasible. If management intentions or U.S. tax law changes in the future, there may be a significant negative impact on the provision for income taxes to record an incremental tax liability in the period the change occurs.
Accounting for income taxes under U.S. GAAP requires that individual tax-paying entities of the company offset all current deferred tax liabilities and assets within each particular tax jurisdiction and present them as a single amount in the Consolidated Financial Position. A similar procedure is followed for all noncurrent deferred tax liabilities and assets. Amounts in different tax jurisdictions cannot be offset against each other. The amount of deferred income taxes at December 31, included on the following lines in Statement 3, are as follows:
|
| | | | | | | | | | | | |
| | | December 31, |
| (Millions of dollars) | | 2013 | | 2012 | | 2011 |
| Assets: | | |
| | |
| | |
|
| Deferred and refundable income taxes | | $ | 877 |
| | $ | 979 |
| | $ | 1,044 |
|
| Noncurrent deferred and refundable income taxes | | 456 |
| | 1,863 |
| | 2,005 |
|
| | | 1,333 |
| | 2,842 |
| | 3,049 |
|
| Liabilities: | | |
| | |
| | |
|
| Other current liabilities | | 86 |
| | 66 |
| | 69 |
|
| Other liabilities | | 447 |
| | 484 |
| | 559 |
|
| Deferred income taxes—net | | $ | 800 |
| | $ | 2,292 |
| | $ | 2,421 |
|
| | | | | | | |
|
| | | | | | | | | | | | |
| Deferred income tax assets and liabilities: | | | | | | |
| | | December 31, |
| (Millions of dollars) | | 2013 | | 2012 | | 2011 |
| Deferred income tax assets: | | |
| | |
| | |
|
| Pension | | $ | 903 |
| | $ | 2,100 |
| | $ | 2,130 |
|
| Postemployment benefits other than pensions | | 1,435 |
| | 1,678 |
| | 1,622 |
|
| Tax carryforwards | | 760 |
| | 663 |
| | 821 |
|
| Warranty reserves | | 313 |
| | 358 |
| | 338 |
|
| Stock-based compensation | | 320 |
| | 281 |
| | 232 |
|
| Inventory | | 112 |
| | 195 |
| | 148 |
|
| Allowance for credit losses | | 184 |
| | 170 |
| | 131 |
|
| Post sale discounts | | 146 |
| | 141 |
| | 141 |
|
| Deferred compensation | | 126 |
| | 110 |
| | 102 |
|
| Other—net | | 524 |
| | 491 |
| | 537 |
|
| | | 4,823 |
| | 6,187 |
| | 6,202 |
|
| | | | | | | |
| Deferred income tax liabilities: | | |
| | |
| | |
|
| Capital and intangible assets | | (2,815 | ) | | (2,759 | ) | | (2,866 | ) |
| Bond discount | | (240 | ) | | (249 | ) | | (37 | ) |
| Translation | | (133 | ) | | (173 | ) | | (193 | ) |
| Undistributed profits of non-U.S. subsidiaries | | (90 | ) | | (128 | ) | | (215 | ) |
| | | (3,278 | ) | | (3,309 | ) | | (3,311 | ) |
| Valuation allowance for deferred tax assets | | (745 | ) | | (586 | ) | | (470 | ) |
| Deferred income taxes—net | | $ | 800 |
| | $ | 2,292 |
| | $ | 2,421 |
|
| | | | | | | |
At December 31, 2013, approximately $707 million of U.S. state tax net operating losses (NOLs) and $169 million of U.S. state tax credit carryforwards were available. The state NOLs primarily expire between 2014 and 2033. The state tax credit carryforwards primarily expire over the next five to fifteen years. We established a valuation allowance of $188 million for those state NOLs and credit carryforwards that are more likely than not to expire prior to utilization.
At December 31, 2013, amounts and expiration dates of net operating loss carryforwards in various non-U.S. taxing jurisdictions were:
|
| | | | | | | | | | | | | | | | | | | | | | | | | | |
| (Millions of dollars) |
| 2014 | | 2015 | | 2016 | | 2017 | | 2018-2034 | | Unlimited | | Total |
| $ | 9 |
| | $ | 10 |
| | $ | 13 |
| | $ | 15 |
| | $ | 760 |
| | $ | 1,192 |
| | $ | 1,999 |
|
At December 31, 2013 a valuation allowance of $557 million has been recorded at certain non-U.S. entities that have not yet demonstrated consistent and/or sustainable profitability to support the realization of net deferred tax assets.
A reconciliation of the beginning and ending amount of gross unrecognized tax benefits for uncertain tax positions, including positions impacting only the timing of tax benefits, follows.
|
| | | | | | | | | | | | |
Reconciliation of unrecognized tax benefits: 1 | | | | | | |
| | | Years ended December 31, |
| (Millions of dollars) | | 2013 | | 2012 | | 2011 |
| Balance at January 1, | | $ | 715 |
| | $ | 958 |
| | $ | 789 |
|
| | | | | | | |
| Additions for tax positions related to current year | | 63 |
| | 64 |
| | 118 |
|
| Additions for tax positions related to prior years | | 52 |
| | 178 |
| | 108 |
|
| Reductions for tax positions related to prior years | | (31 | ) | | (266 | ) | | (30 | ) |
Reductions for settlements 2 | | (15 | ) | | (191 | ) | | — |
|
| Reductions for expiration of statute of limitations | | (25 | ) | | (28 | ) | | (27 | ) |
| | | | | | | |
| Balance at December 31, | | $ | 759 |
| | $ | 715 |
| | $ | 958 |
|
| | | | | | | |
| Amount that, if recognized, would impact the effective tax rate | | $ | 726 |
| | $ | 669 |
| | $ | 835 |
|
| |
1 | Foreign currency translation amounts are included within each line as applicable. |
| |
2 | Includes cash payment or other reduction of assets to settle liability. |
We classify interest and penalties on income taxes as a component of the provision for income taxes. We recognized a net provision (benefit) for interest and penalties of $7 million, $(114) million and $39 million during the years ended December 31, 2013, 2012 and 2011, respectively. The 2012 amount includes a benefit from adjustments for the 2000 through 2006 settlement discussed previously. The total amount of interest and penalties accrued was $59 million, $134 million and $240 million as of December 31, 2013, 2012 and 2011, respectively.
It is reasonably possible that the amount of unrecognized tax benefits will change in the next 12 months. The IRS is currently examining our U.S. tax returns for 2007 to 2009 including the impact of a loss carryback to 2005. While we have not yet received a Revenue Agent's Report generally issued at the end of the field examination process, we have received Notices of Proposed Adjustment from the IRS relating to U.S. taxation of certain non-U.S. operations and foreign tax credits. We disagree with these proposed adjustments, and to the extent that adjustments are assessed upon completion of the field examination relating to these matters, we would vigorously contest the adjustments in appeals. The completion of the field examination for this audit is expected in 2014. In our major non-U.S. jurisdictions, tax years are typically subject to examination for three to eight years. In the opinion of management, the ultimate disposition of these matters will not have a material adverse effect on our consolidated financial position, liquidity or results of operations. Due to the uncertainty related to the timing and potential outcome of these matters, we can not estimate the range of reasonably possible change in unrecognized tax benefits in the next 12 months.
| |
| 6. | Cat Financial Financing Activities |
| |
| A. | Wholesale inventory receivables |
Wholesale inventory receivables are receivables of Cat Financial that arise when Cat Financial provides financing for a dealer’s purchase of inventory. These receivables are included in Receivables—trade and other and Long-term receivables—trade and other in Statement 3 and were $1,945 million, $2,152 million, and $1,990 million at December 31, 2013, 2012 and 2011, respectively.
|
| | | | | | | | | | | | | | | | |
| Contractual maturities of outstanding wholesale inventory receivables: |
| (Millions of dollars) | | December 31, 2013 |
| Amounts Due In | | Wholesale Installment Contracts | | Wholesale Finance Leases | | Wholesale Notes | | Total |
| 2014 | | $ | 258 |
| | $ | 125 |
| | $ | 636 |
| | $ | 1,019 |
|
| 2015 | | 106 |
| | 95 |
| | 231 |
| | 432 |
|
| 2016 | | 77 |
| | 58 |
| | 150 |
| | 285 |
|
| 2017 | | 39 |
| | 31 |
| | 18 |
| | 88 |
|
| 2018 | | 17 |
| | 13 |
| | 5 |
| | 35 |
|
| Thereafter | | 3 |
| | — |
| | — |
| | 3 |
|
| | | 500 |
| | 322 |
| | 1,040 |
| | 1,862 |
|
| Guaranteed residual value | | — |
| | 90 |
| | — |
| | 90 |
|
| Unguaranteed residual value | | — |
| | 35 |
| | — |
| | 35 |
|
| Less: Unearned income | | (8 | ) | | (31 | ) | | (3 | ) | | (42 | ) |
| Total | | $ | 492 |
| | $ | 416 |
| | $ | 1,037 |
| | $ | 1,945 |
|
| | | | | | | | | |
Please refer to Note 18 and Table III for fair value information.
Finance receivables are receivables of Cat Financial, which generally can be repaid or refinanced without penalty prior to contractual maturity. Total finance receivables reported in Statement 3 are net of an allowance for credit losses.
Cat Financial provides financing only when acceptable criteria are met. Credit decisions are based on, among other things, the customer’s credit history, financial strength and intended use of equipment. Cat Financial typically maintains a security interest in retail financed equipment and requires physical damage insurance coverage on financed equipment.
|
| | | | | | | | | | | | | | | | |
| Contractual maturities of outstanding finance receivables: |
| (Millions of dollars) | | December 31, 2013 |
| Amounts Due In | | Retail Installment Contracts | | Retail Finance Leases | | Retail Notes | | Total |
| 2014 | | $ | 2,105 |
| | $ | 3,234 |
| | $ | 3,627 |
| | $ | 8,966 |
|
| 2015 | | 1,627 |
| | 2,183 |
| | 2,263 |
| | 6,073 |
|
| 2016 | | 1,093 |
| | 1,292 |
| | 1,758 |
| | 4,143 |
|
| 2017 | | 590 |
| | 581 |
| | 1,475 |
| | 2,646 |
|
| 2018 | | 198 |
| | 203 |
| | 669 |
| | 1,070 |
|
| Thereafter | | 26 |
| | 139 |
| | 1,070 |
| | 1,235 |
|
| | | 5,639 |
| | 7,632 |
| | 10,862 |
| | 24,133 |
|
| Guaranteed residual value | | — |
| | 354 |
| | — |
| | 354 |
|
| Unguaranteed residual value | | — |
| | 486 |
| | — |
| | 486 |
|
| Less: Unearned income | | (93 | ) | | (730 | ) | | (89 | ) | | (912 | ) |
| Total | | $ | 5,546 |
| | $ | 7,742 |
| | $ | 10,773 |
| | $ | 24,061 |
|
| | | | | | | | | |
Please refer to Note 18 and Table III for fair value information.
| |
| C. | Credit quality of financing receivables and allowance for credit losses |
Cat Financial applies a systematic methodology to determine the allowance for credit losses for finance receivables. Based upon Cat Financial’s analysis of credit losses and risk factors, portfolio segments are as follows:
| |
| • | Customer - Finance receivables with retail customers. |
| |
| • | Dealer - Finance receivables with Caterpillar dealers. |
Cat Financial further evaluates portfolio segments by the class of finance receivables, which is defined as a level of information (below a portfolio segment) in which the finance receivables have the same initial measurement attribute and a similar method for assessing and monitoring credit risk. Typically, Cat Financial’s finance receivables within a geographic area have similar credit risk profiles and methods for assessing and monitoring credit risk. Cat Financial’s classes, which align with management reporting for credit losses, are as follows:
| |
| • | North America - Finance receivables originated in the United States or Canada. |
| |
| • | Europe - Finance receivables originated in Europe, Africa, Middle East and the Commonwealth of Independent States. |
| |
| • | Asia Pacific - Finance receivables originated in Australia, New Zealand, China, Japan, South Korea and Southeast Asia. |
| |
| • | Mining - Finance receivables related to large mining customers worldwide. |
| |
| • | Latin America - Finance receivables originated in Central and South American countries and Mexico. |
| |
| • | Caterpillar Power Finance - Finance receivables related to marine vessels with Caterpillar engines worldwide and Caterpillar electrical power generation, gas compression and co-generation systems and non-Caterpillar equipment that is powered by these systems worldwide. |
Impaired loans and finance leases
For all classes, a loan or finance lease is considered impaired, based on current information and events, if it is probable that Cat Financial will be unable to collect all amounts due according to the contractual terms of the loan or finance lease. Loans and finance leases reviewed for impairment include loans and finance leases that are past due, non-performing or in bankruptcy. Recognition of income is suspended and the loan or finance lease is placed on non-accrual status when management determines that collection of future income is not probable (generally after 120 days past due except in locations where local regulatory requirements dictate a different method, or in instances in which relevant information is known that warrants placing the loan or finance lease on non-accrual status). Accrual is resumed, and previously suspended income is recognized, when the loan or finance lease becomes contractually current and/or collection doubts are removed. Cash receipts on impaired loans or finance leases are recorded against the receivable and then to any unrecognized income.
During 2013, Cat Financial changed the classification of certain loans and finance leases previously reported as impaired. While these loans and finance leases had been incorrectly reported as impaired, the related allowance for these loans and finance leases was appropriately measured; therefore, this change had no impact on the allowance for credit losses. The impact of incorrectly reporting these loans and finance leases as impaired was not considered material to previously issued financial statements; however, prior period impaired loan and finance lease balances have been revised throughout Notes 6 and 18.
At December 31, 2013, 2012 and 2011, there were no impaired loans or finance leases for the Dealer portfolio segment. The average recorded investment for impaired loans and finance leases within the Dealer portfolio segment was zero during 2013, 2012 and 2011.
Individually impaired loans and finance leases for the Customer portfolio segment were as follows:
|
| | | | | | | | | | | |
| | December 31, 2013 |
| (Millions of dollars) | Recorded Investment | | Unpaid Principal Balance | | Related Allowance |
| Impaired Loans and Finance Leases With No Allowance Recorded | |
| | |
| | |
|
| Customer | |
| | |
| | |
|
| North America | $ | 23 |
| | $ | 22 |
| | $ | — |
|
| Europe | 48 |
| | 47 |
| | — |
|
| Asia Pacific | 7 |
| | 7 |
| | — |
|
| Mining | 134 |
| | 134 |
| | — |
|
| Latin America | 11 |
| | 11 |
| | — |
|
| Caterpillar Power Finance | 223 |
| | 222 |
| | — |
|
| Total | $ | 446 |
| | $ | 443 |
| | $ | — |
|
| | | | | | |
| Impaired Loans and Finance Leases With An Allowance Recorded | |
| | |
| | |
|
| Customer | |
| | |
| | |
|
| North America | $ | 13 |
| | $ | 13 |
| | $ | 4 |
|
| Europe | 20 |
| | 19 |
| | 7 |
|
| Asia Pacific | 16 |
| | 16 |
| | 2 |
|
| Mining | — |
| | — |
| | — |
|
| Latin America | 23 |
| | 23 |
| | 6 |
|
| Caterpillar Power Finance | 110 |
| | 106 |
| | 51 |
|
| Total | $ | 182 |
| | $ | 177 |
| | $ | 70 |
|
| | | | | | |
| Total Impaired Loans and Finance Leases | |
| | |
| | |
|
| Customer | |
| | |
| | |
|
| North America | $ | 36 |
| | $ | 35 |
| | $ | 4 |
|
| Europe | 68 |
| | 66 |
| | 7 |
|
| Asia Pacific | 23 |
| | 23 |
| | 2 |
|
| Mining | 134 |
| | 134 |
| | — |
|
| Latin America | 34 |
| | 34 |
| | 6 |
|
| Caterpillar Power Finance | 333 |
| | 328 |
| | 51 |
|
| Total | $ | 628 |
| | $ | 620 |
| | $ | 70 |
|
| | | | | | |
|
| | | | | | | | | | | |
| | December 31, 2012 |
| (Millions of dollars) | Recorded Investment | | Unpaid Principal Balance | | Related Allowance |
| Impaired Loans and Finance Leases With No Allowance Recorded | |
| | |
| | |
|
| Customer | |
| | |
| | |
|
| North America | $ | 28 |
| | $ | 27 |
| | $ | — |
|
| Europe | 45 |
| | 45 |
| | — |
|
| Asia Pacific | 2 |
| | 2 |
| | — |
|
| Mining | 1 |
| | 1 |
| | — |
|
| Latin America | 7 |
| | 7 |
| | — |
|
| Caterpillar Power Finance | 295 |
| | 295 |
| | — |
|
| Total | $ | 378 |
| | $ | 377 |
| | $ | — |
|
| | | | | | |
| Impaired Loans and Finance Leases With An Allowance Recorded | |
| | |
| | |
|
| Customer | |
| | |
| | |
|
| North America | $ | 25 |
| | $ | 23 |
| | $ | 7 |
|
| Europe | 28 |
| | 26 |
| | 11 |
|
| Asia Pacific | 19 |
| | 19 |
| | 4 |
|
| Mining | — |
| | — |
| | — |
|
| Latin America | 30 |
| | 30 |
| | 8 |
|
| Caterpillar Power Finance | 113 |
| | 109 |
| | 24 |
|
| Total | $ | 215 |
| | $ | 207 |
| | $ | 54 |
|
| | | | | | |
| Total Impaired Loans and Finance Leases | |
| | |
| | |
|
| Customer | |
| | |
| | |
|
| North America | $ | 53 |
| | $ | 50 |
| | $ | 7 |
|
| Europe | 73 |
| | 71 |
| | 11 |
|
| Asia Pacific | 21 |
| | 21 |
| | 4 |
|
| Mining | 1 |
| | 1 |
| | — |
|
| Latin America | 37 |
| | 37 |
| | 8 |
|
| Caterpillar Power Finance | 408 |
| | 404 |
| | 24 |
|
| Total | $ | 593 |
| | $ | 584 |
| | $ | 54 |
|
| | | | | | |
|
| | | | | | | | | | | |
| | December 31, 2011 |
| (Millions of dollars) | Recorded Investment | | Unpaid Principal Balance | | Related Allowance |
| Impaired Loans and Finance Leases With No Allowance Recorded | |
| | |
| | |
|
| Customer | |
| | |
| | |
|
| North America | $ | 83 |
| | $ | 80 |
| | $ | — |
|
| Europe | 47 |
| | 46 |
| | — |
|
| Asia Pacific | 4 |
| | 4 |
| | — |
|
| Mining | 8 |
| | 8 |
| | — |
|
| Latin America | 9 |
| | 9 |
| | — |
|
| Caterpillar Power Finance | 175 |
| | 170 |
| | — |
|
| Total | $ | 326 |
| | $ | 317 |
| | $ | — |
|
| | | | | | |
| Impaired Loans and Finance Leases With An Allowance Recorded | |
| | |
| | |
|
| Customer | |
| | |
| | |
|
| North America | $ | 23 |
| | $ | 20 |
| | $ | 6 |
|
| Europe | 22 |
| | 21 |
| | 8 |
|
| Asia Pacific | 9 |
| | 9 |
| | 3 |
|
| Mining | — |
| | — |
| | — |
|
| Latin America | 19 |
| | 19 |
| | 4 |
|
| Caterpillar Power Finance | 85 |
| | 85 |
| | 13 |
|
| Total | $ | 158 |
| | $ | 154 |
| | $ | 34 |
|
| | | | | | |
| Total Impaired Loans and Finance Leases | |
| | |
| | |
|
| Customer | |
| | |
| | |
|
| North America | $ | 106 |
| | $ | 100 |
| | $ | 6 |
|
| Europe | 69 |
| | 67 |
| | 8 |
|
| Asia Pacific | 13 |
| | 13 |
| | 3 |
|
| Mining | 8 |
| | 8 |
| | — |
|
| Latin America | 28 |
| | 28 |
| | 4 |
|
| Caterpillar Power Finance | 260 |
| | 255 |
| | 13 |
|
| Total | $ | 484 |
| | $ | 471 |
| | $ | 34 |
|
| | | | | | |
|
| | | | | | | | | | | | | | | | | | | | | | | | |
| | | Years ended December 31, |
| | | 2013 | | 2012 | | 2011 |
| (Millions of dollars) | | Average Recorded Investment | | Interest
Income
Recognized | | Average Recorded Investment | | Interest
Income
Recognized | | Average Recorded Investment | | Interest
Income
Recognized |
| Impaired Loans and Finance Leases With No Allowance Recorded | | |
| | |
| | |
| | |
| | | | |
| Customer | | |
| | |
| | |
| | |
| | | | |
| North America | | $ | 25 |
| | $ | 3 |
| | $ | 50 |
| | $ | 3 |
| | $ | 91 |
| | $ | 4 |
|
| Europe | | 49 |
| | 1 |
| | 45 |
| | 1 |
| | 11 |
| | — |
|
| Asia Pacific | | 4 |
| | — |
| | 3 |
| | — |
| | 5 |
| | — |
|
| Mining | | 61 |
| | 3 |
| | 8 |
| | — |
| | 8 |
| | 1 |
|
| Latin America | | 11 |
| | — |
| | 6 |
| | — |
| | 9 |
| | 1 |
|
| Caterpillar Power Finance | | 271 |
| | 5 |
| | 220 |
| | 2 |
| | 221 |
| | 6 |
|
| Total | | $ | 421 |
| | $ | 12 |
| | $ | 332 |
| | $ | 6 |
| | $ | 345 |
| | $ | 12 |
|
| | | | | | | | | | | | | |
| Impaired Loans and Finance Leases With An Allowance Recorded | | |
| | |
| | |
| | |
| | | | |
| Customer | | |
| | |
| | |
| | |
| | | | |
| North America | | $ | 18 |
| | $ | 1 |
| | $ | 25 |
| | $ | 1 |
| | $ | 56 |
| | $ | 2 |
|
| Europe | | 22 |
| | 1 |
| | 27 |
| | 1 |
| | 20 |
| | — |
|
| Asia Pacific | | 18 |
| | 1 |
| | 15 |
| | 1 |
| | 11 |
| | 1 |
|
| Mining | | 1 |
| | — |
| | — |
| | — |
| | — |
| | — |
|
| Latin America | | 44 |
| | 2 |
| | 27 |
| | 2 |
| | 11 |
| | — |
|
| Caterpillar Power Finance | | 135 |
| | 1 |
| | 94 |
| | — |
| | 61 |
| | — |
|
| Total | | $ | 238 |
| | $ | 6 |
| | $ | 188 |
| | $ | 5 |
| | $ | 159 |
| | $ | 3 |
|
| | | | | | | | | | | | | |
| Total Impaired Loans and Finance Leases | | |
| | |
| | |
| | |
| | | | |
| Customer | | |
| | |
| | |
| | |
| | | | |
| North America | | $ | 43 |
| | $ | 4 |
| | $ | 75 |
| | $ | 4 |
| | $ | 147 |
| | $ | 6 |
|
| Europe | | 71 |
| | 2 |
| | 72 |
| | 2 |
| | 31 |
| | — |
|
| Asia Pacific | | 22 |
| | 1 |
| | 18 |
| | 1 |
| | 16 |
| | 1 |
|
| Mining | | 62 |
| | 3 |
| | 8 |
| | — |
| | 8 |
| | 1 |
|
| Latin America | | 55 |
| | 2 |
| | 33 |
| | 2 |
| | 20 |
| | 1 |
|
| Caterpillar Power Finance | | 406 |
| | 6 |
| | 314 |
| | 2 |
| | 282 |
| | 6 |
|
| Total | | $ | 659 |
| | $ | 18 |
| | $ | 520 |
| | $ | 11 |
| | $ | 504 |
| | $ | 15 |
|
| | | | | | | | | | | | | |
Non-accrual and past due loans and finance leases
For all classes, Cat Financial considers a loan or finance lease past due if any portion of a contractual payment is due and unpaid for more than 30 days. Recognition of income is suspended and the loan or finance lease is placed on non-accrual status when management determines that collection of future income is not probable (generally after 120 days past due except in locations where local regulatory requirements dictate a different method, or in instances in which relevant information is known that warrants placing the loan or finance lease on non-accrual status). Accrual is resumed, and previously suspended income is recognized, when the loan or finance lease becomes contractually current and/or collection doubts are removed.
As of December 31, 2013, 2012 and 2011, there were no loans or finance leases on non-accrual status for the Dealer portfolio segment.
The investment in customer loans and finance leases on non-accrual status was as follows:
|
| | | | | | | | | | | | |
| | | December 31, |
| (Millions of dollars) | | 2013 | | 2012 | | 2011 |
| Customer | | | | |
| | |
|
| North America | | $ | 26 |
| | $ | 59 |
| | $ | 112 |
|
| Europe | | 28 |
| | 38 |
| | 58 |
|
| Asia Pacific | | 50 |
| | 36 |
| | 24 |
|
| Mining | | 23 |
| | 12 |
| | 12 |
|
| Latin America | | 179 |
| | 148 |
| | 108 |
|
| Caterpillar Power Finance | | 119 |
| | 220 |
| | 158 |
|
| Total | | $ | 425 |
| | $ | 513 |
| | $ | 472 |
|
| | | | | | | |
Aging related to loans and finance leases was as follows:
|
| | | | | | | | | | | | | | | | | | | | | | | | | | | | |
| (Millions of dollars) | | December 31, 2013 |
| | | 31-60 Days Past Due | | 61-90 Days Past Due | | 91+ Days Past Due | | Total Past Due | | Current | | Total Finance Receivables | | 91+ Still Accruing |
| Customer | | |
| | |
| | |
| | |
| | |
| | |
| | |
|
| North America | | $ | 37 |
| | $ | 12 |
| | $ | 24 |
| | $ | 73 |
| | $ | 6,508 |
| | $ | 6,581 |
| | $ | — |
|
| Europe | | 26 |
| | 15 |
| | 29 |
| | 70 |
| | 2,805 |
| | 2,875 |
| | 6 |
|
| Asia Pacific | | 54 |
| | 23 |
| | 59 |
| | 136 |
| | 2,752 |
| | 2,888 |
| | 11 |
|
| Mining | | 3 |
| | — |
| | 12 |
| | 15 |
| | 2,128 |
| | 2,143 |
| | — |
|
| Latin America | | 54 |
| | 25 |
| | 165 |
| | 244 |
| | 2,474 |
| | 2,718 |
| | 5 |
|
| Caterpillar Power Finance | | 55 |
| | 30 |
| | 60 |
| | 145 |
| | 2,946 |
| | 3,091 |
| | — |
|
| Dealer | | |
| | |
| | |
| |
|
| | |
| |
|
| | |
|
| North America | | — |
| | — |
| | — |
| | — |
| | 2,283 |
| | 2,283 |
| | — |
|
| Europe | | — |
| | — |
| | — |
| | — |
| | 150 |
| | 150 |
| | — |
|
| Asia Pacific | | — |
| | — |
| | — |
| | — |
| | 583 |
| | 583 |
| | — |
|
| Mining | | — |
| | — |
| | — |
| | — |
| | 1 |
| | 1 |
| | — |
|
| Latin America | | — |
| | — |
| | — |
| | — |
| | 748 |
| | 748 |
| | — |
|
| Caterpillar Power Finance | | — |
| | — |
| | — |
| | — |
| | — |
| | — |
| | — |
|
| Total | | $ | 229 |
| | $ | 105 |
| | $ | 349 |
| | $ | 683 |
| | $ | 23,378 |
| | $ | 24,061 |
| | $ | 22 |
|
| | | | | | | | | | | | | | | |
|
| | | | | | | | | | | | | | | | | | | | | | | | | | | | |
| (Millions of dollars) | | December 31, 2012 |
| | | 31-60 Days Past Due | | 61-90 Days Past Due | | 91+ Days Past Due | | Total Past Due | | Current | | Total Finance Receivables | | 91+ Still Accruing |
| Customer | | |
| | |
| | |
| | |
| | |
| | |
| | |
|
| North America | | $ | 35 |
| | $ | 8 |
| | $ | 52 |
| | $ | 95 |
| | $ | 5,872 |
| | $ | 5,967 |
| | $ | — |
|
| Europe | | 23 |
| | 9 |
| | 36 |
| | 68 |
| | 2,487 |
| | 2,555 |
| | 6 |
|
| Asia Pacific | | 53 |
| | 19 |
| | 54 |
| | 126 |
| | 2,912 |
| | 3,038 |
| | 18 |
|
| Mining | | — |
| | 1 |
| | 12 |
| | 13 |
| | 1,960 |
| | 1,973 |
| | — |
|
| Latin America | | 62 |
| | 19 |
| | 138 |
| | 219 |
| | 2,500 |
| | 2,719 |
| | — |
|
| Caterpillar Power Finance | | 15 |
| | 14 |
| | 126 |
| | 155 |
| | 3,017 |
| | 3,172 |
| | 4 |
|
| Dealer | | |
| | |
| | |
| |
|
| | |
| |
|
| | |
|
| North America | | — |
| | — |
| | — |
| | — |
| | 2,063 |
| | 2,063 |
| | — |
|
| Europe | | — |
| | — |
| | — |
| | — |
| | 185 |
| | 185 |
| | — |
|
| Asia Pacific | | — |
| | — |
| | — |
| | — |
| | 751 |
| | 751 |
| | — |
|
| Mining | | — |
| | — |
| | — |
| | — |
| | 1 |
| | 1 |
| | — |
|
| Latin America | | — |
| | — |
| | — |
| | — |
| | 884 |
| | 884 |
| | — |
|
| Caterpillar Power Finance | | — |
| | — |
| | — |
| | — |
| | — |
| | — |
| | — |
|
| Total | | $ | 188 |
| | $ | 70 |
| | $ | 418 |
| | $ | 676 |
| | $ | 22,632 |
| | $ | 23,308 |
| | $ | 28 |
|
| | | | | | | | | | | | | | | |
|
| | | | | | | | | | | | | | | | | | | | | | | | | | | | |
| (Millions of dollars) | | December 31, 2011 |
| | | 31-60 Days Past Due | | 61-90 Days Past Due | | 91+ Days Past Due | | Total Past Due | | Current | | Total Finance Receivables | | 91+ Still Accruing |
| Customer | | |
| | |
| | |
| | |
| | |
| | |
| | |
|
| North America | | $ | 74 |
| | $ | 39 |
| | $ | 111 |
| | $ | 224 |
| | $ | 5,378 |
| | $ | 5,602 |
| | $ | 9 |
|
| Europe | | 27 |
| | 11 |
| | 57 |
| | 95 |
| | 2,129 |
| | 2,224 |
| | 10 |
|
| Asia Pacific | | 47 |
| | 23 |
| | 38 |
| | 108 |
| | 2,769 |
| | 2,877 |
| | 14 |
|
| Mining | | — |
| | — |
| | 12 |
| | 12 |
| | 1,473 |
| | 1,485 |
| | — |
|
| Latin America | | 32 |
| | 15 |
| | 99 |
| | 146 |
| | 2,339 |
| | 2,485 |
| | — |
|
| Caterpillar Power Finance | | 14 |
| | 16 |
| | 125 |
| | 155 |
| | 2,765 |
| | 2,920 |
| | 25 |
|
| Dealer | | |
| | |
| | |
| | |
| | |
| | |
| | |
|
| North America | | — |
| | — |
| | — |
| | — |
| | 1,689 |
| | 1,689 |
| | — |
|
| Europe | | — |
| | — |
| | — |
| | — |
| | 57 |
| | 57 |
| | — |
|
| Asia Pacific | | — |
| | — |
| | — |
| | — |
| | 161 |
| | 161 |
| | — |
|
| Mining | | — |
| | — |
| | — |
| | — |
| | — |
| | — |
| | — |
|
| Latin America | | — |
| | — |
| | — |
| | — |
| | 480 |
| | 480 |
| | — |
|
| Caterpillar Power Finance | | — |
| | — |
| | — |
| | — |
| | — |
| | — |
| | — |
|
| Total | | $ | 194 |
| | $ | 104 |
| | $ | 442 |
| | $ | 740 |
| | $ | 19,240 |
| | $ | 19,980 |
| | $ | 58 |
|
| | | | | | | | | | | | | | | |
Allowance for credit loss activity
The allowance for credit losses as of December 31, 2013 was $375 million compared with $423 million as of December 31, 2012. The overall decrease of $48 million in the allowance for credit losses during the year reflects a $55 million decrease associated with the lower allowance rate, partially offset by a $7 million increase due to an increase in Cat Financial's net finance receivables portfolio. The lower allowance rate reflects write-offs taken in 2013, primarily related to Cat Financial's European marine portfolio that had been previously provided for in the allowance for credit losses, favorable changes in Cat Financial's estimated probabilities of default (due to improved financial health of Cat Financial's customers), continued refinements of estimated loss emergence periods and general improvement in the economic conditions of the industries Cat Financial serves.
The allowance for credit losses as of December 31, 2012 was $423 million compared with $366 million as of December 31, 2011. The overall increase of $57 million in allowance for credit losses during the year reflects a $51 million increase in allowance due to an increase in Cat Financial’s net finance receivables portfolio and a $6 million increase associated with the higher allowance rate.
An analysis of the allowance for credit losses during 2013, 2012 and 2011 was as follows:
|
| | | | | | | | | | | | |
| (Millions of dollars) | | December 31, 2013 |
| | | Customer | | Dealer | | Total |
| Allowance for Credit Losses: | | |
| | |
| | |
|
| Balance at beginning of year | | $ | 414 |
| | $ | 9 |
| | $ | 423 |
|
| Receivables written off | | (179 | ) | | — |
| | (179 | ) |
| Recoveries on receivables previously written off | | 56 |
| | — |
| | 56 |
|
| Provision for credit losses | | 83 |
| | 1 |
| | 84 |
|
| Other | | (9 | ) | | — |
| | (9 | ) |
| Balance at end of year | | $ | 365 |
| | $ | 10 |
| | $ | 375 |
|
| | | | | | | |
| Individually evaluated for impairment | | $ | 70 |
| | $ | — |
| | $ | 70 |
|
| Collectively evaluated for impairment | | 295 |
| | 10 |
| | 305 |
|
| Ending Balance | | $ | 365 |
| | $ | 10 |
| | $ | 375 |
|
| | | | | | | |
| Recorded Investment in Finance Receivables: | | |
| | |
| | |
|
| Individually evaluated for impairment | | $ | 628 |
| | $ | — |
| | $ | 628 |
|
| Collectively evaluated for impairment | | 19,668 |
| | 3,765 |
| | 23,433 |
|
| Ending Balance | | $ | 20,296 |
| | $ | 3,765 |
| | $ | 24,061 |
|
| | | | | | | |
|
| | | | | | | | | | | | |
| (Millions of dollars) | | December 31, 2012 |
| | | Customer | | Dealer | | Total |
| Allowance for Credit Losses: | | |
| | |
| | |
|
| Balance at beginning of year | | $ | 360 |
| | $ | 6 |
| | $ | 366 |
|
| Receivables written off | | (149 | ) | | — |
| | (149 | ) |
| Recoveries on receivables previously written off | | 47 |
| | — |
| | 47 |
|
| Provision for credit losses | | 157 |
| | 3 |
| | 160 |
|
| Other | | (1 | ) | | — |
| | (1 | ) |
| Balance at end of year | | $ | 414 |
| | $ | 9 |
| | $ | 423 |
|
| | | | | | | |
| Individually evaluated for impairment | | $ | 54 |
| | $ | — |
| | $ | 54 |
|
| Collectively evaluated for impairment | | 360 |
| | 9 |
| | 369 |
|
| Ending Balance | | $ | 414 |
| | $ | 9 |
| | $ | 423 |
|
| | | | | | | |
| Recorded Investment in Finance Receivables: | | |
| | |
| | |
|
| Individually evaluated for impairment | | $ | 593 |
| | $ | — |
| | $ | 593 |
|
| Collectively evaluated for impairment | | 18,831 |
| | 3,884 |
| | 22,715 |
|
| Ending Balance | | $ | 19,424 |
| | $ | 3,884 |
| | $ | 23,308 |
|
| | | | | | | |
|
| | | | | | | | | | | | |
| (Millions of dollars) | | December 31, 2011 |
| | | Customer | | Dealer | | Total |
| Allowance for Credit Losses: | | |
| | | | |
| Balance at beginning of year | | $ | 357 |
| | $ | 5 |
| | $ | 362 |
|
| Receivables written off | | (210 | ) | | — |
| | (210 | ) |
| Recoveries on receivables previously written off | | 52 |
| | — |
| | 52 |
|
| Provision for credit losses | | 167 |
| | 1 |
| | 168 |
|
| Other | | (6 | ) | | — |
| | (6 | ) |
| Balance at end of year | | $ | 360 |
| | $ | 6 |
| | $ | 366 |
|
| | | | | | | |
| Individually evaluated for impairment | | $ | 34 |
| | $ | — |
| | $ | 34 |
|
| Collectively evaluated for impairment | | 326 |
| | 6 |
| | 332 |
|
| Ending Balance | | $ | 360 |
| | $ | 6 |
| | $ | 366 |
|
| | | | | | | |
| Recorded Investment in Finance Receivables: | | | | | | |
| Individually evaluated for impairment | | $ | 484 |
| | $ | — |
| | $ | 484 |
|
| Collectively evaluated for impairment | | 17,109 |
| | 2,387 |
| | 19,496 |
|
| Ending Balance | | $ | 17,593 |
| | $ | 2,387 |
| | $ | 19,980 |
|
| | | | | | | |
Credit quality of finance receivables
The credit quality of finance receivables is reviewed on a monthly basis. Credit quality indicators include performing and non-performing. Non-performing is defined as finance receivables currently over 120 days past due and/or on non-accrual status or in bankruptcy. Finance receivables not meeting the criteria listed above are considered performing. Non-performing receivables have the highest probability for credit loss. The allowance for credit losses attributable to non-performing receivables is based on the most probable source of repayment, which is normally the liquidation of collateral. In determining collateral value, Cat Financial estimates the current fair market value of the collateral less selling costs. In addition, Cat Financial considers credit enhancements such as additional collateral and contractual third-party guarantees in determining the allowance for credit losses attributable to non-performing receivables.
The recorded investment in performing and non-performing finance receivables was as follows:
|
| | | | | | | | | | | | |
| (Millions of dollars) | | December 31, 2013 |
| | | Customer | | Dealer | | Total |
| Performing | | |
| | |
| | |
|
| North America | | $ | 6,555 |
| | $ | 2,283 |
| | $ | 8,838 |
|
| Europe | | 2,847 |
| | 150 |
| | 2,997 |
|
| Asia Pacific | | 2,838 |
| | 583 |
| | 3,421 |
|
| Mining | | 2,120 |
| | 1 |
| | 2,121 |
|
| Latin America | | 2,539 |
| | 748 |
| | 3,287 |
|
| Caterpillar Power Finance | | 2,972 |
| | — |
| | 2,972 |
|
| Total Performing | | $ | 19,871 |
| | $ | 3,765 |
| | $ | 23,636 |
|
| | | | | | | |
| Non-Performing | | |
| | |
| | |
|
| North America | | $ | 26 |
| | $ | — |
| | $ | 26 |
|
| Europe | | 28 |
| | — |
| | 28 |
|
| Asia Pacific | | 50 |
| | — |
| | 50 |
|
| Mining | | 23 |
| | — |
| | 23 |
|
| Latin America | | 179 |
| | — |
| | 179 |
|
| Caterpillar Power Finance | | 119 |
| | — |
| | 119 |
|
| Total Non-Performing | | $ | 425 |
| | $ | — |
| | $ | 425 |
|
| | | | | | | |
| Performing & Non-Performing | | |
| | |
| | |
|
| North America | | $ | 6,581 |
| | $ | 2,283 |
| | $ | 8,864 |
|
| Europe | | 2,875 |
| | 150 |
| | 3,025 |
|
| Asia Pacific | | 2,888 |
| | 583 |
| | 3,471 |
|
| Mining | | 2,143 |
| | 1 |
| | 2,144 |
|
| Latin America | | 2,718 |
| | 748 |
| | 3,466 |
|
| Caterpillar Power Finance | | 3,091 |
| | — |
| | 3,091 |
|
| Total | | $ | 20,296 |
| | $ | 3,765 |
| | $ | 24,061 |
|
| | | | | | | |
|
| | | | | | | | | | | | |
| (Millions of dollars) | | December 31, 2012 |
| | | Customer | | Dealer | | Total |
| Performing | | |
| | |
| | |
|
| North America | | $ | 5,908 |
| | $ | 2,063 |
| | $ | 7,971 |
|
| Europe | | 2,517 |
| | 185 |
| | 2,702 |
|
| Asia Pacific | | 3,002 |
| | 751 |
| | 3,753 |
|
| Mining | | 1,961 |
| | 1 |
| | 1,962 |
|
| Latin America | | 2,571 |
| | 884 |
| | 3,455 |
|
| Caterpillar Power Finance | | 2,952 |
| | — |
| | 2,952 |
|
| Total Performing | | $ | 18,911 |
| | $ | 3,884 |
| | $ | 22,795 |
|
| | | | | | | |
| Non-Performing | | |
| | |
| | |
|
| North America | | $ | 59 |
| | $ | — |
| | $ | 59 |
|
| Europe | | 38 |
| | — |
| | 38 |
|
| Asia Pacific | | 36 |
| | — |
| | 36 |
|
| Mining | | 12 |
| | — |
| | 12 |
|
| Latin America | | 148 |
| | — |
| | 148 |
|
| Caterpillar Power Finance | | 220 |
| | — |
| | 220 |
|
| Total Non-Performing | | $ | 513 |
| | $ | — |
| | $ | 513 |
|
| | | | | | | |
| Performing & Non-Performing | | |
| | |
| | |
|
| North America | | $ | 5,967 |
| | $ | 2,063 |
| | $ | 8,030 |
|
| Europe | | 2,555 |
| | 185 |
| | 2,740 |
|
| Asia Pacific | | 3,038 |
| | 751 |
| | 3,789 |
|
| Mining | | 1,973 |
| | 1 |
| | 1,974 |
|
| Latin America | | 2,719 |
| | 884 |
| | 3,603 |
|
| Caterpillar Power Finance | | 3,172 |
| | — |
| | 3,172 |
|
| Total | | $ | 19,424 |
| | $ | 3,884 |
| | $ | 23,308 |
|
| | | | | | | |
|
| | | | | | | | | | | | |
| (Millions of dollars) | | December 31, 2011 |
| | | Customer | | Dealer | | Total |
| Performing | | |
| | |
| | |
|
| North America | | $ | 5,490 |
| | $ | 1,689 |
| | $ | 7,179 |
|
| Europe | | 2,166 |
| | 57 |
| | 2,223 |
|
| Asia Pacific | | 2,853 |
| | 161 |
| | 3,014 |
|
| Mining | | 1,473 |
| | — |
| | 1,473 |
|
| Latin America | | 2,377 |
| | 480 |
| | 2,857 |
|
| Caterpillar Power Finance | | 2,762 |
| | — |
| | 2,762 |
|
| Total Performing | | $ | 17,121 |
| | $ | 2,387 |
| | $ | 19,508 |
|
| | | | | | | |
| Non-Performing | | |
| | |
| | |
|
| North America | | $ | 112 |
| | $ | — |
| | $ | 112 |
|
| Europe | | 58 |
| | — |
| | 58 |
|
| Asia Pacific | | 24 |
| | — |
| | 24 |
|
| Mining | | 12 |
| | — |
| | 12 |
|
| Latin America | | 108 |
| | — |
| | 108 |
|
| Caterpillar Power Finance | | 158 |
| | — |
| | 158 |
|
| Total Non-Performing | | $ | 472 |
| | $ | — |
| | $ | 472 |
|
| | | | | | | |
| Performing & Non-Performing | | |
| | |
| | |
|
| North America | | $ | 5,602 |
| | $ | 1,689 |
| | $ | 7,291 |
|
| Europe | | 2,224 |
| | 57 |
| | 2,281 |
|
| Asia Pacific | | 2,877 |
| | 161 |
| | 3,038 |
|
| Mining | | 1,485 |
| | — |
| | 1,485 |
|
| Latin America | | 2,485 |
| | 480 |
| | 2,965 |
|
| Caterpillar Power Finance | | 2,920 |
| | — |
| | 2,920 |
|
| Total | | $ | 17,593 |
| | $ | 2,387 |
| | $ | 19,980 |
|
| | | | | | | |
Troubled Debt Restructurings
A restructuring of a loan or finance lease receivable constitutes a troubled debt restructuring (TDR) when the lender grants a concession it would not otherwise consider to a borrower experiencing financial difficulties. Concessions granted may include extended contract maturities, inclusion of interest only periods, below market interest rates, and extended skip payment periods.
TDRs are reviewed along with other receivables as part of management’s ongoing evaluation of the adequacy of the allowance for credit losses. The allowance for credit losses attributable to TDRs is based on the most probable source of repayment, which is normally the liquidation of collateral. In determining collateral value, Cat Financial estimates the current fair market value of the collateral less selling costs. In addition, Cat Financial factors in credit enhancements such as additional collateral and contractual third-party guarantees in determining the allowance for credit losses attributable to TDRs.
There were no loans or finance lease receivables modified as TDRs during the years ended December 31, 2013, 2012 and 2011 for the Dealer portfolio segment.
Loan and finance lease receivables in the Customer portfolio segment modified as TDRs during the years ended December 31, 2013, 2012, and 2011 were as follows:
|
| | | | | | | | | | | | |
| (Millions of dollars) | | Year ended December 31, 2013 | |
| | | Number of Contracts | | Pre-TDR
Outstanding Recorded
Investment | | Post-TDR Outstanding Recorded Investment | |
| Customer | | |
| | |
| | |
| |
| North America | | 62 |
| | $ | 9 |
| | $ | 9 |
| |
Europe | | 51 |
| | 7 |
| | 7 |
| |
| Asia Pacific | | 3 |
| | 1 |
| | 1 |
| |
| Mining | | 45 |
| | 123 |
| | 123 |
| |
| Latin America | | 16 |
| | 2 |
| | 2 |
| |
Caterpillar Power Finance 1 | | 17 |
| | 153 |
| | 157 |
| |
Total 2 | | 194 |
| | $ | 295 |
| | $ | 299 |
| |
| | | | | | | | |
| | | Year ended December 31, 2012 | |
| | | Number of Contracts | | Pre-TDR
Outstanding Recorded
Investment | | Post-TDR Outstanding Recorded Investment | |
| Customer | | | | | | | |
| North America | | 98 |
| | $ | 15 |
| | $ | 15 |
| |
Europe | | 21 |
| | 8 |
| | 8 |
| |
| Asia Pacific | | 12 |
| | 3 |
| | 3 |
| |
| Mining | | — |
| | — |
| | — |
| |
| Latin America | | 41 |
| | 5 |
| | 5 |
| |
Caterpillar Power Finance 1 | | 27 |
| | 253 |
| | 253 |
| |
Total 2 | | 199 |
| | $ | 284 |
| | $ | 284 |
| |
| | | | | | | | |
| | | Year ended December 31, 2011 | |
| | | Number of Contracts | | Pre-TDR
Outstanding Recorded
Investment | | Post-TDR Outstanding Recorded Investment | |
| Customer | | | | | | | |
| North America | | 71 |
| | $ | 13 |
| | $ | 13 |
| |
Europe | | 7 |
| | 44 |
| | 44 |
| |
| Asia Pacific | | — |
| | — |
| | — |
| |
| Mining | | — |
| | — |
| | — |
| |
| Latin America | | 12 |
| | 10 |
| | 10 |
| |
Caterpillar Power Finance 1 | | 35 |
| | 117 |
| | 117 |
| |
Total 2 | | 125 |
| | $ | 184 |
| | $ | 184 |
| |
| | | | | | | | |
| |
1 | During the years ended December 31, 2013, 2012 and 2011, $25 million, $24 million and $15 million, respectively, of additional funds were subsequently loaned to a borrower whose terms had been modified in a TDR. The $25 million, $24 million and $15 million of additional funds are not reflected in the table above as no incremental modifications have been made with the borrower during the periods presented. At December 31, 2013, remaining commitments to lend additional funds to a borrower whose terms have been modified in a TDR were $6 million. |
| |
2 | Modifications include extended contract maturities, inclusion of interest only periods, below market interest rates, and extended skip payment periods. |
TDRs in the Customer portfolio segment with a payment default during the years ended December 31, 2013, 2012, and 2011 which had been modified within twelve months prior to the default date, were as follows:
|
| | | | | | | | | | | | | | | | | | | | | | |
| (Millions of dollars) | | Year ended December 31, 2013 | | Year ended December 31, 2012 | | Year ended December 31, 2011 | |
| | | Number
of Contracts | | Post-TDR
Recorded
Investment | | Number
of Contracts | | Post-TDR
Recorded
Investment | | Number
of Contracts | | Post-TDR
Recorded
Investment | |
| Customer | | |
| | |
| | | | | | | | | |
| North America | | 19 |
| | $ | 4 |
| | 49 |
| | $ | 4 |
| | 48 |
| | $ | 26 |
| |
| Europe | | 5 |
| | — |
| | — |
| | — |
| | 1 |
| | 1 |
| |
| Asia Pacific | | — |
| | — |
| | 2 |
| | 1 |
| | — |
| | — |
| |
| Mining | | — |
| | — |
| | — |
| | — |
| | — |
| | — |
| |
| Latin America | | — |
| | — |
| | — |
| | — |
| | 7 |
| | 4 |
| |
| Caterpillar Power Finance | | 2 |
| | 3 |
| | 16 |
| | 21 |
| | 14 |
| | 70 |
| |
| Total | | 26 |
| | $ | 7 |
| | 67 |
| | $ | 26 |
| | 70 |
| | $ | 101 |
| |
| |
| D. | Securitized Retail Installment Sale Contracts and Finance Leases |
Cat Financial has periodically transferred certain finance receivables relating to their retail installment sale contracts and finance leases to special-purpose entities (SPEs) as part of their asset-backed securitization program. These SPEs were concluded to be VIEs. Cat Financial determined that they were the primary beneficiary based on their power to direct activities through their role as servicer and their obligation to absorb losses and right to receive benefits and therefore consolidated these securitization SPEs.
On April 25, 2011, Cat Financial exercised a clean-up call on their only outstanding asset-backed securitization transaction. As a result, Cat Financial had no assets or liabilities related to their securitization program as of December 31, 2013, 2012 or 2011.
Inventories (principally using the LIFO method) are comprised of the following:
|
| | | | | | | | | | | | |
| | | December 31, |
| (Millions of dollars) | | 2013 | | 2012 | | 2011 |
| Raw materials | | $ | 2,966 |
| | $ | 3,573 |
| | $ | 3,766 |
|
| Work-in-process | | 2,589 |
| | 2,920 |
| | 2,959 |
|
| Finished goods | | 6,785 |
| | 8,767 |
| | 7,562 |
|
| Supplies | | 285 |
| | 287 |
| | 257 |
|
| Total inventories | | $ | 12,625 |
| | $ | 15,547 |
| | $ | 14,544 |
|
| | | | | | | |
We had long-term material purchase obligations of approximately $1,568 million at December 31, 2013.
During 2013 inventory quantities were reduced. This reduction resulted in a liquidation of LIFO inventory layers carried at lower costs prevailing in prior years as compared with current costs. In 2013, the effect of this reduction of inventory decreased Cost of goods sold by approximately $115 million and increased Profit by approximately $81 million or $0.12 per share.
| |
| 8. | Property, plant and equipment |
|
| | | | | | | | | | | | | | |
| | | | | December 31, |
| (Millions of dollars) | | Useful Lives (Years) | | 2013 | | 2012 | | 2011 |
| Land | | — | | $ | 688 |
| | $ | 723 |
| | $ | 753 |
|
| Buildings and land improvements | | 20-45 | | 6,928 |
| | 6,214 |
| | 5,857 |
|
| Machinery, equipment and other | | 3-10 | | 16,793 |
| | 16,073 |
| | 14,435 |
|
| Equipment leased to others | | 1-10 | | 5,365 |
| | 4,658 |
| | 4,285 |
|
| Construction-in-process | | — | | 1,542 |
| | 2,264 |
| | 1,996 |
|
| Total property, plant and equipment, at cost | | | | 31,316 |
| | 29,932 |
| | 27,326 |
|
| Less: Accumulated depreciation | | | | (14,241 | ) | | (13,471 | ) | | (12,931 | ) |
| Property, plant and equipment–net | | | | $ | 17,075 |
| | $ | 16,461 |
| | $ | 14,395 |
|
| | | | | | | | | |
We had commitments for the purchase or construction of capital assets of approximately $269 million at December 31, 2013.
|
| | | | | | | | | | | | |
Assets recorded under capital leases: 1 | | |
| | | December 31, |
| (Millions of dollars) | | 2013 | | 2012 | | 2011 |
Gross capital leases 2 | | $ | 125 |
| | $ | 134 |
| | $ | 131 |
|
| Less: Accumulated depreciation | | (50 | ) | | (58 | ) | | (75 | ) |
| Net capital leases | | $ | 75 |
| | $ | 76 |
| | $ | 56 |
|
| |
1 | Included in Property, plant and equipment table above. |
| |
2 | Consists primarily of machinery and equipment. |
At December 31, 2013, scheduled minimum rental payments on assets recorded under capital leases were:
|
| | | | | | | | | | | | | | | | | | | | | | |
| (Millions of dollars) |
| 2014 | | 2015 | | 2016 | | 2017 | | 2018 | | Thereafter |
| $ | 10 |
| | $ | 14 |
| | $ | 22 |
| | $ | 7 |
| | $ | 7 |
| | $ | 47 |
|
|
| | | | | | | | | | | | |
| Equipment leased to others (primarily by Cat Financial): | | | | | | |
| | | December 31, |
| (Millions of dollars) | | 2013 | | 2012 | | 2011 |
| Equipment leased to others–at original cost | | $ | 5,365 |
| | $ | 4,658 |
| | $ | 4,285 |
|
| Less: Accumulated depreciation | | (1,521 | ) | | (1,383 | ) | | (1,406 | ) |
| Equipment leased to others–net | | $ | 3,844 |
| | $ | 3,275 |
| | $ | 2,879 |
|
| | | | | | | |
At December 31, 2013, scheduled minimum rental payments to be received for equipment leased to others were:
|
| | | | | | | | | | | | | | | | | | | | | | |
| (Millions of dollars) |
| 2014 | | 2015 | | 2016 | | 2017 | | 2018 | | Thereafter |
| $ | 916 |
| | $ | 626 |
| | $ | 379 |
| | $ | 191 |
| | $ | 95 |
| | $ | 45 |
|
| |
| 9. | Investments in unconsolidated affiliated companies |
Combined financial information of the unconsolidated affiliated companies accounted for by the equity method (generally on a lag of 3 months or less) was as follows:
|
| | | | | | | | | | | | |
| Results of Operations of unconsolidated affiliated companies: | | | | | | |
| | | Years ended December 31, |
| (Millions of dollars) | | 2013 | | 2012 | | 2011 |
| Results of Operations: | | |
| | |
| | |
|
| Sales | | $ | 1,336 |
| | $ | 1,084 |
| | $ | 966 |
|
| Cost of sales | | 1,048 |
| | 872 |
| | 797 |
|
| Gross profit | | $ | 288 |
| | $ | 212 |
| | $ | 169 |
|
| | | | | | | |
| Profit (loss) | | $ | (28 | ) | | $ | 28 |
| | $ | (46 | ) |
| | | | | | | |
|
| | | | | | | | | | | | |
| Financial Position of unconsolidated affiliated companies: | | | | | | |
| | | December 31, |
| (Millions of dollars) | | 2013 | | 2012 | | 2011 |
| Financial Position: | | |
| | |
| | |
|
| Assets: | | |
| | |
| | |
|
| Current assets | | $ | 683 |
| | $ | 715 |
| | $ | 345 |
|
| Property, plant and equipment–net | | 710 |
| | 529 |
| | 200 |
|
| Other assets | | 608 |
| | 616 |
| | 9 |
|
| | | 2,001 |
| | 1,860 |
| | 554 |
|
| Liabilities: | | |
| | |
| | |
|
| Current liabilities | | 437 |
| | 443 |
| | 220 |
|
| Long-term debt due after one year | | 900 |
| | 708 |
| | 72 |
|
| Other liabilities | | 262 |
| | 170 |
| | 17 |
|
| | | 1,599 |
| | 1,321 |
| | 309 |
|
| Equity | | $ | 402 |
| | $ | 539 |
| | $ | 245 |
|
| | | | | | | |
|
| | | | | | | | | | | | |
| Caterpillar’s investments in unconsolidated affiliated companies: | | | | | | |
| | | December 31, |
| (Millions of dollars) | | 2013 | | 2012 | | 2011 |
| Investments in equity method companies | | $ | 262 |
| | $ | 256 |
| | $ | 111 |
|
| Plus: Investments in cost method companies | | 10 |
| | 16 |
| | 22 |
|
| Total investments in unconsolidated affiliated companies | | $ | 272 |
| | $ | 272 |
| | $ | 133 |
|
| | | | | | | |
The increase in the 2012 financial position and equity investments amounts from 2011 relate to the sale of a majority interest in Caterpillar's third party logistics business, which occurred on July 31, 2012. Under the terms of the agreement, Caterpillar retained a 35 percent equity interest. The increase is also related to the acquisition of an equity interest in Black Horse LLC, which occurred on December 5, 2012.
10. Intangible assets and goodwill
Intangible assets are comprised of the following:
|
| | | | | | | | | | | | | | |
| | | | | December 31, 2013 |
| (Millions of dollars) | | Weighted Amortizable Life (Years) | | Gross Carrying Amount | | Accumulated Amortization | | Net |
| Customer relationships | | 15 | | $ | 2,653 |
| | $ | (539 | ) | | $ | 2,114 |
|
| Intellectual property | | 11 | | 1,821 |
| | (495 | ) | | 1,326 |
|
| Other | | 10 | | 274 |
| | (136 | ) | | 138 |
|
| Total finite-lived intangible assets | | 13 | | 4,748 |
| | (1,170 | ) | | 3,578 |
|
| Indefinite-lived intangible assets - In-process research & development | | | | 18 |
| | — |
| | 18 |
|
| Total intangible assets | | | | $ | 4,766 |
| | $ | (1,170 | ) | | $ | 3,596 |
|
| | | | | | | | | |
| | | | | December 31, 2012 |
| | | Weighted Amortizable Life (Years) | | Gross Carrying Amount | | Accumulated Amortization | | Net |
| Customer relationships | | 15 | | $ | 2,756 |
| | $ | (377 | ) | | $ | 2,379 |
|
| Intellectual property | | 12 | | 1,767 |
| | (342 | ) | | 1,425 |
|
| Other | | 10 | | 299 |
| | (105 | ) | | 194 |
|
| Total finite-lived intangible assets | | 13 | | 4,822 |
| | (824 | ) | | 3,998 |
|
| Indefinite-lived intangible assets - In-process research & development | | | | 18 |
| | — |
| | 18 |
|
| Total intangible assets | | | | $ | 4,840 |
| | $ | (824 | ) | | $ | 4,016 |
|
| | | | | | | | | |
| | | | | December 31, 2011 |
| | | Weighted Amortizable Life (Years) | | Gross Carrying Amount | | Accumulated Amortization | | Net |
| Customer relationships | | 15 | | $ | 2,811 |
| | $ | (213 | ) | | $ | 2,598 |
|
| Intellectual property | | 11 | | 1,794 |
| | (244 | ) | | 1,550 |
|
| Other | | 11 | | 299 |
| | (97 | ) | | 202 |
|
| Total finite-lived intangible assets | | 13 | | 4,904 |
| | (554 | ) | | 4,350 |
|
| Indefinite-lived intangible assets - In-process research & development | | | | 18 |
| | — |
| | 18 |
|
| Total intangible assets | | | | $ | 4,922 |
| | $ | (554 | ) | | $ | 4,368 |
|
| | | | | | | | | |
During 2013, we acquired finite-lived intangible assets aggregating $70 million due to the purchase of Johan Walter Berg AB (Berg). See Note 24 for details on this acquisition.
Gross customer relationship intangibles of $168 million and related accumulated amortization of $25 million were reclassified from Intangible assets to assets held for sale and/or divested during 2013, and are not included in the December 31, 2013 balances in the table above. These transactions were related to the divestiture of portions of the Bucyrus distribution business. See Note 26 for additional information on divestitures and assets held for sale.
During 2012, we acquired finite-lived intangible assets aggregating $120 million due to purchases of Siwei ($112 million) and Caterpillar Tohoku Ltd. (Cat Tohoku) ($8 million). See Note 24 for details on these acquisitions.
Gross customer relationship intangibles of $207 million and related accumulated amortization of $93 million were reclassified from Intangible assets to held for sale and/or divested during 2012, and are not included in the December 31, 2012 balances in the table above. These transactions primarily related to the divestiture of portions of the Bucyrus distribution business and our third party logistics business. See Note 26 for additional information on divestitures and assets held for sale.
Gross customer relationship intangibles of $51 million and related accumulated amortization of $29 million from the All Other segment were impaired during 2012. Fair value of the intangibles was determined using an income approach based on the present value of discounted cash flows. The impairment of $22 million was recognized in Other operating (income) expenses in Statement 1 and included in the All Other segment.
During 2011, we acquired finite-lived intangible assets aggregating $4,167 million primarily due to purchases of Bucyrus International, Inc. (Bucyrus) ($3,901 million), Pyroban Group Ltd. (Pyroban) ($41 million) and MWM Holding GmbH (MWM) ($221 million). See Note 24 for details on these acquisitions.
As described in Note 26, we sold customer relationship intangibles of $63 million associated with the divestiture of a portion of the Bucyrus distribution business in December 2011. Additionally, $186 million of customer relationship intangibles were classified as held for sale at December 31, 2011, and are not included in the table above.
Finite-lived intangible assets are amortized over their estimated useful lives and tested for impairment if events or changes in circumstances indicate that the asset may be impaired. Indefinite-lived intangible assets are tested for impairment at least annually.
Amortization expense related to intangible assets was $371 million, $387 million and $233 million for 2013, 2012 and 2011, respectively.
As of December 31, 2013, amortization expense related to intangible assets is expected to be:
|
| | | | | | | | | | | | | | | | | | | | | | |
| (Millions of dollars) |
| 2014 | | 2015 | | 2016 | | 2017 | | 2018 | | Thereafter |
| $ | 365 |
| | $ | 354 |
| | $ | 333 |
| | $ | 331 |
| | $ | 327 |
| | $ | 1,886 |
|
| | | | | | | | | | | |
During 2013, we acquired net assets with related goodwill of $106 million due to the purchase of Berg. See Note 24 for details on this acquisition.
As discussed in Note 24, we recorded goodwill of $625 million related to our May 2012 acquisition of Siwei. In November 2012, Caterpillar became aware of inventory accounting discrepancies at Siwei which led to an internal investigation. Caterpillar's investigation determined that Siwei had engaged in accounting misconduct prior to Caterpillar's acquisition of Siwei in mid-2012. The accounting misconduct included inappropriate accounting practices involving improper cost allocation that resulted in overstated profit and improper revenue recognition practices involving early and, at times unsupported, revenue recognition.
Because of the accounting misconduct identified in the fourth quarter of 2012, Siwei's goodwill was tested for impairment as of November 30, 2012. We determined the carrying value of Siwei, which is a separate reporting unit, exceeded its fair value at the measurement date, requiring step two in the impairment test process. The fair value of the Siwei reporting unit was determined primarily using an income approach based on the present value of discounted cash flows. We assigned the fair value to the reporting unit's assets and liabilities and determined the implied fair value of goodwill was substantially below the carrying value of the reporting unit's goodwill. Accordingly, we recognized a $580 million goodwill impairment charge, which resulted in goodwill of $45 million remaining for Siwei as of December 31, 2012. The goodwill impairment was a result of changes in the assumptions used to determine the fair value resulting from the accounting misconduct that occurred before the acquisition. There was no tax benefit associated with this impairment charge. The Siwei goodwill impairment charge is reported in the Resource Industries segment.
Additionally, during 2012, we recorded goodwill of $22 million related to the acquisition of Cat Tohoku and finalized the allocation of the Bucyrus and MWM purchase prices to identifiable assets and liabilities, adjusting goodwill from our December 31, 2011 preliminary allocation for Bucyrus and MWM by a reduction of $28 million and an increase of $9 million, respectively. See Note 24 for details on these acquisitions.
During 2011, we acquired net assets with related goodwill aggregating $5,026 million primarily due to purchases of Bucyrus ($4,616 million), Pyroban ($23 million) and MWM ($387 million). See Note 24 for details on these acquisitions.
Goodwill of $65 million, $181 million and $409 million was reclassified to held for sale and/or divested during 2013, 2012 and 2011, respectively, and is not included in the December 31, 2013, 2012 and 2011 respective balances in the table below. The reclassified/divested amount in 2013 was related to the divestiture of portions of the Bucyrus distribution business and the sale of certain Power Systems assets that were accounted for as a business. The reclassified/divested amounts in 2012 and 2011 primarily related to the divestiture of portions of the Bucyrus distribution business. See Note 26 for additional information on divestitures and assets held for sale.
The changes in carrying amount of goodwill by reportable segment for the years ended December 31, 2013, 2012 and 2011 were as follows:
|
| | | | | | | | | | | | | | | | | | | | | | | | |
| (Millions of dollars) | | December 31, 2012 | | Acquisitions 1 | | Held for Sale and Business Divestitures 2 | | Impairment Loss | | Other Adjustments 3 | | December 31, 2013 |
| Construction Industries | | | | | | | | | | | | |
| Goodwill | | $ | 382 |
| | $ | — |
| | $ | — |
| | $ | — |
| | $ | (56 | ) | | $ | 326 |
|
| Resource Industries | | | | | | | | | | | | |
| Goodwill | | 4,559 |
| | — |
| | (55 | ) | | — |
| | 11 |
| | 4,515 |
|
| Impairments | | (602 | ) | | — |
| | — |
| | — |
| | — |
| | (602 | ) |
| Net goodwill | | 3,957 |
| | — |
| | (55 | ) | | — |
| | 11 |
| | 3,913 |
|
| Power Systems | | | | | | | | | | | | |
| Goodwill | | 2,486 |
| | 106 |
| | (10 | ) | | — |
| | 18 |
| | 2,600 |
|
All Other 4 | | | | | | | | | | | | |
| Goodwill | | 117 |
| | — |
| | — |
| | — |
| | — |
| | 117 |
|
| Consolidated total | | | | | | | | | | | | |
| Goodwill | | 7,544 |
| | 106 |
| �� | (65 | ) | | — |
| | (27 | ) | | 7,558 |
|
| Impairments | | (602 | ) | | — |
| | — |
| | — |
| | — |
| | (602 | ) |
| Net goodwill | | $ | 6,942 |
| | $ | 106 |
| | $ | (65 | ) | | $ | — |
| | $ | (27 | ) | | $ | 6,956 |
|
| | | | | | | | | | | | | |
| | | December 31, 2011 | | Acquisitions 1 | | Held for Sale and Business Divestitures 2 | | Impairment Loss | | Other Adjustments 3 | | December 31, 2012 |
| Construction Industries | | | | | | | | | | | | |
| Goodwill | | $ | 378 |
| | $ | 22 |
| | $ | — |
| | $ | — |
| | $ | (18 | ) | | $ | 382 |
|
| Resource Industries | | | | | | | | | | | | |
| Goodwill | | 4,121 |
| | 597 |
| | (181 | ) | | — |
| | 22 |
| | 4,559 |
|
| Impairments | | (22 | ) | | — |
| | — |
| | (580 | ) | | — |
| | (602 | ) |
| Net goodwill | | 4,099 |
| | 597 |
| | (181 | ) | | (580 | ) | | 22 |
| | 3,957 |
|
| Power Systems | | | | | | | | | | | | |
| Goodwill | | 2,486 |
| | 9 |
| | — |
| | — |
| | (9 | ) | | 2,486 |
|
All Other 4 | | | | | | | | | | | | |
| Goodwill | | 117 |
| | — |
| | — |
| | — |
| | — |
| | 117 |
|
| Consolidated total | | | | | | | | | | | | |
| Goodwill | | 7,102 |
| | 628 |
| | (181 | ) | | — |
| | (5 | ) | | 7,544 |
|
| Impairments | | (22 | ) | | — |
| | — |
| | (580 | ) | | — |
| | (602 | ) |
| Net goodwill | | $ | 7,080 |
| | $ | 628 |
| | $ | (181 | ) | | $ | (580 | ) | | $ | (5 | ) | | $ | 6,942 |
|
| | | | | | | | | | | | | |
| | | December 31, 2010 | | Acquisitions 1 | | Held for Sale and Business Divestitures 2 | | Impairment Loss | | Other Adjustments 3 | | December 31, 2011 |
| Construction Industries | | | | | | | | | | | | |
| Goodwill | | $ | 357 |
| | $ | — |
| | $ | — |
| | $ | — |
| | $ | 21 |
| | $ | 378 |
|
| Resource Industries | | | | | | | | | | | | |
| Goodwill | | 73 |
| | 4,616 |
| | (397 | ) | | — |
| | (171 | ) | | 4,121 |
|
| Impairments | | (22 | ) | | — |
| | — |
| | — |
| | — |
| | (22 | ) |
| Net goodwill | | 51 |
| | 4,616 |
| | (397 | ) | | — |
| | (171 | ) | | 4,099 |
|
| Power Systems | | | | | | | | | | | | |
| Goodwill | | 2,077 |
| | 410 |
| | — |
| | — |
| | (1 | ) | | 2,486 |
|
All Other 4 | | | | | | | | | | | | |
| Goodwill | | 129 |
| | — |
| | (12 | ) | | — |
| | — |
| | 117 |
|
| Consolidated total | | | | | | | | | | | | |
| Goodwill | | 2,636 |
| | 5,026 |
| | (409 | ) | | — |
| | (151 | ) | | 7,102 |
|
| Impairments | | (22 | ) | | — |
| | — |
| | — |
| | — |
| | (22 | ) |
| Net goodwill | | $ | 2,614 |
| | $ | 5,026 |
| | $ | (409 | ) | | $ | — |
| | $ | (151 | ) | | $ | 7,080 |
|
| | | | | | | | | | | | | |
| |
1 | See Note 24 for additional information. |
| |
2 | See Note 26 for additional information. |
| |
3 | Other adjustments are comprised primarily of foreign currency translation. |
| |
4 | Includes All Other operating segment (See Note 23). |
| |
| 11. | Available-for-sale securities |
We have investments in certain debt and equity securities, primarily at Insurance Services, that have been classified as available-for-sale and recorded at fair value based upon quoted market prices. These investments are primarily included in Other assets in Statement 3. Unrealized gains and losses arising from the revaluation of available-for-sale securities are included, net of applicable deferred income taxes, in equity (Accumulated other comprehensive income (loss) in Statement 3). Realized gains and losses on sales of investments are generally determined using the FIFO (first-in, first-out) method for debt instruments and the specific identification method for equity securities. Realized gains and losses are included in Other income (expense) in Statement 1.
|
| | | | | | | | | | | | | | | | | | | | | | | | | | | | | | | | | | | | |
| | | December 31, 2013 | | December 31, 2012 | | December 31, 2011 |
| (Millions of dollars) | | Cost Basis | | Unrealized Pretax Net Gains (Losses) | | Fair Value | | Cost Basis | | Unrealized Pretax Net Gains (Losses) | | Fair Value | | Cost Basis | | Unrealized Pretax Net Gains (Losses) | | Fair Value |
| Government debt | | |
| | |
| | |
| | |
| | |
| | |
| | |
| | |
| | |
|
| U.S. treasury bonds | | $ | 10 |
| | $ | — |
| | $ | 10 |
| | $ | 10 |
| | $ | — |
| | $ | 10 |
| | $ | 10 |
| | $ | — |
| | $ | 10 |
|
| Other U.S. and non-U.S. government bonds | | 119 |
| | 1 |
| | 120 |
| | 144 |
| | 2 |
| | 146 |
| | 90 |
| | 2 |
| | 92 |
|
| | | | | | | | | | | | | | | | | | | |
| Corporate bonds | | |
| | |
| | |
| | |
| | |
| | |
| | |
| | |
| | |
|
| Corporate bonds | | 612 |
| | 21 |
| | 633 |
| | 626 |
| | 38 |
| | 664 |
| | 542 |
| | 30 |
| | 572 |
|
| Asset-backed securities | | 72 |
| | — |
| | 72 |
| | 96 |
| | — |
| | 96 |
| | 112 |
| | (1 | ) | | 111 |
|
| | | | | | | | | | | | | | | | | | | |
| Mortgage-backed debt securities | | | | | | |
| | |
| | |
| | |
| | |
| | |
| | |
|
| U.S. governmental agency | | 322 |
| | (1 | ) | | 321 |
| | 291 |
| | 8 |
| | 299 |
| | 297 |
| | 13 |
| | 310 |
|
| Residential | | 18 |
| | — |
| | 18 |
| | 26 |
| | (1 | ) | | 25 |
| | 33 |
| | (3 | ) | | 30 |
|
| Commercial | | 87 |
| | 6 |
| | 93 |
| | 117 |
| | 10 |
| | 127 |
| | 142 |
| | 3 |
| | 145 |
|
| | | | | | | | | | | | | | | | | | | |
| Equity securities | | | | | | |
| | |
| | |
| | |
| | |
| | |
| | |
|
| Large capitalization value | | 173 |
| | 81 |
| | 254 |
| | 147 |
| | 38 |
| | 185 |
| | 127 |
| | 21 |
| | 148 |
|
| Smaller company growth | | 25 |
| | 24 |
| | 49 |
| | 22 |
| | 12 |
| | 34 |
| | 22 |
| | 7 |
| | 29 |
|
| Total | | $ | 1,438 |
| | $ | 132 |
| | $ | 1,570 |
| | $ | 1,479 |
| | $ | 107 |
| | $ | 1,586 |
| | $ | 1,375 |
| | $ | 72 |
| | $ | 1,447 |
|
| | | | | | | | | | | | | | | | | | | |
During 2013, 2012 and 2011, charges for other-than-temporary declines in the market values of securities were $1 million, $2 million and $5 million, respectively. These charges were accounted for as realized losses and were included in Other income (expense) in Statement 1. The cost basis of the impacted securities was adjusted to reflect these charges.
|
| | | | | | | | | | | | | | | | | | | | | | | | |
| Investments in an unrealized loss position that are not other-than-temporarily impaired: |
| | | |
| | | December 31, 2013 |
| | | Less than 12 months 1 | | 12 months or more 1 | | Total |
| (Millions of dollars) | | Fair Value | | Unrealized Losses | | Fair Value | | Unrealized Losses | | Fair Value | | Unrealized Losses |
| Corporate bonds | | |
| | |
| | |
| | |
| | |
| | |
|
| Corporate bonds | | $ | 159 |
| | $ | 2 |
| | $ | 1 |
| | $ | — |
| | $ | 160 |
| | $ | 2 |
|
| Asset-backed securities | | 6 |
| | — |
| | 20 |
| | 1 |
| | 26 |
| | 1 |
|
| | | | | | | | | | | | | |
| Mortgage-backed debt securities | | |
| | |
| | |
| | |
| | |
| | |
|
| U.S. governmental agency | | 140 |
| | 4 |
| | 65 |
| | 2 |
| | 205 |
| | 6 |
|
| Total | | $ | 305 |
| | $ | 6 |
| | $ | 86 |
| | $ | 3 |
| | $ | 391 |
| | $ | 9 |
|
| |
1 | Indicates length of time that individual securities have been in a continuous unrealized loss position. |
|
| | | | | | | | | | | | | | | | | | | | | | | | |
| Investments in an unrealized loss position that are not other-than-temporarily impaired: |
| | | |
| | | December 31, 2012 |
| | | Less than 12 months 1 | | 12 months or more 1 | | Total |
| (Millions of dollars) | | Fair Value | | Unrealized Losses | | Fair Value | | Unrealized Losses | | Fair Value | | Unrealized Losses |
| Corporate bonds | | |
| | |
| | |
| | |
| | |
| | |
|
| Asset-backed securities | | $ | — |
| | $ | — |
| | $ | 20 |
| | $ | 3 |
| | $ | 20 |
| | $ | 3 |
|
| | | | | | �� | | | | | | | |
| Mortgage-backed debt securities | | |
| | |
| | |
| | |
| | |
| | |
|
| U.S. governmental agency | | 84 |
| | 1 |
| | 15 |
| | — |
| | 99 |
| | 1 |
|
| Residential | | — |
| | — |
| | 14 |
| | 1 |
| | 14 |
| | 1 |
|
| | | | | | | | | | | | | |
| Equity securities | | | | | | | | | | |
| | |
|
| Large capitalization value | | 25 |
| | 2 |
| | 10 |
| | 1 |
| | 35 |
| | 3 |
|
| Total | | $ | 109 |
| | $ | 3 |
| | $ | 59 |
| | $ | 5 |
| | $ | 168 |
| | $ | 8 |
|
| |
1 | Indicates length of time that individual securities have been in a continuous unrealized loss position. |
|
| | | | | | | | | | | | | | | | | | | | | | | | |
| Investments in an unrealized loss position that are not other-than-temporarily impaired: |
| | | December 31, 2011 |
| | | Less than 12 months 1 | | 12 months or more 1 | | Total |
| (Millions of dollars) | | Fair Value | | Unrealized Losses | | Fair Value | | Unrealized Losses | | Fair Value | | Unrealized Losses |
| Corporate bonds | | |
| | |
| | |
| | |
| | |
| | |
|
| Corporate bonds | | $ | 54 |
| | $ | 1 |
| | $ | 1 |
| | $ | — |
| | $ | 55 |
| | $ | 1 |
|
| Asset-backed securities | | 1 |
| | — |
| | 20 |
| | 5 |
| | 21 |
| | 5 |
|
| | | | | | | | | | | | | |
| Mortgage-backed debt securities | | |
| | |
| | |
| | |
| | |
| | |
|
| U.S. governmental agency | | 51 |
| | 1 |
| | — |
| | — |
| | 51 |
| | 1 |
|
| Residential | | 3 |
| | — |
| | 18 |
| | 3 |
| | 21 |
| | 3 |
|
| Commercial | | 15 |
| | — |
| | 8 |
| | 1 |
| | 23 |
| | 1 |
|
| | | | | | | | | | | | | |
| Equity securities | | |
| | |
| | |
| | |
| | |
| | |
|
| Large capitalization value | | 36 |
| | 5 |
| | 6 |
| | 1 |
| | 42 |
| | 6 |
|
| Smaller company growth | | 4 |
| | 1 |
| | — |
| | — |
| | 4 |
| | 1 |
|
| Total | | $ | 164 |
| | $ | 8 |
| | $ | 53 |
| | $ | 10 |
| | $ | 217 |
| | $ | 18 |
|
| |
1 | Indicates length of time that individual securities have been in a continuous unrealized loss position. |
Corporate Bonds. The unrealized losses on our investments in corporate bonds and asset-backed securities relate to changes in interest rates and credit-related yield spreads since time of purchase. We do not intend to sell the investments and it is not likely that we will be required to sell the investments before recovery of their amortized cost basis. We do not consider these investments to be other-than-temporarily impaired as of December 31, 2013.
Mortgage-Backed Debt Securities. The unrealized losses on our investments in mortgage-backed securities are a function of higher delinquencies, default rates and underlying market yields since time of purchase. We do not intend to sell the investments and it is not likely that we will be required to sell these investments before recovery of their amortized cost basis. We do not consider these investments to be other-than-temporarily impaired as of December 31, 2013.
The cost basis and fair value of the available-for-sale debt securities at December 31, 2013, by contractual maturity, is shown below. Expected maturities will differ from contractual maturities because borrowers may have the right to prepay and creditors may have the right to call obligations.
|
| | | | | | | | |
| | | | | |
| | | December 31, 2013 |
| (Millions of dollars) | | Cost Basis | | Fair Value |
| Due in one year or less | | $ | 187 |
| | $ | 188 |
|
| Due after one year through five years | | 572 |
| | 592 |
|
| Due after five years through ten years | | 24 |
| | 25 |
|
| Due after ten years | | 30 |
| | 30 |
|
| U.S. governmental agency mortgage-backed securities | | 322 |
| | 321 |
|
| Residential mortgage-backed securities | | 18 |
| | 18 |
|
| Commercial mortgage-backed securities | | 87 |
| | 93 |
|
| Total debt securities – available-for-sale | | $ | 1,240 |
| | $ | 1,267 |
|
| | | | | |
|
| | | | | | | | | | | | |
| | | | | | | |
| Sales of Securities: | | | | | | |
| | | Years Ended December 31, |
| (Millions of dollars) | | 2013 | | 2012 | | 2011 |
| Proceeds from the sale of available-for-sale securities | | $ | 449 |
| | $ | 306 |
| | $ | 247 |
|
| Gross gains from the sale of available-for-sale securities | | $ | 22 |
| | $ | 6 |
| | $ | 4 |
|
| Gross losses from the sale of available-for-sale securities | | $ | 2 |
| | $ | — |
| | $ | 1 |
|
| | | | | | | |
| |
| 12. | Postemployment benefit plans |
We provide defined benefit pension plans, defined contribution plans and/or other postretirement benefit plans (retirement health care and life insurance) to employees in many of our locations throughout the world. Our defined benefit pension plans provide a benefit based on years of service and/or the employee’s average earnings near retirement. Our defined contribution plans allow employees to contribute a portion of their salary to help save for retirement, and in certain cases, we provide a matching contribution. The benefit obligation related to our non-U.S. defined benefit pension plans are for employees located primarily in Europe, Japan and Brazil. For other postretirement benefits, substantially all of our benefit obligation is for employees located in the United States.
In February 2012, we announced the closure of the Electro-Motive Diesel facility located in London, Ontario. As a result of the closure, we recognized a $37 million other postretirement benefits curtailment gain. This excludes a $21 million loss of a third-party receivable for other postretirement benefits that was eliminated due to the closure. In addition, a $10 million contractual termination benefit expense was recognized related to statutory pension benefits required to be paid to certain affected employees. As a result, a net gain of $6 million related to the facility closure was recognized in Other operating (income) expenses in Statement 1.
In August 2012, we announced changes to our U.S. hourly pension plan, which impacted certain hourly employees. For the impacted employees, pension benefit accruals were frozen on January 1, 2013 or will freeze January 1, 2016, at which time employees will become eligible for various provisions of company sponsored 401(k) plans including a matching contribution and an annual employer contribution. The plan changes resulted in a curtailment and required a remeasurement as of August 31, 2012. The curtailment and the remeasurement resulted in a net increase in our Liability for postemployment benefits of $243 million and a net loss of $153 million, net of tax, recognized in Accumulated other comprehensive income (loss). The increase in the liability was primarily due to a decline in the discount rate. Also, the curtailment resulted in expense of $7 million which was recognized in Other operating (income) expenses in Statement 1.
|
| | | | | | | | | | | | | | | | | | | | | | | | | | | | | | | | | | | | |
| | | U.S. Pension Benefits | | Non-U.S. Pension Benefits | | Other Postretirement Benefits |
| (Millions of dollars) | | 2013 | | 2012 | | 2011 | | 2013 | | 2012 | | 2011 | | 2013 | | 2012 | | 2011 |
| Change in benefit obligation: | | |
| | |
| | |
| | |
| | |
| | |
| | |
| | |
| | |
|
| Benefit obligation, beginning of year | | $ | 15,913 |
| | $ | 14,782 |
| | $ | 13,024 |
| | $ | 4,737 |
| | $ | 4,299 |
| | $ | 3,867 |
| | $ | 5,453 |
| | $ | 5,381 |
| | $ | 5,184 |
|
| Service cost | | 196 |
| | 185 |
| | 158 |
| | 120 |
| | 108 |
| | 115 |
| | 108 |
| | 92 |
| | 84 |
|
| Interest cost | | 581 |
| | 609 |
| | 651 |
| | 166 |
| | 182 |
| | 182 |
| | 195 |
| | 221 |
| | 253 |
|
| Plan amendments | | — |
| | — |
| | 1 |
| | — |
| | 12 |
| | (24 | ) | | 1 |
| | (38 | ) | | (121 | ) |
| Actuarial losses (gains) | | (1,450 | ) | | 1,168 |
| | 1,635 |
| | (41 | ) | | 385 |
| | 312 |
| | (658 | ) | | 186 |
| | 306 |
|
| Foreign currency exchange rates | | — |
| | — |
| | — |
| | (81 | ) | | 49 |
| | (32 | ) | | (19 | ) | | (11 | ) | | (19 | ) |
| Participant contributions | | — |
| | — |
| | — |
| | 10 |
| | 9 |
| | 9 |
| | 57 |
| | 48 |
| | 44 |
|
| Benefits paid - gross | | (845 | ) | | (831 | ) | | (823 | ) | | (254 | ) | | (190 | ) | | (187 | ) | | (339 | ) | | (394 | ) | | (388 | ) |
| Less: federal subsidy on benefits paid | | — |
| | — |
| | — |
| | — |
| | — |
| | — |
| | 8 |
| | 16 |
| | 14 |
|
| Curtailments, settlements and termination benefits | | (7 | ) | | — |
| | (3 | ) | | (56 | ) | | (67 | ) | | (83 | ) | | — |
| | (48 | ) | | (6 | ) |
Acquisitions, divestitures and other 1 | | 31 |
| | — |
| | 139 |
| | 8 |
| | (50 | ) | | 140 |
| | (22 | ) | | — |
| | 30 |
|
| Benefit obligation, end of year | | $ | 14,419 |
| | $ | 15,913 |
| | $ | 14,782 |
| | $ | 4,609 |
| | $ | 4,737 |
| | $ | 4,299 |
| | $ | 4,784 |
| | $ | 5,453 |
| | $ | 5,381 |
|
| Accumulated benefit obligation, end of year | | $ | 14,056 |
| | $ | 15,132 |
| | $ | 14,055 |
| | $ | 4,247 |
| | $ | 4,329 |
| | $ | 3,744 |
| | |
| | |
| | |
|
| | | | | | | | | | | | | | | | | | | |
Weighted-average assumptions used to determine benefit obligation: | | |
| | |
| | |
| | |
| | |
| | |
| | |
| | |
| | |
|
Discount rate 2 | | 4.6 | % | | 3.7 | % | | 4.3 | % | | 4.1 | % | | 3.7 | % | | 4.3 | % | | 4.6 | % | | 3.7 | % | | 4.3 | % |
Rate of compensation increase 2 | | 4.0 | % | | 4.5 | % | | 4.5 | % | | 4.2 | % | | 3.9 | % | | 3.9 | % | | 4.0 | % | | 4.4 | % | | 4.4 | % |
| |
1 | In 2013, charge to recognize a previously unrecorded liability related to a subsidiary's pension plans and an adjustment to other postretirement benefits related to certain other benefits. See Note 26 regarding the divestiture of the third party logistics business in 2012 and Note 24 for the acquisition of Bucyrus International in 2011. |
| |
2 | End of year rates are used to determine net periodic cost for the subsequent year. See Note 12E. |
Assumed health care cost trend rates have a significant effect on the amounts reported for the health care plans. A one-percentage-point change in assumed health care cost trend rates would have the following effects:
|
| | | | | | | | |
| (Millions of dollars) | | One-percentage- point increase | | One-percentage- point decrease |
| Effect on 2013 service and interest cost components of other postretirement benefit cost | | $ | 26 |
| | $ | (22 | ) |
| Effect on accumulated postretirement benefit obligation | | $ | 274 |
| | $ | (230 | ) |
|
| | | | | | | | | | | | | | | | | | | | | | | | | | | | | | | | | | | | |
| | | U.S. Pension Benefits | | Non-U.S. Pension Benefits | | Other Postretirement Benefits |
| (Millions of dollars) | | 2013 | | 2012 | | 2011 | | 2013 | | 2012 | | 2011 | | 2013 | | 2012 | | 2011 |
| Change in plan assets: | | |
| | |
| | |
| | |
| | |
| | |
| | |
| | |
| | |
|
| Fair value of plan assets, beginning of year | | $ | 10,981 |
| | $ | 9,997 |
| | $ | 10,760 |
| | $ | 3,426 |
| | $ | 2,818 |
| | $ | 2,880 |
| | $ | 789 |
| | $ | 814 |
| | $ | 996 |
|
| Actual return on plan assets | | 1,722 |
| | 1,235 |
| | (270 | ) | | 535 |
| | 368 |
| | (83 | ) | | 158 |
| | 117 |
| | (45 | ) |
| Foreign currency exchange rates | | — |
| | — |
| | — |
| | (41 | ) | | 47 |
| | (1 | ) | | — |
| | — |
| | — |
|
| Company contributions | | 541 |
| | 580 |
| | 212 |
| | 303 |
| | 446 |
| | 234 |
| | 157 |
| | 204 |
| | 207 |
|
| Participant contributions | | — |
| | — |
| | — |
| | 10 |
| | 9 |
| | 9 |
| | 57 |
| | 48 |
| | 44 |
|
| Benefits paid | | (845 | ) | | (831 | ) | | (823 | ) | | (254 | ) | | (190 | ) | | (187 | ) | | (339 | ) | | (394 | ) | | (388 | ) |
| Settlements and termination benefits | | (4 | ) | | — |
| | — |
| | (30 | ) | | (72 | ) | | (41 | ) | | — |
| | — |
| | — |
|
Acquisitions / other 1 | | — |
| | — |
| | 118 |
| | — |
| | — |
| | 7 |
| | — |
| | — |
| | — |
|
| Fair value of plan assets, end of year | | $ | 12,395 |
| | $ | 10,981 |
| | $ | 9,997 |
| | $ | 3,949 |
| | $ | 3,426 |
| | $ | 2,818 |
| | $ | 822 |
| | $ | 789 |
| | $ | 814 |
|
| |
1 | See Note 24 regarding Bucyrus International in 2011. |
Our current U.S. pension target asset allocations are 60 percent equities and 40 percent fixed income. Our strategy includes further aligning our investments to our liabilities, while reducing risk in our portfolio. Target allocation policies will be revisited periodically to ensure they reflect the overall objectives of the fund.
In general, our non-U.S. pension target asset allocations reflect our investment strategy of maximizing the long-term rate of return on plan assets and the resulting funded status, within an appropriate level of risk. The weighted-average target allocations for the non-U.S. pension plans are 59 percent equities, 32 percent fixed income, 7 percent real estate and 2 percent other. The target allocations for each plan vary based upon local statutory requirements, demographics of plan participants and funded status. Plan assets are primarily invested in non-U.S. securities.
Our target allocations for the other postretirement benefit plans are 70 percent equities and 30 percent fixed income.
The U.S. plans are rebalanced to plus or minus 5 percentage points of the target asset allocation ranges on a monthly basis. The frequency of rebalancing for the non-U.S. plans varies depending on the plan. As a result of our diversification strategies, there are no significant concentrations of risk within the portfolio of investments except for the holdings in Caterpillar stock as discussed below.
The use of certain derivative instruments is permitted where appropriate and necessary for achieving overall investment policy objectives. The plans do not engage in derivative contracts for speculative purposes.
The accounting guidance on fair value measurements specifies a fair value hierarchy based upon the observability of inputs used in valuation techniques (Level 1, 2 and 3). See Note 18 for a discussion of the fair value hierarchy.
Fair values are determined as follows:
| |
| • | Equity securities are primarily based on valuations for identical instruments in active markets. |
| |
| • | Fixed income securities are primarily based upon models that take into consideration such market-based factors as recent sales, risk-free yield curves and prices of similarly rated bonds. |
| |
| • | Real estate is stated at the fund’s net asset value or at appraised value. |
| |
| • | Cash, short-term instruments and other are based on the carrying amount, which approximates fair value, or the fund’s net asset value. |
The fair value of the pension and other postretirement benefit plan assets by category is summarized below:
|
| | | | | | | | | | | | | | | | |
| | | December 31, 2013 |
| (Millions of dollars) | | Level 1 | | Level 2 | | Level 3 | | Total Assets, at Fair Value |
| U.S. Pension | | |
| | |
| | |
| | |
|
| Equity securities: | | |
| | |
| | |
| | |
|
| U.S. equities | | $ | 4,337 |
| | $ | — |
| | $ | 129 |
| | $ | 4,466 |
|
| Non-U.S. equities | | 3,058 |
| | — |
| | — |
| | 3,058 |
|
| | | | | | | | | |
| Fixed income securities: | | |
| | |
| | |
| | |
|
| U.S. corporate bonds | | — |
| | 2,123 |
| | 34 |
| | 2,157 |
|
| Non-U.S. corporate bonds | | — |
| | 327 |
| | 20 |
| | 347 |
|
| U.S. government bonds | | — |
| | 774 |
| | — |
| | 774 |
|
| U.S. governmental agency mortgage-backed securities | | — |
| | 905 |
| | — |
| | 905 |
|
| Non-U.S. government bonds | | — |
| | 52 |
| | — |
| | 52 |
|
| | | | | | | | | |
| Real estate | | — |
| | — |
| | 8 |
| | 8 |
|
| | | | | | | | | |
| Cash, short-term instruments and other | | 22 |
| | 606 |
| | — |
| | 628 |
|
| Total U.S. pension assets | | $ | 7,417 |
| | $ | 4,787 |
| | $ | 191 |
| | $ | 12,395 |
|
|
| | | | | | | | | | | | | | | | |
| | | December 31, 2012 |
| (Millions of dollars) | | Level 1 | | Level 2 | | Level 3 | | Total Assets, at Fair Value |
| U.S. Pension | | |
| | |
| | |
| | |
|
| Equity securities: | | |
| | |
| | |
| | |
|
| U.S. equities | | $ | 4,460 |
| | $ | 3 |
| | $ | 98 |
| | $ | 4,561 |
|
| Non-U.S. equities | | 2,691 |
| | 2 |
| | — |
| | 2,693 |
|
| | | | | | | | | |
| Fixed income securities: | | |
| | |
| | |
| | |
|
| U.S. corporate bonds | | — |
| | 1,490 |
| | 23 |
| | 1,513 |
|
| Non-U.S. corporate bonds | | — |
| | 231 |
| | 10 |
| | 241 |
|
| U.S. government bonds | | — |
| | 694 |
| | 8 |
| | 702 |
|
| U.S. governmental agency mortgage-backed securities | | — |
| | 794 |
| | 1 |
| | 795 |
|
| Non-U.S. government bonds | | — |
| | 33 |
| | 3 |
| | 36 |
|
| | | | | | | | | |
| Real estate | | — |
| | — |
| | 8 |
| | 8 |
|
| | | | | | | | | |
| Cash, short-term instruments and other | | 13 |
| | 419 |
| | — |
| | 432 |
|
| Total U.S. pension assets | | $ | 7,164 |
| | $ | 3,666 |
| | $ | 151 |
| | $ | 10,981 |
|
|
| | | | | | | | | | | | | | | | |
| | | December 31, 2011 |
| (Millions of dollars) | | Level 1 | | Level 2 | | Level 3 | | Total Assets, at Fair Value |
| U.S. Pension | | |
| | |
| | |
| | |
|
| Equity securities: | | |
| | |
| | |
| | |
|
| U.S. equities | | $ | 4,314 |
| | $ | — |
| | $ | 77 |
| | $ | 4,391 |
|
| Non-U.S. equities | | 2,366 |
| | — |
| | — |
| | 2,366 |
|
| | | | | | | | | |
| Fixed income securities: | | |
| | |
| | |
| | |
|
| U.S. corporate bonds | | — |
| | 1,178 |
| | 35 |
| | 1,213 |
|
| Non-U.S. corporate bonds | | — |
| | 143 |
| | 6 |
| | 149 |
|
| U.S. government bonds | | — |
| | 462 |
| | 7 |
| | 469 |
|
| U.S. governmental agency mortgage-backed securities | | — |
| | 891 |
| | 3 |
| | 894 |
|
| Non-U.S. government bonds | | — |
| | 31 |
| | — |
| | 31 |
|
| | | | | | | | | |
| Real estate | | — |
| | — |
| | 8 |
| | 8 |
|
| | | | | | | | | |
| Cash, short-term instruments and other | | 48 |
| | 428 |
| | — |
| | 476 |
|
| Total U.S. pension assets | | $ | 6,728 |
| | $ | 3,133 |
| | $ | 136 |
| | $ | 9,997 |
|
| | | | | | | | | |
|
| | | | | | | | | | | | | | | | |
| | | December 31, 2013 |
| (Millions of dollars) | | Level 1 | | Level 2 | | Level 3 | | Total Assets, at Fair Value |
| Non-U.S. Pension | | |
| | |
| | |
| | |
|
| Equity securities: | | |
| | |
| | |
| | |
|
| U.S. equities | | $ | 607 |
| | $ | 1 |
| | $ | — |
| | $ | 608 |
|
| Non-U.S. equities | | 1,022 |
| | 160 |
| | — |
| | 1,182 |
|
Global equities 1 | | 235 |
| | 54 |
| | — |
| | 289 |
|
| | | | | | | | | |
| Fixed income securities: | | |
| | |
| | |
| | |
|
| U.S. corporate bonds | | — |
| | 84 |
| | 9 |
| | 93 |
|
| Non-U.S. corporate bonds | | — |
| | 534 |
| | 12 |
| | 546 |
|
| U.S. government bonds | | — |
| | 3 |
| | — |
| | 3 |
|
| Non-U.S. government bonds | | — |
| | 418 |
| | — |
| | 418 |
|
Global fixed income 1 | | — |
| | 397 |
| | — |
| | 397 |
|
| | | | | | | | | |
| Real estate | | — |
| | 136 |
| | 111 |
| | 247 |
|
| | | | | | | | | |
Cash, short-term instruments and other 2 | | 141 |
| | 25 |
| | — |
| | 166 |
|
| Total non-U.S. pension assets | | $ | 2,005 |
| | $ | 1,812 |
| | $ | 132 |
| | $ | 3,949 |
|
|
| | | | | | | | | | | | | | | | |
| | | December 31, 2012 |
| (Millions of dollars) | | Level 1 | | Level 2 | | Level 3 | | Total Assets, at Fair Value |
| Non-U.S. Pension | | |
| | |
| | |
| | |
|
| Equity securities: | | |
| | |
| | |
| | |
|
| U.S. equities | | $ | 436 |
| | $ | 2 |
| | $ | — |
| | $ | 438 |
|
| Non-U.S. equities | | 1,038 |
| | 118 |
| | — |
| | 1,156 |
|
Global equities 1 | | 244 |
| | 27 |
| | — |
| | 271 |
|
| | | | | | | | | |
| Fixed income securities: | | |
| | |
| | |
| | |
|
| U.S. corporate bonds | | — |
| | 37 |
| | 3 |
| | 40 |
|
| Non-U.S. corporate bonds | | — |
| | 494 |
| | 2 |
| | 496 |
|
| U.S. government bonds | | — |
| | 3 |
| | — |
| | 3 |
|
| Non-U.S. government bonds | | — |
| | 169 |
| | — |
| | 169 |
|
Global fixed income 1 | | — |
| | 403 |
| | — |
| | 403 |
|
| | | | | | | | | |
| Real estate | | — |
| | 114 |
| | 104 |
| | 218 |
|
| | | | | | | | | |
Cash, short-term instruments and other 2 | | 185 |
| | 47 |
| | — |
| | 232 |
|
| Total non-U.S. pension assets | | $ | 1,903 |
| | $ | 1,414 |
| | $ | 109 |
| | $ | 3,426 |
|
|
| | | | | | | | | | | | | | | | |
| | | December 31, 2011 |
| (Millions of dollars) | | Level 1 | | Level 2 | | Level 3 | | Total Assets, at Fair Value |
| Non-U.S. Pension | | |
| | |
| | |
| | |
|
| Equity securities: | | |
| | |
| | |
| | |
|
| U.S. equities | | $ | 356 |
| | $ | 1 |
| | $ | — |
| | $ | 357 |
|
| Non-U.S. equities | | 822 |
| | 84 |
| | — |
| | 906 |
|
Global equities 1 | | 198 |
| | 40 |
| | — |
| | 238 |
|
| | | | | | | | | |
| Fixed income securities: | | |
| | |
| | |
| | |
|
| U.S. corporate bonds | | — |
| | 16 |
| | 4 |
| | 20 |
|
| Non-U.S. corporate bonds | | — |
| | 395 |
| | 5 |
| | 400 |
|
| U.S. government bonds | | — |
| | 3 |
| | — |
| | 3 |
|
| Non-U.S. government bonds | | — |
| | 200 |
| | — |
| | 200 |
|
Global fixed income 1 | | — |
| | 363 |
| | — |
| | 363 |
|
| | | | | | | | | |
| Real estate | | — |
| | 100 |
| | 97 |
| | 197 |
|
| | | | | | | | | |
Cash, short-term instruments and other 2 | | 109 |
| | 25 |
| | — |
| | 134 |
|
| Total non-U.S. pension assets | | $ | 1,485 |
| | $ | 1,227 |
| | $ | 106 |
| | $ | 2,818 |
|
| |
1 | Includes funds that invest in both U.S. and non-U.S. securities. |
| |
2 | Includes funds that invest in multiple asset classes, hedge funds and other. |
|
| | | | | | | | | | | | | | | | |
| | | December 31, 2013 |
| (Millions of dollars) | | Level 1 | | Level 2 | | Level 3 | | Total Assets, at Fair Value |
| Other Postretirement Benefits | | |
| | |
| | |
| | |
|
| Equity securities: | | |
| | |
| | |
| | |
|
| U.S. equities | | $ | 388 |
| | $ | — |
| | $ | — |
| | $ | 388 |
|
| Non-U.S. equities | | 189 |
| | — |
| | — |
| | 189 |
|
| | | | | | | | | |
| Fixed income securities: | | |
| | |
| | |
| | |
|
| U.S. corporate bonds | | — |
| | 101 |
| | — |
| | 101 |
|
| Non-U.S. corporate bonds | | — |
| | 17 |
| | — |
| | 17 |
|
| U.S. government bonds | | — |
| | 23 |
| | — |
| | 23 |
|
| U.S. governmental agency mortgage-backed securities | | — |
| | 49 |
| | — |
| | 49 |
|
| Non-U.S. government bonds | | — |
| | 2 |
| | — |
| | 2 |
|
| | | | | | | | | |
| Cash, short-term instruments and other | | 8 |
| | 45 |
| | — |
| | 53 |
|
| Total other postretirement benefit assets | | $ | 585 |
| | $ | 237 |
| | $ | — |
| | $ | 822 |
|
|
| | | | | | | | | | | | | | | | |
| | | December 31, 2012 |
| (Millions of dollars) | | Level 1 | | Level 2 | | Level 3 | | Total Assets, at Fair Value |
| Other Postretirement Benefits | | |
| | |
| | |
| | |
|
| Equity securities: | | |
| | |
| | |
| | |
|
| U.S. equities | | $ | 387 |
| | $ | — |
| | $ | — |
| | $ | 387 |
|
| Non-U.S. equities | | 194 |
| | — |
| | — |
| | 194 |
|
| | | | | | | | | |
| Fixed income securities: | | |
| | |
| | |
| | |
|
| U.S. corporate bonds | | — |
| | 70 |
| | — |
| | 70 |
|
| Non-U.S. corporate bonds | | — |
| | 11 |
| | — |
| | 11 |
|
| U.S. government bonds | | — |
| | 27 |
| | — |
| | 27 |
|
| U.S. governmental agency mortgage-backed securities | | — |
| | 33 |
| | — |
| | 33 |
|
| Non-U.S. government bonds | | — |
| | 2 |
| | — |
| | 2 |
|
| | | | | | | | | |
| Cash, short-term instruments and other | | 18 |
| | 47 |
| | — |
| | 65 |
|
| Total other postretirement benefit assets | | $ | 599 |
| | $ | 190 |
| | $ | — |
| | $ | 789 |
|
|
| | | | | | | | | | | | | | | | |
| | | December 31, 2011 |
| (Millions of dollars) | | Level 1 | | Level 2 | | Level 3 | | Total Assets, at Fair Value |
| Other Postretirement Benefits | | |
| | |
| | |
| | |
|
| Equity securities: | | |
| | |
| | |
| | |
|
| U.S. equities | | $ | 410 |
| | $ | — |
| | $ | — |
| | $ | 410 |
|
| Non-U.S. equities | | 191 |
| | — |
| | — |
| | 191 |
|
| | | | | | | | | |
| Fixed income securities: | | |
| | |
| | |
| | |
|
| U.S. corporate bonds | | — |
| | 67 |
| | — |
| | 67 |
|
| Non-U.S. corporate bonds | | — |
| | 8 |
| | — |
| | 8 |
|
| U.S. government bonds | | — |
| | 21 |
| | — |
| | 21 |
|
| U.S. governmental agency mortgage-backed securities | | — |
| | 47 |
| | — |
| | 47 |
|
| Non-U.S. government bonds | | — |
| | 1 |
| | — |
| | 1 |
|
| | | | | | | | | |
| Cash, short-term instruments and other | | 4 |
| | 65 |
| | — |
| | 69 |
|
| Total other postretirement benefit assets | | $ | 605 |
| | $ | 209 |
| | $ | — |
| | $ | 814 |
|
Below are roll-forwards of assets measured at fair value using Level 3 inputs for the years ended December 31, 2013, 2012 and 2011. These instruments were valued using pricing models that, in management’s judgment, reflect the assumptions a market participant would use.
|
| | | | | | | | | | | | | | | | |
| (Millions of dollars) | | Equities | | Fixed Income | | Real Estate | | Other |
| U.S. Pension | | |
| | |
| | |
| | |
|
| Balance at December 31, 2010 | | $ | 50 |
| | $ | 48 |
| | $ | 10 |
| | $ | — |
|
| Unrealized gains (losses) | | (4 | ) | | (2 | ) | | (2 | ) | | — |
|
| Realized gains (losses) | | 1 |
| | — |
| | — |
| | — |
|
| Purchases, issuances and settlements, net | | 30 |
| | 17 |
| | — |
| | — |
|
| Transfers in and/or out of Level 3 | | — |
| | (12 | ) | | — |
| | — |
|
| Balance at December 31, 2011 | | $ | 77 |
| | $ | 51 |
| | $ | 8 |
| | $ | — |
|
| Unrealized gains (losses) | | (4 | ) | | — |
| | — |
| | (1 | ) |
| Realized gains (losses) | | 4 |
| | 2 |
| | — |
| | — |
|
| Purchases, issuances and settlements, net | | 21 |
| | (4 | ) | | — |
| | 1 |
|
| Transfers in and/or out of Level 3 | | — |
| | (4 | ) | | — |
| | — |
|
| Balance at December 31, 2012 | | $ | 98 |
| | $ | 45 |
| | $ | 8 |
| | $ | — |
|
| Unrealized gains (losses) | | 10 |
| | (1 | ) | | — |
| | — |
|
| Realized gains (losses) | | 4 |
| | — |
| | — |
| | — |
|
| Purchases, issuances and settlements, net | | 17 |
| | 12 |
| | — |
| | — |
|
| Transfers in and/or out of Level 3 | | — |
| | (2 | ) | | — |
| | — |
|
| Balance at December 31, 2013 | | $ | 129 |
| | $ | 54 |
| | $ | 8 |
| | $ | — |
|
| | | | | | | | | |
| Non-U.S. Pension | | |
| | |
| | |
| | |
|
| Balance at December 31, 2010 | | $ | 1 |
| | $ | 8 |
| | $ | 90 |
| | $ | 35 |
|
| Unrealized gains (losses) | | — |
| | 1 |
| | 7 |
| | — |
|
| Realized gains (losses) | | — |
| | — |
| | — |
| | 3 |
|
| Purchases, issuances and settlements, net | | (1 | ) | | — |
| | — |
| | (38 | ) |
| Transfers in and/or out of Level 3 | | — |
| | — |
| | — |
| | — |
|
| Balance at December 31, 2011 | | $ | — |
| | $ | 9 |
| | $ | 97 |
| | $ | — |
|
| Unrealized gains (losses) | | — |
| | — |
| | 8 |
| | — |
|
| Realized gains (losses) | | — |
| | — |
| | — |
| | — |
|
| Purchases, issuances and settlements, net | | — |
| | (1 | ) | | (1 | ) | | — |
|
| Transfers in and/or out of Level 3 | | — |
| | (3 | ) | | — |
| | — |
|
| Balance at December 31, 2012 | | $ | — |
| | $ | 5 |
| | $ | 104 |
| | $ | — |
|
| Unrealized gains (losses) | | — |
| | — |
| | 7 |
| | — |
|
| Realized gains (losses) | | — |
| | — |
| | — |
| | — |
|
| Purchases, issuances and settlements, net | | — |
| | 16 |
| | — |
| | — |
|
| Transfers in and/or out of Level 3 | | — |
| | — |
| | — |
| | — |
|
| Balance at December 31, 2013 | | $ | — |
| | $ | 21 |
| | $ | 111 |
| | $ | — |
|
| | | | | | | | | |
Equity securities within plan assets include Caterpillar Inc. common stock in the amounts of:
|
| | | | | | | | | | | | | | | | | | | | | | | | | | | | | | | | | | | | |
| | | U.S. Pension Benefits 1 | | Non-U.S. Pension Benefits | | Other Postretirement Benefits |
| (Millions of dollars) | | 2013 | | 2012 | | 2011 | | 2013 | | 2012 | | 2011 | | 2013 | | 2012 | | 2011 |
| Caterpillar Inc. common stock | | $ | 495 |
| | $ | 597 |
| | $ | 653 |
| | $ | — |
| | $ | 1 |
| | $ | 1 |
| | $ | — |
| | $ | 1 |
| | $ | 1 |
|
| |
1 | Amounts represent 4 percent, 5 percent and 7 percent of total plan assets for 2013, 2012 and 2011, respectively. |
The funded status of the plans, reconciled to the amount reported on Statement 3, is as follows:
|
| | | | | | | | | | | | | | | | | | | | | | | | | | | | | | | | | | | | |
| | | U.S. Pension Benefits | | Non-U.S. Pension Benefits | | Other Postretirement Benefits |
| (Millions of dollars) | | 2013 | | 2012 | | 2011 | | 2013 | | 2012 | | 2011 | | 2013 | | 2012 | | 2011 |
| End of Year | | |
| | |
| | |
| | |
| | |
| | |
| | |
| | |
| | |
|
| Fair value of plan assets | | $ | 12,395 |
| | $ | 10,981 |
| | $ | 9,997 |
| | $ | 3,949 |
| | $ | 3,426 |
| | $ | 2,818 |
| | $ | 822 |
| | $ | 789 |
| | $ | 814 |
|
| Benefit obligations | | 14,419 |
| | 15,913 |
| | 14,782 |
| | 4,609 |
| | 4,737 |
| | 4,299 |
| | 4,784 |
| | 5,453 |
| | 5,381 |
|
| Over (under) funded status recognized in financial position | | $ | (2,024 | ) | | $ | (4,932 | ) | | $ | (4,785 | ) | | $ | (660 | ) | | $ | (1,311 | ) | | $ | (1,481 | ) | | $ | (3,962 | ) | | $ | (4,664 | ) | | $ | (4,567 | ) |
| | | | | | | | | | | | | | | | | | | |
| Components of net amount recognized in financial position: | | |
| | |
| | |
| | |
| | |
| | |
| | |
| | |
| | |
|
| Other assets (non-current asset) | | $ | 5 |
| | $ | — |
| | $ | — |
| | $ | 123 |
| | $ | 30 |
| | $ | 3 |
| | $ | — |
| | $ | — |
| | $ | — |
|
| Accrued wages, salaries and employee benefits (current liability) | | (26 | ) | | (23 | ) | | (21 | ) | | (29 | ) | | (27 | ) | | (26 | ) | | (169 | ) | | (169 | ) | | (171 | ) |
| Liability for postemployment benefits (non-current liability) | | (2,003 | ) | | (4,909 | ) | | (4,764 | ) | | (754 | ) | | (1,314 | ) | | (1,458 | ) | | (3,793 | ) | | (4,495 | ) | | (4,396 | ) |
| Net liability recognized | | $ | (2,024 | ) | | $ | (4,932 | ) | | $ | (4,785 | ) | | $ | (660 | ) | | $ | (1,311 | ) | | $ | (1,481 | ) | | $ | (3,962 | ) | | $ | (4,664 | ) | | $ | (4,567 | ) |
| | | | | | | | | | | | | | | | | | | |
| Amounts recognized in Accumulated other comprehensive income (pre-tax) consist of: | | |
| | |
| | |
| | |
| | |
| | |
| | |
| | |
| | |
|
| Net actuarial loss (gain) | | $ | 4,396 |
| | $ | 7,286 |
| | $ | 7,044 |
| | $ | 1,373 |
| | $ | 1,907 |
| | $ | 1,712 |
| | $ | 662 |
| | $ | 1,528 |
| | $ | 1,495 |
|
| Prior service cost (credit) | | 19 |
| | 36 |
| | 63 |
| | 13 |
| | 22 |
| | 15 |
| | (84 | ) | | (159 | ) | | (188 | ) |
| Transition obligation (asset) | | — |
| | — |
| | — |
| | — |
| | — |
| | — |
| | — |
| | 3 |
| | 5 |
|
| Total | | $ | 4,415 |
| | $ | 7,322 |
| | $ | 7,107 |
| | $ | 1,386 |
| | $ | 1,929 |
| | $ | 1,727 |
| | $ | 578 |
| | $ | 1,372 |
| | $ | 1,312 |
|
| | | | | | | | | | | | | | | | | | | |
The estimated amounts that will be amortized from Accumulated other comprehensive income (loss) at December 31, 2013 into net periodic benefit cost (pre-tax) in 2014 are as follows:
|
| | | | | | | | | | | | |
| (Millions of dollars) | | U.S. Pension Benefits | | Non-U.S. Pension Benefits | | Other Postretirement Benefits |
| Net actuarial loss (gain) | | $ | 392 |
| | $ | 86 |
| | $ | 41 |
|
| Prior service cost (credit) | | 17 |
| | 1 |
| | (54 | ) |
| Transition obligation (asset) | | — |
| | — |
| | — |
|
| Total | | $ | 409 |
| | $ | 87 |
| | $ | (13 | ) |
| | | | | | | |
The following amounts relate to our pension plans with projected benefit obligations in excess of plan assets:
|
| | | | | | | | | | | | | | | | | | | | | | | | |
| | | U.S. Pension Benefits at Year-end | | Non-U.S. Pension Benefits at Year-end |
| (Millions of dollars) | | 2013 | | 2012 | | 2011 | | 2013 | | 2012 | | 2011 |
| Projected benefit obligation | | $ | 14,352 |
| | $ | 15,913 |
| | $ | 14,782 |
| | $ | 4,177 |
| | $ | 4,310 |
| | $ | 4,293 |
|
| Accumulated benefit obligation | | $ | 13,989 |
| | $ | 15,132 |
| | $ | 14,055 |
| | $ | 3,820 |
| | $ | 3,903 |
| | $ | 3,738 |
|
| Fair value of plan assets | | $ | 12,323 |
| | $ | 10,981 |
| | $ | 9,997 |
| | $ | 3,394 |
| | $ | 2,969 |
| | $ | 2,809 |
|
The following amounts relate to our pension plans with accumulated benefit obligations in excess of plan assets:
|
| | | | | | | | | | | | | | | | | | | | | | | | |
| | | U.S. Pension Benefits at Year-end | | Non-U.S. Pension Benefits at Year-end |
| (Millions of dollars) | | 2013 | | 2012 | | 2011 | | 2013 | | 2012 | | 2011 |
| Projected benefit obligation | | $ | 14,352 |
| | $ | 15,913 |
| | $ | 14,782 |
| | $ | 1,436 |
| | $ | 4,107 |
| | $ | 4,112 |
|
| Accumulated benefit obligation | | $ | 13,989 |
| | $ | 15,132 |
| | $ | 14,055 |
| | $ | 1,374 |
| | $ | 3,752 |
| | $ | 3,600 |
|
| Fair value of plan assets | | $ | 12,323 |
| | $ | 10,981 |
| | $ | 9,997 |
| | $ | 797 |
| | $ | 2,806 |
| | $ | 2,661 |
|
The accumulated postretirement benefit obligation exceeds plan assets for all of our other postretirement benefit plans for all years presented.
Information about the expected cash flow for the pension and other postretirement benefit plans is as follows:
|
| | | | | | | | | | | | |
| (Millions of dollars) | | U.S. Pension Benefits | | Non-U.S. Pension Benefits | | Other Postretirement Benefits |
| Employer contributions: | | |
| | |
| | |
|
| 2014 (expected) | | $ | 240 |
| | $ | 270 |
| | $ | 210 |
|
| | | | | | | |
| Expected benefit payments: | | |
| | |
| | |
|
| 2014 | | $ | 890 |
| | $ | 250 |
| | $ | 340 |
|
| 2015 | | 900 |
| | 210 |
| | 350 |
|
| 2016 | | 910 |
| | 220 |
| | 350 |
|
| 2017 | | 930 |
| | 220 |
| | 360 |
|
| 2018 | | 940 |
| | 220 |
| | 360 |
|
| 2019-2023 | | 4,810 |
| | 1,200 |
| | 1,850 |
|
| Total | | $ | 9,380 |
| | $ | 2,320 |
| | $ | 3,610 |
|
| | | | | | | |
The above table reflects the total employer contributions and benefits expected to be paid from the plan or from company assets and does not include the participants’ share of the cost. The expected benefit payments for our other postretirement benefits include payments for prescription drug benefits. Medicare Part D subsidy amounts expected to be received by the company which will offset other postretirement benefit payments are as follows:
|
| | | | | | | | | | | | | | | | | | | | | | | | | | | | |
| (Millions of dollars) | | 2014 | | 2015 | | 2016 | | 2017 | | 2018 | | 2019-2023 | | Total |
| Other postretirement benefits | | $ | 20 |
| | $ | 20 |
| | $ | 20 |
| | $ | 20 |
| | $ | 20 |
| | $ | 115 |
| | $ | 215 |
|
| | | | | | | | | | | | | | | |
|
| | | | | | | | | | | | | | | | | | | | | | | | | | | | | | | | | | | | |
| | | U.S. Pension Benefits | | Non-U.S. Pension Benefits | | Other Postretirement Benefits |
| (Millions of dollars) | | 2013 | | 2012 | | 2011 | | 2013 | | 2012 | | 2011 | | 2013 | | 2012 | | 2011 |
| Components of net periodic benefit cost: | | |
| | |
| | |
| | |
| | |
| | |
| | |
| | |
| | |
|
| Service cost | | $ | 196 |
| | $ | 185 |
| | $ | 158 |
| | $ | 120 |
| | $ | 108 |
| | $ | 115 |
| | $ | 108 |
| | $ | 92 |
| | $ | 84 |
|
| Interest cost | | 581 |
| | 609 |
| | 651 |
| | 166 |
| | 182 |
| | 182 |
| | 195 |
| | 221 |
| | 253 |
|
Expected return on plan assets 1 | | (832 | ) | | (812 | ) | | (798 | ) | | (225 | ) | | (215 | ) | | (210 | ) | | (56 | ) | | (63 | ) | | (70 | ) |
Other adjustments 2 | | 31 |
| | — |
| | — |
| | — |
| | — |
| | — |
| | (22 | ) | | — |
| | — |
|
Curtailments, settlements and termination benefits 3 | | — |
| | 7 |
| | — |
| | 2 |
| | 38 |
| | 19 |
| | — |
| | (40 | ) | | — |
|
| Amortization of: | | |
| | |
| | |
| | |
| | |
| | |
| | |
| | |
| | |
|
| Transition obligation (asset) | | — |
| | — |
| | — |
| | — |
| | — |
| | — |
| | 2 |
| | 2 |
| | 2 |
|
Prior service cost (credit) 4 | | 18 |
| | 19 |
| | 20 |
| | 1 |
| | 1 |
| | 3 |
| | (73 | ) | | (68 | ) | | (55 | ) |
Net actuarial loss (gain) 5 | | 546 |
| | 504 |
| | 451 |
| | 128 |
| | 97 |
| | 74 |
| | 107 |
| | 100 |
| | 108 |
|
| Total cost included in operating profit | | $ | 540 |
| | $ | 512 |
| | $ | 482 |
| | $ | 192 |
| | $ | 211 |
| | $ | 183 |
| | $ | 261 |
| | $ | 244 |
| | $ | 322 |
|
| | | | | | | | | | | | | | | | | | | |
| Other changes in plan assets and benefit obligations recognized in other comprehensive income (pre-tax): | | |
| | |
| | |
| | |
| | |
| | |
| | |
| | |
| | |
|
| Current year actuarial loss (gain) | | $ | (2,344 | ) | | $ | 745 |
| | $ | 2,700 |
| | $ | (406 | ) | | $ | 225 |
| | $ | 526 |
| | $ | (759 | ) | | $ | 133 |
| | $ | 408 |
|
| Amortization of actuarial (loss) gain | | (546 | ) | | (504 | ) | | (451 | ) | | (128 | ) | | (97 | ) | | (72 | ) | | (107 | ) | | (100 | ) | | (108 | ) |
| Current year prior service cost (credit) | | — |
| | (7 | ) | | — |
| | (7 | ) | | 10 |
| | (25 | ) | | 2 |
| | (38 | ) | | (121 | ) |
| Amortization of prior service (cost) credit | | (18 | ) | | (19 | ) | | (20 | ) | | (1 | ) | | (1 | ) | | (3 | ) | | 73 |
| | 68 |
| | 55 |
|
| Amortization of transition (obligation) asset | | — |
| | — |
| | — |
| | — |
| | — |
| | — |
| | (2 | ) | | (2 | ) | | (2 | ) |
| Total recognized in other comprehensive income | | (2,908 | ) | | 215 |
| | 2,229 |
| | (542 | ) | | 137 |
| | 426 |
| | (793 | ) | | 61 |
| | 232 |
|
| Total recognized in net periodic cost and other comprehensive income | | $ | (2,368 | ) | | $ | 727 |
| | $ | 2,711 |
| | $ | (350 | ) | | $ | 348 |
| | $ | 609 |
| | $ | (532 | ) | | $ | 305 |
| | $ | 554 |
|
| | | | | | | | | | | | | | | | | | | |
| Weighted-average assumptions used to determine net cost: | | |
| | |
| | |
| | |
| | |
| | |
| | |
| | |
| | |
|
| Discount rate | | 3.7 | % | | 4.3 | % | | 5.1 | % | | 3.7 | % | | 4.3 | % | | 4.6 | % | | 3.7 | % | | 4.3 | % | | 5.0 | % |
Expected rate of return on plan assets 6 | | 7.8 | % | | 8.0 | % | | 8.5 | % | | 6.8 | % | | 7.1 | % | | 7.1 | % | | 7.8 | % | | 8.0 | % | | 8.5 | % |
| Rate of compensation increase | | 4.5 | % | | 4.5 | % | | 4.5 | % | | 3.9 | % | | 3.9 | % | | 4.1 | % | | 4.4 | % | | 4.4 | % | | 4.4 | % |
| |
1 | Expected return on plan assets developed using calculated market-related value of plan assets which recognizes differences in expected and actual returns over a three-year period. |
| |
2 | Charge to recognize a previously unrecorded liability related to a subsidiary's pension plans and an adjustment to other postretirement benefits related to certain other benefits. |
| |
3 | Curtailments, settlements and termination benefits were recognized in Other operating (income) expenses in Statement 1. |
| |
4 | Prior service cost (credit) for both pension and other postretirement benefits are generally amortized using the straight-line method over the average remaining service period of active employees expected to receive benefits from the plan. For pension plans in which all or almost all of the plan's participants are inactive and other postretirement benefit plans in which all or almost all of the plan's participants are fully eligible for benefits under the plan, prior service cost (credit) are amortized using the straight-line method over the remaining life expectancy of those participants. |
| |
5 | Net actuarial loss (gain) for pension and other postretirement benefit plans are generally amortized using the straight-line method over the average remaining service period of active employees expected to receive benefits from the plan. For plans in which all or almost all of the plan’s participants are inactive, net actuarial loss (gain) are amortized using the straight-line method over the remaining life expectancy of the inactive participants. |
| |
6 | The weighted-average rates for 2014 are 7.8 percent and 6.9 percent for U.S. and non-U.S. pension plans, respectively. |
The assumed discount rate is used to discount future benefit obligations back to today’s dollars. The U.S. discount rate is based on a benefit cash flow-matching approach and represents the rate at which our benefit obligations could effectively be settled as of our measurement date, December 31. The benefit cash flow-matching approach involves analyzing Caterpillar’s projected cash flows against a high quality bond yield curve, calculated using a wide population of corporate Aa bonds available on the measurement date. The very highest and lowest yielding bonds (top and bottom 10 percent) are excluded from the analysis. A similar process is used to determine the assumed discount rate for our most significant non-U.S. plans. This rate is sensitive to changes in interest rates. A decrease in the discount rate would increase our obligation and future expense.
Our U.S. expected long-term rate of return on plan assets is based on our estimate of long-term passive returns for equities and fixed income securities weighted by the allocation of our pension assets. Based on historical performance, we increase the passive returns due to our active management of the plan assets. To arrive at our expected long-term return, the amount added for active management was 1 percent for 2013, 2012 and 2011. A similar process is used to determine this rate for our non-U.S. plans.
The assumed health care trend rate represents the rate at which health care costs are assumed to increase. We assumed a weighted-average increase of 7.1 percent in our calculation of 2013 benefit expense. We expect a weighted-average increase of 6.6 percent during 2014. The 2013 and 2014 rates are assumed to decrease gradually to the ultimate health care trend rate of 5 percent in 2019. This rate represents 3 percent general inflation plus 2 percent additional health care inflation.
| |
| F. | Other postemployment benefit plans |
We offer long-term disability benefits, continued health care for disabled employees, survivor income benefit insurance and supplemental unemployment benefits to substantially all U.S. employees.
| |
| G. | Defined contribution plans |
We have both U.S. and non-U.S. employee defined contribution plans to help employees save for retirement. Our primary U.S. 401(k) plan allows eligible employees to contribute a portion of their cash compensation to the plan on a tax-deferred basis. Employees with frozen defined benefit pension accruals are eligible for matching contributions equal to 100 percent of employee contributions to the plan up to 6 percent of cash compensation and an annual employer contribution that ranges from 3 to 5 percent of cash compensation (depending on years of service and age). Employees that are still accruing benefits under a defined benefit pension plan are eligible for matching contributions equal to 50 percent of employee contributions up to 6 percent of cash compensation. Various other U.S. and non-U.S. defined contribution plans allow eligible employees to contribute a portion of their salary to the plans, and in some cases, we provide a matching contribution to the funds.
Total company costs related to U.S. and non-U.S. defined contribution plans were as follows:
|
| | | | | | | | | | | | |
| (Millions of dollars) | | 2013 | | 2012 | | 2011 |
| U.S. plans | | $ | 308 |
| | $ | 260 |
| | $ | 219 |
|
| Non-U.S. plans | | 64 |
| | 60 |
| | 54 |
|
| | | $ | 372 |
| | $ | 320 |
| | $ | 273 |
|
| | | | | | | |
| |
| H. | Summary of long-term liability: |
|
| | | | | | | | | | | | |
| | | December 31, |
| (Millions of dollars) | | 2013 | | 2012 | | 2011 |
| Pensions: | | |
| | |
| | |
|
| U.S. pensions | | $ | 2,003 |
| | $ | 4,909 |
| | $ | 4,764 |
|
| Non-U.S. pensions | | 754 |
| | 1,314 |
| | 1,458 |
|
| Total pensions | | 2,757 |
| | 6,223 |
| | 6,222 |
|
| Postretirement benefits other than pensions | | 3,793 |
| | 4,495 |
| | 4,396 |
|
| Other postemployment benefits | | 99 |
| | 81 |
| | 73 |
|
| Defined contribution | | 324 |
| | 286 |
| | 265 |
|
| | | $ | 6,973 |
| | $ | 11,085 |
| | $ | 10,956 |
|
| | | | | | | |
|
| | | | | | | | | | | | |
| | | December 31, |
| (Millions of dollars) | | 2013 | | 2012 | | 2011 |
| Machinery and Power Systems: | | |
| | |
| | |
|
| Notes payable to banks | | $ | 16 |
| | $ | 484 |
| | $ | 93 |
|
| Notes payable to certain former shareholders of Siwei | | — |
| | 152 |
| | — |
|
| Commercial paper | | — |
| | — |
| | — |
|
| | | 16 |
| | 636 |
| | 93 |
|
| Financial Products: | | |
| | |
| | |
|
| Notes payable to banks | | 545 |
| | 418 |
| | 527 |
|
| Commercial paper | | 2,502 |
| | 3,654 |
| | 2,818 |
|
| Demand notes | | 616 |
| | 579 |
| | 550 |
|
| | | 3,663 |
| | 4,651 |
| | 3,895 |
|
| Total short-term borrowings | | $ | 3,679 |
| | $ | 5,287 |
| | $ | 3,988 |
|
| | | | | | | |
The weighted-average interest rates on short-term borrowings outstanding were:
|
| | | | | | | | | |
| | | December 31, |
| | | 2013 | | 2012 | | 2011 |
| Notes payable to banks | | 6.3 | % | | 5.8 | % | | 7.2 | % |
| Commercial paper | | 0.5 | % | | 0.6 | % | | 1.0 | % |
| Demand notes | | 0.8 | % | | 0.8 | % | | 0.9 | % |
| | | | | | | |
The notes payable to certain former shareholders of Siwei did not bear interest and were settled during the second quarter of 2013. Please refer to Note 26 for more information. Please refer to Note 18 and Table III for fair value information on short-term borrowings.
|
| | | | | | | | | | | | |
| | | December 31, |
| (Millions of dollars) | | 2013 | | 2012 | | 2011 |
| Machinery and Power Systems: | | |
| | |
| | |
|
| Notes—Floating Rate (Three-month USD LIBOR plus 0.17%) due 2013 | | $ | — |
| | $ | — |
| | $ | 750 |
|
| Notes—1.375% due 2014 | | — |
| | 750 |
| | 750 |
|
| Notes—5.700% due 2016 | | 506 |
| | 508 |
| | 510 |
|
| Notes—3.900% due 2021 | | 1,246 |
| | 1,245 |
| | 1,245 |
|
| Notes—5.200% due 2041 | | 757 |
| | 757 |
| | 1,247 |
|
| Debentures—7.000% due 2013 | | — |
| | — |
| | 350 |
|
| Debentures—0.950% due 2015 | | 500 |
| | 500 |
| | — |
|
| Debentures—1.500% due 2017 | | 500 |
| | 499 |
| | — |
|
| Debentures—7.900% due 2018 | | 899 |
| | 899 |
| | 899 |
|
| Debentures—9.375% due 2021 | | 120 |
| | 120 |
| | 120 |
|
| Debentures—2.600% due 2022 | | 498 |
| | 498 |
| | — |
|
| Debentures—8.000% due 2023 | | 82 |
| | 82 |
| | 82 |
|
| Debentures—6.625% due 2028 | | 193 |
| | 193 |
| | 299 |
|
| Debentures—7.300% due 2031 | | 241 |
| | 241 |
| | 349 |
|
Debentures—5.300% due 2035 1 | | 209 |
| | 208 |
| | 206 |
|
| Debentures—6.050% due 2036 | | 459 |
| | 459 |
| | 748 |
|
| Debentures—8.250% due 2038 | | 65 |
| | 65 |
| | 248 |
|
| Debentures—6.950% due 2042 | | 160 |
| | 160 |
| | 250 |
|
Debentures—3.803% due 2042 2 | | 1,168 |
| | 1,149 |
| | — |
|
| Debentures—7.375% due 2097 | | 244 |
| | 244 |
| | 297 |
|
| Capital lease obligations | | 97 |
| | 73 |
| | 46 |
|
| Other | | 55 |
| | 16 |
| | 19 |
|
| Total Machinery and Power Systems | | 7,999 |
| | 8,666 |
| | 8,415 |
|
| Financial Products: | | |
| | |
| | |
|
| Medium-term notes | | 17,856 |
| | 18,036 |
| | 15,701 |
|
| Other | | 864 |
| | 1,050 |
| | 828 |
|
| Total Financial Products | | 18,720 |
| | 19,086 |
| | 16,529 |
|
| Total long-term debt due after one year | | $ | 26,719 |
| | $ | 27,752 |
| | $ | 24,944 |
|
| |
1 | Debentures due in 2035 have a face value of $307 million and an effective yield to maturity of 8.69%. |
| |
2 | Debentures due in 2042 have a face value of $1,722 million and an effective yield to maturity of 6.33%. |
All outstanding notes and debentures are unsecured and rank equally with one another.
On June 26, 2012 we issued $500 million of 0.950% Senior Notes due 2015, $500 million of 1.500% Senior Notes due 2017, and $500 million of 2.600% Senior Notes due 2022.
On August 15, 2012 and August 27, 2012, we exchanged $1.72 billion of newly issued 3.803% Debentures due 2042 and $179 million of cash for $1.33 billion of several series of our outstanding debentures of varying interest rates and maturity dates. This exchange met the requirements to be accounted for as a debt modification.
On May 24, 2011, we issued $750 million of Floating Rate Senior Notes (Three-month USD LIBOR plus 0.17%) due in 2013. The interest rates for the Floating Rate Senior Notes will be reset quarterly. We also issued $750 million of 1.375% Senior Notes due in 2014, $1.25 billion of 3.900% Senior Notes due in 2021, and $1.25 billion of 5.200% Senior Notes due in 2041.
We may redeem the 1.375%, 5.700%, 3.900% and 5.200% notes and the 6.625%, 7.300%, 5.300%, 6.050%, 6.950% and 7.375% debentures in whole or in part at our option at any time at a redemption price equal to the greater of 100% of the
principal amount or the sum of the present value of the remaining scheduled payments of principal and interest of the notes or debentures to be redeemed. We may redeem some or all of the 0.950% debentures and the 1.500% debentures at our option at any time, and some or all of the 2.600% debentures at any time prior to March 26, 2022 (three months prior to the maturity date of the 2022 debentures), in each case at a redemption price equal to the greater of 100% of the principal amount of the notes being redeemed or at the discounted present value of the notes, calculated in accordance with the terms of the relevant notes. We may redeem some or all of the 3.803% debentures at any time at a redemption price equal to the greater of 100% of the principal amount of the debentures being redeemed or at a make-whole price calculated in accordance with the terms of the debentures. The terms of other notes and debentures do not specify a redemption option prior to maturity.
Cat Financial's medium term notes are offered by prospectus and are issued through agents at fixed and floating rates. These notes have a weighted average interest rate of 2.8% with remaining maturities up to 12 years at December 31, 2013.
The aggregate amounts of maturities of long-term debt during each of the years 2014 through 2018, including amounts due within one year and classified as current, are:
|
| | | | | | | | | | | | | | | | | | | | |
| | | December 31, |
| (Millions of dollars) | | 2014 | | 2015 | | 2016 | | 2017 | | 2018 |
| Machinery and Power Systems | | $ | 760 |
| | $ | 514 |
| | $ | 538 |
| | $ | 507 |
| | $ | 906 |
|
| Financial Products | | 6,592 |
| | 6,446 |
| | 4,796 |
| | 2,747 |
| | 2,350 |
|
| | | $ | 7,352 |
| | $ | 6,960 |
| | $ | 5,334 |
| | $ | 3,254 |
| | $ | 3,256 |
|
| | | | | | | | | | | |
Interest paid on short-term and long-term borrowings for 2013, 2012 and 2011 was $1,141 million, $1,404 million and $1,208 million, respectively.
Please refer to Note 18 and Table III for fair value information on long-term debt.
|
| | | | | | | | | | | | |
| | | December 31, 2013 |
| (Millions of dollars) | | Consolidated | | Machinery and Power Systems | | Financial Products |
| Credit lines available: | | |
| | |
| | |
|
| Global credit facilities | | $ | 10,000 |
| | $ | 2,750 |
| | $ | 7,250 |
|
| Other external | | 4,508 |
| | 229 |
| | 4,279 |
|
| Total credit lines available | | 14,508 |
| | 2,979 |
| | 11,529 |
|
| Less: Commercial paper outstanding | | (2,502 | ) | | — |
| | (2,502 | ) |
| Less: Utilized credit | | (2,044 | ) | | (16 | ) | | (2,028 | ) |
| Available credit | | $ | 9,962 |
| | $ | 2,963 |
| | $ | 6,999 |
|
| | | | | | | |
We have three global credit facilities with a syndicate of banks totaling $10.00 billion (Credit Facility) available in the aggregate to both Caterpillar and Cat Financial for general liquidity purposes. Based on management's allocation decision, which can be revised from time to time, the portion of the Credit Facility available to Machinery and Power Systems as of December 31, 2013 was $2.75 billion. Our three Global Credit Facilities are:
| |
| • | The 364-day facility of $3.00 billion (of which $0.82 billion is available to Machinery and Power Systems) expires in September 2014. |
| |
| • | The 2010 four-year facility, as amended in September 2013, of $2.60 billion (of which $0.72 billion is available to Machinery and Power Systems) expires in September 2016. |
| |
| • | The 2011 five-year facility, as amended in September 2013, of $4.40 billion (of which $1.21 billion is available to Machinery and Power Systems) expires in September 2018. |
Other consolidated credit lines with banks as of December 31, 2013 totaled $4.51 billion. These committed and uncommitted credit lines, which may be eligible for renewal at various future dates or have no specified expiration date, are used primarily
by our subsidiaries for local funding requirements. Caterpillar or Cat Financial may guarantee subsidiary borrowings under these lines.
At December 31, 2013, Caterpillar's consolidated net worth was $25.03 billion, which was above the $9.00 billion required under the Credit Facility. The consolidated net worth is defined as the consolidated stockholder's equity including preferred stock but excluding the pension and other postretirement benefits balance within Accumulated other comprehensive income (loss).
At December 31, 2013, Cat Financial's covenant interest coverage ratio was 1.96 to 1. This is above the 1.15 to 1 minimum ratio, calculated as (1) profit excluding income taxes, interest expense and net gain/(loss) from interest rate derivatives to (2) interest expense calculated at the end of each calendar quarter for the rolling four quarter period then most recently ended, required by the Credit Facility.
In addition, at December 31, 2013, Cat Financial's six-month covenant leverage ratio was 8.14 to 1 and year-end covenant leverage ratio was 7.99 to 1. This is below the maximum ratio of debt to net worth of 10 to 1, calculated (1) on a monthly basis as the average of the leverage ratios determined on the last day of each of the six preceding calendar months and (2) at each December 31, required by the Credit Facility.
In the event Caterpillar or Cat Financial does not meet one or more of their respective financial covenants under the Credit Facility in the future (and are unable to obtain a consent or waiver), the syndicate of banks may terminate the commitments allocated to the party that does not meet its covenants. Additionally, in such event, certain of Cat Financial's other lenders under other loan agreements where similar financial covenants or cross default provisions are applicable, may, at their election, choose to pursue remedies under those loan agreements, including accelerating the repayment of outstanding borrowings. At December 31, 2013, there were no borrowings under the Credit Facility.
|
| | | | | | | | | | | | |
| Computations of profit per share: | | | | | | |
| | | | | | | |
| (Dollars in millions except per share data) | | 2013 | | 2012 | | 2011 |
Profit for the period (A) 1 | | $ | 3,789 |
| | $ | 5,681 |
| | $ | 4,928 |
|
| Determination of shares (in millions): | | |
| | |
| | |
|
| Weighted average number of common shares outstanding (B) | | 645.2 |
| | 652.6 |
| | 645.0 |
|
| Shares issuable on exercise of stock awards, net of shares assumed to be purchased out of proceeds at average market price | | 13.4 |
| | 17.0 |
| | 21.1 |
|
Average common shares outstanding for fully diluted computation (C) 2 | | 658.6 |
| | 669.6 |
| | 666.1 |
|
| Profit per share of common stock: | | |
| | |
| | |
|
| Assuming no dilution (A/B) | | $ | 5.87 |
| | $ | 8.71 |
| | $ | 7.64 |
|
Assuming full dilution (A/C) 2 | | $ | 5.75 |
| | $ | 8.48 |
| | $ | 7.40 |
|
| Shares outstanding as of December 31 (in millions) | | 637.8 |
| | 655.0 |
| | 647.5 |
|
| |
1 | Profit attributable to common stockholders. |
| |
2 | Diluted by assumed exercise of stock-based compensation awards using the treasury stock method. |
SARs and stock options to purchase 10,152,448, 6,066,777 and 2,902,533 common shares were outstanding in 2013, 2012 and 2011, respectively, but were not included in the computation of diluted earnings per share because the effect would have been antidilutive.
In February 2007, the Board of Directors authorized the repurchase of $7.5 billion of Caterpillar stock, and in December 2011, the authorization was extended through December 31, 2015. In April 2013, we entered into a definitive agreement with Citibank, N.A. to purchase shares of our common stock under an accelerated stock repurchase transaction (April ASR Agreement), which was completed in June 2013. In accordance with the terms of the April ASR Agreement, a total of 11.5 million shares of our common stock were repurchased at an aggregate cost to Caterpillar of $1.0 billion.
In July 2013, we entered into a definitive agreement with Société Générale to purchase shares of our common stock under an accelerated stock repurchase transaction (July ASR Agreement), which was completed in September 2013. In accordance with the terms of the July ASR Agreement, a total of 11.9 million shares of our common stock were repurchased at an aggregate cost to Caterpillar of $1.0 billion.
In January 2014, we completed the current $7.5 billion stock repurchase program as we entered into a definitive agreement with Citibank, N.A. to purchase shares of our common stock under an accelerated stock repurchase transaction (January ASR Agreement). Pursuant to the terms of the January ASR Agreement, we have agreed to repurchase approximately $1.7 billion of our common stock from Citibank, N.A., with an immediate delivery of approximately 17.7 million shares. The final number of shares to be repurchased and the aggregate cost to Caterpillar will be based on Caterpillar's volume-weighted average stock price during the term of the transaction, which is expected to be completed in March 2014.
In addition, in January 2014, the Board authorized the repurchase of $10 billion of Caterpillar stock, which will expire on December 31, 2018.
| |
| 17. | Accumulated other comprehensive income (loss) |
Comprehensive income and its components are presented in Statement 2. Changes in Accumulated other comprehensive income (loss), net of tax, included in Statement 4, consisted of the following:
|
| | | | | | | | | | | | | | | | | | | | |
| | | | | | | | | | | |
| (Millions of dollars) | | Foreign currency translation | | Pension and other postretirement benefits | | Derivative financial instruments | | Available-for-sale securities | | Total |
| | | | | | | | | | | |
| Balance at December 31, 2011 | | $ | 206 |
| | $ | (6,568 | ) | | $ | (10 | ) | | $ | 44 |
| | $ | (6,328 | ) |
| | | | | | | | | | | |
Balance at December 31, 2012 1 | | $ | 456 |
| | $ | (6,914 | ) | | $ | (42 | ) | | $ | 67 |
| | $ | (6,433 | ) |
| Other comprehensive income (loss) before reclassifications | | (280 | ) | | 2,280 |
| | (4 | ) | | 29 |
| | 2,025 |
|
| Amounts reclassified from accumulated other comprehensive (income) loss | | — |
| | 482 |
| | 41 |
| | (13 | ) | | 510 |
|
| Other comprehensive income (loss) | | (280 | ) | | 2,762 |
| | 37 |
| | 16 |
| | 2,535 |
|
| Balance at December 31, 2013 | | $ | 176 |
| | $ | (4,152 | ) | | $ | (5 | ) | | $ | 83 |
| | $ | (3,898 | ) |
| |
1 | In conjunction with the Cat Japan share redemption, to reflect the increase in our ownership interest in Cat Japan from 67 percent to 100 percent, $107 million was reclassified to Accumulated other comprehensive income (loss) from other components of stockholders' equity and was not included in Comprehensive income during the second quarter of 2012. The amount was comprised of foreign currency translation of $167 million, pension and other postretirement benefits of $(61) million and available-for-sale securities of $1 million. |
The effect of the reclassifications out of Accumulated other comprehensive income (loss) on Statement 1 is as follows:
|
| | | | | | | |
| | | | | | |
| (Millions of dollars) | | Classification of income (expense) | | Year ended December 31, 2013 | |
| | | | | | |
| | | | | | |
| Pension and other postretirement benefits: | | | | | |
| Amortization of actuarial gain (loss) | | Note 12 1 | | $ | (781 | ) | |
| Amortization of prior service credit (cost) | | Note 12 1 | | 54 |
| |
| Amortization of transition asset (obligation) | | Note 12 1 | | (2 | ) | |
| Reclassifications before tax | | (729 | ) | |
| Tax (provision) benefit | | 247 |
| |
| Reclassifications net of tax | | $ | (482 | ) | |
| | | | | | |
| Derivative financial instruments: | | | | | |
| Foreign exchange contracts | | Other income (expense) | | $ | (57 | ) | |
| Interest rate contracts | | Other income (expense) | | (3 | ) | |
| Interest rate contracts | | Interest expense of Financial Products | | (6 | ) | |
| Reclassifications before tax | | (66 | ) | |
| Tax (provision) benefit | | 25 |
| |
| Reclassifications net of tax | | $ | (41 | ) | |
| | | | | | |
| Available-for-sale securities: | | | | | |
| Realized gain (loss) on sale of securities | | Other income (expense) | | $ | 19 |
| |
| Tax (provision) benefit | | (6 | ) | |
| Reclassifications net of tax | | $ | 13 |
| |
| | | | | | |
| Total reclassifications from Accumulated other comprehensive income (loss) | | $ | (510 | ) | |
1 Amounts are included in the calculation of net periodic benefit cost. See Note 12 for additional information.
| |
| 18. | Fair value disclosures |
| |
| A. | Fair value measurements |
The guidance on fair value measurements defines fair value as the exchange price that would be received for an asset or paid to transfer a liability (an exit price) in the principal or most advantageous market for the asset or liability in an orderly transaction between market participants. This guidance also specifies a fair value hierarchy based upon the observability of inputs used in valuation techniques. Observable inputs (highest level) reflect market data obtained from independent sources, while unobservable inputs (lowest level) reflect internally developed market assumptions. In accordance with this guidance, fair value measurements are classified under the following hierarchy:
| |
| • | Level 1 – Quoted prices for identical instruments in active markets. |
| |
| • | Level 2 – Quoted prices for similar instruments in active markets; quoted prices for identical or similar instruments in markets that are not active; and model-derived valuations in which all significant inputs or significant value-drivers are observable in active markets. |
| |
| • | Level 3 – Model-derived valuations in which one or more significant inputs or significant value-drivers are unobservable. |
When available, we use quoted market prices to determine fair value, and we classify such measurements within Level 1. In some cases where market prices are not available, we make use of observable market based inputs to calculate fair value, in which case the measurements are classified within Level 2. If quoted or observable market prices are not available, fair value is based upon internally developed models that use, where possible, current market-based parameters such as interest rates, yield curves and currency rates. These measurements are classified within Level 3.
Fair value measurements are classified according to the lowest level input or value-driver that is significant to the valuation. A measurement may therefore be classified within Level 3 even though there may be significant inputs that are readily observable.
Fair value measurement includes the consideration of nonperformance risk. Nonperformance risk refers to the risk that an obligation (either by a counterparty or Caterpillar) will not be fulfilled. For financial assets traded in an active market (Level 1 and certain Level 2), the nonperformance risk is included in the market price. For certain other financial assets and liabilities (certain Level 2 and Level 3), our fair value calculations have been adjusted accordingly.
Available-for-sale securities
Our available-for-sale securities, primarily at Insurance Services, include a mix of equity and debt instruments (see Note 11 for additional information). Fair values for our U.S. treasury bonds and equity securities are based upon valuations for identical instruments in active markets. Fair values for other government bonds, corporate bonds and mortgage-backed debt securities are based upon models that take into consideration such market-based factors as recent sales, risk-free yield curves and prices of similarly rated bonds.
Derivative financial instruments
The fair value of interest rate swap derivatives is primarily based on models that utilize the appropriate market-based forward swap curves and zero-coupon interest rates to determine discounted cash flows. The fair value of foreign currency and commodity forward, option and cross currency contracts is based on a valuation model that discounts cash flows resulting from the differential between the contract price and the market-based forward rate.
Guarantees
The fair value of guarantees is based on our estimate of the premium a market participant would require to issue the same guarantee in a stand-alone arms-length transaction with an unrelated party. If quoted or observable market prices are not available, fair value is based upon internally developed models that utilize current market-based assumptions.
Assets and liabilities measured on a recurring basis at fair value, primarily related to Financial Products, included in Statement 3 as of December 31, 2013, 2012 and 2011 are summarized below:
|
| | | | | | | | | | | | | | | | |
| | | December 31, 2013 |
| (Millions of dollars) | | Level 1 | | Level 2 | | Level 3 | | Total Assets / Liabilities, at Fair Value |
| Assets | | |
| | |
| | |
| | |
|
| Available-for-sale securities | | |
| | |
| | |
| | |
|
| Government debt | | |
| | |
| | |
| | |
|
| U.S. treasury bonds | | $ | 10 |
| | $ | — |
| | $ | — |
| | $ | 10 |
|
| Other U.S. and non-U.S. government bonds | | — |
| | 120 |
| | — |
| | 120 |
|
| | | | | | | | | |
| Corporate bonds | | |
| | | | |
| | |
|
| Corporate bonds | | — |
| | 633 |
| | — |
| | 633 |
|
| Asset-backed securities | | — |
| | 72 |
| | — |
| | 72 |
|
| | | | | | | | | |
| Mortgage-backed debt securities | | |
| | | | |
| | |
|
| U.S. governmental agency | | — |
| | 321 |
| | — |
| | 321 |
|
| Residential | | — |
| | 18 |
| | — |
| | 18 |
|
| Commercial | | — |
| | 93 |
| | — |
| | 93 |
|
| | | | | | | | | |
| Equity securities | | |
| | |
| | |
| | |
|
| Large capitalization value | | 254 |
| | — |
| | — |
| | 254 |
|
| Smaller company growth | | 49 |
| | — |
| | — |
| | 49 |
|
| Total available-for-sale securities | | 313 |
| | 1,257 |
| | — |
| | 1,570 |
|
| | | | | | | | | |
| Derivative financial instruments, net | | — |
| | 161 |
| | — |
| | 161 |
|
| Total Assets | | $ | 313 |
| | $ | 1,418 |
| | $ | — |
| | $ | 1,731 |
|
| | | | | | | | | |
| Liabilities | | |
| | |
| | |
| | |
|
| Guarantees | | $ | — |
| | $ | — |
| | $ | 13 |
| | $ | 13 |
|
| Total Liabilities | | $ | — |
| | $ | — |
| | $ | 13 |
| | $ | 13 |
|
| | | | | | | | | |
|
| | | | | | | | | | | | | | | | |
| | | December 31, 2012 |
| (Millions of dollars) | | Level 1 | | Level 2 | | Level 3 | | Total Assets / Liabilities, at Fair Value |
| Assets | | |
| | |
| | |
| | |
|
| Available-for-sale securities | | |
| | |
| | |
| | |
|
| Government debt | | |
| | |
| | |
| | |
|
| U.S. treasury bonds | | $ | 10 |
| | $ | — |
| | $ | — |
| | $ | 10 |
|
| Other U.S. and non-U.S. government bonds | | — |
| | 146 |
| | — |
| | 146 |
|
| | | | | | | | | |
| Corporate bonds | | |
| | |
| | |
| | |
|
| Corporate bonds | | — |
| | 664 |
| | — |
| | 664 |
|
| Asset-backed securities | | — |
| | 96 |
| | — |
| | 96 |
|
| | | | | | | | | |
| Mortgage-backed debt securities | | |
| | |
| | |
| | |
|
| U.S. governmental agency | | — |
| | 299 |
| | — |
| | 299 |
|
| Residential | | — |
| | 25 |
| | — |
| | 25 |
|
| Commercial | | — |
| | 127 |
| | — |
| | 127 |
|
| | | | | | | | | |
| Equity securities | | |
| | |
| | |
| | |
|
| Large capitalization value | | 185 |
| | — |
| | — |
| | 185 |
|
| Smaller company growth | | 34 |
| | — |
| | — |
| | 34 |
|
| Total available-for-sale securities | | 229 |
| | 1,357 |
| | — |
| | 1,586 |
|
| | | | | | | | | |
| Derivative financial instruments, net | | — |
| | 154 |
| | — |
| | 154 |
|
| Total Assets | | $ | 229 |
| | $ | 1,511 |
| | $ | — |
| | $ | 1,740 |
|
| | | | | | | | | |
| Liabilities | | |
| | |
| | |
| | |
|
| Guarantees | | $ | — |
| | $ | — |
| | $ | 14 |
| | $ | 14 |
|
| Total Liabilities | | $ | — |
| | $ | — |
| | $ | 14 |
| | $ | 14 |
|
| | | | | | | | | |
|
| | | | | | | | | | | | | | | | |
| | | December 31, 2011 |
| (Millions of dollars) | | Level 1 | | Level 2 | | Level 3 | | Total Assets / Liabilities, at Fair Value |
| Assets | | |
| | |
| | |
| | |
|
| Available-for-sale securities | | |
| | |
| | |
| | |
|
| Government debt | | |
| | |
| | |
| | |
|
| U.S. treasury bonds | | $ | 10 |
| | $ | — |
| | $ | — |
| | $ | 10 |
|
| Other U.S. and non-U.S. government bonds | | — |
| | 92 |
| | — |
| | 92 |
|
| | | | | | | | | |
| Corporate bonds | | |
| | |
| | |
| | |
|
| Corporate bonds | | — |
| | 572 |
| | — |
| | 572 |
|
| Asset-backed securities | | — |
| | 111 |
| | — |
| | 111 |
|
| | | | | | | | | |
| Mortgage-backed debt securities | | |
| | |
| | |
| | |
|
| U.S. governmental agency | | — |
| | 310 |
| | — |
| | 310 |
|
| Residential | | — |
| | 30 |
| | — |
| | 30 |
|
| Commercial | | — |
| | 145 |
| | — |
| | 145 |
|
| | | | | | | | | |
| Equity securities | | |
| | |
| | |
| | |
|
| Large capitalization value | | 148 |
| | — |
| | — |
| | 148 |
|
| Smaller company growth | | 29 |
| | — |
| | — |
| | 29 |
|
| Total available-for-sale securities | | 187 |
| | 1,260 |
| | — |
| | 1,447 |
|
| | | | | | | | | |
| Derivative financial instruments, net | | — |
| | 145 |
| | — |
| | 145 |
|
| Total Assets | | $ | 187 |
| | $ | 1,405 |
| | $ | — |
| | $ | 1,592 |
|
| | | | | | | | | |
| Liabilities | | |
| | |
| | |
| | |
|
| Guarantees | | $ | — |
| | $ | — |
| | $ | 7 |
| | $ | 7 |
|
| Total Liabilities | | $ | — |
| | $ | — |
| | $ | 7 |
| | $ | 7 |
|
| | | | | | | | | |
Below are roll-forwards of liabilities measured at fair value using Level 3 inputs for the years ended December 31, 2013, 2012 and 2011. These instruments were valued using pricing models that, in management’s judgment, reflect the assumptions of a market participant.
|
| | | | |
| (Millions of dollars) | | Guarantees |
| Balance at December 31, 2010 | | $ | 10 |
|
| Issuance of guarantees | | 4 |
|
| Expiration of guarantees | | (7 | ) |
| Balance at December 31, 2011 | | $ | 7 |
|
| Acquisitions | | 6 |
|
| Issuance of guarantees | | 7 |
|
| Expiration of guarantees | | (6 | ) |
| Balance at December 31, 2012 | | $ | 14 |
|
| Issuance of guarantees | | 6 |
|
| Expiration of guarantees | | (7 | ) |
| Balance at December 31, 2013 | | $ | 13 |
|
| | | |
In addition to the amounts above, Cat Financial impaired loans are subject to measurement at fair value on a nonrecurring basis. A loan is considered impaired when management determines that collection of contractual amounts due is not probable. In these cases, an allowance for credit losses may be established based primarily on the fair value of associated collateral. As the collateral’s fair value is based on observable market prices and/or current appraised values, the impaired loans are classified as Level 2 measurements. Cat Financial had impaired loans with a fair value of $81 million, $117 million and $96 million for the years ended December 31, 2013, 2012 and 2011, respectively.
| |
| B. | Fair values of financial instruments |
In addition to the methods and assumptions we use to record the fair value of financial instruments as discussed in the Fair value measurements section above, we used the following methods and assumptions to estimate the fair value of our financial instruments:
Cash and short-term investments
Carrying amount approximated fair value.
Restricted cash and short-term investments
Carrying amount approximated fair value. Restricted cash and short-term investments are included in Prepaid expenses and other current assets in Statement 3.
Finance receivables
Fair value was estimated by discounting the future cash flows using current rates, representative of receivables with similar remaining maturities.
Wholesale inventory receivables
Fair value was estimated by discounting the future cash flows using current rates, representative of receivables with similar remaining maturities.
Short-term borrowings
Carrying amount approximated fair value.
Long-term debt
Fair value for fixed and floating rate debt was estimated based on quoted market prices.
Please refer to the table below for the fair values of our financial instruments.
|
| | | | | | | | | | | | | | | | | | | | | | | | | | | | |
| TABLE III—Fair Values of Financial Instruments |
| | | 2013 | | 2012 | | 2011 | | | | |
| (Millions of dollars) | | Carrying Amount | | Fair Value | | Carrying Amount | | Fair Value | | Carrying Amount | | Fair Value | | Fair Value Levels | | Reference |
| Assets at December 31, | | |
| | |
| | |
| | |
| | |
| | |
| | | | |
| Cash and short-term investments | | $ | 6,081 |
| | $ | 6,081 |
| | $ | 5,490 |
| | $ | 5,490 |
| | $ | 3,057 |
| | $ | 3,057 |
| | 1 | | Statement 3 |
| Restricted cash and short-term investments | | 53 |
| | 53 |
| | 53 |
| | 53 |
| | 87 |
| | 87 |
| | 1 | | Statement 3 |
| Available-for-sale securities | | 1,570 |
| | 1,570 |
| | 1,586 |
| | 1,586 |
| | 1,447 |
| | 1,447 |
| | 1 & 2 | | Notes 11 & 19 |
Finance receivables–net (excluding finance leases 1) | | 16,049 |
| | 15,913 |
| | 15,404 |
| | 15,359 |
| | 12,689 |
| | 12,516 |
| | 2 | | Note 6 & 19 |
Wholesale inventory receivables–net (excluding finance leases 1) | | 1,529 |
| | 1,467 |
| | 1,674 |
| | 1,609 |
| | 1,591 |
| | 1,505 |
| | 2 | | Note 6 & 19 |
| Foreign currency contracts–net | | 45 |
| | 45 |
| | — |
| | — |
| | — |
| | — |
| | 2 | | Notes 3 & 19 |
| Interest rate swaps–net | | 116 |
| | 116 |
| | 219 |
| | 219 |
| | 241 |
| | 241 |
| | 2 | | Notes 3 & 19 |
| Commodity contracts–net | | — |
| | — |
| | 1 |
| | 1 |
| | — |
| | — |
| | 2 | | Notes 3 & 19 |
| | | | | | | | | | | | | | | | | |
| Liabilities at December 31, | | |
| | |
| | |
| | |
| | |
| | |
| | | | |
| Short-term borrowings | | 3,679 |
| | 3,679 |
| | 5,287 |
| | 5,287 |
| | 3,988 |
| | 3,988 |
| | 1 | | Note 13 |
| Long-term debt (including amounts due within one year): | | |
| | |
| | |
| | |
| | |
| | |
| | | | |
| Machinery and Power Systems | | 8,759 |
| | 9,905 |
| | 9,779 |
| | 11,969 |
| | 8,973 |
| | 10,737 |
| | 2 | | Note 14 |
| Financial Products | | 25,312 |
| | 25,849 |
| | 25,077 |
| | 26,063 |
| | 21,631 |
| | 22,674 |
| | 2 | | Note 14 |
| Foreign currency contracts–net | | — |
| | — |
| | 66 |
| | 66 |
| | 89 |
| | 89 |
| | 2 | | Notes 3 & 19 |
| Commodity contracts–net | | — |
| | — |
| | — |
| | — |
| | 7 |
| | 7 |
| | 2 | | Notes 3 & 19 |
| Guarantees | | 13 |
| | 13 |
| | 14 |
| | 14 |
| | 7 |
| | 7 |
| | 3 | | Note 21 |
| |
1 | Total excluded items have a net carrying value at December 31, 2013, 2012 and 2011 of $8,053 million, $7,959 million and $7,324 million, respectively. |
| |
| 19. | Concentration of credit risk |
Financial instruments with potential credit risk consist primarily of trade and finance receivables and short-term and long-term investments. Additionally, to a lesser extent, we have a potential credit risk associated with counterparties to derivative contracts.
Trade receivables are primarily short-term receivables from independently owned and operated dealers and customers which arise in the normal course of business. We perform regular credit evaluations of our dealers and customers. Collateral generally is not required, and the majority of our trade receivables are unsecured. We do, however, when deemed necessary, make use of various devices such as security agreements and letters of credit to protect our interests. No single dealer or customer represents a significant concentration of credit risk.
Finance receivables and wholesale inventory receivables primarily represent receivables under installment sales contracts, receivables arising from leasing transactions and notes receivable. We generally maintain a secured interest in the equipment financed. No single customer or dealer represents a significant concentration of credit risk.
Short-term and long-term investments are held with high quality institutions and, by policy, the amount of credit exposure to any one institution is limited. Long-term investments, primarily included in Other assets in Statement 3, are comprised primarily of available-for-sale securities at Insurance Services.
For derivative contracts, collateral is generally not required of the counterparties or of our company. The company generally enters into International Swaps and Derivatives Association (ISDA) master netting agreements within Machinery & Power Systems and Financial Products that permit the net settlement of amounts owed under their respective derivative contracts. Our exposure to credit loss in the event of nonperformance by the counterparties is limited to only those gains that we have recorded, but for which we have not yet received cash payment. The master netting agreements reduce the amount of loss the company would incur should the counterparties fail to meet their obligations. At December 31, 2013, 2012 and 2011, the
maximum exposure to credit loss, including accrued interest, was $251 million, $366 million and $443 million, respectively, before the application of any master netting agreements. Please refer to Note 18 and Table III above for fair value information.
We lease certain computer and communications equipment, transportation equipment and other property through operating leases. Total rental expense for operating leases was $436 million, $474 million, and $429 million for 2013, 2012 and 2011, respectively.
Minimum payments for operating leases having initial or remaining non-cancelable terms in excess of one year are:
|
| | | | | | | | | | | | | | | | | | | | | | | | | | |
| Years ended December 31, |
| (Millions of dollars) |
| 2014 | | 2015 | | 2016 | | 2017 | | 2018 | | Thereafter | | Total |
| $ | 244 |
| | $ | 180 |
| | $ | 133 |
| | $ | 99 |
| | $ | 74 |
| | $ | 229 |
| | $ | 959 |
|
| | | | | | | | | | | | | |
| |
| 21. | Guarantees and product warranty |
We have provided an indemnity to a third-party insurance company for potential losses related to performance bonds issued on behalf of Caterpillar dealers. The bonds are issued to insure governmental agencies against nonperformance by certain dealers. We also provided guarantees to a third-party related to the performance of contractual obligations by certain Caterpillar dealers. The guarantees cover potential financial losses incurred by the third-party resulting from the dealers’ nonperformance.
We provide loan guarantees to third-party lenders for financing associated with machinery purchased by customers. These guarantees have varying terms and are secured by the machinery. In addition, Cat Financial participates in standby letters of credit issued to third parties on behalf of their customers. These standby letters of credit have varying terms and beneficiaries and are secured by customer assets.
We have provided a guarantee to one of our customers in Brazil related to the performance of contractual obligations by a supplier consortium to which one of our Caterpillar subsidiaries is a member. The guarantees cover potential damages (some of them capped) incurred by the customer resulting from the supplier consortium’s non-performance. The guarantee will expire when the supplier consortium performs all its contractual obligations, which is expected to be completed in 2022.
We have provided guarantees to third-party lessors for certain properties leased by Cat Logistics Services, LLC, in which we sold a 65 percent equity interest in the third quarter of 2012. See Note 26 for further discussion on this divestiture. The guarantees are for the possibility that the third party logistics business would default on real estate lease payments. The guarantees were granted at lease inception, which was prior to the divestiture, and generally will expire at the end of the lease terms.
Cat Financial provided a limited indemnity to a third-party bank resulting from the assignment of certain leases to that bank. The indemnity was for the possibility that the insurers of these leases would become insolvent. The indemnity expired December 15, 2012.
No loss has been experienced or is anticipated under any of these guarantees. At December 31, 2013, 2012 and 2011, the related liability was $13 million, $14 million and $7 million, respectively. The maximum potential amount of future payments (undiscounted and without reduction for any amounts that may possibly be recovered under recourse or collateralized provisions) we could be required to make under the guarantees at December 31 are as follows:
|
| | | | | | | | | | | | |
| (Millions of dollars) | | 2013 | | 2012 | | 2011 |
| Caterpillar dealer guarantees | | $ | 193 |
| | $ | 180 |
| | $ | 140 |
|
| Customer guarantees | | 62 |
| | 77 |
| | 96 |
|
| Customer guarantees - supplier consortium | | 364 |
| | — |
| | — |
|
| Third party logistics business guarantees | | 151 |
| | 176 |
| | — |
|
| Limited indemnity | | — |
| | — |
| | 11 |
|
| Other guarantees | | 35 |
| | 53 |
| | 28 |
|
| Total guarantees | | $ | 805 |
| | $ | 486 |
| | $ | 275 |
|
| | | | | | | |
Cat Financial provides guarantees to repurchase certain loans of Caterpillar dealers from a special-purpose corporation (SPC) that qualifies as a variable interest entity. The purpose of the SPC is to provide short-term working capital loans to Caterpillar dealers. This SPC issues commercial paper and uses the proceeds to fund its loan program. Cat Financial has a loan purchase agreement with the SPC that obligates Cat Financial to purchase certain loans that are not paid at maturity. Cat Financial receives a fee for providing this guarantee, which provides a source of liquidity for the SPC. Cat Financial is the primary beneficiary of the SPC as their guarantees result in Cat Financial having both the power to direct the activities that most significantly impact the SPC’s economic performance and the obligation to absorb losses, and therefore Cat Financial has consolidated the financial statements of the SPC. As of December 31, 2013, 2012 and 2011, the SPC’s assets of $1,005 million, $927 million and $586 million, respectively, are primarily comprised of loans to dealers, and the SPC’s liabilities of $1,005 million, $927 million and $586 million, respectively, are primarily comprised of commercial paper. The assets of the SPC are not available to pay Cat Financial's creditors. Cat Financial may be obligated to perform under the guarantee if the SPC experiences losses. No loss has been experienced or is anticipated under this loan purchase agreement.
Cat Financial is party to agreements in the normal course of business with selected customers and Caterpillar dealers in which we commit to provide a set dollar amount of financing on a pre-approved basis. We also provide lines of credit to selected customers and Caterpillar dealers, of which a portion remains unused as of the end of the period. Commitments and lines of credit generally have fixed expiration dates or other termination clauses. It has been our experience that not all commitments and lines of credit will be used. Management applies the same credit policies when making commitments and granting lines of credit as it does for any other financing.
Cat Financial does not require collateral for these commitments/lines, but if credit is extended, collateral may be required upon funding. The amount of the unused commitments and lines of credit for dealers as of December 31, 2013, 2012 and 2011 was $10,503 million, $10,863 million and $6,469 million, respectively. The amount of the unused commitments and lines of credit for customers as of December 31, 2013, 2012 and 2011 was $4,635 million, $4,690 million and $2,785 million, respectively.
Our product warranty liability is determined by applying historical claim rate experience to the current field population and dealer inventory. Generally, historical claim rates are based on actual warranty experience for each product by machine model/engine size by customer or dealer location (inside or outside North America). Specific rates are developed for each product shipment month and are updated monthly based on actual warranty claim experience.
|
| | | | | | | | | | | | |
| (Millions of dollars) | | 2013 | | 2012 | | 2011 |
| Warranty liability, January 1 | | $ | 1,477 |
| | $ | 1,308 |
| | $ | 1,035 |
|
| Reduction in liability (payments) | | (938 | ) | | (920 | ) | | (926 | ) |
| Increase in liability (new warranties) | | 828 |
| | 1,089 |
| | 1,199 |
|
| Warranty liability, December 31 | | $ | 1,367 |
| | $ | 1,477 |
| | $ | 1,308 |
|
| | | | | | | |
| |
| 22. | Environmental and legal matters |
The company is regulated by federal, state and international environmental laws governing our use, transport and disposal of substances and control of emissions. In addition to governing our manufacturing and other operations, these laws often impact the development of our products, including, but not limited to, required compliance with air emissions standards applicable to internal combustion engines. We have made, and will continue to make, significant research and development and capital expenditures to comply with these emissions standards.
We are engaged in remedial activities at a number of locations, often with other companies, pursuant to federal and state laws. When it is probable we will pay remedial costs at a site, and those costs can be reasonably estimated, the investigation, remediation, and operating and maintenance costs are accrued against our earnings. Costs are accrued based on consideration of currently available data and information with respect to each individual site, including available technologies, current applicable laws and regulations, and prior remediation experience. Where no amount within a range of estimates is more likely, we accrue the minimum. Where multiple potentially responsible parties are involved, we consider our proportionate share of the probable costs. In formulating the estimate of probable costs, we do not consider amounts expected to be recovered from insurance companies or others. We reassess these accrued amounts on a quarterly basis. The amount recorded for environmental remediation is not material and is included in Accrued expenses in Statement 3. There is no more than a remote chance that a material amount for remedial activities at any individual site, or at all the sites in the aggregate, will be required.
On October 24, 2013, Progress Rail Services Corporation (Progress Rail), a wholly-owned indirect subsidiary of Caterpillar Inc., received a grand jury subpoena from the U.S. District Court for the Central District of California. The subpoena requests documents and information from Progress Rail, United Industries Corporation, a wholly-owned subsidiary of Progress Rail, and Caterpillar Inc. relating to allegations that Progress Rail conducted improper or unnecessary railcar inspections and repairs and improperly disposed of parts, equipment, tools and other items. In connection with this subpoena, Progress Rail was informed by the U.S. Attorney for the Central District of California that it is a target of a criminal investigation into potential violations of environmental laws and alleged improper business practices. The Company is cooperating with the authorities. The Company is unable to predict the outcome or reasonably estimate the potential loss; however, we currently believe that this matter will not have a material adverse effect on the Company's consolidated results of operation, financial position or liquidity.
Beginning in September 2010, the company filed a series of legal claims to collect policy proceeds from a third party insurance company to recover amounts paid for covered asbestos defense and settlement costs for occurrences between 1962 and 1981. In the fourth quarter of 2013, the company reached final settlement with the third party insurance company. As a result, a gain of $68 million was recognized in Other operating (income) expense in Statement 1.
In addition, we are involved in other unresolved legal actions that arise in the normal course of business. The most prevalent of these unresolved actions involve disputes related to product design, manufacture and performance liability (including claimed asbestos and welding fumes exposure), contracts, employment issues, environmental matters or intellectual property rights. The aggregate range of reasonably possible losses in excess of accrued liabilities, if any, associated with these unresolved legal actions is not material. In some cases, we cannot reasonably estimate a range of loss because there is insufficient information regarding the matter. However, there is no more than a remote chance that any liability arising from these matters would be material. Although it is not possible to predict with certainty the outcome of these unresolved legal actions, we believe that these actions will not individually or in the aggregate have a material adverse effect on our consolidated results of operations, financial position or liquidity.
| |
| A. | Basis for segment information |
Our Executive Office is comprised of five Group Presidents, a Senior Vice President and a CEO. Group Presidents are accountable for a related set of end-to-end businesses that they manage. The Senior Vice President leads the Caterpillar Enterprise System Group, which was formed during the second quarter of 2013 with the goal of improving our manufacturing and supply chain capabilities, driving sustained improvements in customer deliveries, improving operational efficiencies and building on recent product quality improvements. The CEO allocates resources and manages performance at the Group President level. As such, the CEO serves as our Chief Operating Decision Maker and operating segments are primarily based on the Group President reporting structure.
Three of our operating segments, Construction Industries, Resource Industries and Power Systems, are led by Group Presidents. One operating segment, Financial Products, is led by a Group President who has responsibility for Corporate Services. Corporate Services is a cost center primarily responsible for the performance of certain support functions globally and to provide centralized services; it does not meet the definition of an operating segment. The Caterpillar Enterprise System Group is also a cost center and does not meet the definition of an operating segment. One Group President leads a smaller operating segment that is included in the All Other operating segment.
In 2012, a portion of goodwill related to recent acquisitions was allocated to Machinery and Power Systems operating segments and is now a methodology difference between segment and external reporting. The segment information for 2011 has been retrospectively adjusted.
B. Description of segments
We have five operating segments, of which four are reportable segments. Following is a brief description of our reportable segments and the business activities included in the All Other operating segment:
Construction Industries: A segment primarily responsible for supporting customers using machinery in infrastructure and building construction applications. Responsibilities include business strategy, product design, product management and development, manufacturing, marketing, and sales and product support. The product portfolio includes backhoe loaders, small wheel loaders, small track-type tractors, skid steer loaders, multi-terrain loaders, mini excavators, compact wheel loaders, select work tools, small, medium and large track excavators, wheel excavators, medium wheel loaders, compact track loaders, medium track-type tractors, track-type loaders, motor graders and pipelayers. In addition, Construction Industries has responsibility for Power Systems and three wholly-owned dealers in Japan and an integrated manufacturing cost center. Inter-segment sales are a source of revenue for this segment.
Resource Industries: A segment primarily responsible for supporting customers using machinery in mining and quarrying applications. Responsibilities include business strategy, product design, product management and development, manufacturing, marketing and sales and product support. The product portfolio includes large track-type tractors, large mining trucks, underground mining equipment, electric rope shovels, draglines, hydraulic shovels, drills, highwall miners, tunnel boring equipment, large wheel loaders, off-highway trucks, articulated trucks, wheel tractor scrapers, wheel dozers, select work tools, forestry products, paving products, industrial and waste products, machinery components and electronics and control systems. Resource Industries also manages areas that provide services to other parts of the company, including integrated manufacturing and research and development. In addition, segment profit includes the impact from divestiture of portions of the Bucyrus distribution business and the acquisition of ERA Mining Machinery Limited, including its wholly-owned subsidiary Zhengzhou Siwei Mechanical & Electrical Manufacturing Co., Ltd., commonly known as Siwei, which was completed during the second quarter of 2012. In the fourth quarter of 2013, Siwei was renamed Caterpillar (Zhengzhou) Ltd. Siwei primarily designs, manufactures, sells and supports underground coal mining equipment in China. Inter-segment sales are a source of revenue for this segment.
Power Systems: A segment primarily responsible for supporting customers using reciprocating engines, turbines and related parts across industries serving electric power, industrial, petroleum and marine applications as well as rail-related businesses. Responsibilities include business strategy, product design, product management, development, manufacturing, marketing, sales and product support of reciprocating engine powered generator sets, integrated systems used in the electric power generation industry, reciprocating engines and integrated systems and solutions for the marine and petroleum industries; reciprocating engines supplied to the industrial industry as well as Caterpillar machinery; the business strategy, product design, product management, development, manufacturing, marketing, sales and product support of turbines and turbine-related services; the development, manufacturing, remanufacturing, maintenance, leasing and service of diesel-electric locomotives and components and other rail-related products and services. Inter-segment sales are a source of revenue for this segment.
Financial Products Segment: Provides financing to customers and dealers for the purchase and lease of Caterpillar and other equipment, as well as some financing for Caterpillar sales to dealers. Financing plans include operating and finance leases, installment sale contracts, working capital loans and wholesale financing plans. The segment also provides various forms of insurance to customers and dealers to help support the purchase and lease of our equipment.
All Other: Primarily includes activities such as: the remanufacturing of Cat® engines and components and remanufacturing services for other companies as well as the product management, development, manufacturing, marketing and product support of undercarriage, specialty products, hardened bar stock components and ground engaging tools primarily for Caterpillar products; logistics services; the product management, development, marketing, sales and product support of on-highway vocational trucks for North America; distribution services responsible for dealer development and administration, dealer portfolio management and ensuring the most efficient and effective distribution of machines, engines and parts; and the 50/50 joint venture with Navistar (NC2) until it became a wholly owned subsidiary of Navistar effective September 29, 2011. On July 31, 2012, we sold a majority interest in Caterpillar's third party logistics business. Inter-segment sales are a source of revenue for this segment. Results for the All Other operating segment are included as a reconciling item between reportable segments and consolidated external reporting.
C. Segment measurement and reconciliations
There are several methodology differences between our segment reporting and our external reporting. The following is a list of the more significant methodology differences:
| |
| • | Machinery and Power Systems segment net assets generally include inventories, receivables, property, plant and equipment, goodwill, intangibles, accounts payable, and customer advances. Liabilities other than accounts payable and customer advances are generally managed at the corporate level and are not included in segment operations. Financial Products Segment assets generally include all categories of assets. |
| |
| • | Segment inventories and cost of sales are valued using a current cost methodology. |
| |
| • | Goodwill allocated to segments is amortized using a fixed amount based on a 20 year useful life. This methodology difference only impacts segment assets; no goodwill amortization expense is included in segment profit. In addition, only a portion of goodwill for certain acquisitions made in 2011 or later has been allocated to segments. |
| |
| • | The present value of future lease payments for certain Machinery and Power Systems operating leases is included in segment assets. The estimated financing component of the lease payments is excluded. |
| |
| • | Currency exposures for Machinery and Power Systems are generally managed at the corporate level and the effects of changes in exchange rates on results of operations within the year are not included in segment profit. The net difference created in the translation of revenues and costs between exchange rates used for U.S. GAAP reporting and exchange rates used for segment reporting are recorded as a methodology difference. |
| |
| • | Postretirement benefit expenses are split; segments are generally responsible for service and prior service costs, with the remaining elements of net periodic benefit cost included as a methodology difference. |
| |
| • | Machinery and Power Systems segment profit is determined on a pretax basis and excludes interest expense, gains and losses on interest rate swaps and other income/expense items. Financial Products Segment profit is determined on a pretax basis and includes other income/expense items. |
Reconciling items are created based on accounting differences between segment reporting and our consolidated external reporting. Please refer to pages A-87 to A-91 for financial information regarding significant reconciling items. Most of our reconciling items are self-explanatory given the above explanations. For the reconciliation of profit, we have grouped the reconciling items as follows:
| |
| • | Corporate costs: These costs are related to corporate requirements and strategies that are considered to be for the benefit of the entire organization. |
| |
| • | Methodology differences: See previous discussion of significant accounting differences between segment reporting and consolidated external reporting. |
| |
| • | Timing: Timing differences in the recognition of costs between segment reporting and consolidated external reporting. |
|
| | | | | | | | | | | | | | | | | | | | | | | | | | | | |
| Segment Information |
| (Millions of dollars) |
| Reportable Segments | | | | | | | | | | | | | | |
| | | External sales and revenues | | Inter- segment sales and revenues | | Total sales and revenues | | Depreciation and amortization | | Segment profit | | Segment assets at December 31 | | Capital expenditures |
| 2013 | | |
| | |
| | |
| | |
| | |
| | |
| | |
|
| Construction Industries | | $ | 18,445 |
| | $ | 336 |
| | $ | 18,781 |
| | $ | 576 |
| | $ | 1,363 |
| | $ | 8,429 |
| | $ | 645 |
|
| Resource Industries | | 13,270 |
| | 871 |
| | 14,141 |
| | 758 |
| | 1,575 |
| | 11,201 |
| | 539 |
|
| Power Systems | | 20,155 |
| | 1,895 |
| | 22,050 |
| | 642 |
| | 3,400 |
| | 8,492 |
| | 677 |
|
| Machinery and Power Systems | | $ | 51,870 |
| | $ | 3,102 |
| | $ | 54,972 |
| | $ | 1,976 |
| | $ | 6,338 |
| | $ | 28,122 |
| | $ | 1,861 |
|
| Financial Products Segment | | 3,224 |
| | — |
| | 3,224 |
| | 789 |
| | 990 |
| | 36,980 |
| | 1,806 |
|
| Total | | $ | 55,094 |
| | $ | 3,102 |
| | $ | 58,196 |
| | $ | 2,765 |
| | $ | 7,328 |
| | $ | 65,102 |
| | $ | 3,667 |
|
| | | | | | | | | | | | | | | |
| 2012 | | |
| | |
| | |
| | |
| | |
| | |
| | |
|
| Construction Industries | | $ | 19,334 |
| | $ | 470 |
| | $ | 19,804 |
| | $ | 565 |
| | $ | 1,789 |
| | $ | 10,393 |
| | $ | 1,045 |
|
| Resource Industries | | 21,158 |
| | 1,117 |
| | 22,275 |
| | 694 |
| | 4,318 |
| | 13,455 |
| | 1,143 |
|
| Power Systems | | 21,122 |
| | 2,407 |
| | 23,529 |
| | 604 |
| | 3,434 |
| | 9,323 |
| | 960 |
|
| Machinery and Power Systems | | $ | 61,614 |
| | $ | 3,994 |
| | $ | 65,608 |
| | $ | 1,863 |
| | $ | 9,541 |
| | $ | 33,171 |
| | $ | 3,148 |
|
| Financial Products Segment | | 3,090 |
| | — |
| | 3,090 |
| | 708 |
| | 763 |
| | 36,563 |
| | 1,660 |
|
| Total | | $ | 64,704 |
| | $ | 3,994 |
| | $ | 68,698 |
| | $ | 2,571 |
| | $ | 10,304 |
| | $ | 69,734 |
| | $ | 4,808 |
|
| | | | | | | | | | | | | | | |
| 2011 | | |
| | |
| | |
| | |
| | |
| | |
| | |
|
| Construction Industries | | $ | 19,667 |
| | $ | 575 |
| | $ | 20,242 |
| | $ | 526 |
| | $ | 2,056 |
| | $ | 7,942 |
| | $ | 915 |
|
| Resource Industries | | 15,629 |
| | 1,162 |
| | 16,791 |
| | 463 |
| | 3,334 |
| | 12,292 |
| | 717 |
|
| Power Systems | | 20,114 |
| | 2,339 |
| | 22,453 |
| | 544 |
| | 3,053 |
| | 8,748 |
| | 834 |
|
| Machinery and Power Systems | | $ | 55,410 |
| | $ | 4,076 |
| | $ | 59,486 |
| | $ | 1,533 |
| | $ | 8,443 |
| | $ | 28,982 |
| | $ | 2,466 |
|
| Financial Products Segment | | 3,003 |
| | — |
| | 3,003 |
| | 710 |
| | 587 |
| | 31,747 |
| | 1,191 |
|
| Total | | $ | 58,413 |
| | $ | 4,076 |
| | $ | 62,489 |
| | $ | 2,243 |
| | $ | 9,030 |
| | $ | 60,729 |
| | $ | 3,657 |
|
| | | | | | | | | | | | | | | |
|
| | | | | | | | | | | | | | | | |
| Reconciliation of Sales and Revenues: | | | | | | | | |
| (Millions of dollars) | | Machinery and Power Systems | | Financial Products | | Consolidating Adjustments | | Consolidated Total |
| 2013 | | |
| | |
| | |
| | |
|
| Total external sales and revenues from reportable segments | | $ | 51,870 |
| | $ | 3,224 |
| | $ | — |
| | $ | 55,094 |
|
| All Other operating segment | | 886 |
| | — |
| | — |
| | 886 |
|
| Other | | (62 | ) | | 78 |
| | (340 | ) | 1 | (324 | ) |
| Total sales and revenues | | $ | 52,694 |
| | $ | 3,302 |
| | $ | (340 | ) | | $ | 55,656 |
|
| | | | | | | | | |
| 2012 | | |
| | |
| | |
| | |
|
| Total external sales and revenues from reportable segments | | $ | 61,614 |
| | $ | 3,090 |
| | $ | — |
| | $ | 64,704 |
|
| All Other operating segment | | 1,501 |
| | — |
| | — |
| | 1,501 |
|
| Other | | (47 | ) | | 70 |
| | (353 | ) | 1 | (330 | ) |
| Total sales and revenues | | $ | 63,068 |
| | $ | 3,160 |
| | $ | (353 | ) | | $ | 65,875 |
|
| | | | | | | | | |
| 2011 | | |
| | |
| | |
| | |
|
| Total external sales and revenues from reportable segments | | $ | 55,410 |
| | $ | 3,003 |
| | $ | — |
| | $ | 58,413 |
|
| All Other operating segment | | 2,021 |
| | — |
| | — |
| | 2,021 |
|
| Other | | (39 | ) | | 54 |
| | (311 | ) | 1 | (296 | ) |
| Total sales and revenues | | $ | 57,392 |
| | $ | 3,057 |
| | $ | (311 | ) | | $ | 60,138 |
|
| |
1 | Elimination of Financial Products revenues from Machinery and Power Systems. |
|
| | | | | | | | | | | | |
| Reconciliation of consolidated profit before taxes: | | | | | | |
| (Millions of dollars) | | Machinery and Power Systems | | Financial Products | | Consolidated Total |
| 2013 | | |
| | |
| | |
|
| Total profit from reportable segments | | $ | 6,338 |
| | $ | 990 |
| | $ | 7,328 |
|
| All Other operating segment | | 663 |
| | — |
| | 663 |
|
| Cost centers | | 119 |
| | — |
| | 119 |
|
| Corporate costs | | (1,442 | ) | | — |
| | (1,442 | ) |
| Timing | | 89 |
| | — |
| | 89 |
|
| Methodology differences: | | |
| | |
| |
|
|
| Inventory/cost of sales | | (112 | ) | | — |
| | (112 | ) |
| Postretirement benefit expense | | (685 | ) | | — |
| | (685 | ) |
| Financing costs | | (469 | ) | | — |
| | (469 | ) |
| Equity in (profit) loss of unconsolidated affiliated companies | | 6 |
| | — |
| | 6 |
|
| Currency | | (110 | ) | | — |
| | (110 | ) |
| Interest rate swap | | (1 | ) | | — |
| | (1 | ) |
| Other income/expense methodology differences | | (238 | ) | | — |
| | (238 | ) |
| Other methodology differences | | (50 | ) | | 30 |
| | (20 | ) |
| Total consolidated profit before taxes | | $ | 4,108 |
| | $ | 1,020 |
| | $ | 5,128 |
|
| | | | | | | |
| 2012 | | |
| | |
| | |
|
| Total profit from reportable segments | | $ | 9,541 |
| | $ | 763 |
| | $ | 10,304 |
|
| All Other operating segment | | 1,014 |
| | — |
| | 1,014 |
|
| Cost centers | | 17 |
| | — |
| | 17 |
|
| Corporate costs | | (1,517 | ) | | — |
| | (1,517 | ) |
| Timing | | (298 | ) | | — |
| | (298 | ) |
| Methodology differences: | | |
| | |
| | |
|
| Inventory/cost of sales | | 43 |
| | — |
| | 43 |
|
| Postretirement benefit expense | | (696 | ) | | — |
| | (696 | ) |
| Financing costs | | (474 | ) | | — |
| | (474 | ) |
| Equity in (profit) loss of unconsolidated affiliated companies | | (14 | ) | | — |
| | (14 | ) |
| Currency | | 108 |
| | — |
| | 108 |
|
| Interest rate swap | | 2 |
| | — |
| | 2 |
|
| Other income/expense methodology differences | | (251 | ) | | — |
| | (251 | ) |
| Other methodology differences | | (19 | ) | | 17 |
| | (2 | ) |
| Total consolidated profit before taxes | | $ | 7,456 |
| | $ | 780 |
| | $ | 8,236 |
|
| | | | | | | |
| 2011 | | |
| | |
| | |
|
| Total profit from reportable segments | | $ | 8,443 |
| | $ | 587 |
| | $ | 9,030 |
|
| All Other operating segment | | 837 |
| | — |
| | 837 |
|
| Cost centers | | 14 |
| | — |
| | 14 |
|
| Corporate costs | | (1,174 | ) | | — |
| | (1,174 | ) |
| Timing | | (203 | ) | | — |
| | (203 | ) |
| Methodology differences: | | |
| | |
| | |
|
| Inventory/cost of sales | | 21 |
| | — |
| | 21 |
|
| Postretirement benefit expense | | (670 | ) | | — |
| | (670 | ) |
| Financing costs | | (408 | ) | | — |
| | (408 | ) |
| Equity in (profit) loss of unconsolidated affiliated companies | | 24 |
| | — |
| | 24 |
|
| Currency | | (315 | ) | | — |
| | (315 | ) |
| Interest rate swap | | (149 | ) | | — |
| | (149 | ) |
| Other income/expense methodology differences | | (273 | ) | | — |
| | (273 | ) |
| Other methodology differences | | (42 | ) | | 33 |
| | (9 | ) |
| Total consolidated profit before taxes | | $ | 6,105 |
| | $ | 620 |
| | $ | 6,725 |
|
| | | | | | | |
|
| | | | | | | | | | | | | | | | |
| Reconciliation of Assets: | | | | | | | | |
| (Millions of dollars) | | Machinery and Power Systems | | Financial Products | | Consolidating Adjustments | | Consolidated Total |
| 2013 | | |
| | |
| | |
| | |
|
| Total assets from reportable segments | | $ | 28,122 |
| | $ | 36,980 |
| | $ | — |
| | $ | 65,102 |
|
| All Other operating segment | | 1,431 |
| | — |
| | — |
| | 1,431 |
|
| Items not included in segment assets: | | |
| | |
| | |
| | |
|
| Cash and short-term investments | | 4,597 |
| | — |
| | — |
| | 4,597 |
|
| Intercompany receivables | | 1,219 |
| | — |
| | (1,219 | ) | | — |
|
| Investment in Financial Products | | 4,798 |
| | — |
| | (4,798 | ) | | — |
|
| Deferred income taxes | | 2,541 |
| | — |
| | (525 | ) | | 2,016 |
|
| Goodwill and intangible assets | | 3,582 |
| | — |
| | — |
| | 3,582 |
|
| Property, plant and equipment – net and other assets | | 1,091 |
| | — |
| | — |
| | 1,091 |
|
| Operating lease methodology difference | | (290 | ) | | — |
| | — |
| | (290 | ) |
| Liabilities included in segment assets | | 10,372 |
| | — |
| | — |
| | 10,372 |
|
| Inventory methodology differences | | (2,539 | ) | | — |
| | — |
| | (2,539 | ) |
| Other | | (220 | ) | | (135 | ) | | (111 | ) | | (466 | ) |
| Total assets | | $ | 54,704 |
| | $ | 36,845 |
| | $ | (6,653 | ) | | $ | 84,896 |
|
| | | | | | | | | |
| 2012 | | |
| | |
| | |
| | |
|
| Total assets from reportable segments | | $ | 33,171 |
| | $ | 36,563 |
| | $ | — |
| | $ | 69,734 |
|
| All Other operating segment | | 1,499 |
| | — |
| | — |
| | 1,499 |
|
| Items not included in segment assets: | | |
| | |
| | |
| |
|
|
| Cash and short-term investments | | 3,306 |
| | — |
| | — |
| | 3,306 |
|
| Intercompany receivables | | 303 |
| | — |
| | (303 | ) | | — |
|
| Investment in Financial Products | | 4,433 |
| | — |
| | (4,433 | ) | | — |
|
| Deferred income taxes | | 3,926 |
| | — |
| | (516 | ) | | 3,410 |
|
| Goodwill and intangible assets | | 3,145 |
| | — |
| | — |
| | 3,145 |
|
| Property, plant and equipment – net and other assets | | 668 |
| | — |
| | — |
| | 668 |
|
| Operating lease methodology difference | | (329 | ) | | — |
| | — |
| | (329 | ) |
| Liabilities included in segment assets | | 10,907 |
| | — |
| | — |
| | 10,907 |
|
| Inventory methodology differences | | (2,949 | ) | | — |
| | — |
| | (2,949 | ) |
| Other | | (182 | ) | | (107 | ) | | (132 | ) | | (421 | ) |
| Total assets | | $ | 57,898 |
| | $ | 36,456 |
| | $ | (5,384 | ) | | $ | 88,970 |
|
| | | | | | | | | |
| 2011 | | |
| | |
| | |
| | |
|
| Total assets from reportable segments | | $ | 28,982 |
| | $ | 31,747 |
| | $ | — |
| | $ | 60,729 |
|
| All Other operating segment | | 2,035 |
| | — |
| | — |
| | 2,035 |
|
| Items not included in segment assets: | | |
| | |
| | |
| |
|
|
| Cash and short-term investments | | 1,829 |
| | — |
| | — |
| | 1,829 |
|
| Intercompany receivables | | 75 |
| | — |
| | (75 | ) | | — |
|
| Investment in Financial Products | | 4,035 |
| | — |
| | (4,035 | ) | | — |
|
| Deferred income taxes | | 4,109 |
| | — |
| | (533 | ) | | 3,576 |
|
| Goodwill and intangible assets | | 2,816 |
| | — |
| | — |
| | 2,816 |
|
| Property, plant and equipment – net and other assets | | 1,645 |
| | — |
| | — |
| | 1,645 |
|
| Operating lease methodology difference | | (511 | ) | | — |
| | — |
| | (511 | ) |
| Liabilities included in segment assets | | 11,860 |
| | — |
| | — |
| | 11,860 |
|
| Inventory methodology differences | | (2,786 | ) | | — |
| | — |
| | (2,786 | ) |
| Other | | 362 |
| | (194 | ) | | (143 | ) | | 25 |
|
| Total assets | | $ | 54,451 |
| | $ | 31,553 |
| | $ | (4,786 | ) | | $ | 81,218 |
|
| | | | | | | | | |
|
| | | | | | | | | | | | |
| Reconciliation of Depreciation and amortization: | | | | | | |
| (Millions of dollars) | | Machinery and Power Systems | | Financial Products | | Consolidated Total |
| 2013 | | |
| | |
| | |
|
| Total depreciation and amortization from reportable segments | | $ | 1,976 |
| | $ | 789 |
| | $ | 2,765 |
|
| Items not included in segment depreciation and amortization: | | |
| | |
| | |
|
| All Other operating segment | | 173 |
| | — |
| | 173 |
|
| Cost centers | | 140 |
| | — |
| | 140 |
|
| Other | | (16 | ) | | 25 |
| | 9 |
|
| Total depreciation and amortization | | $ | 2,273 |
| | $ | 814 |
| | $ | 3,087 |
|
| | | | | | | |
| 2012 | | |
| | |
| | |
|
| Total depreciation and amortization from reportable segments | | $ | 1,863 |
| | $ | 708 |
| | $ | 2,571 |
|
| Items not included in segment depreciation and amortization: | | |
| | |
| | |
|
| All Other operating segment | | 168 |
| | — |
| | 168 |
|
| Cost centers | | 89 |
| | — |
| | 89 |
|
| Other | | (38 | ) | | 23 |
| | (15 | ) |
| Total depreciation and amortization | | $ | 2,082 |
| | $ | 731 |
| | $ | 2,813 |
|
| | | | | | | |
| 2011 | | |
| | |
| | |
|
| Total depreciation and amortization from reportable segments | | $ | 1,533 |
| | $ | 710 |
| | $ | 2,243 |
|
| Items not included in segment depreciation and amortization: | | |
| | |
| | |
|
| All Other operating segment | | 172 |
| | — |
| | 172 |
|
| Cost centers | | 77 |
| | — |
| | 77 |
|
| Other | | 20 |
| | 15 |
| | 35 |
|
| Total depreciation and amortization | | $ | 1,802 |
| | $ | 725 |
| | $ | 2,527 |
|
| | | | | | | |
|
| | | | | | | | | | | | | | | | |
| Reconciliation of Capital expenditures: | | | | | | | | |
| (Millions of dollars) | | Machinery and Power Systems | | Financial Products | | Consolidating Adjustments | | Consolidated Total |
| 2013 | | |
| | |
| | |
| | |
|
| Total capital expenditures from reportable segments | | $ | 1,861 |
| | $ | 1,806 |
| | $ | — |
| | $ | 3,667 |
|
| Items not included in segment capital expenditures: | | |
| | |
| | |
| | |
|
| All Other operating segment | | 340 |
| | — |
| | — |
| | 340 |
|
| Cost centers | | 169 |
| | — |
| | — |
| | 169 |
|
| Timing | | 363 |
| | — |
| | — |
| | 363 |
|
| Other | | (128 | ) | | 105 |
| | (70 | ) | | (93 | ) |
| Total capital expenditures | | $ | 2,605 |
| | $ | 1,911 |
| | $ | (70 | ) | | $ | 4,446 |
|
| | | | | | | | | |
| 2012 | | |
| | |
| | |
| | |
|
| Total capital expenditures from reportable segments | | $ | 3,148 |
| | $ | 1,660 |
| | $ | — |
| | $ | 4,808 |
|
| Items not included in segment capital expenditures: | | |
| | |
| | |
| | |
|
| All Other operating segment | | 359 |
| | — |
| | — |
| | 359 |
|
| Cost centers | | 175 |
| | — |
| | — |
| | 175 |
|
| Timing | | (71 | ) | | — |
| | — |
| | (71 | ) |
| Other | | (176 | ) | | 136 |
| | (155 | ) | | (195 | ) |
| Total capital expenditures | | $ | 3,435 |
| | $ | 1,796 |
| | $ | (155 | ) | | $ | 5,076 |
|
| | | | | | | | | |
| 2011 | | |
| | |
| | |
| | |
|
| Total capital expenditures from reportable segments | | $ | 2,466 |
| | $ | 1,191 |
| | $ | — |
| | $ | 3,657 |
|
| Items not included in segment capital expenditures: | | |
| | |
| | |
| | |
|
| All Other operating segment | | 343 |
| | — |
| | — |
| | 343 |
|
| Cost centers | | 146 |
| | — |
| | — |
| | 146 |
|
| Timing | | (211 | ) | | — |
| | — |
| | (211 | ) |
| Other | | (98 | ) | | 163 |
| | (76 | ) | | (11 | ) |
| Total capital expenditures | | $ | 2,646 |
| | $ | 1,354 |
| | $ | (76 | ) | | $ | 3,924 |
|
| | | | | | | | | |
Enterprise-wide Disclosures:
Information about Geographic Areas:
|
| | | | | | | | | | | | | | | | | | | | | | | | | |
| | | | | | | | | Property, plant and equipment - net | |
| | | External sales and revenues 1 | | December 31, | |
| (Millions of dollars) | | 2013 | | 2012 | | 2011 | | 2013 | | 2012 | | 2011 | |
| Inside United States | | $ | 18,579 |
| | $ | 20,239 |
| | $ | 17,980 |
| | $ | 8,723 |
| | $ | 8,559 |
| | $ | 7,448 |
| |
| Outside United States | | 37,077 |
|
| 45,636 |
| 2 | 42,158 |
|
| 8,352 |
|
| 7,902 |
|
| 6,947 |
|
|
| Total | | $ | 55,656 |
| | $ | 65,875 |
| | $ | 60,138 |
| | $ | 17,075 |
| | $ | 16,461 |
| | $ | 14,395 |
| |
| |
1 | Sales of Machinery and Power Systems are based on dealer or customer location. Revenues from services provided are based on where service is rendered. |
| |
2 | The only country with greater than 10 percent of external sales and revenues for any of the periods presented, other than the United States, is Australia with $6,822 million as of December 31, 2012. |
Johan Walter Berg AB
In September 2013, we acquired 100 percent of the stock of Johan Walter Berg AB (Berg). Berg is a leading manufacturer of mechanically and electrically driven propulsion systems and marine controls for ships. Headquartered in Öckerö Islands, Sweden, Berg has designed and manufactured heavy-duty marine thrusters and controllable pitch propellers since 1929. Its proprietary systems are employed in maritime applications throughout the world that require precise maneuvering and positioning. With the acquisition, Caterpillar will transition from selling only engines and generators to providing complete marine propulsion package systems. The purchase price, net of $9 million of acquired cash, was approximately $166 million. The purchase price includes contingent consideration, payable in 2016, with a fair value of approximately $7 million. The contingent consideration will be based on the revenues achieved by Berg in the period from January 1, 2013 to December 31, 2015 and is capped at €30 million. The contingent consideration will be remeasured each reporting period at its estimated fair value with any adjustment included in Other operating (income) expenses in Statement 1.
The transaction was financed with available cash. Tangible assets as of the acquisition date were $82 million, recorded at their fair values, and primarily included cash of $9 million, receivables of $13 million, inventories of $32 million and property, plant and equipment of $28 million. Finite-lived intangible assets acquired of $70 million included developed technology, customer relationships, and trade names. The finite lived intangible assets are being amortized on a straight-line basis over a weighted-average amortization period of approximately 11 years. Liabilities assumed as of the acquisition date were $83 million, recorded at their fair values, and primarily included accounts payable of $19 million, customer advances of $31 million and net deferred tax liabilities of $15 million. Goodwill of $106 million, non-deductible for income tax purposes, represented the excess of the consideration transferred over the net assets recognized and represented the estimated future economic benefits arising from other assets acquired that could not be individually identified and separately recognized. Factors that contributed to a purchase price resulting in the recognition of goodwill include Berg’s strategic fit into our product portfolio, the opportunity to provide worldwide support to marine operators for a complete, optimized propulsion package, and the acquired assembled workforce. These values represent a preliminary allocation of purchase price subject to finalization of post-closing procedures. The results of the acquired business for the period from the acquisition date are included in the accompanying consolidated financial statements and are reported in the Power Systems segment in Note 23. Assuming this transaction had been made at the beginning of any period presented, the consolidated pro forma results would not be materially different from reported results.
Black Horse Joint Venture
In December 2012, Caterpillar and Ariel Corporation (Ariel) contributed $70 million each to obtain a 50 percent equity interest in a newly formed company, Black Horse LLC (Black Horse). Immediately upon formation, Black Horse acquired ProSource, a pump manufacturer headquartered in Houston, Texas. The acquisition of ProSource, which designs and manufactures reciprocating pressure pumps, enables Black Horse to serve the well service market. Black Horse will leverage Caterpillar and Ariel engineering and manufacturing expertise to expand ProSource's existing product line to better serve global oil and gas customers. Frac pumps sold through the combined venture will be branded and sold under the Caterpillar name and will be distributed through the Caterpillar dealer network. Our investment in Black Horse, accounted for by the equity method, is included in Investments in unconsolidated affiliated companies in Statement 3.
ERA Mining Machinery Limited (Siwei)
During the second quarter of 2012, Caterpillar, through its wholly-owned subsidiary Caterpillar (Luxembourg) Investment Co. S.A. (CAT Lux), completed a tender offer to acquire the issued shares of ERA Mining Machinery Limited (Siwei), including its wholly-owned subsidiary Zhengzhou Siwei Mechanical Manufacturing Co., Ltd. In the fourth quarter of 2013, Siwei was renamed Caterpillar (Zhengzhou) Ltd. Substantially all of the issued shares of Siwei, a public company listed on the Hong Kong Exchange, were acquired at the end of May 2012. In October 2012, the remaining shares of Siwei common stock were acquired for approximately $7 million in cash. Siwei primarily designs, manufactures, sells and supports underground coal mining equipment in mainland China and is known for its expertise in manufacturing mining roof support equipment. The acquisition supports Caterpillar's long-term commitment to invest in China in order to support our growing base of Chinese customers and will further expand our underground mining business both inside and outside of China.
The tender offer allowed Siwei shareholders to choose between two types of consideration in exchange for their shares. The alternatives were either cash consideration of HK$0.88 or a HK$1.00 loan note issued by CAT Lux to the former shareholders of Siwei that provided, subject to its terms, for the holder to receive on redemption a minimum of HK$0.75 up to a maximum of HK$1.15 depending on Siwei's consolidated gross profit for 2012 and 2013. Approximately 4 billion Siwei shares were
tendered for the cash alternative and approximately 1.6 billion Siwei shares were tendered for the loan note alternative. The purchase price of approximately $677 million was comprised of net cash paid of approximately $444 million ($475 million in cash paid for shares and to cancel share options less cash acquired of $31 million), the fair value of the loan notes of $152 million, approximately $168 million of assumed third-party short term borrowings and notes payable, a loan and interest payable to Caterpillar from Siwei of $51 million, less restricted cash acquired of approximately $138 million. The noncontrolling interest for the outstanding shares not tendered was approximately $7 million.
The transaction was financed with available cash and included the issuance of loan notes to certain former shareholders of Siwei, which had a debt component and a portion that was contingent consideration. The $152 million fair value represented the minimum redemption amount of the debt component payable in April 2013.
Tangible assets as of the acquisition date and after giving effect to the adjustments described below were $598 million, recorded at their fair values, and primarily included cash of $31 million, restricted cash of $138 million, receivables of $184 million, inventories of $77 million and property, plant and equipment of $94 million. Finite-lived intangible assets acquired of $112 million were primarily related to customer relationships and also included trade names. The finite-lived intangible assets are being amortized on a straight-line basis over a weighted average amortization period of approximately 14 years. Liabilities assumed as of the acquisition date and after giving effect to the adjustments described below were $626 million, recorded at their fair values, and primarily included accounts payable of $352 million, third-party short term borrowings and notes payable of $168 million and accrued expenses of $37 million. Additionally, deferred tax liabilities were $25 million. Goodwill of $625 million, substantially all of which is non-deductible for income tax purposes, represented the excess of the consideration transferred over the net assets recognized and represented the estimated future economic benefits arising from other assets acquired that could not be individually identified and separately recognized. Goodwill will not be amortized, but will be tested for impairment at least annually. Factors that contributed to a purchase price resulting in the recognition of goodwill include expected cost savings primarily from increased purchasing power for raw materials, improved working capital management, expanded underground mining equipment sales opportunities in China and internationally, along with the acquired assembled workforce. The results of the acquired business for the period from the acquisition date are included in the accompanying consolidated financial statements and are reported in the Resource Industries segment in Note 23. Assuming this transaction had been made at the beginning of any period presented, the consolidated pro forma results would not be materially different from reported results.
In November 2012, Caterpillar became aware of inventory accounting discrepancies at Siwei which led to an internal investigation. Caterpillar's investigation determined that Siwei had engaged in accounting misconduct prior to Caterpillar's acquisition of Siwei in mid-2012. The accounting misconduct included inappropriate accounting practices involving improper cost allocation that resulted in overstated profit and improper revenue recognition practices involving early and, at times unsupported, revenue recognition. Due to the identified accounting misconduct that occurred before the acquisition, measurement period adjustments were made to the fair value of the acquired assets and assumed liabilities during the fourth quarter of 2012. The fair values presented above are a final allocation of the purchase price and reflect these changes, which are primarily comprised of a decrease in finite-lived intangible assets of $82 million, a decrease in receivables of $29 million, a decrease in inventory of $17 million and a net increase in liabilities of $23 million, resulting in an increase in goodwill of $149 million.
Because of the accounting misconduct identified in the fourth quarter of 2012, Siwei's goodwill was tested for impairment as of November 30, 2012. We determined the carrying value of Siwei, which is a separate reporting unit, exceeded its fair value at the measurement date, requiring step two in the impairment test process. The fair value of the Siwei reporting unit was determined primarily using an income approach based on the present value of discounted cash flows. We assigned the fair value to the reporting unit's assets and liabilities and determined the implied fair value of goodwill was substantially below the carrying value of the reporting unit's goodwill. Accordingly, we recognized a $580 million goodwill impairment charge, which resulted in goodwill of approximately $45 million remaining for Siwei. The goodwill impairment was a result of changes in the assumptions used to determine the fair value resulting from the accounting misconduct that occurred before the acquisition. There was no tax benefit associated with this impairment charge. The Siwei goodwill impairment charge was reported in the fourth quarter of 2012 in the Resource Industries segment.
In May 2013, Caterpillar and its wholly-owned subsidiaries CAT Lux and Siwei entered into a settlement agreement with two former directors of Siwei and two other parties with an interest in the settlement, including Mining Machinery Limited (MML). The agreement settles the dispute between the parties which arose from Caterpillar's determination that Siwei senior managers had engaged in accounting misconduct for several years prior to Caterpillar's announcement of the completion of its tender offer for Siwei in the second quarter of 2012.
Under the terms of the settlement agreement, the parties agreed that (i) the loan notes issued by CAT Lux (and guaranteed by Caterpillar) as a portion of the Siwei purchase price and held by MML and (ii) loans made by the two former Siwei directors to Siwei prior to its acquisition by Caterpillar would all be canceled and discharged in exchange for payments by CAT Lux to MML and the two former directors in an aggregate amount of approximately $30 million. As of the settlement in May 2013, the loan notes had a book value of approximately $152 million and the obligation related to the loans by the two former directors was approximately $13 million. The settlement agreement contains a mutual release and discharge of the parties' respective claims with respect to the dispute and contains an agreement by Caterpillar and CAT Lux not to pursue any such claims against either the auditors or former directors of Siwei. The settlement and discharge of the loan obligations resulted in the recognition of a gain of approximately $135 million reported in Other operating (income) expenses in Statement 1 and is included in the Resource Industries segment.
Caterpillar Tohoku Ltd.
In March 2012, we acquired 100 percent of the stock of Caterpillar Tohoku Ltd. (Cat Tohoku). Cat Tohoku was an independently owned and operated dealership providing sales, rental, service and after market support for Caterpillar machines and engines in the northeastern part of Japan. The purchase price, net of $18 million of acquired cash, was approximately $206 million. The purchase price included the assumption of $77 million in third-party debt, as well as $64 million net trade payables due to Caterpillar. We paid approximately $59 million at closing, $22 million in July 2012, and $3 million in March 2013. The acquisition of Cat Tohoku supports Caterpillar's efforts to restructure its distribution network in Japan.
The transaction was financed with available cash. Tangible assets as of the acquisition date were $252 million and primarily included cash of $18 million, receivables of $34 million, inventory of $26 million, and property, plant and equipment of $157 million. Finite-lived intangible assets acquired were $8 million. Liabilities assumed as of the acquisition date were $135 million, recorded at their fair values, and primarily included debt of $77 million and accounts payable of $39 million. Goodwill of $22 million, which is deductible for income tax purposes, represents the excess of cost over the fair value of net tangible assets acquired. The results of the acquired business for the period from the acquisition date are included in the accompanying consolidated financial statements and are reported in the Construction Industries segment in Note 23. Assuming this transaction had been made at the beginning of any period presented, the consolidated pro forma results would not be materially different from reported results.
MWM Holding GmbH (MWM)
On October 31, 2011, we acquired 100 percent of the equity in privately held MWM Holding GmbH (MWM). Headquartered in Mannheim, Germany, MWM is a global supplier of sustainable, natural gas and alternative-fuel engines. With the acquisition of MWM, Caterpillar expects to expand customer options for sustainable power generation solutions. The purchase price, net of $94 million of acquired cash, was approximately $774 million (€574 million).
The transaction was financed with available cash. Tangible assets as of the acquisition date were $535 million, recorded at their fair values, and primarily included cash of $94 million, receivables of $96 million, inventories of $205 million and property, plant and equipment of $108 million. Finite-lived intangible assets acquired of $221 million were primarily related to customer relationships and also included intellectual property and trade names. The finite lived intangible assets are being amortized on a straight-line basis over a weighted average amortization period of approximately 10 years. Liabilities assumed as of the acquisition date were $284 million, recorded at their fair values, and primarily included accounts payable of $77 million, net deferred tax liabilities of $67 million and advance payments of $43 million. Goodwill of $396 million, approximately $90 million of which is deductible for income tax purposes, represents the excess of cost over the fair value of the net tangible and intangible assets acquired. Factors that contributed to a purchase price resulting in the recognition of goodwill include MWM’s strategic fit into our product and services portfolio, aftermarket support opportunities and the acquired assembled workforce. The results of the acquired business for the period from the acquisition date are included in the accompanying consolidated financial statements and are reported in the Power Systems segment in Note 23. Assuming this transaction had been made at the beginning of any period presented, the consolidated pro forma results would not be materially different from reported results.
Pyroban Group Limited
In August 2011, we acquired 100 percent of the stock of Pyroban Group Limited (Pyroban) for approximately $69 million. Pyroban is a leading provider of explosion protection safety solutions to the oil, gas, industrial and material handling markets headquartered in the United Kingdom with additional locations in the Netherlands, France, Singapore and China. We expect this acquisition will allow us to grow our existing position in the oil and gas industry and provide further differentiation versus competition.
The transaction was financed with available cash. As of the acquisition date, net tangible assets acquired and liabilities assumed of $5 million were recorded at their fair values. Finite-lived intangible assets acquired of $41 million included customer relationships and trademarks are being amortized on a straight-line basis over a weighted-average amortization period of approximately 15 years. Goodwill of $23 million, non-deductible for income tax purposes, represents the excess of cost over the fair value of net tangible and finite-lived intangible assets acquired. The results of the acquired business for the period from the acquisition date are included in the accompanying consolidated financial statements and reported in the Power Systems segment in Note 23. Assuming this transaction had been made at the beginning of any period presented, the consolidated pro forma results would not be materially different from reported results.
Bucyrus International, Inc.
On July 8, 2011, we completed our acquisition of Bucyrus International, Inc. (Bucyrus). Bucyrus is a designer, manufacturer and marketer of mining equipment for the surface and underground mining industries. The total purchase price was approximately $8.8 billion, consisting of $7.4 billion for the purchase of all outstanding shares of Bucyrus common stock at $92 per share and $1.6 billion of assumed Bucyrus debt, substantially all of which was repaid subsequent to closing, net of $0.2 billion of acquired cash.
We funded the acquisition using available cash, commercial paper borrowings and approximately $4.5 billion of long-term debt issued in May 2011. On May 24, 2011, we issued $500 million of Floating Rate Senior Notes (Three-month USD LIBOR plus 0.10%) due in 2012 and $750 million of Floating Rate Senior Notes (Three-month USD LIBOR plus 0.17%) due in 2013. The interest rates for the Floating Rate Senior Notes will be reset quarterly. We also issued $750 million of 1.375% Senior Notes due in 2014, $1.25 billion of 3.900% Senior Notes due in 2021, and $1.25 billion of 5.200% Senior Notes due in 2041. The Notes are unsecured obligations of Caterpillar and rank equally with all other senior unsecured indebtedness.
In December 2011 and continuing in 2012 and 2013, we completed divestitures of portions of the Bucyrus distribution business. The following disclosures do not reflect the impact of these divestitures (see Note 26 for additional discussion).
Bucyrus contributed the following to sales and to profit before taxes (inclusive of deal-related and integration costs):
|
| | | | |
| (Millions of dollars) | | July 8, 2011 to December 31, 2011 |
| Sales | | $ | 2,524 |
|
| Profit (loss) before taxes | | $ | (403 | ) |
| | | |
The results of the acquired business for the period from the acquisition date are included in the accompanying consolidated financial statements and are reported in the Resource Industries segment in Note 23. For the year ended December 31, 2011, we recorded $373 million in costs related to the acquisition of Bucyrus. These acquisition related costs included consulting, legal and advisory fees, severance costs and financing costs.
During the three months ended December 31, 2011, we adjusted the initial allocation of the purchase price which reduced goodwill by $647 million, the net result of purchase accounting adjustments to the fair value of acquired assets and assumed liabilities. During 2012, we finalized the allocation of the purchase price to identifiable assets and liabilities, reducing the amount allocated to goodwill from our December 31, 2011 preliminary allocation by an additional $28 million. These adjustments primarily included a reduction to goodwill to reflect the tax consequences of the expected reversal of differences in the U.S. GAAP and tax basis of assets and liabilities.
The following table summarizes our initial and final allocation of the assets acquired and liabilities assumed as of the acquisition date at estimated fair value.
|
| | | | | | | | |
| | | July 8, 2011 |
| (Millions of dollars) | | Initial | | Final |
| Assets | | |
| | |
|
| Cash | | $ | 203 |
| | $ | 204 |
|
| Receivables - trade and other | | 693 |
| | 705 |
|
| Prepaid expenses | | 154 |
| | 174 |
|
| Inventories | | 2,305 |
| | 2,223 |
|
| Property, plant and equipment - net | | 692 |
| | 694 |
|
| Intangible assets | | 3,901 |
| | 3,901 |
|
| Goodwill | | 5,263 |
| | 4,588 |
|
| Other assets | | 48 |
| | 141 |
|
| Liabilities | | |
| | |
|
| Short-term borrowings | | 24 |
| | 24 |
|
| Long-term debt due within one year | | 16 |
| | 16 |
|
| Accounts payable | | 444 |
| | 465 |
|
| Accrued expenses | | 405 |
| | 433 |
|
| Customer advances | | 668 |
| | 668 |
|
| Other current liabilities | | 426 |
| | 76 |
|
| Long-term debt due after one year | | 1,514 |
| | 1,528 |
|
| Noncurrent deferred income tax liabilities | | 1,874 |
| | 1,449 |
|
| Other liabilities | | 434 |
| | 517 |
|
| Net assets acquired | | $ | 7,454 |
| | $ | 7,454 |
|
| | | | | |
The following table is a summary of the fair value estimates of the acquired identifiable intangible assets and weighted–average useful lives. These intangible assets recorded as a result of the acquisition are being amortized on a straight-line basis over their respective weighted-average useful life.
|
| | | | | | |
| (Millions of dollars) | | | | |
| | | Fair Value | | Weighted-average
useful life (in years) |
| Customer relationships | | $ | 2,337 |
| | 15 |
| Intellectual property | | 1,489 |
| | 12 |
| Other | | 75 |
| | 4 |
| Total | | $ | 3,901 |
| | 14 |
| | | | | |
Goodwill in the amount of $4,588 million was recorded for the acquisition of Bucyrus. Goodwill is calculated as the excess of the consideration transferred over the net assets recognized and represents the estimated future economic benefits arising from other assets acquired that could not be individually identified and separately recognized. Goodwill will not be amortized, but will be tested for impairment at least annually. Approximately $500 million of the goodwill is deductible for tax purposes. Goodwill largely consists of expected synergies resulting from the acquisition. Key areas of expected cost savings include elimination of redundant selling, general and administrative expenses and increased purchasing power for raw materials and supplies. We also anticipate the acquisition will produce growth synergies as a result of the combined businesses’ broader product portfolio in the mining industry.
A single estimate of fair value results from a complex series of judgments about future events and uncertainties and relies heavily on estimates and assumptions. The judgments used to determine the estimated fair value assigned to each class of assets acquired and liabilities assumed, as well as asset lives, can materially impact our results of operations.
The unaudited pro forma results presented below include the effects of the Bucyrus acquisition as if it had occurred as of January 1, 2010. The unaudited pro forma results reflect certain adjustments related to the acquisition, such as the amortization
associated with estimates for the acquired intangible assets, fair value adjustments for inventory, contracts and the impact of acquisition financing. The 2011 supplemental pro forma earnings excluded $373 million of acquisition related costs, including consulting, legal and advisory fees, severance costs and financing expense prior to debt issuance. Also, the 2011 supplemental pro forma earnings were adjusted to exclude $303 million of nonrecurring expense related to the fair value adjustment to acquisition-date inventory and $25 million acceleration of Bucyrus stock compensation expense.
The pro forma results do not include any anticipated synergies or other expected benefits of the acquisition. Accordingly, the unaudited pro forma financial information below is not necessarily indicative of either future results of operations or results that might have been achieved had the acquisition been completed on the dates indicated.
|
| | | | | |
| | | |
| (Dollars in millions except per share data) | | Year Ended December 31, 2011 | |
| Total Sales and revenues | | $ | 62,281 |
| |
| Profit | | $ | 5,401 |
| |
| Profit per common share | | $ | 8.37 |
| |
| Profit per common share – diluted | | $ | 8.11 |
| |
Balfour Beatty’s Trackwork Business
In May 2011, we acquired 100 percent of the assets and certain liabilities of the United Kingdom trackwork business from Balfour Beatty Rail Limited for approximately $60 million. The trackwork division specializes in the design and manufacture of special trackwork and associated products for the United Kingdom and international rail markets. The acquisition supports our strategic initiative to expand the scope and product range of our rail business.
The transaction was financed with available cash. Tangible assets as of the acquisition date were $82 million, recorded at their fair values, and included receivables of $18 million, inventory of $12 million, and property, plant and equipment of $52 million. Liabilities assumed as of the acquisition date were $22 million, recorded at their fair values, and primarily included accounts payable of $10 million and accrued expenses of $10 million. The results of the acquired business for the period from the acquisition date are included in the accompanying consolidated financial statements and are reported in the Power Systems segment in Note 23. Assuming this transaction had been made at the beginning of any period presented, the consolidated pro forma results would not be materially different from reported results.
| |
| 25. | Redeemable Noncontrolling Interest – Caterpillar Japan Ltd. |
On August 1, 2008, Shin Caterpillar Mitsubishi Ltd. (SCM) completed the first phase of a share redemption plan whereby SCM redeemed half of Mitsubishi Heavy Industries' (MHI’s) shares in SCM. This resulted in Caterpillar owning 67 percent of the outstanding shares of SCM and MHI owning the remaining 33 percent. As part of the share redemption, SCM was renamed Caterpillar Japan Ltd. (Cat Japan) and we consolidated its financial statements. On April 2, 2012, we redeemed the remaining 33 percent interest at its carrying amount, resulting in Caterpillar becoming the sole owner of Cat Japan. Caterpillar paid $444 million (36.5 billion Japanese Yen) to acquire the remaining equity interest held in Cat Japan by MHI.
| |
| 26. | Divestitures and Assets held for sale |
Bucyrus Distribution Business Divestitures
In conjunction with our acquisition of Bucyrus in July 2011, we announced our intention to sell the Bucyrus distribution business to Caterpillar dealers that support mining customers around the world in a series of individual transactions. Bucyrus predominantly employed a direct to end customer model to sell and support products. The intention is for all Bucyrus products to be sold and serviced by Caterpillar dealers, consistent with our long-held distribution strategy. These transitions are occurring in phases based on the mining business opportunity within each dealer territory.
As portions of the Bucyrus distribution business are sold or classified as held for sale, they will not qualify as discontinued operations because Caterpillar expects significant continuing direct cash flows from the Caterpillar dealers after the divestitures. The gain or loss on disposal, along with the continuing operations of these disposal groups, will be reported in the Resource Industries segment. Goodwill will be allocated to each disposal group using the relative fair value method. The value of the customer relationship intangibles related to each portion of the Bucyrus distribution business to be sold will be
included in the disposal groups. The disposal groups will be recorded at the lower of their carrying value or fair value less cost to sell. In 2013 and 2012, we recorded asset impairment charges of $11 million and $27 million respectively, related to disposal groups being sold to Caterpillar dealers. Fair value was determined based upon the negotiated sales price. The impairments were recorded in Other operating (income) expenses and included in the Resource Industries segment. The portions of the distribution business that were sold were not material to our results of operations, financial position or cash flow.
In 2013, we completed 19 sale transactions whereby we sold portions of the Bucyrus distribution business to Caterpillar dealers for an aggregate price of $466 million. A portion of these transactions are subject to certain working capital adjustments. For the full year 2013, after-tax profit was unfavorably impacted by $39 million as a result of the Bucyrus distribution divestiture activities. This is comprised of $95 million of income related to sales transactions, a $34 million unfavorable adjustment due to a change in estimate to increase the reserve for parts returns related to prior sale transactions (both included in Other operating (income) expenses), costs incurred related to the Bucyrus distribution divestiture activities of $104 million (included in Selling, general and administrative expenses) and an income tax benefit of $4 million.
Assets sold in 2013 included customer relationship intangibles of $127 million, other assets of $65 million, which consisted primarily of inventory and fixed assets, and allocated goodwill of $56 million related to the divested portions of the Bucyrus distribution business.
As part of the 2013 divestitures, Cat Financial provided $132 million of financing to five of the Caterpillar dealers.
In 2012, we completed 12 sale transactions whereby we sold portions of the Bucyrus distribution business to Caterpillar dealers for an aggregate price of $1,443 million, which included $38 million of working capital adjustments paid throughout 2013. For the full year 2012, after-tax profit was unfavorably impacted by $28 million as a result of the Bucyrus distribution divestiture activities. This is comprised of $310 million of income (included in Other operating (income) expenses) related to sales transactions, offset by costs incurred related to the Bucyrus distribution divestiture activities of $177 million (included in Selling, general and administrative expenses) and income tax of $161 million.
Assets sold in 2012 included customer relationship intangibles of $256 million, other assets of $254 million, which consisted primarily of inventory and fixed assets, and allocated goodwill of $405 million related to the divested portions of the Bucyrus distribution business.
As part of the 2012 divestitures, Cat Financial provided $739 million of financing to five of the Caterpillar dealers.
In December 2011, we completed one sale transaction whereby we sold a portion of the Bucyrus distribution business to a Caterpillar dealer for $337 million, which includes a $23 million working capital adjustment paid in the third quarter of 2012. After-tax profit was favorably impacted by $9 million in 2011 as a result of the Bucyrus distribution business divestiture activities. This is comprised of $96 million of income (included in Other operating (income) expenses) primarily related to the sale transaction, offset by costs incurred related to the Bucyrus distribution business divestiture activities of $32 million (included in Selling, general and administrative expenses) and income tax of $55 million. Assets sold included customer relationship intangibles of $63 million, other assets of $53 million, which consisted primarily of inventory and fixed assets, and allocated goodwill of $101 million.
As of December 31, 2013, ten divestiture transactions were classified as held for sale and are expected to close in 2014. Current assets held for sale were included in Prepaid expenses and other current assets and non-current assets held for sale were included in Other assets in Statement 3.
The major classes of assets held for sale for a portion of the Bucyrus distribution business were as follows:
|
| | | | | | | | | | | |
| | December 31, |
| (Millions of dollars) | 2013 | | 2012 | | 2011 |
| Receivables – trade and other | $ | — |
| | $ | — |
| | $ | 25 |
|
| Inventories | 14 |
| | 30 |
| | 109 |
|
| Current assets held for sale | $ | 14 |
| | $ | 30 |
| | $ | 134 |
|
| | | | |
| | |
|
| Property, plant and equipment – net | $ | 5 |
| | $ | — |
| | $ | 28 |
|
| Intangible assets | 44 |
| | 32 |
| | 186 |
|
| Goodwill | 45 |
| | 52 |
| | 296 |
|
| Non-current assets held for sale | $ | 94 |
| | $ | 84 |
| | $ | 510 |
|
| | | | | | |
Third Party Logistics Business Divestiture
On July 31, 2012, Platinum Equity acquired a 65 percent equity interest in Caterpillar Logistics Services LLC, the third party logistics division of our wholly owned subsidiary, Caterpillar Logistics Inc., for $567 million subject to certain working capital adjustments. The purchase price of $567 million was comprised of a $107 million equity contribution from Platinum Equity to, and third party debt raised by, Caterpillar Logistics Services LLC. The sale of the third party logistics business supports Caterpillar's increased focus on the continuing growth opportunities in its core businesses. Under the terms of the agreement, Caterpillar retained a 35 percent equity interest.
As a result of the divestiture, we recorded a pretax gain of $278 million (included in Other operating (income) expenses). In addition, we recognized $8 million of incremental incentive compensation expense. The fair value of our retained noncontrolling interest was $58 million, as determined by the $107 million equity contribution from Platinum Equity, and was included in Investments in unconsolidated affiliated companies in Statement 3. The disposal did not qualify as discontinued operations because Caterpillar has significant continuing involvement through its noncontrolling interest. The financial impact of the disposal was reported in the All Other operating segment. Results for our remaining interest will be recorded in Equity in profit (loss) of unconsolidated affiliated companies and are reported in the All Other operating segment.
The controlling financial interest in Caterpillar Logistics Services LLC was not material to our results of operations, financial position or cash flow.
Carter Machinery
In March 2011, we sold 100 percent of the equity in Carter Machinery Company Inc. for $364 million. Carter Machinery is a Caterpillar dealership headquartered in Salem, Virginia, and has operations and stores covering Virginia and nine counties in southeast West Virginia. The current senior management of Carter Machinery, which led the buy-out of Carter Machinery from Caterpillar, remained in place. A retired Caterpillar Vice President is now CEO and principal owner of Carter Machinery. Caterpillar had owned Carter Machinery since 1988. Carter Machinery was the only dealership in the United States that was not independently owned. Continued Caterpillar ownership did not align with our comprehensive business strategy, resulting in the sale.
As part of the divestiture, Cat Financial provided $348 million of financing to the buyer. The loan is included in Receivables – finance and Long-term receivables – finance in Statement 3. We recorded a pre-tax gain of $24 million included in Other operating (income) expenses in Statement 1 and was reported in the All Other operating segment. The sale did not qualify as discontinued operations because Caterpillar has significant continuing direct cash flows with Carter Machinery after the divestiture. The sale of Carter Machinery was not material to our results of operations, financial position or cash flow.
Restructuring costs for 2013, 2012, and 2011 were $200 million, $94 million and $112 million, respectively, and were recognized in Other operating (income) expenses in Statement 1. The 2013 restructuring costs included $151 million of employee separation costs, $41 million of fixed asset impairments and $8 million of other restructuring costs. The 2012 and 2011 costs were for employee separations.
The most significant charges in 2013 were for the restructuring of management and support functions and the closure or downsizing of several facilities related to our mining business which is included in the Resource Industries segment. The
separation charges in 2012 were primarily in the Power Systems segment and were related to the closure of the Electro-Motive Diesel facility located in London, Ontario and separation programs in Europe. The separation charges in 2011 were primarily in the Resource Industries segment and were related to the acquisition of Bucyrus.
Our accounting for separations was dependent upon how the particular program was designed. For voluntary programs, eligible separation costs were recognized at the time of employee acceptance. For involuntary programs, eligible costs were recognized when management had approved the program, the affected employees had been properly notified and the costs were estimable.
The following table summarizes the 2011, 2012 and 2013 employee separation activity:
|
| | | |
| (Millions of dollars) | Total |
| Liability balance at December 31, 2010 | $ | 22 |
|
| Increase in liability (separation charges) | 112 |
|
| Reduction in liability (payments and other adjustments) | (44 | ) |
| Liability balance at December 31, 2011 | $ | 90 |
|
| Increase in liability (separation charges) | 94 |
|
| Reduction in liability (payments and other adjustments) | (155 | ) |
| Liability balance at December 31, 2012 | $ | 29 |
|
| Increase in liability (separation charges) | 151 |
|
| Reduction in liability (payments and other adjustments) | (91 | ) |
| Liability balance at December 31, 2013 | $ | 89 |
|
| | |
The remaining liability balance as of December 31, 2013 represents costs for employees that have either not yet separated from the Company or their full severance has not yet been paid. The majority of these remaining costs are expected to be paid in 2014.
In December 2013, we announced a restructuring plan for our Gosselies, Belgium facility. This restructuring plan is designed to improve the competitiveness of our European manufacturing footprint and achieve competitiveness in our European operations by refocusing our current Gosselies operations on final machine assembly, test and paint with limited component and fabrication operations. These actions will include reshaping our supply base for more efficient sourcing, improving factory efficiencies and workforce reductions. Our proposals were subject to Belgian Ministerial approval. We estimate the employee cash separation costs to be about $300 million before tax, which represents substantially all of the restructuring costs to be incurred under the plan. In February 2014, our proposals were approved by the Belgian Minister of Employment and we expect to recognize substantially all of these separation-related charges throughout 2014.
| |
| 28. | Selected quarterly financial results (unaudited) |
|
| | | | | | | | | | | | | | | | |
| | | | | | | | | |
| | | 2013 Quarter 3 |
| (Dollars in millions except per share data) | | 1st | | 2nd | | 3rd | | 4th |
| Sales and revenues | | $ | 13,210 |
| | $ | 14,621 |
| | $ | 13,423 |
| | $ | 14,402 |
|
| Less: Revenues | | (726 | ) | | (735 | ) | | (745 | ) | | (756 | ) |
| Sales | | 12,484 |
| | 13,886 |
| | 12,678 |
| | 13,646 |
|
| Cost of goods sold | | 9,639 |
| | 10,773 |
| | 9,774 |
| | 10,541 |
|
| Gross margin | | 2,845 |
| | 3,113 |
| | 2,904 |
| | 3,105 |
|
Profit 1 | | $ | 880 |
| | $ | 960 |
| | $ | 946 |
| | $ | 1,003 |
|
| Profit per common share | | $ | 1.34 |
| | $ | 1.48 |
| | $ | 1.48 |
| | $ | 1.57 |
|
Profit per common share–diluted 2 | | $ | 1.31 |
| | $ | 1.45 |
| | $ | 1.45 |
| | $ | 1.54 |
|
| | | | | | | | | |
| | | 2012 Quarter 3 |
| | | 1st | | 2nd | | 3rd | | 4th |
| Sales and revenues | | $ | 15,981 |
| | $ | 17,374 |
| | $ | 16,445 |
| | $ | 16,075 |
|
| Less: Revenues | | (693 | ) | | (690 | ) | | (706 | ) | | (718 | ) |
| Sales | | 15,288 |
| | 16,684 |
| | 15,739 |
| | 15,357 |
|
| Cost of goods sold | | 11,237 |
| | 12,280 |
| | 11,639 |
| | 11,899 |
|
| Gross margin | | 4,051 |
| | 4,404 |
| | 4,100 |
| | 3,458 |
|
Profit 1, 4 | | $ | 1,586 |
| | $ | 1,699 |
| | $ | 1,699 |
| | $ | 697 |
|
Profit per common share 4 | | $ | 2.44 |
| | $ | 2.60 |
| | $ | 2.60 |
| | $ | 1.07 |
|
Profit per common share–diluted 2, 4 | | $ | 2.37 |
| | $ | 2.54 |
| | $ | 2.54 |
| | $ | 1.04 |
|
| |
1 | Profit attributable to common stockholders. |
| |
2 | Diluted by assumed exercise of stock-based compensation awards using the treasury stock method. |
| |
3 | See Note 24 - Acquisitions and Note 26 - Divestitures and Assets held for sale for additional information. |
| |
4 | The fourth quarter 2012 includes a goodwill impairment charge related to Siwei of $580 million. |
In January 2014, we completed the current $7.5 billion stock repurchase program as we entered into a definitive agreement with Citibank, N.A. to purchase shares of our common stock under an accelerated stock repurchase transaction (January ASR Agreement). Pursuant to the terms of the January ASR Agreement, we have agreed to repurchase approximately $1.7 billion of our common stock from Citibank, N.A., with an immediate delivery of approximately 17.7 million shares. The final number of shares to be repurchased and the aggregate cost to Caterpillar will be based on Caterpillar's volume-weighted average stock price during the term of the transaction, which is expected to be completed in March 2014.
In addition, in January 2014, the Board authorized the repurchase of $10 billion of Caterpillar stock, which will expire on December 31, 2018.
|
| | | | | | | | | | | | | | | | | | | | |
| Five-year Financial Summary | | | | | | | | | | |
| (Dollars in millions except per share data) | | | | | | | | | | |
| | | 2013 | | 2012 | | 2011 | | 2010 | | 2009 |
| Years ended December 31, | | |
| | |
| | |
| | |
| | |
|
| Sales and revenues | | $ | 55,656 |
| | $ | 65,875 |
| | $ | 60,138 |
| | $ | 42,588 |
| | $ | 32,396 |
|
| Percent inside the United States | | 33 | % | | 31 | % | | 30 | % | | 32 | % | | 31 | % |
| Percent outside the United States | | 67 | % | | 69 | % | | 70 | % | | 68 | % | | 69 | % |
| Sales | | $ | 52,694 |
| | $ | 63,068 |
| | $ | 57,392 |
| | $ | 39,867 |
| | $ | 29,540 |
|
| Revenues | | $ | 2,962 |
| | $ | 2,807 |
| | $ | 2,746 |
| | $ | 2,721 |
| | $ | 2,856 |
|
Profit 4 | | $ | 3,789 |
| | $ | 5,681 |
| | $ | 4,928 |
| | $ | 2,700 |
| | $ | 895 |
|
Profit per common share 1 | | $ | 5.87 |
| | $ | 8.71 |
| | $ | 7.64 |
| | $ | 4.28 |
| | $ | 1.45 |
|
Profit per common share–diluted 2 | | $ | 5.75 |
| | $ | 8.48 |
| | $ | 7.40 |
| | $ | 4.15 |
| | $ | 1.43 |
|
| Dividends declared per share of common stock | | $ | 2.320 |
| | $ | 2.020 |
| | $ | 1.820 |
| | $ | 1.740 |
| | $ | 1.680 |
|
Return on average common stockholders’ equity 3 | | 19.7 | % | | 37.2 | % | | 41.4 | % | | 27.4 | % | | 11.9 | % |
| Capital expenditures: | | |
| | |
| | |
| | |
| | |
|
| Property, plant and equipment | | $ | 2,522 |
| | $ | 3,350 |
| | $ | 2,515 |
| | $ | 1,575 |
| | $ | 1,504 |
|
| Equipment leased to others | | $ | 1,924 |
| | $ | 1,726 |
| | $ | 1,409 |
| | $ | 1,011 |
| | $ | 968 |
|
| Depreciation and amortization | | $ | 3,087 |
| | $ | 2,813 |
| | $ | 2,527 |
| | $ | 2,296 |
| | $ | 2,336 |
|
| Research and development expenses | | $ | 2,046 |
| | $ | 2,466 |
| | $ | 2,297 |
| | $ | 1,905 |
| | $ | 1,421 |
|
| As a percent of sales and revenues | | 3.7 | % | | 3.7 | % | | 3.8 | % | | 4.5 | % | | 4.4 | % |
| Wages, salaries and employee benefits | | $ | 10,962 |
| | $ | 11,756 |
| | $ | 10,994 |
| | $ | 9,187 |
| | $ | 7,416 |
|
| Average number of employees | | 122,502 |
| | 127,758 |
| | 113,620 |
| | 98,554 |
| | 99,359 |
|
| December 31, | | |
| | |
| | |
| | |
| | |
|
| Total assets | | $ | 84,896 |
| | $ | 88,970 |
| | $ | 81,218 |
| | $ | 63,728 |
| | $ | 59,842 |
|
| Long-term debt due after one year: | | |
| | |
| | |
| | |
| | |
|
| Consolidated | | $ | 26,719 |
| | $ | 27,752 |
| | $ | 24,944 |
| | $ | 20,437 |
| | $ | 21,847 |
|
| Machinery and Power Systems | | $ | 7,999 |
| | $ | 8,666 |
| | $ | 8,415 |
| | $ | 4,505 |
| | $ | 5,652 |
|
| Financial Products | | $ | 18,720 |
| | $ | 19,086 |
| | $ | 16,529 |
| | $ | 15,932 |
| | $ | 16,195 |
|
| Total debt: | | |
| | |
| | |
| | |
| | |
|
| Consolidated | | $ | 37,750 |
| | $ | 40,143 |
| | $ | 34,592 |
| | $ | 28,418 |
| | $ | 31,631 |
|
| Machinery and Power Systems | | $ | 8,775 |
| | $ | 10,415 |
| | $ | 9,066 |
| | $ | 5,204 |
| | $ | 6,387 |
|
| Financial Products | | $ | 28,975 |
| | $ | 29,728 |
| | $ | 25,526 |
| | $ | 23,214 |
| | $ | 25,244 |
|
| |
1 | Computed on weighted-average number of shares outstanding. |
| |
2 | Computed on weighted-average number of shares outstanding diluted by assumed exercise of stock-based compensation awards, using the treasury stock method. |
| |
3 | Represents profit divided by average stockholders’ equity (beginning of year stockholders’ equity plus end of year stockholders’ equity divided by two). |
| |
4 | Profit attributable to common stockholders. |
MANAGEMENT’S DISCUSSION AND ANALYSIS OF FINANCIAL CONDITION AND RESULTS OF OPERATIONS
OVERVIEW
Our 2013 sales and revenues were $55.656 billion, a decrease of 16 percent from $65.875 billion in 2012. Profit in 2013 was $3.789 billion, a decrease of 33 percent from $5.681 billion in 2012. The 2013 profit per share was $5.75, down 32 percent from $8.48 in 2012.
Fourth-quarter 2013 sales and revenues were $14.402 billion, down $1.673 billion from $16.075 billion in the fourth quarter of 2012. Fourth-quarter 2013 profit was $1.003 billion compared with $697 million in the fourth quarter of 2012. Profit was $1.54 per share in the fourth quarter of 2013 compared with profit per share of $1.04 in the fourth quarter of 2012. Fourth-quarter 2012 profit was negatively impacted by a goodwill impairment charge of $580 million, or $0.87 per share, related to Siwei, but was positively impacted by a tax settlement of $300 million, or $0.45 per share.
Highlights for 2013 include:
| |
| ▪ | Our largest segment, Power Systems, delivered profit near its 2012 record despite lower sales. We also had a strong year in our Financial Products segment, which delivered a record profit in 2013. |
| |
| ▪ | Substantial actions to reduce costs resulted in a $731 million improvement from the combination of lower SG&A and R&D expenses and manufacturing costs, or a $1.2 billion improvement excluding the impact of cost absorption from manufacturing costs. |
| |
| ▪ | Decremental operating profit pull through of 29 percent was indicative of strong operating performance. |
| |
| ▪ | We lowered Caterpillar inventory by $2.9 billion in 2013, and dealers lowered their inventories by more than $3 billion. While these inventory reductions were a significant sales and production headwind for Caterpillar in 2013, we believe the significant impact on our sales is largely over. |
| |
| ▪ | Machinery & Power Systems (M&PS) operating cash flow for 2013 was a record $9.0 billion, a $4.8 billion increase from 2012. |
| |
| ▪ | At the end of 2013, the M&PS debt-to-capital ratio was 29.7 percent, down from 37.4 percent at the end of 2012. In addition, we finished the year with $6.1 billion of cash. |
| |
| ▪ | We repurchased $2 billion of Caterpillar stock and increased the quarterly dividend by 15 percent in 2013. |
Restructuring Costs
In 2013, we turned our focus to structural cost reduction and worked on a large number of restructuring activities to help improve our long-term results. We incurred about $200 million in restructuring charges in 2013. We expect to take additional restructuring actions in 2014 and anticipate that these actions will result in charges of about $400 to $500 million. About $300 million of these expected charges are attributable to restructuring our Gosselies, Belgium facility to reduce costs and improve competitiveness. The remaining amount of about $100 to $200 million relates to a wide range of actions across the company that are part of our ongoing efforts to optimize our cost structure and improve the efficiency of our operations.
* Glossary of terms included on pages A-128 to A-129; first occurrence of terms shown in bold italics.
2013 COMPARED WITH 2012
CONSOLIDATED SALES AND REVENUES
The chart above graphically illustrates reasons for the change in Consolidated Sales and Revenues between 2012 (at left) and 2013 (at right). Items favorably impacting sales and revenues appear as upward stair steps with the corresponding dollar amounts above each bar, while items negatively impacting sales and revenues appear as downward stair steps with dollar amounts reflected in parentheses above each bar. Caterpillar management utilizes these charts internally to visually communicate with the company's Board of Directors and employees.
Total sales and revenues were $55.656 billion in 2013, a decrease of $10.219 billion, or 16 percent, from 2012. When reviewing the change in sales and revenues, we focus on the following perspectives:
| |
| • | Reasons for the change: Sales volume decreased $9.456 billion with the most significant decline in Resource Industries. More than half of the total volume decrease was related to changes in dealer machine and engine inventories and the remainder was primarily due to lower dealer deliveries to end users, primarily in Resource Industries. During 2012, dealers increased machine and engine inventories by about $1.6 billion. During 2013, dealers reduced their machine and engine inventories by more than $3 billion. Most of the change in both periods was in Resource Industries related to mining. During 2012, dealers received products that they had previously ordered in anticipation of higher demand. During 2013, most of the decline was related to dealers adjusting inventory levels in response to lower end-user demand resulting primarily from mining companies reducing their capital expenditures. While these substantial dealer inventory reductions were unfavorable to sales in 2013, we believe the significant declines are largely over. |
Dealers are independent, and there could be many reasons for changes in their inventory levels. In general, dealers adjust inventory based on their expectations of future demand and product delivery times. Dealers’ demand expectations take into account seasonal changes, macroeconomic conditions and other factors. Delivery times can vary based on availability of product from Caterpillar factories and product distribution centers. In addition, during 2013 dealers utilized inventory from our product distribution centers at a higher rate to meet end-user demand, primarily for Construction Industries’ products.
In addition, the impact of currency was unfavorable $573 million primarily due to the weakening of the Japanese yen, as sales in yen translated into fewer U.S. dollars. The net impact of acquisitions and divestitures was unfavorable $427 million mainly due to the absence of our third party logistics business. These decreases were partially offset by increased Financial Products' revenues of $155 million and favorable price realization of $82 million.
While almost all of the decline in sales was related to new equipment, aftermarket parts sales declined slightly.
| |
| • | Sales by geographic region: Sales declined in all geographic regions. The decline in Asia/Pacific was primarily related to lower sales in Australia where the most significant decrease was in mining sales, due to continued low demand. While sales in Asia/Pacific declined overall, sales in China increased as we focused on improving our competitive position through building out the Caterpillar business model, the key elements of which focus on increasing field population, improving customer loyalty and providing superior customer support in conjunction with our independent dealers. Our total company sales and revenues |
in China for 2013 were about $3.5 billion compared with about $2.9 billion for 2012, with the increase primarily in Construction Industries. Sales were down in North America primarily due to lower end-user demand and changes in dealer inventories. In EAME, the sales decline was primarily due to changes in dealer inventories and lower end-user demand. In Latin America, the sales decline was primarily due to changes in dealer inventories, partially offset by increases in deliveries to end users.
| |
| • | Sales by segment: Sales decreased in all segments. The most significant decrease was in Resource Industries, with sales down 37 percent primarily from dealer inventory changes and weaker demand in mining as mining companies have reduced their capital expenditures. Construction Industries' and Power Systems' sales decreased 5 percent. Financial Products' segment revenues were up 4 percent. |
CONSOLIDATED OPERATING PROFIT
The chart above graphically illustrates reasons for the change in Consolidated Operating Profit between 2012 (at left) and 2013 (at right). Items favorably impacting operating profit appear as upward stair steps with the corresponding dollar amounts above each bar, while items negatively impacting operating profit appear as downward stair steps with dollar amounts reflected in parentheses above each bar. Caterpillar management utilizes these charts internally to visually communicate with the company's Board of Directors and employees. The bar entitled Other includes consolidating adjustments and Machinery and Power Systems other operating (income) expenses.
Operating profit in 2013 was $5.628 billion compared with $8.573 billion in 2012, a 34 percent decrease. The decrease was primarily the result of lower sales volume, which included about $750 million from an unfavorable mix of products. The unfavorable mix was primarily due to a significant decline in sales of high margin mining products. Acquisitions and divestitures were also unfavorable to operating profit.
Acquisitions and divestitures negatively impacted operating profit by $581 million. Over half of the impact was due to the absence of a gain from the sale of a majority interest in our external logistics business during the third quarter of 2012. Additionally, 2012 included pre-tax gains on the sale of portions of the Bucyrus distribution business, while the impact on 2013 was negative. The $135 million favorable impact from the settlement with the previous owners of our Siwei acquisition was about offset by other operating losses at Siwei.
These unfavorable impacts were partially offset by the absence of a goodwill impairment charge of $580 million related to Siwei, decreased SG&A and R&D expense, favorable currency impacts, increased Financial Products' profit of $242 million and lower manufacturing costs.
The decline in SG&A and R&D expenses was positive to operating profit by $564 million, primarily due to lower discretionary and program spending driven by cost reduction measures implemented in response to lower volumes and decreased incentive compensation expense, partially offset by higher wage and benefit inflation.
Short-term incentive compensation expense related to 2013 was about $545 million, compared with about $825 million in 2012.
Currency favorably impacted operating profit by $390 million, mostly due to the Japanese yen. We have a sizable manufacturing presence in Japan, and while some of this production is sold in Japan, we are a net exporter, and therefore, a weaker yen provides a cost benefit.
Manufacturing costs decreased $167 million. The decrease was primarily due to lower material costs and $115 million ($0.12 per share) of LIFO inventory decrement benefits, partially offset by unfavorable changes in cost absorption resulting from a decrease in inventory during 2013 and an increase in inventory during 2012.
We reduced inventory both in the fourth quarter of 2012 and throughout 2013 primarily in Resource Industries and Construction Industries. The groundwork for these reductions began in mid-2012 as order rates declined and actions were needed to bring inventory levels in line with expected demand. Based on dealers’ expectation of future demand, macro-economic conditions and the amount of finished goods we had available in our product distribution centers, dealers also took action to lower their inventories. As a result, new orders from dealers declined sharply in the third quarter of 2012, and we began lowering production schedules and incoming material purchases from suppliers around the world. While production schedules began to decline in the third quarter of 2012, the most significant impacts on production and inventory, including rolling plant shutdowns at a number of facilities, occurred in the fourth quarter of 2012 and continued throughout 2013. Although inventory continued to decrease during the fourth quarter of 2013, production levels increased in Construction Industries. Overall, we believe current inventory and production levels are reasonably aligned with anticipated demand.
Excluding the impact of inventory cost absorption, manufacturing costs and SG&A and R&D expenses were favorable by $1.2 billion compared with 2012.
Other Profit/Loss Items
| |
| • | Other income/expense was expense of $35 million compared with income of $130 million in 2012. The change was primarily due to the unfavorable impact of currency translation and hedging gains and losses. Translation and hedging losses in 2013 totaled $254 million, primarily due to translation losses. Most of the impact in 2013 was a result of our net asset/liability positions and exchange rate movements and hedging, primarily for Japanese yen, Brazilian real and euro. In 2012, we had translation and hedging losses of $116 million. |
| |
| • | The provision for income taxes for 2013 reflects an effective tax rate of 28.5 percent compared with 30.5 percent for 2012, excluding the items discussed below. The decrease is primarily due to a more favorable geographic mix of profits from a tax perspective along with the U.S. research and development tax credit that was expired in 2012. |
The 2013 tax provision also included a benefit of $87 million primarily related to the research and development tax credit that was retroactively extended in 2013 for 2012 and a benefit of $55 million resulting from true-up of estimated amounts used in the tax provision to the 2012 U.S. tax return as filed in September 2013. This compares to an $18 million net negative impact in 2012 related to a $300 million benefit from a tax settlement offset by the negative impact of goodwill not deductible for tax purposes of $318 million.
Segment Information
|
| | | | | | | | | | | | | | | | | | | | | | | | | | | | | | | | | | |
| Sales and Revenues by Geographic Region |
| (Millions of dollars) | Total | | % Change | | North America | | % Change | | Latin America | | % Change | | EAME | | % Change | | Asia/ Pacific | | % Change |
| 2013 | |
| | |
| | |
| | |
| | |
| | |
| | |
| | |
| | |
| | |
|
Construction Industries 1 | $ | 18,445 |
| | (5 | )% | | $ | 7,008 |
| | (1 | )% | | $ | 2,728 |
| | 3 | % | | $ | 4,019 |
| | (13 | )% | | $ | 4,690 |
| | (5 | )% |
Resource Industries 2 | 13,270 |
| | (37 | )% | | 4,443 |
| | (26 | )% | | 2,481 |
| | (32 | )% | | 3,241 |
| | (26 | )% | | 3,105 |
| | (56 | )% |
Power Systems 3 | 20,155 |
| | (5 | )% | | 8,231 |
| | (6 | )% | | 2,168 |
| | (1 | )% | | 5,735 |
| | (5 | )% | | 4,021 |
| | (4 | )% |
All Other Segment 4 | 886 |
| | (41 | )% | | 602 |
| | (23 | )% | | 37 |
| | (43 | )% | | 142 |
| | (64 | )% | | 105 |
| | (60 | )% |
| Corporate Items and Eliminations | (62 | ) | | | | (65 | ) | | | | 1 |
| | | | 1 |
| | | | 1 |
| | |
| Machinery & Power Systems Sales | 52,694 |
| | (16 | )% | | 20,219 |
| | (10 | )% | | 7,415 |
| | (13 | )% | | 13,138 |
| | (15 | )% | | 11,922 |
| | (28 | )% |
| | | | | | | | | | | | | | | | | | | | |
| Financial Products Segment | 3,224 |
| | 4 | % | | 1,688 |
| | 5 | % | | 430 |
| | 6 | % | | 503 |
| | 9 | % | | 603 |
| | (1 | )% |
| Corporate Items and Eliminations | (262 | ) | | | | (145 | ) | | | | (34 | ) | | | | (28 | ) | | | | (55 | ) | | |
| Financial Products Revenues | 2,962 |
| | 6 | % | | 1,543 |
| | 8 | % | | 396 |
| | 5 | % | | 475 |
| | 10 | % | | 548 |
| | (3 | )% |
| | | | | | | | | | | | | | | | | | | | |
| Consolidated Sales and Revenues | $ | 55,656 |
| | (16 | )% | | $ | 21,762 |
| | (9 | )% | | $ | 7,811 |
| | (13 | )% | | $ | 13,613 |
| | (14 | )% | | $ | 12,470 |
| | (27 | )% |
| | | | | | | | | | | | | | | | | | | | |
| 2012 | | | |
| | |
| | |
| | |
| | |
| | |
| | |
| | |
| | |
|
Construction Industries 1 | $ | 19,334 |
| | | | $ | 7,101 |
| | | | $ | 2,650 |
| | | | $ | 4,633 |
| | | | $ | 4,950 |
| | |
|
Resource Industries 2 | 21,158 |
| | | | 6,037 |
| | | | 3,662 |
| | | | 4,374 |
| | | | 7,085 |
| | |
|
Power Systems 3 | 21,122 |
| | | | 8,720 |
| | | | 2,191 |
| | | | 6,043 |
| | | | 4,168 |
| | |
|
All Other Segment 4 | 1,501 |
| | | | 777 |
| | | | 65 |
| | | | 395 |
| | | | 264 |
| | |
|
| Corporate Items and Eliminations | (47 | ) | | | | (50 | ) | | | | 1 |
| | | | 1 |
| | | | 1 |
| | |
| Machinery & Power Systems Sales | 63,068 |
| | |
| | 22,585 |
| | |
| | 8,569 |
| | |
| | 15,446 |
| | |
| | 16,468 |
| | |
|
| | | | | | | | | | | | | | | | | | | | |
| Financial Products Segment | 3,090 |
| | | | 1,614 |
| | | | 406 |
| | | | 460 |
| | | | 610 |
| | |
|
| Corporate Items and Eliminations | (283 | ) | | | | (181 | ) | | | | (30 | ) | | | | (27 | ) | | | | (45 | ) | | |
|
| Financial Products Revenues | 2,807 |
| | |
| | 1,433 |
| | |
| | 376 |
| | |
| | 433 |
| | |
| | 565 |
| | |
|
| | | | | | | | | | | | | | | | | | | | |
| Consolidated Sales and Revenues | $ | 65,875 |
| | |
| | $ | 24,018 |
| | |
| | $ | 8,945 |
| | |
| | $ | 15,879 |
| | |
| | $ | 17,033 |
| | |
|
| |
1 | Does not include inter-segment sales of $336 million and $470 million in 2013 and 2012, respectively. |
| |
2 | Does not include inter-segment sales of $871 million and $1,117 million in 2013 and 2012, respectively. |
| |
3 | Does not include inter-segment sales of $1,895 million and $2,407 million in 2013 and 2012, respectively. |
| |
4 | Does not include inter-segment sales of $3,105 million and $3,492 million in 2013 and 2012, respectively. |
|
| | | | | | | | | | | | | | | | | | | | | | | | | | | | | | | | | | |
| Sales and Revenues by Segment | | | | | | | | | | | | | | | | |
| (Millions of dollars) | 2012 | | Sales Volume | | Price Realization | | Currency | | Acquisitions/Divestitures | | Other | | 2013 | | $ Change | | % Change |
| | | | | | | | | | | | | | | | | | |
| Construction Industries | $ | 19,334 |
| | $ | (282 | ) | | $ | (139 | ) | | $ | (468 | ) | | $ | — |
| | $ | — |
| | $ | 18,445 |
| | $ | (889 | ) | | (5 | )% |
| Resource Industries | 21,158 |
| | (7,792 | ) | | 39 |
| | (90 | ) | | (45 | ) | | — |
| | 13,270 |
| | (7,888 | ) | | (37 | )% |
| Power Systems | 21,122 |
| | (1,139 | ) | | 184 |
| | (12 | ) | | — |
| | — |
| | 20,155 |
| | (967 | ) | | (5 | )% |
| All Other Segment | 1,501 |
| | (231 | ) | | (1 | ) | | (1 | ) | | (382 | ) | | — |
| | 886 |
| | (615 | ) | | (41 | )% |
| Corporate Items and Eliminations | (47 | ) | | (12 | ) | | (1 | ) | | (2 | ) | | — |
| | — |
| | (62 | ) | | (15 | ) | | |
|
| Machinery & Power Systems Sales | 63,068 |
| | (9,456 | ) | | 82 |
| | (573 | ) | | (427 | ) | | — |
| | 52,694 |
| | (10,374 | ) | | (16 | )% |
| | | | | | | | | | | | | | | | | | |
| Financial Products Segment | 3,090 |
| | — |
| | — |
| | — |
| | — |
| | 134 |
| | 3,224 |
| | 134 |
| | 4 | % |
| Corporate Items and Eliminations | (283 | ) | | — |
| | — |
| | — |
| | — |
| | 21 |
| | (262 | ) | | 21 |
| | |
|
| Financial Products Revenues | 2,807 |
| | — |
| | — |
| | — |
| | — |
| | 155 |
| | 2,962 |
| | 155 |
| | 6 | % |
| | | | | | | | | | | | | | | | | | |
| Consolidated Sales and Revenues | $ | 65,875 |
| | $ | (9,456 | ) | | $ | 82 |
| | $ | (573 | ) | | $ | (427 | ) | | $ | 155 |
| | $ | 55,656 |
| | $ | (10,219 | ) | | (16 | )% |
| | | | | | | | | | | | | | | | | | |
|
| | | | | | | | | | | | | | |
| Operating Profit by Segment | | | | | | | |
| (Millions of dollars) | 2013 | | 2012 | | $ Change | | % Change |
| Construction Industries | $ | 1,363 |
| | $ | 1,789 |
| | $ | (426 | ) | | (24 | )% |
| Resource Industries | 1,575 |
| | 4,318 |
| | (2,743 | ) | | (64 | )% |
| Power Systems | 3,400 |
| | 3,434 |
| | (34 | ) | | (1 | )% |
| All Other Segment | 663 |
| | 1,014 |
| | (351 | ) | | (35 | )% |
| Corporate Items and Eliminations | (2,086 | ) | | (2,441 | ) | | 355 |
| | |
|
| Machinery & Power Systems | 4,915 |
| | 8,114 |
| | (3,199 | ) | | (39 | )% |
| | | | | | | | |
| Financial Products Segment | 990 |
| | 763 |
| | 227 |
| | 30 | % |
| Corporate Items and Eliminations | (7 | ) | | (22 | ) | | 15 |
| | |
|
| Financial Products | 983 |
| | 741 |
| | 242 |
| | 33 | % |
| Consolidating Adjustments | (270 | ) | | (282 | ) | | 12 |
| | |
|
| Consolidated Operating Profit | $ | 5,628 |
| | $ | 8,573 |
| | $ | (2,945 | ) | | (34 | )% |
| | | | | | | | |
Construction Industries
Construction Industries' sales were $18.445 billion in 2013, a decrease of $889 million, or 5 percent, from 2012. Over half of the sales decrease was due to the unfavorable impact of currency primarily from a weaker Japanese yen, as sales in yen translated into fewer U.S. dollars. In addition, volume was lower primarily from changes in dealer machine inventory. Dealer-reported machine inventory decreases were more significant in 2013 than they were in 2012. Throughout 2013 dealers utilized inventory from our product distribution centers at a higher rate to meet end-user demand. We believe that the significant decreases in dealer inventory are largely over. Although the worldwide construction industry is showing some signs of improvement and order rates are improving, it remains relatively depressed from a historical standpoint.
Most of the $139 million unfavorable impact from price realization was due to sales from a large government order in Brazil. We expect continuing machine sales in 2014 pursuant to an additional government order in Brazil, although not to the same extent as the current order. In addition, there was an unfavorable impact on price realization from a continued competitive pricing environment. The competitive pricing environment is attributable to a number of factors including excess industry capacity caused by weaker than expected economic conditions. Sales of new equipment declined, and sales of aftermarket parts were about flat.
Sales declined in EAME and Asia/Pacific and were about flat in North America and Latin America. Sales in EAME were lower primarily due to changes in dealer inventory. In addition, dealer deliveries to end users declined as construction activity in Europe remains low due to continued economic weakness.
In Asia/Pacific, higher sales in China were more than offset by negative currency impacts primarily from the weaker Japanese yen and lower sales in other countries due to slower economic growth. We believe higher sales in China, particularly with respect to hydraulic excavators, were due primarily to an increase in our competitive position through building out the Caterpillar business
model. In North America, unfavorable changes in dealer inventories were about offset by increased dealer deliveries to end users. The increase in end-user demand resulted primarily from an increase in construction-related spending in the United States. Although still below prior peaks, the housing industry has improved, and many state and local government budgets are showing signs of improvement which we expect to favorably impact construction spending.
Construction Industries' profit was $1.363 billion in 2013 compared with $1.789 billion in 2012. The decrease in profit was primarily due to lower sales volume, including an unfavorable mix of products, unfavorable price realization and increased manufacturing costs. The unfavorable mix of products is primarily attributable to relatively higher sales of small and mid-size machines which generally have lower margins than larger size machines which are also sold into mining applications. Higher manufacturing costs were driven primarily by unfavorable changes in cost absorption resulting from a decrease in inventory in 2013 and an increase in inventory during 2012, partially offset by lower material costs.
Resource Industries
Resource Industries' sales were $13.270 billion in 2013, a decrease of $7.888 billion, or 37 percent, from 2012, primarily due to changes in dealer machine inventory and lower deliveries to end users. Although production of most mined commodities is near or above a year ago, after several years of increasing capital expenditures, mining customers in all geographic regions have reduced capital spending across the mining industry. We believe that mining companies are increasing productivity at existing mines rather than investing in expansions or new mine openings which results in lower demand for our mining products. As a result, end-user demand was lower, and new orders for mining equipment continued to be weak during 2013.
Dealers reduced machine inventory in 2013 to better align their inventory levels with expected demand. This compares with an increase in dealer machine inventory during 2012. For 2014, we are expecting a modest decline in dealer inventory of mining machines.
Sales were lower in every region of the world due to both changes in dealer inventory and lower end-user demand. The most significant decline was in Asia/Pacific, primarily due to lower mining sales in Australia.
Almost all of the sales decline was related to new equipment. Aftermarket part sales also declined as some companies are delaying maintenance and rebuild activities.
Resource Industries' profit was $1.575 billion in 2013 compared with $4.318 billion in 2012. Profit in 2012 included a $580 million goodwill impairment related to Siwei. Excluding the impairment charge, operating profit declined $3.323 billion. The decrease was primarily the result of lower sales volume, including an unfavorable mix of products, and the unfavorable impact of acquisitions and divestitures, partially offset by lower SG&A and R&D expenses.
Acquisitions and divestitures negatively impacted profit by $230 million. Profit in 2012 included pre-tax gains on the sale of portions of the Bucyrus distribution business, while the impact in 2013 was negative. The $135 million favorable impact from the settlement with the previous owners of our Siwei acquisition was about offset by other operating losses at Siwei.
Decreases in SG&A and R&D expenses were driven by cost-reduction measures implemented in response to lower volumes.
Power Systems
Power Systems' sales were $20.155 billion in 2013, a decrease of $967 million, or 5 percent, compared with 2012. The decrease was primarily the result of lower volume, primarily for electric power, petroleum and rail applications. This was partially offset by higher price realization.
Sales declines in electric power applications were driven by dealers reducing their inventory levels in 2013, compared with dealers increasing inventory levels in 2012. In addition, end-user demand for electric-power applications was lower. The decline in petroleum application sales was due to decreases in dealer deliveries to end users primarily for drilling and well servicing due to an oversupply of equipment. Sales into rail applications decreased primarily due to declines in services and lower sales of recyclable materials partially offset by higher locomotive sales as we continue to focus on increasing field population, improving customer loyalty and providing superior customer support. Turbine-related sales, which are sold directly to end users and are not affected by dealer inventory, increased slightly primarily for petroleum production and gas compression applications due to continued strong demand for oil and natural gas.
Sales decreased in North America and EAME and were about flat in Latin America and Asia/Pacific.
In North America, the sales decrease was primarily due to declines in deliveries to end users with the largest decline in petroleum drilling and well servicing applications, partially offset by higher sales into gas compression applications. Sales into rail applications decreased primarily due to declines in services and lower sales of recyclable materials partially offset by higher locomotive sales. In addition, end-user demand for electric power applications declined.
In EAME, the sales decrease was largely due to the impact of dealer inventory changes for electric power applications. During 2012, dealers increased inventories in anticipation of higher demand and reduced their inventories during in 2013.
Power Systems' profit was $3.400 billion in 2013, about the same as 2012, despite the decline in sales volume. The impact from lower sales volume was about offset by decreased costs and favorable price realization. Costs were lower primarily due to favorable material and program-related costs and lower incentive compensation expense.
Financial Products Segment
Financial Products’ revenues were $3.224 billion, an increase of $134 million, or 4 percent, from 2012. The increase was primarily due to the favorable impact from higher average earning assets across all geographic regions and an increase in Insurance Services' revenues, primarily in North America. These increases were partially offset by the unfavorable impact from lower average financing rates on new and existing finance receivables and operating leases across all geographic regions.
Financial Products’ profit of $990 million was up $227 million from 2012. The increase was primarily due to a $97 million favorable impact from higher average earning assets, an $85 million favorable impact from lower claims experience at Insurance Services and a $67 million decrease in the provision for credit losses at Cat Financial.
All Other Segment
All Other Segment includes groups that provide services such as component manufacturing, remanufacturing and logistics.
The decrease in sales of $615 million was primarily due to the absence of our third party logistics business, which was sold in the third quarter of 2012. Lower profit of $351 million was primarily due to the absence of the gain on the sale of our third party logistics business.
Corporate Items and Eliminations
Expense for corporate items and eliminations was $2.093 billion in 2013, a decrease of $370 million from 2012. Corporate items and eliminations include: corporate-level expenses; timing differences, as some expenses are reported in segment profit on a cash basis; retirement benefit costs other than service cost; currency differences for M&PS, as segment profit is reported using annual fixed exchange rates; and inter-segment eliminations.
The decrease in expense from 2012 was primarily due to timing differences, lower corporate level expenses and LIFO inventory decrement benefits of $115 million, partially offset by methodology differences.
FOURTH QUARTER 2013 COMPARED WITH FOURTH QUARTER 2012
CONSOLIDATED SALES AND REVENUES
The chart above graphically illustrates reasons for the change in Consolidated Sales and Revenues between the fourth quarter of 2012 (at left) and the fourth quarter of 2013 (at right). Items favorably impacting sales and revenues appear as upward stair steps with the corresponding dollar amounts above each bar, while items negatively impacting sales and revenues appear as downward stair steps with dollar amounts reflected in parentheses above each bar. Caterpillar management utilizes these charts internally to visually communicate with the company's Board of Directors and employees.
Total sales and revenues were $14.402 billion in the fourth quarter of 2013, a decrease of $1.673 billion, or 10 percent, from the fourth quarter of 2012. When reviewing the change in sales and revenues, we focus on the following perspectives:
| |
| ▪ | Reason for the change: Sales volume decreased $1.511 billion due to lower volume in Resource Industries, partially offset by increased volume in Construction Industries and Power Systems. The volume decrease was primarily the result of lower end-user demand, with the largest impact in mining primarily due to mining customers reducing their capital expenditures. Overall, the change in dealer machine and engine inventories did not have a significant impact on total sales volume. |
Dealers are independent, and there could be many reasons for changes in their inventory levels. In general, dealers adjust inventory based on their expectations of future demand and product delivery times. Dealers’ demand expectations take into account seasonal changes, macroeconomic conditions and other factors. Delivery times can vary based on availability of product from Caterpillar factories and product distribution centers. In addition, during 2013 dealers utilized inventory from our product distribution centers at a higher rate to meet end-user demand, primarily for Construction Industries’ products.
In addition, currency was unfavorable $174 million primarily due to the weaker Japanese yen, as sales in yen translated into fewer U.S. dollars.
While almost all of the decline in sales was related to new equipment, aftermarket parts sales declined slightly.
| |
| ▪ | Sales by geographic region: Sales declined in all geographic regions except North America. Asia/Pacific declined 30 percent primarily related to lower sales in Australia where the most significant decrease was in mining sales, due to continued low demand. While sales in Asia/Pacific declined overall, sales in China, primarily in Construction Industries, increased more than 20 percent due to favorable impacts of dealer inventory changes and increased dealer deliveries to end users. Sales declined 20 percent in Latin America primarily due to unfavorable changes in dealer inventories of mining equipment as dealers took actions to better align inventory levels with demand. In EAME, lower sales were primarily the result of decreased dealer deliveries to end users, primarily due to lower mining demand. In North America, sales increased 6 percent primarily due to favorable impacts of dealer inventory changes for construction equipment and engines. |
| |
| ▪ | Sales by segment: Sales decreases in Resource Industries were partially offset by increases in Construction Industries and Power Systems. Resource Industries’ sales declined 48 percent resulting primarily from weaker demand for mining products as mining companies have reduced their capital expenditures as well as unfavorable changes in dealer inventories. Construction |
Industries’ sales increased 20 percent primarily due to favorable changes in dealer inventories and higher end-user demand. Power Systems’ sales were 5 percent higher. Financial Products segment revenues were up 3 percent.
CONSOLIDATED OPERATING PROFIT
The chart above graphically illustrates reasons for the change in Consolidated Operating Profit between the fourth quarter of 2012 (at left) and the fourth quarter of 2013 (at right). Items favorably impacting operating profit appear as upward stair steps with the corresponding dollar amounts above each bar, while items negatively impacting operating profit appear as downward stair steps with dollar amounts reflected in parentheses above each bar. Caterpillar management utilizes these charts internally to visually communicate with the company's Board of Directors and employees. The bar entitled Other includes consolidating adjustments and Machinery and Power Systems other operating (income) expenses.
Operating profit for the fourth quarter of 2013 was $1.452 billion, an increase of $414 million from the fourth quarter of 2012. The increase was primarily the result of the absence of a goodwill impairment charge of $580 million related to Siwei from the fourth quarter of 2012, lower manufacturing costs, decreased SG&A and R&D expenses and the favorable impact of currency. These favorable impacts were partially offset by lower sales volume, which included an unfavorable mix of products. The unfavorable mix was primarily due to a significant decline in Resource Industries’ sales and an increase in Construction Industries’ sales, which traditionally have lower margins. Acquisitions and divestitures negatively impacted operating profit by $120 million due to lower pre-tax gains on the sale of portions of the Bucyrus distribution business in the fourth quarter of 2013 compared with the fourth quarter of 2012 and Siwei operating losses in the fourth quarter of 2013.
Manufacturing costs decreased $480 million. The decrease was primarily due to favorable changes in cost absorption resulting from a smaller decrease in inventory during the fourth quarter of 2013 than in the fourth quarter of 2012, lower material costs and LIFO inventory decrement benefits of $115 million.
Decreases in SG&A and R&D expenses were primarily due to lower discretionary and program spending driven by cost reduction measures implemented in response to lower volumes.
The favorable impact of currency was mostly due to the Japanese yen. We have a sizeable manufacturing presence in Japan, and while some of this production is sold in Japan, we are a net exporter, and therefore, a weaker yen provides a cost benefit.
In the fourth quarter of 2013, we incurred $130 million of restructuring costs primarily in Resource Industries and recognized a gain on a legal settlement of $68 million. Both of these items are included in Other operating (income) expenses.
Other Profit/Loss Items
| |
| ▪ | Other income/expense was income of $44 million compared with expense of $11 million in the fourth quarter of 2012. The change was primarily due to the net impact from currency translation and hedging. Although both periods included unfavorable impacts from currency translation and hedging, losses were more significant in the fourth quarter of 2012 than in the fourth quarter of 2013. |
| |
| ▪ | The provision for income taxes in the fourth quarter of 2013 reflects an effective tax rate of 28.5 percent compared with 30.5 percent for 2012, excluding the items discussed below. The decrease is primarily due to a more favorable geographic mix of profits from a tax perspective along with the U.S. research and development tax credit that was expired in 2012 and retroactively extended in 2013. |
The 2013 fourth-quarter tax provision also included a $19 million benefit related to a decrease from the third-quarter estimated annual effective tax rate of 29 percent. This compares to a $63 million net benefit in the fourth quarter of 2012 related to a $300 million benefit from a tax settlement offset by the negative impact of goodwill not deductible for tax purposes of $237 million.
Segment Information
|
| | | | | | | | | | | | | | | | | | | | | | | | | | | | | | | | | | |
| Sales and Revenues by Geographic Region |
| (Millions of dollars) | Total | | % Change | | North America | | % Change | | Latin America | | % Change | | EAME | | % Change | | Asia/ Pacific | | % Change |
| Fourth Quarter 2013 | |
| | |
| | |
| | |
| | |
| | |
| | |
| | |
| | |
| | |
|
Construction Industries 1 | $ | 4,851 |
| | 20 | % | | $ | 1,751 |
| | 21 | % | | $ | 725 |
| | 21 | % | | $ | 1,033 |
| | 17 | % | | $ | 1,342 |
| | 22 | % |
Resource Industries 2 | 3,019 |
| | (48 | )% | | 1,184 |
| | (19 | )% | | 507 |
| | (54 | )% | | 726 |
| | (43 | )% | | 602 |
| | (69 | )% |
Power Systems 3 | 5,565 |
| | 5 | % | | 2,296 |
| | 15 | % | | 567 |
| | 5 | % | | 1,697 |
| | 4 | % | | 1,005 |
| | (12 | )% |
All Other Segment 4 | 239 |
| | (6 | )% | | 161 |
| | 5 | % | | 10 |
| | (38 | )% | | 39 |
| | (19 | )% | | 29 |
| | (24 | )% |
| Corporate Items and Eliminations | (28 | ) | | — |
| | (27 | ) | | | | — |
| | | | (1 | ) | | | | — |
| | |
| Machinery & Power Systems Sales | 13,646 |
| | (11 | )% | | 5,365 |
| | 6 | % | | 1,809 |
| | (20 | )% | | 3,494 |
| | (9 | )% | | 2,978 |
| | (30 | )% |
| | | | | | | | | | | | | | | | | | | | |
| Financial Products Segment | 816 |
| | 3 | % | | 436 |
| | 8 | % | | 106 |
| | — | % | | 131 |
| | 10 | % | | 143 |
| | (11 | )% |
| Corporate Items and Eliminations | (60 | ) | | | | (31 | ) | | | | (10 | ) | | | | (7 | ) | | | | (12 | ) | | |
| Financial Products Revenues | 756 |
| | 5 | % | | 405 |
| | 12 | % | | 96 |
| | (2 | )% | | 124 |
| | 10 | % | | 131 |
| | (9 | )% |
| | | | | | | | | | | | | | | | | | | | |
| Consolidated Sales and Revenues | $ | 14,402 |
| | (10 | )% | | $ | 5,770 |
| | 7 | % | | $ | 1,905 |
| | (19 | )% | | $ | 3,618 |
| | (8 | )% | | $ | 3,109 |
| | (29 | )% |
| | | | | | | | | | | | | | | | | | | | |
| Fourth Quarter 2012 | |
| | |
| | |
| | |
| | |
| | |
| | |
| | |
| | |
| | |
|
Construction Industries 1 | $ | 4,028 |
| | | | $ | 1,445 |
| | | | $ | 600 |
| | | | $ | 882 |
| | | | $ | 1,101 |
| | |
|
Resource Industries 2 | 5,776 |
| | | | 1,467 |
| | | | 1,095 |
| | | | 1,266 |
| | | | 1,948 |
| | |
|
Power Systems 3 | 5,307 |
| | | | 1,994 |
| | | | 539 |
| | | | 1,628 |
| | | | 1,146 |
| | |
|
All Other Segment4 | 255 |
| | | | 153 |
| | | | 16 |
| | | | 48 |
| | | | 38 |
| | |
|
| Corporate Items and Eliminations | (9 | ) | | | | (12 | ) | | | | 1 |
| | | | 1 |
| | | | 1 |
| | |
| Machinery & Power Systems Sales | 15,357 |
| | |
| | 5,047 |
| | |
| | 2,251 |
| | |
| | 3,825 |
| | |
| | 4,234 |
| | |
|
| | | | | | | | | | | | | | | | | | | | |
| Financial Products Segment | 789 |
| | | | 404 |
| | | | 106 |
| | | | 119 |
| | | | 160 |
| | |
|
| Corporate Items and Eliminations | (71 | ) | | | | (41 | ) | | | | (8 | ) | | | | (6 | ) | | | | (16 | ) | | |
|
| Financial Products Revenues | 718 |
| | |
| | 363 |
| | |
| | 98 |
| | |
| | 113 |
| | |
| | 144 |
| | |
|
| | | | | | | | | | | | | | | | | | | | |
| Consolidated Sales and Revenues | $ | 16,075 |
| | |
| | $ | 5,410 |
| | |
| | $ | 2,349 |
| | |
| | $ | 3,938 |
| | |
| | $ | 4,378 |
| | |
|
| |
1 | Does not include inter-segment sales of $74 million and $115 million in the fourth quarter 2013 and 2012, respectively. |
| |
2 | Does not include inter-segment sales of $210 million and $208 million in the fourth quarter 2013 and 2012, respectively. |
| |
3 | Does not include inter-segment sales of $567 million and $455 million in the fourth quarter 2013 and 2012, respectively. |
| |
4 | Does not include inter-segment sales of $749 million and $773 million in the fourth quarter 2013 and 2012, respectively. |
|
| | | | | | | | | | | | | | | | | | | | | | | | | | | | | | | | | | |
| Sales and Revenues by Segment | | | | | | | | | | | | | | | | |
| (Millions of dollars) | Fourth Quarter 2012 | | Sales Volume | | Price Realization | | Currency | | Acquisitions/Divestitures | | Other | | Fourth Quarter 2013 | | $ Change | | % Change |
| | | | | | | | | | | | | | | | | | |
| Construction Industries | $ | 4,028 |
| | $ | 1,030 |
| | $ | (51 | ) | | $ | (156 | ) | | $ | — |
| | $ | — |
| | $ | 4,851 |
| | $ | 823 |
| | 20 | % |
| Resource Industries | 5,776 |
| | (2,705 | ) | | 7 |
| | (30 | ) | | (29 | ) | | — |
| | 3,019 |
| | (2,757 | ) | | (48 | )% |
| Power Systems | 5,307 |
| | 197 |
| | 48 |
| | 13 |
| | — |
| | — |
| | 5,565 |
| | 258 |
| | 5 | % |
| All Other Segment | 255 |
| | (16 | ) | | — |
| | — |
| | — |
| | — |
| | 239 |
| | (16 | ) | | (6 | )% |
| Corporate Items and Eliminations | (9 | ) | | (17 | ) | | (1 | ) | | (1 | ) | | — |
| | — |
| | (28 | ) | | (19 | ) | | |
|
| Machinery & Power Systems Sales | 15,357 |
| | (1,511 | ) | | 3 |
| | (174 | ) | | (29 | ) | | — |
| | 13,646 |
| | (1,711 | ) | | (11 | )% |
| | | | | | | | | | | | | | | | | | |
| Financial Products Segment | 789 |
| | — |
| | — |
| | — |
| | — |
| | 27 |
| | 816 |
| | 27 |
| | 3 | % |
| Corporate Items and Eliminations | (71 | ) | | — |
| | — |
| | — |
| | — |
| | 11 |
| | (60 | ) | | 11 |
| | |
|
| Financial Products Revenues | 718 |
| | — |
| | — |
| | — |
| | — |
| | 38 |
| | 756 |
| | 38 |
| | 5 | % |
| | | | | | | | | | | | | | | | | | |
| Consolidated Sales and Revenues | $ | 16,075 |
| | $ | (1,511 | ) | | $ | 3 |
| | $ | (174 | ) | | $ | (29 | ) | | $ | 38 |
| | $ | 14,402 |
| | $ | (1,673 | ) | | (10 | )% |
| | | | | | | | | | | | | | | | | | |
|
| | | | | | | | | | | | | | |
| Operating Profit by Segment | | | | | | | |
| (Millions of dollars) | Fourth Quarter 2013 | | Fourth Quarter 2012 | | $ Change | | % Change |
| Construction Industries | $ | 500 |
| | $ | 26 |
| | $ | 474 |
| | 1,823 | % |
| Resource Industries | 139 |
| | 611 |
| | (472 | ) | | (77 | )% |
| Power Systems | 964 |
| | 697 |
| | 267 |
| | 38 | % |
| All Other Segment | 116 |
| | 126 |
| | (10 | ) | | (8 | )% |
| Corporate Items and Eliminations | (449 | ) | | (534 | ) | | 85 |
| | |
|
| Machinery & Power Systems | 1,270 |
| | 926 |
| | 344 |
| | 37 | % |
| | | | | | | | |
| Financial Products Segment | 266 |
| | 180 |
| | 86 |
| | 48 | % |
| Corporate Items and Eliminations | (16 | ) | | 2 |
| | (18 | ) | | |
|
| Financial Products | 250 |
| | 182 |
| | 68 |
| | 37 | % |
| Consolidating Adjustments | (68 | ) | | (70 | ) | | 2 |
| | |
|
| Consolidated Operating Profit | $ | 1,452 |
| | $ | 1,038 |
| | $ | 414 |
| | 40 | % |
| | | | | | | | |
Construction Industries
Construction Industries’ sales were $4.851 billion in the fourth quarter of 2013, an increase of $823 million, or 20 percent, from the fourth quarter of 2012. The sales increase was due to higher sales volume, partially offset by the unfavorable impact of currency and price realization. Sales of new equipment increased, and sales of aftermarket parts were about flat.
| |
| ▪ | The increase in sales volume was primarily related to changes in dealer inventories as the decline in dealer inventories was significantly greater in the fourth quarter of 2012 than in the fourth quarter of 2013. Additionally, deliveries to end users increased in Latin America, Asia/Pacific and North America. |
| |
| ▪ | The unfavorable currency impact was primarily from a weaker Japanese yen, as sales in yen translated into fewer U.S. dollars. |
| |
| ▪ | Price realization was unfavorable primarily due to continuing sales from a large government order in Brazil and a continued competitive pricing environment. |
Sales increased in all geographic regions.
| |
| ▪ | In North America, higher sales were primarily due to the favorable impact of dealer inventory changes, as dealers decreased inventory more in the fourth quarter of 2012 than in the fourth quarter of 2013. The remaining sales increase was primarily due to higher end-user demand resulting from an increase in construction-related spending in the United States. Although still below prior peaks, construction-related spending continues to improve. The increase was partially offset by unfavorable price realization due to a continued competitive pricing environment. |
| |
| ▪ | In Asia/Pacific, the sales increase was primarily in China due to both favorable impacts of dealer inventory changes and increased dealer deliveries to end users as we focused on improving our competitive position through building out the |
Caterpillar business model, the key elements of which focus on increasing field population, improving customer loyalty and providing superior customer support in conjunction with our independent dealers. In addition, price realization was favorable. These items were partially offset by negative currency impacts primarily from the weaker Japanese yen.
| |
| ▪ | In EAME, higher sales were primarily due to the favorable impact of dealer inventory changes, as dealers decreased inventory more in the fourth quarter of 2012 than in the fourth quarter of 2013. This was partially offset by unfavorable price realization due to a continued competitive pricing environment. Dealer deliveries to end users were about flat. |
| |
| ▪ | The increase in Latin America was primarily due to continuing sales from a large government order in Brazil. |
Construction Industries’ profit was $500 million in the fourth quarter of 2013, compared with $26 million in the fourth quarter of 2012. The increase in profit was primarily due to higher sales volume and favorable manufacturing costs, partially offset by unfavorable price realization. Manufacturing costs improved primarily due to favorable changes in cost absorption resulting from the absence of the large decrease in inventory during the fourth quarter of 2012. After significant changes in inventory in 2012 and 2013, we believe current inventory and production levels are reasonably aligned with anticipated demand. In addition, profit was favorably impacted by lower material and freight costs.
Resource Industries
Resource Industries’ sales were $3.019 billion in the fourth quarter of 2013, a decrease of $2.757 billion, or 48 percent, from the fourth quarter of 2012, nearly all from lower sales volume. More than half of the sales volume decline was due to lower end-user demand across all geographic regions. Sales volume also declined as a result of unfavorable changes in dealer machine inventory across all regions. Dealers continued to significantly reduce machine inventory during the fourth quarter of 2013 to better align inventory levels with demand. This compares with an increase in dealer machine inventory during the fourth quarter of 2012. Although production of most mined commodities is at levels near or above a year ago, after several years of increasing capital expenditures customers in all geographic regions have reduced spending across the mining industry. As a result, we believe that mining companies are increasing productivity at existing mines rather than investing in expansions or new mine openings, which results in lower demand for our mining products, and new orders for mining equipment continued to be weak in the quarter.
Almost the entire sales decline was related to new equipment. Aftermarket part sales also declined as we believe some companies are delaying maintenance and rebuild activities.
Sales were lower in every region of the world due to both changes in dealer inventory and lower end-user demand. The most significant decline was in Asia/Pacific, primarily due to lower mining sales in Australia.
Resource Industries’ profit was $139 million in the fourth quarter of 2013 compared with $611 million in the fourth quarter of 2012. The fourth quarter of 2012 included a $580 million goodwill impairment related to Siwei. Excluding this impairment charge related to Siwei, operating profit declined $1.052 billion. The decrease was primarily the result of lower sales volume. Acquisitions and divestitures negatively impacted operating profit by $121 million due to lower pre-tax gains on the sale of portions of the Bucyrus distribution business in the fourth quarter of 2013 compared with the fourth quarter 2012 and Siwei operating losses in the fourth quarter of 2013. Restructuring costs of about $90 million in the fourth quarter of 2013 also lowered profit. These negative factors were partially offset by lower SG&A and R&D expenses and an improvement in manufacturing costs.
SG&A and R&D expenses were lower primarily due to decreased spending for new product introduction programs and other cost cutting measures implemented in response to lower volumes. Incentive compensation expense was also lower.
The decrease in manufacturing costs was primarily driven by lower material costs, favorable changes in cost absorption resulting from a significantly larger decrease in inventory during the fourth quarter of 2012 than in the fourth quarter of 2013, and cost cutting measures.
Power Systems
Power Systems’ sales were $5.565 billion in the fourth quarter of 2013, an increase of $258 million, or 5 percent, from the fourth quarter of 2012. The increase in sales was primarily a result of favorable changes in dealer inventories. Dealer engine inventory increased in the fourth quarter of 2013 compared with a decrease during the fourth quarter of 2012. Overall end-user demand was down slightly with lower demand for electric power applications partially offset by increased demand for industrial engines.
Sales increased in all regions except Asia/Pacific.
| |
| ▪ | In North America, the sales increase was primarily due to favorable changes in dealer inventories for nearly all applications. In addition, locomotive sales were higher as we continue to focus on increasing field population, improving customer loyalty and providing superior customer support. These increases were partially offset by weaker end-user demand for electric power applications. |
| |
| ▪ | Sales in EAME were relatively flat with the fourth quarter of 2012 with stronger demand for industrial engines used in agriculture equipment and third party generator set packages, partially offset by lower demand for electric power applications and locomotives due to weak economic conditions. |
| |
| ▪ | In Latin America, sales were relatively flat with fourth quarter of 2012. |
| |
| ▪ | In Asia/Pacific, the decline in sales was primarily due to lower sales into petroleum and electric power applications resulting primarily from timing of large projects. |
Power Systems’ profit was $964 million in the fourth quarter of 2013 compared with $697 million in the fourth quarter of 2012. The increase was primarily due to lower manufacturing costs, higher sales volume and favorable price realization. The decrease in manufacturing costs was primarily driven by lower material and freight costs.
Financial Products Segment
Financial Products’ revenues were $816 million, an increase of $27 million, or 3 percent, from the fourth quarter of 2012. The increase was primarily due to the favorable impact from higher average earning assets across all geographic regions except Asia/Pacific.
Financial Products’ profit was $266 million in the fourth quarter of 2013, compared with $180 million in the fourth quarter of 2012. The increase was primarily due to a $61 million decrease in the provision for credit losses at Cat Financial, and a $16 million favorable impact from currency gains and losses.
At the end of 2013, past dues at Cat Financial were 2.37 percent compared with 2.45 percent at the end of the third quarter of 2013 and 2.26 percent at the end of 2012. Write-offs, net of recoveries, were $123 million for the full-year 2013, compared with $102 million for 2012. The increase in write-offs was primarily related to Cat Financial's European marine portfolio and was previously provided for in the allowance for credit losses.
As of December 31, 2013, Cat Financial's allowance for credit losses totaled $378 million or 1.30 percent of net finance receivables, compared with $426 million or 1.49 percent of net finance receivables at year-end 2012.
Corporate Items and Eliminations
Expense for corporate items and eliminations was $465 million in the fourth quarter of 2013, a decrease of $67 million from the fourth quarter of 2012. Corporate items and eliminations include: corporate-level expenses; timing differences, as some expenses are reported in segment profit on a cash basis; retirement benefit costs other than service cost; currency differences for M&PS, as segment profit is reported using annual fixed exchange rates; and inter-segment eliminations.
The decrease in expense from the fourth quarter of 2012 was primarily due to LIFO inventory decrement benefits of $115 million, lower corporate level expenses and the favorable impact from a legal settlement of $68 million, partially offset by methodology and timing differences.
2012 COMPARED WITH 2011
CONSOLIDATED SALES AND REVENUES
The chart above graphically illustrates reasons for the change in Consolidated Sales and Revenues between 2011 (at left) and 2012 (at right). Items favorably impacting sales and revenues appear as upward stair steps with the corresponding dollar amounts above each bar, while items negatively impacting sales and revenues appear as downward stair steps with dollar amounts reflected in parentheses above each bar. Caterpillar management utilizes these charts internally to visually communicate with the company's Board of Directors and employees.
Total sales and revenues were $65.875 billion in 2012, an increase of $5.737 billion, or 10 percent, from 2011. When reviewing the change in sales and revenues, we focus on the following perspectives:
| |
| • | Reason for the change: The net impact of acquisitions and divestitures added $2.668 billion, sales volume improved $2.059 billion, price realization was favorable $1.531 billion and Financial Products revenues were up $61 million. Currency partially offset these increases by $582 million. While sales of both new equipment and aftermarket parts increased, the more significant increase was new equipment. |
| |
| • | Sales by geographic region: Excluding acquisitions and divestitures, sales increased in all geographic regions except Latin America, with the most significant improvement in North America. The sales increase in North America was driven by improvements in the United States. Within Asia/Pacific, increases in Australia and other parts of Asia/Pacific more than offset a decrease in China. Within EAME, increased sales in Africa, the Middle East and CIS were partially offset by lower sales in Europe. |
| |
| • | Segment: Excluding acquisitions and divestitures, the sales increase was primarily due to Resource Industries, with sales up 24 percent from 2011. Sales for both Construction Industries and Power Systems were about flat. |
CONSOLIDATED OPERATING PROFIT
The chart above graphically illustrates reasons for the change in Consolidated Operating Profit between 2011 (at left) and 2012 (at right). Items favorably impacting operating profit appear as upward stair steps with the corresponding dollar amounts above each bar, while items negatively impacting operating profit appear as downward stair steps with dollar amounts reflected in parentheses above each bar. Caterpillar management utilizes these charts internally to visually communicate with the company’s Board of Directors and employees. The bar entitled Other includes consolidating adjustments and Machinery and Power Systems other operating (income) expenses.
Operating profit in 2012 was $8.573 billion compared with $7.153 billion in 2011. The increase was primarily the result of improved price realization and higher sales volume, which included the impact of a favorable mix of products. Acquisitions and divestitures favorably impacted operating profit by $674 million, primarily related to Bucyrus and the sale of a majority interest in Caterpillar's third party logistics business.
The improvements were partially offset by higher manufacturing costs, a goodwill impairment charge related to Siwei and increased selling, general and administrative (SG&A) and research and development (R&D) expenses. Manufacturing costs were up $1.138 billion primarily due to capacity expansion programs, inefficiencies driven by lower production and declining inventory in the fourth quarter of 2012 and increased wages and benefits and freight costs. These increases were partially offset by lower incentive compensation expense. SG&A and R&D expenses increased $308 million primarily due to growth-related initiatives, increased costs to support product programs and wage and benefit inflation, partially offset by lower incentive compensation expense.
Short-term incentive compensation was about $825 million for 2012 compared with $1.2 billion in 2011.
The amount of incremental operating profit we earn on incremental sales and revenues is an important performance metric. Sales and revenues increased $5.737 billion from 2011, and operating profit increased $1.420 billion. The resulting incremental operating profit rate is 25 percent. Excluding acquisitions and divestitures, incremental operating profit was about 43 percent. Excluding acquisitions, divestitures and currency impacts, incremental margin was about 33 percent.
Other Profit/Loss Items
| |
| • | Interest expense excluding Financial Products increased $71 million from 2011, due to long-term debt issued in 2011 relating to the acquisition of Bucyrus and underwriting expense related to our debt exchange in the third quarter of 2012. |
| |
| • | Other income/expense was income of $130 million compared with expense of $32 million in 2011. The change was primarily due to the absence of losses on interest rate swaps and credit facility fees associated with the debt issuance for the Bucyrus acquisition in 2011, partially offset by the unfavorable impact of currency gains and losses. |
| |
| • | The provision for income taxes for 2012 reflects an effective tax rate of 30.5 percent compared with 26.5 percent for 2011, excluding the items discussed below. The increase from 26.5 percent to 30.5 percent is primarily due to changes in our geographic mix of profits from a tax perspective and the expiration of the U.S. research and development tax credit. While |
the American Taxpayer Relief Act of 2012 extended this credit, the related benefit will be reported in 2013 due to the law's enactment in January of 2013.
The 2012 tax provision includes a benefit of $300 million from a decrease in tax and interest reserves due to a settlement reached with the Internal Revenue Service related to 2000 to 2006 U.S. tax returns. Approximately $200 million of this benefit is related to tax and $100 million is related to interest. This was offset by a negative impact of $318 million from goodwill not deductible for tax purposes related to the Siwei goodwill impairment and the divestiture of portions of the Bucyrus distribution business. This compared to a $63 million net benefit in 2011 due to repatriation of non-U.S. earnings and a release of a valuation allowance offset by an increase in prior year unrecognized tax benefits and a negative impact from nondeductible goodwill primarily related to the divestiture of a portion of the Bucyrus distribution business.
Segment Information
|
| | | | | | | | | | | | | | | | | | | | | | | | | | | | | | | | | | | |
| Sales and Revenues by Geographic Region |
| (Millions of dollars) | | Total | | % Change | | North America | | % Change | | Latin America | | % Change | | EAME | | % Change | | Asia/ Pacific | | % Change |
| 2012 | | |
| | |
| | |
| | |
| | |
| | |
| | |
| | |
| | |
| | |
|
Construction Industries 1 | | $ | 19,334 |
| | (2 | )% | | $ | 7,101 |
| | 19 | % | | $ | 2,650 |
| | (13 | )% | | $ | 4,633 |
| | (3 | )% | | $ | 4,950 |
| | (16 | )% |
Resource Industries 2 | | 21,158 |
| | 35 | % | | 6,037 |
| | 22 | % | | 3,662 |
| | 29 | % | | 4,374 |
| | 36 | % | | 7,085 |
| | 54 | % |
Power Systems 3 | | 21,122 |
| | 5 | % | | 8,720 |
| | 5 | % | | 2,191 |
| | (7 | )% | | 6,043 |
| | 5 | % | | 4,168 |
| | 14 | % |
All Other Segment 4 | | 1,501 |
| | (26 | )% | | 777 |
| | (20 | )% | | 65 |
| | (37 | )% | | 395 |
| | (32 | )% | | 264 |
| | (27 | )% |
| Corporate Items and Eliminations | | (47 | ) | | | | (50 | ) | | | | 1 |
| | | | 1 |
| | | | 1 |
| | |
| Machinery & Power Systems Sales | | 63,068 |
| | 10 | % | | 22,585 |
| | 12 | % | | 8,569 |
| | 3 | % | | 15,446 |
| | 8 | % | | 16,468 |
| | 14 | % |
| | | | | | | | | | | | | | | | | | | | | |
| Financial Products Segment | | 3,090 |
| | 3 | % | | 1,614 |
| | (1 | )% | | 406 |
| | 10 | % | | 460 |
| | (6 | )% | | 610 |
| | 18 | % |
| Corporate Items and Eliminations | | (283 | ) | | | | (181 | ) | | | | (30 | ) | | | | (27 | ) | | | | (45 | ) | | |
| Financial Products Revenues | | 2,807 |
| | 2 | % | | 1,433 |
| | (2 | )% | | 376 |
| | 10 | % | | 433 |
| | (6 | )% | | 565 |
| | 16 | % |
| | | | | | | | | | | | | | | | | | | | | |
| Consolidated Sales and Revenues | | $ | 65,875 |
| | 10 | % | | $ | 24,018 |
| | 11 | % | | $ | 8,945 |
| | 3 | % | | $ | 15,879 |
| | 7 | % | | $ | 17,033 |
| | 14 | % |
| | | | | | | | | | | | | | | | | | | | | |
| 2011 | | | | |
| | |
| | |
| | |
| | |
| | |
| | |
| | |
| | |
|
Construction Industries 1 | | $ | 19,667 |
| | | | $ | 5,985 |
| | | | $ | 3,045 |
| | | | $ | 4,768 |
| | | | $ | 5,869 |
| | |
|
Resource Industries 2 | | 15,629 |
| | | | 4,963 |
| | | | 2,831 |
| | | | 3,228 |
| | | | 4,607 |
| | |
|
Power Systems 3 | | 20,114 |
| | | | 8,331 |
| | | | 2,363 |
| | | | 5,752 |
| | | | 3,668 |
| | |
|
All Other Segment 4 | | 2,021 |
| | | | 970 |
| | | | 103 |
| | | | 585 |
| | | | 363 |
| | |
|
| Corporate Items and Eliminations | | (39 | ) | | | | (32 | ) | | | | (1 | ) | | | | (4 | ) | | | | (2 | ) | | |
| Machinery & Power Systems Sales | | 57,392 |
| | |
| | 20,217 |
| | |
| | 8,341 |
| | |
| | 14,329 |
| | |
| | 14,505 |
| | |
|
| | | | | | | | | | | | | | | | | | | | | |
| Financial Products Segment | | 3,003 |
| | | | 1,626 |
| | | | 370 |
| | | | 490 |
| | | | 517 |
| | |
|
| Corporate Items and Eliminations | | (257 | ) | | | | (171 | ) | | | | (29 | ) | | | | (28 | ) | | | | (29 | ) | | |
|
| Financial Products Revenues | | 2,746 |
| | |
| | 1,455 |
| | |
| | 341 |
| | |
| | 462 |
| | |
| | 488 |
| | |
|
| | | | | | | | | | | | | | | | | | | | | |
| Consolidated Sales and Revenues | | $ | 60,138 |
| | |
| | $ | 21,672 |
| | |
| | $ | 8,682 |
| | |
| | $ | 14,791 |
| | |
| | $ | 14,993 |
| | |
|
| |
1 | Does not include inter-segment sales of $470 million and $575 million in 2012 and 2011, respectively. |
| |
2 | Does not include inter-segment sales of $1,117 million and $1,162 million in 2012 and 2011, respectively. |
| |
3 | Does not include inter-segment sales of $2,407 million and $2,339 million in 2012 and 2011, respectively. |
| |
4 | Does not include inter-segment sales of $3,492 million and $3,413 million in 2012 and 2011, respectively. |
|
| | | | | | | | | | | | | | | | | | | | | | | | | | | | | | | | | | | |
| Sales and Revenues by Segment |
| (Millions of dollars) | | 2011 | | Sales Volume | | Price Realization | | Currency | | Acquisitions/Divestitures | | Other | | 2012 | | $ Change | | % Change |
| Construction Industries | | $ | 19,667 |
| | $ | (301 | ) | | $ | 264 |
| | $ | (296 | ) | | $ | — |
| | $ | — |
| | $ | 19,334 |
| | $ | (333 | ) | | (2 | )% |
| Resource Industries | | 15,629 |
| | 2,414 |
| | 850 |
| | (71 | ) | | 2,336 |
| | — |
| | 21,158 |
| | 5,529 |
| | 35 | % |
| Power Systems | | 20,114 |
| | 251 |
| | 342 |
| | (194 | ) | | 609 |
| | — |
| | 21,122 |
| | 1,008 |
| | 5 | % |
| All Other Segment | | 2,021 |
| | (224 | ) | | — |
| | (19 | ) | | (277 | ) | | — |
| | 1,501 |
| | (520 | ) | | (26 | )% |
| Corporate Items and Eliminations | | (39 | ) | | (81 | ) | | 75 |
| | (2 | ) | | — |
| | — |
| | (47 | ) | | (8 | ) | | |
|
| Machinery & Power Systems Sales | | 57,392 |
| | 2,059 |
| | 1,531 |
| | (582 | ) | | 2,668 |
| | — |
| | 63,068 |
| | 5,676 |
| | 10 | % |
| | | | | | | | | | | | | | | | | | | |
| Financial Products Segment | | 3,003 |
| | — |
| | — |
| | — |
| | — |
| | 87 |
| | 3,090 |
| | 87 |
| | 3 | % |
| Corporate Items and Eliminations | | (257 | ) | | — |
| | — |
| | — |
| | — |
| | (26 | ) | | (283 | ) | | (26 | ) | | |
|
| Financial Products Revenues | | 2,746 |
| | — |
| | — |
| | — |
| | — |
| | 61 |
| | 2,807 |
| | 61 |
| | 2 | % |
| | | | | | | | | | | | | | | | | | | |
| Consolidated Sales and Revenues | | $ | 60,138 |
| | $ | 2,059 |
| | $ | 1,531 |
| | $ | (582 | ) | | $ | 2,668 |
| | $ | 61 |
| | $ | 65,875 |
| | $ | 5,737 |
| | 10 | % |
| | | | | | | | | | | | | | | | | | | |
|
| | | | | | | | | | | | | | | |
| Operating Profit by Segment | | | | | | | | |
| | | | | | | | | |
| (Millions of dollars) | | 2012 | | 2011 | | $ Change | | % Change |
| Construction Industries | | $ | 1,789 |
| | $ | 2,056 |
| | $ | (267 | ) | | (13 | )% |
| Resource Industries | | 4,318 |
| | 3,334 |
| | 984 |
| | 30 | % |
| Power Systems | | 3,434 |
| | 3,053 |
| | 381 |
| | 12 | % |
| All Other Segment | | 1,014 |
| | 837 |
| | 177 |
| | 21 | % |
| Corporate Items and Eliminations | | (2,441 | ) | | (2,457 | ) | | 16 |
| | |
|
| Machinery & Power Systems | | 8,114 |
| | 6,823 |
| | 1,291 |
| | 19 | % |
| | | | | | | | | |
| Financial Products Segment | | 763 |
| | 587 |
| | 176 |
| | 30 | % |
| Corporate Items and Eliminations | | (22 | ) | | (4 | ) | | (18 | ) | | |
|
| Financial Products | | 741 |
| | 583 |
| | 158 |
| | 27 | % |
| Consolidating Adjustments | | (282 | ) | | (253 | ) | | (29 | ) | | |
|
| Consolidated Operating Profit | | $ | 8,573 |
| | $ | 7,153 |
| | $ | 1,420 |
| | 20 | % |
| | | | | | | | | |
Construction Industries
Construction Industries' sales were $19.334 billion in 2012, a decrease of $333 million, or 2 percent, from 2011. Sales decreased in all geographic regions except North America. New equipment sales declined and sales of aftermarket parts were about flat.
Construction Industries' sales were lower in Asia/Pacific, where a large decrease in China more than offset increases in Japan and other Asia/Pacific countries. China's austerity policies caused machine demand to peak in the first half of 2011, making the first half of 2011 in China a strong sales period.
Lower sales in Latin America were a result of changes in dealer inventory, as dealer inventory increased in 2011 and declined in 2012.
Higher sales in North America were driven by increased dealer deliveries to end users resulting from improvements in construction activity.
Construction Industries' profit was $1.789 billion in 2012 compared with $2.056 billion in 2011. Currency was unfavorable primarily because segment profit for 2012 was based on fixed exchange rates set at the beginning of 2012, while segment profit for 2011 was based on fixed exchange rates set at the beginning of 2011. Excluding the impacts of currency, Construction Industries' profit was about flat. Higher manufacturing costs were about offset by favorable price realization.
Resource Industries
Resource Industries' sales were $21.158 billion in 2012, an increase of $5.529 billion, or 35 percent, from 2011. The sales increase was a result of higher volume in all regions of the world, the acquisition of Bucyrus and favorable price realization. New equipment sales accounted for the majority of the increase, while sales for aftermarket parts improved slightly.
Over the past two years we have added capacity for mining products to better align production with expected demand. As a result of the increase in production capability, coupled with our existing mining order backlog, sales were higher than 2011. While sales were up in 2012 compared with 2011, new orders declined significantly. Slow global growth and lower commodity prices resulted in some reductions, delays and cancellation of orders for mining products.
Bucyrus, which was acquired on July 8, 2011, had sales in 2012 of $4.758 billion, with $1.283 billion in North America, $660 million in Latin America, $915 million in EAME and $1.900 billion in Asia/Pacific.
Resource Industries' profit was $4.318 billion in 2012 compared with $3.334 billion in 2011.
Resource Industries' profit increased primarily due to higher sales volume, improved price realization and the impact of Bucyrus. These improvements were partially offset by higher manufacturing costs primarily driven by higher production volume and a goodwill impairment charge related to Siwei of $580 million.
Power Systems
Power Systems' sales were $21.122 billion in 2012, an increase of $1.008 billion, or 5 percent, from 2011. The improvement was a result of the MWM Holding GmbH (MWM) acquisition, improved price realization and increased volume, partially offset by the impact of currency. Excluding acquisitions, sales were up in Asia/Pacific and North America and were down in Latin America and EAME.
Excluding acquisitions, demand for energy resulted in higher sales of engines and turbines for petroleum applications in Asia/Pacific. Sales of our rail products and services, primarily locomotives, increased due to higher demand. These increases were partially offset by lower sales for industrial and electric power generation due to lower end-user demand.
Power Systems' profit was $3.434 billion in 2012 compared with $3.053 billion in 2011. The improvement was primarily due to favorable price realization and higher sales volume, which included the impact of a favorable mix of products. The improvements were partially offset by higher manufacturing costs and SG&A and R&D expenses.
MWM, acquired during the fourth quarter of 2011, added sales of $609 million, primarily in EAME, and increased segment profit by $53 million.
Financial Products Segment
Financial Products' revenues were $3.090 billion, an increase of $87 million, or 3 percent, from 2011. The increase was primarily due to the favorable impact from higher average earning assets and an increase in Insurance Services revenues. These increases were partially offset by the unfavorable impact from lower average financing rates on new and existing finance receivables and operating leases and an unfavorable impact from returned or repossessed equipment.
Financial Products' profit of $763 million was up $176 million from 2011. The increase was primarily due to an $89 million favorable impact from higher average earning assets and an $87 million favorable impact from lower claims experience at Insurance Services. These increases were partially offset by a $33 million unfavorable impact from returned or repossessed equipment.
During 2012, Cat Financial's overall portfolio quality reflected continued improvement. At the end of 2012, past dues at Cat Financial were 2.26 percent compared with 2.80 percent at the end of the third quarter of 2012 and 2.89 percent at the end of 2011. Write-offs, net of recoveries, were $102 million for the full-year 2012, down from $158 million for 2011.
As of December 31, 2012, Cat Financial's allowance for credit losses totaled $426 million or 1.49 percent of net finance receivables, compared with $369 million or 1.47 percent of net finance receivables at year-end 2011.
All Other Segment
All Other segment includes groups that provide services such as component manufacturing, remanufacturing and logistics. The increase in profit from 2011 was due to the gain from the third-quarter 2012 sale of a majority interest in our third party logistics business.
Corporate Items and Eliminations
Expense for corporate items and eliminations was $2.463 billion in 2012, about flat with 2011. Corporate items and eliminations include: corporate-level expenses; timing differences, as some expenses are reported in segment profit on a cash basis; retirement benefit costs other than service cost; currency differences, as segment profit is reported using annual fixed exchange rates; and inter-segment eliminations.
Corporate-level expenses and expense from timing and other methodology differences increased compared to 2011. These items were about offset by favorable currency differences. Segment profit for 2012 is based on fixed exchange rates set at the beginning of 2012, while segment profit for 2011 is based on fixed exchange rates set at the beginning of 2011. The difference in actual exchange rates compared with fixed exchange rates is included in corporate items and eliminations and is not reflected in segment profit.
RESTRUCTURING COSTS
Restructuring costs for 2013, 2012, and 2011 were $200 million, $94 million and $112 million, respectively. The 2013 restructuring costs included $151 million of employee separation costs, $41 million of fixed asset impairments and $8 million of other restructuring costs. The 2012 and 2011 costs were for employee separations.
The most significant charges in 2013 were for the restructuring of management and support functions and the closure or downsizing of several facilities related to our mining business which is included in the Resource Industries segment. The separation charges in 2012 were primarily in the Power Systems segment and were related to the closure of the Electro-Motive Diesel facility located in London, Ontario and separation programs in Europe. The separation charges in 2011 were primarily in the Resource Industries segment and were related to the acquisition of Bucyrus.
The following table summarizes the 2011, 2012 and 2013 employee separation activity:
|
| | | |
| (Millions of dollars) | Total |
| Liability balance at December 31, 2010 | $ | 22 |
|
| Increase in liability (separation charges) | 112 |
|
| Reduction in liability (payments and other adjustments) | (44 | ) |
| Liability balance at December 31, 2011 | $ | 90 |
|
| Increase in liability (separation charges) | 94 |
|
| Reduction in liability (payments and other adjustments) | (155 | ) |
| Liability balance at December 31, 2012 | $ | 29 |
|
| Increase in liability (separation charges) | 151 |
|
| Reduction in liability (payments and other adjustments) | (91 | ) |
| Liability balance at December 31, 2013 | $ | 89 |
|
| | |
The remaining liability balance as of December 31, 2013 represents costs for employees that have either not yet separated from the Company or their full severance has not yet been paid. The majority of these remaining costs are expected to be paid in 2014.
We expect to incur restructuring costs of about $400 to $500 million, or $0.50 to $0.60 per share during 2014. The charges are primarily related to employee cash separation costs.
The most significant item is the restructuring of our Gosselies, Belgium, facility (part of our Construction Industries segment) that we announced on December 23, 2013. This restructuring plan is designed to improve the competitiveness of our European manufacturing footprint and achieve competitiveness in our European operations by refocusing our current Gosselies operations on final machine assembly, test and paint with limited component and fabrication operations. These actions will include reshaping our supply base for more efficient sourcing, improving factory efficiencies and workforce reductions. Our proposals were subject to Belgian Ministerial approval. We estimate the employee cash separation costs to be about $300 million before tax, which represents substantially all of the restructuring costs to be incurred under the plan. In February 2014, our proposals were approved by the Belgian Minister of Employment and we expect to recognize substantially all of these separation-related charges throughout 2014.
The remaining restructuring costs of about $100 to $200 million are related to a wide range of actions under consideration across the company that are part of our ongoing efforts to optimize our cost structure and improve the efficiency of our operations.
We expect that the actions taken in 2013 and anticipated in 2014 to have a favorable impact on costs (not including the restructuring costs) of about $200 million in 2014 and about $400 to $500 million per year after 2015. The most significant reason the 2014 impact is lower than the impact after 2015 is the timeframe involved in implementing the program in Gosselies, Belgium. It is an extensive program that will take several years to complete. In addition, many of the actions we are expecting to take in 2014
will occur over the course of the year and, as a result, we are expecting partial year benefits. About 75 percent of the expected benefit in 2014 is related to the Resource Industries segment, primarily from actions taken in 2013.
ACQUISITIONS AND DIVESTITURES
ERA Mining Machinery Limited (Siwei)
During the second quarter of 2012, Caterpillar, through its wholly-owned subsidiary Caterpillar (Luxembourg) Investment Co. S.A. (CAT Lux), completed a tender offer to acquire the issued shares of ERA Mining Machinery Limited (Siwei), including its wholly-owned subsidiary Zhengzhou Siwei Mechanical Manufacturing Co., Ltd. In the fourth quarter 2013, Siwei was renamed Caterpillar (Zhengzhou) Ltd. Substantially all of the issued shares of Siwei, a public company listed on the Hong Kong Exchange, were acquired at the end of May 2012. In October 2012, the remaining shares of Siwei common stock were acquired for approximately $7 million in cash. Siwei primarily designs, manufactures, sells and supports underground coal mining equipment in mainland China and is known for its expertise in manufacturing mining roof support equipment. The acquisition supports Caterpillar's long-term commitment to invest in China in order to support our growing base of Chinese customers and will further expand our underground mining business both inside and outside of China.
The tender offer allowed Siwei shareholders to choose between two types of consideration in exchange for their shares. The alternatives were either cash consideration of HK$0.88 or a HK$1.00 loan note issued by CAT Lux to the former shareholders of Siwei that provided, subject to its terms, for the holder to receive on redemption a minimum of HK$0.75 up to a maximum of HK$1.15 depending on Siwei's consolidated gross profit for 2012 and 2013. Approximately 4 billion Siwei shares were tendered for the cash alternative and approximately 1.6 billion Siwei shares were tendered for the loan note alternative. The purchase price of approximately $677 million was comprised of net cash paid of approximately $444 million ($475 million in cash paid for shares and to cancel share options less cash acquired of $31 million), the fair value of the loan notes of $152 million, approximately $168 million of assumed third-party short term borrowings and notes payable, a loan and interest payable to Caterpillar from Siwei of $51 million, less restricted cash acquired of approximately $138 million. The noncontrolling interest for the outstanding shares not tendered was approximately $7 million.
The transaction was financed with available cash and included the issuance of loan notes to certain former shareholders of Siwei, which had a debt component and a portion that was contingent consideration. The $152 million fair value represented the minimum redemption amount of the debt component payable in April 2013.
Tangible assets as of the acquisition date and after giving effect to the adjustments described below were $598 million, recorded at their fair values, and primarily included cash of $31 million, restricted cash of $138 million, receivables of $184 million, inventories of $77 million and property, plant and equipment of $94 million. Finite-lived intangible assets acquired of $112 million were primarily related to customer relationships and also included trade names. The finite-lived intangible assets are being amortized on a straight-line basis over a weighted average amortization period of approximately 14 years. Liabilities assumed as of the acquisition date and after giving effect to the adjustments described below were $626 million, recorded at their fair values, and primarily included accounts payable of $352 million, third-party short term borrowings and notes payable of $168 million and accrued expenses of $37 million. Additionally, deferred tax liabilities were $25 million. Goodwill of $625 million, substantially all of which is non-deductible for income tax purposes, represented the excess of the consideration transferred over the net assets recognized and represented the estimated future economic benefits arising from other assets acquired that could not be individually identified and separately recognized. Goodwill will not be amortized, but will be tested for impairment at least annually. Factors that contributed to a purchase price resulting in the recognition of goodwill include expected cost savings primarily from increased purchasing power for raw materials, improved working capital management, expanded underground mining equipment sales opportunities in China and internationally, along with the acquired assembled workforce. The results of the acquired business for the period from the acquisition date are included in the accompanying consolidated financial statements and are reported in the Resource Industries segment. Assuming this transaction had been made at the beginning of any period presented, the consolidated pro forma results would not be materially different from reported results.
In November 2012, Caterpillar became aware of inventory accounting discrepancies at Siwei which led to an internal investigation. Caterpillar's investigation determined that Siwei had engaged in accounting misconduct prior to Caterpillar's acquisition of Siwei in mid-2012. The accounting misconduct included inappropriate accounting practices involving improper cost allocation that resulted in overstated profit and improper revenue recognition practices involving early and, at times unsupported, revenue recognition. Due to the identified accounting misconduct that occurred before the acquisition, measurement period adjustments were made to the fair value of the acquired assets and assumed liabilities during the fourth quarter of 2012. The fair values presented above are a final allocation of the purchase price and reflect these changes, which are primarily comprised of a decrease in finite-lived intangible assets of $82 million, a decrease in receivables of $29 million, a decrease in inventory of $17 million and a net increase in liabilities of $23 million, resulting in an increase in goodwill of $149 million.
Because of the accounting misconduct identified in the fourth quarter of 2012, Siwei's goodwill was tested for impairment as of November 30, 2012. We determined the carrying value of Siwei, which is a separate reporting unit, exceeded its fair value at the measurement date, requiring step two in the impairment test process. The fair value of the Siwei reporting unit was determined primarily using an income approach based on the present value of discounted cash flows. We assigned the fair value to the reporting unit's assets and liabilities and determined the implied fair value of goodwill was substantially below the carrying value of the reporting unit's goodwill. Accordingly, we recognized a $580 million goodwill impairment charge, which resulted in goodwill of approximately $45 million remaining for Siwei. The goodwill impairment was a result of changes in the assumptions used to determine the fair value resulting from the accounting misconduct that occurred before the acquisition. There was no tax benefit associated with this impairment charge. The Siwei goodwill impairment charge was reported in the fourth quarter of 2012 in the Resource Industries segment.
In May 2013, Caterpillar and its wholly-owned subsidiaries CAT Lux and Siwei entered into a settlement agreement with two former directors of Siwei and two other parties with an interest in the settlement, including Mining Machinery Limited (MML). The agreement settles the dispute between the parties which arose from Caterpillar's determination that Siwei senior managers had engaged in accounting misconduct for several years prior to Caterpillar's announcement of the completion of its tender offer for Siwei in the second quarter of 2012.
Under the terms of the settlement agreement, the parties agreed that (i) the loan notes issued by CAT Lux (and guaranteed by Caterpillar) as a portion of the Siwei purchase price and held by MML and (ii) loans made by the two former Siwei directors to Siwei prior to its acquisition by Caterpillar would all be canceled and discharged in exchange for payments by CAT Lux to MML and the two former directors in an aggregate amount of approximately $30 million. As of the settlement in May 2013, the loan notes had a book value of approximately $152 million and the obligation related to the loans by the two former directors was approximately $13 million. The settlement agreement contains a mutual release and discharge of the parties' respective claims with respect to the dispute and contains an agreement by Caterpillar and CAT Lux not to pursue any such claims against either the auditors or former directors of Siwei. The settlement and discharge of the loan obligations resulted in the recognition of a gain of approximately $135 million reported in Other operating (income) expenses in and is included in the Resource Industries segment.
MWM Holding GmbH (MWM)
On October 31, 2011, we acquired 100 percent of the equity in privately held MWM Holding GmbH (MWM). Headquartered in Mannheim, Germany, MWM is a global supplier of sustainable, natural gas and alternative-fuel engines. With the acquisition of MWM, Caterpillar expects to expand customer options for sustainable power generation solutions. The purchase price, net of $94 million of acquired cash, was approximately $774 million (€574 million).
The transaction was financed with available cash. Tangible assets as of the acquisition date were $535 million, recorded at their fair values, and primarily included cash of $94 million, receivables of $96 million, inventories of $205 million and property, plant and equipment of $108 million. Finite-lived intangible assets acquired of $221 million were primarily related to customer relationships and also included intellectual property and trade names. The finite lived intangible assets are being amortized on a straight-line basis over a weighted average amortization period of approximately 10 years. Liabilities assumed as of the acquisition date were $284 million, recorded at their fair values, and primarily included accounts payable of $77 million, net deferred tax liabilities of $67 million and advance payments of $43 million. Goodwill of $396 million, approximately $90 million of which is deductible for income tax purposes, represents the excess of cost over the fair value of the net tangible and intangible assets acquired. Factors that contributed to a purchase price resulting in the recognition of goodwill include MWM’s strategic fit into our product and services portfolio, aftermarket support opportunities and the acquired assembled workforce. The results of the acquired business for the period from the acquisition date are included in the accompanying consolidated financial statements and are reported in the Power Systems segment. Assuming this transaction had been made at the beginning of any period presented, the consolidated pro forma results would not be materially different from reported results.
Bucyrus International, Inc.
On July 8, 2011, we completed our acquisition of Bucyrus International, Inc. (Bucyrus). Bucyrus is a designer, manufacturer and marketer of mining equipment for the surface and underground mining industries. The total purchase price was approximately $8.8 billion, consisting of $7.4 billion for the purchase of all outstanding shares of Bucyrus common stock at $92 per share and $1.6 billion of assumed Bucyrus debt, substantially all of which was repaid subsequent to closing, net of $0.2 billion of acquired cash.
We funded the acquisition using available cash, commercial paper borrowings and approximately $4.5 billion of long-term debt issued in May 2011. On May 24, 2011, we issued $500 million of Floating Rate Senior Notes (Three-month USD LIBOR plus
0.10%) due in 2012 and $750 million of Floating Rate Senior Notes (Three-month USD LIBOR plus 0.17%) due in 2013. The interest rates for the Floating Rate Senior Notes will be reset quarterly. We also issued $750 million of 1.375% Senior Notes due in 2014, $1.25 billion of 3.900% Senior Notes due in 2021, and $1.25 billion of 5.200% Senior Notes due in 2041. The Notes are unsecured obligations of Caterpillar and rank equally with all other senior unsecured indebtedness.
Bucyrus contributed the following to sales and to profit before taxes (inclusive of deal-related and integration costs):
|
| | | | |
| (Millions of dollars) | | July 8, 2011 to December 31, 2011 |
| Sales | | $ | 2,524 |
|
| Profit (loss) before taxes | | $ | (403 | ) |
| | | |
The results of the acquired business for the period from the acquisition date are included in the accompanying consolidated financial statements and are reported in the Resource Industries segment. For the year ended December 31, 2011, we recorded $373 million in costs related to the acquisition of Bucyrus. These acquisition related costs include consulting, legal and advisory fees, severance costs and financing costs.
During the three months ended December 31, 2011, we adjusted the initial allocation of the purchase price which reduced goodwill by $647 million, the net result of purchase accounting adjustments to the fair value of acquired assets and assumed liabilities. During 2012, we finalized the allocation of the purchase price to identifiable assets and liabilities, reducing the amount allocated to goodwill from our December 31, 2011 preliminary allocation by an additional $28 million. These adjustments primarily included a reduction to goodwill to reflect the tax consequences of the expected reversal of differences in the U.S. GAAP and tax basis of assets and liabilities.
The following table summarizes our initial and final allocation of the assets acquired and liabilities assumed as of the acquisition date at estimated fair value.
|
| | | | | | | | |
| | | July 8, 2011 |
| (Millions of dollars) | | Initial | | Final |
| Assets | | |
| | |
|
| Cash | | $ | 203 |
| | $ | 204 |
|
| Receivables - trade and other | | 693 |
| | 705 |
|
| Prepaid expenses | | 154 |
| | 174 |
|
| Inventories | | 2,305 |
| | 2,223 |
|
| Property, plant and equipment - net | | 692 |
| | 694 |
|
| Intangible assets | | 3,901 |
| | 3,901 |
|
| Goodwill | | 5,263 |
| | 4,588 |
|
| Other assets | | 48 |
| | 141 |
|
| Liabilities | | |
| | |
|
| Short-term borrowings | | 24 |
| | 24 |
|
| Long-term debt due within one year | | 16 |
| | 16 |
|
| Accounts payable | | 444 |
| | 465 |
|
| Accrued expenses | | 405 |
| | 433 |
|
| Customer advances | | 668 |
| | 668 |
|
| Other current liabilities | | 426 |
| | 76 |
|
| Long-term debt due after one year | | 1,514 |
| | 1,528 |
|
| Noncurrent deferred income tax liabilities | | 1,874 |
| | 1,449 |
|
| Other liabilities | | 434 |
| | 517 |
|
| Net assets acquired | | $ | 7,454 |
| | $ | 7,454 |
|
| | | | | |
The following table is a summary of the fair value estimates of the acquired identifiable intangible assets and weighted–average useful lives. These intangible assets recorded as a result of the acquisition are being amortized on a straight-line basis over their respective weighted-average useful life.
|
| | | | | | |
| (Millions of dollars) | | | | |
| | | Fair Value | | Weighted-average
useful life (in years) |
| Customer relationships | | $ | 2,337 |
| | 15 |
| Intellectual property | | 1,489 |
| | 12 |
| Other | | 75 |
| | 4 |
| Total | | $ | 3,901 |
| | 14 |
| | | | | |
Goodwill in the amount of $4,588 million was recorded for the acquisition of Bucyrus. Goodwill is calculated as the excess of the consideration transferred over the net assets recognized and represents the estimated future economic benefits arising from other assets acquired that could not be individually identified and separately recognized. Goodwill will not be amortized, but will be tested for impairment at least annually. Approximately $500 million of the goodwill is deductible for tax purposes. Goodwill largely consists of expected synergies resulting from the acquisition. Key areas of expected cost savings include elimination of redundant selling, general and administrative expenses and increased purchasing power for raw materials and supplies. We also anticipate the acquisition will produce growth synergies as a result of the combined businesses’ broader product portfolio in the mining industry.
A single estimate of fair value results from a complex series of judgments about future events and uncertainties and relies heavily on estimates and assumptions. The judgments used to determine the estimated fair value assigned to each class of assets acquired and liabilities assumed, as well as asset lives, can materially impact our results of operations.
The unaudited pro forma results presented below include the effects of the Bucyrus acquisition as if it had occurred as of January 1, 2010. The unaudited pro forma results reflect certain adjustments related to the acquisition, such as the amortization associated with estimates for the acquired intangible assets, fair value adjustments for inventory, contracts and the impact of acquisition financing. The 2011 supplemental pro forma earnings excluded $373 million of acquisition related costs, including consulting, legal and advisory fees, severance costs and financing expense prior to debt issuance. Also, the 2011 supplemental pro forma earnings were adjusted to exclude $303 million of nonrecurring expense related to the fair value adjustment to acquisition-date inventory and $25 million acceleration of Bucyrus stock compensation expense.
The pro forma results do not include any anticipated synergies or other expected benefits of the acquisition. Accordingly, the unaudited pro forma financial information below is not necessarily indicative of either future results of operations or results that might have been achieved had the acquisition been completed on the dates indicated.
|
| | | | | |
| | | |
| (Dollars in millions except per share data) | | Year Ended December 31, 2011 | |
| Total Sales and revenues | | $ | 62,281 |
| |
| Profit | | $ | 5,401 |
| |
| Profit per common share | | $ | 8.37 |
| |
| Profit per common share – diluted | | $ | 8.11 |
| |
Bucyrus Distribution Business Divestitures
In conjunction with our acquisition of Bucyrus in July 2011, we announced our intention to sell the Bucyrus distribution business to Caterpillar dealers that support mining customers around the world in a series of individual transactions. Bucyrus predominantly employed a direct to end customer model to sell and support products. The intention is for all Bucyrus products to be sold and serviced by Caterpillar dealers, consistent with our long-held distribution strategy. These transitions are occurring in phases based on the mining business opportunity within each dealer territory.
As portions of the Bucyrus distribution business are sold or classified as held for sale, they will not qualify as discontinued operations because Caterpillar expects significant continuing direct cash flows from the Caterpillar dealers after the divestitures. The gain or loss on disposal, along with the continuing operations of these disposal groups, will be reported in the Resource Industries segment. Goodwill will be allocated to each disposal group using the relative fair value method. The value of the customer relationship intangibles related to each portion of the Bucyrus distribution business to be sold will be included in the disposal groups. The disposal groups will be recorded at the lower of their carrying value or fair value less cost to sell. In 2013 and 2012, we recorded asset impairment charges of $11 million and $27 million respectively, related to disposal groups being sold to Caterpillar dealers. Fair value was determined based upon the negotiated sales price. The impairments were recorded in Other operating (income) expenses and included in the Resource Industries segment. The portions of the distribution business that were sold were not material to our results of operations, financial position or cash flow.
In 2013, we completed 19 sale transactions whereby we sold portions of the Bucyrus distribution business to Caterpillar dealers for an aggregate price of $466 million. A portion of these transactions are subject to certain working capital adjustments. For the full year 2013, after-tax profit was unfavorably impacted by $39 million as a result of the Bucyrus distribution divestiture activities. This is comprised of $95 million of income related to sales transactions, a $34 million unfavorable adjustment due to a change in estimate to increase the reserve for parts returns related to prior sale transactions (both included in Other operating (income) expenses), costs incurred related to the Bucyrus distribution divestiture activities of $104 million (included in Selling, general and administrative expenses) and an income tax benefit of $4 million.
Assets sold in 2013 included customer relationship intangibles of $127 million, other assets of $65 million, which consisted primarily of inventory and fixed assets, and allocated goodwill of $56 million related to the divested portions of the Bucyrus distribution business.
As part of the 2013 divestitures, Cat Financial provided $132 million of financing to five of the Caterpillar dealers.
In 2012, we completed 12 sale transactions whereby we sold portions of the Bucyrus distribution business to Caterpillar dealers for an aggregate price of $1,443 million, which included $38 million of working capital adjustments paid throughout 2013. For the full year 2012, after-tax profit was unfavorably impacted by $28 million as a result of the Bucyrus distribution divestiture activities. This is comprised of $310 million of income (included in Other operating (income) expenses) related to sales transactions, offset by costs incurred related to the Bucyrus distribution divestiture activities of $177 million (included in Selling, general and administrative expenses) and income tax of $161 million.
Assets sold in 2012 included customer relationship intangibles of $256 million, other assets of $254 million, which consisted primarily of inventory and fixed assets, and allocated goodwill of $405 million related to the divested portions of the Bucyrus distribution business.
As part of the 2012 divestitures, Cat Financial provided $739 million of financing to five of the Caterpillar dealers.
In December 2011, we completed one sale transaction whereby we sold a portion of the Bucyrus distribution business to a Caterpillar dealer for $337 million, which includes a $23 million working capital adjustment paid in the third quarter of 2012. After-tax profit was favorably impacted by $9 million in 2011 as a result of the Bucyrus distribution business divestiture activities. This is comprised of $96 million of income (included in Other operating (income) expenses) primarily related to the sale transaction, offset by costs incurred related to the Bucyrus distribution business divestiture activities of $32 million (included in Selling, general and administrative expenses) and income tax of $55 million. Assets sold included customer relationship intangibles of $63 million, other assets of $53 million, which consisted primarily of inventory and fixed assets, and allocated goodwill of $101 million.
Third Party Logistics Business Divestiture
On July 31, 2012, Platinum Equity acquired a 65 percent equity interest in Caterpillar Logistics Services LLC, the third party logistics division of our wholly owned subsidiary, Caterpillar Logistics Inc., for $567 million subject to certain working capital adjustments. The purchase price of $567 million was comprised of a $107 million equity contribution from Platinum Equity to, and third party debt raised by, Caterpillar Logistics Services LLC. The sale of the third party logistics business supports Caterpillar's increased focus on the continuing growth opportunities in its core businesses. Under the terms of the agreement, Caterpillar retained a 35 percent equity interest.
As a result of the divestiture, we recorded a pretax gain of $278 million (included in Other operating (income) expenses). In addition, we recognized $8 million of incremental incentive compensation expense. The fair value of our retained noncontrolling interest was $58 million, as determined by the $107 million equity contribution from Platinum Equity, and was included in Investments in unconsolidated affiliated companies in Statement 3. The disposal did not qualify as discontinued operations because
Caterpillar has significant continuing involvement through its noncontrolling interest. The financial impact of the disposal was reported in the All Other operating segment. Results for our remaining interest will be recorded in Equity in profit (loss) of unconsolidated affiliated companies and are reported in the All Other operating segment.
The controlling financial interest in Caterpillar Logistics Services LLC was not material to our results of operations, financial position or cash flow.
GLOSSARY OF TERMS
| |
| 1. | All Other Segment - Primarily includes activities such as: the remanufacturing of Cat® engines and components and remanufacturing services for other companies as well as the product management, development, manufacturing, marketing and product support of undercarriage, specialty products, hardened bar stock components and ground engaging tools primarily for Caterpillar products; logistics services; the product management, development, marketing, sales and product support of on-highway vocational trucks for North America; distribution services responsible for dealer development and administration, dealer portfolio management and ensuring the most efficient and effective distribution of machines, engines and parts. On July 31, 2012, we sold a majority interest in Caterpillar’s third party logistics business. |
| |
| 2. | Consolidating Adjustments - Eliminations of transactions between Machinery and Power Systems and Financial Products. |
| |
| 3. | Construction Industries - A segment primarily responsible for supporting customers using machinery in infrastructure and building construction applications. Responsibilities include business strategy, product design, product management and development, manufacturing, marketing and sales and product support. The product portfolio includes backhoe loaders, small wheel loaders, small track-type tractors, skid steer loaders, multi-terrain loaders, mini excavators, compact wheel loaders, select work tools, small, medium and large track excavators, wheel excavators, medium wheel loaders, compact track loaders, medium track-type tractors, track-type loaders, motor graders and pipelayers. In addition, Construction Industries has responsibility for Power Systems and three wholly-owned dealers in Japan and an integrated manufacturing cost center. |
| |
| 4. | Currency - With respect to sales and revenues, currency represents the translation impact on sales resulting from changes in foreign currency exchange rates versus the U.S. dollar. With respect to operating profit, currency represents the net translation impact on sales and operating costs resulting from changes in foreign currency exchange rates versus the U.S. dollar. Currency includes the impact on sales and operating profit for the Machinery and Power Systems lines of business only; currency impacts on Financial Products revenues and operating profit are included in the Financial Products portions of the respective analyses. With respect to other income/expense, currency represents the effects of forward and option contracts entered into by the company to reduce the risk of fluctuations in exchange rates and the net effect of changes in foreign currency exchange rates on our foreign currency assets and liabilities for consolidated results. |
| |
| 5. | Debt-to-Capital Ratio - A key measure of Machinery and Power Systems’ financial strength used by both management and our credit rating agencies. The metric is defined as Machinery and Power Systems’ short-term borrowings, long-term debt due within one year and long-term debt due after one year (debt) divided by the sum of Machinery and Power Systems’ debt and stockholders’ equity. Debt also includes Machinery and Power Systems’ borrowings from Financial Products. |
| |
| 6. | EAME - A geographic region including Europe, Africa, the Middle East and the Commonwealth of Independent States (CIS). |
| |
| 7. | Earning Assets - Assets consisting primarily of total finance receivables net of unearned income, plus equipment on operating leases, less accumulated depreciation at Cat Financial. |
| |
| 8. | Financial Products Segment - Provides financing to customers and dealers for the purchase and lease of Caterpillar and other equipment, as well as some financing for Caterpillar sales to dealers. Financing plans include operating and finance leases, installment sale contracts, working capital loans and wholesale financing plans. The segment also provides various forms of insurance to customers and dealers to help support the purchase and lease of our equipment. |
| |
| 9. | Latin America - Geographic region including Central and South American countries and Mexico. |
| |
| 10. | LIFO Inventory Decrement Benefits - A significant portion of Caterpillar's inventory is valued using the last-in, first-out (LIFO) method. With this method, the cost of inventory is comprised of "layers" at cost levels for years when inventory increases occurred. A LIFO decrement occurs when inventory decreases, depleting layers added in earlier, generally lower cost, years. A LIFO decrement benefit represents the impact on operating profit of charging cost of goods sold with prior-year cost levels rather than current period costs. |
| |
| 11. | Machinery and Power Systems (M&PS) - Represents the aggregate total of Construction Industries, Resource Industries, Power Systems, and All Other Segment and related corporate items and eliminations. |
| |
| 12. | Machinery and Power Systems Other Operating (Income) Expenses - Comprised primarily of gains/losses on disposal of long-lived assets, long-lived asset impairment charges, legal settlements, employee separation charges and benefit plan curtailment, settlement and contractual termination benefits. |
| |
| 13. | Manufacturing Costs - Manufacturing costs exclude the impacts of currency and represent the volume-adjusted change for variable costs and the absolute dollar change for period manufacturing costs. Variable manufacturing costs are defined as having a direct relationship with the volume of production. This includes material costs, direct labor and other costs that vary directly with production volume such as freight, power to operate machines and supplies that are consumed in the manufacturing process. Period manufacturing costs support production but are defined as generally not having a direct relationship to short-term changes in volume. Examples include machinery and equipment repair, depreciation on manufacturing assets, facility support, procurement, factory scheduling, manufacturing planning and operations management. |
| |
| 14. | Power Systems - A segment primarily responsible for supporting customers using reciprocating engines, turbines and related parts across industries serving electric power, industrial, petroleum and marine applications as well as rail-related businesses. Responsibilities include business strategy, product design, product management, development, manufacturing, marketing, sales and product support of reciprocating engine powered generator sets, integrated systems used in the electric power generation industry, reciprocating engines and integrated systems and solutions for the marine and petroleum industries; reciprocating engines supplied to the industrial industry as well as Caterpillar machinery; the business strategy, product design, product management, development, manufacturing, marketing, sales and product support of turbines and turbine-related services; the development, manufacturing, remanufacturing, maintenance, leasing, and service of diesel-electric locomotives and components and other rail-related products and services. |
| |
| 15. | Price Realization - The impact of net price changes excluding currency and new product introductions. Consolidated price realization includes the impact of changes in the relative weighting of sales between geographic regions. |
| |
| 16. | Resource Industries - A segment primarily responsible for supporting customers using machinery in mining and quarrying applications. Responsibilities include business strategy, product design, product management and development, manufacturing, marketing and sales and product support. The product portfolio includes large track-type tractors, large mining trucks, underground mining equipment, electric rope shovels, draglines, hydraulic shovels, drills, highwall miners, tunnel boring equipment, large wheel loaders, off-highway trucks, articulated trucks, wheel tractor scrapers, wheel dozers, select work tools, forestry products, paving products, industrial and waste products, machinery components and electronics and control systems. Resource Industries also manages areas that provide services to other parts of the company, including integrated manufacturing and research and development. In addition, segment profit includes the impact from divestiture of portions of the Bucyrus distribution business and the acquisition of Siwei. |
| |
| 17. | Restructuring Costs - Primarily costs for employee severance and long-lived asset impairments. |
| |
| 18. | Sales Volume - With respect to sales and revenues, sales volume represents the impact of changes in the quantities sold for Machinery and Power Systems as well as the incremental revenue impact of new product introductions, including emissions-related product updates. With respect to operating profit, sales volume represents the impact of changes in the quantities sold for Machinery and Power Systems combined with product mix as well as the net operating profit impact of new product introductions, including emissions-related product updates. Product mix represents the net operating profit impact of changes in the relative weighting of Machinery and Power Systems sales with respect to total sales. |
| |
| 19. | Siwei - ERA Mining Machinery Limited, including its wholly-owned subsidiary Zhengzhou Siwei Mechanical & Electrical Manufacturing Co., Ltd., commonly known as Siwei, which was acquired during the second quarter of 2012. Siwei primarily designs, manufactures, sells and supports underground coal mining equipment in China and is included in our Resource Industries segment. In the fourth quarter of 2013, Siwei was renamed to Caterpillar (Zhengzhou) Ltd. |
LIQUIDITY AND CAPITAL RESOURCES
Sources of funds
We generate significant capital resources from operating activities, which are the primary source of funding for our Machinery and Power Systems' operations. Funding for these businesses is also available from commercial paper and long-term debt issuances. Financial Products' operations are funded primarily from commercial paper, term debt issuances and collections from its existing
portfolio. Throughout 2013, we experienced favorable liquidity conditions globally in both our Machinery and Power Systems and Financial Products' operations. On a consolidated basis, we ended 2013 with $6.08 billion of cash, an increase of $591 million from year-end 2012. We intend to maintain a strong cash and liquidity position. Our cash balances are held in numerous locations throughout the world with approximately $3.5 billion held by our non-U.S. subsidiaries. Amounts held outside the United States are available for general corporate use and could be used in the United States without incurring significant additional U.S. taxes.
Consolidated operating cash flow for 2013 was $10.19 billion up from $5.18 billion in 2012. The increase was primarily due to favorable changes in inventory and accounts payable. Throughout 2013, inventory decreased significantly, whereas during 2012, there was an increase in inventory. In mid-2012, as order rates declined, we began lowering production schedules and incoming material purchases from suppliers around the world to bring inventory levels in line with expected demand. While production schedules began to decline in the second half of 2012, the most significant impacts on inventory occurred in the fourth quarter of 2012 and throughout 2013. We believe current inventory and production levels are reasonably aligned with anticipated demand. Changes in accounts payable had a slight positive impact on operating cash flow in 2013, whereas during the second half of 2012, a decline in material purchases to support inventory reduction, resulted in lower accounts payable. In addition, changes in receivables had a positive impact on operating cash flow, primarily due to lower sales in 2013. These favorable items were partially offset by lower profit. See further discussion of operating cash flow under Machinery and Power Systems and Financial Products.
Total debt as of December 31, 2013, was $37.75 billion, a decrease of $2.39 billion from year-end 2012. Debt related to Machinery and Power Systems decreased $1.64 billion in 2013, primarily due to payments on matured long-term debt and short-term borrowings. Debt related to Financial Products decreased $753 million, due to an increase in payments, partially offset by increasing portfolio balances.
We have three global credit facilities with a syndicate of banks totaling $10.00 billion (Credit Facility) available in the aggregate to both Caterpillar and Cat Financial for general liquidity purposes. Based on management's allocation decision, which can be revised from time to time, the portion of the Credit Facility available to Machinery and Power Systems as of December 31, 2013 was $2.75 billion. Our three Global Credit Facilities are:
| |
| • | The 364-day facility of $3.00 billion (of which $0.82 billion is available to Machinery and Power Systems) expires in September 2014. |
| |
| • | The 2010 four-year facility, as amended in September 2013, of $2.60 billion (of which $0.72 billion is available to Machinery and Power Systems) expires in September 2016. |
| |
| • | The 2011 five-year facility, as amended in September 2013, of $4.40 billion (of which $1.21 billion is available to Machinery and Power Systems) expires in September 2018. |
At December 31, 2013, Caterpillar's consolidated net worth was $25.03 billion, which was above the $9.00 billion required under the Credit Facility. The consolidated net worth is defined as the consolidated stockholder's equity including preferred stock but excluding the pension and other postretirement benefits balance within Accumulated other comprehensive income (loss).
At December 31, 2013, Cat Financial's covenant interest coverage ratio was 1.96 to 1. This is above the 1.15 to 1 minimum ratio calculated as (1) profit excluding income taxes, interest expense and net gain/(loss) from interest rate derivatives to (2) interest expense calculated at the end of each calendar quarter for the rolling four quarter period then most recently ended, required by the Credit Facility.
In addition, at December 31, 2013, Cat Financial's six-month covenant leverage ratio was 8.14 to 1 and year-end covenant leverage ratio was 7.99 to 1. This is below the maximum ratio of debt to net worth of 10 to 1, calculated (1) on a monthly basis as the average of the leverage ratios determined on the last day of each of the six preceding calendar months and (2) at each December 31, required by the Credit Facility.
In the event Caterpillar or Cat Financial does not meet one or more of their respective financial covenants under the Credit Facility in the future (and are unable to obtain a consent or waiver), the syndicate of banks may terminate the commitments allocated to the party that does not meet its covenants. Additionally, in such event, certain of Cat Financial's other lenders under other loan agreements where similar financial covenants or cross default provisions are applicable, may, at their election, choose to pursue remedies under those loan agreements, including accelerating the repayment of outstanding borrowings. At December 31, 2013, there were no borrowings under the Credit Facility.
Our total credit commitments as of December 31, 2013 were:
|
| | | | | | | | | | | | |
| | | | | | | |
| | | December 31, 2013 |
| (Millions of dollars) | | Consolidated | | Machinery and Power Systems | | Financial Products |
| Credit lines available: | | |
| | |
| | |
|
| Global credit facilities | | $ | 10,000 |
| | $ | 2,750 |
| | $ | 7,250 |
|
| Other external | | 4,508 |
| | 229 |
| | 4,279 |
|
| Total credit lines available | | 14,508 |
| | 2,979 |
| | 11,529 |
|
| Less: Commercial paper outstanding | | (2,502 | ) | | — |
| | (2,502 | ) |
| Less: Utilized credit | | (2,044 | ) | | (16 | ) | | (2,028 | ) |
| Available credit | | $ | 9,962 |
| | $ | 2,963 |
| | $ | 6,999 |
|
| | | | | | | |
Other consolidated credit lines with banks as of December 31, 2013 totaled $4.51 billion. These committed and uncommitted credit lines, which may be eligible for renewal at various future dates or have no specified expiration date, are used primarily by our subsidiaries for local funding requirements. Caterpillar or Cat Financial may guarantee subsidiary borrowings under these lines.
In the event that Caterpillar or Cat Financial, or any of their debt securities, experiences a credit rating downgrade, it would likely result in an increase in our borrowing costs and make access to certain credit markets more difficult. In the event economic conditions deteriorate such that access to debt markets becomes unavailable, our Machinery and Power Systems operations would rely on cash flow from operations, use of existing cash balances, borrowings from Cat Financial and access to our Credit Facility. Our Financial Products operations would rely on cash flow from its existing portfolio, existing cash balances, access to our Credit Facility and other credit line facilities of Cat Financial and potential borrowings from Caterpillar. In addition, we maintain a support agreement with Cat Financial, which requires Caterpillar to remain the sole owner of Cat Financial and may, under certain circumstances, require Caterpillar to make payments to Cat Financial should Cat Financial fail to maintain certain financial ratios.
Machinery and Power Systems
Net cash provided by operating activities was $8.96 billion in 2013, compared with $4.20 billion in 2012. The increase was primarily due to favorable changes in inventory and accounts payable. Throughout 2013, inventory decreased significantly, whereas during 2012, there was an increase in inventory. In mid-2012, as order rates declined, we began lowering production schedules and incoming material purchases from suppliers around the world to bring inventory levels in line with expected demand. While production schedules began to decline in the second half of 2012, the most significant impacts on inventory occurred in the fourth quarter of 2012 and throughout 2013. We believe current inventory and production levels are reasonably aligned with anticipated demand. Changes in accounts payable had a slight positive impact on operating cash flow in 2013, whereas during the second half of 2012, a decline in material purchases to support inventory reduction, resulted in lower accounts payable. In addition, changes in receivables had a positive impact on operating cash flow, primarily due to lower sales in 2013. These favorable items were partially offset by lower profit.
Net cash used for investing activities in 2013 was $3.14 billion compared with $1.87 billion in 2012. The change was primarily due to lower cash proceeds from the sale of portions of the Bucyrus distribution business in 2013 as compared to 2012 and the absence of the sale of a majority interest in our third party logistics business during the third quarter of 2012. In addition, there was an increase in net loans to Cat Financial in 2013. Partially offsetting these items were lower capital expenditures in 2013 in response to lower sales.
Net cash used for financing activities in 2013 was $4.51 billion compared with net cash used for financing activities of $773 million in 2012. The change was primarily due to the repurchase of $2 billion of Caterpillar stock as well as the net payment of long-term debt in 2013 as compared with the net issuance of long-term debt in 2012. These items were partially offset by the redemption of the remaining 33 percent interest of Cat Japan in the second quarter of 2012, and the accelerated payment of the fourth quarter 2012 dividend.
Our priorities for the use of cash are maintaining a strong financial position that helps maintain our credit rating, providing capital to support growth, appropriately funding employee benefit plans, paying dividends and repurchasing common stock.
Strong financial position — A key measure of Machinery and Power Systems' financial strength used by both management and our credit rating agencies is Machinery and Power Systems' debt-to-capital ratio. Debt-to-capital is defined as short-
term borrowings, long-term debt due within one year and long-term debt due after one year (debt) divided by the sum of debt and stockholders' equity. Debt also includes Machinery and Power Systems borrowings from Financial Products. The debt-to-capital ratio for Machinery and Power Systems was 29.7 percent at December 31, 2013, just below our target range of 30 to 45 percent. The Machinery and Power Systems' debt-to-capital ratio was 37.4 percent at December 31, 2012. The reduction in the debt-to-capital ratio was due to a reduction of debt during 2013 and an increase in equity, resulting from the year end pension and post-retirement benefit revaluation adjustment and 2013 profit, partially offset by the $2 billion stock repurchase.
Capital to support growth — Capital expenditures during 2013 were $2.61 billion, a decrease of $830 million compared with 2012. The reduction in capital expenditures was in response to lower sales. We expect capital expenditures for 2014 will be slightly lower than 2013 capital expenditures.
Appropriately funded employee benefit plans — During 2013, we made contributions of $541 million to our U.S. defined benefit pension plans and $303 million to our non-U.S. pension plans. We made contributions of $580 million to our U.S. defined benefit pension plans and $446 million to our non-U.S. pension plans in 2012. We expect to make approximately $510 million of required contributions in 2014. We believe we have adequate liquidity resources to fund both U.S. and non-U.S. pension plans.
Paying dividends — Dividends paid totaled $1.11 billion in 2013, representing 52 cents per share paid in the second quarter and 60 cents per share in the third and fourth quarters. During the first quarter of 2013, there was no dividend payment, as it was accelerated into and paid in December 2012. Each quarter, our Board of Directors reviews the company's dividend for the applicable quarter. The Board evaluates the financial condition of the company and considers the economic outlook, corporate cash flow, the company's liquidity needs and the health and stability of global credit markets to determine whether to maintain or change the quarterly dividend.
Common stock repurchases — In February 2007, the Board of Directors authorized the repurchase of $7.5 billion of Caterpillar stock, and in December 2011, the authorization was extended through December 2015. We repurchased $1 billion in stock in both the second and third quarters of 2013. Through the end of 2013, we have repurchased $5.8 billion of Caterpillar stock, leaving approximately $1.7 billion in the authorization. Basic shares outstanding as of December 31, 2013 were 638 million.
In January 2014, we completed the current $7.5 billion stock repurchase program as we entered into a definitive agreement with Citibank, N.A. to purchase shares of our common stock under an accelerated stock repurchase transaction (January ASR Agreement). Pursuant to the terms of the January ASR Agreement, we have agreed to repurchase approximately $1.7 billion of our common stock from Citibank, N.A., with an immediate delivery of approximately 17.7 million shares. The final number of shares to be repurchased and the aggregate cost to Caterpillar will be based on Caterpillar's volume-weighted average stock price during the term of the transaction, which is expected to be completed in March 2014.
In addition, in January 2014, the Board authorized the repurchase of $10 billion of Caterpillar stock, which will expire on December 31, 2018.
Financial Products
Financial Products operating cash flow was $1.28 billion in 2013, compared with $1.26 billion in 2012. Net cash used for investing activities in 2013 was $2.53 billion, compared with $4.52 billion in 2012. The change was primarily due to less net cash used for finance receivables due to slower growth in Cat Financial's portfolio. Net cash provided by financing activities in 2013 was $572 million, compared with $4.30 billion in 2012. The change was primarily due to lower funding requirements for investing activities, the impact of net intercompany borrowings and the use of existing cash.
|
| | | | | | | | | | | | |
| Dividends paid per common share | | | | | | |
| Quarter | | 2013 | | 2012 | | 2011 |
| First | | $ | — |
| 1 | $ | .460 |
| | $ | .440 |
|
| Second | | .520 |
| | .460 |
| | .440 |
|
| Third | | .600 |
| | .520 |
| | .460 |
|
| Fourth | | .600 |
| | 1.040 |
| 1 | .460 |
|
| | | $ | 1.720 |
| | $ | 2.480 |
| | $ | 1.800 |
|
| | | | | | | |
1 There were two dividend payments of $0.52 per share in the fourth quarter of 2012 due to the acceleration of the fourth quarter dividend payment from January 2013 to December 2012. |
Contractual obligations
The company has committed cash outflow related to long-term debt, operating lease agreements, postretirement obligations, purchase obligations, interest on long-term debt and other long-term contractual obligations. Minimum payments for these obligations are:
|
| | | | | | | | | | | | | | | | | | | | | | | | | | | | |
| (Millions of dollars) | | 2014 | | 2015 | | 2016 | | 2017 | | 2018 | | After 2018 | | Total |
| Long-term debt: | | |
| | |
| | |
| | |
| | |
| | |
| | |
|
| Machinery and Power Systems (excluding capital leases) | | $ | 750 |
| | $ | 500 |
| | $ | 516 |
| | $ | 500 |
| | $ | 899 |
| | $ | 5,487 |
| | $ | 8,652 |
|
| Machinery and Power Systems-capital leases | | 10 |
| | 14 |
| | 22 |
| | 7 |
| | 7 |
| | 47 |
| | 107 |
|
| Financial Products | | 6,592 |
| | 6,446 |
| | 4,796 |
| | 2,747 |
| | 2,350 |
| | 2,381 |
| | 25,312 |
|
| Total long-term debt | | 7,352 |
| | 6,960 |
| | 5,334 |
| | 3,254 |
| | 3,256 |
| | 7,915 |
| | 34,071 |
|
| Operating leases | | 244 |
| | 180 |
| | 133 |
| | 99 |
| | 74 |
| | 229 |
| | 959 |
|
Postretirement obligations 1 | | 700 |
| | 1,070 |
| | 1,030 |
| | 1,040 |
| | 700 |
| | 3,000 |
| | 7,540 |
|
| Purchase obligations: | | |
| | |
| | |
| | |
| | |
| | |
| | |
|
Accounts payable 2 | | 6,560 |
| | — |
| | — |
| | — |
| | — |
| | — |
| | 6,560 |
|
Purchase orders 3 | | 7,473 |
| | 2 |
| | 1 |
| | — |
| | — |
| | — |
| | 7,476 |
|
Other contractual obligations 4 | | 427 |
| | 401 |
| | 328 |
| | 190 |
| | 189 |
| | 33 |
| | 1,568 |
|
| Total purchase obligations | | 14,460 |
| | 403 |
| | 329 |
| | 190 |
| | 189 |
| | 33 |
| | 15,604 |
|
Interest on long-term debt 5 | | 968 |
| | 803 |
| | 729 |
| | 621 |
| | 550 |
| | 5,810 |
| | 9,481 |
|
Other long-term obligations 6 | | 267 |
| | 180 |
| | 113 |
| | 83 |
| | 64 |
| | 275 |
| | 982 |
|
| Total contractual obligations | | $ | 23,991 |
| | $ | 9,596 |
| | $ | 7,668 |
| | $ | 5,287 |
| | $ | 4,833 |
| | $ | 17,262 |
| | $ | 68,637 |
|
| |
1 | Amounts represent expected contributions to our pension and other postretirement benefit plans through 2023, offset by expected Medicare Part D subsidy receipts. |
| |
2 | Amount represents invoices received and recorded as liabilities in 2013, but scheduled for payment in 2014. These represent short-term obligations made in the ordinary course of business. |
| |
3 | Amount represents contractual obligations for material and services on order at December 31, 2013 but not yet delivered. These represent short-term obligations made in the ordinary course of business. |
| |
4 | Amounts represent long-term commitments entered into with key suppliers for minimum purchases quantities. |
| |
5 | Amounts represent estimated contractual interest payments on long-term debt, including capital lease interest payments. |
| |
6 | Amounts represent contractual obligations primarily related to logistics services agreements with the third party logistics business in which Caterpillar sold a majority interest in during 2012, software license contracts, IT consulting contracts and outsourcing contracts for benefit plan administration and software system support. |
The total amount of gross unrecognized tax benefits for uncertain tax positions, including positions impacting only the timing of tax benefits, was $759 million at December 31, 2013. Payment of these obligations would result from settlements with taxing authorities. Due to the difficulty in determining the timing of settlements, these obligations are not included in the table above. We do not expect to make a tax payment related to these obligations within the next year that would significantly impact liquidity.
CRITICAL ACCOUNTING POLICIES
The preparation of financial statements in conformity with generally accepted accounting principles requires management to make estimates and assumptions that affect reported amounts. The more significant estimates include: residual values for leased assets, fair values for goodwill impairment tests, impairment of available-for-sale securities, warranty liability, stock-based compensation, reserves for product liability and insurance losses, postretirement benefits, post-sale discounts, credit losses and income taxes. We have incorporated many years of data into the determination of each of these estimates and we have not historically experienced significant adjustments. These assumptions are reviewed at least annually with the Audit Committee of the Board of Directors. Following are the methods and assumptions used in determining our estimates and an indication of the risks inherent in each.
Residual values for leased assets – The residual values for Cat Financial’s leased assets, which are based upon the estimated wholesale market value of leased equipment at the time of the expiration of the lease, are based on a careful analysis of historical wholesale market sales prices, projected forward on a level trend line without consideration for inflation or possible future pricing action. At the inception of the lease, residual values are derived from consideration of the following critical factors: market size and demand, any known significant market/product trends, total expected hours of usage, machine configuration, application, location, model changes, quantities and past re-marketing experience, third-party residual guarantees and contractual customer purchase options. Many of these factors are gathered in an application survey that is completed prior to quotation. The lease agreement also clearly defines applicable return conditions and remedies for non-compliance, to ensure that the leased equipment will be in good operating condition upon return. Model changes and updates, as well as market strength and product acceptance, are monitored and adjustments are made to residual values in accordance with the significance of any such changes. Remarketing sales staff works closely with customers and dealers to manage the sale of lease returns and the recovery of residual exposure.
During the term of the leases, residual amounts are monitored. If estimated market values reflect a non-temporary impairment due to economic factors, obsolescence or other adverse circumstances, the residuals are adjusted to the lower estimated values by a charge to earnings. For equipment on operating leases, the charge is recognized through depreciation expense. For finance leases, it is recognized through a reduction of finance revenue.
Fair values for goodwill impairment tests – We test goodwill for impairment annually, at the reporting unit level, and whenever events or circumstances make it likely that an impairment may have occurred, such as a significant adverse change in the business climate or a decision to sell all or a portion of a reporting unit. We perform our annual goodwill impairment test as of October 1 and monitor for interim triggering events on an ongoing basis.
Goodwill is reviewed for impairment utilizing a qualitative assessment or a two-step process. We have an option to make a qualitative assessment of a reporting unit's goodwill for impairment. If we choose to perform a qualitative assessment and determine the fair value more likely than not exceeds the carrying value, no further evaluation is necessary. For reporting units where we perform the two-step process, the first step requires us to compare the fair value of each reporting unit, which we primarily determine using an income approach based on the present value of discounted cash flows, to the respective carrying value, which includes goodwill. If the fair value of the reporting unit exceeds its carrying value, the goodwill is not considered impaired. If the carrying value is higher than the fair value, there is an indication that an impairment may exist and the second step is required. In step two, the implied fair value of goodwill is calculated as the excess of the fair value of a reporting unit over the fair values assigned to its assets and liabilities. If the implied fair value of goodwill is less than the carrying value of the reporting unit's goodwill, the difference is recognized as an impairment loss.
The impairment test process requires valuation of the respective reporting unit, which we primarily determine using an income approach based on a discounted five year forecasted cash flow with a year-five residual value. The residual value is computed using the constant growth method, which values the forecasted cash flows in perpetuity. The income approach is supported by a reconciliation of our calculated fair value for Caterpillar to the company's market capitalization. The assumptions about future cash flows and growth rates are based on each reporting unit's long-term forecast and are subject to review and approval by senior management. The discount rate is a risk-adjusted weighted average cost of capital, which we believe approximates the rate from a market participant's perspective. The estimated fair value could be impacted by changes in market conditions, interest rates, growth rates, tax rates, costs, pricing and capital expenditures.
Annual impairment tests, completed in the fourth quarter of 2013 and 2011, indicated the fair value of each reporting unit was substantially above its respective carrying value, including Goodwill. Caterpillar's market capitalization has remained significantly above the net book value of the Company.
The 2012 impairment test, completed in the fourth quarter, indicated the fair value of each of our reporting units was above its respective carrying value, including goodwill, with the exception of our Siwei reporting unit. The Siwei impairment test was performed as of November 30 after it came to our attention in the month of November that Siwei had engaged in accounting misconduct prior to Caterpillar's acquisition of Siwei in mid-2012. The accounting misconduct included inappropriate accounting practices involving improper cost allocation that resulted in overstated profit and improper revenue recognition practices involving early and, at times unsupported, revenue recognition. We determined the carrying value of Siwei exceeded its fair value at the measurement date, requiring step two in the impairment test process. We assigned the fair value to the reporting unit's assets and liabilities and determined the implied fair value of goodwill was substantially below the carrying value of the reporting unit's goodwill. Accordingly, we recognized a $580 million goodwill impairment charge, which resulted in goodwill of $45 million remaining for Siwei as of December 31, 2012. The goodwill impairment was a result of changes in the assumptions used to determine the fair value resulting from the accounting misconduct that occurred before the acquisition. There was no tax benefit associated with this impairment charge. The Siwei goodwill impairment charge is reported in the Resource Industries segment.
A prolonged economic downturn resulting in lower long-term growth rates and reduced long-term profitability may reduce the fair value of our reporting units. Industry specific events or circumstances that have a negative impact to the valuation assumptions may also reduce the fair value of our reporting units. Should such events occur and it becomes more likely than not that a reporting unit's fair value has fallen below its carrying value, we will perform an interim goodwill impairment test(s), in addition to the annual impairment test. Future impairment tests may result in a goodwill impairment, depending on the outcome of both step one and step two of the impairment review process. A goodwill impairment would be reported as a non-cash charge to earnings.
Impairment of available-for-sale securities – Available-for-sale securities, primarily at Insurance Services, are reviewed at least quarterly to identify fair values below cost which may indicate that a security is impaired and should be written down to fair value.
For debt securities, once a security’s fair value is below cost we utilize data gathered by investment managers, external sources and internal research to monitor the performance of the security to determine whether an other-than-temporary impairment has occurred. These reviews, which include an analysis of whether it is more likely than not that we will be required to sell the security before its anticipated recovery, consist of both quantitative and qualitative analysis and require a degree of management judgment. Securities in a loss position are monitored and assessed at least quarterly based on severity and timing of loss and may be deemed other-than-temporarily impaired at any time. Once a security’s fair value has been 20 percent or more below its original cost for six consecutive months, the security will be other-than-temporarily impaired unless there are sufficient facts and circumstances supporting otherwise.
For equity securities in a loss position, determining whether a security is other-than-temporarily impaired requires an analysis of that security's historical sector return as well as the volatility of that return. This information is utilized to estimate a security’s future fair value and to assess whether the security has the ability to recover to its original cost over a reasonable period of time. Both historical annualized sector returns and the volatility of those returns are considered over a two year period to arrive at these estimates.
For both debt and equity securities, qualitative factors are also considered in determining whether a security is other-than-temporarily impaired. These include reviews of the following: significant changes in the regulatory, economic or technological environment of the investee, significant changes in the general market condition of either the geographic area or the industry in which the investee operates, and length of time and the extent to which the fair value has been less than cost. These qualitative factors are subjective and require a degree of management judgment.
Warranty liability – At the time a sale is recognized, we record estimated future warranty costs. The warranty liability is determined by applying historical claim rate experience to the current field population and dealer inventory. Generally, historical claim rates are based on actual warranty experience for each product by machine model/engine size by customer or dealer location (inside or outside North America). Specific rates are developed for each product shipment month and are updated monthly based on actual warranty claim experience. Warranty costs may differ from those estimated if actual claim rates are higher or lower than our historical rates.
Stock-based compensation – We use a lattice-based option-pricing model to calculate the fair value of our stock options and SARs. The calculation of the fair value of the awards using the lattice-based option-pricing model is affected by our stock price on the date of grant as well as assumptions regarding the following:
| |
| • | Volatility is a measure of the amount by which the stock price is expected to fluctuate each year during the expected term of the award and is based on historical Caterpillar stock price movement and current implied volatilities from traded options on Caterpillar stock. The implied volatilities from traded options are impacted by changes in market conditions. An increase in the volatility would result in an increase in our expense. |
| |
| • | The expected term represents the period of time that awards granted are expected to be outstanding and is an output of the lattice-based option-pricing model. In determining the expected term of the award, future exercise and forfeiture patterns are estimated from Caterpillar employee historical exercise behavior. These patterns are also affected by the vesting conditions of the award. Changes in the future exercise behavior of employees or in the vesting period of the award could result in a change in the expected term. An increase in the expected term would result in an increase to our expense. |
| |
| • | The weighted-average dividend yield is based on Caterpillar’s historical dividend yields. As holders of stock-based awards do not receive dividend payments, this could result in employees retaining the award for a longer period of time if dividend yields decrease or exercising the award sooner if dividend yields increase. A decrease in the dividend yield would result in an increase in our expense. |
| |
| • | The risk-free interest rate is based on the U.S. Treasury yield curve in effect at time of grant. As the risk-free interest rate increases, the expected term increases, resulting in an increase in our expense. |
The fair value of our RSUs is determined by reducing the stock price on the date of grant by the present value of the estimated dividends to be paid during the vesting period. The estimated dividends are based on Caterpillar’s weighted-average dividend yields. A decrease in the dividend yield would result in an increase in our expense.
Stock-based compensation expense recognized during the period is based on the value of the number of awards that are expected to vest. In determining the stock-based compensation expense to be recognized, a forfeiture rate is applied to the fair value of the award. This rate represents the number of awards that are expected to be forfeited prior to vesting and is based on Caterpillar employee historical behavior. Changes in the future behavior of employees could impact this rate. A decrease in this rate would result in an increase in our expense.
Product liability and insurance loss reserve – We determine these reserves based upon reported claims in process of settlement and actuarial estimates for losses incurred but not reported. Loss reserves, including incurred but not reported reserves, are based on estimates and ultimate settlements may vary significantly from such estimates due to increased claims frequency or severity over historical levels.
Postretirement benefits – Primary actuarial assumptions were determined as follows:
| |
| • | The U.S. expected long-term rate of return on plan assets is based on our estimate of long-term passive returns for equities and fixed income securities weighted by the allocation of our plan assets. Based on historical performance, we increase the passive returns due to our active management of the plan assets. A similar process is used to determine the rate for our non-U.S. pension plans. This rate is impacted by changes in general market conditions, but because it represents a long-term rate, it is not significantly impacted by short-term market swings. Changes in our allocation of plan assets would also impact this rate. For example, a shift to more fixed income securities would lower the rate. A decrease in the rate would increase our expense. |
| |
| • | The assumed discount rate is used to discount future benefit obligations back to today’s dollars. The U.S. discount rate is based on a benefit cash flow-matching approach and represents the rate at which our benefit obligations could effectively be settled as of our measurement date, December 31. The benefit cash flow-matching approach involves analyzing Caterpillar’s projected cash flows against a high quality bond yield curve, calculated using a wide population of corporate Aa bonds available on the measurement date. The very highest and lowest yielding bonds (top and bottom 10 percent) are excluded from the analysis. A similar approach is used to determine the assumed discount rate for our most significant non-U.S. plans. This rate is sensitive to changes in interest rates. A decrease in the discount rate would increase our obligation and future expense. |
| |
| • | The expected rate of compensation increase is used to develop benefit obligations using projected pay at retirement. It represents average long-term salary increases. This rate is influenced by our long-term compensation policies. An increase in the rate would increase our obligation and expense. |
| |
| • | The assumed health care trend rate represents the rate at which health care costs are assumed to increase and is based on historical and expected experience. Changes in our projections of future health care costs due to general economic conditions and those specific to health care (e.g., technology driven cost changes) will impact this trend rate. An increase in the trend rate would increase our obligation and expense. |
The effects of actual results differing from our assumptions and the effects of changing assumptions are considered actuarial gains or losses. Actuarial gains or losses are recorded in Accumulated other comprehensive income (loss). When the unamortized actuarial gains or losses for an individual plan exceed 10 percent of the higher of the projected benefit obligation or 10 percent of market-related value of plans assets at the beginning of the year, the excess is amortized as a component of net periodic benefit cost using the straight-line method. The amortization period is generally the average remaining service period of active employees
expected to receive benefits from the plan. For plans in which all or almost all of the plan’s participants are inactive, actuarial gains or losses are amortized over the remaining life expectancy of the inactive participants.
Post-sale discount reserve – We provide discounts to dealers through merchandising programs. We have numerous programs that are designed to promote the sale of our products. The most common dealer programs provide a discount when the dealer sells a product to a targeted end user. The amount of accrued post-sale discounts was $1,132 million, $1,066 million and $937 million as of December 31, 2013, 2012 and 2011, respectively. The reserve represents discounts that we expect to pay on previously sold units and is reviewed at least quarterly. The reserve is adjusted if discounts paid differ from those estimated. Historically, those adjustments have not been material.
Credit loss reserve – The allowance for credit losses is an estimate of the losses inherent in our finance receivable portfolio and includes consideration of accounts that have been individually identified as impaired, as well as pools of finance receivables where it is probable that certain receivables in the pool are impaired but the individual accounts cannot yet be identified. In identifying and measuring impairment, management takes into consideration past loss experience, known and inherent risks in the portfolio, adverse situations that may affect the borrower’s ability to repay, estimated value of underlying collateral and current economic conditions. In estimating probable credit losses, we review accounts that are past due, non-performing, in bankruptcy or otherwise identified as at-risk for potential credit loss including accounts which have been modified. Accounts are identified as at-risk for potential credit loss using information available about the customer, such as financial statements, news reports and published credit ratings, as well as general information regarding industry trends and the economic environment in which our customers operate.
The allowance for credit losses attributable to specific accounts is based on the most probable source of repayment, which is normally the liquidation of collateral. In determining collateral value, we estimate the current fair market value of the collateral less selling costs. We also consider credit enhancements such as additional collateral and contractual third-party guarantees. The allowance for credit losses attributable to the remaining accounts not yet individually identified as impaired is estimated utilizing probabilities of default and the estimated loss given default. In addition, qualitative factors not able to be fully captured in previous analysis including industry trends, macroeconomic factors and model imprecision are considered in the evaluation of the adequacy of the allowance for credit losses. These qualitative factors are subjective and require a degree of management judgment.
While management believes it has exercised prudent judgment and applied reasonable assumptions, there can be no assurance that in the future, changes in economic conditions or other factors would not cause changes in the financial health of our customers. If the financial health of our customers deteriorates, the timing and level of payments received could be impacted and therefore, could result in a change to our estimated losses.
Income taxes – We are subject to the income tax laws of the many jurisdictions in which we operate. These tax laws are complex, and the manner in which they apply to our facts is sometimes open to interpretation. In establishing the provision for income taxes, we must make judgments about the application of these inherently complex tax laws.
Despite our belief that our tax return positions are consistent with applicable tax laws, we believe that taxing authorities could challenge certain positions. Settlement of any challenge can result in no change, a complete disallowance, or some partial adjustment reached through negotiations or litigation. We record tax benefits for uncertain tax positions based upon management’s evaluation of the information available at the reporting date. To be recognized in the financial statements, a tax benefit must be at least more likely than not of being sustained based on technical merits. The benefit for positions meeting the recognition threshold is measured as the largest benefit more likely than not of being realized upon ultimate settlement with a taxing authority that has full knowledge of all relevant information. Significant judgment is required in making these determinations and adjustments to unrecognized tax benefits may be necessary to reflect actual taxes payable upon settlement. Adjustments related to positions impacting the effective tax rate affect the provision for income taxes. Adjustments related to positions impacting the timing of deductions impact deferred tax assets and liabilities.
Our income tax positions and analysis are based on currently enacted tax law. Future changes in tax law could significantly impact the provision for income taxes, the amount of taxes payable, and the deferred tax asset and liability balances. Deferred tax assets generally represent tax benefits for tax deductions or credits available in future tax returns. Certain estimates and assumptions are required to determine whether it is more likely than not that all or some portion of the benefit of a deferred tax asset will not be realized. In making this assessment, management analyzes and estimates the impact of future taxable income, reversing temporary differences and available prudent and feasible tax planning strategies. Should a change in facts or circumstances lead to a change in judgment about the ultimate realizability of a deferred tax asset, we record or adjust the related valuation allowance in the period that the change in facts and circumstances occurs, along with a corresponding increase or decrease in the provision for income taxes.
A provision for U.S. income taxes has not been recorded on undistributed profits of our non-U.S. subsidiaries that we have determined to be indefinitely reinvested outside the U.S. If management intentions or U.S. tax law changes in the future, there may be a significant negative impact on the provision for income taxes to record an incremental tax liability in the period the change occurs. A deferred tax asset is recognized only if we have definite plans to generate a U.S. tax benefit by repatriating earnings in the foreseeable future.
GLOBAL WORKFORCE
Caterpillar worldwide full-time employment was 118,501 at the end of 2013 compared with 125,341 at the end of 2012, a decrease of 6,840 full-time employees. The flexible workforce decreased 2,863 for a total decrease in the global workforce of 9,703. The decrease was primarily the result of restructuring programs and lower production volumes.
|
| | | | | | | | |
| Full-Time Employees at Year-End | | | | | |
| | 2013 | | 2012 | | 2011 |
| Inside U.S. | 51,877 |
| | 54,558 |
| | 53,236 |
|
| Outside U.S. | 66,624 |
| | 70,783 |
| | 71,863 |
|
| Total | 118,501 |
| | 125,341 |
| | 125,099 |
|
| | | | | | |
| By Region: | |
| | |
| | |
|
| North America | 52,519 |
| | 55,372 |
| | 54,880 |
|
| EAME | 24,927 |
| | 25,611 |
| | 28,778 |
|
| Latin America | 15,385 |
| | 16,441 |
| | 19,111 |
|
| Asia/Pacific | 25,670 |
| | 27,917 |
| | 22,330 |
|
| Total | 118,501 |
| | 125,341 |
| | 125,099 |
|
| �� | | | | | |
OTHER MATTERS
ENVIRONMENTAL AND LEGAL MATTERS
The company is regulated by federal, state and international environmental laws governing our use, transport and disposal of substances and control of emissions. In addition to governing our manufacturing and other operations, these laws often impact the development of our products, including, but not limited to, required compliance with air emissions standards applicable to internal combustion engines. We have made, and will continue to make, significant research and development and capital expenditures to comply with these emissions standards.
We are engaged in remedial activities at a number of locations, often with other companies, pursuant to federal and state laws. When it is probable we will pay remedial costs at a site, and those costs can be reasonably estimated, the investigation, remediation, and operating and maintenance costs are accrued against our earnings. Costs are accrued based on consideration of currently available data and information with respect to each individual site, including available technologies, current applicable laws and regulations, and prior remediation experience. Where no amount within a range of estimates is more likely, we accrue the minimum. Where multiple potentially responsible parties are involved, we consider our proportionate share of the probable costs. In formulating the estimate of probable costs, we do not consider amounts expected to be recovered from insurance companies or others. We reassess these accrued amounts on a quarterly basis. The amount recorded for environmental remediation is not material and is included in Accrued expenses in Statement 3. There is no more than a remote chance that a material amount for remedial activities at any individual site, or at all the sites in the aggregate, will be required.
On October 24, 2013, Progress Rail Services Corporation (Progress Rail), a wholly-owned indirect subsidiary of Caterpillar Inc., received a grand jury subpoena from the U.S. District Court for the Central District of California. The subpoena requests documents and information from Progress Rail, United Industries Corporation, a wholly-owned subsidiary of Progress Rail, and Caterpillar Inc. relating to allegations that Progress Rail conducted improper or unnecessary railcar inspections and repairs and improperly disposed of parts, equipment, tools and other items. In connection with this subpoena, Progress Rail was informed by the U.S. Attorney for the Central District of California that it is a target of a criminal investigation into potential violations of environmental laws and alleged improper business practices. The Company is cooperating with the authorities. The Company is unable to predict the outcome or reasonably estimate the potential loss; however, we currently believe that this matter will not have a material adverse effect on the Company's consolidated results of operation, financial position or liquidity.
Beginning in September 2010, the company filed a series of legal claims to collect policy proceeds from a third party insurance company to recover amounts paid for covered asbestos defense and settlement costs for occurrences between 1962 and 1981. In the fourth quarter of 2013, the company reached final settlement with the third party insurance company. As a result, a gain of $68 million was recognized in Other operating (income) expense in Statement 1.
In addition, we are involved in other unresolved legal actions that arise in the normal course of business. The most prevalent of these unresolved actions involve disputes related to product design, manufacture and performance liability (including claimed asbestos and welding fumes exposure), contracts, employment issues, environmental matters or intellectual property rights. The aggregate range of reasonably possible losses in excess of accrued liabilities, if any, associated with these unresolved legal actions is not material. In some cases, we cannot reasonably estimate a range of loss because there is insufficient information regarding the matter. However, there is no more than a remote chance that any liability arising from these matters would be material. Although it is not possible to predict with certainty the outcome of these unresolved legal actions, we believe that these actions will not individually or in the aggregate have a material adverse effect on our consolidated results of operations, financial position or liquidity.
RETIREMENT BENEFITS
We recognized pension expense of $732 million in 2013 as compared to $723 million in 2012. The increase in expense was primarily due to higher amortization of net actuarial losses mostly due to lower discount rates at the end of 2012 and a $31 million charge to recognize a previously unrecorded liability related to a subsidiary's pension plans. The increase in expense was partially offset by lower interest costs, higher expected return on plan assets due to higher asset levels, $10 million of contractual termination benefits related to the closure of the Electro-Motive Diesel facility (discussed below) recognized in 2012 and $7 million of curtailment expense due to changes in our hourly U.S. pension plan (discussed below) and $7 million of settlement losses due to the disposal of the third party logistics business recognized in 2012. Accounting guidance on retirement benefits requires companies to discount future benefit obligations back to today’s dollars using a discount rate that is based on high-quality fixed income investments. A decrease in the discount rate increases the pension benefit obligation, while an increase in the discount rate decreases the pension benefit obligation. This increase or decrease in the pension benefit obligation is recognized in Accumulated other comprehensive income (loss) and subsequently amortized into earnings as an actuarial gain or loss. The guidance also requires companies to use an expected long-term rate of return on plan assets for computing current year pension expense. Differences between the actual and expected returns are also recognized in Accumulated other comprehensive income (loss) and subsequently amortized into earnings as actuarial gains and losses. At the end of 2013, total actuarial losses recognized in Accumulated other comprehensive income (loss) for pension plans were $5.77 billion, as compared to $9.19 billion in 2012. The majority of the actuarial losses are due to changes in discount rates, losses from other demographic and economic assumptions over the past several years and plan asset losses. The decrease from 2012 to 2013 was primarily the result of an increase in discount rates, current year asset gains and amortization of net actuarial losses into earnings during 2013.
In 2013, we recognized other postretirement benefit expense of $261 million compared to $244 million in 2012. The increase in expense was primarily the result of the absence of $40 million of curtailment gains recognized in 2012, of which $37 million is related to the closure of the Electro-Motive Diesel facility discussed below. This was partially offset by a decrease in expense related to a $22 million adjustment for certain other benefits in 2013. At the end of 2013 total actuarial losses recognized in Accumulated other comprehensive income (loss) for other postretirement benefit plans were $0.66 billion as compared to $1.53 billion in 2012. These losses mainly reflect the impact of discount rates, changes in our health care trend assumption, and plan asset losses, partially offset by gains from lower than expected health care costs. The decrease from 2012 to 2013 was primarily the result of an increase in discount rates, gains from lower than expected health care costs, current year asset gains and amortization of net actuarial losses into earnings during 2013.
Actuarial losses for both pensions and other postretirement benefits will be impacted in future periods by actual asset returns, actual health care inflation, discount rate changes, actual demographic experience and other factors that impact these expenses. These losses, reported in Accumulated other comprehensive income (loss), will generally be amortized as a component of net periodic benefit cost on a straight-line basis over the average remaining service period of active employees expected to receive benefits from the plan. For plans in which all or almost all of the plan’s participants are inactive, actuarial losses are amortized using the straight-line method over the remaining life expectancy of the inactive participants. At the end of 2013, the average remaining service period of active employees or life expectancy for inactive participants was 10 years for our U.S. pension plans, 13 years for non-U.S. pension plans and 9 years for other postretirement benefit plans. We expect our amortization of net actuarial losses to decrease approximately $260 million in 2014 as compared to 2013, primarily due to an increase in discount rates during 2013 and plan asset gains during 2013. We expect our total pension and other postretirement benefits expense to decrease approximately $300 million in 2014 which is primarily due to a decrease in amortization of net actuarial losses.
In February 2012, we announced the closure of the Electro-Motive Diesel facility located in London, Ontario. As a result of the closure, we recognized a $37 million other postretirement benefits curtailment gain. This excludes a $21 million loss of a third-party receivable for other postretirement benefits that was eliminated due to the closure. In addition, a $10 million contractual termination benefit expense was recognized related to statutory pension benefits required to be paid to certain affected employees. As a result, a net gain of $6 million related to the facility closure was recognized in Other operating (income) expenses.
In August 2012, we announced changes to our U.S. hourly pension plan, which impacted certain hourly employees. For the impacted employees, pension benefit accruals were frozen on January 1, 2013 or will freeze January 1, 2016, at which time employees will become eligible for various provisions of company sponsored 401(k) plans including a matching contribution and an annual employer contribution. The plan changes resulted in a curtailment and required a remeasurement as of August 31, 2012. The curtailment and the remeasurement resulted in a net increase in our Liability for postemployment benefits of $243 million and a net loss of $153 million, net of tax, recognized in Accumulated other comprehensive income (loss). The increase in the liability was primarily due to a decline in the discount rate. Also, the curtailment resulted in expense of $7 million which was recognized in Other operating (income) expenses.
For our U.S. pension plans, our year-end 2013 asset allocation was 61 percent equity securities, 34 percent fixed income securities and 5 percent other. Our current U.S. pension target asset allocations are 60 percent equity and 40 percent fixed income. Our strategy includes further aligning our investments to our liabilities, while reducing risk in our portfolio. Target allocation policies will be revisited periodically to ensure they reflect the overall objectives of the fund. The U.S. plans are rebalanced to plus or minus 5 percentage points of the target asset allocation ranges on a monthly basis.
The year-end 2013 asset allocation for our non-U.S. pension plans was 53 percent equity securities, 37 percent fixed income securities, 6 percent real estate and 4 percent other. The 2013 target allocation for our non-U.S. pension plans is 59 percent equity securities, 32 percent fixed income securities, 7 percent real estate and 2 percent other. Our target asset allocations reflect our investment strategy of maximizing the rate of return on plan assets and the resulting funded status, within an appropriate level of risk. The frequency of rebalancing for the non-U.S. plans varies depending on the plan.
The use of certain derivative instruments is permitted where appropriate and necessary for achieving overall investment policy objectives. The plans do not engage in derivative contracts for speculative purposes.
During 2013, we made contributions of $541 million to our U.S. defined benefit pension plans and $303 million to our non-U.S. pension plans. We made contributions of $580 million to our U.S. defined benefit pension plans and $446 million to our non-U.S. pension plans in 2012. We expect to make approximately $510 million of required contributions in 2014. We believe we have adequate liquidity resources to fund both U.S. and non-U.S. pension plans.
Actuarial assumptions have a significant impact on both pension and other postretirement benefit expenses. The effects of a one percentage point change in our primary actuarial assumptions on 2013 benefit costs and year-end obligations are included in the table below.
Postretirement Benefit Plan Actuarial Assumptions Sensitivity
Following are the effects of a one percentage-point change in our primary pension and other postretirement benefit actuarial assumptions (included in the following table) on 2013 pension and other postretirement benefits costs and obligations:
|
| | | | | | | | | | | | | | | | |
| | | 2013 Benefit Cost | | Year-end Benefit Obligation |
| (Millions of dollars) | | One percentage- point increase | | One percentage- point decrease | | One percentage- point increase | | One percentage- point decrease |
| Pension benefits: | | |
| | |
| | |
| | |
|
| Assumed discount rate | | $ | (201 | ) | | $ | 191 |
| | $ | (2,137 | ) | | $ | 2,630 |
|
| Expected rate of compensation increase | | 42 |
| | (53 | ) | | 225 |
| | (211 | ) |
| Expected long-term rate of return on plan assets | | (142 | ) | | 142 |
| | — |
| | — |
|
| Other postretirement benefits: | | |
| | |
| | |
| | |
|
| Assumed discount rate | | (46 | ) | | 51 |
| | (482 | ) | | 542 |
|
| Expected rate of compensation increase | | — |
| | — |
| | 1 |
| | (1 | ) |
| Expected long-term rate of return on plan assets | | (7 | ) | | 7 |
| | — |
| | — |
|
| Assumed health care cost trend rate | | 55 |
| | (46 | ) | | 274 |
| | (230 | ) |
| | | | | | | | | |
|
| | | | | | | | | | | | | | | | | | | | | | | | | | | |
| Primary Actuarial Assumptions | | | | | | | | | | | | | | | | | | |
| | | U.S. Pension Benefits | | Non-U.S. Pension Benefits | | Other Postretirement Benefits |
| | | 2013 | | 2012 | | 2011 | | 2013 | | 2012 | | 2011 | | 2013 | | 2012 | | 2011 |
| Weighted-average assumptions used to determine benefit obligations, end of year: | | |
| | |
| | |
| | |
| | |
| | |
| | |
| | |
| | |
|
| Discount rate | | 4.6 | % | | 3.7 | % | | 4.3 | % | | 4.1 | % | | 3.7 | % | | 4.3 | % | | 4.6 | % | | 3.7 | % | | 4.3 | % |
| Rate of compensation increase | | 4.0 | % | | 4.5 | % | | 4.5 | % | | 4.2 | % | | 3.9 | % | | 3.9 | % | | 4.0 | % | | 4.4 | % | | 4.4 | % |
| | | | | | | | | | | | | | | | | | | |
| Weighted-average assumptions used to determine net cost: | | |
| | |
| | |
| | |
| | |
| | |
| | |
| | |
| | |
|
| Discount rate | | 3.7 | % | | 4.3 | % | | 5.1 | % | | 3.7 | % | | 4.3 | % | | 4.6 | % | | 3.7 | % | | 4.3 | % | | 5.0 | % |
| Expected rate of return on plan assets | | 7.8 | % | | 8.0 | % | | 8.5 | % | | 6.8 | % | | 7.1 | % | | 7.1 | % | | 7.8 | % | | 8.0 | % | | 8.5 | % |
| Rate of compensation increase | | 4.5 | % | | 4.5 | % | | 4.5 | % | | 3.9 | % | | 3.9 | % | | 4.1 | % | | 4.4 | % | | 4.4 | % | | 4.4 | % |
| | | | | | | | | | | | | | | | | | | |
| Health care cost trend rates at year-end: | | |
| | |
| | |
| | |
| | |
| | |
| | |
| | |
| | |
|
| Health care trend rate assumed for next year | | 6.6 | % | | 7.1 | % | | 7.4 | % |
| Rate that the cost trend rate gradually declines to | | 5.0 | % | | 5.0 | % | | 5.0 | % |
| Year that the cost trend rate reaches ultimate rate | | 2019 |
| | 2019 |
| | 2019 |
|
| | | | | | | | | | | | | | | | | | | |
SENSITIVITY
Foreign Exchange Rate Sensitivity
Machinery and Power Systems use foreign currency forward and option contracts to manage unmatched foreign currency cash inflow and outflow. Our objective is to minimize the risk of exchange rate movements that would reduce the U.S. dollar value of our foreign currency cash flow. Our policy allows for managing anticipated foreign currency cash flow for up to five years. Based on the anticipated and firmly committed cash inflow and outflow for our Machinery and Power Systems operations for the next 12 months and the foreign currency derivative instruments in place at year-end, a hypothetical 10 percent weakening of the U.S. dollar relative to all other currencies would adversely affect our expected 2014 cash flow for our Machinery and Power Systems operations by approximately $361 million. Last year similar assumptions and calculations yielded a potential $526 million adverse impact on 2013 cash flow. We determine our net exposures by calculating the difference in cash inflow and outflow by currency
and adding or subtracting outstanding foreign currency derivative instruments. We multiply these net amounts by 10 percent to determine the sensitivity.
Since our policy for Financial Products operations is to hedge the foreign exchange risk when the currency of our debt portfolio does not match the currency of our receivable portfolio, a 10 percent change in the value of the U.S. dollar relative to all other currencies would not have a material effect on our consolidated financial position, results of operations or cash flow. Neither our policy nor the effect of a 10 percent change in the value of the U.S. dollar has changed from that reported at the end of last year.
The effect of the hypothetical change in exchange rates ignores the effect this movement may have on other variables, including competitive risk. If it were possible to quantify this competitive impact, the results would probably be different from the sensitivity effects shown above. In addition, it is unlikely that all currencies would uniformly strengthen or weaken relative to the U.S. dollar. In reality, some currencies may weaken while others may strengthen. Our primary exposure (excluding competitive risk) is to exchange rate movements in the euro, Japanese yen, British pound and Australian dollar.
Interest Rate Sensitivity
For our Machinery and Power Systems operations, we have the option to use interest rate swaps to lower the cost of borrowed funds by attaching fixed-to-floating interest rate swaps to fixed-rate debt, and by entering into forward rate agreements on future debt issuances. A hypothetical 100 basis point adverse move in interest rates along the entire interest rate yield curve would have a minimal impact to 2014 pre-tax earnings of Machinery and Power Systems. Last year, similar assumptions and calculations yielded a potential $14 million adverse impact on 2013 pre-tax earnings. This effect is caused by the interest rate fluctuations on our short-term debt and forward and fixed-to-floating interest rate swaps.
For our Financial Products operations, we use interest rate derivative instruments primarily to meet our match-funding objectives and strategies. We have a match-funding policy whereby the interest rate profile (fixed or floating rate) of our debt portfolio is matched to the interest rate profile of our earning asset portfolio (finance receivables and operating leases) within certain parameters. In connection with that policy, we use interest rate swap agreements to modify the debt structure. Match funding assists us in maintaining our interest rate spreads, regardless of the direction interest rates move.
In order to properly manage sensitivity to changes in interest rates, Financial Products measures the potential impact of different interest rate assumptions on pre-tax earnings. All on-balance sheet positions, including derivative financial instruments, are included in the analysis. The primary assumptions included in the analysis are that there are no new fixed rate assets or liabilities, the proportion of fixed rate debt to fixed rate assets remains unchanged and the level of floating rate assets and debt remain constant. An analysis of the December 31, 2013 balance sheet, using these assumptions, estimates the impact of a 100 basis point immediate and sustained adverse change in interest rates to have a minimal impact on pre-tax earnings. Last year, similar assumptions and calculations yielded a minimal impact to 2013 pre-tax earnings.
This analysis does not necessarily represent our current outlook of future market interest rate movement, nor does it consider any actions management could undertake in response to changes in interest rates. Accordingly, no assurance can be given that actual results would be consistent with the results of our estimate.
NON-GAAP FINANCIAL MEASURES
The following definitions are provided for “non-GAAP financial measures” in connection with Item 10(e) of Regulation S-K issued by the Securities and Exchange Commission. These non-GAAP financial measures have no standardized meaning prescribed by U.S. GAAP and therefore are unlikely to be comparable to the calculation of similar measures for other companies. Management does not intend these items to be considered in isolation or as a substitute for the related GAAP measures.
Supplemental Consolidating Data
We are providing supplemental consolidating data for the purpose of additional analysis. The data has been grouped as follows:
Consolidated – Caterpillar Inc. and its subsidiaries.
Machinery and Power Systems – The Machinery and Power Systems data contained in the schedules on pages A-144 to A-146 are “non-GAAP financial measures” as defined by the Securities and Exchange Commission in Regulation G. These non-GAAP financial measures have no standardized meaning prescribed by U.S. GAAP, and therefore, are unlikely to be comparable with the calculation of similar measures for other companies. Management does not intend these items to be considered in isolation or as a substitute for the related GAAP measures. Caterpillar defines Machinery and Power Systems as it is presented in the
supplemental data as Caterpillar Inc. and its subsidiaries with Financial Products accounted for on the equity basis. Machinery and Power Systems information relates to our design, manufacturing, marketing and parts distribution operations. Financial Products information relates to the financing to customers and dealers for the purchase and lease of Caterpillar and other equipment. The nature of these businesses is different, especially with regard to the financial position and cash flow items. Caterpillar management utilizes this presentation internally to highlight these differences. We also believe this presentation will assist readers in understanding our business.
Financial Products – primarily our finance and insurance subsidiaries, Cat Financial and Insurance Services.
Consolidating Adjustments – eliminations of transactions between Machinery and Power Systems and Financial Products.
Pages A-144 to A-146 reconcile Machinery and Power Systems with Financial Products on the equity basis to Caterpillar Inc. consolidated financial information.
|
| | | | | | | | | | | | | | | | | | | | | | | | | | | | | | | | | | | | | | | | | | | | | | | | | |
| Supplemental Data for Results of Operations |
| For The Years Ended December 31 | |
| | | | | Supplemental consolidating data | |
| | | Consolidated | | Machinery & Power Systems 1 | | Financial Products | | Consolidating Adjustments | |
| (Millions of dollars) | | 2013 | | 2012 | | 2011 | | 2013 | | 2012 | | 2011 | | 2013 | | 2012 | | 2011 | | 2013 | | 2012 | | 2011 | |
| Sales and revenues: | | |
| | |
| | |
| | |
| | |
| | |
| | |
| | |
| | |
| | |
| | |
| | |
| |
| Sales of Machinery and Power Systems | | $ | 52,694 |
| | $ | 63,068 |
| | $ | 57,392 |
| | $ | 52,694 |
| | $ | 63,068 |
| | $ | 57,392 |
| | $ | — |
| | $ | — |
| | $ | — |
| | $ | — |
| | $ | — |
| | $ | — |
| |
| Revenues of Financial Products | | 2,962 |
| | 2,807 |
| | 2,746 |
| | — |
| | — |
| | — |
| | 3,302 |
| | 3,160 |
| | 3,057 |
| | (340 | ) | 2 | (353 | ) | 2 | (311 | ) | 2 |
| Total sales and revenues | | 55,656 |
| | 65,875 |
| | 60,138 |
| | 52,694 |
| | 63,068 |
| | 57,392 |
| | 3,302 |
| | 3,160 |
| | 3,057 |
| | (340 | ) | | (353 | ) | | (311 | ) | |
| | | | | | | | | | | | | | | | | | | | | | | | | | |
| Operating costs: | | |
| | |
| | |
| | |
| | |
| | |
| | |
| | |
| | |
| | |
| | |
| | |
| |
| Cost of goods sold | | 40,727 |
| | 47,055 |
| | 43,578 |
| | 40,727 |
| | 47,055 |
| | 43,578 |
| | — |
| | — |
| | — |
| | — |
| | — |
| | — |
| |
| Selling, general and administrative expenses | | 5,547 |
| | 5,919 |
| | 5,203 |
| | 5,029 |
| | 5,348 |
| | 4,631 |
| | 566 |
| | 618 |
| | 621 |
| | (48 | ) | 3 | (47 | ) | 3 | (49 | ) | 3 |
| Research and development expenses | | 2,046 |
| | 2,466 |
| | 2,297 |
| | 2,046 |
| | 2,466 |
| | 2,297 |
| | — |
| | — |
| | — |
| | — |
| | — |
| | — |
| |
| Interest expense of Financial Products | | 727 |
| | 797 |
| | 826 |
| | — |
| | — |
| | — |
| | 734 |
| | 801 |
| | 827 |
| | (7 | ) | 4 | (4 | ) | 4 | (1 | ) | 4 |
| Goodwill impairment charge | | — |
| | 580 |
| | — |
| | — |
| | 580 |
| | — |
| | — |
| | — |
| | — |
| | — |
| | — |
| | — |
| |
| Other operating (income) expenses | | 981 |
| | 485 |
| | 1,081 |
| | (23 | ) | | (495 | ) | | 63 |
| | 1,019 |
| | 1,000 |
| | 1,026 |
| | (15 | ) | 3 | (20 | ) | 3 | (8 | ) | 3 |
| Total operating costs | | 50,028 |
| | 57,302 |
| | 52,985 |
| | 47,779 |
| | 54,954 |
| | 50,569 |
| | 2,319 |
| | 2,419 |
| | 2,474 |
| | (70 | ) | | (71 | ) | | (58 | ) | |
| Operating profit | | 5,628 |
| | 8,573 |
| | 7,153 |
| | 4,915 |
| | 8,114 |
| | 6,823 |
| | 983 |
| | 741 |
| | 583 |
| | (270 | ) | | (282 | ) | | (253 | ) | |
| Interest expense excluding Financial Products | | 465 |
| | 467 |
| | 396 |
| | 508 |
| | 512 |
| | 439 |
| | — |
| | — |
| | — |
| | (43 | ) | 4 | (45 | ) | 4 | (43 | ) | 4 |
| Other income (expense) | | (35 | ) | | 130 |
| | (32 | ) | | (299 | ) | | (146 | ) | | (279 | ) | | 37 |
| | 39 |
| | 37 |
| | 227 |
| 5 | 237 |
| 5 | 210 |
| 5 |
| | |
|
| |
|
| |
|
| | | | | | | | | | | | | | | | | | | |
| Consolidated profit before taxes | | 5,128 |
| | 8,236 |
| | 6,725 |
| | 4,108 |
| | 7,456 |
| | 6,105 |
| | 1,020 |
| | 780 |
| | 620 |
| | — |
| | — |
| | — |
| |
| Provision (benefit) for income taxes | | 1,319 |
| | 2,528 |
| | 1,720 |
| | 1,039 |
| | 2,314 |
| | 1,568 |
| | 280 |
| | 214 |
| | 152 |
| | — |
| | — |
| | — |
| |
| Profit of consolidated companies | | 3,809 |
| | 5,708 |
| | 5,005 |
| | 3,069 |
| | 5,142 |
| | 4,537 |
| | 740 |
| | 566 |
| | 468 |
| | — |
| | — |
| | — |
| |
| Equity in profit (loss) of unconsolidated affiliated companies | | (6 | ) | | 14 |
| | (24 | ) | | (6 | ) | | 14 |
| | (24 | ) | | — |
| | — |
| | — |
| | — |
| | — |
| | — |
| |
| Equity in profit of Financial Products’ subsidiaries | | — |
| | — |
| | — |
| | 726 |
| | 555 |
| | 453 |
| | — |
| | — |
| | — |
| | (726 | ) | 6 | (555 | ) | 6 | (453 | ) | 6 |
| | | | | | | | | | | | | | | | | | | | | | | | | | |
| Profit of consolidated and affiliated companies | | 3,803 |
| | 5,722 |
| | 4,981 |
| | 3,789 |
| | 5,711 |
| | 4,966 |
| | 740 |
| | 566 |
| | 468 |
| | (726 | ) | | (555 | ) | | (453 | ) | |
| | | | | | | | | | | | | | | | | | | | | | | | | | |
| Less: Profit (loss) attributable to noncontrolling interests | | 14 |
| | 41 |
| | 53 |
| | — |
| | 30 |
| | 38 |
| | 14 |
| | 11 |
| | 15 |
| | — |
| | — |
| | — |
| |
| | | | | | | | | | | | | | | | | | | | | | | | | | |
Profit 7 | | $ | 3,789 |
| | $ | 5,681 |
| | $ | 4,928 |
| | $ | 3,789 |
| | $ | 5,681 |
| | $ | 4,928 |
| | $ | 726 |
| | $ | 555 |
| | $ | 453 |
| | $ | (726 | ) | | $ | (555 | ) | | $ | (453 | ) | |
| |
1 | Represents Caterpillar Inc. and its subsidiaries with Financial Products accounted for on the equity basis. |
| |
2 | Elimination of Financial Products’ revenues earned from Machinery and Power Systems. |
| |
3 | Elimination of net expenses recorded by Machinery and Power Systems paid to Financial Products. |
| |
4 | Elimination of interest expense recorded between Financial Products and Machinery and Power Systems. |
| |
5 | Elimination of discount recorded by Machinery and Power Systems on receivables sold to Financial Products and of interest earned between Machinery and Power Systems and Financial Products. |
| |
6 | Elimination of Financial Products’ profit due to equity method of accounting. |
| |
7 | Profit attributable to common stockholders. |
|
| | | | | | | | | | | | | | | | | | | | | | | | | | | | | | | | | |
| Supplemental Data for Financial Position | | | | | | | | | | | | | | | | | |
| At December 31 | | | | | | | | | | | | | | | | | |
| | | | | Supplemental consolidating data | |
| | | Consolidated | | Machinery & Power Systems 1 | | Financial Products | | Consolidating Adjustments | |
| (Millions of dollars) | | 2013 | | 2012 | | 2013 | | 2012 | | 2013 | | 2012 | | 2013 | | 2012 | |
| Assets | | |
| | |
| | |
| | |
| | |
| | |
| | |
| | |
| |
| Current assets: | | |
| | |
| | |
| | |
| | |
| | |
| | |
| | |
| |
| Cash and short-term investments | | $ | 6,081 |
| | $ | 5,490 |
| | $ | 4,597 |
| | $ | 3,306 |
| | $ | 1,484 |
| | $ | 2,184 |
| | $ | — |
| | $ | — |
| |
| Receivables - trade and other | | 8,413 |
| | 9,706 |
| | 5,188 |
| | 5,248 |
| | 386 |
| | 445 |
| | 2,839 |
| 2,3 | 4,013 |
| 2,3 |
| Receivables - finance | | 8,763 |
| | 8,860 |
| | — |
| | — |
| | 12,886 |
| | 13,259 |
| | (4,123 | ) | 3 | (4,399 | ) | 3 |
| Deferred and refundable income taxes | | 1,553 |
| | 1,547 |
| | 1,511 |
| | 1,501 |
| | 42 |
| | 46 |
| | — |
| | — |
| |
| Prepaid expenses and other current assets | | 900 |
| | 988 |
| | 417 |
| | 547 |
| | 496 |
| | 454 |
| | (13 | ) | 4 | (13 | ) | 4 |
| Inventories | | 12,625 |
| | 15,547 |
| | 12,625 |
| | 15,547 |
| | — |
| | — |
| | — |
| | — |
| |
| Total current assets | | 38,335 |
| | 42,138 |
| | 24,338 |
| | 26,149 |
| | 15,294 |
| | 16,388 |
| | (1,297 | ) | | (399 | ) | |
| | | | | | | | | | | | | | | | | | |
| Property, plant and equipment - net | | 17,075 |
| | 16,461 |
| | 13,078 |
| | 13,058 |
| | 3,997 |
| | 3,403 |
| | — |
| | — |
| |
| Long-term receivables - trade and other | | 1,397 |
| | 1,316 |
| | 224 |
| | 195 |
| | 292 |
| | 284 |
| | 881 |
| 2,3 | 837 |
| 2,3 |
| Long-term receivables - finance | | 14,926 |
| | 14,029 |
| | — |
| | — |
| | 15,840 |
| | 14,902 |
| | (914 | ) | 3 | (873 | ) | 3 |
| Investments in unconsolidated affiliated companies | | 272 |
| | 272 |
| | 272 |
| | 272 |
| | — |
| | — |
| | — |
| | — |
| |
| Investments in Financial Products subsidiaries | | — |
| | — |
| | 4,798 |
| | 4,433 |
| | — |
| | — |
| | (4,798 | ) | 5 | (4,433 | ) | 5 |
| Noncurrent deferred and refundable income taxes | | 594 |
| | 2,011 |
| | 1,027 |
| | 2,422 |
| | 92 |
| | 105 |
| | (525 | ) | 6 | (516 | ) | 6 |
| Intangible assets | | 3,596 |
| | 4,016 |
| | 3,589 |
| | 4,008 |
| | 7 |
| | 8 |
| | — |
| | — |
| |
| Goodwill | | 6,956 |
| | 6,942 |
| | 6,939 |
| | 6,925 |
| | 17 |
| | 17 |
| | — |
| | — |
| |
| Other assets | | 1,745 |
| | 1,785 |
| | 439 |
| | 436 |
| | 1,306 |
| | 1,349 |
| | — |
| | — |
| |
| Total assets | | $ | 84,896 |
| | $ | 88,970 |
| | $ | 54,704 |
| | $ | 57,898 |
| | $ | 36,845 |
| | $ | 36,456 |
| | $ | (6,653 | ) | | $ | (5,384 | ) | |
| | | | | | | | | | | | | | | | | | |
| Liabilities | | |
| | |
| | |
| | |
| | |
| | |
| | |
| | |
| |
| Current liabilities: | | |
| | |
| | |
| | |
| | |
| | |
| | |
| | |
| |
| Short-term borrowings | | $ | 3,679 |
| | $ | 5,287 |
| | $ | 16 |
| | $ | 668 |
| | $ | 4,781 |
| | $ | 4,859 |
| | $ | (1,118 | ) | 7 | $ | (240 | ) | 7 |
| Accounts payable | | 6,560 |
| | 6,753 |
| | 6,516 |
| | 6,718 |
| | 209 |
| | 178 |
| | (165 | ) | 8 | (143 | ) | 8 |
| Accrued expenses | | 3,493 |
| | 3,667 |
| | 3,165 |
| | 3,258 |
| | 341 |
| | 422 |
| | (13 | ) | 9 | (13 | ) | 9 |
| Accrued wages, salaries and employee benefits | | 1,622 |
| | 1,911 |
| | 1,589 |
| | 1,876 |
| | 33 |
| | 35 |
| | — |
| | — |
| |
| Customer advances | | 2,360 |
| | 2,638 |
| | 2,360 |
| | 2,638 |
| | — |
| | — |
| | — |
| | — |
| |
| Dividends payable | | 382 |
| | — |
| | 382 |
| | — |
| | — |
| | — |
| | — |
| | — |
| |
| Other current liabilities | | 1,849 |
| | 2,055 |
| | 1,425 |
| | 1,561 |
| | 432 |
| | 502 |
| | (8 | ) | 6 | (8 | ) | 6 |
| Long-term debt due within one year | | 7,352 |
| | 7,104 |
| | 760 |
| | 1,113 |
| | 6,592 |
| | 5,991 |
| | — |
| | — |
| |
| Total current liabilities | | 27,297 |
| | 29,415 |
| | 16,213 |
| | 17,832 |
| | 12,388 |
| | 11,987 |
| | (1,304 | ) | | (404 | ) | |
| Long-term debt due after one year | | 26,719 |
| | 27,752 |
| | 8,033 |
| | 8,705 |
| | 18,720 |
| | 19,086 |
| | (34 | ) | 7 | (39 | ) | 7 |
| Liability for postemployment benefits | | 6,973 |
| | 11,085 |
| | 6,973 |
| | 11,085 |
| | — |
| | — |
| | — |
| | — |
| |
| Other liabilities | | 3,029 |
| | 3,136 |
| | 2,607 |
| | 2,694 |
| | 939 |
| | 950 |
| | (517 | ) | 6 | (508 | ) | 6 |
| Total liabilities | | 64,018 |
| | 71,388 |
| | 33,826 |
| | 40,316 |
| | 32,047 |
| | 32,023 |
| | (1,855 | ) | | (951 | ) | |
| Commitments and contingencies | | |
| | |
| | |
| | |
| | |
| | |
| | |
| | |
| |
| Stockholders’ equity | | |
| | |
| | |
| | |
| | |
| | |
| | |
| | |
| |
| Common stock | | 4,709 |
| | 4,481 |
| | 4,709 |
| | 4,481 |
| | 906 |
| | 906 |
| | (906 | ) | 5 | (906 | ) | 5 |
| Treasury stock | | (11,854 | ) | | (10,074 | ) | | (11,854 | ) | | (10,074 | ) | | — |
| | — |
| | — |
| | — |
| |
| Profit employed in the business | | 31,854 |
| | 29,558 |
| | 31,854 |
| | 29,558 |
| | 3,586 |
| | 3,185 |
| | (3,586 | ) | 5 | (3,185 | ) | 5 |
| Accumulated other comprehensive income (loss) | | (3,898 | ) | | (6,433 | ) | | (3,898 | ) | | (6,433 | ) | | 183 |
| | 236 |
| | (183 | ) | 5 | (236 | ) | 5 |
| Noncontrolling interests | | 67 |
| | 50 |
| | 67 |
| | 50 |
| | 123 |
| | 106 |
| | (123 | ) | 5 | (106 | ) | 5 |
| Total stockholders’ equity | | 20,878 |
| | 17,582 |
| | 20,878 |
| | 17,582 |
| | 4,798 |
| | 4,433 |
| | (4,798 | ) | | (4,433 | ) | |
| Total liabilities and stockholders’ equity | | $ | 84,896 |
| | $ | 88,970 |
| | $ | 54,704 |
| | $ | 57,898 |
| | $ | 36,845 |
| | $ | 36,456 |
| | $ | (6,653 | ) | | $ | (5,384 | ) | |
| |
1 | Represents Caterpillar Inc. and its subsidiaries with Financial Products accounted for on the equity basis. |
| |
2 | Elimination of receivables between Machinery and Power Systems and Financial Products. |
| |
3 | Reclassification of Machinery and Power Systems’ trade receivables purchased by Financial Products and Financial Products' wholesale inventory receivables. |
| |
4 | Elimination of Machinery and Power Systems’ insurance premiums that are prepaid to Financial Products. |
| |
5 | Elimination of Financial Products’ equity which is accounted for on Machinery and Power Systems on the equity basis. |
| |
6 | Reclassification reflecting required netting of deferred tax assets/liabilities by taxing jurisdiction. |
| |
7 | Elimination of debt between Machinery and Power Systems and Financial Products. |
| |
8 | Elimination of payables between Machinery and Power Systems and Financial Products. |
| |
9 | Elimination of prepaid insurance in Financial Products’ accrued expenses. |
|
| | | | | | | | | | | | | | | | | | | | | | | | | | | | | | | | | |
| Supplemental Data for Statement of Cash Flow | | | | | | | | | | | | | | | | | |
| For the Years Ended December 31 | | | | Supplemental consolidating data | |
| | | Consolidated | | Machinery & Power Systems1 | | Financial Products | | Consolidating Adjustments | |
| (Millions of dollars) | | 2013 | | 2012 | | 2013 | | 2012 | | 2013 | | 2012 | | 2013 | | 2012 | |
| Cash flow from operating activities: | | |
| | |
| | |
| | |
| | |
| | |
| | |
| | |
| |
| Profit of consolidated and affiliated companies | | $ | 3,803 |
| | $ | 5,722 |
| | $ | 3,789 |
| | $ | 5,711 |
| | $ | 740 |
| | $ | 566 |
| | $ | (726 | ) | 2 | $ | (555 | ) | 2 |
| Adjustments for non-cash items: | | |
| | |
| | |
| | |
| | |
| | |
| | |
| | |
| |
| Depreciation and amortization | | 3,087 |
| | 2,813 |
| | 2,273 |
| | 2,082 |
| | 814 |
| | 731 |
| | — |
| | — |
| |
| Undistributed profit of Financial Products | | — |
| | — |
| | (401 | ) | | (305 | ) | | — |
| | — |
| | 401 |
| 3 | 305 |
| 3 |
| Net gain from sale of businesses and investments | | (68 | ) | | (630 | ) | | (68 | ) | | (630 | ) | | — |
| | — |
| | — |
| | — |
| |
| Goodwill impairment charge | | — |
| | 580 |
| | — |
| | 580 |
| | — |
| | — |
| | — |
| | — |
| |
| Other | | 550 |
| | 439 |
| | 444 |
| | 332 |
| | (101 | ) | | (88 | ) | | 207 |
| 4 | 195 |
| 4 |
| Changes in assets and liabilities, net of acquisitions and divestitures: | | 0 |
| | 0 |
| | |
| | |
| | |
| | |
| | |
| | |
| |
| Receivables - trade and other | | 835 |
| | (15 | ) | | 718 |
| | 158 |
| | 16 |
| | (37 | ) | | 101 |
| 4,5 | (136 | ) | 4,5 |
| Inventories | | 2,658 |
| | (1,149 | ) | | 2,665 |
| | (1,094 | ) | | — |
| | — |
| | (7 | ) | 4 | (55 | ) | 4 |
| Accounts payable | | 134 |
| | (1,868 | ) | | 226 |
| | (1,821 | ) | | (70 | ) | | (15 | ) | | (22 | ) | 4 | (32 | ) | 4 |
| Accrued expenses | | (108 | ) | | 126 |
| | (24 | ) | | 134 |
| | (84 | ) | | (9 | ) | | — |
| | 1 |
| 4 |
| Accrued wages, salaries and employee benefits | | (279 | ) | | (490 | ) | | (277 | ) | | (488 | ) | | (2 | ) | | (2 | ) | | — |
| | — |
| |
| Customer advances | | (301 | ) | | 83 |
| | (301 | ) | | 83 |
| | — |
| | — |
| | — |
| | — |
| |
| Other assets—net | | (49 | ) | | 252 |
| | (60 | ) | | 275 |
| | 2 |
| | (7 | ) | | 9 |
| 4 | (16 | ) | 4 |
| Other liabilities—net | | (71 | ) | | (679 | ) | | (22 | ) | | (819 | ) | | (40 | ) | | 124 |
| | (9 | ) | 4 | 16 |
| 4 |
| Net cash provided by (used for) operating activities | | 10,191 |
| | 5,184 |
| | 8,962 |
| | 4,198 |
| | 1,275 |
| | 1,263 |
| | (46 | ) | | (277 | ) | |
| | | | | | | | | | | | | | | | | | |
| Cash flow from investing activities: | | |
| | |
| | |
| | |
| | |
| | |
| | |
| | |
| |
| Capital expenditures—excluding equipment leased to others | | (2,522 | ) | | (3,350 | ) | | (2,508 | ) | | (3,335 | ) | | (14 | ) | | (15 | ) | | — |
| | — |
| |
| Expenditures for equipment leased to others | | (1,924 | ) | | (1,726 | ) | | (97 | ) | | (100 | ) | | (1,897 | ) | | (1,781 | ) | | 70 |
| 4 | 155 |
| 4,9 |
| Proceeds from disposals of leased assets and property, plant and equipment | | 844 |
| | 1,117 |
| | 122 |
| | 244 |
| | 738 |
| | 891 |
| | (16 | ) | 4 | (18 | ) | 4 |
| Additions to finance receivables | | (11,422 | ) | | (12,010 | ) | | — |
| | — |
| | (14,095 | ) | | (18,754 | ) | | 2,673 |
| 5,8 | 6,744 |
| 5,8,9 |
| Collections of finance receivables | | 9,567 |
| | 8,995 |
| | — |
| | — |
| | 12,253 |
| | 14,787 |
| | (2,686 | ) | 5 | (5,792 | ) | 5,9 |
| Net intercompany purchased receivables | | — |
| | — |
| | — |
| | — |
| | 181 |
| | 250 |
| | (181 | ) | 5 | (250 | ) | 5 |
| Proceeds from sale of finance receivables | | 220 |
| | 132 |
| | — |
| | — |
| | 227 |
| | 144 |
| | (7 | ) | 5 | (12 | ) | 5 |
| Net intercompany borrowings | | — |
| | — |
| | (935 | ) | | (203 | ) | | 36 |
| | 33 |
| | 899 |
| 6 | 170 |
| 6 |
| Investments and acquisitions (net of cash acquired) | | (195 | ) | | (618 | ) | | (195 | ) | | (562 | ) | | — |
| | — |
| | — |
| | (56 | ) | 9 |
| Proceeds from sale of businesses and investments (net of cash sold) | | 365 |
| | 1,199 |
| | 497 |
| | 1,943 |
| | — |
| | — |
| | (132 | ) | 8 | (744 | ) | 8 |
| Proceeds from sale of available-for-sale securities | | 449 |
| | 306 |
| | 31 |
| | 27 |
| | 418 |
| | 279 |
| | — |
| | — |
| |
| Investments in available-for-sale securities | | (402 | ) | | (402 | ) | | (25 | ) | | (8 | ) | | (377 | ) | | (394 | ) | | — |
| | — |
| |
| Other—net | | (26 | ) | | 167 |
| | (31 | ) | | 126 |
| | 5 |
| | 41 |
| | — |
| | — |
| |
| Net cash provided by (used for) investing activities | | (5,046 | ) | | (6,190 | ) | | (3,141 | ) | | (1,868 | ) | | (2,525 | ) | | (4,519 | ) | | 620 |
| | 197 |
| |
| | | | | | | | | | | | | | | | | | |
| Cash flow from financing activities: | | |
| | |
| | |
| | |
| | |
| | |
| | |
| | |
| |
| Dividends paid | | (1,111 | ) | | (1,617 | ) | | (1,111 | ) | | (1,617 | ) | | (325 | ) | | (250 | ) | | 325 |
| 7 | 250 |
| 7 |
| Distribution to noncontrolling interests | | (13 | ) | | (6 | ) | | (13 | ) | | (6 | ) | | — |
| | — |
| | — |
| | — |
| |
| Common stock issued, including treasury shares reissued | | 128 |
| | 52 |
| | 128 |
| | 52 |
| | — |
| | — |
| | — |
| | — |
| |
| Treasury shares purchased | | (2,000 | ) | | — |
| | (2,000 | ) | | — |
| | — |
| | — |
| | — |
| | — |
| |
| Excess tax benefit from stock-based compensation | | 96 |
| | 192 |
| | 96 |
| | 192 |
| | — |
| | — |
| | — |
| | — |
| |
| Acquisitions of redeemable noncontrolling interests | | — |
| | (444 | ) | | — |
| | (444 | ) | | — |
| | — |
| | — |
| | — |
| |
| Acquisitions of noncontrolling interests | | — |
| | (5 | ) | | — |
| | (5 | ) | | — |
| | — |
| | — |
| | — |
| |
| Net intercompany borrowings | | — |
| | — |
| | (36 | ) | | (33 | ) | | 935 |
| | 203 |
| | (899 | ) | 6 | (170 | ) | 6 |
| Proceeds from debt issued (original maturities greater than three months) | | 9,328 |
| | 16,015 |
| | 195 |
| | 2,209 |
| | 9,133 |
| | 13,806 |
| | — |
| | — |
| |
| Payments on debt (original maturities greater than three months) | | (10,870 | ) | | (11,047 | ) | | (1,769 | ) | | (1,107 | ) | | (9,101 | ) | | (9,940 | ) | | — |
| | — |
| |
| Short-term borrowings - net (original maturities three months or less) | | (69 | ) | | 466 |
| | 1 |
| | (14 | ) | | (70 | ) | | 480 |
| | — |
| | — |
| |
| Net cash provided by (used for) financing activities | | (4,511 | ) | | 3,606 |
| | (4,509 | ) | | (773 | ) | | 572 |
| | 4,299 |
| | (574 | ) | | 80 |
| |
| Effect of exchange rate changes on cash | | (43 | ) | | (167 | ) | | (21 | ) | | (80 | ) | | (22 | ) | | (87 | ) | | — |
| | — |
| |
| Increase (decrease) in cash and short-term investments | | 591 |
| | 2,433 |
| | 1,291 |
| | 1,477 |
| | (700 | ) | | 956 |
| | — |
| | — |
| |
| Cash and short-term investments at beginning of period | | 5,490 |
| | 3,057 |
| | 3,306 |
| | 1,829 |
| | 2,184 |
| | 1,228 |
| | — |
| | — |
| |
| Cash and short-term investments at end of period | | $ | 6,081 |
| | $ | 5,490 |
| | $ | 4,597 |
| | $ | 3,306 |
| | $ | 1,484 |
| | $ | 2,184 |
| | $ | — |
| | $ | — |
| |
| |
1 | Represents Caterpillar Inc. and its subsidiaries with Financial Products accounted for on the equity basis. |
| |
2 | Elimination of Financial Products’ profit after tax due to equity method of accounting. |
| |
3 | Elimination of non-cash adjustment for the undistributed earnings from Financial Products. |
| |
4 | Elimination of non-cash adjustments and changes in assets and liabilities related to consolidated reporting. |
| |
5 | Reclassification of Financial Products' cash flow activity from investing to operating for receivables that arose from the sale of inventory. |
| |
6 | Elimination of net proceeds and payments to/from Machinery and Power Systems and Financial Products. |
| |
7 | Elimination of dividend from Financial Products to Machinery and Power Systems. |
| |
8 | Elimination of proceeds received from Financial Products related to Machinery and Power Systems’ sale of portions of the Bucyrus distribution business to Cat dealers. |
| |
9 | Reclassification of Financial Products' payments related to Machinery and Power Systems' acquisition of Caterpillar Tohoku Limited. |
SUPPLEMENTAL STOCKHOLDER INFORMATION
Registered stockholders should contact:
|
| | | | | |
| Stock Transfer Agent | | Caterpillar Corporate Secretary |
| Computershare | | Christopher M. Reitz |
| (formerly BNY Mellon Shareowner Services) | | Corporate Secretary |
| P.O. Box 43006 | | Caterpillar Inc. |
| Providence, RI 02940-3006 | | 100 N.E. Adams Street |
| | Phone: | (866) 203-6622 (U.S. and Canada) | | Peoria, IL 61629-6490 |
| | | +1 (201) 680-6578 (Outside U.S. and Canada) | | Phone: | (309) 675-4619 |
| | Hearing Impaired: | (800) 231-5469 (U.S. or Canada) | | Fax: | (309) 494-1467 |
| | | (201) 680-6610 (Outside U.S. or Canada) | | E-mail: | CATshareservices@CAT.com |
| | Internet: | https://www-us.computershare.com/Investor/ | | | |
Shares held in Street Position
Stockholders that hold shares through a street position should contact their bank or broker with questions regarding those shares.
Current stockholders and other interested investors may purchase Caterpillar Inc. common stock directly through a Direct Stock Purchase and Dividend Reinvestment Plan for Caterpillar Inc. which is sponsored and administered by our Transfer Agent, Computershare. The program materials and enrollment form are available on-line from Computershare's website https://www-us.computershare.com/Investor/ or by following a link from www.caterpillar.com/dspp.
Institutional analysts, portfolio managers, and representatives of financial institutions seeking additional information about the Company should contact:
|
| | |
| Senior Manager of Investor Relations | | |
| Rich Moore | Phone: | (309) 675-4549 |
| Caterpillar Inc. | Fax: | (309) 675-4457 |
| 100 N.E. Adams Street | E-mail: | CATir@CAT.com |
| Peoria, IL 61629-5310 | Internet: | www.caterpillar.com/investors |
Current information -
| |
| • | phone our Information Hotline - (800) 228-7717 (U.S. or Canada) or (858) 764-9492 (Outside U.S. or Canada) to request company publications by mail, listen to a summary of Caterpillar’s latest financial results and current outlook, or to request a copy of results by fax or mail |
| |
| • | request, view, or download materials on-line by visiting www.caterpillar.com/materialsrequest or register for e-mail alerts by visiting www.caterpillar.com/investors |
Historical information -
| |
| • | view/download on-line at www.caterpillar.com/historical |
On Wednesday, June 11, 2014, at 8:00 a.m., Central Time, the annual meeting of stockholders will be held in Corinth, Mississippi. We expect to send proxy materials to stockholders on or about May 1, 2014.
Visit us on the Internet at www.caterpillar.com.
Information contained on our website is not incorporated by reference into this document.
Listing Information: Caterpillar common stock is listed on the New York Stock Exchange in the United States, and on stock exchanges in France, Germany and Switzerland. We expect to delist from the Deutsche Boerse in Germany effective February 28, 2014.
Price Ranges: Quarterly price ranges of Caterpillar common stock on the New York Stock Exchange, the principal market in which the stock is traded, were:
|
| | | | | | | | | | | | | | | | |
| | | 2013 | | 2012 |
| Quarter | | High | | Low | | High | | Low |
| First | | $ | 99.70 |
| | $ | 85.80 |
| | $ | 116.95 |
| | $ | 92.77 |
|
| Second | | $ | 90.69 |
| | $ | 79.49 |
| | $ | 109.77 |
| | $ | 80.96 |
|
| Third | | $ | 89.00 |
| | $ | 81.35 |
| | $ | 94.28 |
| | $ | 78.25 |
|
| Fourth | | $ | 91.67 |
| | $ | 81.87 |
| | $ | 91.83 |
| | $ | 80.16 |
|
Number of Stockholders: Stockholders of record at year-end totaled 32,161, compared with 35,738 at the end of 2012. Approximately 62 percent of our issued shares are held by institutions and banks, 32 percent by individuals, and 6 percent by employees through company stock plans.
|
| | | | |
| Performance Graph: Total Cumulative Stockholder Return for Five-Year Period Ending December 31, 2013 |
The graph below shows the cumulative stockholder return assuming an investment of $100 on December 31, 2008, and reinvestment of dividends issued thereafter.
|
| | | | | | | | | | | | | | | | | | | | | | | |
| | 2008 | | 2009 | | 2010 | | 2011 | | 2012 | | 2013 |
| Caterpillar Inc. | $ | 100.00 |
| | $ | 133.10 |
| | $ | 224.51 |
| | $ | 221.08 |
| | $ | 224.58 |
| | $ | 232.31 |
|
| S&P 500 | $ | 100.00 |
| | $ | 126.45 |
| | $ | 145.52 |
| | $ | 148.55 |
| | $ | 172.29 |
| | $ | 228.04 |
|
| S&P 500 Machinery | $ | 100.00 |
| | $ | 140.03 |
| | $ | 216.05 |
| | $ | 194.65 |
| | $ | 227.92 |
| | $ | 289.40 |
|
|
| | | | | |
| Directors/Committee Membership (as of February 1, 2014) |
| | | | | | |
| | Audit | | Compensation & Human Resources | | Public Policy & Governance |
| David L. Calhoun | | | ü | | |
| Daniel M. Dickinson | ü | | | | |
| Juan Gallardo | | | | | ü |
| Jesse J. Greene, Jr. | | | ü | | |
| Jon M. Huntsman, Jr. | | | | | ü |
| Peter A. Magowan | ü | | | | |
| Dennis A. Muilenburg | ü | | | | |
| Douglas R. Oberhelman | | | | | |
| William A. Osborn | ü* | | | | |
| Edward B. Rust, Jr. | | | | | ü* |
| Susan C. Schwab | | | | | ü |
| Miles D. White | | | ü* | | |
| | * Chairman of Committee |
|
| |
Officers (as of February 1, 2014, except as noted) |
| | |
| Douglas R. Oberhelman | Chairman and Chief Executive Officer |
| Bradley M. Halverson | Group President and Chief Financial Officer |
| Stuart L. Levenick | Group President |
| Edward J. Rapp | Group President |
| D. James Umpleby III | Group President |
| Steven H. Wunning | Group President |
| James B. Buda | Executive Vice President, Law and Public Policy |
| David P. Bozeman | Senior Vice President |
| Kent M. Adams | Vice President |
| William P. Ainsworth | Vice President |
| Mary H. Bell | Vice President |
| Thomas J. Bluth | Vice President |
| Robert B. Charter | Vice President |
| Qihua Chen | Vice President |
| Frank J. Crespo | Vice President |
| Christopher C. Curfman | Vice President |
| Michael L. DeWalt | Vice President |
| Paolo Fellin | Vice President |
| William E. Finerty | Vice President |
| Gregory S. Folley | Vice President |
| Thomas G. Frake | Vice President |
| Stephen A. Gosselin | Vice President |
Hans A. Haefeli (1) | Vice President |
| Kimberly S. Hauer | Vice President |
| Gwenne A. Henricks | Vice President |
| Denise C. Johnson | Vice President |
| James W. Johnson | Vice President |
| Kathryn Dickey Karol | Vice President |
| Pablo M. Koziner | Vice President |
| Randy M. Krotowski | Vice President |
| Julie A. Lagacy | Vice President |
| Nigel A. Lewis | Vice President |
| Steven W. Niehaus | Vice President |
| Thomas A. Pellette | Vice President |
| Mark E. Sweeney | Vice President |
| Tana L. Utley | Vice President |
| Karl E. Weiss | Vice President |
| Ramin Younessi | Vice President |
| Edward J. Scott | Treasurer |
| Amy A. Campbell | Chief Audit Officer |
| Christopher C. Spears | Chief Ethics and Compliance Officer |
| Jananne A. Copeland | Chief Accounting Officer |
| Jill E. Daugherty | Controller |
| Christopher M. Reitz | Corporate Secretary |
| Robin D. Beran | Assistant Treasurer |
| Joni J. Funk | Assistant Secretary |
| Patrick G. Holcombe | Assistant Secretary |
| | |
(1) will retire effective 4/30/2014 | |