Exhibit 99.1
Caterpillar Inc.
3Q 2014 Earnings Release
| October 23, 2014 |
FOR IMMEDIATE RELEASE
Caterpillar Reports Improved Third-Quarter Results,
Increases 2014 Profit Per Share Outlook
PEORIA, Ill. — Caterpillar Inc. (NYSE: CAT) today announced profit per share of $1.63 for the third quarter of 2014, an increase from third-quarter 2013 profit per share of $1.45. The third quarter of 2014 included a negative impact of $0.09 per share for restructuring costs. Excluding restructuring costs, third-quarter 2014 profit per share was $1.72. Third-quarter 2014 sales and revenues were $13.549 billion, up from $13.423 billion in the third quarter of 2013.
“We’re pleased with the third-quarter profit improvement considering world economic growth remains slower than we’d like. We’ve continued to focus on what we can control — cost management and operational execution. We continue on a Lean manufacturing journey and are focused on improving safety, quality, efficiency and inventory turns. We’re making progress and it is beginning to be reflected in our results. The diversity of the businesses we’re in and the strengthening of our operational performance have been key to helping us improve results and our competitive position in this weak economic recovery. Our broad geographic reach and manufacturing footprint help mitigate the impact of currency fluctuations. In fact, currency impacts were positive in the third quarter,” said Caterpillar Chairman and Chief Executive Officer Doug Oberhelman.
“In addition to the profit improvement, we have a strong balance sheet and through the first nine months of the year, we’ve had good cash flow. So far this year, we’ve returned value to our stockholders by repurchasing $4.2 billion of Caterpillar stock and raising our quarterly dividend by 17 percent,” Oberhelman said.
“We are confident that, when we see more significant economic growth around the world, our consistent focus on operational performance will have prepared us to deliver even better results,” Oberhelman added.
2014 Outlook
The company now expects 2014 sales and revenues to be about $55 billion, the middle of the previous outlook range of $54 to $56 billion. While the mid-point of the sales and revenues outlook range has not changed, profit per share expectations for 2014 continue to improve.
(more)
To provide a better understanding of the company’s expectations for 2014 profit, the profit per share outlook is being provided with and without anticipated restructuring costs. With 2014 sales and revenues of about $55 billion, the revised profit outlook is $6.00 per share, or $6.50 per share excluding $450 million of restructuring costs. That is an improvement from the previous profit outlook of $5.75 per share, or $6.20 per share excluding $400 million of restructuring costs at the mid-point of the previous sales and revenues outlook range of $54 to $56 billion.
“In January we provided our first profit outlook for 2014 at $5.85 per share excluding restructuring costs — our current outlook excluding restructuring costs is $6.50 per share, a substantial improvement. The fact that we continue to raise our profit per share outlook on relatively flat sales is a testament to our diverse portfolio of businesses, disciplined cost control and operational execution. I’m proud of our people for what they’ve been able to accomplish in the current economic environment. We have an exceptional team around the world and in uncertain times like these, they are especially important to us. As we move into the final quarter of 2014, we expect to build on what we’ve been working on: strategy execution, operational performance, cost management, cash flow, our healthy balance sheet and improving our market position,” Oberhelman said.
Preliminary 2015 Sales and Revenues Outlook
From an economic perspective, we believe there is a reasonable likelihood that world economic growth could improve in 2015. In developed countries, growth-oriented monetary policies should support continued modest economic improvement. In addition, we believe there is potential for increased investment in infrastructure in countries such as the United States, India and Turkey.
In developing countries, several governments raised interest rates or constrained liquidity in 2013 to control inflation or protect their exchange rates, and these measures have led to slower growth in 2014. More recently, interest rates in many developing countries have stabilized and we saw the first monetary policy easing in the third quarter of 2014.
Despite cautious optimism for improved global economic growth, significant risks and uncertainties remain that could temper growth in 2015. Political conflicts and social unrest continue to disrupt economic activity in several regions, in particular, the Commonwealth of Independent States, Africa and the Middle East. The Chinese government’s push for structural reform is slowing growth, and the ongoing uncertainty around the direction and timing of U.S. fiscal and monetary policy actions may temper business confidence. As a result, our preliminary outlook for 2015 expects sales and revenues to be flat to slightly up from 2014.
“At this point, our view of 2015 sales and revenues isn’t significantly different than 2014. Our order backlog was up a little in the third quarter and was slightly higher than at this point last year. We’re hopeful that economic growth will improve in 2015, but are mindful of the uncertainties and risks. We have continued to
improve operational execution, and if we see more positive economic momentum, we believe we’re well-positioned to respond and deliver for our customers and stockholders,” Oberhelman added.
Notes:
· Glossary of terms is included on pages 17-18; first occurrence of terms shown in bold italics.
· Information on non-GAAP financial measures is included on page 19.
About Caterpillar:
For nearly 90 years, Caterpillar Inc. has been making sustainable progress possible and driving positive change on every continent. Customers turn to Caterpillar to help them develop infrastructure, energy and natural resource assets. With 2013 sales and revenues of $55.656 billion, Caterpillar is the world’s leading manufacturer of construction and mining equipment, diesel and natural gas engines, industrial gas turbines and diesel-electric locomotives. The company principally operates through its three product segments - Construction Industries, Resource Industries and Energy & Transportation - and also provides financing and related services through its Financial Products segment. For more information, visit caterpillar.com. To connect with us on social media, visit caterpillar.com/social-media.
Caterpillar contact: Rachel Potts (309) 675-6892 (Office) or (309) 573-3444 (Mobile)
Forward-Looking Statements
Certain statements in this press release relate to future events and expectations and are forward-looking statements within the meaning of the Private Securities Litigation Reform Act of 1995. Words such as “believe,” “estimate,” “will be,” “will,” “would,” “expect,” “anticipate,” “plan,” “project,” “intend,” “could,” “should” or other similar words or expressions often identify forward-looking statements. All statements other than statements of historical fact are forward-looking statements, including, without limitation, statements regarding our outlook, projections, forecasts or trend descriptions. These statements do not guarantee future performance, and we do not undertake to update our forward-looking statements.
Caterpillar’s actual results may differ materially from those described or implied in our forward-looking statements based on a number of factors, including, but not limited to: (i) global economic conditions and economic conditions in the industries we serve; (ii) government monetary or fiscal policies and infrastructure spending; (iii) commodity price changes, component price increases, fluctuations in demand for our products or significant shortages of component products; (iv) disruptions or volatility in global financial markets limiting our sources of liquidity or the liquidity of our customers, dealers and suppliers; (v) political and economic risks, commercial instability and events beyond our control in the countries in which we operate; (vi) failure to maintain our credit ratings and potential resulting increases to our cost of borrowing and adverse effects on our cost of funds, liquidity, competitive position and access to capital markets; (vii) our Financial Products segment’s risks associated with the financial services industry; (viii) changes in interest rates or market liquidity conditions; (ix) an increase in delinquencies, repossessions or net losses of Cat Financial’s customers; (x) new regulations or changes in financial services regulations; (xi) a failure to realize, or a delay in realizing, all of the anticipated benefits of our acquisitions, joint ventures or divestitures; (xii) international trade policies and their impact on demand for our products and our competitive position; (xiii) our ability to develop, produce and market quality products that meet our customers’ needs; (xiv) the impact of the highly competitive environment in which we operate on our sales and pricing; (xv) failure to realize all of the anticipated benefits from initiatives to increase our productivity, efficiency and cash flow and to reduce costs; (xvi) additional restructuring costs or a failure to realize anticipated savings or benefits from past or future cost reduction actions; (xvii) inventory management decisions and sourcing practices of our dealers and our OEM customers; (xviii) compliance with environmental laws and regulation; (xix) alleged or actual violations of trade or anti-corruption laws and regulations; (xx) additional tax expense or exposure; (xxi) currency fluctuations; (xxii) our or Cat Financial’s compliance with financial covenants; (xxiii) increased pension plan funding obligations; (xxiv) union disputes or other employee relations issues; (xxv) significant legal proceedings, claims, lawsuits or investigations; (xxvi) compliance requirements imposed if additional carbon emissions legislation and/or regulations are adopted; (xxvii) changes in accounting standards; (xxviii) failure or breach of IT security; (xxix) adverse effects of unexpected events including natural disasters; and (xxx) other factors described in more detail under “Item 1A. Risk Factors” in our Form 10-K filed with the SEC on February 18, 2014 for the year ended December 31, 2013 and in our Form 10-Q filed with the SEC on August 1, 2014 for the quarter ended June 30, 2014.
Key Points
Third Quarter 2014
(Dollars in millions except per share data)
|
| Third Quarter |
| Third Quarter |
| $ Change |
| % Change |
| |||
Machinery, Energy & Transportation Sales |
| $ | 12,758 |
| $ | 12,678 |
| $ | 80 |
| 1 | % |
Financial Products Revenues |
| 791 |
| 745 |
| 46 |
| 6 | % | |||
Total Sales and Revenues |
| $ | 13,549 |
| $ | 13,423 |
| $ | 126 |
| 1 | % |
Profit |
| $ | 1,017 |
| $ | 946 |
| $ | 71 |
| 8 | % |
Profit per common share - diluted |
| $ | 1.63 |
| $ | 1.45 |
| $ | 0.18 |
| 12 | % |
Profit per common share - diluted (excluding restructuring) |
| $ | 1.72 |
| $ | 1.49 |
| $ | 0.23 |
| 15 | % |
· Third-quarter sales and revenues were $13.549 billion, compared with $13.423 billion in the third quarter of 2013. Energy & Transportation’s sales were higher, while Resource Industries’ sales declined.
· Restructuring costs were $81 million in the third quarter of 2014 with an after-tax impact of $0.09 per share.
· Profit per share was $1.63 in the third quarter of 2014 and $1.72 per share excluding restructuring costs. Profit in the third quarter of 2013 was $1.45 per share.
· Machinery, Energy & Transportation (ME&T) operating cash flow was $1.442 billion in the third quarter of 2014, compared with $2.109 billion in the third quarter of 2013.
· ME&T debt-to-capital ratio was 34.7 percent compared with 32.5 percent at the end of the second quarter of 2014.
· As previously announced, the company repurchased $2.5 billion of Caterpillar common stock during the third quarter of 2014. This repurchase is part of the $10 billion stock repurchase authorization approved by the Board of Directors in the first quarter of 2014.
2014 Outlook
· The company now expects 2014 sales and revenues to be about $55 billion, the middle of the previous outlook range of $54 to $56 billion.
· With sales and revenues at $55 billion, the revised profit outlook is $6.00 per share, or $6.50 per share excluding $450 million of restructuring costs.
· The company expects ME&T capital expenditures for 2014 will be less than $2 billion.
Preliminary 2015 Sales and Revenues Outlook
· Despite cautious optimism for improved global economic growth, significant risks and uncertainties remain that could temper growth in 2015.
· Our preliminary outlook for 2015 expects sales and revenues to be flat to slightly up from 2014.
CONSOLIDATED RESULTS
Consolidated Sales and Revenues
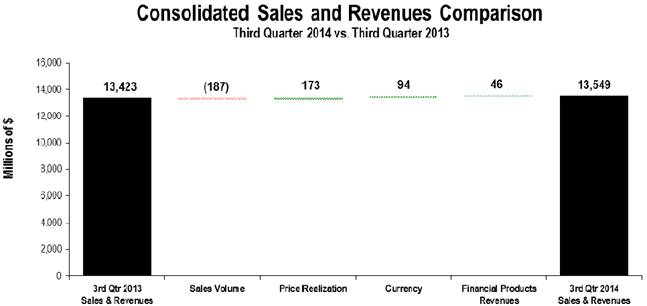
The chart above graphically illustrates reasons for the change in Consolidated Sales and Revenues between the third quarter of 2013 (at left) and the third quarter of 2014 (at right). Items favorably impacting sales and revenues appear as upward stair steps with the corresponding dollar amounts above each bar, while items negatively impacting sales and revenues appear as downward stair steps with dollar amounts reflected in parentheses above each bar. Caterpillar management utilizes these charts internally to visually communicate with the company’s Board of Directors and employees.
Sales and Revenues
Total sales and revenues were $13.549 billion in the third quarter of 2014, about flat with the third quarter of 2013. When reviewing the change in sales and revenues, we focus on the following perspectives:
· Reason for the change: Sales volume decreased $187 million primarily due to lower volume in Resource Industries and Construction Industries, partially offset by increased volume in Energy & Transportation. Favorable changes in price realization and currency and increases in Financial Products’ revenues about offset the sales volume decrease.
The volume decrease was the result of lower end-user demand primarily for mining equipment, as customers continued to reduce their capital expenditures. This decrease was partially offset by the favorable impact of changes in dealer machine and engine inventories as dealers reduced machine and engine inventories about $600 million in the third quarter of 2014 compared with a decrease of about $800 million in the third quarter of 2013. Aftermarket parts sales were slightly higher than the third quarter of 2013.
· Sales by geographic region: Sales increases in North America were about offset by declines in Latin America and Asia/Pacific. Sales increased 15 percent in North America, primarily due to higher demand for oil and gas and transportation applications and construction equipment. Sales decreased 21 percent in Latin America, primarily due to lower end-user demand. Asia/Pacific sales declined 7 percent primarily due to lower construction and mining sales. While sales in Asia/Pacific declined overall, sales in China were about flat. Sales in EAME were about flat as lower end-user demand was offset by the favorable impact of changes in dealer inventories. While EAME sales were about flat, the impact from higher sales in Europe was offset by sales declines in the CIS as a result of political unrest.
· Sales by segment: Energy & Transportation’s sales were higher, while Resource Industries’ sales declined. Energy & Transportation’s sales increased 13 percent primarily due to higher demand for transportation and
oil and gas applications. Resource Industries’ sales decreased 19 percent, primarily due to lower end-user demand for mining equipment, partially offset by the favorable impact of changes in dealer inventories. Construction Industries’ sales were about flat. Financial Products’ segment revenues increased 5 percent.
Consolidated Operating Profit
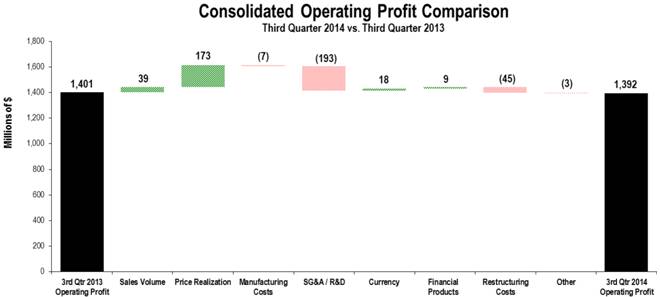
The chart above graphically illustrates reasons for the change in Consolidated Operating Profit between the third quarter of 2013 (at left) and the third quarter of 2014 (at right). Items favorably impacting operating profit appear as upward stair steps with the corresponding dollar amounts above each bar, while items negatively impacting operating profit appear as downward stair steps with dollar amounts reflected in parentheses above each bar. Caterpillar management utilizes these charts internally to visually communicate with the company’s Board of Directors and employees. The bar entitled Other includes consolidating adjustments and Machinery, Energy & Transportation other operating (income) expenses.
Operating profit for the third quarter of 2014 was $1.392 billion, about flat with the third quarter of 2013. Increased SG&A and R&D expenses resulting from higher incentive compensation expense were about offset by favorable price realization.
Manufacturing costs were about flat as higher warranty expense, primarily for mining equipment, and increased incentive compensation expense were about offset by lower material costs and favorable changes in cost absorption as inventory increased in the third quarter of 2014, compared with a decrease in the third quarter of 2013.
Restructuring costs of $81 million in the third quarter of 2014 related to a reduction in workforce in our Gosselies, Belgium, facility and several other restructuring programs across the company. In the third quarter of 2013 restructuring costs were $36 million.
Other Profit/Loss Items
· Other income/expense was income of $117 million compared with expense of $24 million in the third quarter of 2013. The change was primarily due to the favorable net impact from currency translation and hedging gains and losses. The third quarter of 2014 included net gains related to currency translation and hedging compared to net losses in the third quarter of 2013.
· The provision for income taxes in the third quarter of 2014 reflects an estimated annual tax rate of 29.5 percent compared with 29 percent for third quarter of 2013, excluding the items discussed below. The increase from the full-year 2013 rate of 28.5 percent is primarily due to the expiration of the U.S. research and development tax credit.
The provisions for income taxes for the third quarters of 2014 and 2013 also include benefits of $43 million and $55 million, respectively, resulting from true-up of estimated amounts used in the tax provision to the U.S. tax return as filed in September of each year.
Global Workforce
Caterpillar worldwide full-time employment was 114,352 at the end of the third quarter of 2014, compared with 121,506 at the end of the third quarter of 2013, a decrease of 7,154 full-time employees. The flexible workforce increased by 1,017 for a total decrease in the global workforce of 6,137. The decrease was primarily the result of restructuring programs.
|
| September 30 |
| ||||
|
| 2014 |
| 2013 |
| Increase / |
|
Full-time employment |
| 114,352 |
| 121,506 |
| (7,154 | ) |
Flexible workforce |
| 16,615 |
| 15,598 |
| 1,017 |
|
Total |
| 130,967 |
| 137,104 |
| (6,137 | ) |
|
|
|
|
|
|
|
|
Summary of change |
|
|
|
|
|
|
|
U.S. workforce |
|
|
|
|
| (1,453 | ) |
Non-U.S. workforce |
|
|
|
|
| (4,684 | ) |
Total |
|
|
|
|
| (6,137 | ) |
SEGMENT RESULTS
Sales and Revenues by Geographic Region
|
|
|
| % |
| North |
| % |
| Latin |
| % |
|
|
| % |
| Asia/ |
| % |
| |||||
(Millions of dollars) |
| Total |
| Change |
| America |
| Change |
| America |
| Change |
| EAME |
| Change |
| Pacific |
| Change |
| |||||
Third Quarter 2014 |
|
|
|
|
|
|
|
|
|
|
|
|
|
|
|
|
|
|
|
|
| |||||
Construction Industries¹ |
| $ | 4,471 |
| (2 | )% | $ | 1,913 |
| 9 | % | $ | 599 |
| (15 | )% | $ | 997 |
| 1 | % | $ | 962 |
| (13 | )% |
Resource Industries² |
| 2,172 |
| (19 | )% | 752 |
| (10 | )% | 369 |
| (31 | )% | 495 |
| (25 | )% | 556 |
| (13 | )% | |||||
Energy & Transportation³ |
| 5,585 |
| 13 | % | 2,541 |
| 33 | % | 481 |
| (21 | )% | 1,582 |
| 9 | % | 981 |
| 2 | % | |||||
All Other Segments4 |
| 583 |
| 10 | % | 376 |
| 18 | % | 64 |
| 2 | % | 82 |
| (7 | )% | 61 |
| — | % | |||||
Corporate Items and Eliminations |
| (53 | ) |
|
| (27 | ) |
|
| — |
|
|
| (26 | ) |
|
| — |
|
|
| |||||
Machinery, Energy & Transportation |
| $ | 12,758 |
| 1 | % | $ | 5,555 |
| 15 | % | $ | 1,513 |
| (21 | )% | $ | 3,130 |
| (2 | )% | $ | 2,560 |
| (7 | )% |
|
|
|
|
|
|
|
|
|
|
|
|
|
|
|
|
|
|
|
|
|
| |||||
Financial Products Segment |
| $ | 851 |
| 5 | % | $ | 446 |
| 3 | % | $ | 130 |
| 24 | % | $ | 127 |
| — | % | $ | 148 |
| 3 | % |
Corporate Items and Eliminations |
| (60 | ) |
|
| (28 | ) |
|
| (14 | ) |
|
| (6 | ) |
|
| (12 | ) |
|
| |||||
Financial Products Revenues |
| $ | 791 |
| 6 | % | $ | 418 |
| 6 | % | $ | 116 |
| 20 | % | $ | 121 |
| 1 | % | $ | 136 |
| 2 | % |
|
|
|
|
|
|
|
|
|
|
|
|
|
|
|
|
|
|
|
|
|
| |||||
Consolidated Sales and Revenues |
| $ | 13,549 |
| 1 | % | $ | 5,973 |
| 15 | % | $ | 1,629 |
| (19 | )% | $ | 3,251 |
| (2 | )% | $ | 2,696 |
| (7 | )% |
|
|
|
|
|
|
|
|
|
|
|
|
|
|
|
|
|
|
|
|
|
| |||||
Third Quarter 2013 |
|
|
|
|
|
|
|
|
|
|
|
|
|
|
|
|
|
|
|
|
| |||||
Construction Industries¹ |
| $ | 4,569 |
|
|
| $ | 1,760 |
|
|
| $ | 708 |
|
|
| $ | 990 |
|
|
| $ | 1,111 |
|
|
|
Resource Industries² |
| 2,668 |
|
|
| 838 |
|
|
| 534 |
|
|
| 659 |
|
|
| 637 |
|
|
| |||||
Energy & Transportation³ |
| 4,922 |
|
|
| 1,905 |
|
|
| 608 |
|
|
| 1,450 |
|
|
| 959 |
|
|
| |||||
All Other Segments4 |
| 532 |
|
|
| 320 |
|
|
| 63 |
|
|
| 88 |
|
|
| 61 |
|
|
| |||||
Corporate Items and Eliminations |
| (13 | ) |
|
| (12 | ) |
|
| — |
|
|
| — |
|
|
| (1 | ) |
|
| |||||
Machinery, Energy & Transportation |
| $ | 12,678 |
|
|
| $ | 4,811 |
|
|
| $ | 1,913 |
|
|
| $ | 3,187 |
|
|
| $ | 2,767 |
|
|
|
|
|
|
|
|
|
|
|
|
|
|
|
|
|
|
|
|
|
|
|
|
| |||||
Financial Products Segment |
| $ | 807 |
|
|
| $ | 431 |
|
|
| $ | 105 |
|
|
| $ | 127 |
|
|
| $ | 144 |
|
|
|
Corporate Items and Eliminations |
| (62 | ) |
|
| (36 | ) |
|
| (8 | ) |
|
| (7 | ) |
|
| (11 | ) |
|
| |||||
Financial Products Revenues |
| $ | 745 |
|
|
| $ | 395 |
|
|
| $ | 97 |
|
|
| $ | 120 |
|
|
| $ | 133 |
|
|
|
|
|
|
|
|
|
|
|
|
|
|
|
|
|
|
|
|
|
|
|
|
| |||||
Consolidated Sales and Revenues |
| $ | 13,423 |
|
|
| $ | 5,206 |
|
|
| $ | 2,010 |
|
|
| $ | 3,307 |
|
|
| $ | 2,900 |
|
|
|
1 Does not include inter-segment sales of $67 million and $67 million in third quarter 2014 and 2013, respectively.
2 Does not include inter-segment sales of $144 million and $102 million in third quarter 2014 and 2013, respectively.
3 Does not include inter-segment sales of $570 million and $471 million in third quarter 2014 and 2013, respectively.
4 Does not include inter-segment sales of $875 million and $805 million in third quarter 2014 and 2013, respectively.
Sales and Revenues by Segment
|
| Third |
| Sales |
| Price |
|
|
|
|
| Third |
| $ |
| % |
| |||||||
(Millions of dollars) |
| Quarter 2013 |
| Volume |
| Realization |
| Currency |
| Other |
| Quarter 2014 |
| Change |
| Change |
| |||||||
Construction Industries |
| $ | 4,569 |
| $ | (243 | ) | $ | 123 |
| $ | 22 |
| $ | — |
| $ | 4,471 |
| $ | (98 | ) | (2 | )% |
Resource Industries |
| 2,668 |
| (483 | ) | (28 | ) | 15 |
| — |
| 2,172 |
| (496 | ) | (19 | )% | |||||||
Energy & Transportation |
| 4,922 |
| 545 |
| 65 |
| 53 |
| — |
| 5,585 |
| 663 |
| 13 | % | |||||||
All Other Segments |
| 532 |
| 34 |
| 14 |
| 3 |
| — |
| 583 |
| 51 |
| 10 | % | |||||||
Corporate Items and Eliminations |
| (13 | ) | (40 | ) | (1 | ) | 1 |
| — |
| (53 | ) | (40 | ) |
|
| |||||||
|
|
|
|
|
|
|
|
|
|
|
|
|
|
|
|
|
| |||||||
Machinery, Energy & Transportation |
| $ | 12,678 |
| $ | (187 | ) | $ | 173 |
| $ | 94 |
| $ | — |
| $ | 12,758 |
| $ | 80 |
| 1 | % |
|
|
|
|
|
|
|
|
|
|
|
|
|
|
|
|
|
| |||||||
Financial Products Segment |
| 807 |
| — |
| — |
| — |
| 44 |
| 851 |
| 44 |
| 5 | % | |||||||
Corporate Items and Eliminations |
| (62 | ) | — |
| — |
| — |
| 2 |
| (60 | ) | 2 |
|
|
| |||||||
Financial Products Revenues |
| $ | 745 |
| $ | — |
| $ | — |
| $ | — |
| $ | 46 |
| $ | 791 |
| $ | 46 |
| 6 | % |
|
|
|
|
|
|
|
|
|
|
|
|
|
|
|
|
|
| |||||||
Consolidated Sales and Revenues |
| $ | 13,423 |
| $ | (187 | ) | $ | 173 |
| $ | 94 |
| $ | 46 |
| $ | 13,549 |
| $ | 126 |
| 1 | % |
Operating Profit by Segment
|
| Third Quarter |
| Third Quarter |
| $ |
| % |
| |||
(Millions of dollars) |
| 2014 |
| 2013 |
| Change |
| Change |
| |||
Construction Industries |
| $ | 483 |
| $ | 289 |
| $ | 194 |
| 67 | % |
Resource Industries |
| 147 |
| 386 |
| (239 | ) | (62 | )% | |||
Energy & Transportation |
| 1,125 |
| 875 |
| 250 |
| 29 | % | |||
All Other Segments |
| 228 |
| 180 |
| 48 |
| 27 | % | |||
Corporate Items and Eliminations |
| (739 | ) | (475 | ) | (264 | ) |
|
| |||
Machinery, Energy & Transportation |
| $ | 1,244 |
| $ | 1,255 |
| $ | (11 | ) | (1 | )% |
Financial Products Segment |
| 220 |
| 218 |
| 2 |
| 1 | % | |||
Corporate Items and Eliminations |
| (1 | ) | (8 | ) | 7 |
|
|
| |||
Financial Products |
| $ | 219 |
| $ | 210 |
| $ | 9 |
| 4 | % |
Consolidating Adjustments |
| (71 | ) | (64 | ) | (7 | ) |
|
| |||
|
|
|
|
|
|
|
|
|
| |||
Consolidated Operating Profit |
| $ | 1,392 |
| $ | 1,401 |
| $ | (9 | ) | (1 | )% |
CONSTRUCTION INDUSTRIES
(Millions of dollars)
Sales Comparison
|
| Third |
| Sales |
| Price |
| Currency |
| Third |
| $ |
| % |
| ||||||
|
|
|
|
|
|
|
|
|
|
|
|
|
|
|
| ||||||
Sales Comparison1 |
| $ | 4,569 |
| $ | (243 | ) | $ | 123 |
| $ | 22 |
| $ | 4,471 |
| $ | (98 | ) | (2 | )% |
|
|
|
|
|
|
|
|
|
|
|
|
|
|
|
| ||||||
Sales by Geographic Region | |||||||||||||||||||||
|
|
|
|
|
|
|
|
|
|
|
|
|
|
|
| ||||||
|
| Third |
| Third |
| $ |
| % |
|
|
|
|
|
|
| ||||||
North America |
| $ | 1,913 |
| $ | 1,760 |
| $ | 153 |
| 9 | % |
|
|
|
|
|
| |||
Latin America |
| 599 |
| 708 |
| (109 | ) | (15 | )% |
|
|
|
|
|
| ||||||
EAME |
| 997 |
| 990 |
| 7 |
| 1 | % |
|
|
|
|
|
| ||||||
Asia/Pacific |
| 962 |
| 1,111 |
| (149 | ) | (13 | )% |
|
|
|
|
|
| ||||||
Total1 |
| $ | 4,471 |
| $ | 4,569 |
| $ | (98 | ) | (2 | )% |
|
|
|
|
|
| |||
|
|
|
|
|
|
|
|
|
|
|
|
|
|
|
| ||||||
Operating Profit | |||||||||||||||||||||
|
|
|
|
|
|
|
|
|
|
|
|
|
|
|
| ||||||
|
| Third |
| Third |
| $ |
| % |
|
|
|
|
|
|
| ||||||
Operating Profit |
| $ | 483 |
| $ | 289 |
| $ | 194 |
| 67 | % |
|
|
|
|
|
| |||
1 Does not include inter-segment sales of $67 million and $67 million in the third quarter 2014 and 2013, respectively.
Construction Industries’ sales were $4.471 billion in the third quarter of 2014, about flat with the third quarter of 2013. Sales volume was lower, while price realization improved. Sales of new equipment decreased slightly, while sales of aftermarket parts increased slightly.
· The sales volume decrease was primarily related to unfavorable changes in dealer inventories as dealers lowered their inventories more significantly in the third quarter of 2014 than in the third quarter of 2013. Additionally, deliveries to end users decreased.
· Price realization was favorable across all geographic regions. About one-third of the overall improvement was due to the absence of a large government order in Brazil during the third quarter of 2013.
Sales decreases in Asia/Pacific and Latin America were about offset by increases in North America. EAME sales were about flat.
· In Asia/Pacific, the sales decline was primarily due to unfavorable changes in dealer inventories as dealers decreased inventory in the third quarter of 2014 and increased inventory in the third quarter of 2013. In addition, deliveries to end users were lower due to weak construction activity.
· Sales decreased in Latin America primarily due to the absence of a large government order in Brazil.
· Sales in North America improved primarily due to higher end-user demand resulting from an increase in construction-related spending in the United States. Although still below prior peaks, construction-related spending continues to improve. This increase was partially offset by the impact of unfavorable changes in dealer inventories as dealers reduced inventory more significantly in the third quarter of 2014 than in the third quarter of 2013.
Construction Industries’ profit was $483 million in the third quarter of 2014, compared with $289 million in the third quarter of 2013. Profit increased primarily due to the favorable impacts of price realization and currency and
lower manufacturing costs. These favorable impacts were partially offset by lower sales volume and increased SG&A and R&D expenses.
Segment profit for 2014 is based on fixed exchange rates set at the beginning of 2014, while segment profit for 2013 is based on fixed exchange rates set at the beginning of 2013. The difference in these fixed exchange rates resulted in a favorable currency impact for the segment.
Manufacturing costs improved primarily due to favorable changes in cost absorption resulting from the absence of a decrease in inventory during the third quarter of 2013. In addition, material costs were lower. These favorable items were partially offset by higher incentive compensation expense.
SG&A and R&D expenses increased primarily due to higher incentive compensation expense.
RESOURCE INDUSTRIES
(Millions of dollars)
Sales Comparison
|
| Third |
| Sales |
| Price |
| Currency |
| Third |
| $ |
| % |
| ||||||
|
|
|
|
|
|
|
|
|
|
|
|
|
|
|
| ||||||
Sales Comparison1 |
| $ | 2,668 |
| $ | (483 | ) | $ | (28 | ) | $ | 15 |
| $ | 2,172 |
| $ | (496 | ) | (19 | )% |
|
|
|
|
|
|
|
|
|
|
|
|
|
|
|
| ||||||
Sales by Geographic Region | |||||||||||||||||||||
|
|
|
|
|
|
|
|
|
|
|
|
|
|
|
| ||||||
|
| Third |
| Third |
| $ |
| % |
|
|
|
|
|
|
| ||||||
North America |
| $ | 752 |
| $ | 838 |
| $ | (86 | ) | (10 | )% |
|
|
|
|
|
| |||
Latin America |
| 369 |
| 534 |
| (165 | ) | (31 | )% |
|
|
|
|
|
| ||||||
EAME |
| 495 |
| 659 |
| (164 | ) | (25 | )% |
|
|
|
|
|
| ||||||
Asia/Pacific |
| 556 |
| 637 |
| (81 | ) | (13 | )% |
|
|
|
|
|
| ||||||
Total1 |
| $ | 2,172 |
| $ | 2,668 |
| $ | (496 | ) | (19 | )% |
|
|
|
|
|
| |||
|
|
|
|
|
|
|
|
|
|
|
|
|
|
|
| ||||||
Operating Profit | |||||||||||||||||||||
|
|
|
|
|
|
|
|
|
|
|
|
|
|
|
| ||||||
|
| Third |
| Third |
| $ |
| % |
|
|
|
|
|
|
| ||||||
Operating Profit |
| $ | 147 |
| $ | 386 |
| $ | (239 | ) | (62 | )% |
|
|
|
|
|
| |||
1 Does not include inter-segment sales of $144 million and $102 million in the third quarter 2014 and 2013, respectively.
Resource Industries’ sales were $2.172 billion in the third quarter of 2014, a decrease of $496 million, or 19 percent, from the third quarter of 2013. Sales declined in all geographic regions primarily due to lower end-user demand. This unfavorable impact was partially offset by the favorable impact of changes in dealer inventories. While dealers continued to reduce inventories during the third quarter of 2014, the reductions were less significant than in the third quarter of 2013.
Although prices of some mined commodities remained above investment thresholds, customers in all geographic regions have reduced spending across the mining industry. We believe that mining companies are increasing productivity at existing mines and improving their transportation infrastructure rather than investing in expansions or new mine openings, which results in lower demand for our mining products. In addition, projects financed and started in prior years have led to an increased supply of coal and iron ore which has outpaced demand and resulted in prices at or below investment thresholds for those commodities. As a result, new orders for mining equipment continued to be weak in the quarter.
Aftermarket part sales were slightly lower. We believe some companies are continuing to extend proactive maintenance schedules and delay major overhauls when possible.
Resource Industries’ profit was $147 million in the third quarter of 2014 compared with $386 million in the third quarter of 2013. The decrease was primarily the result of lower sales volume, increased SG&A and R&D expenses and unfavorable price realization.
SG&A and R&D expenses increased primarily due to higher spending for new product introduction programs and increased incentive compensation expense. Price realization was unfavorable primarily due to an increasingly competitive pricing environment. Manufacturing costs were about flat as increased warranty expense was about offset by lower material costs.
ENERGY & TRANSPORTATION
(Millions of dollars)
Sales Comparison
|
| Third |
| Sales |
| Price |
| Currency |
| Third |
| $ |
| % |
| ||||||
|
|
|
|
|
|
|
|
|
|
|
|
|
|
|
| ||||||
Sales Comparison1 |
| $ | 4,922 |
| $ | 545 |
| $ | 65 |
| $ | 53 |
| $ | 5,585 |
| $ | 663 |
| 13 | % |
Sales by Geographic Region
|
| Third |
| Third |
| $ |
| % |
| |||
North America |
| $ | 2,541 |
| $ | 1,905 |
| $ | 636 |
| 33 | % |
Latin America |
| 481 |
| 608 |
| (127 | ) | (21 | )% | |||
EAME |
| 1,582 |
| 1,450 |
| 132 |
| 9 | % | |||
Asia/Pacific |
| 981 |
| 959 |
| 22 |
| 2 | % | |||
Total1 |
| $ | 5,585 |
| $ | 4,922 |
| $ | 663 |
| 13 | % |
Operating Profit
|
| Third |
| Third |
| $ |
| % |
| |||
Operating Profit |
| $ | 1,125 |
| $ | 875 |
| $ | 250 |
| 29 | % |
1 Does not include inter-segment sales of $570 million and $471 million in the third quarter 2014 and 2013, respectively.
Energy & Transportation’s sales were $5.585 billion in the third quarter of 2014, an increase of 13 percent compared with the third quarter of 2013. Sales for all applications increased.
· Transportation — Sales increased in North America and EAME and were about flat in Asia/Pacific and Latin America. Higher sales in North America and EAME were primarily due to increased sales for rail applications. In North America, sales strengthened due to customer demand in advance of the 2015 emissions change for locomotives. In EAME, sales increased as we continue to focus on expansion of our rail business.
· Oil and Gas — Sales increased in North America and were partially offset by declines in Latin America. EAME and Asia/Pacific sales were about flat. In North America, sales increased primarily due to higher demand for equipment used in well servicing, gas compression and drilling applications. In Latin America, lower sales were primarily due to lower end-user demand.
· Industrial — Sales increased in EAME and were about flat in all other geographic regions. In EAME, sales increased due to higher demand for engines used by original equipment manufacturers for industrial and construction applications.
· Power Generation — Sales were slightly higher as favorable changes in dealer inventories primarily in North America were partially offset by slightly lower end-user demand.
Energy & Transportation’s profit was $1.125 billion in the third quarter of 2014, compared with $875 million in the third quarter of 2013. The improvement was primarily due to higher sales volume and favorable price realization, partially offset by an increase in incentive compensation expense.
FINANCIAL PRODUCTS SEGMENT
(Millions of dollars)
Revenues by Geographic Region
|
| Third |
| Third |
| $ |
| % |
| |||
North America |
| $ | 446 |
| $ | 431 |
| $ | 15 |
| 3 | % |
Latin America |
| 130 |
| 105 |
| 25 |
| 24 | % | |||
EAME |
| 127 |
| 127 |
| — |
| — | % | |||
Asia/Pacific |
| 148 |
| 144 |
| 4 |
| 3 | % | |||
Total |
| $ | 851 |
| $ | 807 |
| $ | 44 |
| 5 | % |
Operating Profit
|
| Third |
| Third |
| $ |
| % |
| |||
Operating Profit |
| $ | 220 |
| $ | 218 |
| $ | 2 |
| 1 | % |
Financial Products’ revenues were $851 million in the third quarter of 2014, an increase of $44 million, or 5 percent, from the third quarter of 2013. The increase was primarily due to the favorable impact from higher average earning assets primarily in North America.
Financial Products’ profit was $220 million in the third quarter of 2014, compared with $218 million in the third quarter of 2013. The increase was primarily due to a $23 million improvement on net yield on average earning assets and a $21 million increase in gains on sales of securities at Caterpillar Financial Insurance Services. These increases were partially offset by $32 million of unfavorable adjustments related to prior periods for interest rate swap contracts and the provision for credit losses.
At the end of the third quarter of 2014, past dues at Cat Financial were 2.81 percent compared with 2.63 percent at the end of the second quarter of 2014, 2.37 percent at the end of 2013 and 2.45 percent at the end of the third quarter of 2013. The increase reflects higher past dues in Cat Financial’s Latin American, Asia/Pacific and European portfolios. Write-offs, net of recoveries, were $22 million for the third quarter of 2014, compared with $58 million for the third quarter of 2013.
As of September 30, 2014, Cat Financial’s allowance for credit losses totaled $405 million, or 1.37 percent of net finance receivables, compared with $387 million, or 1.27 percent of net finance receivables as of June 30, 2014, and $378 million, or 1.30 percent of net finance receivables, at year-end 2013. The allowance for credit losses as of September 30, 2013, was $404 million, or 1.40 percent of net finance receivables.
Corporate Items and Eliminations
Expense for corporate items and eliminations was $740 million in the third quarter of 2014, an increase of $257 million from the third quarter of 2013. Corporate items and eliminations include: corporate-level expenses; restructuring costs; timing differences, as some expenses are reported in segment profit on a cash basis; retirement benefit costs other than service cost; currency differences for ME&T, as segment profit is reported using annual fixed exchange rates and inter-segment eliminations.
The increase in expense from the third quarter of 2013 was primarily due to timing differences, higher corporate costs, the unfavorable impact of currency and higher restructuring costs. Segment profit for 2014 is based on fixed exchange rates set at the beginning of 2014, while segment profit for 2013 is based on fixed exchange rates set at the beginning of 2013. The difference in actual exchange rates compared with fixed exchange rates is
included in corporate items and eliminations and is not reflected in segment profit. These unfavorable items were partially offset by decreased retirement benefit costs.
2014 Outlook
The company now expects 2014 sales and revenues to be about $55 billion, the middle of the previous outlook range of $54 to $56 billion. While the mid-point of the sales and revenues outlook range has not changed, profit per share expectations for 2014 continue to improve.
With 2014 sales and revenues of about $55 billion, the revised profit outlook is $6.00 per share, or $6.50 per share excluding $450 million of restructuring costs. That is an improvement from the previous profit outlook of $5.75 per share, or $6.20 per share excluding $400 million of restructuring costs at the mid-point of the previous sales and revenues outlook range of $54 to $56 billion.
The improvement in the profit outlook is a result of our continuing focus on execution and cost control, favorable currency impacts and a favorable tax item that occurred in the third quarter.
Preliminary 2015 Sales and Revenues Outlook
From an economic perspective, we believe there is a reasonable likelihood that world economic growth could improve in 2015. In developed countries, growth-oriented monetary policies should support continued modest economic improvement. In addition, we believe there is potential for increased investment in infrastructure in countries such as the United States, India and Turkey.
In developing countries, several governments raised interest rates or constrained liquidity in 2013 to control inflation or protect their exchange rates, and these measures have led to slower growth in 2014. More recently, interest rates in many developing countries have stabilized and we saw the first monetary policy easing in the third quarter of 2014.
Despite cautious optimism for improved global economic growth, significant risks and uncertainties remain that could temper growth in 2015. Political conflicts and social unrest continue to disrupt economic activity in several regions, in particular, the Commonwealth of Independent States, Africa and the Middle East. The Chinese government’s push for structural reform is slowing growth, and the ongoing uncertainty around the direction and timing of U.S. fiscal and monetary policy actions may temper business confidence. As a result, our preliminary outlook for 2015 expects sales and revenues to be flat to slightly up from 2014.
As usual for this time of year, we are in the process of developing our operational and resource planning for next year. In January 2015, with our year-end financial release, we will provide a more complete outlook, including sales and revenues and profit.
QUESTIONS AND ANSWERS
Q1: Can you discuss changes in dealer inventories in the third quarter, and your expectations for dealer inventory changes in the fourth quarter of 2014?
A: Dealer machine and engine inventories decreased in the third quarter of 2014 by about $600 million. This compares with a decrease of about $800 million in the third quarter of 2013. We believe that dealers will continue to decrease inventory, primarily construction equipment, in the fourth quarter of 2014 due to expected seasonal selling patterns and increased utilization of inventory from our product distribution centers.
Q2: Can you comment on expense related to your short-term incentive compensation plans?
A: Short-term incentive compensation expense is directly related to financial and operational performance measured against targets set annually. The third-quarter 2014 expense was about $390 million, and we expect the full year will be about $1.3 billion. Short-term incentive compensation in the third quarter of 2013 was about $100 million, and full-year 2013 was about $545 million.
Q3: Can you comment on the change in your order backlog during the third quarter of 2014?
A: At the end of the third quarter, the backlog was $19.7 billion. This represents an increase of about $400 million from the end of the second quarter of 2014. The increase was primarily related to an early order program for rental machines in North America and Europe with delivery in 2015 and an increase in the backlog for reciprocating engines. These increases were partially offset by declines in the backlog for locomotives.
Q4: Can you comment on your balance sheet and ME&T operating cash flow in the third quarter of 2014?
A: ME&T operating cash flow for the third quarter of 2014 was $1.442 billion, compared with $2.109 billion in the third quarter of 2013. The decrease was due to unfavorable changes in working capital primarily inventory, which declined in the third quarter of 2013 and increased in the third quarter of 2014.
The ME&T debt-to-capital ratio was 34.7 percent, up from 32.5 percent at the end of the second quarter but within our target range of 30 to 45 percent. The increase was mostly due to the repurchase of $2.5 billion of Caterpillar common stock in the third quarter of 2014. Our cash and liquidity positions remain strong with an enterprise cash balance of $6.082 billion at September 30, 2014.
Our priorities for the use of cash are to maintain a strong financial position in support of our credit rating, provide capital to support growth, appropriately fund employee benefit plans, pay dividends and repurchase common stock. During the third quarter, capital expenditures totaled $395 million. We also paid a dividend of $440 million following the announcement to increase the quarterly cash dividend 17 percent in the second quarter. Further demonstrating our commitment to deliver superior returns to stockholders through business cycles, we repurchased $2.5 billion of common stock in the third quarter of 2014. Year-to-date, total return of capital to stockholders through the repurchase of common stock and payment of dividends is approximately $5.4 billion.
Q5: Based on what you are currently seeing, can you provide an update on prospects for improvement in mining?
A: The mining equipment industry remains weak and quoting activity and order rates remain at low levels. While we have not seen evidence of an upturn in the industry, because of the low level of sales of new equipment, we believe the likelihood of significant decline from current levels is limited.
Q6: Can you provide an update on China, your expectations about the construction machinery industry and how Caterpillar is performing?
A: China’s construction machinery industry continued to weaken in the third quarter of 2014. In the first eight months of 2014, the overall construction machinery industry fell approximately 10 percent from the same period last year. However, our dealer deliveries to end users have outpaced the industry overall. We are pleased with our improved competitive position and expect to build on the solid foundation we have in place. We expect the Chinese construction machinery industry to remain challenged in the near future.
Q7: What are your expected total restructuring costs in 2014?
A: Expected restructuring costs are about $450 million, higher than the previous estimate of about $400 million. The increase is primarily due to restructuring programs related to mining.
GLOSSARY OF TERMS
1. All Other Segments — Primarily includes activities such as: the remanufacturing of Cat® engines and components and remanufacturing services for other companies as well as the business strategy, product management, development, manufacturing, marketing and product support of undercarriage, specialty products, hardened bar stock components and ground engaging tools primarily for Cat products, paving products, forestry products, industrial and waste products and tunnel boring equipment; the product management, development, marketing, sales and product support of on-highway vocational trucks for North America; parts distribution; distribution services responsible for dealer development and administration including three wholly owned dealers in Japan, dealer portfolio management and ensuring the most efficient and effective distribution of machines, engines and parts.
2. Consolidating Adjustments — Eliminations of transactions between Machinery, Energy & Transportation and Financial Products.
3. Construction Industries — A segment primarily responsible for supporting customers using machinery in infrastructure and building construction applications. Responsibilities include business strategy, product design, product management and development, manufacturing, marketing and sales and product support. The product portfolio includes backhoe loaders, small wheel loaders, small track-type tractors, skid steer loaders, multi-terrain loaders, mini excavators, compact wheel loaders, telehandlers, select work tools, small, medium and large track excavators, wheel excavators, medium wheel loaders, compact track loaders, medium track-type tractors, track-type loaders, motor graders and pipe layers. In addition, Construction Industries has responsibility for an integrated manufacturing cost center.
4. Currency — With respect to sales and revenues, currency represents the translation impact on sales resulting from changes in foreign currency exchange rates versus the U.S. dollar. With respect to operating profit, currency represents the net translation impact on sales and operating costs resulting from changes in foreign currency exchange rates versus the U.S. dollar. Currency includes the impact on sales and operating profit for the Machinery, Energy & Transportation lines of business only; currency impacts on Financial Products revenues and operating profit are included in the Financial Products portions of the respective analyses. With respect to other income/expense, currency represents the effects of forward and option contracts entered into by the company to reduce the risk of fluctuations in exchange rates (hedging) and the net effect of changes in foreign currency exchange rates on our foreign currency assets and liabilities for consolidated results (translation).
5. Debt-to-Capital Ratio — A key measure of Machinery, Energy & Transportation’s financial strength used by both management and our credit rating agencies. The metric is defined as Machinery, Energy & Transportation’s short-term borrowings, long-term debt due within one year and long-term debt due after one year (debt) divided by the sum of Machinery, Energy & Transportation’s debt and stockholders’ equity. Debt also includes Machinery, Energy & Transportation’s borrowings from Financial Products.
6. EAME — A geographic region including Europe, Africa, the Middle East and the Commonwealth of Independent States (CIS).
7. Earning Assets — Assets consisting primarily of total finance receivables net of unearned income, plus equipment on operating leases, less accumulated depreciation at Cat Financial.
8. Energy & Transportation (formerly Power Systems) — A segment primarily responsible for supporting customers using reciprocating engines, turbines, diesel-electric locomotives and related parts across industries serving power generation, industrial, oil and gas and transportation applications, including marine and rail-related businesses. Responsibilities include business strategy, product design, product management, development, manufacturing, marketing, sales and product support of turbines and turbine-related services, reciprocating engine powered generator sets, integrated systems used in the electric power generation industry, reciprocating engines and integrated systems and solutions for the marine and oil and gas industries; reciprocating engines supplied to the industrial industry as well as Caterpillar machinery; the business strategy, product design, product management, development, manufacturing, remanufacturing, leasing, and service of diesel-electric locomotives and components and other rail-related products and services.
9. Financial Products Segment — Provides financing to customers and dealers for the purchase and lease of Cat and other equipment, as well as some financing for Caterpillar sales to dealers. Financing plans include
operating and finance leases, installment sale contracts, working capital loans and wholesale financing plans. The segment also provides various forms of insurance to customers and dealers to help support the purchase and lease of our equipment.
10. Latin America — Geographic region including Central and South American countries and Mexico.
11. Machinery, Energy & Transportation (ME&T) — Represents the aggregate total of Construction Industries, Resource Industries, Energy & Transportation and All Other Segments and related corporate items and eliminations.
12. Machinery, Energy & Transportation Other Operating (Income) Expenses — Comprised primarily of gains/losses on disposal of long-lived assets, gains/losses on divestitures, long-lived asset impairment charges and legal settlements. Restructuring costs, which are classified as other operating expenses on the Results of Operations, are presented separately on the Operating Profit Comparison.
13. Manufacturing Costs — Manufacturing costs exclude the impacts of currency and represent the volume-adjusted change for variable costs and the absolute dollar change for period manufacturing costs. Variable manufacturing costs are defined as having a direct relationship with the volume of production. This includes material costs, direct labor and other costs that vary directly with production volume such as freight, power to operate machines and supplies that are consumed in the manufacturing process. Period manufacturing costs support production but are defined as generally not having a direct relationship to short-term changes in volume. Examples include machinery and equipment repair, depreciation on manufacturing assets, facility support, procurement, factory scheduling, manufacturing planning and operations management.
14. Price Realization — The impact of net price changes excluding currency and new product introductions. Consolidated price realization includes the impact of changes in the relative weighting of sales between geographic regions.
15. Resource Industries — A segment primarily responsible for supporting customers using machinery in mining and quarrying applications. Responsibilities include business strategy, product design, product management and development, manufacturing, marketing and sales and product support. The product portfolio includes large track-type tractors, large mining trucks, hard rock vehicles, longwall miners, electric rope shovels, draglines, hydraulic shovels, drills, highwall miners, large wheel loaders, off-highway trucks, articulated trucks, wheel tractor scrapers, wheel dozers, select work tools, machinery components and electronics and control systems. Resource Industries also manages areas that provide services to other parts of the company, including integrated manufacturing and research and development. In addition, segment profit includes the impact from divestiture of portions of the Bucyrus distribution business.
16. Restructuring Costs — Primarily costs for employee separation costs and long-lived asset impairments.
17. Sales Volume — With respect to sales and revenues, sales volume represents the impact of changes in the quantities sold for Machinery, Energy & Transportation as well as the incremental revenue impact of new product introductions, including emissions-related product updates. With respect to operating profit, sales volume represents the impact of changes in the quantities sold for Machinery, Energy & Transportation combined with product mix as well as the net operating profit impact of new product introductions, including emissions-related product updates. Product mix represents the net operating profit impact of changes in the relative weighting of Machinery, Energy & Transportation sales with respect to total sales.
NON-GAAP FINANCIAL MEASURES
The following definition is provided for “non-GAAP financial measures” in connection with Regulation G issued by the Securities and Exchange Commission. This non-GAAP financial measure has no standardized meaning prescribed by U.S. GAAP and therefore is unlikely to be comparable to the calculation of similar measures for other companies. Management does not intend this item to be considered in isolation or substituted for the related GAAP measure.
Profit Per Share Excluding Restructuring Costs
We anticipate incurring significant restructuring costs in 2014. We believe it is important to separately quantify the profit per share impact of restructuring costs in order for our third-quarter 2014 results and the 2014 outlook to be meaningful to our readers. We have also provided third quarter of 2013 profit per share excluding restructuring costs comparable to the 2014 presentation. Reconciliation of profit per share excluding restructuring costs to the most directly comparable GAAP measure, profit per share is as follows:
|
| 2013 |
| 2014 |
| Original1 |
| 2014 Outlook |
| Current3 |
| |||||
Profit per share |
| $ | 1.45 |
| $ | 1.63 |
| $ | 5.30 |
| $ | 5.75 |
| $ | 6.00 |
|
Per share restructuring costs |
| $ | 0.04 |
| $ | 0.09 |
| $ | 0.55 |
| $ | 0.45 |
| $ | 0.50 |
|
Profit per share excluding restructuring costs |
| $ | 1.49 |
| $ | 1.72 |
| $ | 5.85 |
| $ | 6.20 |
| $ | 6.50 |
|
1 2014 Sales and Revenues Outlook of $56 billion in a range of plus or minus 5 percent (as of January 27, 2014).
2 2014 Sales and Revenues Outlook in a range of $54 to $56 billion (as of July 24, 2014).
3 2014 Sales and Revenues Outlook of about $55 billion (as of October 23, 2014).
Machinery, Energy & Transportation
Caterpillar defines Machinery, Energy & Transportation as it is presented in the supplemental data as Caterpillar Inc. and its subsidiaries with Financial Products accounted for on the equity basis. Machinery, Energy & Transportation information relates to the design, manufacture and marketing of our products. Financial Products information relates to the financing to customers and dealers for the purchase and lease of Caterpillar and other equipment. The nature of these businesses is different, especially with regard to the financial position and cash flow items. Caterpillar management utilizes this presentation internally to highlight these differences. We also believe this presentation will assist readers in understanding our business. Pages 23-28 reconcile Machinery, Energy & Transportation with Financial Products on the equity basis to Caterpillar Inc. consolidated financial information.
Caterpillar’s latest financial results and outlook are also available via:
Telephone:
(800) 228-7717 (Inside the United States and Canada)
(858) 764-9492 (Outside the United States and Canada)
Internet:
http://www.caterpillar.com/en/investors.html
http://www.caterpillar.com/en/investors/quarterly-results.html (live broadcast/replays of quarterly conference call)
Caterpillar contact:
Rachel Potts
309-675-6892 (Office) or 309-573-3444 (Mobile)
mail to: Potts_Rachel_A@cat.com
Caterpillar Inc.
Condensed Consolidated Statement of Results of Operations
(Unaudited)
(Dollars in millions except per share data)
|
| Three Months Ended |
| Nine Months Ended |
| ||||||||
|
| September 30, |
| September 30, |
| ||||||||
|
| 2014 |
| 2013 |
| 2014 |
| 2013 |
| ||||
Sales and revenues: |
|
|
|
|
|
|
|
|
| ||||
Sales of Machinery, Energy & Transportation |
| $ | 12,758 |
| $ | 12,678 |
| $ | 38,642 |
| $ | 39,048 |
|
Revenues of Financial Products |
| 791 |
| 745 |
| 2,298 |
| 2,206 |
| ||||
Total sales and revenues |
| 13,549 |
| 13,423 |
| 40,940 |
| 41,254 |
| ||||
|
|
|
|
|
|
|
|
|
| ||||
Operating costs: |
|
|
|
|
|
|
|
|
| ||||
Cost of goods sold |
| 9,634 |
| 9,774 |
| 29,268 |
| 30,186 |
| ||||
Selling, general and administrative expenses |
| 1,446 |
| 1,319 |
| 4,175 |
| 4,130 |
| ||||
Research and development expenses |
| 533 |
| 469 |
| 1,557 |
| 1,579 |
| ||||
Interest expense of Financial Products |
| 157 |
| 178 |
| 470 |
| 552 |
| ||||
Other operating (income) expenses |
| 387 |
| 282 |
| 1,205 |
| 631 |
| ||||
Total operating costs |
| 12,157 |
| 12,022 |
| 36,675 |
| 37,078 |
| ||||
|
|
|
|
|
|
|
|
|
| ||||
Operating profit |
| 1,392 |
| 1,401 |
| 4,265 |
| 4,176 |
| ||||
|
|
|
|
|
|
|
|
|
| ||||
Interest expense excluding Financial Products |
| 128 |
| 116 |
| 358 |
| 356 |
| ||||
Other income (expense) |
| 117 |
| (24 | ) | 236 |
| (79 | ) | ||||
|
|
|
|
|
|
|
|
|
| ||||
Consolidated profit before taxes |
| 1,381 |
| 1,261 |
| 4,143 |
| 3,741 |
| ||||
|
|
|
|
|
|
|
|
|
| ||||
Provision (benefit) for income taxes |
| 364 |
| 310 |
| 1,201 |
| 943 |
| ||||
Profit of consolidated companies |
| 1,017 |
| 951 |
| 2,942 |
| 2,798 |
| ||||
|
|
|
|
|
|
|
|
|
| ||||
Equity in profit (loss) of unconsolidated affiliated companies |
| 4 |
| (1 | ) | 6 |
| (1 | ) | ||||
|
|
|
|
|
|
|
|
|
| ||||
Profit of consolidated and affiliated companies |
| 1,021 |
| 950 |
| 2,948 |
| 2,797 |
| ||||
|
|
|
|
|
|
|
|
|
| ||||
Less: Profit (loss) attributable to noncontrolling interests |
| 4 |
| 4 |
| 10 |
| 11 |
| ||||
|
|
|
|
|
|
|
|
|
| ||||
Profit 1 |
| $ | 1,017 |
| $ | 946 |
| $ | 2,938 |
| $ | 2,786 |
|
|
|
|
|
|
|
|
|
|
| ||||
Profit per common share |
| $ | 1.66 |
| $ | 1.48 |
| $ | 4.73 |
| $ | 4.30 |
|
|
|
|
|
|
|
|
|
|
| ||||
Profit per common share — diluted 2 |
| $ | 1.63 |
| $ | 1.45 |
| $ | 4.64 |
| $ | 4.21 |
|
|
|
|
|
|
|
|
|
|
| ||||
Weighted-average common shares outstanding (millions) |
|
|
|
|
|
|
|
|
| ||||
- Basic |
| 611.5 |
| 639.3 |
| 620.6 |
| 647.6 |
| ||||
- Diluted 2 |
| 622.8 |
| 651.9 |
| 632.7 |
| 661.3 |
| ||||
|
|
|
|
|
|
|
|
|
| ||||
Cash dividends declared per common share |
| $ | — |
| $ | — |
| $ | 1.30 |
| $ | 1.12 |
|
1 Profit attributable to common stockholders.
2 Diluted by assumed exercise of stock-based compensation awards using the treasury stock method.
Caterpillar Inc.
Condensed Consolidated Statement of Financial Position
(Unaudited)
(Millions of dollars)
|
| September 30, |
| December 31, |
| ||
|
| 2014 |
| 2013 |
| ||
Assets |
|
|
|
|
| ||
Current assets: |
|
|
|
|
| ||
Cash and short-term investments |
| $ | 6,082 |
| $ | 6,081 |
|
Receivables - trade and other |
| 7,705 |
| 8,413 |
| ||
Receivables - finance |
| 9,307 |
| 8,763 |
| ||
Deferred and refundable income taxes |
| 1,370 |
| 1,553 |
| ||
Prepaid expenses and other current assets |
| 1,250 |
| 900 |
| ||
Inventories |
| 13,328 |
| 12,625 |
| ||
Total current assets |
| 39,042 |
| 38,335 |
| ||
|
|
|
|
|
| ||
Property, plant and equipment — net |
| 16,431 |
| 17,075 |
| ||
Long-term receivables - trade and other |
| 1,473 |
| 1,397 |
| ||
Long-term receivables - finance |
| 14,691 |
| 14,926 |
| ||
Investments in unconsolidated affiliated companies |
| 265 |
| 272 |
| ||
Noncurrent deferred and refundable income taxes |
| 761 |
| 594 |
| ||
Intangible assets |
| 3,210 |
| 3,596 |
| ||
Goodwill |
| 6,801 |
| 6,956 |
| ||
Other assets |
| 1,814 |
| 1,745 |
| ||
Total assets |
| $ | 84,488 |
| $ | 84,896 |
|
|
|
|
|
|
| ||
Liabilities |
|
|
|
|
| ||
Current liabilities: |
|
|
|
|
| ||
Short-term borrowings: |
|
|
|
|
| ||
— Machinery, Energy & Transportation |
| $ | 7 |
| $ | 16 |
|
— Financial Products |
| 4,429 |
| 3,663 |
| ||
Accounts payable |
| 6,778 |
| 6,560 |
| ||
Accrued expenses |
| 3,466 |
| 3,493 |
| ||
Accrued wages, salaries and employee benefits |
| 2,230 |
| 1,622 |
| ||
Customer advances |
| 2,165 |
| 2,360 |
| ||
Dividends payable |
| — |
| 382 |
| ||
Other current liabilities |
| 1,848 |
| 1,849 |
| ||
Long-term debt due within one year: |
|
|
|
|
| ||
— Machinery, Energy & Transportation |
| 509 |
| 760 |
| ||
— Financial Products |
| 6,157 |
| 6,592 |
| ||
Total current liabilities |
| 27,589 |
| 27,297 |
| ||
|
|
|
|
|
| ||
Long-term debt due after one year: |
|
|
|
|
| ||
— Machinery, Energy & Transportation |
| 9,498 |
| 7,999 |
| ||
— Financial Products |
| 18,682 |
| 18,720 |
| ||
Liability for postemployment benefits |
| 6,539 |
| 6,973 |
| ||
Other liabilities |
| 3,284 |
| 3,029 |
| ||
Total liabilities |
| 65,592 |
| 64,018 |
| ||
|
|
|
|
|
| ||
Stockholders’ equity |
|
|
|
|
| ||
Common stock |
| 4,968 |
| 4,709 |
| ||
Treasury stock |
| (15,765 | ) | (11,854 | ) | ||
Profit employed in the business |
| 33,977 |
| 31,854 |
| ||
Accumulated other comprehensive income (loss) |
| (4,357 | ) | (3,898 | ) | ||
Noncontrolling interests |
| 73 |
| 67 |
| ||
Total stockholders’ equity |
| 18,896 |
| 20,878 |
| ||
Total liabilities and stockholders’ equity |
| $ | 84,488 |
| $ | 84,896 |
|
Caterpillar Inc.
Condensed Consolidated Statement of Cash Flow
(Unaudited)
(Millions of dollars)
|
| Nine Months Ended |
| ||||
|
| September 30, |
| ||||
|
| 2014 |
| 2013 |
| ||
Cash flow from operating activities: |
|
|
|
|
| ||
Profit of consolidated and affiliated companies |
| $ | 2,948 |
| $ | 2,797 |
|
Adjustments for non-cash items: |
|
|
|
|
| ||
Depreciation and amortization |
| 2,368 |
| 2,263 |
| ||
Other |
| 327 |
| 377 |
| ||
Changes in assets and liabilities, net of acquisitions and divestitures: |
|
|
|
|
| ||
Receivables — trade and other |
| 244 |
| 992 |
| ||
Inventories |
| (859 | ) | 1,911 |
| ||
Accounts payable |
| 667 |
| 157 |
| ||
Accrued expenses |
| (44 | ) | (227 | ) | ||
Accrued wages, salaries and employee benefits |
| 648 |
| (500 | ) | ||
Customer advances |
| (132 | ) | (230 | ) | ||
Other assets — net |
| (104 | ) | (74 | ) | ||
Other liabilities — net |
| 123 |
| 145 |
| ||
Net cash provided by (used for) operating activities |
| 6,186 |
| 7,611 |
| ||
Cash flow from investing activities: |
|
|
|
|
| ||
Capital expenditures — excluding equipment leased to others |
| (1,072 | ) | (1,862 | ) | ||
Expenditures for equipment leased to others |
| (1,310 | ) | (1,301 | ) | ||
Proceeds from disposals of leased assets and property, plant and equipment |
| 681 |
| 593 |
| ||
Additions to finance receivables |
| (8,464 | ) | (8,339 | ) | ||
Collections of finance receivables |
| 7,264 |
| 6,790 |
| ||
Proceeds from sale of finance receivables |
| 154 |
| 110 |
| ||
Investments and acquisitions (net of cash acquired) |
| (18 | ) | (193 | ) | ||
Proceeds from sale of businesses and investments (net of cash sold) |
| 196 |
| 168 |
| ||
Proceeds from sale of securities |
| 347 |
| 297 |
| ||
Investments in securities |
| (769 | ) | (312 | ) | ||
Other — net |
| (12 | ) | (29 | ) | ||
Net cash provided by (used for) investing activities |
| (3,003 | ) | (4,078 | ) | ||
Cash flow from financing activities: |
|
|
|
|
| ||
Dividends paid |
| (1,197 | ) | (730 | ) | ||
Distribution to noncontrolling interests |
| (7 | ) | (10 | ) | ||
Contribution from noncontrolling interests |
| 2 |
| — |
| ||
Common stock issued, including treasury shares reissued |
| 218 |
| 77 |
| ||
Treasury shares purchased |
| (4,238 | ) | (2,000 | ) | ||
Excess tax benefit from stock-based compensation |
| 162 |
| 70 |
| ||
Proceeds from debt issued (original maturities greater than three months) |
| 9,103 |
| 6,999 |
| ||
Payments on debt (original maturities greater than three months) |
| (7,893 | ) | (8,770 | ) | ||
Short-term borrowings - net (original maturities three months or less) |
| 791 |
| 1,736 |
| ||
Net cash provided by (used for) financing activities |
| (3,059 | ) | (2,628 | ) | ||
Effect of exchange rate changes on cash |
| (123 | ) | (38 | ) | ||
Increase (decrease) in cash and short-term investments |
| 1 |
| 867 |
| ||
Cash and short-term investments at beginning of period |
| 6,081 |
| 5,490 |
| ||
Cash and short-term investments at end of period |
| $ | 6,082 |
| $ | 6,357 |
|
All short-term investments, which consist primarily of highly liquid investments with original maturities of three months or less, are considered to be cash equivalents.
Caterpillar Inc.
Supplemental Data for Results of Operations
For the Three Months Ended September 30, 2014
(Unaudited)
(Millions of dollars)
|
|
|
| Supplemental Consolidating Data |
| ||||||||
|
|
|
| Machinery, |
|
|
|
|
| ||||
|
| Consolidated |
| Energy & |
| Financial |
| Consolidating |
| ||||
Sales and revenues: |
|
|
|
|
|
|
|
|
| ||||
Sales of Machinery, Energy & Transportation |
| $ | 12,758 |
| $ | 12,758 |
| $ | — |
| $ | — |
|
Revenues of Financial Products |
| 791 |
| — |
| 875 |
| (84 | )2 | ||||
Total sales and revenues |
| 13,549 |
| 12,758 |
| 875 |
| (84 | ) | ||||
|
|
|
|
|
|
|
|
|
| ||||
Operating costs: |
|
|
|
|
|
|
|
|
| ||||
Cost of goods sold |
| 9,634 |
| 9,634 |
| — |
| — |
| ||||
Selling, general and administrative expenses |
| 1,446 |
| 1,278 |
| 172 |
| (4 | )3 | ||||
Research and development expenses |
| 533 |
| 533 |
| — |
| — |
| ||||
Interest expense of Financial Products |
| 157 |
| — |
| 158 |
| (1 | )4 | ||||
Other operating (income) expenses |
| 387 |
| 69 |
| 326 |
| (8 | )3 | ||||
Total operating costs |
| 12,157 |
| 11,514 |
| 656 |
| (13 | ) | ||||
|
|
|
|
|
|
|
|
|
| ||||
Operating profit |
| 1,392 |
| 1,244 |
| 219 |
| (71 | ) | ||||
|
|
|
|
|
|
|
|
|
| ||||
Interest expense excluding Financial Products |
| 128 |
| 139 |
| — |
| (11 | )4 | ||||
Other income (expense) |
| 117 |
| 53 |
| 4 |
| 60 | 5 | ||||
|
|
|
|
|
|
|
|
|
| ||||
Consolidated profit before taxes |
| 1,381 |
| 1,158 |
| 223 |
| — |
| ||||
|
|
|
|
|
|
|
|
|
| ||||
Provision (benefit) for income taxes |
| 364 |
| 304 |
| 60 |
| — |
| ||||
Profit of consolidated companies |
| 1,017 |
| 854 |
| 163 |
| — |
| ||||
|
|
|
|
|
|
|
|
|
| ||||
Equity in profit (loss) of unconsolidated affiliated companies |
| 4 |
| 4 |
| — |
| — |
| ||||
Equity in profit of Financial Products’ subsidiaries |
| — |
| 161 |
| — |
| (161 | )6 | ||||
|
|
|
|
|
|
|
|
|
| ||||
Profit of consolidated and affiliated companies |
| 1,021 |
| 1,019 |
| 163 |
| (161 | ) | ||||
|
|
|
|
|
|
|
|
|
| ||||
Less: Profit (loss) attributable to noncontrolling interests |
| 4 |
| 2 |
| 2 |
| — |
| ||||
|
|
|
|
|
|
|
|
|
| ||||
Profit 7 |
| $ | 1,017 |
| $ | 1,017 |
| $ | 161 |
| $ | (161 | ) |
1 | Represents Caterpillar Inc. and its subsidiaries with Financial Products accounted for on the equity basis. |
2 | Elimination of Financial Products’ revenues earned from Machinery, Energy & Transportation. |
3 | Elimination of net expenses recorded by Machinery, Energy & Transportation paid to Financial Products. |
4 | Elimination of interest expense recorded between Financial Products and Machinery, Energy & Transportation. |
5 | Elimination of discount recorded by Machinery, Energy & Transportation on receivables sold to Financial Products and of interest earned between Machinery, Energy & Transportation and Financial Products. |
6 | Elimination of Financial Products’ profit due to equity method of accounting. |
7 | Profit attributable to common stockholders. |
Caterpillar Inc.
Supplemental Data for Results of Operations
For the Three Months Ended September 30, 2013
(Unaudited)
(Millions of dollars)
|
|
|
| Supplemental Consolidating Data |
| ||||||||
|
|
|
| Machinery, |
|
|
|
|
| ||||
|
| Consolidated |
| Energy & |
| Financial |
| Consolidating |
| ||||
Sales and revenues: |
|
|
|
|
|
|
|
|
| ||||
Sales of Machinery, Energy & Transportation |
| $ | 12,678 |
| $ | 12,678 |
| $ | — |
| $ | — |
|
Revenues of Financial Products |
| 745 |
| — |
| 825 |
| (80 | )2 | ||||
Total sales and revenues |
| 13,423 |
| 12,678 |
| 825 |
| (80 | ) | ||||
|
|
|
|
|
|
|
|
|
| ||||
Operating costs: |
|
|
|
|
|
|
|
|
| ||||
Cost of goods sold |
| 9,774 |
| 9,774 |
| — |
| — |
| ||||
Selling, general and administrative expenses |
| 1,319 |
| 1,168 |
| 156 |
| (5 | )3 | ||||
Research and development expenses |
| 469 |
| 469 |
| — |
| — |
| ||||
Interest expense of Financial Products |
| 178 |
| — |
| 179 |
| (1 | )4 | ||||
Other operating (income) expenses |
| 282 |
| 12 |
| 280 |
| (10 | )3 | ||||
Total operating costs |
| 12,022 |
| 11,423 |
| 615 |
| (16 | ) | ||||
|
|
|
|
|
|
|
|
|
| ||||
Operating profit |
| 1,401 |
| 1,255 |
| 210 |
| (64 | ) | ||||
|
|
|
|
|
|
|
|
|
| ||||
Interest expense excluding Financial Products |
| 116 |
| 127 |
| — |
| (11 | )4 | ||||
Other income (expense) |
| (24 | ) | (81 | ) | 4 |
| 53 | 5 | ||||
|
|
|
|
|
|
|
|
|
| ||||
Consolidated profit before taxes |
| 1,261 |
| 1,047 |
| 214 |
| — |
| ||||
|
|
|
|
|
|
|
|
|
| ||||
Provision (benefit) for income taxes |
| 310 |
| 248 |
| 62 |
| — |
| ||||
Profit of consolidated companies |
| 951 |
| 799 |
| 152 |
| — |
| ||||
|
|
|
|
|
|
|
|
|
| ||||
Equity in profit (loss) of unconsolidated affiliated companies |
| (1 | ) | (1 | ) | — |
| — |
| ||||
Equity in profit of Financial Products’ subsidiaries |
| — |
| 149 |
| — |
| (149 | )6 | ||||
|
|
|
|
|
|
|
|
|
| ||||
Profit of consolidated and affiliated companies |
| 950 |
| 947 |
| 152 |
| (149 | ) | ||||
|
|
|
|
|
|
|
|
|
| ||||
Less: Profit (loss) attributable to noncontrolling interests |
| 4 |
| 1 |
| 3 |
| — |
| ||||
|
|
|
|
|
|
|
|
|
| ||||
Profit 7 |
| $ | 946 |
| $ | 946 |
| $ | 149 |
| $ | (149 | ) |
1 | Represents Caterpillar Inc. and its subsidiaries with Financial Products accounted for on the equity basis. |
2 | Elimination of Financial Products’ revenues earned from Machinery, Energy & Transportation. |
3 | Elimination of net expenses recorded by Machinery, Energy & Transportation paid to Financial Products. |
4 | Elimination of interest expense recorded between Financial Products and Machinery, Energy & Transportation. |
5 | Elimination of discount recorded by Machinery, Energy & Transportation on receivables sold to Financial Products and of interest earned between Machinery, Energy & Transportation and Financial Products. |
6 | Elimination of Financial Products’ profit due to equity method of accounting. |
7 | Profit attributable to common stockholders. |
Caterpillar Inc.
Supplemental Data for Results of Operations
For the Nine Months Ended September 30, 2014
(Unaudited)
(Millions of dollars)
|
|
|
| Supplemental Consolidating Data |
| ||||||||
|
|
|
| Machinery, |
|
|
|
|
| ||||
|
| Consolidated |
| Energy & |
| Financial |
| Consolidating |
| ||||
Sales and revenues: |
|
|
|
|
|
|
|
|
| ||||
Sales of Machinery, Energy & Transportation |
| $ | 38,642 |
| $ | 38,642 |
| $ | — |
| $ | — |
|
Revenues of Financial Products |
| 2,298 |
| — |
| 2,557 |
| (259 | )2 | ||||
Total sales and revenues |
| 40,940 |
| 38,642 |
| 2,557 |
| (259 | ) | ||||
|
|
|
|
|
|
|
|
|
| ||||
Operating costs: |
|
|
|
|
|
|
|
|
| ||||
Cost of goods sold |
| 29,268 |
| 29,268 |
| — |
| — |
| ||||
Selling, general and administrative expenses |
| 4,175 |
| 3,717 |
| 477 |
| (19 | )3 | ||||
Research and development expenses |
| 1,557 |
| 1,557 |
| — |
| — |
| ||||
Interest expense of Financial Products |
| 470 |
| — |
| 475 |
| (5 | )4 | ||||
Other operating (income) expenses |
| 1,205 |
| 300 |
| 929 |
| (24 | )3 | ||||
Total operating costs |
| 36,675 |
| 34,842 |
| 1,881 |
| (48 | ) | ||||
|
|
|
|
|
|
|
|
|
| ||||
Operating profit |
| 4,265 |
| 3,800 |
| 676 |
| (211 | ) | ||||
|
|
|
|
|
|
|
|
|
| ||||
Interest expense excluding Financial Products |
| 358 |
| 390 |
| — |
| (32 | )4 | ||||
Other income (expense) |
| 236 |
| 30 |
| 27 |
| 179 | 5 | ||||
|
|
|
|
|
|
|
|
|
| ||||
Consolidated profit before taxes |
| 4,143 |
| 3,440 |
| 703 |
| — |
| ||||
|
|
|
|
|
|
|
|
|
| ||||
Provision (benefit) for income taxes |
| 1,201 |
| 1,003 |
| 198 |
| — |
| ||||
Profit of consolidated companies |
| 2,942 |
| 2,437 |
| 505 |
| — |
| ||||
|
|
|
|
|
|
|
|
|
| ||||
Equity in profit (loss) of unconsolidated affiliated companies |
| 6 |
| 6 |
| — |
| — |
| ||||
Equity in profit of Financial Products’ subsidiaries |
| — |
| 498 |
| — |
| (498 | )6 | ||||
|
|
|
|
|
|
|
|
|
| ||||
Profit of consolidated and affiliated companies |
| 2,948 |
| 2,941 |
| 505 |
| (498 | ) | ||||
|
|
|
|
|
|
|
|
|
| ||||
Less: Profit (loss) attributable to noncontrolling interests |
| 10 |
| 3 |
| 7 |
| — |
| ||||
|
|
|
|
|
|
|
|
|
| ||||
Profit 7 |
| $ | 2,938 |
| $ | 2,938 |
| $ | 498 |
| $ | (498 | ) |
1 | Represents Caterpillar Inc. and its subsidiaries with Financial Products accounted for on the equity basis. |
2 | Elimination of Financial Products’ revenues earned from Machinery, Energy & Transportation. |
3 | Elimination of net expenses recorded by Machinery, Energy & Transportation paid to Financial Products. |
4 | Elimination of interest expense recorded between Financial Products and Machinery, Energy & Transportation. |
5 | Elimination of discount recorded by Machinery, Energy & Transportation on receivables sold to Financial Products and of interest earned between Machinery, Energy & Transportation and Financial Products. |
6 | Elimination of Financial Products’ profit due to equity method of accounting. |
7 | Profit attributable to common stockholders. |
Caterpillar Inc.
Supplemental Data for Results of Operations
For the Nine Months Ended September 30, 2013
(Unaudited)
(Millions of dollars)
|
|
|
| Supplemental Consolidating Data |
| ||||||||
|
|
|
| Machinery, |
|
|
|
|
| ||||
|
| Consolidated |
| Energy & |
| Financial |
| Consolidating |
| ||||
Sales and revenues: |
|
|
|
|
|
|
|
|
| ||||
Sales of Machinery, Energy & Transportation |
| $ | 39,048 |
| $ | 39,048 |
| $ | — |
| $ | — |
|
Revenues of Financial Products |
| 2,206 |
| — |
| 2,462 |
| (256 | )2 | ||||
Total sales and revenues |
| 41,254 |
| 39,048 |
| 2,462 |
| (256 | ) | ||||
|
|
|
|
|
|
|
|
|
| ||||
Operating costs: |
|
|
|
|
|
|
|
|
| ||||
Cost of goods sold |
| 30,186 |
| 30,186 |
| — |
| — |
| ||||
Selling, general and administrative expenses |
| 4,130 |
| 3,721 |
| 435 |
| (26 | )3 | ||||
Research and development expenses |
| 1,579 |
| 1,579 |
| — |
| — |
| ||||
Interest expense of Financial Products |
| 552 |
| — |
| 557 |
| (5 | )4 | ||||
Other operating (income) expenses |
| 631 |
| (83 | ) | 737 |
| (23 | )3 | ||||
Total operating costs |
| 37,078 |
| 35,403 |
| 1,729 |
| (54 | ) | ||||
|
|
|
|
|
|
|
|
|
| ||||
Operating profit |
| 4,176 |
| 3,645 |
| 733 |
| (202 | ) | ||||
|
|
|
|
|
|
|
|
|
| ||||
Interest expense excluding Financial Products |
| 356 |
| 388 |
| — |
| (32 | )4 | ||||
Other income (expense) |
| (79 | ) | (250 | ) | 1 |
| 170 | 5 | ||||
|
|
|
|
|
|
|
|
|
| ||||
Consolidated profit before taxes |
| 3,741 |
| 3,007 |
| 734 |
| — |
| ||||
|
|
|
|
|
|
|
|
|
| ||||
Provision (benefit) for income taxes |
| 943 |
| 733 |
| 210 |
| — |
| ||||
Profit of consolidated companies |
| 2,798 |
| 2,274 |
| 524 |
| — |
| ||||
|
|
|
|
|
|
|
|
|
| ||||
Equity in profit (loss) of unconsolidated affiliated companies |
| (1 | ) | (1 | ) | — |
| — |
| ||||
Equity in profit of Financial Products’ subsidiaries |
| — |
| 515 |
| — |
| (515 | )6 | ||||
|
|
|
|
|
|
|
|
|
| ||||
Profit of consolidated and affiliated companies |
| 2,797 |
| 2,788 |
| 524 |
| (515 | ) | ||||
|
|
|
|
|
|
|
|
|
| ||||
Less: Profit (loss) attributable to noncontrolling interests |
| 11 |
| 2 |
| 9 |
| — |
| ||||
|
|
|
|
|
|
|
|
|
| ||||
Profit 7 |
| $ | 2,786 |
| $ | 2,786 |
| $ | 515 |
| $ | (515 | ) |
1 | Represents Caterpillar Inc. and its subsidiaries with Financial Products accounted for on the equity basis. |
2 | Elimination of Financial Products’ revenues earned from Machinery, Energy & Transportation. |
3 | Elimination of net expenses recorded by Machinery, Energy & Transportation paid to Financial Products. |
4 | Elimination of interest expense recorded between Financial Products and Machinery, Energy & Transportation. |
5 | Elimination of discount recorded by Machinery, Energy & Transportation on receivables sold to Financial Products and of interest earned between Machinery, Energy & Transportation and Financial Products. |
6 | Elimination of Financial Products’ profit due to equity method of accounting. |
7 | Profit attributable to common stockholders. |
Caterpillar Inc.
Supplemental Data for Cash Flow
For the Nine Months Ended September 30, 2014
(Unaudited)
(Millions of dollars)
|
|
|
| Supplemental Consolidating Data |
| ||||||||
|
|
|
| Machinery, |
|
|
|
|
| ||||
|
| Consolidated |
| Energy & |
| Financial |
| Consolidating |
| ||||
Cash flow from operating activities: |
|
|
|
|
|
|
|
|
| ||||
Profit of consolidated and affiliated companies |
| $ | 2,948 |
| $ | 2,941 |
| $ | 505 |
| $ | (498 | )2 |
Adjustments for non-cash items: |
|
|
|
|
|
|
|
|
| ||||
Depreciation and amortization |
| 2,368 |
| 1,685 |
| 683 |
| — |
| ||||
Undistributed profit of Financial Products |
| — |
| (233 | ) | — |
| 233 | 3 | ||||
Other |
| 327 |
| 240 |
| (94 | ) | 181 | 4 | ||||
Changes in assets and liabilities, net of acquisitions and divestitures: |
|
|
|
|
|
|
|
|
| ||||
Receivables - trade and other |
| 244 |
| 523 |
| 27 |
| (306 | )4,5 | ||||
Inventories |
| (859 | ) | (849 | ) | — |
| (10 | )4 | ||||
Accounts payable |
| 667 |
| 657 |
| (51 | ) | 61 | 4 | ||||
Accrued expenses |
| (44 | ) | 18 |
| (62 | ) | — |
| ||||
Accrued wages, salaries and employee benefits |
| 648 |
| 646 |
| 2 |
| — |
| ||||
Customer advances |
| (132 | ) | (132 | ) | — |
| — |
| ||||
Other assets - net |
| (104 | ) | (94 | ) | (21 | ) | 11 | 4 | ||||
Other liabilities - net |
| 123 |
| (18 | ) | 152 |
| (11 | )4 | ||||
Net cash provided by (used for) operating activities |
| 6,186 |
| 5,384 |
| 1,141 |
| (339 | ) | ||||
Cash flow from investing activities: |
|
|
|
|
|
|
|
|
| ||||
Capital expenditures - excluding equipment leased to others |
| (1,072 | ) | (1,063 | ) | (9 | ) | — |
| ||||
Expenditures for equipment leased to others |
| (1,310 | ) | (70 | ) | (1,286 | ) | 46 | 4 | ||||
Proceeds from disposals of leased assets and property, plant and equipment |
| 681 |
| 61 |
| 626 |
| (6 | )4 | ||||
Additions to finance receivables |
| (8,464 | ) | — |
| (10,777 | ) | 2,313 | 5,8 | ||||
Collections of finance receivables |
| 7,264 |
| — |
| 9,280 |
| (2,016 | )5 | ||||
Net intercompany purchased receivables |
| — |
| — |
| 246 |
| (246 | )5 | ||||
Proceeds from sale of finance receivables |
| 154 |
| — |
| 157 |
| (3 | )5 | ||||
Net intercompany borrowings |
| — |
| — |
| 1 |
| (1 | )6 | ||||
Investments and acquisitions (net of cash acquired) |
| (18 | ) | (18 | ) | — |
| — |
| ||||
Proceeds from sale of businesses and investments (net of cash sold) |
| 196 |
| 210 |
| — |
| (14 | )8 | ||||
Proceeds from sale of securities |
| 347 |
| 21 |
| 326 |
| — |
| ||||
Investments in securities |
| (769 | ) | (418 | ) | (351 | ) | — |
| ||||
Other - net |
| (12 | ) | 8 |
| (20 | ) | — |
| ||||
Net cash provided by (used for) investing activities |
| (3,003 | ) | (1,269 | ) | (1,807 | ) | 73 |
| ||||
Cash flow from financing activities: |
|
|
|
|
|
|
|
|
| ||||
Dividends paid |
| (1,197 | ) | (1,197 | ) | (265 | ) | 265 | 7 | ||||
Distribution to noncontrolling interests |
| (7 | ) | (7 | ) | — |
| — |
| ||||
Contribution from noncontrolling interests |
| 2 |
| 2 |
| — |
| — |
| ||||
Common stock issued, including treasury shares reissued |
| 218 |
| 218 |
| — |
| — |
| ||||
Treasury shares purchased |
| (4,238 | ) | (4,238 | ) | — |
| — |
| ||||
Excess tax benefit from stock-based compensation |
| 162 |
| 162 |
| — |
| — |
| ||||
Net intercompany borrowings |
| — |
| (1 | ) | — |
| 1 | 6 | ||||
Proceeds from debt issued (original maturities greater than three months) |
| 9,103 |
| 1,991 |
| 7,112 |
| — |
| ||||
Payments on debt (original maturities greater than three months) |
| (7,893 | ) | (779 | ) | (7,114 | ) | — |
| ||||
Short-term borrowings - net (original maturities three months or less) |
| 791 |
| — |
| 791 |
| — |
| ||||
Net cash provided by (used for) financing activities |
| (3,059 | ) | (3,849 | ) | 524 |
| 266 |
| ||||
Effect of exchange rate changes on cash |
| (123 | ) | (58 | ) | (65 | ) | — |
| ||||
Increase (decrease) in cash and short-term investments |
| 1 |
| 208 |
| (207 | ) | — |
| ||||
Cash and short-term investments at beginning of period |
| 6,081 |
| 4,597 |
| 1,484 |
| — |
| ||||
Cash and short-term investments at end of period |
| $ | 6,082 |
| $ | 4,805 |
| $ | 1,277 |
| $ | — |
|
1 | Represents Caterpillar Inc. and its subsidiaries with Financial Products accounted for on the equity basis. |
2 | Elimination of Financial Products’ profit after tax due to equity method of accounting. |
3 | Elimination of non-cash adjustment for the undistributed earnings from Financial Products. |
4 | Elimination of non-cash adjustments and changes in assets and liabilities related to consolidated reporting. |
5 | Reclassification of Financial Products’ cash flow activity from investing to operating for receivables that arose from the sale of inventory. |
6 | Elimination of net proceeds and payments to/from Machinery, Energy & Transportation and Financial Products. |
7 | Elimination of dividend from Financial Products to Machinery, Energy & Transportation. |
8 | Elimination of proceeds received from Financial Products related to Machinery, Energy & Transportation’s sale of portions of the Bucyrus distribution business to Cat dealers. |
Caterpillar Inc.
Supplemental Data for Cash Flow
For The Nine Months Ended September 30, 2013
(Unaudited)
(Millions of dollars)
|
|
|
| Supplemental Consolidating Data |
| ||||||||
|
|
|
| Machinery, |
|
|
|
|
| ||||
|
| Consolidated |
| Energy & |
| Financial |
| Consolidating |
| ||||
Cash flow from operating activities: |
|
|
|
|
|
|
|
|
| ||||
Profit of consolidated and affiliated companies |
| $ | 2,797 |
| $ | 2,788 |
| $ | 524 |
| $ | (515 | )2 |
Adjustments for non-cash items: |
|
|
|
|
|
|
|
|
|
|
|
|
|
Depreciation and amortization |
| 2,263 |
| 1,674 |
| 589 |
| — |
| ||||
Undistributed profit of Financial Products |
| — |
| (365 | ) | — |
| 365 | 3 | ||||
Other |
| 377 |
| 247 |
| (33 | ) | 163 | 4 | ||||
Changes in assets and liabilities, net of acquisitions and divestitures: |
|
|
|
|
|
|
|
|
| ||||
Receivables - trade and other |
| 992 |
| 585 |
| 40 |
| 367 | 4,5 | ||||
Inventories |
| 1,911 |
| 1,916 |
| — |
| (5 | )4 | ||||
Accounts payable |
| 157 |
| 169 |
| (82 | ) | 70 | 4 | ||||
Accrued expenses |
| (227 | ) | (101 | ) | (126 | ) | — |
| ||||
Accrued wages, salaries and employee benefits |
| (500 | ) | (494 | ) | (6 | ) | — |
| ||||
Customer advances |
| (230 | ) | (230 | ) | — |
| — |
| ||||
Other assets - net |
| (74 | ) | (51 | ) | 3 |
| (26 | )4 | ||||
Other liabilities - net |
| 145 |
| 109 |
| 10 |
| 26 | 4 | ||||
Net cash provided by (used for) operating activities |
| 7,611 |
| 6,247 |
| 919 |
| 445 |
| ||||
Cash flow from investing activities: |
|
|
|
|
|
|
|
|
| ||||
Capital expenditures - excluding equipment leased to others |
| (1,862 | ) | (1,851 | ) | (11 | ) | — |
| ||||
Expenditures for equipment leased to others |
| (1,301 | ) | (52 | ) | (1,299 | ) | 50 | 4 | ||||
Proceeds from disposals of leased assets and property, plant and equipment |
| 593 |
| 72 |
| 535 |
| (14 | )4 | ||||
Additions to finance receivables |
| (8,339 | ) | — |
| (10,400 | ) | 2,061 | 5,8 | ||||
Collections of finance receivables |
| 6,790 |
| — |
| 8,803 |
| (2,013 | )5 | ||||
Net intercompany purchased receivables |
| — |
| — |
| 600 |
| (600 | )5 | ||||
Proceeds from sale of finance receivables |
| 110 |
| — |
| 111 |
| (1 | )5 | ||||
Net intercompany borrowings |
| — |
| — |
| 35 |
| (35 | ) 6 | ||||
Investments and acquisitions (net of cash acquired) |
| (193 | ) | (193 | ) | — |
| — |
| ||||
Proceeds from sale of businesses and investments (net of cash sold) |
| 168 |
| 246 |
| — |
| (78 | )8 | ||||
Proceeds from sale of securities |
| 297 |
| 19 |
| 278 |
| — |
| ||||
Investments in securities |
| (312 | ) | (15 | ) | (297 | ) | — |
| ||||
Other - net |
| (29 | ) | (32 | ) | 3 |
| — |
| ||||
Net cash provided by (used for) investing activities |
| (4,078 | ) | (1,806 | ) | (1,642 | ) | (630 | ) | ||||
Cash flow from financing activities: |
|
|
|
|
|
|
|
|
| ||||
Dividends paid |
| (730 | ) | (730 | ) | (150 | ) | 150 | 7 | ||||
Distribution to noncontrolling interests |
| (10 | ) | (10 | ) | — |
| — |
| ||||
Common stock issued, including treasury shares reissued |
| 77 |
| 77 |
| — |
| — |
| ||||
Treasury shares purchased |
| (2,000 | ) | (2,000 | ) | — |
| — |
| ||||
Excess tax benefit from stock-based compensation |
| 70 |
| 70 |
| — |
| — |
| ||||
Net intercompany borrowings |
| — |
| (35 | ) | — |
| 35 | 6 | ||||
Proceeds from debt issued (original maturities greater than three months) |
| 6,999 |
| 145 |
| 6,854 |
| — |
| ||||
Payments on debt (original maturities greater than three months) |
| (8,770 | ) | (1,134 | ) | (7,636 | ) | — |
| ||||
Short-term borrowings - net (original maturities three months or less) |
| 1,736 |
| 1 |
| 1,735 |
| — |
| ||||
Net cash provided by (used for) financing activities |
| (2,628 | ) | (3,616 | ) | 803 |
| 185 |
| ||||
Effect of exchange rate changes on cash |
| (38 | ) | (23 | ) | (15 | ) | — |
| ||||
Increase (decrease) in cash and short-term investments |
| 867 |
| 802 |
| 65 |
| — |
| ||||
Cash and short-term investments at beginning of period |
| 5,490 |
| 3,306 |
| 2,184 |
| — |
| ||||
Cash and short-term investments at end of period |
| $ | 6,357 |
| $ | 4,108 |
| $ | 2,249 |
| $ | — |
|
1 | Represents Caterpillar Inc. and its subsidiaries with Financial Products accounted for on the equity basis. |
2 | Elimination of Financial Products’ profit after tax due to equity method of accounting. |
3 | Elimination of non-cash adjustment for the undistributed earnings from Financial Products. |
4 | Elimination of non-cash adjustments and changes in assets and liabilities related to consolidated reporting. |
5 | Reclassification of Financial Products’ cash flow activity from investing to operating for receivables that arose from the sale of inventory. |
6 | Elimination of net proceeds and payments to/from Machinery, Energy & Transportation and Financial Products. |
7 | Elimination of dividend from Financial Products to Machinery, Energy & Transportation. |
8 | Elimination of proceeds received from Financial Products related to Machinery, Energy & Transportation’s sale of portions of the Bucyrus distribution business to Cat dealers. |
#