UNITED STATES
SECURITIES AND EXCHANGE COMMISSION
Washington, D.C. 20549
FORM N-CSR
CERTIFIED SHAREHOLDER REPORT OF REGISTERED
MANAGEMENT INVESTMENT COMPANIES
Investment Company Act file number 811-23613
Pioneer Core Trust I
(Exact name of registrant as specified in charter)
60 State Street, Boston, MA 02109
(Address of principal executive offices) (ZIP code)
Christopher J. Kelley, Amundi Asset Management, Inc.,
60 State Street, Boston, MA 02109
(Name and address of agent for service)
Registrant’s telephone number, including area code: (617) 742-7825
Date of fiscal year end: August 31, 2023
Date of reporting period: September 1, 2022 through February 28, 2023
Form N-CSR is to be used by management investment companies to file reports with the Commission not later than 10 days after the transmission to stockholders of any report that is required to be transmitted to stockholders under Rule 30e-1 under the Investment Company Act of 1940 (17 CFR 270.30e-1). The Commission may use the information provided on Form N-CSR in its regulatory, disclosure review, inspection, and policymaking roles.
A registrant is required to disclose the information specified by Form N-CSR, and the Commission will make this information public. A registrant is not required to respond to the collection of information contained in Form N-CSR unless the Form displays a currently valid Office of Management and Budget (“OMB”) control number. Please direct comments concerning the accuracy of the information collection burden estimate and any suggestions for reducing the burden to Secretary, Securities and Exchange Commission, 450 Fifth Street, NW, Washington, DC 20549-0609. The OMB has reviewed this collection of information under the clearance requirements of 44 U.S.C. ss. 3507.
ITEM 1. REPORTS TO STOCKHOLDERS.


Head of the Americas, President and CEO of US
Amundi Asset Management US, Inc.
April 2023
| Q | How did the Portfolio perform during the six-month period ended February 28, 2023? |
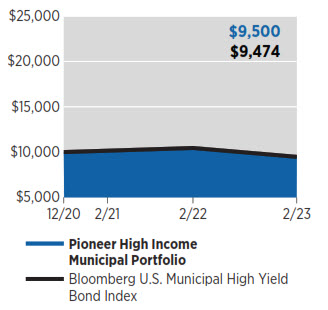
| A | Pioneer High Income Municipal Portfolio returned -1.35% during the six-month period ended February 28, 2023, while the Portfolio’s benchmark, the Bloomberg US Municipal High Yield Bond Index (the Bloomberg Index), returned -1.77%. During the same period, the average return of the 195 mutual funds in Morningstar’s High-Yield Municipal Funds category was -1.66%. |
| Q | How would you describe the investment environment for municipal bonds during the six-month period ended February 28, 2023? |
| A | Municipal bonds posted negative returns for the six-month period, with the adverse effect of falling prices offsetting the contribution to performance from income generation. During the period, the municipal market experienced its weakest performance in September and October of 2022, when the combination of robust economic growth data and rising inflation fueled expectations that the US Federal Reserve (Fed) would need to continue raising interest rates aggressively in an attempt to curb the high inflation readouts. The Fed indeed raised the target range for the federal funds rate by three-quarters of a percentage point at its meetings in both late-September and early November, bringing the federal funds target to a range of 3.75% ‒ 4.00%. In comparison, the target range for the federal funds rate was pegged at a range of 0.00% ‒ 0.25% at the beginning of 2022. |
| The tax-exempt market rallied off its October lows over the following three months, as inflation began to decline from its peak of mid-2022. Investors started to look ahead to the point at which the Fed could pause its rate-hiking cycle, a hope that was supported by the US central bank’s decision to raise interest |
| rates by only a quarter-point at its February 2, 2023 meeting. Municipal bonds, at their peak in early February, had recaptured nearly all of the price decline they had experienced in the first two months of the six-month period. However, the market declined as the month progressed, amid concerns that solid economic growth and persistently high inflation would prompt the Fed to keep rates “higher for longer.” | |
| High-yield municipals underperformed the investment-grade tax-exempt market for the six-month period. The investment-grade municipal market, as measured by the Bloomberg Municipal Bond Index, managed to generate a gain 0.66% for the period, while the high-yield municipal market, as measured by the Portfolio’s benchmark, returned -1.77%. The difference in returns largely reflected investors’ depressed appetite for riskier assets in an uncertain environment. In addition, high-yield municipal funds continued to experience outflows over the six-month period. Despite those headwinds, the fundamentals within the municipal market remained firm, driven by the continued post-COVID reopening of the economy, steady tax receipts, and the ongoing benefits of the substantial federal aid provided during the pandemic in 2020-2021. The default rate in the municipal market has remained very low, illustrating, in our view, the gap between the price performance of municipal bonds and the underlying health of municipal issuers. Notably, some previously underperforming municipal issuers received further upgrades to their credit ratings from the major agencies during the six-month period. | |
| Q | What factors affected the Portfolio’s performance relative to the benchmark Bloomberg Index during the six-month period ended February 28, 2023? |
| A | Sector allocation results and individual security selection results both aided the Portfolio’s benchmark-relative performance for the six-month period. In particular, the Portfolio’s relative returns benefited from our decision to mostly avoid investments in the traditional senior living sector (continuing care retirement communities), which underperformed. On the other hand, an underweight to Puerto Rico issues detracted from the Portfolio’s relative results. |
| At the individual security level, portfolio holdings of Phoenix (Arizona) Industrial Development Authority multifamily housing revenue bonds and Chicago (Illinois) general obligation debt contributed positively to the Portfolio’s relative performance. Conversely, exposure to bonds issued by the Massachusetts State Development Finance Agency (heath care revenue bonds), and Capital Trust Agency (Florida senior living revenue bonds), detracted from the Portfolio’s relative returns for the six-month period. | |
| Q | Did the Portfolio have any exposure to derivative securities during the six-month period ended February 28, 2023? |
| A | No, the Portfolio had no exposure to derivatives during the six-month period. |
| Q | What were some notable aspects of the Portfolio’s positioning as of February 28, 2023? |
| A | At the end of the period, the Portfolio was overweight versus the Bloomberg Index to charter schools, a sector where we saw both above-average yields as well as an opportunity for quality individual security selection. The Portfolio was also overweight to the tobacco sector, due to the higher liquidity and attractive yields of tobacco (Master Settlement Agreement) bonds. Tobacco bonds are revenue bonds sold by certain states, backed by annual payments to the government entities by tobacco companies in connection with the settlement of litigation claims. We have found tobacco bonds to be attractive investments, not only for their potential to enhance performance, but also for the benefits received by the settling states that issue tobacco bonds since the establishment of the Master Settlement Agreement between the settling states and the tobacco-related companies several years ago. Those benefits have included: substantial funding for the advancement of public health; the implementation of important tobacco-related public health measures; and funding towards establishment of a national foundation dedicated to significantly reducing the use of tobacco products among youths. |
| Meanwhile, the Portfolio was underweight to Puerto Rico bonds, due to our concerns regarding the Commonwealth’s sensitivity to economic cycles, the ebbs and flows of the tourism industry, and hurricanes. As mentioned earlier, we have also maintained low |
| portfolio exposure to continuing care retirement communities (CCRCs), given those issuers’ need to maintain high occupancy in order to generate revenues. Since the ongoing occupancy rates of CCRCs have often been tied to the performance of the overall housing market, the sector, historically, has been vulnerable to potential weakness in the residential real estate market. | |
| In terms of changes made during the six-month period, the most notable positioning shift was our decision to increase the Portfolio’s weighting in the hospital sector, as we were able to identify some valuation opportunities in some issuers within the sector that we had been watching for a while. | |
| Q | What is your investment outlook? |
| A | Although we think continued uncertainty in the macroeconomic picture could lead to further volatility in the high-yield municipal market, we would view such an outcome as a chance to capture opportunities in select municipal securities. On the positive side, current expectations are for supply in the municipal space to remain shallow to moderate. Coupled with heightened demand for tax-efficient investments, we believe lower supply and higher yields could translate to attractive valuations within high-yield municipals. Potential risk factors to this outlook, in our view, include continued interest-rate increases by the Fed, rising unemployment (or underemployment), and the possibility that inflation could remain elevated for longer than expected. |
| As is always the case, headline news events have had a minimal effect on our day-to-day approach to managing the Portfolio. Our goal is to invest the Portfolio in what we believe are fundamentally sound credits with attractive yields, while maintaining an appropriate level of portfolio diversification*. We also seek to avoid experiencing defaults in the Portfolio through our emphasis on fundamental research. We believe this steady, long-term approach remains the most effective way to identify opportunities and to help minimize the risk associated with investing in the high-yield municipal market. |
| * | Diversification does not assure a profit nor protect against loss. |
| (As a percentage of total investments)* | ||
| 1. | Buckeye Tobacco Settlement Financing Authority, Senior Class 2, Series B2, 5.00%, 6/1/55 | 4.45% |
| 2. | Golden State Tobacco Securitization Corp., Series A1, 4.214%, 6/1/50 | 3.70 |
| 3. | Tobacco Settlement Financing Corp., Series B1, 5.00%, 6/1/47 | 2.77 |
| 4. | City of Oroville, Oroville Hospital, 5.25%, 4/1/49 | 2.39 |
| 5. | Arkansas Development Finance Authority, Big River Steel Project, 4.50%, 9/1/49 (144A) | 2.22 |
| 6. | City of Oroville, Oroville Hospital, 5.25%, 4/1/54 | 2.15 |
| 7. | New York Counties Tobacco Trust IV, Settlement pass through, Series A, 5.00%, 6/1/45 | 2.11 |
| 8. | California Statewide Communities Development Authority, Loma Linda University Medical Center, Series A, 5.25%, 12/1/56 (144A) | 2.10 |
| 9. | TSASC, Inc., Series B, 5.00%, 6/1/48 | 1.87 |
| 10. | Dominion Water & Sanitation District, 5.875%, 12/1/52 | 1.82 |
| * | Excludes short-term investments and all derivative contracts except for options purchased. The Portfolio is actively managed, and current holdings may be different. The holdings listed should not be considered recommendations to buy or sell any securities. |
| Average Annual Total Return (As of February 28, 2023) | ||
| Period | Fund | Bloomberg U.S. Municipal High Yield Bond Index |
| Life-of-Fund (12/21/20) | 0.00% | -2.33% |
| 1 Year | -8.69 | -9.35 |
| (1) | ongoing costs, including management fees and other Portfolio expenses; and |
| (2) | transaction costs. |
| (1) | Divide your account value by $1,000 Example: an $8,600 account value ÷ $1,000 = 8.6 |
| (2) | Multiply the result in (1) above by the corresponding share class’s number in the third row under the heading entitled “Expenses Paid During Period” to estimate the expenses you paid on your account during this period. |
| Beginning Account Value on 9/1/22 | $1,000.00 |
| Ending Account Value (after expenses) on 2/28/23 | $986.50 |
| Expenses Paid During Period* | $0.10 |
| * | Expenses are equal to the Portfolio’s annualized net expense ratio of 0.02% multiplied by the average account value over the period, multiplied by 181/365 (to reflect the partial year period). |
| Beginning Account Value on 9/1/22 | $1,000.00 |
| Ending Account Value (after expenses) on 2/28/23 | $1,024.70 |
| Expenses Paid During Period* | $0.10 |
| * | Expenses are equal to the Portfolio’s annualized net expense ratio of 0.02% multiplied by the average account value over the period, multiplied by 181/365 (to reflect the partial year period). |
| Principal Amount USD ($) | Value | |||||
| UNAFFILIATED ISSUERS — 97.4% | ||||||
| Municipal Bonds — 96.8% of Net Assets(a) | ||||||
| Alabama — 0.9% | ||||||
| 4,525,000 | Hoover Industrial Development Board, 5.75%, 10/1/49 | $ 4,649,302 | ||||
| 10,000,000 | Tuscaloosa County Industrial Development Authority, Hunt Refining Project, Series A, 5.25%, 5/1/44 (144A) | 8,667,700 | ||||
| Total Alabama | $ 13,317,002 | |||||
| Arizona — 1.9% | ||||||
| 1,675,000 | Arizona Industrial Development Authority, Doral Academy Nevada Fire Mesa, Series A, 5.00%, 7/15/49 (144A) | $ 1,497,634 | ||||
| 265,000 | Arizona Industrial Development Authority, Doral Academy Of Northern Nevada Project, Series A, 4.00%, 7/15/41 (144A) | 216,921 | ||||
| 500,000 | Arizona Industrial Development Authority, Doral Academy Of Northern Nevada Project, Series A, 4.00%, 7/15/51 (144A) | 371,180 | ||||
| 475,000 | Arizona Industrial Development Authority, Doral Academy Of Northern Nevada Project, Series A, 4.00%, 7/15/56 (144A) | 342,561 | ||||
| 12,595,000 | Industrial Development Authority of the City of Phoenix, 3rd & Indian School Assisted Living Project, 5.40%, 10/1/36 | 11,095,439 | ||||
| 1,000,000 | Industrial Development Authority of the County of Pima, Facility Desert Heights Charter, 7.00%, 5/1/34 | 1,035,310 | ||||
| 3,000,000 | Industrial Development Authority of the County of Pima, Facility Desert Heights Charter, 7.25%, 5/1/44 | 3,096,300 | ||||
| 7,320,000 | Maricopa County Industrial Development Authority, Commercial Metals Company, 4.00%, 10/15/47 (144A) | 6,073,038 | ||||
| 1,810,000 | Tempe Industrial Development Authority, Series A, 6.125%, 10/1/47 (144A) | 1,383,890 | ||||
| 2,400,000 | Tempe Industrial Development Authority, Series A, 6.125%, 10/1/52 (144A) | 1,765,968 | ||||
| Total Arizona | $ 26,878,241 | |||||
| Principal Amount USD ($) | Value | |||||
| Arkansas — 2.8% | ||||||
| 35,000,000 | Arkansas Development Finance Authority, Big River Steel Project, 4.50%, 9/1/49 (144A) | $ 31,073,000 | ||||
| 9,500,000 | Arkansas Development Finance Authority, Green Bond, 5.45%, 9/1/52 (144A) | 9,349,330 | ||||
| Total Arkansas | $ 40,422,330 | |||||
| California — 16.7% | ||||||
| 2,000,000 | California County Tobacco Securitization Agency, 5.00%, 6/1/50 | $ 1,997,960 | ||||
| 80,000 | California County Tobacco Securitization Agency, Asset-Backed, Series A, 5.875%, 6/1/43 | 80,270 | ||||
| 1,370,000 | California County Tobacco Securitization Agency, Golden Gate Tobacco Settlement, Series A, 5.00%, 6/1/47 | 1,256,852 | ||||
| 185,000 | California Municipal Finance Authority, Series A, 5.00%, 12/1/36 (144A) | 187,847 | ||||
| 2,000,000 | California Municipal Finance Authority, Series A, 5.00%, 12/1/46 (144A) | 1,915,740 | ||||
| 2,000,000 | California Municipal Finance Authority, Series A, 5.00%, 11/1/49 (144A) | 1,892,060 | ||||
| 2,000,000 | California Municipal Finance Authority, Series A, 5.00%, 12/1/54 (144A) | 1,889,780 | ||||
| 2,910,000 | California Municipal Finance Authority, Series B, 4.75%, 12/1/31 (144A) | 2,637,333 | ||||
| 6,115,000 | California Municipal Finance Authority, Series B, 5.25%, 12/1/36 (144A) | 5,505,579 | ||||
| 4,530,000 | California Municipal Finance Authority, Series B, 5.50%, 12/1/39 (144A) | 4,079,944 | ||||
| 2,000,000 | California Municipal Finance Authority, Baptist University, Series A, 5.00%, 11/1/46 (144A) | 1,922,160 | ||||
| 8,350,000 | California Municipal Finance Authority, Baptist University, Series A, 5.50%, 11/1/45 (144A) | 8,424,231 | ||||
| 250,000 | California Municipal Finance Authority, John Adams Academics Project, Series A, 5.00%, 10/1/35 | 255,260 | ||||
| 1,550,000 | California Municipal Finance Authority, John Adams Academics Project, Series A, 5.25%, 10/1/45 | 1,580,861 | ||||
| 500,000 | California Municipal Finance Authority, Santa Rosa Academy Project, 5.125%, 7/1/35 (144A) | 504,415 | ||||
| 1,575,000 | California Municipal Finance Authority, Santa Rosa Academy Project, 5.375%, 7/1/45 (144A) | 1,631,070 | ||||
| 100,000 | California School Finance Authority, View Park Elementary & Middle School, Series A, 4.75%, 10/1/24 | 101,033 | ||||
| Principal Amount USD ($) | Value | |||||
| California — (continued) | ||||||
| 830,000 | California School Finance Authority, View Park Elementary & Middle School, Series A, 5.625%, 10/1/34 | $ 859,191 | ||||
| 2,175,000 | California School Finance Authority, View Park Elementary & Middle School, Series A, 5.875%, 10/1/44 | 2,234,312 | ||||
| 1,000,000 | California School Finance Authority, View Park Elementary & Middle School, Series A, 6.00%, 10/1/49 | 1,025,800 | ||||
| 3,230,000 | California School Finance Authority, View Park High School, Series A, 7.125%, 10/1/48 (144A) | 3,304,936 | ||||
| 1,875,000 | California Statewide Communities Development Authority, Baptist University, Series A, 5.00%, 11/1/41 (144A) | 1,836,994 | ||||
| 1,560,000 | California Statewide Communities Development Authority, Baptist University, Series A, 6.125%, 11/1/33 (144A) | 1,580,264 | ||||
| 4,030,000 | California Statewide Communities Development Authority, Baptist University, Series A, 6.375%, 11/1/43 (144A) | 4,069,696 | ||||
| 5,475,000 | California Statewide Communities Development Authority, Loma Linda University Medical Center, 5.25%, 12/1/43 (144A) | 5,433,828 | ||||
| 6,165,000 | California Statewide Communities Development Authority, Loma Linda University Medical Center, 5.50%, 12/1/54 | 6,109,638 | ||||
| 20,760,000 | California Statewide Communities Development Authority, Loma Linda University Medical Center, 5.50%, 12/1/58 (144A) | 20,851,967 | ||||
| 3,500,000 | California Statewide Communities Development Authority, Loma Linda University Medical Center, Series A, 5.00%, 12/1/46 (144A) | 3,211,285 | ||||
| 31,320,000 | California Statewide Communities Development Authority, Loma Linda University Medical Center, Series A, 5.25%, 12/1/56 (144A) | 29,427,019 | ||||
| 700,000 | City of Oroville, Oroville Hospital, 5.25%, 4/1/34 | 723,975 | ||||
| 6,980,000 | City of Oroville, Oroville Hospital, 5.25%, 4/1/39 | 7,043,658 | ||||
| 34,720,000 | City of Oroville, Oroville Hospital, 5.25%, 4/1/49 | 33,491,259 | ||||
| 31,800,000 | City of Oroville, Oroville Hospital, 5.25%, 4/1/54 | 30,171,204 | ||||
| 64,000,000 | Golden State Tobacco Securitization Corp., Series A1, 4.214%, 6/1/50 | 51,827,840 | ||||
| Principal Amount USD ($) | Value | |||||
| California — (continued) | ||||||
| 2,500,000(b) | Pittsburg Unified School District Financing Authority, Capital Appreciation General Obligation Pittsburg, 9/1/41 (AGM Insured) | $ 1,133,425 | ||||
| 1,925,000(b) | Pittsburg Unified School District Financing Authority, Capital Appreciation General Obligation Pittsburg, 9/1/42 (AGM Insured) | 831,177 | ||||
| Total California | $ 241,029,863 | |||||
| Colorado — 6.6% | ||||||
| 4,535,000(c) | 2000 Holly Metropolitan District, Series A, 5.00%, 12/1/50 | $ 3,991,027 | ||||
| 577,000(c) | 2000 Holly Metropolitan District, Series B, 7.50%, 12/15/50 | 543,413 | ||||
| 1,735,000(c) | Belleview Village Metropolitan District, 4.95%, 12/1/50 | 1,467,272 | ||||
| 1,250,000(c) | Cottonwood Highlands Metropolitan District No. 1, Series A, 5.00%, 12/1/49 | 1,131,263 | ||||
| 2,090,000(c) | Cottonwood Highlands Metropolitan District No. 1, Series B, 8.75%, 12/15/49 | 2,123,774 | ||||
| 4,090,000(c) | Crystal Crossing Metropolitan District, 5.25%, 12/1/40 | 4,064,724 | ||||
| 26,000,000 | Dominion Water & Sanitation District, 5.875%, 12/1/52 | 25,455,300 | ||||
| 8,425,000(c) | Green Valley Ranch East Metropolitan District No. 6, Series A, 5.875%, 12/1/50 | 8,082,018 | ||||
| 15,270,000(c) | Larkridge Metropolitan District No. 2, 5.25%, 12/1/48 | 14,187,052 | ||||
| 5,261,000(c) | Littleton Village Metropolitan District No. 2, 5.375%, 12/1/45 | 5,153,886 | ||||
| 1,125,000 | Nine Mile Metropolitan District, 4.625%, 12/1/30 | 1,063,361 | ||||
| 9,760,000 | Nine Mile Metropolitan District, 5.125%, 12/1/40 | 9,166,299 | ||||
| 1,000,000(c) | Ridgeline Vista Metropolitan District, Series A, 5.25%, 12/1/60 | 939,830 | ||||
| 2,000,000(c) | Settler's Crossing Metropolitan District No. 1, Series A, 5.00%, 12/1/40 (144A) | 1,841,780 | ||||
| 3,760,000(c) | Settler's Crossing Metropolitan District No. 1, Series A, 5.125%, 12/1/50 (144A) | 3,303,310 | ||||
| 597,000(c) | Settler's Crossing Metropolitan District No. 1, Series B, 7.625%, 12/15/50 | 582,284 | ||||
| 1,722,000(c) | Village at Dry Creek Metropolitan District No. 2, 4.375%, 12/1/44 | 1,476,030 | ||||
| 1,246,000(c) | Villas Metropolitan District, Series A, 5.125%, 12/1/48 | 1,238,910 | ||||
| Principal Amount USD ($) | Value | |||||
| Colorado — (continued) | ||||||
| 4,280,000(c) | Willow Bend Metropolitan District, Series A, 5.00%, 12/1/39 | $ 4,104,648 | ||||
| 5,375,000(c) | Willow Bend Metropolitan District, Series A, 5.00%, 12/1/49 | 4,835,135 | ||||
| 755,000(c) | Willow Bend Metropolitan District, Series B, 7.625%, 12/15/49 | 690,923 | ||||
| Total Colorado | $ 95,442,239 | |||||
| Delaware — 0.2% | ||||||
| 2,225,000 | Delaware State Economic Development Authority, Aspira of Delaware Charter, 4.00%, 6/1/52 | $ 1,669,974 | ||||
| 1,380,000 | Delaware State Economic Development Authority, Aspira of Delaware Charter, 4.00%, 6/1/57 | 1,003,080 | ||||
| Total Delaware | $ 2,673,054 | |||||
| District of Columbia — 0.4% | ||||||
| 915,000 | District of Columbia, Inspired Teaching Demonstration Public Charter School, 5.00%, 7/1/32 | $ 961,217 | ||||
| 1,500,000 | District of Columbia, Inspired Teaching Demonstration Public Charter School, 5.00%, 7/1/42 | 1,509,300 | ||||
| 1,165,000 | District of Columbia, Inspired Teaching Demonstration Public Charter School, 5.00%, 7/1/47 | 1,160,934 | ||||
| 1,835,000 | District of Columbia, Inspired Teaching Demonstration Public Charter School, 5.00%, 7/1/52 | 1,807,163 | ||||
| 735,000 | District of Columbia Tobacco Settlement Financing Corp., Asset-Backed, 6.75%, 5/15/40 | 756,940 | ||||
| Total District of Columbia | $ 6,195,554 | |||||
| Florida — 1.3% | ||||||
| 500,000(d) | Capital Trust Agency, Inc., Series B, 5.00%, 7/1/43 | $ 50,000 | ||||
| 750,000(d) | Capital Trust Agency, Inc., Series B, 5.00%, 7/1/53 | 75,000 | ||||
| 500,000(d) | Capital Trust Agency, Inc., Series B, 5.25%, 7/1/48 | 50,000 | ||||
| 1,000,000 | Charlotte County Industrial Development Authority, Town & Country Utilities Project, 4.00%, 10/1/51 (144A) | 743,860 | ||||
| 850,000 | County of Lake, 5.00%, 1/15/54 (144A) | 745,382 | ||||
| 270,000 | County of Lake, Imagine South Lake Charter School Project, 5.00%, 1/15/29 (144A) | 272,049 | ||||
| 1,250,000 | County of Lake, Imagine South Lake, Charter School Project, 5.00%, 1/15/39 (144A) | 1,184,438 | ||||
| 2,350,000 | County of Lake, Imagine South Lake, Charter School Project, 5.00%, 1/15/49 (144A) | 2,100,454 | ||||
| 300,000 | Florida Development Finance Corp., Glenridge On Palmer Ranch Project, 5.00%, 6/1/31 | 291,612 | ||||
| Principal Amount USD ($) | Value | |||||
| Florida — (continued) | ||||||
| 13,475,000 | Florida Development Finance Corp., Glenridge On Palmer Ranch Project, 5.00%, 6/1/51 | $ 10,717,206 | ||||
| 225,000 | Florida Development Finance Corp., The Glenridge On Palmer Ranch Project, 5.00%, 6/1/35 | 209,439 | ||||
| 2,500,000 | Palm Beach County Health Facilities Authority, Toby & Leon Cooperman Sinai, 4.25%, 6/1/56 | 1,887,650 | ||||
| Total Florida | $ 18,327,090 | |||||
| Guam — 0.1% | ||||||
| 1,100,000 | Guam Economic Development & Commerce Authority, Asset-Backed, 5.625%, 6/1/47 | $ 1,000,923 | ||||
| Total Guam | $ 1,000,923 | |||||
| Illinois — 8.8% | ||||||
| 1,650,000 | Chicago Board of Education, 5.75%, 4/1/35 | $ 1,759,841 | ||||
| 8,010,000 | Chicago Board of Education, 6.00%, 4/1/46 | 8,291,471 | ||||
| 2,500,000(c) | Chicago Board of Education, Series A, 5.00%, 12/1/37 | 2,482,625 | ||||
| 16,170,000(c) | Chicago Board of Education, Series A, 5.00%, 12/1/42 | 15,490,375 | ||||
| 1,000,000(c) | Chicago Board of Education, Series A, 7.00%, 12/1/46 (144A) | 1,083,680 | ||||
| 8,000,000(c) | Chicago Board of Education, Series B, 6.50%, 12/1/46 | 8,468,880 | ||||
| 2,035,000(c) | Chicago Board of Education, Series C, 5.00%, 12/1/34 | 2,067,601 | ||||
| 1,415,000(c) | Chicago Board of Education, Series C, 5.25%, 12/1/39 | 1,392,049 | ||||
| 20,000,000(c) | Chicago Board of Education, Series D, 5.00%, 12/1/46 | 18,932,800 | ||||
| 2,305,000(c) | Chicago Board of Education, Series G, 5.00%, 12/1/44 | 2,238,385 | ||||
| 7,775,000(c) | Chicago Board of Education, Series H, 5.00%, 12/1/46 | 7,481,105 | ||||
| 2,900,000(c) | City of Chicago, 5.50%, 1/1/34 | 2,948,169 | ||||
| 9,200,000(c) | City of Chicago, Series A, 5.50%, 1/1/35 | 9,701,124 | ||||
| 13,795,000(c) | City of Chicago, Series A, 5.50%, 1/1/49 | 14,140,427 | ||||
| 4,270,000 | City of Plano Special Service Area No. 3 & No. 4, 4.00%, 3/1/35 | 4,280,248 | ||||
| 4,050,000 | Illinois Finance Authority, Series 2, 6.00%, 11/15/36 | 3,460,482 | ||||
| 1,591,212(b) | Illinois Finance Authority, Cabs Clare Oaks Project, Series B1, 11/15/52 | 18,219 | ||||
| 2,520,597(e) | Illinois Finance Authority, Clare Oaks Project, Series 3, 5.25%, 11/15/52 | 1,813,418 | ||||
| Principal Amount USD ($) | Value | |||||
| Illinois — (continued) | ||||||
| 2,000,000 | Metropolitan Pier & Exposition Authority, Searstone CCRC Project, 5.00%, 6/15/50 | $ 1,966,920 | ||||
| 12,160,000 | Southwestern Illinois Development Authority, 5.00%, 6/1/53 | 11,476,730 | ||||
| 1,415,000(d) | Southwestern Illinois Development Authority, Village of Sauget Project, 5.625%, 11/1/26 | 820,700 | ||||
| 3,040,000 | Village of Lincolnwood, Series A, 4.82%, 1/1/41 (144A) | 2,773,118 | ||||
| 2,165,000 | Village of Matteson, 6.50%, 12/1/35 | 2,205,139 | ||||
| 1,139,000 | Village of Volo IL Special Service Area No. 17, 5.50%, 3/1/47 | 1,145,880 | ||||
| Total Illinois | $ 126,439,386 | |||||
| Indiana — 6.9% | ||||||
| 8,230,000 | City of Anderson, 5.375%, 1/1/40 (144A) | $ 6,843,739 | ||||
| 580,000 | City of Evansville, Silver Birch Evansville Project, 4.80%, 1/1/28 | 553,790 | ||||
| 6,475,000 | City of Evansville, Silver Birch Evansville Project, 5.45%, 1/1/38 | 5,442,108 | ||||
| 600,000 | City of Fort Wayne, 5.125%, 1/1/32 | 539,802 | ||||
| 4,665,000 | City of Fort Wayne, 5.35%, 1/1/38 | 3,856,276 | ||||
| 24,990,000 | City of Hammond, Custodial Receipts Cabelas Project, 7.50%, 2/1/29 (144A) | 24,052,875 | ||||
| 1,275,000 | City of Kokomo, Silver Birch of Kokomo, 5.75%, 1/1/34 | 1,230,375 | ||||
| 7,575,000 | City of Kokomo, Silver Birch of Kokomo, 5.875%, 1/1/37 | 7,127,848 | ||||
| 1,075,000 | City of Lafayette, Glasswater Creek Lafayette Project, 5.60%, 1/1/33 | 1,067,798 | ||||
| 6,000,000 | City of Lafayette, Glasswater Creek Lafayette Project, 5.80%, 1/1/37 | 6,010,680 | ||||
| 800,000 | City of Mishawaka, Silver Birch Mishawaka Project, 5.10%, 1/1/32 (144A) | 750,112 | ||||
| 5,890,000 | City of Mishawaka, Silver Birch Mishawaka Project, 5.375%, 1/1/38 (144A) | 4,882,162 | ||||
| 4,560,000 | City of Terre Haute, 5.35%, 1/1/38 | 3,709,879 | ||||
| 5,190,000 | Indiana Finance Authority, Multipurpose Educational Facilities, Avondale Meadows Academy Project, 5.125%, 7/1/37 | 5,317,155 | ||||
| 330,000 | Indiana Finance Authority, Multipurpose Educational Facilities, Avondale Meadows Academy Project, 5.375%, 7/1/47 | 331,003 | ||||
| 1,975,000 | Indiana Finance Authority, Sanders Glen Project, Series A, 4.25%, 7/1/43 | 1,729,606 | ||||
| Principal Amount USD ($) | Value | |||||
| Indiana — (continued) | ||||||
| 2,020,000 | Indiana Finance Authority, Sanders Glen Project, Series A, 4.50%, 7/1/53 | $ 1,743,179 | ||||
| 11,985,000 | Indiana Housing & Community Development Authority, Series A, 5.00%, 1/1/39 (144A) | 9,450,172 | ||||
| 8,340,000 | Indiana Housing & Community Development Authority, Evergreen Village Bloomington Project, 5.50%, 1/1/37 | 7,329,025 | ||||
| 7,950,000 | Town of Plainfield Multifamily Housing Revenue, 5.375%, 9/1/38 | 7,590,581 | ||||
| Total Indiana | $ 99,558,165 | |||||
| Iowa — 1.4% | ||||||
| 21,485,000 | Iowa Finance Authority, Alcoa Inc. Projects, 4.75%, 8/1/42 | $ 20,426,649 | ||||
| Total Iowa | $ 20,426,649 | |||||
| Kansas — 0.9% | ||||||
| 400,000 | Kansas Development Finance Authority, Series A, 5.25%, 11/15/33 | $ 361,212 | ||||
| 15,405,000 | Kansas Development Finance Authority, Series A, 5.25%, 11/15/53 | 11,058,325 | ||||
| 2,500,000 | Kansas Development Finance Authority, Series A, 5.50%, 11/15/38 | 2,117,825 | ||||
| Total Kansas | $ 13,537,362 | |||||
| Maryland — 0.1% | ||||||
| 900,000 | Maryland Health & Higher Educational Facilities Authority, City Neighbors, Series A, 6.75%, 7/1/44 | $ 909,126 | ||||
| Total Maryland | $ 909,126 | |||||
| Massachusetts — 0.5% | ||||||
| 689,436(d) | Massachusetts Development Finance Agency, Adventcare Project, 7.625%, 10/15/37 | $ 241,302 | ||||
| 1,802,446(d) | Massachusetts Development Finance Agency, Adventcare Project, Series A, 6.75%, 10/15/37 (144A) | 630,856 | ||||
| 1,250,000 | Massachusetts Development Finance Agency, International Charter School, 5.00%, 4/15/40 | 1,264,025 | ||||
| 4,500,000 | Massachusetts Development Finance Agency, Linden Ponds, 5.125%, 11/15/46 (144A) | 4,632,525 | ||||
| Total Massachusetts | $ 6,768,708 | |||||
| Michigan — 2.1% | ||||||
| 8,565,000 | David Ellis Academy-West, 5.25%, 6/1/45 | $ 7,697,365 | ||||
| Principal Amount USD ($) | Value | |||||
| Michigan — (continued) | ||||||
| 1,250,000 | Flint Hospital Building Authority, Hurley Medical Center, Series A, 5.25%, 7/1/39 | $ 1,250,013 | ||||
| 5,485,000 | Flint International Academy, 5.75%, 10/1/37 | 5,485,000 | ||||
| 5,720,000 | Michigan Finance Authority, 5.75%, 4/1/40 | 5,889,255 | ||||
| 4,000,000(e) | Michigan Strategic Fund, Series B, 7.50%, 11/1/41 | 4,178,800 | ||||
| 7,115,000(e) | Michigan Strategic Fund, Michigan Department Offices Lease, Series B, 7.75%, 3/1/40 | 6,384,076 | ||||
| Total Michigan | $ 30,884,509 | |||||
| Minnesota — 2.1% | ||||||
| 1,310,000 | City of Bethel, 6.00%, 7/1/57 | $ 1,189,336 | ||||
| 4,210,000 | City of Bethel, Series A, 5.00%, 7/1/48 | 3,940,055 | ||||
| 1,000,000 | City of Bethel, Series A, 5.00%, 7/1/53 | 911,390 | ||||
| 2,600,000 | City of Brooklyn Park, Prairie Seeds Academy Project, Series A, 5.00%, 3/1/34 | 2,638,584 | ||||
| 2,000,000 | City of Brooklyn Park, Prairie Seeds Academy Project, Series A, 5.00%, 3/1/39 | 2,016,720 | ||||
| 3,515,000 | City of Deephaven, Eagle Ridge Academy Project, Series A, 5.00%, 7/1/55 | 3,636,724 | ||||
| 400,000 | City of Deephaven, Eagle Ridge Academy Project, Series A, 5.25%, 7/1/37 | 404,396 | ||||
| 1,500,000 | City of Deephaven, Eagle Ridge Academy Project, Series A, 5.50%, 7/1/50 | 1,500,285 | ||||
| 3,145,000 | City of Rochester, Series A, 5.25%, 9/1/43 | 2,701,398 | ||||
| 6,080,000 | City of Rochester, Series A, 5.375%, 9/1/50 | 5,089,386 | ||||
| 1,500,000 | City of Rochester, Rochester Math & Science Academy, Series A, 5.125%, 9/1/38 | 1,430,295 | ||||
| 2,000,000 | Housing & Redevelopment Authority of The City of St. Paul Minnesota, Great River School Project, Series A, 5.50%, 7/1/52 (144A) | 2,077,140 | ||||
| 1,415,000 | Housing & Redevelopment Authority of The City of St. Paul Minnesota, Higher Ground Academy Project, 5.125%, 12/1/38 | 1,415,792 | ||||
| 1,300,000 | Housing & Redevelopment Authority of The City of St. Paul Minnesota, St. Paul City School Project, Series A, 5.00%, 7/1/36 | 1,388,101 | ||||
| Total Minnesota | $ 30,339,602 | |||||
| Missouri — 0.2% | ||||||
| 200,000 | Kansas City Industrial Development Authority, Series A, 4.25%, 4/1/26 (144A) | $ 199,020 | ||||
| Principal Amount USD ($) | Value | |||||
| Missouri — (continued) | ||||||
| 1,000,000 | Kansas City Industrial Development Authority, Series A, 5.00%, 4/1/36 (144A) | $ 971,360 | ||||
| 2,300,000 | Kansas City Industrial Development Authority, Series A, 5.00%, 4/1/46 (144A) | 2,084,766 | ||||
| Total Missouri | $ 3,255,146 | |||||
| New Jersey — 1.3% | ||||||
| 934,452 | New Jersey Economic Development Authority, Series A, 4.70%, 9/1/28 (144A) | $ 855,023 | ||||
| 1,255,000 | New Jersey Economic Development Authority, Series A, 5.25%, 10/1/38 (144A) | 1,206,344 | ||||
| 541,503 | New Jersey Economic Development Authority, Series A, 5.375%, 9/1/33 (144A) | 495,475 | ||||
| 1,092,590 | New Jersey Economic Development Authority, Series A, 5.625%, 9/1/38 (144A) | 999,720 | ||||
| 5,870,274 | New Jersey Economic Development Authority, Series A, 5.75%, 9/1/50 (144A) | 5,371,301 | ||||
| 1,215,000 | New Jersey Economic Development Authority, Charter Hatikvah International Academy, Series A, 5.25%, 7/1/37 (144A) | 1,141,444 | ||||
| 2,500,000 | New Jersey Economic Development Authority, Charter Hatikvah International Academy, Series A, 5.375%, 7/1/47 (144A) | 2,261,200 | ||||
| 7,205,000 | New Jersey Economic Development Authority, Marion P. Thomas Charter School, Inc., Project, Series A, 5.375%, 10/1/50 (144A) | 6,769,602 | ||||
| Total New Jersey | $ 19,100,109 | |||||
| New Mexico — 1.3% | ||||||
| 1,690,000(e) | County of Otero, Otero County Jail Project, Certificate Participation, 9.00%, 4/1/23 | $ 1,690,000 | ||||
| 16,135,000(e) | County of Otero, Otero County Jail Project, Certificate Participation, 9.00%, 4/1/28 | 16,135,000 | ||||
| 1,750,000 | Lower Petroglyphs Public Improvement District, 5.00%, 10/1/48 | 1,609,947 | ||||
| Total New Mexico | $ 19,434,947 | |||||
| New York — 14.0% | ||||||
| 375,000 | Buffalo & Erie County Industrial Land Development Corp., 5.00%, 10/1/28 (144A) | $ 386,996 | ||||
| 4,150,000 | Buffalo & Erie County Industrial Land Development Corp., 5.00%, 10/1/38 (144A) | 4,152,781 | ||||
| 6,175,000 | Chautauqua Tobacco Asset Securitization Corp., 5.00%, 6/1/48 | 6,005,188 | ||||
| Principal Amount USD ($) | Value | |||||
| New York — (continued) | ||||||
| 10,000,000(d) | Erie County Industrial Development Agency, Galvstar LLC Project, Series A, 9.25%, 10/1/30 | $ 1,250,000 | ||||
| 8,000,000(d) | Erie County Industrial Development Agency, Galvstar LLC Project, Series B, 9.25%, 10/1/30 | 1,890,000 | ||||
| 1,795,000(d) | Erie County Industrial Development Agency, Galvstar LLC Project, Series C, 9.25%, 10/1/30 | 424,069 | ||||
| 8,755,000 | Erie Tobacco Asset Securitization Corp., Asset-Backed, Series A, 5.00%, 6/1/45 | 8,402,611 | ||||
| 22,015,000 | Nassau County Tobacco Settlement Corp., Asset-Backed, Series A3, 5.00%, 6/1/35 | 20,642,365 | ||||
| 15,020,000 | Nassau County Tobacco Settlement Corp., Asset-Backed, Series A3, 5.125%, 6/1/46 | 13,834,471 | ||||
| 5,735,000 | New York Counties Tobacco Trust IV, Series A, 5.00%, 6/1/42 | 5,311,241 | ||||
| 21,100,000 | New York Counties Tobacco Trust IV, Series A, 6.25%, 6/1/41 (144A) | 21,101,688 | ||||
| 32,420,000 | New York Counties Tobacco Trust IV, Settlement pass through, Series A, 5.00%, 6/1/45 | 29,540,780 | ||||
| 51,600,000(b) | New York Counties Tobacco Trust V, Capital Appreciation Pass Through, Series S-4A, 6/1/60 (144A) | 2,340,060 | ||||
| 440,000 | New York Counties Tobacco Trust VI, Series A-2B, 5.00%, 6/1/45 | 416,438 | ||||
| 18,745,000 | New York Counties Tobacco Trust VI, Settlement pass through, Series A-2B, 5.00%, 6/1/51 | 17,562,190 | ||||
| 2,820,000 | Riverhead Industrial Development Agency, 7.65%, 8/1/34 | 2,828,798 | ||||
| 2,250,000 | TSASC, Inc., Series B, 5.00%, 6/1/25 | 2,199,353 | ||||
| 26,890,000 | TSASC, Inc., Series B, 5.00%, 6/1/45 | 25,144,301 | ||||
| 27,480,000 | TSASC, Inc., Series B, 5.00%, 6/1/48 | 26,169,204 | ||||
| 12,000,000 | Westchester County Local Development Corp., Purchase Senior Learning Community, Inc. Project, 4.50%, 7/1/56 (144A) | 7,986,600 | ||||
| 5,000,000 | Westchester County Local Development Corp., Purchase Senior Learning Community, Inc. Project, 5.00%, 7/1/36 (144A) | 4,302,300 | ||||
| Total New York | $ 201,891,434 | |||||
| Ohio — 4.7% | ||||||
| 69,000,000 | Buckeye Tobacco Settlement Financing Authority, Senior Class 2, Series B2, 5.00%, 6/1/55 | $ 62,445,000 | ||||
| Principal Amount USD ($) | Value | |||||
| Ohio — (continued) | ||||||
| 530,000 | Ohio Housing Finance Agency, Sanctuary Springboro Project, 5.125%, 1/1/32 (144A) | $ 456,643 | ||||
| 5,275,000 | Ohio Housing Finance Agency, Sanctuary Springboro Project, 5.45%, 1/1/38 (144A) | 4,217,784 | ||||
| Total Ohio | $ 67,119,427 | |||||
| Pennsylvania — 4.1% | ||||||
| 1,000,000 | Chester County Industrial Development Authority, Collegium Charter School, Series A, 5.125%, 10/15/37 | $ 1,000,170 | ||||
| 2,535,000 | Chester County Industrial Development Authority, Collegium Charter School, Series A, 5.25%, 10/15/47 | 2,277,469 | ||||
| 8,465,000 | Delaware County Industrial Development Authority, Chester Charter School Arts Project, Series A, 5.125%, 6/1/46 (144A) | 8,811,049 | ||||
| 1,310,000 | Philadelphia Authority for Industrial Development, 5.00%, 4/15/32 (144A) | 1,333,174 | ||||
| 2,290,000 | Philadelphia Authority for Industrial Development, 5.00%, 4/15/42 (144A) | 2,170,233 | ||||
| 3,335,000 | Philadelphia Authority for Industrial Development, 5.00%, 4/15/52 (144A) | 3,020,843 | ||||
| 1,660,000 | Philadelphia Authority for Industrial Development, 5.125%, 6/1/38 (144A) | 1,700,222 | ||||
| 3,500,000 | Philadelphia Authority for Industrial Development, 5.25%, 6/1/48 (144A) | 3,521,350 | ||||
| 4,370,000 | Philadelphia Authority for Industrial Development, 5.375%, 6/1/53 (144A) | 4,391,500 | ||||
| 9,435,000 | Philadelphia Authority for Industrial Development, 5.50%, 6/1/49 (144A) | 9,636,532 | ||||
| 925,000 | Philadelphia Authority for Industrial Development, Series A, 5.00%, 11/15/31 | 917,508 | ||||
| 4,055,000 | Philadelphia Authority for Industrial Development, 2800 American Street Co. Project, Series A, 5.625%, 7/1/48 (144A) | 4,067,084 | ||||
| 8,295,000 | Philadelphia Authority for Industrial Development, Global Leadership Academy Charter School Project, Series A, 5.00%, 11/15/50 | 7,312,872 | ||||
| 2,200,000 | Philadelphia Authority for Industrial Development, Greater Philadelphia Health Action, Inc. Project, Series A, 6.50%, 6/1/45 | 2,127,554 | ||||
| 2,940,000 | Philadelphia Authority for Industrial Development, Greater Philadelphia Health Action, Inc., Project, Series A, 6.625%, 6/1/50 | 2,866,118 | ||||
| Principal Amount USD ($) | Value | |||||
| Pennsylvania — (continued) | ||||||
| 340,000 | Philadelphia Authority for Industrial Development, Green Woods Charter School, Series A, 5.00%, 6/15/32 | $ 336,291 | ||||
| 1,045,000 | Philadelphia Authority for Industrial Development, Green Woods Charter School, Series A, 5.125%, 6/15/42 | 975,831 | ||||
| 970,000 | Philadelphia Authority for Industrial Development, Green Woods Charter School, Series A, 5.25%, 6/15/52 | 884,679 | ||||
| 1,020,000 | Philadelphia Authority for Industrial Development, Green Woods Charter School, Series A, 5.375%, 6/15/57 | 957,494 | ||||
| Total Pennsylvania | $ 58,307,973 | |||||
| Puerto Rico — 4.8% | ||||||
| 15,689,000(c) | Commonwealth of Puerto Rico, Series A1, 4.00%, 7/1/46 | $ 12,354,774 | ||||
| 10,745,000 | Puerto Rico Commonwealth Aqueduct & Sewer Authority, Series A, 5.00%, 7/1/47 (144A) | 10,001,016 | ||||
| 6,685,000 | Puerto Rico Electric Power Authority, Series AAA, 5.25%, 7/1/21 | 4,575,883 | ||||
| 3,535,000 | Puerto Rico Electric Power Authority, Series CCC, 4.80%, 7/1/28 | 2,439,150 | ||||
| 1,285,000 | Puerto Rico Electric Power Authority, Series CCC, 5.00%, 7/1/24 | 888,256 | ||||
| 3,735,000 | Puerto Rico Electric Power Authority, Series DDD, 5.00%, 7/1/23 | 2,633,175 | ||||
| 3,315,000 | Puerto Rico Electric Power Authority, Series TT, 5.00%, 7/1/21 | 2,337,075 | ||||
| 1,000,000 | Puerto Rico Electric Power Authority, Series WW, 5.00%, 7/1/28 | 692,500 | ||||
| 1,130,000 | Puerto Rico Electric Power Authority, Series ZZ, 4.75%, 7/1/27 | 776,875 | ||||
| 14,060,000 | Puerto Rico Highway & Transportation Authority, Series A, 5.00%, 7/1/62 | 13,005,500 | ||||
| 4,000,000 | Puerto Rico Highway & Transportation Authority, Series A, 5.85%, 3/1/27 | 3,998,000 | ||||
| 1,295,000 | Puerto Rico Industrial Tourist Educational Medical & Environmental Control Facilities Financing Authority, Series A, 5.20%, 7/1/24 | 1,306,046 | ||||
| Principal Amount USD ($) | Value | |||||
| Puerto Rico — (continued) | ||||||
| 11,458,000 | Puerto Rico Sales Tax Financing Corp. Sales Tax Revenue, Series 2, 4.784%, 7/1/58 | $ 10,184,787 | ||||
| 4,209,000 | Puerto Rico Sales Tax Financing Corp. Sales Tax Revenue, Series A1, 5.00%, 7/1/58 | 3,889,326 | ||||
| Total Puerto Rico | $ 69,082,363 | |||||
| Rhode Island — 0.2% | ||||||
| 2,065,000(d) | Central Falls Detention Facility Corp., 7.25%, 7/15/35 | $ 371,700 | ||||
| 2,000,000(e) | Tender Option Bond Trust Receipts/Certificates, RIB, Series 2019, 8.129%, 9/1/47 (144A) | 1,810,980 | ||||
| Total Rhode Island | $ 2,182,680 | |||||
| Tennessee — 0.1% | ||||||
| 1,095,000 | Metropolitan Government Nashville & Davidson County Industrial Development Board, 4.00%, 6/1/51 (144A) | $ 832,660 | ||||
| Total Tennessee | $ 832,660 | |||||
| Texas — 4.4% | ||||||
| 640,000 | Arlington Higher Education Finance Corp., 3.50%, 3/1/24 (144A) | $ 635,898 | ||||
| 16,875,000 | Arlington Higher Education Finance Corp., 5.45%, 3/1/49 (144A) | 17,607,544 | ||||
| 95,000 | Arlington Higher Education Finance Corp., Series A, 5.875%, 3/1/24 | 95,437 | ||||
| 525,000 | Arlington Higher Education Finance Corp., Series A, 6.625%, 3/1/29 | 538,613 | ||||
| 375,000 | Arlington Higher Education Finance Corp., Universal Academy, Series A, 7.00%, 3/1/34 | 382,223 | ||||
| 7,030,000 | Arlington Higher Education Finance Corp., Universal Academy, Series A, 7.125%, 3/1/44 | 7,154,009 | ||||
| 280,000 | City of Celina, 5.50%, 9/1/24 | 282,254 | ||||
| 1,025,000 | City of Celina, 6.00%, 9/1/30 | 1,040,447 | ||||
| 2,590,000 | City of Celina, 6.25%, 9/1/40 | 2,642,214 | ||||
| 16,755,000(e) | Greater Texas Cultural Education Facilities Finance Corp., 9.00%, 2/1/50 (144A) | 15,349,758 | ||||
| 3,335,000(e) | Greater Texas Cultural Education Facilities Finance Corp., Series B, 9.00%, 2/1/33 (144A) | 3,327,963 | ||||
| 100,000(f) | La Vernia Higher Education Finance Corp., Meridian World School, Series A, 5.25%, 8/15/35 (144A) | 102,882 | ||||
| 2,000,000(f) | La Vernia Higher Education Finance Corp., Meridian World School, Series A, 5.50%, 8/15/45 (144A) | 2,064,680 | ||||
| 1,250,000 | New Hope Cultural Education Facilities Finance Corp., Village On The Park, Series C, 5.50%, 7/1/46 | 562,500 | ||||
| Principal Amount USD ($) | Value | |||||
| Texas — (continued) | ||||||
| 1,000,000 | New Hope Cultural Education Facilities Finance Corp., Village On The Park, Series C, 5.75%, 7/1/51 | $ 450,000 | ||||
| 75,000 | New Hope Cultural Education Facilities Finance Corp., Village On The Park, Series D, 6.00%, 7/1/26 | 30,000 | ||||
| 1,350,000 | New Hope Cultural Education Facilities Finance Corp., Village On The Park, Series D, 7.00%, 7/1/51 | 540,000 | ||||
| 17,350,000(d) | Sanger Industrial Development Corp., Texas Pellets Project, Series B, 8.00%, 7/1/38 | 4,272,437 | ||||
| 8,142,447(d) | Tarrant County Cultural Education Facilities Finance Corp., Series A, 5.75%, 12/1/54 | 5,292,591 | ||||
| 1,000,000(e) | Texas Midwest Public Facility Corp., Secure Treatment Facility Project, Restructured, 0.001%, 12/1/30 | 631,650 | ||||
| Total Texas | $ 63,003,100 | |||||
| Virginia — 5.0% | ||||||
| 3,000,000 | Ballston Quarter Community Development Authority, Series A, 5.50%, 3/1/46 | $ 2,158,500 | ||||
| 2,050,000 | Cherry Hill Community Development Authority, Potomac Shores Project, 5.40%, 3/1/45 (144A) | 2,056,929 | ||||
| 21,385,000 | Tobacco Settlement Financing Corp., Series 1, 6.706%, 6/1/46 | 19,767,439 | ||||
| 41,495,000 | Tobacco Settlement Financing Corp., Series B1, 5.00%, 6/1/47 | 38,843,884 | ||||
| 5,905,000(e) | Tobacco Settlement Financing Corp., Series B2, 5.20%, 6/1/46 | 5,733,046 | ||||
| 14,000,000(b) | Tobacco Settlement Financing Corp., Series D, 6/1/47 | 3,285,660 | ||||
| Total Virginia | $ 71,845,458 | |||||
| Wisconsin — 3.0% | ||||||
| 2,500,000 | Public Finance Authority, American Preparatory Academy - Las Vegas Project, Series A, 5.125%, 7/15/37 (144A) | $ 2,445,225 | ||||
| 1,550,000 | Public Finance Authority, Community School of Davidson Project, 5.00%, 10/1/33 | 1,561,036 | ||||
| 5,905,000 | Public Finance Authority, Community School of Davidson Project, 5.00%, 10/1/48 | 5,506,117 | ||||
| 1,590,000 | Public Finance Authority, Coral Academy Science Las Vegas, Series A, 5.625%, 7/1/44 | 1,627,254 | ||||
| 370,000 | Public Finance Authority, Coral Academy Science Reno, 5.00%, 6/1/29 (144A) | 364,742 | ||||
| 710,000 | Public Finance Authority, Coral Academy Science Reno, 5.00%, 6/1/39 (144A) | 656,111 | ||||
| Principal Amount USD ($) | Value | |||||
| Wisconsin — (continued) | ||||||
| 2,660,000 | Public Finance Authority, Coral Academy Science Reno, 5.00%, 6/1/50 (144A) | $ 2,279,514 | ||||
| 400,000 | Public Finance Authority, Coral Academy Science Reno, Series A, 4.00%, 6/1/36 (144A) | 390,488 | ||||
| 700,000 | Public Finance Authority, Coral Academy Science Reno, Series A, 4.00%, 6/1/51 (144A) | 592,662 | ||||
| 1,130,000 | Public Finance Authority, Coral Academy Science Reno, Series A, 4.00%, 6/1/61 (144A) | 897,570 | ||||
| 335,000 | Public Finance Authority, Coral Academy Science Reno, Series A, 5.375%, 6/1/37 (144A) | 336,437 | ||||
| 900,000 | Public Finance Authority, Coral Academy Science Reno, Series A, 5.875%, 6/1/52 (144A) | 872,757 | ||||
| 1,565,000 | Public Finance Authority, Coral Academy Science Reno, Series A, 6.00%, 6/1/62 (144A) | 1,517,158 | ||||
| 9,310,000 | Public Finance Authority, Gardner Webb University, 5.00%, 7/1/31 (144A) | 9,809,854 | ||||
| 275,000 | Public Finance Authority, Lead Academy Project, Series A, 4.25%, 8/1/26 (144A) | 271,480 | ||||
| 2,000,000 | Public Finance Authority, Lead Academy Project, Series A, 5.00%, 8/1/36 (144A) | 2,076,920 | ||||
| 2,500,000 | Public Finance Authority, Lead Academy Project, Series A, 5.125%, 8/1/46 (144A) | 2,539,500 | ||||
| 2,000,000 | Public Finance Authority, Searstone CCRC Project, 4.00%, 6/1/41 (144A) | 1,496,340 | ||||
| 1,500,000 | Public Finance Authority, SearStone CCRC Project, Series A, 5.00%, 6/1/37 (144A) | 1,323,540 | ||||
| 2,500,000 | Public Finance Authority, SearStone CCRC Project, Series A, 5.00%, 6/1/52 (144A) | 1,954,150 | ||||
| 500,000(e) | Public Finance Authority, SearStone CCRC Project, Series A, 5.613%, 6/1/47 | 524,125 | ||||
| 2,500,000(e) | Public Finance Authority, SearStone CCRC Project, Series A, 5.688%, 6/1/52 | 2,620,525 | ||||
| 10,640,000(b)(d) | Public Finance Authority, Springshire Pre Development Project, 12/1/20 (144A) | 1,064,000 | ||||
| Total Wisconsin | $ 42,727,505 | |||||
| Total Municipal Bonds (Cost $1,508,316,828) | $1,392,932,605 | |||||
| Principal Amount USD ($) | Value | |||||
| Debtors in Possession Financing — 0.6% of Net Assets# | ||||||
| Retirement Housing — 0.6% | ||||||
| 9,000,000 + | Springshire Retirement LLC - Promissory Note, 9.00%, 4/1/23 | $ 9,000,000 | ||||
| Total Retirement Housing | $ 9,000,000 | |||||
| TOTAL DEBTORS IN POSSESSION FINANCING (Cost $9,000,000) | $ 9,000,000 | |||||
| TOTAL INVESTMENTS IN UNAFFILIATED ISSUERS — 97.4% (Cost $1,517,316,828) | $1,401,932,605 | |||||
| OTHER ASSETS AND LIABILITIES — 2.6% | $ 37,459,938 | |||||
| net assets — 100.0% | $1,439,392,543 | |||||
| AGM | Assured Guaranty Municipal Corp. |
| RIB | Residual Interest Bond is purchased in a secondary market. The interest rate is subject to change periodically and inversely based upon prevailing market rates. The interest rate shown is the rate at February 28, 2023. |
| (144A) | Security is exempt from registration under Rule 144A of the Securities Act of 1933. Such securities may be resold normally to qualified institutional buyers in a transaction exempt from registration. At February 28, 2023, the value of these securities amounted to $419,045,874, or 29.1% of net assets. |
| (a) | Consists of Revenue Bonds unless otherwise indicated. |
| (b) | Security issued with a zero coupon. Income is recognized through accretion of discount. |
| (c) | Represents a General Obligation Bond. |
| (d) | Security is in default. |
| (e) | The interest rate is subject to change periodically. The interest rate and/or reference index and spread shown at February 28, 2023. |
| (f) | Pre-refunded bonds have been collateralized by U.S. Treasury or U.S. Government Agency securities which are held in escrow to pay interest and principal on the tax exempt issue and to retire the bonds in full at the earliest refunding date. |
| + | Security is valued using significant unobservable inputs (Level 3). |
| # | Securities are restricted as to resale. |
| Restricted Securities | Acquisition date | Cost | Value |
| Springshire Retirement LLC - Promissory Note | 12/1/2021 | $9,000,000 | $9,000,000 |
| % of Net assets | 0.6% |
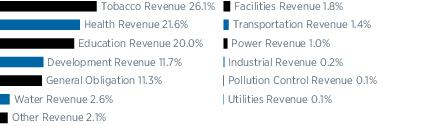
| Revenue Bonds: | |
| Tobacco Revenue | 26.1% |
| Health Revenue | 21.6 |
| Education Revenue | 20.0 |
| Development Revenue | 11.7 |
| Water Revenue | 2.6 |
| Other Revenue | 2.1 |
| Facilities Revenue | 1.8 |
| Transportation Revenue | 1.4 |
| Power Revenue | 1.0 |
| Industrial Revenue | 0.2 |
| Pollution Control Revenue | 0.1 |
| Utilities Revenue | 0.1 |
| 88.7% | |
| General Obligation Bonds: | 11.3% |
| 100.0% |
| Level 1 | – | unadjusted quoted prices in active markets for identical securities. |
| Level 2 | – | other significant observable inputs (including quoted prices for similar securities, interest rates, prepayment speeds, credit risks, etc.). |
| Level 3 | – | significant unobservable inputs (including the Adviser's own assumptions in determining fair value of investments). |
| Level 1 | Level 2 | Level 3 | Total | |
| Municipal Bonds | $— | $1,392,932,605 | $ — | $1,392,932,605 |
| Debtors in Possession Financing | — | — | 9,000,000 | 9,000,000 |
| Total Investments in Securities | $ — | $ 1,392,932,605 | $ 9,000,000 | $ 1,401,932,605 |
| ASSETS: | |
| Investments in unaffiliated issuers, at value (cost $1,517,316,828) | $1,401,932,605 |
| Cash | 11,091,164 |
| Receivables — | |
| Investment securities sold | 6,101,075 |
| Proceeds from contributions | 2,655,841 |
| Interest | 26,668,979 |
| Other assets | 311,500 |
| Total assets | $1,448,761,164 |
| LIABILITIES: | |
| Payables — | |
| Investment securities purchased | $ 4,908,692 |
| Value of withdrawals | 4,341,977 |
| Trustees' fees | 12,638 |
| Administrative expenses | 49,252 |
| Accrued expenses | 56,062 |
| Total liabilities | $ 9,368,621 |
| NET ASSETS: | |
| Paid-in capital | $1,483,853,797 |
| Distributable earnings (loss) | (44,461,254) |
| Net assets | $1,439,392,543 |
| INVESTMENT INCOME: | ||
| Interest from unaffiliated issuers | $39,766,792 | |
| Total Investment Income | $ 39,766,792 | |
| EXPENSES: | ||
| Administrative expenses | $ 46,723 | |
| Transfer agent fees | 4,377 | |
| Consulting fees | 21,614 | |
| Custodian fees | 11,440 | |
| Professional fees | 34,971 | |
| Printing expense | 1,690 | |
| Officers' and Trustees' fees | 41,603 | |
| Miscellaneous | 1,600 | |
| Total expenses | $ 164,018 | |
| Net investment income | $ 39,602,774 | |
| REALIZED AND UNREALIZED GAIN (LOSS) ON INVESTMENTS: | ||
| Net realized gain (loss) on: | ||
| Investments in unaffiliated issuers | $ (65,194,089) | |
| Change in net unrealized appreciation (depreciation) on: | ||
| Investments in unaffiliated issuers | $ 420,503 | |
| Net realized and unrealized gain (loss) on investments | $(64,773,586) | |
| Net decrease in net assets resulting from operations | $ (25,170,812) |
| Six Months Ended 2/28/23 (unaudited) | Year Ended 8/31/22 | |
| FROM OPERATIONS: | ||
| Net investment income (loss) | $ 39,602,774 | $ 84,276,467 |
| Net realized gain (loss) on investments | (65,194,089) | (49,557,811) |
| Change in net unrealized appreciation (depreciation) on investments | 420,503 | (223,692,236) |
| Net decrease in net assets resulting from operations | $ (25,170,812) | $ (188,973,580) |
| FROM CAPITAL TRANSACTIONS: | ||
| Proceeds from contributions | $ 344,890,233 | $ 821,599,552 |
| Value of withdrawals | (499,613,926) | (1,068,188,723) |
| Net decrease in net assets resulting from capital transactions | $ (154,723,693) | $ (246,589,171) |
| Net decrease in net assets | $ (179,894,505) | $ (435,562,751) |
| NET ASSETS: | ||
| Beginning of period | $1,619,287,048 | $ 2,054,849,799 |
| End of period | $1,439,392,543 | $ 1,619,287,048 |
| Six Months Ended 2/28/23 (unaudited) | Year Ended 8/31/22 | 12/21/20 to 8/31/21* | |
| Total return | (1.35)%(a) | (9.34)% | 6.30%(a) |
| Ratio of net expenses to average net assets | 0.02%(b) | 0.02% | 0.02%(b) |
| Ratio of net investment income (loss) to average net assets | 5.44%(b) | 4.47% | 3.07%(b) |
| Portfolio turnover rate | 30%(a) | 38% | 11%(a)(c) |
| Net assets, end of period (in thousands) | $1,439,393 | $1,619,287 | $2,054,850 |
| * | The Portfolio commenced operations on December 21, 2020. |
| (a) | Not annualized. |
| (b) | Annualized. |
| (c) | The portfolio turnover rate excludes purchases and sales from the transfer of assets from Pioneer High Income Municipal Fund (see note 1). |
| A. | Security Valuation |
| Investments are stated at value, computed once daily, on each day the New York Stock Exchange (“NYSE”) is open, as of the close of regular trading on the NYSE. | |
| Fixed-income securities are valued by using prices supplied by independent pricing services, which consider such factors as market prices, market events, quotations from one or more brokers, Treasury spreads, yields, maturities and ratings, or may use a pricing matrix or other fair value methods or techniques to provide an estimated value of the security or instrument. A pricing matrix is a means of valuing a debt security on the basis of current market prices for other debt securities, historical trading patterns in the market for fixed-income securities and/or other factors. Non-U.S. debt securities that are listed on an exchange will be valued at the bid price obtained from an independent third party pricing service. When independent third party pricing services are unable to supply prices, or when prices or market quotations are considered to be unreliable, the value of that security may be determined using quotations from one or more broker-dealers. |
| Securities for which independent pricing services or broker-dealers are unable to supply prices or for which market prices and/or quotations are not readily available or are considered to be unreliable are valued by a fair valuation team comprised of certain personnel of the Adviser. Effective September 8, 2022, the Adviser is designated as the valuation designee for the Portfolio pursuant to Rule 2a-5 under the 1940 Act. The Adviser’s fair valuation team is responsible for monitoring developments that may impact fair valued securities. | |
| Inputs used when applying fair value methods to value a security may include credit ratings, the financial condition of the company, current market conditions and comparable securities. The Adviser may use fair value methods if it is determined that a significant event has occurred after the close of the exchange or market on which the security trades and prior to the determination of the Portfolio’s net asset value. Examples of a significant event might include political or economic news, corporate restructurings, natural disasters, terrorist activity or trading halts. Thus, the valuation of the Portfolio’s securities may differ significantly from exchange prices, and such differences could be material. | |
| B. | Investment Income and Transactions |
| Interest income, including interest on income-bearing cash accounts, is recorded on the accrual basis. Dividend and interest income are reported net of unrecoverable foreign taxes withheld at the applicable country rates and net of income accrued on defaulted securities. | |
| Interest and dividend income payable by delivery of additional shares is reclassified as PIK (payment-in-kind) income upon receipt and is included in interest and dividend income, respectively. | |
| Security transactions are recorded as of trade date. Gains and losses on sales of investments are calculated on the identified cost method for both financial reporting and federal income tax purposes. | |
| The Portfolio makes a daily allocation of its net investment income and realized and unrealized gains and losses from securities to its investors in proportion to their investment in the Portfolio. | |
| C. | Federal Income Taxes |
| The Portfolio is classified as a partnership for federal income tax purposes. As such, each investor in the Portfolio is treated as the owner of its proportionate share of the net assets, income, expenses and realized and unrealized gains and losses of the Portfolio. Therefore, no federal income tax provision is required. It is intended that the |
| Portfolio’s assets will be managed so an investor in the Portfolio can satisfy the requirements of Subchapter M of the Internal Revenue Code. | |
| Management has analyzed the Portfolio’s tax positions taken on income tax returns for all open tax years and has concluded no provision for income tax is required in the Portfolio’s financial statements. The Portfolio’s federal and state income and federal excise tax returns for tax years for which the applicable statutes of limitations have not expired are subject to examination by the Internal Revenue Service and state departments of revenue. | |
| D. | Risks |
| The value of securities held by the Portfolio may go up or down, sometimes rapidly or unpredictably, due to general market conditions, such as real or perceived adverse economic, political or regulatory conditions, recessions, the spread of infectious illness or other public health issues, inflation, changes in interest rates, armed conflict including Russia's military invasion of Ukraine, sanctions against Russia, other nations or individuals or companies and possible countermeasures, lack of liquidity in the bond markets or adverse investor sentiment. In the past several years, financial markets have experienced increased volatility, depressed valuations, decreased liquidity and heightened uncertainty. These conditions may continue, recur, worsen or spread. Recently, inflation and interest rates have increased and may rise further. These circumstances could adversely affect the value and liquidity of the Portfolio's investments, impair the Portfolio's ability to satisfy redemption requests, and negatively impact the Portfolio's performance. Raising the ceiling on U.S. government debt has become increasingly politicized. Any failure to increase the ceiling on U.S. government debt could lead to a default on U.S. government obligations, with unpredictable consequences for economies and markets. | |
| The global pandemic of the novel coronavirus respiratory disease designated COVID-19 has resulted in major disruption to economies and markets around the world, including the United States. Global financial markets have experienced extreme volatility and severe losses, and trading in many instruments has been disrupted. Liquidity for many instruments has been greatly reduced for periods of time. Some sectors of the economy and individual issuers have experienced particularly large losses. These circumstances may continue to affect adversely the value and liquidity of the Portfolio’s investments. Following Russia’s invasion of Ukraine, Russian securities have lost all, or nearly all, their |
| market value. Other securities or markets could be similarly affected by past or future political, geopolitical or other events or conditions. | |
| Governments and central banks, including the U.S. Federal Reserve, have taken extraordinary and unprecedented actions to support local and global economies and the financial markets. These actions have resulted in significant expansion of public debt, including in the U.S. The consequences of high public debt, including its future impact on the economy and securities markets, may not be known for some time. | |
| The U.S. and other countries are periodically involved in disputes over trade and other matters, which may result in tariffs, investment restrictions and adverse impacts on affected companies and securities. For example, the U.S. has imposed tariffs and other trade barriers on Chinese exports, has restricted sales of certain categories of goods to China, and has established barriers to investments in China. Trade disputes may adversely affect the economies of the U.S. and its trading partners, as well as companies directly or indirectly affected and financial markets generally. If the political climate between the U.S. and China does not improve or continues to deteriorate, if China were to attempt unification of Taiwan by force, or if other geopolitical conflicts develop or get worse, economies, markets and individual securities may be severely affected both regionally and globally, and the value of the Portfolio's assets may go down. | |
| At times, the Portfolio’s investments may represent industries or industry sectors that are interrelated or have common risks, making the Portfolio more susceptible to any economic, political, or regulatory developments or other risks affecting those industries and sectors. | |
| The municipal bond market can be susceptible to unusual volatility, particularly for lower-rated and unrated securities. Liquidity can be reduced unpredictably in response to overall economic conditions or credit tightening. Municipal issuers may be adversely affected by rising health care costs, increasing unfunded pension liabilities, and by the phasing out of federal programs providing financial support. Unfavorable conditions and developments relating to projects financed with municipal securities can result in lower revenues to issuers of municipal securities, potentially resulting in defaults. Issuers often depend on revenues from these projects to make principal and interest payments. The value of municipal securities can also be adversely affected by changes in the financial condition of one or more individual municipal issuers or insurers of municipal issuers, regulatory and political developments, tax law changes or other legislative actions, and by uncertainties and public perceptions concerning these and other factors. |
| Municipal securities may be more susceptible to downgrades or defaults during recessions or similar periods of economic stress. Financial difficulties of municipal issuers may continue or get worse, particularly in the event of political, economic or market turmoil or a recession. To the extent the Portfolio invests significantly in a single state (including California, Illinois, New York and Indiana), city, territory (including Puerto Rico), or region, or in securities the payments on which are dependent upon a single project or source of revenues, or that relate to a sector or industry, including health care facilities, education, transportation, special revenues and pollution control, the Portfolio will be more susceptible to associated risks and developments. | |
| The Portfolio invests in below-investment-grade (high-yield) debt securities and preferred stocks. Some of these high-yield securities may be convertible into equity securities of the issuer. Debt securities rated below-investment-grade are commonly referred to as “junk bonds” and are considered speculative with respect to the issuer's capacity to pay interest and repay principal. These securities involve greater risk of loss, are subject to greater price volatility, and may be less liquid and more difficult to value, especially during periods of economic uncertainty or change, than higher rated debt securities. | |
| The market prices of the Portfolio's fixed income securities may fluctuate significantly when interest rates change. The value of your investment will generally go down when interest rates rise. A rise in rates tends to have a greater impact on the prices of longer term or duration securities. For example, if interest rates increase by 1%, the value of a Portfolio's portfolio with a portfolio duration of ten years would be expected to decrease by 10%, all other things being equal. In recent years interest rates and credit spreads in the U.S. have been at historic lows. The U.S. Federal Reserve has raised certain interest rates, and interest rates may continue to go up. A general rise in interest rates could adversely affect the price and liquidity of fixed income securities. The maturity of a security may be significantly longer than its effective duration. A security's maturity and other features may be more relevant than its effective duration in determining the security's sensitivity to other factors affecting the issuer or markets generally, such as changes in credit quality or in the yield premium that the market may establish for certain types of securities (sometimes called "credit spread"). In general, the longer its maturity the more a security may be susceptible to these factors. When the credit spread for a fixed income security goes up, or "widens," the value of the security will generally go down. | |
| If an issuer or guarantor of a security held by the Portfolio or a counterparty to a financial contract with the Portfolio defaults on its |
| obligation to pay principal and/or interest, has its credit rating downgraded or is perceived to be less creditworthy, or the credit quality or value of any underlying assets declines, the value of your investment will typically decline. Changes in actual or perceived creditworthiness may occur quickly. The Portfolio could be delayed or hindered in its enforcement of rights against an issuer, guarantor or counterparty. | |
| The Portfolio’s investments, payment obligations and financing terms may be based on floating rates, such as LIBOR (London Interbank Offered Rate) or SOFR (Secured Overnight Financing Rate). ICE Benchmark Administration, the administrator of LIBOR, ceased publication of most LIBOR settings on a representative basis at the end of 2021 and is expected to cease publication of a majority of U.S. dollar LIBOR settings on a representative basis after June 30, 2023. In addition, global regulators have announced that, with limited exceptions, no new LIBOR-based contracts should be entered into after 2021. Actions by regulators have resulted in the establishment of alternative reference rates to LIBOR in most major currencies. Markets are developing in response to these new rates, but questions around liquidity in these rates and how to appropriately adjust these rates to eliminate any economic value transfer at the time of transition remain a significant concern. The effect of any changes to - or discontinuation of - LIBOR on the Portfolio will vary depending on, among other things, existing fallback provisions in individual contracts and whether, how, and when industry participants develop and widely adopt new reference rates and fallbacks for both legacy and new products and instruments. The transition process may involve, among other things, increased volatility or illiquidity in markets for instruments that rely on LIBOR. The transition may also result in a reduction in the value of certain LIBOR-based investments held by the Portfolio or reduce the effectiveness of related transactions such as hedges. Any such effects of the transition away from LIBOR, as well as other unforeseen effects, could result in losses for the Portfolio. Because the usefulness of LIBOR as a benchmark may deteriorate during the transition period, these effects could occur at any time. | |
| With the increased use of technologies such as the Internet to conduct business, the Portfolio is susceptible to operational, information security and related risks. While the Portfolio’s Adviser has established business continuity plans in the event of, and risk management systems to prevent, limit or mitigate, such cyber-attacks, there are inherent limitations in such plans and systems, including the possibility that certain risks have not been identified. Furthermore, the Portfolio cannot control the cybersecurity plans and systems put in place by service |
| providers to the Portfolio such as the Portfolio’s custodian and accounting agent, and the Portfolio’s transfer agent. In addition, many beneficial owners of Portfolio shares hold them through accounts at broker-dealers, retirement platforms and other financial market participants over which neither the Portfolio nor the Adviser exercises control. Each of these may in turn rely on service providers to them, which are also subject to the risk of cyber-attacks. Cybersecurity failures or breaches at the Adviser or the Portfolio’s service providers or intermediaries have the ability to cause disruptions and impact business operations, potentially resulting in financial losses, interference with the Portfolio’s ability to calculate its net asset value, impediments to trading, the inability of investors in the Portfolio to purchase or withdraw interests in the Portfolio, loss of or unauthorized access to private investor information and violations of applicable privacy and other laws, regulatory fines, penalties, reputational damage, or additional compliance costs. Such costs and losses may not be covered under any insurance. In addition, maintaining vigilance against cyber-attacks may involve substantial costs over time, and system enhancements may themselves be subject to cyber-attacks. | |
| The Portfolio’s registration statement on Form N-1A contains unaudited information regarding the Portfolio’s principal risks. Please refer to that document when considering the Portfolio’s principal risks. | |
| E. | Restricted Securities |
| Restricted Securities are subject to legal or contractual restrictions on resale. Restricted securities generally are resold in transactions exempt from registration under the Securities Act of 1933. Private placement securities are generally considered to be restricted except for those securities traded between qualified institutional investors under the provisions of Rule 144A of the Securities Act of 1933. | |
| Disposal of restricted investments may involve negotiations and expenses, and prompt sale at an acceptable price may be difficult to achieve. Restricted investments held by the Portfolio at February 28, 2023 are listed in the Schedule of Investments. |
Chief Executive Officer
and Chief Financial and
Accounting Officer
Chief Legal Officer
Amundi Asset Management US, Inc.
The Bank of New York Mellon Corporation
Ernst & Young LLP
Amundi Distributor US, Inc.
Morgan, Lewis & Bockius LLP
BNY Mellon Investment Servicing (US) Inc.
60 State Street
Boston, MA 02109
ITEM 2. CODE OF ETHICS.
(a) Disclose whether, as of the end of the period covered by the report, the registrant has adopted a code of ethics that applies to the registrant’s principal executive officer, principal financial officer, principal accounting officer or controller, or persons performing similar functions, regardless of whether these individuals are employed by the registrant or a third party. If the registrant has not adopted such a code of ethics, explain why it has not done so.
The registrant has adopted, as of the end of the period covered by this report, a code of ethics that applies to the registrant’s principal executive officer, principal financial officer, principal accounting officer and controller.
(b) For purposes of this Item, the term “code of ethics” means written standards that are reasonably designed to deter wrongdoing and to promote:
(1) Honest and ethical conduct, including the ethical handling of actual or apparent conflicts of interest between personal and professional relationships;
(2) Full, fair, accurate, timely, and understandable disclosure in reports and documents that a registrant files with, or submits to, the Commission and in other public communications made by the registrant;
(3) Compliance with applicable governmental laws, rules, and regulations;
(4) The prompt internal reporting of violations of the code to an appropriate person or persons identified in the code; and
(5) Accountability for adherence to the code.
(c) The registrant must briefly describe the nature of any amendment, during the period covered by the report, to a provision of its code of ethics that applies to the registrant’s principal executive officer, principal financial officer, principal accounting officer or controller, or persons performing similar functions, regardless of whether these individuals are employed by the registrant or a third party, and that relates to any element of the code of ethics definition enumerated in paragraph (b) of this Item. The registrant must file a copy of any such amendment as an exhibit pursuant to Item 10(a), unless the registrant has elected to satisfy paragraph (f) of this Item by posting its code of ethics on its website pursuant to paragraph (f)(2) of this Item, or by undertaking to provide its code of ethics to any person without charge, upon request, pursuant to paragraph (f)(3) of this Item.
The registrant has made no amendments to the code of ethics during the period covered by this report.
(d) If the registrant has, during the period covered by the report, granted a waiver, including an implicit waiver, from a provision of the code of ethics to the registrant’s principal executive officer, principal financial officer, principal accounting officer or controller, or persons performing similar functions, regardless of whether these individuals are employed by the registrant or a third party, that relates to one or more of the items set forth in paragraph (b) of this Item, the registrant must briefly describe the nature of the waiver, the name of the person to whom the waiver was granted, and the date of the waiver.
Not applicable.
(e) If the registrant intends to satisfy the disclosure requirement under paragraph (c) or (d) of this Item regarding an amendment to, or a waiver from, a provision of its code of ethics that applies to the registrant’s principal executive officer, principal financial officer, principal accounting officer or controller, or persons performing similar functions and that relates to any element of the code of ethics definition enumerated in paragraph (b) of this Item by posting such information on its Internet website, disclose the registrant’s Internet address and such intention.
Not applicable.
(f) The registrant must:
(1) File with the Commission, pursuant to Item 12(a)(1), a copy of its code of ethics that applies to the registrant’s principal executive officer, principal financial officer, principal accounting officer or controller, or persons performing similar functions, as an exhibit to its annual report on this Form N-CSR (see attachment);
(2) Post the text of such code of ethics on its Internet website and disclose, in its most recent report on this Form N-CSR, its Internet address and the fact that it has posted such code of ethics on its Internet website; or
(3) Undertake in its most recent report on this Form N-CSR to provide to any person without charge, upon request, a copy of such code of ethics and explain the manner in which such request may be made. See Item 10(2)
ITEM 3. AUDIT COMMITTEE FINANCIAL EXPERT.
(a) (1) Disclose that the registrant’s Board of Trustees has determined that the registrant either:
(i) Has at least one audit committee financial expert serving on its audit committee; or
(ii) Does not have an audit committee financial expert serving on its audit committee.
The registrant’s Board of Trustees has determined that the registrant has at least one audit committee financial expert.
(2) If the registrant provides the disclosure required by paragraph (a)(1)(i) of this Item, it must disclose the name of the audit committee financial expert and whether that person is “independent.” In order to be considered “independent” for purposes of this Item, a member of an audit committee may not, other than in his or her capacity as a member of the audit committee, the Board of Trustees, or any other board committee:
(i) Accept directly or indirectly any consulting, advisory, or other compensatory fee from the issuer; or
(ii) Be an “interested person” of the investment company as defined in Section 2(a)(19) of the Act (15 U.S.C. 80a-2(a)(19)).
Mr. Fred J. Ricciardi, an independent Trustee, is such an audit committee financial expert.
(3) If the registrant provides the disclosure required by paragraph (a)(1) (ii) of this Item, it must explain why it does not have an audit committee financial expert.
Not applicable.
ITEM 4. PRINCIPAL ACCOUNTANT FEES AND SERVICES.
(a) Disclose, under the caption AUDIT FEES, the aggregate fees billed for each of the last two fiscal years for professional services rendered by the principal accountant for the audit of the registrant’s annual financial statements or services that are normally provided by the accountant in connection with statutory and regulatory filings or engagements for those fiscal years.
N/A
(b) Disclose, under the caption AUDIT-RELATED FEES, the aggregate fees billed in each of the last two fiscal years for assurance and related services by the principal accountant that are reasonably related to the performance of the audit of the registrant’s financial statements and are not reported under paragraph (a) of this Item. Registrants shall describe the nature of the services comprising the fees disclosed under this category.
N/A
(c) Disclose, under the caption TAX FEES, the aggregate fees billed in each of the last two fiscal years for professional services rendered by the principal accountant for tax compliance, tax advice, and tax planning. Registrants shall describe the nature of the services comprising the fees disclosed under this category.
N/A
(d) Disclose, under the caption ALL OTHER FEES, the aggregate fees billed in each of the last two fiscal years for products and services provided by the principal accountant, other than the services reported in paragraphs (a) through (c) of this Item. Registrants shall describe the nature of the services comprising the fees disclosed under this category.
N/A
(e) (1) Disclose the audit committee’s pre-approval policies and procedures described in paragraph (c)(7) of Rule 2-01 of Regulation S-X.
PIONEER FUNDS
APPROVAL OF AUDIT, AUDIT-RELATED, TAX AND OTHER SERVICES
PROVIDED BY THE INDEPENDENT AUDITOR
SECTION I - POLICY PURPOSE AND APPLICABILITY
The Pioneer Funds recognize the importance of maintaining the independence of their outside auditors. Maintaining independence is a shared responsibility involving Amundi Asset Management US, Inc., the audit committee and the independent auditors.
The Funds recognize that a Fund’s independent auditors: 1) possess knowledge of the Funds, 2) are able to incorporate certain services into the scope of the audit, thereby avoiding redundant work, cost and disruption of Fund personnel and processes, and 3) have expertise that has value to the Funds. As a result, there are situations where it is desirable to use the Fund’s independent auditors for services in addition to the annual audit and where the potential for conflicts of interests are minimal. Consequently, this policy, which is intended to comply with Rule 210.2-01(C)(7), sets forth guidelines and procedures to be followed by the Funds when retaining the independent audit firm to perform audit, audit-related tax and other services under those circumstances, while also maintaining independence.
Approval of a service in accordance with this policy for a Fund shall also constitute approval for any other Fund whose pre-approval is required pursuant to Rule 210.2-01(c)(7)(ii).
In addition to the procedures set forth in this policy, any non-audit services that may be provided consistently with Rule 210.2-01 may be approved by the Audit Committee itself and any pre-approval that may be waived in accordance with Rule 210.2-01(c)(7)(i)(C) is hereby waived.
Selection of a Fund’s independent auditors and their compensation shall be determined by the Audit Committee and shall not be subject to this policy.
| SECTION II—POLICY | ||||
| SERVICE CATEGORY | SERVICE CATEGORY DESCRIPTION | SPECIFIC PRE-APPROVED SERVICE SUBCATEGORIES | ||
| I. AUDIT SERVICES | Services that are directly related to performing the independent audit of the Funds | • Accounting research assistance
• SEC consultation, registration statements, and reporting | ||
• Tax accrual related matters | ||||
• Implementation of new accounting standards | ||||
• Compliance letters (e.g. rating agency letters) | ||||
• Regulatory reviews and assistance regarding financial matters | ||||
• Semi-annual reviews (if requested) | ||||
• Comfort letters for closed end offerings | ||||
| II. AUDIT-RELATED SERVICES | Services which are not prohibited under Rule 210.2-01(C)(4) (the “Rule”) and are related extensions of the audit services support the audit, or use the knowledge/expertise gained from the audit procedures as a foundation to complete the project. In most cases, if the Audit-Related Services are not performed by the Audit firm, the scope of the Audit Services would likely increase. The Services are typically well-defined and governed by accounting professional standards (AICPA, SEC, etc.) | • AICPA attest and agreed-upon procedures
• Technology control assessments
• Financial reporting control assessments
• Enterprise security architecture assessment | ||
| AUDIT COMMITTEE APPROVAL POLICY | AUDIT COMMITTEE REPORTING POLICY | |
• “One-time” pre-approval for the audit period for all pre-approved specific service subcategories. Approval of the independent auditors as auditors for a Fund shall constitute pre approval for these services. | • A summary of all such services and related fees reported at each regularly scheduled Audit Committee meeting. | |
• “One-time” pre-approval for the fund fiscal year within a specified dollar limit for all pre-approved specific service subcategories | �� | • A summary of all such services and related fees (including comparison to specified dollar limits) reported quarterly. |
• Specific approval is needed to exceed the pre-approved dollar limit for these services (see general Audit Committee approval policy below for details on obtaining specific approvals)
• Specific approval is needed to use the Fund’s auditors for Audit-Related Services not denoted as “pre-approved”, or to add a specific service subcategory as “pre-approved” |
SECTION III - POLICY DETAIL, CONTINUED
| SERVICE CATEGORY | SERVICE CATEGORY DESCRIPTION | SPECIFIC PRE-APPROVED SERVICE SUBCATEGORIES | ||
| III. TAX SERVICES | Services which are not prohibited by the Rule, if an officer of the Fund determines that using the Fund’s auditor to provide these services creates significant synergy in the form of efficiency, minimized disruption, or the ability to maintain a desired level of confidentiality. | • Tax planning and support
• Tax controversy assistance
• Tax compliance, tax returns, excise tax returns and support
• Tax opinions |
AUDIT COMMITTEE APPROVAL POLICY | AUDIT COMMITTEE REPORTING POLICY | |
• “One-time” pre-approval for the fund fiscal year within a specified dollar limit | • A summary of all such services and related fees (including comparison to specified dollar limits) reported quarterly. | |
• Specific approval is needed to exceed the pre-approved dollar limits for these services (see general Audit Committee approval policy below for details on obtaining specific approvals) | ||
• Specific approval is needed to use the Fund’s auditors for tax services not denoted as pre-approved, or to add a specific service subcategory as “pre-approved” | ||
SECTION III - POLICY DETAIL, CONTINUED
| SERVICE CATEGORY | SERVICE CATEGORY DESCRIPTION | SPECIFIC PRE-APPROVED SERVICE SUBCATEGORIES | ||
IV. OTHER SERVICES
A. SYNERGISTIC, UNIQUE QUALIFICATIONS | Services which are not prohibited by the Rule, if an officer of the Fund determines that using the Fund’s auditor to provide these services creates significant synergy in the form of efficiency, minimized disruption, the ability to maintain a desired level of confidentiality, or where the Fund’s auditors posses unique or superior qualifications to provide these services, resulting in superior value and results for the Fund. | • Business Risk Management support
• Other control and regulatory compliance projects | ||
AUDIT COMMITTEE APPROVAL POLICY | AUDIT COMMITTEE REPORTING POLICY | |
• “One-time” pre-approval for the fund fiscal year within a specified dollar limit | • A summary of all such services and related fees (including comparison to specified dollar limits) reported quarterly. | |
• Specific approval is needed to exceed the pre-approved dollar limits for these services (see general Audit Committee approval policy below for details on obtaining specific approvals) | ||
• Specific approval is needed to use the Fund’s auditors for “Synergistic” or “Unique Qualifications” Other Services not denoted as pre-approved to the left, or to add a specific service subcategory as “pre-approved” | ||
SECTION III - POLICY DETAIL, CONTINUED
| SERVICE CATEGORY | SERVICE CATEGORY DESCRIPTION | SPECIFIC PROHIBITED SERVICE SUBCATEGORIES | ||
| PROHIBITED SERVICES | Services which result in the auditors losing independence status under the Rule. | 1. Bookkeeping or other services related to the accounting records or financial statements of the audit client* | ||
| 2. Financial information systems design and implementation* | ||||
| 3. Appraisal or valuation services, fairness* opinions, or contribution-in-kind reports | ||||
| 4. Actuarial services (i.e., setting actuarial reserves versus actuarial audit work)* | ||||
| 5. Internal audit outsourcing services* | ||||
| 6. Management functions or human resources | ||||
| 7. Broker or dealer, investment advisor, or investment banking services | ||||
| 8. Legal services and expert services unrelated to the audit | ||||
| 9. Any other service that the Public Company Accounting Oversight Board determines, by regulation, is impermissible | ||||
| AUDIT COMMITTEE APPROVAL POLICY | AUDIT COMMITTEE REPORTING POLICY | |
• These services are not to be performed with the exception of the(*) services that may be permitted if they would not be subject to audit procedures at the audit client (as defined in rule 2-01(f)(4)) level the firm providing the service. | • A summary of all services and related fees reported at each regularly scheduled Audit Committee meeting will serve as continual confirmation that has not provided any restricted services. |
GENERAL AUDIT COMMITTEE APPROVAL POLICY:
| • | For all projects, the officers of the Funds and the Fund’s auditors will each make an assessment to determine that any proposed projects will not impair independence. |
| • | Potential services will be classified into the four non-restricted service categories and the “Approval of Audit, Audit-Related, Tax and Other Services” Policy above will be applied. Any services outside the specific pre-approved service subcategories set forth above must be specifically approved by the Audit Committee. |
| • | At least quarterly, the Audit Committee shall review a report summarizing the services by service category, including fees, provided by the Audit firm as set forth in the above policy. |
(2) Disclose the percentage of services described in each of paragraphs (b) through (d) of this Item that were approved by the audit committee pursuant to paragraph (c)(7)(i)(C) of Rule 2-01 of Regulation S-X.
Non-Audit Services
N/A
(f) If greater than 50 percent, disclose the percentage of hours expended on the principal accountants engagement to audit the registrant’s financial statements for the most recent fiscal year that were attributed to work performed by persons other than the principal accountant’s full-time, permanent employees.
N/A
(g) Disclose the aggregate non-audit fees billed by the registrants accountant for services rendered to the registrant, and rendered to the registrants investment adviser (not including any sub-adviser whose role is primarily portfolio management and is subcontracted with or overseen by another investment adviser), and any entity controlling, controlled by, or under common control with the adviser that provides ongoing services to the registrant for each of the last two fiscal years of the registrant.
N/A
(h) Disclose whether the registrants audit committee of the Board of Trustees has considered whether the provision of non-audit services that were rendered to the registrants investment adviser (not including any subadviser whose role is primarily portfolio management and is subcontracted with or overseen by another investment adviser), and any entity controlling, controlled by, or under common control with the investment adviser that provides ongoing services to the registrant that were not pre-approved pursuant to paragraph (c)(7)(ii) of Rule 2-01 of Regulation S-X is compatible with maintaining the principal accountant’s independence.
The Fund’s audit committee of the Board of Trustees has considered whether the provision of non-audit services that were rendered to the Affiliates (as defined) that were not pre- approved pursuant to paragraph (c)(7)(ii) of Rule 2-01 of Regulation S-X is compatible with maintaining the principal accountant’s independence.
ITEM 5. AUDIT COMMITTEE OF LISTED REGISTRANTS
(a) If the registrant is a listed issuer as defined in Rule 10A-3 under the Exchange Act (17 CFR 240.10A-3), state whether or not the registrant has a separately-designated standing audit committee established in accordance with Section 3(a)(58)(A) of the Exchange Act (15 U.S.C. 78c(a)(58)(A)). If the registrant has such a committee, however designated, identify each committee member. If the entire board of directors is acting as the registrant’s audit committee as specified in Section 3(a)(58)(B) of the Exchange Act (15 U.S.C. 78c(a)(58)(B)), so state.
N/A
(b) If applicable, provide the disclosure required by Rule 10A-3(d) under the Exchange Act (17 CFR 240.10A-3(d)) regarding an exemption from the listing standards for audit committees.
N/A
ITEM 6. SCHEDULE OF INVESTMENTS.
File Schedule of Investments in securities of unaffiliated issuers as of the close of the reporting period as set forth in 210.1212 of Regulation S-X [17 CFR 210.12-12], unless the schedule is included as part of the report to shareholders filed under Item 1 of this Form.
Included in Item 1
ITEM 7. DISCLOSURE OF PROXY VOTING POLICIES AND PROCEDURES FOR CLOSED-END MANAGEMENT INVESTMENT COMPANIES.
A closed-end management investment company that is filing an annual report on this Form N-CSR must, unless it invests exclusively in non-voting securities, describe the policies and procedures that it uses to determine how to vote proxies relating to portfolio securities, including the procedures that the company uses when a vote presents a conflict between the interests of its shareholders, on the one hand, and those of the company’s investment adviser; principal underwriter; or any affiliated person (as defined in Section 2(a)(3) of the Investment Company Act of 1940 (15 U.S.C. 80a-2(a)(3)) and the rules thereunder) of the company, its investment adviser, or its principal underwriter, on the other. Include any policies and procedures of the company’s investment adviser, or any other third party, that the company uses, or that are used on the company’s behalf, to determine how to vote proxies relating to portfolio securities.
Not applicable to open-end management investment companies.
ITEM 8. PORTFOLIO MANAGERS OF CLOSED-END MANAGEMENT INVESTMENT COMPANIES.
(a) If the registrant is a closed-end management investment company that is filing an annual report on this Form N-CSR, provide the following information:
(1) State the name, title, and length of service of the person or persons employed by or associated with the registrant or an investment adviser of the registrant who are primarily responsible for the day-to-day management of the registrant’s portfolio (“Portfolio Manager”). Also state each Portfolio Manager’s business experience during the past 5 years.
Not applicable to open-end management investment companies.
ITEM 9. PURCHASES OF EQUITY SECURITIES BY CLOSED-END MANAGEMENT INVESTMENT COMPANY AND AFFILIATED PURCHASERS.
(a) If the registrant is a closed-end management investment company, in the following tabular format, provide the information specified in paragraph (b) of this Item with respect to any purchase made by or on behalf of the registrant or any affiliated purchaser, as defined in Rule 10b-18(a)(3) under the Exchange Act (17 CFR 240.10b-18(a)(3)), of shares or other units of any class of the registrant’s equity securities that is registered by the registrant pursuant to Section 12 of the Exchange Act (15 U.S.C. 781).
Not applicable to open-end management investment companies.
ITEM 10. SUBMISSION OF MATTERS TO A VOTE OF SECURITY HOLDERS.
Describe any material changes to the procedures by which shareholders may recommend nominees to the registrant’s board of directors, where those changes were implemented after the registrant last provided disclosure in response to the requirements of Item 407(c)(2)(iv) of Regulation S-R(17 CFR 229.407)(as required by Item 22(b)(15)) of Schedule 14A (17 CFR 240.14a-101), or this Item.
There have been no material changes to the procedures by which the shareholders may recommend nominees to the registrant’s board of directors since the registrant last provided disclosure in response to the requirements of Item 407(c)(2)(iv) of Regulation S-R of Schedule 14(A) in its definitive proxy statement, or this item.
ITEM 11. CONTROLS AND PROCEDURES.
(a) Disclose the conclusions of the registrant’s principal executive and principal financials officers, or persons performing similar functions, regarding the effectiveness of the registrant’s disclosure controls and procedures (as defined in Rule 30a-3(c) under the Act (17 CFR 270.30a-3(c))) as of a date within 90 days of the filing date of the report that includes the disclosure required by this paragraph, based on the evaluation of these controls and procedures required by Rule 30a-3(b) under the Act (17 CFR 270.30(a)-3(b) and Rules 13a-15(b) or 15d-15(b) under the Exchange Act (17 CFR 240.13a-15(b) or 240.15d-15(b)).
The registrant’s principal executive officer and principal financial officer have concluded that the registrant’s disclosure controls and procedures are effective based on the evaluation of these controls and procedures as of a date within 90 days of the filing date of this report.
(b) Disclose any change in the registrant’s internal control over financial reporting (as defined in Rule 30a-3(d) under the Act (17CFR 270.30a-3(d)) that occurred during the period covered by this report that has materially affected, or is reasonably likely to materially affect, the registrant’s internal control over financial reporting.
There were no significant changes in the registrant’s internal control over financial reporting that occurred during the period covered by this report that have materially affected, or are reasonably likely to materially affect, the registrant’s internal control over financial reporting.
Item 12. Disclosure of Securities Lending Activities for Closed-End Management Investment Companies.
(a) If the registrant is a closed-end management investment company, provide the following dollar amounts of income and compensation related to the securities lending activities of the registrant during its most recent fiscal year:
N/A
(1) Gross income from securities lending activities;
N/A
(2) All fees and/or compensation for each of the following securities lending activities and related services: any share of revenue generated by the securities lending program paid to the securities lending agent(s) (revenue split); fees paid for cash collateral management services (including fees deducted from a pooled cash collateral reinvestment vehicle) that are not included in the revenue split; administrative fees that are not included in the revenue split; fees for indemnification that are not included in the revenue split; rebates paid to borrowers; and any other fees relating to the securities lending program that are not included in the revenue split, including a description of those other fees;
N/A
(3) The aggregate fees/compensation disclosed pursuant to paragraph (2); and
N/A
(4) Net income from securities lending activities (i.e., the dollar amount in paragraph (1) minus the dollar amount in paragraph (3)).
If a fee for a service is included in the revenue split, state that the fee is included in the revenue split.
N/A
(b) If the registrant is a closed-end management investment company, describe the services provided to the registrant by the securities lending agent in the registrants most recent fiscal year.
N/A
ITEM 13. EXHIBITS.
(a) File the exhibits listed below as part of this Form. Letter or number the exhibits in the sequence indicated.
SIGNATURES
[See General Instruction F]
Pursuant to the requirements of the Securities Exchange Act of 1934 and the Investment Company Act of 1940, the registrant has duly caused this report to be signed on its behalf by the undersigned, thereunto duly authorized.
(Registrant) Pioneer Core Trust I
By (Signature and Title)* /s/ Lisa M. Jones
Lisa M. Jones, President and Chief Executive Officer
Date May 3, 2023
Pursuant to the requirements of the Securities Exchange Act of 1934 and the Investment Company Act of 1940, this report has been signed below by the following persons on behalf of the registrant and in the capacities and on the dates indicated.
By (Signature and Title)* /s/ Lisa M. Jones
Lisa M. Jones, President and Chief Executive Officer
Date May 3, 2023
By (Signature and Title)* /s/ Anthony J. Koenig, Jr.
Anthony J. Koenig, Jr., Managing Director, Chief Operations Officer & Treasurer of the Funds
Date May 3, 2023
| * | Print the name and title of each signing officer under his or her signature. |