UNITED STATES
SECURITIES AND EXCHANGE COMMISSION
Washington, D.C. 20549
FORM N-CSR
CERTIFIED SHAREHOLDER REPORT OF REGISTERED
MANAGEMENT INVESTMENT COMPANIES
Investment Company Act file number 811-23613
(Pioneer Core Trust I)
(Exact name of registrant as specified in charter)
60 State Street, Boston, MA 02109
(Address of principal executive offices) (ZIP code)
Terrence J. Cullen, Amundi Pioneer Asset Management, Inc.,
60 State Street, Boston, MA 02109
(Name and address of agent for service)
Registrant’s telephone number, including area code: (617) 742-7825
Date of fiscal year end: August 31, 2021
Date of reporting period: September 1, 2020 through February 28, 2021
Form N-CSR is to be used by management investment companies to file reports with the Commission not later than 10 days after the transmission to stockholders of any report that is required to be transmitted to stockholders under Rule 30e-1 under the Investment Company Act of 1940 (17 CFR 270.30e-1). The Commission may use the information provided on Form N-CSR in its regulatory, disclosure review, inspection, and policymaking roles.
A registrant is required to disclose the information specified by Form N-CSR, and the Commission will make this information public. A registrant is not required to respond to the collection of information contained in Form N-CSR unless the Form displays a currently valid Office of Management and Budget (“OMB”) control number. Please direct comments concerning the accuracy of the information collection burden estimate and any suggestions for reducing the burden to Secretary, Securities and Exchange Commission, 450 Fifth Street, NW, Washington, DC 20549-0609. The OMB has reviewed this collection of information under the clearance requirements of 44 U.S.C. ss. 3507.
Pioneer High Income
Municipal Fund
Semiannual Report | February 28, 2021
| A: PIMAX | C: HICMX | Y: HIMYX |
Paper copies of the Fund’s shareholder reports are no longer sent by mail, unless you specifically request paper copies of the reports from the Fund or from your financial intermediary, such as a broker-dealer, bank or insurance company. Instead, the reports are available on the Fund’s website, and you will be notified by mail each time a report is posted and provided with a website link to access the report.
You may elect to receive all future reports in paper free of charge. If you invest directly with the Fund, you can inform the Fund that you wish to continue receiving paper copies of your shareholder reports by calling 1-800-225-6292. If you invest through a financial intermediary, you can contact your financial intermediary to request that you continue to receive paper copies of your shareholder reports. Your election to receive reports in paper will apply to all funds held in your account if you invest through your financial intermediary or all funds held within the Pioneer Fund complex if you invest directly.
visit us: www.amundi.com/us
Table of Contents | |
| 2 | |
| 4 | |
| 10 | |
| 12 | |
| 13 | |
| 16 | |
| 18 | |
| 25 | |
| 34 | |
| Pioneer High Income Municipal Portfolio | |
| 40 | |
| 57 | |
| 61 | |
| 69 | |
| 72 |
Pioneer High Income Municipal Fund | Semiannual Report | 2/28/21 1
The first quarter of 2021 has brought some better news on the COVID-19 global pandemic front, as the deployment of the first approved COVID-19 vaccines is well underway, with expectations for widespread vaccine distribution by the middle of the year. In general, COVID-19 cases and related hospitalizations have been on the decline in the US, despite a few problematic “hot spots” in some states, and that has had a positive effect on overall market sentiment.
While there may finally be a light visible at the end of the pandemic tunnel, the long-term impact on the global economy from COVID-19, while currently unknown, is likely to be considerable. It is clear that several industries have already felt greater effects than others, and the markets, which do not thrive on uncertainty, have been volatile. With that said, in the first few months of 2021, equity markets and other so-called “riskier” assets, such as high-yield bonds, have outperformed investments regarded as less risky, such as government debt. In addition, we’ve witnessed the long-awaited rebound in the performance of cyclical stocks, or stocks of companies with greater exposure to the ebbs and flows of the economic cycle, as investors have appeared to embrace the potential for a more widespread reopening of the economy in the coming months. Additional fiscal stimulus from the US government in recent months has also helped provide some market momentum.
However, despite the dramatic market rebound since its March 2020 low point, volatility has remained elevated, with momentum rising and falling on seemingly every bit of positive or negative news about the virus. In addition, the recent US Presidential and Congressional elections have resulted in a power shift in Washington, DC, and that most likely portends some changes in fiscal policy above and beyond just additional pandemic-related stimulus. That, too, could lead to increased market volatility as investors analyze the various tax and spending plans, and wait to see what proposed policy alterations actually become law.
With the advent of COVID-19 in early 2020, we implemented our business continuity plan according to the new COVID-19 guidelines, and most of our employees have been working remotely since March 2020. To date, our operating environment has faced no interruption. I am proud of the careful planning that has taken place and confident we can maintain this environment for as long as is prudent. History in the making for a company that first opened its doors way back in 1928.
2 Pioneer High Income Municipal Fund | Semiannual Report | 2/28/21
Since 1928, Amundi US’s investment process has been built on a foundation of fundamental research and active management, principles which have guided our investment decisions for more than 90 years. We believe active management – that is, making active investment decisions – can help mitigate the risks during periods of market volatility. As 2020 has reminded us, investment risk can arise from a number of factors in today’s global economy, including slower or stagnating growth, changing U.S. Federal Reserve policy, oil price shocks, political and geopolitical factors and, unfortunately, major public health concerns such as a viral pandemic.
At Amundi US, active management begins with our own fundamental, bottom-up research process. Our team of dedicated research analysts and portfolio managers analyzes each security under consideration, communicating directly with the management teams of the companies issuing the securities and working together to identify those securities that best meet our investment criteria for our family of funds. Our risk management approach begins with each and every security, as we strive to carefully understand the potential opportunity, while considering any and all risk factors.
Today, as investors, we have many options. It is our view that active management can serve shareholders well, not only when markets are thriving, but also during periods of market stress.
As you consider your long-term investment goals, we encourage you to work with your financial professional to develop an investment plan that paves the way for you to pursue both your short-term and long-term goals.
We remain confident that the current crisis, like others in human history, will pass, and we greatly appreciate the trust you have placed in us and look forward to continuing to serve you in the future.
Sincerely,

Head of the Americas, President and CEO of US
Amundi Asset Management US, Inc.
April 2021
Any information in this shareowner report regarding market or economic trends or the factors influencing the Fund’s historical or future performance are statements of opinion as of the date of this report. Past performance is no guarantee of future results.
Pioneer High Income Municipal Fund | Semiannual Report | 2/28/21 3
Municipal bonds performed positively during the six-month period ended February 28, 2021, as the US economy gradually began to recover from the disruptive effects of the COVID-19 pandemic. In the following interview, Jonathan Chirunga and David Eurkus discuss the factors that influenced the performance of Pioneer High Income Municipal Fund during the six-month period. Mr. Chirunga, Managing Director, Director of High-Yield Municipals, and a portfolio manager at Amundi Asset Management US, Inc. (Amundi US), is responsible for the day-to-day management of the Fund, along with Mr. Eurkus, Managing Director, Director of Municipals, and a portfolio manager at Amundi US.
Q How did the Fund perform during the six-month period ended February 28, 2021?
A Pioneer High Income Municipal Fund’s Class A shares returned 3.37% at net asset value during the six-month period ended February 28, 2021, while the Fund’s benchmark, the Bloomberg Barclays US Municipal High Yield Bond Index, returned 5.67%. During the same period, the average return of the 197 mutual funds in Morningstar’s High-Yield Municipal Funds category was 4.20%.
Q How would you describe the investment environment in the municipal bond market during the six-month period ended February 28, 2021?
A For the six-month period, the investment environment for municipal bonds was largely favorable, driven by the accommodative stance on monetary policy by the US Federal Reserve (Fed), and healthy demand for tax-free bonds in a market featuring limited supply. In addition, the longer-term effects on the municipal market from the federal tax overhaul legislation passed in late 2017 continued to contribute to a positive investment landscape for municipals. As we have noted previously, the US tax overhaul law passed in 2017 has helped to boost the performance of tax-free bonds in general, given that, under the law, income earned by investors on advance-refunding bonds, formerly treated as tax-exempt, is now treated as taxable income for the investors. (An advance-refunding bond is issued to retire, or pre-refund, another outstanding bond more than 90 days in advance of the original bond’s maturity date.) The revamped tax laws have effectively removed approximately one-quarter of the prior municipal supply from the tax-exempt marketplace over the past few years, which in turn has helped to lift tax-free bond prices. In
4 Pioneer High Income Municipal Fund | Semiannual Report | 2/28/21
addition, the concurrently enacted federal limits on state and local tax deductions have significantly increased demand for municipal investments in higher-tax states.
Like most financial markets, the tax-exempt market had come under significant stress created by onset of the COVID-19 pandemic in the first quarter of 2020, as virus-mitigation efforts put into place by state and local governments caused many segments of the US economy to shut down and drove unemployment rates into territory rarely seen in recent decades. To combat the very serious economic effects from COVID-19 on individuals, states, municipalities and the United States overall, the Fed as well as Congress and the Trump administration undertook a large number of monetary and fiscal measures. In early 2020, the Fed reduced the target range of the federal funds rate to near zero, reintroduced lending facilities from the 2008 financial crisis era, instituted new lending facilities, and re-started quantitative easing (that is, injecting massive liquidity into the economy by purchasing Treasury, agency, mortgage, and corporate bonds in significant quantities). In addition, US lawmakers approved two large fiscal aid packages during the spring and early summer of 2020, in the form of loans and grants to individuals, small businesses, medical systems, and higher education institutions, in light of the sudden freeze-up in economic activity and continuously rising unemployment. Taken together, those measures helped to calm financial markets, including the municipal bond market, heading into the Fund’s semiannual reporting period.
During the six-month period, the tax-exempt bond market continued its recovery from the low points of March 2020, as domestic and global investors became aggressive purchasers of municipals. As a result, the recent yield increases reversed themselves as municipal bond prices rose. At the same time, the stunning contraction in economic activity across the country – especially within the tourism, transportation, retail, and service industries – as well as dramatic reductions in federal, state, and local tax revenues, continued to overshadow the municipal bond market. In September and October 2020, amid robust demand from buyers, the market saw a rush of tax-exempt and taxable municipal issuance in advance of the November presidential election. Near the end of the calendar year, the conclusion of the US and Congressional elections and investor optimism regarding the direction of the US economy in the wake of rollouts of the first approved COVID-19 vaccines, helped to reinforce a strong technical (supply/demand) environment for investing in longer-term municipal bonds. In addition, the default rate for municipal bonds has remained low, despite massive shutdowns by state and local
Pioneer High Income Municipal Fund | Semiannual Report | 2/28/21 5
governments during portions of 2020 in order to contain the spread of the virus, as most states had retained significant “rainy day” funds during the past decade in order to deal with periods of reduced tax collections.
During the six-month period, strong demand from traditional investors as well as by non-traditional and foreign purchasers looking for relative safety, a lower default rate and attractive tax equivalent yields versus taxable investments, helped to boost the performance of high-yield municipal bonds. The Fund’s benchmark, Bloomberg Barclays US Municipal High Yield Bond Index (the Bloomberg Barclays Index), returned 5.67% for the six-month period, outperforming the investment-grade municipal market, which returned just 0.86%, as measured by the Bloomberg Barclays Municipal Bond Index.
Q Which of your investment decisions drove the Fund’s performance relative to the Bloomberg Barclays Index during the six-month period ended February 28, 2021?
A During the six-month period, we made no significant changes to the portfolio’s sector weightings, as we continued to maintain a strong balance between holdings in tobacco bonds and the charter school sector, as well as allocations to a diverse range of other municipal sectors.
A key detractor from the Fund’s performance relative to the benchmark, especially in the fourth calendar quarter of 2020, was a continued portfolio underweight to Puerto Rico. The Fund’s allocation to Puerto Rico’s debt has remained at less than 3% of invested assets, compared to an approximately 13% weighting in the Bloomberg Barclays Index. The Commonwealth’s bonds have been benefiting from increased investor demand for high-yield municipal bonds. Due to the volume of bonds issued by Puerto Rico, they have managed to retain liquidity. That said, we anticipate keeping the Fund underweight to Puerto Rico, as we have had ongoing concerns about its debt, given the effects the COVID-19 pandemic has had on international tourism, an industry upon which the Commonwealth’s economy has been heavily reliant.
Towards the end of the six-month period, the portfolio’s tactical positions within investment-grade municipal bonds detracted from relative performance, especially in February. The Fund’s exposures to AAA-rated bonds underperformed the most. However, we believe it is prudent to maintain the Fund’s investment-grade allocations as we continue to sift through the new-deal market as well as offerings in the secondary market, due in part to our general concerns about credit quality and the relative value of many new issues.
6 Pioneer High Income Municipal Fund | Semiannual Report | 2/28/21
Security selection results for the Fund were strong within its allocation to Tobacco MSA (master settlement agreement) bonds, especially in the fourth quarter of 2020. We have typically maintained an overweight versus the benchmark to the tobacco sector in an effort to enhance the portfolio’s liquidity profile. Security selection results within charter schools also contributed positively to the Fund’s performance. Charter schools have continued to represent a significant portion of the Fund’s allocation to education bonds. Enrollments in charter schools have remained strong, and those schools have been able to manage distance-learning measures effectively throughout the pandemic situation.
With regard to individual holdings that affected the Fund’s relative performance, the largest detractors from benchmark-relative returns were holdings of California education bonds and senior living bonds issued by North Carolina. Individual bonds that contributed positively to the Fund’s relative results for the six-month period included Arkansas industrial development bonds and Ohio tobacco settlement bonds.
Q Did the Fund have any exposure to derivative securities during the six-month period ended February 28, 2021?
A No, the Fund had no material exposure to derivatives during the six-month period.
Q Did the Fund’s distributions* to shareholders change during the six-month period ended February 28, 2021?
A No. The Fund’s monthly distribution levels remained stable over the six-month period.
Q What is your investment outlook?
A Because of an apparent lack of any resurgence in US inflation, as well as the frequently repeated pronouncements from the Fed that it will continue to hold the federal funds target range at or near zero for the next several years, we are optimistic regarding the path of interest rates going forward. Additionally, in light of the continued low default rate for the municipal bond asset class and a favorable supply/demand technical environment, given ample but reasonable supply and persistently strong demand from various categories of investors, we believe that the prospects for the tax-exempt bond market are favorable. Lastly, given the enormous and continuing need for federal economic assistance of all sorts
* Distributions are not guaranteed.
Pioneer High Income Municipal Fund | Semiannual Report | 2/28/21 7
in order to cope with the effects of the COVID-19 situation, the US government may be forced to deal with its rising debt levels in part by raising taxes, particularly on wealthier taxpayers, which could further increase demand for municipal bonds.
With regard to managing the Fund, we have continued to see investment opportunities created by large investors having to sell strong credit bonds out of their portfolios to meet liquidity needs and redemption requests, particularly sales related to weak-credit purchases of bonds issued in the summer of 2017.
Consistent with our investment discipline in managing the Fund, we intend to continue to focus on intensive, fundamental research into individual bond issues, while maintaining a close watch on any economic factors that could influence the high-yield municipal market. Based on these factors, we do not anticipate making any significant changes to the portfolio’s positioning and structure in the near future.
Please refer to the Schedule of Investments on pages 40–56 for a full listing of Fund securities.
All investments are subject to risk, including the possible loss of principal. In the past several years, financial markets have experienced increased volatility and heightened uncertainty. The market prices of securities may go up or down, sometimes rapidly or unpredictably, due to general market conditions, such as real or perceived adverse economic, political, or regulatory conditions, recessions, inflation, changes in interest or currency rates, lack of liquidity in the bond markets, the spread of infectious illness or other public health issues or adverse investor sentiment. These conditions may continue, recur, worsen or spread.
Investments in high-yield or lower-rated securities are subject to greater-than-average price volatility, illiquidity and possibility of default.
When interest rates rise, the prices of fixed-income securities held by the Fund will generally fall. Conversely, when interest rates fall, the prices of fixed-income securities held by the Fund will generally rise.
Investments in the Fund are subject to possible loss due to the financial failure of issuers of underlying securities and their inability to meet their debt obligations.
Prepayment risk is the chance that an issuer may exercise its right to prepay its security, if falling interest rates prompt the issuer to do so. Forced to reinvest the unanticipated proceeds at lower interest rates, the Fund would experience a decline in income and lose the opportunity for additional price appreciation.
8 Pioneer High Income Municipal Fund | Semiannual Report | 2/28/21
The value of municipal securities can be adversely affected by changes in financial condition of municipal issuers, lower revenues, and regulatory and political developments.
The Fund may use derivatives, such as options, futures, inverse floating rate obligations, swaps, and others, which can be illiquid, may disproportionately increase losses, and have a potentially large impact on Fund performance. Derivatives may have a leveraging effect on the Fund.
A portion of income may be subject to local, state, federal, and/or alternative minimum tax. Capital gains, if any, are subject to a capital gains tax.
At times, the Fund’s investments may represent industries or industry sectors that are interrelated or have common risks, making the Fund more susceptible to any economic, political, or regulatory developments or other risks affecting those industries and sectors.
These risks may increase share price volatility.
Before investing, consider the product’s investment objectives, risks, charges and expenses. Contact your financial professional or Amundi Asset Management US, Inc., for a prospectus or summary prospectus containing this information. Read it carefully.
Any information in this shareholder report regarding market or economic trends or the factors influencing the Fund’s historical or future performance are statements of opinion as of the date of this report. Past performance is not a guarantee of future results.
Pioneer High Income Municipal Fund | Semiannual Report | 2/28/21 9
10 Pioneer High Income Municipal Fund | Semiannual Report | 2/28/21
| 10 Largest Holdings* | ||
(As a percentage of total investment)** | ||
| 1. | Buckeye Tobacco Settlement Financing Authority, 5.0%, 6/1/55 | 3.37% |
| 2. | Tobacco Settlement Financing Corp., Series B-1, 5.0%, 6/1/47 | 2.48 |
| 3. | Arkansas Development Finance Authority, Big River Steel Project, | |
4.5%, 9/1/49 (144A) | 1.95 | |
| 4. | Commonwealth of Puerto Rico, 8.0%, 7/1/35 | 1.84 |
| 5. | Northern Tobacco Securitization Corp., 5.0%, 6/1/46 | 1.84 |
| 6. | Puerto Rico Sales Tax Financing Corp. Sales Tax Revenue, 5.0%, 7/1/58 | 1.81 |
| 7. | Golden State Tobacco Securitization Corp., 5.0%, 6/1/47 | 1.78 |
| 8. | Metropolitan Pier & Exposition Authority, 5.0%, 6/15/50 | 1.63 |
| 9. | Metropolitan Pier & Exposition Authority, Mccormick Place Expansion, | |
5.0%, 6/15/57 | 1.48 | |
| 10. | City of Hammond, Custodial Receipts Cabelas Project, 7.5%, 2/1/29 (144A) | 1.40 |
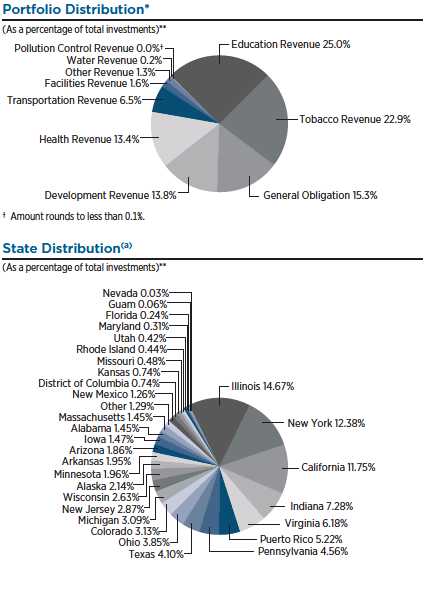
* | On December 21, 2020, the Fund began investing as a feeder fund in Pioneer High Income Municipal Portfolio (the “Portfolio”), and owns a pro rata interest in the Portfolio’s net assets. Portfolio Diversification, State Distribution and Ten Largest Holdings at February 28, 2021 are based on the holdings of the Portfolio. For more complete details about the Portfolio’s investment portfolio, see page 40. |
** | Excludes temporary cash investments and all derivative contracts except for options purchased. The Portfolio is actively managed, and current holdings may be different. The holdings listed should not be considered recommendations to buy or sell any securities. |
Pioneer High Income Municipal Fund | Semiannual Report | 2/28/21 11
Net Asset Value per Share
| Class | 2/28/21 | 8/31/20 | |
A | $7.34 | $7.23 | |
C | $7.35 | $7.24 | |
Y | $7.24 | $7.14 |
| Distributions per Share: 9/1/20–2/28/21 | |||
| Net Investment | Short-Term | Long-Term | |
| Class | Income | Capital Gains | Capital Gains |
A | $0.1333 | $ — | $ — |
C | $0.1051 | $ — | $ — |
Y | $0.1404 | $ — | $ — |
Index Definitions
The Bloomberg Barclays U.S. Municipal High Yield Bond Index is an unmanaged measure of the performance of the high-yield municipal bond market. Index returns are calculated monthly, assume reinvestment of dividends and, unlike Fund returns, do not reflect any fees, expenses or sales charges. It is not possible to invest directly in an index.
The index defined here pertains to the “Value of $10,000 Investment” and “Value of $5 Million Investment” charts shown on pages 13–15.
12 Pioneer High Income Municipal Fund | Semiannual Report | 2/28/21
| Class A Shares |
Investment Returns
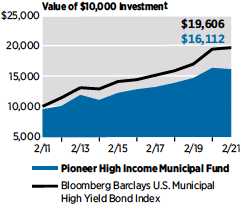
The mountain chart on the right shows the change in value of a $10,000 investment made in Class A shares of Pioneer High Income Municipal Fund at public offering price during the periods shown, compared to that of the Bloomberg Barclays U.S. Municipal High Yield Bond Index.
| Average Annual Total Returns | |||
(As of February 28, 2021) | |||
| Bloomberg | |||
| Net | Public | Barclays U.S. | |
| Asset | Offering | Municipal | |
| Value | Price | High Yield | |
| Period | (NAV) | (POP) | Bond Index |
10 years | 5.37% | 4.89% | 6.96% |
5 years | 4.67 | 3.71 | 6.42 |
1 year | -1.32 | -5.76 | 1.27 |
| Expense Ratio | |||
(Per prospectus dated December 18, 2020) | |||
| Gross | |||
0.82% | |||
Call 1-800-225-6292 or visit www.amundi.com/us for the most recent month-end performance results. Current performance may be lower or higher than the performance data quoted.
The performance data quoted represents past performance, which is no guarantee of future results. Investment return and principal value will fluctuate, and shares, when redeemed, may be worth more or less than their original cost.
NAV results represent the percent change in net asset value per share. NAV returns would have been lower had sales charges been reflected. POP returns reflect deduction of maximum 4.50% sales charge. All results are historical and assume the reinvestment of dividends and capital gains. Other share classes are available for which performance and expenses will differ.
Performance results reflect any applicable expense waivers in effect during the periods shown. Without such waivers Fund performance would be lower. Waivers may not be in effect for all funds. Certain fee waivers are contractual through a specified period. Otherwise, fee waivers can be rescinded at any time. See the prospectus and financial statements for more information.
The performance table and graph do not reflect the deduction of fees and taxes that a shareowner would pay on Fund distributions or the redemption of Fund shares.
Please refer to the financial highlights for more current expense ratios.
Pioneer High Income Municipal Fund | Semiannual Report | 2/28/21 13
Performance Update | 2/28/21 | Class C Shares |
Investment Returns
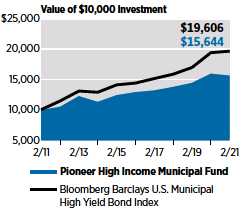
The mountain chart on the right shows the change in value of a $10,000 investment made in Class C shares of Pioneer High Income Municipal Fund during the periods shown, compared to that of the Bloomberg Barclays U.S. Municipal High Yield Bond Index.
| Average Annual Total Returns | |||
(As of February 28, 2021) | |||
| Bloomberg | |||
| Barclays U.S. | |||
| Municipal | |||
| If | If | High Yield | |
| Period | Held | Redeemed | Bond Index |
10 years | 4.58% | 4.58% | 6.96% |
5 years | 3.90 | 3.90 | 6.42 |
1 year | -1.94 | -1.94 | 1.27 |
| Expense Ratio | |||
(Per prospectus dated December 18, 2020) | |||
| Gross | |||
1.59% | |||
Call 1-800-225-6292 or visit www.amundi.com/us for the most recent month-end performance results. Current performance may be lower or higher than the performance data quoted.
The performance data quoted represents past performance, which is no guarantee of future results. Investment return and principal value will fluctuate, and shares, when redeemed, may be worth more or less than their original cost.
Class C shares held for less than one year are also subject to a 1% contingent deferred sales charge (CDSC). “If Held” results represent the percent change in net asset value per share. “If Redeemed” returns would have been lower had sales charges been reflected. All results are historical and assume the reinvestment of dividends and capital gains. Other share classes are available for which performance and expenses will differ.
Performance results reflect any applicable expense waivers in effect during the periods shown. Without such waivers Fund performance would be lower. Waivers may not be in effect for all funds. Certain fee waivers are contractual through a specified period. Otherwise, fee waivers can be rescinded at any time. See the prospectus and financial statements for more information.
The performance table and graph do not reflect the deduction of fees and taxes that a shareowner would pay on Fund distributions or the redemption of Fund shares.
Please refer to the financial highlights for a more current expense ratio.
14 Pioneer High Income Municipal Fund | Semiannual Report | 2/28/21
Performance Update | 2/28/21 | Class Y Shares |
Investment Returns
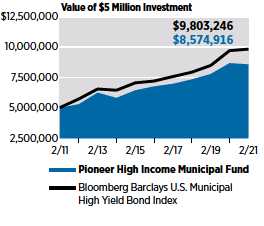
The mountain chart on the right shows the change in value of a $5 million investment made in Class Y shares of Pioneer High Income Municipal Fund during the periods shown, compared to that of the Bloomberg Barclays U.S. Municipal High Yield Bond Index.
| Average Annual Total Returns | ||
(As of February 28, 2021) | ||
| Bloomberg | ||
| Net | Barclays U.S. | |
| Asset | Municipal | |
| Value | High Yield | |
| Period | (NAV) | Bond Index |
10 years | 5.54% | 6.96% |
5 years | 4.86 | 6.42 |
1 year | -1.14 | 1.27 |
| Expense Ratio | ||
(Per prospectus dated December 18, 2020) | ||
| Gross | Net | |
0.64% | 0.55% | |
Call 1-800-225-6292 or visit www.amundi.com/us for the most recent month-end performance results. Current performance may be lower or higher than the performance data quoted.
The performance data quoted represents past performance, which is no guarantee of future results. Investment return and principal value will fluctuate, and shares, when redeemed, may be worth more or less than their original cost.
Class Y shares are not subject to sales charges and are available for limited groups of eligible investors, including institutional investors. All results are historical and assume the reinvestment of dividends and capital gains. Other share classes are available for which performance and expenses will differ.
Performance results reflect any applicable expense waivers in effect during the periods shown. Without such waivers Fund performance would be lower. Waivers may not be in effect for all funds. Certain fee waivers are contractual through a specified period. Otherwise, fee waivers can be rescinded at any time. See the prospectus and financial statements for more information.
The net expense ratio reflects the contractual expense limitation currently in effect through January 1, 2022 for Class Y shares. There can be no assurance that Amundi US will extend the expense limitation beyond such time. Please see the prospectus and financial statements for more information.
The performance table and graph do not reflect the deduction of fees and taxes that a shareowner would pay on Fund distributions or the redemption of Fund shares.
Please refer to the financial highlights for more current expense ratios.
Pioneer High Income Municipal Fund | Semiannual Report | 2/28/21 15
As a shareowner in the Fund, you incur two types of costs:
(1) | ongoing costs, including management fees, distribution and/or service (12b-1) fees, and other Fund expenses; and |
(2) | transaction costs, including sales charges (loads) on purchase payments. |
This example is intended to help you understand your ongoing expenses (in dollars) of investing in the Fund and to compare these costs with the ongoing costs of investing in other mutual funds. The example is based on an investment of $1,000 at the beginning of the Fund’s latest six-month period and held throughout the six months.
Using the Tables
Actual Expenses
The first table below provides information about actual account values and actual expenses. You may use the information in this table, together with the amount you invested, to estimate the expenses that you paid over the period as follows:
1. | Divide your account value by $1,000 |
Example: an $8,600 account value ÷ $1,000 = 8.6 | |
2. | Multiply the result in (1) above by the corresponding share class’s number in the third row under the heading entitled “Expenses Paid During Period” to estimate the expenses you paid on your account during this period. |
Expenses Paid on a $1,000 Investment in Pioneer High Income Municipal Fund
Based on actual returns from September 1, 2020 through February 28, 2021.
| Share Class* | A | C | Y |
Beginning Account | $1,000.00 | $1,000.00 | $1,000.00 |
Value on 9/1/20 | |||
Ending Account Value | $1,033.70 | $1,029.80 | $1,033.80 |
(after expenses) on 2/28/21 | |||
Expenses Paid | $4.03 | $7.90 | $2.77 |
During Period** |
* | Includes the Fund’s share of Pioneer High Income Municipal Portfolio’s allocated expenses. |
** | Expenses are equal to the Fund’s annualized expense ratio of 0.80%, 1.57% and 0.55% for Class A, Class C and Class Y shares, respectively, multiplied by the average account value over the period, multiplied by 181/365 (to reflect the partial year period). |
16 Pioneer High Income Municipal Fund | Semiannual Report | 2/28/21
Hypothetical Example for Comparison Purposes
The table below provides information about hypothetical account values and hypothetical expenses based on the Fund’s actual expense ratio and an assumed rate of return of 5% per year before expenses, which is not the Fund’s actual return. The hypothetical account values and expenses may not be used to estimate the actual ending account balance or expenses you paid for the period.
You may use this information to compare the ongoing costs of investing in the Fund and other funds. To do so, compare this 5% hypothetical example with the 5% hypothetical examples that appear in the shareholder reports of the other funds.
Please note that the expenses shown in the tables are meant to highlight your ongoing costs only and do not reflect any transaction costs, such as sales charges (loads) that are charged at the time of the transaction. Therefore, the table below is useful in comparing ongoing costs only and will not help you determine the relative total costs of owning different funds. In addition, if these transaction costs were included, your costs would have been higher.
Expenses Paid on a $1,000 Investment in Pioneer High Income Municipal Fund
Based on a hypothetical 5% return per year before expenses, reflecting the period from September 1, 2020 through February 28, 2021.
| Share Class* | A | C | Y |
Beginning Account | $1,000.00 | $1,000.00 | $1,000.00 |
Value on 9/1/20 | |||
Ending Account Value | $1,020.83 | $1,017.01 | $1,022.02 |
(after expenses) on 2/28/21 | |||
Expenses Paid | $4.01 | $7.85 | $2.76 |
During Period** |
* | Includes the Fund’s share of Pioneer High Income Municipal Portfolio’s allocated expenses. |
** | Expenses are equal to the Fund’s annualized expense ratio of 0.80%, 1.57%, and 0.55% for Class A, Class C and Class Y shares, respectively, multiplied by the average account value over the period, multiplied by 181/365 (to reflect the partial year period). |
Pioneer High Income Municipal Fund | Semiannual Report | 2/28/21 17
(unaudited)
| ASSETS: | ||||
| Investments in Pioneer High Income Municipal Portfolio, | ||||
| at value (cost $1,816,077,605) | $ | 1,870,334,582 | ||
| Cash | 8,117,913 | |||
| Receivables — | ||||
| Fund shares sold | 4,787,503 | |||
| Due from the Adviser | 326,922 | |||
| Other assets | 80,849 | |||
Total assets | $ | 1,883,647,769 | ||
| LIABILITIES: | ||||
| Payables — | ||||
| Fund shares repurchased | $ | 10,278,488 | ||
| Distributions | 1,304,116 | |||
| Trustees’ fees | 14,035 | |||
| Due to affiliates | 205,896 | |||
| Accrued expenses | 383,091 | |||
| Total liabilities | $ | 12,185,626 | ||
| NET ASSETS: | ||||
| Paid-in capital | $ | 1,930,566,849 | ||
| Distributable earnings (loss) | (59,104,706 | ) | ||
| Net assets | $ | 1,871,462,143 | ||
| NET ASSET VALUE PER SHARE: | ||||
No par value (unlimited number of shares authorized) | ||||
| Class A (based on $649,427,249/88,476,011 shares) | $ | 7.34 | ||
| Class C (based on $164,804,249/22,429,492 shares) | $ | 7.35 | ||
| Class Y (based on $1,057,230,645/145,951,311 shares) | $ | 7.24 | ||
| MAXIMUM OFFERING PRICE PER SHARE: | ||||
| Class A (based on $7.34 net asset value per share/100%-4.50% | ||||
| maximum sales charge) | $ | 7.69 | ||
The accompanying notes are an integral part of these financial statements.
18 Pioneer High Income Municipal Fund | Semiannual Report | 2/28/21
Statement of Operations* (unaudited)
FOR THE SIX MONTHS ENDED 2/28/21
| INVESTMENT INCOME | ||||||||
Income and expenses allocated from Pioneer High | ||||||||
| Income Portfolio: | ||||||||
| Interest Income | $ | 15,873,245 | ||||||
| Expenses | (109,408 | ) | ||||||
Net Investment Income allocated from Pioneer High | ||||||||
| Income Portfolio | 15,763,837 | |||||||
Interest from unaffiliated issuers | 24,912,948 | |||||||
| Total investment income | $ | 40,676,785 | ||||||
| EXPENSES: | ||||||||
| Management fees | $ | 4,207,997 | ||||||
| Administrative expense | 242,826 | |||||||
| Transfer agent fees | ||||||||
| Class A | 62,512 | |||||||
| Class C | 33,431 | |||||||
| Class Y | 525,257 | |||||||
| Distribution fees | ||||||||
| Class A | 794,284 | |||||||
| Class C | 877,038 | |||||||
| Shareowner communications expense | 8,125 | |||||||
| Custodian fees | 10,450 | |||||||
| Registration fees | 47,150 | |||||||
| Professional fees | 175,411 | |||||||
| Printing expense | 27,517 | |||||||
| Pricing fees | 12,935 | |||||||
| Trustees’ fees | 26,036 | |||||||
| Insurance expense | 2,332 | |||||||
| Miscellaneous | 67,978 | |||||||
| Total expenses | $ | 7,121,279 | ||||||
| Less fees waived and expenses reimbursed by the Adviser | (524,454 | ) | ||||||
| Net expenses | $ | 6,596,825 | ||||||
| Net investment income | $ | 34,079,960 | ||||||
| REALIZED AND UNREALIZED GAIN (LOSS) ON INVESTMENTS | ||||||||
| Net realized gain (loss): | ||||||||
| Investments in unaffiliated issuers | $ | (3,978,049 | ) | |||||
| Allocated from Pioneer High Income Portfolio: | ||||||||
| Investments | 1,255,288 | $ | (2,722,761 | ) | ||||
| Change in net unrealized appreciation (depreciation): | ||||||||
| Investments in unaffiliated issuers | $ | (26,277,937 | ) | |||||
| Allocated from Pioneer High Income Portfolio: | ||||||||
| Investments | 54,256,977 | $ | 27,979,040 | |||||
| Net realized and unrealized gain (loss) on investments | $ | 25,256,279 | ||||||
| Net increase in net assets resulting from operations* | $ | 59,336,239 | ||||||
* | On December 21, 2020, the Fund began investing as a feeder fund in Pioneer High Income Municipal Portfolio. The Statement of Operations includes the Fund’s information as a stand-alone and feeder fund for the respective periods (see Note 1). |
The accompanying notes are an integral part of these financial statements.
Pioneer High Income Municipal Fund | Semiannual Report | 2/28/21 19
Statements of Changes in Net Assets
| Six Months | ||||||||
| Ended | Year | |||||||
| 2/28/21 | Ended | |||||||
| (unaudited) | 8/31/20 | |||||||
| FROM OPERATIONS: | ||||||||
Net investment income (loss) | $ | 34,079,960 | $ | 64,033,056 | ||||
Net realized gain (loss) | (2,722,761 | ) | (59,320,919 | ) | ||||
Change in net unrealized appreciation (depreciation) | 27,979,040 | (21,611,905 | ) | |||||
| Net increase (decrease) in net assets resulting | ||||||||
| from operations | $ | 59,336,239 | $ | (16,899,768 | ) | |||
| DISTRIBUTIONS TO SHAREOWNERS: | ||||||||
| Class A ($0.13 and $0.30 per share, respectively) | $ | (11,715,698 | ) | $ | (24,841,976 | ) | ||
| Class C ($0.11 and $0.24 per share, respectively) | (2,544,999 | ) | (6,402,827 | ) | ||||
| Class Y ($0.14 and $0.31 per share, respectively) | (19,218,146 | ) | (38,090,971 | ) | ||||
| Total distributions to shareowners | $ | (33,478,843 | ) | $ | (69,335,774 | ) | ||
| FROM FUND SHARE TRANSACTIONS: | ||||||||
Net proceeds from sales of shares | $ | 391,456,108 | $ | 1,095,332,906 | ||||
Reinvestment of distributions | 27,109,989 | 56,598,939 | ||||||
Cost of shares repurchased | (342,281,869 | ) | (804,346,001 | ) | ||||
| Net increase in net assets resulting from Fund | ||||||||
| share transactions | $ | 76,284,228 | $ | 347,585,844 | ||||
| Net increase in net assets | $ | 102,141,624 | $ | 261,350,302 | ||||
| NET ASSETS: | ||||||||
Beginning of period | $ | 1,769,320,519 | $ | 1,507,970,217 | ||||
End of period | $ | 1,871,462,143 | $ | 1,769,320,519 | ||||
The accompanying notes are an integral part of these financial statements.
20 Pioneer High Income Municipal Fund | Semiannual Report | 2/28/21
| Six Months | Six Months | |||||||||||||||
| Ended | Ended | Year | Year | |||||||||||||
| 2/28/21 | 2/28/21 | Ended | Ended | |||||||||||||
| Shares | Amounts | 8/31/20 | 8/31/20 | |||||||||||||
| (unaudited) | (unaudited) | Shares | Amount | |||||||||||||
| Class A | ||||||||||||||||
Shares sold | 14,478,536 | $ | 105,622,088 | 42,422,453 | $ | 313,402,243 | ||||||||||
Reinvestment of distributions | 1,401,759 | 10,215,279 | 3,017,200 | 22,098,332 | ||||||||||||
Less shares repurchased | (14,768,230 | ) | (107,631,094 | ) | (30,167,966 | ) | (216,677,996 | ) | ||||||||
| Net increase | 1,112,065 | $ | 8,206,273 | 15,271,687 | $ | 118,822,579 | ||||||||||
| Class C | ||||||||||||||||
Shares sold | 1,921,966 | $ | 14,061,890 | 9,914,054 | $ | 73,707,281 | ||||||||||
Reinvestment of distributions | 309,507 | 2,255,922 | 739,548 | 5,415,934 | ||||||||||||
Less shares repurchased | (6,082,317 | ) | (44,313,990 | ) | (7,534,554 | ) | (54,546,485 | ) | ||||||||
| Net increase (decrease) | (3,850,844 | ) | $ | (27,996,178 | ) | 3,119,048 | $ | 24,576,730 | ||||||||
| Class Y | ||||||||||||||||
Shares sold | 37,715,409 | $ | 271,772,130 | 98,135,027 | $ | 708,223,382 | ||||||||||
Reinvestment of distributions | 2,033,896 | 14,638,788 | 4,018,802 | 29,084,673 | ||||||||||||
Less shares repurchased | (26,476,038 | ) | (190,336,785 | ) | (75,051,914 | ) | (533,121,520 | ) | ||||||||
| Net increase | 13,273,267 | $ | 96,074,133 | 27,101,915 | $ | 204,186,535 | ||||||||||
The accompanying notes are an integral part of these financial statements.
Pioneer High Income Municipal Fund | Semiannual Report | 2/28/21 21
Financial Highlights
| Six Months | , | |||||||||||||||||||||||
| Ended | Year | Year | Year | Year | Year | |||||||||||||||||||
| 2/28/21(e) | Ended | Ended | Ended | Ended | Ended | |||||||||||||||||||
| (unaudited) | 8/31/20(e) | 8/31/19(e) | 8/31/18(e) | 8/31/17(e) | 8/31/16*(e) | |||||||||||||||||||
| Class A | ||||||||||||||||||||||||
Net asset value, beginning of period | $ | 7.23 | $ | 7.56 | $ | 7.36 | $ | 7.32 | $ | 7.59 | $ | 7.22 | ||||||||||||
Increase (decrease) from investment operations: | ||||||||||||||||||||||||
| Net investment income (loss) (a) | $ | 0.14 | $ | 0.27 | $ | 0.35 | $ | 0.38 | $ | 0.35 | $ | 0.36 | ||||||||||||
| Net realized and unrealized gain (loss) on investments | 0.10 | (0.30 | ) | 0.21 | 0.02 | (0.26 | ) | 0.41 | ||||||||||||||||
| Net increase (decrease) from investment operations | $ | 0.24 | $ | (0.03 | ) | $ | 0.56 | $ | 0.40 | $ | 0.09 | $ | 0.77 | |||||||||||
Distributions to shareowners: | ||||||||||||||||||||||||
| Net investment income | $ | (0.13 | ) | $ | (0.30 | ) | $ | (0.36 | ) | $ | (0.36 | ) | $ | (0.36 | ) | $ | (0.40 | ) | ||||||
| Net increase (decrease) in net asset value | $ | 0.11 | $ | (0.33 | ) | $ | 0.20 | $ | 0.04 | $ | (0.27 | ) | $ | 0.37 | ||||||||||
Net asset value, end of period | $ | 7.34 | $ | 7.23 | $ | 7.56 | $ | 7.36 | $ | 7.32 | $ | 7.59 | ||||||||||||
| Total return (b) | 3.37 | %(c) | (0.41 | )% | 7.87 | % | 5.60 | % | 1.32 | % | 10.90 | % | ||||||||||||
Ratio of net expenses to average net assets | 0.80 | %(d)(f) | 0.82 | % | 0.83 | % | 0.86 | % | 0.88 | % | 0.87 | % | ||||||||||||
Ratio of net investment income (loss) to average net assets | 3.75 | %(d) | 3.71 | % | 4.81 | % | 5.16 | % | 4.85 | % | 4.86 | % | ||||||||||||
Portfolio turnover rate | 7 | %(c)(g) | 73 | % | 20 | % | 22 | % | 35 | % | 20 | % | ||||||||||||
Net assets, end of period (in thousands) | $ | 649,427 | $ | 631,922 | $ | 545,014 | $ | 313,695 | $ | 267,618 | $ | 292,019 | ||||||||||||
Ratios with no waiver of fees and assumption of expenses by | ||||||||||||||||||||||||
| the Adviser and no reduction for fees paid indirectly: | ||||||||||||||||||||||||
| Total expenses to average net assets | 0.81 | %(d)(f) | 0.82 | % | 0.85 | % | 0.86 | % | 0.88 | % | 0.87 | % | ||||||||||||
| Net investment income (loss) to average net assets | 3.74 | %(d) | 3.71 | % | 4.79 | % | 5.16 | % | 4.85 | % | 4.86 | % | ||||||||||||
* | The Fund was audited by an independent registered public accounting firm other than Ernst & Young LLP. |
(a) | The per-share data presented above is based on the average shares outstanding for the period presented. |
(b) | Assumes initial investment at net asset value at the beginning of each period, reinvestment of all distributions, the complete redemption of the investment at net asset value at the end of each period and no sales charges. Total return would be reduced if sales charges were taken into account. |
(c) | Not annualized. |
(d) | Annualized. |
(e) | On December 21, 2020, the Fund began investing as a feeder fund in Pioneer High Income Municipal Portfolio. Expense ratios disclosed prior to February 28, 2021 are for the Fund as a stand-alone fund. |
(f) | Includes the Fund’s share of Pioneer High Income Municipal Portfolio’s allocated expenses. |
(g) | Represents the combined portfolio turnover rate of the Fund and Pioneer High Income Municipal Portfolio. |
The accompanying notes are an integral part of these financial statements.
22 Pioneer High Income Municipal Fund | Semiannual Report | 2/28/21
| Six Months | ||||||||||||||||||||||||
| Ended | Year | Year | Year | Year | Year | |||||||||||||||||||
| 2/28/21(e) | Ended | Ended | Ended | Ended | Ended | |||||||||||||||||||
| (unaudited) | 8/31/20(e) | 8/31/19(e) | 8/31/18(e) | 8/31/17(e) | 8/31/16*(e) | |||||||||||||||||||
| Class C | ||||||||||||||||||||||||
Net asset value, beginning of period | $ | 7.24 | $ | 7.56 | $ | 7.36 | $ | 7.32 | $ | 7.59 | $ | 7.22 | ||||||||||||
Increase (decrease) from investment operations: | ||||||||||||||||||||||||
| Net investment income (loss) (a) | $ | 0.11 | $ | 0.22 | $ | 0.35 | $ | 0.32 | $ | 0.30 | $ | 0.30 | ||||||||||||
| Net realized and unrealized gain (loss) on investments | 0.11 | (0.30 | ) | 0.15 | 0.02 | (0.27 | ) | 0.41 | ||||||||||||||||
| Net increase (decrease) from investment operations | $ | 0.22 | $ | (0.08 | ) | $ | 0.50 | $ | 0.34 | $ | 0.03 | $ | 0.71 | |||||||||||
Distributions to shareowners: | ||||||||||||||||||||||||
| Net investment income | $ | (0.11 | ) | $ | (0.24 | ) | $ | (0.30 | ) | $ | (0.30 | ) | $ | (0.30 | ) | $ | (0.34 | ) | ||||||
| Net increase (decrease) in net asset value | $ | 0.11 | $ | (0.32 | ) | $ | 0.20 | $ | 0.04 | $ | (0.27 | ) | $ | 0.37 | ||||||||||
Net asset value, end of period | $ | 7.35 | $ | 7.24 | $ | 7.56 | $ | 7.36 | $ | 7.32 | $ | 7.59 | ||||||||||||
| Total return (b) | 2.98 | %(c) | (1.03 | )% | 7.05 | % | 4.81 | % | 0.55 | % | 10.07 | % | ||||||||||||
Ratio of net expenses to average net assets | 1.57 | %(d)(f) | 1.59 | % | 1.60 | % | 1.63 | % | 1.65 | % | 1.63 | % | ||||||||||||
Ratio of net investment income (loss) to average net assets | 2.98 | %(d) | 2.95 | % | 4.07 | % | 4.42 | % | 4.10 | % | 4.10 | % | ||||||||||||
Portfolio turnover rate | 7 | %(c)(g) | 73 | % | 20 | % | 22 | % | 35 | % | 20 | % | ||||||||||||
Net assets, end of period (in thousands) | $ | 164,804 | $ | 190,279 | $ | 175,156 | $ | 134,670 | $ | 143,846 | $ | 165,883 | ||||||||||||
Ratios with no waiver of fees and assumption of expenses by | ||||||||||||||||||||||||
| the Adviser and no reduction for fees paid indirectly: | ||||||||||||||||||||||||
| Total expenses to average net assets | 1.58 | %(d)(f) | 1.59 | % | 1.61 | % | 1.63 | % | 1.65 | % | 1.63 | % | ||||||||||||
| Net investment income (loss) to average net assets | 2.97 | %(d) | 2.95 | % | 4.06 | % | 4.42 | % | 4.10 | % | 4.10 | % | ||||||||||||
* | The Fund was audited by an independent registered public accounting firm other than Ernst & Young LLP. |
(a) | The per-share data presented above is based on the average shares outstanding for the period presented. |
(b) | Assumes initial investment at net asset value at the beginning of each period, reinvestment of all distributions, the complete redemption of the investment at net asset value at the end of each period and no sales charges. Total return would be reduced if sales charges were taken into account. |
(c) | Not annualized. |
(d) | Annualized. |
(e) | On December 21, 2020, the Fund began investing as a feeder fund in Pioneer High Income Municipal Portfolio. Expense ratios disclosed prior to February 28, 2021 are for the Fund as a stand-alone fund. |
(f) | Includes the Fund’s share of Pioneer High Income Municipal Portfolio’s allocated expenses. |
(g) | Represents the combined portfolio turnover rate of the Fund and Pioneer High Income Municipal Portfolio. |
The accompanying notes are an integral part of these financial statements.
Pioneer High Income Municipal Fund | Semiannual Report | 2/28/21 23
Financial Highlights (continued)
| Six Months | ||||||||||||||||||||||||
| Ended | Year | Year | Year | Year | Year | |||||||||||||||||||
| 2/28/21(e) | Ended | Ended | Ended | Ended | Ended | |||||||||||||||||||
| (unaudited) | 8/31/20(e) | 8/31/19(e) | 8/31/18(e) | 8/31/17(e) | 8/31/16*(e) | |||||||||||||||||||
| Class Y | ||||||||||||||||||||||||
Net asset value, beginning of period | $ | 7.14 | $ | 7.46 | $ | 7.26 | $ | 7.22 | $ | 7.49 | $ | 7.12 | ||||||||||||
Increase (decrease) from investment operations: | ||||||||||||||||||||||||
| Net investment income (loss) (a) | $ | 0.14 | $ | 0.29 | $ | 0.35 | $ | 0.38 | $ | 0.36 | $ | 0.37 | ||||||||||||
| Net realized and unrealized gain (loss) on investments | 0.10 | (0.30 | ) | 0.22 | 0.03 | (0.26 | ) | 0.41 | ||||||||||||||||
| Net increase (decrease) from investment operations | $ | 0.24 | $ | (0.01 | ) | $ | 0.57 | $ | 0.41 | $ | 0.10 | $ | 0.78 | |||||||||||
Distributions to shareowners: | ||||||||||||||||||||||||
| Net investment income | $ | (0.14 | ) | $ | (0.31 | ) | $ | (0.37 | ) | $ | (0.37 | ) | $ | (0.37 | ) | $ | (0.41 | ) | ||||||
| Net increase (decrease) in net asset value | $ | 0.10 | $ | (0.32 | ) | $ | 0.20 | $ | 0.04 | $ | (0.27 | ) | $ | 0.37 | ||||||||||
Net asset value, end of period | $ | 7.24 | $ | 7.14 | $ | 7.46 | $ | 7.26 | $ | 7.22 | $ | 7.49 | ||||||||||||
| Total return (b) | 3.38 | %(c) | (0.08 | )% | 8.18 | % | 5.80 | % | 1.45 | % | 11.17 | % | ||||||||||||
Ratio of net expenses to average net assets | 0.55 | %(d)(f) | 0.55 | % | 0.55 | % | 0.68 | % | 0.72 | % | 0.71 | % | ||||||||||||
Ratio of net investment income (loss) to average net assets | 4.00 | %(d) | 3.97 | % | 4.99 | % | 5.31 | % | 4.99 | % | 5.01 | % | ||||||||||||
Portfolio turnover rate | 7 | %(c)(g) | 73 | % | 20 | % | 22 | % | 35 | % | 20 | % | ||||||||||||
Net assets, end of period (in thousands) | $ | 1,057,231 | $ | 947,119 | $ | 787,800 | $ | 290,431 | $ | 192,118 | $ | 192,198 | ||||||||||||
Ratios with no waiver of fees and assumption of expenses by | ||||||||||||||||||||||||
| the Adviser and no reduction for fees paid indirectly: | ||||||||||||||||||||||||
| Total expenses to average net assets | 0.65 | %(d)(f) | 0.64 | % | 0.66 | % | 0.68 | % | 0.72 | % | 0.71 | % | ||||||||||||
| Net investment income (loss) to average net assets | 3.90 | %(d) | 3.88 | % | 4.88 | % | 5.31 | % | 4.99 | % | 5.01 | % | ||||||||||||
* | The Fund was audited by an independent registered public accounting firm other than Ernst & Young LLP. |
(a) | The per-share data presented above is based on the average shares outstanding for the period presented. |
(b) | Assumes initial investment at net asset value at the beginning of each period, reinvestment of all distributions and the complete redemption of the investment at net asset value at the end of each period. |
(c) | Not annualized. |
(d) | Annualized. |
(e) | On December 21, 2020, the Fund began investing as a feeder fund in Pioneer High Income Municipal Portfolio. Expense ratios disclosed prior to February 28, 2021 are for the Fund as a stand-alone fund. |
(f) | Includes the Fund’s share of Pioneer High Income Municipal Portfolio’s allocated expenses. |
(g) | Represents the combined portfolio turnover rate of the Fund and Pioneer High Income Municipal Portfolio. |
The accompanying notes are an integral part of these financial statements.
24 Pioneer High Income Municipal Fund | Semiannual Report | 2/28/21
(unaudited)
1. Organization and Significant Accounting Policies
Pioneer High Income Municipal Fund (the “Fund”) is one of four portfolios comprising Pioneer Series Trust V (the “Trust”), a Delaware statutory trust. The Fund is registered under the Investment Company Act of 1940 as a diversified, open-end management investment company. The investment objective of the Fund is to maximize total return through a combination of income that is exempt from regular federal income tax and capital appreciation.
Effective December 21, 2020, the Fund began investing all of its investable assets as a feeder fund in Pioneer High Income Municipal Portfolio (the “Portfolio”), a portfolio of Pioneer Core Trust I, that has the same investment objective and policies as the Fund. The financial statements of the Portfolio including the schedule of investments, are contained elsewhere in this report and should be read in conjunction with the Fund’s financial statements. The Portfolio is registered under the Investment Company Act of 1940 as a diversified, open-end management investment company. At February 28, 2021, the Fund owned approximately 99.999% of the Portfolio. On December 21, 2020 the Fund had assets with a cost basis of $1,707,674,760 and a Value of $1,760,998,235 that were transferred to the Portfolio.
The Fund offers four classes of shares designated as Class A, Class C, Class K and Class Y shares. Class K shares had not commenced operations as of February 28, 2021. Each class of shares represents an interest in the same portfolio of investments of the Fund and has identical rights (based on relative net asset values) to assets and liquidation proceeds. Share classes can bear different rates of class-specific fees and expenses, such as transfer agent and distribution fees. Differences in class-specific fees and expenses will result in differences in net investment income and, therefore, the payment of different dividends from net investment income earned by each class. The Amended and Restated Declaration of Trust of the Trust gives the Board of Trustees the flexibility to specify either per-share voting or dollar-weighted voting when submitting matters for shareowner approval. Under per-share voting, each share of a class of the Fund is entitled to one vote. Under dollar-weighted voting, a shareowner’s voting power is determined not by the number of shares owned, but by the dollar value of the shares on the record date. Each share class has exclusive voting rights with respect to matters affecting only that class, including with respect to the distribution plan for that class. There is no distribution plan for Class Y shares.
Pioneer High Income Municipal Fund | Semiannual Report | 2/28/21 25
Amundi Asset Management US, Inc., an indirect, wholly owned subsidiary of Amundi and Amundi’s wholly owned subsidiary, Amundi USA, Inc., serves as the investment adviser of the Fund and the Portfolio (the “Adviser”). Prior to January 1, 2021, the Adviser was named Amundi Pioneer Asset Management, Inc. Amundi Distributor US, Inc., an affiliate of Amundi Asset Management US, Inc., serves as the Fund’s placement agent (the “Placement Agent”). The Portfolio offers beneficial interests through the Placement Agent.
In August 2018, the Financial Accounting Standards Board (FASB) issued Accounting Standards Update 2018-13 “Disclosure Framework - Changes to the Disclosure Requirements for Fair Value Measurement” (“ASU 2018-13”), which modifies disclosure requirements for fair value measurements, principally for Level 3 securities and transfers between levels of the fair value hierarchy. ASU 2018-13 is effective for fiscal years beginning after December 15, 2019 and for interim periods within those fiscal years. The Fund has adopted ASU 2018-13 for the six months ended February 28, 2021. The impact to the Fund’s adoption was limited to changes in the Fund’s disclosures regarding fair value, primarily those disclosures related to transfers between levels of the fair value hierarchy and disclosure of the range and weighted average used to develop significant unobservable inputs for Level 3 fair value investments, when applicable.
In March 2020, FASB issued an Accounting Standard Update, ASU 2020-04, Reference Rate Reform (Topic 848) — Facilitation of the Effects of Reference Rate Reform on Financial Reporting (“ASU 2020-04”), which provides optional, temporary relief with respect to the financial reporting of contracts subject to certain types of modifications due to the planned discontinuation of the London Interbank Offered Rate (“LIBOR”) and other LIBOR-based reference rates at the end of 2021. The temporary relief provided by ASU 2020-04 is effective for certain reference rate-related contract modifications that occur during the period from March 12, 2020 through December 31, 2022. Management is evaluating the impact of ASU 2020-04 on the Fund’s investments, derivatives, debt and other contracts, if applicable, that will undergo reference rate-related modifications as a result of the reference rate reform.
The Fund is an investment company and follows investment company accounting and reporting guidance under U.S. Generally Accepted Accounting Principles (“U.S. GAAP”). U.S. GAAP requires the management of the Fund to make estimates and assumptions that affect the reported amounts of assets and liabilities, the disclosure of contingent assets and liabilities at the date of the financial statements, and the reported amounts of income, expenses and gain or loss on investments during the reporting period. Actual results could differ from those estimates.
The following is a summary of significant accounting policies followed by the Fund in the preparation of its financial statements:
26 Pioneer High Income Municipal Fund | Semiannual Report | 2/28/21
A. Security Valuation
The net asset value of the Fund is computed once daily, on each day the New York Stock Exchange (“NYSE”) is open, as of the close of regular trading on the NYSE.
The Fund records its investment in the Portfolio at value, which reflects its proportionate interest in the net assets of the Portfolio and is categorized as Level 1. Valuation of the securities held by the Portfolio is discussed in the notes to the Portfolio’s financial statements included elsewhere in this report. Disclosure about the classification of fair value measurements is presented in a tabular format, following the Portfolio’s Schedule of Investments.
Prior to December 21, 2020, the Fund invested directly in securities. Purchases and sales of securities by the Fund (excluding temporary cash investments) during the period from September 1, 2020 through December 21, 2020 aggregated $408,904,154 and $181,801,240, respectively. Please see the notes to the Portfolio’s financial statements included elsewhere in this report for a discussion regarding the valuation of securities in which the Fund and Portfolio invest.
The Fund did not engage in purchase and sale transactions (“cross trades”) as set forth in Rule 17a-7 under the Investment Company Act of 1940 during the period from September 1, 2020 through December 21, 2020.
B. Investment Income and Transactions
Interest income, including interest on income-bearing cash accounts, is recorded on the accrual basis. Dividend and interest income are reported net of unrecoverable foreign taxes withheld at the applicable country rates and net of income accrued on defaulted securities.
Interest and dividend income payable by delivery of additional shares is reclassified as PIK (payment-in-kind) income upon receipt and is included in interest and dividend income, respectively.
Security transactions are recorded as of trade date. Gains and losses on sales of investments are calculated on the identified cost method for both financial reporting and federal income tax purposes.
The Fund receives a daily allocation of the Portfolio’s income, expenses and net realized and unrealized gains and losses in proportion to its investment in the Portfolio.
C. Federal Income Taxes
It is the Fund’s policy to comply with the requirements of the Internal Revenue Code applicable to regulated investment companies and to distribute all of its net taxable income and net realized capital gains, if any, to its shareowners. Therefore, no provision for federal income taxes is
Pioneer High Income Municipal Fund | Semiannual Report | 2/28/21 27
required. As of August 31, 2020, the Fund did not accrue any interest or penalties with respect to uncertain tax positions, which, if applicable, would be recorded as an income tax expense on the Statement of Operations. Tax returns filed within the prior three years remain subject to examination by federal and state tax authorities.
The amount and character of income and capital gain distributions to shareowners are determined in accordance with federal income tax rules, which may differ from U.S. GAAP. Distributions in excess of net investment income or net realized gains are temporary over distributions for financial statement purposes resulting from differences in the recognition or classification of income or distributions for financial statement and tax purposes. Capital accounts within the financial statements are adjusted for permanent book/tax differences to reflect tax character, but are not adjusted for temporary differences.
The tax character of current year distributions payable will be determined at the end of the current taxable year. The tax character of distributions paid during the year ended August 31, 2020 was as follows:
| 2020 | ||||
| Distributions paid from: | ||||
Tax-exempt income | $ | 67,574,615 | ||
Ordinary income | 1,761,159 | |||
| Total | $ | 69,335,774 | ||
The following shows the components of distributable earnings (losses) on a federal income tax basis at August 31, 2020:
| 2020 | ||||
| Distributable earnings/(loss): | ||||
Undistributed tax-exempt income | $ | 8,361,302 | ||
Capital loss carryforward | (109,166,519 | ) | ||
Current year dividend payable | (1,001,377 | ) | ||
Net unrealized appreciation | 16,844,492 | |||
| Total | $ | (84,962,102 | ) | |
The difference between book-basis and tax-basis unrealized appreciation is attributable to the tax deferral of losses on wash sales, adjustments related to interest on defaulted bonds and the tax treatment of amortization.
D. Fund Shares
The Fund records sales and repurchases of its shares as of trade date. The Distributor earned $85,462 in underwriting commissions on the sale of Class A shares during the six months ended February 28, 2021.
28 Pioneer High Income Municipal Fund | Semiannual Report | 2/28/21
E. Class Allocations
Income, common expenses and realized and unrealized gains and losses are calculated at the Fund level and allocated daily to each class of shares based on its respective percentage of adjusted net assets at the beginning of the day. Distribution fees are calculated based on the average daily net asset value attributable to Class A and Class C shares of the Fund, respectively (see Note 4). Class Y shares do not pay distribution fees. All expenses and fees paid to the Fund’s transfer agent for its services are allocated among the classes of shares based on the number of accounts in each class and the ratable allocation of related out-of-pocket expenses (see Note 4).
The Fund declares as daily dividends substantially all of its net investment income. All dividends are paid on a monthly basis. Short-term capital gain distributions, if any, may be declared with the daily dividends. Distributions to shareowners are recorded as of the ex-dividend date. Distributions paid by the Fund with respect to each class of shares are calculated in the same manner and at the same time, except that net investment income dividends to Class A, Class C, and Class Y shares can reflect different transfer agent and distribution expense rates.
F. Risks
The value of securities held by the Fund may go up or down, sometimes rapidly or unpredictably, due to general market conditions, such as real or perceived adverse economic, political or regulatory conditions, recessions, the spread of infectious illness or other public health issues, inflation, changes in interest rates, lack of liquidity in the bond markets or adverse investor sentiment. In the past several years, financial markets have experienced increased volatility, depressed valuations, decreased liquidity and heightened uncertainty. These conditions may continue, recur, worsen or spread. A general rise in interest rates could adversely affect the price and liquidity of fixed-income securities and could also result in increased redemptions from the Fund.
At times, the Fund’s investments may represent industries or industry sectors that are interrelated or have common risks, making the Fund more susceptible to any economic, political, or regulatory developments or other risks affecting those industries and sectors. The Fund’s investments in foreign markets and countries with limited developing markets may subject the Fund to a greater degree of risk than investments in a developed market. These risks include disruptive political or economic conditions and the imposition of adverse governmental laws or currency exchange restrictions.
Pioneer High Income Municipal Fund | Semiannual Report | 2/28/21 29
The Fund’s investments, payment obligations and financing terms may be based on floating rates, such as LIBOR (London Interbank Offered Rate). Plans are underway to phase out the use of LIBOR. The UK Financial Conduct Authority (“FCA”) and LIBOR’s administrator, ICE Benchmark Administration (“IBA”), have announced that most LIBOR rates will no longer be published after the end of 2021 and a majority of U.S. dollar LIBOR rates will no longer be published after June 30, 2023. It is possible that the FCA may compel the IBA to publish a subset of LIBOR settings after these dates on a “synthetic” basis, but any such publications would be considered non-representative of the underlying markets. There remains uncertainty regarding the nature of any replacement rate and the impact of the transition from LIBOR on the fund, issuers of instruments in which the fund invests, and financial markets generally.
With the increased use of technologies such as the Internet to conduct business, the Fund is susceptible to operational, information security and related risks. While the Fund’s Adviser has established business continuity plans in the event of, and risk management systems to prevent, limit or mitigate, such cyber-attacks, there are inherent limitations in such plans and systems, including the possibility that certain risks have not been identified. Furthermore, the Fund cannot control the cybersecurity plans and systems put in place by service providers to the Fund such as Brown Brothers Harriman & Co., the Fund’s custodian and accounting agent, and DST Asset Manager Solutions, Inc., the Fund’s transfer agent. In addition, many beneficial owners of Fund shares hold them through accounts at broker-dealers, retirement platforms and other financial market participants over which neither the Fund nor the Adviser exercises control. Each of these may in turn rely on service providers to them, which are also subject to the risk of cyber-attacks. Cybersecurity failures or breaches at the Adviser or the Fund’s service providers or intermediaries have the ability to cause disruptions and impact business operations, potentially resulting in financial losses, interference with the Fund’s ability to calculate its net asset value, impediments to trading, the inability of Fund shareowners to effect share purchases, redemptions or exchanges or receive distributions, loss of or unauthorized access to private shareowner information and violations of applicable privacy and other laws, regulatory fines, penalties, reputational damage, or additional compliance costs. Such costs and losses may not be covered under any insurance. In addition, maintaining vigilance against cyber-attacks may involve substantial costs over time, and system enhancements may themselves be subject to cyber-attacks.
30 Pioneer High Income Municipal Fund | Semiannual Report | 2/28/21
COVID-19
The respiratory illness COVID-19 caused by a novel coronavirus has resulted in a global pandemic and major disruption to economies and markets around the world, including the United States. Global financial markets have experienced extreme volatility and severe losses, and trading in many instruments has been disrupted. Liquidity for many instruments has been greatly reduced for periods of time. Some interest rates are very low and in some cases yields are negative. Some sectors of the economy and individual issuers have experienced particularly large losses. These circumstances may continue for an extended period of time, and may continue to affect adversely the value and liquidity of the Fund’s investments. The ultimate economic fallout from the pandemic, and the long-term impact on economies, markets, industries and individual issuers, are not known. Governments and central banks, including the Federal Reserve in the U.S., have taken extraordinary and unprecedented actions to support local and global economies and the financial markets. These actions have resulted in significant expansion of public debt, including in the U.S. The impact of these measures, and whether they will be effective to mitigate the economic and market disruption, will not be known for some time. The consequences of high public debt, including its future impact on the economy and securities markets, likewise may not be known for some time.
The Fund’s prospectus contains unaudited information regarding the Fund’s principal risks. Please refer to that document when considering the Fund’s principal risks.
2. Management Agreement
The Adviser manages the Fund’s portfolio. Management fees are calculated daily and paid monthly at the annual rate equal to 0.50% of the Fund’s average daily net assets up to $500 million, 0.475% of the next $500 million of the Fund’s average daily net assets and 0.45% of the Fund’s average daily net assets over $1 billion. For the six months ended February 28, 2021, the effective management fee (excluding waivers and/or assumption of expenses) was equivalent to 0.47% (annualized) of the Fund’s average daily net assets.
Effective December 21, 2020, the Adviser contractually agreed to limit ordinary operating expenses (ordinary operating expenses means all fund expenses other than extraordinary expenses, such as litigation, taxes, brokerage commissions and acquired fund fees and expenses) of the Fund to the extent required to reduce Fund expenses to 0.82%, 1.59% and 0.55% of the average daily net assets attributable to Class A, Class C and Class Y shares, respectively. These expense limitations are in effect through January 1, 2022. There can be no assurance that the Adviser will extend the expense limitation agreement beyond the date referred to above.
Pioneer High Income Municipal Fund | Semiannual Report | 2/28/21 31
Prior to December 21, 2020, the Adviser has contractually agreed to limit ordinary operating expenses (ordinary operating expenses means all fund expenses other than extraordinary expenses, such as litigation, taxes, brokerage commissions and acquired fund fees and expenses) of the Fund to the extent required to reduce Fund expenses to 0.83% and 0.55% of the average daily net assets attributable to Class A and Class Y shares, respectively. Class C shares did not have an expense limitation.
In addition, under the management and administration agreements, certain other services and costs, including accounting, regulatory reporting and insurance premiums, are paid by the Fund as administrative reimbursements. Included in “Due to affiliates” reflected on the Statement of Assets and Liabilities is $160,889 in management fees, administrative costs and certain other reimbursements payable to the Adviser at February 28, 2021.
3. Compensation of Trustees and Officers
The Fund pays an annual fee to its Trustees. The Adviser reimburses the Fund for fees paid to the Interested Trustees. The Fund does not pay any salary or other compensation to its officers. For the six-month period ended February 28, 2021, the Fund paid $26,036 in Trustees’ compensation, which is reflected on the Statement of Operations as Trustees’ fees. At February 28, 2021, the Fund had a payable for Trustees’ fees on its Statement of Assets and Liabilities of $14,035.
4. Transfer Agent
DST Asset Manager Solutions, Inc. serves as the transfer agent to the Fund at negotiated rates. Transfer agent fees and payables shown on the Statement of Operations and the Statement of Assets and Liabilities, respectively, include sub-transfer agent expenses incurred through the Fund’s omnibus relationship contracts.
In addition, the Fund reimbursed the transfer agent for out-of-pocket expenses incurred by the transfer agent related to shareowner communications activities such as proxy and statement mailings, and outgoing phone calls. For the six months ended February 28, 2021, such out-of-pocket expenses by class of shares were as follows:
| Shareowner Communications: | ||||
Class A | $ | 2,338 | ||
Class C | 858 | |||
Class Y | 4,929 | |||
| Total | $ | 8,125 | ||
32 Pioneer High Income Municipal Fund | Semiannual Report | 2/28/21
5. Distribution Plan
The Fund has adopted a distribution plan (the “Plan”) pursuant to Rule 12b-1 of the Investment Company Act of 1940 with respect to its Class A and Class C shares. Pursuant to the Plan, the Fund pays the Placement Agent 0.25% of the average daily net assets attributable to Class A shares as compensation for personal services and/or account maintenance services or distribution services with regard to Class A shares. Pursuant to the Plan, the Fund also pays the Placement Agent 1.00% of the average daily net assets attributable to Class C shares. The fee for Class C shares consists of a 0.25% service fee and a 0.75% distribution fee paid as compensation for personal services and/or account maintenance services or distribution services with regard to Class C shares. Included in “Due to affiliates” reflected on the Statement of Assets and Liabilities is $45,007 in distribution fees payable to the Placement Agent at February 28, 2021.
In addition, redemptions of Class A and Class C shares may be subject to a contingent deferred sales charge (“CDSC”). A CDSC of 1.00% may be imposed on redemptions of certain net asset value purchases of Class A shares within 12 months of purchase. Redemptions of Class C shares within 12 months of purchase are subject to a CDSC of 1.00%, based on the lower of cost or market value of shares being redeemed. Shares purchased as part of an exchange remain subject to any CDSC that applied to the original purchase of those shares. There is no CDSC for Class Y shares. Proceeds from the CDSCs are paid to the Placement Agent. For the six months ended February 28, 2021, CDSCs in the amount of $248,192 were paid to the Placement Agent.
6. Line of Credit Facility
The Fund, along with certain other funds in the Pioneer Family of Funds (the “Funds”), participates in a committed, unsecured revolving line of credit (“credit facility”). Borrowings are used solely for temporary or emergency purposes. The Fund may borrow up to the lesser of the amount available under the credit facility or the limits set for borrowing by the Fund’s prospectus and the 1940 Act. Effective February 4, 2021, the Fund participates in a facility in the amount of $450 million. Prior to February 4, 2021, the Fund participated in a facility in the amount of $300 million. Under such facility, depending on the type of loan, interest on borrowings is payable at the London Interbank Offered Rate (“LIBOR”) plus a credit spread. The Fund also pays an annual commitment fee to participate in a credit facility. The commitment fee in the amount of 0.25% of the daily unused portion of each lenders commitment is allocated among participating Funds based on an allocation schedule set forth in the credit agreement. For the six months ended February 28, 2021, the Fund had no borrowings under the credit facility.
Pioneer High Income Municipal Fund | Semiannual Report | 2/28/21 33
Amundi Pioneer Asset Management, Inc.1 (“APAM”) serves as the investment adviser to Pioneer High Income Municipal Fund (the “Fund”) pursuant to an investment management agreement between APAM and the Fund. In order for APAM to remain the investment adviser of the Fund, the Trustees of the Fund must determine annually whether to renew the investment management agreement for the Fund.
The contract review process began in January 2020 as the Trustees of the Fund agreed on, among other things, an overall approach and timeline for the process. Contract review materials were provided to the Trustees in March 2020, July 2020 and September 2020. In addition, the Trustees reviewed and discussed the Fund’s performance at regularly scheduled meetings throughout the year, and took into account other information related to the Fund provided to the Trustees at regularly scheduled meetings, in connection with the review of the Fund’s investment management agreement.
In March 2020, the Trustees, among other things, discussed the memorandum provided by Fund counsel that summarized the legal standards and other considerations that are relevant to the Trustees in their deliberations regarding the renewal of the investment management agreement, and reviewed and discussed the qualifications of the investment management teams for the Fund, as well as the level of investment by the Fund’s portfolio managers in the Fund. In July 2020, the Trustees, among other things, reviewed the Fund’s management fees and total expense ratios, the financial statements of APAM and its parent companies, profitability analyses provided by APAM, and analyses from APAM as to possible economies of scale. The Trustees also reviewed the profitability of the institutional business of APAM and APAM’s affiliate, Amundi Pioneer Institutional Asset Management, Inc.2 (“APIAM” and, together with APAM, “Amundi Pioneer”), as compared to that of APAM’s fund management business, and considered the differences between the fees and expenses of the Fund and the fees and expenses of APAM’s and APIAM’s institutional accounts, as well as the different services provided by APAM to the Fund and by APAM and APIAM to the institutional accounts. The Trustees further considered contract review materials, including additional materials received in response to the Trustees’ request, in September 2020.
1 | Effective January 1, 2021, Amundi Pioneer Asset Management, Inc. changed its name to Amundi Asset Management US, Inc. (“Amundi US”). |
2 | Effective January 1, 2021, Amundi Pioneer Institutional Asset Management, Inc. (“APIAM”) merged with and into Amundi US. After the Merger, the investment advisory services previously provided by APIAM are now provided through Amundi US. |
34 Pioneer High Income Municipal Fund | Semiannual Report | 2/28/21
At a meeting held on September 15, 2020, based on their evaluation of the information provided by APAM and third parties, the Trustees of the Fund, including the Independent Trustees voting separately, unanimously approved the renewal of the investment management agreement for another year. In approving the renewal of the investment management agreement, the Trustees considered various factors that they determined were relevant, including the factors described below. The Trustees did not identify any single factor as the controlling factor in determining to approve the renewal of the agreement.
Nature, Extent and Quality of Services
The Trustees considered the nature, extent and quality of the services that had been provided by APAM to the Fund, taking into account the investment objective and strategy of the Fund. The Trustees also reviewed APAM’s investment approach for the Fund and its research process. The Trustees considered the resources of APAM and the personnel of APAM who provide investment management services to the Fund. They also reviewed the amount of non-Fund assets managed by the portfolio managers of the Fund. They considered the non-investment resources and personnel of APAM that are involved in APAM’s services to the Fund, including APAM’s compliance, risk management, and legal resources and personnel. The Trustees noted the substantial attention and high priority given by APAM’s senior management to the Pioneer Fund complex. The Trustees considered the implementation and effectiveness of APAM’s business continuity plan in response to the COVID-19 pandemic.
The Trustees considered that APAM supervises and monitors the performance of the Fund’s service providers and provides the Fund with personnel (including Fund officers) and other resources that are necessary for the Fund’s business management and operations. The Trustees also considered that, as administrator, APAM is responsible for the administration of the Fund’s business and other affairs. The Trustees considered the fees paid to APAM for the provision of administration services.
Based on these considerations, the Trustees concluded that the nature, extent and quality of services that had been provided by APAM to the Fund were satisfactory and consistent with the terms of the investment management agreement.
Performance of the Fund
In considering the Fund’s performance, the Trustees regularly review and discuss throughout the year data prepared by APAM and information comparing the Fund’s performance with the performance of its peer group
Pioneer High Income Municipal Fund | Semiannual Report | 2/28/21 35
of funds, as classified by Morningstar, Inc. (Morningstar), and with the performance of the Fund’s benchmark index. They also discuss the Fund’s performance with APAM on a regular basis.
The Trustees discussed the Fund’s performance with APAM on a more frequent basis in light of the Fund’s unfavorable performance compared to its benchmark index and peers over certain periods. The Trustees noted APAM’s explanation for the Fund’s relative performance and the steps taken by APAM to address the Fund’s performance, including enhancing the investment process used for the Fund. The Trustees’ regular reviews and discussions were factored into the Trustees’ deliberations concerning the renewal of the investment management agreement.
Management Fee and Expenses
The Trustees considered information showing the fees and expenses of the Fund in comparison to the management fees of its peer group of funds as classified by Morningstar and also to the expense ratios of a peer group of funds selected on the basis of criteria determined by the Independent Trustees for this purpose using data provided by Strategic Insight Mutual Fund Research and Consulting, LLC (Strategic Insight), an independent third party. The peer group comparisons referred to below are organized in quintiles. Each quintile represents one-fifth of the peer group. In all peer group comparisons referred to below, first quintile is most favorable to the Fund’s shareowners. The Trustees noted that they separately review and consider the impact of the Fund’s transfer agency and Fund- and APAM-paid expenses for sub-transfer agency and intermediary arrangements, and that the results of the most recent such review were considered in the consideration of the Fund’s expense ratio.
The Trustees considered that the Fund’s management fee for the most recent fiscal year was in the third quintile relative to the management fees paid by other funds in its Morningstar category for the comparable period. The Trustees also considered the breakpoints in the management fee schedule and the reduced fee rates above certain asset levels. The Trustees considered that the expense ratio of the Fund’s Class A shares for the most recent fiscal year was in the second quintile relative to its Strategic Insight peer group for the comparable period. The Trustees considered that the expense ratio of the Fund’s Class Y shares for the most recent fiscal year was in the first quintile relative to its Strategic Insight peer group for the comparable period. The Trustees noted that APAM had agreed to waive fees and/or reimburse expenses in order to limit the ordinary operating expenses of the Fund.
36 Pioneer High Income Municipal Fund | Semiannual Report | 2/28/21
The Trustees reviewed management fees charged by APAM and APIAM to institutional and other clients, including publicly offered European funds sponsored by APAM’s affiliates, unaffiliated U.S. registered investment companies (in a sub-advisory capacity), and unaffiliated foreign and domestic separate accounts. The Trustees also considered APAM’s costs in providing services to the Fund and APAM’s and APIAM’s costs in providing services to the other clients and considered the differences in management fees and profit margins for fund and non-fund services. In evaluating the fees associated with APAM’s and APIAM’s client accounts, the Trustees took into account the respective demands, resources and complexity associated with the Fund and other client accounts. The Trustees noted that, in some instances, the fee rates for those clients were lower than the management fee for the Fund and considered that, under the investment management agreement with the Fund, APAM performs additional services for the Fund that it does not provide to those other clients or services that are broader in scope, including oversight of the Fund’s other service providers and activities related to compliance and the extensive regulatory and tax regimes to which the Fund is subject. The Trustees also considered the entrepreneurial risks associated with APAM’s management of the Fund.
The Trustees concluded that the management fee payable by the Fund to APAM was reasonable in relation to the nature and quality of the services provided by APAM.
Profitability
The Trustees considered information provided by APAM regarding the profitability of APAM with respect to the advisory services provided by APAM to the Fund, including the methodology used by APAM in allocating certain of its costs to the management of the Fund. The Trustees also considered APAM’s profit margin in connection with the overall operation of the Fund. They further reviewed the financial results, including the profit margins, realized by APAM and APIAM from non-fund businesses. The Trustees considered APAM’s profit margins in comparison to the limited industry data available and noted that the profitability of any adviser was affected by numerous factors, including its organizational structure and method for allocating expenses. The Trustees concluded that APAM’s profitability with respect to the management of the Fund was not unreasonable.
Economies of Scale
The Trustees considered APAM’s views relating to economies of scale in connection with the Pioneer Funds as fund assets grow and the extent to which any such economies of scale are shared with the Fund and Fund shareholders. The Trustees noted the breakpoints in the management fee
Pioneer High Income Municipal Fund | Semiannual Report | 2/28/21 37
schedule. The Trustees recognize that economies of scale are difficult to identify and quantify, and that, among other factors that may be relevant, are the following: fee levels, expense subsidization, investment by APAM in research and analytical capabilities and APAM’s commitment and resource allocation to the Fund. The Trustees noted that profitability also may be an indicator of the availability of any economies of scale, although profitability may vary for other reasons including due to reductions in expenses. The Trustees concluded that economies of scale, if any, were being appropriately shared with the Fund.
Other Benefits
The Trustees considered the other benefits that APAM enjoys from its relationship with the Fund. The Trustees considered the character and amount of fees paid or to be paid by the Fund, other than under the investment management agreement, for services provided by APAM and its affiliates. The Trustees further considered the revenues and profitability of APAM’s businesses other than the Fund business. To the extent applicable, the Trustees also considered the benefits to the Fund and to APAM and its affiliates from the use of “soft” commission dollars generated by the Fund to pay for research and brokerage services.
The Trustees considered that Amundi Pioneer is the principal U.S. asset management business of Amundi, which is one of the largest asset managers globally. Amundi’s worldwide asset management business manages over $1.7 trillion in assets (including the Pioneer Funds). The Trustees considered that APAM’s relationship with Amundi creates potential opportunities for APAM, APIAM and Amundi that derive from APAM’s relationships with the Fund, including Amundi’s ability to market the services of APAM globally. The Trustees noted that APAM has access to additional research and portfolio management capabilities as a result of its relationship with Amundi and Amundi’s enhanced global presence that may contribute to an increase in the resources available to APAM. The Trustees considered that APAM and the Fund receive reciprocal intangible benefits from the relationship, including mutual brand recognition and, for the Fund, direct and indirect access to the resources of a large global asset manager. The Trustees concluded that any such benefits received by APAM as a result of its relationship with the Fund were reasonable.
Conclusion
After consideration of the factors described above as well as other factors, the Trustees, including the Independent Trustees, concluded that the investment management agreement for the Fund, including the fees payable thereunder, was fair and reasonable and voted to approve the proposed renewal of the investment management agreement.
38 Pioneer High Income Municipal Fund | Semiannual Report | 2/28/21
(The following financial statements of the Pioneer High Income Municipal Portfolio should be read in conjunction with the Fund’s financial statements.)
Pioneer High Income Municipal Portfolio | Semiannual Report | 2/28/21 39
(unaudited)
| Pioneer High Income Municipal Portfolio | |||
| Principal | |||
| Amount | |||
| USD ($) | Value | ||
| UNAFFILIATED ISSUERS — 95.6% | |||
| DEBTORS IN POSSESSION FINANCING — 1.2% | |||
| of Net Assets# | |||
| Entertainment — 0.3% | |||
| 5,000,000 | Enterprise Development Authority, 12.0%, | ||
| 7/15/24 (144A) | $ 5,645,000 | ||
| Total Entertainment | $ 5,645,000 | ||
| Iron & Steel — 0.9% | |||
| 11,000,000 | United States Steel Corp., 6.25%, 3/15/26 | $ 10,563,850 | |
| 7,500,000 | United States Steel Corp., 6.65%, 6/1/37 | 6,937,500 | |
| Total Iron & Steel | $ 17,501,350 | ||
| TOTAL DEBTORS IN POSSESSION FINANCING | |||
(Cost $23,455,601) | $ 23,146,350 | ||
| MUNICIPAL BONDS — 94.4% of Net Assets(a) | |||
| Alabama — 1.4% | |||
| 2,500,000 | Hoover Industrial Development Board, 5.75%, 10/1/49 | $ 2,740,450 | |
| 3,500,000 | Tuscaloosa County Industrial Development Authority, | ||
| Hunt Refining Project, Series A, 4.5%, 5/1/32 (144A) | 3,831,345 | ||
| 17,500,000 | Tuscaloosa County Industrial Development Authority, | ||
| Hunt Refining Project, Series A, 5.25%, 5/1/44 (144A) | 19,403,125 | ||
| Total Alabama | $ 25,974,920 | ||
| Alaska — 2.0% | |||
| 5,420,000 | Northern Tobacco Securitization Corp., 5.0%, 6/1/32 | $ 5,434,255 | |
| 32,735,000 | Northern Tobacco Securitization Corp., 5.0%, 6/1/46 | 32,861,357 | |
| Total Alaska | $ 38,295,612 | ||
| Arizona — 1.8% | |||
| 1,675,000 | Arizona Industrial Development Authority, Doral | ||
Academy Nevada Fire Mesa, Series A, 5.0%, | |||
| 7/15/49 (144A) | $ 1,865,699 | ||
| 9,400,000 | City of Phoenix, AZ, Industrial Development Authority, | ||
Deer Valley Veterans Assisted Living Project, | |||
| 5.125%, 7/1/36 | 9,477,456 | ||
| 12,865,000 | City of Phoenix, Industrial Development Authority, | ||
3rd & Indian School Assisted Living Project, | |||
| 5.4%, 10/1/36 | 13,263,429 | ||
| 1,000,000 | Industrial Development Authority of the County of | ||
| Pima, Facility Desert Heights Charter, 7.0%, 5/1/34 | 1,099,400 | ||
| 3,000,000 | Industrial Development Authority of the County of | ||
| Pima, Facility Desert Heights Charter, 7.25%, 5/1/44 | 3,289,440 | ||
| 1,700,000 | Tempe Industrial Development Authority, 6.125%, | ||
| 10/1/47 (144A) | 1,746,512 | ||
| 2,400,000 | Tempe Industrial Development Authority, 6.125%, | ||
| 10/1/52 (144A) | 2,459,040 | ||
| Total Arizona | $ 33,200,976 | ||
The accompanying notes are an integral part of these financial statements.
40 Pioneer High Income Municipal Portfolio | Semiannual Report | 2/28/21
| Principal | |||
| Amount | |||
| USD ($) | Value | ||
| Arkansas — 1.9% | |||
| 32,265,000 | Arkansas Development Finance Authority, Big River | ||
Steel Project, 4.5%, 9/1/49 (144A) | $ 34,906,536 | ||
| Total Arkansas | $ 34,906,536 | ||
| California — 11.2% | |||
| 12,025,000 | California Educational Facilities Authority, | ||
5.0%, 5/1/45 | $ 17,488,438 | ||
| 4,495,000 | California Educational Facilities Authority, Stanford | ||
University, Series U-7, 5.0%, 6/1/46 | 6,567,779 | ||
| 11,020,000 | California Educational Facilities Authority, Stanford | ||
University, Series V-1, 5.0%, 5/1/49 | 16,557,550 | ||
| 2,910,000 | California Municipal Finance Authority, 4.75%, | ||
12/1/31 (144A) | 2,973,875 | ||
| 185,000 | California Municipal Finance Authority, 5.0%, | ||
12/1/36 (144A) | 208,896 | ||
| 2,000,000 | California Municipal Finance Authority, 5.0%, | ||
12/1/46 (144A) | 2,183,000 | ||
| 2,000,000 | California Municipal Finance Authority, 5.0%, | ||
11/1/49 (144A) | 2,183,780 | ||
| 2,000,000 | California Municipal Finance Authority, 5.0%, | ||
12/1/54 (144A) | 2,173,000 | ||
| 6,115,000 | California Municipal Finance Authority, 5.25%, | ||
12/1/36 (144A) | 6,246,228 | ||
| 4,530,000 | California Municipal Finance Authority, 5.5%, | ||
12/1/39 (144A) | 4,588,120 | ||
| 1,600,000 | California Municipal Finance Authority, 5.5%, | ||
11/1/45 (144A) | 1,874,992 | ||
| 1,550,000 | California Municipal Finance Authority, John Adams | ||
Academics Project, 5.25%, 10/1/45 | 1,621,114 | ||
| 250,000 | California Municipal Finance Authority, John Adams | ||
Academics Project, Series A, 5.0%, 10/1/35 | 260,640 | ||
| 500,000 | California Municipal Finance Authority, Santa Rosa | ||
Academy Project, 5.125%, 7/1/35 (144A) | 543,695 | ||
| 1,575,000 | California Municipal Finance Authority, Santa Rosa | ||
Academy Project, 5.375%, 7/1/45 (144A) | 1,703,882 | ||
| 6,300,000 | California Municipal Finance Authority, Santa Rosa | ||
Academy Project, Series A, 6.0%, 7/1/42 | 6,557,418 | ||
| 2,900,000(b) | California School Finance Authority, Classical | ||
Academies Project, Series A, 7.375%, 10/1/43 | 3,211,083 | ||
| 830,000 | California School Finance Authority, School View | ||
Park Elementary & Middle School, Series A, | |||
5.625%, 10/1/34 | 904,841 | ||
| 2,175,000 | California School Finance Authority, School View | ||
Park Elementary & Middle School, Series A, | |||
5.875%, 10/1/44 | 2,376,296 |
The accompanying notes are an integral part of these financial statements.
Pioneer High Income Municipal Portfolio | Semiannual Report | 2/28/21 41
Schedule of Investments | 2/28/21
(unaudited) (continued)
| Principal | |||
| Amount | |||
| USD ($) | Value | ||
| California — (continued) | |||
| 1,000,000 | California School Finance Authority, School View | ||
Park Elementary & Middle School, Series A, | |||
6.0%, 10/1/49 | $ 1,096,680 | ||
| 215,000 | California School Finance Authority, View Park | ||
Elementary & Middle School, Series A, 4.75%, 10/1/24 | 229,330 | ||
| 3,230,000 | California School Finance Authority, View Park High | ||
School, Series A, 7.125%, 10/1/48 (144A) | 3,593,956 | ||
| 1,875,000 | California Statewide Communities Development | ||
Authority, 5.0%, 11/1/41 (144A) | 2,207,363 | ||
| 1,560,000 | California Statewide Communities Development | ||
Authority, Baptist University, Series A, | |||
6.125%, 11/1/33 | 1,777,870 | ||
| 4,030,000 | California Statewide Communities Development | ||
Authority, Baptist University, Series A, | |||
6.375%, 11/1/43 | 4,571,672 | ||
| 1,000,000 | California Statewide Communities Development | ||
Authority, Loma Linda University Medical Center, | |||
Series A, 5.25%, 12/1/43 (144A) | 1,182,960 | ||
| 13,095,000 | California Statewide Communities Development | ||
Authority, Loma Linda University Medical Center, | |||
Series A, 5.25%, 12/1/56 (144A) | 14,781,636 | ||
| 10,000,000 | California Statewide Communities Development | ||
Authority, Loma Linda University Medical Center, | |||
Series A, 5.5%, 12/1/58 (144A) | 11,695,100 | ||
| 700,000 | City of Oroville CA, 5.25%, 4/1/34 | 806,995 | |
| 4,730,000 | City of Oroville CA, 5.25%, 4/1/39 | 5,424,932 | |
| 8,415,000 | City of Oroville CA, 5.25%, 4/1/49 | 9,514,925 | |
| 13,200,000 | City of Oroville, Oroville Hospital, 5.25%, 4/1/54 | 14,823,204 | |
| 30,830,000 | Golden State Tobacco Securitization Corp., | ||
5.0%, 6/1/47 | 31,890,244 | ||
| 11,815,000 | Golden State Tobacco Securitization Corp., | ||
5.25%, 6/1/47 | 12,280,038 | ||
| 9,825,000 | Golden State Tobacco Securitization Corp., | ||
Asset-Backed, Series A-2, 5.3%, 6/1/37 | 10,184,988 | ||
| 2,500,000(c) | Pittsburg Unified School District Financing Authority, | ||
Capital Appreciation General Obligation | |||
Pittsburg, 9/1/41 (AGM Insured) | 1,472,075 | ||
| 1,925,000(c) | Pittsburg Unified School District Financing Authority, | ||
Capital Appreciation General Obligation | |||
Pittsburg, 9/1/42 (AGM Insured) | 1,095,248 | ||
| 1,000,000 | Tobacco Securitization Authority of Northern | ||
California, 4.0%, 6/1/49 | 1,149,720 | ||
| Total California | $ 210,003,563 |
The accompanying notes are an integral part of these financial statements.
42 Pioneer High Income Municipal Portfolio | Semiannual Report | 2/28/21
| Principal | |||
| Amount | |||
| USD ($) | Value | ||
| Colorado — 3.0% | |||
| 4,535,000(d) | 2000 Holly Metropolitan District, 5.0%, 12/1/50 | $ 4,812,406 | |
| 577,000(d) | 2000 Holly Metropolitan District, 7.5%, 12/15/50 | 591,569 | |
| 865,000(d) | Belleview Village Metropolitan District, 4.95%, 12/1/50 | 892,429 | |
| 2,000,000(b) | Colorado Educational & Cultural Facilities Authority, | ||
Rocky Mountain Classical Academy Project, | |||
8.0%, 9/1/43 | 2,367,940 | ||
| 5,000,000(b) | Colorado Educational & Cultural Facilities Authority, | ||
Rocky Mountain Classical Academy Project, | |||
8.125%, 9/1/48 | 5,935,300 | ||
| 1,250,000(d) | Cottonwood Highlands Metropolitan District No. 1, | ||
Series A, 5.0%, 12/1/49 | 1,326,938 | ||
| 2,090,000(d) | Cottonwood Highlands Metropolitan District No. 1, | ||
Series B, 8.75%, 12/15/49 | 2,246,374 | ||
| 2,840,000(d) | Crystal Crossing Metropolitan District, 5.25%, 12/1/40 | 3,020,965 | |
| 3,379,000 | Dominion Water & Sanitation District, 6.0%, 12/1/46 | 3,538,421 | |
| 3,550,000(d) | Green Valley Ranch East Metropolitan District No 6, | ||
5.875%, 12/1/50 | 3,830,734 | ||
| 7,635,000(d) | Larkridge Metropolitan District No. 2, 5.25%, 12/1/48 | 8,160,593 | |
| 3,327,000(d) | Littleton Village Metropolitan District No. 2, 5.375%, | ||
12/1/45 | 3,430,237 | ||
| 1,125,000 | Nine Mile Metropolitan District, 4.625%, 12/1/30 | 1,182,296 | |
| 2,500,000 | Nine Mile Metropolitan District, 5.125%, 12/1/40 | 2,676,850 | |
| 1,000,000(d) | Ridgeline Vista Metropolitan District, 5.25%, 12/1/60 | 981,320 | |
| 1,000,000(d) | Settler’s Crossing Metropolitan District No 1, 5.0%, | ||
12/1/40 (144A) | 1,073,610 | ||
| 2,130,000(d) | Settler’s Crossing Metropolitan District No 1, 5.125%, | ||
12/1/50 (144A) | 2,277,481 | ||
| 597,000(d) | Settler’s Crossing Metropolitan District No 1, 7.625%, | ||
12/15/50 | 629,423 | ||
| 1,875,000(d) | Village at Dry Creek Metropolitan District No 2, 4.375%, | ||
12/1/44 | 1,928,925 | ||
| 1,250,000(d) | Villas Metropolitan District, 5.125%, 12/1/48 | 1,326,225 | |
| 1,240,000(d) | Willow Bend Metropolitan District, 5.0%, 12/1/39 | 1,328,028 | |
| 1,460,000(d) | Willow Bend Metropolitan District, 5.0%, 12/1/49 | 1,552,549 | |
| 755,000(d) | Willow Bend Metropolitan District, 7.625%, 12/15/49 | 793,573 | |
| Total Colorado | $ 55,904,186 | ||
| District of Columbia — 0.7% | |||
| 735,000 | District of Columbia Tobacco Settlement Financing | ||
Corp., Asset-Backed, 6.75%, 5/15/40 | $ 754,397 | ||
| 10,000,000(d) | District of Columbia, Series A, 5.0%, 10/15/44 | 12,544,400 | |
| Total District of Columbia | $ 13,298,797 |
The accompanying notes are an integral part of these financial statements.
Pioneer High Income Municipal Portfolio | Semiannual Report | 2/28/21 43
Schedule of Investments | 2/28/21
(unaudited) (continued)
| Principal | |||
| Amount | |||
| USD ($) | Value | ||
| Florida — 0.2% | |||
| 500,000 | Capital Trust Agency, Inc., 5.0%, 7/1/43 | $ 273,555 | |
| 750,000 | Capital Trust Agency, Inc., 5.0%, 7/1/53 | 415,800 | |
| 500,000 | Capital Trust Agency, Inc., 5.25%, 7/1/48 | 273,070 | |
| 700,000 | County of Lake FL, 5.0%, 1/15/39 (144A) | 773,871 | |
| 1,525,000 | County of Lake FL, 5.0%, 1/15/49 (144A) | 1,659,642 | |
| 850,000 | County of Lake FL, 5.0%, 1/15/54 (144A) | 922,505 | |
| Total Florida | $ 4,318,443 | ||
| Guam — 0.1% | |||
| 1,100,000 | Guam Economic Development & Commerce | ||
Authority, 5.625%, 6/1/47 | $ 1,080,937 | ||
| Total Guam | $ 1,080,937 | ||
| Illinois — 14.0% | |||
| 1,305,000(d) | Chicago Board of Education, 5.0%, 12/1/44 | $ 1,455,780 | |
| 4,275,000(d) | Chicago Board of Education, 5.0%, 12/1/46 | 4,768,677 | |
| 15,000,000(d) | Chicago Board of Education, 5.0%, 12/1/46 | 16,926,750 | |
| 35,000(d) | Chicago Board of Education, 5.25%, 12/1/41 | 35,633 | |
| 5,000,000(d) | Chicago Board of Education, 5.5%, 12/1/31 | ||
(AMBAC Insured) | 6,374,400 | ||
| 1,650,000 | Chicago Board of Education, 5.75%, 4/1/35 | 1,967,147 | |
| 8,010,000 | Chicago Board of Education, 6.0%, 4/1/46 | 9,433,778 | |
| 6,500,000(d) | Chicago Board of Education, 6.138%, 12/1/39 | 7,723,560 | |
| 5,000,000(d) | Chicago Board of Education, 6.519%, 12/1/40 | 6,187,950 | |
| 2,415,000(d) | Chicago Board of Education Project, Series C, | ||
5.25%, 12/1/39 | 2,620,589 | ||
| 2,035,000(d) | Chicago Board of Education, Series A, 5.0%, 12/1/33 | 2,354,129 | |
| 925,000(d) | Chicago Board of Education, Series A, 5.0%, 12/1/41 | 939,754 | |
| 12,075,000(d) | Chicago Board of Education, Series A, 5.0%, 12/1/42 | 12,515,979 | |
| 1,575,000(d) | Chicago Board of Education, Series A, 5.5%, 12/1/39 | 1,606,153 | |
| 1,000,000(d) | Chicago Board of Education, Series A, 7.0%, | ||
12/1/46 (144A) | 1,253,740 | ||
| 8,000,000(d) | Chicago Board of Education, Series B, 6.5%, 12/1/46 | 9,556,160 | |
| 3,250,000(d) | Chicago Board of Education, Series D, 5.0%, 12/1/31 | 3,804,027 | |
| 10,000,000(d) | City of Chicago IL, 5.0%, 1/1/28 | 11,948,500 | |
| 3,435,000(d) | City of Chicago IL, 5.5%, 1/1/30 | 3,888,317 | |
| 9,200,000(d) | City of Chicago IL, 5.5%, 1/1/35 | 10,971,736 | |
| 17,000,000(d) | City of Chicago IL, 5.5%, 1/1/49 | 19,760,120 | |
| 7,975,000(d) | City of Chicago IL, 6.0%, 1/1/38 | 9,411,058 | |
| 4,000,000(d) | City of Chicago IL, 6.314%, 1/1/44 | 4,795,200 | |
| 2,000,000(d) | City of Chicago, Series A, 5.0%, 1/1/44 | 2,272,600 | |
| 4,495,000 | City of Plano IL Special Service Area No 3 & No 4, | ||
4.0%, 3/1/35 | 4,737,685 |
The accompanying notes are an integral part of these financial statements.
44 Pioneer High Income Municipal Portfolio | Semiannual Report | 2/28/21
| Principal | |||
| Amount | |||
| USD ($) | Value | ||
| Illinois — (continued) | |||
| 1,591,212(c) | Illinois Finance Authority, 11/15/52 | $ 123,096 | |
| 2,520,597(e) | Illinois Finance Authority, 4.0%, 11/15/52 | 2,562,187 | |
| 4,050,000 | Illinois Finance Authority, 6.0%, 11/15/36 | 4,002,575 | |
| 865,000 | Illinois Finance Authority, Norwegian American | ||
Hospital, Inc., 7.625%, 9/15/28 | 867,517 | ||
| 4,700,000 | Illinois Finance Authority, Norwegian American | ||
Hospital, Inc., 7.75%, 9/15/38 | 4,802,648 | ||
| 10,000,000 | Illinois State Toll Highway Authority, 5.0%, 1/1/45 | 12,402,800 | |
| 5,000,000(c) | Metropolitan Pier & Exposition Authority, 12/15/56 | 1,460,700 | |
| 10,000,000 | Metropolitan Pier & Exposition Authority, 4.0%, 6/15/50 | 10,798,300 | |
| 25,000,000 | Metropolitan Pier & Exposition Authority, 5.0%, 6/15/50 | 29,169,750 | |
| 23,000,000 | Metropolitan Pier & Exposition Authority, Mccormick | ||
Place Expansion, 5.0%, 6/15/57 | 26,533,490 | ||
| 2,830,000 | Metropolitan Pier & Exposition Authority, McCormick | ||
Place, Series B, 5.0%, 6/15/52 (ST APPROP Insured) | 2,928,993 | ||
| 7,690,000(f) | Southwestern Illinois Development Authority, | ||
Comprehensive Mental Health Center, 6.625%, 6/1/37 | 5,306,100 | ||
| 1,415,000 | Southwestern Illinois Development Authority, Village | ||
of Sauget Project, 5.625%, 11/1/26 | 1,344,278 | ||
| 1,225,000 | Village of Matteson IL, 6.5%, 12/1/35 | 1,345,736 | |
| 1,139,000 | Village of Volo IL Special Service Area No 17, | ||
5.5%, 3/1/47 | 1,200,677 | ||
| Total Illinois | $ 262,158,269 | ||
| Indiana — 7.0% | |||
| 2,745,000 | City of Anderson IN, 5.375%, 1/1/40 | $ 2,765,999 | |
| 775,000 | City of Evansville IN, 4.8%, 1/1/28 | 780,929 | |
| 6,475,000 | City of Evansville, Silver Birch Evansville Project, | ||
5.45%, 1/1/38 | 6,507,440 | ||
| 700,000 | City of Fort Wayne IN, 5.125%, 1/1/32 | 710,073 | |
| 4,665,000 | City of Fort Wayne IN, 5.35%, 1/1/38 | 4,719,767 | |
| 24,990,000 | City of Hammond, Custodial Receipts Cabelas | ||
Project, 7.5%, 2/1/29 (144A) | 25,073,716 | ||
| 1,275,000 | City of Kokomo, IN, Silver Birch of Kokomo, | ||
5.75%, 1/1/34 | 1,332,095 | ||
| 7,825,000 | City of Kokomo, IN, Silver Birch of Kokomo, | ||
5.875%, 1/1/37 | 8,206,704 | ||
| 1,230,000 | City of Lafayette, IN, Glasswater Creek Lafayette | ||
Project, 5.6%, 1/1/33 | 1,269,545 | ||
| 6,000,000 | City of Lafayette, IN, Glasswater Creek Lafayette | ||
Project, 5.8%, 1/1/37 | 6,172,140 | ||
| 1,000,000 | City of Mishawaka IN, 5.1%, 1/1/32 (144A) | 1,006,380 | |
| 5,890,000 | City of Mishawaka, Silver Birch Mishawaka Project, | ||
5.375%, 1/1/38 (144A) | 5,904,548 |
The accompanying notes are an integral part of these financial statements.
Pioneer High Income Municipal Portfolio | Semiannual Report | 2/28/21 45
Schedule of Investments | 2/28/21
(unaudited) (continued)
| Principal | |||
| Amount | |||
| USD ($) | Value | ||
| Indiana — (continued) | |||
| 1,905,000 | City of Muncie, IN, Silver Birch Muncie Project, | ||
5.05%, 1/1/31 | $ 1,955,121 | ||
| 5,510,000 | City of Muncie, IN, Silver Birch Muncie Project, | ||
5.25%, 1/1/37 | 5,614,690 | ||
| 4,560,000 | City of Terre Haute IN, 5.35%, 1/1/38 | 4,595,978 | |
| 4,000,000(b) | Hospital Authority of Vigo County, Union Hospital, | ||
Inc., 8.0%, 9/1/41 | 4,148,440 | ||
| 7,500,000 | Indiana Finance Authority, 5.0%, 7/1/44 | 7,989,300 | |
| 1,405,000 | Indiana Finance Authority, 5.0%, 7/1/48 | 1,494,976 | |
| 1,705,000 | Indiana Finance Authority, 5.25%, 1/1/51 | 1,822,099 | |
| 5,190,000 | Indiana Finance Authority, Educational Facilities, | ||
5.125%, 7/1/37 | 5,459,724 | ||
| 330,000 | Indiana Finance Authority, Multipurpose Educational | ||
Facilities, Avondale Meadows Academy Project, | |||
5.375%, 7/1/47 | 360,244 | ||
| 1,940,000 | Indiana Finance Authority, Sanders Glen Project, | ||
Series A, 4.25%, 7/1/43 | 1,788,641 | ||
| 1,920,000 | Indiana Finance Authority, Sanders Glen Project, | ||
Series A, 4.5%, 7/1/53 | 1,764,960 | ||
| 11,985,000 | Indiana Housing & Community Development Authority, | ||
5.0%, 1/1/39 (144A) | 11,996,985 | ||
| 8,505,000 | Indiana Housing & Community Development Authority, | ||
Evergreen Village Bloomington Project, 5.5%, 1/1/37 | 8,572,360 | ||
| 8,000,000 | Town of Plainfield IN Multifamily Housing Revenue, | ||
5.375%, 9/1/38 | 8,076,240 | ||
| Total Indiana | $ 130,089,094 | ||
| Iowa — 1.4% | |||
| 8,000,000 | Iowa Finance Authority, 4.75%, 8/1/42 | $ 8,243,440 | |
| 2,500,000 | Iowa Tobacco Settlement Authority, 5.375%, 6/1/38 | 2,500,250 | |
| 4,255,000 | Iowa Tobacco Settlement Authority, 5.6%, 6/1/34 | 4,255,425 | |
| 6,385,000 | Iowa Tobacco Settlement Authority, Asset Backed, | ||
Series C, 5.625%, 6/1/46 | 6,385,639 | ||
| 4,960,000 | Iowa Tobacco Settlement Authority, Asset-Backed, | ||
Series C, 5.5%, 6/1/42 | 4,960,496 | ||
| Total Iowa | $ 26,345,250 | ||
| Kansas — 0.7% | |||
| 400,000 | Kansas Development Finance Authority, | ||
5.25%, 11/15/33 | $ 403,264 | ||
| 11,215,000 | Kansas Development Finance Authority, | ||
5.25%, 11/15/53 | 10,877,541 | ||
| 2,000,000 | Kansas Development Finance Authority, | ||
5.5%, 11/15/38 | 2,035,900 | ||
| Total Kansas | $ 13,316,705 |
The accompanying notes are an integral part of these financial statements.
46 Pioneer High Income Municipal Portfolio | Semiannual Report | 2/28/21
| Principal | |||
| Amount | |||
| USD ($) | Value | ||
| Maryland — 0.3% | |||
| 4,160,000 | Maryland Economic Development Corp., | ||
5.0%, 3/31/41 | $ 4,585,651 | ||
| 915,000 | Maryland Health & Higher Educational Facilities | ||
Authority, City Neighbors, Series A, 6.75%, 7/1/44 | 985,949 | ||
| Total Maryland | $ 5,571,600 | ||
| Massachusetts — 1.4% | |||
| 11,500,000 | Massachusetts Development Finance Agency, | ||
5.0%, 7/1/50 | $ 17,641,115 | ||
| 4,500,000 | Massachusetts Development Finance Agency, 5.125%, | ||
11/15/46 (144A) | 4,846,995 | ||
| 765,000 | Massachusetts Development Finance Agency, | ||
Adventcare Project, 7.625%, 10/15/37 | 382,500 | ||
| 2,000,000 | Massachusetts Development Finance Agency, | ||
Adventcare Project, Series A, 6.75%, 10/15/37 | 1,460,000 | ||
| 1,250,000 | Massachusetts Development Finance Agency, | ||
International Charter School, 5.0%, 4/15/40 | 1,361,163 | ||
| 917,706(c) | Massachusetts Development Finance Agency, Linden | ||
Ponds, Inc., Series B, 11/15/56 | 179,283 | ||
| Total Massachusetts | $ 25,871,056 | ||
| Michigan — 3.0% | |||
| 8,565,000 | David Ellis Academy-West, 5.25%, 6/1/45 | $ 8,723,709 | |
| 1,250,000 | Flint Michigan Hospital Building Authority, Hurley | ||
Medical Center, Series A, 5.25%, 7/1/39 | 1,334,638 | ||
| 5,485,000 | Flint Michigan International Academy, 5.75%, 10/1/37 | 5,494,160 | |
| 60,000,000(c) | Michigan Finance Authority, 6/1/65 | 7,407,000 | |
| 1,105,000 | Michigan Finance Authority, 5.0%, 6/1/40 | 1,431,240 | |
| 2,000,000 | Michigan Finance Authority, 5.0%, 6/1/49 | 2,457,720 | |
| 5,720,000 | Michigan Finance Authority, 5.75%, 4/1/40 | 6,357,322 | |
| 7,125,000(e) | Michigan Strategic Fund, Michigan Department | ||
Offices Lease Series B, 7.75%, 3/1/40 | 7,845,480 | ||
| 4,000,000(e) | Michigan Strategic Fund, Series B, 6.625%, 11/1/41 | 4,560,000 | |
| 7,550,000 | University of Michigan, 5.0%, 4/1/50 | 9,569,776 | |
| Total Michigan | $ 55,181,045 | ||
| Minnesota — 1.9% | |||
| 1,935,000 | Bloomington Port Authority, Radisson Blu Mall of | ||
America, 9.0%, 12/1/35 | $ 1,869,674 | ||
| 4,210,000 | City of Bethel MN, 5.0%, 7/1/48 | 4,508,952 | |
| 1,000,000 | City of Bethel MN, 5.0%, 7/1/53 | 1,068,210 | |
| 2,600,000 | City of Brooklyn Park, Prairie Seeds Academy Project, | ||
Series A, 5.0%, 3/1/34 | 2,703,636 | ||
| 2,000,000 | City of Brooklyn Park, Prairie Seeds Academy Project, | ||
Series A, 5.0%, 3/1/39 | 2,064,400 | ||
| 3,515,000 | City of Deephaven MN, 5.0%, 7/1/55 | 3,845,972 |
The accompanying notes are an integral part of these financial statements.
Pioneer High Income Municipal Portfolio | Semiannual Report | 2/28/21 47
Schedule of Investments | 2/28/21
(unaudited) (continued)
| Principal | |||
| Amount | |||
| USD ($) | Value | ||
| Minnesota — (continued) | |||
| 400,000 | City of Deephaven, MN, Eagle Ridge Academy Project, | ||
Series A, 5.25%, 7/1/37 | $ 442,944 | ||
| 1,500,000 | City of Deephaven, MN, Eagle Ridge Academy Project, | ||
Series A, 5.5%, 7/1/50 | 1,652,565 | ||
| 1,500,000 | City of Rochester MN, 5.125%, 9/1/38 | 1,601,775 | |
| 3,145,000 | City of Rochester MN, 5.25%, 9/1/43 | 3,510,229 | |
| 6,080,000 | City of Rochester MN, 5.375%, 9/1/50 | 6,778,106 | |
| 2,000,000 | Housing & Redevelopment Authority of The City of | ||
St Paul Minnesota, Great River School Project, Series A, | |||
5.5%, 7/1/52 (144A) | 2,181,840 | ||
| 1,415,000 | Housing & Redevelopment Authority of The City of | ||
St. Paul Minnesota, Higher Ground Academy Project, | |||
Series A, 5.125%, 12/1/38 | 1,470,044 | ||
| 1,300,000 | Housing & Redevelopment Authority of The City of | ||
St. Paul Minnesota, St. Paul City School Project, | |||
Series A, 5.0%, 7/1/36 | 1,362,413 | ||
| Total Minnesota | $ 35,060,760 | ||
| Missouri — 0.5% | |||
| 4,700,000 | Community Memorial Hospital District, 6.68%, 12/1/34 | $ 4,709,541 | |
| 400,000 | Kansas City Industrial Development Authority, | ||
Series A, 4.25%, 4/1/26 (144A) | 413,600 | ||
| 1,000,000 | Kansas City Industrial Development Authority, | ||
Series A, 5.0%, 4/1/36 (144A) | 1,044,560 | ||
| 2,300,000 | Kansas City Industrial Development Authority, | ||
Series A, 5.0%, 4/1/46 (144A) | 2,375,808 | ||
| Total Missouri | $ 8,543,509 | ||
| Nevada — 0.0%† | |||
| 4,000,000(c) | City of Reno NV, 7/1/58 (144A) | $ 548,040 | |
| Total Nevada | $ 548,040 | ||
| New Jersey — 2.7% | |||
| 975,000 | New Jersey Economic Development Authority, 4.7%, | ||
9/1/28 (144A) | $ 1,019,987 | ||
| 1,255,000 | New Jersey Economic Development Authority, | ||
5.25%, 10/1/38 (144A) | 1,365,653 | ||
| 565,000 | New Jersey Economic Development Authority, | ||
5.375%, 9/1/33 (144A) | 603,013 | ||
| 7,205,000 | New Jersey Economic Development Authority, | ||
5.375%, 10/1/50 (144A) | 7,795,162 | ||
| 1,140,000 | New Jersey Economic Development Authority, | ||
5.625%, 9/1/38 (144A) | 1,212,276 | ||
| 6,125,000 | New Jersey Economic Development Authority, | ||
5.75%, 9/1/50 (144A) | 6,434,680 | ||
| 1,215,000 | New Jersey Economic Development Authority, | ||
Charter Hatikvah International Academy, 5.25%, | |||
7/1/37 (144A) | 1,287,560 |
The accompanying notes are an integral part of these financial statements.
48 Pioneer High Income Municipal Portfolio | Semiannual Report | 2/28/21
| Principal | |||
| Amount | |||
| USD ($) | Value | ||
| New Jersey — (continued) | |||
| 2,500,000 | New Jersey Economic Development Authority, | ||
| Charter Hatikvah International Academy, 5.375%, | |||
| 7/1/47 (144A) | $ 2,648,675 | ||
| 4,500,000 | New Jersey Health Care Facilities Financing Authority, | ||
| St Peters University Hospital, 6.25%, 7/1/35 | 4,557,240 | ||
| 2,355,000 | New Jersey Transportation Trust Fund Authority, | ||
| 3.0%, 6/15/50 | 2,413,922 | ||
| 18,605,000 | Tobacco Settlement Financing Corp., Series B, | ||
| 5.0%, 6/1/46 | 22,014,924 | ||
| Total New Jersey | $ 51,353,092 | ||
| New Mexico — 1.2% | |||
| 4,795,000 | County of Otero, NM, Otero County Jail Project, | ||
| 9.0%, 4/1/23 | $ 4,735,110 | ||
| 16,040,000(e) | County of Otero, NM, Otero County Jail Project, | ||
| 9.0%, 4/1/28 | 15,839,500 | ||
| 1,750,000 | Lower Petroglyphs Public Improvement District, | ||
| 5.0%, 10/1/48 | 1,911,648 | ||
| Total New Mexico | $ 22,486,258 | ||
| New York — 11.8% | |||
| 475,000 | Buffalo & Erie County Industrial Land Development | ||
| Corp., 5.0%, 10/1/28 (144A) | $ 533,235 | ||
| 4,150,000 | Buffalo & Erie County Industrial Land Development | ||
| Corp., 5.0%, 10/1/38 (144A) | 4,550,682 | ||
| 10,000,000(f) | Erie County Industrial Development Agency, Galvstar | ||
| LLC Project, Series A, 9.25%, 10/1/30 | 1,250,000 | ||
| 8,000,000(f) | Erie County Industrial Development Agency, Galvstar | ||
| LLC Project, Series B, 9.25%, 10/1/30 | 1,890,000 | ||
| 1,795,000(f) | Erie County Industrial Development Agency, Galvstar | ||
| LLC, Series C, 9.25%, 10/1/30 | 424,069 | ||
| 8,755,000 | Erie Tobacco Asset Securitization Corp, 5.0%, 6/1/45 | 8,771,634 | |
| 17,100,000(c) | Metropolitan Transportation Authority, 11/15/32 | 12,594,150 | |
| 9,000,000(c) | Metropolitan Transportation Authority, 11/15/33 | 6,357,330 | |
| 1,870,000 | Metropolitan Transportation Authority, 5.0%, 11/15/25 | 2,185,544 | |
| 2,000,000 | Metropolitan Transportation Authority, 5.0%, 11/15/33 | 2,406,520 | |
| 3,000,000 | Metropolitan Transportation Authority, 5.0%, 11/15/43 | 3,585,420 | |
| 4,395,000 | Metropolitan Transportation Authority, 5.0%, 11/15/46 | 4,943,760 | |
| 9,500,000 | Metropolitan Transportation Authority, 5.0%, 11/15/48 | 11,278,115 | |
| 5,850,000 | Metropolitan Transportation Authority, 5.0%, 11/15/56 | 6,615,941 | |
| 17,000,000 | Metropolitan Transportation Authority, 5.25%, 11/15/55 | 20,557,080 | |
| 4,845,000 | Metropolitan Transportation Authority, 5.25%, 11/15/56 | 5,549,608 | |
| 21,410,000 | Nassau County Tobacco Settlement Corp., | ||
| Asset-Backed, Series A-3, 5.0%, 6/1/35 | 21,626,883 |
The accompanying notes are an integral part of these financial statements.
Pioneer High Income Municipal Portfolio | Semiannual Report | 2/28/21 49
Schedule of Investments | 2/28/21
(unaudited) (continued)
| Principal | |||
| Amount | |||
| USD ($) | Value | ||
| New York — (continued) | |||
| 4,740,000 | Nassau County Tobacco Settlement Corp., | ||
Asset-Backed, Series A-3, 5.125%, 6/1/46 | $ 4,788,016 | ||
| 605,000 | New York Counties Tobacco Trust IV, 5.0%, 6/1/42 | 612,647 | |
| 18,800,000 | New York Counties Tobacco Trust IV, 6.25%, | ||
6/1/41 (144A) | 20,305,504 | ||
| 13,120,000 | New York Counties Tobacco Trust IV, Series A, | ||
5.0%, 6/1/45 | 13,285,837 | ||
| 51,600,000(c) | New York Counties Tobacco Trust V, Capital | ||
Appreciation Pass Through, Sub Series S-4A, | |||
6/1/60 (144A) | 2,105,796 | ||
| 2,000,000 | New York Counties Tobacco Trust VI, 5.0%, 6/1/45 | 2,119,100 | |
| 4,000,000 | New York Transportation Development Corp., | ||
4.375%, 10/1/45 | 4,584,720 | ||
| 5,000,000 | New York Transportation Development Corp., | ||
5.0%, 10/1/40 | 6,065,150 | ||
| 3,210,000 | Riverhead Industrial Development Agency, | ||
7.65%, 8/1/34 | 3,294,359 | ||
| 15,050,000 | Suffolk Tobacco Asset Securitization Corp., Capital | ||
Appreciation, Series C, 6.625%, 6/1/44 | 15,698,204 | ||
| 9,030,000 | Suffolk Tobacco Asset Securitization Corp., Series B, | ||
6.0%, 6/1/48 | 9,042,010 | ||
| 3,000,000 | TSASC, Inc., 5.0%, 6/1/45 | 3,274,080 | |
| 19,500,000 | TSASC, Inc., 5.0%, 6/1/48 | 21,011,250 | |
| Total New York | $ 221,306,644 | ||
| Ohio — 3.7% | |||
| 53,500,000 | Buckeye Tobacco Settlement Financing Authority, | ||
5.0%, 6/1/55 | $ 60,187,500 | ||
| 715,000 | Ohio Housing Finance Agency, 5.125%, 1/1/32 (144A) | 719,312 | |
| 4,775,000 | Ohio Housing Finance Agency, Sanctuary Springboro | ||
Project, 5.45%, 1/1/38 (144A) | 4,827,286 | ||
| 2,900,000 | Southeastern Ohio Port Authority, Refunding And | ||
Improvement Memorial Health System, 6.0%, 12/1/42 | 3,002,254 | ||
| Total Ohio | $ 68,736,352 | ||
| Pennsylvania — 4.4% | |||
| 200,000 | Chester County Industrial Development Authority, | ||
5.25%, 10/15/32 | $ 208,070 | ||
| 1,000,000 | Chester County Industrial Development Authority, | ||
Collegium Charter School, Series A, 5.125%, 10/15/37 | 1,101,510 | ||
| 2,435,000 | Chester County Industrial Development Authority, | ||
Collegium Charter School, Series A, 5.25%, 10/15/47 | 2,658,557 | ||
| 8,425,000 | Delaware County Industrial Development Authority, | ||
Chester Charter School Arts Project, Series A, 5.125%, | |||
6/1/46 (144A) | 9,100,769 |
The accompanying notes are an integral part of these financial statements.
50 Pioneer High Income Municipal Portfolio | Semiannual Report | 2/28/21
| Principal | |||
| Amount | |||
| USD ($) | Value | ||
| Pennsylvania — (continued) | |||
| 4,000,000 | Hospitals & Higher Education Facilities Authority of | ||
Philadelphia, Temple University Health System, | |||
Series A, 5.625%, 7/1/42 | $ 4,177,880 | ||
| 8,445,000 | Pennsylvania Economic Development Financing | ||
Authority, US Airways Group, Series B, 8.0%, 5/1/29 | 8,483,087 | ||
| 1,030,000 | Philadelphia Authority for Industrial Development, | ||
5.0%, 11/15/31 | 1,070,500 | ||
| 1,570,000 | Philadelphia Authority for Industrial Development, | ||
5.0%, 3/15/45 (144A) | 1,656,067 | ||
| 8,295,000 | Philadelphia Authority for Industrial Development, | ||
5.0%, 11/15/50 | 8,318,641 | ||
| 1,660,000 | Philadelphia Authority for Industrial Development, | ||
5.125%, 6/1/38 (144A) | 1,790,161 | ||
| 3,500,000 | Philadelphia Authority for Industrial Development, | ||
5.25%, 6/1/48 (144A) | 3,766,700 | ||
| 4,370,000 | Philadelphia Authority for Industrial Development, | ||
5.375%, 6/1/53 (144A) | 4,699,280 | ||
| 9,435,000 | Philadelphia Authority for Industrial Development, | ||
5.5%, 6/1/49 (144A) | 9,953,453 | ||
| 4,055,000 | Philadelphia Authority for Industrial Development, | ||
2800 American Street Co. Project, Series A, 5.625%, | |||
7/1/48 (144A) | 4,362,693 | ||
| 2,200,000 | Philadelphia Authority for Industrial Development, | ||
Greater Philadelphia Health Action, Inc. Project, Series | |||
A, 6.5%, 6/1/45 | 2,342,824 | ||
| 2,940,000 | Philadelphia Authority for Industrial Development, | ||
Greater Philadelphia Health Action, Inc., Project, Series | |||
A, 6.625%, 6/1/50 | 3,133,217 | ||
| 2,500,000 | Philadelphia Authority for Industrial Development, | ||
Green Woods Charter School Project, Series A, 5.5%, | |||
6/15/32 | 2,556,400 | ||
| 5,200,000 | Philadelphia Authority for Industrial Development, | ||
Green Woods Charter School Project, Series A, 5.75%, | |||
6/15/42 | 5,320,900 | ||
| 6,000,000(b) | Philadelphia Authority for Industrial Development, | ||
Nueva Esperanze, Inc., 8.2%, 12/1/43 | 6,840,720 | ||
| Total Pennsylvania | $ 81,541,429 | ||
| Puerto Rico — 5.0% | |||
| 42,400,000(d)(f) | Commonwealth of Puerto Rico, 8.0%, 7/1/35 | $ 32,913,000 | |
| 2,460,000 | Puerto Rico Industrial Tourist Educational Medical & | ||
Envirml Ctl Facs Fing Auth, 5.2%, 7/1/24 | 2,470,332 | ||
| 85,000 | Puerto Rico Industrial Tourist Educational Medical & | ||
Envirml Ctl Facs Fing Auth, 5.625%, 7/1/22 | 85,383 | ||
| 3,598,000 | Puerto Rico Sales Tax Financing Corp. Sales Tax | ||
Revenue, 4.75%, 7/1/53 | 3,917,970 |
The accompanying notes are an integral part of these financial statements.
Pioneer High Income Municipal Portfolio | Semiannual Report | 2/28/21 51
Schedule of Investments | 2/28/21
(unaudited) (continued)
| Principal | |||
| Amount | |||
| USD ($) | Value | ||
| Puerto Rico — (continued) | |||
| 19,958,000 | Puerto Rico Sales Tax Financing Corp. Sales Tax | ||
Revenue, 4.784%, 7/1/58 | $ 21,604,535 | ||
| 29,308,000 | Puerto Rico Sales Tax Financing Corp. Sales Tax | ||
Revenue, 5.0%, 7/1/58 | 32,386,512 | ||
| Total Puerto Rico | $ 93,377,732 | ||
| Rhode Island — 0.4% | |||
| 2,065,000(f) | Central Falls Detention Facility Corp., 7.25%, 7/15/35 | $ 371,700 | |
| 2,000,000(e) | Tender Option Bond Trust Receipts/Certificates, | ||
RIB, 0.0%, 9/1/47 (144A) | 2,934,160 | ||
| 4,250,000 | Tobacco Settlement Financing Corp., Series B, | ||
5.0%, 6/1/50 | 4,547,160 | ||
| Total Rhode Island | $ 7,853,020 | ||
| Texas — 3.9% | |||
| 640,000 | Arlington Higher Education Finance Corp., 3.5%, | ||
3/1/24 (144A) | $ 659,155 | ||
| 16,875,000 | Arlington Higher Education Finance Corp., 5.45%, | ||
3/1/49 (144A) | 18,371,981 | ||
| 170,000 | Arlington Higher Education Finance Corp., Universal | ||
Academy, Series A, 5.875%, 3/1/24 | 182,809 | ||
| 525,000 | Arlington Higher Education Finance Corp., Universal | ||
Academy, Series A, 6.625%, 3/1/29 | 566,102 | ||
| 375,000 | Arlington Higher Education Finance Corp., Universal | ||
Academy, Series A, 7.0%, 3/1/34 | 410,460 | ||
| 7,030,000 | Arlington Higher Education Finance Corp., Universal | ||
Academy, Series A, 7.125%, 3/1/44 | 7,625,511 | ||
| 540,000 | City of Celina, TX, 5.5%, 9/1/24 | 563,404 | |
| 1,040,000 | City of Celina, TX, 6.0%, 9/1/30 | 1,093,092 | |
| 2,650,000 | City of Celina, TX, 6.25%, 9/1/40 | 2,784,858 | |
| 3,335,000(e) | Greater Texas Cultural Education Facilities Finance | ||
Corp., 9.0%, 2/1/33 (144A) | 3,209,571 | ||
| 16,755,000(e) | Greater Texas Cultural Education Facilities Finance | ||
Corp., 9.0%, 2/1/50 (144A) | 17,376,275 | ||
| 100,000 | La Vernia Higher Education Finance Corp., 5.25%, | ||
8/15/35 (144A) | 108,715 | ||
| 2,000,000 | La Vernia Higher Education Finance Corp., Meridian | ||
World School, Series A, 5.5%, 8/15/45 (144A) | 2,165,160 | ||
| 1,250,000 | New Hope Cultural Education Facilities Finance | ||
Corp., Cardinal Bay, Inc., Village On The Park, | |||
5.5%, 7/1/46 | 1,023,737 | ||
| 1,000,000 | New Hope Cultural Education Facilities Finance | ||
Corp., Cardinal Bay, Inc., Village On The Park, | |||
5.75%, 7/1/51 | 831,910 |
The accompanying notes are an integral part of these financial statements.
52 Pioneer High Income Municipal Portfolio | Semiannual Report | 2/28/21
| Principal | |||
| Amount | |||
| USD ($) | Value | ||
| Texas — (continued) | |||
| 90,000 | New Hope Cultural Education Facilities Finance Corp., | ||
Cardinal Bay, Inc., Village On The Park, 6.0%, | |||
7/1/26 | $ 84,911 | ||
| 1,350,000 | New Hope Cultural Education Facilities Finance Corp., | ||
Cardinal Bay, Inc., Village On The Park, 7.0%, | |||
7/1/51 | 1,138,847 | ||
| 1,700,000 | Newark Higher Education Finance Corp., | ||
5.0%, 6/15/48 | 1,725,636 | ||
| 17,350,000(f) | Sanger Industrial Development Corp., Texas Pellets | ||
Project, Series B, 8.0%, 7/1/38 | 4,272,438 | ||
| 8,142,447 | Tarrant County Cultural Education Facilities Finance | ||
Corp., 5.75%, 12/1/54 | 8,675,126 | ||
| 1,000,000(f) | Texas Midwest Public Facility Corp., Secure Treatment | ||
Facility Project, 9.0%, 10/1/30 | 350,000 | ||
| Total Texas | $ 73,219,698 | ||
| Utah — 0.4% | |||
| 255,000(g) | Utah Charter School Finance Authority, Summit | ||
Academy High School, Series A, 7.25%, 5/15/21 | $ 258,748 | ||
| 1,985,000(b) | Utah Charter School Finance Authority, Summit | ||
Academy High School, Series A, 8.125%, 5/15/31 | 2,015,589 | ||
| 5,145,000(b) | Utah Charter School Finance Authority, Summit | ||
Academy High School, Series A, 8.5%, 5/15/41 | 5,227,886 | ||
| Total Utah | $ 7,502,223 | ||
| Virginia — 5.9% | |||
| 3,000,000 | Ballston Quarter Community Development Authority, | ||
Series A, 5.5%, 3/1/46 | $ 2,706,000 | ||
| 2,100,000 | Cherry Hill Community Development Authority, | ||
Potomac Shores Project, 5.4%, 3/1/45 (144A) | 2,204,496 | ||
| 810,000 | Embrey Mill Community Development Authority, | ||
5.3%, 3/1/35 (144A) | 859,685 | ||
| 4,645,000 | Embrey Mill Community Development Authority, | ||
5.6%, 3/1/45 (144A) | 4,941,769 | ||
| 44,310,000 | Tobacco Settlement Financing Corp., Series B-1, | ||
5.0%, 6/1/47 | 44,314,431 | ||
| 14,000,000(c) | Tobacco Settlement Financing Corp./VA, 6/1/47 | 3,083,780 | |
| 4,605,000 | Tobacco Settlement Financing Corp./VA, 5.2%, 6/1/46 | 4,704,468 | |
| 21,585,000 | Tobacco Settlement Financing Corp./VA, | ||
6.706%, 6/1/46 | 22,841,247 | ||
| 13,225,000 | Virginia Small Business Financing Authority, | ||
5.0%, 1/1/40 | 13,609,319 | ||
| 925,000 | Virginia Small Business Financing Authority, | ||
5.0%, 1/1/44 | 952,001 | ||
| 10,000,000 | Virginia Small Business Financing Authority, | ||
5.0%, 7/1/49 | 10,286,800 | ||
| Total Virginia | $ 110,503,996 |
The accompanying notes are an integral part of these financial statements.
Pioneer High Income Municipal Portfolio | Semiannual Report | 2/28/21 53
Schedule of Investments | 2/28/21
(unaudited) (continued)
| Principal | |||
| Amount | |||
| USD ($) | Value | ||
| Wisconsin — 2.5% | |||
| 5,905,000 | Public Finance Authority, 5.0%, 10/1/48 | $ 6,455,582 | |
| 2,660,000 | Public Finance Authority, 5.0%, 6/1/50 (144A) | 2,842,290 | |
| 2,500,000 | Public Finance Authority, 5.375%, 6/1/52 | 2,507,425 | |
| 775,000 | Public Finance Authority, Community School of | ||
| Davidson Project, 5.0%, 10/1/33 | 874,618 | ||
| 1,590,000 | Public Finance Authority, Coral Academy Science | ||
| Las Vegas, 5.625%, 7/1/44 | 1,726,056 | ||
| 9,310,000 | Public Finance Authority, Gardner Webb University, | ||
| 5.0%, 7/1/31 (144A) | 10,181,695 | ||
| 5,325,000 | Public Finance Authority, Glenridge Palmer Ranch, | ||
| Series A, 8.25%, 6/1/46 (144A) | 5,494,335 | ||
| 5,057,500 | Public Finance Authority, Las Ventanas Retirement | ||
| Community, 7.0%, 10/1/42 | 5,084,305 | ||
| 400,000 | Public Finance Authority, Lead Academy Project, | ||
| Series A, 4.25%, 8/1/26 (144A) | 427,128 | ||
| 2,000,000 | Public Finance Authority, Lead Academy Project, | ||
| Series A, 5.0%, 8/1/36 (144A) | 2,100,200 | ||
| 2,500,000 | Public Finance Authority, Lead Academy Project, | ||
| Series A, 5.125%, 8/1/46 (144A) | 2,613,450 | ||
| 500,000 | Public Finance Authority, SearStone CCRC Project, | ||
| Series A, 5.3%, 6/1/47 | 501,015 | ||
| 10,340,000(c)(f) | Public Finance Authority, Springshire Pre Development | ||
| Project, 12/1/20 (144A) | 1,777,446 | ||
| 1,245,000(b) | Public Finance Authority, Voyager Foundation, Inc., | ||
| Project, Series A, 5.125%, 10/1/45 | 1,335,624 | ||
| 2,815,000(b) | Public Finance Authority, Voyager Foundation, Inc., | ||
| Project, Series A, 6.2%, 10/1/42 | 3,063,114 | ||
| Total Wisconsin | $ 46,984,283 | ||
| TOTAL MUNICIPAL BONDS | |||
(Cost $1,710,072,293) | $ 1,764,534,025 | ||
| TOTAL INVESTMENTS IN UNAFFILIATED ISSUERS — 95.6% | |||
(Cost $1,733,527,894) (h) | $ 1,787,680,375 | ||
| OTHER ASSETS AND LIABILITIES — 4.4% | $ 82,664,308 | ||
| NET ASSETS — 100.0% | $ 1,870,344,683 |
AGM | Assured Guaranty Municipal Corp. |
AMBAC | American Municipal Bond Association Corporation. |
RIB | Residual Interest Bond is purchased in a secondary market. The interest rate is subject to change periodically and inversely based upon prevailing market rates. The interest rate shown is the rate at February 28, 2021. |
ST APPROP | State Appropriations. |
The accompanying notes are an integral part of these financial statements.
54 Pioneer High Income Municipal Portfolio | Semiannual Report | 2/28/21
(144A) | Security is exempt from registration under Rule 144A of the Securities Act of 1933. Such securities may be resold normally to qualified institutional buyers in a transaction exempt from registration. At February 28, 2021, the value of these securities amounted to $360,356,516, or 19.3% of net assets. |
† | Amount rounds to less than 0.1%. |
(a) | Consists of Revenue Bonds unless otherwise indicated. |
(b) | Pre-refunded bonds have been collateralized by U.S. Treasury or U.S. Government Agency securities which are held in escrow to pay interest and principal on the tax exempt issue and to retire the bonds in full at the earliest refunding date. |
(c) | Security issued with a zero coupon. Income is recognized through accretion of discount. |
(d) | Represents a General Obligation Bond. |
(e) | The interest rate is subject to change periodically. The interest rate and/or reference index and spread shown at February 28, 2021. |
(f) | Security is in default. |
(g) | Escrow to maturity. |
(h) | The concentration of investments by type of obligation/market sector is as follows: Revenue Bonds: |
Education Revenue | 25.0 | % | ||
Tobacco Revenue | 22.9 | |||
General Obligation | 15.3 | |||
Development Revenue | 13.8 | |||
Health Revenue | 13.4 | |||
Transportation Revenue | 6.5 | |||
Facilities Revenue | 1.6 | |||
Other Revenue | 1.3 | |||
Water Revenue | 0.2 | |||
Pollution Control Revenue | 0.0 | † | ||
100.0 | % |
† Amount rounds to less than 0.1%. |
# Securities are restricted as to resale.
| Acquisition | |||
| Restricted Securities | date | Cost | Value |
Enterprise Development Authority | 6/6/2019 | $ 5,228,533 | $ 5,645,000 |
United States Steel Corp. | 1/15/2021 | 10,838,923 | 10,563,850 |
United States Steel Corp. | 1/20/2021 | 7,388,145 | 6,937,500 |
| Total Restricted Securities | $23,146,350 | ||
| % of Net Assets | 1.2% |
The accompanying notes are an integral part of these financial statements.
Pioneer High Income Municipal Portfolio | Semiannual Report | 2/28/21 55
Schedule of Investments | 2/28/21
(unaudited) (continued)
Purchases and sales of securities (excluding temporary cash investments) for the period ended February 28, 2021, aggregated $125,840,082 and $66,917,170, respectively.
The Portfolio is permitted to engage in purchase and sale transactions (“cross trades”) with certain funds and accounts for which Amundi Asset Management US, Inc. (the “Adviser”) serves as the Portfolio’s investment adviser, as set forth in Rule 17a-7 under the Investment Company Act of 1940, pursuant to procedures adopted by the Board of Trustees. Under these procedures, cross trades are effected at current market prices. During the period ended February 28, 2021, the Portfolio did not engage in any cross trade activity.
At February 28, 2021, the net unrealized appreciation on investments based on cost for federal tax purposes of $1,742,961,339 was as follows:
| Aggregate gross unrealized appreciation for all investments in which | |
| there is an excess of value over tax cost | $ 153,580,968 |
| Aggregate gross unrealized depreciation for all investments in which | |
| there is an excess of tax cost over value | (108,861,932) |
| Net unrealized appreciation | $ 44,719,036 |
Various inputs are used in determining the value of the Portfolio’s investments. These inputs are summarized in the three broad levels below.
Level 1 – unadjusted quoted prices in active markets for identical securities.
Level 2 – other significant observable inputs (including quoted prices for similar securities, interest rates, prepayment speeds, credit risks, etc.).
Level 3 – significant unobservable inputs (including the Portfolio’s own assumptions in determining fair value of investments).
The following is a summary of the inputs used as of February 28, 2021, in valuing the Portfolio’s investments:
| Level 1 | Level 2 | Level 3 | Total | |||||||||||||
Debtors in Possession Financing | $ | — | $ | 23,146,350 | $ | — | $ | 23,146,350 | ||||||||
Municipal Bonds | — | 1,764,534,025 | — | 1,764,534,025 | ||||||||||||
| Total Investments in Securities | $ | — | $ | 1,787,680,375 | $ | — | $ | 1,787,680,375 | ||||||||
During the period ended February 28, 2021, there were no transfers in or out of Level 3.
The accompanying notes are an integral part of these financial statements.
56 Pioneer High Income Municipal Portfolio | Semiannual Report | 2/28/21
(unaudited)
| ASSETS: | ||||
| Investments in unaffiliated issuers, at value (cost $1,733,527,894) | $ | 1,787,680,375 | ||
| Cash | 65,650,048 | |||
| Receivables — | ||||
| Investment securities sold | 406,000 | |||
| Interest | 23,958,258 | |||
| Other assets | 1,642,730 | |||
| Total assets | $ | 1,879,337,411 | ||
| LIABILITIES: | ||||
| Payables — | ||||
| Investment securities purchased | $ | 3,914,368 | ||
| Value of withdrawals | 5,000,000 | |||
| Trustees’ fees | 14,425 | |||
| Accrued expenses | 63,935 | |||
| Total liabilities | $ | 8,992,728 | ||
| NET ASSETS: | ||||
| Paid-in capital | $ | 1,799,172,984 | ||
| Distributable earnings | 71,171,699 | |||
| Net assets | $ | 1,870,344,683 | ||
The accompanying notes are an integral part of these financial statements.
Pioneer High Income Municipal Portfolio | Semiannual Report | 2/28/21 57
Statement of Operations (unaudited)
FOR THE PERIOD ENDED 2/28/21*
| INVESTMENT INCOME: | ||||||||
| Interest from unaffiliated issuers | $ | 15,873,332 | ||||||
| Total investment income | $ | 15,873,332 | ||||||
| EXPENSES: | ||||||||
| Administrative expense | $ | 15,004 | ||||||
| Transfer agent fees | 3,629 | |||||||
| Custodian fees | 5,950 | |||||||
| Professional fees | 48,525 | |||||||
| Printing expense | 19,425 | |||||||
| Pricing fees | 2,450 | |||||||
| Trustees’ fees | 14,425 | |||||||
| Total expenses | $ | 109,408 | ||||||
| Net investment income | $ | 15,763,924 | ||||||
| REALIZED AND UNREALIZED GAIN (LOSS) ON INVESTMENTS: | ||||||||
| Net realized gain (loss) on: | ||||||||
| Investments in unaffiliated issuers | $ | 1,255,294 | ||||||
| Change in net unrealized appreciation (depreciation) on: | ||||||||
| Investments in unaffiliated issuers | $ | 54,152,481 | ||||||
| Net realized and unrealized gain (loss) on investments | $ | 55,407,775 | ||||||
| Net increase in net assets resulting from operations | $ | 71,171,699 | ||||||
* For the period from December 21, 2020 (commencement of operations) to February 28, 2021.
The accompanying notes are an integral part of these financial statements.
58 Pioneer High Income Municipal Portfolio | Semiannual Report | 2/28/21
Statements of Changes in Net Assets
| Period | ||||
| Ended | ||||
| 2/28/21* | ||||
| (unaudited) | ||||
| FROM OPERATIONS: | ||||
Net investment income (loss) | $ | 15,763,924 | ||
Net realized gain (loss) on investments | 1,255,294 | |||
Change in net unrealized appreciation (depreciation) on investments | 54,152,481 | |||
| Net increase in net assets resulting from operations | $ | 71,171,699 | ||
| FROM CAPITAL TRANSACTIONS: | ||||
Proceeds from contributions | $ | 62,684,749 | ||
Value of withdrawals | (24,510,000 | ) | ||
In-kind subscriptions | 1,760,998,235 | |||
| Net increase in net assets resulting from capital transactions | $ | 1,799,172,984 | ||
| Net increase in net assets | $ | 1,870,344,683 | ||
| NET ASSETS: | ||||
Beginning of period | $ | — | ||
End of period | $ | 1,870,344,683 | ||
* For the period from December 21, 2020 (commencement of operations) to February 28, 2021.
The accompanying notes are an integral part of these financial statements.
Pioneer High Income Municipal Portfolio | Semiannual Report | 2/28/21 59
Financial Highlights (unaudited) | ||||
| Period Ended | ||||
| 2/28/21* | ||||
| Total return(a) | 1.00 | %(b) | ||
| Ratio of net expenses to average net assets | 0.03 | %(c) | ||
| Ratio of net investment income (loss) to average net assets | 4.63 | %(c) | ||
| Portfolio turnover rate | 4 | %(b) | ||
| Net assets, end of period (in thousands) | $ | 1,870,345 | ||
* | For the period from December 21, 2020 (commencement of operations) to February 28, 2021. |
(a) | Assumes initial investment at net asset value at the beginning of each period, reinvestment of all distributions, the complete redemption of the investment at net asset value at the end of each period and no sales charges. |
(b) | Not annualized. |
(c) | Annualized. |
The accompanying notes are an integral part of these financial statements.
60 Pioneer High Income Municipal Portfolio | Semiannual Report | 2/28/21
(unaudited)
1. Organization and Significant Accounting Policies
Pioneer High Income Municipal Portfolio (the “Portfolio”) is a diversified series of Pioneer Core Trust I (the “Trust”), an open-end management investment company established as a Delaware statutory trust on October 14, 2020. The Portfolio is registered under the Investment Company Act of 1940 as a diversified, open-end management investment company. The investment objective of the Portfolio is to maximize total return through a combination of income that is exempt from regular federal income tax and capital appreciation.
The Declaration of Trust permits the Trustees to issue beneficial interests in the Portfolio. At February 28, 2021, all investors in the Portfolio were funds advised by the investment adviser of the Portfolio. At February 28, 2021, Pioneer High Income Municipal Fund owned approximately 99.999% of the Portfolio and Pioneer MAP-High Income Municipal Fund owned approximately 0.001% of the Portfolio. On December 21, 2020 the Fund had assets with a cost basis of $1,707,674,760 and a Value of $1,760,998,235 that were transferred to the Portfolio.
Amundi Asset Management US, Inc., an indirect, wholly owned subsidiary of Amundi and Amundi’s wholly owned subsidiary, Amundi USA, Inc., serves as the Portfolio’s investment adviser (the “Adviser”). Prior to January 1, 2021, the Adviser was named Amundi Pioneer Asset Management, Inc. Amundi Distributor US, Inc., an affiliate of Amundi Asset Management US, Inc., serves as the Portfolio’s placement agent (the “Placement Agent”). The Portfolio offers beneficial interests through the Placement Agent.
In August 2018, the Financial Accounting Standards Board (FASB) issued Accounting Standards Update 2018-13 “Disclosure Framework - Changes to the Disclosure Requirements for Fair Value Measurement” (“ASU 2018-13”) which modifies disclosure requirements for fair value measurements, principally for Level 3 securities and transfers between levels of the fair value hierarchy. ASU 2018-13 is effective for fiscal years beginning after December 15, 2019 and for interim periods within those fiscal years. The Portfolio has adopted ASU 2018-13 for the six months ended January 31, 2021. The impact to the Portfolio’s adoption was limited to changes in the Portfolio’s disclosures regarding fair value, primarily those disclosures related to transfers between levels of the fair value hierarchy and disclosure of the range and weighted average used to develop significant unobservable inputs for Level 3 fair value investments, when applicable.
Pioneer High Income Municipal Portfolio | Semiannual Report | 2/28/21 61
In March 2020, FASB issued an Accounting Standard Update, ASU 2020-04, Reference Rate Reform (Topic 848) — Facilitation of the Effects of Reference Rate Reform on Financial Reporting (“ASU 2020-04”), which provides optional, temporary relief with respect to the financial reporting of contracts subject to certain types of modifications due to the planned discontinuation of the London Interbank Offered Rate (“LIBOR”) and other LIBOR-based reference rates at the end of 2021. The temporary relief provided by ASU 2020-04 is effective for certain reference rate-related contract modifications that occur during the period from March 12, 2020 through December 31, 2022. Management is evaluating the impact of ASU 2020-04 on the Portfolio’s investments, derivatives, debt and other contracts, if applicable, that will undergo reference rate-related modifications as a result of the reference rate reform.
The Portfolio is an investment company and follows investment company accounting and reporting guidance under U.S. Generally Accepted Accounting Principles (“U.S. GAAP”). U.S. GAAP requires the management of the Portfolio to make estimates and assumptions that affect the reported amounts of assets and liabilities, the disclosure of contingent assets and liabilities at the date of the financial statements, and the reported amounts of income, expenses and gain or loss on investments during the reporting period. Actual results could differ from those estimates.
The following is a summary of significant accounting policies followed by the Portfolio in the preparation of its financial statements:
A. Security Valuation
Investments are stated at value, computed once daily, on each day the New York Stock Exchange (“NYSE”) is open, as of the close of regular trading on the NYSE.
Fixed-income securities are valued by using prices supplied by independent pricing services, which consider such factors as market prices, market events, quotations from one or more brokers, Treasury spreads, yields, maturities and ratings, or may use a pricing matrix or other fair value methods or techniques to provide an estimated value of the security or instrument. A pricing matrix is a means of valuing a debt security on the basis of current market prices for other debt securities, historical trading patterns in the market for fixed-income securities and/or other factors. Non-U.S. debt securities that are listed on an exchange will be valued at the bid price obtained from an independent third party pricing service. When independent third party pricing services are unable to supply prices,
62 Pioneer High Income Municipal Portfolio | Semiannual Report | 2/28/21
or when prices or market quotations are considered to be unreliable, the value of that security may be determined using quotations from one or more broker-dealers.
Securities for which independent pricing services or broker-dealers are unable to supply prices or for which market prices and/or quotations are not readily available or are considered to be unreliable are valued by a fair valuation team comprised of certain personnel of the Adviser pursuant to procedures adopted by the Portfolio’s Board of Trustees. The Adviser’s fair valuation team uses fair value methods approved by the Valuation Committee of the Board of Trustees. The Adviser’s fair valuation team is responsible for monitoring developments that may impact fair valued securities and for discussing and assessing fair values on an ongoing basis, and at least quarterly, with the Valuation Committee of the Board of Trustees.
Inputs used when applying fair value methods to value a security may include credit ratings, the financial condition of the company, current market conditions and comparable securities. The Portfolio may use fair value methods if it is determined that a significant event has occurred after the close of the exchange or market on which the security trades and prior to the determination of the Portfolio’s net asset value. Examples of a significant event might include political or economic news, corporate restructurings, natural disasters, terrorist activity or trading halts. Thus, the valuation of the Portfolio’s securities may differ significantly from exchange prices, and such differences could be material.
At February 28, 2021, no securities were valued using fair value methods (other than securities valued using prices supplied by independent pricing services, broker-dealers or using a third party insurance industry pricing model).
B. Investment Income and Transactions
Interest income, including interest on income-bearing cash accounts, is recorded on the accrual basis. Dividend and interest income are reported net of unrecoverable foreign taxes withheld at the applicable country rates and net of income accrued on defaulted securities.
Interest and dividend income payable by delivery of additional shares is reclassified as PIK (payment-in-kind) income upon receipt and is included in interest and dividend income, respectively.
Security transactions are recorded as of trade date. Gains and losses on sales of investments are calculated on the identified cost method for both financial reporting and federal income tax purposes.
Pioneer High Income Municipal Portfolio | Semiannual Report | 2/28/21 63
The Portfolio makes a daily allocation of its net investment income and realized and unrealized gains and losses from securities to its investors in proportion to their investment in the Portfolio.
C. Federal Income Taxes
The Portfolio is classified as a partnership for federal income tax purposes. As such, each investor in the Portfolio is treated as the owner of its proportionate share of the net assets, income, expenses and realized and unrealized gains and losses of the Portfolio. Therefore, no federal income tax provision is required. It is intended that the Portfolio’s assets will be managed so an investor in the Portfolio can satisfy the requirements of Subchapter M of the Internal Revenue Code.
Management has analyzed the Portfolio’s tax positions taken on income tax returns for all open tax years and has concluded no provision for income tax is required in the Portfolio’s financial statements. The Portfolio’s federal and state income and federal excise tax returns for tax years for which the applicable statutes of limitations have not expired are subject to examination by the Internal Revenue Service and state departments of revenue.
D. Risks
The value of securities held by the Portfolio may go up or down, sometimes rapidly or unpredictably, due to general market conditions, such as real or perceived adverse economic, political or regulatory conditions, recessions, the spread of infectious illness or other public health issues, inflation, changes in interest rates, lack of liquidity in the bond markets or adverse investor sentiment. In the past several years, financial markets have experienced increased volatility, depressed valuations, decreased liquidity and heightened uncertainty. These conditions may continue, recur, worsen or spread. A general rise in interest rates could adversely affect the price and liquidity of fixed-income securities and could also result in increased redemptions from the Portfolio.
At times, the Portfolio’s investments may represent industries or industry sectors that are interrelated or have common risks, making the Portfolio more susceptible to any economic, political, or regulatory developments or other risks affecting those industries and sectors. The Portfolio’s investments in foreign markets and countries with limited developing markets may subject the Portfolio to a greater degree of risk than investments in a developed market. These risks include disruptive political or economic conditions and the imposition of adverse governmental laws or currency exchange restrictions.
64 Pioneer High Income Municipal Portfolio | Semiannual Report | 2/28/21
The Portfolio invests in below-investment-grade (high-yield) debt securities and preferred stocks. Some of these high-yield securities may be convertible into equity securities of the issuer. Debt securities rated below-investment-grade are commonly referred to as “junk bonds” and are considered speculative. These securities involve greater risk of loss, are subject to greater price volatility, and are less liquid, especially during periods of economic uncertainty or change, than higher rated debt securities.
The municipal bond market can be susceptible to unusual volatility, particularly for lower-rated and unrated securities. Liquidity can be reduced unpredictably in response to overall economic conditions or credit tightening. Municipal issuers may be adversely affected by rising health care costs, increasing unfunded pension liabilities, and by the phasing out of federal programs providing financial support. Unfavorable conditions and developments relating to projects financed with municipal securities can result in lower revenues to issuers of municipal securities, potentially resulting in defaults. Issuers often depend on revenues from these projects to make principal and interest payments. The value of municipal securities can also be adversely affected by changes in the financial condition of one or more individual municipal issuers or insurers of municipal issuers, regulatory and political developments, tax law changes or other legislative actions, and by uncertainties and public perceptions concerning these and other factors. Municipal securities may be more susceptible to downgrades or defaults during recessions or similar periods of economic stress. In recent periods, an increasing number of municipal issuers in the United States have defaulted on obligations and commenced insolvency proceedings.
Financial difficulties of municipal issuers may continue or get worse. To the extent the Fund invests significantly in a single state, including California, Illinois, New York and Indiana, or in securities the payments on which are dependent upon a single project or source of revenues, or that relate to a sector or industry, including health care facilities, education, transportation, special revenues and pollution control, the Fund will be more susceptible to associated risks and developments.
The Portfolio’s investments, payment obligations and financing terms may be based on floating rates, such as LIBOR (London Interbank Offered Rate). Plans are underway to phase out the use of LIBOR. The UK Financial Conduct Authority (“FCA”) and LIBOR’s administrator, ICE Benchmark Administration (“IBA”), have announced that most LIBOR rates will no longer be published after the end of 2021 and a majority of U.S. dollar LIBOR rates will no longer be published after June 30, 2023. It is possible
Pioneer High Income Municipal Portfolio | Semiannual Report | 2/28/21 65
that the FCA may compel the IBA to publish a subset of LIBOR settings after these dates on a “synthetic” basis, but any such publications would be considered non-representative of the underlying markets. There remains uncertainty regarding the nature of any replacement rate and the impact of the transition from LIBOR on the Portfolio, issuers of instruments in which the Portfolio invests, and financial markets generally.
With the increased use of technologies such as the Internet to conduct business, the Portfolio is susceptible to operational, information security and related risks. While the Portfolio’s Adviser has established business continuity plans in the event of, and risk management systems to prevent, limit or mitigate, such cyber-attacks, there are inherent limitations in such plans and systems, including the possibility that certain risks have not been identified. Furthermore, the Portfolio cannot control the cybersecurity plans and systems put in place by service providers to the Portfolio such as Brown Brothers Harriman & Co., the Portfolio’s custodian and accounting agent, and DST Asset Manager Solutions, Inc., the Portfolio’s transfer agent. In addition, many beneficial owners of Portfolio shares hold them through accounts at broker-dealers, retirement platforms and other financial market participants over which neither the Portfolio nor the Adviser exercises control. Each of these may in turn rely on service providers to them, which are also subject to the risk of cyber-attacks. Cybersecurity failures or breaches at the Adviser or the Portfolio’s service providers or intermediaries have the ability to cause disruptions and impact business operations, potentially resulting in financial losses, interference with the Portfolio’s ability to calculate its net asset value, impediments to trading, the inability of Portfolio investors to effect contributions or withdrawals from the Portfolio or receive distributions, loss of or unauthorized access to private shareowner information and violations of applicable privacy and other laws, regulatory fines, penalties, reputational damage, or additional compliance costs. Such costs and losses may not be covered under any insurance. In addition, maintaining vigilance against cyber-attacks may involve substantial costs over time, and system enhancements may themselves be subject to cyber-attacks.
COVID-19
The respiratory illness COVID-19 caused by a novel coronavirus has resulted in a global pandemic and major disruption to economies and markets around the world, including the United States. Global financial markets have experienced extreme volatility and severe losses, and trading in many instruments has been disrupted. Liquidity for many instruments has been
66 Pioneer High Income Municipal Portfolio | Semiannual Report | 2/28/21
greatly reduced for periods of time. Some interest rates are very low and in some cases yields are negative. Some sectors of the economy and individual issuers have experienced particularly large losses. These circumstances may continue for an extended period of time, and may continue to affect adversely the value and liquidity of the Portfolio’s investments. The ultimate economic fallout from the pandemic, and the long-term impact on economies, markets, industries and individual issuers, are not known. Governments and central banks, including the Federal Reserve in the U.S., have taken extraordinary and unprecedented actions to support local and global economies and the financial markets. These actions have resulted in significant expansion of public debt, including in the U.S. The impact of these measures, and whether they will be effective to mitigate the economic and market disruption, will not be known for some time. The consequences of high public debt, including its future impact on the economy and securities markets, likewise may not be known for some time.
The Portfolio’s registration statement on Form N-1A contains unaudited information regarding the Portfolio’s principal risks. Please refer to that document when considering the Portfolio’s principal risks.
E. Restricted Securities
Restricted Securities are subject to legal or contractual restrictions on resale. Restricted securities generally are resold in transactions exempt from registration under the Securities Act of 1933. Private placement securities are generally considered to be restricted except for those securities traded between qualified institutional investors under the provisions of Rule 144A of the Securities Act of 1933.
Disposal of restricted investments may involve negotiations and expenses, and prompt sale at an acceptable price may be difficult to achieve. Restricted investments held by the Portfolio at February 28, 2021 are listed in the Schedule of Investments.
2. Management Agreement
The Adviser manages the Portfolio’s portfolio. The Portfolio does not pay a management fee under the Portfolio’s investment advisory agreement with the Adviser.
3. Compensation of Trustees and Officers
The Portfolio pays an annual fee to its Trustees. The Adviser reimburses the Portfolio for fees paid to the Interested Trustees. The Portfolio does not pay any salary or other compensation to its officers. For the period ended February 28, 2021, the Portfolio paid $14,425 in Trustees’ compensation,
Pioneer High Income Municipal Portfolio | Semiannual Report | 2/28/21 67
which is reflected on the Statement of Operations as Trustees’ fees. At February 28, 2021, the Portfolio had a payable for Trustees’ fees on its Statement of Assets and Liabilities of $14,425.
4. Transfer Agent
DST Asset Manager Solutions, Inc. serves as the transfer agent to the Portfolio at negotiated rates. Transfer agent fees and payables shown on the Statement of Operations and the Statement of Assets and Liabilities, respectively.
68 Pioneer High Income Municipal Portfolio | Semiannual Report | 2/28/21
Amundi Pioneer Asset Management, Inc.1 (“APAM”) serves as the investment adviser to Pioneer High Income Municipal Portfolio (the “Fund”) pursuant to an investment management agreement between APAM and the Fund. Based on their evaluation of the information provided by APAM, the Trustees, including the Independent Trustees voting separately, unanimously approved an investment management agreement for the Fund. In approving the investment management agreement, the Trustees considered various factors that they determined were relevant, including the factors described below. The Trustees did not identify any single factor as the controlling factor in determining to approve the agreement.
Nature, Extent and Quality of Services
The Trustees considered the nature, extent and quality of the services that would be provided by APAM to the Fund under the investment management agreement. The Trustees reviewed APAM’s investment approach for the Fund and its research process, and considered the resources of APAM and the personnel of APAM who would provide investment management services to the Fund. The Trustees also considered that, as administrator, APAM would be responsible for the administration of the Fund’s business and other affairs. The Trustees considered the quality of such services provided by APAM to the other Pioneer Funds. The Trustees considered the implementation and effectiveness of APAM’s business continuity plan in response to the COVID-19 pandemic. Based on these considerations, the Trustees concluded that the nature, extent and quality of services that APAM would provide to the Fund were satisfactory and consistent with the terms of the investment management agreement.
Performance of the Fund
The Trustees did not consider the Fund’s performance in approving the investment management agreement because the Fund was newly-offered and did not have a performance history.
Management Fee and Expenses
The Trustees considered that the Fund would not pay a management fee. The Trustees considered that the Fund would be a master fund in a master-feeder structure in which each feeder fund investing in the Fund would have the same investment objective and policies as the Fund. The
1 | Effective January 1, 2021, Amundi Pioneer Asset Management, Inc. changed its name to Amundi Asset Management US, Inc. (“Amundi US”). |
Pioneer High Income Municipal Portfolio | Semiannual Report | 2/28/21 69
Trustees considered that each feeder fund investing in the Fund pays a management fee directly to APAM for its management services to the feeder fund, or is offered through a separately managed account program in which participants pay fees to APAM or an affiliate for management of the separately managed account. The Trustees concluded that the proposed fee and expense structure for the Fund was reasonable in relation to the nature and quality of services to be provided by APAM.
Profitability
The Trustees did not consider APAM’s profitability with respect to the management of the Fund in approving the investment management agreement because the Fund was newly-offered and profitability information was not available.
Economies of Scale
The Trustees considered APAM’s views relating to economies of scale in connection with the Pioneer Funds as fund assets grow and the extent to which any such economies of scale are shared with funds and fund shareholders. The Trustees recognize that economies of scale are difficult to identify and quantify, and that, among other factors that may be relevant, are the following: fee levels, expense subsidization, investment by APAM in research and analytical capabilities and APAM’s commitment and resource allocation to the Fund. The Trustees noted that profitability also may be an indicator of the availability of any economies of scale, although profitability may vary for other reasons including due to reductions in expenses. The Trustees concluded that economies of scale, if any, were being appropriately shared with the Funds.
Other Benefits
The Trustees considered the other potential benefits to APAM from its relationship with the Fund, including the character and amount of fees that would be paid by the Fund, other than under the investment management agreement, for services that would be provided by APAM and its affiliates, and the revenues and profitability of APAM’s businesses other than the fund business. The Trustees considered that APAM is the principal U.S. asset management business of Amundi, which is one of the largest asset managers globally. Amundi’s worldwide asset management business manages over $1.7 trillion in assets (including the Pioneer Funds). The Trustees considered that APAM’s relationship with Amundi creates potential opportunities for APAM and Amundi that derive from APAM’s
70 Pioneer High Income Municipal Portfolio | Semiannual Report | 2/28/21
relationships with the Fund, including Amundi’s ability to market the services of APAM globally. The Trustees noted that APAM has access to additional research and portfolio management capabilities as a result of its relationship with Amundi and Amundi’s enhanced global presence that may contribute to an increase in the resources available to APAM. The Trustees considered that APAM and the Funds receive reciprocal intangible benefits from the relationship, including mutual brand recognition and, for the Funds, direct and indirect access to the resources of a large global asset manager. The Trustees concluded that any such benefits received by APAM as a result of its relationship with the Funds were reasonable.
Conclusion
After consideration of the factors described above as well as other factors, the Trustees, including the Independent Trustees, concluded that the investment management agreement for the Fund, including the fees payable thereunder, was fair and reasonable and voted to approve the proposed renewal of the investment management agreement.
Pioneer High Income Municipal Portfolio | Semiannual Report | 2/28/21 71
| Trustees | Officers |
Thomas J. Perna, Chairman | Lisa M. Jones, President and |
John E. Baumgardner, Jr. | Chief Executive Officer |
Diane Durnin | Mark E. Bradley, Treasurer and |
Benjamin M. Friedman | Chief Financial and |
Lisa M. Jones | Accounting Officer |
Lorraine H. Monchak | Christopher J. Kelley, Secretary and |
Marguerite A. Piret | Chief Legal Officer |
Fred J. Ricciardi | |
Kenneth J. Taubes |
Investment Adviser and Administrator
Amundi Asset Management US, Inc.
Custodian and Sub-Administrator
Brown Brothers Harriman & Co.
Principal Underwriter
Amundi Distributor US, Inc.
Legal Counsel
Morgan, Lewis & Bockius LLP
Transfer Agent
DST Asset Manager Solutions, Inc.
Amundi Asset Management US, Inc.
Custodian and Sub-Administrator
Brown Brothers Harriman & Co.
Principal Underwriter
Amundi Distributor US, Inc.
Legal Counsel
Morgan, Lewis & Bockius LLP
Transfer Agent
DST Asset Manager Solutions, Inc.
Proxy Voting Policies and Procedures of the Fund are available without charge, upon request, by calling our toll free number (1-800-225-6292). Information regarding how the Fund voted proxies relating to fund securities during the most recent 12-month period ended June 30 is publicly available to shareowners at www.amundi.com/us. This information is also available on the Securities and Exchange Commission’s web site at www.sec.gov.
72 Pioneer High Income Municipal Portfolio | Semiannual Report | 2/28/21
This page was intentionally left blank.
Pioneer High Income Municipal Fund | Semiannual Report | 2/28/21 73
This page was intentionally left blank.
74 Pioneer High Income Municipal Fund | Semiannual Report | 2/28/21
This page was intentionally left blank.
Pioneer High Income Municipal Fund | Semiannual Report | 2/28/21 75
This page was intentionally left blank.
76 Pioneer High Income Municipal Fund | Semiannual Report | 2/28/21
How to Contact Amundi
We are pleased to offer a variety of convenient ways for you to contact us for assistance or information.
| Call us for: | |
Account Information, including existing accounts, | |
new accounts, prospectuses, applications | |
and service forms | 1-800-225-6292 |
FactFoneSM for automated fund yields, prices, | |
account information and transactions | 1-800-225-4321 |
| Retirement plans information | 1-800-622-0176 |
Write to us:
Amundi
P.O. Box 219427
Kansas City, MO 64121-9427
Amundi
P.O. Box 219427
Kansas City, MO 64121-9427
| Our toll-free fax | 1-800-225-4240 |
| Our internet e-mail address | us.askamundi@amundi.com |
(for general questions about Amundi only) | |
| Visit our web site: www.amundi.com/us | |
This report must be preceded or accompanied by a prospectus.
The Fund files a complete schedule of portfolio holdings with the Securities and Exchange Commission for the first and third quarters of each fiscal year as an exhibit to its reports on Form N-PORT. Shareholders may view the filed Form N-PORT by visiting the Commission’s web site at https://www.sec.gov.

Amundi Asset Management US, Inc.
60 State Street
Boston, MA 02109
www. amundi. com/us
60 State Street
Boston, MA 02109
www. amundi. com/us
Securities offered through Amundi Distributor US, Inc.,
60 State Street, Boston, MA 02109
Underwriter of Pioneer Mutual Funds, Member SIPC
© 2021 Amundi Asset Management US, Inc. 20563-14-0421
60 State Street, Boston, MA 02109
Underwriter of Pioneer Mutual Funds, Member SIPC
© 2021 Amundi Asset Management US, Inc. 20563-14-0421
ITEM 2. CODE OF ETHICS.
(a) Disclose whether, as of the end of the period covered by the report, the registrant has adopted a code of ethics that applies to the registrant’s principal executive officer, principal financial officer, principal accounting officer or controller, or persons performing similar functions, regardless of whether these individuals are employed by the registrant or a third party. If the registrant has not adopted such a code of ethics, explain why it has not done so.
The registrant has adopted, as of the end of the period covered by this report, a code of ethics that applies to the registrant’s principal executive officer, principal financial officer, principal accounting officer and controller.
(b) For purposes of this Item, the term “code of ethics” means written standards that are reasonably designed to deter wrongdoing and to promote:
(1) Honest and ethical conduct, including the ethical handling of actual or apparent conflicts of interest between personal and professional relationships;
(2) Full, fair, accurate, timely, and understandable disclosure in reports and documents that a registrant files with, or submits to, the Commission and in other public communications made by the registrant;
(3) Compliance with applicable governmental laws, rules, and regulations;
(4) The prompt internal reporting of violations of the code to an appropriate person or persons identified in the code; and
(5) Accountability for adherence to the code.
(c) The registrant must briefly describe the nature of any amendment, during the period covered by the report, to a provision of its code of ethics that applies to the registrant’s principal executive officer, principal financial officer, principal accounting officer or controller, or persons performing similar functions, regardless of whether these individuals are employed by the registrant or a third party, and that relates to any element of the code of ethics definition enumerated in paragraph (b) of this Item. The registrant must file a copy of any such amendment as an exhibit pursuant to Item 10(a), unless the registrant has elected to satisfy paragraph (f) of this Item by posting its code of ethics on its website pursuant to paragraph (f)(2) of this Item, or by undertaking to provide its code of ethics to any person without charge, upon request, pursuant to paragraph (f)(3) of this Item.
The registrant has made no amendments to the code of ethics during the period covered by this report.
(d) If the registrant has, during the period covered by the report, granted a waiver, including an implicit waiver, from a provision of the code of ethics to the registrant’s principal executive officer, principal financial officer, principal accounting officer or controller, or persons performing similar functions, regardless of whether these individuals are employed by the registrant or a third party, that relates to one or more of the items set forth in paragraph (b) of this Item, the registrant must briefly describe the nature of the waiver, the name of the person to whom the waiver was granted, and the date of the waiver.
Not applicable.
(e) If the registrant intends to satisfy the disclosure requirement under paragraph (c) or (d) of this Item regarding an amendment to, or a waiver from, a provision of its code of ethics that applies to the registrant’s principal executive officer, principal financial officer, principal accounting officer or controller, or persons performing similar functions and that relates to any element of the code of ethics definition
enumerated in paragraph (b) of this Item by posting such information on its Internet website, disclose the registrant’s Internet address and such intention.
Not applicable.
(f) The registrant must:
(1) File with the Commission, pursuant to Item 12(a)(1), a copy of its code of ethics that applies to the registrant’s principal executive officer, principal financial officer, principal accounting officer or controller, or persons performing similar functions, as an exhibit to its annual report on this Form N-CSR (see attachment);
(2) Post the text of such code of ethics on its Internet website and disclose, in its most recent report on this Form N-CSR, its Internet address and the fact that it has posted such code of ethics on its Internet website; or
(3) Undertake in its most recent report on this Form N-CSR to provide to any person without charge, upon request, a copy of such code of ethics and explain the manner in which such request may be made. See Item 10(2)
ITEM 3. AUDIT COMMITTEE FINANCIAL EXPERT.
(a) (1) Disclose that the registrant’s board of trustees has determined that the registrant either:
(i) Has at least one audit committee financial expert serving on its audit committee; or
(ii) Does not have an audit committee financial expert serving on its audit committee.
The registrant’s Board of Trustees has determined that the registrant has at least one audit committee financial expert.
(2) If the registrant provides the disclosure required by paragraph (a)(1)(i) of this Item, it must disclose the name of the audit committee financial expert and whether that person is “independent.” In order to be considered “independent” for purposes of this Item, a member of an audit committee may not, other than in his or her capacity as a member of the audit committee, the board of trustees, or any other board committee:
(i) Accept directly or indirectly any consulting, advisory, or other compensatory fee from the issuer; or
(ii) Be an “interested person” of the investment company as defined in Section 2(a)(19) of the Act (15 U.S.C. 80a-2(a)(19)).
Mr. Fred J. Ricciardi, an independent trustee, is such an audit committee financial expert.
(3) If the registrant provides the disclosure required by paragraph (a)(1) (ii) of this Item, it must explain why it does not have an audit committee financial expert.
Not applicable.
ITEM 4. PRINCIPAL ACCOUNTANT FEES AND SERVICES.
(a) Disclose, under the caption AUDIT FEES, the aggregate fees billed for each of the last two fiscal years for professional services rendered by the principal accountant for the audit of the registrant’s annual financial statements or services that are normally provided by the accountant in connection with statutory and regulatory filings or engagements for those fiscal years.
N/A
(b) Disclose, under the caption AUDIT-RELATED FEES, the aggregate fees billed in each of the last two fiscal years for assurance and related services by the principal accountant that are reasonably related to the performance of the audit of the registrant’s financial statements and are not reported under paragraph (a) of this Item. Registrants shall describe the nature of the services comprising the fees disclosed under this category.
N/A
(c) Disclose, under the caption TAX FEES, the aggregate fees billed in each of the last two fiscal years for professional services rendered by the principal accountant for tax compliance, tax advice, and tax planning. Registrants shall describe the nature of the services comprising the fees disclosed under this category.
N/A
(d) Disclose, under the caption ALL OTHER FEES, the aggregate fees billed in each of the last two fiscal years for products and services provided by the principal accountant, other than the services reported in paragraphs (a) through (c) of this Item. Registrants shall describe the nature of the services comprising the fees disclosed under this category.
N/A
(e) (1) Disclose the audit committee’s pre-approval policies and procedures described in paragraph (c)(7) of Rule 2-01 of Regulation S-X.
PIONEER FUNDS
APPROVAL OF AUDIT, AUDIT-RELATED, TAX AND OTHER SERVICES
PROVIDED BY THE INDEPENDENT AUDITOR
SECTION I - POLICY PURPOSE AND APPLICABILITY
The Pioneer Funds recognize the importance of maintaining the independence of their outside auditors. Maintaining independence is a shared responsibility involving Amundi Pioneer Asset Management, Inc, the audit committee and the independent auditors.
The Funds recognize that a Fund’s independent auditors: 1) possess knowledge of the Funds, 2) are able to incorporate certain services into the scope of the audit, thereby avoiding redundant work, cost and disruption of Fund personnel and processes, and 3) have expertise that has value to the Funds. As a result, there are situations where it is desirable to use the Fund’s independent auditors for services in addition to the annual audit and where the potential for conflicts of interests are minimal. Consequently, this policy, which is intended to comply with Rule 210.2-01(C)(7), sets forth guidelines and procedures to be followed by the Funds when retaining the independent audit firm to perform audit, audit-related tax and other services under those circumstances, while also maintaining independence.
Approval of a service in accordance with this policy for a Fund shall also constitute approval for any other Fund whose pre-approval is required pursuant to Rule 210.2-01(c)(7)(ii).
In addition to the procedures set forth in this policy, any non-audit services that may be provided consistently with Rule 210.2-01 may be approved by the Audit Committee itself and any pre-approval that may be waived in accordance with Rule 210.2-01(c)(7)(i)(C) is hereby waived.
Selection of a Fund’s independent auditors and their compensation shall be determined by the Audit Committee and shall not be subject to this policy.
| SECTION II - POLICY | ||
SERVICE CATEGORY | SERVICE CATEGORY DESCRIPTION | SPECIFIC PRE-APPROVED SERVICE SUBCATEGORIES |
I. AUDIT SERVICES | Services that are directly | o Accounting research assistance |
related to performing the | o SEC consultation, registration | |
independent audit of the Funds | statements, and reporting | |
o Tax accrual related matters | ||
o Implementation of new accounting standards | ||
o Compliance letters (e.g. rating agency letters) | ||
o Regulatory reviews and assistance | ||
regarding financial matters | ||
o Semi-annual reviews (if requested) | ||
o Comfort letters for closed end offerings | ||
II. AUDIT-RELATED | Services which are not | o AICPA attest and agreed-upon procedures |
SERVICES | prohibited under Rule | o Technology control assessments |
210.2-01(C)(4) (the “Rule”) | o Financial reporting control assessments | |
and are related extensions of | o Enterprise security architecture | |
the audit services support the | assessment | |
audit, or use the knowledge/expertise | ||
gained from the audit procedures as a | ||
foundation to complete the project. | ||
In most cases, if the Audit-Related | ||
Services are not performed by the | ||
Audit firm, the scope of the Audit | ||
Services would likely increase. | ||
The Services are typically well-defined | ||
and governed by accounting | ||
professional standards (AICPA, | ||
SEC, etc.) | ||
AUDIT COMMITTEE APPROVAL POLICY | AUDIT COMMITTEE REPORTING POLICY | |
| o “One-time” pre-approval | o A summary of all such | |
| for the audit period for all | services and related fees | |
| pre-approved specific service | reported at each regularly | |
| subcategories. Approval of the | scheduled Audit Committee | |
| independent auditors as | meeting. | |
| auditors for a Fund shall | ||
| constitute pre approval for | ||
| these services. | ||
| o “One-time” pre-approval | o A summary of all such | |
| for the fund fiscal year within | services and related fees | |
| a specified dollar limit | (including comparison to | |
| for all pre-approved | specified dollar limits) | |
| specific service subcategories | reported quarterly. | |
| o Specific approval is | |
| needed to exceed the | |
| pre-approved dollar limit for | |
| these services (see general | |
| Audit Committee approval policy | |
| below for details on obtaining | |
| specific approvals) | |
| o Specific approval is | |
| needed to use the Fund’s | |
| auditors for Audit-Related | |
| Services not denoted as | |
| “pre-approved”, or | |
| to add a specific service | |
| subcategory as “pre-approved” | |
SECTION III - POLICY DETAIL, CONTINUED
SERVICE CATEGORY | SERVICE CATEGORY DESCRIPTION | SPECIFIC PRE-APPROVED SERVICE |
SUBCATEGORIES | ||
III. TAX SERVICES | Services which are not | o Tax planning and support |
| prohibited by the Rule, | o Tax controversy assistance | |
| if an officer of the Fund | o Tax compliance, tax returns, excise | |
| determines that using the | tax returns and support | |
| Fund’s auditor to provide | o Tax opinions | |
| these services creates | ||
| significant synergy in | ||
| the form of efficiency, | ||
| minimized disruption, or | ||
| the ability to maintain a | ||
| desired level of | ||
| confidentiality. | ||
| AUDIT COMMITTEE APPROVAL POLICY | AUDIT COMMITTEE REPORTING POLICY |
o “One-time” pre-approval | o A summary of |
for the fund fiscal year | all such services and |
within a specified dollar limit | related fees |
(including comparison | |
to specified dollar | |
limits) reported | |
quarterly. | |
o Specific approval is | |
| needed to exceed the | |
| pre-approved dollar limits for | |
| these services (see general | |
| Audit Committee approval policy | |
| below for details on obtaining | |
| specific approvals) | |
o Specific approval is | |
| needed to use the Fund’s | |
| auditors for tax services not | |
| denoted as pre-approved, or to | |
| add a specific service subcategory as | |
| “pre-approved” | |
SECTION III - POLICY DETAIL, CONTINUED
SERVICE CATEGORY | SERVICE CATEGORY DESCRIPTION | SPECIFIC PRE-APPROVED SERVICE |
SUBCATEGORIES | ||
IV. OTHER SERVICES | Services which are not | o Business Risk Management support |
| prohibited by the Rule, | o Other control and regulatory | |
A. SYNERGISTIC, | if an officer of the Fund | compliance projects |
UNIQUE QUALIFICATIONS | determines that using the | |
| Fund’s auditor to provide | ||
| these services creates | ||
| significant synergy in | ||
| the form of efficiency, | ||
| minimized disruption, | ||
| the ability to maintain a | ||
| desired level of | ||
| confidentiality, or where | ||
| the Fund’s auditors | ||
| posses unique or superior | ||
| qualifications to provide | ||
| these services, resulting | ||
| in superior value and | ||
| results for the Fund. | ||
AUDIT COMMITTEE APPROVAL POLICY | AUDIT COMMITTEE REPORTING POLICY |
o “One-time” pre-approval | o A summary of |
| for the fund fiscal year within | all such services and |
| a specified dollar limit | related fees |
(including comparison | |
to specified dollar | |
limits) reported | |
quarterly. | |
o Specific approval is | |
| needed to exceed the | |
| pre-approved dollar limits for | |
| these services (see general | |
| Audit Committee approval policy | |
| below for details on obtaining | |
| specific approvals) | |
o Specific approval is | |
| needed to use the Fund’s | |
| auditors for “Synergistic” or | |
| “Unique Qualifications” Other | |
| Services not denoted as | |
| pre-approved to the left, or to | |
| add a specific service | |
| subcategory as “pre-approved” | |
SECTION III - POLICY DETAIL, CONTINUED
SERVICE CATEGORY | SERVICE CATEGORY DESCRIPTION | SPECIFIC PROHIBITED SERVICE |
SUBCATEGORIES | ||
PROHIBITED SERVICES | Services which result | 1. Bookkeeping or other services |
| in the auditors losing | related to the accounting records or | |
| independence status | financial statements of the audit | |
| under the Rule. | client* | |
2. Financial information systems design | ||
| and implementation* | ||
3. Appraisal or valuation services, | ||
| fairness* opinions, or | ||
| contribution-in-kind reports | ||
4. Actuarial services (i.e., setting | ||
| actuarial reserves versus actuarial | ||
| audit work)* | ||
5. Internal audit outsourcing services* | ||
6. Management functions or human | ||
| resources | ||
7. Broker or dealer, investment | ||
| advisor, or investment banking services | ||
8. Legal services and expert services | ||
| unrelated to the audit | ||
9. Any other service that the Public | ||
| Company Accounting Oversight Board | ||
| determines, by regulation, is | ||
| impermissible | ||
AUDIT COMMITTEE APPROVAL POLICY | AUDIT COMMITTEE REPORTING POLICY |
o These services are not to be | o A summary of all |
| performed with the exception of the(*) | services and related |
| services that may be permitted | fees reported at each |
| if they would not be subject to audit | regularly scheduled |
| procedures at the audit client (as | Audit Committee meeting |
| defined in rule 2-01(f)(4)) level | will serve as continual |
| the firm providing the service. | confirmation that has |
not provided any | |
restricted services. |
GENERAL AUDIT COMMITTEE APPROVAL POLICY:
o For all projects, the officers of the Funds and the Fund’s auditors will each make an assessment to determine that any proposed projects will not impair independence.
o Potential services will be classified into the four non-restricted service categories and the “Approval of Audit, Audit-Related, Tax and Other Services” Policy above will be applied. Any services outside the specific pre-approved service subcategories set forth above must be specifically approved by the Audit Committee.
o At least quarterly, the Audit Committee shall review a report summarizing the services by service category, including fees, provided by the Audit firm as set forth in the above policy.
(2) Disclose the percentage of services described in each of paragraphs (b) through (d) of this Item that were approved by the audit committee pursuant to paragraph (c)(7)(i)(C) of Rule 2-01 of Regulation S-X.
N/A
(f) If greater than 50 percent, disclose the percentage of hours expended on the principal accountants engagement to audit the registrant’s financial statements for the most recent fiscal year that were attributed to work performed by persons other than the principal accountant’s full-time, permanent employees.
N/A
(g) Disclose the aggregate non-audit fees billed by the registrants accountant for services rendered to the registrant, and rendered to the registrants investment adviser (not including any sub-adviser whose role is primarily portfolio management and is subcontracted with or overseen by another investment adviser), and any entity controlling, controlled by, or under common control with the adviser that provides ongoing services to the registrant for each of the last two fiscal years of the registrant.
N/A
(h) Disclose whether the registrants audit committee of the board of trustees has considered whether the provision of non-audit services that were rendered to the registrants investment adviser (not including any subadviser whose role is primarily portfolio management and is subcontracted with or overseen by another investment adviser), and any entity controlling, controlled by, or under common control with the investment adviser that provides ongoing services to the registrant that were not pre-approved pursuant to paragraph (c)(7)(ii) of Rule 2-01 of Regulation S-X is compatible with maintaining the principal accountant’s independence.
The Fund’s audit committee of the Board of Trustees has considered whether the provision of non-audit services that were rendered to the Affiliates (as defined) that were not pre- approved pursuant to paragraph (c)(7)(ii) of Rule 2-01 of Regulation S-X is compatible with maintaining the principal accountant’s independence.
ITEM 5. AUDIT COMMITTEE OF LISTED REGISTRANTS
(a) If the registrant is a listed issuer as defined in Rule 10A-3 under the Exchange Act (17 CFR 240.10A-3), state whether or not the registrant has a separately-designated standing audit committee established in accordance with Section 3(a)(58)(A) of the Exchange Act (15 U.S.C. 78c(a)(58)(A)). If the registrant has such a committee, however designated, identify each committee member. If the entire board of directors is acting as the registrant’s audit committee as specified in Section 3(a)(58)(B) of the Exchange Act (15 U.S.C. 78c(a)(58)(B)), so state.
N/A
(b) If applicable, provide the disclosure required by Rule 10A-3(d) under the Exchange Act (17 CFR 240.10A-3(d)) regarding an exemption from the listing standards for audit committees.
N/A
ITEM 6. SCHEDULE OF INVESTMENTS.
File Schedule of Investments in securities of unaffiliated issuers as of the close of the reporting period as set forth in 210.1212 of Regulation S-X [17 CFR 210.12-12], unless the schedule is included as part of the report to shareholders filed under Item 1 of this Form.
Included in Item 1
ITEM 7. DISCLOSURE OF PROXY VOTING POLICIES AND PROCEDURES FOR CLOSED-END MANAGEMENT INVESTMENT COMPANIES.
A closed-end management investment company that is filing an annual report on this Form N-CSR must, unless it invests exclusively in non-voting securities, describe the policies and procedures that it uses to determine how to vote proxies relating to portfolio securities, including the procedures that the company uses when a vote presents a conflict between the interests of its shareholders, on the one hand, and those of the company’s investment adviser; principal underwriter; or any affiliated person (as defined in Section 2(a)(3) of the Investment Company Act of 1940 (15 U.S.C. 80a-2(a)(3)) and the rules thereunder) of the company, its investment adviser, or its principal underwriter, on the other. Include any policies and procedures of the company’s investment adviser, or any other third party, that the company uses, or that are used on the company’s behalf, to determine how to vote proxies relating to portfolio securities.
Not applicable to open-end management investment companies.
ITEM 8. PORTFOLIO MANAGERS OF CLOSED-END MANAGEMENT INVESTMENT COMPANIES.
(a) If the registrant is a closed-end management investment company that is filing an annual report on this Form N-CSR, provide the following information:
(1) State the name, title, and length of service of the person or persons employed by or associated with the registrant or an investment adviser of the registrant who are primarily responsible for the day-to-day management of the registrant’s portfolio (“Portfolio Manager”). Also state each Portfolio Manager’s business experience during the past 5 years.
Not applicable to open-end management investment companies.
ITEM 9. PURCHASES OF EQUITY SECURITIES BY CLOSED-END MANAGEMENT INVESTMENT COMPANY AND AFFILIATED PURCHASERS.
(a) If the registrant is a closed-end management investment company, in the following tabular format, provide the information specified in paragraph (b) of this Item with respect to any purchase made by or on behalf of the registrant or any affiliated purchaser, as defined in Rule 10b-18(a)(3) under the Exchange Act (17 CFR 240.10b-18(a)(3)), of shares or other units of any class of the registrant’s equity securities that is registered by the registrant pursuant to Section 12 of the Exchange Act (15 U.S.C. 781).
Not applicable to open-end management investment companies.
ITEM 10. SUBMISSION OF MATTERS TO A VOTE OF SECURITY HOLDERS.
Describe any material changes to the procedures by which shareholders may recommend nominees to the registrant’s board of directors, where those changes were implemented after the registrant last provided disclosure in response to the requirements of Item 407(c)(2)(iv) of Regulation S-R(17 CFR 229.407)(as required by Item 22(b)(15)) of Schedule 14A (17 CFR 240.14a-101), or this Item.
There have been no material changes to the procedures by which the shareholders may recommend nominees to the registrant’s board of directors since the registrant last provided disclosure in response to the requirements of Item 407(c)(2)(iv) of Regulation S-R of Schedule 14(A) in its definitive proxy statement, or this item.
ITEM 11. CONTROLS AND PROCEDURES.
(a) Disclose the conclusions of the registrant’s principal executive and principal financials officers, or persons performing similar functions, regarding the effectiveness of the registrant’s disclosure controls and procedures (as defined in Rule 30a-3(c) under the Act (17 CFR 270.30a-3(c))) as of a date within 90 days of the filing date of the report that includes the disclosure required by this paragraph, based on the evaluation of these controls and procedures required by Rule 30a-3(b) under the Act (17 CFR 270.30(a)-3(b) and Rules 13a-15(b) or 15d-15(b) under the Exchange Act (17 CFR 240.13a-15(b) or 240.15d-15(b)).
The registrant’s principal executive officer and principal financial officer have concluded that the registrant’s disclosure controls and procedures are effective based on the evaluation of these controls and procedures as of a date within 90 days of the filing date of this report.
(b) Disclose any change in the registrant’s internal control over financial reporting (as defined in Rule 30a-3(d) under the Act (17CFR 270.30a-3(d)) that occured during the second fiscal quarter of the period covered by this report that has materially affected, or is reasonably likely to materially affect, the registrant’s internal control over financial reporting.
There were no significant changes in the registrant’s internal control over financial reporting that occurred during the second fiscal quarter of the period covered by this report that have materially affected, or are reasonably likely to materially affect, the registrant’s internal control over financial reporting.
Item 12. Disclosure of Securities Lending Activities for Closed-End Management Investment Companies.
(a) If the registrant is a closed-end management investment company, provide the following dollar amounts of income and compensation related to the securities lending activities of the registrant during its most recent fiscal year:
N/A
(1) Gross income from securities lending activities;
N/A
(2) All fees and/or compensation for each of the following securities lending activities and related services: any share of revenue generated by the securities lending program paid to the securities lending agent(s) (revenue split); fees paid for cash collateral management services (including fees deducted from a pooled cash collateral reinvestment vehicle) that are not included in the revenue split; administrative fees that are not included in the revenue split; fees for indemnification that are not included in the revenue split; rebates paid to borrowers; and any other fees relating to the securities lending program that are not included in the revenue split, including a description of those other fees;
N/A
(3) The aggregate fees/compensation disclosed pursuant to paragraph (2); and
N/A
(4) Net income from securities lending activities (i.e., the dollar amount in paragraph (1) minus the dollar amount in paragraph (3)).
If a fee for a service is included in the revenue split, state that the fee is included in the revenue split.
N/A
(b) If the registrant is a closed-end management investment company, describe the services provided to the registrant by the securities lending agent in the registrants most recent fiscal year.
N/A
ITEM 13. EXHIBITS.
(a) File the exhibits listed below as part of this Form. Letter or number the exhibits in the sequence indicated.
SIGNATURES
[See General Instruction F]
Pursuant to the requirements of the Securities Exchange Act of 1934 and the Investment Company Act of 1940, the registrant has duly caused this report to be signed on its behalf by the undersigned, thereunto duly authorized.
(Registrant) Pioneer Core Trust I
By (Signature and Title)* /s/ Lisa M. Jones
Lisa M. Jones, President & Chief Executive Officer
Date May 5, 2021
Pursuant to the requirements of the Securities Exchange Act of 1934 and the Investment Company Act of 1940, this report has been signed below by the following persons on behalf of the registrant and in the capacities and on the dates indicated.
By (Signature and Title)* /s/ Lisa M. Jones
Lisa M. Jones, President & Chief Executive Officer
Date May 5, 2021
By (Signature and Title)* /s/ Mark E. Bradley
Mark E. Bradley, Treasurer & Chief Accounting & Financial Officer
Date May 5, 2021
* Print the name and title of each signing officer under his or her signature.