Q3 2021 Letter to Shareholders November 3, 2021
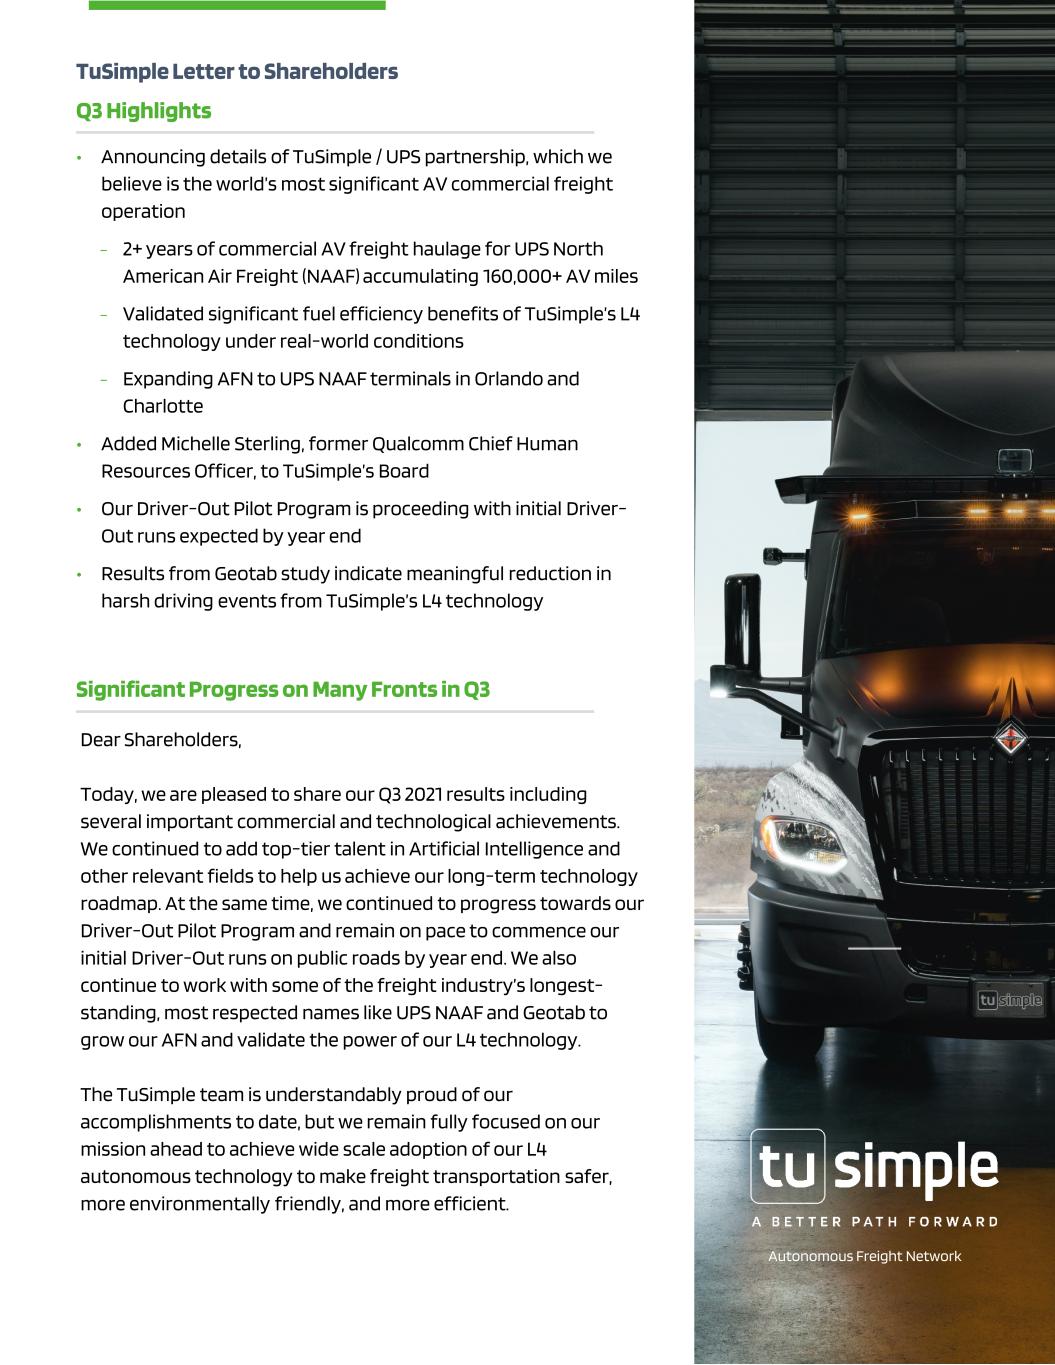
Autonomous Freight Network TuSimple Letter to Shareholders Q3 Highlights Dear Shareholders, Today, we are pleased to share our Q3 2021 results including several important commercial and technological achievements. We continued to add top-tier talent in Artificial Intelligence and other relevant fields to help us achieve our long-term technology roadmap. At the same time, we continued to progress towards our Driver-Out Pilot Program and remain on pace to commence our initial Driver-Out runs on public roads by year end. We also continue to work with some of the freight industry’s longest- standing, most respected names like UPS NAAF and Geotab to grow our AFN and validate the power of our L4 technology. The TuSimple team is understandably proud of our accomplishments to date, but we remain fully focused on our mission ahead to achieve wide scale adoption of our L4 autonomous technology to make freight transportation safer, more environmentally friendly, and more efficient. • Announcing details of TuSimple / UPS partnership, which we believe is the world’s most significant AV commercial freight operation – 2+ years of commercial AV freight haulage for UPS North American Air Freight (NAAF) accumulating 160,000+ AV miles – Validated significant fuel efficiency benefits of TuSimple’s L4 technology under real-world conditions – Expanding AFN to UPS NAAF terminals in Orlando and Charlotte • Added Michelle Sterling, former Qualcomm Chief Human Resources Officer, to TuSimple’s Board • Our Driver-Out Pilot Program is proceeding with initial Driver- Out runs expected by year end • Results from Geotab study indicate meaningful reduction in harsh driving events from TuSimple’s L4 technology Significant Progress on Many Fronts in Q3
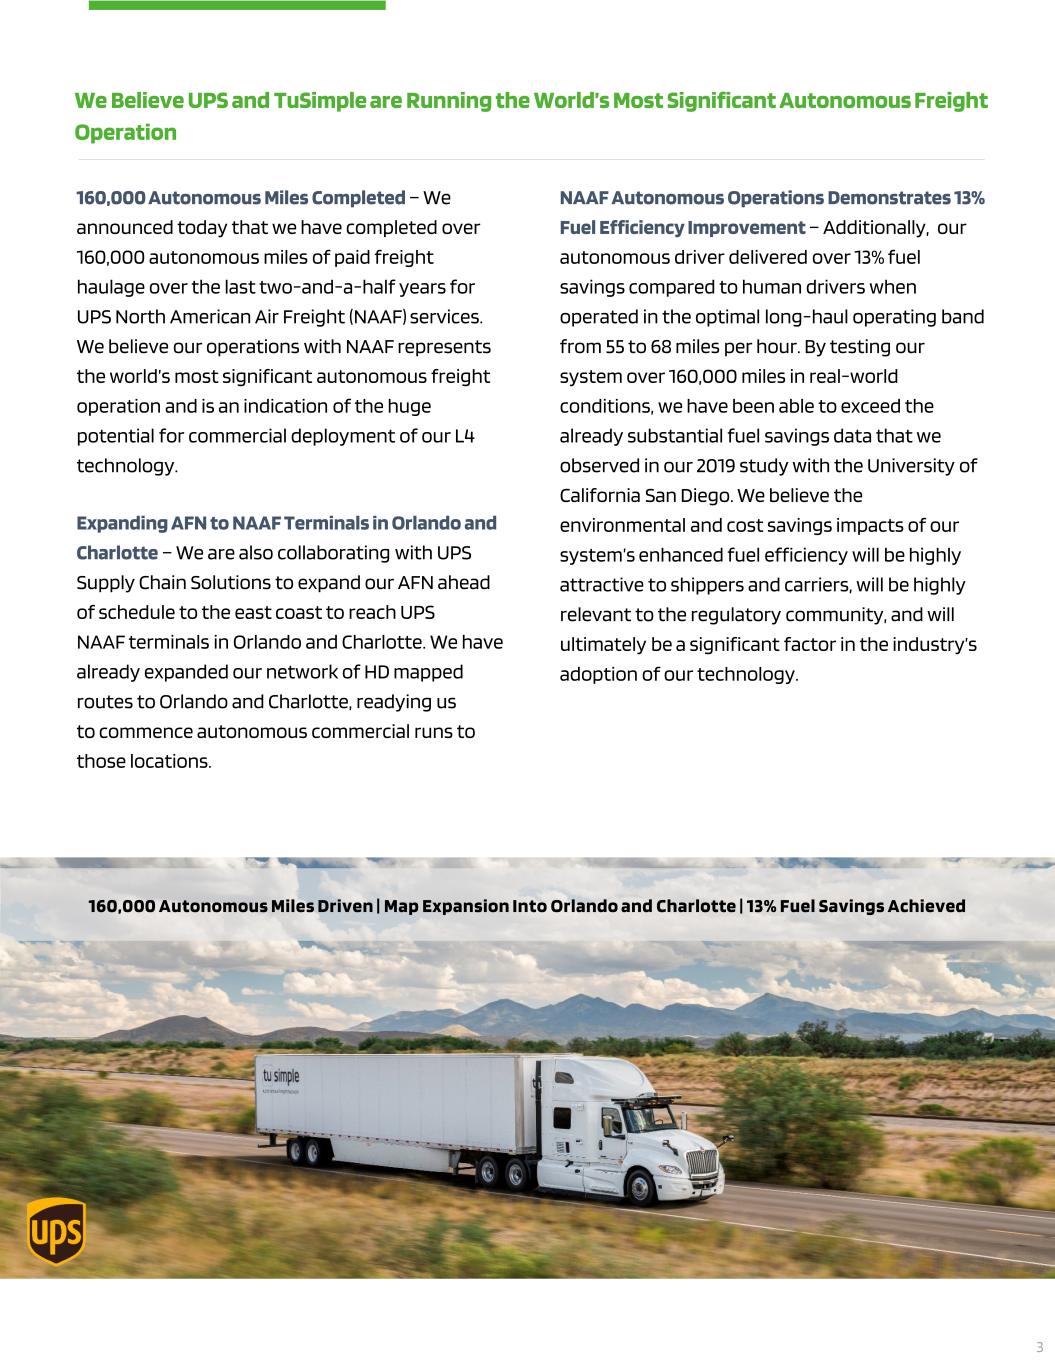
160,000 Autonomous Miles Completed – We announced today that we have completed over 160,000 autonomous miles of paid freight haulage over the last two-and-a-half years for UPS North American Air Freight (NAAF) services. We believe our operations with NAAF represents the world’s most significant autonomous freight operation and is an indication of the huge potential for commercial deployment of our L4 technology. Expanding AFN to NAAF Terminals in Orlando and Charlotte – We are also collaborating with UPS Supply Chain Solutions to expand our AFN ahead of schedule to the east coast to reach UPS NAAF terminals in Orlando and Charlotte. We have already expanded our network of HD mapped routes to Orlando and Charlotte, readying us to commence autonomous commercial runs to those locations. We Believe UPS and TuSimple are Running the World’s Most Significant Autonomous Freight Operation 160,000 Autonomous Miles Driven | Map Expansion Into Orlando and Charlotte | 13% Fuel Savings Achieved NAAF Autonomous Operations Demonstrates 13% Fuel Efficiency Improvement – Additionally, our autonomous driver delivered over 13% fuel savings compared to human drivers when operated in the optimal long-haul operating band from 55 to 68 miles per hour. By testing our system over 160,000 miles in real-world conditions, we have been able to exceed the already substantial fuel savings data that we observed in our 2019 study with the University of California San Diego. We believe the environmental and cost savings impacts of our system’s enhanced fuel efficiency will be highly attractive to shippers and carriers, will be highly relevant to the regulatory community, and will ultimately be a significant factor in the industry’s adoption of our technology. 3

Initial Telematics Study Results Demonstrate Significant Reduction in Harsh Driving Events Improving safety is one of the most important potential benefits of autonomous technology. During Q3 we released the initial results of a safety-performance study by Geotab, a global leader in IoT and connected transportation. Geotab processed 80,000 autonomous miles driven by TuSimple’s trucks and compared those miles to its benchmark rates of harsh driving events of human semi-truck drivers at other companies. The initial results of the study indicate that TuSimple’s autonomous technology helps significantly reduce harsh driving events per 10,000 miles that lead to accidents. Number of Harsh Driving Events per 10,000 Miles This study adds to our growing data set supporting the broad-based benefits of our L4 technology, including fuel savings, and now, a third-party study indicating significant reductions in harsh cornering, braking, and acceleration events. According to the U.S. DOT, over 90% of vehicle accidents are caused by human error. In 2018, the U.S. DOT reported over 4,800 large truck-related fatal crashes. The Geotab results support our strong belief that autonomous vehicles will improve overall road safety and potentially reduce the number of road accidents. Our study with Geotab is ongoing and we are excited about the possibility to share this work with other participants in the freight industry to better understand the significant safety benefits of our L4 autonomous technology. Geotab Study Reveals Significant Safety Advantages of TuSimple’s Technology TuSimple’s Autonomous Technology Industry Human Operated Driving Harsh Braking(1) 0 - 2 8 – 10 Harsh Acceleration(2) 11 – 16 99 – 106 Harsh Cornering(3) 4 - 10 118 - 189 1) Harsh braking occurs when a driver uses more force than necessary to control the vehicle. The presence of harsh braking often indicates aggressive or distracted driving that can lead to costly accidents, as well as increased maintenance issues. 2) Harsh acceleration is defined as acceleration greater than 3.35 m/s2 in the forward direction. In the vehicle, the driver would feel like they were pushed back into the seat and the load in the vehicle would shift to the rear. 3) Harsh cornering is an event that exceeds certain values of Geotab's GO device's accelerometer, specifically side-to-side values (G-Force). This action increases the amount of force on the vehicle, putting top-heavy vehicles at risk of overturning. 4
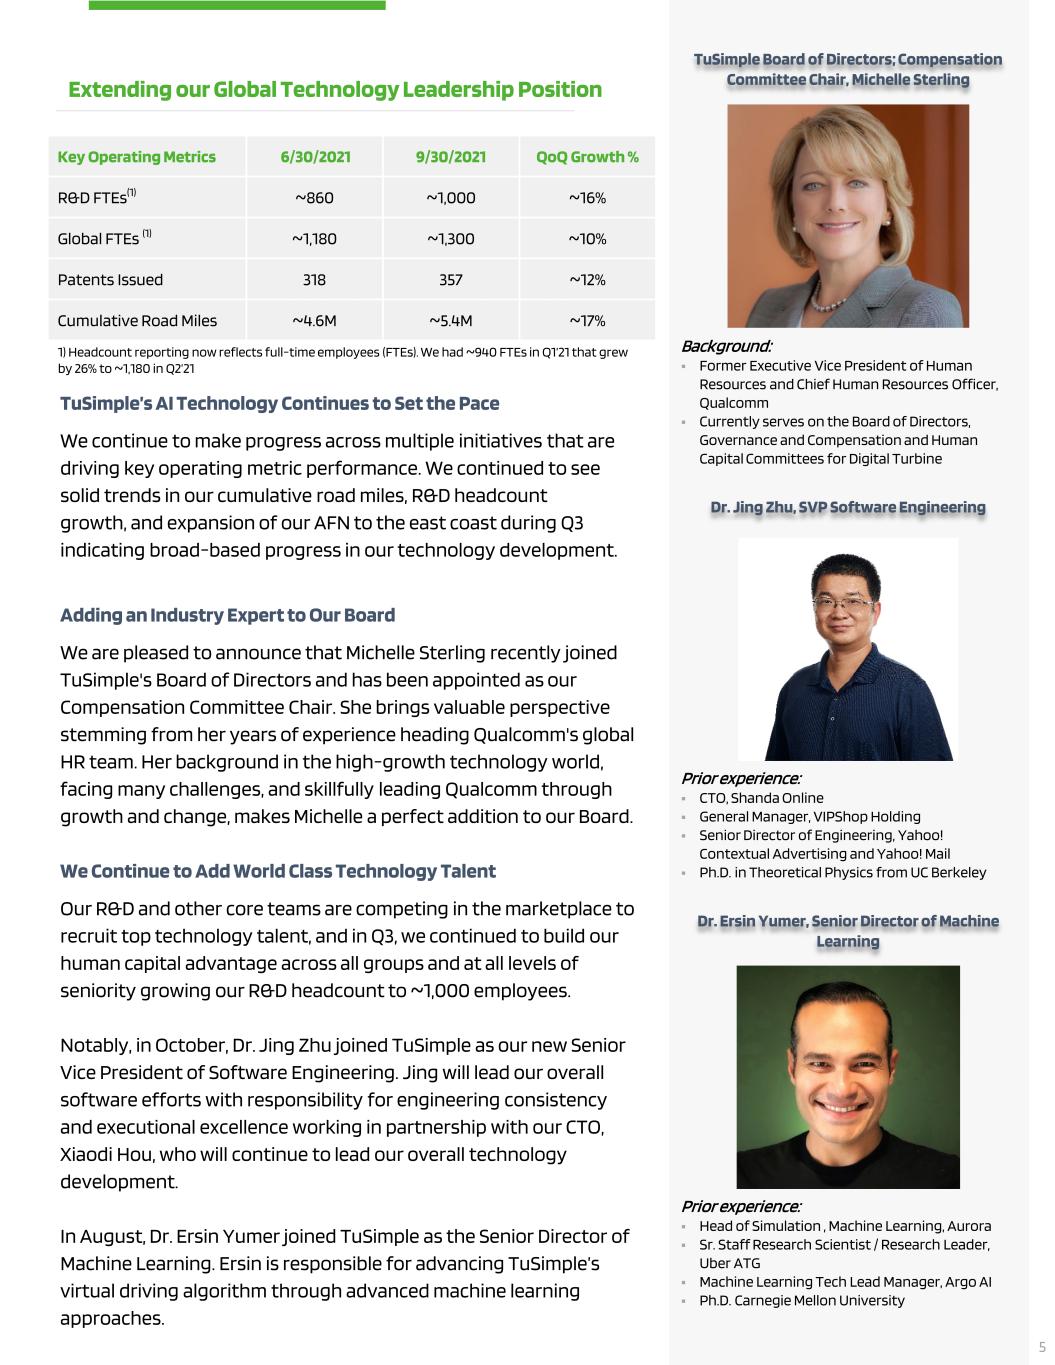
TuSimple’s AI Technology Continues to Set the Pace We continue to make progress across multiple initiatives that are driving key operating metric performance. We continued to see solid trends in our cumulative road miles, R&D headcount growth, and expansion of our AFN to the east coast during Q3 indicating broad-based progress in our technology development. Adding an Industry Expert to Our Board We are pleased to announce that Michelle Sterling recently joined TuSimple's Board of Directors and has been appointed as our Compensation Committee Chair. She brings valuable perspective stemming from her years of experience heading Qualcomm's global HR team. Her background in the high-growth technology world, facing many challenges, and skillfully leading Qualcomm through growth and change, makes Michelle a perfect addition to our Board. We Continue to Add World Class Technology Talent Our R&D and other core teams are competing in the marketplace to recruit top technology talent, and in Q3, we continued to build our human capital advantage across all groups and at all levels of seniority growing our R&D headcount to ~1,000 employees. Notably, in October, Dr. Jing Zhu joined TuSimple as our new Senior Vice President of Software Engineering. Jing will lead our overall software efforts with responsibility for engineering consistency and executional excellence working in partnership with our CTO, Xiaodi Hou, who will continue to lead our overall technology development. In August, Dr. Ersin Yumer joined TuSimple as the Senior Director of Machine Learning. Ersin is responsible for advancing TuSimple’s virtual driving algorithm through advanced machine learning approaches. Extending our Global Technology Leadership Position TuSimple Board of Directors; Compensation Committee Chair, Michelle Sterling Background: Former Executive Vice President of Human Resources and Chief Human Resources Officer, Qualcomm Currently serves on the Board of Directors, Governance and Compensation and Human Capital Committees for Digital Turbine Dr. Jing Zhu, SVP Software Engineering Prior experience: CTO, Shanda Online General Manager, VIPShop Holding Senior Director of Engineering, Yahoo! Contextual Advertising and Yahoo! Mail Ph.D. in Theoretical Physics from UC Berkeley Dr. Ersin Yumer, Senior Director of Machine Learning Prior experience: Head of Simulation , Machine Learning, Aurora Sr. Staff Research Scientist / Research Leader, Uber ATG Machine Learning Tech Lead Manager, Argo AI Ph.D. Carnegie Mellon University 5 Key Operating Metrics 6/30/2021 9/30/2021 QoQ Growth % R&D FTEs(1) ~860 ~1,000 ~16% Global FTEs (1) ~1,180 ~1,300 ~10% Patents Issued 318 357 ~12% Cumulative Road Miles ~4.6M ~5.4M ~17% 1) Headcount reporting now reflects full-time employees (FTEs). We had ~940 FTEs in Q1’21 that grew by 26% to ~1,180 in Q2’21
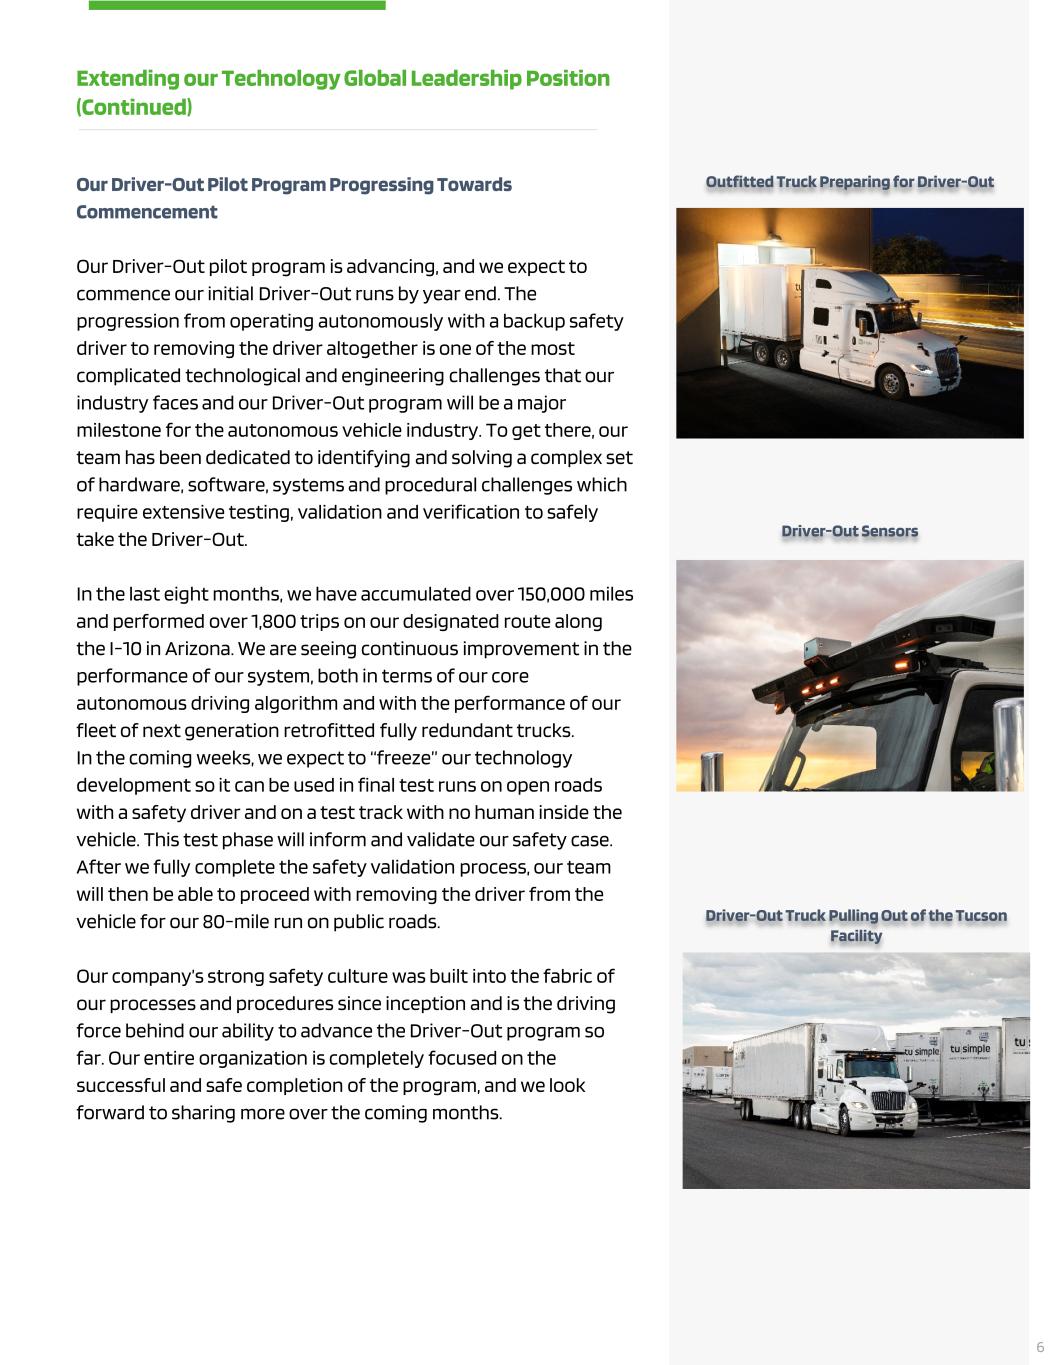
Extending our Technology Global Leadership Position (Continued) Outfitted Truck Preparing for Driver-Out Driver-Out Sensors Driver-Out Truck Pulling Out of the Tucson Facility Our Driver-Out Pilot Program Progressing Towards Commencement Our Driver-Out pilot program is advancing, and we expect to commence our initial Driver-Out runs by year end. The progression from operating autonomously with a backup safety driver to removing the driver altogether is one of the most complicated technological and engineering challenges that our industry faces and our Driver-Out program will be a major milestone for the autonomous vehicle industry. To get there, our team has been dedicated to identifying and solving a complex set of hardware, software, systems and procedural challenges which require extensive testing, validation and verification to safely take the Driver-Out. In the last eight months, we have accumulated over 150,000 miles and performed over 1,800 trips on our designated route along the I-10 in Arizona. We are seeing continuous improvement in the performance of our system, both in terms of our core autonomous driving algorithm and with the performance of our fleet of next generation retrofitted fully redundant trucks. In the coming weeks, we expect to “freeze” our technology development so it can be used in final test runs on open roads with a safety driver and on a test track with no human inside the vehicle. This test phase will inform and validate our safety case. After we fully complete the safety validation process, our team will then be able to proceed with removing the driver from the vehicle for our 80-mile run on public roads. Our company’s strong safety culture was built into the fabric of our processes and procedures since inception and is the driving force behind our ability to advance the Driver-Out program so far. Our entire organization is completely focused on the successful and safe completion of the program, and we look forward to sharing more over the coming months. 6
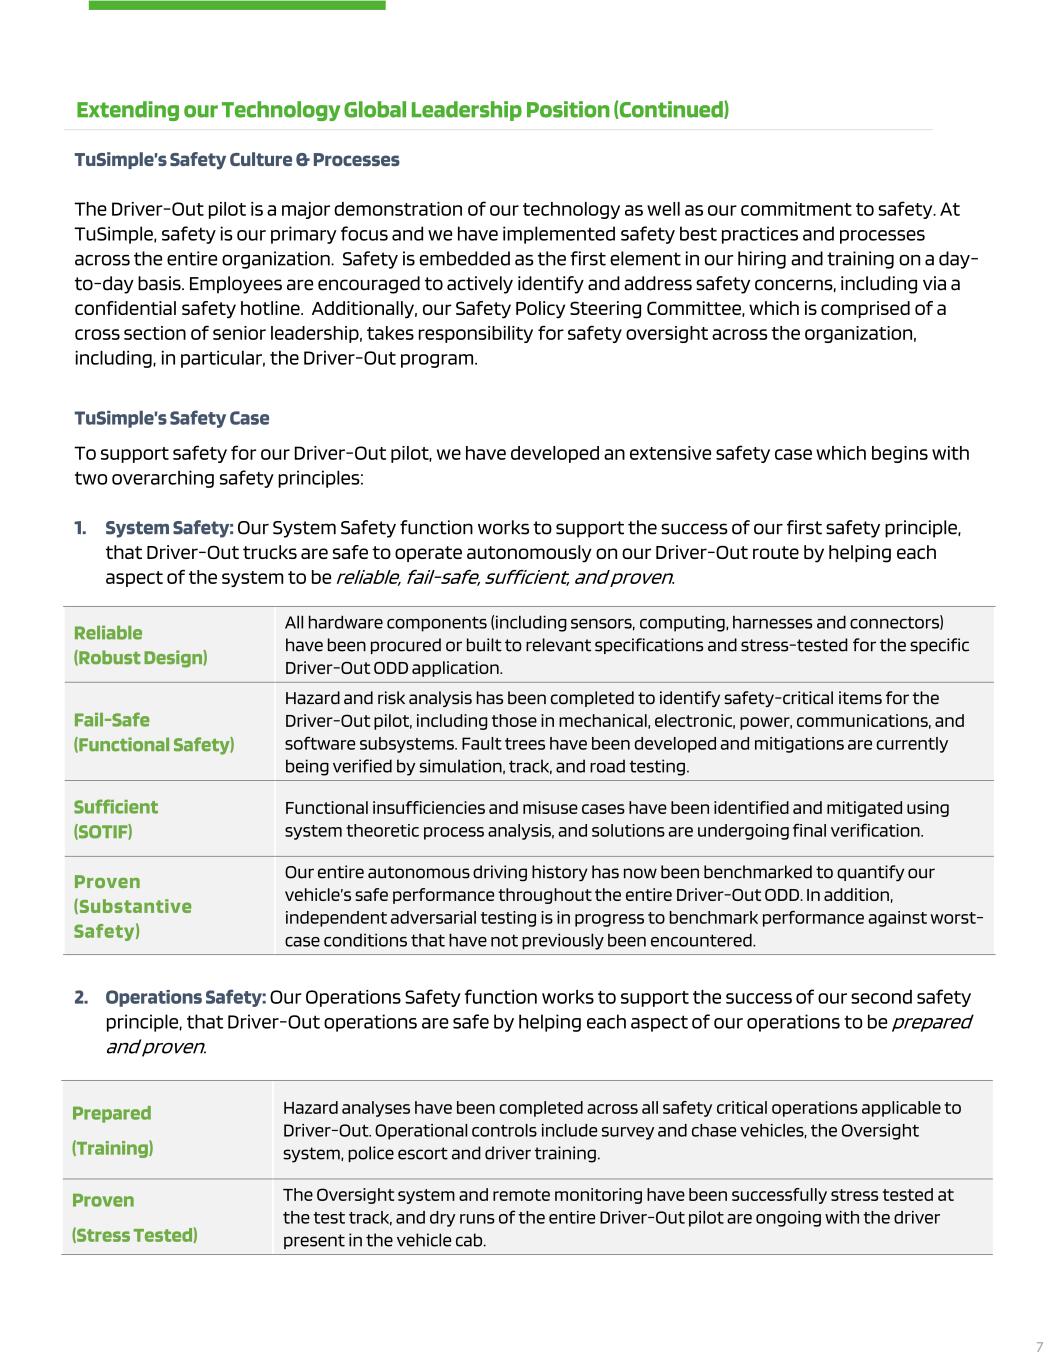
TuSimple’s Safety Culture & Processes The Driver-Out pilot is a major demonstration of our technology as well as our commitment to safety. At TuSimple, safety is our primary focus and we have implemented safety best practices and processes across the entire organization. Safety is embedded as the first element in our hiring and training on a day- to-day basis. Employees are encouraged to actively identify and address safety concerns, including via a confidential safety hotline. Additionally, our Safety Policy Steering Committee, which is comprised of a cross section of senior leadership, takes responsibility for safety oversight across the organization, including, in particular, the Driver-Out program. TuSimple’s Safety Case To support safety for our Driver-Out pilot, we have developed an extensive safety case which begins with two overarching safety principles: 1. System Safety: Our System Safety function works to support the success of our first safety principle, that Driver-Out trucks are safe to operate autonomously on our Driver-Out route by helping each aspect of the system to be reliable, fail-safe, sufficient, and proven. 2. Operations Safety: Our Operations Safety function works to support the success of our second safety principle, that Driver-Out operations are safe by helping each aspect of our operations to be prepared and proven. Extending our Technology Global Leadership Position (Continued) Reliable (Robust Design) All hardware components (including sensors, computing, harnesses and connectors) have been procured or built to relevant specifications and stress-tested for the specific Driver-Out ODD application. Fail-Safe (Functional Safety) Hazard and risk analysis has been completed to identify safety-critical items for the Driver-Out pilot, including those in mechanical, electronic, power, communications, and software subsystems. Fault trees have been developed and mitigations are currently being verified by simulation, track, and road testing. Sufficient (SOTIF) Functional insufficiencies and misuse cases have been identified and mitigated using system theoretic process analysis, and solutions are undergoing final verification. Proven (Substantive Safety) Our entire autonomous driving history has now been benchmarked to quantify our vehicle’s safe performance throughout the entire Driver-Out ODD. In addition, independent adversarial testing is in progress to benchmark performance against worst- case conditions that have not previously been encountered. Prepared (Training) Hazard analyses have been completed across all safety critical operations applicable to Driver-Out. Operational controls include survey and chase vehicles, the Oversight system, police escort and driver training. Proven (Stress Tested) The Oversight system and remote monitoring have been successfully stress tested at the test track, and dry runs of the entire Driver-Out pilot are ongoing with the driver present in the vehicle cab. 7
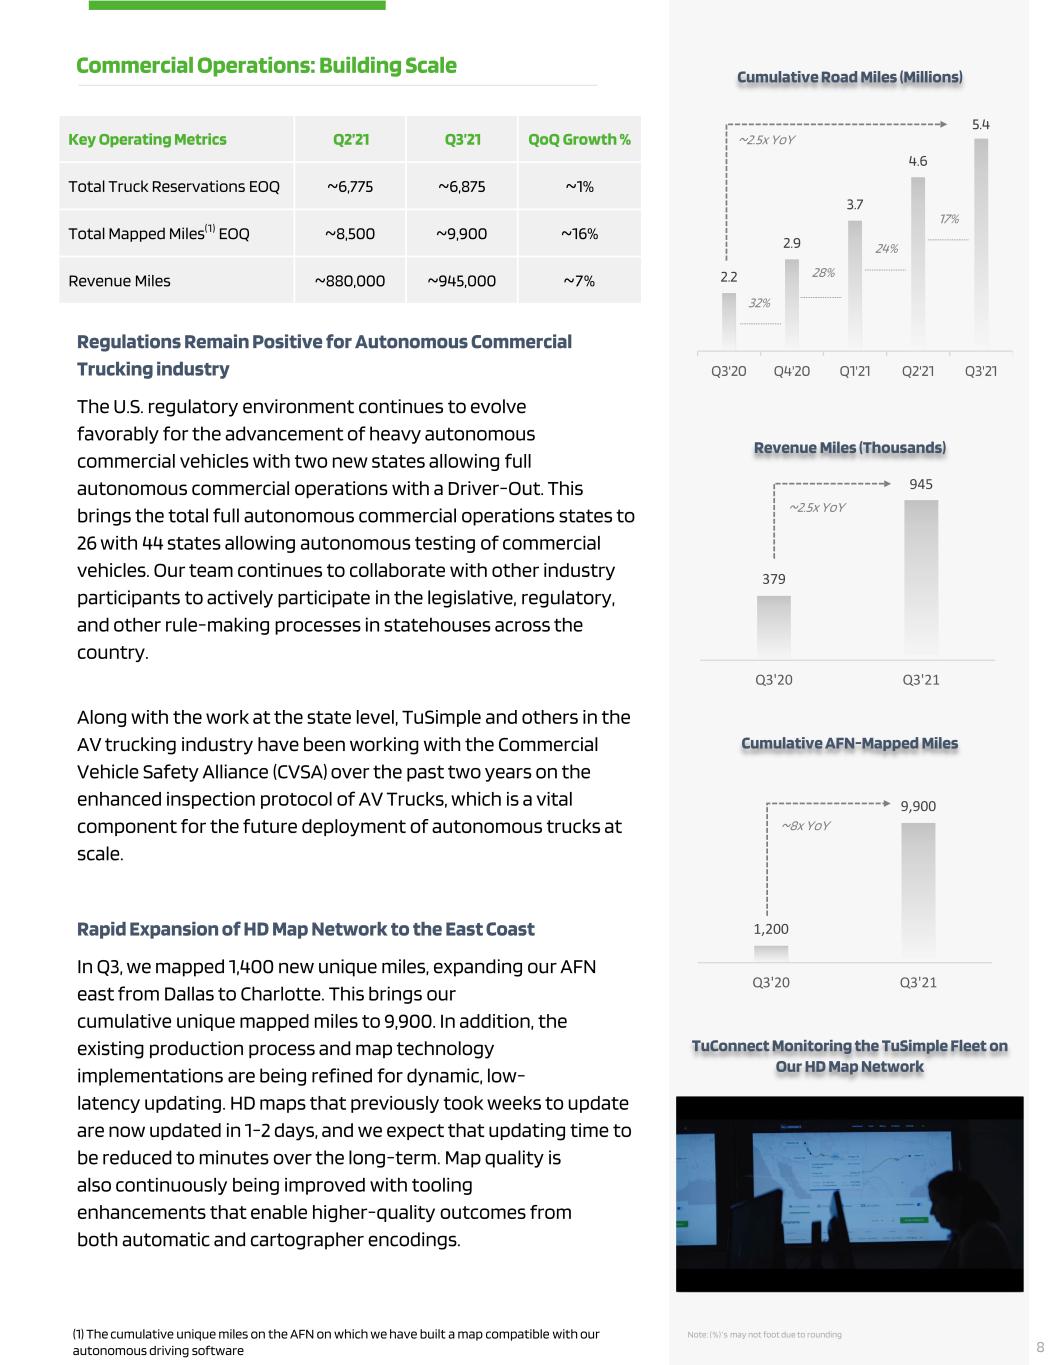
8 1,200 9,900 Q3'20 Q3'21 ~8x YoY Cumulative AFN-Mapped Miles Regulations Remain Positive for Autonomous Commercial Trucking industry The U.S. regulatory environment continues to evolve favorably for the advancement of heavy autonomous commercial vehicles with two new states allowing full autonomous commercial operations with a Driver-Out. This brings the total full autonomous commercial operations states to 26 with 44 states allowing autonomous testing of commercial vehicles. Our team continues to collaborate with other industry participants to actively participate in the legislative, regulatory, and other rule-making processes in statehouses across the country. Along with the work at the state level, TuSimple and others in the AV trucking industry have been working with the Commercial Vehicle Safety Alliance (CVSA) over the past two years on the enhanced inspection protocol of AV Trucks, which is a vital component for the future deployment of autonomous trucks at scale. Rapid Expansion of HD Map Network to the East Coast In Q3, we mapped 1,400 new unique miles, expanding our AFN east from Dallas to Charlotte. This brings our cumulative unique mapped miles to 9,900. In addition, the existing production process and map technology implementations are being refined for dynamic, low- latency updating. HD maps that previously took weeks to update are now updated in 1-2 days, and we expect that updating time to be reduced to minutes over the long-term. Map quality is also continuously being improved with tooling enhancements that enable higher-quality outcomes from both automatic and cartographer encodings. Commercial Operations: Building Scale Key Operating Metrics Q2’21 Q3’21 QoQ Growth % Total Truck Reservations EOQ ~6,775 ~6,875 ~1% Total Mapped Miles(1) EOQ ~8,500 ~9,900 ~16% Revenue Miles ~880,000 ~945,000 ~7% (1) The cumulative unique miles on the AFN on which we have built a map compatible with our autonomous driving software Revenue Miles (Thousands) 379 945 Q3'20 Q3'21 ~2.5x YoY TuConnect Monitoring the TuSimple Fleet on Our HD Map Network 2.2 2.9 3.7 4.6 5.4 Q3'20 Q4'20 Q1'21 Q2'21 Q3'21 32% 28% 24% 17% ~2.5x YoY Cumulative Road Miles (Millions) Note: (%) ’s may not foot due to rounding
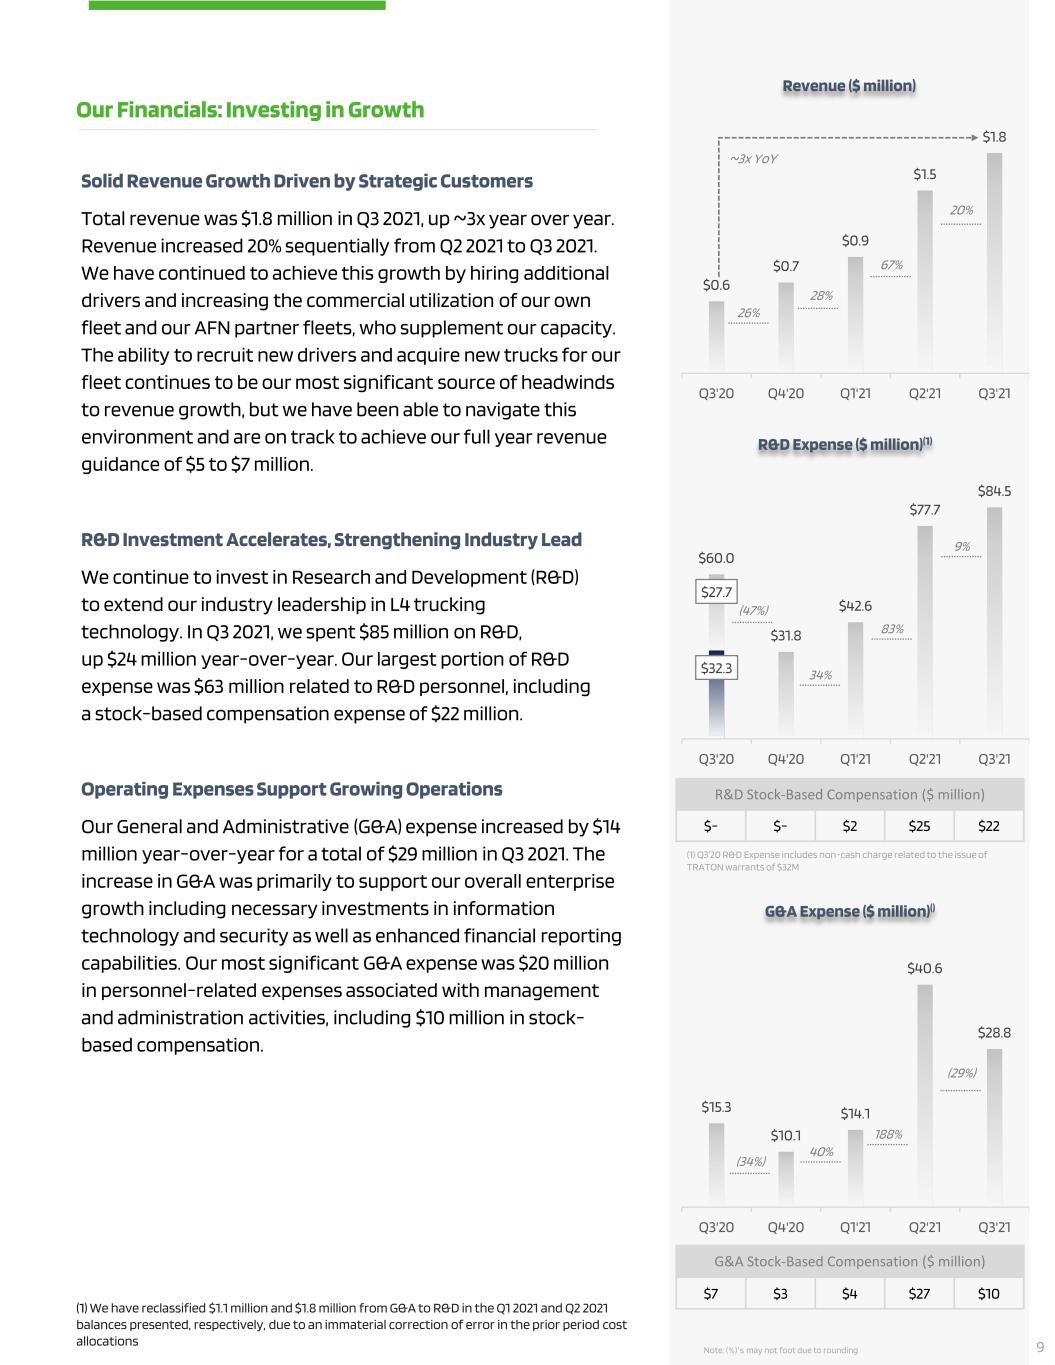
Solid Revenue Growth Driven by Strategic Customers Total revenue was $1.8 million in Q3 2021, up ~3x year over year. Revenue increased 20% sequentially from Q2 2021 to Q3 2021. We have continued to achieve this growth by hiring additional drivers and increasing the commercial utilization of our own fleet and our AFN partner fleets, who supplement our capacity. The ability to recruit new drivers and acquire new trucks for our fleet continues to be our most significant source of headwinds to revenue growth, but we have been able to navigate this environment and are on track to achieve our full year revenue guidance of $5 to $7 million. R&D Investment Accelerates, Strengthening Industry Lead We continue to invest in Research and Development (R&D) to extend our industry leadership in L4 trucking technology. In Q3 2021, we spent $85 million on R&D, up $24 million year-over-year. Our largest portion of R&D expense was $63 million related to R&D personnel, including a stock-based compensation expense of $22 million. Operating Expenses Support Growing Operations Our General and Administrative (G&A) expense increased by $14 million year-over-year for a total of $29 million in Q3 2021. The increase in G&A was primarily to support our overall enterprise growth including necessary investments in information technology and security as well as enhanced financial reporting capabilities. Our most significant G&A expense was $20 million in personnel-related expenses associated with management and administration activities, including $10 million in stock- based compensation. Revenue ($ million) Our Financials: Investing in Growth G&A Expense ($ million)() R&D Expense ($ million)(1) (1) Q3’20 R&D Expense includes non-cash charge related to the issue of TRATON warrants of $32M Note: (%) ’s may not foot due to rounding (1) We have reclassified $1.1 million and $1.8 million from G&A to R&D in the Q1 2021 and Q2 2021 balances presented, respectively, due to an immaterial correction of error in the prior period cost allocations G&A Stock-Based Compensation ($ million) $7 $3 $4 $27 $10 $- $- $2 $25 $22 R&D Stock-Based Compensation ($ million) $0.6 $0.7 $0.9 $1.5 $1.8 Q3'20 Q4'20 Q1'21 Q2'21 Q3'21 26% 67% 20% ~3x YoY 28% $32.3 $27.7 $60.0 $31.8 $42.6 $77.7 $84.5 Q3'20 Q4'20 Q1'21 Q2'21 Q3'21 (47%) 9% 34% 83% $15.3 $10.1 $14.1 $40.6 $28.8 Q3'20 Q4'20 Q1'21 Q2'21 Q3'21 (34%) 40% 188% (29%) 9

Net Loss from Operations and Adjusted EBITDA(1) In Q3 2021, our Net Loss from Operations was $(116) million and our Adjusted EBITDA was $(81) million. Capital Investment Propels AFN Rollout Our capital expenditures are investments to grow our AFN and primarily relate to our revenue and testing truck fleet, terminal facilities, and other facilities and equipment used in operations. TuSimple invested a total of $6 million in capital expenditures in Q3 2021 and $14 million in the first nine months of 2021. Strong Cash Position to Reach Commercialization Our operating cash spend during Q3 2021 was $71 million as we continue to invest in our strategic growth and development, and we ended the quarter with $1.4 billion in cash and cash equivalents. Full Year 2021 Guidance(2) We are refining our prior guidance regarding R&D expense excluding stock-based compensation to $210 to $220 million. Similarly, we are refining our G&A expense excluding stock-based compensation to $55 - $60 million. Both ranges represent the upper half of the prior guidance ranges for these items. We also expect capital expenditures to be at the upper end of the guidance range of $14 – 18 million. In addition, we are adjusting our guidance regarding stock-based compensation to $120 - $130 million. There are no other updates to the financial guidance we previously communicated. (1) Adjusted EBITDA is calculated by adding back stock-based compensation expense, depreciation and amortization, and capital lease interest expense to loss from operations. See the section titled “Non-GAAP Financial Measures” for more information. (2) See the section titled “Non-GAAP Financial Measures” for important information regarding the non-GAAP measures used by TuSimple. Our Financials: Investing in Growth (cont’d) 10

In Closing TuSimple strives to solve one of the most complex engineering challenges ever undertaken. We are focused on delivering a world-class product to deliver the safest, most efficient, and affordable freight capacity at scale to the market. During Q3, every one of our employees stepped up to propel us towards completing our mission. We are incredibly proud of our talent and of the product we are developing as we near the beginning of our Driver-Out pilot and continue the expansion of our AFN. Bringing L4 technology to market is not simple, but it will change the world, and that is what makes our mission worth pursuing. As we head into the end of the year, we will remain steadfast in our goals. We will continue to lead the industry with our technology, go-to-market strategy, and creation of a high-performance organization. At TuSimple, we are building a Better Path Forward. Sincerely, Pat Dillon Chief Financial Officer Cheng Lu President and Chief Executive Officer 11
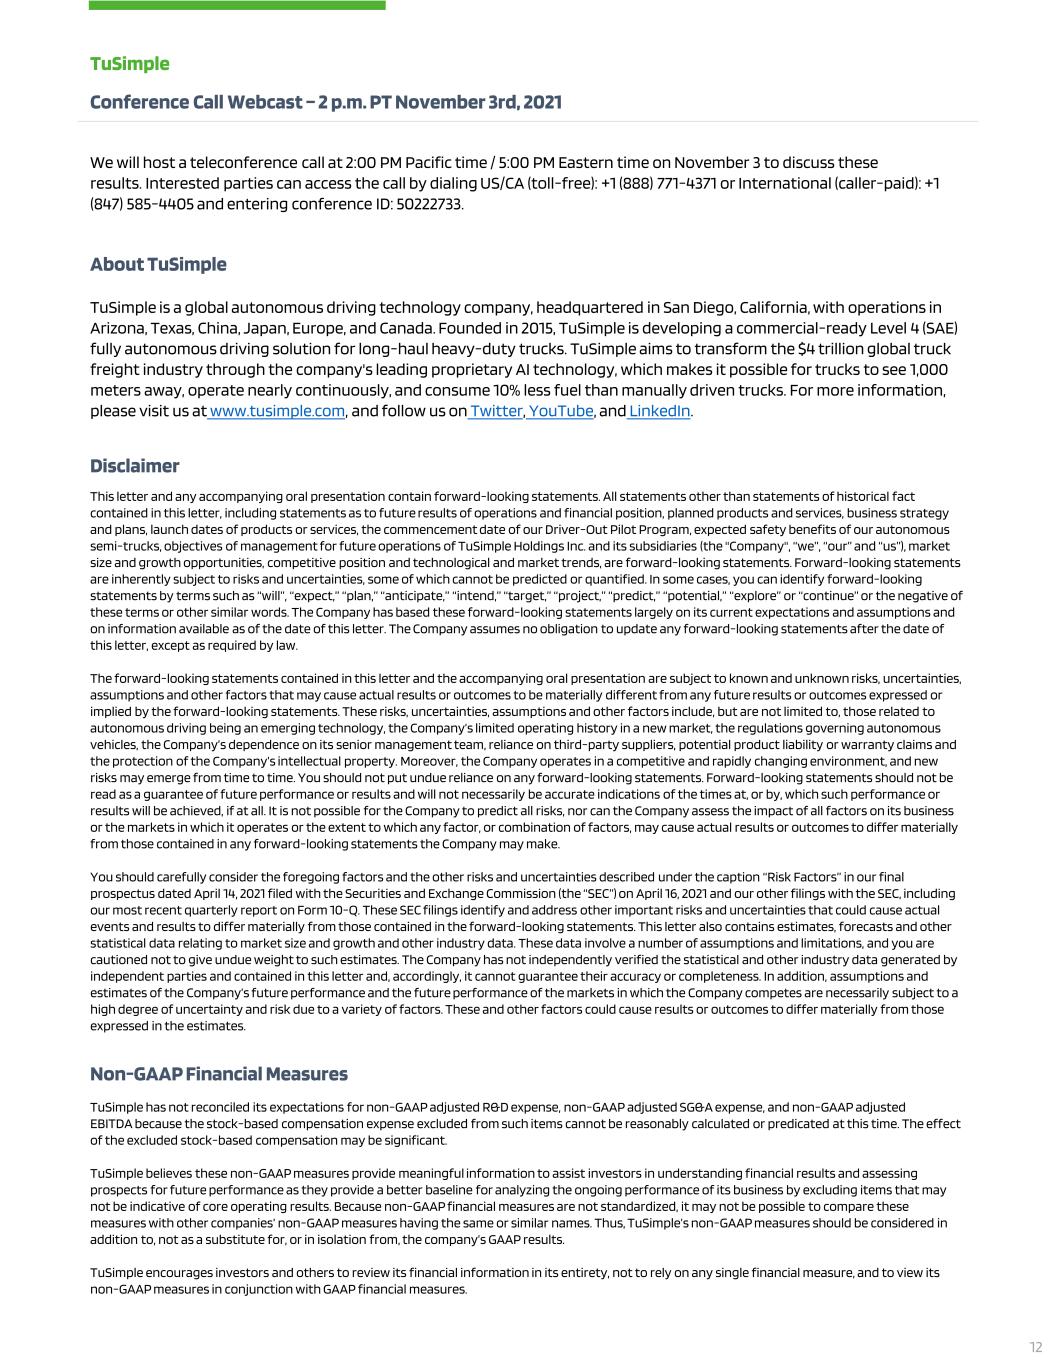
Disclaimer This letter and any accompanying oral presentation contain forward-looking statements. All statements other than statements of historical fact contained in this letter, including statements as to future results of operations and financial position, planned products and services, business strategy and plans, launch dates of products or services, the commencement date of our Driver-Out Pilot Program, expected safety benefits of our autonomous semi-trucks, objectives of management for future operations of TuSimple Holdings Inc. and its subsidiaries (the "Company", “we”, “our” and “us”), market size and growth opportunities, competitive position and technological and market trends, are forward-looking statements. Forward-looking statements are inherently subject to risks and uncertainties, some of which cannot be predicted or quantified. In some cases, you can identify forward-looking statements by terms such as “will”, “expect,” “plan,” “anticipate,” “intend,” “target,” “project,” “predict,” “potential,” “explore” or “continue” or the negative of these terms or other similar words. The Company has based these forward-looking statements largely on its current expectations and assumptions and on information available as of the date of this letter. The Company assumes no obligation to update any forward-looking statements after the date of this letter, except as required by law. The forward-looking statements contained in this letter and the accompanying oral presentation are subject to known and unknown risks, uncertainties, assumptions and other factors that may cause actual results or outcomes to be materially different from any future results or outcomes expressed or implied by the forward-looking statements. These risks, uncertainties, assumptions and other factors include, but are not limited to, those related to autonomous driving being an emerging technology, the Company’s limited operating history in a new market, the regulations governing autonomous vehicles, the Company’s dependence on its senior management team, reliance on third-party suppliers, potential product liability or warranty claims and the protection of the Company’s intellectual property. Moreover, the Company operates in a competitive and rapidly changing environment, and new risks may emerge from time to time. You should not put undue reliance on any forward-looking statements. Forward-looking statements should not be read as a guarantee of future performance or results and will not necessarily be accurate indications of the times at, or by, which such performance or results will be achieved, if at all. It is not possible for the Company to predict all risks, nor can the Company assess the impact of all factors on its business or the markets in which it operates or the extent to which any factor, or combination of factors, may cause actual results or outcomes to differ materially from those contained in any forward-looking statements the Company may make. You should carefully consider the foregoing factors and the other risks and uncertainties described under the caption “Risk Factors” in our final prospectus dated April 14, 2021 filed with the Securities and Exchange Commission (the “SEC”) on April 16, 2021 and our other filings with the SEC, including our most recent quarterly report on Form 10-Q. These SEC filings identify and address other important risks and uncertainties that could cause actual events and results to differ materially from those contained in the forward-looking statements. This letter also contains estimates, forecasts and other statistical data relating to market size and growth and other industry data. These data involve a number of assumptions and limitations, and you are cautioned not to give undue weight to such estimates. The Company has not independently verified the statistical and other industry data generated by independent parties and contained in this letter and, accordingly, it cannot guarantee their accuracy or completeness. In addition, assumptions and estimates of the Company’s future performance and the future performance of the markets in which the Company competes are necessarily subject to a high degree of uncertainty and risk due to a variety of factors. These and other factors could cause results or outcomes to differ materially from those expressed in the estimates. Non-GAAP Financial Measures TuSimple has not reconciled its expectations for non-GAAP adjusted R&D expense, non-GAAP adjusted SG&A expense, and non-GAAP adjusted EBITDA because the stock-based compensation expense excluded from such items cannot be reasonably calculated or predicated at this time. The effect of the excluded stock-based compensation may be significant. TuSimple believes these non-GAAP measures provide meaningful information to assist investors in understanding financial results and assessing prospects for future performance as they provide a better baseline for analyzing the ongoing performance of its business by excluding items that may not be indicative of core operating results. Because non-GAAP financial measures are not standardized, it may not be possible to compare these measures with other companies’ non-GAAP measures having the same or similar names. Thus, TuSimple’s non-GAAP measures should be considered in addition to, not as a substitute for, or in isolation from, the company’s GAAP results. TuSimple encourages investors and others to review its financial information in its entirety, not to rely on any single financial measure, and to view its non-GAAP measures in conjunction with GAAP financial measures. About TuSimple TuSimple is a global autonomous driving technology company, headquartered in San Diego, California, with operations in Arizona, Texas, China, Japan, Europe, and Canada. Founded in 2015, TuSimple is developing a commercial-ready Level 4 (SAE) fully autonomous driving solution for long-haul heavy-duty trucks. TuSimple aims to transform the $4 trillion global truck freight industry through the company's leading proprietary AI technology, which makes it possible for trucks to see 1,000 meters away, operate nearly continuously, and consume 10% less fuel than manually driven trucks. For more information, please visit us at www.tusimple.com, and follow us on Twitter, YouTube, and LinkedIn. TuSimple Conference Call Webcast – 2 p.m. PT November 3rd, 2021 We will host a teleconference call at 2:00 PM Pacific time / 5:00 PM Eastern time on November 3 to discuss these results. Interested parties can access the call by dialing US/CA (toll-free): +1 (888) 771-4371 or International (caller-paid): +1 (847) 585-4405 and entering conference ID: 50222733. 12
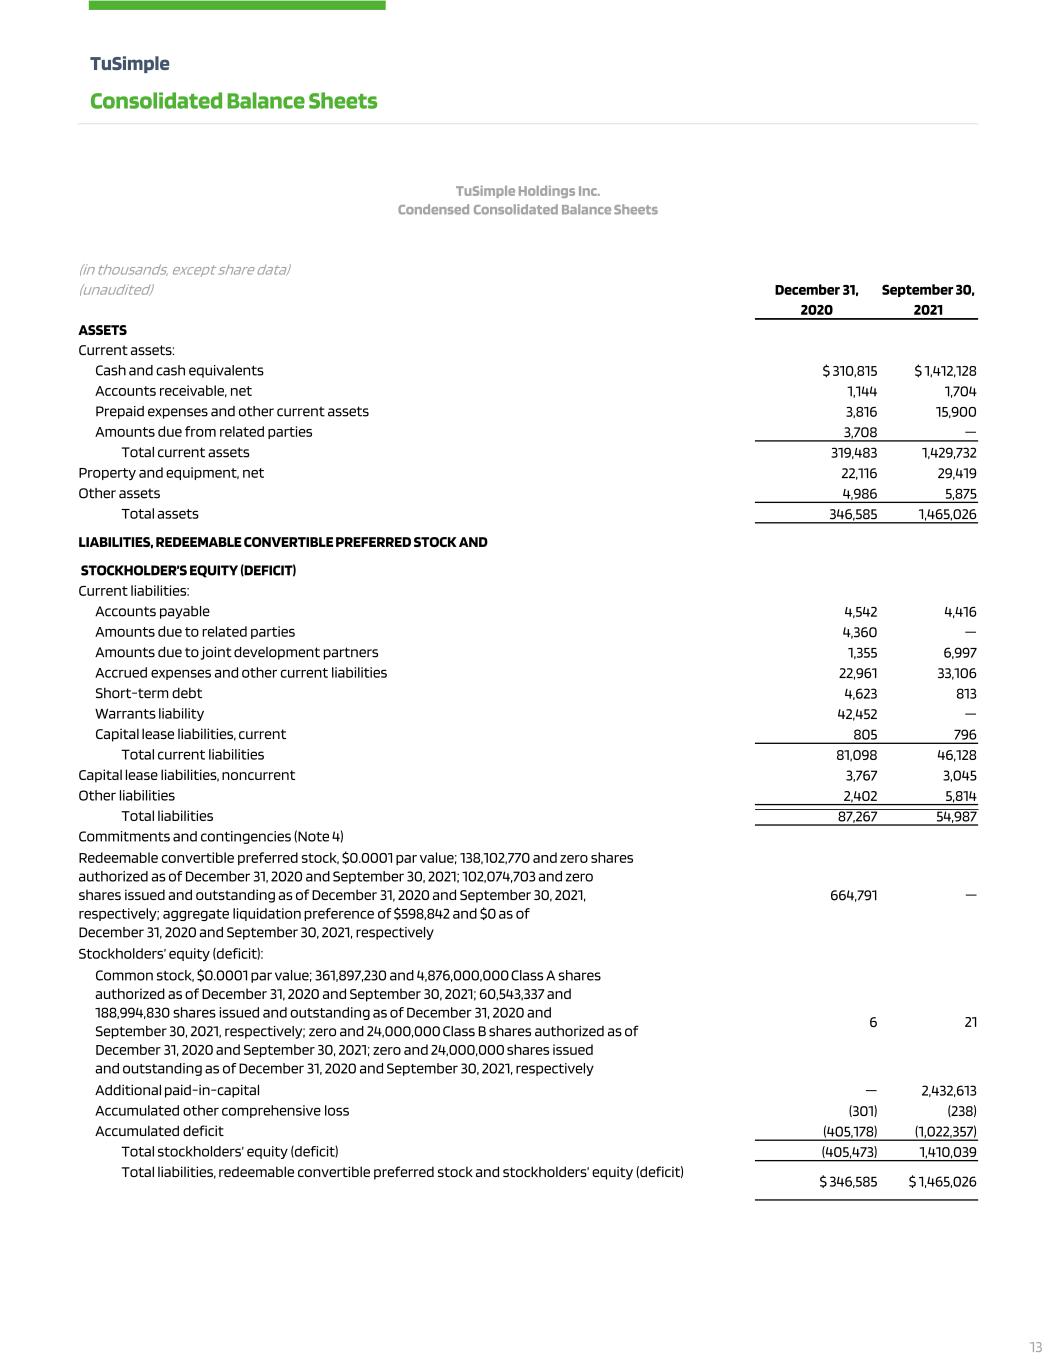
TuSimple Consolidated Balance Sheets TuSimple Holdings Inc. Condensed Consolidated Balance Sheets (in thousands, except share data) (unaudited) December 31, September 30, 2020 2021 ASSETS Current assets: Cash and cash equivalents $ 310,815 $ 1,412,128 Accounts receivable, net 1,144 1,704 Prepaid expenses and other current assets 3,816 15,900 Amounts due from related parties 3,708 — Total current assets 319,483 1,429,732 Property and equipment, net 22,116 29,419 Other assets 4,986 5,875 Total assets 346,585 1,465,026 LIABILITIES, REDEEMABLE CONVERTIBLE PREFERRED STOCK AND STOCKHOLDER’S EQUITY (DEFICIT) Current liabilities: Accounts payable 4,542 4,416 Amounts due to related parties 4,360 — Amounts due to joint development partners 1,355 6,997 Accrued expenses and other current liabilities 22,961 33,106 Short-term debt 4,623 813 Warrants liability 42,452 — Capital lease liabilities, current 805 796 Total current liabilities 81,098 46,128 Capital lease liabilities, noncurrent 3,767 3,045 Other liabilities 2,402 5,814 Total liabilities 87,267 54,987 Commitments and contingencies (Note 4) Redeemable convertible preferred stock, $0.0001 par value; 138,102,770 and zero shares authorized as of December 31, 2020 and September 30, 2021; 102,074,703 and zero shares issued and outstanding as of December 31, 2020 and September 30, 2021, respectively; aggregate liquidation preference of $598,842 and $0 as of December 31, 2020 and September 30, 2021, respectively 664,791 — Stockholders’ equity (deficit): Common stock, $0.0001 par value; 361,897,230 and 4,876,000,000 Class A shares authorized as of December 31, 2020 and September 30, 2021; 60,543,337 and 188,994,830 shares issued and outstanding as of December 31, 2020 and September 30, 2021, respectively; zero and 24,000,000 Class B shares authorized as of December 31, 2020 and September 30, 2021; zero and 24,000,000 shares issued and outstanding as of December 31, 2020 and September 30, 2021, respectively 6 21 Additional paid-in-capital — 2,432,613 Accumulated other comprehensive loss (301) (238) Accumulated deficit (405,178) (1,022,357) Total stockholders’ equity (deficit) (405,473) 1,410,039 Total liabilities, redeemable convertible preferred stock and stockholders’ equity (deficit) $ 346,585 $ 1,465,026 13
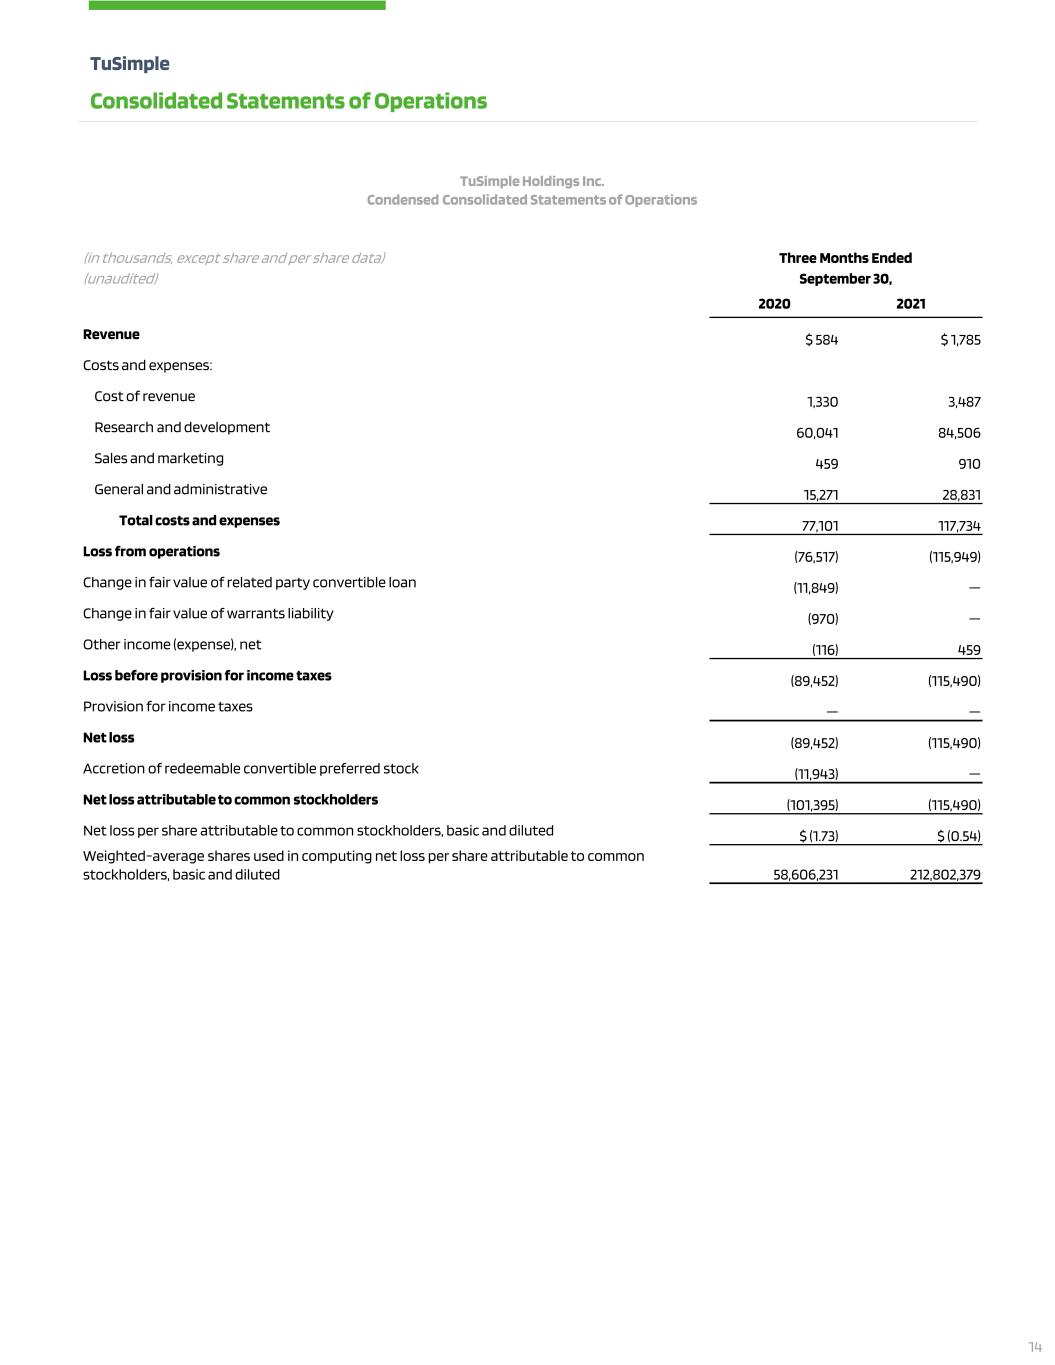
TuSimple Holdings Inc. Condensed Consolidated Statements of Operations (in thousands, except share and per share data) Three Months Ended (unaudited) September 30, 2020 2021 Revenue $ 584 $ 1,785 Costs and expenses: Cost of revenue 1,330 3,487 Research and development 60,041 84,506 Sales and marketing 459 910 General and administrative 15,271 28,831 Total costs and expenses 77,101 117,734 Loss from operations (76,517) (115,949) Change in fair value of related party convertible loan (11,849) — Change in fair value of warrants liability (970) — Other income (expense), net (116) 459 Loss before provision for income taxes (89,452) (115,490) Provision for income taxes — — Net loss (89,452) (115,490) Accretion of redeemable convertible preferred stock (11,943) — Net loss attributable to common stockholders (101,395) (115,490) Net loss per share attributable to common stockholders, basic and diluted $ (1.73) $ (0.54) Weighted-average shares used in computing net loss per share attributable to common stockholders, basic and diluted 58,606,231 212,802,379 TuSimple Consolidated Statements of Operations 14

TuSimple Consolidated Statements of Cash Flows TuSimple Holdings Inc. Condensed Consolidated Statements of Cash Flows (in thousands) Nine Months Ended (unaudited) September 30, 2020 2021 Cash flows from operating activities: Net loss $ (143,297) $ (617,179) Adjustments to reconcile net loss to net cash used in operating activities: Stock-based compensation 9,325 90,880 Accretion of asset retirement obligations 27 — Depreciation and amortization 5,611 6,768 Loss on disposal of property and equipment 127 — Non-cash research and development expense 32,325 — Change in fair value of warrants liability 970 326,900 Change in fair value of related party convertible loan 11,849 — Gain on loan extinguishment — (4,183) Changes in operating assets and liabilities: Accounts receivable (298) (560) Prepaid expenses and other current assets 1,251 (12,114) Other assets (339) (659) Accounts payable 1,359 (313) Amounts due to/from related parties (274) — Amounts due to joint development partners — 5,642 Accrued expenses and other current liabilities 15,317 16,488 Other liabilities 1,263 1,965 Net cash used in operating activities (64,784) (186,365) Cash flows from investing activities: Purchases of property and equipment (2,881) (12,218) Purchases of intangible assets (207) (302) Proceeds from disposal of property and equipment 178 100 Net cash used in investing activities (2,910) (12,420) Cash flows from financing activities: Proceeds from issuance of redeemable convertible preferred stock, net of offering costs 3,057 54,693 Proceeds from exercise of warrants for redeemable convertible preferred stock — 183,007 Proceeds from issuance of related party convertible loan 50,000 — Proceeds from issuance of warrants 11,943 — Proceeds from exercise of stock options — 782 Proceeds from issuance of common stock upon initial public offering, net of offering costs — 1,030,965 Proceeds from issuance of common stock related to private placement — 35,000 Proceeds from related party loan 5,000 — Proceeds from loans 4,134 — Return of guarantee deposit on related party loan — 3,715 Principal payments on related party loan — (4,398) Payment of third-party costs in connection with initial public offering — (2,812) Principal payments on capital lease obligations (528) (586) Principal payments on other liabilities (38) (353) Net cash provided by financing activities 73,568 1,300,013 Effect of exchange rate changes on cash, cash equivalents, and restricted cash (324) 55 Net increase (decrease) in cash, cash equivalents, and restricted cash 5,550 1,101,283 Cash, cash equivalents, and restricted cash - beginning of period 64,110 312,351 Cash, cash equivalents, and restricted cash - end of period $ 69,660 $ 1,413,634 15

TuSimple Consolidated Statements of Cash Flows TuSimple Holdings Inc. Condensed Consolidated Statements of Cash Flows (in thousands) Nine Months Ended (unaudited) September 30, 2020 2021 Reconciliation of cash, cash equivalents, and restricted cash to the condensed consolidated balance sheets: Cash and cash equivalents $ 68,910 $ 1,412,128 Restricted cash included in prepaid expenses and other current assets 750 1,506 Total cash and cash equivalents, and restricted cash 69,660 1,413,634 Supplemental disclosure of cash flow information: Cash paid for interest $ 850 $ 575 Supplemental schedule of non-cash investing and financing activities: Acquisitions of property and equipment included in liabilities 1,526 1,987 Accretion of redeemable convertible preferred stock 11,943 4,135 Vesting of early exercised stock options — 63 Exercise of liability-classified warrants — 369,352 Conversion of redeemable convertible preferred stock to common stock upon initial public offering — 1,282,916 Cashless exercise of stock options for common stock 975 — Issuance costs incurred in connection with initial public offering included in current liabilities — 779 16
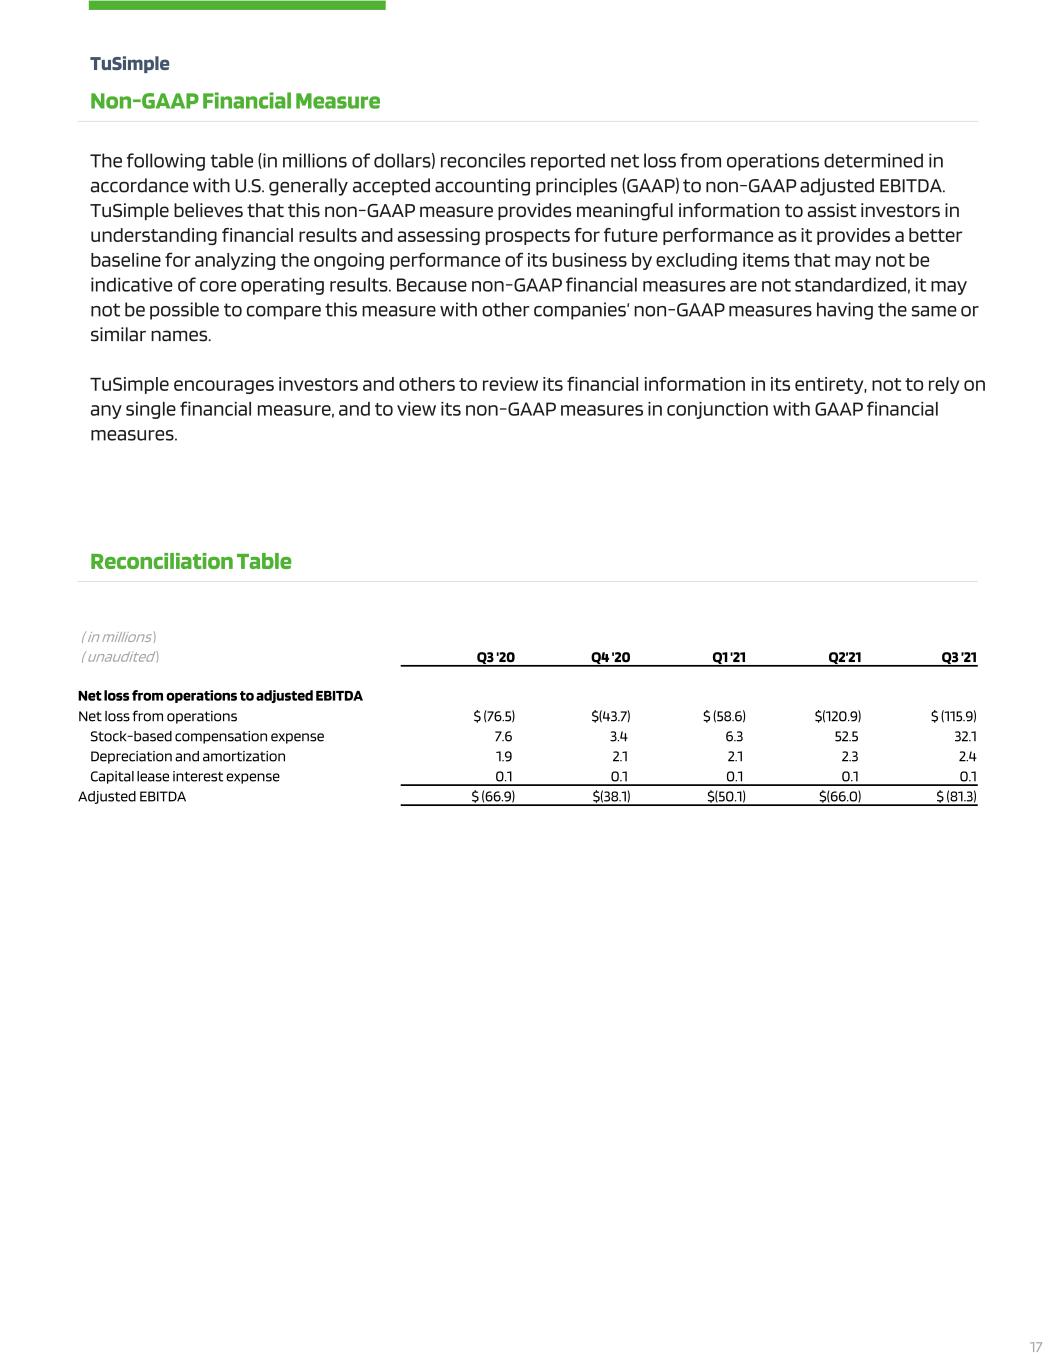
( in millions ) ( unaudited ) Q3 '20 Q4 '20 Q1 '21 Q2’21 Q3 ’21 Net loss from operations to adjusted EBITDA Net loss from operations $ (76.5) $(43.7) $ (58.6) $(120.9) $ (115.9) Stock-based compensation expense 7.6 3.4 6.3 52.5 32.1 Depreciation and amortization 1.9 2.1 2.1 2.3 2.4 Capital lease interest expense 0.1 0.1 0.1 0.1 0.1 Adjusted EBITDA $ (66.9) $(38.1) $(50.1) $(66.0) $ (81.3) TuSimple Non-GAAP Financial Measure The following table (in millions of dollars) reconciles reported net loss from operations determined in accordance with U.S. generally accepted accounting principles (GAAP) to non-GAAP adjusted EBITDA. TuSimple believes that this non-GAAP measure provides meaningful information to assist investors in understanding financial results and assessing prospects for future performance as it provides a better baseline for analyzing the ongoing performance of its business by excluding items that may not be indicative of core operating results. Because non-GAAP financial measures are not standardized, it may not be possible to compare this measure with other companies’ non-GAAP measures having the same or similar names. TuSimple encourages investors and others to review its financial information in its entirety, not to rely on any single financial measure, and to view its non-GAAP measures in conjunction with GAAP financial measures. Reconciliation Table 17

1,300+ Employees across three continents with ~80% of workforce dedicated to R&D TUSIMPLE BY THE NUMBERS $1.8 B+ Cumulative funding-to- date, from IPO and private capital raises ~ 9,900 350+ ~80 Miles of Mapped Routes Core Technology Patents Autonomous Trucks Globally 6,875 Purpose-built, L4 Driver-Out Autonomous Truck Reservations ~5.4 MM Road Miles ~ $4.2 MM YTD 2021 Revenue (1) As of September 30, 2021 (1) (1) (1) (1)(1) (1) 18


