Q4 2021 Letter to Shareholders February 9, 2022

TuSimple Letter to Shareholders Q4 Highlights Dear Shareholders, We are pleased to share with you that we have completed the first seven fully Driver Out semi-truck runs on open public roads, ever. We have always prided ourselves in setting firsts for autonomous trucking, but this milestone stands alone. All AV trucking companies have a goal to remove the driver eventually, but at TuSimple the Driver Out era has started. Importantly, Driver Out is not an endpoint. It is the start of scaling, and our focus has turned fully to commercialization including our recent announcement that we plan to begin hauling driver out freight for Union Pacific this spring. We are extending our Driver Out operations from a pilot to an ongoing program that we expect to expand in scope and scale. As wrap up for 2021, we are proud to say that we accomplished our major goals for the year. As an advanced technology company, we know it is critical to achieve our plan and continue to build trust with our stakeholders. We are pleased to say we delivered in 2021: The initial Driver Out runs are the “zero to one” moment for AV trucking, and we are now focused on the engineering work needed to scale from “one to many." Landmark Driver Out Operations: TuSimple completed the world’s first fully driverless semi-truck runs on open public roads – Seven runs completed to date, over 550 miles cumulatively with no human operation, no traffic interference – Plans to haul driver out freight for Union Pacific this spring – Driver Out program to continue with intent to scale to commercialization in the next two years Proprietary Autonomous Domain Controller with NVIDIA: Developing vertically integrated edge computing platform for our Autonomous Driving System in collaboration with NVIDIA Keeping our Promises: Delivered on our major technology, commercial and financial goals for 2021 The Driver Out Era Has Started at TuSimple Driver Out Achieved 80-mile real freight run without any human in the vehicle or any human operations by year end. Technology Leadership Extended industry lead in patents, road miles, and semi-trucks, expanded world-class R&D team, continued innovation, including industry-first ADC development collaboration with NVIDIA. AFN Growth Expanded to east coast ahead of schedule, unveiled unmatched AV operations with UPS, built a deep and diverse list of blue-chip reservation holders. Capital Efficiency Strategically deployed capital and ended the year with over $1.3 billion in cash. 2

The Driver Out Era Has Started at TuSimple Overview of World’s First Driver Out, Fully Autonomous Semi-Truck Runs on Open Public Roads Q4 brought the most important technological milestone in TuSimple’s history: the world’s first fully Driver Out freight runs on open public roads. Seven runs completed: To date, we have successfully completed seven runs operated entirely by TuSimple’s proprietary Autonomous Driving System (ADS) on open public roads. No human onboard: No person on the vehicle for any runs, nor was there any teleoperation or other human input to the semi-truck’s operation. 80-Mile Freight Route: The runs were conducted on actual freight routes between a railyard in Tucson, AZ, and a high-volume distribution center in the Phoenix metro area. The route covered surface streets, on-ramps, off-ramps, and highways. Natural Interactions with Motorists: TuSimple’s vehicle interacted naturally with traffic, changing lanes at highway speeds, navigating intersections and traffic signals, and handling complex road situations such as emergency lane vehicles. No Traffic Interference: There was no interference with traffic or other aid to the Driver Out semi-truck by TuSimple or law enforcement on any of the runs. 3 550+ Fully Driverless Miles on Public Roads 112 Intersections 28 Traffic Lights Navigated 101 Lane Changes Executed 34 Emergency Lane Vehicles Safely Encountered 7,000+ Cars or Trucks Detected Eight Pedestrians Passed on Local Surface Streets Zero Disengagements or Human Interventions Driver Out Cumulative Stats: First Seven Runs
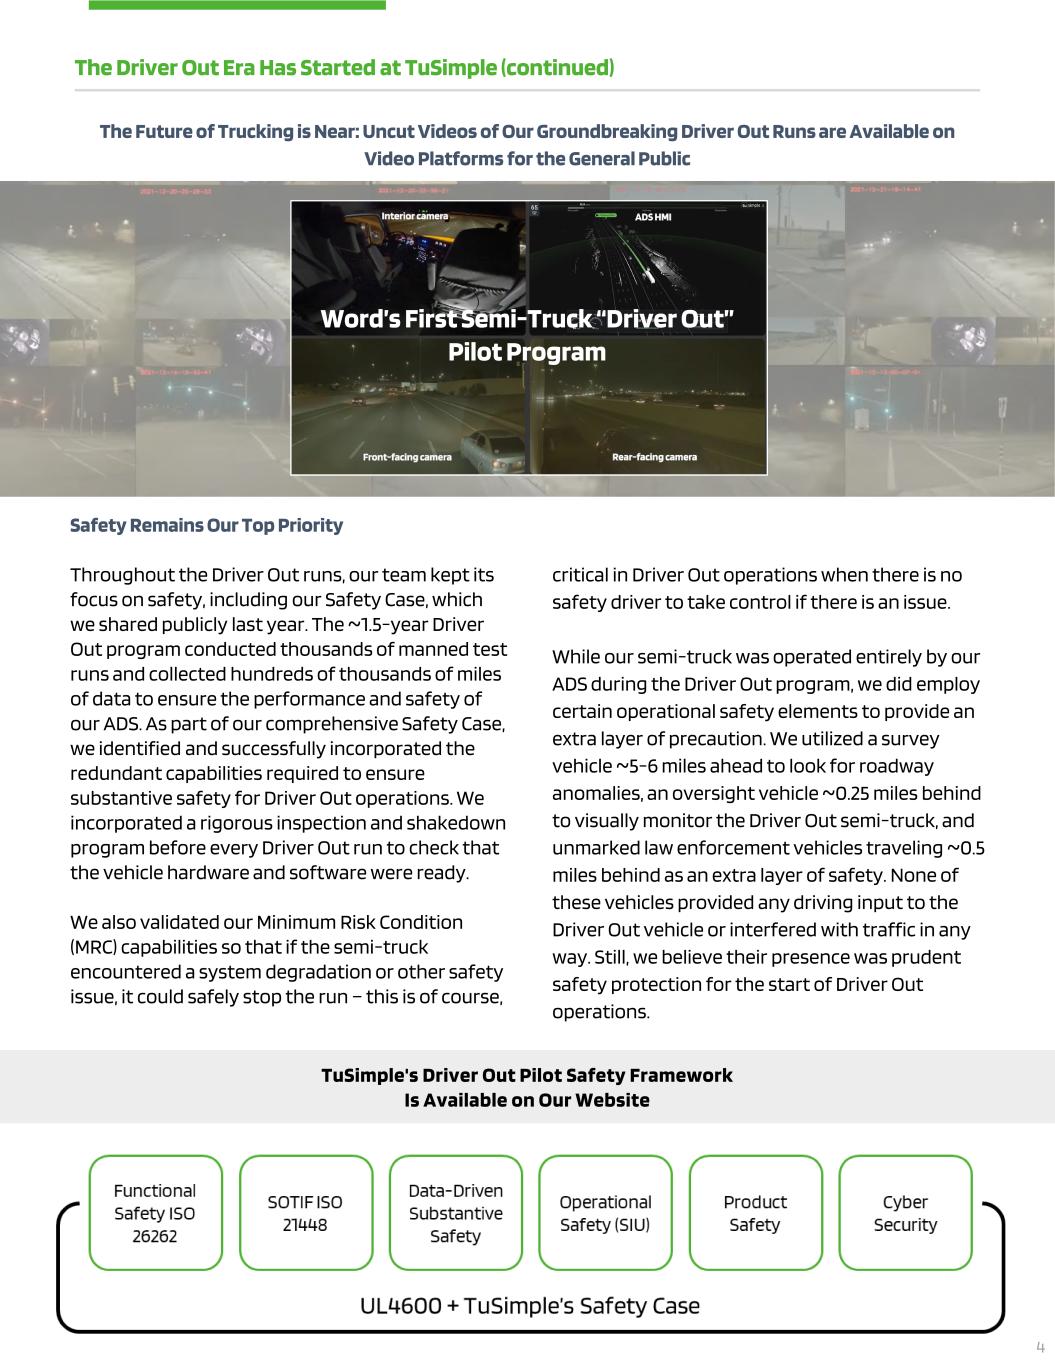
The Driver Out Era Has Started at TuSimple (continued) critical in Driver Out operations when there is no safety driver to take control if there is an issue. While our semi-truck was operated entirely by our ADS during the Driver Out program, we did employ certain operational safety elements to provide an extra layer of precaution. We utilized a survey vehicle ~5-6 miles ahead to look for roadway anomalies, an oversight vehicle ~0.25 miles behind to visually monitor the Driver Out semi-truck, and unmarked law enforcement vehicles traveling ~0.5 miles behind as an extra layer of safety. None of these vehicles provided any driving input to the Driver Out vehicle or interfered with traffic in any way. Still, we believe their presence was prudent safety protection for the start of Driver Out operations. 4 Safety Remains Our Top Priority Throughout the Driver Out runs, our team kept its focus on safety, including our Safety Case, which we shared publicly last year. The ~1.5-year Driver Out program conducted thousands of manned test runs and collected hundreds of thousands of miles of data to ensure the performance and safety of our ADS. As part of our comprehensive Safety Case, we identified and successfully incorporated the redundant capabilities required to ensure substantive safety for Driver Out operations. We incorporated a rigorous inspection and shakedown program before every Driver Out run to check that the vehicle hardware and software were ready. We also validated our Minimum Risk Condition (MRC) capabilities so that if the semi-truck encountered a system degradation or other safety issue, it could safely stop the run – this is of course, The Future of Trucking is Near: Uncut Videos of Our Groundbreaking Driver Out Runs are Available on Video Platforms for the General Public TuSimple's Driver Out Pilot Safety Framework Is Available on Our Website Word’s First Semi-Truck “Driver Out” Pilot Program

Driver Out Commercialization Since our company was founded in 2015, we have had a singular vision and purpose: Apply our proprietary AI technology to develop driver out semi-trucks to transform freight transportation. Since 2015, all elements of our technology development have been led by our visionary co- founder and CTO, Dr. Xiaodi Hou. We believe our focus and team continuity have enabled us to lead the industry in technology. In 2018, we were the first to demonstrate that we were capable of fully autonomous operations on surface streets and highways with a safety driver onboard for redundancy and edge case mitigation. In 2021, we engineered redundancy, reliability, and consistency to operate safely without any driver onboard on a commercial freight route, with our system now responsible for edge case mitigation . Now that we have proven our Driver Out capabilities, our focus fully shifts to commercialization. Driver Out Continues and is Expected to Build to Commercialization in the Next Two Years What’s next for Driver Out? Over the coming months, we plan to continue Driver Out operations on the same route in Arizona. We aim to collect data, improve our system, and continue to demonstrate repeatability. We also plan to begin incorporating daytime runs and removing non- scalable elements, such as our survey vehicle and chase van. Over the next two years, we plan to expand our Driver Out operations to new routes and geographies and improve our ADS and hardware to achieve commercialization, which we define as: • Continuous Driver Out operations that haul paid freight across multiple routes • Clear line-of-sight to per-mile operating costs cheaper than human operations We expect to initially commercialize in the “Texas triangle”, a major freight area running between Dallas, San Antonio, and Houston. Achieving continuous Driver Out operations will require the next generation of our retrofitted trucks, which will be designed to be significantly more advanced as we move closer to our factory- built production truck. Ultimately, the development roadmap for AV trucking is linear. We have experienced the R&D-heavy technology breakthrough and now are scaling to commercialization. We expect it to be a period of intense and defined engineering work, but our goal of making trucking safer, more environmentally friendly, and more efficient is one step closer. 5 Driver Out Marks the Start of Scaling for TuSimple 20182015 End of 20232021 Proof of Concept TuSimple Founded Driver In Full AV Trucking Capabilities Driver Out Operations Begin Scaling Driver Out Freight Operations Commercialization The Driver Out Era Has Started at TuSimple (continued)

TuSimple and NVIDIA to Co-Develop ADC In January, we announced a partnership with NVIDIA to design the world’s most advanced Autonomous Domain Control (ADC) specifically engineered for TuSimple’s Level 4 (L4) autonomous trucking applications. The ADC design will incorporate TuSimple’s leading autonomous driving software and NVIDIA DRIVE Orin system-on-a-chip (SoC) hardware. TuSimple will own usage rights to the ADC reference design, including certain limited “first use” provisions. We intend to work with third-party manufacturers for ADC production and incorporation into our production semi-truck programs. As the leader in AV trucking, we know we need to 6 Planning: TuSimple’s virtual driver AI software makes policy and planning decisions to determine appropriate driving decisions. Perception: The ADC receives input from the vehicle sensors, which are combined with proprietary HD maps to construct a digital representation of the surrounding environment. Proprietary ADC is Designed to Be a Critical Element of TuSimple’s Autonomous Driving System Vehicle Systems Including Engine, Steering, and Braking Vehicle Actuation Autonomous Domain Controller (ADC): Powers hundreds of trillions of operations per second (TOPS) to enable rapid interaction between TuSimple’s perception and planning systems and vehicle actuation controls. Actuation: Controls the autonomous vehicle’s engine, steering, braking and other critical functions. ADC Vertical Integration in Collaboration with NVIDIA ADS Software + Orin SoC Hardware LidarCamera Radar blaze the trail to commercialization. During our Driver Out development in 2021, we learned both the importance of a robust, reliable edge compute, and that the traditional automotive supply base for the ADC was still immature. By vertically integrating the ADC, we expect to have enhanced control over its design and capabilities while accelerating its development timeline. While supply base risk mitigation is one benefit of vertical integration, we believe our ADC will also provide us a meaningful strategic advantage as we build accumulated proprietary IP and know-how while effectively setting the standards for edge computing for the AV trucking industry. Proprietary Autonomous Driving Systems ADC Edge Compute Planning Perception
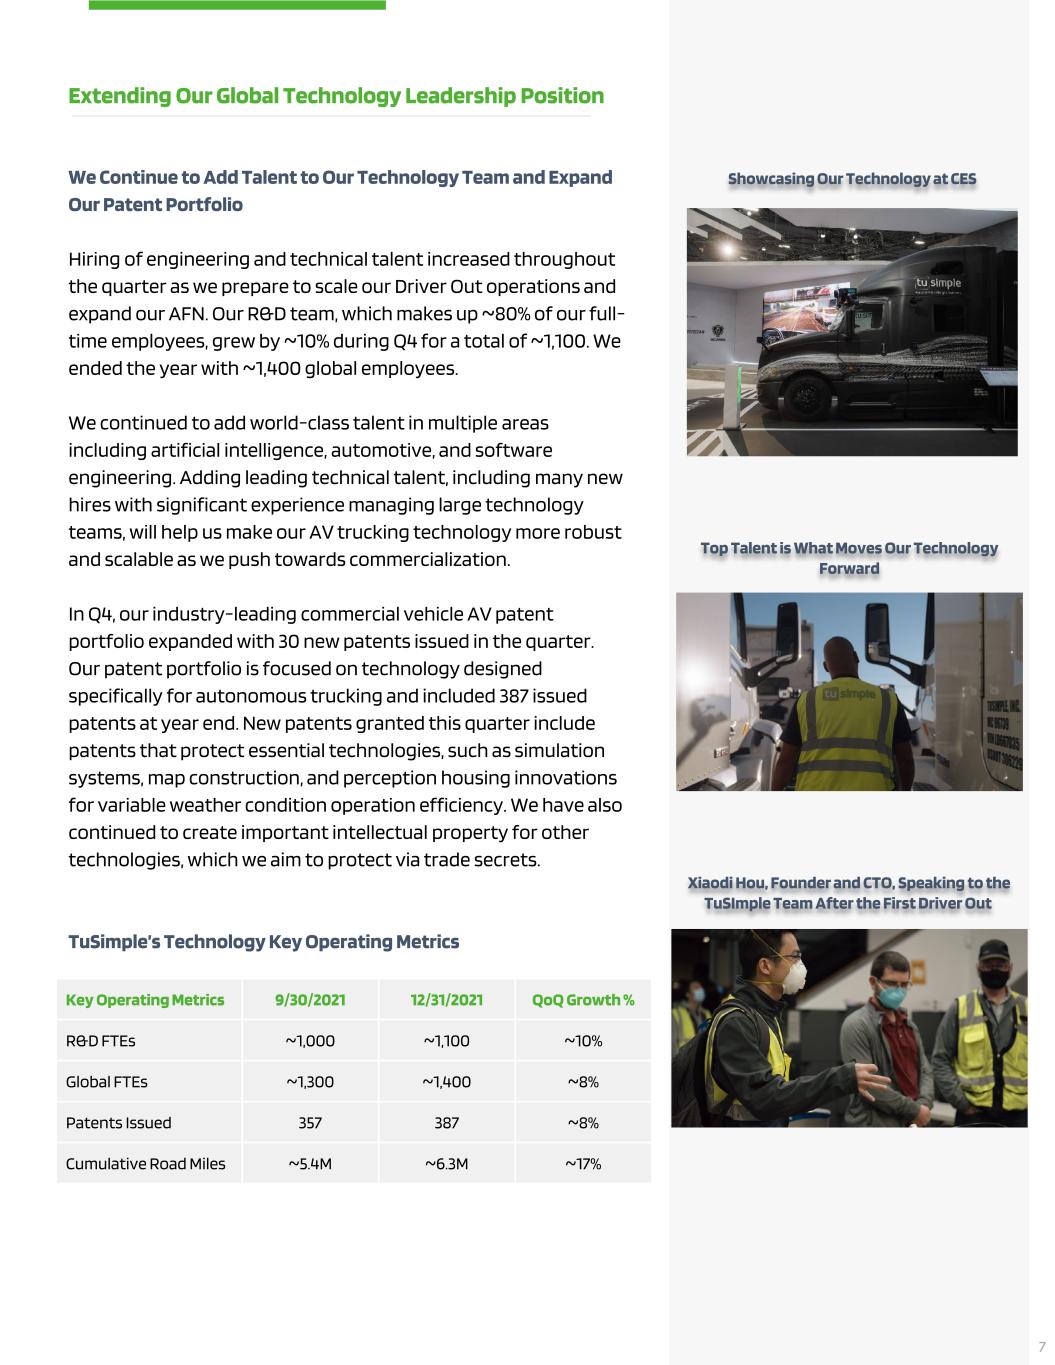
We Continue to Add Talent to Our Technology Team and Expand Our Patent Portfolio Hiring of engineering and technical talent increased throughout the quarter as we prepare to scale our Driver Out operations and expand our AFN. Our R&D team, which makes up ~80% of our full- time employees, grew by ~10% during Q4 for a total of ~1,100. We ended the year with ~1,400 global employees. We continued to add world-class talent in multiple areas including artificial intelligence, automotive, and software engineering. Adding leading technical talent, including many new hires with significant experience managing large technology teams, will help us make our AV trucking technology more robust and scalable as we push towards commercialization. In Q4, our industry-leading commercial vehicle AV patent portfolio expanded with 30 new patents issued in the quarter. Our patent portfolio is focused on technology designed specifically for autonomous trucking and included 387 issued patents at year end. New patents granted this quarter include patents that protect essential technologies, such as simulation systems, map construction, and perception housing innovations for variable weather condition operation efficiency. We have also continued to create important intellectual property for other technologies, which we aim to protect via trade secrets. TuSimple’s Technology Key Operating Metrics Extending Our Global Technology Leadership Position 7 Key Operating Metrics 9/30/2021 12/31/2021 QoQ Growth % R&D FTEs ~1,000 ~1,100 ~10% Global FTEs ~1,300 ~1,400 ~8% Patents Issued 357 387 ~8% Cumulative Road Miles ~5.4M ~6.3M ~17% Showcasing Our Technology at CES Top Talent is What Moves Our Technology Forward Xiaodi Hou, Founder and CTO, Speaking to the TuSImple Team After the First Driver Out

8 3,775 11,200 Q4'20 Q4'21 ~3x YoY Cumulative AFN-Mapped Miles Adding More Blue-Chip Reservation Partners During Q4, we increased reservations by 100 to 6,975 total reservations as of December 31, 2021. The new reservations are from two large trucking fleets, and we anticipate we will start hauling freight for these customers later this year. In December, we announced that we began hauling commercial freight for DHL, a major global logistics organization who became a TuSimple reservation partner in Q3 2021. In 2022, we added two new major logistics players as reservation partners, adding a combined 350 trucks to our reservation book. These new reservations will be included in our Q1 2022 results bringing the total reservations to date to 7,325. Continued AFN Expansion Through Mapping and Freight Operations Freight ecosystem participants continue their enthusiasm about incorporating TuSimple’s L4 technology into their freight networks. To meet their needs, we have continued to map and add freight lanes for strategic partners. In Q4, we mapped over 1,200 new unique miles, expanding our AFN east from Dallas to Memphis and north from Dallas to Oklahoma City. This brings our cumulative unique mapped miles to 11,200 miles. During the quarter, our mapping team made significant enhancements to our map-processing pipeline technology, making map updates quicker and more robust as we prepare for commercialization. We also grew our AFN footprint by scaling freight operations with our customers and reservation partners. In Q4, we added new customer freight routes from Dallas to Orlando and Charlotte for UPS NAAF and from Dallas to San Antonio for DHL. During Q4, we increased our revenue miles by 8% due to increased asset utilization. Commercial Operations: Building Scale Key Operating Metrics Q3’21 Q4’21 QoQ Growth % Total Truck Reservations EOQ 6,875 6,975 ~1% Total Mapped Miles(1) EOQ ~9,900 ~11,200 ~13% Revenue Miles ~945,000 ~1,017,000 ~8% (1) The cumulative unique miles on the AFN on which we have built a map compatible with our autonomous driving software Revenue Miles (Thousands) 600 1,000 Q4'20 Q4'21 ~1.7x YoY The TuSimple Fleet is Expanding Operations Across the Sunbelt 2.9 3.7 4.6 5.4 6.3 Q4'20 Q1'21 Q2'21 Q3'21 Q4'21 28% 24% 17% 17% ~2.2x YoY Cumulative Road Miles (Millions) Note: (%)’s may not foot due to rounding
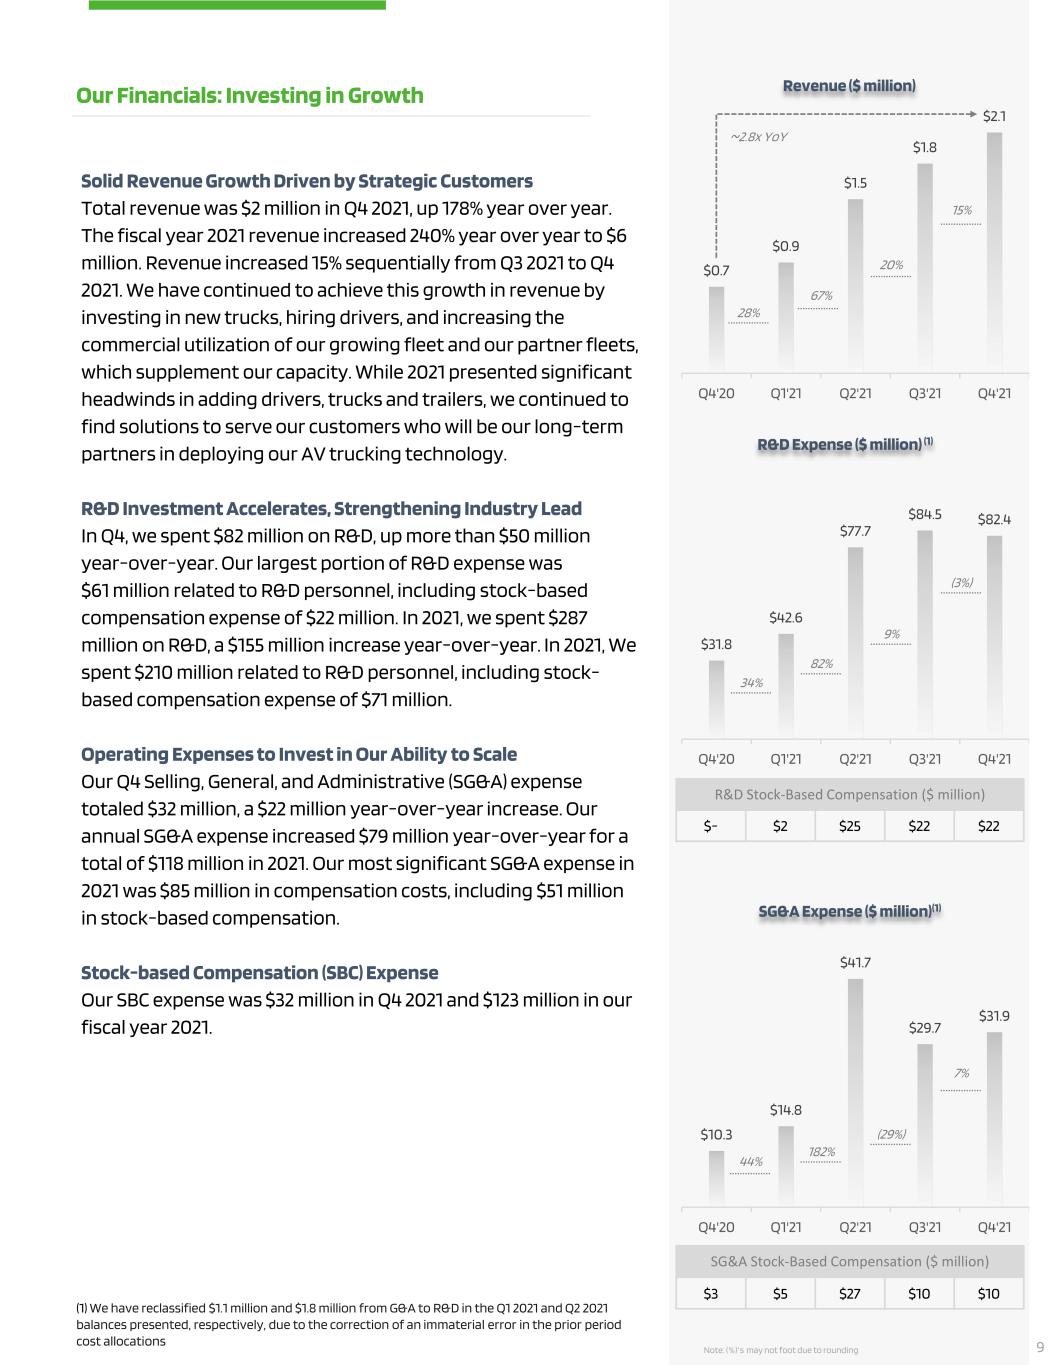
$10.3 $14.8 $41.7 $29.7 $31.9 Q4'20 Q1'21 Q2'21 Q3'21 Q4'21 44% 182% (29%) 7% Solid Revenue Growth Driven by Strategic Customers Total revenue was $2 million in Q4 2021, up 178% year over year. The fiscal year 2021 revenue increased 240% year over year to $6 million. Revenue increased 15% sequentially from Q3 2021 to Q4 2021. We have continued to achieve this growth in revenue by investing in new trucks, hiring drivers, and increasing the commercial utilization of our growing fleet and our partner fleets, which supplement our capacity. While 2021 presented significant headwinds in adding drivers, trucks and trailers, we continued to find solutions to serve our customers who will be our long-term partners in deploying our AV trucking technology. R&D Investment Accelerates, Strengthening Industry Lead In Q4, we spent $82 million on R&D, up more than $50 million year-over-year. Our largest portion of R&D expense was $61 million related to R&D personnel, including stock-based compensation expense of $22 million. In 2021, we spent $287 million on R&D, a $155 million increase year-over-year. In 2021, We spent $210 million related to R&D personnel, including stock- based compensation expense of $71 million. Operating Expenses to Invest in Our Ability to Scale Our Q4 Selling, General, and Administrative (SG&A) expense totaled $32 million, a $22 million year-over-year increase. Our annual SG&A expense increased $79 million year-over-year for a total of $118 million in 2021. Our most significant SG&A expense in 2021 was $85 million in compensation costs, including $51 million in stock-based compensation. Stock-based Compensation (SBC) Expense Our SBC expense was $32 million in Q4 2021 and $123 million in our fiscal year 2021. Revenue ($ million) Our Financials: Investing in Growth SG&A Expense ($ million)(1) R&D Expense ($ million) (1) Note: (%)’s may not foot due to rounding (1) We have reclassified $1.1 million and $1.8 million from G&A to R&D in the Q1 2021 and Q2 2021 balances presented, respectively, due to the correction of an immaterial error in the prior period cost allocations SG&A Stock-Based Compensation ($ million) $3 $5 $27 $10 $10 $- $2 $25 $22 $22 R&D Stock-Based Compensation ($ million) $0.7 $0.9 $1.5 $1.8 $2.1 Q4'20 Q1'21 Q2'21 Q3'21 Q4'21 28% 20% 15% ~2.8x YoY 67% 9 $31.8 $42.6 $77.7 $84.5 $82.4 Q4'20 Q1'21 Q2'21 Q3'21 Q4'21 34% 82% 9% (3%)

Net Loss from Operations and Adjusted EBITDA(1) In Q4, our Net Loss from Operations was ($116) million, and our Adjusted EBITDA was ($81) million. In 2021, our Net Loss from Operations was ($411) million, and our Adjusted EBITDA was ($279) million. Capital Investment Propels AFN Rollout (2) We continue to invest to grow our AFN including growing our revenue and testing truck fleet, adding terminal facilities, and purchasing equipment used in operations. TuSimple invested a total of $1 million in purchases of property and equipment in Q4 and $13 million for full year 2021. We also made acquisitions of property and equipment included in liabilities of $9 million in Q4 and $11 million for full year 2021. Strong Cash Position to Reach Commercialization Our operating cash spending during Q4 was $73 million and a total of $259 million in 2021 as we continue to invest in our strategic growth and development initiatives. We ended the year with over $1.3 billion of cash on the balance sheet. Full Year 2022 Guidance(2) Revenue: $9 - $11 million Adjusted EBITDA Loss: $400 - $420 million Stock-based compensation expense: $155 - $175 million Purchases of property and equipment: $30 - $40 million Ending Cash at 12/31/2022: Approximately $900 million (1) Adjusted EBITDA is calculated by adding back stock-based compensation expense, depreciation, and amortization, and capital lease interest expense to loss from operations. See the section titled “Non-GAAP Financial Measures” for more information. (2) See the section titled “Non-GAAP Financial Measures” for important information regarding the non-GAAP measures used by TuSimple. Our Financials: Investing in Growth (cont’d) 10

In Closing Keeping the trust of our shareholders is critical to us. When we set off on life as a public company in April of 2021, we set ambitious-but-achievable goals and our team delivered in huge way including the world’s first Driver Out trucking operations. We now have set our next ambitious-but-achievable milestone: scaling Driver Out operations rapidly over the next two years. Our historical track record, systematic approach to problem solving, and laser focus on L4 AV trucking gives us confidence that we will continue to deliver. At TuSimple, we are building a Better Path Forward. Sincerely, Pat Dillon Chief Financial Officer Cheng Lu President and Chief Executive Officer 11

Disclaimer This letter and any accompanying oral presentation contain forward-looking statements. All statements other than statements of historical fact contained in this letter, including statements as to future results of operations and financial position, planned products and services, business strategy and plans, launch dates of products or services, the trajectory of our Driver Out Pilot Program, our timeline to commercialization, expected safety benefits of our autonomous semi-trucks, objectives of management for future operations of TuSimple Holdings Inc. and its subsidiaries (the "Company", “we”, “our” and “us”), market size and growth opportunities, competitive position and technological and market trends, are forward-looking statements. Forward- looking statements are inherently subject to risks and uncertainties, some of which cannot be predicted or quantified. In some cases, you can identify forward-looking statements by terms such as “will”, “expect,” “plan,” “anticipate,” “intend,” “target,” “project,” “predict,” “potential,” “explore” or “continue” or the negative of these terms or other similar words. The Company has based these forward-looking statements largely on its current expectations and assumptions and on information available as of the date of this letter. The Company assumes no obligation to update any forward-looking statements after the date of this letter, except as required by law. The forward-looking statements contained in this letter and the accompanying oral presentation are subject to known and unknown risks, uncertainties, assumptions and other factors that may cause actual results or outcomes to be materially different from any future results or outcomes expressed or implied by the forward-looking statements. These risks, uncertainties, assumptions and other factors include, but are not limited to, those related to autonomous driving being an emerging technology, the development of our technology and products, the Company’s limited operating history in a new market, the regulations governing autonomous vehicles, the Company’s dependence on its senior management team, reliance on third-party suppliers, potential product liability or warranty claims and the protection of the Company’s intellectual property. Moreover, the Company operates in a competitive and rapidly changing environment, and new risks may emerge from time to time. You should not put undue reliance on any forward-looking statements. Forward-looking statements should not be read as a guarantee of future performance or results and will not necessarily be accurate indications of the times at, or by, which such performance or results will be achieved, if at all. It is not possible for the Company to predict all risks, nor can the Company assess the impact of all factors on its business or the markets in which it operates or the extent to which any factor, or combination of factors, may cause actual results or outcomes to differ materially from those contained in any forward-looking statements the Company may make. You should carefully consider the foregoing factors and the other risks and uncertainties described under the caption “Risk Factors” in ourmost recent quarterly report on Form 10-Q. These SEC filings identify and address other important risks and uncertainties that could cause actual events and results to differ materially from those contained in the forward-looking statements. This letter also contains estimates, forecasts and other statistical data relating to market size and growth and other industry data. These data involve several assumptions and limitations, and you are cautioned not to give undue weight to such estimates. The Company has not independently verified the statistical and other industry data generated by independent parties and contained in this letter and, accordingly, it cannot guarantee their accuracy or completeness. In addition, assumptions and estimates of the Company’s future performance and the future performance of the markets in which the Company competes are necessarily subject to a high degree of uncertainty and risk due to a variety of factors. These and other factors could cause results or outcomes to differ materially from those expressed in the estimates. Non-GAAP Financial Measures TuSimple has not reconciled its expectations for non-GAAP adjusted EBITDA, because the stock-based compensation expense excluded from such items cannot be reasonably calculated or predicated at this time. The effect of the excluded stock-based compensation may be significant. TuSimple believes the non-GAAP measures calculated herein provide meaningful information to assist investors in understanding financial results and assessing prospects for future performance as they provide a better baseline for analyzing the ongoing performance of its business by excluding items that may not be indicative of core operating results. Because non-GAAP financial measures are not standardized, it may not be possible to compare these measures with other companies’ non-GAAP measures having the same or similar names. Thus, TuSimple’s non-GAAP measures should be considered in addition to, not as a substitute for, or in isolation from, the company’s GAAP results. TuSimple encourages investors and others to review its financial information in its entirety, not to rely on any single financial measure, and to view its non-GAAP measures in conjunction with GAAP financial measures. About TuSimple TuSimple is a global autonomous driving technology company, headquartered in San Diego, California, with operations in Arizona, Texas, China, Japan, Europe, and Canada. Founded in 2015, TuSimple is developing a commercial-ready Level 4 (SAE) fully autonomous driving solution for long-haul heavy-duty trucks. TuSimple aims to transform the $4 trillion global truck freight industry through the company's leading proprietary AI technology, which makes it possible for trucks to see 1,000 meters away, operate nearly continuously, and consume 10% less fuel than manually driven trucks. TuSimple Conference Call Webcast – 2 p.m. PT February 9, 2022 We will host a teleconference call at 2:00 PM Pacific time/5:00 PM Eastern time on February 9 to discuss these results. Interested parties can access the call by dialing North America (toll-free): +1 (833) 519-1404 or International (caller- paid): (270) 215-9738 and entering conference ID: 9580979. 12
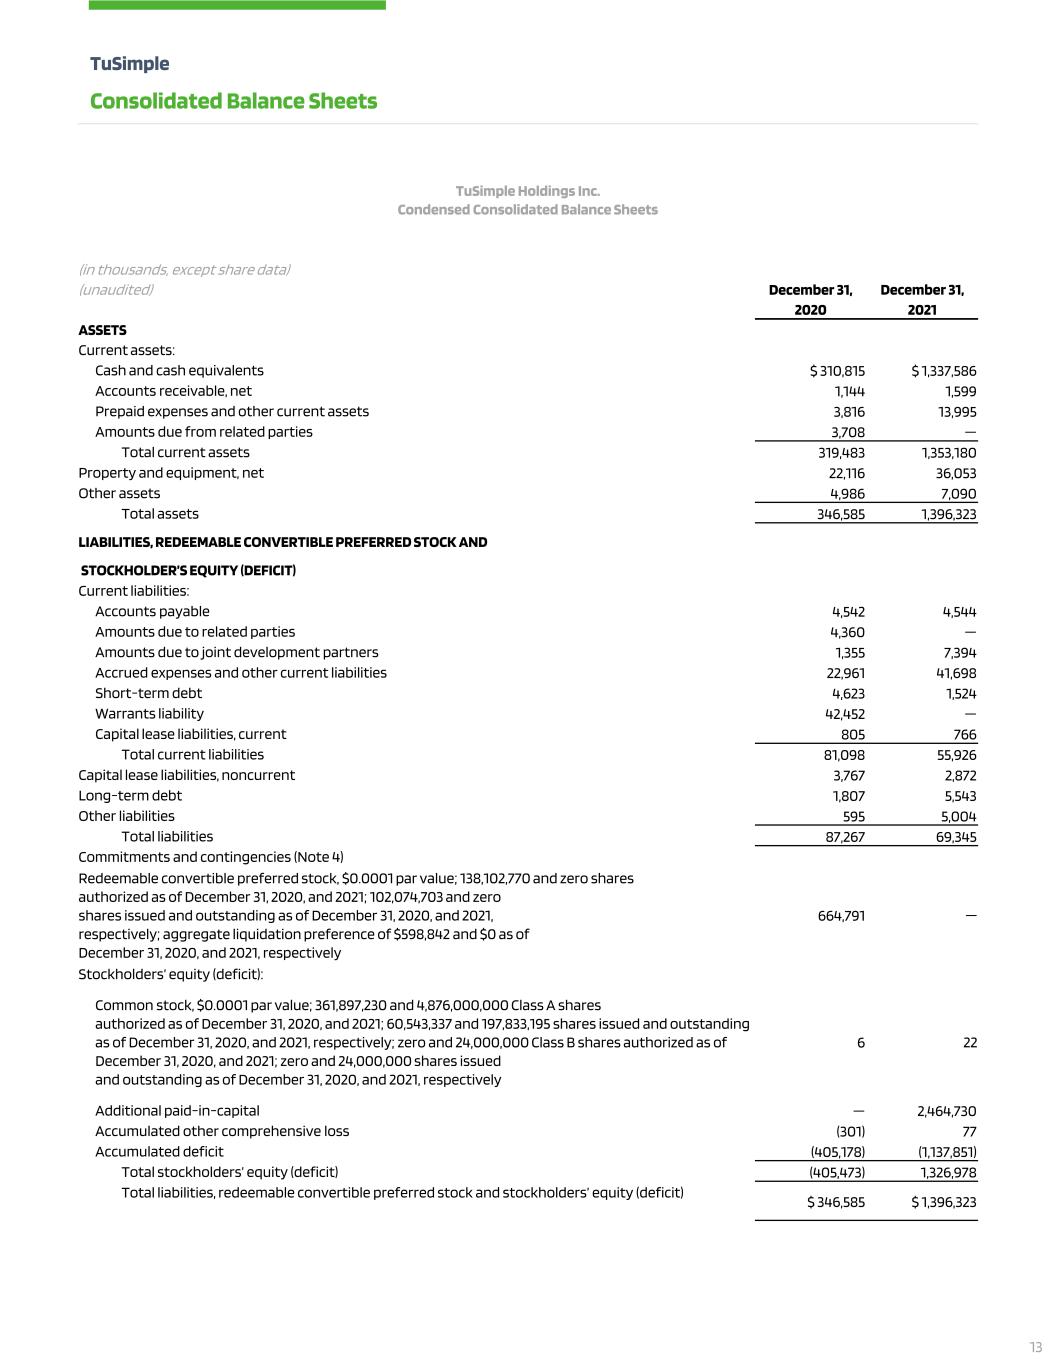
TuSimple Consolidated Balance Sheets TuSimple Holdings Inc. Condensed Consolidated Balance Sheets (in thousands, except share data) (unaudited) December 31, December 31, 2020 2021 ASSETS Current assets: Cash and cash equivalents $ 310,815 $ 1,337,586 Accounts receivable, net 1,144 1,599 Prepaid expenses and other current assets 3,816 13,995 Amounts due from related parties 3,708 — Total current assets 319,483 1,353,180 Property and equipment, net 22,116 36,053 Other assets 4,986 7,090 Total assets 346,585 1,396,323 LIABILITIES, REDEEMABLE CONVERTIBLE PREFERRED STOCK AND STOCKHOLDER’S EQUITY (DEFICIT) Current liabilities: Accounts payable 4,542 4,544 Amounts due to related parties 4,360 — Amounts due to joint development partners 1,355 7,394 Accrued expenses and other current liabilities 22,961 41,698 Short-term debt 4,623 1,524 Warrants liability 42,452 — Capital lease liabilities, current 805 766 Total current liabilities 81,098 55,926 Capital lease liabilities, noncurrent 3,767 2,872 Long-term debt 1,807 5,543 Other liabilities 595 5,004 Total liabilities 87,267 69,345 Commitments and contingencies (Note 4) Redeemable convertible preferred stock, $0.0001 par value; 138,102,770 and zero shares authorized as of December 31, 2020, and 2021; 102,074,703 and zero shares issued and outstanding as of December 31, 2020, and 2021, respectively; aggregate liquidation preference of $598,842 and $0 as of December 31, 2020, and 2021, respectively 664,791 — Stockholders’ equity (deficit): Common stock, $0.0001 par value; 361,897,230 and 4,876,000,000 Class A shares authorized as of December 31, 2020, and 2021; 60,543,337 and 197,833,195 shares issued and outstanding as of December 31, 2020, and 2021, respectively; zero and 24,000,000 Class B shares authorized as of December 31, 2020, and 2021; zero and 24,000,000 shares issued and outstanding as of December 31, 2020, and 2021, respectively 6 22 Additional paid-in-capital — 2,464,730 Accumulated other comprehensive loss (301) 77 Accumulated deficit (405,178) (1,137,851) Total stockholders’ equity (deficit) (405,473) 1,326,978 Total liabilities, redeemable convertible preferred stock and stockholders’ equity (deficit) $ 346,585 $ 1,396,323 13
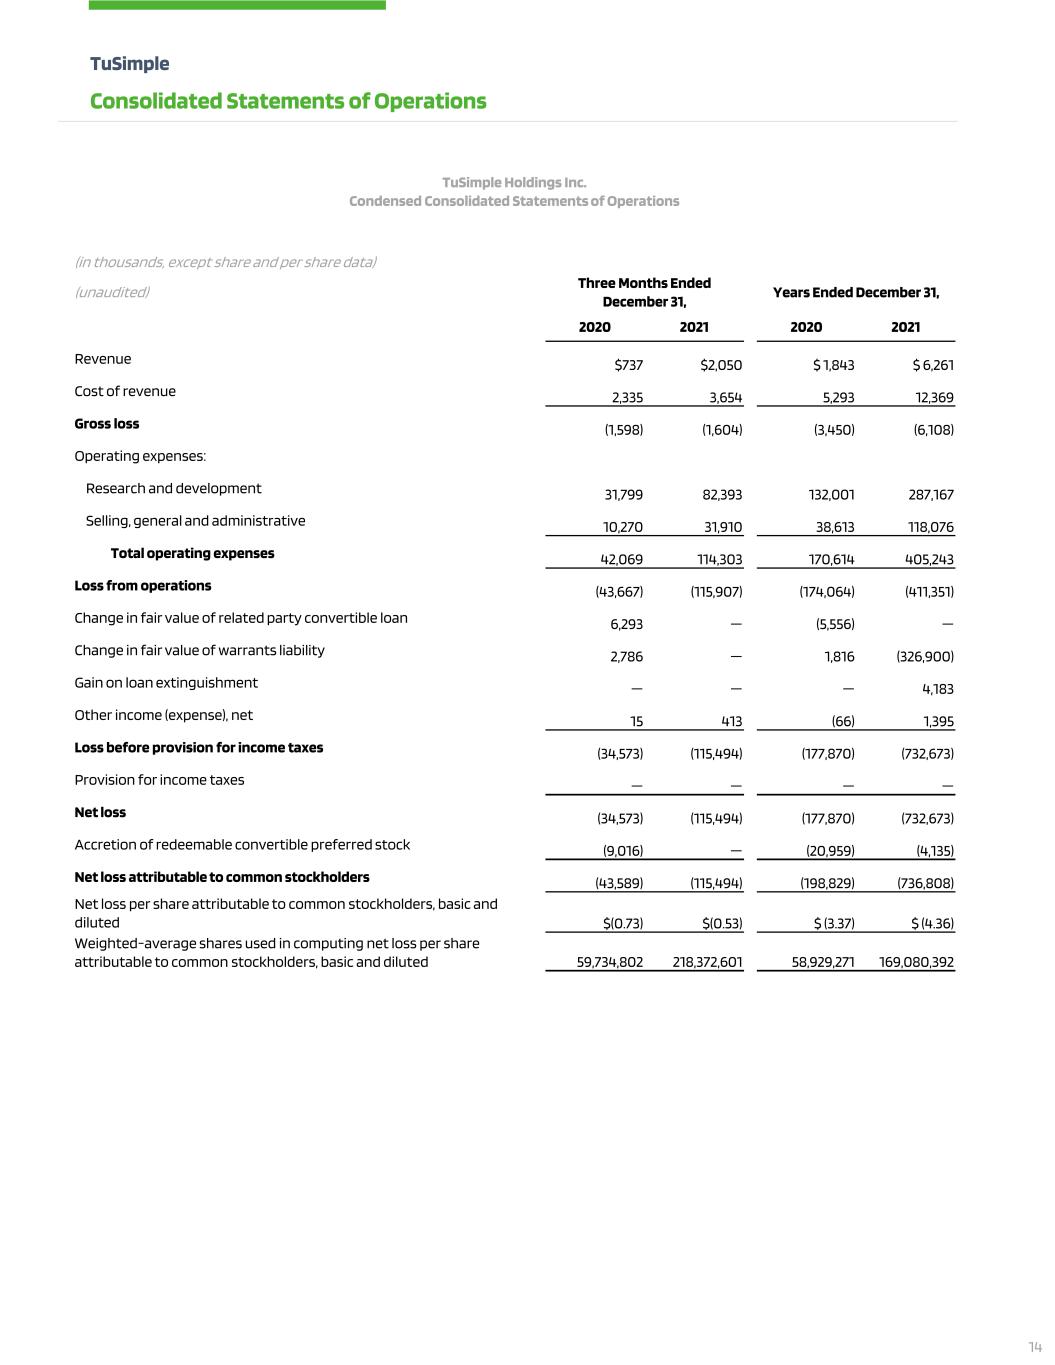
TuSimple Holdings Inc. Condensed Consolidated Statements of Operations (in thousands, except share and per share data) (unaudited) Three Months Ended December 31, Years Ended December 31, 2020 2021 2020 2021 Revenue $737 $2,050 $ 1,843 $ 6,261 Cost of revenue 2,335 3,654 5,293 12,369 Gross loss (1,598) (1,604) (3,450) (6,108) Operating expenses: Research and development 31,799 82,393 132,001 287,167 Selling, general and administrative 10,270 31,910 38,613 118,076 Total operating expenses 42,069 114,303 170,614 405,243 Loss from operations (43,667) (115,907) (174,064) (411,351) Change in fair value of related party convertible loan 6,293 — (5,556) — Change in fair value of warrants liability 2,786 — 1,816 (326,900) Gain on loan extinguishment — — — 4,183 Other income (expense), net 15 413 (66) 1,395 Loss before provision for income taxes (34,573) (115,494) (177,870) (732,673) Provision for income taxes — — — — Net loss (34,573) (115,494) (177,870) (732,673) Accretion of redeemable convertible preferred stock (9,016) — (20,959) (4,135) Net loss attributable to common stockholders (43,589) (115,494) (198,829) (736,808) Net loss per share attributable to common stockholders, basic and diluted $(0.73) $(0.53) $ (3.37) $ (4.36) Weighted-average shares used in computing net loss per share attributable to common stockholders, basic and diluted 59,734,802 218,372,601 58,929,271 169,080,392 TuSimple Consolidated Statements of Operations 14

TuSimple Consolidated Statements of Cash Flows TuSimple Holdings Inc. Condensed Consolidated Statements of Cash Flows (in thousands) (unaudited) Years Ended December 31, 2020 2021 Cash flows from operating activities: Net loss $ (177,870) $ (732,673) Adjustments to reconcile net loss to net cash used in operating activities: Stock-based compensation 12,763 122,596 Accretion of asset retirement obligations 35 — Bad debt expense — 42 Depreciation and amortization 7,683 9,450 Loss (Gain) on disposal of property and equipment 134 (19) Non-cash research and development expense 32,325 — Change in fair value of warrants liability (1,816) 326,900 Change in fair value of related party convertible loan 5,556 — Gain on loan extinguishment — (4,183) Changes in operating assets and liabilities: Accounts receivable (1,004) (497) Prepaid expenses and other current assets 274 (10,209) Other assets (682) (1,777) Accounts payable 4,196 (181) Amounts due to/from related parties (205) — Amounts due to joint development partners 1,355 6,039 Accrued expenses and other current liabilities 13,112 25,486 Other liabilities 296 (7) Net cash used in operating activities (103,848) (259,033) Cash flows from investing activities: Repayments from advances to related parties 8 Purchases of property and equipment (4,303) (13,321) Purchases of intangible assets (306) (416) Proceeds from disposal of property and equipment 189 100 Net cash used in investing activities (4,412) (13,637) Cash flows from financing activities: Proceeds from issuance of redeemable convertible preferred stock, net of offering costs 291,646 54,693 Proceeds from exercise of warrants for redeemable convertible preferred stock 2,500 183,007 Proceeds from issuance of related party convertible loan 50,000 — Proceeds from issuance of warrants 11,943 — Proceeds from exercise of stock options — 1,163 Proceeds from issuance of common stock upon initial public offering, net of offering costs — 1,030,965 Proceeds from issuance of common stock related to private placement — 35,000 Proceeds from related party loan 5,000 — Proceeds from loans 4,134 — Return of guaranteed deposit on related party loan — 3,715 Principal payments on related party loan (7,900) (4,398) Payment of third-party costs in connection with initial public offering — (3,591) Principal payments on capital lease obligations (713) (783) Principal payments on other liabilities (115) (620) Net cash provided by financing activities 356,495 1,299,151 Effect of exchange rate changes on cash, cash equivalents, and restricted cash 6 260 Net increase (decrease) in cash, cash equivalents, and restricted cash 248,241 1,026,741 Cash, cash equivalents, and restricted cash - beginning of period 64,110 312,351 Cash, cash equivalents, and restricted cash - end of period $ 312,351 $ 1,339,092 15
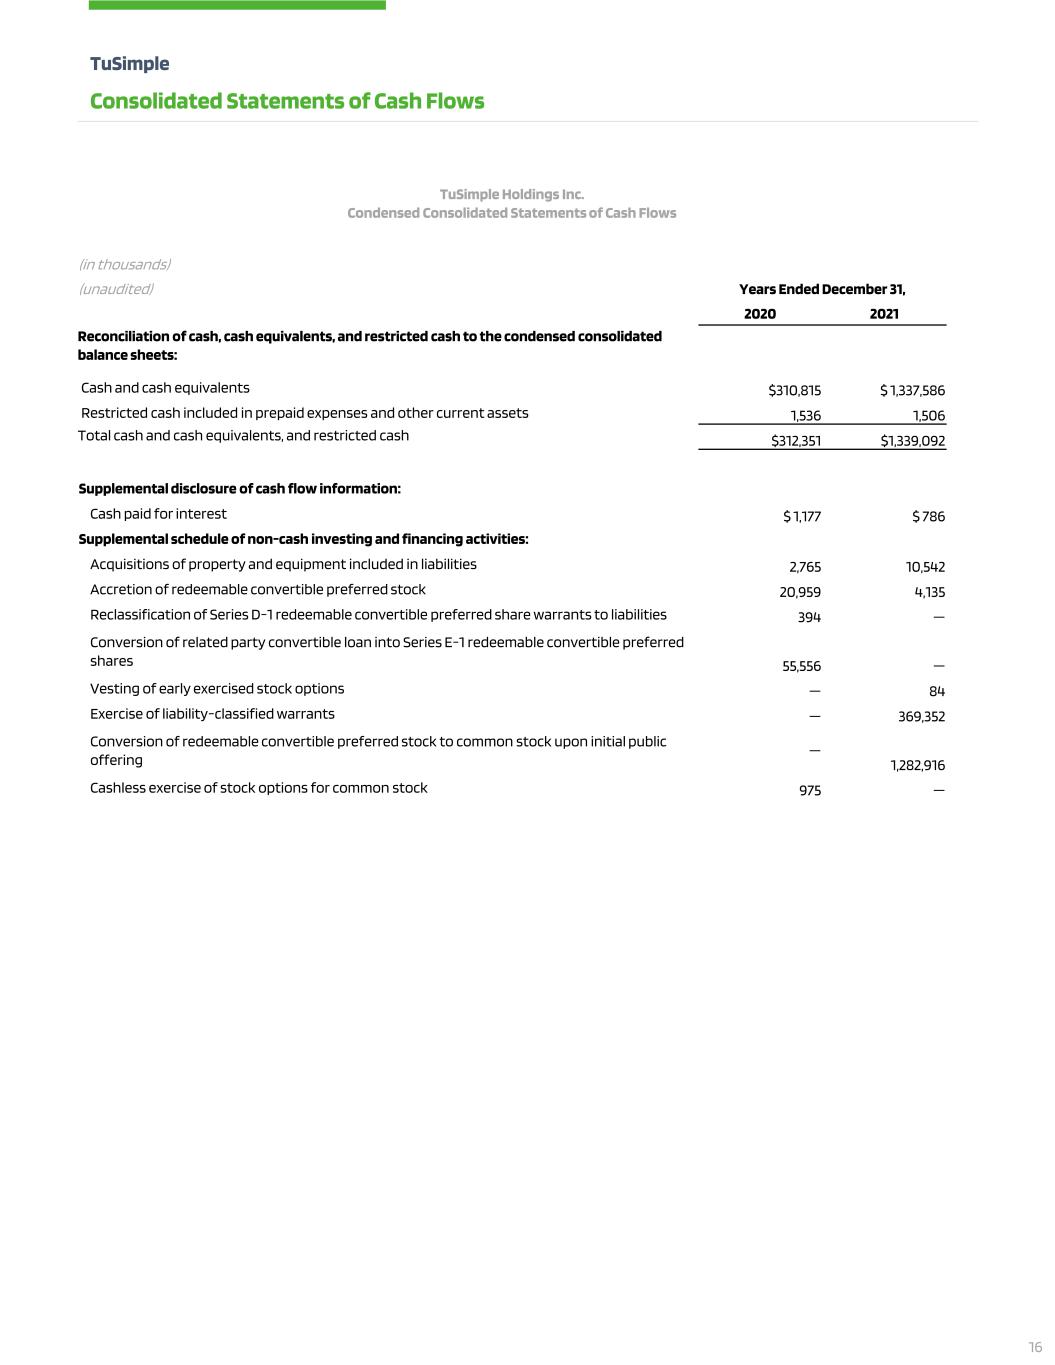
TuSimple Consolidated Statements of Cash Flows TuSimple Holdings Inc. Condensed Consolidated Statements of Cash Flows (in thousands) (unaudited) Years Ended December 31, 2020 2021 Reconciliation of cash, cash equivalents, and restricted cash to the condensed consolidated balance sheets: Cash and cash equivalents $310,815 $ 1,337,586 Restricted cash included in prepaid expenses and other current assets 1,536 1,506 Total cash and cash equivalents, and restricted cash $312,351 $1,339,092 Supplemental disclosure of cash flow information: Cash paid for interest $ 1,177 $ 786 Supplemental schedule of non-cash investing and financing activities: Acquisitions of property and equipment included in liabilities 2,765 10,542 Accretion of redeemable convertible preferred stock 20,959 4,135 Reclassification of Series D-1 redeemable convertible preferred share warrants to liabilities 394 — Conversion of related party convertible loan into Series E-1 redeemable convertible preferred shares 55,556 — Vesting of early exercised stock options — 84 Exercise of liability-classified warrants — 369,352 Conversion of redeemable convertible preferred stock to common stock upon initial public offering — 1,282,916 Cashless exercise of stock options for common stock 975 — 16
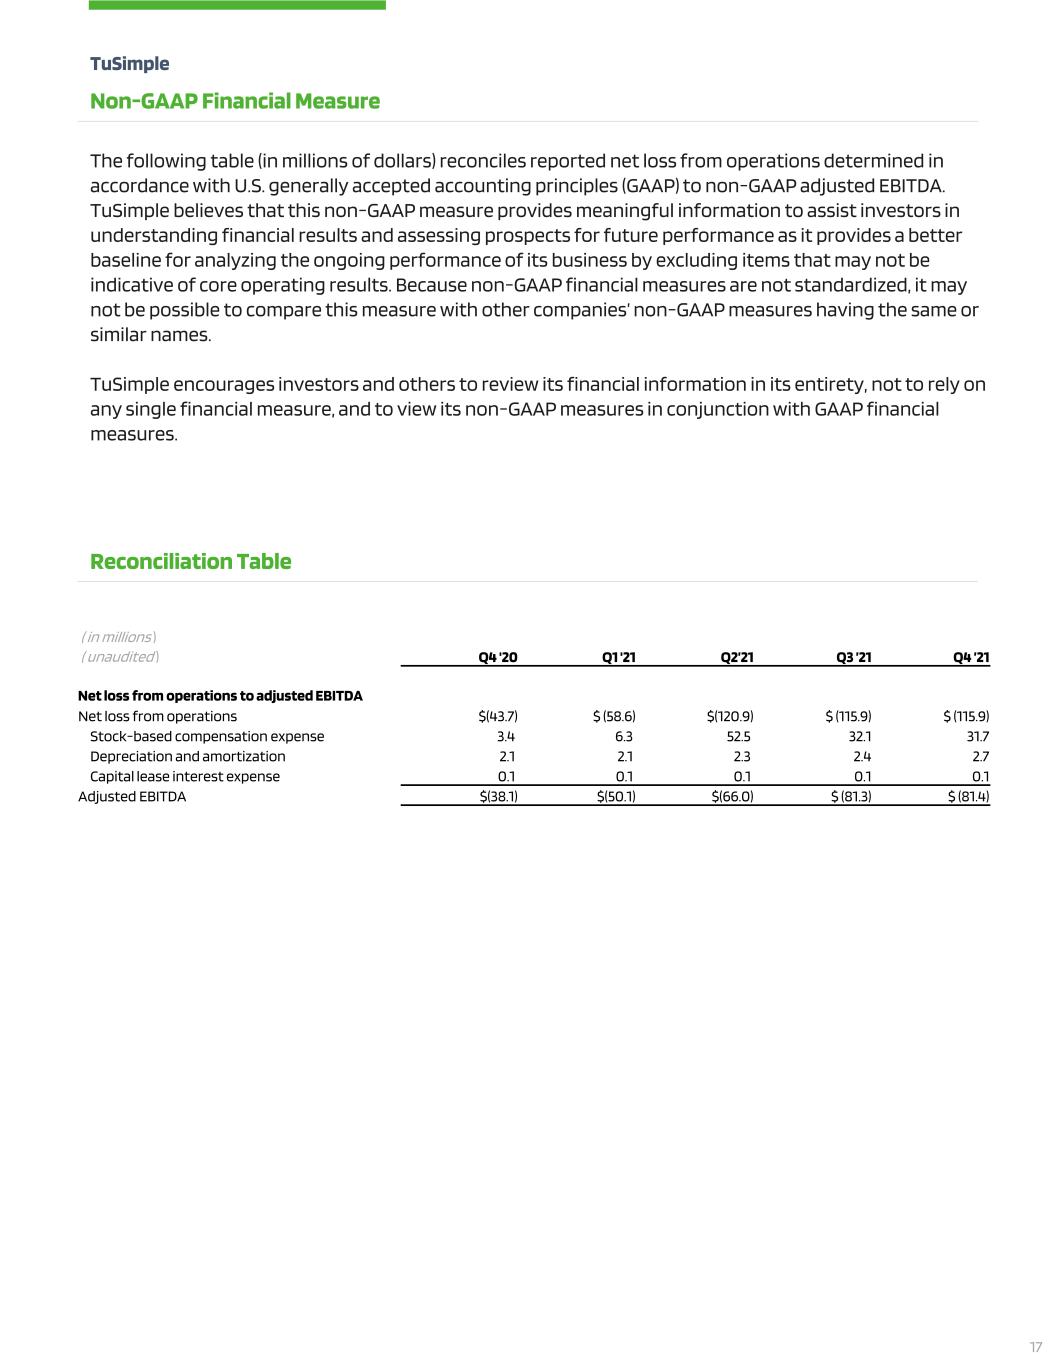
( in millions ) ( unaudited ) Q4 '20 Q1 '21 Q2’21 Q3 ’21 Q4 ’21 Net loss from operations to adjusted EBITDA Net loss from operations $(43.7) $ (58.6) $(120.9) $ (115.9) $ (115.9) Stock-based compensation expense 3.4 6.3 52.5 32.1 31.7 Depreciation and amortization 2.1 2.1 2.3 2.4 2.7 Capital lease interest expense 0.1 0.1 0.1 0.1 0.1 Adjusted EBITDA $(38.1) $(50.1) $(66.0) $ (81.3) $ (81.4) TuSimple Non-GAAP Financial Measure The following table (in millions of dollars) reconciles reported net loss from operations determined in accordance with U.S. generally accepted accounting principles (GAAP) to non-GAAP adjusted EBITDA. TuSimple believes that this non-GAAP measure provides meaningful information to assist investors in understanding financial results and assessing prospects for future performance as it provides a better baseline for analyzing the ongoing performance of its business by excluding items that may not be indicative of core operating results. Because non-GAAP financial measures are not standardized, it may not be possible to compare this measure with other companies’ non-GAAP measures having the same or similar names. TuSimple encourages investors and others to review its financial information in its entirety, not to rely on any single financial measure, and to view its non-GAAP measures in conjunction with GAAP financial measures. Reconciliation Table 17
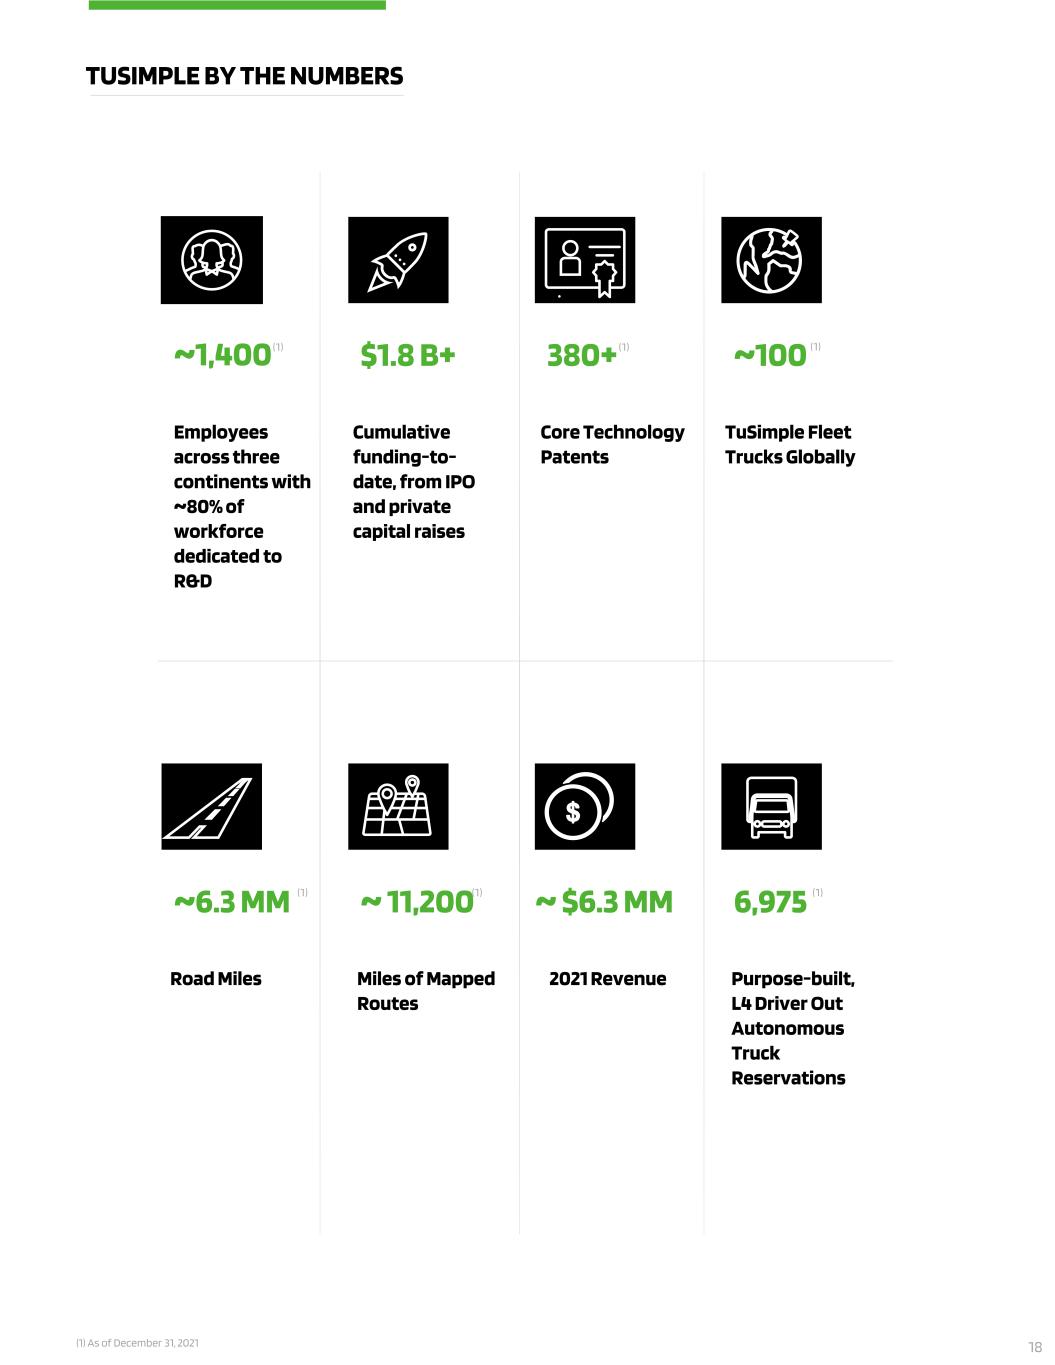
~1,400 Employees across three continents with ~80% of workforce dedicated to R&D TUSIMPLE BY THE NUMBERS $1.8 B+ Cumulative funding-to- date, from IPO and private capital raises ~ 11,200 380+ ~100 Miles of Mapped Routes Core Technology Patents TuSimple Fleet Trucks Globally 6,975 Purpose-built, L4 Driver Out Autonomous Truck Reservations ~6.3 MM Road Miles ~ $6.3 MM 2021 Revenue (1) As of December 31, 2021 (1) (1) (1) (1)(1) (1) 18


