
| 2Q21 Earnings Release August 18th, 2021 |  |
Vinci Partners Reports Second Quarter 2021 Earnings Results
Alessandro Horta, Chief Executive Officer, stated, “Vinci Partners reported outstanding results for the second quarter. Distributable Earningsi doubled year-over-year and Fee Related Earningsii grew by 67%, when compared to the second quarter of 2020. AUMiii expanded 31% year-over-year, reaching R$57 billion at the end of the quarter. Momentum is very strong across all our platform, which translates into record quarterly FRE and Distributable Earnings.”
Dividend
Vinci Partners has declared a semi-annual dividend of US$0.30 per share to record holders of common stock at the close of business on September 1, 2021. This dividend will be paid on September 16, 2021.
ABOUT VINCI PARTNERS Vinci Partners is a leading alternative investment platform in Brazil, established in 2009. Vinci Partners’ business segments include Private Markets (Private Equity, Real Estate, Infrastructure and Credit), Liquid Strategies (Public Equities and Hedge Funds), Investment products and Solutions, and Financial Advisory. As of June 30, 2021, the firm had R$57 billion of assets under management.
WEBCAST AND EARNINGS CONFERENCE CALL Vinci Partners will host a conference call at 5:00pm EST on Wednesday, August 18, 2021, to announce its second quarter 2021 results.
To access the full detailed presentation and listen to the conference call via public webcast, please visit the Events & Presentations section of the Company’s website at https://ir.vincipartners.com/news-
For those unable to listen to the live broadcast, there will be a webcast replay on the same section of the website.
The conference call can also be accessed by dialing the following:
+1 (833) 665-0595 (Domestic) +1 (661) 407-1609 (International) Conference ID: 9577665
INVESTOR CONTACT ShareholderRelations@vincipartners.com NY: +1 (646) 559-8040 RJ: +55 (21) 2159-6240
USA MEDIA CONTACT Joele Frank, Wilkinson Brimmer Katcher Nick Lamplough / Kate Thompson / Katie Villany +1 (212) 355-4449
BRAZIL MEDIA CONTACT Danthi Comunicações Carla Azevedo (carla@danthicomunicacoes.com.br) +55 (21) 3114-0779 |
Second Quarter 2021 Highlights

Fee Related Earnings (FRE) – R$mm

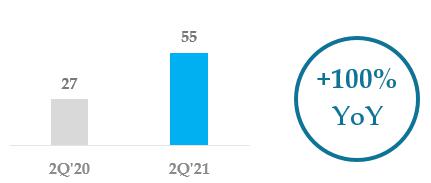
Distributable Earnings (DE) – R$mm
| / IR.VINCIPARTNERS.COM |  | / SHAREHOLDERRELATIONS@VINCIPARTNERS.COM |  |
|
| |
Segment Earnings (Unaudited)
| (R$ thousands, unless mentioned) | 2Q'20 | 2Q'21 | ∆ (%) | 2Q'20 YTD | 2Q'21 YTD | ∆ (%) |
| Net revenue from management fees | 60,826 | 94,778 | 56% | 123,724 | 176,621 | 43% |
| Net revenue from advisory fees | 6,479 | 6,378 | -2% | 22,451 | 21,444 | -4% |
| Total Fee Related Revenues | 67,305 | 101,156 | 50% | 146,175 | 198,065 | 35% |
| Segment personnel expenses | (3,600) | (5,528) | 54% | (6,840) | (10,625) | 55% |
| Other G&A expenses | (4,436) | (4,058) | -9% | (6,534) | (7,632) | 17% |
| Corporate center expenses | (12,632) | (19,296) | 53% | (26,606) | (38,808) | 46% |
| Bonus compensation related to management and advisory | (13,607) | (17,082) | 26% | (28,597) | (35,608) | 25% |
| Total Fee Related Expenses | (34,275) | (45,964) | 56% | (68,577) | (92,674) | 35% |
| FEE RELATED EARNINGS (FRE) | 33,030 | 55,192 | 67% | 77,598 | 105,391 | 36% |
| FRE Margin (%) | 49.1% | 54.6% | 53.1% | 53.2% | ||
| FRE per share (R$/share) | 0.58 | 0.97 | 1.37 | 1.86 | ||
| Net revenue from performance fees | 19,537 | 18,624 | -5% | 15,561 | 28,575 | 84% |
| Performance based compensation | (6,712) | (7,817) | 16% | (5,270) | (11,109) | 111% |
| PERFORMANCE RELATED EARNINGS (PRE) | 12,825 | 10,807 | -16% | 10,291 | 17,466 | 70% |
| PRE Margin (%) | 65.6% | 58.0% | 66.1% | 61.1% | ||
| (-) Unrealized performance fees | (11,794) | (9,065) | -23% | (6,724) | (9,487) | 41% |
| (+) Unrealized performance compensation | 4,284 | 2,980 | -30% | 2,442 | 3,130 | 28% |
| (+) Realized GP investment income | 1 | 345 | 34400% | 39 | 457 | 1072% |
| SEGMENT DISTRIBUTABLE EARNINGS | 38,346 | 60,259 | 57% | 83,646 | 116,958 | 40% |
| Segment DE Margin (%) | 51.1% | 54.3% | 53.9% | 53.7% | ||
| (+) Depreciation and amortization | - | 926 | N/A | - | 1,865 | N/A |
| (+) Realized financial income | 933 | 14,239 | 1426% | 1,969 | 18,883 | 859% |
| (-) Leasing expenses | (3,047) | (3,106) | 2% | (6,112) | (6,263) | 2% |
| (-) Other items | 207 | (2,120) | N/A | 603 | (1,234) | N/A |
| (-) Income taxes (excluding related to unrealized fees and income) | (9,016) | (15,417) | 71% | (19,294) | (28,232) | 46% |
| DISTRIBUTABLE EARNINGS (DE) | 27,423 | 54,781 | 100% | 60,812 | 101,976 | 68% |
| DE Margin (%) | 36.1% | 43.7% | 38.7% | 43.1% | ||
| DE per share (R$/share) | 0.48 | 0.97 | 1.07 | 1.80 |
| / IR.VINCIPARTNERS.COM | | / SHAREHOLDERRELATIONS@VINCIPARTNERS.COM | |
|
| |
Total Fee-Related Revenuesiv of R$101.2 million for the quarter ended June 30, 2021, compared to R$67.3 million for the quarter ended June 30, 2020, an increase of 56% year-over year, driven by the strong growth in the Fee earning AUM. Fee-related revenues were R$198.1 million for the six months ended June 30, 2021, up 35% year-over-year, when compared to the six months ended June 30, 2020.
Fee Related Earnings (“FRE”) of R$55.2 million (R$0.97/share) for the quarter ended June 30, 2021, compared to R$33.0 million for the quarter ended June 30, 2020, an increase of 67% year-over-year, driven by the robust growth in management fees across segments. FRE was R$105.4 million for the six months ended June 30, 2021, up 36% year-over-year, when compared to the six months ended June 30, 2020.
FRE Marginv was 54.6% for the quarter ended June 30, 2021, compared to 49.1% for the quarter ended June 30, 2020, an increase of 5.4 percentage points year-over-year, showcasing the platform´s highly scalable potential.
Performance Related Earnings (“PRE”)vi of R$10.8 million for the quarter ended June 30, 2021, down 16% compared to R$12.8 million for the quarter ended June 30, 2020, primarily due to a substantial outperformance from our Total Return strategy in Hedge Funds, impacting performance compensation expenses. PRE was R$17.5 million for the six months ended June 30, 2021, up 70% year-over-year, when compared to the six months ended June 30, 2020.
Segment Distributable Earningsvii of R$60.3 million for the quarter ended June 30, 2021, compared to R$38.3 million for the quarter ended June 30, 2020, an increase of 57% year-over-year. Segment Distributable Earnings was R$117.0 million for the six months ended June 30, 2021, up 40% year-over-year, when compared to the six months ended June 30, 2020.
Distributable Earnings (“DE”) of R$54.8 million (R$0.97/share) for the quarter ended June 30, 2021, compared to R$27.4 million for the quarter ended June 30, 2020, an increase of 100% year-over-year, driven by the notable growth in management fees and financial income in the quarter. DE was R$ 102.0 million for the six months ended June 30, 2021, up 68% year-over-year, when compared to the six months ended June 30, 2020.
DE Marginviii was 43.7% for the quarter ended June 30, 2021, a 7.6 percentage point increase compared to 36.1 % for the quarter ended June 30, 2020.
| / IR.VINCIPARTNERS.COM | | / SHAREHOLDERRELATIONS@VINCIPARTNERS.COM | |
|
| |
Segment Highlights
Private Market Strategies
| (R$ thousands, unless mentioned) | 2Q'20 | 2Q'21 | ∆ (%) | 2Q'20 YTD | 2Q'21 YTD | ∆ (%) |
| Net revenue from management fees | 37,147 | 49,406 | 33% | 74,213 | 95,987 | 29% |
| Net revenue from advisory fees | 92 | 2,641 | 2772% | 817 | 3,146 | 285% |
| Total Fee Related Revenues | 37,239 | 52,047 | 40% | 75,030 | 99,133 | 32% |
| Segment personnel expenses | (1,931) | (2,722) | 41% | (3,637) | (5,160) | 42% |
| Other G&A expenses | (3,330) | (2,907) | -13% | (4,283) | (5,232) | 22% |
| Corporate center expenses | (7,376) | (9,792) | 33% | (15,257) | (20,376) | 34% |
| Bonus compensation related to management and advisory | (6,742) | (7,568) | 12% | (12,894) | (15,299) | 19% |
| Total Fee Related Expenses | (19,380) | (22,989) | 19% | (36,071) | (46,067) | 28% |
| FEE RELATED EARNINGS (FRE) | 17,860 | 29,058 | 63% | 38,959 | 53,066 | 36% |
| FRE Margin (%) | 48.0% | 55.8% | 51.9% | 53.5% | ||
| Net revenue from performance fees | 13,898 | 1,792 | -87% | 10,783 | 2,254 | -79% |
| Realized performance fees | 2,103 | 715 | -66% | 2,106 | 755 | -64% |
| Unrealized performance fees | 11,794 | 1,077 | -91% | 8,677 | 1,499 | -83% |
| Performance based compensation | (4,915) | (570) | -88% | (3,784) | (731) | -81% |
| PERFORMANCE RELATED EARNINGS (PRE) | 8,983 | 1,222 | -86% | 7,000 | 1,523 | -78% |
| PRE Margin (%) | 64.6% | 68.2% | 64.9% | 67.6% | ||
| (-) Unrealized performance fees | (11,794) | (1,077) | -91% | (8,677) | (1,499) | -83% |
| (+) Unrealized performance compensation | 4,284 | 382 | -91% | 3,151 | 532 | -83% |
| (+) Realized GP investment income | 1 | 345 | 34400% | 39 | 457 | 1072% |
| SEGMENT DISTRIBUTABLE EARNINGS | 19,333 | 29,930 | 55% | 40,472 | 54,078 | 34% |
| Segment DE Margin (%) | 49.1% | 56.7% | 52.5% | 54.1% | ||
| AUM (R$ millions) | 17,328 | 20,762 | 20% | 17,328 | 20,762 | 20% |
| FEAUM (R$ millions) | 15,271 | 18,873 | 24% | 15,271 | 18,873 | 24% |
| AVERAGE MANAGEMENT FEE RATE (%) | 0.89% | 0.99% | 0.91% | 0.98% | ||
| FULL TIME EMPLOYEES | 41 | 50 | 22% | 41 | 50 | 22% |
Fee related earnings (FRE) of R$29.1 million in the 2Q’21, an increase of 63% year-over-year, driven by the growth in fee-earning AUM. FRE was R$53.1 million in the 2Q'21 YTD, up 36% when compared to the 2Q'20 YTD.
Segment Distributable Earnings of R$29.9 million in the 2Q’21, an increase of 55% year-over-year. Segment DE was R$54.1 million in the 2Q'21 YTD, up 34% when compared to the 2Q'20 YTD.
AUM of R$20.8 billion at the end of the 2Q'21, an increase of 20% year-over-year, with highlights to over R$2 billion raised through six different fundraisings in our Private Equity, Real Estate and Infrastructure strategies in the first half of 2021.
Fee-earning AUM of R$18.9 billion at the end of the 2Q'21, an increase of 24% year-over-year. This increase positively impacted our average management fee rate, going from 89 basis points in the 2Q’20 to 99 basis points in the 2Q’21, with highlights to fundraising for VIR IV and public market vehicles during the past year.
| / IR.VINCIPARTNERS.COM | | / SHAREHOLDERRELATIONS@VINCIPARTNERS.COM | |
|
| |
Liquid Strategies
| (R$ thousands, unless mentioned) | 2Q'20 | 2Q'21 | ∆ (%) | 2Q’20 YTD | 2Q’21 YTD | ∆ (%) |
| Net revenue from management fees | 13,559 | 23,020 | 70% | 30,306 | 43,003 | 42% |
| Net revenue from advisory fees | 0 | 0 | N/A | 0 | 0 | N/A |
| Total Fee Related Revenues | 13,559 | 23,020 | 65% | 30,306 | 43,003 | 40% |
| Segment personnel expenses | (669) | (1,387) | 107% | (1,328) | (2,680) | 102% |
| Other G&A expenses | (687) | (681) | -1% | (1,347) | (1,305) | -3% |
| Corporate center expenses | (2,685) | (4,196) | 56% | (6,178) | (8,689) | 41% |
| Bonus compensation related to management and advisory | (2,565) | (3,893) | 52% | (5,446) | (7,312) | 34% |
| Total Fee Related Expenses | (6,606) | (10,157) | 54% | (14,299) | (19,986) | 40% |
| FEE RELATED EARNINGS (FRE) | 6,952 | 12,863 | 85% | 16,007 | 23,017 | 44% |
| FRE Margin (%) | 51.3% | 55.9% | 52.8% | 53.5% | ||
| Net revenue from performance fees | 3,647 | 6,450 | 77% | 2,478 | 8,459 | 241% |
| Realized performance fees | 3,647 | 6,450 | 77% | 4,374 | 8,459 | 93% |
| Unrealized performance fees | 0 | 0 | N/A | (1,896) | 0 | N/A |
| Performance based compensation | (1,094) | (4,015) | 267% | (671) | (4,718) | 603% |
| PERFORMANCE RELATED EARNINGS (PRE) | 2,553 | 2,435 | -5% | 1,807 | 3,741 | 107% |
| PRE Margin (%) | 70.0% | 37.8% | 72.9% | 44.2% | ||
| (-) Unrealized performance fees | 0 | 0 | N/A | 1,896 | 0 | N/A |
| (+) Unrealized performance compensation | 0 | 0 | N/A | (689) | 0 | N/A |
| SEGMENT DISTRIBUTABLE EARNINGS | 9,506 | 15,299 | 61% | 19,021 | 26,759 | 41% |
| Segment DE Margin (%) | 55.2% | 51.9% | 54.8% | 52.0% | ||
| AUM (R$ millions) | 14,300 | 14,124 | -1% | 14,300 | 14,124 | -1% |
| FEAUM (R$ millions) | 14,179 | 13,965 | -2% | 14,179 | 13,965 | -2% |
| AVERAGE MANAGEMENT FEE RATE (%) | 0.48% | 0.73% | 0.59% | 0.69% | ||
| FULL TIME EMPLOYEES | 17 | 24 | 41% | 17 | 24 | 41% |
Fee related earnings (FRE) of R$12.9 million in the 2Q'21, an increase of 85% year-over-year, driven by the end of revenue sharing agreement with GAS Investimentos and strong net inflows in our Hedge Funds strategy, which impacted positively our average management fee rate. FRE was R$23.0 million in the 2Q'21 YTD, up 44% when compared to the 2Q'20 YTD.
Performance related earnings (PRE) of R$2.4 million in the quarter, down 5% year-over-year, due to a higher compensation expense that followed a substantial benchmark outperform from our Total Return strategy in Hedge Funds. PRE was R$3.7 million in the 2Q'21 YTD, an increase of 107% when compared to the 2Q'20 YTD.
Segment Distributable Earnings of R$15.3 million in the quarter, up 61% year-over-year, due to a robust growth in management fees.
AUM remained stable on a year-over-year basis, with strong fundraising in Hedge Funds and market appreciation offsetting outflows in low fee-paying AUM across our Public Equities strategy, coming primarily from the GAS Dissociation in December 2020. As a result, our average management fee rate was positively impacted, going from 48 basis points in 2Q'20 to 73 basis points in 2Q'21.
| / IR.VINCIPARTNERS.COM | | / SHAREHOLDERRELATIONS@VINCIPARTNERS.COM | |
|
| |
Investment Products and Solutions
| (R$ thousands, unless mentioned) | 2Q'20 | 2Q'21 | ∆ (%) | 2Q'20 YTD | 2Q'21 YTD | ∆ (%) |
| Net revenue from management fees | 10,120 | 22,349 | 121% | 19,206 | 37,629 | 96% |
| Net revenue from advisory fees | 24 | 20 | -16% | 71 | 39 | -45% |
| Total Fee Related Revenues | 10,144 | 22,369 | 128% | 19,277 | 37,668 | 99% |
| Segment personnel expenses | (774) | (1,008) | 30% | (1,460) | (1,979) | 36% |
| Other G&A expenses | (360) | (344) | -4% | (779) | (809) | 4% |
| Corporate center expenses | (1,939) | (4,343) | 124% | (3,843) | (7,782) | 102% |
| Bonus compensation related to management and advisory | (2,512) | (3,927) | 56% | (4,695) | (7,595) | 62% |
| Total Fee Related Expenses | (5,585) | (9,622) | 72% | (10,778) | (18,166) | 69% |
| FEE RELATED EARNINGS (FRE) | 4,559 | 12,747 | 180% | 8,499 | 19,502 | 129% |
| FRE Margin (%) | 44.9% | 57.0% | 44.1% | 51.8% | ||
| Net revenue from performance fees | 1,991 | 10,382 | 421% | 2,299 | 17,863 | 677% |
| Realized performance fees | 1,991 | 2,394 | 20% | 2,356 | 9,875 | 319% |
| Unrealized performance fees | 0 | 7,988 | N/A | (57) | 7,988 | N/A |
| Performance based compensation | (703) | (3,233) | 360% | (816) | (5,660) | 594% |
| PERFORMANCE RELATED EARNINGS (PRE) | 1,288 | 7,149 | 455% | 1,483 | 12,203 | 723% |
| PRE Margin (%) | 64.7% | 68.9% | 64.5% | 68.3% | ||
| (-) Unrealized performance fees | 0 | (7,988) | N/A | 57 | (7,988) | N/A |
| (+) Unrealized performance compensation | 0 | 2,599 | N/A | (21) | 2,599 | N/A |
| SEGMENT DISTRIBUTABLE EARNINGS | 5,848 | 14,507 | 148% | 10,018 | 26,316 | 163% |
| Segment DE Margin (%) | 48.2% | 58.6% | 46.3% | 55.4% | ||
| AUM (R$ millions) | 11,887 | 21,966 | 85% | 11,887 | 21,966 | 85% |
| FEAUM (R$ millions) | 11,730 | 21,812 | 86% | 11,730 | 21,812 | 86% |
| AVERAGE MANAGEMENT FEE RATE (%) | 0.38% | 0.45% | 0.37% | 0.41% | ||
| FULL TIME EMPLOYEES | 9 | 14 | 56% | 9 | 14 | 56% |
Fee related earnings (FRE) of R$12.7 million in the 2Q’21, up 180% year-over-year, due to the growth in management fees following notable fundraising over the last twelve months. FRE was R$19.5 million in the 2Q'21 YTD, an increase of 129% when compared to the 2Q’20 YTD.
Performance related earnings (PRE) of R$7.1 million, up 455% year-over-year, driven by strong performance in our international separate mandates. In the 2Q’21 we had unrealized performance fees of R$7.9 million coming from international mandates, which will be realized in the 3Q'21. PRE in the 2Q'21 YTD was R$12.2 million, an increase of 723% when compared to the 2Q'20 YTD.
Segment Distributable Earnings in 2Q'21 of R$14.5 million in the quarter, up 148% year-over-year, due to growth in management and performance revenues. Segment DE was R$26.3 million in the 2Q'21 YTD, an increase of 163% when compared to the 2Q'20 YTD.
AUM of R$22.0 billion, up 85% year-over-year, driven primarily by strong net inflows in our separate local and international mandates. Fee Earning AUM of R$21.8 million, up 86% year-over-year.
| / IR.VINCIPARTNERS.COM | | / SHAREHOLDERRELATIONS@VINCIPARTNERS.COM | |
|
| |
Financial Advisory
| (R$ thousands, unless mentioned) | 2Q'20 | 2Q'21 | ∆ (%) | 2Q'20 YTD | 2Q'21 YTD | ∆ (%) |
| Net revenue from management fees | 0 | 0 | N/A | 0 | 0 | N/A |
| Net revenue from advisory fees | 6,364 | 3,717 | -42% | 21,564 | 18,258 | -15% |
| Total Fee Related Revenues | 6,364 | 3,717 | -42% | 21,564 | 18,258 | -15% |
| Segment personnel expenses | (225) | (411) | 82% | (415) | (806) | 94% |
| Other G&A expenses | (60) | (126) | 111% | (126) | (307) | 144% |
| Corporate center expenses | (632) | (965) | 53% | (1,330) | (1,939) | 46% |
| Bonus compensation related to management and advisory | (1,789) | (1,694) | -5% | (5,559) | (5,401) | -3% |
| Total Fee Related Expenses | (2,705) | (3,196) | 18% | (7,430) | (8,454) | 14% |
| FEE RELATED EARNINGS (FRE) | 3,659 | 521 | -86% | 14,134 | 9,804 | -31% |
| FRE Margin (%) | 57.5% | 14.0% | 65.5% | 53.7% | ||
| SEGMENT DISTRIBUTABLE EARNINGS | 3,659 | 521 | -86% | 14,134 | 9,804 | -31% |
| Segment DE Margin (%) | 57.5% | 14.0% | 65.5% | 53.7% | ||
| FULL TIME EMPLOYEES | 7 | 8 | 2% | 7 | 8 | 2% |
Fee related earnings (FRE) of R$0.5 million in the quarter, down 86% year-over-year. FRE was R$9.8 million in the 2Q'21 YTD, a decrease of 31% when compared to the 2Q'21 YTD.
We have visibility of approximately R$20 million in advisory revenues for the 3Q'21, a result of the strong deal activity we’re facing this year.
Segment Distributable Earnings in the 2Q'21 YTD were R$9.8 million, a decrease of 31% year-over-year when compared to the 2Q'21 YTD.
| / IR.VINCIPARTNERS.COM | | / SHAREHOLDERRELATIONS@VINCIPARTNERS.COM | |
|
| |
IFRS Income Statement (Unaudited)
| (R$ thousands, unless mentioned) | 2Q'20 | 2Q'21 | ∆ (%) | 2Q'20 YTD | 2Q'21 YTD | ∆ (%) |
| REVENUES | ||||||
| Net revenue from management fees | 60,826 | 94,778 | 56% | 123,724 | 176,621 | 43% |
| Net revenue from performance fees | 19,537 | 18,624 | -5% | 15,561 | 28,575 | 84% |
| Realized performance fees | 7,743 | 9,559 | 23% | 8,837 | 19,088 | 116% |
| Unrealized performance fees | 11,794 | 9,065 | -23% | 6,724 | 9,487 | 41% |
| Net revenue from advisory | 6,479 | 6,378 | -2% | 22,451 | 21,444 | -4% |
| Total net revenues from services rendered | 86,842 | 119,780 | 38% | 161,736 | 226,640 | 40% |
| EXPENSES | ||||||
| Bonus related to management and advisory | (13,607) | (17,082) | 26% | (28,597) | (35,608) | 25% |
| Performance based compensation | (6,712) | (7,817) | 16% | (5,270) | (11,109) | 111% |
| Realized | (2,428) | (4,837) | 99% | (2,828) | (7,979) | 182% |
| Unrealized | (4,284) | (2,980) | -30% | (2,442) | (3,130) | 28% |
| Total compensation and benefitsix | (20,319) | (24,899) | 23% | (33,867) | (46,717) | 38% |
| Segment personnel expenses | (3,600) | (5,528) | 54% | (6,840) | (10,625) | 55% |
| Other general and administrative expenses | (4,436) | (4,058) | -9% | (6,534) | (7,632) | 17% |
| Corporate center expenses | (12,632) | (19,296) | 53% | (26,606) | (38,808) | 46% |
| Total expenses | (40,987) | (53,781) | 31% | (73,847) | (103,783) | 41% |
| Operating profit | 45,855 | 65,999 | 44% | 87,889 | 122,857 | 40% |
| OTHER ITEMS | ||||||
| GP Investment income | 1,591 | (5,206) | N/A | 2,416 | (4,045) | N/A |
| Realized gain from GP investment income | 1 | 345 | 34400% | 39 | 457 | 1072% |
| Unrealized gain from GP investment income | 1,590 | (5,551) | N/A | 2,377 | (4,502) | N/A |
| Financial income | 1,386 | 14,152 | 921% | 1,450 | 18,649 | 1186% |
| Realized gain from financial income | 933 | 14,239 | 1426% | 1,969 | 18,883 | 859% |
| Unrealized gain from financial income | 453 | (87) | N/A | (519) | (234) | -55% |
| Leasing expenses | (3,047) | (3,106) | 2% | (6,112) | (6,263) | 2% |
| Other items | 207 | (2,120) | N/A | 603 | (1,234) | N/A |
| Stock compensation plan | 0 | (1,642) | N/A | 0 | (1,642) | N/A |
| Total Other Items | 137 | 2,078 | 1420% | (1,643) | 5,465 | N/A |
| Profit before income taxes | 45,992 | 68,077 | 48% | 86,246 | 128,322 | 49% |
| (-) Income taxes | (11,071) | (14,671) | 33% | (20,701) | (27,903) | 35% |
| NET INCOME | 34,921 | 53,406 | 53% | 65,545 | 100,419 | 53% |
| / IR.VINCIPARTNERS.COM | | / SHAREHOLDERRELATIONS@VINCIPARTNERS.COM | |
|
| |
Total net revenues from services rendered of R$119.8 million for the quarter ended June 30, 2021, compared to R$86.8 million for the quarter ended June 30, 2020, an increase of 38% year-over-year. Net revenues for the six months ended June 30, 2021 were R$226.6 million, up 40% year-over-year, when compared to the six months ended June 30, 2020.
| · | Management fee revenues of R$94.8 million for the quarter ended June 30,2021, compared to R$60.8 million for the quarter ended June 30, 2021, an increase of 56% year-over-year. This increase was primarily driven by the growth in Fee earning AUM. Management fee revenues for the six months ended June 30, 2021were R$176.6 million, up 43% year-over-year, when compared to the six months ended June 30, 2020. |
| · | Performance fee revenues of R$18.6 million for the quarter ended June 30, 2021, compared to R$19.5 million for the quarter ended June 30, 2020, a decrease of 5% year-over-year. Performance fee revenues were R$28.6 million for the six months ended June 30,2021, up 84% year-over-year, when compared to the six months ended June 30, 2020. In the second quarter of 2021 the firm had unrealized performance fees of R$9.1 million, coming primarily from international separate mandates in the IP&S segment, which will be realized in the 3Q'21. |
| · | Advisory fee revenues of R$6.4 million for the quarter ended June 30, 2021, compared to R$6.5 million for the quarter ended June 30, 2020, a decrease of 2% year-over-year. Advisory revenues for the six months ended June 30, 2021 were R$21.4 million, a decrease of 4% year-over-year, when compared to the six months ended June 30, 2020. |
Total expenses for the quarter ended June 30, 2021 of R$53.8 million, compared to R$41.0 million for the quarter ended June 30, 2020, an increase of 31% year-over-year. Part of this increase was driven by new recurring costs related to becoming a public company, such as changes in the company’s compensation structure, Board and support teams’ hirings and third-party services. Those factors accounted for R$3.2 million in additional expenses for the quarter. On a comparable basis, excluding costs related to being a public company, expenses were up 23% year-over-year. Additionally, 2Q'21 expenses were impacted by R$1.7 million related to a new branding project to take place throughout 2021, targeting retail investors.
| · | Bonus related to management and advisory fees of R$17.1 million for the quarter ended June 30,2021, compared to R$13.6 million for the quarter ended June 30,2020, an increase of 26% year-over-year. Bonus related to management and advisory was R$35.6 million for the six months ended June 30, 2021, up 25% year-over-year, when compared to the six months ended June 30, 2020. |
| · | Performance based compensation of R$7.8 million for the quarter ended June 30,2021, compared to R$6.7 million for the quarter ended June 30,2020, an increase of 16% year-over-year, primarily due to a substantial benchmark outperformance from our Total Return strategy in Hedge funds, which accounted for higher performance compensation. Performance based compensation for the six months ended June 30, 2021 was R$11.1 million, an increase of 111% year-over-year, when compared to the six months ended June 30, 2020. |
| · | Segment personnel expensesx of R$5.5 million for the quarter ended June 30,2021 compared to R$3.6 million for the quarter ended June 30,2020, an increase of 54% year-over-year. This increase is primarily due to the change in Vinci Partners´ compensation structure after becoming a public company in 2021, which accounted for R$0.9 million in additional segment personnel expenses for the quarter. |
| · | Corporate center expensesxi of R$19.3 million for the quarter ended June 30,2021 compared to R$12.6 million for the quarter ended June 30,2021, an increase of 53% year-over-year. This increase was primarily due to (i) the previously mentioned change in the company´s compensation structure, (ii) new hirings after the company became public such as our Board of directors and financial reporting and shareholder relations teams, and (iii) third-party expenses, such as Auditor and Nasdaq listing fees. These additional costs accounted for R$2.4 million in additional corporate center |
| / IR.VINCIPARTNERS.COM | | / SHAREHOLDERRELATIONS@VINCIPARTNERS.COM | |
|
| |
expenses for the quarter. Corporate center expenses for the quarter ended June 30, 2021 were also impacted by a R$1.7 million expense for a new branding project, that will take place throughout the year. Corporate center expenses for the six months ended June 30, 2021 were R$38.8 million, up 46% year-over-year, when compared to the six months ended June 30, 2020.
| · | Other general and administrative expensesxii of R$4.1 million for the quarter ended June 30,2021, compared to R$4.4 million for the quarter ended June 30,2020, a decrease of 9% year-over-year. Other G&A for the six months ended June 30, 2021 were R$7.6 million, up 17% year-over-year, when compared to the six months ended June 30, 2020. |
Operating Profit of R$65.6 million for the quarter ended June 30,2021, compared to R$45.9 million for the quarter ended June 30,2020, an increase of 44% year-over-year. Operating profit for the six months ended June 30, 2021 was R$122.9 million, up 40% year-over-year, when compared to the six months ended June 30, 2020.
GP Investment incomexiii, which is a result of the company’s GP investments in its proprietary private market funds, was negative R$5.2 million for the quarter ended June 30,2021, due to mark to market valuation of funds listed in the Brazilian stock exchange, compared to a positive R$1.6 million for the quarter ended June 30, 2020. GP Investment income for the six months ended June 30, 2021 was negative R$4.0 million compared to positive R$2.4 million for the six months ended June 30, 2020.
Financial Incomexiv of R$14.2 million for the quarter ended June 30,2021, compared to R$1.4 million for the quarter ended June 30, 2020, an increase of 1426% year-over-year, driven by the cash allocations of the company’s IPO proceeds. Financial income for the six months ended June 30, 2021 was R$18.6 million, up 1186% year-over-year, when compared to the six months ended June 30, 2020.
Leasing Expensesxv of R$3.1 million for the quarter ended June 30,2021, compared to R$3.0 million for the quarter ended June 30, 2020, an increase of 2% year-over-year. Leasing Expenses for the six months ended June 30, 2021 were R$6.3 million, up 2% year-over-year, when compared to the six months ended June 30, 2020.
Stock compensation plan expensesxvi of R$1.6 million for the quarter ended June 30,2021.
Profit before income taxes of R$68.1 million for the quarter ended June 30, 2021, compared to R$46.0 million for the quarter ended June 30, 2020, an increase of 48% year-over-year. Profit before income taxes for the six months ended June 30, 2021 were R$128.3 million, up 49% year-over-year, when compared to the six months ended June 30, 2020.
Income Taxesxvii of R$14.7 million for the quarter ended June 30, 2021, which represented an effective tax rate for the quarter of 22%, compared to R$11.1 million for the quarter ended June 30, 2020, which represented an effective tax rate for the quarter of 19%.
Net Income of R$53.4 million for the quarter ended June 30, 2021, compared to R$34.9 million for the quarter ended June 30, 2020, an increase of 53% year-over-year. Net Income was R$100.4 million for the six months ended June 30, 2021, up 53% year-over-year, when compared to the six months ended June 30, 2020.
| / IR.VINCIPARTNERS.COM | | / SHAREHOLDERRELATIONS@VINCIPARTNERS.COM | |
|
| |
Supplement Details
Assets Under Management (AUM) Rollforward – R$ millions
| For the Three Months Ended June 30, 2021 | ||||||||
| Private | Public | IP&S | Infrastructure | Real | Credit | Hedge | Total | |
| Equity | Equities | Estate | Funds | |||||
| Beginning balance | 11,442 | 10,016 | 20,449 | 2,455 | 5,125 | 2,330 | 2,946 | 54,763 |
| (+/-) Capital Subscription / (capital return)xviii | – | – | – | – | 251 | 14 | – | 265 |
| (+/-) Net Inflow / (outflow)xix | – | (87) | 1,268 | – | – | 68 | 275 | 1,525 |
| (+/-) Appreciation / (depreciation)xx | (591) | 932 | 248 | (92) | (289) | 49 | 41 | 299 |
| Ending Balance | 10,851 | 10,861 | 21,966 | 2,363 | 5,087 | 2,461 | 3,263 | 56,852 |
| For the Twelve Months Ended June 30, 2021 | ||||||||
| Private | Public | IP&S | Infrastructure | Real | Credit | Hedge | Total | |
| Equity | Equities | Estate | Funds | |||||
| Beginning balance | 9,847 | 12,526 | 11,887 | 1,620 | 3,656 | 2,204 | 1,774 | 43,514 |
| (+/-) Capital Subscription / (capital return) | 855 | – | – | 634 | 1,555 | 130 | – | 3,174 |
| (+/-) Net Inflow / (outflow) | – | (4,956) | 7,923 | – | 4 | 25 | 1,342 | 4,337 |
| (+/-) Appreciation / (depreciation) | 150 | 3,292 | 2,157 | 108 | (128) | 101 | 146 | 5,827 |
| Ending Balance | 10,851 | 10,861 | 21,966 | 2,363 | 5,087 | 2,461 | 3,263 | 56,852 |
| / IR.VINCIPARTNERS.COM | | / SHAREHOLDERRELATIONS@VINCIPARTNERS.COM | |
|
| |
Fee Earning Assets Under Management (FEAUM) Rollforward – R$ millions
| For the Three Months Ended June 30, 2021 |
| Private | Public | IP&S | Infrastructure | Real | Credit | Hedge | Total | |
| Equity | Equities | Estate | Funds | |||||
| Beginning balance | 9,530 | 9,955 | 20,299 | 2,351 | 5,125 | 2,330 | 2,884 | 52,474 |
| (+/-) Capital Subscription / (capital return) | – | – | – | – | 251 | 15 | – | 265 |
| (+/-) Net Inflow / (outflow) | – | (86) | 1,271 | – | – | 68 | 275 | 1,528 |
| (+/-) Appreciation / (depreciation) | (464) | 895 | 242 | (92) | (289) | 49 | 41 | 383 |
| Ending Balance | 9,066 | 10,765 | 21,812 | 2,259 | 5,087 | 2,461 | 3,200 | 54,650 |
| For the Twelve Months Ended June 30, 2021 |
| Private | Public | IP&S | Infrastructure | Real | Credit | Hedge | Total | |
| Equity | Equities | Estate | Funds | |||||
| Beginning balance | 7,874 | 12,466 | 11,730 | 1,536 | 3,656 | 2,204 | 1,713 | 41,180 |
| (+/-) Capital Subscription / (capital return) | 855 | – | – | 634 | 1,555 | 130 | – | 3,174 |
| (+/-) Net Inflow / (outflow) | – | (4,951) | 7,936 | – | 3 | 25 | 1,342 | 4,355 |
| (+/-) Appreciation / (depreciation) | 338 | 3,250 | 2,146 | 88 | (128) | 101 | 145 | 5,941 |
| Ending Balance | 9,066 | 10,765 | 21,812 | 2,259 | 5,087 | 2,461 | 3,200 | 54,650 |
| / IR.VINCIPARTNERS.COM | | / SHAREHOLDERRELATIONS@VINCIPARTNERS.COM | |
|
| |
Investment Records – IP&S, Liquid Strategies, Credit and Listed REITs
| Fund | Segment | NAVxxi (R$ millions) | 2Q21 | YTD | 12 M | 24 M | Market Comparison | Index Rate |
| Vinci Multiestratégia FIM | Hedge Funds | 1,209.7 | 0.5% | 0.4% | 1.3% | 7.1% | CDIxxii | CDI |
| Atlas Strategyxxiii | Hedge Funds | 703.4 | 1.6% | 0.2% | 0.5% | 15.5% | CDI | CDI |
| Vinci Total Return | Hedge Funds | 156.4 | 17.1% | 24.9% | 48.8% | - | IPCAxxiv + Yield IMA-Bxxv | IPCA + Yield IMA-B |
| Mosaico Strategyxxvi | Public Equities | 1,824.7 | 7.7% | 5.2% | 28.6% | 36.9% | IBOVxxvii | IBOV |
| Vinci Gas Dividendos FIA | Public Equities | 731.2 | 7.0% | 2.8% | 27.3% | 26.4% | IBOV | IBOV |
| Vinci Valorem FIM | IP&S | 3,066.5 | 1.0% | 1.4% | 5.2% | 13.7% | IMA-B 5 | IMA-B 5 |
| Equilibrio Strategyxxviii | IP&S | 1,901.2 | 1.6% | 1.9% | 6.4% | 11.5% | IPCA | - |
| Vinci Selection Equities FIA | IP&S | 634.3 | 9.3% | 6.6% | 27.9% | 36.3% | IBOV | IBOV |
| Vinci Crédito Imobiliário I | Credit | 314.4 | -0.4% | 0.9% | 6.8% | 14.2% | IPCA | IPCA +7.785% |
| Vinci Crédito Imobiliário II | Credit | 382.7 | 1.6% | -0.7% | 6.7% | - | IPCA | IPCA + 6% |
| Vinci Crédito Estruturado Multiestrategia Plus FIC FIM | Credit | 55.5 | 1.9% | 2.8% | 4.9% | 11.1% | CDI | CDI |
| Vinci Energia Sustentável | Credit | 592.7 | 3.3% | 0.9% | 9.6% | 18.2% | IPCA | IPCA + 6% |
| VISC11 | Real Estate (listed REIT) | 1,521.0 | -2.3% | -5.5% | 7.3% | 13.9% | IFIX | IPCA + 6% |
| VILG11 | Real Estate (listed REIT) | 1,626.3 | -6.4% | -10.7% | -4.3% | 30.2% | IFIX | IPCA + 6% |
| VINO11 | Real Estate (listed REIT) | 748.1 | -1.6% | -1.8% | 10.7% | - | IFIX | IPCA + 6% |
| VIFI11 | Real Estate (listed REIT) | 235.7 | -2.2% | -8.0% | -8.5% | - | IFIX | IFIX |
| VIUR11 | Real Estate (listed REIT) | 243.7 | -8.9% | -8.9% | - | - | IFIX | IPCA + 6% |
| VIGT11 | Infrastructure (listed) | 695.8 | -3.8% | -14.3% | -19.5% | - | - | - |
| Benchmark | 2Q21 | YTD | 12 M | 24 M | ||
| IBOV | 8.7% | 6.5% | 33.4% | 25.6% | ||
| CDI | 0.8% | 1.3% | 2.3% | 7.0% | ||
| IMA-B 5 | 1.4% | 1.3% | 6.1% | 15.4% | ||
| IPCA + Yield IMA-B | 2.7% | 5.6% | 10.9% | 16.4% | ||
| IPCA | 1.7% | 3.8% | 8.3% | 10.7% | ||
| IFIX | -3.2% | -4.0% | -1.8% | 4.9% |
| / IR.VINCIPARTNERS.COM | | / SHAREHOLDERRELATIONS@VINCIPARTNERS.COM | |
|
| |
Investment Records – Closed End Private Markets fundsxxix
| Fund | Segment | Vintage Year | Committed
(R$ mm)
| Invested
(R$ mm)
| Realized/ Partially Realized (R$ mm) | Unrealized
(R$ mm)
| Total
(R$mm)
| Gross MOICxxx
(BRL)
| Gross MOIC
(USD)
| Gross IRRxxxi
(BRL)
| Gross IRR
(USD)
|
| Fund 1 | Private Equity | 2,004 | 1,415 | 1,206 | 5,058 | 276 | 5,334 | 4.4x | 4.0x | 71.5% | 77.2% |
| VCP II | Private Equity | 2,011 | 2,200 | 1,805 | 1,913 | 2,859 | 4,772 | 2.6x | 1.2x | 15.6% | 3.0% |
| VCP III | Private Equity | 2,018 | 4,000 | 1,080 | 13 | 1,664 | 1,677 | 1.6x | 1.3x | 50.6% | 25.7% |
| VCP Strategy[xxxiii] | Private Equity | 7,615 | 4,091 | 6,984 | 4,799 | 11,783 | 2.9x | 2.3x | 64.9% | 70.3% | |
| NE Empreendedor | Private Equity | 2003 | 36 | 13 | 26 | 0 | 26 | 2.1x | 2.6x | 22.0% | 30.5% |
| Nordeste III | Private Equity | 2017 | 240 | 127 | 57.3 | 130.3 | 187.6 | 1.5x | 1.1x | 22.8% | 7.0% |
| VIR IV | Private Equity | 2020 | 1,000 | 96 | 0 | 42.9 | 42.9 | 1.0x | 1.0x | NM | NM |
| VIR Strategy | Private Equity | 1,276 | 236 | 83 | 173 | 257 | 1.4x | 1.3x | 22.0% | 28.0% | |
| FIP Transmissão | Infrastructure | 2017 | 211 | 103.8 | 111.5 | 255.5 | 367 | 3.5x | 2.6x | 82.8% | 58.4% |
| VIAS | Infrastructure | - | 381 | - | - | - | - | - | - | - | - |
| VFDL | Real Estate | 2021 | 256 | - | - | - | - | - | - | - | - |
Shareholder Dividends
| ($ in thousands) | 1H21 |
| Distributable Earnings (R$) | 101,976 |
| Distributable Earnings (US$)xxxiii | 19,397 |
| Common Shares at the end of the period | 56,736,933 |
| DE per Common Share (US$) | 0.34 |
| Less: Retained Capital per Common Share (US$) | 0.04 |
| Actual Dividend per Common Share | 0.30 |
| Record Date | September 01, 2021 |
| Payable Date | September 16, 2021 |
Generated R$1.80 or US$0.34 of Distributable Earnings per common share for the first half of 2021.
Vinci Partners declared a semi-annual dividend of US$0.30 per common share to record holders as of September 01, 2021; payable on September 16, 2021
| / IR.VINCIPARTNERS.COM | | / SHAREHOLDERRELATIONS@VINCIPARTNERS.COM | |
|
| |
Share Summary
| VINP Shares | 4Q'20 (Pre IPO) | 1Q'21 | 2Q'21 |
| Class B | 14,466,239 | 14,466,239 | 14,466,239 |
| Class A – Partnership Units | 27,175,861 | 27,175,861 | 27,175,861 |
| Class A - Public Float | n.a | 15,271,488 | 15,094,833 |
| Common Shares | 41,642,100 | 56,913,588 | 56,736,933 |
Common Shares Outstanding as of quarter end of 56.7 million shares.
| · | Repurchased 176,655 common shares in the quarter, with an average share price of US$14.7. |
| · | Available authorization remaining was R$71.8 million at June 30,2021. |
GP Commitment in Private Market funds
(R$ millions, unless mentioned) Fund
| Segment | 2Q'21 Commitments | Total Capital Committed
| 2Q’21 Capital Called
| Total Capital Called
| Capital Returned/ Dividends Payed (2Q'21)
| Accumulated Capital Returned/ Dividends Payed
| Fair value of investments | |||||
| Nordeste III | Private Equity | 0.0 | 5.0 | 0.0 | 3.1 | 0.1 | 1.2 | 2.7 | |||||
| VCP III | Private Equity | 0.0 | 3.1 | 0.2 | 0.9 | 0.0 | 0.0 | 1.1 | |||||
| VIR IV | Private Equity | 0.0 | 11.1 | 0.3 | 1.3 | 0.0 | 0.0 | 1.2 | |||||
FIP Infra Transmissão (co- investment) | Infrastructure | 0.0 | 29.5 | 0.0 | 8.9 | 0.0 | 9.2 | 22.7 | |||||
FIP Infra Transmissão | Infrastructure | 0.0 | 10.5 | 0.0 | 3.4 | 0.0 | 3.3 | 6.5 | |||||
| VIAS | Infrastructure | 0.0 | 50.0 | 0.0 | 0.0 | 0.0 | 0.0 | 0.0 | |||||
| VFDL | Real Estate | 0.0 | 70.0 | 0.0 | 7.0 | 0.0 | 0.0 | 6.6 | |||||
| VIUR | Real Estate | 66.9 | 66.9 | 66.9 | 66.9 | 0.4 | 0.4 | 60.3 | |||||
| VCS | Credit | 20.0 | 20.0 | 20.0 | 20.0 | 0.0 | 0.0 | 20.1 | |||||
| Total | 86.9 | 266.1 | 87.4 | 111.1 | 0.5 | 14.1 | 121.2 |
| / IR.VINCIPARTNERS.COM | | / SHAREHOLDERRELATIONS@VINCIPARTNERS.COM | |
|
| |
Reconciliation and Disclosures
Non-GAAP Reconciliation
| (R$ thousands, unless mentioned) | 2Q'20 | 2Q'21 | 2Q´20 YTD | 2Q´21 YTD |
| OPERATING PROFIT | 45,855 | 65,999 | 87,889 | 122,857 |
| (-) Net revenue from realized performance fees | (7,743) | (9,559) | (8,837) | (19,088) |
| (-) Net revenue from unrealized performance fees | (11,794) | (9,065) | (6,724) | (9,487) |
| (+) Compensation allocated in relation to performance fees¹ | 6,712 | 7,817 | 5,270 | 11,109 |
| FEE RELATED EARNINGS (FRE) | 33,030 | 55,192 | 77,598 | 105,391 |
| OPERATING PROFIT | 45,855 | 65,999 | 87,889 | 122,857 |
| (-) Net revenue from management fees | (60,826) | (94,778) | (123,724) | (176,621) |
| (-) Net revenue from advisory | (6,479) | (6,378) | (22,451) | (21,444) |
| (+) Bonus related to management and advisory² | 13,607 | 17,082 | 28,597 | 35,608 |
| (+) Personnel expenses | 3,600 | 5,528 | 6,840 | 10,625 |
| (+) Other general and administrative expenses | 4,436 | 4,058 | 6,534 | 7,632 |
| (+) Corporate center expenses | 12,632 | 19,296 | 26,606 | 38,808 |
| PERFORMANCE RELATED EARNINGS (PRE) | 12,825 | 10,807 | 10,291 | 17,466 |
| OPERATING PROFIT | 45,855 | 65,999 | 87,889 | 122,857 |
| (-) Net revenue from unrealized performance fees | (11,794) | (9,065) | (6,724) | (9,487) |
| (+) Compensation allocated in relation to unrealized performance fees | 4,284 | 2,980 | 2,442 | 3,130 |
| (+) Realized gain from GP investment income | 1 | 345 | 39 | 457 |
| SEGMENT DISTRIBUTABLE EARNINGS | 38,346 | 60,259 | 83,646 | 116,958 |
| NET INCOME | 34,921 | 53,406 | 65,545 | 100,419 |
| (-) Net revenue from unrealized performance fees | (11,794) | (9,065) | (6,724) | (9,487) |
| (+) Income tax from unrealized performance fees | 1,360 | 124 | 775 | 173 |
| (+) Compensation allocated in relation to unrealized performance fees | 4,284 | 2,980 | 2,442 | 3,130 |
| (-) Unrealized gain from GP investment income | (1,590) | 5,551 | (2,377) | 4,502 |
| (+) Income tax on unrealized gain from GP investment income | 541 | (838) | 808 | (422) |
| (-) Unrealized gain from financial income | (453) | 87 | 519 | 234 |
| (+) Income tax on unrealized gain from financial income | 154 | (32) | (176) | (80) |
| (+) Depreciation and amortization³ | 0 | 926 | 0 | 1,865 |
| (+) Stock compensation plan | 0 | 1,642 | 0 | 1,642 |
| DISTRIBUTABLE EARNINGS | 27,422 | 54,781 | 60,812 | 101,976 |
| TOTAL NET REVENUE FROM SERVICES RENDERED | 86,842 | 119,780 | 161,736 | 226,640 |
| (-) Net revenue from realized performance fees | (7,743) | (9,559) | (8,837) | (19,088) |
| (-) Net revenue from unrealized performance fees | (11,794) | (9,065) | (6,724) | (9,487) |
| NET REVENUE FROM MANAGEMENT FEES AND ADVISORY | 67,305 | 101,156 | 146,175 | 198,065 |
| / IR.VINCIPARTNERS.COM | | / SHAREHOLDERRELATIONS@VINCIPARTNERS.COM | |
|
| |
Effective Tax Rate Reconciliation
| (R$ thousands, unless mentioned) | 2Q'20 | 2Q'21 |
| Profit (loss) before income taxes, including Dividends to partners | 45,992 | 68,077 |
| (+) Dividends to Partners, related to management, advisory and performance fees | 11,463 | - |
| Profit (loss) before income taxes, not-including Dividends to partners | 57,455 | 68,077 |
| Combined statutory income taxes rate - % | 34% | 34% |
| Income tax benefit (Expense) at statutory rates | (19,535) | (23,146) |
| Reconciliation adjustments: | ||
| Expenses not deductible | (156) | (4) |
| Tax benefits | - | 33 |
| Share based payments | - | (166) |
| Effect of presumed profit of subsidiariesxxxiv | 8,322 | 8,739 |
| Other additions (exclusions), net | 298 | (127) |
| Income taxes expenses | (11,071) | (14,671) |
| Current | (9,381) | (16,704) |
| Deferred | (1,690) | 2,033 |
| Effective tax rate | 19% | 22% |
| / IR.VINCIPARTNERS.COM | | / SHAREHOLDERRELATIONS@VINCIPARTNERS.COM | |
|
| |
Balance Sheet Results
| Assets | 12/31/2020 | 6/30/2021 |
| Current assets | ||
| Cash and cash equivalents | 83,449 | 79,969 |
| Cash and bank deposits | 13,096 | 23,514 |
| Financial instruments at fair value through profit or loss | 70,353 | 56,455 |
| Financial instruments at fair value through profit or loss | 8,253 | 1,382,288 |
| Trade receivables | 47,978 | 58,551 |
| Sub-leases receivable | 2,963 | 1,579 |
| Taxes recoverable | 1,153 | 409 |
| Other assets | 12,383 | 8,988 |
| Total current assets | 156,179 | 1,531,784 |
| Non-current assets | ||
| Financial instruments at fair value through profit or loss | 31,596 | 10,330 |
| Trade receivables | 27,545 | 29,134 |
| Sub-leases receivable | - | - |
| Taxes recoverable | 134 | 79 |
| Deferred taxes | 4,568 | 3,986 |
| Other receivables | 1,540 | 1,316 |
| 65,383 | 44,845 | |
| Property and equipment | 15,043 | 15,545 |
| Right of use - Leases | 90,478 | 86,805 |
| Intangible assets | 1,441 | 1,161 |
| Total non-current assets | 172,345 | 148,356 |
| TOTAL | 328,524 | 1,680,140 |
| / IR.VINCIPARTNERS.COM | | / SHAREHOLDERRELATIONS@VINCIPARTNERS.COM | |
|
| |
| Liabilities and equity | 12/31/2020 | 6/30/2021 |
| Current liabilities | ||
| Trade payables | 1,039 | 346 |
| Leases | 19,828 | 20,467 |
| Accounts payable | 125,795 | 12,848 |
| Labor and social security obligations | 40,724 | 53,410 |
| Taxes and contributions payable | 22,878 | 19,988 |
| Total current liabilities | 210,264 | 107,059 |
| Non-current liabilities | ||
| Accounts payable | 33 | 33 |
| Leases | 86,371 | 82,484 |
| Deferred taxes | 12,620 | 9,196 |
| 99,024 | 91,713 | |
| Equity | ||
| Share capital | 8,730 | 15 |
| Additional paid-in capital | - | 1,383,033 |
| Treasury shares | - | (13,151) |
| Retained Earnings | - | 100,419 |
| Other reserves | 10,491 | 11,013 |
| 19,221 | 1,481,329 | |
| Non-controlling interests in the equity of subsidiaries | 15 | 39 |
| Total equity | 19,236 | 1,481,368 |
| Total liabilities and equity | 328,524 | 1,680,140 |
| / IR.VINCIPARTNERS.COM | | / SHAREHOLDERRELATIONS@VINCIPARTNERS.COM | |
|
| |
Forward-Looking Statements
This earnings release contains forward-looking statements that can be identified by the use of words such as “anticipate,” “believe,” “could,” “expect,” “should,” “plan,” “intend,” “estimate” and “potential,” among others. By their nature, forward-looking statements are necessarily subject to a high degree of uncertainty and involve known and unknown risks, uncertainties, assumptions and other factors because they relate to events and depend on circumstances that will occur in the future whether or not outside of our control. Such factors may cause actual results, performance or developments to differ materially from those expressed or implied by such forward-looking statements and there can be no assurance that such forward-looking statements will prove to be correct. The forward-looking statements included herein speak only as at the date of this press release and we do not undertake any obligation to update these forward-looking statements. Past performance does not guarantee or predict future performance. Moreover, neither we nor our affiliates, officers, employees and agents undertake any obligation to review, update or confirm expectations or estimates or to release any revisions to any forward-looking statements to reflect events that occur or circumstances that arise in relation to the content of this press release. Further information on these and other factors that could affect our financial results is included in filings we have made and will make with the U.S. Securities and Exchange Commission from time to time.
| / IR.VINCIPARTNERS.COM | | / SHAREHOLDERRELATIONS@VINCIPARTNERS.COM | |
|
| |
i Distributable Earnings is used as a reference point by our board of directors for determining the amount of earnings available to distribute to shareholders as dividends. Distributable Earnings is calculated as profit for the year, less (a) net revenue from unrealized performance fees, plus (b) income taxes from unrealized performance fees, plus (c) compensation allocated in relation to unrealized performance fees, less (d) unrealized gain from GP investment income, less (e) unrealized gain from financial income, plus (f) income taxes on unrealized gain from GP investment income, plus (g) income taxes on unrealized gain from financial income.
ii Fee related earnings, or FRE, is a metric to monitor the baseline performance of, and trends in, our business, in a manner that does not include performance fees or investment income. We calculate FRE as operating profit less (a) net revenue from realized performance fees, less (b) net revenue from unrealized performance fees, plus (c) compensation allocated in relation to performance fees.
iii “AUM” refers to assets under management. Our assets under management equal the sum of: (1) the fair market value of the investments held by funds plus the capital that we are entitled to call from investors in those funds pursuant to the terms of their capital commitments to those funds (plus the fair market value of co-investments arranged by us that were made or could be made by limited partners of our corporate private equity funds and portfolio companies of such funds); (2) the net asset value of our public equity funds, hedge funds and closed-end mutual funds; and (3) the amount of capital raised for our credit funds. AUM includes double counting related to funds from one segment that invest in funds from another segment. Those cases occur mainly due to (a) fund of funds of investment products and solutions segment, and (b) investment funds in general that invest part of their cash in credit segment and hedge fund segment funds in order to maintain liquidity and provide for returns on cash. Such amounts are eliminated on consolidation. The bylaws of the relevant funds prohibit double-charging fees on AUM across segments. Therefore, while our AUM by segment may double-count funds from one segment that invest in funds from another segment, the revenues for any given segment do not include revenue in respect of assets managed by another segment, which means there are no intercompany eliminations on revenues in our results of operations.
iv Net revenue from Fund Management and Advisory is a performance measure that we use to assess our ability to generate profits from our fund management and advisory business without measuring for the outcomes from funds above their respective benchmarks. We calculate Net Revenue from Fund Management and Advisory as net revenue from services rendered less (a) net revenue from realized performance fees and less (b) net revenue from unrealized performance fees.
v FRE Margin is calculated as FRE over total net management and advisory fees.
vi Performance Related Earnings, or PRE, is a performance measure that we use to assess our ability to generate profits from revenue that relies on outcome from funds above their respective benchmarks. We calculate PRE as operating profit, less (a) net revenue from fund management, less (b) compensation allocated in relation to performance fees.
vii Segment Distributable Earnings is Vinci Partners’ segment profitability measure used to make operating decisions and assess performance across the company’s four segments (Private Markets, Liquid Strategies, Investment Products and Solutions and Financial Advisory). Segment Distributable Earnings is calculated as operating profit less (a) net revenue from unrealized performance fees, plus (b) compensation allocated in relation to unrealized performance fees, plus (c) realized gain from GP investment income.
viii DE Margin is calculated as DE over the sum of management and advisory fee related revenues, realized performance revenue, realized GP investment income and realized financial income, net of revenue tax.
ix “Total compensation and benefits” is the result of the profit sharing paid to our employees as (a) bonus compensation related to management advisory and (b) performance based compensation. Total compensation and benefits include Dividends to Partners, distributed by the company to its original partners before the public turned public in 2021. In accordance with the by-laws of Vinci Brazil, dividends have historically been distributed based on the resolution of the partners. Therefore, dividends could be distributed on a non-proportional basis among quotaholders, which are comprised by the partners of Vinci Brazil. After the company’s IPO, Vinci Partners changed its compensation structure, from a dividend distribution policy to a profit-sharing scheme for our partners.
| / IR.VINCIPARTNERS.COM | | / SHAREHOLDERRELATIONS@VINCIPARTNERS.COM | |
|
| |
x “Segment personnel expenses” are composed of the salary-part compensation paid to employees and partners of our funds’ management teams.
xi “Corporate center expenses” are composed by the salary-compensation paid to employees and partners of our support teams and other expenses, such as research, risk, legal & compliance, investor relations, operations and ESG.
xii “Other general and administrative expenses” is made up of third-party expenses, depreciation and amortization, travel and representation, marketing expenses, administrative fees, non-operating taxes, third-party consultants’ fees, such as legal and accounting, and office consumables.
xiii “GP investment income” is income from proprietary investments made by us in our own Private Markets’ funds, used as GP Commitments.
xiv “Financial income” is income generated through the investments made with our cash and cash equivalents in cash and bank deposits, certificate of deposits and proprietary investments in our Liquid Funds from our public equities and hedge funds’ segments and listed REITs from our real estate segment.
xv “Leasing expenses” include costs from the company’s sub-leasing activities.
xvi “Stock option compensation plan” is a benefit program in which the company concedes to an employee the option to buy stock in the company with stated fixed price.
xvii Income taxes is comprised of taxes on our corporate income tax and social contribution taxes. We are taxed on an actual taxable profit regime, while our subsidiaries are taxed based on deemed profit. Dividends to partners distributed by the company to its original partners before turned public in 2021 are not included in actual taxable regime.
xviii “Capital Subscription / (capital return)” represents the net capital commitments and capital returns from our Private Markets’ closed end and listed funds.
xix “Net Inflows / (outflows)” represent the net inflows and outflows from our liquid funds from our liquid strategies, IP&S and credit segments.
xx “Appreciation / (depreciation)” represents the net capital appreciation/depreciation from our funds, which refers to the increase or decrease of the funds’ investment’s value.
xxi NAV is the net asset value of each fund. For listed vehicles, the NAV represents the Market valuation of the fund.
xxii CDI is an average of interbank overnight rates in Brazil (daily average for the period).
xxiii Atlas strategy comprises Atlas FIC FIM and Atlas Institucional FIC FIM.
xxiv IPCA is a broad consumer price index measured by the IBGE.
xxv IMAB is composed by government bonds indexed to IPCA. IMAB 5 also comprises government bonds indexed to IPCA but only the one´s with up to 5 Years duration.
xxvi Mosaico strategy comprises Vinci Mosaico FIA, Vinci Mosaico Institucional FIA and Vinci Mosaico Advisory FIA.
xxvii IBOV is the Brazilian stock market most relevant index.
xxviii Equilibrio Strategy comprises IP&S Family of pension plans.
| / IR.VINCIPARTNERS.COM | | / SHAREHOLDERRELATIONS@VINCIPARTNERS.COM | |
|
| |
xxix Track record information is presented throughout this release on a pro forma basis and in local currency, excluding PIPE investments, a strategy that will be discontinued in VCP III. Past performance of investments described herein is provided for illustrative purposes only and is not necessarily indicative of future investment results.
xxx “MOIC” means multiple on invested capital, a ratio intended to represent how much value an investment has returned, and is calculated as realized value plus unrealized value, divided by the total amount invested, gross of expenses and fees.
xxxi “IRR” means the internal rate of return, which is a discount rate that makes the net present value of all cash flows equal to zero in a discounted cash flow analysis.
xxxii Total commitments for VCP III include R$1.3 billion in co-investments.
xxxiii US$ Distributable Earnings was calculated considering the exchange rate from USD to BRL of 5.2574 as of August 13, 2021, when dividends were approved by our Board of Directors.
xxxiv Brazilian tax law establishes that companies that generate gross revenues of up to R$ 78,000 in the prior fiscal year may calculate income taxes as a percentage of gross revenue, using the presumed profit income tax regime. The Entity's subsidiaries adopted this tax regime and the effect of the presumed profit of subsidiaries represents the difference between the taxation based on this method and the amount that would be due based on the statutory rate applied to the taxable profit of the subsidiaries.
| / IR.VINCIPARTNERS.COM | | / SHAREHOLDERRELATIONS@VINCIPARTNERS.COM | |