
Second Quarter 2021 Earnings Presentation August 18, 2021 1 Exhibit 99.2

Disclaimer 2 This presentation contains forward - looking statements that can be identified by the use of words such as “anticipate,” “believe, ” “could,” “expect,” “should,” “plan,” “intend,” “estimate” and “potential,” among others. By their nature, forward - looking statements are necessarily subject to a high degree of uncertain ty and involve known and unknown risks, uncertainties, assumptions and other factors because they relate to events and depend on circumstances that will occur in the future whether or not outside of our control. Such factors may cause actual results, performance or developments to differ materially from those expressed or implied by such forward - looking statements and there can be no assurance that such forward - looking statements will prove to be correct. Accordingly, you should not place undue reliance on forward - looking statements. The forward - looking statements included herein speak only as at the date of this presentation and we do not undertake any obligation to update these forward - looking statements. Past performance do es not guarantee or predict future performance. Moreover, neither we nor our affiliates, officers, employees and agents undertake any obligation to review, update or confirm ex pectations or estimates or to release any revisions to any forward - looking statements to reflect events that occur or circumstances that arise in relation to the content of the presentati on. Further information on these and other factors that could affect our financial results is included in filings we have made and will make with the U.S. Securities and Exchange Commissi on (the “SEC”) from time to time, including in the section titled “Risk Factors” in our most recent form F - 1 and 424(b) prospectus and form 20 - F. These documents are available on the SEC Filings section of the investor relations section of our website at: https://ir.vincipartners.com/financials/sec - filings. We have prepared this presentation solely for informational purposes. The information in this presentation does not constitut e o r form part of, and should not be construed as, an offer or invitation to subscribe for, underwrite or otherwise acquire, any of our securities or securities of our subsidiaries or affi lia tes, not should it or any part of it form the basis of, or be relied on, in connection with any contract to purchase or subscribe for any of our securities or securities of any of our subsidiaries o r a ffiliates, nor shall it or any part of it form the basis of, or be relied on, in connection w ith any contract or commitment whatsoever. This presentation also includes certain non - GAAP financial information. We believe that such information is meaningful and usefu l in understanding the activities and business metrics of our operations. We also believe that these non - GAAP financial measures reflect an additional way of viewing aspects of our busin ess that, when viewed with our International Financial Reporting Standards (“IFRS”) results, as issued by the International Accounting Standards Board, provide a more complete unde rst anding of factors and trends affecting our business. Further, investors regularly rely on non - GAAP financial measures to assess operating performance and such measures may highlight trends in our business that may not otherwise be apparent when relying on financial measures calculated in accordance with IFRS. We also believe that certain non - GAAP financial measures are frequently used by securities analysts, investors and other interested parties in the evaluation of public companies in our industry, many of which present these mea sur es when reporting their results. The non - GAAP financial information is presented for informational purposes and to enhance understanding of the IFRS financial statements. The non - GAAP measures should be considered in addition to results prepared in accordance with IFRS, but not as a substitute for, or superior to, IFRS results. As other companies may determine or calculate this non - GAAP financial information differently, the usefulness of these measures for comparative purposes is limited. A reconciliation of such non - GAAP financial measures to th e nearest GAAP measure is included in this presentation.

Presenters 3 Alessandro Horta Chief Executive Officer Bruno Zaremba Head of Private Equity & Investor Relations Sergio Passos Chief Operating Officer & Chief Financial Officer

Opening Remarks 4

2 6 11 15 17 18 20 19 21 24 35 48 52 50 57 2009 2010 2011 2012 2013 2014 2015 2016 2017 2018 2019 2020 2Q'21 AUM (R$bn) AUM DC¹ (R$bn) We continue to deliver strong results across the board backed by management fees. AUM reached R$57bn in 2Q ' 21, a 31% increase year - over - year , and continues to expand at an accelerated pace, with a 36% CAGR since 2018² . R$57bn AUM Vinci Partners delivered strong results, continuous growth in AUM and profitability in 2Q'21 5 CAGR: 32% CAGR: 36 % 33% CAGR 2009 - 2Q ' 2021² We are focused on generating value for our shareholders. R$102.0mm Total capital returned to shareholders 100% DE 2Q’21 YTD Our business is profitable and growing , with strong operating leverage . FRE Margin 54.6% 2Q ' 21 DE Margin 43.7% 2Q ' 21 +67% YoY +100% YoY FRE R$55.2mm 2Q ' 21 DE R$54.8mm 2Q ' 21 Semi - annual Dividend US$0.30 per share See notes and definitions at end of document Which translates into substantial amounts of free cash flow.

Financial Highlights 6
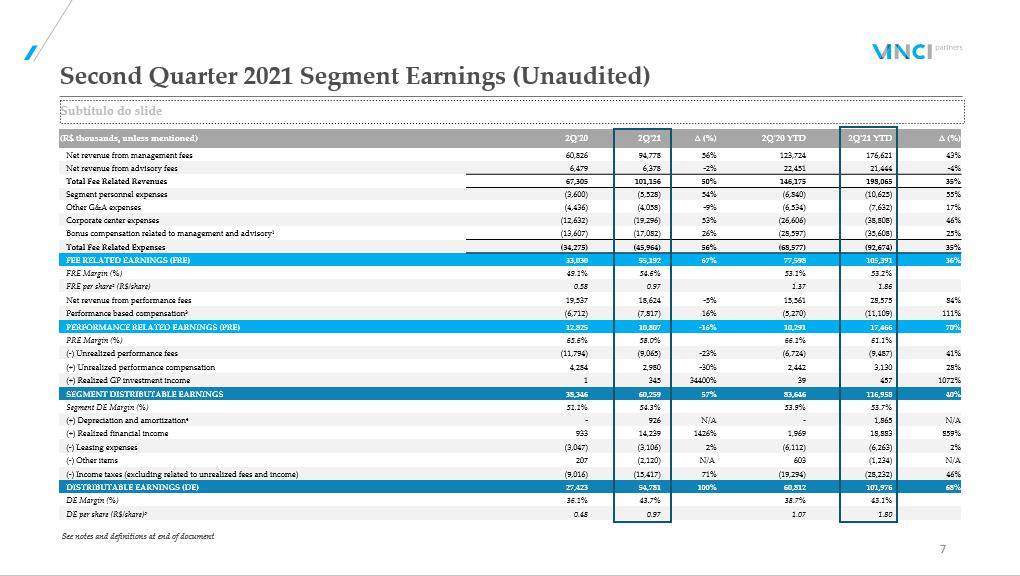
(R$ thousands, unless mentioned) 2Q'20 2Q'21 ∆ (%) 2Q'20 YTD 2Q'21 YTD ∆ (%) Net revenue from management fees 60,826 94,778 56% 123,724 176,621 43% Net revenue from advisory fees 6,479 6,378 - 2% 22,451 21,444 - 4% Total Fee Related Revenues 67,305 101,156 50% 146,175 198,065 35% Segment personnel expenses (3,600) (5,528) 54% (6,840) (10,625) 55% Other G&A expenses (4,436) (4,058) - 9% (6,534) (7,632) 17% Corporate center expenses (12,632) (19,296) 53% (26,606) (38,808) 46% Bonus compensation related to management and advisory¹ (13,607) (17,082) 26% (28,597) (35,608) 25% Total Fee Related Expenses (34,275) (45,964) 56% (68,577) (92,674) 35% FEE RELATED EARNINGS (FRE) 33,030 55,192 67% 77,598 105,391 36% FRE Margin (%) 49.1% 54.6% 53.1% 53.2% FRE per share² (R$/share) 0.58 0.97 1.37 1.86 Net revenue from performance fees 19,537 18,624 - 5% 15,561 28,575 84% Performance based compensation³ (6,712) (7,817) 16% (5,270) (11,109) 111% PERFORMANCE RELATED EARNINGS (PRE) 12,825 10,807 - 16% 10,291 17,466 70% PRE Margin (%) 65.6% 58.0% 66.1% 61.1% ( - ) Unrealized performance fees (11,794) (9,065) - 23% (6,724) (9,487) 41% (+) Unrealized performance compensation 4,284 2,980 - 30% 2,442 3,130 28% (+) Realized GP investment income 1 345 34400% 39 457 1072% SEGMENT DISTRIBUTABLE EARNINGS 38,346 60,259 57% 83,646 116,958 40% Segment DE Margin (%) 51.1% 54.3% 53.9% 53.7% (+) Depreciation and amortization 4 - 926 N/A - 1,865 N/A (+) Realized financial income 933 14,239 1426% 1,969 18,883 859% ( - ) Leasing expenses (3,047) (3,106) 2% (6,112) (6,263) 2% ( - ) Other items 207 (2,120) N/A 603 (1,234) N/A ( - ) Income taxes (excluding related to unrealized fees and income) (9,016) (15,417) 71% (19,294) (28,232) 46% DISTRIBUTABLE EARNINGS (DE) 27,423 54,781 100% 60,812 101,976 68% DE Margin (%) 36.1% 43.7% 38.7% 43.1% DE per share (R$/share) 5 0.48 0.97 1.07 1.80 Second Quarter 2021 Segment Earnings (Unaudited) See notes and definitions at end of document 7

Second Quarter 2021 Highlights Financial Measures Capital Metrics Capital Returned to Shareholders ▪ Fee - related revenues (management and advisory fees) of R$101.2 million in the quarter, up 50% year - over - year. x Fee - related revenues was R$198.1 million in the 2Q'21 YTD, up 35% year - over - year. ▪ Fee - Related Earnings (“FRE”) of R$55.2 million (R$0.97/share) in the quarter, up 67% year - over - year. x FRE was R$105.4 million in the 2Q'21 YTD, up 36% year - over - year. ▪ Distributable Earnings (“DE”) of R$54.8 million (R$0.97/share) in the quarter, up 100% year - over - year. x DE was R$102.0 million in the 2Q'21 YTD, up 68% year - over - year. ▪ Total assets under management (“AUM”) of R$56.9 billion, up 31% year - over - year. x Fee - Earning AUM (“FEAUM”) of R$54.7 billion, up 33% year - over - year. ▪ Performance fee - eligible AUM (“PEAUM”) of R$36.8 billion at the end of the quarter. ▪ Net inflows of R$1.5 billion in the quarter and R$3.7 billion over the 2Q ' 21 YTD. ▪ Net capital subscriptions of R$265.4 million in quarter and R$1.9 billion over the 2Q ' 21 YTD. ▪ Net cash and investments of R$1.5 billion (R$25.96/share) at the end of the quarter. ▪ Semi - annual dividend of US$0.30 per common share payable on September 16, 2021 ▪ R$102.0 million to be distributed to shareholders through dividends and share repurchases, effectively returning 100% of the Distributable Earnings generated in the 2Q ' 21 YTD. 8
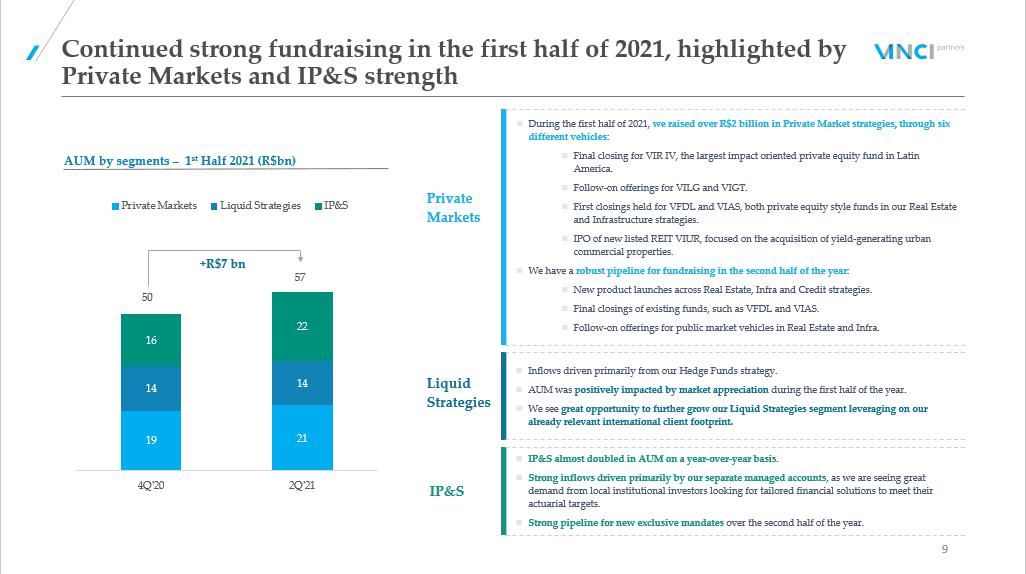
9 Continued strong fundraising in the first half of 2021, highlighted by Private Markets and IP&S strength Private Markets During the first half of 2021, we raised over R$2 billion in Private Market strategies, through six different vehicles : Final closing for VIR IV, the largest impact oriented private equity fund in Latin America. Follow - on offerings for VILG and VIGT. First closings held for VFDL and VIAS, both private equity style funds in our Real Estate and Infrastructure strategies. IPO of new listed REIT VIUR, focused on the acquisition of yield - generating urban commercial properties. We have a robust pipeline for fundraising in the second half of the year : New product launches across Real Estate, Infra and Credit strategies. Final closings of existing funds, such as VFDL and VIAS. Follow - on offerings for public market vehicles in Real Estate and Infra. IP&S almost doubled in AUM on a year - over - year basis . Strong inflows driven primarily by our separate managed accounts , as we are seeing great demand from local institutional investors looking for tailored financial solutions to meet their actuarial targets. Strong pipeline for new exclusive mandates over the second half of the year. IP&S Liquid Strategies Inflows driven primarily from our Hedge Funds strategy. AUM was positively impacted by market appreciation during the first half of the year. We see great opportunity to further grow our Liquid Strategies segment leveraging on our already relevant international client footprint. AUM by segments – 1 st Half 2021 (R$bn) +R$7 bn 50 57 19 21 14 14 16 22 4Q'20 2Q'21 Private Markets Liquid Strategies IP&S
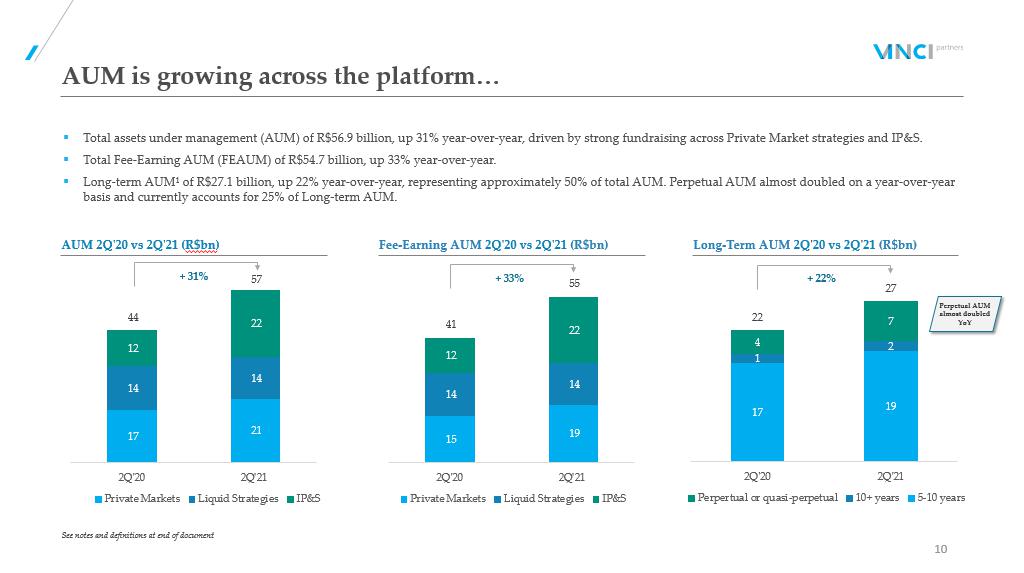
AUM is growing across the platform… 10 Fee - Earning AUM 2Q ' 20 vs 2Q ' 21 (R$bn) Long - Term AUM 2Q ' 20 vs 2Q ' 21 (R$bn) AUM 2Q ' 20 vs 2Q ' 21 ( R$bn ) 17 21 14 14 12 22 44 57 2Q'20 2Q'21 Private Markets Liquid Strategies IP&S + 31% 15 19 14 14 12 22 41 55 2Q'20 2Q'21 Private Markets Liquid Strategies IP&S + 33% 17 19 1 2 4 7 22 27 2Q'20 2Q'21 Perpertual or quasi-perpetual 10+ years 5-10 years + 22% ▪ Total assets under management (AUM) of R$56.9 billion, up 31% year - over - year, driven by strong fundraising across Private Market strategies and IP&S. ▪ Total Fee - Earning AUM (FEAUM) of R$54.7 billion, up 33% year - over - year. ▪ Long - term AUM¹ of R$27.1 billion, up 22% year - over - year, representing approximately 50% of total AUM. Perpetual AUM almost doubl ed on a year - over - year basis and currently accounts for 25% of Long - term AUM. Perpetual AUM almost doubled YoY See notes and definitions at end of document

19% 9% 4% 4% 39% 19% 6% 30% 11% 4% 6% 19% 16% 5% 9% 34% 23% 23% 10% 9% … and is highly diversified across different strategies and clients Our AUM base favors alpha - driven strategies, while our revenue profile is management fee - centric 11 AUM 2Q ' 21 Net Revenues 2Q ' 21 YTD Private Equity Real Estate Credit Infrastructure IP&S Public Equities Hedge Funds Advisory 50% of net revenues come from private market strategies ² ~50% of AUM is in long term products ¹ AUM diversified across five different distribution channels AUM 2Q ' 21 Local Institutional Institutional Offshore HNWI Allocators & Distributors Public market vehicles See notes and definitions at end of document

Significant exposure to performance fee - eligible AUM Vinci holds a strong position for future realization of performance fees with over R$7 billion in PEAUM coming from preferred re turn funds with carried interest 12 ▪ Total Performance fee eligible AUM (PEAUM) of R$36.8 billion. ▪ Hurdle rate funds charge performance based on the fund’s return over its benchmark, generally with a high - watermark clause, except for the SWF mandate in Public Equities. ▪ Within our Private Market strategies, R$7 billion in AUM comes from “preferred return” funds with carried interest, that are still in investment period. 25% 24% 23% 9% 8% 7% 4% Private Equity IP&S Public Equities Real Estate Hedge Funds Credit Infrastructure PEAUM R$37 bn PERFORMANCE FEE ELIGIBLE AUM (PEAUM) Strategy/Fund AUM R$mm Index type Index Rate Status Offshore Vehicles 3,147 Preferred Return w/ Catch - Up² USD + 8% Within investment period Onshore Vehicles 1,567 Preferred Return w/ Catch - Up² IPCA 5 + 8% Within investment period Nordeste III 228 Preferred Return w/ Catch - Up² IPCA 5 + 8.5% Currently generating performance Others 4,233 Not expected to pay performance Total Private Equity 9,174 Vinci Valorem 3,067 Hurdle³ IMAB 5 6 Currently generating performance Separate Mandates 2,557 Hurdle³ IBOV 7 + alpha Currently generating performance International¹ 1,575 Currently generating performance Commingled Funds 852 Hurdle³ IBOV 7 + alpha Currently generating performance Others 923 Currently generating performance Total IP&S 8,974 SWF 5,625 Hurdle³ FTSE 8 Currently generating performance Mosaico Strategy 1,825 Hurdle³ IBOV 7 Currently generating performance Vinci Gas Dividendos 731 Hurdle³ IBOV 7 Currently generating performance Others 395 Currently generating performance Total Public Equities 8,577 Listed REITs 2,635 Hurdle³ IPCA 5 + 6% Currently generating performance Listed REITs 237 Hurdle³ IFIX 9 Currently generating performance VFDL 380 Preferred Return 4 IPCA 5 + 6% Within investment period Total Real Estate 3,251 Vinci Multiestratégia 1,210 Hurdle³ CDI 10 Currently generating performance Atlas Strategy 703 Hurdle³ CDI 10 Currently generating performance Vinci Total Return 159 Hurdle³ IPCA 5 + Yield IMAB 11 Currently generating performance Others 774 Currently generating performance Total Hedge Funds 2,846 VCI II 693 Preferred Return 4 IPCA 5 + 6% Within investment period VES 593 Preferred Return 4 IPCA 5 + 6% Within investment period VCM FIM 184 Preferred Return 4 IPCA 5 + 5% Within investment period VCS 20 Hurdle³ IPCA 5 + 5% Within investment period Energia FIM 247 Hurdle³ CDI 10 Currently generating performance VCI I 314 Not expected to pay performance Others 409 Currently generating performance Total Credit 2,461 VIAS 256 Preferred Return 4 IPCA 5 + 6% Within investment period FIP Infra Transmissão 126 Preferred Return 4 IPCA 5 + 8% Currently generating performance Others 1,181 Not expected to pay performance Total Infrastructure 1,563 PEAUM TOTAL 36,845 See notes and definitions at end of document

Fee related revenues are expanding alongside AUM growth Management fees remain the main contributor to revenues, accounting for 78% of total revenues in the 2Q'21 YTD. 13 61 95 6 6 67 101 2Q'20 2Q'21 Management fees Advisory fees +50% Management and Advisory fees 2Q ' 21 vs. 2Q ' 2 0 (R$mm) Management and Advisory fees 2Q ' 21 YTD vs. 2Q ' 20 YTD (R$mm) 124 177 22 21 146 198 2Q'20 YTD 2Q'21 YTD Management fees Advisory fees +35% ▪ Fee related revenues, composed of management and advisory fees, totaled R$101.2 million in the quarter, up 50% year - over - year, a nd R$198.1 million in the 2Q ' 21 YTD, up 35% when compared to the 2Q ' 20 YTD. ▪ Management fee revenues reached R$94.8 million in the quarter, up 56% year - over - year, following strong fundraising and growth in fee - paying AUM across Private Markets and IP&S funds.
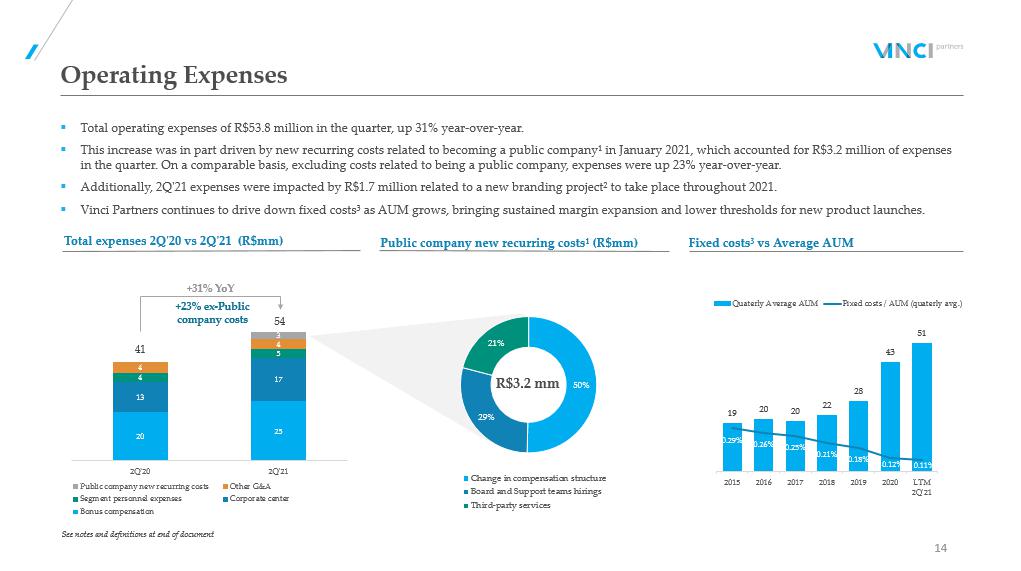
▪ Total operating expenses of R$53.8 million in the quarter, up 31% year - over - year. ▪ This increase was in part driven by new recurring costs related to becoming a public company¹ in January 2021, which accounte d f or R$3.2 million of expenses in the quarter. On a comparable basis, excluding costs related to being a public company, expenses were up 23% year - over - year. ▪ Additionally, 2Q'21 expenses were impacted by R$1.7 million related to a new branding project² to take place throughout 2021. ▪ Vinci Partners continues to drive down fixed costs³ as AUM grows, bringing sustained margin expansion and lower thresholds fo r n ew product launches. 50% 29% 21% Change in compensation structure Board and Support teams hirings Third-party services Operating Expenses 14 Total expenses 2Q ' 20 vs 2Q ' 21 (R$mm) Fixed costs³ vs Average AUM Public company new recurring costs¹ (R$mm) +23% ex - Public company costs +31% YoY R$3.2 mm 19 20 20 22 28 43 51 0.29% 0.26% 0.25% 0.21% 0.18% 0.12% 0.11% 0.05% 0.15% 0.25% 0.35% 0.45% 0.55% 0.65% 0.75% 0.85% 0 10 20 30 40 50 60 2015 2016 2017 2018 2019 2020 LTM 2Q'21 Quaterly Average AUM Fixed costs / AUM (quaterly avg.) See notes and definitions at end of document 20 25 13 17 4 5 4 4 3 41 54 2Q'20 2Q'21 Public company new recurring costs Other G&A Segment personnel expenses Corporate center Bonus compensation

78 105 YTD 2Q'20 YTD 2Q'21 Fee Related Earnings (FRE) 15 Fee Related Earnings (FRE) 2Q ' 21 vs 2Q ' 20 (R$mm) FRE 2Q ' 21 YTD vs 2Q ' 20 YTD (R$mm) % FRE margin FRE per share 4 R$0.58 R$1.06 R$0.97 R$1.37 R$1.86 +36% ▪ Fee Related Earnings (FRE) of R$55.2 million (R$0.97/share) in the quarter, up 67% year - over - year, driven by the robust growth i n management fees across all segments and strong margin expansion in the quarter. FRE was R$105.4 million (R$1.85/share) in the 2Q ' 21 YTD, up 36% when compared to the 2Q ' 20 YTD. ▪ Comparable FRE¹ margin, disregarding new public company costs² and a one - off branding project³, would be 60% at the end of the q uarter, compared to 49% in the 2Q ' 20, representing a notable increase of 10 percentage points year - over - year. ▪ FRE Margin was 55% at the end of the quarter, an increase of 5.4 percentage points year - over - year, showcasing the platform's hig hly scalable potential. 53% 53% 49% 60% 55% See notes and definitions at end of document
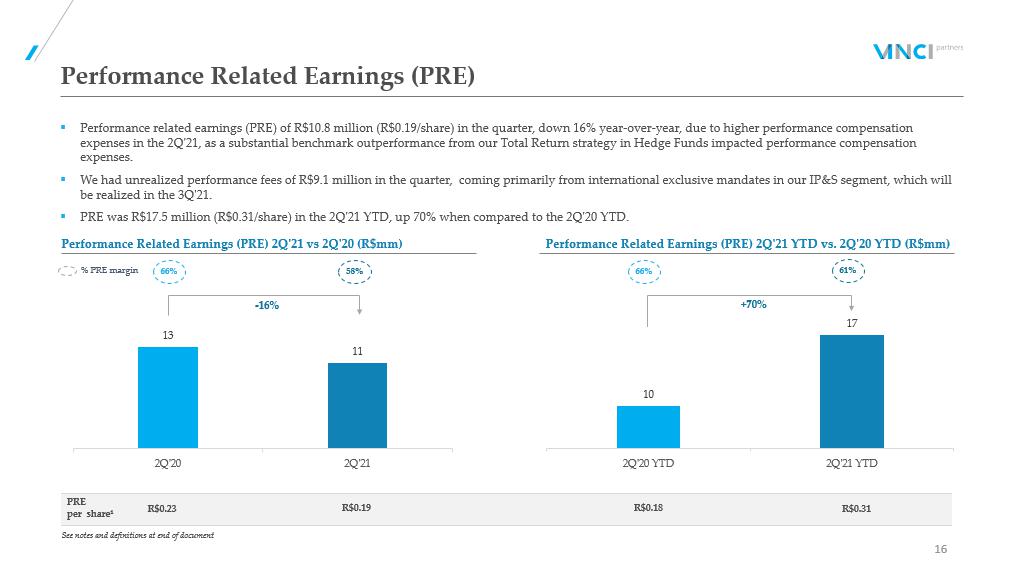
▪ Performance related earnings (PRE) of R$10.8 million (R$0.19/share) in the quarter, down 16% year - over - year, due to higher perfo rmance compensation expenses in the 2Q ' 21, as a substantial benchmark outperformance from our Total Return strategy in Hedge Funds impacted performance compensation expenses. ▪ We had unrealized performance fees of R$9.1 million in the quarter, coming primarily from international exclusive mandates i n o ur IP&S segment, which will be realized in the 3Q ' 21. ▪ PRE was R$17.5 million (R$0.31/share) in the 2Q ' 21 YTD, up 70% when compared to the 2Q ' 20 YTD. 10 17 2Q'20 YTD 2Q'21 YTD Performance Related Earnings (PRE) 16 Performance Related Earnings (PRE) 2Q ' 21 vs 2Q ' 20 (R$mm) 58% % PRE margin Performance Related Earnings (PRE) 2Q ' 21 YTD vs. 2Q ' 20 YTD (R$mm) 66% 61% +70% PRE per share¹ R$0.23 R$0.19 R$0.18 R$0.31 13 11 2Q'20 2Q'21 66% - 16% See notes and definitions at end of document

Realized GP Investment¹ and Financial income² 2Q ' 21 vs 2Q ' 20 (R$mm) GP Investment and Financial income 17 Quarter Return (+/ - ) CDI 1Q19 2.2% 0.7% 2Q19 3.3% 1.7% 3Q19 2.1% 0.6% 4Q19 3.3% 2.0% 1Q20 0.2% - 0.8% 2Q20 3.9% 3.1% 3Q20 0.4% - 0.1% 4Q20 1.9% 1.5% 1Q21 1.0% 0.5% 2Q21 1.2% 0.4% ▪ Realized GP Investment¹ and Financial income² totaled R$14.6 million in the quarter, up 1,461% year - over - year, due to the financ ial income generated from the cash allocations of the company's IPO proceeds. ▪ Cash allocations in the second quarter resulted in a 1.2% quarterly return, 0.4 percentage points above the quarterly return for the CDI rate. Our cash allocations target a CDI + 2% annual return. Liquid funds allocation track record³ 0.3 1 14 1 15 2Q'20 2Q'21 Realized GP Investment Income Realized Financial Income See notes and definitions at end of document
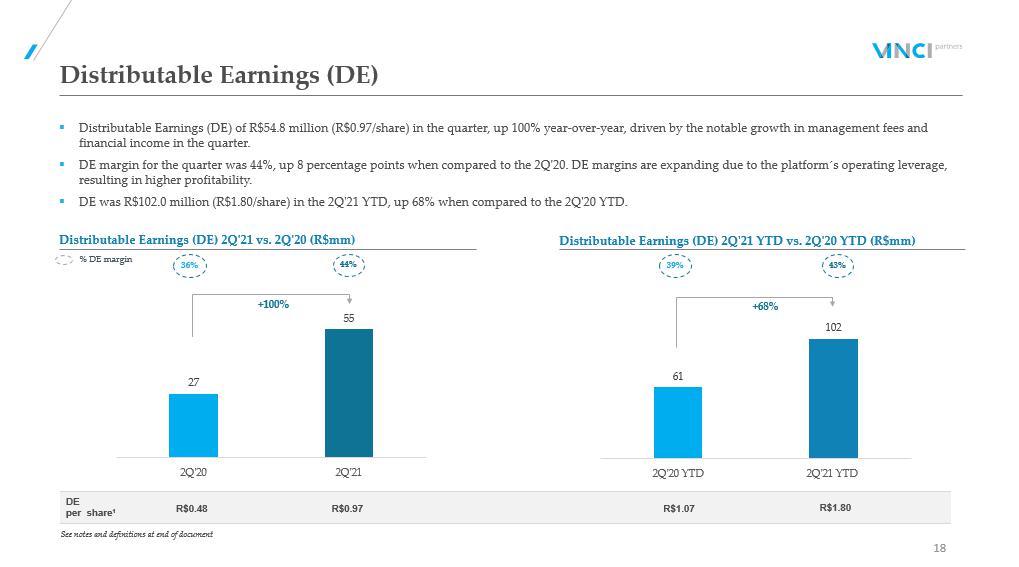
▪ Distributable Earnings (DE) of R$54.8 million (R$0.97/share) in the quarter, up 100% year - over - year, driven by the notable growt h in management fees and financial income in the quarter. ▪ DE margin for the quarter was 44%, up 8 percentage points when compared to the 2Q'20. DE margins are expanding due to the pla tfo rm ´ s operating leverage, resulting in higher profitability. ▪ DE was R$102.0 million (R$1.80/share) in the 2Q'21 YTD, up 68% when compared to the 2Q'20 YTD. 61 102 2Q'20 YTD 2Q'21 YTD Distributable Earnings (DE) 18 Distributable Earnings (DE) 2Q ' 21 vs. 2Q ' 20 (R$mm) 39% 43% 36% 44% Distributable Earnings (DE) 2Q ' 21 YTD vs. 2Q ' 20 YTD (R$mm) % DE margin +100% +68% DE per share¹ R$0.48 R$0.97 R$1.07 R$1.80 27 55 2Q'20 2Q'21 See notes and definitions at end of document

(in R$ millions, unless mentioned) 1Q'21 2Q'21 Cash and cash equivalents¹ 854.0 80.0 Net Investments 595.9 1,392.6 Liquid funds² 556.0 1,271.4 GP Fund Investments³ 39.9 121.2 Cash and Net Investments 1,449.9 1,472.6 Cash and Net Investments per share 4 (R$/share) 25.48 25.96 Balance Sheet Highlights 19 ▪ As of June 30, 2021, Vinci Partners had R$1.5 billion (R$25.96/share) in total cash and net investments, that comprise cash, cas h equivalents and Net investments (Liquid funds and GP fund investments at fair value). ▪ Vinci Partners repurchased 176,655 shares in the quarter with an average share price of US$14.7. As of June 30,2021, there wa s R $71.8 million in share repurchased plan authorization remaining. Share Repurchase Activity (in R$ million, unless mentioned) 2Q'21 Total Shares Purchased (number of shares) 176,655 Total Capital Used for Share Purchases 13.2 Share Repurchase Plan Authorization Remaining 71.8 Average Price Paid Per Share (US$) 14.7 Average Share Price in the period (US$) 14.7 1Q'21 2Q'21 Cash and Net Investments per share (R$/share) 4 25.48 25.96 See notes and definitions at end of document

Segment Highlights 20

50% 22% 19% 9% Financials by Segment 21 R$105.4 mm R$117.0 mm Segment Distributable Earnings 2Q ' 21 YTD by Segment ▪ Fee Related Earnings (FRE) were R$105.4 million in the 2Q'21 YTD, with 50% of FRE coming from Private Markets, followed by Li qui d Strategies with 22%, IP&S with 19% and Financial Advisory with 9%. ▪ Segment Distributable Earnings were R$117.0 million in the 2Q'21 YTD, with 46% coming from Private Markets’ strategies, follo wed by Liquid Strategies with 23%, IP&S with 23% and Financial Advisory 8%. Fee Related Earnings (FRE) 2Q ' 21 YTD by Segment 46% 23% 23% 8% Private Markets Liquid Strategies IP&S Advisory
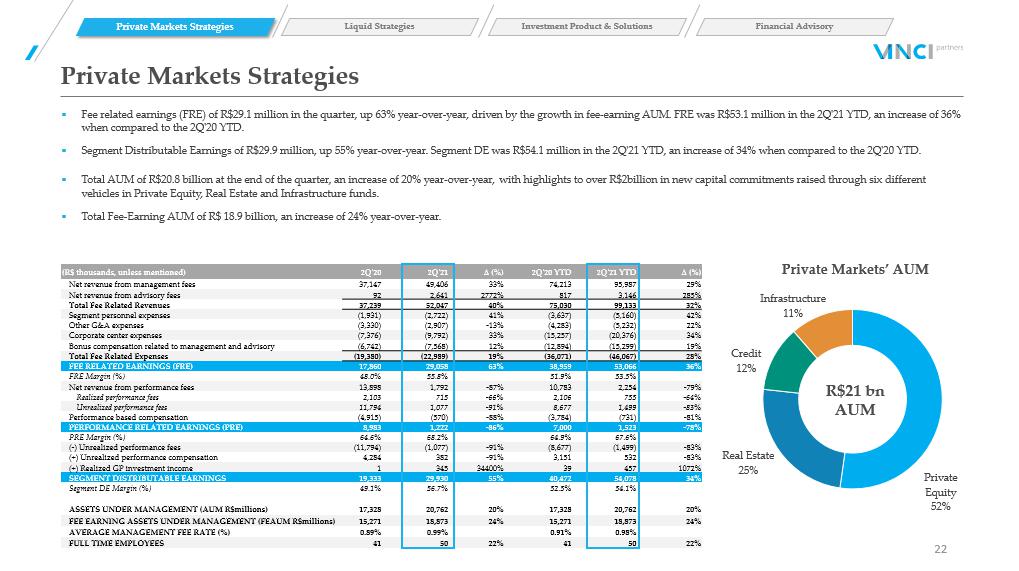
▪ Fee related earnings (FRE) of R$29.1 million in the quarter, up 63% year - over - year, driven by the growth in fee - earning AUM. FRE was R$53.1 million in the 2Q'21 YTD, an increase of 36% when compared to the 2Q'20 YTD. ▪ Segment Distributable Earnings of R$29.9 million, up 55% year - over - year. Segment DE was R$54.1 million in the 2Q ' 21 YTD, an increase of 34% when compared to the 2Q ' 20 YTD. ▪ Total AUM of R$20.8 billion at the end of the quarter, an increase of 20% year - over - year, with highlights to over R$2billion in new capital commitments raised through six different vehicles in Private Equity, Real Estate and Infrastructure funds. ▪ Total Fee - Earning AUM of R$ 18.9 billion, an increase of 24% year - over - year. (R$ thousands, unless mentioned) 2Q'20 2Q'21 ∆ (%) 2Q'20 YTD 2Q'21 YTD ∆ (%) Net revenue from management fees 37,147 49,406 33% 74,213 95,987 29% Net revenue from advisory fees 92 2,641 2772% 817 3,146 285% Total Fee Related Revenues 37,239 52,047 40% 75,030 99,133 32% Segment personnel expenses (1,931) (2,722) 41% (3,637) (5,160) 42% Other G&A expenses (3,330) (2,907) - 13% (4,283) (5,232) 22% Corporate center expenses (7,376) (9,792) 33% (15,257) (20,376) 34% Bonus compensation related to management and advisory (6,742) (7,568) 12% (12,894) (15,299) 19% Total Fee Related Expenses (19,380) (22,989) 19% (36,071) (46,067) 28% FEE RELATED EARNINGS (FRE) 17,860 29,058 63% 38,959 53,066 36% FRE Margin (%) 48.0% 55.8% 51.9% 53.5% Net revenue from performance fees 13,898 1,792 - 87% 10,783 2,254 - 79% Realized performance fees 2,103 715 - 66% 2,106 755 - 64% Unrealized performance fees 11,794 1,077 - 91% 8,677 1,499 - 83% Performance based compensation (4,915) (570) - 88% (3,784) (731) - 81% PERFORMANCE RELATED EARNINGS (PRE) 8,983 1,222 - 86% 7,000 1,523 - 78% PRE Margin (%) 64.6% 68.2% 64.9% 67.6% ( - ) Unrealized performance fees (11,794) (1,077) - 91% (8,677) (1,499) - 83% (+) Unrealized performance compensation 4,284 382 - 91% 3,151 532 - 83% (+) Realized GP investment income 1 345 34400% 39 457 1072% SEGMENT DISTRIBUTABLE EARNINGS 19,333 29,930 55% 40,472 54,078 34% Segment DE Margin (%) 49.1% 56.7% 52.5% 54.1% ASSETS UNDER MANAGEMENT (AUM R$millions) 17,328 20,762 20% 17,328 20,762 20% FEE EARNING ASSETS UNDER MANAGEMENT (FEAUM R$millions) 15,271 18,873 24% 15,271 18,873 24% AVERAGE MANAGEMENT FEE RATE (%) 0.89% 0.99% 0.91% 0.98% FULL TIME EMPLOYEES 41 50 22% 41 50 22% Private Markets Strategies 22 Private Markets Strategies Liquid Strategies Investment Product & Solutions Financial Advisory Private Markets’ AUM Private Equity 52% Real Estate 25% Credit 12% Infrastructure 11% R$21 bn AUM

Public Equities 77% Hedge Funds 23% ▪ Fee related earnings (FRE) of R$12.9 million in the quarter, up 85% year - over - year, driven by the end of the revenue sharing ag reement with GAS Investimentos in 2021 and net inflows in Hedge Funds which impacted positively our average management fee rate. FRE was R$23.0 million in the 2Q ' 21 YTD, an increase of 44% compared to the 2Q ' 20 YTD. ▪ Performance related earnings (PRE) of R$2.4 million in the quarter, down 5% year - over - year, due to a higher compensation expense that followed a substantial benchmark outperform from our Total Return strategy in Hedge Funds, which also accounted for lower PRE Margins in the quarter. PRE was R$3.7 milli on in the 2Q'21 YTD, an increase of 107% when compared to the 2Q'20 YTD. ▪ Segment Distributable Earnings of R$15.3 million in the quarter, up 61% year - over - year, due to a robust growth in management fees. ▪ AUM remained stable on a year - over - year basis, with strong fundraising in Hedge Funds and market appreciation offsetting outflow s in low fee - paying AUM across our Public Equities strategy, coming primarily from the GAS Dissociation in December 2020. As a result, our average management fee rate was posit ive ly impacted, going from 48 basis points in 2Q'20 to 73 basis points in 2Q'21. (R$ thousands, unless mentioned) 2Q'20 2Q'21 ∆ (%) 2Q’20 YTD 2Q’21 YTD ∆ (%) Net revenue from management fees 13,559 23,020 70% 30,306 43,003 42% Net revenue from advisory fees 0 0 N/A 0 0 N/A Total Fee Related Revenues 13,559 23,020 65% 30,306 43,003 40% Segment personnel expenses (669) (1,387) 107% (1,328) (2,680) 102% Other G&A expenses (687) (681) - 1% (1,347) (1,305) - 3% Corporate center expenses (2,685) (4,196) 56% (6,178) (8,689) 41% Bonus compensation related to management and advisory (2,565) (3,893) 52% (5,446) (7,312) 34% Total Fee Related Expenses (6,606) (10,157) 54% (14,299) (19,986) 40% FEE RELATED EARNINGS (FRE) 6,952 12,863 85% 16,007 23,017 44% FRE Margin (%) 51.3% 55.9% 52.8% 53.5% Net revenue from performance fees 3,647 6,450 77% 2,478 8,459 241% Realized performance fees 3,647 6,450 77% 4,374 8,459 93% Unrealized performance fees 0 0 N/A (1,896) 0 N/A Performance based compensation (1,094) (4,015) 267% (671) (4,718) 603% PERFORMANCE RELATED EARNINGS (PRE) 2,553 2,435 - 5% 1,807 3,741 107% PRE Margin (%) 70.0% 37.8% 72.9% 44.2% ( - ) Unrealized performance fees 0 0 N/A 1,896 0 N/A (+) Unrealized performance compensation 0 0 N/A (689) 0 N/A SEGMENT DISTRIBUTABLE EARNINGS 9,506 15,299 61% 19,021 26,759 41% Segment DE Margin (%) 55.2% 51.9% 54.8% 52.0% ASSETS UNDER MANAGEMENT (AUM R$millions) 14,300 14,124 - 1% 14,300 14,124 - 1% FEE EARNING ASSETS UNDER MANAGEMENT (FEAUM R$millions) 14,179 13,965 - 2% 14,179 13,965 - 2% AVERAGE MANAGEMENT FEE RATE (%) 0.48% 0.73% 0.59% 0.69% FULL TIME EMPLOYEES 17 24 41% 17 24 41% Liquid Strategies 23 Private Market Strategies Liquid Strategies Investment Product & Solutions Financial Advisory Liquid Strategies’ AUM R$14 bn AUM
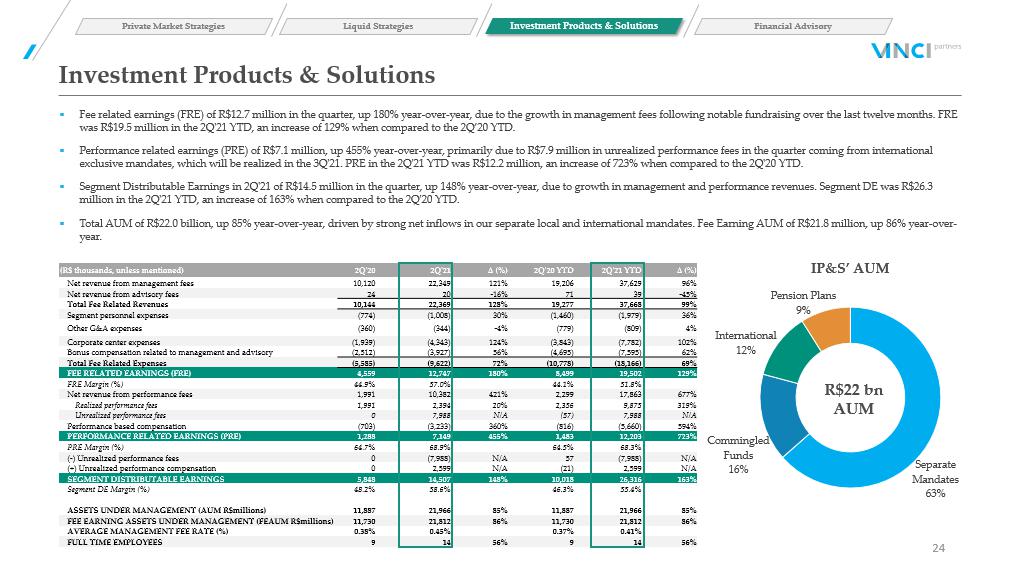
Separate Mandates 63% Commingled Funds 16% International 12% Pension Plans 9% R$22 bn AUM ▪ Fee related earnings (FRE) of R$12.7 million in the quarter, up 180% year - over - year, due to the growth in management fees follow ing notable fundraising over the last twelve months. FRE was R$19.5 million in the 2Q ' 21 YTD, an increase of 129% when compared to the 2Q ’ 20 YTD. ▪ Performance related earnings (PRE) of R$7.1 million, up 455% year - over - year, primarily due to R$7.9 million in unrealized perfor mance fees in the quarter coming from international exclusive mandates, which will be realized in the 3Q ' 21. PRE in the 2Q ' 21 YTD was R$12.2 million, an increase of 723% when compared to the 2Q ' 20 YTD. ▪ Segment Distributable Earnings in 2Q ' 21 of R$14.5 million in the quarter, up 148% year - over - year, due to growth in management and performance revenues. Segment DE wa s R$26.3 million in the 2Q ' 21 YTD, an increase of 163% when compared to the 2Q ' 20 YTD. ▪ Total AUM of R$22.0 billion, up 85% year - over - year, driven by strong net inflows in our separate local and international mandate s. Fee Earning AUM of R$21.8 million, up 86% year - over - year. (R$ thousands, unless mentioned) 2Q'20 2Q'21 ∆ (%) 2Q'20 YTD 2Q'21 YTD ∆ (%) Net revenue from management fees 10,120 22,349 121% 19,206 37,629 96% Net revenue from advisory fees 24 20 - 16% 71 39 - 45% Total Fee Related Revenues 10,144 22,369 128% 19,277 37,668 99% Segment personnel expenses (774) (1,008) 30% (1,460) (1,979) 36% Other G&A expenses (360) (344) - 4% (779) (809) 4% Corporate center expenses (1,939) (4,343) 124% (3,843) (7,782) 102% Bonus compensation related to management and advisory (2,512) (3,927) 56% (4,695) (7,595) 62% Total Fee Related Expenses (5,585) (9,622) 72% (10,778) (18,166) 69% FEE RELATED EARNINGS (FRE) 4,559 12,747 180% 8,499 19,502 129% FRE Margin (%) 44.9% 57.0% 44.1% 51.8% Net revenue from performance fees 1,991 10,382 421% 2,299 17,863 677% Realized performance fees 1,991 2,394 20% 2,356 9,875 319% Unrealized performance fees 0 7,988 N/A (57) 7,988 N/A Performance based compensation (703) (3,233) 360% (816) (5,660) 594% PERFORMANCE RELATED EARNINGS (PRE) 1,288 7,149 455% 1,483 12,203 723% PRE Margin (%) 64.7% 68.9% 64.5% 68.3% ( - ) Unrealized performance fees 0 (7,988) N/A 57 (7,988) N/A (+) Unrealized performance compensation 0 2,599 N/A (21) 2,599 N/A SEGMENT DISTRIBUTABLE EARNINGS 5,848 14,507 148% 10,018 26,316 163% Segment DE Margin (%) 48.2% 58.6% 46.3% 55.4% ASSETS UNDER MANAGEMENT (AUM R$millions) 11,887 21,966 85% 11,887 21,966 85% FEE EARNING ASSETS UNDER MANAGEMENT (FEAUM R$millions) 11,730 21,812 86% 11,730 21,812 86% AVERAGE MANAGEMENT FEE RATE (%) 0.38% 0.45% 0.37% 0.41% FULL TIME EMPLOYEES 9 14 56% 9 14 56% Investment Products & Solutions 24 Private Market Strategies Liquid Strategies Investment Products & Solutions Financial Advisory IP&S’ AUM
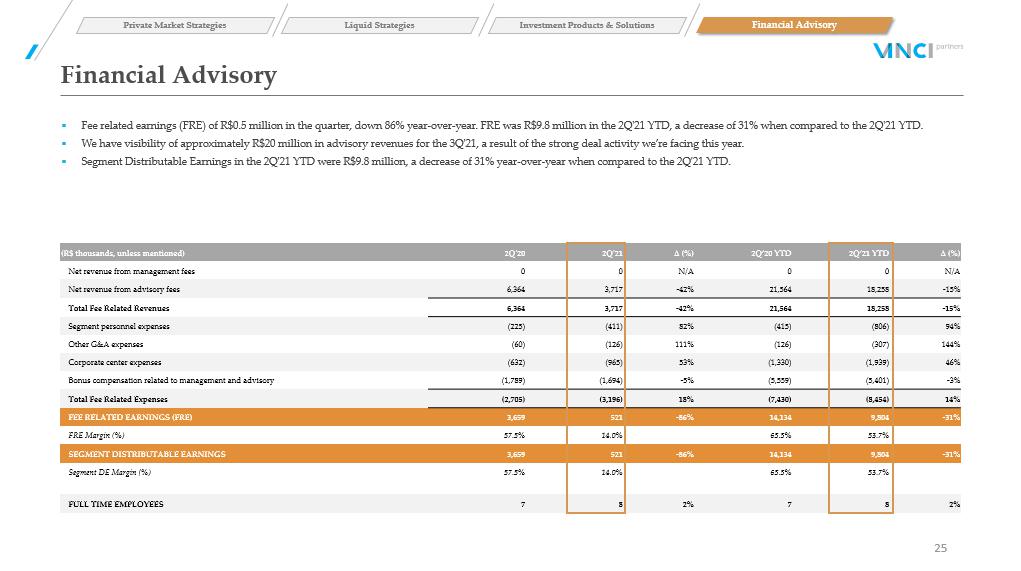
(R$ thousands, unless mentioned) 2Q'20 2Q'21 ∆ (%) 2Q’20 YTD 2Q’21 YTD ∆ (%) Net revenue from management fees 0 0 N/A 0 0 N/A Net revenue from advisory fees 6,364 3,717 - 42% 21,564 18,258 - 15% Total Fee Related Revenues 6,364 3,717 - 42% 21,564 18,258 - 15% Segment personnel expenses (225) (411) 82% (415) (806) 94% Other G&A expenses (60) (126) 111% (126) (307) 144% Corporate center expenses (632) (965) 53% (1,330) (1,939) 46% Bonus compensation related to management and advisory (1,789) (1,694) - 5% (5,559) (5,401) - 3% Total Fee Related Expenses (2,705) (3,196) 18% (7,430) (8,454) 14% FEE RELATED EARNINGS (FRE) 3,659 521 - 86% 14,134 9,804 - 31% FRE Margin (%) 57.5% 14.0% 65.5% 53.7% SEGMENT DISTRIBUTABLE EARNINGS 3,659 521 - 86% 14,134 9,804 - 31% Segment DE Margin (%) 57.5% 14.0% 65.5% 53.7% FULL TIME EMPLOYEES 7 8 2% 7 8 2% Financial Advisory 25 Private Market Strategies Liquid Strategies Investment Products & Solutions Financial Advisory ▪ Fee related earnings (FRE) of R$0.5 million in the quarter, down 86% year - over - year. FRE was R$9.8 million in the 2Q ' 21 YTD, a decrease of 31% when compared to the 2Q ' 21 YTD. ▪ We have visibility of approximately R$20 million in advisory revenues for the 3Q ' 21, a result of the strong deal activity we’re facing this year. ▪ Segment Distributable Earnings in the 2Q ' 21 YTD were R$9.8 million, a decrease of 31% year - over - year when compared to the 2Q ' 21 YTD.

Supplement Details 26

Private Public IP&S Infrastructure Real Estate Credit Hedge Total Equity Equities Funds Beginning balance 7,874 12,466 11,730 1,536 3,656 2,204 1,713 41,180 (+/ - ) Capital Subscription / (capital return) 855 – – 634 1,555 130 – 3,174 (+/ - ) Netflows – (4,951) 7,936 – 3 25 1,342 4,355 (+/ - ) Appreciation / (depreciation) 338 3,250 2,146 88 (128) 101 145 5,941 Ending Balance 9,066 10,765 21,812 2,259 5,087 2,461 3,200 54,650 Private Public IP&S Infrastructure Real Estate Credit Hedge Total Equity Equities Funds Beginning balance 9,530 9,955 20,299 2,351 5,125 2,330 2,884 52,474 (+/ - ) Capital Subscription / (capital return) – – – – 251 15 – 265 (+/ - ) Netflows – (86) 1,271 – – 68 275 1,528 (+/ - ) Appreciation / (depreciation) (464) 895 242 (92) (289) 49 41 383 Ending Balance 9,066 10,765 21,812 2,259 5,087 2,461 3,200 54,650 Private Public IP&S Infrastructure Real Estate Credit Hedge Total Equity Equities Funds Beginning balance 9,847 12,526 11,887 1,620 3,656 2,204 1,774 43,514 (+/ - ) Capital Subscription / (capital return) 855 – – 634 1,555 130 – 3,174 (+/ - ) Net Inflow/Outflow – (4,956) 7,923 – 4 25 1,342 4,337 (+/ - ) Appreciation / (depreciation) 150 3,292 2,157 108 (128) 101 146 5,827 Ending Balance 10,851 10,861 21,966 2,363 5,087 2,461 3,263 56,852 Private Public IP&S Infrastructure Real Estate Credit Hedge Total Equity Equities Funds Beginning balance 11,442 10,016 20,449 2,455 5,125 2,330 2,946 54,763 (+/ - ) Capital Subscription / (capital return) – – – – 251 14 – 265 (+/ - ) Net Inflow / (outflow) – (87) 1,268 – – 68 275 1,525 (+/ - ) Appreciation / (depreciation) (591) 932 248 (92) (289) 49 41 299 Ending Balance 10,851 10,861 21,966 2,363 5,087 2,461 3,263 56,852 AUM and Fee - Earning AUM Rollforward Assets Under Management (AUM) – R$ million Fee - Earning Assets Under Management (FEAUM) – R$ million For the Three Months Ended June 30, 2021 For the Twelve Months Ended June 30, 2021 For the Three Months Ended June 30, 2021 For the Twelve Months Ended June 30, 2021 27

Investment records – IP&S, Liquid Strategies, Credit and Listed Funds Fund Segment NAV¹ (R$ millions) 2Q21 YTD 12 M 24 M Market Comparison Index Rate Vinci Multiestratégia FIM Hedge Funds 1,209.7 0.5% 0.4% 1.3% 7.1% CDI 4 CDI 4 Atlas Strategy² Hedge Funds 703.4 1.6% 0.2% 0.5% 15.5% CDI 4 CDI 4 Vinci Total Return Hedge Funds 156.4 17.1% 24.9% 48.8% - IPCA 5 + Yield IMA - B 7 IPCA 5 + Yield IMA - B 7 Mosaico Strategy Public Equities 1,824.7 7.7% 5.2% 28.6% 36.9% IBOV 5 IBOV 5 Vinci Gas Dividendos FIA Public Equities 731.2 7.0% 2.8% 27.3% 26.4% IBOV 5 IBOV 5 Vinci Valorem FIM IP&S 3,066.5 1.0% 1.4% 5.2% 13.7% IMA - B 5 7 IMA - B 5 7 Equilibrio Strategy³ IP&S 1,901.2 1.6% 1.9% 6.4% 11.5% IPCA 6 - Vinci Selection Equities FIA IP&S 634.3 9.3% 6.6% 27.9% 36.3% IBOV 5 IBOV 5 Vinci Crédito Imobiliário I Credit 314.4 - 0.4% 0.9% 6.8% 14.2% IPCA 6 IPCA 6 +7.785% Vinci Crédito Imobiliário II Credit 382.7 1.6% - 0.7% 6.7% - IPCA 6 IPCA 6 + 6% Vinci Crédito Estruturado Multiestrategia Plus FIC FIM Credit 55.5 1.9% 2.8% 4.9% 11.1% CDI 4 CDI 4 Vinci Energia Sustentável Credit 592.7 3.3% 0.9% 9.6% 18.2% IPCA 6 IPCA 6 + 6% VISC11 Real Estate (listed REIT) 1,521.0 - 2.3% - 5.5% 7.3% 13.9% IFIX 8 IPCA 6 + 6% VILG11 Real Estate (listed REIT) 1,626.3 - 6.4% - 10.7% - 4.3% 30.2% IFIX 8 IPCA 6 + 6% VINO11 Real Estate (listed REIT) 748.1 - 1.6% - 1.8% 10.7% - IFIX 8 IPCA 6 + 6% VIFI11 Real Estate (listed REIT) 235.7 - 2.2% - 8.0% - 8.5% - IFIX 8 IFIX 8 VIUR11 Real Estate (listed REIT) 243.7 - 8.9% - 8.9% - - IFIX 8 IPCA 6 + 6% VIGT11 Infrastructure (listed) 695.8 - 3.8% - 14.3% - 19.5% - - - Benchmark 2Q21 YTD 12 M 24 M IBOV 5 8.7% 6.5% 33.4% 25.6% CDI 4 0.8% 1.3% 2.3% 7.0% IMA - B 5 7 1.4% 1.3% 6.1% 15.4% IPCA 6 + Yield IMA - B 7 2.7% 5.6% 10.9% 16.4% IPCA 6 1.7% 3.8% 8.3% 10.7% IFIX 8 - 3.2% - 4.0% - 1.8% 4.9% See notes and definitions at end of document 28
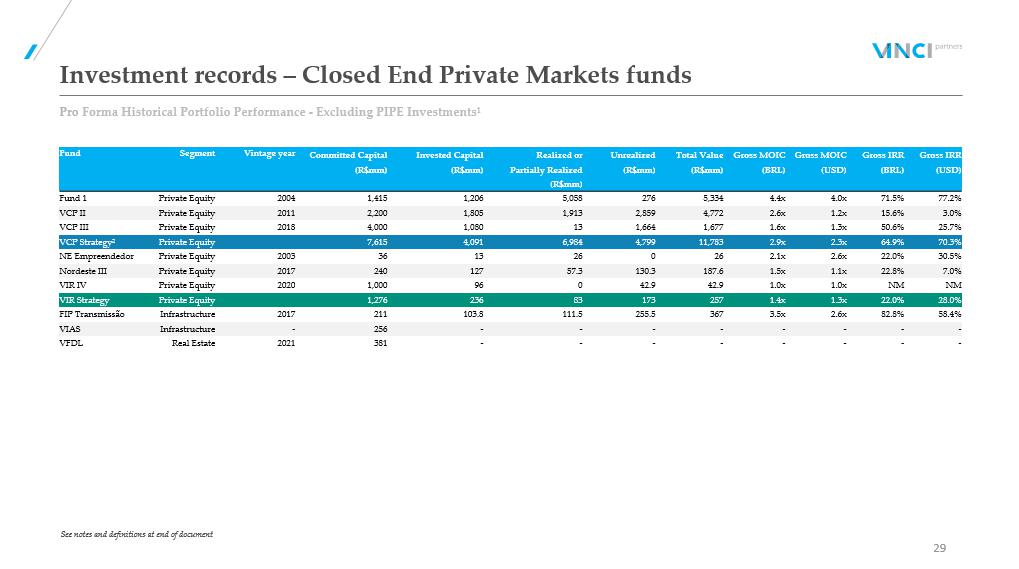
Investment records – Closed End Private Markets funds Pro Forma Historical Portfolio Performance - Excluding PIPE Investments¹ 29 Fund Segment Vintage year Committed Capital Invested Capital Realized or Unrealized Total Value Gross MOIC Gross MOIC Gross IRR Gross IRR (R$mm) (R$mm) Partially Realized (R$mm) (R$mm) (BRL) (USD) (BRL) (USD) (R$mm) Fund 1 Private Equity 2004 1,415 1,206 5,058 276 5,334 4.4x 4.0x 71.5% 77.2% VCP II Private Equity 2011 2,200 1,805 1,913 2,859 4,772 2.6x 1.2x 15.6% 3.0% VCP III Private Equity 2018 4,000 1,080 13 1,664 1,677 1.6x 1.3x 50.6% 25.7% VCP Strategy² Private Equity 7,615 4,091 6,984 4,799 11,783 2.9x 2.3x 64.9% 70.3% NE Empreendedor Private Equity 2003 36 13 26 0 26 2.1x 2.6x 22.0% 30.5% Nordeste III Private Equity 2017 240 127 57.3 130.3 187.6 1.5x 1.1x 22.8% 7.0% VIR IV Private Equity 2020 1,000 96 0 42.9 42.9 1.0x 1.0x NM NM VIR Strategy Private Equity 1,276 236 83 173 257 1.4x 1.3x 22.0% 28.0% FIP Transmissão Infrastructure 2017 211 103.8 111.5 255.5 367 3.5x 2.6x 82.8% 58.4% VIAS Infrastructure - 256 - - - - - - - - VFDL Real Estate 2021 381 - - - - - - - - See notes and definitions at end of document
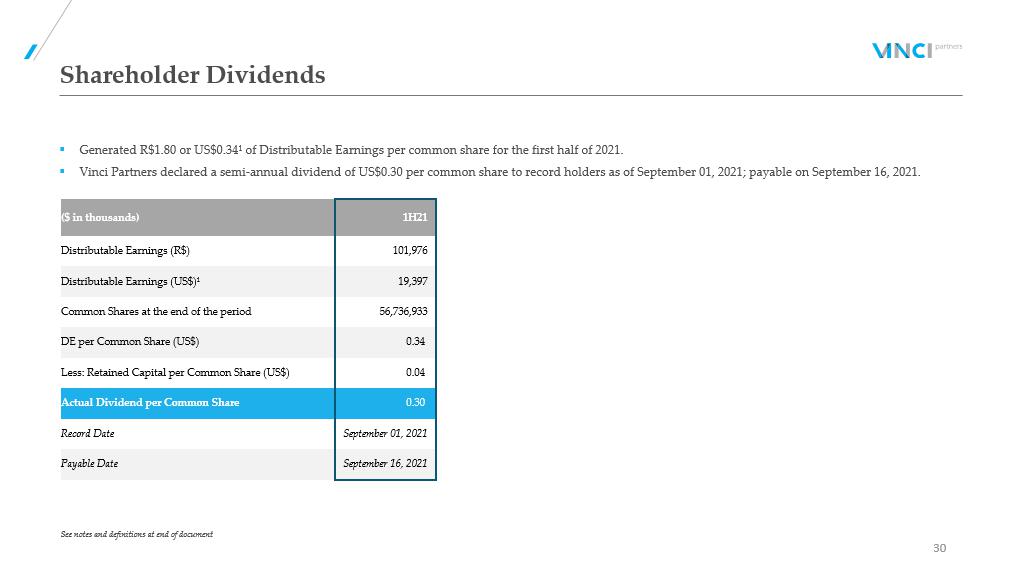
Shareholder Dividends 30 ▪ Generated R$1.80 or US$0.34¹ of Distributable Earnings per common share for the first half of 2021. ▪ Vinci Partners declared a semi - annual dividend of US$0.30 per common share to record holders as of September 01, 2021; payable o n September 16, 2021 . ($ in thousands) 1H21 Distributable Earnings (R$) 101,976 Distributable Earnings (US$)¹ 19,397 Common Shares at the end of the period 56,736,933 DE per Common Share (US$) 0.34 Less: Retained Capital per Common Share (US$) 0.04 Actual Dividend per Common Share 0.30 Record Date September 01, 2021 Payable Date September 16, 2021 See notes and definitions at end of document

Share Summary 31 VINP Shares 4Q ' 20 (Pre IPO) 1Q ' 21 2Q ' 21 Class B 14,466,239 14,466,239 14,466,239 Class A – Partnership Units 27,175,861 27,175,861 27,175,861 Class A - Public Float n.a 15,271,488 15,094,833 Common Shares 41,642,100 56,913,588 56,736,933 ▪ Common Shares Outstanding as of quarter end of 56.7 million shares. x Repurchased 176,655 common shares in the quarter, with an average share price of US$14.7. x Available authorization remaining was R$71.8 million at June 30,2021.
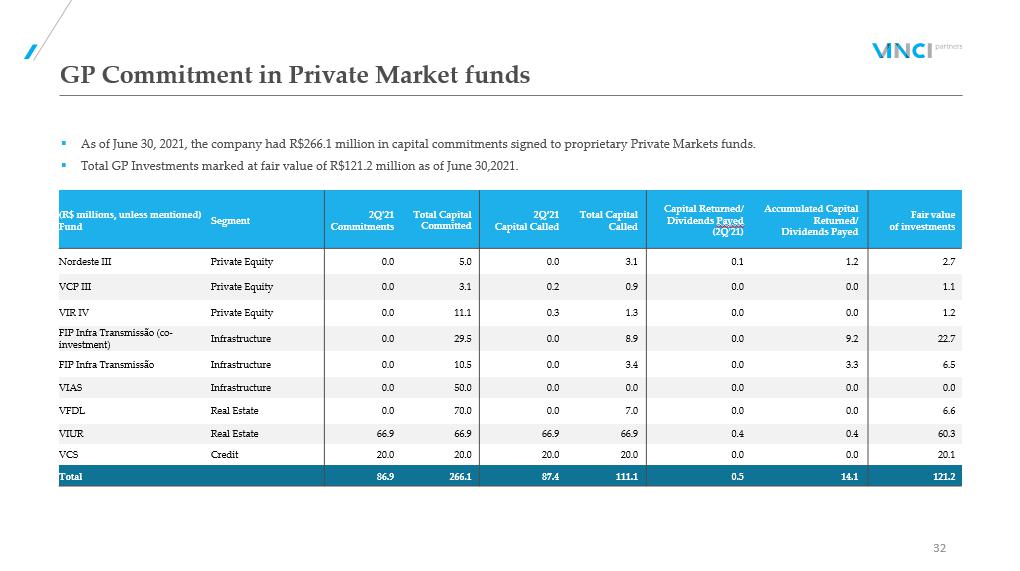
GP Commitment in Private Market funds 32 ▪ As of June 30, 2021, the company had R$266.1 million in capital commitments signed to proprietary Private Markets funds. ▪ Total GP Investments marked at fair value of R$121.2 million as of June 30,2021. (R$ millions, unless mentioned) Fund Segment 2Q ' 21 Commitments Total Capital Committed 2Q ’ 21 Capital Called Total Capital Called Capital Returned/ Dividends Payed (2Q ' 21) Accumulated Capital Returned/ Dividends Payed Fair value of investments Nordeste III Private Equity 0.0 5.0 0.0 3.1 0.1 1.2 2.7 VCP III Private Equity 0.0 3.1 0.2 0.9 0.0 0.0 1.1 VIR IV Private Equity 0.0 11.1 0.3 1.3 0.0 0.0 1.2 FIP Infra Transmissão (co - investment) Infrastructure 0.0 29.5 0.0 8.9 0.0 9.2 22.7 FIP Infra Transmissão Infrastructure 0.0 10.5 0.0 3.4 0.0 3.3 6.5 VIAS Infrastructure 0.0 50.0 0.0 0.0 0.0 0.0 0.0 VFDL Real Estate 0.0 70.0 0.0 7.0 0.0 0.0 6.6 VIUR Real Estate 66.9 66.9 66.9 66.9 0.4 0.4 60.3 VCS Credit 20.0 20.0 20.0 20.0 0.0 0.0 20.1 Total 86.9 266.1 87.4 111.1 0.5 14.1 121.2

Reconciliations and Disclosures 33
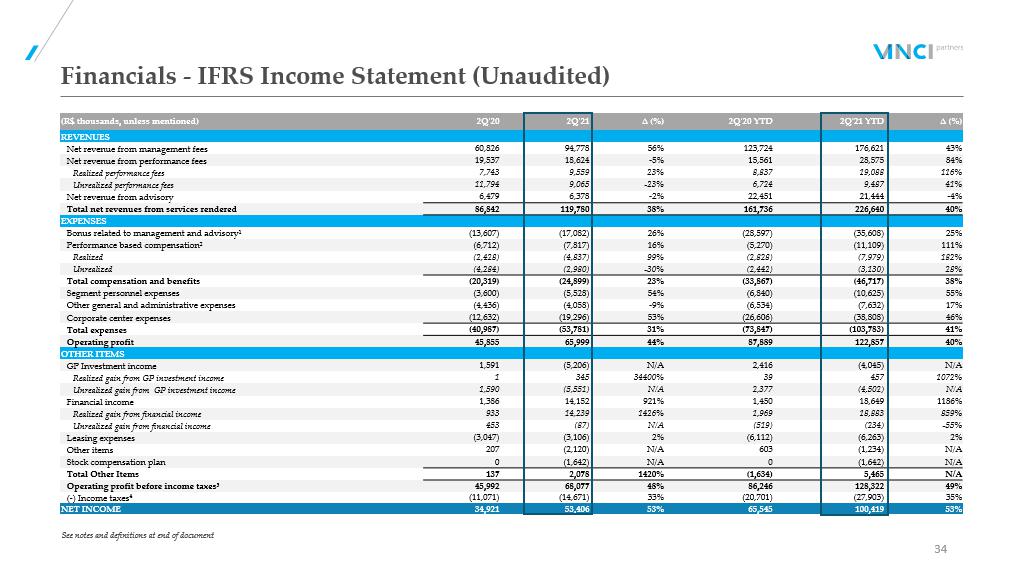
(R$ thousands, unless mentioned) 2Q'20 2Q'21 ∆ (%) 2Q'20 YTD 2Q'21 YTD ∆ (%) REVENUES Net revenue from management fees 60,826 94,778 56% 123,724 176,621 43% Net revenue from performance fees 19,537 18,624 - 5% 15,561 28,575 84% Realized performance fees 7,743 9,559 23% 8,837 19,088 116% Unrealized performance fees 11,794 9,065 - 23% 6,724 9,487 41% Net revenue from advisory 6,479 6,378 - 2% 22,451 21,444 - 4% Total net revenues from services rendered 86,842 119,780 38% 161,736 226,640 40% EXPENSES Bonus related to management and advisory¹ (13,607) (17,082) 26% (28,597) (35,608) 25% Performance based compensation² (6,712) (7,817) 16% (5,270) (11,109) 111% Realized (2,428) (4,837) 99% (2,828) (7,979) 182% Unrealized (4,284) (2,980) - 30% (2,442) (3,130) 28% Total compensation and benefits (20,319) (24,899) 23% (33,867) (46,717) 38% Segment personnel expenses (3,600) (5,528) 54% (6,840) (10,625) 55% Other general and administrative expenses (4,436) (4,058) - 9% (6,534) (7,632) 17% Corporate center expenses (12,632) (19,296) 53% (26,606) (38,808) 46% Total expenses (40,987) (53,781) 31% (73,847) (103,783) 41% Operating profit 45,855 65,999 44% 87,889 122,857 40% OTHER ITEMS GP Investment income 1,591 (5,206) N/A 2,416 (4,045) N/A Realized gain from GP investment income 1 345 34400% 39 457 1072% Unrealized gain from GP investment income 1,590 (5,551) N/A 2,377 (4,502) N/A Financial income 1,386 14,152 921% 1,450 18,649 1186% Realized gain from financial income 933 14,239 1426% 1,969 18,883 859% Unrealized gain from financial income 453 (87) N/A (519) (234) - 55% Leasing expenses (3,047) (3,106) 2% (6,112) (6,263) 2% Other items 207 (2,120) N/A 603 (1,234) N/A Stock compensation plan 0 (1,642) N/A 0 (1,642) N/A Total Other Items 137 2,078 1420% (1,634) 5,465 N/A Operating profit before income taxes³ 45,992 68,077 48% 86,246 128,322 49% ( - ) Income taxes 4 (11,071) (14,671) 33% (20,701) (27,903) 35% NET INCOME 34,921 53,406 53% 65,545 100,419 53% Financials - IFRS Income Statement (Unaudited) 34 See notes and definitions at end of document

(R$ thousands, unless mentioned) 2Q'20 2Q'21 2Q ´ 20 YTD 2Q ´ 21 YTD OPERATING PROFIT 45,855 65,999 87,889 122,857 ( - ) Net revenue from realized performance fees (7,743) (9,559) (8,837) (19,088) ( - ) Net revenue from unrealized performance fees (11,794) (9,065) (6,724) (9,487) (+) Compensation allocated in relation to performance fees¹ 6,712 7,817 5,270 11,109 FEE RELATED EARNINGS (FRE) 33,030 55,192 77,598 105,391 OPERATING PROFIT 45,855 65,999 87,889 122,857 ( - ) Net revenue from management fees (60,826) (94,778) (123,724) (176,621) ( - ) Net revenue from advisory (6,479) (6,378) (22,451) (21,444) (+) Bonus related to management and advisory² 13,607 17,082 28,597 35,608 (+) Personnel expenses 3,600 5,528 6,840 10,625 (+) Other general and administrative expenses 4,436 4,058 6,534 7,632 (+) Corporate center expenses 12,632 19,296 26,606 38,808 PERFORMANCE RELATED EARNINGS (PRE) 12,825 10,807 10,291 17,466 OPERATING PROFIT 45,855 65,999 87,889 122,857 ( - ) Net revenue from unrealized performance fees (11,794) (9,065) (6,724) (9,487) (+) Compensation allocated in relation to unrealized performance fees 4,284 2,980 2,442 3,130 (+) Realized gain from GP investment income 1 345 39 457 SEGMENT DISTRIBUTABLE EARNINGS 38,346 60,259 83,646 116,958 NET INCOME 34,921 53,406 65,545 100,419 ( - ) Net revenue from unrealized performance fees (11,794) (9,065) (6,724) (9,487) (+) Income tax from unrealized performance fees 1,360 124 775 173 (+) Compensation allocated in relation to unrealized performance fees 4,284 2,980 2,442 3,130 ( - ) Unrealized gain from GP investment income (1,590) 5,551 (2,377) 4,502 (+) Income tax on unrealized gain from GP investment income 541 (838) 808 (422) ( - ) Unrealized gain from financial income (453) 87 519 234 (+) Income tax on unrealized gain from financial income 154 (32) (176) (80) (+) Depreciation and amortization³ 0 926 0 1,865 (+) Stock compensation plan 0 1,642 0 1,642 DISTRIBUTABLE EARNINGS 27,422 54,781 60,812 101,976 TOTAL NET REVENUE FROM SERVICES RENDERED 86,842 119,780 161,736 226,640 ( - ) Net revenue from realized performance fees (7,743) (9,559) (8,837) (19,088) ( - ) Net revenue from unrealized performance fees (11,794) (9,065) (6,724) (9,487) NET REVENUE FROM MANAGEMENT FEES AND ADVISORY 67,305 101,156 146,175 198,065 Financials - Non - GAAP Reconciliation 35 See notes and definitions at end of document
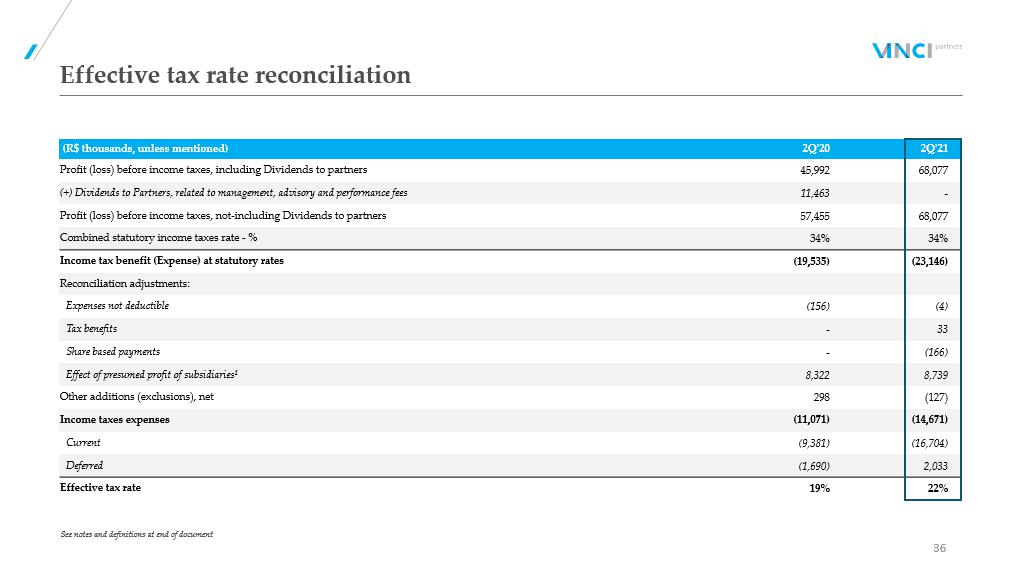
(R$ thousands, unless mentioned) 2Q'20 2Q'21 Profit (loss) before income taxes, including Dividends to partners 45,992 68,077 (+) Dividends to Partners, related to management, advisory and performance fees 11,463 - Profit (loss) before income taxes, not - including Dividends to partners 57,455 68,077 Combined statutory income taxes rate - % 34% 34% Income tax benefit (Expense) at statutory rates (19,535) (23,146) Reconciliation adjustments: Expenses not deductible (156) (4) Tax benefits - 33 Share based payments - (166) Effect of presumed profit of subsidiaries¹ 8,322 8,739 Other additions (exclusions), net 298 (127) Income taxes expenses (11,071) (14,671) Current (9,381) (16,704) Deferred (1,690) 2,033 Effective tax rate 19% 22% Effective tax rate reconciliation See notes and definitions at end of document 36
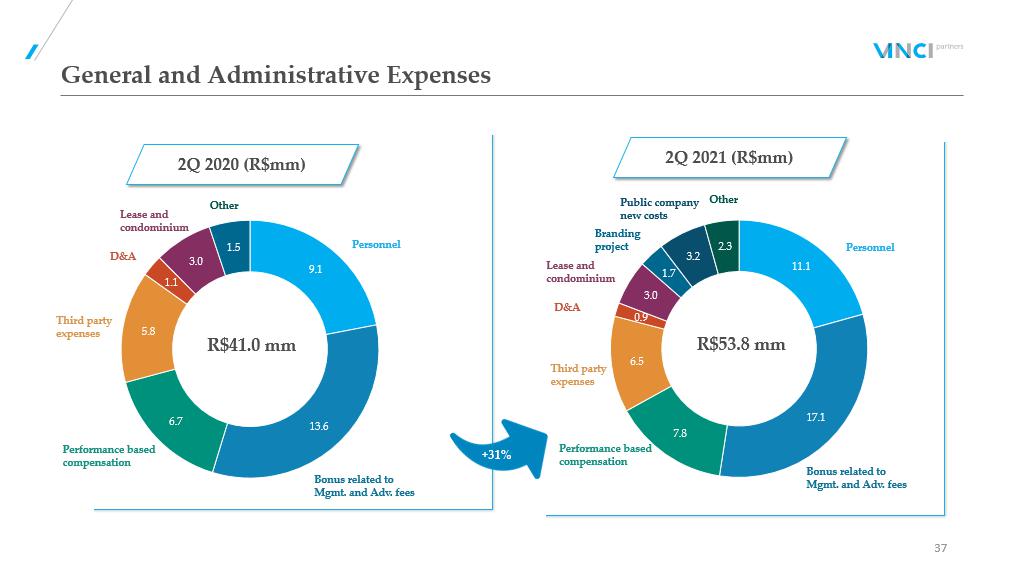
9.1 13.6 6.7 5.8 1.1 3.0 1.5 General and Administrative Expenses 37 Personnel Bonus related to Mgmt. and Adv. fees Performance based compensation Third party expenses Lease and condominium D&A Branding project Public company new costs Other R$53.8 mm Personnel Bonus related to Mgmt. and Adv. fees Performance based compensation Third party expenses Lease and condominium D&A Other R$41.0 mm +31% 2Q 2020 (R$mm) 2Q 2021 (R$mm) 11.1 17.1 7.8 6.5 0.9 3.0 1.7 3.2 2.3
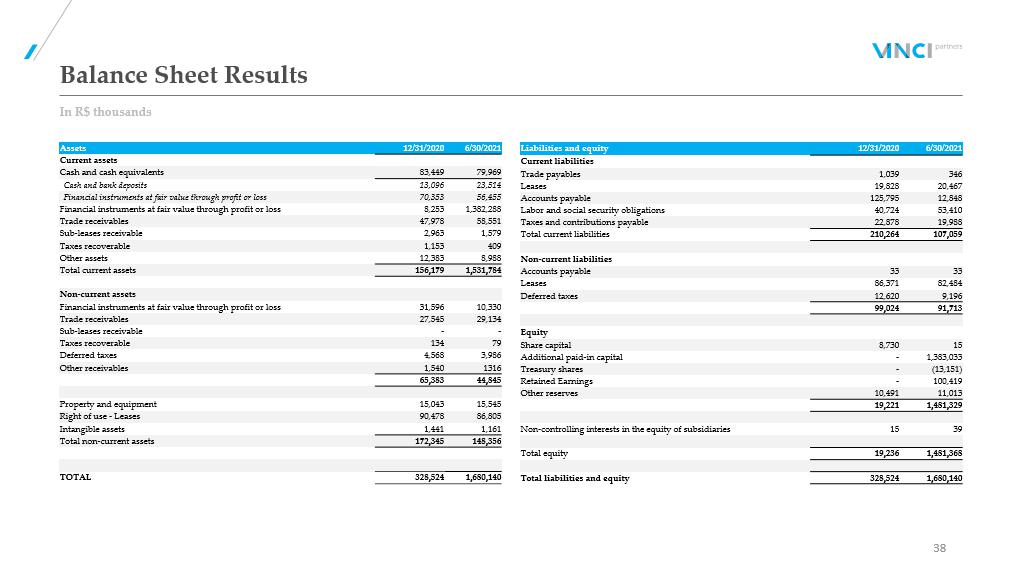
Balance Sheet Results In R$ thousands 38 Assets 12/31/2020 6/30/2021 Current assets Cash and cash equivalents 83,449 79,969 Cash and bank deposits 13,096 23,514 Financial instruments at fair value through profit or loss 70,353 56,455 Financial instruments at fair value through profit or loss 8,253 1,382,288 Trade receivables 47,978 58,551 Sub - leases receivable 2,963 1,579 Taxes recoverable 1,153 409 Other assets 12,383 8,988 Total current assets 156,179 1,531,784 Non - current assets Financial instruments at fair value through profit or loss 31,596 10,330 Trade receivables 27,545 29,134 Sub - leases receivable - - Taxes recoverable 134 79 Deferred taxes 4,568 3,986 Other receivables 1,540 1316 65,383 44,845 Property and equipment 15,043 15,545 Right of use - Leases 90,478 86,805 Intangible assets 1,441 1,161 Total non - current assets 172,345 148,356 TOTAL 328,524 1,680,140 Liabilities and equity 12/31/2020 6/30/2021 Current liabilities Trade payables 1,039 346 Leases 19,828 20,467 Accounts payable 125,795 12,848 Labor and social security obligations 40,724 53,410 Taxes and contributions payable 22,878 19,988 Total current liabilities 210,264 107,059 Non - current liabilities Accounts payable 33 33 Leases 86,371 82,484 Deferred taxes 12,620 9,196 99,024 91,713 Equity Share capital 8,730 15 Additional paid - in capital - 1,383,033 Treasury shares - (13,151) Retained Earnings - 100,419 Other reserves 10,491 11,013 19,221 1,481,329 Non - controlling interests in the equity of subsidiaries 15 39 Total equity 19,236 1,481,368 Total liabilities and equity 328,524 1,680,140
Notes and Definitions 39 ▪ Notes to page 5 (1) AUM is calculated as consolidated with double counting, due to funds from one segment investing in other segments and it ´ s eliminated on consolidation and excluding VIFI from Credit and Pension Products Co - managed with IP&S from Equities. (2) CAGR is calculated considering AUM without double counting. ▪ Notes to page 7 (1) Bonus compensation related to management and advisory includes Dividends to Partners related to management and advisory, dis tributed by the company to its original partners before the company turned public in 2021. (2) FRE per share was calculated considering the same number of outstanding shares at the end of the quarter of 56,736,933. (3) Performance based compensation includes Dividends to Partners related to performance fees, distributed by the company to its original partners before the company turned public in 2021. (4) Depreciation and amortization is a non - cash expense that is being added back for our calculation of Distributable Earnings f or the year ended December 31, 2020, and future periods. Our Distributable Earnings for the quarter and six months ended June 30, 2020, would have been R$28.6 million and R$63.2 million, re spectively, if we did add back depreciation and amortization to our calculation of Distributable Earnings. (5) For comparison purposes, DE per share was calculated considering the same number of outstanding shares from the end of th e 2 Q’21 of 56,736,933. ▪ Notes to page 10 (1) Long - term AUM includes funds with lockups for at least five years to quasi - perpetual capital commitments. ▪ Notes to page 11 (1) Long term products include funds with former lockups superior to five years. (2) Private markets strategies include Private Equity, Real Estate, Credit and Infrastructure. ▪ Notes to page 12 (1) International mandates have several different benchmarks across its vehicles. (2) The preferred return w/ catch - up rule applies to funds for which the vehicle must pay back its limited partners 100% of the invested capital corrected by the preferred return rate so it can charge performance fees. Once the preferred return rate is achieved, due to the catch - up clause, performance fees are charged ov er the absolute return of the fund instead of the excess return over the preferred rate .

Notes and Definitions (cont’d.) 40 (3) Hurdle Rate is the minimum return the fund must achieve before it can charge performance fees. In most cases, funds with hur dle rate also are under a high - water mark clause . (4) Funds with preferred return must return 100% of invested capital corrected by the preferred return rate to its limited pa rtn ers in order to charge performance fees. (5) IPCA is a broad consumer price index measured by the IBGE. (6) IMAB 5 is composed by government bonds indexed to IPCA with up to 5 years in duration. (7) IBOV is the Brazilian stock market's most relevant index; (8) FTSE is London's stock market most relevant index. (9) IFIX is an index composed by listed REITs in the brazilian stock exchange. (10) The CDI rate is a result of the average interbank overnight rates in Brazil (daily average for the period). (11) IMAB is composed by government bonds indexed to IPCA. ▪ Notes to page 14 (1) Public company new recurring costs include personnel expenses such as changes made in the company’s compensation structur e a fter the IPO, new hirings for our board of directors, support teams such as Investor Relations and Financial Reporting, and other expenses such as audit and Nasdaq fees. (2) Vinci Partners started a new branding project that will take place throughout 2021 to increase brand awareness among inve sto rs, especially to retail investors. (3) Fixed costs are calculated as total G&A expenses less personnel and profit sharing costs. ▪ Notes to page 15 (1) Comparable FRE is calculated as FRE 2Q'21 less public company new recurring costs and branding project costs for the quar ter . (2) Public company new recurring costs include personnel expenses such as changes made in the company’s compensation structur e a fter the IPO, new hirings for our board of directors, support teams such as Investor Relations and Financial Reporting, and other expenses such as audit and Nasdaq fees. (3) Vinci Partners started a new branding project that will take place throughout 2021 to increase brand awareness among inve sto rs, especially to retail investors. (4) FRE per share was calculated considering the same number of outstanding shares at the end of the 2Q'21 of 56,736,933. ▪ Notes to page 16 (1) For comparison purposes, PRE per share was calculated considering the same number of outstanding shares from the end of t he 2Q'21 of 56,736,933.
Notes and Definitions (cont’d.) 41 ▪ Notes to page 17 (1) GP investment income comes from proprietary investments made by Vinci Partners in its own Private Markets’ funds. (2) Financial income is income generated through investments made with our cash and cash equivalents in cash and bank deposit s, certificate of deposits and proprietary investments in Vinci Partners’ Liquid Funds, including funds from Public Equities, Hedge Funds, Real Estate and Credit. (3) Back test result between January 2016 and March 2021. The result from the 2Q’21 onwards is the effective return of the ca sh allocation. ▪ Notes to page 18 (1) For comparison purposes, DE per share was calculated considering the same number of outstanding shares from the end of th e 2 Q’21 of 56,736,933. ▪ Notes to page 19 (1) Cash and cash equivalents include certificate of deposits and federal bonds. Certificate of deposits are issued by Banco Bra desco (credit rating AAA evaluated by Fitch Ratings) with interest rates variable from 99.5% to 101% of CDI (interback deposit rate). The certificates are readily convertible to known am ounts of cash and which are subject to an insignificant risk of changes in value. (2) Liquid funds’ value are calculated as investment at fair value as of June 30, 2021, in liquid funds from Vinci Partners’ pub lic equities, hedge funds, credit segments and listed REITs. It also comprises the cash and certificate of deposits and federal bonds from Vinci Monalisa FIM. For more detail, see 2Q’21 Financia l S tatements filed within the SEC on August 18, 2021. (3) GP Fund Investments include Vinci Partners’ GP investments in private market funds, calculated at fair value as of June 3 0, 2021. For more detail, please see slide 32 and the Financial Statements filed within the SEC on August 18, 2021. (4) Cash and Net Investments per share were calculated considering the number of outstanding shares at the end of each quarte r. ▪ Notes to page 28 (1) NAV is the net asset value of each fund. For listed vehicles, the NAV represents the Market valuation of the fund. (2) Atlas strategy includes the funds Atlas FIC FIM and Atlas Institucional FIC FIM. (3) Equilibrio Strategy incudes the IP&S Family of pension plans. (4) CDI is an average of interbank overnight rates in Brazil(daily average for the period). (5) Brazil stock market most relevant index. (6) IPCA is a broad consumer price index measured by the IBGE. (7) IMAB is composed by government bonds indexed to IPCA. IMAB 5 also includes government bonds indexed to IPCA with up to 5 Yea rs in duration.

Notes and Definitions (cont’d.) 42 (8) IFIX is an index composed by listed REITs in the brazilian stock Market. ▪ Notes to page 29 (1) Track record information is presented throughout this presentation on a pro forma basis and in local currency, excluding PIP E investments, a strategy that will be discontinued in VCP III. Past performance of investments described herein is provided for illustrative purposes only and is not necessarily indicative of VCP II or VCP III’s future investment results. (2) Total commitments for VCP III include R$1.3 billion in co - investments . ▪ Notes to page 30 (1) US$ Distributable Earnings was calculated considering the exchange rate from USD to BRL of 5.2574, as of August 13, 2021 whe n dividends were approved by our Board of Directors. ▪ Notes to page 34 (1) Bonus compensation related to management and advisory includes Dividends to Partners related to management and advisory, dis tri buted by the company to its original partners before the company turned public in 2021. (2) Performance based compensation includes Dividends to Partners related to performance fees, distributed by the company to its original partners before the company turned public in 2021. (3) Profit before income taxes includes Dividends to partners related to management, advisory and performance fees, distribut ed by the company to its original partners before the company turned public in 2021. (4) Income taxes are comprised of taxes calculated over our corporate income tax and social contribution taxes. We are taxed on an actual taxable profit regime, while our subsidiaries are taxed based on deemed profit. Dividends to partners distributed by the company to its original partners before turned public in 2021 are not included in actual taxable regime. ▪ Notes to page 35 (1) Performance based compensation includes Dividends to Partners related to performance fees, distributed by the company to its original partners before the company turned public in 2021. (2) Bonus compensation related to management and advisory includes Dividends to Partners related to management and advisory, dis tributed by the company to its original partners before the company turned public in 2021. (3) Depreciation and amortization is a non - cash expense that is being added back for our calculation of Distributable Earnings f or the year ended December 31, 2020, and future periods. ▪ Notes to page 36 (1) Brazilian tax law establishes that companies that generate gross revenues of up to R$ 78,000 in the prior fiscal year may ca lculate income taxes as a percentage of gross revenue, using the presumed profit income tax regime. The Entity's subsidiaries adopted this tax regime and the effect of the presumed profit of su bsidiaries represents the difference between the taxation based on this method and the amount that would be due based on the statutory rate applied to the taxable profit of the subsid iar ies.
Notes and Definitions (cont’d.) 43 ▪ “Fee related earnings”, or “FRE”, is a metric to monitor the baseline performance of, and trends in, our business, in a manne r t hat does not include performance fees or investment income. We calculate FRE as operating profit less (a) net revenue from realized performance fees, less (b) net revenue from u nre alized performance fees, plus (c) compensation allocated in relation to performance fees. ▪ “FRE Margin” is calculated as FRE over total net management and advisory fees. ▪ “Distributable Earnings”, or “DE”, is used as a reference point by our board of directors for determining the amount of earni ngs available to distribute to shareholders as dividends. Distributable Earnings is calculated as profit for the year, less (a) net revenue from unrealized performance fees, plus (b) inc ome taxes from unrealized performance fees, plus (c) compensation allocated in relation to unrealized performance fees, less (d) unrealized gain from GP investment income, less ( e) unrealized gain from financial income, plus (f) income taxes on unrealized gain from GP investment income, plus (g) income taxes on unrealized gain from financial income. ▪ “DE Margin” is calculated as DE over the sum of management and advisory fee related revenues, realized performance revenue, r eal ized GP investment income and realized financial income, net of revenue tax. ▪ “Performance Related Earnings”, or “PRE”, is a performance measure that we use to assess our ability to generate profits from re venue that relies on outcome from funds above their respective benchmarks. We calculate PRE as operating profit, less (a) net revenue from fund management and advisory, less (b) op erating expenses, such as segment personnel, G&A, corporate center and bonus related to management and advisory.. ▪ “Segment Distributable Earnings” is Vinci Partners’ segment profitability measure used to make operating decisions and assess pe rformance across the company’s four segments (Private Markets, Liquid Strategies, Investment Products and Solutions and Financial Advisory). Segment Distributable Earnings is calc ula ted as operating profit less (a) net revenue from unrealized performance fees, plus (b) compensation allocated in relation to unrealized performance fees, plus (c) realized ga in from GP investment income. ▪ “AUM” refers to assets under management. Our assets under management equal the sum of: (1) the fair market value of the inves tme nts held by funds plus the capital that we are entitled to call from investors in those funds pursuant to the terms of their capital commitments to those funds (plus the fair market va lue of co - investments arranged by us that were made or could be made by limited partners of our corporate private equity funds and portfolio companies of such funds); (2) the net a sse t value of our public equity funds, hedge funds and closed - end mutual funds; and (3) the amount of capital raised for our credit funds. AUM includes double counting related to fund s from one segment that invest in funds from another segment. Those cases occur mainly due to (a) fund of funds of investment products and solutions segment, and (b) investment f und s in general that invest part of their cash in credit segment and hedge fund segment funds in order to maintain liquidity and provide for returns on cash. Such amounts are elimina ted on consolidation. The bylaws of the relevant funds prohibit double - charging fees on AUM across segments. Therefore, while our AUM by segment may double - count funds from one segmen t that invest in funds from another segment, the revenues for any given segment do not include revenue in respect of assets managed by another segment, which means there are no intercompany eliminations on revenues in our results of operations.

Notes and Definitions (cont’d.) 44 ▪ Net Cash and Investments include cash and cash equivalents and the fair value of investments in liquid funds and GP Fund Inve stm ents. Cash and cash equivalents include cash, certificate of deposits, which are issued by Banco Bradesco (credit rating AAA evaluated by Fitch Ratings) with interest rate s f rom 99.5% to 101% of CDI. ▪ “Net revenue from Fund Management and Advisory” is a performance measure that we use to assess our ability to generate profit s f rom our fund management and advisory business without measuring for the outcomes from funds above their respective benchmarks. We calculate Net Revenue from Fund Managemen t a nd Advisory as net revenue from services rendered less (a) net revenue from realized performance fees and less (b) net revenue from unrealized performance fees. ▪ “Total compensation and benefits” is the result of the profit sharing paid to our employees as (a) bonus compensation related to management advisory and (b) performance based compensation. Total compensation and benefits include Dividends to Partners, distributed by the company to its original partn ers before the public turned public in 2021. In accordance with the by - laws of Vinci Brazil, dividends have historically been distributed based on the resolution of the partners. Therefor e, dividends could be distributed on a non - proportional basis among quotaholders, which are comprised by the partners of Vinci Brazil. After the company’s IPO, Vinci Partners change d i ts compensation structure, from a dividend distribution policy to a profit - sharing scheme our partners. ▪ “Segment personnel expenses” are composed of the salary - part compensation paid to employees and partners of our funds’ managemen t teams. ▪ “Corporate center expenses” are composed by the salary - compensation paid to employees and other general and administrative expen ses related to our support teams, such as research, risk, legal & compliance, investor relations, operations and ESG. ▪ “Other general and administrative expenses” is made up of third - party expenses, depreciation and amortization, travel and repres entation, marketing expenses, administrative fees, non - operating taxes, third - party consultants’ fees, such as legal and accounting, and office consumables. ▪ “GP investment income” is income from proprietary investments made by us in our own Private Markets’ funds, used as GP Commit men ts. ▪ “Financial income” is income generated through the investments made with our cash and cash equivalents in cash and bank depos its , certificate of deposits and proprietary investments in our Liquid Funds from our public equities and hedge funds’ segments and listed REITs from our real estate segment. ▪ “Leasing expenses” include costs from the company’s sub - leasing activities. ▪ “Income taxes” is comprised of taxes on our corporate income tax and social contribution taxes. We are taxed on an actual tax abl e profit regime, while our subsidiaries are taxed based on deemed profit. Dividends to partners distributed by the company to its original partners before turned public in 2021 are not in cluded in actual taxable regime.
Notes and Definitions (cont’d.) 45 ▪ “Capital Subscription / (capital return)” represents the net capital commitments and capital returns from our Private Markets ’ c losed end and listed funds. ▪ “Net Inflows / (outflows)” represent the net inflows and outflows from our liquid funds from our liquid strategies, IP&S and cre dit segments. ▪ “Appreciation / (depreciation)” represents the net capital appreciation/depreciation from our funds, which refers to the incr eas e or decrease of the funds’ investment’s value. ▪ “MOIC” means multiple on invested capital, a ratio intended to represent how much value an investment has returned, and is ca lcu lated as realized value plus unrealized value, divided by the total amount invested, gross of expenses and fees. ▪ “IRR” means the internal rate of return, which is a discount rate that makes the net present value of all cash flows equal to ze ro in a discounted cash flow analysis.

Funds/strategies’ descriptions 46 ▪ Vinci Multiestratégia: The fund seeks to achieve long - term returns by investing in fixed income assets, through strategies that imply interest rates and currency risks. ▪ Vinci Atlas: The fund seeks to achieve long - term returns by investing across all strategies within fixed income, equities, curre ncy, derivatives, commodities and other investment funds with no obligation of any class concentration. ▪ Vinci Mosaico FIA: Public Equities’ long only flagship strategy. The strategy seeks to achieve long - term returns above Brazilian equities market ( Ibovespa ) based on a fundamental analysis. ▪ Vinci Gas Dividendos : Public Equities’ dividends flagship strategy. The strategy seeks to achieve long - term returns by investing in companies with a consistent history of paying dividends in the Brazilian stock market. ▪ Vinci Total Return: The fund seeks to achieve medium and long - term returns by investing most of its capital in the Brazilian sto ck market, through bottom up and top - down strategies. ▪ Vinci Valorem: IP&S flagship commingled fund with exposure to fixed income assets, foreign exchange currency and derivatives. ▪ Equilibrio Strategy: IP&S family of pension plan funds. The strategy seeks to achieve long - term returns by investing across all strategies within fixed income, equities, currency, derivatives, commodities and other investment funds, respecting limitations in regulation. ▪ Vinci Selection Equities: The fund seeks to beat the Brazilian stock market index by investing in other funds that invest in Bra zilian public equities. ▪ Vinci Crédito Imobiliário I: The fund seeks to achieve long - term returns by investing in real estate mortgage - backed credit secu rity bonds. ▪ Vinci Crédito Estruturado Multiestratégia PLUS FIC FIM: The fund seeks to achieve consistent returns by investing in private str uctured credit bonds. ▪ VISC11: Shopping malls listed REIT, focused on acquiring income - generating shopping malls in Brazil. ▪ VILG11: Industrial listed REIT focused on acquiring mature income - generating industrial properties in Brazil. ▪ VINO11: Listed REIT focused on acquiring mature income - generating boutique office real estate assets in Brazil. ▪ VIF11: Listed REIT that invests in other listed REITs and real estate mortgage - backed credit security bonds. ▪ VIUR11: perpetual capital listed REIT, focused on income generation to its quotaholders through the acquisition of urban comm erc ial properties in Brazil, such as street retail, grocery, healthcare, and educational focused real estate properties.
Rio de Janeiro 55 21 2159 6000 Av. Bartolomeu Mitre, 336 Leblon - 22431 - 002 São Paulo 55 11 3572 3700 Av. Brigadeiro Faria Lima, 2.277 14 o andar Jardim Paulistano - 01452 - 000 N ew York 1 646 559 8000 780 Third Avenue, 25 th Floor 10017 Recife 55 81 3204 6811 Av. República do Líbano, 251 - Sala 301 Torre A - Pina - 51110 - 160 47