Exhibit 99.1
FEDERAL DEPOSIT INSURANCE CORPORATION
Washington, D.C. 20429
FORM 10-K
x ANNUAL REPORT PURSUANT TO SECTION 13 OR 15(d) OF THE SECURITIES EXCHANGE ACT OF 1934
For the fiscal year ended December 31, 2019
¨ TRANSITION REPORT PURSUANT TO SECTION 13 OR 15(d) OF THE SECURITIES EXCHANGE ACT OF 1934
For the transition period from ________________ to
Commission file number: N/A
CARTER BANK & TRUST
(Exact name of registrant as specified in its charter)
| Virginia | | 20-5539935 |
(State or other jurisdiction of
incorporation or organization) | | (I.R.S. Employer Identification No.) |
| | | |
| 1300 Kings Mountain Road, Martinsville, Virginia | | 24112 |
(Address of principal executive offices) | | (Zip Code) |
Registrant’s telephone number, including area code: (276) 656-1776
Securities registered pursuant to Section 12(b) of the Act:
| Title of each class | Trading Symbol(s) | Name of each exchange on which registered |
| Common Stock, $1 par value | CARE | Nasdaq Global Select Market |
Securities registered pursuant to Section 12(g) of the Act:
None
Indicate by check mark if the registrant is a well-known seasoned issuer, as defined in Rule 405 of the Securities Act. Yes ¨ No x
Indicate by check mark if the registrant is not required to file reports pursuant to Section 13 or Section 15(d) of the Act. Yes ¨ No x
Indicate by check mark whether the registrant (1) has filed all reports required to be filed by Section 13 or 15(d) of the Securities Exchange Act of 1934 during the preceding 12 months (or for such shorter period that the registrant was required to file such reports), and (2) has been subject to such filing requirements for the past 90 days. Yes x No ¨
Indicate by check mark whether the registrant has submitted electronically every Interactive Data File required to be submitted pursuant to Rule 405 of Regulation S-T (§ 232.405 of this chapter) during the preceding 12 months (or for such shorter period that the registrant was required to submit such files). Yes ¨ No ¨
Indicate by check mark whether the registrant is a large accelerated filer, an accelerated filer, a non-accelerated filer, a smaller reporting company, or an emerging growth company. See the definitions of “large accelerated filer,” “accelerated filer,” “smaller reporting company,” and “emerging growth company” in Rule 12b-2 of the Exchange Act.
| Large accelerated filer ¨ | Accelerated filer x | Emerging growth company ¨ |
| Non-accelerated filer ¨ | Smaller reporting company ¨ | |
If an emerging growth company, indicate by check mark if the registrant has elected not to use the extended transition period for complying with any new or revised financial accounting standards provided pursuant to Section 13(a) of the Exchange Act. ¨
Indicate by check mark whether the registrant is a shell company (as defined in Rule 12b-2 of the Act). Yes ¨ No x
The aggregate market value of Carter Bank & Trust’s common stock held by non-affiliates, computed by reference to the price at which the common stock was last sold, or the average bid and asked price of such common stock, as of June 30, 2019 was $484,136,451.
There were 26,384,801 shares of common stock of Carter Bank & Trust outstanding as of June 2, 2020.
DOCUMENTS INCORPORATED BY REFERENCE
TABLE OF CONTENTS
| PART I |
| | | | |
| Item 1. | Business. | | 3 |
| Item 1A. | Risk Factors. | | 15 |
| Item 1B. | Unresolved Staff Comments. | | 28 |
| Item 2. | Properties. | | 28 |
| Item 3. | Legal Proceedings. | | 28 |
| Item 4. | Mine Safety Disclosures. | | 28 |
| | | | |
| PART II |
| | | | |
| Item 5. | Market for Registrant’s Common Equity, Related Stockholder Matters and Issuer Purchases of Equity Securities. | | 29 |
| Item 6. | Selected Financial Data. | | 31 |
| Item 7. | Management’s Discussion and Analysis of Financial Condition and Results of Operations. | | 32 |
| Item 7A. | Quantitative and Qualitative Disclosures About Market Risk. | | 73 |
| Item 8. | Financial Statements and Supplementary Data. | | 75 |
| Item 9. | Changes in and Disagreements With Accountants on Accounting and Financial Disclosure. | | 129 |
| Item 9A. | Controls and Procedures. | | 129 |
| Item 9B. | Other Information. | | 130 |
| | | | |
| PART III |
| | | | |
| Item 10. | Directors, Executive Officers and Corporate Governance. | | 131 |
| Item 11. | Executive Compensation. | | 137 |
| Item 12. | Security Ownership of Certain Beneficial Owners and Management and Related Stockholder Matters. | | 153 |
| Item 13. | Certain Relationships and Related Transactions, and Director Independence. | | 154 |
| Item 14. | Principal Accounting Fees and Services. | | 156 |
| | | | |
| PART IV |
| | | | |
| Item 15. | Exhibits, Financial Statement Schedules. | | 157 |
| Item 16. | Form 10-K Summary. | | 159 |
CARTER BANK & TRUST
PART I
ITEM 1. BUSINESS
General
Carter Bank & Trust (the “Bank”) is a non-member state Bank headquartered in Martinsville, Virginia with assets of $4.0 billion at December 31, 2019. The Bank operates branches in Virginia and North Carolina and is the fourth largest state chartered commercial banks headquartered in Virginia, operating 101 branches across both states.
The Bank provides a full range of financial services with retail, commercial banking products and insurance products. Our common stock began trading on Nasdaq Global Select Market (“NASDAQ”) effective March 25, 2019, under the ticker symbol “CARE.” Prior to March 25, 2019, our common stock traded on the Over the Counter (“OTCQX”) Best Market under the ticker symbol “CARE.”
The Bank earns revenue primarily from interest on loans and securities and fees charged for financial services provided to our customers. The Bank incurs expenses for the cost of deposits, provision for loan losses and other operating costs such as salaries and employee benefits, data processing, occupancy and tax expense.
Our mission is that the Bank strives to be the preferred lifetime financial partner for our customers and shareholders, and the employer of choice in the communities the Bank is privileged to serve. Our strategic plan focuses on restructuring the balance sheet to provide more diversification and higher yielding assets and to change the mix of deposits to increase the net interest margin. Another area of focus is the transformation of our infrastructure of the Bank to provide a foundation for operational efficiency and provide new products and services for our customers that will ultimately increase noninterest income.
Our focus continues to be on loan and deposit growth with a shift in the composition of deposits to more low cost core deposits with less dependence on higher cost certificates of deposits. Additionally, the Bank is implementing strategies to increase fee income while closely monitoring our operating expenses. The Bank is focused on executing our strategy to successfully build our brand and grow our business in our markets. The Bank’s net interest margin has improved due to our strategy to deploy our excess cash into higher yielding and diversified investment securities and loan growth, as well as the runoff of higher cost deposits.
The Bank offers a full range of deposit services including LIFETIME FREE CHECKING, interest checking accounts, savings accounts, retirement accounts and other deposit accounts of various types, ranging from money market accounts to longer-term certificates of deposits. These products and services are available to our personal and business customers. The transaction accounts and time certificates of deposits are tailored to each of the Bank's principal markets at competitive rates. All deposit accounts are insured by the Federal Deposit Insurance Corporation ("FDIC") up to the maximum amount allowed by law. The Dodd-Frank Act, signed into law on July 21, 2010, makes permanent the $250,000 limit for federal deposit insurance and the coverage limit applies per depositor, per insured depository institution for each account ownership.
The Bank also offers a full range of commercial and personal loans. Commercial loans include both secured and unsecured loans. Consumer loans include secured and unsecured loans for financing automobiles, home improvements, education and personal investments. The Bank also makes real estate construction and acquisition loans, and originates and holds fixed and variable rate mortgage loans. In addition, the Bank now offers home equity lines of credit to its customers.
CARTER BANK & TRUST
ITEM 1. BUSINESS (continued)
The Bank's lending activities are subject to a variety of lending limits imposed by federal law. While differing limits apply in certain circumstances based on the type of loan or the nature of the borrower (including the borrower's relationship to the Bank), in general the Bank is subject to a “loan to one” borrower limit of an amount equal to 15% of the Bank's unimpaired capital and surplus. The Bank may not make loans to any director, officer, employee or 10% shareholder of the Bank unless the loan is approved by the Board of Directors and is made on terms not more favorable than are made available to a person not affiliated with the Bank.
Other bank services include safe deposit boxes, direct deposit of payroll and social security checks, online banking, bill pay, mobile banking, debit cards, e-statements, and automated drafts for various accounts. Treasury services are also available to our business customers. The Bank has no current plans to exercise trust powers.
The Bank has one wholly owned subsidiary, CB&T Investment Company (“the investment company”), which was chartered effective April 1, 2019. The investment company was formed to hold and manage a group of investments previously owned by the Bank and to provide additional latitude to purchase other investments. Formerly, the Bank owned Mortgage Company of Virginia who owned 100% of Bank Services of Virginia and Bank Services Insurance, Inc. Mortgage Company of Virginia was terminated and dissolved on December 11, 2018. Bank Services of Virginia was terminated and dissolved on July 10, 2018. Bank Services Insurance, Inc. was sold in January of 2018.
Employees
As of December 31, 2019, the Bank and its subsidiary had 977 full-time equivalent employees.
Competition
The Bank experiences significant competition in attracting depositors and borrowers. Competition in lending activities comes principally from other commercial banks, savings associations, insurance companies, governmental agencies, credit unions, and brokerage firms. Competition for deposits comes from other commercial banks, savings associations, money market and mutual funds, credit unions, insurance companies and brokerage firms. Some of the financial organizations competing with the Bank have greater financial resources than the Bank. Certain of these financial organizations also have greater geographic coverage and some offer bank and bank-related services which the Bank does not offer.
Supervision and Regulation
General. Financial institutions are extensively regulated under federal and state law. Consequently, the growth and earnings performance of the Bank can be affected not only by management decisions and general economic conditions, but also by the statutes administered by, and the regulations and policies of, various governmental regulatory authorities including, but not limited to, the Virginia Bureau of Financial Institutions (the “Bureau”), the FDIC, the Federal Reserve Board (“FRB”), the Internal Revenue Service (“IRS”), federal and state taxing authorities, and the Securities and Exchange Commission (“SEC”). The effect of such statutes, regulations and policies can be significant, and cannot be predicted with a high degree of certainty.
CARTER BANK & TRUST
ITEM 1. BUSINESS (continued)
The Bank is subject to supervision, regulation and examination by the Bureau and the Bank’s primary federal regulator, the FDIC. Federal and state laws and regulations generally applicable to financial institutions regulate, among other things, the scope of business, investments, reserves against deposits, capital levels relative to operations, the nature and amount of collateral for loans, the establishment of branches, mergers, consolidations and dividends.
The system of supervision and regulation applicable to the Bank establishes a comprehensive framework for its operations and is intended primarily for the protection of the FDIC’s deposit insurance funds and the depositors, rather than the shareholders of the Bank.
Finally, the Bank is subject to the periodic reporting requirements of the Securities Exchange Act of 1934, as amended, including, but not limited to, filing annual, quarterly and other current reports with the FDIC. The Bank is not a member of the FRB System.
The following references to material statutes and regulations affecting the Bank are brief summaries and do not purport to be complete, and are qualified in their entirety by reference to such statutes and regulations. Any change in applicable law or regulations may have a material effect on the business of the Bank.
Regulatory Reform. The financial crisis of 2008, including the downturn of global economic, financial and money markets and the threat of collapse of numerous financial institutions, and other events led to the adoption of numerous laws and regulations that apply to, and focus on, financial institutions. The most significant of these laws is the Dodd-Frank Act Wall Street Reform and Consumer Protection Act (the “Dodd-Frank Act”), which was enacted on July 21, 2010 and, in part, was intended to implement significant structural reforms to the financial services industry.
The Dodd-Frank Act implemented far-reaching changes across the financial regulatory landscape, including changes that have significantly affected the business of all bank holding companies and banks, including the Bank. Some of the rules that have been proposed and, in some cases, adopted to comply with the Dodd-Frank Act's mandates are discussed further below. In May 2018, the Economic Growth, Regulatory Relief and Consumer Protection Act (the “EGRRCPA”) was enacted to reduce the regulatory burden on certain banking organizations, including community banks, by modifying or eliminating certain federal regulatory requirements. While the EGRRCPA maintains most of the regulatory structure established by the Dodd-Frank Act, it amends certain aspects of the regulatory framework for small depository institutions with assets of less than $10 billion as well as for larger banks with assets above $50 billion. In addition, the EGRRCPA included regulatory relief for community banks regarding regulatory examination cycles, call reports, application of the Volcker Rule (proprietary trading prohibitions), mortgage disclosures, qualified mortgages, and risk weights for certain high-risk commercial real estate loans. However, federal banking regulators retain broad discretion to impose additional regulatory requirements on banking organizations based on safety and soundness and U.S. financial system stability considerations.
The Bank continues to experience ongoing regulatory reform. These regulatory changes could have a significant effect on how the Bank conducts its business. The specific implications of the Dodd-Frank Act, the EGRRCPA, and other potential regulatory reforms cannot yet be fully predicted and will depend to a large extent on the specific regulations that are to be adopted in the future. Certain aspects of the Dodd-Frank Act and the EGRRCPA are discussed below in more detail.
CARTER BANK & TRUST
ITEM 1. BUSINESS (continued)
Regulatory Capital Requirements. All financial institutions are required to maintain minimum levels of regulatory capital. The FDIC establishes risk-based and leveraged capital standards for the financial institutions they regulate. The FDIC also may impose capital requirements in excess of these standards on a case-by-case basis for various reasons, including financial condition or actual or anticipated growth.
As of December 31, 2019 and 2018, the Bank qualified as a “well capitalized” institution (see Note 19 of the Notes to Consolidated Financial Statements filed herewith). Under the risk-based capital requirements, through December 31, 2015, the Bank was required to maintain a minimum ratio of total capital to risk-weighted assets of at least 8%. At least half of the total capital was required to be “Tier 1 capital,” which consists principally of common and certain qualifying preferred shareholders’ equity, less certain intangibles and other adjustments. The remainder, “Tier 2 capital,” consists of a limited amount of subordinated and other qualifying debt (including certain hybrid capital instruments) and a limited amount of the general loan loss reserve.
The federal regulatory agencies established a minimum leveraged capital ratio (Tier 1 capital to period end total average assets). These guidelines provided for a minimum leverage capital ratio of 4%. The guidelines also provided that banking organizations experiencing internal growth or making acquisitions were expected to maintain strong capital positions substantially above the minimum supervisory levels, without significant reliance on intangible assets.
Basel III Capital Framework. The FRB and the FDIC have adopted rules to implement the Basel III capital framework as outlined by the Basel Committee on Banking Supervision and standards for calculating risk-weighted assets and risk-based capital measurements (collectively, the “Basel III Final Rules”) that apply to banking institutions they supervise. For the purposes of the Basel III Final Rules, (i) common equity tier 1 capital (CET1) consists principally of common stock (including surplus) and retained earnings; (ii) Tier 1 capital consists principally of CET1 plus non-cumulative preferred stock and related surplus, and certain grandfathered cumulative preferred stocks and trust preferred securities; and (iii) Tier 2 capital consists of other capital instruments, principally qualifying subordinated debt and preferred stock, and limited amounts of an institution’s allowance for loan losses. Each regulatory capital classification is subject to certain adjustments and limitations, as implemented by the Basel III Final Rules. The Basel III Final Rules also establish risk weightings that are applied to many classes of assets held by community banks, importantly including applying higher risk weightings to certain commercial real estate loans.
The Basel III Final Rules and minimum capital ratios required to be maintained by banks were effective January 1, 2015. The Basel III Final Rules also include a requirement that banks maintain additional capital (the “capital conservation buffer”), which was phased in beginning January 1, 2016 and was fully phased-in effective January 1, 2019. The Basel III Final Rules and fully phased-in capital conservation buffer require banks to maintain a:
| · | minimum ratio of CET1 to risk-weighted assets of at least 4.5%, plus a 2.5% capital conservation buffer (which is added to the minimum CET1 ratio, effectively resulting in a required ratio of CET1 to risk-weighted assets of at least 7%); |
| · | minimum ratio of Tier 1 capital to risk-weighted assets of at least 6.0%, plus the capital conservation buffer (effectively resulting in a required Tier 1 capital ratio of 8.5%); |
CARTER BANK & TRUST
ITEM 1. BUSINESS (continued)
| · | minimum ratio of total capital (that is, Tier 1 plus Tier 2) capital to risk-weighted assets of at least 8.0%, plus the capital conservation buffer (effectively resulting in a required total capital ratio of 10.5%); and |
| · | minimum leverage ratio of 4.0%, calculated as the ratio of Tier 1 capital to average total assets, subject to certain adjustments and limitations. |
The Basel III Final Rules provide deductions from and adjustments to regulatory capital measures, primarily to CET1, including deductions and adjustments that were not applied to reduce CET1 under historical regulatory capital rules.
For example, mortgage servicing rights, deferred tax assets dependent upon future taxable income, and significant investments in non-consolidated financial entities must be deducted from CET1 to the extent that any one such category exceeds 10% of CET1 or all such categories in the aggregate exceed 15% of CET1.
As of December 31, 2019, the Bank meets all capital adequacy requirements under the Basel III Final Rules, including the capital conservation buffer on a fully phased-in basis as if such requirements were in effect as of that date.
Community Bank Leverage Ratio. As a result of the EGRRCPA, the federal banking agencies were required to develop a Community Bank Leverage Ratio (the ratio of a bank’s tangible equity capital to average total consolidated assets) for banking organizations with assets of less than $10 billion, such as the Bank. On October 29, 2019, the federal banking agencies issued a final rule that implements the Community Bank Leverage Ratio Framework (the “CBLRF”). To qualify for the CBLRF, a bank must have less than $10 billion in total consolidated assets, limited amounts of off-balance sheet exposures and trading assets and liabilities, and a leverage ratio greater than 9%. A bank that elects the CBLRF and has a leverage ratio greater than 9% will be considered to be in compliance with Basel III capital requirements and exempt from the complex Basel III calculations. A bank that falls out of compliance with the CBLRF will have a two-quarter grace period to come back into full compliance, provided its leverage ratio remains above 8% (a bank will be deemed well-capitalized during the grace period). The CBLRF will be available for banking organizations to use as of March 31, 2020 (with the flexibility for banking organizations to subsequently opt into or out of the CBLRF, as applicable).
Insurance of Accounts, Assessments and Regulation by the FDIC. Deposits with the Bank are insured through the Deposit Insurance Fund (“DIF”) of the FDIC. As a DIF-insured institution, the Bank is subject to FDIC rules and regulations as administrator of the DIF. The Dodd-Frank Act made permanent the current standard maximum deposit insurance amount of $250,000. The FDIC coverage applies per depositor, per insured depository institution, for each account ownership category. The FDIC is authorized to conduct examinations of and to require reporting by DIF-insured institutions.
The FDIC is authorized to prohibit any DIF-insured institution from engaging in any activity that the FDIC determines by regulation or order to pose a serious threat to the insurance fund. Also, the FDIC may initiate enforcement actions against banks after first giving the institution’s primary regulatory authority an opportunity to take such action. The FDIC may terminate the deposit insurance of any depository institution, including the Bank, if it determines, after a hearing, that the institution has engaged or is engaging in unsafe or unsound practices, is in an unsafe or unsound condition to continue operations, or has violated any applicable law, regulation, order or any condition imposed in writing by the FDIC. It also may suspend deposit insurance temporarily during the hearing process for the permanent termination of insurance, if the institution has no tangible capital. If deposit insurance is terminated, the deposits at the institution at the time of termination, less subsequent withdrawals, shall continue to be insured for a period from six months to two years, as determined by the FDIC. Management is aware of no existing circumstances that could result in termination of the Bank’s deposit insurance.
CARTER BANK & TRUST
ITEM 1. BUSINESS (continued)
The actual assessment to be paid by each DIF member is based on the institution’s assessment risk classification and whether the institution is considered by its supervisory agency to be financially sound or to have supervisory concerns.
The DIF is funded by assessments on banks and other depository institutions calculated based on average consolidated total assets minus average tangible equity (defined as Tier 1 capital). As required by the Dodd-Frank Act, the FDIC has adopted a large-bank pricing assessment scheme, set a target “designated reserve ratio” (described in more detail below) of 2% for the DIF and, in lieu of dividends, provides for a lower assessment rate schedule when the reserve ratio reaches 2% and 2.5%. An institution's assessment rate is based on a statistical analysis of financial ratios that estimates the likelihood of failure over a three-year period, which considers the institution’s weighted average CAMELS component rating, and is subject to further adjustments including those related to levels of unsecured debt and brokered deposits (not applicable to banks with less than $10 billion in assets). At December 31, 2019, total base assessment rates for institutions that have been insured for at least five years range from 1.5 to 30 basis points applying to banks with less than $10 billion in assets.
The Dodd-Frank Act transferred to the FDIC increased discretion with regard to managing the required amount of reserves for the DIF, or the “designated reserve ratio.” The Federal Deposit Insurance Act (“FDIA”) requires that the FDIC consider the appropriate level for the DIF on at least an annual basis. As of December 31, 2019, the DIF was 2% and the minimum DIF was 1.35%.
Banks with less than $10 billion in total consolidated assets (such as the Bank) receive credits to offset the portion of their assessments that help to raise the reserve ratio to 1.35%. The FDIC will automatically apply such a bank’s credits to reduce its regular DIF assessment up to the entire amount of the assessment. The FDIC will remit any such remaining credits in a lump sum to the appropriate bank following application to the bank’s regular DIF assessment for four quarterly assessment periods. The Bank received and utilized its entire $1.1 million credit during the third quarter of 2019.
CFPB Regulation and Supervision. The Consumer Financial Protection Bureau (the “CFPB”) is the federal regulatory agency responsible for implementing, examining and enforcing compliance with federal consumer financial laws for institutions with more than $10 billion of assets and, to a lesser extent, smaller institutions. The CFPB supervises and regulates providers of consumer financial products and services, and has rulemaking authority in connection with numerous federal consumer financial protection laws (for example, but not limited to, the Truth-in-Lending Act (“TILA”) and the Real Estate Settlement Procedures Act (“RESPA”)).
Because the Bank is a smaller institution (i.e., with assets of $10 billion or less), most consumer protection aspects of the Dodd-Frank Act will continue to be applied to the Bank by the FDIC. However, the CFPB may include its own examiners in regulatory examinations by a smaller institution’s principal regulators and may require smaller institutions to comply with certain CFPB reporting requirements. In addition, regulatory positions taken by the CFPB and administrative and legal precedents established by CFPB enforcement activities, including in connection with supervision of larger banks, could influence how the FDIC applies consumer protection laws and regulations to financial institutions that are not directly supervised by the CFPB. The precise effect of the CFPB’s consumer protection activities on the Bank cannot be determined with certainty.
CARTER BANK & TRUST
ITEM 1. BUSINESS (continued)
Mortgage Banking Regulation. In connection with making mortgage loans, the Bank is subject to rules and regulations that, among other things, establish standards for loan origination, prohibit discrimination, provide for inspections and appraisals of property, require credit reports on prospective borrowers, in some cases restrict certain loan features and fix maximum interest rates and fees, require the disclosure of certain basic information to mortgagors concerning credit and settlement costs, limit payment for settlement services to the reasonable value of the services rendered and require the maintenance and disclosure of information regarding the disposition of mortgage applications based on race, gender, geographical distribution and income level. The Bank’s mortgage origination activities are subject to the Equal Credit Opportunity Act (“ECOA”), TILA, the Home Mortgage Disclosure Act, RESPA, the Home Ownership Equity Protection Act, and the regulations promulgated under these acts, among other additional state and federal laws, regulations and rules.
The Bank’s mortgage origination activities are also subject to Regulation Z, which implements TILA. Certain provisions of Regulation Z require mortgage lenders to make a reasonable and good faith determination, based on verified and documented information, that a consumer applying for a mortgage loan has a reasonable ability to repay the loan according to its terms. Alternatively, a mortgage lender can originate “qualified mortgages”, which are generally defined as mortgage loans without negative amortization, interest-only payments, balloon payments, terms exceeding 30 years, and points and fees paid by a consumer equal to or less than 3% of the total loan amount. Under the EGRRCPA, most residential mortgage loans originated and held in portfolio by a bank with less than $10 billion in assets will be designated as “qualified mortgages.” Higher-priced qualified mortgages (e.g., sub-prime loans) receive a rebuttable presumption of compliance with ability-to-repay rules, and other qualified mortgages (e.g., prime loans) are deemed to comply with the ability-to-repay rules. The Bank predominantly originates mortgage loans that comply with Regulation Z’s “qualified mortgage” rules.
Brokered Deposits. Section 29 of the FDIA and FDIC regulations generally limit the ability of any bank to accept, renew or roll over any brokered deposit unless it is “well capitalized” or, with the FDIC’s approval, “adequately capitalized.” However, as a result of the EGRRCPA, the FDIC undertook a comprehensive review of its regulatory approach to brokered deposits, including reciprocal deposits, and interest rate caps applicable to banks that are less than “well capitalized.” On December 12, 2019, the FDIC issued a notice of proposed rulemaking to modernize its brokered deposit regulations. At this time, it is difficult to predict what changes, if any, to the brokered deposit regulations will actually be implemented or the effect of such changes on the Bank.
Prompt Corrective Action. The federal banking agencies have broad powers under current federal law to take prompt corrective action to resolve problems of insured depository institutions. The extent of these powers depends upon whether the institution in question is “well capitalized,” “adequately capitalized,” “undercapitalized,” “significantly undercapitalized” or “critically undercapitalized.” These terms are defined under uniform regulations issued by each of the federal banking agencies regulating these institutions. An insured depository institution which is less than adequately capitalized must adopt an acceptable capital restoration plan, is subject to increased regulatory oversight and is increasingly restricted in the scope of its permissible activities. As of December 31, 2019, the Bank was considered “well capitalized.”
Incentive Compensation. The federal banking agencies have issued regulatory guidance (the “Incentive Compensation Guidance”) intended to ensure that the incentive compensation policies of banking organizations do not undermine the safety and soundness of such organizations by encouraging excessive risk-taking. The FDIC will review, as part of the regular, risk-focused examination process, the incentive compensation arrangements of banking organizations, such as the Bank, that are not “large, complex banking organizations.” The findings will be included in reports of examination, and deficiencies will be incorporated into the organization’s supervisory ratings. Enforcement actions may be taken against a banking organization if its incentive compensation arrangements, or related risk-management control or governance processes, pose a risk to the organization’s safety and soundness and the organization is not taking prompt and effective measures to correct the deficiencies.
CARTER BANK & TRUST
ITEM 1. BUSINESS (continued)
In 2016, the SEC and the federal banking agencies proposed rules that prohibit covered financial institutions (including bank holding companies and banks) from establishing or maintaining incentive-based compensation arrangements that encourage inappropriate risk taking by providing covered persons (consisting of senior executive officers and significant risk takers, as defined in the rules) with excessive compensation, fees or benefits that could lead to material financial loss to the financial institution. The proposed rules outline factors to be considered when analyzing whether compensation is excessive and whether an incentive-based compensation arrangement encourages inappropriate risks that could lead to material loss to the covered financial institution, and establishes minimum requirements that incentive-based compensation arrangements must meet to be considered to not encourage inappropriate risks and to appropriately balance risk and reward. The proposed rules also impose additional corporate governance requirements on the boards of directors of covered financial institutions and impose additional record-keeping requirements. The comment period for these proposed rules has closed and a final rule has not yet been published.
Community Reinvestment. The Community Reinvestment Act (the “CRA”) imposes on financial institutions, including the Bank an affirmative obligation to help meet the credit needs of their local communities, including low- and moderate-income neighborhoods, consistent with the safe and sound operation of those institutions. Each financial institution’s efforts in helping meet community credit needs currently are evaluated as part of the examination process pursuant to regulations adopted by the banking regulatory agencies. Under the regulation financial institution’s efforts in helping meet its community’s credit needs are evaluated, based on the particular institution’s total assets, according to a lending test, a community development test in addition to the lending test, or the three-pronged (lending, investment and service) test. The grade received by a bank is considered in evaluating mergers, acquisitions and applications to open a branch or facility. To the best knowledge of the Bank, it is meeting its obligations under the CRA. The Bank received a rating of “satisfactory” on its most recent CRA examination dated October 23, 2017.
Confidentiality and Required Disclosures of Customer Information. The Bank is subject to various laws and regulations that address the privacy of nonpublic personal financial information of consumers. The Gramm-Leach-Bliley Act and certain regulations issued thereunder protect against the transfer and use by financial institutions of consumer nonpublic personal information. A financial institution must provide to its customers, at the beginning of the customer relationship and annually thereafter, the institution’s policies and procedures regarding the handling of customers’ nonpublic personal financial information. These privacy provisions generally prohibit a financial institution from providing a customer’s personal financial information to unaffiliated third parties unless the institution discloses to the customer that the information may be so provided and the customer is given the opportunity to opt out of such disclosure. Certain exceptions may apply to the requirement to deliver an annual privacy notice based on how a financial institution limits sharing of nonpublic personal information, and whether the institution’s disclosure practices or policies have changed in certain ways since the last privacy notice that was delivered.
CARTER BANK & TRUST
ITEM 1. BUSINESS (continued)
The Bank is also subject to various laws and regulations that attempt to combat money laundering and terrorist financing. The Bank Secrecy Act requires all financial institutions to, among other things, create a system of controls designed to prevent money laundering and the financing of terrorism, and imposes recordkeeping and reporting requirements. The USA Patriot Act added regulations to facilitate information sharing among governmental entities and financial institutions for the purpose of combating terrorism and money laundering, and requires financial institutions to establish anti-money laundering programs. The Office of Foreign Assets Control (“OFAC”), which is a division of the U.S Department of Treasury, is responsible for helping to ensure that United States entities do not engage in transactions with “enemies” of the United States, as defined by various Executive Orders and Acts of Congress. If the Bank finds the name of an “enemy” of the United States on any transaction, account or wire transfer that is on an OFAC list, it must freeze such account or place transferred funds into a blocked account, and report it to OFAC.
Although these laws and programs impose compliance costs and create privacy obligations and, in some cases, reporting obligations, and compliance with all of the laws, programs, and privacy and reporting obligations may require significant resources of the Bank, these laws and programs do not materially affect the Bank’s products, services or other business activities.
Cybersecurity. The federal banking agencies have also adopted guidelines for establishing information security standards and cybersecurity programs for implementing safeguards under the supervision of a financial institution’s board of directors. These guidelines, along with related regulatory materials, increasingly focus on risk management and processes related to information technology and the use of third parties in the provision of financial products and services. The federal banking agencies expect financial institutions to establish lines of defense and ensure that their risk management processes also address the risk posed by compromised customer credentials, and also expect financial institutions to maintain sufficient business continuity planning processes to ensure rapid recovery, resumption and maintenance of the institution’s operations after a cyber-attack. If the Bank fails to meet the expectations set forth in this regulatory guidance, it could be subject to various regulatory actions and any remediation efforts may require significant resources of the Bank. In addition, all federal and state bank regulatory agencies continue to increase focus on cybersecurity programs and risks as part of regular supervisory exams.
In October 2016, the federal banking agencies issued proposed rules on enhanced cybersecurity risk-management and resilience standards that would apply to very large financial institutions and to services provided by third parties to these institutions. The comment period for these proposed rules has closed and a final rule has not been published. Although the proposed rules would apply only to bank holding companies and banks with $50 billion or more in total consolidated assets, these rules could influence the federal banking agencies’ expectations and supervisory requirements for information security standards and cybersecurity programs of smaller financial institutions, such as the Bank.
Stress Testing. The federal banking agencies have implemented stress testing requirements for certain large or risky financial institutions, including bank holding companies and state-chartered banks. Although these requirements do not apply to the Bank, the federal banking agencies emphasize that all banking organizations, regardless of size, should have the capacity to analyze the potential effect of adverse market conditions or outcomes on the organization’s financial condition. Based on existing regulatory guidance, the Bank will be expected to consider its interest rate risk management, commercial real estate loan concentrations and other credit-related information, and funding and liquidity management during this analysis of adverse market conditions or outcomes.
CARTER BANK & TRUST
ITEM 1. BUSINESS (continued)
Volcker Rule. The Dodd-Frank Act prohibits bank holding companies and their subsidiary banks from engaging in proprietary trading except in limited circumstances, and places limits on ownership of equity investments in private equity and hedge funds (the “Volcker Rule”). The EGRRCPA and final rules adopted to implement the EGRRCPA exempt all banks with less than $10 billion in assets (including their holding companies and affiliates) from the Volcker Rule, provided that the institution has total trading assets and liabilities of 5% or less of total assets, subject to certain limited exceptions. The Bank believes that its financial condition and its operations are not significantly affected by the Volcker Rule, amendments thereto, or it’s implementing regulations.
Call Reports and Examination Cycle. All institutions, regardless of size, submit a quarterly call report that includes data used by federal banking agencies to monitor the condition, performance, and risk profile of individual institutions and the industry as a whole. The EGRRCPA contained provisions expanding the number of regulated institutions eligible to use streamlined call report forms. In June 2019, the federal banking agencies issued a final rule to permit insured depository institutions with total assets of less than $5 billion that do not engage in certain complex or international activities to file the most streamlined version of the quarterly call report, and to reduce data reportable on certain streamlined call report submissions.
In December 2018, consistent with the provisions of the EGRRCPA, the federal banking agencies jointly adopted final rules that permit banks with up to $3 billion in total assets, that received a composite CAMELS rating of “1” or “2,” and that meet certain other criteria (including not having undergone any change in control during the previous 12-month period, and not being subject to a formal enforcement proceeding or order), to qualify for an 18-month on-site examination cycle.
Effect of Governmental Monetary Policies. As with other financial institutions, the earnings of the Bank are affected by general economic conditions as well as by the monetary policies of the FRB. Such policies, which include regulating the national supply of bank reserves and bank credit, can have a major effect upon the source and cost of funds and the rates of return earned on loans and investments. The FRB System exerts a substantial influence on interest rates and credit conditions, primarily through establishing target rates for federal funds, open market operations in U.S. Government securities, varying the discount rate on member bank borrowings and setting cash reserve requirements against deposits. Changes in monetary policy, including changes in interest rates, will influence the origination of loans, the purchase of investments, the generation of deposits, and rates received on loans and investment securities and paid on deposits. Fluctuations in the FRB’s monetary policies have had a significant impact on the operating results of the Bank and all financial institutions in the past and are expected to continue to do so in the future.
Dividend Limitations. The amount of dividends permitted to be paid by the Bank will depend upon its earnings and capital position, and is limited by federal and state law, regulations and policy. Virginia law imposes restrictions on the ability of all banks chartered under Virginia law to pay dividends. Under Virginia law, no dividend may be declared or paid that would impair a bank’s paid-in capital and payments must be made from retained earnings.
State and federal regulators have the general authority to limit dividends paid by the Bank if it is, or after making the distribution it would become, “undercapitalized” (as that term is defined in federal law). The FDIC has issued policy statements that provide that insured banks generally should pay dividends only from their current operating earnings, and, under the FDIA, no dividend may be paid by an insured bank while it is in default on any assessment due the FDIC. The Bank’s payment of dividends also could be affected or limited by other factors, such as events or circumstances which lead the FDIC to require that the Bank maintain capital in excess of regulatory guidelines, or the Bank’s failure to maintain an appropriate capital conservation buffer as discussed above.
CARTER BANK & TRUST
ITEM 1. BUSINESS (continued)
Legislative and Regulatory Responses to the COVID-19 Pandemic. In response to the COVID-19 pandemic, the Coronavirus Aid, Relief, and Economic Security Act (the “CARES Act”) was signed into law by President Trump on March 27, 2020. The CARES Act provides for approximately $2.2 trillion in emergency economic relief measures including, among other things, loan programs for small and mid-sized businesses and other economic relief for impacted businesses and industries, including financial institutions. Many of the CARES Act’s programs are dependent upon the direct involvement of U.S. financial institutions and will be implemented through rules and guidance adopted by federal departments and agencies, including the U.S. Department of the Treasury, the FDIC, the FRB and other federal bank regulatory authorities, including those with direct supervisory jurisdiction over the Bank.
Set forth below is a brief overview of certain provisions of the CARES Act and certain other regulations and supervisory guidance related to the COVID-19 pandemic that are applicable to the operations and activities of the Bank. The following description is qualified in its entirety by reference to the full text of the CARES Act and the statutes, regulations, and policies described herein. Such statutes, regulations, and policies are subject to ongoing review by U.S. Congress and federal regulatory authorities. Future amendments to the provisions of the CARES Act or changes to any of the statutes, regulations, or regulatory policies applicable to the Bank could have a material effect on the Bank. Many of the requirements called for in the CARES Act and related regulations and supervisory guidance will be implemented over time and most will be subject to implementing regulations over the course of the coming weeks. The Bank will continue to assess the impact of the CARES Act and other statutes, regulations and supervisory guidance related to the COVID-19 pandemic.
CARES Act
Paycheck Protection Program (“PPP”). Under the CARES Act, PPP is an amendment to the Small Business Administration (“SBA”) 7-A loan program. The Bank recently became an approved SBA 7-A lender. PPP is a guaranteed, unsecured loan program created to fund certain payroll and operating costs of eligible businesses, organizations and self-employed persons during COVID-19. Initially, $349 billion were approved and designated for PPP in order for the SBA to guarantee 100% of collective loans made under the program to eligible small businesses, nonprofits, veteran’s organizations, and tribal businesses. The Bank participated in the initial round of funding though a referral relationship with a third-party, non-bank lender. When an additional $310 billion in funds were approved and designated for PPP, the Bank opted to stand up an internal, automated loan process utilizing its core system provider.
The FRB implemented a liquidity facility available to financial institutions participating in the PPP. We believe we have sufficient liquidity sources to fund all pending PPP loans and to continue to provide this important service to local businesses. These loans are fully guaranteed by the SBA and do not represent a credit risk.
Troubled Debt Restructuring and Loan Modifications for Affected Borrowers. The CARES Act permits financial institutions to suspend requirements under GAAP for loan modifications to borrowers affected by COVID-19 that would otherwise be characterized as troubled debt restructurings (“TDRs”) and suspend any determination related thereto if (i) the loan modification is made between March 1, 2020 and the earlier of December 31, 2020 or 60 days after the end of the coronavirus emergency declaration and (ii) the applicable loan was not more than 30 days past due as of December 31, 2019. In addition, federal bank regulatory authorities have issued guidance to encourage financial institutions to make loan modifications for borrowers affected by COVID-19 and have assured financial institutions that they will neither receive supervisory criticism for such prudent loan modifications, nor be required by examiners to automatically categorize COVID-19-related loan modifications as TDRs.
CARTER BANK & TRUST
ITEM 1. BUSINESS (continued)
Debt Guarantees, Account Insurance Increase, and Temporary Lending Limit Relief. The CARES Act also authorized several key initiatives directly applicable to federal bank regulatory authorities, including (i) the establishment of a program by the FDIC to guarantee the debt obligations of solvent insured depository institutions and their affiliates (including their holding companies) through December 31, 2020 and (ii) an increase by the FDIC and the National Credit Union Association to the insurance coverage on any noninterest-bearing transaction accounts through December 31, 2020.
FRB Programs and Initiatives
The CARES Act encourages the FRB, in coordination with the Secretary of the Treasury, to establish or implement various programs to help midsize businesses, nonprofits, and municipalities, including (i) a Midsize Business/Nonprofit Organization Program to provide financing to banks and other lenders to make direct loans to eligible businesses and nonprofit organizations with between 500 and 10,000 employees and (ii) the Municipal Liquidity Facility, to provide liquidity to the financial system that supports states and municipalities. On April 9, 2020, the FRB announced and solicited comments regarding the Main Street Lending Program, which would implement certain of these recommendations. Further action regarding the Main Street Lending Program is expected soon.
Separately and in response to COVID-19, the FRB’s Federal Open Market Committee (the “FOMC”) has set the federal funds target rate – i.e., the interest rate at which depository institutions such as the Bank lend reserve balances to other depository institutions overnight on an uncollateralized basis – to an historic low. On March 16, 2020, the FOMC set the federal funds target rate at 0-0.25%. Consistent with FRB policy, the FRB has committed to the use of overnight reverse repurchase agreements as a supplementary policy tool, as necessary, to help control the federal funds rate and keep it in the target range set by the FOMC.
In addition, the FRB has expanded the size and scope of three existing programs to mitigate the economic impact of the COVID-19 outbreak: (i) the Primary Market Corporate Credit Facility; (ii) the Secondary Market Corporate Credit Facility; and (iii) the Term Asset-Backed Securities Loan Facility. The FRB has also established two new program facilities – the Money Market Mutual Fund Liquidity Facility and the Commercial Paper Funding Facility – to broaden its support for the flow of credit to households and businesses during COVID-19.
Temporary Regulatory Capital Relief related to Impact of Current Expected Credit Losses (“CECL”)
Concurrent with enactment of the CARES Act, the federal bank regulatory authorities issued an interim final rule to provide banking organizations that are required to implement ASU 2016-13, Measurement of Credit Losses on Financial Instruments before the end of 2020 the option to delay the estimated impact on regulatory capital by up to two years, with a three-year transition period to phase out the cumulative benefit to regulatory capital provided during the two-year delay.
CARTER BANK & TRUST
ITEM 1. BUSINESS (continued)
Temporary Bank Secrecy Act (“BSA”) Reporting Relief
The U.S. Department of the Treasury’s Financial Crimes Enforcement Network (“FinCEN”) has provided targeted relief from certain BSA reporting requirements and have provided updated guidance to financial institutions on complying with such requirements during COVID-19. Specifically, FinCEN has (i) granted targeted relief to financial institutions participating in the PPP, stating that PPP loans to existing customers will not require re-verification under applicable BSA requirements, unless re-verification is otherwise required under the financial institution’s risk-based BSA compliance program, (ii) acknowledged that there may be “reasonable delays in compliance” due to COVID-19, and (iii) temporarily suspended implementation if its February 2020 ruling, which would have entailed significant changes to currency transaction reporting filing requirements for transactions involving sole proprietorships and entities operating under a “doing business as” or other assumed name.
Future Regulation. From time to time, various legislative and regulatory initiatives are introduced in Congress and state legislatures, as well as by regulatory agencies. Such initiatives may include proposals to expand or contract the powers of bank holding companies and depository institutions or proposals to substantially change the financial institution regulatory system. Such legislation could change banking statutes and the operating environment of the Bank in substantial and unpredictable ways. If enacted, such legislation could increase or decrease the cost of doing business, limit or expand permissible activities or affect the competitive balance among banks, savings associations, credit unions, and other financial institutions. The Bank cannot predict whether any such legislation will be enacted, and, if enacted, the effect that it, or any implementing regulations, would have on its financial condition or results of operations. A change in statutes, regulations or regulatory policies applicable to the Bank could have a material effect on its business.
Where You Can Find More Information
The Bank files quarterly, annual and periodic reports, proxy statements and insider filings with the FDIC (rather than the SEC). You may (i) obtain copies of the documents the Bank files with the FDIC by directing a request by telephone or mail to Investor Relations, Carter Bank & Trust, 1300 Kings Mountain Road, Martinsville, Virginia 24112; telephone number: (276) 656-1776, or (ii) obtain copies of these documents directly from the FDIC’s website at www.fdic.gov. The annual report and proxy statement will be available through our website at www.CBTCares.com under “Investor Relations” as of the date of the annual mailing to shareholders.
ITEM 1A. RISK FACTORS
An investment in the Bank’s securities involves risk. In addition to the other information set forth in this report, including the information under the heading “Important Notice Regarding Forward-Looking Statements,” investors in the Bank’s securities should consider the factors discussed below.
The Bank’s business is subject to interest rate risk and fluctuations in interest rates may adversely affect its earnings and capital levels.
The majority of the Bank’s assets are monetary in nature and, as a result, the Bank is subject to significant risk from changes in interest rates. Changes in interest rates can impact the Bank’s net interest income as well as the valuation of its assets and liabilities. Also, the Bank’s earnings are significantly dependent on its net interest income, which is the difference between interest income on interest-earning assets, such as loans and securities, and interest expense on interest-bearing liabilities, such as deposits and borrowings. The Bank expects that it will experience “gaps” in the interest rate sensitivities of its assets and liabilities, meaning that either its interest-bearing liabilities will be more sensitive to changes in market interest rates than its interest-earning assets, or vice versa. In either event, if market interest rates should move contrary to the Bank’s position, this “gap” will work against it and its earnings may be negatively affected.
CARTER BANK & TRUST
ITEM 1A. RISK FACTORS (continued)
During the calendar ending December 31, 2019, the Federal Open Market Committee (“FOMC”) announced three rate decreases for the target federal funds rate, which is the range of interest rates at which depository institutions lend reserve balances to other depository institutions overnight, which decreased from 2.25% to 1.50%. During March 2020, the FOMC took unprecedented measures to mitigated the potential disruption in the economy due to the COVID-19 pandemic and keep credit markets functioning properly by announced two additional rate decreases in the target federal funds rate of 0.50% and 1.00%, respectively, resulting in a target federal funds rate of 0.00% - 0.25%. On March 9, 2020, the ten-year US Treasury yield closed at an all-time low at 0.54%, down from its close of 1.92% at December 31, 2019. Treasury yields remain at historical lows across all maturities indicating an expected prolonged low rate environment on all points of the yield curve.
A decrease in the general level of interest rates may, among other things, lead to an increase in prepayments on loans and increased competition for deposits. Conversely, an increase in the general level of interest rates may also, among other things, reduce the demand for loans and the Bank’s ability to originate loans or increase the rate of default on existing loans. Accordingly, changes in the general level of market interest rates may affect net yield on interest-earning assets, loan origination volume, loan portfolios, and funding costs which impact the Bank’s overall results.
Although the Bank’s asset-liability management strategy is designed to control its risk from changes in the general level of market interest rates, market interest rates will be affected by many factors outside of its control, including inflation, recession, changes in unemployment, other economic conditions, money supply and international disorder and instability in domestic and foreign financial markets. It is possible that significant or unexpected changes in interest rates may take place in the future, and the Bank cannot always accurately predict the nature or magnitude of such changes or how such changes may affect its business.
The COVID-19 pandemic and resulting adverse economic conditions have already adversely impacted the Bank’s business and results, and could have a more material adverse impact on our business, financial condition and results of operations.
The ongoing COVID-19 global and national health emergency has caused significant disruption in the United States and international economies and financial markets. The spread of COVID-19 in the United States has caused illness, quarantines, cancellation of events and travel, business and school shutdowns, reduction in commercial activity and financial transactions, supply chain interruptions, increased unemployment, and overall economic and financial market instability. Almost all states, including Virginia, where the Bank is headquartered, and North Carolina, in which the Bank has significant operations, have issued “stay-at-home orders” and have declared states of emergency.
CARTER BANK & TRUST
ITEM 1A. RISK FACTORS (continued)
Although banks have generally been permitted to continue operating, the COVID-19 pandemic has caused disruptions to the Bank’s business and could cause material disruptions to our business and operations in the future. Impacts to the Bank’s business have included decreased operating effectiveness due to additional health and safety precautions implemented at the Bank’s branches and the transition of 20% of the Bank’s workforce to home locations, decreases in customer traffic in the Bank’s branches and increases in requests for forbearance and loan modifications. Further, loan payment deferment programs implemented by the Bank or under government stimulus programs, like the PPP, may mask credit deterioration in our loan portfolio by making less applicable standard measures of developing financial weakness in a client or portfolio, such as past due monitoring and non-accrual assessments. To the extent that commercial and social restrictions remain in place or increase, the Bank’s expenses, delinquencies, charge-offs, foreclosures and credit losses could materially increase, and the Bank could experience reductions in interest and fee income. In addition, the Bank anticipates that potential declines in credit quality could significantly affect the adequacy of its allowance for loan losses, which the Bank expects could lead to increases in the provision for loan losses and related declines in the Bank’s net income.
Unfavorable economic conditions and increasing unemployment figures may also make it more difficult for the Bank to maintain deposit levels and loan origination volume and to obtain additional financing. Furthermore, such conditions have and may continue to cause the value of the Bank’s investment portfolio and of collateral associated with the Bank’s existing loans to decline. In addition, in March 2020, the FRB lowered the target range for the federal funds rate to a range from 0 to 0.25 percent in part as a result of the pandemic. A prolonged period of very low interest rates could reduce the Bank’s net interest income and have a material adverse impact on our cash flows and the market value of our investments or the manner in which we redeploy proceeds from maturing investments.
While the Bank has taken and is continuing to take precautions to protect the safety and well-being of its employees and customers, no assurance can be given that the steps being taken will be deemed to be adequate or appropriate, nor can the Bank predict the level of disruption which will occur to its employees’ ability to provide customer support and service. The continued or renewed spread of COVID-19 could negatively impact the availability of key personnel necessary to conduct the Bank’s business, the business and operations of the Bank’s third-party service providers who perform critical services for the Bank’s business, or the businesses of many of the Bank’s customers and borrowers. If COVID-19 is not successfully contained, the Bank could experience a material adverse effect on its business, financial condition, results of operations and cash flow.
Among the factors outside the Bank’s control that are likely to affect the impact the COVID-19 pandemic will ultimately have on the Bank’s business are, without limitation:
| · | the pandemic’s course and severity; |
| · | the direct and indirect results of the pandemic, such as recessionary economic trends, including with respect to employment, wages and benefits, commercial activity, the residential housing market, consumer spending and real estate and investment securities market values; |
| · | political, legal and regulatory actions and policies in response to the pandemic, including the effects of restrictions on commerce and banking, such as current temporary or required continuing moratoria and other suspensions of collections, foreclosures, and related obligations; |
| · | the timing, magnitude and effect of public spending, directly or through subsidies, its direct and indirect effects on commercial activity and incentives of employers and individuals to resume or increase employment, wages and benefits and commercial activity; |
CARTER BANK & TRUST
ITEM 1A. RISK FACTORS (continued)
| · | effects on the Bank’s liquidity position due to changes in customers’ deposit and loan activity in response to the pandemic and its economic effects; |
| · | the timing and availability of direct and indirect governmental support for various financial assets, including mortgage loans; |
| · | the long-term effect of the economic downturn on the Bank’s intangible assets such as our deferred tax asset and goodwill; |
| · | potential longer-term effects of increased government spending on the interest rate environment and borrowing costs for non-governmental parties; |
| · | the ability of the Bank’s employees to work effectively during the course of the pandemic; |
| · | the ability of the Bank’s third-party vendors to maintain a high-quality and effective level of service; |
| · | the possibility of increased fraud, cybercrime and similar incidents, due to vulnerabilities posed by the significant increase in Bank employees and customers handling their banking interactions remotely from home, the quick roll-out of various government-sponsored lending programs, like the PPP, or otherwise; |
| · | required changes to the Bank’s internal controls over financial reporting to reflect a rapidly changing work environment; |
| · | potential longer-term shifts toward mobile banking, telecommuting and telecommerce; and |
| · | geographic variation in the severity and duration of the COVID-19 pandemic, particularly in Virginia and North Carolina, where the Bank operates physically. |
The ongoing COVID-19 pandemic has resulted in severe volatility in the financial markets and meaningfully lower stock prices for many companies, including the Bank’s common stock. Depending on the extent and duration of the COVID-19 pandemic, the price of the Bank’s common stock may continue to experience volatility and declines.
The Bank is continuing to monitor the COVID-19 pandemic and related risks, although the rapid development and fluidity of the situation precludes any specific prediction as to its ultimate impact on the Bank. However, if the COVID-19 pandemic continues to spread or otherwise result in a continuation or worsening of the current economic and commercial environments, the Bank’s business, financial condition, results of operations and cash flows could be materially adversely affected.
The Bank is subject to extensive government regulation and supervision.
Banking regulations are primarily intended to protect depositors’ funds, federal deposit insurance funds and the banking system as a whole, not security holders. These regulations affect our lending practices, capital structure, investment practices, dividend policy and growth, among other things. Congress and federal regulatory agencies continually review banking laws, regulations and policies for possible changes. Changes to statutes, regulations or regulatory policies, including changes in interpretation or implementation of statutes, regulations or policies, could affect us in substantial and unpredictable ways. Such changes could subject us to additional costs, limit the types of financial services and products we may offer and/or increase the ability of non-banks to offer competing financial services and products, among other things. Failure to comply with laws, regulations, policies or supervisory guidance could result in enforcement and other legal actions by Federal or state authorities, including criminal and civil penalties, the loss of FDIC insurance, the revocation of a banking charter, other sanctions by regulatory agencies, civil money penalties and/or reputational damage. In this regard, government authorities, including the bank regulatory agencies, are pursuing aggressive enforcement actions with respect to compliance and other legal matters involving financial activities, which heightens the risks associated with actual and perceived compliance failures. See “Supervision and Regulation” included in Item 1. Business of this Report for a more detailed description of the certain regulatory requirements applicable to the Bank.
CARTER BANK & TRUST
ITEM 1A. RISK FACTORS (continued)
The Bank’s profitability depends significantly on local economic conditions.
The Bank’s success depends primarily on the general economic conditions of the geographic markets in which it operates, primarily in Virginia and North Carolina. The local economic conditions in the areas where it operates have a significant impact on its commercial, real estate and construction loans, the ability of its borrowers to repay their loans and the value of the collateral securing these loans and on customer demand for loans, deposits and other bank products. A significant decline in general economic conditions, including a decline caused by the COVID-19 pandemic, inflation, recession, acts of terrorism, outbreak of hostilities or other international or domestic calamities, unemployment or other factors, all of which are beyond the Bank’s control, could impact these local economic conditions and negatively affect the Bank’s financial results.
The Basel III Final Rules require higher levels of capital and liquid assets, which could adversely affect the Bank’s net income and return on equity.
The Basel III Final Rules represent the most comprehensive overhaul of the U.S. banking capital framework in over two decades. This new capital framework and related changes to the standardized calculations of risk-weighted assets are complex and create additional compliance burdens, especially for community banks. The Basel III Final Rules require bank holding companies and their subsidiaries, such as the Bank, to maintain significantly more capital as a result of higher required capital levels and more demanding regulatory capital risk weightings and calculations. The stricter capital requirements were fully implemented on January 1, 2019. See “Supervision and Regulation” included in Item 1. Business of this Report for a more detailed description of the Basel III Final Rules applicable to the Bank.
As a result of the Basel III Final Rules, many community banks could be forced to limit banking operations, activities and growth of loan portfolios, in order to focus on retention of earnings to improve capital levels. The Bank believes that it maintains sufficient levels of Tier 1 and Common Equity Tier 1 capital to comply with the Basel III Final Rules. However, the Bank can offer no assurances with regard to the ultimate effect of the Basel III Final Rules, and satisfying increased capital requirements imposed by the Basel III Final Rules may require the Bank to limit its banking operations, raise additional capital, retain net income or reduce dividends to improve regulatory capital levels, which could negatively affect our business, financial condition and results of operations. In addition, the Bank could be subject to regulatory actions if it were unable to comply with such requirements.
CARTER BANK & TRUST
ITEM 1A. RISK FACTORS (continued)
The Bank faces strong competition from financial services companies and other companies that offer banking services which could negatively affect its business.
The Bank conducts its banking operations primarily in Virginia and North Carolina, including Fredericksburg, Charlottesville, Lynchburg, Roanoke, Christiansburg, Martinsville, Danville, Greensboro, Fayetteville, and Mooresville. Increased competition in these markets may result in reduced loans and deposits. Ultimately, the Bank may not be able to compete successfully against current and future competitors. Many competitors offer the same banking services that the Bank offers in its service area. These competitors include national banks, regional banks and other community banks. The Bank also faces competition from many other types of financial institutions, including without limitation, savings and loan institutions, finance companies, brokerage firms, insurance companies, credit unions, mortgage banks and other financial intermediaries. In particular, The Bank’s competitors include several major financial companies whose greater resources may afford them a marketplace advantage by enabling them to maintain numerous banking locations and ATMs, conduct extensive promotional and advertising campaigns and offer a wider range of products, services and technologies.
Additionally, banks and other financial institutions with larger capitalization and financial intermediaries not subject to bank regulatory restrictions have larger lending limits and are thereby able to serve the credit needs of larger customers. Areas of competition include interest rates for loans and deposits, efforts to obtain deposits, and range and quality of products and services provided, including new technology-driven products and services. Technological innovation continues to contribute to greater competition in domestic and international financial services markets as technological advances enable more companies to provide financial services. The Bank also faces competition from out-of-state financial intermediaries that have opened low-end production offices or that solicit deposits in its market areas. If the Bank is unable to attract and retain banking customers, it may be unable to continue to grow its loan and deposit portfolios or may be required to increase the rates it pays on deposits or lower the rates it offers on loans and its results of operations and financial condition may otherwise be adversely affected.
A large percentage of the Bank’s loans are secured by real estate, and an adverse change in the real estate market may result in losses and adversely affect Carter Bank & Trust’s profitability.
Approximately 75% of the Bank’s loan portfolio as of December 31, 2019, was comprised of loans secured by real estate. An adverse change in the economy affecting values of real estate generally or in the market areas served by the Bank specifically could impair the value of the Bank’s collateral and its ability to sell the collateral upon foreclosure. In the event of a default with respect to any of these loans, the amounts the Bank receives upon sale of the collateral may be insufficient to recover outstanding principal and interest on the loan. As a result, the Bank’s profitability and financial condition could be negatively impacted by an adverse change in the real estate market.
CARTER BANK & TRUST
ITEM 1A. RISK FACTORS (continued)
The Bank relies on independent appraisals to determine the value of the real estate which secures a significant portion of the Bank’s loans, and the values indicated by such appraisals may not be realizable if foreclose on such loans is forced.
A significant portion of the Bank’s loan portfolio consists of loans secured by real estate. We rely on independent appraisers to estimate the value of such real estate. Appraisals are only estimates of value and the independent appraisers may make mistakes of fact or judgment that adversely affect the reliability of their appraisals. In addition, events occurring after the initial appraisal may cause the value of the real estate to increase or decrease. As a result of any of these factors, the real estate securing some of the loans may be more or less valuable than anticipated at the time the loans were made. If a default occurs on a loan secured by real estate that is less valuable than originally estimated, the Bank may not be able to recover the outstanding balance of the loan.
The Bank’s level of credit risk is increased due to the level of commercial real estate loans in its portfolio.
Approximately 48% of the Bank’s loan portfolio as of December 31, 2019, was comprised of loans secured by commercial purpose real estate, including loans related to hotels, strip malls and apartments. These loans generally carry larger loan balances and involve a greater degree of financial and credit risk than loans secured by residential real estate. Repayment of these loans is often dependent on the success of the borrower’s underlying business and the borrower’s ability to generate a positive cash flow sufficient to service its debts. The increased financial and credit risk associated with these loans is a result of several factors, including the concentration of principal in a limited number of loans and to borrowers in similar lines of business, the size of the loan balances, general economic conditions affecting values of real estate, and the existence of a market for the subject collateral. The ongoing adverse economic effects of the COVID-19 pandemic will likely exacerbate the financial and credit risk associated with these loans.
The Bank’s exposure to hospitality at December 31, 2019 equated to approximately $499.4 million, or 17.3% of total portfolio loans. These were mostly loans secured by upscale or top tier flagged hotels, which have historically exhibited low leverage and strong operating cash flows. However, the Bank anticipates that a significant portion of the Bank’s borrowers in the hotel industry will continue to endure significant economic distress, which has caused, and may continue to cause, them to draw on their existing lines of credit with other financial institutions and adversely affect their ability to repay existing indebtedness, and is expected to adversely impact the value of collateral. These developments, together with economic conditions generally, are also expected to impact our commercial real estate portfolio. As a result, we anticipate that our financial condition, capital levels and results of operations could be adversely affected.
Allowance for loan losses may be insufficient.
All borrowers carry the potential to default and our remedies to recover may not fully satisfy money previously loaned. We maintain an allowance for loan losses, which is a reserve established through a provision for loan losses charged to expense, which represents management’s best estimate of probable credit losses that have been incurred within the existing portfolio of loans. The allowance, in the judgment of management, is adequate to reserve for estimated loan losses and risks inherent in the loan portfolio. The level of the allowance for loan losses reflects management’s continuing evaluation of industry concentrations, specific credit risks, loan loss experience, current loan portfolio quality, present economic conditions and unidentified losses in the current loan portfolio. The determination of the appropriate level of the allowance for loan losses inherently involves a high degree of subjectivity and requires us to make significant estimates of current credit risks using existing qualitative and quantitative information, all of which may undergo material changes. Changes in economic conditions affecting borrowers, new information regarding existing loans, identification of additional problem loans and other factors, both within and outside of our control, may require an increase in the allowance for loan losses. In addition, bank regulatory agencies periodically review our allowance for loan losses and may require an increase in the provision for credit losses or the recognition of additional loan charge-offs, based on judgments different than those of management. An increase in the allowance for loan losses results in a decrease in net income or losses, and possibly risk-based capital, and may have a material adverse effect on our financial condition and results of operations.
CARTER BANK & TRUST
ITEM 1A. RISK FACTORS (continued)
The adoption of ASU 2016-13, Measurement of Credit Losses on Financial Instruments, referred to as CECL, will result in a significant change in how the Bank recognizes credit losses. If the assumptions or estimates used in adopting the new standard are incorrect or needs to change, there may be a material adverse impact on the results of operations and financial condition.
The Bank has elected to take advantage of Section 4014 of the CARES Act provision to temporarily delay adoption of the CECL methodology. The Bank was subject to the adoption of the CECL accounting method under Financial Accounting Standards Board (“FASB”) Accounting Standards Update 2016-03 and related amendments, Financial Instruments – Credit Losses (Topic 326). However, the Bank elected under the CARES Act to defer the implementation of CECL until the earlier of when the national emergency related to the outbreak of COVID-19 ends or December 31, 2020.
CECL replaces the incurred loss impairment methodology in current GAAP with a methodology that reflects expected credit losses and requires consideration of a broader range of reasonable and supportable information to form credit loss estimates. The measurement of expected credit losses is to be based on historical loss experience, current conditions and reasonable and supportable forecasts that affect the collectability of the reported amount. This measurement will take place at the time the financial asset is first added to the balance sheet and periodically thereafter. This differs significantly from the incurred loss mode required under current GAAP, which delays recognition until it is probable a loss has been incurred. Upon origination of a loan, the estimate of expected credit losses, and any subsequent changes to such estimate, will be recorded through provision for loan losses in our Consolidated Statements of Income. The CECL model may create more volatility in the level of our allowance for loan losses.
The CECL model permits the use of judgment in determining the approach most appropriate for the Bank, based on facts and circumstances. Changes in economic conditions affecting borrowers, new information on our loans, and other factors, both within and outside of our control, may require an increase to the allowance for loan losses. We may underestimate our expected losses and fail to maintain an allowance for loan losses sufficient to account for these losses. We will continue to periodically review and update our CECL methodology, models and the underlying assumptions, estimates and assessments we use to establish our allowance for loan losses under the CECL standard to reflect our view of current conditions and reasonable and supportable forecasts. We will implement further enhancements or changes to our methodology, models and the underlying assumptions, estimates and assessments, as needed. If the assumptions or estimates we use in adopting the new standard are incorrect or we need to change our underlying assumptions and estimates, there may be a material adverse impact on our results of operation and financial condition. For further information on our anticipated adoption of the CECL standard, see “Management’s Discussion and Analysis of Financial Condition and Results of Operations” in Item 7 of this Form 10-K.
CARTER BANK & TRUST
ITEM 1A. RISK FACTORS (continued)
The Bank is dependent on its management team, and the loss of its senior executive officers or other key employees could impair its relationship with its customers and adversely affect its business and financial results.
We believe that our growth and future success will depend in large part on the skills of our executive officers. We also depend upon the experience of the senior officers and other key personnel and their relationship with the communities they serve. The loss of the services of one or more of these officers or key personnel could have an adverse impact on the business of the Bank because of their skills, knowledge of the market, years of industry experience and the difficulty promptly finding qualified replacement personnel.
A failure in or breach of our operational or security systems or infrastructure, or those of third parties, could disrupt the Bank’s businesses, and adversely impact our results of operations, liquidity and financial condition, as well as cause reputational harm.
The Bank’s operational and security systems, infrastructure, including our computer systems, data management, and internal processes, as well as those of third parties, are integral to our business. We rely on our employees and third parties in our day-to-day and ongoing operations, who may, as a result of human error, misconduct or malfeasance, or failure or breach of third party systems or infrastructure, expose us to risk. We have taken measures to implement backup systems and other safeguards to support our operations, but our ability to conduct business may be adversely affected by any significant disruptions to us or to third parties with whom we interact. In addition, our ability to implement backup systems and other safeguards with respect to third party systems is more limited than with our own systems.
The Bank handles a substantial volume of customer and other financial transactions every day. Our financial, accounting, data processing, check processing, electronic funds transfer, loan processing, online and mobile banking, backup or other operating or security systems and infrastructure may fail to operate properly or become disabled or damaged as a result of a number of factors including events that are wholly or partially beyond our control. This could adversely affect our ability to process these transactions or provide these services. There could be sudden increases in customer transaction volume, electrical, telecommunications or other major physical infrastructure outages, natural disasters, events arising from local or larger scale political or social matters, including terrorist acts, and cyber-attacks. We continuously update these systems to support our operations and growth. This updating entails significant costs and creates risk associated with implementing new systems and integrating them with existing ones. Operational risk exposures could adversely impact our results of operations, liquidity and financial condition, and cause reputational harm.
A cyber-attack, information or security breach, or a technology failure of ours or of a third party could adversely affect the Bank’s ability to conduct business or manage exposure to risk, resulting in the disclosure or misuse of confidential or proprietary information, increase costs to maintain and update our operational systems, security systems, and infrastructure, and adversely impact results of operations, liquidity and financial condition, as well as cause reputation harm.
The Bank’s business is highly dependent on the security and efficacy of our infrastructure, computer and data management systems, as well as those of third parties with whom we interact. Cyber security risks for financial institutions have significantly increased in recent years in part because of the proliferation of new technologies, the use of the internet and telecommunications technologies to conduct financial transactions, and the increased sophistication and activities of organized crime, hackers, terrorists and other external parties, including foreign state actors. Our operations rely on the secure processing, transmission, storage and retrieval of confidential, proprietary and other information in our computer and data management systems and networks, and in the computer and data management systems and networks of third parties. We rely on digital technologies, computer, database and email systems, software, and networks to conduct our operations. In addition, to access our network, products and services, our customers and third parties may use personal mobile devices or computing devices that are outside of our network environment.
CARTER BANK & TRUST
ITEM 1A. RISK FACTORS (continued)
Financial services institutions have been subject to, and are likely to continue to be the target of, cyber-attacks, including computer viruses, malicious or destructive code, phishing attacks, denial of service or other security breaches that could result in the unauthorized release, gathering, monitoring, misuse, loss or destruction of confidential, proprietary and other information of the institution, its employees or customers or of third parties, or otherwise materially disrupt network access or business operations. For example, denial of service attacks have been launched against a number of large financial institutions and several large retailers have disclosed substantial cyber security breaches affecting debit and credit card accounts of their customers. We have not experienced cyber security incidents in the past, but there is no assurance that we will not experience an attack in the future. Technology failures, cyber-attacks or other information or security breaches can cause material losses or other material consequences.
In addition to external threats, insider threats also represent a risk to us. Insiders, having legitimate access to our systems and the information contained in them, have the opportunity to make inappropriate use of the systems and information. We have policies, procedures and controls in place designed to prevent or limit this risk, but we cannot guarantee that policies, procedures and controls fully mitigate this risk.
As cyber threats continue to evolve, we may be required to expend significant additional resources to continue to modify and enhance our protective measures or to investigate and remediate any information security vulnerabilities or incidents. Any of these matters could result in our loss of customers and business opportunities, significant disruption to our operations and business, misappropriation or destruction of our confidential information and /or that of our customers, or damage to computers or systems of our customers and/or third parties, and could result in a violation of applicable privacy laws and other laws, litigation exposure, regulatory fines, penalties or intervention, loss of confidence in our security measures, reputational damage, reimbursement or other compensatory costs, and additional compliance costs. In addition, any of the matters described above could adversely impact our results of operations and financial condition.
The Bank relies on third-party providers and other suppliers for a number of services that are important to our business. An interruption or cessation of an important service by any third-party could have a material adverse effect on our business.
The Bank is dependent for the majority of our technology, including our core operating system, on third party providers. If these companies were to discontinue providing services to us, we may experience significant disruption to our business. In addition, each of these third parties faces the risk of cyber-attack, information breach or loss, or technology failure. If any of our third party service providers experience such difficulties, or if there is any other disruption in our relationships with them, we may be required to find alternative sources of such services. We are dependent on these third party providers securing their information systems, over which we have no control, and a breach of their information systems could adversely affect our ability to process transactions, service our clients or manage our exposure to risk and could result in the disclosure of sensitive, personal customer information, which could have a material adverse impact on our business through damage to our reputation, loss of customer business, remedial costs, additional regulatory scrutiny or exposure to civil litigation and possible financial liability. Assurance cannot be provided that we could negotiate terms with alternative service sources that are as favorable or could obtain services with similar functionality as found in our existing systems without the need to expend substantial resources, if at all, thereby resulting in a material adverse impact on our business and results of operations.
CARTER BANK & TRUST
ITEM 1A. RISK FACTORS (continued)
Failure to maintain effective systems of internal control over financial reporting and disclosure controls and procedures could have a material adverse effect on the Bank’s results of operation and financial condition.
Effective internal controls over financial reporting and disclosure controls and procedures are necessary for the Bank to provide reliable financial reports and effectively prevent fraud and to operate successfully as a public company. The Bank is required to establish and maintain an adequate internal control structure over financial reporting pursuant to FDIC regulations. If the Bank cannot provide reliable financial reports or prevent fraud, its reputation and operating results would be harmed. As part of the Bank’s ongoing monitoring of internal control, it may discover material weaknesses or significant deficiencies in its internal control that require remediation. A “material weakness” is a deficiency, or a combination of deficiencies, in internal control over financial reporting, such that there is a reasonable possibility that a material misstatement of a company’s annual or interim financial statements will not be prevented or detected on a timely basis.
As disclosed in Part II, Item 9A, a material weakness was identified as of December 31, 2019, in our controls over the completeness and accuracy of impaired loans, including calculations and supporting information. A material weakness related to ineffective control of the valuation and existence of complex collateral associated with two collateral-dependent impaired loans. The Bank relied on stale appraisal information in order to support the underlying assumptions and methodologies to determine fair value and existence of the complex collateral. The appraisals were incomplete and did not adequately support the valuation and existence of the complex collateral which was identified and included in Management’s Report on Internal Control over Financial Reporting.
Management is committed to continuing efforts to improve the design and operation of our internal controls, including taking all necessary steps to remediate the material weakness identified above. We are addressing the material weakness by defining expectations for validating assumptions accompanying appraisals and plan to test in 2020.
The Bank’s inability to maintain the operating effectiveness of the controls described above could result in a material misstatement to the Bank’s financial statements or other disclosures, which could have an adverse effect on its business, financial condition or results of operations. In addition, any failure to maintain effective controls or to timely effect any necessary improvement of the Bank’s internal and disclosure controls could, among other things, result in losses from fraud or error, harm the Bank’s reputation or cause investors to lose confidence in its reported financial information, all of which could have a material adverse effect on its results of operation and financial condition.
The market price of the Bank’s common stock may fluctuate significantly in response to a number of factors.
The Bank’s operating results may fluctuate due to a variety of factors, many of which are outside of our control, including the changing U.S. economic environment and changes in the commercial and residential real estate market, any of which may cause the Bank’s stock price to fluctuate. If the Bank’s operating results fall below the expectation of investors or securities analysts, the price of the Bank’s common stock could decline substantially.
CARTER BANK & TRUST
ITEM 1A. RISK FACTORS (continued)
The Bank’s stock price can fluctuate significantly in response to a variety of factors including, among other things:
| · | volatility of stock market prices and volumes in general; |
| · | changes in market valuations of similar companies; |
| · | changes in the conditions of credit markets; |
| · | changes in accounting policies or procedures as required by the Financial Accounting Standards Board, or other regulatory agencies; |
| · | legislative and regulatory actions, including the impact of the Dodd-Frank Act and related regulations, that may subject the Bank to additional regulatory oversight which may result in increased compliance costs and/or require the Bank to change its business model; |
| · | government intervention in the U.S. financial system and the effects of and changes in trade and monetary and fiscal policies and laws, including the interest rate policies of the FRB; |
| · | additions or departures of key members of management; |
| · | fluctuations in the Bank’s quarterly or annual operating results; and |
| · | changes in analysts’ estimates of financial performance. |
The Bank’s risk management framework may not be effective in mitigating risk and loss.
The Bank maintains an enterprise risk management program that is designed to identify, quantify, monitor, report and control the risks we face. These risks include, but are not limited to, interest rate, credit, liquidity, operational, reputation, legal, compliance, economic and litigation risk. Although we assess our risk management program on an ongoing basis and make identified improvements to it, the Bank can offer no assurances that this approach and risk management framework (including related controls) will effectively mitigate the risks listed above or limit losses that we may incur.
If our risk management program has flaws or gaps, or if our risk management controls do not function effectively, our results of operations, financial condition or business may be adversely affected.
The Bank’s real estate lending business can result in increased costs associated with Other Real Estate Owned (“OREO”).
Because the Bank originates loans secured by real estate, it may have to foreclose on the collateral property to protect our investment and may thereafter own and operate such property, in which case we are exposed to the risks inherent in the ownership of real estate. The Bank uses methods for valuing collateral for impaired loans and OREO that are in compliance with ASC 310 (“Accounting Standards Codification 310”) Receivables. The methods require the use of assumptions that are subject to change based on events impacting real estate values. The amount that we may realize after a default is dependent upon factors outside of our control, including, but not limited to, general or local economic conditions, environmental cleanup liability, neighborhood values, interest rates, real estate tax rates, operating expenses of the mortgaged properties, and supply of and demand for properties. Certain expenditures associated with the ownership of income producing real estate, principally real estate taxes and maintenance costs, may adversely affect the net cash flows generated by the real estate. Therefore, the cost of operating income-producing real property may exceed the rental income earned from such property, and we may have to advance funds to protect our investment or we may be required to dispose of the real property at a loss.
CARTER BANK & TRUST
ITEM 1A. RISK FACTORS (continued)
We rely substantially on deposits obtained from customers in our target markets to provide liquidity and support growth.
Our primary funding and liquidity source to support our business strategies is a stable customer deposit base. Deposit levels may be affected by a number of factors, including interest rates paid by competitors, general interest rate levels, returns available to customers on alternative investments and general economic conditions. If our deposit levels fall, we could lose a relatively low-cost source of funding and our interest expense would likely increase as we obtain alternative funding to replace lost deposits. If local customer deposits are not sufficient to fund our normal operations and growth, we will look to outside sources, such as Fed Funds lines with other financial institutions or additional borrowings with the Federal Home Loan Bank of Atlanta (“FHLB”). We may also seek to raise funds through the issuance of shares of our common stock, or other equity or equity-related securities, or debt securities including subordinated notes as additional sources of liquidity. If we are unable to access funding sufficient to support our business operations and growth strategies or are only able to access such funding on unattractive terms, we may not be able to implement our business strategies which may negatively affect our financial performance.
The Bank’s ability to meet contingency funding needs, in the event of a crisis that causes a disruption to our core deposit base, is dependent on access to wholesale markets, including funds provided by the FHLB of Atlanta.
The Bank owns stock in the FHLB of Atlanta, in order to qualify for membership in the FHLB system, which enables us to borrow on our line of credit with the FHLB that is secured by a blanket lien on select commercial loans, residential mortgages and investment securities available-for-sale and is estimated to be equal to 25% of the Bank’s assets approximating $1.0 billion, with available borrowing capacity subject to the amount of eligible collateral pledged at any given time. Changes or disruptions to the FHLB or the FHLB system in general may materially impact our ability to meet short and long-term liquidity needs or meet growth plans. Additionally, we cannot be assured that the FHLB will be able to provide funding to us when needed, nor can we be certain that the FHLB will provide funds specifically to us, should our financial condition and/or our regulators prevent access to our line of credit. The inability to access this source of funds could have a materially adverse effect on our ability to meet our customer’s needs. Our financial flexibility could be severely constrained if we were unable to maintain our access to funding or if adequate financing is not available at acceptable interest rates.
The Bank’s earnings are significantly affected by the fiscal and monetary policies of the federal government and its agencies.
The policies of the FRB affect the Bank significantly. The FRB regulates the supply of money and credit in the United States. Its policies directly and indirectly influence the rate of interest earned on loans and paid on borrowings and interest-bearing deposits and can also affect the value of financial instruments we hold. Those policies determine, to a significant extent, our cost of funds for lending and investing. Changes in those policies are beyond our control and are difficult to predict. FRB policies can also affect our borrowers, potentially increasing the risk that they may fail to repay their loans. For example, a tightening of the money supply by the FRB could reduce the demand for a borrower's products and services. This could adversely affect the borrower’s earnings and ability to repay a loan, which could have a material adverse effect on our financial condition and results of operations.
CARTER BANK & TRUST
ITEM 1A. RISK FACTORS (continued)
Our Bank may be adversely affected by a world-wide pandemic.
Certain of the Bank’s borrowers may be affected by the recent outbreak of COVID-19 (“coronavirus”), which originated in Wuhan, Hubei Province, China but has been reported in other countries. These effects could include disruptions or restrictions in our borrowers’ supply chains, closures of their facilities or decreases in demand for their products and services. If our borrowers are adversely affected, or if the virus leads to a worldwide health crisis that impacts economic growth, our financial condition and results of operations could be adversely affected, despite having no direct operations in China.
ITEM 1B. UNRESOLVED STAFF COMMENTS
Not applicable.
ITEM 2. PROPERTIES
Carter Bank & Trust’s principal executive office is located at 1300 Kings Mountain Road in Martinsville, Virginia. There are also two other corporate administrative locations that house its operations center and various other corporate functions. We offer our community banking services through 101 combined depository locations in Virginia and North Carolina at December 31, 2019. Seventy-six offices are located in Virginia and twenty-five are located in North Carolina. Four of these depository banking locations are held under lease contracts. In addition, the Bank leases a loan production office and a commercial banking office. Management believes the terms of the various leases are consistent with market standards and were arrived at through arm’s length bargaining. The leases are described in Note 8 of the Notes to Consolidated Financial Statements.
ITEM 3. LEGAL PROCEEDINGS
As of December 31, 2019, no material legal proceedings were pending or threatened against Carter Bank & Trust.
ITEM 4. MINE SAFETY DISCLOSURES
Not applicable.
CARTER BANK & TRUST
PART II
ITEM 5. MARKET FOR REGISTRANT’S COMMON EQUITY, RELATED STOCKHOLDER MATTERS AND ISSUER PURCHASES OF EQUITY SECURITIES
Market for Common Stock and Dividends
Carter Bank & Trust’s common stock began trading on NASDAQ effective March 25, 2019, under the ticker symbol “CARE.” Prior to March 25, 2019, our common stock traded on the Over the Counter (“OTCQX”) Best Market under the ticker symbol “CARE.” While trading on the OTCQX Best Market, Raymond James and Associates and Boenning and Scattergood quoted a market in Carter Bank & Trust under the symbol “CARE” on the OTCQX Best Market. Those over-the-counter market quotations reflected inter-dealer prices, without retail mark-up, mark-down or commission and did not necessarily reflect actual transactions.
The Bank’s common stock last traded at $8.15 on June 4, 2020 the last completed trading day before the filing of this Report.
As of June 2, 2020, there were 26,384,801 shares of common stock of Carter Bank & Trust outstanding, held by 2,483 shareholders of record.
Dividends
On October 14, 2016, the Board of Directors (the "Board") of Carter Bank & Trust (the "Bank") determined that it was prudent not to declare a quarterly cash dividend on the Bank's common stock beginning in the fourth quarter of 2016. Given the Bank's history of paying a quarterly cash dividend on its common stock, this decision was an extremely difficult one and one that the Board did not take lightly. However, the Board believes this decision is necessary and appropriate as the Bank commits additional resources to assist with regulatory compliance and makes significant investments in new technology and human resources. While recognizing the importance of dividends to the Bank's shareholders, the Board determined that preservation of capital is of paramount importance at this time.
The Board of the Bank announced on February 11, 2020 the declaration of a special one-time cash dividend of $0.14 per share. This dividend was paid on March 3, 2020 to shareholders of record as of February 18, 2020. The Board emphasized that this was a one-time dividend and there are no immediate plans to reinstate a quarterly dividend. The amount and timing of future dividends, if any, remain subject to the discretion of the Bank’s Board and will depend upon a number of factors, including future earnings, financial condition, liquidity and capital requirements of the Bank, applicable governmental regulations and other factors deemed relevant by the Board. The Board believed that it was appropriate to return some of our excess capital to our shareholders since our recent strategy of capital retention has resulted in capital levels that are well above the well-capitalized levels of federal banking regulatory agencies.
CARTER BANK & TRUST
ITEM 5. MARKET FOR REGISTRANT’S COMMON EQUITY, RELATED STOCKHOLDER MATTERS AND ISSUER PURCHASES OF EQUITY SECURITIES (continued)
Five-Year Cumulative Total Return
The following chart compares the cumulative total shareholder return on our common stock with the cumulative total return of the NASDAQ Composite Index and SNL Bank and Thrift Index, which includes the stocks of banks, thrifts and bank and financial holding companies listed on all major exchanges (NYSE, AMEX, NASDAQ) S&P Global Market Intelligence’s coverage universe.
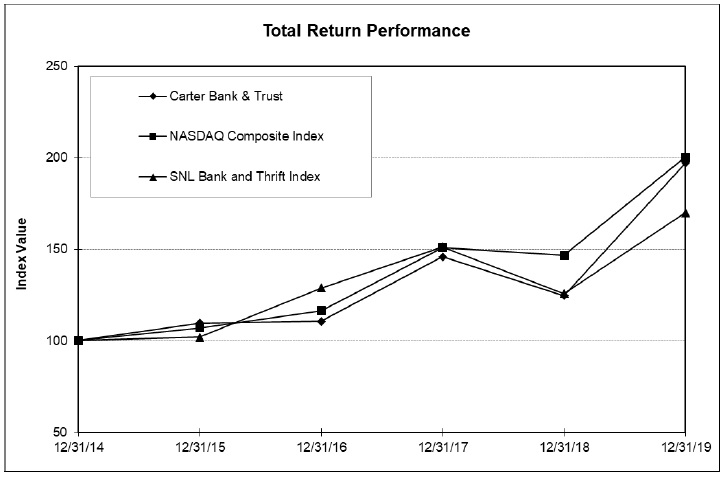
| | | Period Ending | |
| Index | | 12/31/14 | | | 12/31/15 | | | 12/31/16 | | | 12/31/17 | | | 12/31/18 | | | 12/31/19 | |
| Carter Bank & Trust | | | 100.00 | | | | 109.72 | | | | 110.53 | | | | 145.96 | | | | 124.75 | | | | 197.27 | |
| NASDAQ Composite Index | | | 100.00 | | | | 106.96 | | | | 116.45 | | | | 150.96 | | | | 146.67 | | | | 200.49 | |
| SNL Bank and Thrift Index | | | 100.00 | | | | 102.02 | | | | 128.80 | | | | 151.45 | | | | 125.81 | | | | 170.04 | |
Repurchases of Shares of Common Stock
Carter Bank & Trust did not repurchase any shares of its common stock during 2019.
CARTER BANK & TRUST
ITEM 6. SELECTED FINANCIAL DATA
The tables below summarize selected consolidated financial data as of the dates or for the periods presented and should be read in conjunction with Management’s Discussion and Analysis of Financial Condition and Results of Operations in Part II, Item 7 and the Consolidated Financial Statements and Supplementary Data in Part II, Item 8 of this Report:
| (Dollars in Thousands except per Share Data) | | For the Year Ended December 31, | |
| Five-Year Selected Financial Data | | 2019 | | | 2018 | | | 2017 | | | 2016 | | | 2015 | |
| Balance Sheet Summary | | | | | | | | | | | | | | | | | | | | |
| (At End of Period) | | | | | | | | | | | | | | | | | | | | |
| Total Assets | | $ | 4,006,108 | | | $ | 4,039,599 | | | $ | 4,112,292 | | | $ | 4,505,529 | | | $ | 4,893,968 | |
| Securities Available-for-Sale, at Fair Value | | | 742,617 | | | | 782,758 | | | | 947,201 | | | | - | | | | - | |
| Securities Held-to-Maturity, at Cost | | | - | | | | - | | | | - | | | | 879,694 | | | | 1,422,101 | |
| Loans Held-for-Sale | | | 19,714 | | | | 2,559 | | | | 517 | | | | - | | | | - | |
| Portfolio Loans | | | 2,884,766 | | | | 2,703,792 | | | | 2,684,445 | | | | 2,731,783 | | | | 2,638,852 | |
| Allowance for Loan Losses | | | (38,762 | ) | | | (39,199 | ) | | | (35,318 | ) | | | (34,500 | ) | | | (26,990 | ) |
| Goodwill and Other Intangibles | | | 62,192 | | | | 62,192 | | | | 63,350 | | | | 63,261 | | | | 63,294 | |
| Noninterest-Bearing Deposits | | | 554,875 | | | | 547,773 | | | | 530,242 | | | | 534,923 | | | | 534,005 | |
| Interest-Bearing Deposits | | | 2,949,370 | | | | 3,043,408 | | | | 3,139,373 | | | | 3,528,916 | | | | 3,920,556 | |
| Total Deposits | | | 3,504,245 | | | | 3,591,181 | | | | 3,669,615 | | | | 4,063,839 | | | | 4,454,561 | |
| Other Liabilities | | | 28,752 | | | | 12,204 | | | | 10,551 | | | | 7,040 | | | | 12,858 | |
| Total Liabilities | | | 3,532,997 | | | | 3,603,385 | | | | 3,680,166 | | | | 4,070,879 | | | | 4,467,419 | |
| Retained Earnings | | | 304,158 | | | | 277,835 | | | | 265,930 | | | | 266,214 | | | | 258,113 | |
| Accumulated Other Comprehensive Income (Loss) | | | 127 | | | | (10,066 | ) | | | (2,240 | ) | | | - | | | | - | |
| Total Shareholders' Equity | | | 473,111 | | | | 436,214 | | | | 432,126 | | | | 434,650 | | | | 426,549 | |
| | | | | | | | | | | | | | | | | | | | | |
| Summary of Earnings | | | | | | | | | | | | | | | | | | | | |
| Interest Income | | $ | 159,120 | | | $ | 152,019 | | | $ | 144,084 | | | $ | 147,648 | | | $ | 152,479 | |
| Interest Expense | | | 46,773 | | | | 38,114 | | | | 37,111 | | | | 46,382 | | | | 47,797 | |
| Provision for Loan Losses | | | 3,404 | | | | 16,870 | | | | 43,197 | | | | 17,717 | | | | 3,300 | |
| Net Interest Income after Provision for Loan Losses | | | 108,943 | | | | 97,035 | | | | 63,776 | | | | 83,549 | | | | 101,382 | |
| Noninterest Income | | | 16,870 | | | | 16,986 | | | | 12,591 | | | | 12,494 | | | | 14,685 | |
| Noninterest Expense | | | 98,029 | | | | 99,713 | | | | 94,579 | | | | 78,419 | | | | 66,668 | |
| Net Income (Loss) before Taxes | | | 27,784 | | | | 14,308 | | | | (18,212 | ) | | | 17,624 | | | | 49,399 | |
| Income Tax Provision (Benefit) | | | 1,209 | | | | 2,403 | | | | (17,531 | ) | | | 1,645 | | | | 10,241 | |
| Net Income (Loss) | | $ | 26,575 | | | $ | 11,905 | | | $ | (681 | ) | | $ | 15,979 | | | $ | 39,158 | |
| | | | | | | | | | | | | | | | | | | | | |
| Earnings (Loss) per Share | | | | | | | | | | | | | | | | | | | | |
| Basic and Diluted | | $ | 1.01 | | | $ | 0.45 | | | $ | (0.03 | ) | | $ | 0.61 | | | $ | 1.49 | |
| Cash Dividends Declared per Share | | $ | - | | | $ | - | | | $ | - | | | $ | 0.30 | | | $ | 0.40 | |
| | | | | | | | | | | | | | | | | | | | | |
| Selected Ratios | | | | | | | | | | | | | | | | | | | | |
| Return on average assets | | | 0.65 | % | | | 0.29 | % | | | -0.02 | % | | | 0.33 | % | | | 0.82 | % |
| Return on average equity | | | 5.76 | % | | | 2.75 | % | | | -0.15 | % | | | 3.63 | % | | | 9.51 | % |
| Equity to Assets | | | 11.81 | % | | | 10.80 | % | | | 10.51 | % | | | 9.65 | % | | | 8.72 | % |
| Total Risk-based capital | | | 14.71 | % | | | 15.11 | % | | | 14.05 | % | | | 13.25 | % | | | 11.94 | % |
| Leverage Ratio | | | 10.33 | % | | | 9.61 | % | | | 9.25 | % | | | 8.03 | % | | | 7.54 | % |
| Dividend Payout | | | 0.00 | % | | | 0.00 | % | | | 0.00 | % | | | 49.30 | % | | | 26.85 | % |
CARTER BANK & TRUST
ITEM 7. MANAGEMENT’S DISCUSSION AND ANALYSIS OF FINANCIAL CONDITION AND RESULTS OF OPERATIONS
This section reviews our financial condition for each of the past two years and results of operations for each of the past three years. Certain reclassifications have been made to prior periods to place them on a basis comparable with the current period presentation. Some tables may include additional time periods to illustrate trends within our Consolidated Financial Statements. The results of operations reported in the accompanying Consolidated Financial Statements are not necessarily indicative of results to be expected in future periods.
Important Note Regarding Forward-Looking Statements
This Annual Report on Form 10-K contains or incorporates statements that we believe are “forward-looking statements” within the meaning of the Private Securities Litigation Reform Act of 1995. Forward-looking statements generally relate to our financial condition, results of operations, plans, objectives, outlook for earnings, revenues, expenses, capital and liquidity levels and ratios, asset levels, asset quality, financial position, and other matters regarding or affecting Carter Bank & Trust and its future business and operations. Forward looking statements are typically identified by words or phrases such as “will likely result,” “expect,” “anticipate,” “estimate,” “forecast,” “project,” “intend,” “ believe,” “assume,” “strategy,” “trend,” “plan,” “outlook,” “outcome,” “continue,” “remain,” “potential,” “opportunity,” “believe,” “comfortable,” “current,” “position,” “maintain,” “sustain,” “seek,” “achieve” and variations of such words and similar expressions, or future or conditional verbs such as will, would, should, could or may. Although we believe the assumptions upon which these forward-looking statements are based are reasonable, any of these assumptions could prove to be inaccurate and the forward-looking statements based on these assumptions could be incorrect. The matters discussed in these forward-looking statements are subject to various risks, uncertainties and other factors that could cause actual results and trends to differ materially from those made, projected, or implied in or by the forward-looking statements depending on a variety of uncertainties or other factors including, but not limited to: credit losses; loan quality; levels of net charge-offs; changes in appraised values of collateral securing loans; the Bank’s liquidity and capital positions; interest rates; the potential adverse effects of unusual and infrequently occurring events, such as weather-related disasters, terrorist acts or public health events (such as the current COVID-19 pandemic), and of governmental and societal responses thereto; these potential adverse effects may include, without limitation, adverse effects on the ability of the Bank's borrowers to satisfy their obligations to the Bank, on the value of collateral securing loans, on the demand for the Bank's loans or its other products and services, on incidents of cyberattack and fraud, on the Bank’s liquidity or capital positions, on risks posed by reliance on third-party service providers, on other aspects of the Bank's business operations and on financial markets and economic growth; rates of customer loan payoffs; cyber-security concerns; rapid technological developments and changes; the impact of the information technology systems upgrade; efforts to restructure the balance sheet; sensitivity to the interest rate environment including a prolonged period of low interest rates, a rapid increase in interest rates or a change in the shape of the yield curve; a change in spreads on interest-earning assets and interest-bearing liabilities; our ability to retain existing deposits and attract new deposits; regulatory supervision and oversight; legislation affecting the financial services industry as a whole, and Carter Bank & Trust in particular; the outcome of pending and future litigation and governmental proceedings; increasing price and product/service competition; the ability to continue to introduce competitive new products and services on a timely, cost-effective basis; containing costs and expenses; reliance on significant customer relationships; general economic or business conditions; deterioration of the housing market and reduced demand for mortgages; deterioration in the overall macroeconomic conditions or the state of the banking industry that could warrant further analysis of the carrying value of goodwill and could result in an adjustment to its carrying value resulting in a non-cash charge to net income; re-emergence of turbulence in significant portions of the global financial and real estate markets that could impact our performance, both directly, by affecting our revenues and the value of our assets and liabilities, and indirectly, by affecting the economy generally and access to capital in the amounts, at the times and on the terms required to support our future businesses; and the risk factors discussed in Part I, Item 1A, Risk Factors of this Report or contained in any of our subsequent filings with the FDIC. Forward-looking statements are based on beliefs and assumptions using information available at the time the statements are made. We caution you not to unduly rely on forward-looking statements because the assumptions, beliefs, expectations and projections about future events may, and often do, differ materially from actual results. Any forward-looking statement speaks only as to the date on which it is made, and we undertake no obligation to update any forward-looking statement to reflect developments occurring after the statement is made.
CARTER BANK & TRUST
ITEM 7. MANAGEMENT’S DISCUSSION AND ANALYSIS OF FINANCIAL CONDITION AND RESULTS OF OPERATIONS (continued)
Explanation of Use of Non-GAAP Financial Measures
In addition to the results of operations presented in accordance with generally accepted accounting principles (“GAAP”) in the United States, management uses, and this annual report references, net interest income on a fully taxable equivalent, or (“FTE”), basis, which is a non-GAAP financial measure. Management believes this measure provides information useful to investors in understanding our underlying business, operational performance and performance trends as it facilitates comparisons with the performance of other companies in the financial services industry. Although management believes that this non-GAAP financial measure enhances an investors’ understanding of our business and performance, this non-GAAP financial measure should not be considered an alternative to GAAP or considered to be more important than financial results determined in accordance with GAAP, nor is it necessarily comparable with similar non-GAAP measures which may be presented by other companies.
The Bank believes the presentation of net interest income on an FTE basis ensures the comparability of net interest income arising from both taxable and tax-exempt sources and is consistent with industry practice. Net interest income per the Consolidated Statements of Income (Loss) is reconciled to net interest income adjusted to an FTE basis in the Net Interest Income section of the "Results of Operations – Year ended December 31, 2019."
COVID-19 Subsequent Event and Recent Developments
In December 2019, in Wuhan, China, a novel strain of coronavirus causing a previously unknown disease (“COVID-19”) was reported in Wuhan, China. The World Health Organization (the “WHO”) declared the outbreak to constitute a Public Health Emergency of International Concern on January 30, 2020. Over the course of the first quarter of 2020, COVID-19 developed into a worldwide outbreak and, on March 11, 2020, the WHO characterized COVID-19 as a pandemic. On March 13, 2020, President Trump issued a proclamation declaring a national state of emergency in response to COVID-19. During the final two weeks of March 2020, the governors of multiple U.S. states, including Virginia, where the Bank has its principal place of business, and North Carolina, where the Bank has significant operations, issued stay-at-home orders that directed the closing of non-essential businesses and restricted public gatherings. The COVID-19 pandemic continues to grow in the Bank’s areas of operation, the United States and across the globe. The pandemic has severely disrupted supply chains and adversely affected production, demand, sales and employee productivity across a range of industries and dramatically increased unemployment in the Bank’s areas of operation and nationally. These events have affected the Bank’s operations in the first quarter of 2020 and are expected to impact the Bank’s financial results throughout fiscal year 2020. The extent of the impact of the COVID-19 pandemic on the Bank’s operational and financial performance will depend on certain developments, including the duration and spread of the outbreak, the impact on the Bank’s customers, employees and vendors and the nature and effect of past and future federal and state governmental and private sector responses to the pandemic, all of which are uncertain and cannot be predicted.
CARTER BANK & TRUST
ITEM 7. MANAGEMENT’S DISCUSSION AND ANALYSIS OF FINANCIAL CONDITION AND RESULTS OF OPERATIONS (continued)
Future developments with respect to COVID-19 are highly uncertain and cannot be predicted and new information may emerge concerning the severity of the outbreak and the actions to contain the outbreak or treat its impact, among others. Other national health concerns, including the outbreak of other contagious diseases or pandemics may adversely affect us in the future.
In response to the COVID-19 pandemic, the Coronavirus Aid, Relief, and Economic Security Act (the “CARES Act”) was signed into law by President Trump on March 27, 2020. The CARES Act is an emergency stimulus measure providing assistance and relief in a variety of ways to certain individuals, businesses, and industries. The CARES Act established a $2 trillion economic stimulus package, including cash payments to individuals, supplemental unemployment insurance benefits and a $349 billion loan program administered through the U.S. Small Business Administration (“SBA”), referred to as the paycheck protection program (“PPP”). In addition to the general impact of COVID-19, certain provisions of the CARES act as well as other legislative and regulatory relief efforts are expected to have a material impact on our operation. It is impossible to determine the extent of these impacts at the date of this filing; therefore, we are disclosing potentially material items of which we are aware.
Many of the CARES Act’s programs are dependent upon the direct involvement of U.S. financial institutions and will be implemented through rules and guidance adopted by federal departments and agencies, including the U.S. Department of the Treasury, the FDIC, the FRB and other federal bank regulatory authorities, including those with direct supervisory jurisdiction over the Bank.
Set forth below is a brief overview of certain provisions of the CARES Act and certain other regulations and supervisory guidance related to the COVID-19 pandemic that are applicable to the operations and activities of the Bank. The following description is qualified in its entirety by reference to the full text of the CARES Act and the statutes, regulations, and policies described herein. Such statutes, regulations, and policies are subject to ongoing review by U.S. Congress and federal regulatory authorities. Future amendments to the provisions of the CARES Act or changes to any of the statutes, regulations, or regulatory policies applicable to the Bank could have a material effect on the Bank. Many of the requirements called for in the CARES Act and related regulations and supervisory guidance will be implemented over time and most will be subject to implementing regulations over the course of the coming weeks. The Bank will continue to assess the impact of the CARES Act and other statutes, regulations and supervisory guidance related to the COVID-19 pandemic.
FRB Reserve Programs and Initiatives
The CARES Act encourages the FRB, in coordination with the Secretary of the Treasury, to establish or implement various programs to help midsize businesses, nonprofits, and municipalities, including (i) a Midsize Business/Nonprofit Organization Program to provide financing to banks and other lenders to make direct loans to eligible businesses and nonprofit organizations with between 500 and 10,000 employees and (ii) the Municipal Liquidity Facility, provide liquidity to the financial system that supports states and municipalities. On April 9, 2020, the FRB announced and solicited comments regarding the Main Street Lending Program, which would implement certain of these recommendations. Further action regarding the Main Street Lending Program is expected soon.
CARTER BANK & TRUST
ITEM 7. MANAGEMENT’S DISCUSSION AND ANALYSIS OF FINANCIAL CONDITION AND RESULTS OF OPERATIONS (continued)
Separately and in response to COVID-19, the FRB’s Federal Open Market Committee (the “FOMC”) has set the federal funds target rate – i.e., the interest rate at which depository institutions such as the Bank lend reserve balances to other depository institutions overnight on an uncollateralized basis – to an historic low. On March 16, 2020, the FOMC set the federal funds target rate at 0-0.25%. Consistent with FRB policy, the FRB has committed to the use of overnight reverse repurchase agreements as a supplementary policy tool, as necessary, to help control the federal funds rate and keep it in the target range set by the FOMC.
In addition, the FRB has expanded the size and scope of three existing programs to mitigate the economic impact of the COVID-19 outbreak: (i) the Primary Market Corporate Credit Facility; (ii) the Secondary Market Corporate Credit Facility; and (iii) the Term Asset-Backed Securities Loan Facility. The FRB has also established two new program facilities – the Money Market Mutual Fund Liquidity Facility and the Commercial Paper Funding Facility – to broaden its support for the flow of credit to households and businesses during COVID-19.
Temporary Regulatory Capital Relief related to Impact of CECL
Concurrent with the enactment of the CARES Act, the federal bank regulatory authorities issued an interim final rule to provide banking organizations that are required to implement CECL before the end of 2020 the option to delay the estimated impact on regulatory capital by up to two years, with a three-year transition period to phase out the cumulative benefit to regulatory capital provided during the two-year delay.
Temporary Bank Secrecy Act (“BSA”) Reporting Relief
The U.S. Department of the Treasury’s Financial Crimes Enforcement Network (“FinCEN”) has provided targeted relief from certain BSA reporting requirements and have provided updated guidance to financial institutions on complying with such requirements during COVID-19. Specifically, FinCEN has (i) granted targeted relief to financial institutions participating in the PPP, stating that PPP loans to existing customers will not require re-verification under applicable BSA requirements, unless re-verification is otherwise required under the financial institution’s risk-based BSA compliance program, (ii) acknowledged that there may be “reasonable delays in compliance” due to COVID-19, and (iii) temporarily suspended implementation if its February 2020 ruling, which would have entailed significant changes to currency transaction reporting filing requirements for transactions involving sole proprietorships and entities operating under a “doing business as” or other assumed name.
Bank’s Response to COVID-19
Lending Operations
The Bank has elected to take advantage of Section 4014 of the CARES Act provision to temporarily delay adoption of the CECL methodology. The Bank was subject to the adoption of the CECL accounting method under Financial Accounting Standards Board (“FASB”) Accounting Standards Update 2016-03 and related amendments, Financial Instruments – Credit Losses (Topic 326). However, the Bank elected under the CARES Act to defer the implementation of CECL until the earlier of when the national emergency related to the outbreak of COVID-19 ends or December 31, 2020.
CARTER BANK & TRUST
ITEM 7. MANAGEMENT’S DISCUSSION AND ANALYSIS OF FINANCIAL CONDITION AND RESULTS OF OPERATIONS (continued)
The Bank quickly responded to the pandemic and the CARES Act, offering the option of payment deferrals, participation in the PPP, fee waivers and other relief actions to customers. Banks have been identified as essential services and have remained open during the order. The Bank continues to serve its customers through modified hours in both the drive-ins and branch services via appointment. Every opportunity is being taken to protect both customers and employees through enhanced cleaning services, social distancing and personal protective equipment requirements for both. Approximately 20% of the Bank’s workforce is working remotely.
Under the CARES Act, PPP is an amendment to the Small Business Administration (“SBA”) 7-A loan program. The Bank recently became an approved SBA 7-A lender. PPP is a guaranteed, unsecured loan program created to fund certain payroll and operating costs of eligible businesses, organizations and self-employed persons during COVID-19. Initially, $349 billion were approved and designated for PPP in order for the SBA to guarantee 100% of collective loans made under the program to eligible small businesses, nonprofits, veteran’s organizations, and tribal businesses. The Bank participated in the initial round of funding though a referral relationship with a third-party, non-bank lender. When an additional $310 billion in funds were approved and designated for PPP, the Bank opted to stand up an internal, automated loan process utilizing its core system provider. As of May 31, 2020 we had processed 538 PPP loans totaling $44 million.
The FRB implemented a liquidity facility available to financial institutions participating in the PPP. We believe we have sufficient liquidity sources to fund all pending PPP loans and to continue to provide this important service to local businesses. These loans are fully guaranteed by the SBA and do not represent a credit risk.
The Bank is providing deferrals to customers under Section 4013 of the CARES Act. These deferrals typically provide deferrals of both principal and interest for up to 180 days. At the end of the deferral period, for loan terms, payments will be applied to accrued interest first and will resume principal payments once accrued interest is current. Deferred principal will be due at maturity. For interest only loans, such as lines of credit, deferred interest will be due at maturity. As of May 31, 2020, we have had 651 commercial and consumer customers opt for deferrals with an aggregate principal balance of $1.2 billion with $30.0 million in deferred principal and interest payments. Approximately $465.9 million of these modifications were in the hospitality industry comprised of deferrals on 84 loans. The average deferment period for these customers has been 4.5 months.
| | | Number | | | Loan | | | Percent of | | | Aggregate Deferred Payments | |
| (Dollars in Thousands) | | of Loans | | | Principal | | | Outstanding | | | Principal | | | Interest | |
| Commercial | | | | | | | | | | | | | | | |
| Commercial Real Estate | | | 245 | | | $ | 778,267 | | | | 56.7 | % | | $ | 9,009 | | | $ | 13,481 | |
| Commercial and Industrial | | | 107 | | | | 110,509 | | | | 42.0 | % | | | 1,577 | | | | 1,166 | |
| Obligations of State and Political Subdivisions | | | | | | | | | | | | | | | | | | | | |
| Commercial Construction | | | 35 | | | | 179,212 | | | | 51.4 | % | | | 762 | | | | 2,199 | |
| Total Commercial Loans | | | 387 | | | | 1,067,988 | | | | 45.6 | % | | | 11,348 | | | | 16,846 | |
| Consumer | | | | | | | | | | | | | | | | | | | | |
| Residential Mortgages | | | 167 | | | | 95,198 | | | | 18.6 | % | | | 522 | | | | 1,150 | |
| Other Consumer | | | 97 | | | | 873 | | | | 1.2 | % | | | 122 | | | | 29 | |
| Consumer Construction | | | | | | | | | | | | | | | | | | | | |
| Total Consumer Loans | | | 264 | | | | 96,071 | | | | 16.0 | % | | | 644 | | | | 1,179 | |
| Total Aggregate Deferred Payments | | | 651 | | | $ | 1,164,059 | | | | 39.6 | % | | $ | 11,992 | | | $ | 18,025 | |
CARTER BANK & TRUST
ITEM 7. MANAGEMENT’S DISCUSSION AND ANALYSIS OF FINANCIAL CONDITION AND RESULTS OF OPERATIONS (continued)
Our interest income could be reduced due to COVID-19. In keeping with guidance from regulators, we are actively working with COVID-19 affected borrowers to defer their payments, interest, and fees. While interest and fees will still accrue to income, through normal GAAP accounting, should eventual credit losses on these deferred payments emerge, interest income and fees accrued would need to be reversed. In such a scenario, interest income in future periods could be negatively impacted. At this time, we are unable to project the materiality of such an impact, but recognize the breadth of the economic impact may affect our borrowers’ ability to repay in future periods.
The Bank’s exposure to hospitality at December 31, 2019 equated to approximately $499.4 million, or 17.3% of total portfolio loans. These were mostly loans secured by upscale or top tier flagged hotels, which have historically exhibited low leverage and strong operating cash flows. However, the Bank anticipates that a significant portion of the Bank’s borrowers in the hotel industry will continue to endure significant economic distress, which has caused, and may continue to cause, them to draw on their existing lines of credit with other financial institutions and adversely affect their ability to repay existing indebtedness, and is expected to adversely impact the value of collateral. These developments, together with economic conditions generally, are also expected to impact our commercial real estate portfolio. As a result, we anticipate that our financial condition, capital levels and results of operations could be adversely affected.
The allowance for loan loss at March 31, 2020 includes a reserve build of $2.6 million, driven by the economic and market conditions as a result of COVID-19. The Bank adjusted qualitative risk factors under its incurred loss model for economic conditions, changes in payment deferral procedures, expected changes in collateral values due to reduced cash flows and external factors such as government actions. Management believes the uncertainly regarding customers’ ability to repay loans could be adversely impacted by the COVID-19 pandemic given higher unemployment rates, requests for payment deferrals, temporary business shutdowns and reduced consumer and business spending.
Retail Operations
The Bank will continue to promote our digital banking options through our website. Customers are encouraged to utilize online and mobile banking tools, and our customer service and retail departments are fully staffed and available to assist customers remotely.
We have closed all branches to customer activity, except for drive-up and appointment only services. We continue to pay all employees according to their normal work schedule, even if their work has been reduced. No employees have been furloughed. Employees whose job responsibilities can be effectively carried out remotely are working from home. Employees whose critical duties require their continued presence on-site are observing social distancing and cleaning protocols.
Our fee income could be reduced due to COVID-19. In keeping with guidance from regulators, we are actively working with COVID-19 affected customers to waive fees from a variety of sources, such as, but not limited to, insufficient funds and overdraft fees and account maintenance fees, etc. These reductions in fees are thought, at this time, to be temporary in conjunction with the length of the expected COVID-19 related economic crisis. At this time, we are unable to project the materiality of such an impact, but recognize the breadth of the economic impact is likely to impact our fee income in future periods.
CARTER BANK & TRUST
ITEM 7. MANAGEMENT’S DISCUSSION AND ANALYSIS OF FINANCIAL CONDITION AND RESULTS OF OPERATIONS (continued)
Capital Resources and Liquidity
As of March 31, 2020, all of the Bank’s capital ratios were in excess of all regulatory requirements. An extended economic recession brought about by COVID-19 could adversely impact our reported regulatory capital ratios.
We maintain access to multiple sources of liquidity. Funding sources accessible to the Bank include borrowing availability at the FHLB, equal to 25% of the Bank’s assets approximating $1.0 billion, subject to the amount of eligible collateral pledged, federal funds unsecured lines with six other correspondent financial institutions in the amount of $115.0 million and access to the institutional CD market through brokered CDs and QwickRate. In addition to the above resources, the Bank also has $605.4 million of unpledged available-for-sale securities as an additional source of liquidity at March 31, 2020. If an extended recession caused large numbers of our deposit customers to withdraw their funds, we might become more reliant on volatile or more expensive sources of funding.
The Bank is monitoring and will continue to monitor the impact of the COVID-19 pandemic and has taken and will continue to take steps to mitigate the potential risks and impact on our liquidity and capital resources. Due to the economic uncertainty, we are taking a prudent approach to capital management and have established access to the FRB’s PPP Lending Facility.
Goodwill and Other Intangibles
As of March 31, 2020 goodwill and other intangible assets were not considered impaired; however, changing economic conditions that may adversely affect our performance and stock price could result in impairment, which could adversely affect earnings in future periods. As a result of our impairment analysis as of March 31, 2020, it was determined that the fair value of our goodwill exceeded its carrying value.
Critical Accounting Policies and Significant Accounting Estimates
Carter Bank & Trust’s accounting and reporting policies conform to GAAP and predominant practice in the banking industry. The preparation of financial statements in accordance with GAAP requires management to make estimates, assumptions and judgments that affect the amounts reported in the financial statements and accompanying notes. Over time, these estimates, assumptions and judgments may prove to be inaccurate or vary from actual results and may significantly affect our reported results and financial position for the period presented or in future periods. We currently view the determination of the allowance for loan losses, fair value measurements, goodwill and income taxes to be critical because they are highly dependent on subjective or complex judgments, assumptions and estimates made by management.
Allowance for Loan Losses
We account for the credit risk associated with our lending activities through the allowance and provision for loan losses. The allowance represents management’s best estimate of probable incurred losses that have been incurred in our existing loan portfolio as of the balance sheet date. The provision is a periodic charge to earnings in an amount necessary to maintain the allowance at a level that is appropriate based on management’s assessment of probable estimated losses.
CARTER BANK & TRUST
ITEM 7. MANAGEMENT’S DISCUSSION AND ANALYSIS OF FINANCIAL CONDITION AND RESULTS OF OPERATIONS (continued)
Management determines and reviews with the Board of Directors the adequacy of the allowance on a quarterly basis in accordance with the methodology described below:
| · | Individual loans are selected for review in accordance with Financial Accounting Standards Board (“FASB”) Accounting Standards Codification (“ASC”) Topic 310, “Receivables.” These are generally large balance commercial loans and commercial mortgages that are rated less than “satisfactory” based on our internal credit-rating process. |
| · | We assess whether the loans identified for review in step one are “impaired,” which means that it is probable that all amounts will not be collected according to the contractual terms of the loan agreement, which generally represents loans that management has placed on nonaccrual status. |
| · | For impaired loans we calculate the estimated fair value of the loans that are selected for review based on observable market prices, discounted cash flows or the value of the underlying collateral less costs to sell and record an allowance if needed. The Bank individually evaluates all impaired loans greater than $1.0 million for additional impairment. In addition, the Bank evaluates credits, which have complex loan structures, with balances less than $1.0 million for impairment. Impaired loans are reevaluated quarterly for additional impairment and adjustments to fair value less costs to sell are made, where appropriate. For collateral dependent loans, the first stage of our impairment analysis involves management’s inspection of the property in question to affirm the condition has not deteriorated since the previous impairment analysis date. The second stage involves an assessment of current trends in the regional market. After thorough consideration of these factors, management will either internally evaluate fair value or order a new appraisal. In circumstances where the Bank feels confident in its ability to collect and analyze salient information on the subject collateral and its surrounding real estate market, an in-house valuation shall be utilized. |
| · | We then select pools of homogeneous smaller balance loans, having similar risk characteristics, as well as unimpaired larger commercial loans, that have similar risk characteristics, for evaluation collectively under the provisions of FASB ASC Topic 450, “Contingencies.” These smaller balance loans generally include residential mortgages, consumer loans, installment loans and some commercial loans. |
| · | FASB ASC Topic 450 loans are segmented into groups with similar characteristics and an allowance for loan losses is allocated to each segment based on recent loss history and other relevant information. |
| · | We then review the results to determine the appropriate balance of the allowance for loan losses. This review includes consideration of additional factors, such as the mix of loans in the portfolio, the balance of the allowance relative to total loans and nonperforming assets, trends in the overall risk profile in the portfolio, trends in delinquencies and nonaccrual loans, and local and national economic information and industry data, including trends in the industries we believe are higher risk. |
There are many factors affecting the allowance for loan losses; some are quantitative, while others require qualitative judgment. These factors require the use of estimates related to the amount and timing of expected future cash flows, appraised values on impaired loans, estimated losses for each loan category based on historical loss experience by category, loss emergence periods for each loan category and consideration of current economic trends and conditions, all of which may be susceptible to significant judgment and change. To the extent that actual outcomes differ from estimates, additional provisions for loan losses could be required that could adversely affect our earnings or financial position in future periods. The loan portfolio represents the largest asset category on our Consolidated Balance Sheets.
CARTER BANK & TRUST
ITEM 7. MANAGEMENT’S DISCUSSION AND ANALYSIS OF FINANCIAL CONDITION AND RESULTS OF OPERATIONS (continued)
Fair Value Measurements
Fair value is the exchange price that would be received for an asset or paid to transfer a liability (exit price) in the principal or most advantageous market for the asset or liability in an orderly transaction between market participants on the measurement date. We use various valuation techniques to determine fair value, including market, income and cost approaches. There are three levels of inputs that may be used to measure fair values:
Level 1: Quoted prices (unadjusted) for identical assets or liabilities in active markets that an entity has the ability to access as of the measurement date, or observable inputs.
Level 2: Significant other observable inputs other than Level 1 prices, such as quoted prices for similar assets or liabilities, quoted prices in markets that are not active, and other inputs that are observable or can be corroborated by observable market data.
Level 3: Significant unobservable inputs that reflect an entity’s own assumptions about the assumptions that market participants would use in pricing an asset or liability.
In certain cases, the inputs used to measure fair value may fall into different levels of the fair value hierarchy. When that occurs, we classify the fair value hierarchy on the lowest level of input that is significant to the fair value measurement. We used the following methods and significant assumptions to estimate fair value:
Securities: The fair values of securities available-for-sale are determined by obtaining quoted prices on nationally recognized securities exchanges, if available. This valuation method is classified as Level 1 in the fair value hierarchy. For securities where quoted prices are not available, fair values are calculated on market prices of similar securities, or matrix pricing, which is a mathematical technique, used widely in the industry to value debt securities without relying exclusively on quoted prices for the specific securities but rather by relying on the securities’ relationship to other benchmark quoted securities. Matrix pricing relies on the securities’ relationship to similarly traded securities, benchmark curves, and the benchmarking of like securities. Matrix pricing utilizes observable market inputs such as benchmark yields, reported trades, broker/dealer quotes, issuer spreads, two-sided markets, benchmark securities, bids, offers, reference data, and industry and economic events. In instances where broker quotes are used, these quotes are obtained from market makers or broker-dealers recognized to be market participants. This valuation method is classified as Level 2 in the fair value hierarchy. For securities where quoted prices or market prices of similar securities are not available, fair values are calculated using discounted cash flows or other market indicators. This valuation method is classified as Level 3 in the fair value hierarchy.
CARTER BANK & TRUST
ITEM 7. MANAGEMENT’S DISCUSSION AND ANALYSIS OF FINANCIAL CONDITION AND RESULTS OF OPERATIONS (continued)
Impaired Loans: All loans with an outstanding balance greater than $1.0 million are evaluated for potential impairment when based on current information and events, it is probable that the Bank will be unable to collect all amounts due according to the contractual terms of the loan agreement. At the time a loan is initially identified as impaired it is evaluated for potential impairment and is adjusted, if a shortfall exists, to fair value less costs to sell.
Fair value is measured based on the value of the underlying collateral securing the loan if repayment is expected solely from the sale or operation of the collateral or present value of estimated future cash flows using the loan’s existing rate if the loan is not determined to be collateral dependent. All impaired loans with a specific reserve are classified as Level 3 in the fair value hierarchy.
Fair value for collateral dependent loans is determined using several methods. Generally, the fair value of real estate is determined based on appraisals by qualified licensed appraisers. These appraisals may utilize a single valuation approach or a combination of approaches including comparable sales and the income approach. Adjustments are routinely made in the appraisal process by the appraisers to adjust for differences between the comparable sales and income data available. These routine adjustments are made to adjust the value of a specific property relative to comparable properties for variations in qualities such as location, size, and income production capacity relative to the subject property of the appraisal. Such adjustments are typically significant and result in a Level 3 classification of the inputs for determining fair value.
Subsequent to the initial impairment date, existing impaired loans are reevaluated quarterly for additional impairment and adjustments to fair value less costs to sell are made, where appropriate. For collateral dependent loans, the first stage of our impairment analysis involves management’s inspection of the property in question to affirm the condition has not deteriorated since the previous impairment analysis date. Management also engages in conversations with local real estate professionals and market participants to determine the likely marketing time and value range for the property. The second stage involves an assessment of current trends in the regional market. After thorough consideration of these factors, management will either internally evaluate fair value or order a new appraisal. In circumstances where the Bank feels confident in its ability to collect and analyze salient information on the subject collateral and its surrounding real estate market, an in-house valuation shall be utilized. Factors which should be considered in an in-house valuation are timing of sale, location and neighborhood, size of the structure and land component, age of any improvements, and other attributes as warranted by the Bank. This determination is made on a property-by-property basis in light of circumstances in the broader economic climate and our assessment of deterioration of real estate values in the market in which the property is located. When the Bank feels it cannot collect and analyze salient information on the subject collateral or the collateral’s real estate market, a full appraisal will be utilized.
For non-collateral dependent loans, the fair value is determined by updating the present value of estimated future cash flows using the loan’s existing rate to reflect the payment schedule for the remaining life of the loan.
CARTER BANK & TRUST
ITEM 7. MANAGEMENT’S DISCUSSION AND ANALYSIS OF FINANCIAL CONDITION AND RESULTS OF OPERATIONS (continued)
Other Real Estate Owned (“OREO”): OREO is evaluated at the time of acquisition and is recorded at fair value as determined by an appraisal or evaluation, less costs to sell. After acquisition, most OREO assets are revalued every twelve months, or more frequently when deemed necessary by management based upon changes in market or collateral conditions. For smaller OREO assets with existing carrying values less than $0.5 million, management may elect to revalue the assets, at minimum, once every twenty-four months based on the size of the exposure. At December 31, 2019 Carter Bank’s OREO assets were in compliance with the Bank’s OREO policy as set forth above, and substantially all of the assets were listed for sale with credible third party real estate brokers.
At this time, we are unable to project the breadth that the economic impact of COVID-19 may have on the Bank’s current impaired loans or the susceptibility of the loan portfolio to future loan impairment.
Goodwill and Other Intangibles
Goodwill and other intangible assets with indefinite useful lives are tested for impairment at least annually and written down and charged to results of operations only in periods in which the recorded value is more than the estimated fair value. Intangible assets that have finite useful lives will continue to be amortized over their useful lives and are periodically evaluated for impairment.
As of December 31, 2019, goodwill and other intangible assets were not considered impaired; however, changing economic conditions that may adversely affect our performance and stock price could result in impairment, which could adversely affect earnings in future periods. As a result of our impairment analysis as of December 31, 2019, it was determined that the fair value of our goodwill exceeded its carrying value.
Income Taxes
We estimate income tax expense based on amounts expected to be owed to the tax jurisdictions where we conduct business. On a quarterly basis, management assesses the reasonableness of its effective tax rate based upon its current estimate of the amount and components of net income, tax credits and the applicable statutory tax rates expected for the full year.
Deferred income tax assets and liabilities are determined using the asset and liability method and are reported in the Consolidated Balance Sheets. Under this method, deferred tax assets and liabilities are recognized for the future tax consequences attributable to differences between the financial statement carrying amounts of existing assets and liabilities and their respective tax bases. If current available information raises doubt as to the realization of the deferred tax assets, a valuation allowance is established. Deferred tax assets and liabilities are measured using enacted tax rates expected to be applied to taxable income in the years in which those temporary differences are expected to be recovered or settled. Management assesses all available positive and negative evidence on a quarterly basis to estimate if sufficient future taxable income will be generated to utilize the existing deferred tax assets. The amount of future taxable income used in management’s valuation is based upon management approved forecasts, evaluation of historical earnings levels, proven ability to raise capital to support growth or during times of economic stress and consideration of prudent and feasible potential tax strategies. If future events differ from our current forecasts, a valuation allowance may be required, which could have a material impact on our financial condition and results of operations.
CARTER BANK & TRUST
ITEM 7. MANAGEMENT’S DISCUSSION AND ANALYSIS OF FINANCIAL CONDITION AND RESULTS OF OPERATIONS (continued)
Accrued taxes payable or receivable represent the net estimated amount due to or due from taxing jurisdictions and are reported in other liabilities and other assets, respectively, in the Consolidated Balance Sheets. Management evaluates and assesses the relative risks and appropriate tax treatment of transactions and filing positions after considering statutes, regulations, judicial precedent and other information and maintains tax accruals consistent with its evaluation of these relative risks and merits. Changes to the estimate of accrued taxes occur periodically due to changes in tax rates, interpretations of tax laws, the status of examinations being conducted by taxing authorities and changes to statutory, judicial and regulatory guidance. These changes, when they occur, can affect deferred taxes and accrued taxes, as well as the current period’s income tax expense and can be significant to our operating results.
Recent Accounting Pronouncements
In August 2018, the FASB issued ASU 2018-13, “Fair Value Measurement (Topic 820): Disclosure Framework—Changes to the Disclosure Requirements for Fair Value Measurement”. The amendments modify the disclosure requirements in Topic 820 to add disclosures regarding changes in unrealized gains and losses, the range and weighted average of significant unobservable inputs used to develop Level 3 fair value measurements and the narrative description of measurement uncertainty. Certain disclosure requirements in Topic 820 are also removed or modified. The amendments are effective for fiscal years beginning after December 15, 2019, and interim periods within those fiscal years. Certain of the amendments are to be applied prospectively while others are to be applied retrospectively. Early adoption is permitted. The Bank does not expect the adoption of ASU 2018-13 to have a material impact on our consolidated financial statements.
In January 2017, the FASB issued ASU No. 2017-04, “Intangibles – Goodwill and Other (Topic 350): Simplifying the Test for Goodwill Impairment”. The amendments in this ASU simplify how an entity is required to test goodwill for impairment by eliminating Step 2 from the goodwill impairment test. Step 2 measures a goodwill impairment loss by comparing the implied fair value of a reporting unit’s goodwill with the carrying amount of that goodwill. Instead, under the amendments in this ASU, an entity should perform its annual, or interim, goodwill impairment test by comparing the fair value of a reporting unit with its carrying amount. An entity still has the option to perform the qualitative assessment for a reporting unit to determine if the quantitative impairment test is necessary. Public business entities that are not SEC filers should adopt the amendments in this ASU for annual or interim goodwill impairment tests in fiscal years beginning after December 15, 2020. Early adoption is permitted for interim or annual goodwill impairment tests performed on testing dates after January 1, 2017. The Bank did not early adopt ASU 2017-04 and does not expect the adoption of ASU 2017-04 to have a material impact on our consolidated financial statements.
In June 2016, the FASB issued ASU No. 2016-13, “Financial Instruments – Credit Losses (Topic 326): Measurement of Credit Losses on Financial Instruments”, universally referred to as CECL. The amendments in this ASU, among other things, require the measurement of all expected credit losses for financial assets held at the reporting date based on historical experience, current conditions, and reasonable and supportable forecasts. Financial institutions and other organizations will now use forward-looking information to better inform their credit loss estimates. Many of the loss estimation techniques applied today will still be permitted, although the inputs to those techniques will change to reflect the full amount of expected credit losses. In addition, the ASU amends the accounting for credit losses on available-for-sale debt securities and purchased financial assets with credit deterioration. For periodic report filers that are not smaller reporting companies, such as the Bank, this standard (ASC 326) is effective as of January 1, 2020.
CARTER BANK & TRUST
ITEM 7. MANAGEMENT’S DISCUSSION AND ANALYSIS OF FINANCIAL CONDITION AND RESULTS OF OPERATIONS (continued)
The Bank has elected to take advantage of Section 4014 of the CARES Act provision to temporarily delay adoption of the CECL methodology. The Bank was subject to the adoption of the CECL accounting method under FASB Accounting Standards Update 2016-03 and related amendments, Financial Instruments – Credit Losses (Topic 326). However, the Bank elected under the CARES Act to defer the implementation of CECL until the earlier of when the national emergency related to the outbreak of COVID-19 ends or December 31, 2020.
The Bank’s CECL Committee, which includes members from Credit Administration, Accounting/Finance, Risk Management and Internal Audit, has oversight by the Chief Executive Officer, Chief Financial Officer, and Chief Credit Officer. We have engaged a third-party to assist us in developing our CECL model and to assist with evaluation of data and methodologies related to this standard.
As part of its process of adopting CECL, management implemented a third party software solution and determined appropriate loan segments, methodologies, model assumptions and qualitative components. Our CECL model includes portfolio loan segmentation based upon similar risk characteristics and contains both a quantitative and qualitative component of the calculation which incorporates a forecasting component of certain economic variables. Our implementation plan also includes the assessment and documentation of appropriate processes, policies and internal controls. Management had a third party independent consultant to review and validate our CECL model.
Parallel runs utilizing data from the first and fourth quarters of 2020 and 2019, respectively, incorporate elements of our operational procedures and internal controls. Our current parallel run includes the composition, characteristics and quality of our loan portfolio as well as current market economic conditions and forecasts as of the adoption date.
In addition, ASU 2016-13 amends the accounting for credit losses on certain debt securities. Based upon the nature and characteristics of our securities portfolio at the adoption date, management does not expect to record any allowance for credit losses on its debt securities as a result of adopting ASU 2016-13.
The ultimate impact of adopting ASU 2016-13, and at each subsequent reporting period, is highly dependent on credit quality, macroeconomic forecasts and conditions, composition of our loans and available-for-sale securities portfolio, along with other management judgments. The transition adjustment to record the allowance for loan losses will be applied using a cumulative effect adjustment to retained earnings.
Executive Overview
Carter Bank & Trust (the “Bank”) is a state non-member Bank headquartered in Martinsville, Virginia with assets of $4.0 billion at December 31, 2019. The Bank operates branches in Virginia and North Carolina. The Bank provides a full range of financial services with retail, commercial banking, and insurance products. Our common stock began trading on NASDAQ effective March 25, 2019, under the ticker symbol “CARE.” Prior to March 25, 2019, our common stock traded on the Over the Counter (“OTCQX”) Best Market under the ticker symbol “CARE.”
The Bank earns revenue primarily from interest on loans and securities and fees charged for financial services provided to our customers. The Bank incurs expenses for the cost of deposits, provision for loan losses and other operating costs such as salaries and employee benefits, data processing, occupancy and tax expense.
CARTER BANK & TRUST
ITEM 7. MANAGEMENT’S DISCUSSION AND ANALYSIS OF FINANCIAL CONDITION AND RESULTS OF OPERATIONS (continued)
Our mission is that the Bank strives to be the preferred lifetime financial partner for our customers and shareholders, and the employer of choice in the communities the Bank is privileged to serve. Our strategic plan focuses on restructuring the balance sheet to provide more diversification and higher yielding assets to increase the net interest margin. Another area of focus is the transformation of the infrastructure of the Bank to provide a foundation for operational efficiency and provide new products and services for our customers that will ultimately increase noninterest income.
Our focus continues to be on loan and deposit growth with a shift in the composition of deposits to more low cost core deposits with less dependence on higher cost certificates of deposits. Additionally, the Bank is implementing strategies to increase fee income while closely monitoring our operating expenses. The Bank is focused on executing our strategy to successfully build our brand and grow our business in our markets. The Bank’s net interest margin has improved due to our strategy to deploy our excess cash into higher yielding and diversified investment securities and loan growths, as well as, the runoff of higher cost deposits.
Earnings Summary
Net interest income decreased $1.6 million to $112.3 million in 2019 from $113.9 million in 2018. The decrease in net interest income is driven by an increase in interest income of $7.1 million, offset by an increase of $8.7 million in interest expense during 2019 as compared to 2018. The increase in interest income is primarily due to growth in average loan balances and more active balance sheet management. The increase in interest expense is due to recent money market and certificates of deposits promotions, partially offset by the intentional runoff of higher cost certificates of deposits.
Net interest income, on a FTE basis, decreased $2.3 million to $115.4 million in 2019 from $117.7 million in 2018. The net interest margin, on a FTE basis, decreased five basis points to 3.05% over the past twelve months. The yield on interest-earning assets increased 17 basis points, offset by a 32 basis point increase in funding costs as compared to 2018.
The Bank’s interest income could be reduced due to COVID-19. In keeping with guidance from regulators, we are actively working with COVID-19 affected borrowers to defer their payments, interest, and fees. While interest and fees will still accrue to income, through normal GAAP accounting, should eventual credit losses on these deferred payments emerge, interest income and fees accrued would need to be reversed. In such a scenario, interest income in future periods could be negatively impacted. At this time, we are unable to project the materiality of such an impact, but recognize the breadth of the economic impact may affect our borrowers’ ability to repay in future periods.
The provision for loan losses decreased $13.5 million to $3.4 million in 2019 compared to $16.9 million in 2018. The decrease in provision expense in 2019 as compared to 2018 is primarily attributable to a reduction in net charge-offs in the loan portfolio. The reduction in net charge-offs was due to a $10.1 million charge-off of a legacy commercial real estate relationship in the third quarter of 2018 as a result of a new appraisal. Net charge-offs were $3.8 million in 2019 as compared to $13.0 million in 2018.
CARTER BANK & TRUST
ITEM 7. MANAGEMENT’S DISCUSSION AND ANALYSIS OF FINANCIAL CONDITION AND RESULTS OF OPERATIONS (continued)
Noninterest income decreased $1.1 million, or 6.7%, to $14.7 million, excluding net securities gains, in 2019 as compared to 2018. This decrease in 2019 was primarily due to lower rental income from OREO, $2.0 million, due to the sale of several large commercial properties during 2019 and insurance income also decreased by $0.6 million, or 34.0%. Offsetting these decreases were increases in service charges, commissions, and fees, debit card interchange fees, and BOLI income in the amounts of $0.9 million, $0.4 million, and $0.3 million, respectively, in the year over year comparison. Securities gains of $2.2 million and $1.3 million were realized during the years ended December 31, 2019 and 2018, respectively, to take advantage of market opportunities and reposition and diversify holdings in the securities portfolio.
Total noninterest expense decreased $1.7 million, or 1.7%, in 2019 to $98.0 million as compared to $99.7 million in 2018. Losses on sales and write-downs of OREO decreased by $3.5 million and OREO expense decreased by $1.7 million in 2019 as compared to 2018 due to fewer properties under management during 2019. Tax credit amortization decreased by $1.8 million in the year over year comparison. FDIC insurance expense decreased $1.7 million, or 57.5%, and professional and legal fees decreased by $0.8 million in 2019 as compared to 2018 Offsetting these decreases were increases in salaries and employee benefits, occupancy expense, data processing, and other expenses. Occupancy expense increased $1.5 million and data processing expense increased by $0.6 million in 2019 as compared to 2018. Other expenses increased by $2.8 million, or 38.4%, in 2019 over 2018 and are primarily comprised of increased ancillary systems, subscriptions, employee training and higher marketing expenses related to our deposit acquisition strategy. Investments continue to be made in the appropriate infrastructure to support the Bank in the future. There have not been any permanent or temporary reductions in employees as a result of COVID-19.
The provision for income taxes was a tax provision of $1.2 million for 2019 and pretax income of $27.8 million compared to a tax provision of $2.4 million in 2018 and pretax income of $14.3 million. The decrease in provision for income taxes was due to the utilization of a deferred tax asset benefit and higher general business credits in 2019.
The effective tax rate was 4% in 2019 and 17% in 2018. The Bank ordinarily generates an annual effective tax rate that is less than the federal statutory rate of 21% due to benefits resulting from tax-exempt interest and tax credit projects due to the aforementioned deferred tax asset utilization and higher tax credit projects during 2019.
CARTER BANK & TRUST
ITEM 7. MANAGEMENT’S DISCUSSION AND ANALYSIS OF FINANCIAL CONDITION AND RESULTS OF OPERATIONS (continued)
RESULTS OF OPERATIONS
Year Ended December 31, 2019
Net Interest Income
Our principal source of revenue is net interest income. Net interest income represents the difference between the interest and fees earned on interest-earning assets and the interest paid on interest-bearing liabilities. Net interest income is affected by changes in the average balance of interest-earning assets and interest-bearing liabilities and changes in interest rates and spreads. The level and mix of interest-earning assets and interest-bearing liabilities is managed by our Asset and Liability Committee, or (“ALCO”), in order to mitigate interest rate and liquidity risks of the balance sheet. A variety of ALCO strategies were implemented, within prescribed ALCO risk parameters, to produce what the Bank believes is an acceptable level of net interest income.
The interest income on interest-earning assets and the net interest margin are presented on a FTE basis. The FTE basis adjusts for the tax benefit of income on certain tax-exempt loans and securities using the applicable federal statutory tax rate for each period (which was 21% for the years ended December 31, 2019 and 2018 and 35% for the year ended December 31, 2017) and the dividend-received deduction for equity securities. The Bank believes this FTE presentation provides a relevant comparison between taxable and non-taxable sources of interest income.
The following table reconciles net interest income per the Consolidated Statements of Income (Loss) to net interest income on a FTE basis for the periods presented:
| | | Years Ended December 31, | |
| (Dollars in Thousands) | | 2019 | | | 2018 | | | 2017 | |
| Total Interest Income | | $ | 159,120 | | | $ | 152,019 | | | $ | 144,084 | |
| Total Interest Expense | | | 46,773 | | | | 38,114 | | | | 37,111 | |
| Net Interest Income | | | 112,347 | | | | 113,905 | | | | 106,973 | |
| Adjustment to FTE Basis | | | 3,046 | | | | 3,816 | | | | 8,505 | |
| Net Interest Income (FTE) (non-GAAP) | | $ | 115,393 | | | $ | 117,721 | | | $ | 115,478 | |
| Net Interest Margin | | | 2.97 | % | | | 3.00 | % | | | 2.59 | % |
| Adjustment to FTE Basis | | | 0.08 | | | | 0.10 | | | | 0.21 | |
| Net Interest Income (FTE) (non-GAAP) | | | 3.05 | % | | | 3.10 | % | | | 2.80 | % |
Average Balance Sheet and Net Interest Income Analysis (FTE)
Net interest income, on a fully FTE basis, decreased $2.3 million, or 2.0%, to $115.4 million in 2019 as compared to $117.7 million in 2018. The decrease in net interest income is driven by a $6.4 million increase in interest income, offset by an $8.7 million increase in interest expense during 2019 as compared to 2018. The increase in interest income is primarily due to growth in average loan balances, but are muted by lower replacement yields due to legacy loan pay-downs during 2018. The increase in interest expense is due to recent money market and certificates of deposits promotions, partially offset by the intentional runoff of higher cost certificates of deposits. The net interest margin, on a FTE basis, decreased five basis points to 3.05% over the past twelve months. The yield on interest-earning assets increased 17 basis points, offset by a 32 basis point increase in funding costs as compared to 2018.
CARTER BANK & TRUST
ITEM 7. MANAGEMENT’S DISCUSSION AND ANALYSIS OF FINANCIAL CONDITION AND RESULTS OF OPERATIONS (continued)
The following table provides information regarding the average balances, interest and rates earned on interest-earning assets and the average balances, interest and rates paid on interest-bearing liabilities for the years ended December 31:
| | | 2019 | | | 2018 | | | 2017 | |
| (Dollars in Thousands) | | Average
Balance | | | Income/
Expense | | | Rate | | | Average
Balance | | | Income/
Expense | | | Rate | | | Average
Balance | | | Income/
Expense | | | Rate | |
| ASSETS | | | | | | | | | | | | | | | | | | | | | | | | | | | | | | | | | | | | |
| Interest-Bearing Deposits with Banks | | $ | 123,946 | | | $ | 2,750 | | | | 2.22 | % | | $ | 134,406 | | | $ | 2,682 | | | | 2.00 | % | | $ | 481,128 | | | $ | 5,184 | | | | 1.08 | % |
| Tax-Free Investment Securities | | | 63,641 | | | | 2,352 | | | | 3.70 | % | | | 153,036 | | | | 5,375 | | | | 3.51 | % | | | 126,287 | | | | 7,530 | | | | 5.96 | % |
| Taxable Investment Securities | | | 730,500 | | | | 17,826 | | | | 2.44 | % | | | 753,023 | | | | 15,421 | | | | 2.05 | % | | | 806,353 | | | | 14,911 | | | | 1.85 | % |
| Tax-Free Loans | | | 379,090 | | | | 12,154 | | | | 3.21 | % | | | 419,981 | | | | 12,794 | | | | 3.05 | % | | | 451,100 | | | | 16,771 | | | | 3.72 | % |
| Taxable Loans | | | 2,489,105 | | | | 126,940 | | | | 5.10 | % | | | 2,331,165 | | | | 119,563 | | | | 5.13 | % | | | 2,259,438 | | | | 108,193 | | | | 4.79 | % |
| Federal Home Loan Bank Stock | | | 2,352 | | | | 144 | | | | 6.12 | % | | | - | | | | - | | | | - | | | | - | | | | - | | | | - | |
| Total Interest-Earning Assets | | $ | 3,788,634 | | | $ | 162,166 | | | | 4.28 | % | | $ | 3,791,611 | | | $ | 155,835 | | | | 4.11 | % | | $ | 4,124,306 | | | $ | 152,589 | | | | 3.70 | % |
| | | | | | | | | | | | | | | | | | | | | | | | | | | | | | | | | | | | | |
| LIABILITIES | | | | | | | | | | | | | | | | | | | | | | | | | | | | | | | | | | | | |
| Deposits: | | | | | | | | | | | | | | | | | | | | | | | | | | | | | | | | | | | | |
| Interest-Bearing Demand | | $ | 249,086 | | | $ | 2,004 | | | | 0.80 | % | | $ | 246,592 | | | $ | 1,959 | | | | 0.79 | % | | $ | 244,919 | | | $ | 1,587 | | | | 0.65 | % |
| Money Market | | | 134,676 | | | | 1,671 | | | | 1.24 | % | | | 96,068 | | | | 694 | | | | 0.72 | % | | | 141,438 | | | | 788 | | | | 0.56 | % |
| Savings | | | 582,195 | | | | 1,388 | | | | 0.24 | % | | | 663,801 | | | | 2,027 | | | | 0.31 | % | | | 727,182 | | | | 3,568 | | | | 0.49 | % |
| Certificates of Deposit | | | 2,054,077 | | | | 41,593 | | | | 2.02 | % | | | 2,090,103 | | | | 33,414 | | | | 1.60 | % | | | 2,199,263 | | | | 31,168 | | | | 1.42 | % |
| Total Interest-Bearing Deposits | | $ | 3,020,034 | | | $ | 46,656 | | | | 1.54 | % | | $ | 3,096,564 | | | $ | 38,094 | | | | 1.23 | % | | $ | 3,312,802 | | | $ | 37,111 | | | | 1.12 | % |
| Borrowings: | | | | | | | | | | | | | | | | | | | | | | | | | | | | | | | | | | | | |
| Federal Funds Purchased | | | - | | | | - | | | | - | | | | 681 | | | | 20 | | | | 2.94 | % | | | - | | | | - | | | | - | |
| FHLB Borrowings | | | 2,329 | | | | 38 | | | | 1.63 | % | | | - | | | | - | | | | - | | | | - | | | | - | | | | - | |
| Other Borrowings | | | 1,042 | | | | 79 | | | | 7.58 | % | | | - | | | | - | | | | - | | | | - | | | | - | | | | - | |
| Total Borrowings | | | 3,371 | | | | 117 | | | | 3.47 | % | | | 681 | | | | 20 | | | | 2.94 | % | | | - | | | | - | | | | - | |
| Total Interest-Bearing Liabilities | | $ | 3,023,405 | | | $ | 46,773 | | | | 1.55 | % | | $ | 3,097,245 | | | $ | 38,114 | | | | 1.23 | % | | $ | 3,312,802 | | | $ | 37,111 | | | | 1.12 | % |
| Net Interest Income | | | | | | $ | 115,393 | | | | | | | | | | | $ | 117,721 | | | | | | | | | | | $ | 115,478 | | | | | |
| Net Interest Margin | | | | | | | | | | | 3.05 | % | | | | | | | | | | | 3.10 | % | | | | | | | | | | | 2.80 | % |
Interest income, on a FTE basis, increased $6.4 million, or 4.1%, in 2019 compared to 2018. The increase is primarily due to increases in taxable loan volumes. The average balance of taxable loans increased $157.9 million in 2019 as compared to 2018. Interest income earned on these loans increased $7.4 million in the same comparison as the average balance. Average tax-free investment securities and average taxable investment securities decreased $89.4 million and $22.5 million, respectively, in the 2019 year-to-date comparison to 2018. The change in investment securities is the result of loan growth and active balance sheet management as our portfolio has been diversified as to bond types, maturities, and interest rate structures. The rate earned on total interest-earning assets increased by 17 basis points in 2019 as compared to 2018.
Interest expense increased $8.7 million, or 22.7%, in 2019 compared to 2018. The increase was primarily due to an increase in money market accounts and certificates of deposits as a result of recent special rate promotions. The average balance of money market accounts increased $38.6 million and interest expense on these deposits increased $1.0 million in the year over year comparison. The average balance of certificates of deposits decreased $36.0 million; however, interest expense on these deposits increased $8.2 million in the year over year comparison. The intentional runoff of higher cost certificates of deposits has now surpassed the increase in these deposits from recent special rate promotions. Savings balances decreased in conjunction with the increases noted above due to customer preferences in converting to higher rate deposit products. The rate on total interest-bearing deposits and total interest-bearing liabilities increased 31 and 32 basis points, respectively, in 2019 as compared to 2018.
CARTER BANK & TRUST
ITEM 7. MANAGEMENT’S DISCUSSION AND ANALYSIS OF FINANCIAL CONDITION AND RESULTS OF OPERATIONS (continued)
The following table sets forth for the periods presented a summary of the changes in interest earned and interest paid resulting from changes in volume and changes in rates:
| | | | | | | |
| | | 2019 Compared to 2018 | | | 2018 Compared to 2017 | |
| (Dollars in Thousands) | | Increase/
(Decrease) | | | Rate | | | Volume | | | Increase/
(Decrease) | | | Rate | | | Volume | |
| ASSETS | | | | | | | | | | | | | | | | | | | | | | | | |
| Interest-Bearing Deposits with Banks | | $ | 68 | | | $ | 287 | | | $ | (219 | ) | | $ | (2,502 | ) | | $ | 2,693 | | | $ | (5,195 | ) |
| Tax-Free Investment Securities | | | (3,023 | ) | | | 268 | | | | (3,291 | ) | | | (2,155 | ) | | | (3,527 | ) | | | 1,372 | |
| Taxable Investment Securities | | | 2,405 | | | | 2,878 | | | | (473 | ) | | | 510 | | | | 1,536 | | | | (1,026 | ) |
| Tax-Free Loans | | | (640 | ) | | | 648 | | | | (1,288 | ) | | | (3,977 | ) | | | (2,878 | ) | | | (1,099 | ) |
| Taxable Loans | | | 7,377 | | | | (681 | ) | | | 8,058 | | | | 11,370 | | | | 7,860 | | | | 3,510 | |
| Federal Home Loan Bank Stock | | | 144 | | | | - | | | | 144 | | | | - | | | | - | | | | - | |
| Total Interest-Earning Assets | | $ | 6,331 | | | $ | 3,400 | | | $ | 2,931 | | | $ | 3,246 | | | $ | 5,684 | | | $ | (2,438 | ) |
| | | | | | | | | | | | | | | | | | | | | | | | | |
| LIABILITIES | | | | | | | | | | | | | | | | | | | | | | | | |
| Deposits: | | | | | | | | | | | | | | | | | | | | | | | | |
| Interest-Bearing Demand | | $ | 45 | | | $ | 25 | | | $ | 20 | | | $ | 372 | | | $ | 361 | | | $ | 11 | |
| Money Market | | | 977 | | | | 626 | | | | 351 | | | | (94 | ) | | | 198 | | | | (292 | ) |
| Savings | | | (639 | ) | | | (409 | ) | | | (230 | ) | | | (1,541 | ) | | | (1,252 | ) | | | (289 | ) |
| Certificates of Deposit | | | 8,179 | | | | 8,764 | | | | (585 | ) | | | 2,246 | | | | 3,848 | | | | (1,602 | ) |
| Total Interest-Bearing Deposits | | $ | 8,562 | | | $ | 9,006 | | | $ | (444 | ) | | $ | 983 | | | $ | 3,155 | | | $ | (2,172 | ) |
| Borrowings: | | | | | | | | | | | | | | | | | | | | | | | | |
| Federal Funds Purchased | | | (20 | ) | | | (10 | ) | | | (10 | ) | | | 20 | | | | - | | | | 20 | |
| FHLB Borrowings | | | 38 | | | | - | | | | 38 | | | | - | | | | - | | | | - | |
| Other Borrowings | | | 79 | | | | - | | | | 79 | | | | - | | | | - | | | | - | |
| Total Borrowings | | | 97 | | | | (10 | ) | | | 107 | | | | 20 | | | | - | | | | 20 | |
| Total Interest-Bearing Liabilities | | $ | 8,659 | | | $ | 8,996 | | | $ | (337 | ) | | $ | 1,003 | | | $ | 3,155 | | | $ | (2,152 | ) |
| Net Interest Income | | $ | (2,328 | ) | | $ | (5,596 | ) | | $ | 3,268 | | | $ | 2,243 | | | $ | 2,529 | | | $ | (286 | ) |
CARTER BANK & TRUST
ITEM 7. MANAGEMENT’S DISCUSSION AND ANALYSIS OF FINANCIAL CONDITION AND RESULTS OF OPERATIONS (continued)
Provision for Loan Losses
The following table summarizes the activity in the ALL for the periods presented:
| (Dollars in Thousands) | | 2019 | | | 2018 | | | 2017 | | | 2016 | | | 2015 | |
| Balance Beginning of Year | | $ | 39,199 | | | $ | 35,318 | | | $ | 34,500 | | | $ | 26,990 | | | $ | 24,142 | |
| Provision for Loan Losses | | | 3,404 | | | | 16,870 | | | | 43,197 | | | | 17,717 | | | | 3,300 | |
| Charge-offs: | | | | | | | | | | | | | | | | | | | | |
| Real Estate Loans | | | 659 | | | | 11,924 | | | | 42,813 | | | | 9,687 | | | | 310 | |
| Consumer Loans | | | 4,401 | | | | 2,710 | | | | 465 | | | | 510 | | | | 177 | |
| Commercial Loans | | | 22 | | | | 20 | | | | 31 | | | | 257 | | | | 20 | |
| Total Charge-offs | | | 5,082 | | | | 14,654 | | | | 43,309 | | | | 10,454 | | | | 507 | |
| Recoveries: | | | | | | | | | | | | | | | | | | | | |
| Real Estate Loans | | | 639 | | | | 1,415 | | | | 720 | | | | 131 | | | | - | |
| Consumer Loans | | | 602 | | | | 250 | | | | 210 | | | | 110 | | | | 55 | |
| Commercial Loans | | | - | | | | - | | | | - | | | | 6 | | | | - | |
| Total Recoveries | | | 1,241 | | | | 1,665 | | | | 930 | | | | 247 | | | | 55 | |
| Total Net Charge-offs | | | 3,841 | | | | 12,989 | | | | 42,379 | | | | 10,207 | | | | 452 | |
| Balance End of Year | | $ | 38,762 | | | $ | 39,199 | | | $ | 35,318 | | | $ | 34,500 | | | $ | 26,990 | |
| | | | | | | | | | | | | | | | | | | | | |
| Net Charge-offs to Average loans | | | 0.13 | % | | | 0.47 | % | | | 1.56 | % | | | 0.38 | % | | | 0.02 | % |
| Allowance for Loan Losses to Portfolio loans | | | 1.34 | % | | | 1.45 | % | | | 1.32 | % | | | 1.26 | % | | | 1.03 | % |
The provision for loan losses is the amount to be added to the allowance for loan losses, or (“ALL”), after considering loan charge-offs and recoveries, to bring the ALL to a level determined to be appropriate in management's judgment to absorb probable incurred losses inherent in the loan portfolio.
The provision for loan losses decreased $13.5 million to $3.4 million in 2019 compared to $16.9 million in 2018. The decrease in provision expense in 2019 as compared to 2018 is primarily attributable to a reduction in net charge-offs in the loan portfolio. The reduction in net charge-offs was due to a $10.1 million charge-off of a legacy commercial real estate relationship in the third quarter of 2018 as a result of a new appraisal. Net charge-offs were $3.8 million in 2019 as compared to $13.0 million in 2018.
Net charge-offs decreased $9.2 million to $3.8 million in 2019 compared to $13.0 million for 2018. Net loan charge-offs to average loans were 0.13% and 0.47% in 2019 and 2018, respectively. Specific reserves were $6.2 million at December 31, 2019 and $5.2 million at December 31, 2018.
Nonperforming loans decreased at December 31, 2019 by $8.6 million, to $42.1 million as compared to $50.7 million at December 31 2018. The allowance for loan losses was 92.0% of nonperforming loans as of December 31, 2019 as compared to 77.3% of nonperforming loans as of December 31, 2018. Management is aggressively taking steps to address problem loan relationships.
The ALL at December 31, 2019 was $38.8 million compared to $39.2 million at December 31, 2018. The ALL as a percentage of total portfolio loans was 1.34% at December 31, 2019 and 1.45% at December 31, 2018.
CARTER BANK & TRUST
ITEM 7. MANAGEMENT’S DISCUSSION AND ANALYSIS OF FINANCIAL CONDITION AND RESULTS OF OPERATIONS (continued)
Noninterest Income
| | | Years Ended December 31, | |
| (Dollars in Thousands) | | 2019 | | | 2018 | | | $ Change | | | % Change | |
| Gains on Sales of Securities, net | | $ | 2,205 | | | $ | 1,271 | | | $ | 934 | | | | 73.5 | % |
| Service Charges, Commissions and Fees | | | 4,962 | | | | 4,081 | | | | 881 | | | | 21.6 | % |
| Debit Card Interchange Fees | | | 5,160 | | | | 4,750 | | | | 410 | | | | 8.6 | % |
| Insurance | | | 1,225 | | | | 1,855 | | | | (630 | ) | | | (34.0 | )% |
| Bank Owned Life Insurance Income | | | 1,436 | | | | 1,161 | | | | 275 | | | | 23.7 | % |
| Other Real Estate Owned Income | | | 689 | | | | 2,692 | | | | (2,003 | ) | | | (74.4 | )% |
| Other | | | 1,193 | | | | 1,176 | | | | 17 | | | | 1.4 | % |
| Total Noninterest Income | | $ | 16,870 | | | $ | 16,986 | | | $ | (116 | ) | | | (0.7 | )% |
| | | | | | | | | | | | | | | | | |
| NM - percentage not meaningful | | | | | | | | | | | | | | | | |
Noninterest income decreased $1.1 million, or 6.7%, to $14.7 million, excluding net securities gains, in 2019 as compared to 2018. This decrease in 2019 as compared to 2018 was primarily due to lower rental income from OREO, or $2.0 million, due to the sale of several large commercial properties over the last 12 months that generated income beginning in the first quarter of 2018. This rental income is shown as Other Real Estate Owned Income in the noninterest income section of the Consolidated Statements of Income (Loss). Net losses on the sale of OREO are included in Losses on Sales and Write-downs of Other Real Estate Owned, net in the noninterest expense section of the Consolidated Statements of Income (Loss). Insurance income also decreased by $0.6 million, or 34.0%, due to bank owned life insurance (“BOLI”) commissions received in 2018 with the purchase of $50.0 million of BOLI in the first quarter of 2018. Offsetting these decreases were increases in service charges, commissions, and fees, debit card interchange fees, and BOLI income in the amounts of $0.9 million, $0.4 million, and $0.3 million, respectively, in the year over year comparison. Securities gains of $2.2 million and $1.3 million were realized during the years ended December 31, 2019 and 2018, respectively, to take advantage of market opportunities and reposition and diversify holdings in the securities portfolio.
Noninterest Expense
| | | Years Ended December 31, | |
| (Dollars in Thousands) | | 2019 | | | 2018 | | | $ Change | | | % Change | |
| Salaries and Employee Benefits | | $ | 52,879 | | | $ | 49,958 | | | $ | 2,921 | | | | 5.8 | % |
| Occupancy Expense, net | | | 11,785 | | | | 10,312 | | | | 1,473 | | | | 14.3 | % |
| FDIC Insurance Expense | | | 1,270 | | | | 2,985 | | | | (1,715 | ) | | | (57.5 | )% |
| Other Taxes | | | 2,847 | | | | 2,571 | | | | 276 | | | | 10.7 | % |
| Telephone Expense | | | 2,202 | | | | 2,466 | | | | (264 | ) | | | (10.7 | )% |
| Professional and Legal Fees | | | 4,507 | | | | 5,288 | | | | (781 | ) | | | (14.8 | )% |
| Data Processing | | | 2,083 | | | | 1,505 | | | | 578 | | | | 38.4 | % |
| Losses on Sales and Write-downs of Other Real Estate Owned, net | | | 4,732 | | | | 8,201 | | | | (3,469 | ) | | | (42.3 | )% |
| Losses on Sales and Write-downs of Bank Premises, net | | | 188 | | | | 186 | | | | 2 | | | | 1.1 | % |
| Debit Card Expense | | | 2,753 | | | | 2,785 | | | | (32 | ) | | | (1.1 | )% |
| Tax Credit Amortization | | | 2,265 | | | | 4,060 | | | | (1,795 | ) | | | (44.2 | )% |
| Other Real Estate Owned Expense | | | 474 | | | | 2,139 | | | | (1,665 | ) | | | (77.8 | )% |
| Other | | | 10,044 | | | | 7,257 | | | | 2,787 | | | | 38.4 | % |
| Total Noninterest Expense | | $ | 98,029 | | | $ | 99,713 | | | $ | (1,684 | ) | | | (1.7 | )% |
| | | | | | | | | | | | | | | | | |
| NM - percentage not meaningful | | | | | | | | | | | | | | | | |
CARTER BANK & TRUST
ITEM 7. MANAGEMENT’S DISCUSSION AND ANALYSIS OF FINANCIAL CONDITION AND RESULTS OF OPERATIONS (continued)
Total noninterest expense decreased $1.7 million, or 1.7%, in 2019 to $98.0 million as compared to $99.7 million in 2018. Losses on sales and write-downs of OREO decreased by $3.5 million and OREO expense decreased by $1.7 million in 2019 as compared to 2018 due to fewer properties under management during 2019. Tax credit amortization decreased by $1.8 million in the year over year comparison. Tax credit amortization declined because two tax credits were fully amortized in 2018. FDIC insurance expense decreased $1.7 million, or 57.5%, in 2019 as compared to 2018 due to a lower rate assessment and the one-time credit for the deposit insurance funds taken in the third quarter of 2019. Professional and legal fees decreased by $0.8 million due to regulatory and compliance reviews which were completed as of September 30, 2018. Offsetting these decreases were increases in salaries and employee benefits, occupancy expense, data processing, and other expenses. Salaries and employee benefits increased $2.9 million, or 5.8%, in 2019 as compared to 2018. The increase in salaries and benefits expense was primarily due to increased salaries and benefits due to infrastructure buildout, a full year of restricted stock compensation expense and the new 401-K match, offset by a decrease in the deferral of loan fees and costs. There have not been any permanent or temporary reductions in employees as a result of COVID-19. Occupancy expense increased $1.5 million due to higher depreciation for hardware and software and amortization of maintenance agreements related to the core conversion completed in November 2018. Data processing expense increased by $0.6 million in 2019 as compared to 2018 due to the aforementioned core conversion. Other expenses increased by $2.8 million, or 38.4%, in 2019 over 2018 and are primarily comprised of increased ancillary systems, subscriptions, employee training and higher marketing expenses related to our deposit acquisition strategy. Investments continue to be made in the appropriate infrastructure to support the Bank in the future.
Provision for Income Taxes
The provision for income taxes was a tax provision of $1.2 million for 2019 and pretax income of $27.8 million compared to a tax provision of $2.4 million in 2018 and pretax income of $14.3 million. The decrease in provision for income taxes was due to the utilization of a deferred tax asset benefit and higher general business credits in 2019.
The effective tax rate was 4% in 2019 and 17% in 2018. The Bank ordinarily generates an annual effective tax rate that is less than the federal statutory rate of 21% due to benefits resulting from tax-exempt interest and tax credit projects due to the aforementioned deferred tax asset utilization and higher tax credit projects during 2019.
Financial Condition
December 31, 2019
Total assets were $4.0 billion at December 31, 2019 and 2018. Total portfolio loans increased $181.0 million, or 6.7%, to $2.9 billion as of December 31, 2019 as compared to December 31, 2018. Nonperforming loans decreased $8.6 million to $42.1 million, or 16.9% as of December 31, 2019 as compared to $50.7 million at December 31, 2018. OREO decreased $15.4 million at December 31, 2019 as compared to December 31, 2018 due to the sale of properties during 2019. Closed retail bank offices declined $3.8 million from December 31, 2018 and have a remaining book value of $3.0 million at December 31, 2019.
CARTER BANK & TRUST
ITEM 7. MANAGEMENT’S DISCUSSION AND ANALYSIS OF FINANCIAL CONDITION AND RESULTS OF OPERATIONS (continued)
FRB excess reserves decreased $145.5 million at December 31, 2019 as compared to December 31, 2018. This excess cash was deployed into higher yielding and diversified securities, funded loan growth, and also funded the planned decrease in high cost deposits.
The securities portfolio decreased $40.1 million and is currently 18.5% of total assets at December 31, 2019 as compared to 19.4% of total assets at December 31, 2018. The decrease is a result of loan growth and active balance sheet management. We have further diversified the securities portfolio as to bond types, maturities and interest rate structures.
During 2019, the Bank joined the Federal Home Loan Bank of Atlanta (“FHLB”). The FHLB is a low cost funding source and provides low cost products and services. The FHLB requires members to purchase and hold a specified level of FHLB stock based on the member’s asset value, level of borrowings and participation in other programs offered. Stock in the FHLB is non-marketable and is redeemable at the discretion of the FHLB. FHLB stock is evaluated for other-than-temporary impairment (“OTTI”) on a quarterly basis. At December 31, 2019, the Bank had $4.1 million of FHLB stock.
Deposits are our primary source of funds. The Bank believes that our deposit base is stable and that the Bank has the ability to attract new depositors while diversifying the deposit composition. Total deposits were $3.5 billion as of December 31, 2019 and $3.6 billion as of December 31, 2018. Noninterest-bearing deposits increased $7.1 million, or 1.3%, to $554.9 million as of December 31, 2019 as compared to $547.8 million as of December 31, 2018. Money market accounts increased $59.8 million, or 73.9%, to $140.6 million due to recent special rate promotions during 2019 and a renewed focus on lower cost non-maturing deposit account acquisition. Interest-bearing demand deposits increased $32.5 million, or 12.8%, to $286.6 million at December 31, 2019 as compared to December 31, 2018. Offsetting these increases were decreases of $48.9 million or 8.0% in savings accounts and $137.4 million in certificates of deposits as compared to December 31, 2018. The decrease in certificates of deposits from 2018 to 2019 is part of an ongoing strategic initiative by the Bank to transition the funding mix from higher cost certificates of deposits to lower cost non-maturing deposits. Noninterest-bearing deposits comprised 15.8% and 15.3% of total deposits at December 31, 2019 and December 31, 2018, respectively.
The allowance for loan losses was 1.34% of portfolio loans as of December 31, 2019 as compared to 1.45% as of December 31, 2018. General reserves as a percentage of portfolio loans were 1.13% at December 31, 2019 as compared to 1.26% as of December 31, 2018. The allowance for loan losses was 92.0% of nonperforming loans as of December 31, 2019 as compared to 77.3% of nonperforming loans as of December 31, 2018. In the view of management, the allowance for loan losses is adequate to absorb probable incurred losses inherent in the loan portfolio.
The Bank remains well capitalized. The Bank’s Tier 1 Capital ratio decreased to 13.46% as of December 31, 2019 as compared to 13.86% as of December 31, 2018. The Bank’s leverage ratio was 10.33% at December 31, 2019 as compared to 9.61% as of December 31, 2018. The Bank’s Total Risk-Based Capital ratio was 14.71% at December 31, 2019 as compared to 15.11% at December 31, 2018.
As of March 31, 2020, all of the Bank’s capital ratios were in excess of all regulatory requirements. An extended economic recession brought about by COVID-19 could adversely impact our regulatory capital ratios.
CARTER BANK & TRUST
ITEM 7. MANAGEMENT’S DISCUSSION AND ANALYSIS OF FINANCIAL CONDITION AND RESULTS OF OPERATIONS (continued)
Securities
The following table presents the composition of available-for-sale securities for the periods presented:
| (Dollars in Thousands) | | December 31, 2019 | | | December 31, 2018 | | | $ Change | |
| U.S. Government Agency Securities | | $ | - | | | $ | 270,388 | | | $ | (270,388 | ) |
| Residential Mortgage-Backed Securities | | | 52,644 | | | | 70,871 | | | | (18,227 | ) |
| Commercial Mortgage-Backed Securities | | | 19,006 | | | | 21,792 | | | | (2,786 | ) |
| Asset Backed Securities | | | 109,639 | | | | 58,861 | | | | 50,778 | |
| Collateralized Mortgage Obligations | | | 292,224 | | | | 76,819 | | | | 215,405 | |
| Small Business Administration | | | 105,736 | | | | 89,238 | | | | 16,498 | |
| States and Political Subdivisions | | | 148,480 | | | | 167,474 | | | | (18,994 | ) |
| Corporate Notes | | | 14,888 | | | | 27,315 | | | | (12,427 | ) |
| Total Debt Securities | | $ | 742,617 | | | $ | 782,758 | | | $ | (40,141 | ) |
The balances and average rates of our securities portfolio are presented below as of December 31:
| | | 2019 | | | 2018 | | | 2017 | |
| (Dollars in Thousands) | | Balance | | | Weighted-
Average
Yield | | | Balance | | | Weighted-
Average
Yield | | | Balance | | | Weighted-
Average
Yield | |
| U.S. Government Agency Securities | | $ | - | | | | 0.00 | % | | $ | 270,388 | | | | 1.44 | % | | $ | 298,665 | | | | 1.42 | % |
| Residential Mortgage-Backed Securities | | | 52,644 | | | | 2.72 | % | | | 70,871 | | | | 2.37 | % | | | 60,380 | | | | 1.98 | % |
| Commercial Mortgage-Backed Securities | | | 19,006 | | | | 2.53 | % | | | 21,792 | | | | 2.59 | % | | | 24,908 | | | | 2.58 | % |
| Asset Backed Securities | | | 109,639 | | | | 3.05 | % | | | 58,861 | | | | 3.46 | % | | | 16,867 | | | | 2.28 | % |
| Collateralized Mortgage Obligations | | | 292,224 | | | | 2.49 | % | | | 76,819 | | | | 2.84 | % | | | 61,594 | | | | 2.45 | % |
| Small Business Administration | | | 105,736 | | | | 3.23 | % | | | 89,238 | | | | 3.59 | % | | | 68,260 | | | | 2.73 | % |
| States and Political Subdivisions | | | 148,480 | | | | 2.94 | % | | | 167,474 | | | | 3.45 | % | | | 306,963 | | | | 4.42 | % |
| Corporate Notes | | | 14,888 | | | | 4.08 | % | | | 27,315 | | | | 3.62 | % | | | 109,564 | | | | 1.75 | % |
| Total Securities Available for Sale | | $ | 742,617 | | | | 2.82 | % | | $ | 782,758 | | | | 2.49 | % | | $ | 947,201 | | | | 2.66 | % |
The Bank invests in various securities in order to maintain a source of liquidity, to satisfy various pledging requirements, to increase net interest income and as a tool of the ALCO to diversify and reposition the balance sheet for interest rate risk purposes. Securities are subject to market risks that could negatively affect the level of liquidity available to the Bank. Security purchases are subject to our investment policy approved annually by our Board of Directors and administered through ALCO and our treasury function.
The securities portfolio decreased by $40.1 million at December 31, 2019 as compared to December 31, 2018. Securities comprise 18.5% of total assets at December 31, 2019 as compared to 19.4% at December 31, 2018. The decrease is a result of loan growth and active balance sheet management. We have further diversified the securities portfolio as to bond types, maturities and interest rate structures.
CARTER BANK & TRUST
ITEM 7. MANAGEMENT’S DISCUSSION AND ANALYSIS OF FINANCIAL CONDITION AND RESULTS OF OPERATIONS (continued)
On July 26, 2017, the Bank reclassified its entire held-to-maturity portfolio to the available-for-sale portfolio. This allows for greater flexibility in using the investment portfolio for liquidity purposes by allowing securities to be sold when favorable market opportunities exist. At the time of reclassification, the investments had an amortized cost of $863.8 million. At December 31, 2019, total gross unrealized gains in the available-for-sale portfolio were $6.2 million offset by $6.0 million of gross unrealized losses. At December 31, 2018, total gross unrealized gains in the available-for-sale portfolio were $0.5 million offset by $13.2 million of gross unrealized losses.
Management evaluates the securities portfolio for OTTI on a quarterly basis. During the years ended December 31, 2019 and 2018 the Bank did not record any OTTI. The performance of the debt and equity securities markets could generate impairments in future periods requiring realized losses to be reported.
The following table sets forth the maturities of securities at December 31, 2019 and the weighted average yields of such securities. Taxable-equivalent adjustments (using a 21% federal income tax rate) for 2019 have been made in calculating yields on obligations of state and political subdivisions.
Available-for-Sale Securities
| | | Maturing | |
| | | | | | | | | After One But
Within | | | After Five But
Within | | | | | | | |
| | | Within One Year | | | Five Years | | | Ten Years | | | After Ten Years | |
| (Dollars in Thousands) | | Amount | | | Yield | | | Amount | | | Yield | | | Amount | | | Yield | | | Amount | | | Yield | |
| Residential Mortgage-Backed Securities | | | - | | | | 0.00 | % | | | 83 | | | | 4.38 | % | | | - | | | | 0.00 | % | | | 52,561 | | | | 2.71 | % |
| Commercial Mortgage-Backed Securities | | | - | | | | 0.00 | % | | | - | | | | 0.00 | % | | | 16,881 | | | | 2.54 | % | | | 2,125 | | | | 2.46 | % |
| Asset Backed Securities | | | - | | | | 0.00 | % | | | - | | | | 0.00 | % | | | 5,939 | | | | 3.33 | % | | | 103,700 | | | | 3.03 | % |
| Collateralized Mortgage Obligations | | | - | | | | 0.00 | % | | | 3,073 | | | | 2.58 | % | | | 106,433 | | | | 2.45 | % | | | 182,718 | | | | 2.51 | % |
| Small Business Administration | | | - | | | | 0.00 | % | | | 1,100 | | | | 3.91 | % | | | 54,198 | | | | 3.20 | % | | | 50,438 | | | | 3.25 | % |
| States and Political Subdivisions | | | 5,316 | | | | 2.40 | % | | | 3,931 | | | | 3.46 | % | | | 23,888 | | | | 2.95 | % | | | 115,345 | | | | 2.95 | % |
| Corporate Notes | | | 1,500 | | | | 2.83 | % | | | 8,388 | | | | 2.99 | % | | | 5,000 | | | | 6.25 | % | | | - | | | | 0.00 | % |
| Total | | $ | 6,816 | | | | | | | $ | 16,575 | | | | | | | $ | 212,339 | | | | | | | $ | 506,887 | | | | | |
| Weighted Average Yield | | | | | | | 2.50 | % | | | | | | | 3.10 | % | | | | | | | 2.82 | % | | | | | | | 2.81 | % |
Weighted -average yields are calculated on a taxable-equivalent basis using the federal statutory tax rate of 21 percent.
CARTER BANK & TRUST
ITEM 7. MANAGEMENT’S DISCUSSION AND ANALYSIS OF FINANCIAL CONDITION AND RESULTS OF OPERATIONS (continued)
Loan Composition
The following table summarizes our loan portfolio as of the periods presented:
| | | December 31, | |
| (Dollars in Thousands) | | 2019 | | | 2018 | | | 2017 | | | 2016 | | | 2015 | |
| Commercial | | | | | | | | | | | | | | | | | | | | |
| Commercial Real Estate | | $ | 1,365,310 | | | $ | 1,359,036 | | | $ | 1,479,765 | | | $ | 1,527,552 | | | $ | 1,407,951 | |
| Commercial and Industrial | | | 621,667 | | | | 661,870 | | | | 804,592 | | | | 835,131 | | | | 851,083 | |
| Commercial Construction | | | 292,827 | | | | 201,240 | | | | 118,786 | | | | 199,551 | | | | 203,718 | |
| Total Commercial Loans | | | 2,279,804 | | | | 2,222,146 | | | | 2,403,143 | | | | 2,562,234 | | | | 2,462,752 | |
| Consumer | | | | | | | | | | | | | | | | | | | | |
| Residential Mortgages | | | 514,538 | | | | 397,280 | | | | 193,328 | | | | 138,657 | | | | 145,331 | |
| Other Consumer | | | 73,688 | | | | 73,058 | | | | 79,980 | | | | 20,724 | | | | 22,810 | |
| Consumer Construction | | | 16,736 | | | | 11,308 | | | | 7,994 | | | | 10,168 | | | | 7,959 | |
| Total Consumer Loans | | | 604,962 | | | | 481,646 | | | | 281,302 | | | | 169,549 | | | | 176,100 | |
| Total Portfolio Loans | | | 2,884,766 | | | | 2,703,792 | | | | 2,684,445 | | | | 2,731,783 | | | | 2,638,852 | |
| Loans Held-for-Sale | | | 19,714 | | | | 2,559 | | | | 517 | | | | - | | | | - | |
| Total Loans | | $ | 2,904,480 | | | $ | 2,706,351 | | | $ | 2,684,962 | | | $ | 2,731,783 | | | $ | 2,638,852 | |
Our loan portfolio represents our most significant source of interest income. The risk that borrowers will be unable to pay such obligations is inherent in the loan portfolio. Other conditions such as downturns in the borrower's industry or the overall economic climate can significantly impact the borrower’s ability to pay.
Total portfolio loans increased $181.0 million, or 6.7%, as of December 31, 2019 as compared to December 31, 2018. Commercial loans increased $57.7 million, or 2.6%. Consumer loans increased $123.3 million, or 25.6%. The increase in consumer loans is a result of the Bank’s new mortgage division, which began making a significant impact during 2018.
Total commercial loans represented 79% of total portfolio loans at December 31, 2019 and 82% of total portfolio loans at December 31, 2018. Within our commercial portfolio, the CRE and Commercial Construction portfolios combined comprised $1.7 billion or 73% of total commercial loans and 57% of total portfolio loans at December 31, 2019 and comprised $1.6 billion or 70% of total commercial loans and 58% of total portfolio loans at December 31, 2018. Net deferred costs included in the portfolio balances above were $5.1 million and $3.2 million at December 31, 2019 and 2018, respectively. Discounts on purchased 1-4 family loans included in the portfolio balances above were $250 thousand and zero at December 31, 2019 and 2018, respectively.
The commercial portfolio is monitored for potential concentrations of credit risk by market, type of lending, CRE property type, C&I and owner-occupied CRE by industry, investment CRE dependent on common tenants and industries or property types that are similarly impacted by external factors.
CARTER BANK & TRUST
ITEM 7. MANAGEMENT’S DISCUSSION AND ANALYSIS OF FINANCIAL CONDITION AND RESULTS OF OPERATIONS (continued)
The Bank’s exposure to hospitality at December 31, 2019 equated to approximately $499.4 million, or 17.3% of total portfolio loans. These were mostly loans secured by upscale or top tier flagged hotels, which have historically exhibited low leverage and strong operating cash flows. However, the Bank anticipates that a significant portion of the Bank’s borrowers in the hotel industry will continue to endure significant economic distress, which has caused, and may continue to cause, them to draw on their existing lines of credit with other financial institutions and adversely affect their ability to repay existing indebtedness, and is expected to adversely impact the value of collateral. These developments, together with economic conditions generally, are also expected to impact our commercial real estate portfolio. As a result, we anticipate that our financial condition, capital levels and results of operations could be adversely affected.
Portfolio loans originated to our top 10 credit relationships were $746.8 million at December 31, 2019. These loans are in the hospitality, golf course, agricultural, land holdings, commercial real estate (multi-family and office/retail), energy, land development and lumber industries.
From time to time, the Bank has loans held-for-sale from two sources. First, the Bank purchases mortgage loans from another financial institution with fully executed contracts with investors. Secondly, the Bank originates and closes mortgages with fully executed contracts with investors to purchase shortly after closing. The Bank then holds the loans from both sources until funded by the investor, typically a two-week period. Loans held-for-sale were $19.7 million and $2.6 million as of December 31, 2019 and December 31, 2018, respectively.
The following tables present the maturity schedule of selected loan types at December 31, 2019:
| | | Maturity | | | | |
| | | | | | After One | | | | | | | |
| | | Within | | | But Within | | | After | | | | |
| (Dollars in Thousands) | | One Year | | | Five Years | | | Five Years | | | Total | |
| Fixed interest rates | | $ | 58,748 | | | $ | 100,337 | | | $ | 8,169 | | | $ | 167,254 | |
| Variable interest rates | | | 16,377 | | | | 109,938 | | | | 15,994 | | | | 142,309 | |
| Total Construction Loans (1) | | $ | 75,125 | | | $ | 210,275 | | | $ | 24,163 | | | $ | 309,563 | |
(1) Totals to Commercial Construction and Consumer Construction in the loan composition table above.
| | | | | | Maturity | | | | | | | |
| | | | | | After One | | | | | | | |
| (Dollars in Thousands) | | One Year | | | Five Years | | | Five Years | | | Total | |
| Fixed interest rates | | $ | 4,200 | | | $ | 32,704 | | | $ | 43,241 | | | $ | 80,145 | |
| Variable interest rates | | | 15,083 | | | | 82,278 | | | | 78,787 | | | | 176,148 | |
| Total Commercial, Industrial & Agricultural (2) | | $ | 19,283 | | | $ | 114,982 | | | $ | 122,028 | | | $ | 256,293 | |
(2) This amount is included in the Commercial and Industrial total in the loan composition table above, combined with the Bank’s municipal loans.
CARTER BANK & TRUST
ITEM 7. MANAGEMENT’S DISCUSSION AND ANALYSIS OF FINANCIAL CONDITION AND RESULTS OF OPERATIONS (continued)
Credit Quality
On a monthly basis, a criticized asset committee meets to review all special mention and substandard loans within prescribed policy thresholds. These loans typically represent the highest risk of loss to us. Action plans are established and these loans are monitored through regular contact with the borrower and loan officer, review of current financial information and other documentation, review of all loan or potential loan restructures or modifications and the regular re-evaluation of assets held as collateral.
We attempt to limit our exposure to credit risk by diversifying our loan portfolio by segment, geography, collateral and industry and actively managing concentrations. When concentrations exist in certain segments, we mitigate this risk by reviewing the relevant economic indicators and interest risk rating trends and through stress testing of the loans in these segments. The Bank has specific loan segment limits in its loan policy. Total commercial real estate balances should not exceed the combination of 300% of total risk based capital and growth in excess of 50% over the previous thirty-six months and construction loan balances should not exceed 100% of total risk based capital. Investment real estate property types and purchased loan programs have individual dollar limits that should not be exceeded in the portfolio. In addition, there are specific limits in place for various categories of real estate loans with regards to loan-to-value ratios, loan terms, and amortization periods.
Unsecured loans pose a higher risk for the Bank due to the lack of a well-defined secondary source of repayment. Unsecured loans are reserved for the best quality customers with well-established businesses, operate with low financial and operating leverage and demonstrate an ability to clear the outstanding balance on lines of credit for at least thirty consecutive days annually. The repayment capacity of the borrower should exceed all policy and guidelines for secured loans. If the borrower is unable to comply with this requirement and the Bank is willing to renew the credit facility, the line should be secured and/or begin amortization.
On a quarterly basis, the Credit Risk Committee of the Board of Directors meets to review our loan portfolio metrics, segmentation guidelines, and loan review findings from the previous quarter. Annually, this same committee reviews credit related policies and policy enhancements as they become available.
Additional credit risk management practices include periodic review and update of our lending policies and procedures to support sound underwriting practices and portfolio management through portfolio stress testing. Our loan review serves as a mechanism to independently monitor credit quality and assess the effectiveness of credit risk management practices to provide oversight of all corporate lending activities. The loan review function has the primary responsibility for assessing commercial credit administration and credit decision functions of consumer and mortgage underwriting, as well as providing input to the loan risk rating process. Our policy is to place loans in all categories in nonaccrual status when collection of interest or principal is doubtful, or generally when interest or principal payments are 90 days or more past due based on contractual terms.
CARTER BANK & TRUST
ITEM 7. MANAGEMENT’S DISCUSSION AND ANALYSIS OF FINANCIAL CONDITION AND RESULTS OF OPERATIONS (continued)
The Bank has a loan review policy and annual scope report that details the level of loan review for commercial loans in a given year. During 2019, the Bank used a four step approach for loan review in the following segments:
| · | Top 20 largest loan relationships, which is defined as any relationship with an aggregate outstanding balance of $2.0 million or more; |
| · | Large loan relationships that are not part of the top 20; and |
| · | Concentration focus reviews of the 16 segments sampling 20% of the balances in each segment. |
Nonperforming assets (“NPAs”) consist of nonaccrual loans, nonaccrual TDRs and other real estate owned (”OREO”). The following table summarizes nonperforming assets for the dates presented:
| | | December 31, | |
| (Dollars in Thousands) | | 2019 | | | 2018 | | | 2017 | | | 2016 | | | 2015 | |
| Nonperforming Loans | | | | | | | | | | | | | | | | | | | | |
| Real Estate | | $ | 7,084 | | | $ | 3,289 | | | $ | 51,047 | | | $ | 96,143 | | | $ | 92,944 | |
| Consumer | | | 267 | | | | 65 | | | | 47 | | | | 1 | | | | 40 | |
| Commercial | | | 77 | | | | 606 | | | | - | | | | 1 | | | | - | |
| Total Nonperforming Loans | | | 7,428 | | | | 3,960 | | | | 51,094 | | | | 96,145 | | | | 92,984 | |
| Nonperforming Troubled Debt Restructurings | | | | | | | | | | | | | | | | | | | | |
| Real Estate | | | 34,315 | | | | 46,771 | | | | 41,804 | | | | 23,319 | | | | 7,920 | |
| Consumer | | | - | | | | - | | | | - | | | | - | | | | - | |
| Commercial | | | 390 | | | | - | | | | - | | | | - | | | | - | |
| Total Nonperforming Troubled Debt Restructurings | | | 34,705 | | | | 46,771 | | | | 41,804 | | | | 23,319 | | | | 7,920 | |
| Total Nonperforming Loans and Troubled Debt Restructurings | | | 42,133 | | | | 50,731 | | | | 92,898 | | | | 119,464 | | | | 100,904 | |
| Other Real Estate Owned | | | 18,324 | | | | 33,681 | | | | 39,793 | | | | 23,558 | | | | 43,422 | |
| Total Nonperforming Assets | | $ | 60,457 | | | $ | 84,412 | | | $ | 132,691 | | | $ | 143,022 | | | $ | 144,326 | |
| | | | | | | | | | | | | | | | | | | | | |
Nonperforming Loans and Troubled Debt Restructurings to Total
Portfolio Loans | | | 1.46 | % | | | 1.88 | % | | | 3.46 | % | | | 4.37 | % | | | 3.82 | % |
| Nonperforming Assets to Total Portfolio Loans plus OREO | | | 2.08 | % | | | 3.08 | % | | | 4.87 | % | | | 5.19 | % | | | 5.38 | % |
Nonperforming assets decreased to $60.5 million at December 31, 2019 as compared to December 31, 2018. The decrease was due to an $8.6 million decline in nonperforming loans and a $15.4 million net decrease in OREO. The decrease in nonperforming loans is primarily due to principal curtailments, offset by draws due to minimal commitments remaining on the credits. The decrease in OREO was due to the sale of properties during the year ended 2019. The book value of closed retail offices, included in OREO, declined $3.8 million from December 31, 2018 and have a remaining book value of $3.0 million at December 31, 2019. During the second quarter of 2019, one retail office building with a book value of $0.7 million was closed and transferred to OREO. During the fourth quarter of 2019, three retail office buildings with a book value of $1.0 million were closed and transferred to OREO.
The CARES Act permits financial institutions to suspend requirements under GAAP for loan modifications to borrowers affected by COVID-19 that would otherwise be characterized as TDRs and suspend any determination related thereto if (i) the loan modification is made between March 1, 2020 and the earlier of December 31, 2020 or 60 days after the end of the coronavirus emergency declaration and (ii) the applicable loan was not more than 30 days past due as of December 31, 2019. In addition, federal bank regulatory authorities have issued guidance to encourage financial institutions to make loan modifications for borrowers affected by COVID-19 and have assured financial institutions that they will neither receive supervisory criticism for such prudent loan modifications, nor be required by examiners to automatically categorize COVID-19-related loan modifications as TDRs. At this time, it is uncertain what future impact loan and lease modifications related to COVID-19 will have on the Bank’s financial condition, results of operations and allowance for loan losses.
CARTER BANK & TRUST
ITEM 7. MANAGEMENT’S DISCUSSION AND ANALYSIS OF FINANCIAL CONDITION AND RESULTS OF OPERATIONS (continued)
The following table summarizes past due loans for the dates presented:
| | | December 31, | |
| (Dollars in Thousands) | | 2019 | | | 2018 | | | 2017 | | | 2016 | | | 2015 | |
| Loans 90 Days or More Past Due and Still Accruing | | | | | | | | | | | | | | | | | | | | |
| Real Estate | | $ | - | | | $ | - | | | $ | 493 | | | $ | 592 | | | $ | 418 | |
| Consumer | | | - | | | | - | | | | 59 | | | | 26 | | | | 5 | |
| Commercial | | | - | | | | - | | | | 4 | | | | - | | | | - | |
| Total Loans 90 Days or More Past Due | | $ | - | | | $ | - | | | $ | 556 | | | $ | 618 | | | $ | 423 | |
| | | December 31, | |
| (Dollars in Thousands) | | 2019 | | | 2018 | | | 2017 | | | 2016 | | | 2015 | |
| Loans 30 to 89 Days Past Due | | | | | | | | | | | | | | | | | | | | |
| Real Estate | | $ | 2,390 | | | $ | 6,046 | | | $ | 5,443 | | | $ | 9,158 | | | $ | 43,062 | |
| Consumer | | | 1,283 | | | | 1,510 | | | | 392 | | | | 197 | | | | 329 | |
| Commercial | | | 397 | | | | 62 | | | | 161 | | | | 23 | | | | 75 | |
| Total Loans 30 to 89 Days Past Due | | $ | 4,070 | | | $ | 7,618 | | | $ | 5,996 | | | $ | 9,378 | | | $ | 43,466 | |
Loans past due 90 days or more and still accruing were zero at December 31, 2019 and 2018. With the implementation of the Bank’s new core system, loans past due 90 days are automatically transferred to nonaccrual status. Loans past due 30 to 89 days or more and still accruing decreased $3.5 million to $4.1 million at December 31, 2019 compared to $7.6 million at December 31, 2018.
Closed-end installment loans, amortizing loans secured by real estate and any other loans with payments scheduled monthly are reported past due when the borrower is in arrears two or more monthly payments. Other multi-payment obligations with payments scheduled other than monthly are reported past due when one scheduled payment is due and unpaid for 30 days or more. We monitor delinquency on a monthly basis, including early stage delinquencies of 30 to 89 days past due for early identification of potential problem loans.
TDRs are loans that we, for economic or legal reasons related to a borrower’s financial difficulties, grant a concession to the borrower that we would not otherwise grant. The Bank strives to identify borrowers in financial difficulty early and work with them to modify the terms before their loan reaches nonaccrual status. These modified terms generally include extension of maturity dates at a stated interest rate lower than the current market rate for a new loan with similar characteristics, reductions in contractual interest rates or principal deferment. While unusual, there may be instances of principal forgiveness. These modifications are generally for longer term periods that would not be considered insignificant.
CARTER BANK & TRUST
ITEM 7. MANAGEMENT’S DISCUSSION AND ANALYSIS OF FINANCIAL CONDITION AND RESULTS OF OPERATIONS (continued)
An accruing loan that is modified into a TDR can remain in accrual status if, based on a current credit analysis, collection of principal and interest in accordance with the modified terms is reasonably assured, and the borrower has demonstrated sustained historical performance for a reasonable period before the modification. All TDRs are considered to be impaired loans and will be reported as impaired loans for their remaining lives, unless the restructuring agreement specifies an interest rate equal to or greater than the rate that would be accepted at the time of the restructuring for a new loan with comparable risk and we fully expect that the remaining principal and interest will be collected according to the restructured agreement. The Bank individually evaluates all impaired loans, which includes TDRs, greater than $1.0 million for additional impairment. In addition, the Bank evaluates credits with balances less than $1.0 million for impairment that may have complex loan structures. Nonaccrual TDRs can be returned to accruing status if the ultimate collectability of all contractual amounts due, according to the restructured agreement, is not in doubt and there is a period of a minimum of six months of satisfactory payment performance by the borrower either immediately before or after the restructuring.
As an example, consider a substandard commercial construction loan that is currently 90 days past due where the loan is restructured to extend the maturity date for a period longer than would be considered an insignificant period of time. The post-modification interest rate given to the borrower is considered to be lower than the current market rate for new debt with similar risk and all other terms remain the same according to the original loan agreement. This loan will be considered a TDR as the borrower is experiencing financial difficulty and a concession has been granted due to the long extension, resulting in payment delay as well as the rate being lower than current market rate for new debt with similar risk. The loan will be reported as a nonaccrual TDR and an impaired loan. In addition, the loan could be charged down to the fair value of the collateral if a confirmed loss exists. If the loan subsequently performs, by means of making on-time principal and interest payments according to the newly restructured terms for a period of six months, and it is expected that all remaining principal and interest will be collected according to the terms of the restructured agreement, the loan will be returned to accrual status and reported as an accruing TDR. The loan will remain an impaired loan for the remaining life of the loan because the interest rate was not adjusted to be equal to or greater than the rate that would be accepted at the time of the restructuring for a new loan with comparable risk.
The following table summarizes the restructured loans as of the dates presented:
| | | December 31, 2019 | | | December 31, 2018 | |
| | | Performing | | | Nonperforming | | | Total | | | Performing | | | Nonperforming | | | Total | |
| (Dollars in Thousands) | | TDRs | | | TDRs | | | TDRs | | | TDRs | | | TDRs | | | TDRs | |
| Real Estate | | $ | 109,265 | | | $ | 34,315 | | | $ | 143,580 | | | $ | 114,806 | | | $ | 46,771 | | | $ | 161,577 | |
| Consumer | | | - | | | | - | | | | - | | | | - | | | | - | | | | - | |
| Commercial | | | - | | | | 390 | | | | 390 | | | | - | | | | - | | | | - | |
| Total TDRs | | $ | 109,265 | | | $ | 34,705 | | | $ | 143,970 | | | $ | 114,806 | | | $ | 46,771 | | | $ | 161,577 | |
TDRs decreased $17.6 million to $144.0 million at December 31, 2019 compared to 161.6 million at December 31, 2018. The decrease is primarily due to principal payoffs and pay-downs totaling $19.6 million, charge-offs in the amount of $0.4 million offset by recoveries of $0.6 million, all offset by draws on commitments in the amount of $1.2 million and new accruing TDRs of $0.6 million. Total TDRs of $34.7 million and $46.8 million were on nonaccrual at December 31, 2019 and December 31, 2018, respectively. At December 31 2019, there were minimal commitments to lend additional funds on one loan relationship identified as a TDR.
CARTER BANK & TRUST
ITEM 7. MANAGEMENT’S DISCUSSION AND ANALYSIS OF FINANCIAL CONDITION AND RESULTS OF OPERATIONS (continued)
The Bank had one loan modified as a TDR during the twelve months ending December 31, 2019 totaling $0.6 million in post-modified recorded balances. The TDR modification was a result of several key factors. The borrower is experiencing financial difficulties due to negative cash flows and being dependent upon collateral to repay the loan. The most recent appraisal suggests that the borrower would have to sell the lots in this lot development project at a price higher than the appraisal for this project to be profitable. In addition, when comparing the complete value versus the cost to complete, the loan would not currently fit our standards for underwriting a lot development loan. The current rate on the loan is below market rate and there are other terms and conditions that would not be offered to a comparable borrower. There were no TDR payment defaults during the year ended December 31, 2019 for TDRs with outstanding principal balances at year end 2019. For purposes of this disclosure, a TDR payment default occurs when, within 12 months of the original TDR modification, either a full or partial charge-off occurs or a TDR becomes 90 days or more past due.
The Bank had seven loans modified as TDR’s for the twelve months ending December 31, 2018 totaling $137.9 million in post-modified recorded balances. Three TDRs in the amount of $98.3 were real estate loans and one TDR in the amount of $32.3 was a commercial and industrial loan. One TDR in the amount of $57.9 million involved modifying the terms of the note from contractual principal and interest payments to a single pay loan structure with interest and principal due at maturity. The modification was a result of the borrower experiencing financial difficulties and the single pay structure allows the borrower adequate time to liquidate the collateral and satisfy the Bank’s outstanding loan balance. One TDR in the amount of $32.3 million involved the customer offering additional collateral as part of a forbearance agreement to cure a collateral deficiency in exchange for the Bank renewing the loan and extending the maturity, a transaction the Bank would not agree to enter into without additional collateral. Two TDRs totaling $40.4 million involved the borrower offering additional collateral and entering into a forbearance agreement with the Bank which established a formal liquidation plan for the borrower to market and sell the collateral and satisfy the Bank’s outstanding loan balance. There were three additional TDRs in the amount of $7.3 million modified during the year ended 2018. Two of the three TDRs were related to one relationship and totaled $7.0 million in post modification balances. The concessions under this first TDR relationship included the installation of a forbearance agreement in which the Bank agreed to lend additional funds on a previously delinquent project, a reduction in the current contractual interest rate and the potential for partial debt forgiveness should the borrowers be able to perform all additional obligations under the restructured loan agreement including a timely liquidation of collateral and principal curtailment. In return, the borrowers granted the Bank a cross-collateralization agreement with other performing loans at the Bank to ensure that an adequate collateral margin is maintained going forward. The modification was a result of the borrower experiencing financial difficulties due to project cost overruns and the newly modified loan terms allow the borrower adequate time to liquidate the underlying collateral. The remaining $0.3 million TDR was related to one existing relationship that was reworked as a TDR in previous quarters. There were no TDR payment defaults during the year ended December 31, 2018 for TDRs with outstanding principal balances at year end 2018. For purposes of this disclosure, a TDR payment default occurs when, within 12 months of the original TDR modification, either a full or partial charge-off occurs or a TDR becomes 90 days or more past due.
��
CARTER BANK & TRUST
ITEM 7. MANAGEMENT’S DISCUSSION AND ANALYSIS OF FINANCIAL CONDITION AND RESULTS OF OPERATIONS (continued)
The following tables represent credit exposures by internally assigned grades as of December 31, 2019 and 2018:
| | | | | | | | | | | | Obligations | | | | |
| (Dollars in Thousands) | | | | | Consumers & | | | Commercial | | | Of States and | | | | |
| December 31, 2019 | | Real Estate | | | Other Loans | | | & Industrial | | | Political Sub. | | | Total | |
| Pass | | $ | 1,845,040 | | | $ | 73,345 | | | $ | 167,326 | | | $ | 364,869 | | | $ | 2,450,580 | |
| Special Mention | | | 4,022 | | | | 9 | | | | 203 | | | | - | | | | 4,234 | |
| Substandard | | | 340,349 | | | | 334 | | | | 89,269 | | | | - | | | | 429,952 | |
| Doubtful | | | - | | | | - | | | | - | | | | - | | | | - | |
| Loss | | | - | | | | - | | | | - | | | | - | | | | - | |
| Total Loans | | $ | 2,189,411 | | | $ | 73,688 | | | $ | 256,798 | | | $ | 364,869 | | | $ | 2,884,766 | |
| | | | | | | | | | | | | | | | | | | | | |
| Performing Loans | | $ | 2,148,012 | | | $ | 73,421 | | | $ | 256,331 | | | $ | 364,869 | | | $ | 2,842,633 | |
| Non-Accrual Loans | | | 41,399 | | | | 267 | | | | 467 | | | | - | | | | 42,133 | |
| Total Loans | | $ | 2,189,411 | | | $ | 73,688 | | | $ | 256,798 | | | $ | 364,869 | | | $ | 2,884,766 | |
| | | | | | | | | | | | Obligations | | | | |
| (Dollars in Thousands) | | | | | Consumers & | | | Commercial | | | Of States and | | | | |
| December 31, 2018 | | Real Estate | | | Other Loans | | | & Industrial | | | Political Sub. | | | Total | |
| Pass | | $ | 1,592,124 | | | $ | 72,907 | | | $ | 134,002 | | | $ | 432,402 | | | $ | 2,231,435 | |
| Special Mention | | | 10,765 | | | | 45 | | | | 70 | | | | - | | | | 10,880 | |
| Substandard | | | 365,975 | | | | 106 | | | | 95,396 | | | | - | | | | 461,477 | |
| Doubtful | | | - | | | | - | | | | - | | | | - | | | | - | |
| Loss | | | - | | | | - | | | | - | | | | - | | | | - | |
| Total Loans | | $ | 1,968,864 | | | $ | 73,058 | | | $ | 229,468 | | | $ | 432,402 | | | $ | 2,703,792 | |
| | | | | | | | | | | | | | | | | | | | | |
| Performing Loans | | $ | 1,918,804 | | | $ | 72,993 | | | $ | 228,862 | | | $ | 432,402 | | | $ | 2,653,061 | |
| Non-Accrual Loans | | | 50,060 | | | | 65 | | | | 606 | | | | - | | | | 50,731 | |
| Total Loans | | $ | 1,968,864 | | | $ | 73,058 | | | $ | 229,468 | | | $ | 432,402 | | | $ | 2,703,792 | |
Special mention, substandard and doubtful loans at December 31, 2019 decreased by $38.2 million to $434.2 million compared to $472.4 million at December 31, 2018, with a decrease of $6.7 million in special mention and a decrease of $31.5 million in substandard.
At this time, it is uncertain what impact COVID-19 will have on the Bank’s current impaired loans or the susceptibility of the loan portfolio to future loan impairment.
CARTER BANK & TRUST
ITEM 7. MANAGEMENT’S DISCUSSION AND ANALYSIS OF FINANCIAL CONDITION AND RESULTS OF OPERATIONS (continued)
Allowance for Loan Losses
The Bank maintains an ALL at a level determined to be adequate to absorb estimated probable credit losses inherent within the loan portfolio as of the balance sheet date and it is presented as a reserve against loans in the Consolidated Balance Sheets. Determination of an adequate ALL is inherently subjective and may be subject to significant changes from period to period. The methodology for determining the ALL has two main components: evaluation and impairment tests of individual loans and evaluation and impairment tests of certain groups of homogeneous loans with similar risk characteristics.
Our charge-off policy for commercial loans requires that loans and other obligations that are not collectible be promptly charged-off when the loss becomes probable, regardless of the delinquency status of the loan. The Bank may elect to recognize a partial charge-off when management has determined that the value of collateral is less than the remaining investment in the loan. A loan or obligation does not need to be charged-off, regardless of delinquency status, if (i) management has determined there exists sufficient collateral to protect the remaining loan balance and (ii) there exists a strategy to liquidate the collateral. Management may also consider a number of other factors to determine when a charge-off is appropriate. These factors may include, but are not limited to:
• The status of a bankruptcy proceeding
• The value of collateral and probability of successful liquidation; and/or
• The status of adverse proceedings or litigation that may result in collection
Consumer unsecured loans and secured loans are evaluated for charge-off after the loan becomes 90 days past due. Unsecured loans are fully charged-off and secured loans are charged-off to the estimated fair value of the collateral less the cost to sell.
The following summarizes our allowance for loan loss experience at December 31 for each of the years presented below:
| (Dollars in Thousands) | | 2019 | | | 2018 | | | 2017 | | | 2016 | | | 2015 | |
| Balance Beginning of Year | | $ | 39,199 | | | $ | 35,318 | | | $ | 34,500 | | | $ | 26,990 | | | $ | 24,142 | |
| Provision for Loan Losses | | | 3,404 | | | | 16,870 | | | | 43,197 | | | | 17,717 | | | | 3,300 | |
| Charge-offs: | | | | | | | | | | | | | | | | | | | | |
| Real Estate Loans | | | 659 | | | | 11,924 | | | | 42,813 | | | | 9,687 | | | | 310 | |
| Consumer Loans | | | 4,401 | | | | 2,710 | | | | 465 | | | | 510 | | | | 177 | |
| Commercial Loans | | | 22 | | | | 20 | | | | 31 | | | | 257 | | | | 20 | |
| Total Charge-offs | | | 5,082 | | | | 14,654 | | | | 43,309 | | | | 10,454 | | | | 507 | |
| Recoveries: | | | | | | | | | | | | | | | | | | | | |
| Real Estate Loans | | | 639 | | | | 1,415 | | | | 720 | | | | 131 | | | | - | |
| Consumer Loans | | | 602 | | | | 250 | | | | 210 | | | | 110 | | | | 55 | |
| Commercial Loans | | | - | | | | - | | | | - | | | | 6 | | | | - | |
| Total Recoveries | | | 1,241 | | | | 1,665 | | | | 930 | | | | 247 | | | | 55 | |
| Total Net Charge-offs | | | 3,841 | | | | 12,989 | | | | 42,379 | | | | 10,207 | | | | 452 | |
| Balance End of Year | | $ | 38,762 | | | $ | 39,199 | | | $ | 35,318 | | | $ | 34,500 | | | $ | 26,990 | |
| | | | | | | | | | | | | | | | | | | | | |
| Net Charge-offs to Average Loans | | | 0.13 | % | | | 0.47 | % | | | 1.56 | % | | | 0.38 | % | | | 0.02 | % |
| Allowance for Loan Losses to Portfolio Loans | | | 1.34 | % | | | 1.45 | % | | | 1.32 | % | | | 1.26 | % | | | 1.03 | % |
CARTER BANK & TRUST
ITEM 7. MANAGEMENT’S DISCUSSION AND ANALYSIS OF FINANCIAL CONDITION AND RESULTS OF OPERATIONS (continued)
Net charge-offs were $3.8 million in 2019 as compared to $13.0 million in 2018. The reduction in net charge-offs was due to a $10.1 million charge-off of a legacy commercial real estate relationship in the third quarter of 2018 as a result of a new appraisal. This reduction in net charge-offs is the primary reason for the $13.5 million decrease in the provision for loan losses for the year ended December 31, 2019 as compared to December 31, 2018.
An inherent risk to the loan portfolio as a whole is the condition of the economy in our markets. In addition, each loan segment carries with it risks specific to the segment. The Bank develops and documents a systematic ALL methodology based on the following portfolio segments: 1) Commercial Real Estate (“CRE”), 2) Commercial & Industrial (“C&I”), 3) Consumer, and 4) Obligations of States and Political Subdivisions. The following is a discussion of the key risks by portfolio segment that management assesses in preparing the ALL.
CRE loans are secured by commercial purpose real estate, including both owner occupied properties and investment properties, for various purposes such as hotels, strip malls and apartments. Operations of the individual projects as well as global cash flows of the debtors are the primary sources of repayment for these loans. The condition of the local economy is an important indicator of risk, but there are also more specific risks depending on the collateral type as well as the business.
C&I loans are made to operating companies or manufacturers for the purpose of production, operating capacity, accounts receivable, inventory or equipment financing. Cash flow from the operations of the borrower is the primary source of repayment for these loans. The condition of the local economy is an important indicator of risk, but there are also more specific risks depending on the industry of the borrower. Collateral for these types of loans often do not have sufficient value in a distressed or liquidation scenario to satisfy the outstanding debt.
Consumer loans are made to individuals and may be secured by assets other than 1-4 family residences, as well as unsecured loans. This segment includes auto loans and unsecured loans and lines. The primary source of repayment for these loans is the income and assets of the borrower. The condition of the local economy, in particular the unemployment rate, is an important indicator of risk for this segment. The value of the collateral, if there is any, is less likely to be a source of repayment due to less certain collateral values.
Obligations of States and Political Subdivision loans are made to local and state municipalities for various purposes including refinancing existing obligations, infrastructure up-fit and expansion, or to purchase new equipment. This segment of loans may be secured by general obligations from the municipal authority or revenues generated by infrastructure and equipment financed by the Bank. The primary repayment source for these loans include the tax basis of the municipality, specific revenue streams related to the infrastructure financed, and other business operations of the municipal authority. The health and stability of state and local economies directly impacts each municipality’s tax basis and are important indicators of risk for this segment. The ability of each municipality to increase taxes and fees to offset debt service requirements give this type of loan a very low risk profile in the continuum of the Bank’s loan portfolio.
CARTER BANK & TRUST
ITEM 7. MANAGEMENT’S DISCUSSION AND ANALYSIS OF FINANCIAL CONDITION AND RESULTS OF OPERATIONS (continued)
The following is the ALL balance by segment as of December 31 for the years presented below:
| | | 2019 | | | 2018 | | | 2017 | | | 2016 | | | 2015 | |
| | | | | | % of | | | | | | % of | | | | | | % of | | | | | | % of | | | | | | % of | |
| | | | | | Loans | | | | | | Loans | | | | | | Loans | | | | | | Loans | | | | | | Loans | |
| | | | | | in each | | | | | | in each | | | | | | in each | | | | | | in each | | | | | | in each | |
| | | | | | Category | | | | | | Category | | | | | | Category | | | | | | Category | | | | | | Category | |
| | | | | | to Total | | | | | | to Total | | | | | | to Total | | | | | | to Total | | | | | | to Total | |
| (Dollars in Thousands) | | Amount | | | Loans | | | Amount | | | Loans | | | Amount | | | Loans | | | Amount | | | Loans | | | Amount | | | Loans | |
| Real Estate | | $ | 31,873 | | | | 76 | % | | $ | 35,422 | | | | 73 | % | | $ | 33,367 | | | | 67 | % | | $ | 32,476 | | | | 69 | % | | $ | 16,584 | | | | 67 | % |
| Consumer & Other Loans | | | 3,299 | | | | 2 | % | | | 2,728 | | | | 3 | % | | | 288 | | | | 3 | % | | | 82 | | | | 1 | % | | | 6,098 | | | | 1 | % |
| Commercial & Industrial | | | 3,225 | | | | 9 | % | | | 617 | | | | 8 | % | | | 1,203 | | | | 12 | % | | | 1,480 | | | | 13 | % | | | 4,308 | | | | 17 | % |
| Obligations of States and Political Sub. | | | 365 | | | | 13 | % | | | 432 | | | | 16 | % | | | 460 | | | | 18 | % | | | 462 | | | | 17 | % | | | - | | | | 15 | % |
| Balance End of Year | | $ | 38,762 | | | | 100 | % | | $ | 39,199 | | | | 100 | % | | $ | 35,318 | | | | 100 | % | | $ | 34,500 | | | | 100 | % | | $ | 26,990 | | | | 100 | % |
Significant to our ALL is a higher concentration of commercial loans. The ability of borrowers to repay commercial loans is dependent upon the success of their business and general economic conditions. Due to the greater potential for loss within our commercial portfolio, we monitor the commercial loan portfolio through an internal risk rating system. Loan risk ratings are assigned based upon the creditworthiness of the borrower and are reviewed on an ongoing basis according to our internal policies. Loans rated special mention or substandard have potential or well-defined weaknesses not generally found in high quality, performing loans, and require attention from management to limit loss.
The following table summarizes the ALL balance as of December 31 for the years presented below:
| (Dollars in Thousands) | | 2019 | | | 2018 | | | 2017 | | | 2016 | | | 2015 | |
| Collectively Evaluated for Impairment | | $ | 32,593 | | | $ | 34,000 | | | $ | 35,286 | | | $ | 34,256 | | | $ | 26,440 | |
| Individually Evaluated for Impairment | | | 6,169 | | | | 5,199 | | | | 32 | | | | 244 | | | | 550 | |
| Total Allowance for Loan Losses | | $ | 38,762 | | | $ | 39,199 | | | $ | 35,318 | | | $ | 34,500 | | | $ | 26,990 | |
The ALL was $38.8 million, or 1.34% of total portfolio loans at December 31, 2019 compared to $39.2 million, or 1.45% of total portfolio loans at December 31, 2018.
CARTER BANK & TRUST
ITEM 7. MANAGEMENT’S DISCUSSION AND ANALYSIS OF FINANCIAL CONDITION AND RESULTS OF OPERATIONS (continued)
The decrease in the ALL of $0.4 million was primarily due to a $1.0 million increase in the specific reserve for impaired loans, offset by a $1.4 million decrease for loans collectively evaluated for impairment at December 31, 2019 compared to December 31, 2018. Please reference Note 6-Allowance for Loan Losses for additional information. The $1.4 million decrease since December 31, 2018 in the reserve for collectively evaluated loans is primarily related to a decrease in historical losses due to legacy credit charge-offs that occurred in the fourth quarter of 2016 that are now outside of the 36 month look-back period, offset by increased provision due to higher portfolio loan volumes. Qualitative adjustment factors in the calculation were down slightly down from the prior year due to overall stable economic and business conditions in our primary markets and in segments represented in the portfolio.
Deposits
The following tables present the composition of deposits at December 31:
| (Dollars in Thousands) | | 2019 | | | 2018 | | | $ Change | | | % Change | |
| Noninterest-Bearing Demand | | $ | 554,875 | | | $ | 547,773 | | | $ | 7,102 | | | | 1.3 | % |
| Interest-Bearing Demand | | | 286,561 | | | | 254,015 | | | | 32,546 | | | | 12.8 | % |
| Money Market | | | 140,589 | | | | 80,835 | | | | 59,754 | | | | 73.9 | % |
| Savings | | | 561,814 | | | | 610,757 | | | | (48,943 | ) | | | (8.0 | )% |
| Certificates of Deposits | | | 1,960,406 | | | | 2,097,801 | | | | (137,395 | ) | | | (6.5 | )% |
| Total | | $ | 3,504,245 | | | $ | 3,591,181 | | | $ | (86,936 | ) | | | (2.4 | )% |
| | | For the Year Ended December 31, | |
| | | Average Balance | | | Average Cost Rate | |
| (Dollars in Thousands) | | 2019 | | | 2018 | | | 2017 | | | 2019 | | | 2018 | | | 2017 | |
| Noninterest-Bearing Demand Deposits | | $ | 557,505 | | | $ | 551,124 | | | $ | 550,496 | | | | - | | | | - | | | | - | |
| Interest-Bearing Transaction Accounts | | | 249,086 | | | | 246,592 | | | | 244,919 | | | | 0.80 | % | | | 0.79 | % | | | 0.65 | % |
| Money Market | | | 134,676 | | | | 96,068 | | | | 141,438 | | | | 1.24 | % | | | 0.72 | % | | | 0.56 | % |
| Savings | | | 582,195 | | | | 663,801 | | | | 727,182 | | | | 0.24 | % | | | 0.31 | % | | | 0.49 | % |
| Certificates of Deposit | | | 2,054,077 | | | | 2,090,103 | | | | 2,199,263 | | | | 2.02 | % | | | 1.60 | % | | | 1.42 | % |
| Total Interest-Bearing Deposits | | | 3,020,034 | | | | 3,096,564 | | | | 3,312,802 | | | | 1.54 | % | | | 1.23 | % | | | 1.12 | % |
| Total Deposits | | $ | 3,577,539 | | | $ | 3,647,688 | | | $ | 3,863,298 | | | | 1.30 | % | | | 1.04 | % | | | 0.96 | % |
Deposits are our primary source of funds. The Bank believes that our deposit base is stable and that the Bank has the ability to attract new depositors while diversifying the deposit composition. Total deposits at December 31, 2019 decreased $86.9 million, or 2.4%, from December 31, 2018. Noninterest-bearing deposits increased by $7.1 million, or 1.3%, to $554.9 million as of December 31, 2019 as compared to $547.8 million at December 31, 2018. Money market accounts increased $59.8 million, or 73.9%, at year-end 2019 as compared to year-end 2018, due to recent special rate promotions during 2019 and a renewed focus on lower cost non-maturing deposit account acquisition. Interest-bearing demand deposits increased $32.5 million, or 12.8%, to $286.6 million at December 31, 2019 as compared to December 31, 2018. Offsetting these increases were decreases of $48.9 million, or 8.0%, in savings accounts and $137.4 million in certificates of deposits in the 2019 to 2018 comparison. The decrease in certificates of deposits from 2018 to 2019 is part of an ongoing strategic initiative by the Bank to transition the funding mix from higher cost certificates of deposits to lower cost non-maturing deposits. Noninterest-bearing deposits comprised 15.8% and 15.3% of total deposits at December 31, 2019 and December 31, 2018, respectively.
CARTER BANK & TRUST
ITEM 7. MANAGEMENT’S DISCUSSION AND ANALYSIS OF FINANCIAL CONDITION AND RESULTS OF OPERATIONS (continued)
The following table summarizes the maturities of our certificates of deposits:
| (Dollars in Thousands) | | | 2019 | |
| 2020 | | | $ | 1,034,098 | |
| 2021 | | | | 332,864 | |
| 2022 | | | | 153,255 | |
| 2023 | | | | 294,547 | |
| 2024 | | | | 143,666 | |
| Thereafter | | | | 1,976 | |
| TOTAL | | | $ | 1,960,406 | |
Maturities of CDs of $250,000 or more outstanding at December 31, 2019 are summarized as follows:
| (Dollars in Thousands) | | Amount | | | Percent | |
| Three Months or Less | | $ | 40,691 | | | | 20.84 | % |
| Over Three Months Through Twelve Months | | | 68,386 | | | | 35.02 | % |
| Over Twelve Months Through Three Years | | | 39,301 | | | | 20.12 | % |
| Over Three Years | | | 46,918 | | | | 24.02 | % |
| Total | | $ | 195,296 | | | | 100 | % |
Long-Term Borrowings
Borrowings are an additional source of liquidity for the Bank. Long-term borrowings are for terms greater than one year and consist of FHLB advances. FHLB Borrowings were $10.0 million and zero at December 31, 2019 and December 31, 2018, respectively. FHLB borrowings are fixed rate advances for various terms and are secured by a blanket lien on select residential mortgages and investment securities available-for-sale. Total loans pledged as collateral were $284.6 million at December 31, 2019. Total securities available-for-sale pledged as collateral were $28.6 million at December 31, 2019. The Bank is eligible to borrow up to an additional $242.2 million based upon qualifying collateral, to a maximum borrowing capacity of approximately $1.0 billion, or 25% of the Bank’s assets, as of December 31, 2019.
Information pertaining to long-term borrowings at December 31 is summarized in the table below:
| (Dollars in Thousands) | | 2019 | | | 2018 | | | 2017 | |
| Balance at December 31 | | $ | 10,000 | | | $ | - | | | $ | - | |
| Average Balance during Year | | | 2,329 | | | | - | | | | - | |
| Average Interest Rate during the Year | | | 1.63 | % | | | 0.00 | % | | | 0.00 | % |
| Maximum Month-end Balance during the Year | | | 10,000 | | | | - | | | | - | |
| Average Interest Rate at December 31 | | | 1.63 | % | | | 0.00 | % | | | 0.00 | % |
CARTER BANK & TRUST
ITEM 7. MANAGEMENT’S DISCUSSION AND ANALYSIS OF FINANCIAL CONDITION AND RESULTS OF OPERATIONS (continued)
The Bank held FHLB Atlanta stock of $4.1 million and zero at December 31, 2019 and December 31, 2018, respectively. Dividends received on this restricted stock were $144 thousand for the year ended December 31, 2019 and zero for 2018 and 2017. The investment is carried at cost and evaluated for impairment based on the ultimate recoverability of the par value. We hold FHLB stock because we are a member of the FHLB of Atlanta. The FHLB requires members to purchase and hold a specified level of FHLB stock based upon the members’ asset values, level of borrowings and participation in other programs offered. Stock in the FHLB is non-marketable and is redeemable at the discretion of the FHLB. Members do not purchase stock in the FHLB for the same reasons that traditional equity investors acquire stock in an investor-owned enterprise. Rather, members purchase stock to obtain access to the products and services offered by the FHLB. Unlike equity securities of traditional for-profit enterprises, the stock of the FHLB does not provide its holders with an opportunity for capital appreciation because, by regulation, FHLB stock can only be purchased, redeemed and transferred at par value. The Bank reviewed and evaluated FHLB stock for OTTI at December 31, 2019. The Bank reviews factors such as earnings, capital ratios, and dividend paying capacity in its evaluation of impairment. The Bank believes that there is sufficient evidence to conclude that there is no impairment at December 31, 2019 or subsequently at March 31, 2020.
Capital Resources
The following table summarizes ratios for the Bank for December 31:
| Risk-based capital ratios | | | | | |
| | | 2019 | | | 2018 | | | 2017 | | | 2016 | | | 2015 | |
| Common Equity Tier 1 | | | 13.46 | % | | | 13.86 | % | | | 12.82 | % | | | 12.12 | % | | | 11.27 | % |
| Tier 1 Ratio | | | 13.46 | % | | | 13.86 | % | | | 12.82 | % | | | 12.12 | % | | | 11.27 | % |
| Total Risk-Based Capital Ratio | | | 14.71 | % | | | 15.11 | % | | | 14.05 | % | | | 13.25 | % | | | 11.94 | % |
| Leverage Ratio | | | 10.33 | % | | | 9.61 | % | | | 9.25 | % | | | 8.03 | % | | | 7.54 | % |
Shareholders’ equity increased $36.9 million, or 8.5%, to $473.1 million at December 31, 2019 as compared to $436.2 million at December 31, 2018. The increase in shareholders’ equity is primarily due to net income of $26.6 million in 2019 and other comprehensive income in the amount of $10.2 million. The change in other comprehensive income of $10.2 million was primarily due to the increase in net unrealized gains on securities available-for-sale driven by a decrease in interest rates during the period.
The Bank continues to maintain its capital position with a leverage ratio of 10.33% as compared to the regulatory guideline of 5.0% to be well-capitalized and a risk-based Common Equity Tier 1 ratio of 13.46% compared to the regulatory guideline of 6.5% to be well-capitalized. Our risk-based Tier 1 and Total Capital ratios were 13.46% and 14.71%, respectively, which places the Bank about the federal bank regulatory agencies’ well-capitalized guidelines of 8.0% and 10.0%, respectively. We believe that we have the ability to raise additional capital, if necessary.
In July 2013 the federal banking agencies issued a final rule to implement Basel III (which were agreements reached in July 2010 by the international oversight body of the Basel Committee on Banking Supervision to require more and higher quality capital) and the minimum leverage and risk-based capital requirements of the Dodd-Frank Act. The final rule established a comprehensive capital framework and went into effect on January 1, 2015 for smaller banking organizations such as the Bank. The rule also required the Bank to maintain a capital conservation buffer composed of Common Equity Tier 1 capital in an amount greater than 2.50% of total risk-weighted assets beginning in 2019. The capital conservation buffer is scheduled to phase in over several years. The capital conservation buffer was .25% in 2016, .50% in 2017, .75% in 2018, and increased to 1.00% in 2019 and beyond. As a result, starting in 2019, the Bank must maintain a Common Equity Tier I risk-based capital ratio greater than 7.0%, a Tier 1 risk-based capital ratio greater than 8.5%, and a Total risk-based capital ratio greater than 10.5%; otherwise, the Bank will be subject to restrictions on capital distributions and discretionary bonus payments. Now that the new rule is fully phased in, the minimum capital requirements plus the capital conservation buffer exceeds the regulatory capital ratios required for an insured depository institution to be well-capitalized under the FDIC’s prompt corrective action framework.
CARTER BANK & TRUST
ITEM 7. MANAGEMENT’S DISCUSSION AND ANALYSIS OF FINANCIAL CONDITION AND RESULTS OF OPERATIONS (continued)
Federal regulators periodically propose amendments to the regulatory capital rules and the related regulatory framework and consider changes to the capital standards that could significantly increase the amount of capital needed to meet applicable standards. The timing of adoption, ultimate form and effect of any such proposed amendments cannot be predicted.
Contractual Obligations
Contractual obligations represent future cash commitments and liabilities under agreements with third parties and exclude contingent contractual liabilities for which we cannot reasonably predict future payments. We have various financial obligations, including contractual obligations and commitments that may require future cash payments. The following table presents as of December 31, 2019, significant fixed and determinable contractual obligations to third parties by payment date:
| | | Payments Due In | |
| (Dollars in Thousands) | | | 2020 | | | | 2021-2022 | | | | 2023-2024 | | | | Later Years | | | | Total | |
| Deposits without a Stated Maturity (1) | | $ | 1,543,839 | | | $ | - | | | $ | - | | | $ | - | | | $ | 1,543,839 | |
| Certificates of Deposits (1) | | | 1,034,098 | | | | 486,119 | | | | 438,213 | | | | 1,976 | | | | 1,960,406 | |
| Operating and Capital Leases | | | 375 | | | | 534 | | | | 472 | | | | 826 | | | | 2,207 | |
| Purchase Obligations | | | 4,967 | | | | 9,835 | | | | 5,539 | | | | 10,617 | | | | 30,958 | |
| Total | | $ | 2,583,279 | | | $ | 496,488 | | | $ | 444,224 | | | $ | 13,419 | | | $ | 3,537,410 | |
(1) Excludes Interest
Lease contracts are described in Note 8, Premises and Equipment, to the Consolidated Financial Statements included in Part II, Item 8 of this Report. Purchase obligations primarily represent obligations under agreement with a third party data processing vendor and communications charges.
Off-Balance Sheet Arrangements
In the normal course of business, we offer off-balance sheet credit arrangements to enable our customers to meet their financing objectives. These instruments involve, to varying degrees, elements of credit and interest rate risk in excess of the amount recognized in the financial statements. Our exposure to credit loss, in the event the customer does not satisfy the terms of the agreement, equals the contractual amount of the obligation less the value of any collateral. We apply the same credit policies in making commitments and standby letters of credit that are used for the underwriting of loans to customers. Commitments generally have fixed expiration dates, annual renewals or other termination clauses and may require payment of a fee. Because many of the commitments are expected to expire without being drawn upon, the total commitment amounts do not necessarily represent future cash requirements.
CARTER BANK & TRUST
ITEM 7. MANAGEMENT’S DISCUSSION AND ANALYSIS OF FINANCIAL CONDITION AND RESULTS OF OPERATIONS (continued)
The following table sets forth the commitments and letters of credit as of December 31:
| (Dollars in Thousands) | | 2019 | | | 2018 | |
| Commitments to Extend Credit | | $ | 488,864 | | | $ | 387,695 | |
| Standby Letters of Credit | | | 39,575 | | | | 34,354 | |
| Total | | $ | 528,439 | | | $ | 422,049 | |
Estimates of the fair value of these off-balance sheet items were not made because of the short-term nature of these arrangements and the credit standing of the counterparties.
Our allowance for unfunded commitments is determined using a methodology similar to that used to determine the ALL. Amounts are added to the allowance for unfunded commitments through a charge to current earnings in noninterest expense. The balance in the allowance for unfunded commitments was $0.4 million and $0.3 million at December 31, 2019 and December 31, 2018, respectively.
Liquidity
Liquidity is defined as a financial institution’s ability to meet its cash and collateral obligations at a reasonable cost. This includes the ability to satisfy the financial needs of depositors who want to withdraw funds or of borrowers needing to access funds to meet their credit needs. In order to manage liquidity risk our Board of Directors has delegated authority to the Asset Liability Committee (“ALCO”) for formulation, implementation and oversight of liquidity risk management for the Bank. The ALCO’s goal is to maintain adequate levels of liquidity at a reasonable cost to meet funding needs in both a normal operating environment and for potential liquidity stress events. The ALCO monitors and manages liquidity through various ratios, reviewing cash flow projections, performing stress tests and by having a detailed contingency funding plan. The ALCO policy guidelines define graduated risk tolerance levels. If our liquidity position moves to a level that has been defined as high risk, specific actions are required, such as increased monitoring or the development of an action plan to reduce the risk position.
Our primary funding and liquidity source is a stable customer deposit base. We believe we have the ability to retain existing deposits and attract new deposits, mitigating any funding dependency on other more volatile sources. Although deposits are the primary source of funds, the Bank has identified various other funding sources that can be used as part of our normal funding program when either a structure or cost efficiency has been identified. Additional funding sources accessible to the Bank include borrowing availability at the FHLB, equal to 25% of the Bank’s assets approximating $1.0 billion, subject to the amount of eligible collateral pledged, federal funds lines with six other correspondent financial institutions in the amount of $115.0 million, and the brokered deposit market. In addition to the lines referenced above, the Bank also has its available-for-sale investment securities portfolio as an additional source of liquidity.
CARTER BANK & TRUST
ITEM 7. MANAGEMENT’S DISCUSSION AND ANALYSIS OF FINANCIAL CONDITION AND RESULTS OF OPERATIONS (continued)
An important component of our ability to effectively respond to potential liquidity stress events is maintaining a cushion of highly liquid assets. Highly liquid assets are those that can be converted to cash quickly, with little or no loss in value, to meet financial obligations. ALCO policy guidelines define a ratio of highly liquid assets to total assets by graduated risk tolerance levels of minimal, moderate and high. At December 31, 2019, the Bank had $696.2 million in highly liquid assets, which consisted of $45.1 million in interest-bearing deposits in other financial institutions, $39.3 million in FRB Excess Reserves, $592.1 million in unpledged securities and $19.7 million in loans held-for-sale. This resulted in a highly liquid assets to total assets ratio of 17.4% at December 31, 2019.
If an extended recession caused large numbers of our deposit customers to withdraw their funds, we might become more reliant on volatile or more expensive sources of funding.
The following table provides detail of liquidity sources as of the periods presented:
| (Dollars in Thousands) | | March 31, 2020 | | | December 31, 2019 | |
| Cash and Due From Banks | | $ | 50,879 | | | $ | 85,628 | |
| Interest Bearing Deposits | | | 1,493 | | | | 914 | |
| Excess Reserves | | | 11,028 | | | | 39,270 | |
| Unpledged Investment Securities | | | 605,432 | | | | 592,065 | |
| Excess Pledged Securities | | | 29,018 | | | | 16,030 | |
| FHLB Borrowing Availability | | | 217,626 | | | | 242,188 | |
| Unsecured Lines of Credit | | | 115,000 | | | | 115,000 | |
| Total Liquidity Sources | | $ | 1,030,477 | | | $ | 1,091,094 | |
Inflation
Management is aware of the significant effect inflation has on interest rates and can have on financial performance. Our ability to cope with this is best determined by analyzing our capability to respond to changing interest rates and our ability to manage noninterest income and expense. We monitor the mix of interest-rate sensitive assets and liabilities through ALCO in order to reduce the impact of inflation on net interest income. We also control the effects of inflation by reviewing the prices of our products and services, by introducing new products and services and by controlling overhead expenses.
CARTER BANK & TRUST
ITEM 7A. QUANTITATIVE AND QUALITATIVE DISCLOSURES ABOUT MARKET RISK
Market Risk
Market risk is defined as the degree to which changes in interest rates, foreign exchange rates, commodity prices, or equity prices can adversely affect a financial institution’s earnings or capital. For financial institutions, market risk primarily reflects exposures to changes in interest rates. Interest rate fluctuations affect earnings by changing net interest income and other interest-sensitive income and expense levels. Interest rate changes affect capital by changing the net present value of a bank’s future cash flows, and the cash flows themselves, as rates change. Accepting this risk is a normal part of banking and can be an important source of profitability and enhancement of shareholder value. However, excessive interest rate risk can threaten a bank’s earnings, capital, liquidity and solvency. Our sensitivity to changes in interest rate movements is continually monitored by the ALCO.
The ALCO utilizes an asset liability model (“ALM”) to monitor and manage market risk through net interest income simulation for various rate shock scenarios and economic value of equity (“EVE”), simulation for various rate shock scenarios. The rate shock scenarios used in the ALM span over multiple time horizons and yield curve shapes and include parallel and non-parallel shifts to ensure the ALCO can mitigate future earnings and market value fluctuations due to changes in market interest rates.
Within the context of the ALM, net interest income rate shock simulations explicitly measure the exposure to earnings from changes in market rates of interest over a defined time horizon. These robust simulations include assumptions of how the balance sheet will react in different rate environments including loan pre-payment speeds, average life of non-maturing deposits, and how sensitive each interest-earning asset and interest-bearing liability is to changes in market rates (betas). Under simulation analysis, our current financial position is combined with assumptions regarding future business to calculate net interest income under various hypothetical rate scenarios. Reviewing these various measures provides us with a more comprehensive view of our interest rate risk profile.
Net interest income rate shock simulation results are compared to a base case to provide an estimate of the impact that market rate changes may have on 12 months and 24 months of pretax net interest income. The base case and rate shock analyses are performed on a static and growth balance sheet. A static balance sheet is a no growth balance sheet in which all maturing and/or repricing cash flows are reinvested in the same product at the existing product spread. Rate shock analyses assume an immediate parallel shift in market interest rates and also include management assumptions regarding the impact of interest rate changes on non-maturity deposit products (noninterest-bearing demand, interest-bearing demand, money market and savings) and changes in the prepayment behavior of loans and securities with optionality. Our policy guidelines limit the change in pretax net interest income over a 12 month horizon using rate shocks of +/- 100, 200, 300 and 400 basis points. We have temporarily suspended the -300 and -400 basis point rate shock analyses. Due to the low interest rate environment, we believe the impact to net interest income when evaluating the -300 and -400 basis point rate shock scenarios does not provide meaningful insight into our interest rate risk position.
In order to monitor interest rate risk beyond the 24 month time horizon of rate shocks, we also perform EVE analyses. EVE represents the present value of all asset cash flows minus the present value of all liability cash flows. EVE rate change results are compared to a base case to determine the impact that market rate changes may have on our EVE. As with rate shock analysis, EVE analyses incorporate management assumptions regarding prepayment behavior of fixed rate loans and securities with optionality and the behavior and value of non-maturity deposit products. Our policy guidelines limit the change in EVE given changes in rates of +/- 100, 200, 300 and 400 basis points. We have also temporarily suspended the EVE -300 and -400 basis point scenarios due to the low interest rate environment.
CARTER BANK & TRUST
ITEM 7A. QUANTITATIVE AND QUALITATIVE DISCLOSURES ABOUT MARKET RISK (continued)
The tables below reflect the net interest income rate shock analyses and EVE analyses results for the periods presented utilizing a static balance sheet. All percentage changes presented are within prescribed ranges set by management.
| | December 31, 2019 | |
| Change in Interest Rate | | | % Change in Pretax | | | % Change in Economic | |
| (basis points) | | | Net Interest Income | | | Value of Equity | |
| | 400 | | | | 24.12 | % | | | 1.43 | % |
| | 300 | | | | 19.09 | % | | | 2.17 | % |
| | 200 | | | | 13.35 | % | | | 2.94 | % |
| | 100 | | | | 7.08 | % | | | 2.49 | % |
| | (100) | | | | -8.63 | % | | | -6.96 | % |
| | (200) | | | | -15.90 | % | | | -14.13 | % |
| | | | December 31, 2018 | |
| Change in Interest Rate | | | % Change in Pretax | | | % Change in Economic | |
| (basis points) | | | Net Interest Income | | | Value of Equity | |
| | 400 | | | | 26.47 | % | | | 3.94 | % |
| | 300 | | | | 20.28 | % | | | 3.93 | % |
| | 200 | | | | 13.98 | % | | | 3.64 | % |
| | 100 | | | | 7.08 | % | | | 2.51 | % |
| | (100) | | | | -7.29 | % | | | -4.98 | % |
| | (200) | | | | -16.31 | % | | | -13.14 | % |
The results from the net interest income rate shock analysis are consistent with having an asset sensitive balance sheet, when adjusted for repricing correlations (betas). The above table indicates that in a rising interest rate environment, the Bank is positioned to have increased pretax net interest income for the same asset base due to the balance sheet composition, related maturity structures and repricing correlations to market interest rates for assets and liabilities. Conversely, in a declining interest rate environment the Bank is positioned to have decreased pretax net interest income for the same reasons discussed above.
In addition to rate shocks and EVE analyses, sensitivity analyses are performed to help us identify which model assumptions are critical and cause the greatest impact on pretax net interest income. Sensitivity analyses include changing prepayment behavior of loans and securities with optionality, repricing correlations, and the impact of interest rate changes on non-maturity deposit products (decay rates).
CARTER BANK & TRUST
ITEM 8. FINANCIAL STATEMENTS AND SUPPLEMENTARY DATA
Consolidated Financial Statements
| Consolidated Balance Sheets | 76 |
| | |
| Consolidated Statements of Income (Loss) | 77 |
| | |
| Consolidated Statements of Comprehensive Income (Loss) | 78 |
| | |
| Consolidated Statements of Changes in Shareholders’ Equity | 79 |
| | |
| Consolidated Statements of Cash Flows | 80 |
| | |
| Notes to Consolidated Financial Statements | 82 |
| | |
Report of Crowe LLP, Independent Registered Public Accounting Firm, on Consolidated Financial Statements | 125 |
| | |
Report of Crowe LLP, Independent Registered Public Accounting Firm, on Effectiveness of Internal Control Over Financial Reporting | 126 |
| | |
| Report of Yount, Hyde & Barbour, Independent Registered Public Accounting Firm, on Consolidated Financial Statements | 128 |
CARTER BANK & TRUST
ITEM 8. FINANCIAL STATEMENTS AND SUPPLEMENTARY DATA (continued)
CONSOLIDATED BALANCE SHEETS
| (Dollars in Thousands Except Per Share Data) | | December 31, | | | December 31, | |
| ASSETS | | 2019 | | | 2018 | |
| Cash and Due From Banks | | $ | 41,386 | | | $ | 47,413 | |
| Interest-Bearing Deposits in Other Financial Institutions | | | 45,156 | | | | 61,612 | |
| FRB Excess Reserves | | | 39,270 | | | | 184,798 | |
| Total Cash and Cash Equivalents | | | 125,812 | | | | 293,823 | |
| Securities Available-for-Sale, at Fair Value | | | 742,617 | | | | 782,758 | |
| Loans Held-for-Sale | | | 19,714 | | | | 2,559 | |
| Portfolio Loans | | | 2,884,766 | | | | 2,703,792 | |
| Allowance for Loan Losses | | | (38,762 | ) | | | (39,199 | ) |
| Portfolio Loans, net | | | 2,846,004 | | | | 2,664,593 | |
| Bank Premises and Equipment, net | | | 85,942 | | | | 85,841 | |
| Other Real Estate Owned, net | | | 18,324 | | | | 33,681 | |
| Federal Home Loan Bank Stock, at Cost | | | 4,113 | | | | - | |
| Goodwill | | | 62,192 | | | | 62,192 | |
| Bank Owned Life Insurance | | | 52,597 | | | | 51,161 | |
| Other Assets | | | 48,793 | | | | 62,991 | |
| Total Assets | | $ | 4,006,108 | | | $ | 4,039,599 | |
| | | | | | | | | |
| LIABILITIES | | | | | | | | |
| Deposits: | | | | | | | | |
| Noninterest-Bearing Demand | | $ | 554,875 | | | $ | 547,773 | |
| Interest-Bearing Demand | | | 286,561 | | | | 254,015 | |
| Money Market | | | 140,589 | | | | 80,835 | |
| Savings | | | 561,814 | | | | 610,757 | |
| Certificates of Deposit | | | 1,960,406 | | | | 2,097,801 | |
| Total Deposits | | | 3,504,245 | | | | 3,591,181 | |
| Federal Home Loan Bank Borrowings | | | 10,000 | | | | - | |
| Other Liabilities | | | 18,752 | | | | 12,204 | |
| Total Liabilities | | | 3,532,997 | | | | 3,603,385 | |
| | | | | | | | | |
| SHAREHOLDERS' EQUITY | | | | | | | | |
| Common Stock, Par Value $1 Per Share, Authorized 100,000,000 | | | | | | | | |
| Shares; 26,334,229 Outstanding in 2019 and 26,270,174 in 2018 | | | 26,334 | | | | 26,270 | |
| Additional Paid-in-Capital | | | 142,492 | | | | 142,175 | |
| Retained Earnings | | | 304,158 | | | | 277,835 | |
| Accumulated Other Comprehensive Income (Loss) | | | 127 | | | | (10,066 | ) |
| Total Shareholders' Equity | | | 473,111 | | | | 436,214 | |
| Total Liabilities and Shareholders' Equity | | $ | 4,006,108 | | | $ | 4,039,599 | |
See accompanying notes to audited consolidated financial statements.
CARTER BANK & TRUST
ITEM 8. FINANCIAL STATEMENTS AND SUPPLEMENTARY DATA (continued)
CONSOLIDATED STATEMENTS OF INCOME (LOSS)
| | | Years Ended December 31, | |
| (Dollars in Thousands except Per Share Data) | | 2019 | | | 2018 | | | 2017 | |
| INTEREST INCOME | | | | | | | | | | | | |
| Loans, including fees | | | | | | | | | | | | |
| Taxable | | $ | 126,939 | | | $ | 119,563 | | | $ | 108,193 | |
| Non-Taxable | | | 9,603 | | | | 10,107 | | | | 10,901 | |
| Investment Securities | | | | | | | | | | | | |
| Taxable | | | 17,826 | | | | 15,421 | | | | 14,911 | |
| Non-Taxable | | | 1,858 | | | | 4,246 | | | | 4,895 | |
| FRB Excess Reserves | | | 1,484 | | | | 1,589 | | | | 4,617 | |
| Interest on Bank Deposits | | | 1,266 | | | | 1,093 | | | | 567 | |
| Dividend Income | | | 144 | | | | - | | | | - | |
| Total Interest Income | | | 159,120 | | | | 152,019 | | | | 144,084 | |
| Interest Expense | | | | | | | | | | | | |
| Interest Expense on Deposits | | | 46,656 | | | | 38,094 | | | | 37,111 | |
| Interest Expense on Federal Funds Purchased | | | - | | | | 20 | | | | - | |
| Interest on Other Borrowings | | | 117 | | | | - | | | | - | |
| Total Interest Expense | | | 46,773 | | | | 38,114 | | | | 37,111 | |
| NET INTEREST INCOME | | | 112,347 | | | | 113,905 | | | | 106,973 | |
| Provision for Loan Losses | | | 3,404 | | | | 16,870 | | | | 43,197 | |
| Net Interest Income After Provision for Loan Losses | | | 108,943 | | | | 97,035 | | | | 63,776 | |
| NONINTEREST INCOME | | | | | | | | | | | | |
| Gain on Sales of Securities, net | | | 2,205 | | | | 1,271 | | | | 1,186 | |
| Service Charges, Commissions and Fees | | | 4,962 | | | | 4,081 | | | | 2,920 | |
| Debit Card Interchange Fees | | | 5,160 | | | | 4,750 | | | | 4,854 | |
| Insurance | | | 1,225 | | | | 1,855 | | | | 2,582 | |
| Bank Owned Life Insurance Income | | | 1,436 | | | | 1,161 | | | | - | |
| Other Real Estate Owned Income | | | 689 | | | | 2,692 | | | | 448 | |
| Other | | | 1,193 | | | | 1,176 | | | | 601 | |
| Total Noninterest Income | | | 16,870 | | | | 16,986 | | | | 12,591 | |
| NONINTEREST EXPENSE | | | | | | | | | | | | |
| Salaries and Employee Benefits | | | 52,879 | | | | 49,958 | | | | 42,711 | |
| Occupancy Expense, net | | | 11,785 | | | | 10,312 | | | | 9,780 | |
| FDIC Insurance Expense | | | 1,270 | | | | 2,985 | | | | 3,890 | |
| Other Taxes | | | 2,847 | | | | 2,571 | | | | 1,907 | |
| Telephone Expense | | | 2,202 | | | | 2,466 | | | | 1,699 | |
| Professional and Legal Fees | | | 4,507 | | | | 5,288 | | | | 6,856 | |
| Data Processing Licensing Fee | | | 2,083 | | | | 1,505 | | | | 5,631 | |
| Losses on Sales and Write-downs of Other Real Estate Owned, net | | | 4,732 | | | | 8,201 | | | | 9,909 | |
| Loss on Sales and Write-downs of Bank Premises | | | 188 | | | | 186 | | | | 714 | |
| Debit Card Expense | | | 2,753 | | | | 2,785 | | | | 2,436 | |
| Tax Credit Amortization | | | 2,265 | | | | 4,060 | | | | - | |
| Tax Credit Impairment | | | - | | | | - | | | | 3,259 | |
| Other Real Estate Owned Expense | | | 474 | | | | 2,139 | | | | 791 | |
| Other | | | 10,044 | | | | 7,257 | | | | 4,996 | |
| Total Noninterest Expense | | | 98,029 | | | | 99,713 | | | | 94,579 | |
| Income (Loss) Before Taxes | | | 27,784 | | | | 14,308 | | | | (18,212 | ) |
| Income Tax Provision (Benefit) | | | 1,209 | | | | 2,403 | | | | (17,531 | ) |
| Net Income (Loss) | | $ | 26,575 | | | $ | 11,905 | | | $ | (681 | ) |
| Earnings (Loss) per Common Share | | | | | | | | | | | | |
| Basic Earnings (Loss) per Common Share | | $ | 1.01 | | | $ | 0.45 | | | $ | (0.03 | ) |
| Diluted Earnings (Loss) per Common Share | | $ | 1.01 | | | $ | 0.45 | | | $ | (0.03 | ) |
| Average Shares Outstanding-Basic | | | 26,323,899 | | | | 26,259,223 | | | | 26,257,761 | |
| Average Shares Outstanding-Diluted | | | 26,339,085 | | | | 26,259,234 | | | | 26,257,761 | |
See accompanying notes to audited consolidated financial statements.
CARTER BANK & TRUST
ITEM 8. FINANCIAL STATEMENTS AND SUPPLEMENTARY DATA (continued)
CONSOLIDATED STATEMENTS OF COMPREHENSIVE INCOME (LOSS)
| | | Years Ended December 31, | |
| (Dollars in Thousands) | | 2019 | | | 2018 | | | 2017 | |
| Net Income (Loss) | | $ | 26,575 | | | $ | 11,905 | | | $ | (681 | ) |
| Other Comprehensive Income (Loss): | | | | | | | | | | | | |
| Net Unrealized Gains (Losses) on Securities Available-for-Sale: | | | | | | | | | | | | |
| Net Unrealized Gains (Losses) Arising during the Period | | | 15,108 | | | | (8,636 | ) | | | (7,249 | ) |
| Transfer of Held-to-Maturity Securities to Available-for-Sale Securities | | | - | | | | - | | | | 5,600 | |
| Reclassification Adjustment for Gains included in Net Income (Loss) | | | (2,205 | ) | | | (1,271 | ) | | | (1,186 | ) |
| Net Unrealized Gains (Losses) Recognized in Other Comprehensive Income (Loss) | | | 12,903 | | | | (9,907 | ) | | | (2,835 | ) |
| Tax Effect | | | (2,710 | ) | | | 2,081 | | | | 992 | |
| Other Comprehensive Income (Loss): | | | 10,193 | | | | (7 ,826) | | | | (1,843 | ) |
| Comprehensive Income (Loss) | | $ | 36,768 | | | $ | 4,079 | | | $ | (2,524 | ) |
See accompanying notes to audited consolidated financial statements.
CARTER BANK & TRUST
ITEM 8. FINANCIAL STATEMENTS AND SUPPLEMENTARY DATA (continued)
CONSOLIDATED STATEMENTS OF CHANGES IN SHAREHOLDERS’ EQUITY
| | | Years Ended December 31, | |
| (Dollars in Thousands) | | Common
Stock | | | Additional
Paid-in-
Capital | | | Retained
Earnings | | | Accumulated
Other
Comprehensive
Income (Loss) | | | Total
Shareholder's
Equity | |
| Balance December 31, 2016 | | $ | 26,258 | | | $ | 142,178 | | | $ | 266,214 | | | $ | - | | | $ | 434,650 | |
| Net Loss | | | - | | | | - | | | | (681 | ) | | | - | | | | (681 | ) |
| Other Comprehensive Loss | | | - | | | | - | | | | - | | | | (1,843 | ) | | | 1,843 | ) |
| Reclassification of Certain Tax Effects from Change in Tax Rate | | | - | | | | - | | | | 397 | | | | (397 | ) | | | - | |
| Balance December 31, 2017 | | $ | 26,258 | | | $ | 142,178 | | | $ | 265,930 | | | $ | (2,240 | ) | | $ | 432,126 | |
| Net Income | | | - | | | | - | | | | 11,905 | | | | - | | | | 11,905 | |
| Other Comprehensive Loss | | | - | | | | - | | | | - | | | | (7,826 | ) | | | (7,826 | ) |
| Issuance of Restricted Stock (12,413 shares) | | | 12 | | | | (12 | ) | | | - | | | | - | | | | - | |
| Recognition of Restricted Stock Compensation Expense | | | - | | | | 9 | | | | - | | | | - | | | | 9 | |
| Balance December 31, 2018 | | $ | 26,270 | | | $ | 142,175 | | | $ | 277,835 | | | $ | (10,066 | ) | | $ | 436,214 | |
| Cumulative Effect of Adopting New Lease Standard | | | | | | | | | | | (252 | ) | | | | | | | (252 | ) |
| Balance December 31, 2018 adjusted for Cumulative Effect | | $ | 26,270 | | | $ | 142,175 | | | $ | 277,583 | | | $ | (10,066 | ) | | $ | 435,962 | |
| Net Income | | | - | | | | - | | | | 26,575 | | | | - | | | | 26,575 | |
| Other Comprehensive Income | | | - | | | | - | | | | - | | | | 10,193 | | | | 10,193 | |
| Issuance of Restricted Stock (64,458 shares) | | | 64 | | | | (64 | ) | | | - | | | | - | | | | - | |
| Recognition of Restricted Stock Compensation Expense | | | - | | | | 381 | | | | - | | | | - | | | | 381 | |
| Balance December 31, 2019 | | $ | 26,334 | | | $ | 142,492 | | | $ | 304,158 | | | $ | 127 | | | $ | 473,111 | |
See accompanying notes to audited consolidated financial statements.
CARTER BANK & TRUST
ITEM 8. FINANCIAL STATEMENTS AND SUPPLEMENTARY DATA (continued)
CONSOLIDATED STATEMENTS OF CASH FLOWS
| | | Years Ended December 31, | |
| (Dollars in Thousands) | | 2019 | | | 2018 | | | 2017 | |
| OPERATING ACTIVITIES | | | | | | | | | | | | |
| Net Income (Loss) | | $ | 26,575 | | | $ | 11,905 | | | $ | (681 | ) |
| Adjustments to Reconcile Net Income (Loss) to Net Cash Provided by Operating Activities | | | | | | | | | | | | |
| Provision for Loan Losses | | | 3,404 | | | | 16,870 | | | | 43,197 | |
| Origination of Loans Held-for-Sale | | | (329,932 | ) | | | (29,307 | ) | | | (45,900 | ) |
| Proceeds From Loans Held-for-Sale | | | 312,777 | | | | 27,265 | | | | 45,383 | |
| Depreciation/Amortization of Bank Premises and Equipment | | | 5,335 | | | | 3,682 | | | | 3,150 | |
| (Benefit) Provision for Deferred Taxes | | | (76 | ) | | | 4,850 | | | | (10,371 | ) |
| Net Amortization of Securities | | | 3,953 | | | | 4,704 | | | | 1,332 | |
| Tax Credit Impairment | | | - | | | | - | | | | 3,259 | |
| Tax Credit Amortization | | | 2,265 | | | | 4,060 | | | | - | |
| Gains on Sales of Securities, net | | | (2,205 | ) | | | (1,271 | ) | | | (1,186 | ) |
| Write-downs of Other Real Estate Owned | | | 4,457 | | | | 8,714 | | | | 9,967 | |
| Losses (Gains) on Sales of Other Real Estate Owned, Net | | | 275 | | | | (513 | ) | | | (58 | ) |
| Losses on Sales and Write-downs of Bank Premises | | | 188 | | | | 186 | | | | 714 | |
| Increase in the Value of Life Insurance Contracts | | | (1,436 | ) | | | (1,161 | ) | | | - | |
| Stock Compensation Expense | | | 381 | | | | 9 | | | | - | |
| Decrease (Increase) in Other Assets | | | 10,094 | | | | (2,244 | ) | | | (8,053 | ) |
| Increase in Other Liabilities | | | 2,231 | | | | 1,653 | | | | 3,511 | |
| Net Cash Provided By Operating Activities | | | 38,286 | | | | 49,402 | | | | 44,264 | |
| INVESTING ACTIVITIES | | | | | | | | | | | | |
| Securities Held-to-Maturity: | | | | | | | | | | | | |
| Proceeds from Maturities and Redemptions | | | - | | | | - | | | | 57,330 | |
| Purchases | | | - | | | | - | | | | (41,436 | ) |
| Securities Available-for-Sale: | | | | | | | | | | | | |
| Proceeds from Sales | | | 390,548 | | | | 133,120 | | | | 123,920 | |
| Proceeds from Maturities, Redemptions, and Pay-downs | | | 198,154 | | | | 219,223 | | | | 183,197 | |
| Purchases | | | (534,136 | ) | | | (201,240 | ) | | | (393,499 | ) |
| Purchase of Bank Premises and Equipment, Net | | | (8,453 | ) | | | (14,613 | ) | | | (3,540 | ) |
| Proceeds from Sales of Bank Premises and Equipment, net | | | 1,135 | | | | - | | | | - | |
| Purchase of Federal Home Loan Bank Stock | | | (4,113 | ) | | | - | | | | - | |
| Loan Originations and Payments, net | | | (185,117 | ) | | | (59,655 | ) | | | (5,606 | ) |
| Purchases of Bank Owned Life Insurance | | | - | | | | (50,000 | ) | | | - | |
| Other Real Estate Owned Improvements | | | - | | | | (1,272 | ) | | | (372 | ) |
| Proceeds from Sales of Other Real Estate Owned | | | 12,621 | | | | 28,679 | | | | 3,802 | |
| Net Cash (Used In) Provided By Investing Activities | | | (129,361 | ) | | | 54,242 | | | | (76,204 | ) |
| FINANCING ACTIVITIES | | | | | | | | | | | | |
| Net Change in Demand, Money Markets and Savings Accounts | | | 50,459 | | | | (121,986 | ) | | | (66,225 | ) |
| (Decrease) Increase in Certificates of Deposits | | | (137,395 | ) | | | 43,552 | | | | (327,999 | ) |
| Proceeds from Federal Home Loan Bank Borrowings | | | 10,000 | | | | - | | | | - | |
| Net Cash Used In Financing Activities | | | (76,936 | ) | | | (78,434 | ) | | | (394,224 | ) |
| Net (Decrease) Increase in Cash and Cash Equivalents | | | (168,011 | ) | | | 25,210 | | | | (426,164 | ) |
| Cash and Cash Equivalents at Beginning of Period | | | 293,823 | | | | 268,613 | | | | 694,777 | |
| Cash and Cash Equivalents at End of Period | | $ | 125,812 | | | $ | 293,823 | | | $ | 268,613 | |
See accompanying notes to audited consolidated financial statements.
CARTER BANK & TRUST
ITEM 8. FINANCIAL STATEMENTS AND SUPPLEMENTARY DATA (continued)
CONSOLIDATED STATEMENTS OF CASH FLOWS - (continued)
| | | Years Ended December 31, | |
| (Dollars in Thousands) | | 2019 | | | 2018 | | | 2017 | |
| SUPPLEMENTARY DATA | | | | | | | | | | | | |
| Cash Interest Paid | | $ | 46,170 | | | $ | 37,918 | | | $ | 37,824 | |
| Cash Paid for Income Taxes | | | 220 | | | | 175 | | | | 1,675 | |
| Transfer from Loans to Other Real Estate Owned | | | 302 | | | | 28,212 | | | | 17,912 | |
| Loans Provided for Sales of Other Real Estate Owned | | | - | | | | 893 | | | | 7,347 | |
| Transfer from Fixed Assets to Other Real Estate Owned | | | 1,694 | | | | 2,177 | | | | 19,009 | |
| Security (Purchases) Sales Settled in Subsequent Period | | | (3,270 | ) | | | - | | | | - | |
| Right-of-use Asset Recorded in Exchange for Lease Liabilities | | | 1,659 | | | | - | | | | - | |
See accompanying notes to audited consolidated financial statements.
CARTER BANK & TRUST
NOTES TO CONSOLIDATED FINANCIAL STATEMENTS
(Dollars in Thousands in Charts Except for Per Share Data)
NOTE 1 – SUMMARY OF SIGNIFICANT ACCOUNTING POLICIES
Nature of Operations: Carter Bank & Trust (the “Bank”) is a banking institution, incorporated under Virginia law, with headquarters located in Martinsville, Virginia. The Bank is a non-member state bank, regulated by the FDIC and State Bureau of Financial Institutions. The Bank has one wholly owned subsidiary, CB&T Investment Company, which was chartered effective April 1, 2019. Formerly, Carter Bank & Trust owned Mortgage Company of Virginia who owned 100% of Bank Services of Virginia and Bank Services Insurance, Inc. Mortgage Company of Virginia was terminated and dissolved on December 11, 2018. Bank Services of Virginia was terminated and dissolved on July 10, 2018. Bank Services Insurance, Inc. was sold in January of 2018.
Accounting Policies: Our financial statements have been prepared in accordance with U.S. Generally Accepted Accounting Principles (“GAAP”). In preparing the financial statements, management is required to make estimates and assumptions that affect the reported amounts of assets and liabilities and disclosures of contingent assets and liabilities as of the dates of the balance sheets and revenues and expenses for the periods then ended. Actual results could differ from those estimates. Our significant accounting policies are described below.
Principles of Consolidation: The Consolidated Financial Statements include the accounts of Carter Bank & Trust and its wholly owned subsidiary. All significant intercompany transactions have been eliminated in consolidation.
Reclassification: Amounts in prior years' period financial statements and footnotes are reclassified whenever necessary to conform to the current year’s presentation. Reclassifications had no material effect on prior year net income or shareholders’ equity.
Use of Estimates: To prepare financial statements in conformity with GAAP, management makes estimates and assumptions based on available information. These estimates and assumptions affect the amounts reported in the consolidated financial statements and the disclosures provided, and actual results could differ. Information available which could affect these judgments include, but are not limited to, changes in interest rates, changes in the performance of the economy, including COVID-19-related changes, and changes in the financial condition of borrowers.
The Bank could experience a material adverse effect on its business as a result of the impact of the COVID-19 pandemic, and the resulting governmental actions to curtail its spread. It is at least reasonably possible that information which was available at the date of the financial statements will change in the near term due to the COVID-19 pandemic and that the effect of the change would be material to the financial statements. The extent to which the COVID-19 pandemic will impact our estimates and assumptions is highly uncertain and we are unable to make an estimate, at this time.
Operating Segments: While the chief decision-makers monitor the revenue streams of the various products and services, operations are managed and financial performance is evaluated on a Bank-wide basis, and operating segments are aggregated into one as operating results for all segments are similar. Accordingly, all of the financial service operations are considered by management to be aggregated in one reportable operating segment.
CARTER BANK & TRUST
NOTES TO CONSOLIDATED FINANCIAL STATEMENTS (continued)
Cash and Cash Equivalents: The Bank considers all cash on hand, amounts due from banks, federal funds sold, and Federal Reserve Bank (“FRB”) excess reserves as cash equivalents for the purposes of the consolidated statements of cash flows with all items having maturities fewer than 90 days. Federal funds are customarily sold for one-day periods. The FRB pays the target fed funds rate on the FRB excess reserves.
Restrictions on Cash: Cash on hand or on deposit with the FRB is required to meet regulatory reserve and clearing requirements.
Loan Commitments and Related Financial Instruments: Financial instruments include off-balance sheet credit instruments, such as commitments to make loans and commercial letters of credit, issued to meet customer financing needs. The face amount for these items represents the exposure to loss, before considering customer collateral or ability to repay. Such financial instruments are recorded when they are funded.
Comprehensive Income (Loss): Comprehensive income (loss) consists of net income (loss) and other comprehensive income (loss). Other comprehensive income (loss) includes unrealized gains and losses on securities available-for-sale, net of tax.
Securities: The Bank classifies securities into either the held-to-maturity or available-for-sale categories at the time of purchase. All securities are classified as available-for-sale at December 31, 2019 and December 31, 2018. During 2017, management transferred all investment securities previously classified as held-to-maturity to available-for-sale. See further information on this transfer within Note 4. Held-to-maturity securities are those which the Bank has the positive intent and ability to hold until maturity and are reported at amortized cost. Securities classified as available-for-sale include securities, which can be sold for liquidity, investment management, or similar reasons even if there is not a present intention of such a sale. Available-for-sale securities are reported at fair value, with unrealized gains or losses included in other comprehensive income (loss), net of tax.
Premium amortization is deducted from, and discount accretion is added to, interest income on securities using the level yield method without anticipating prepayments, except for mortgage-backed securities where prepayments are anticipated. Gains and losses are recognized upon the sale of specific identified securities on the completed trade date.
Other-Than-Temporary Impairments of Securities: Management evaluates debt securities for other-than-temporary impairment (“OTTI”) on at least a quarterly basis, and more frequently when economic or market conditions warrant such an evaluation. In determining OTTI, management considers many factors, including: (1) the length of time and the extent to which the fair value has been less than cost, (2) the financial condition and near-term prospects of the issuer, (3) whether the market decline was affected by macroeconomic conditions, and (4) whether the Bank has the intent to sell the debt security or more likely than not will be required to sell the debt security before its anticipated recovery. The assessment of whether an OTTI decline exists involves a high degree of subjectivity and judgment and is based on the information available to management at a point in time.
When an OTTI occurs, the amount of the OTTI recognized in earnings depends on whether an entity intends to sell the security or it is more likely than not it will be required to sell the security before recovery of its amortized cost basis, less any current-period credit loss. If an entity intends to sell or it is more likely than not it will be required to sell the security before recovery of its amortized cost basis, less any current-period credit loss, the OTTI shall be recognized in earnings equal to the entire difference between the investment’s amortized cost basis and its fair value at the balance sheet date. If an entity does not intend to sell the security and it is not more likely than not that the entity will be required to sell the security before recovery of its amortized cost basis less any current-period loss, the OTTI shall be separated into the amount representing the credit loss and the amount related to all other factors. The amount of the total OTTI related to the credit loss is determined based upon the difference of the present value of cash flows expected be collected and the amortized cost basis and is recognized in earnings. The amount of the total OTTI related to other factors is recognized in other comprehensive income, net of applicable taxes. The previous amortized cost basis less the OTTI recognized in earnings becomes the new amortized cost basis of the investment.
CARTER BANK & TRUST
NOTES TO CONSOLIDATED FINANCIAL STATEMENTS (continued)
Loans Held-for-Sale: From time to time, the Bank has loans held-for-sale from two sources. First, the Bank purchases mortgage loans from another financial institution with fully executed contracts with investors. Secondly, the Bank originates and closes mortgages with fully executed contracts with investors to purchase shortly after closing. The Bank then holds the loans from both sources until funded by the investor, typically a two-week period. Gains and losses on sales of loans held-for-sale are determined using the specific identification method and are included in other noninterest income in the Consolidated Statements of Net Income (Loss).
Loans and Allowance for Loan Losses: Loans that management have the intent and ability to hold for the foreseeable future or until maturity or payoff are reported at the principal balance outstanding, net of deferred loan fees and costs, discounts, and an allowance for loan losses. Interest income is accrued on the unpaid principal balance. Loan origination fees, net of certain direct origination costs, are deferred and recognized in interest income using the level-yield method without anticipating prepayments.
A loan is considered impaired when it is probable that the Bank will be unable to collect all principal and interest amounts when due according to the contractual terms of the loan agreement. A performing loan may be considered impaired. The allowance for loan losses related to loans identified as impaired is primarily based on the excess of the loan's current outstanding principal balance compared to the estimated fair value of the related collateral, less cost to sell. For a loan that is not collateral-dependent, the allowance is recorded at the amount by which the outstanding principal balance exceeds the current estimate of the future cash flows on the loan discounted at the loan's original effective interest rate.
Loans, including impaired loans, are generally classified as nonaccrual if they are past due as to maturity or payment of principal or interest for a period of more than 90 days based on contractual terms, unless such loans are well-secured and in the process of collection. If a loan or a portion of a loan is classified as doubtful or is partially charged off, the loan is generally classified as nonaccrual. Loans that are on a current payment status or past due less than 90 days may also be classified as nonaccrual, if repayment in full of principal and/or interest is unlikely. All interest accrued but not received for loans placed on non-accrual status is reversed against interest income.
While a loan is classified as nonaccrual and the probability of collecting the recorded loan balance is doubtful, collections of interest and principal are generally applied as a reduction to principal outstanding. Payments collected on a nonaccrual loan are first applied to principal, secondly to any existing charge-offs, thirdly to interest, and lastly to any outstanding fees owed to the Bank.
Loans may be returned to accrual status when all principal and interest amounts contractually due (including arrearages) are reasonably assured of repayment within an acceptable period of time, and there is a sustained period of repayment performance by the borrower in accordance with the contractual terms of interest and principal.
CARTER BANK & TRUST
NOTES TO CONSOLIDATED FINANCIAL STATEMENTS (continued)
The allowance for loan losses is a valuation allowance for probable incurred losses inherent in the loan portfolio as determined by management taking into consideration historical loan loss experience, diversification of the loan portfolio, amounts of secured and unsecured loans, banking industry standards and averages, and general economic conditions. Loan losses are charged against the allowance when management believes the un-collectability of a loan balance is confirmed. Subsequent recoveries, if any, are credited to the allowance. Ultimate losses may vary from current estimates. These estimates are reviewed periodically and as adjustments become necessary, they are reported in earnings in the periods in which they become reasonably estimable.
During the quarterly evaluation of the allowance for loan losses, particular characteristics associated with a segment of the loan portfolio are also considered. These characteristics are detailed below:
| · | Commercial loans not secured by real estate carry risks associated with the successful operation of a business, and the repayments of these loans depend on the profitability and cash flows of the business. Additional risk relates to the value of collateral upon which depreciation occurs and the valuation is less precise. |
| · | Loans secured by commercial real estate also carry risks associated with the success of the business and the ability to generate a positive cash flow sufficient to service debts. Real estate security diminishes risks only to the extent that a market exists for the subject collateral. |
| · | Residential real estate loans carry risks associated with the continued credit-worthiness of the borrower and changes in the value of the collateral. In instances where construction is in process, these loans carry risks that a project will not be completed as scheduled and budgeted and that the value of the collateral may, at any point be less than the principal amount of the loan. Additional risks may occur if the general contractor, who may not be a loan customer, is unable to finish the project as planned due to financial pressures unrelated to the project. |
| · | Consumer loans carry risks associated with the continued credit-worthiness of the borrower and the value of the collateral, such as automobiles, which may depreciate more rapidly than other assets. In addition, these loans may be unsecured. Consumer loans are more likely than real estate loans to be immediately affected in an adverse manner by job loss, divorce, illness, or personal bankruptcy. Consumer loans are further segmented into automobile and recreational vehicle loans and other consumer loans. |
| · | Loans to tax-exempt state and political subdivisions carry risks associated with changes in budget constraints or revenue bases of the particular municipality or entity. These loans are dependent on the cash flow from the tax-exempt entity and often times have collateral upon which depreciation occurs and valuation is less than precise. |
The allowance consists of specific and general components. The specific component relates to loans that are individually classified as impaired. Factors considered by management in determining impairment include payment status, collateral value, and the probability of collecting scheduled principal and interest payments when due. Loans over $1.0 million are individually evaluated for impairment. If a loan is impaired, a portion of the allowance is allocated so that the loan is reported, net, at the present value of estimated future cash flows using the loan’s existing rate or at the fair value of collateral if repayment is expected solely from the collateral.
CARTER BANK & TRUST
NOTES TO CONSOLIDATED FINANCIAL STATEMENTS (continued)
The general component covers loans that are collectively evaluated for impairment. Large groups of homogeneous loans are collectively evaluated for impairment, and accordingly, they are not included in the separately identified impairment disclosures. The general allowance component also includes loans that are not individually identified for impairment evaluation, such as those loans that fall below the individual evaluation threshold. The general component is based on historical loss experience adjusted for current factors. These factors may include consideration for the following: levels of delinquency and delinquency trends; migration of loans to the classification of special mention, substandard or doubtful; trends in volume and terms of loans; effects of changes in underwriting standards; changes in lending policies, procedures, and practices; national and local economic trends and conditions; industry conditions, and effects of credit concentrations.
Our charge-off policy for loans requires that loans and other obligations that are not collectible be promptly charged-off when the loss becomes probable, regardless of the delinquency status of the loan. The Bank may elect to recognize a partial charge-off when management has determined that the value of collateral is less than the remaining investment in the loan. A loan or obligation does not need to be charged-off, regardless of delinquency status, if (i) management has determined there exists sufficient collateral to protect the remaining loan balance and (ii) there exists a strategy to liquidate the collateral. Management may also consider a number of other factors to determine when a charge-off is appropriate. These factors may include, but are not limited to:
• The status of a bankruptcy proceeding
• The value of collateral and probability of successful liquidation; and/or
• The status of adverse proceedings or litigation that may result in collection
Consumer unsecured loans and secured loans are evaluated for charge-off after the loan becomes 90 days past due. Unsecured loans are fully charged-off and secured loans are charged-off to the estimated fair value of the collateral less the cost to sell.
Closed-end installment loans, amortizing loans secured by real estate and any other loans with payments scheduled monthly are reported past due when the borrower is in arrears two or more monthly payments. Other multi-payment obligations with payments scheduled other than monthly are reported past due when one scheduled payment is due and unpaid for 30 days or more. We monitor delinquency on a monthly basis, including early stage delinquencies of 30 to 89 days past due for early identification of potential problem loans.
Troubled Debt Restructurings: In situations where, for economic or legal reasons related to a borrower's financial condition, management may grant a concession to the borrower that it would not otherwise consider, the related loan is classified as a troubled debt restructuring (“TDR”). Management strives to identify borrowers in financial difficulty early and work with them to modify their loan to more affordable terms before their loan reaches nonaccrual status. These modified terms have historically included interest only periods, extended amortization periods beyond what management would typically offer for a similar loan or a below market interest rate when compared to management's underwriting standards for a similar loan type. These concessions are intended to minimize the economic loss and to avoid foreclosure or repossession of the collateral. In cases where borrowers are granted new terms that provide for a reduction of interest, management measures any impairment on the restructuring as noted above for impaired loans.
CARTER BANK & TRUST
NOTES TO CONSOLIDATED FINANCIAL STATEMENTS (continued)
Concentration of Credit Risk: The majority of the Bank's loans, commitments and lines of credit have been granted to customers in the Bank's market area. The concentrations of credit by loan classification are set forth in Note 5.
Advertising Costs: We expense all marketing-related costs, including advertising costs, as incurred. Advertising expense was $1.4 million, $876 thousand, and $191 thousand for the years ended 2019, 2018, and 2017, respectively.
Bank Owned Life Insurance: The Bank has purchased life insurance policies on certain executive officers and employees. We receive the cash surrender value of each policy upon its termination or benefits are payable to us upon the death of the insured. Changes in net cash surrender value are recognized in noninterest income in the Consolidated Statements of Income (Loss).
Bank Premises and Equipment: Bank premises and equipment acquired are stated at cost, less accumulated depreciation. Depreciation is charged to operating expenses over the estimated useful life of the assets by the straight-line method. Land is carried at cost. Costs of maintenance or repairs are charged to expense as incurred and improvements are capitalized. Upon retirement or disposal of an asset, the asset and related allowance account are eliminated. Any gain or loss on such transactions is included in current operations. Depreciation has been included under occupancy expense in the Consolidated Statements of Income (Loss) totaling $5.3 million in 2019, $3.7 million in 2018, and $3.2 million in 2017. The estimated useful life for bank premises ranges from 5 to 40 years and equipment depreciates over a 3 to 10 year period.
Federal Home Loan Bank Stock (“FHLB”): The Bank is a member of the FHLB system. Members are required to own a certain amount of stock based on the level of borrowings and other factors such as asset base. FHLB stock is carried at cost, classified as a restricted security, and periodically evaluated for impairment based on ultimate recovery of par value. Cash dividends are reported as dividend income on the Consolidated Statements of Income (Loss).
Earnings per Share: Basic earnings per share represent income available to common shareholders divided by the weighted-average number of common shares outstanding during the period. Diluted earnings per share reflect additional common shares that would have been outstanding if dilutive common shares had been issued, as well as any adjustment to income resulting from the assumed issuance. Non-vested shares of restricted stock are included in the computation of basic and diluted earnings per share because the holder has voting rights and shares in non-forfeitable dividends during the vesting period.
Other Real Estate Owned (“OREO”): Real estate properties acquired through or in lieu of loan foreclosure are initially recorded at fair value less estimated selling cost at the date of foreclosure, which establishes a new cost basis. Any write-downs based on the asset's fair value at the date of acquisition are charged to the allowance for loan losses. After foreclosure, these assets are carried at the lower of their new cost basis or fair value less cost to sell. In addition, any retail branch locations closed for branch operations and marketed for sale are also moved to OREO from bank premises and equipment. This real estate is initially valued based on recent comparative market values received from a real estate broker and any necessary write-downs are charged to operations. Costs of significant property improvements are capitalized, whereas costs relating to holding property are expensed. Valuations are periodically performed by management, and any write-downs are recorded as a charge to operations, if necessary, to reduce the carrying value of a property to the lower of its carrying value or fair value less cost to sell. OREO assets are revalued every twelve months, or more frequently when deemed necessary by management based upon changes in market or collateral conditions. For smaller OREO assets with existing carrying values less than $0.5 million, management may elect to re-value the assets, at minimum, once every twenty-four months based on the size of the exposure. Operating costs after acquisition are expensed.
CARTER BANK & TRUST
NOTES TO CONSOLIDATED FINANCIAL STATEMENTS (continued)
Income Taxes: Income tax expense is the total of the current year income tax due or refundable and the change in deferred tax assets and liabilities. Deferred taxes are provided on a liability method whereby deferred tax assets are recognized for deductible temporary differences, operating losses, and tax credit carryforwards. Deferred tax liabilities are recognized for taxable temporary differences. Temporary differences are the differences between the reported amounts of assets and liabilities and their tax bases. Deferred tax assets are reduced by a valuation allowance when, in the opinion of management, it is more likely than not that some portion or all of the deferred tax assets will not be realized. Deferred tax assets and liabilities are adjusted for the effects of changes in tax laws and rates on the date of enactment.
When tax returns are filed, it is highly certain that some positions taken would be sustained upon examination by the taxing authorities, while others are subject to uncertainty about the merits of the position taken or the amount of the position that would be ultimately sustained. The benefit of a tax position is recognized in the financial statements in the period during which, based on all available evidence, management believes it is more likely than not that the position will be sustained upon examination, including the resolution of appeals or litigation processes, if any. Tax positions taken are not offset or aggregated with other positions. Tax positions that meet the more-likely-than-not recognition threshold are measured as the largest amount of tax benefit that is more than 50 percent likely of being realized upon settlement with the applicable taxing authority. The portion of the benefits associated with tax positions taken that exceeds the amount measured as described above is reflected as a liability for unrecognized tax benefits in the accompanying consolidated balance sheets along with any associated interest and penalties that would be payable to the taxing authorities upon examination. Interest and penalties associated with unrecognized tax benefits are classified as additional income taxes in the Consolidated Statements of Income (Loss).
The Bank is a limited partner in several tax-advantaged limited partnerships whose purpose is to invest in approved new market and historic rehabilitation projects. These investments are included in other assets on the Consolidated Balance Sheets. These partnership investments may generate a return through the realization of federal income tax credits, as well as other tax benefits, such as tax deductions from net operating losses of the investments over a period of time. The investments are accounted for under the equity method, with the expense included within noninterest expense on the Consolidated Statements of Income (Loss). All of the Bank's tax credit investments are evaluated for impairment at the end of each reporting period.
Transfer of Financial Assets: Transfers of financial assets are accounted for as sales, when control over the assets has been surrendered. Control over transferred assets is deemed to be surrendered when (1) the assets have been isolated from the Bank, (2) the transferee obtains the right (free of conditions that constrain it from taking advantage of that right) to pledge or exchange the transferred assets, and (3) the Bank does not maintain effective control over the transferred assets through an agreement to repurchase them before their maturity, or the ability to unilaterally cause the transferee to return specific assets.
Retirement Benefits: The Bank has established an employee benefit plan as described in Note 14. The Bank does not provide any other post-retirement benefits.
CARTER BANK & TRUST
NOTES TO CONSOLIDATED FINANCIAL STATEMENTS (continued)
Goodwill and Intangible Assets: Goodwill resulting from business combinations prior to January 1, 2009 represents the excess of the purchase price over the fair value of the net assets of businesses acquired. Goodwill resulting from business combinations after January 1, 2009, is generally determined as the excess of the fair value of the net assets acquired and liabilities assumed as of the acquisition date. Goodwill and intangible assets acquired in a purchase business combination and determined to have an indefinite useful life are not amortized, but tested for impairment at least annually or more frequently if events and circumstances exist that indicate that a goodwill impairment test should be performed. The Bank has outsourced its annual impairment testing to an independent third party and has selected October 1st as the impairment testing date. Intangible assets with definite useful lives are amortized over their estimated useful lives to their estimated residual values. Goodwill is the only intangible asset with an indefinite life on our consolidated balance sheet.
Fair Value of Financial Instruments: Fair values of financial instruments are estimated using relevant market information and other assumptions, as more fully disclosed in Note 7. Fair value estimates involve uncertainties and matters of significant judgment regarding interest rates, credit risk, prepayments, and other factors, especially in the absence of broad markets for particular items. Changes in assumptions or in market conditions could significantly affect the estimates.
Derivative Instruments and Hedging Activities: The Bank uses derivative instruments such as interest rate swaps for commercial loans with our customers. Upon entering into swaps with the borrower, The Bank entered into offsetting positions with counterparties to minimize risk to the Bank. The back-to-back swaps qualify as derivatives, but are not designated as hedging instruments. Interest rate swap contracts involve the risk of dealing with borrower and counterparties and their ability to meet contractual terms. When the fair value of a derivative instrument contract is positive, this generally indicates that the counterparty or customer owes the Bank, and results in credit risk to the Bank. When the fair value of a derivative instrument contract is negative, the Bank owes the customer or counterparty, and, therefore, has no risk.
The Bank also enters into commitments to originate mortgage loans whereby the interest rate on the loan is determined prior to funding (rate lock commitments). Rate lock commitments on mortgage loans to be held for sale are considered to be derivatives. The period of time between issuance of a loan commitment and closing and sale of the loan generally ranges from 15 to 90 days. The Bank protects itself from changes in interest rates through the use of best efforts forward delivery commitments, whereby the Bank commits to sell a loan at the time the borrower commits to an interest rate with the intent that the buyer has assumed interest rate risk on rate lock commitments dues to changes in interest rates.
Stock-Based Compensation: Compensation cost is recognized for restricted stock awards issued to employees and non-employee directors, based on the fair value of these awards at the date of the grant. The market price of the Bank’s common stock at the date of the grant is the fair value of the award.
Compensation cost is recognized over the required service period, generally defined as the vesting period. For awards with graded vesting, compensation cost is recognized on a straight-line basis over the requisite service period for the entire award. The Bank recognizes forfeitures as they occur.
CARTER BANK & TRUST
NOTES TO CONSOLIDATED FINANCIAL STATEMENTS (continued)
Loss Contingencies: Loss contingencies, including claims and legal actions arising in the ordinary course of business, are recorded as liabilities when the likelihood of loss is probable and an amount or range of loss can be reasonably estimated. Management does not believe there now are such matters that will have a material effect on the financial statements.
Newly Adopted Pronouncements: The Bank adopted ASU 2016-02, “Leases (Topic 842),” on January 1, 2019, the effective date of the guidance, using the practical expedient transition method whereby we did not revise comparative period information or disclosure. The Bank recorded a one-time cumulative effect adjustment to the retained earnings component of equity as of the implementation date. The new standard requires lessees to record assets and liabilities on the balance sheet for all leases with terms longer than 12 months. We also elected certain optional practical expedients including the hindsight practical expedient under which we considered the actual outcomes of lease renewals and terminations when measuring the lease term at adoption, and we made an accounting policy election to keep leases with an initial term of 12 months or less off of the balance sheet. We have lease agreements with lease and non-lease components, and we have elected the practical expedient to account for these as a single lease component.
We evaluate our contracts at inception to determine if an arrangement is or contains a lease. Right-of-use (“ROU”) assets are included in other assets and lease liabilities are included in other liabilities in our Consolidated Balance Sheets.
ROU assets represent our right to use an underlying asset for the lease term, and lease liabilities represent our obligation to make lease payments arising from the lease. Operating lease ROU assets and liabilities are recognized at commencement date based on the present value of lease payments over the lease term. The operating lease ROU asset also includes any initial direct costs and prepaid lease payments made less any lease incentives. Our lease terms may include options to extend or terminate the lease when it is reasonably certain that we will exercise that option.
Our operating leases relate primarily to bank branches and office space. In conjunction with the adoption on January 1, 2019, we recognized operating lease liabilities of $1.0 million and related lease assets of $0.7 million on our Consolidated Balance Sheet. The difference between the lease assets and lease liabilities primarily consists of deferred rent liabilities reclassified upon adoption to reduce the measurement of the lease assets. The standard did not materially impact our consolidated net income and had no impact on cash flows.
NOTE 2 – EARNINGS PER SHARE
Basic earnings per share is calculated by dividing net income available to common shareholders by the weighted average number of common shares outstanding during the period. Diluted earnings per share is calculated using the two-class method. Diluted earnings per share reflects the potential dilution that could occur if securities or other contracts to issue common stock were exercised or converted into common stock or resulted in the issuance of common stock that then shared in the earnings of the entity. For all periods presented, the dilutive effect on average shares outstanding is the result of unvested restricted stock grants.
CARTER BANK & TRUST
NOTES TO CONSOLIDATED FINANCIAL STATEMENTS (continued)
The following table reconciles the numerators and denominators of basic and diluted earnings per share calculations for the periods presented:
| | | Years ended December 31, | |
| (Dollars in Thousands, except share and per share data) | | 2019 | | | 2018 | | | 2017 | |
| Numerator for Earnings per Share- Basic: | | | | | | | | | | | | |
| Net Income (Loss) Allocated to Common Shareholders | | $ | 26,575 | | | $ | 11,905 | | | $ | (681 | ) |
| Numerator for Earnings per Share- Diluted: | | | | | | | | | | | | |
| Net Income (Loss) Allocated to Common Shareholders | | $ | 26,575 | | | $ | 11,905 | | | $ | (681 | ) |
| Denominators: | | | | | | | | | | | | |
| Weighted Average Shares Outstanding- Basic | | | 26,323,899 | | | | 26,259,223 | | | | 26,257,761 | |
| Add: Average Participating Shares Outstanding | | | 15,186 | | | | 11 | | | | - | |
| Denominator for Two-Class Method-Diluted | | | 26,339,085 | | | | 26,259,234 | | | | 26,257,761 | |
| Earnings (Loss) per Common Share-Basic | | $ | 1.01 | | | $ | 0.45 | | | $ | (0.03 | ) |
| Earnings (Loss) per Common Share-Diluted | | $ | 1.01 | | | $ | 0.45 | | | $ | (0.03 | ) |
There were two shares not included in the average participating shares outstanding because they would be considered to be anti-dilutive for the year ended December 31, 2019. There were no weighted average shares considered anti-dilutive in the calculations for the years ended December 31, 2018 or 2017.
NOTE 3 - RESTRICTIONS ON CASH AND DUE FROM BANK ACCOUNTS
The Board of Governors of the FRB System imposes certain reserve requirements on all depository institutions. These reserves are maintained in the form of vault cash or as an interest-bearing balance with the FRB. The required reserves averaged $44.3 million for 2019, $42.4 million for 2018, and $40.4 million for 2017.
NOTE 4 - INVESTMENT SECURITIES
The following tables present the amortized cost and fair value of available-for-sale securities as of the dates presented:
| | | December 31, 2019 | |
| (Dollars in Thousands) | | Amortized Cost | | | Gross
Unrealized
Gains | | | Gross
Unrealized
Losses | | | Fair Value | |
| Residential Mortgage-Backed Securities | | $ | 51,600 | | | $ | 1,136 | | | $ | (92 | ) | | $ | 52,644 | |
| Commercial Mortgage-Backed Securities | | | 18,972 | | | | 147 | | | | (113 | ) | | | 19,006 | |
| Asset Backed Securities | | | 110,943 | | | | 285 | | | | (1,589 | ) | | | 109,639 | |
| Collateralized Mortgage Obligations | | | 291,139 | | | | 2,425 | | | | (1,340 | ) | | | 292,224 | |
| Small Business Administration | | | 106,485 | | | | 347 | | | | (1,096 | ) | | | 105,736 | |
| States and Political Subdivisions | | | 148,596 | | | | 1,669 | | | | (1,785 | ) | | | 148,480 | |
| Corporate Notes | | | 14,721 | | | | 167 | | | | - | | | | 14,888 | |
| Total Debt Securities | | $ | 742,456 | | | $ | 6,176 | | | $ | (6,015 | ) | | $ | 742,617 | |
CARTER BANK & TRUST
NOTES TO CONSOLIDATED FINANCIAL STATEMENTS (continued)
| | | December 31, 2018 | |
| (Dollars in Thousands) | | Amortized Cost | | | Gross
Unrealized
Gains | | | Gross
Unrealized
Losses | | | Fair Value | |
| U.S. Government Agency Securities | | $ | 274,998 | | | $ | - | | | $ | (4,610 | ) | | $ | 270,388 | |
| Residential Mortgage-Backed Securities | | | 72,295 | | | | 4 | | | | (1,428 | ) | | | 70,871 | |
| Commercial Mortgage-Backed Securities | | | 22,322 | | | | - | | | | (530 | ) | | | 21,792 | |
| Asset Backed Securities | | | 59,368 | | | | 62 | | | | (569 | ) | | | 58,861 | |
| Collateralized Mortgage Obligations | | | 78,107 | | | | 10 | | | | (1,298 | ) | | | 76,819 | |
| Small Business Administration | | | 90,673 | | | | 50 | | | | (1,485 | ) | | | 89,238 | |
| States and Political Subdivisions | | | 170,229 | | | | 329 | | | | (3,084 | ) | | | 167,474 | |
| Corporate Notes | | | 27,508 | | | | - | | | | (193 | ) | | | 27,315 | |
| Total Debt Securities | | $ | 795,500 | | | $ | 455 | | | $ | (13,197 | ) | | $ | 782,758 | |
The Bank did not have securities classified as held-to-maturity at December 31, 2019 or December 31, 2018.
The following table shows the composition of gross and net realized gains and losses for the periods presented:
| | | Years ended December 31, | |
| (Dollars in Thousands) | | 2019 | | | 2018 | | | 2017 | |
| Gross Realized Gains | | $ | 4,172 | | | $ | 1,899 | | | $ | 1,253 | |
| Gross Realized Losses | | | (1,967 | ) | | | (628 | ) | | | (67 | ) |
| Net Realized Gains | | $ | 2,205 | | | $ | 1,271 | | | $ | 1,186 | |
| Tax Impact | | $ | 463 | | | $ | 267 | | | $ | 415 | |
Gains or losses are recognized in earnings on the trade date using the amortized cost of the specific security sold. The net realized gains above reflect reclassification adjustments in the calculation of other comprehensive income (loss). The net realized gains are included in noninterest income as gains on sales of securities, net in the Consolidated Statements of Income (Loss). The tax impact is included in income tax provision (benefit) in the Consolidated Statements of Income (Loss).
The amortized cost and fair value of available-for-sale debt securities are shown below by contractual maturity. Expected maturities may differ from contractual maturities if borrowers have the right to call or prepay obligations with or without call or prepayment penalties. Securities not due at a single maturity date are shown separately.
| (Dollars in Thousands) | | Amortized | | | Fair | |
| December 31, 2019 | | Cost | | | Value | |
| Due in One Year or Less | | $ | 6,805 | | | $ | 6,816 | |
| Due after One Year through Five Years | | | 13,195 | | | | 13,419 | |
| Due after Five Years through Ten Years | | | 82,610 | | | | 83,086 | |
| Due after Ten Years | | | 167,192 | | | | 165,783 | |
| Residential Mortgage-Backed Securities | | | 51,600 | | | | 52,644 | |
| Commercial Mortgage-Backed Securities | | | 18,972 | | | | 19,006 | |
| Collateralized Mortgage Obligations | | | 291,139 | | | | 292,224 | |
| Asset Backed Securities | | | 110,943 | | | | 109,639 | |
| Total Securities | | $ | 742,456 | | | $ | 742,617 | |
CARTER BANK & TRUST
NOTES TO CONSOLIDATED FINANCIAL STATEMENTS (continued)
| (Dollars in Thousands) | | Amortized | | | Fair | |
| December 31, 2018 | | Cost | | | Value | |
| Due in One Year or Less | | $ | 139,169 | | | $ | 138,056 | |
| Due after One Year through Five Years | | | 195,808 | | | | 191,962 | |
| Due after Five Years through Ten Years | | | 47,320 | | | | 46,846 | |
| Due after Ten Years | | | 181,111 | | | | 177,551 | |
| Residential Mortgage-Backed Securities | | | 72,295 | | | | 70,871 | |
| Commercial Mortgage-Backed Securities | | | 22,322 | | | | 21,792 | |
| Collateralized Mortgage Obligations | | | 78,107 | | | | 76,819 | |
| Asset Backed Securities | | | 59,368 | | | | 58,861 | |
| Total Securities | | $ | 795,500 | | | $ | 782,758 | |
At December 31, 2019 and December 31, 2018, there were no holdings of securities of any one issuer, other than those securities issued by or collateralized by the U.S. Government and its Agencies, in an amount greater than 10% of shareholders’ equity. The carrying value of securities pledged for various regulatory and legal requirements was $150.6 million at December 31, 2019 and $176.3 million at December 31, 2018.
CARTER BANK & TRUST
NOTES TO CONSOLIDATED FINANCIAL STATEMENTS (continued)
Available-for-sale securities with unrealized losses at December 31, 2019 and 2018, aggregated by investment category and length of time that individual securities have been in a continuous unrealized loss position, were as follows:
| | | December 31, 2019 | |
| | | Less Than 12 Months | | | 12 Months or More | | | Total | |
| (Dollars in Thousands) | | Number of
Securities | | | Fair Value | | | Unrealized
Losses | | | Number of
Securities | | | Fair Value | | | Unrealized
Losses | | | Number of
Securities | | | Fair Value | | | Unrealized
Losses | |
| Residential Mortgage-Backed Securities | | | 5 | | | $ | 9,972 | | | $ | 92 | | | | 1 | | | $ | 2 | | | $ | - | | | | 6 | | | $ | 9,974 | | | $ | 92 | |
| Commercial Mortgage-Backed Securities | | | 3 | | | | 7,713 | | | | 113 | | | | - | | | | - | | | | - | | | | 3 | | | | 7,713 | | | | 113 | |
| Asset Backed Securities | | | 22 | | | | 50,530 | | | | 549 | | | | 16 | | | | 39,153 | | | | 1,040 | | | | 38 | | | | 89,683 | | | | 1,589 | |
| Collateralized Mortgage Obligations | | | 37 | | | | 144,543 | | | | 1,051 | | | | 6 | | | | 18,107 | | | | 289 | | | | 43 | | | | 162,650 | | | | 1,340 | |
| Small Business Administration | | | 13 | | | | 25,380 | | | | 91 | | | | 69 | | | | 47,616 | | | | 1,005 | | | | 82 | | | | 72,996 | | | | 1,096 | |
| States and Political Subdivisions | | | 37 | | | | 70,678 | | | | 1,785 | | | | - | | | | - | | | | - | | | | 37 | | | | 70,678 | | | | 1,785 | |
| Total Debt Securities | | | 117 | | | $ | 308,816 | | | $ | 3,681 | | | | 92 | | | $ | 104,878 | | | $ | 2,334 | | | | 209 | | | $ | 413,694 | | | $ | 6,015 | |
| | | December 31, 2018 | |
| | | Less Than 12 Months | | | 12 Months or More | | | Total | |
| (Dollars in Thousands) | | Number of
Securities | | | Fair Value | | | Unrealized
Losses | | | Number of
Securities | | | Fair Value | | | Unrealized
Losses | | | Number of
Securities | | | Fair Value | | | Unrealized
Losses | |
| U.S. Government Agency Securities | | | - | | | $ | - | | | $ | - | | | | 12 | | | $ | 270,388 | | | $ | 4,610 | | | | 12 | | | $ | 270,388 | | | $ | 4,610 | |
| Residential Mortgage-Backed Securities | | | 1 | | | | 3,220 | | | | 71 | | | | 30 | | | | 62,112 | | | | 1,357 | | | | 31 | | | | 65,332 | | | | 1,428 | |
| Commercial Mortgage-Backed Securities | | | - | | | | - | | | | - | | | | 8 | | | | 21,792 | | | | 530 | | | | 8 | | | | 21,792 | | | | 530 | |
| Asset Backed Securities | | | 16 | | | | 40,812 | | | | 560 | | | | 1 | | | | 2,242 | | | | 9 | | | | 17 | | | | 43,054 | | | | 569 | |
| Collateralized Mortgage Obligations | | | 8 | | | | 20,073 | | | | 111 | | | | 21 | | | | 52,073 | | | | 1,187 | | | | 29 | | | | 72,146 | | | | 1,298 | |
| Small Business Administration | | | 25 | | | | 39,766 | | | | 291 | | | | 54 | | | | 41,830 | | | | 1,194 | | | | 79 | | | | 81,596 | | | | 1,485 | |
| States and Political Subdivisions | | | 4 | | | | 10,674 | | | | 129 | | | | 77 | | | | 130,371 | | | | 2,955 | | | | 81 | | | | 141,045 | | | | 3,084 | |
| Corporate Notes | | | 8 | | | | 20,368 | | | | 136 | | | | 1 | | | | 1,947 | | | | 57 | | | | 9 | | | | 22,315 | | | | 193 | |
| Total Debt Securities | | | 62 | | | $ | 134,913 | | | $ | 1,298 | | | | 204 | | | $ | 582,755 | | | $ | 11,899 | | | | 266 | | | $ | 717,668 | | | $ | 13,197 | |
CARTER BANK & TRUST
NOTES TO CONSOLIDATED FINANCIAL STATEMENTS (continued)
Securities are evaluated for other-than-temporary impairment (“OTTI”) quarterly and more frequently if economic or market concerns warrant. Consideration is given to the length of time and the extent to which the fair value has been less than cost, the financial condition and near-term prospects of the issuer, the credit quality of the issuer, and whether the Bank intends to sell the security or may be required to sell the security prior to maturity. The Bank has reviewed all securities for OTTI.
As of December 31 2019, no OTTI has been identified for any investment securities in the Bank’s portfolio. The Bank does not believe any individual unrealized loss as of December 31, 2019 represents other-than-temporary impairment, or OTTI. At December 31, 2019 there were 209 securities in an unrealized loss position and at December 31, 2018 there were 266 debt securities in an unrealized loss position. The unrealized losses on debt securities were primarily attributable to changes in interest rates and not related to the credit quality of these securities. All debt securities are determined to be investment grade and are paying principal and interest according to the contractual terms of the security. The Bank generally does not intend to sell and it is not more likely than not that the Bank will be required to sell any of the securities in an unrealized loss position before recovery of their amortized cost.
NOTE 5 – LOANS AND LOANS HELD-FOR-SALE
The composition of the loan portfolio by dollar amount is shown in the table below:
| | | December 31, | |
| (Dollars in Thousands) | | 2019 | | | 2018 | |
| Commercial | | | | | | | | |
| Commercial Real Estate | | $ | 1,365,310 | | | $ | 1,359,036 | |
| Commercial and Industrial | | | 621,667 | | | | 661,870 | |
| Commercial Construction | | | 292,827 | | | | 201,240 | |
| Total Commercial Loans | | | 2,279,804 | | | | 2,222,146 | |
| Consumer | | | | | | | | |
| Residential Mortgages | | | 514,538 | | | | 397,280 | |
| Other Consumer | | | 73,688 | | | | 73,058 | |
| Consumer Construction | | | 16,736 | | | | 11,308 | |
| Total Consumer Loans | | | 604,962 | | | | 481,646 | |
| Total Portfolio Loans | | $ | 2,884,766 | | | $ | 2,703,792 | |
We attempt to limit our exposure to credit risk by diversifying our loan portfolio by segment, geography, collateral and industry and actively managing concentrations. When concentrations exist in certain segments, we mitigate this risk by reviewing the relevant economic indicators and internal risk rating trends and through stress testing of the loans in these segments. The Bank has specific loan segment limits in its loan policy. Total commercial real estate balances should not exceed the combination of 300% of total risk based capital and growth in excess of 50% over the previous thirty-six months and construction loan balances should not exceed 100% of total risk based capital. Investment real estate property types and purchased loan programs have individual dollar limits that should not be exceeded in the portfolio. In addition, there are specific limits in place for various categories of real estate loans with regards to loan-to-value ratios, loan terms, and amortization periods.
CARTER BANK & TRUST
NOTES TO CONSOLIDATED FINANCIAL STATEMENTS (continued)
Unsecured loans pose higher risk for the Bank due to the lack of a well-defined secondary source of repayment. Unsecured loans are reserved for the best quality customers with well-established businesses, operate with low financial and operating leverage and demonstrate an ability to clear the outstanding balance on lines of credit for at least thirty consecutive days annually. The repayment capacity of the borrower should exceed the policy and guidelines for secured loans. If the borrower is unable to comply with this requirement and the Bank is willing to renew the credit facility, the line should be secured and/or begin amortization.
Total commercial loans represented 79% of total portfolio loans at December 31, 2019 and 82% of total portfolio loans at December 31, 2018. Within our commercial portfolio, the CRE and Commercial Construction portfolios combined comprised $1.7 billion or 73% of total commercial loans and 57% of total portfolio loans at December 31, 2019 and comprised $1.6 billion or 70% of total commercial loans and 58% of total portfolio loans at December 31, 2018. Net deferred costs included in the portfolio balances above were $5.1 million and $3.2 million at December 31, 2019 and 2018, respectively. Discounts on purchased 1-4 family loans included in the portfolio balances above were $250 thousand and zero at December 31, 2019 and 2018, respectively.
Loans held-for-sale were $19.7 million and $2.6 million as of December 31, 2019 and December 31, 2018, respectively.
Troubled Debt Restructurings
The following table summarizes the restructured loans as of the dates presented:
| | | December 31, 2019 | | | December 31, 2018 | |
| | | Performing | | | Nonperforming | | | Total | | | Performing | | | Nonperforming | | | Total | |
| (Dollars in Thousands) | | TDRs | | | TDRs | | | TDRs | | | TDRs | | | TDRs | | | TDRs | |
| Real Estate | | $ | 109,265 | | | $ | 34,315 | | | $ | 143,580 | | | $ | 114,806 | | | $ | 46,771 | | | $ | 161,577 | |
| Consumer | | | - | | | | - | | | | - | | | | - | | | | - | | | | - | |
| Commercial | | | - | | | | 390 | | | | 390 | | | | - | | | | - | | | | - | |
| Total TDRs | | $ | 109,265 | | | $ | 34,705 | | | $ | 143,970 | | | $ | 114,806 | | | $ | 46,771 | | | $ | 161,577 | |
In order to maximize the collection of loan balances, the Bank evaluates troubled loan accounts on a case-by-case basis to determine if a loan modification would be appropriate. Loan modifications may be utilized when there is a reasonable chance that an appropriate modification would allow our client to continue servicing the debt. A loan is a troubled debt restructuring (“TDR”) if both of the following exist: 1) the debtor is experiencing financial difficulties, and 2) a creditor has granted a concession to the debtor that it would not normally grant. Nonaccrual loans that are modified can be placed back on accrual status when both principal and interest are current and it is probable that the Bank will be able to collect all amounts due (both principal and interest) according to the terms of the loan agreement. There were minimal commitments to lend additional funds for loans identified as TDRs.
The Bank had one loan modified as a TDR during the twelve months ending December 31, 2019 totaling $0.6 million in post-modified recorded balances. The loan is classified as a TDR because there are concessions present that would not be offered to a comparable borrower. There were no TDR payment defaults during the year ended December 31, 2019 for TDRs with outstanding principal balances at year end 2019. For purposes of this disclosure, a TDR payment default occurs when, within 12 months of the original TDR modification, either a full or partial charge-off occurs or a TDR becomes 90 days or more past due.
CARTER BANK & TRUST
NOTES TO CONSOLIDATED FINANCIAL STATEMENTS (continued)
The Bank had seven loans modified as TDR’s for the twelve months ending December 31, 2018 totaling $137.9 million in post-modified recorded balances. One TDR involved modifying the terms of the note from contractual principal and interest payments to a single pay loan structure with interest and principal due at maturity. Five TDRs involved the installation of forbearance agreements for various concessions. The last TDR was related to one relationship that was reworked as a TDR in previous quarters. There were no TDR payment defaults during the year ended December 31, 2018 for TDRs with outstanding principal balances at year end 2018. For purposes of this disclosure, a TDR payment default occurs when, within 12 months of the original TDR modification, either a full or partial charge-off occurs or a TDR becomes 90 days or more past due.
At December 31, 2019 and December 31, 2018 the Bank had $34.7 million and $46.8 million in loans, respectively, modified as TDR’s in previous years which had experienced a payment default subsequent to the rework date and were classified as nonperforming. During the first quarter of 2018 the Bank foreclosed on $29.9 million in loans that were classified as nonperforming TDR’s at December 31, 2017.
The specific reserve portion of the allowance for loan losses on TDRs, if required, is determined by discounting the restructured cash flow at the original effective rate of the loan before modification or is based on the fair value of the collateral less cost to sell, if repayment of the loan is collateral dependent. If the resulting amount is less than the recorded book value, the Bank either establishes a valuation allowance as a component of the allowance for loan losses or charges off the impaired balance if it determines that such amount is a confirmed loss. This method is used consistently for all segments of the portfolio. As of December 31, 2019, there were specific reserves on two credit relationships allocated in the amount of $6.2 million. As of December 31, 2018, there were two specific reserves allocated in the amount of $5.2 million.
Loans to principal officers, directors and their affiliates during 2019 were as follows:
| (Dollars in Thousands) | | 2019 | |
| Beginning Balance | | $ | 23,409 | |
| New Loans | | | 27,664 | |
| Repayments | | | (11,393 | ) |
| Balance at End of Year | | $ | 39,680 | |
NOTE 6 - ALLOWANCE FOR LOAN LOSSES
We maintain an allowance for loan losses (“ALL”) at a level determined to be adequate to absorb estimated probable incurred losses inherent in the loan portfolio as of the balance sheet date. We develop and document a systematic ALL methodology based on the following portfolio segments: 1) Commercial Real Estate (“CRE”), 2) Commercial & Industrial (“C&I”), 3) Consumer, and 4) Obligations of States and Political Subdivisions. The following is a discussion of the key risks by portfolio segment that management assesses in preparing the ALL.
CRE loans are secured by commercial purpose real estate, including both owner occupied properties and investment properties, for various purposes such as hotels, strip malls and apartments. Operations of the individual projects as well as global cash flows of the debtors are the primary sources of repayment for these loans. The condition of the local economy is an important indicator of risk, but there are also more specific risks depending on the collateral type as well as the business.
CARTER BANK & TRUST
NOTES TO CONSOLIDATED FINANCIAL STATEMENTS (continued)
C&I loans are made to operating companies or manufacturers for the purpose of production, operating capacity, accounts receivable, inventory or equipment financing. Cash flow from the operations of the borrower is the primary source of repayment for these loans. The condition of the local economy is an important indicator of risk, but there are also more specific risks depending on the industry of the borrower. Collateral for these types of loans often do not have sufficient value in a distressed or liquidation scenario to satisfy the outstanding debt.
Consumer loans are made to individuals and may be either secured by assets other than 1-4 family residences or unsecured. This segment includes auto loans and unsecured loans and lines. The primary source of repayment for these loans is the income and assets of the borrower. The condition of the local economy, in particular the unemployment rate, is an important indicator of risk for this segment. The value of the collateral, if there is any, is less likely to be a source of repayment due to less certain collateral values.
Obligations of States and Political Subdivision loans are made to local and state municipalities for various purposes including refinancing existing obligations, infrastructure up-fit and expansion, or to purchase new equipment. This segment of loans may be secured by general obligations from the municipal authority or revenues generated by infrastructure and equipment financed by the Bank. The primary repayment source for these loans include the tax base of the municipality, specific revenue streams related to the infrastructure financed, and other business operations of the municipal authority. The health and stability of state and local economies directly impacts each municipality’s tax basis and are important indicators of risk for this segment. The ability of each municipality to increase taxes and fees to offset debt service requirements give this type of loan a very low risk profile in the continuum of the Bank’s loan portfolio.
CARTER BANK & TRUST
NOTES TO CONSOLIDATED FINANCIAL STATEMENTS (continued)
The following tables present, by portfolio segment, the changes in the allowance for loan losses and the allocation of the allowance for loan losses for the years ended December 31, 2019, 2018, and 2017:
| | | | | | Consumer | | | | | | Obligations | | | | |
| (Dollars in Thousands) | | Real | | | & Other | | | Commercial | | | Of States and | | | | |
| December 31, 2019 | | Estate | | | Loans | | | & Industrial | | | Political Sub. | | | Total | |
| Allowance for Loan Losses: | | | | | | | | | | | | | | | | | | | | |
| Balance: Beginning of Year | | $ | 35,413 | | | $ | 2,728 | | | $ | 626 | | | $ | 432 | | | $ | 39,199 | |
| Provision Charged to Expense | | | (3,531 | ) | | | 4,370 | | | | 2,632 | | | | (67 | ) | | | 3,404 | |
| Losses Charged Off | | | (659 | ) | | | (4,401 | ) | | | (22 | ) | | | – | | | | (5,082 | ) |
| Recoveries | | | 639 | | | | 602 | | | | – | | | | – | | | | 1,241 | |
| Balance, End of Year | | $ | 31,862 | | | $ | 3,299 | | | $ | 3,236 | | | $ | 365 | | | $ | 38,762 | |
| | | | | | Consumer | | | | | | Obligations | | | | |
| (Dollars in Thousands) | | Real | | | & Other | | | Commercial | | | Of States and | | | | |
| December 31, 2018 | | Estate | | | Loans | | | & Industrial | | | Political Sub. | | | Total | |
| Allowance for Loan Losses: | | | | | | | | | | | | | | | | | | | | |
| Balance: Beginning of Year | | $ | 33,360 | | | $ | 288 | | | $ | 1,210 | | | $ | 460 | | | $ | 35,318 | |
| Provision Charged to Expense | | | 12,562 | | | | 4,900 | | | | (564 | ) | | | (28 | ) | | | 16,870 | |
| Losses Charged Off | | | (11,924 | ) | | | (2,710 | ) | | | (20 | ) | | | – | | | | (14,654 | ) |
| Recoveries | | | 1,415 | | | | 250 | | | | – | | | | – | | | | 1,665 | |
| Balance, End of Year | | $ | 35,413 | | | $ | 2,728 | | | $ | 626 | | | $ | 432 | | | $ | 39,199 | |
| | | | | | Consumer | | | | | | Obligations | | | | |
| (Dollars in Thousands) | | Real | | | & Other | | | Commercial | | | Of States and | | | | |
| December 31, 2017 | | Estate | | | Loans | | | & Industrial | | | Political Sub. | | | Total | |
| Allowance for Loan Losses: | | | | | | | | | | | | | | | | | | | | |
| Balance: Beginning of Year | | $ | 32,476 | | | $ | 82 | | | $ | 1,480 | | | $ | 462 | | | $ | 34,500 | |
| Provision Charged to Expense | | | 42,977 | | | | 461 | | | | (239 | ) | | | (2 | ) | | | 43,197 | |
| Losses Charged Off | | | (42,813 | ) | | | (465 | ) | | | (31 | ) | | | – | | | | (43,309 | ) |
| Recoveries | | | 720 | | | | 210 | | | | - | | | | – | | | | 930 | |
| Balance, End of Year | | $ | 33,360 | | | $ | 288 | | | $ | 1,210 | | | $ | 460 | | | $ | 35,318 | |
Credit Quality Indicators:
The Bank’s portfolio grading analysis estimates the capability of the borrower to repay the contractual obligations of the loan agreements as scheduled or at all. The Bank’s internal credit risk grading system is based on debt service coverage, collateral values and other subjective factors. Mortgage and consumer loans are defaulted to a pass grade until a loan migrates to past due status.
CARTER BANK & TRUST
NOTES TO CONSOLIDATED FINANCIAL STATEMENTS (continued)
The Bank has a loan review policy and annual scope report that details the level of loan review for commercial loans in a given year. During 2019, the Bank used a four step approach for loan review in the following segments:
| · | Top 20 largest relationships, which is defined as any relationship with an aggregate outstanding balance of $2.0 million or more; |
| · | Large loan relationships that are not part of the top 20; and |
| · | Concentration focus reviews of the top 16 segments sampling 20% of the balances in each segment. |
The Bank’s internally assigned grades are as follows:
Pass – The loan is currently performing and is of high quality.
Special Mention – Assets with potential weaknesses that warrant management’s close attention and if left uncorrected, these potential weaknesses may result in deterioration of the repayment prospects for the asset or in the institutions credit position at some future date. Special mention assets are not adversely classified and do not expose an institution to sufficient risk to warrant adverse classification.
Substandard – Assets that are inadequately protected by the current sound worth and paying capacity of the obligor or by the collateral pledged, if any. Assets so classified have a well-defined weakness, or weaknesses that jeopardize the liquidation of the debt. Such assets are characterized by the distinct possibility that the institution will sustain some loss if the deficiencies are not corrected.
Doubtful – Assets with all the weaknesses inherent in one classified substandard with the added characteristic that the weaknesses make collection or liquidation in full, on the basis of currently known facts, conditions, and values, highly questionable and improbable.
Loss – Assets considered of such little value that its continuance on the books is not warranted. This classification does not mean that the asset has absolutely no recovery or salvage value, but rather it is not practical or desirable to defer writing off this basically worthless asset even though partial recovery may be affected in the future.
The following tables represent credit exposures by internally assigned grades as of December 31, 2019 and 2018:
| | | | | | | | | | | | Obligations | | | | |
| (Dollars in Thousands) | | | | | Consumers & | | | Commercial | | | Of States and | | | | |
| December 31, 2019 | | Real Estate | | | Other Loans | | | & Industrial | | | Political Sub. | | | Total | |
| Pass | | $ | 1,845,040 | | | $ | 73,345 | | | $ | 167,326 | | | $ | 364,869 | | | $ | 2,450,580 | |
| Special Mention | | | 4,022 | | | | 9 | | | | 203 | | | | - | | | | 4,234 | |
| Substandard | | | 340,349 | | | | 334 | | | | 89,269 | | | | - | | | | 429,952 | |
| Doubtful | | | - | | | | - | | | | - | | | | - | | | | - | |
| Loss | | | - | | | | - | | | | - | | | | - | | | | - | |
| Total Loans | | $ | 2,189,411 | | | $ | 73,688 | | | $ | 256,798 | | | $ | 364,869 | | | $ | 2,884,766 | |
| | | | | | | | | | | | | | | | | | | | | |
| Performing Loans | | $ | 2,148,012 | | | $ | 73,421 | | | $ | 256,331 | | | $ | 364,869 | | | $ | 2,842,633 | |
| Non-Accrual Loans | | | 41,399 | | | | 267 | | | | 467 | | | | - | | | | 42,133 | |
| Total Loans | | $ | 2,189,411 | | | $ | 73,688 | | | $ | 256,798 | | | $ | 364,869 | | | $ | 2,884,766 | |
CARTER BANK & TRUST
NOTES TO CONSOLIDATED FINANCIAL STATEMENTS (continued)
| | | | | | | | | | | | Obligations | | | | |
| (Dollars in Thousands) | | | | | Consumers & | | | Commercial | | | Of States and | | | | |
| December 31, 2018 | | Real Estate | | | Other Loans | | | & Industrial | | | Political Sub. | | | Total | |
| Pass | | $ | 1,592,124 | | | $ | 72,907 | | | $ | 134,002 | | | $ | 432,402 | | | $ | 2,231,435 | |
| Special Mention | | | 10,765 | | | | 45 | | | | 70 | | | | - | | | | 10,880 | |
| Substandard | | | 365,975 | | | | 106 | | | | 95,396 | | | | - | | | | 461,477 | |
| Doubtful | | | - | | | | - | | | | - | | | | - | | | | - | |
| Loss | | | - | | | | - | | | | - | | | | - | | | | - | |
| Total Loans | | $ | 1,968,864 | | | $ | 73,058 | | | $ | 229,468 | | | $ | 432,402 | | | $ | 2,703,792 | |
| | | | | | | | | | | | | | | | | | | | | |
| Performing Loans | | $ | 1,918,804 | | | $ | 72,993 | | | $ | 228,862 | | | $ | 432,402 | | | $ | 2,653,061 | |
| Non-Accrual Loans | | | 50,060 | | | | 65 | | | | 606 | | | | - | | | | 50,731 | |
| Total Loans | | $ | 1,968,864 | | | $ | 73,058 | | | $ | 229,468 | | | $ | 432,402 | | | $ | 2,703,792 | |
The Bank individually evaluates all substandard and nonaccrual loans greater than $1.0 million for impairment. A loan is impaired when, based on current information and events, it is probable that the Bank will be unable to collect all amounts due according to the contractual terms of the loan agreement. Our methodology for evaluating whether a loan is impaired includes risk-rating credits on an individual basis and consideration of the borrower’s overall financial condition, payment history and available cash resources. In measuring impairment, the Bank primarily utilizes fair market value of the collateral; however, the Bank also uses the discounted cash flow method for loans that are not deemed to be collateral dependent at the time of impairment. Troubled debt restructurings, or (“TDRs”), whether on accrual or nonaccrual status, are also classified as impaired loans. TDRs are loans where the Bank, for economic or legal reasons related to a borrower’s financial difficulties, grant a concession to the borrower that the Bank would not otherwise grant. The Bank strives to identify borrowers in financial difficulty early and work with them to modify the terms before their loan reaches nonaccrual status. These modified terms generally include extensions of maturity dates at a stated interest rate lower than the current market rate for a new loan with similar risk characteristics, reductions in contractual interest rates or principal deferment. While unusual, there may be instances of principal forgiveness. These modifications are generally for longer term periods that would not be considered insignificant.
CARTER BANK & TRUST
NOTES TO CONSOLIDATED FINANCIAL STATEMENTS (continued)
The following tables present the balances in the ALL and the recorded investment in the loan balances based on impairment method as of December 31, 2019 and 2018.
| | | | | | Consumer | | | | | | Obligations | | | | |
| (Dollars in Thousands) | | Real | | | & Other | | | Commercial | | | Of States and | | | | |
| December 31, 2019 | | Estate | | | Loans | | | & Industrial | | | Political Sub. | | | Total | |
| Allowance for Loan Losses: | | | | | | | | | | | | | | | | | | | | |
| Individually Evaluated for Impairment | | $ | 5,779 | | | $ | – | | | $ | 390 | | | $ | – | | | $ | 6,169 | |
| Collectively Evaluated for Impairment | | | 26,083 | | | | 3,299 | | | | 2,846 | | | | 365 | | | | 32,593 | |
| | | | | | | | | | | | | | | | | | | | | |
| Total Loans: | | | | | | | | | | | | | | | | | | | | |
| Individually Evaluated for Impairment | | $ | 145,275 | | | $ | – | | | $ | 390 | | | $ | – | | | $ | 145,665 | |
| Collectively Evaluated for Impairment | | | 2,044,136 | | | | 73,688 | | | | 256,408 | | | | 364,869 | | | | 2,739,101 | |
| | | | | | Consumer | | | | | | Obligations | | | | |
| (Dollars in Thousands) | | Real | | | & Other | | | Commercial | | | Of States and | | | | |
| December 31, 2018 | | Estate | | | Loans | | | & Industrial | | | Political Sub. | | | Total | |
| Allowance for Loan Losses: | | | | | | | | | | | | | | | | | | | | |
| Individually Evaluated for Impairment | | $ | 5,199 | | | $ | – | | | $ | – | | | $ | – | | | $ | 5,199 | |
| Collectively Evaluated for Impairment | | | 30,214 | | | | 2,728 | | | | 626 | | | | 432 | | | | 34,000 | |
| | | | | | | | | | | | | | | | | | | | | |
| Total Loans: | | | | | | | | | | | | | | | | | | | | |
| Individually Evaluated for Impairment | | $ | 161,577 | | | $ | – | | | $ | – | | | $ | – | | | $ | 161,577 | |
| Collectively Evaluated for Impairment | | | 1,807,287 | | | | 73,058 | | | | 229,468 | | | | 432,402 | | | | 2,542,215 | |
The recorded investment in loans excludes accrued interest receivable.
CARTER BANK & TRUST
NOTES TO CONSOLIDATED FINANCIAL STATEMENTS (continued)
The following table includes the recorded investment and unpaid principal balance for impaired loans with the associated allowance, if applicable, at December 31, 2019, 2018 and 2017:
| (Dollars in Thousands) | | Unpaid Principal | | | Recorded | | | Specific | | | Average Investment | | | Interest Income | |
| December 31, 2019 | | Balance | | | Balance | | | Allowance | | | in Impaired Loans | | | Recognized | |
| Loans without a Specific Valuation Allowance: | | | | | | | | | | | | | | | | | | | | |
Real Estate | | $ | 116,506 | | | $ | 116,506 | | | $ | - | | | $ | 122,522 | | | $ | 9,049 | |
| | | | | | | | | | | | | | | | | | | | | |
| Loans with a Specific Valuation Allowance: | | | | | | | | | | | | | | | | | | | | |
| Real Estate | | | 28,769 | | | | 28,769 | | | | 5,779 | | | | 32,917 | | | | - | |
| Commercial and Industrial | | | 390 | | | | 390 | | | | 390 | | | | 434 | | | | - | |
| | | | | | | | | | | | | | | | | | | | | |
| Total by Category: | | | | | | | | | | | | | | | | | | | | |
| Real Estate | | | 145,275 | | | | 145,275 | | | | 5,779 | | | | 155,439 | | | | 9,049 | |
| Commercial and Industrial | | | 390 | | | | 390 | | | | 390 | | | | 434 | | | | - | |
| Total Impaired Loans | | $ | 145,665 | | | $ | 145,665 | | | $ | 6,169 | | | $ | 155,873 | | | $ | 9,049 | |
| (Dollars in Thousands) | | Unpaid Principal | | | Recorded | | | Specific | | | Average Investment | | | Estimated Interest | |
| December 31, 2018 | | Balance | | | Balance | | | Allowance | | | in Impaired Loans | | | Income Recognized | |
| Loans without a Specific Valuation Allowance: | | | | | | | | | | | | | | | | | | | | |
Real Estate | | $ | 131,198 | | | $ | 131,198 | | | $ | - | | | $ | 128,694 | | | $ | 3,946 | |
| Commercial and Industrial | | | - | | | | - | | | | - | | | | 187,978 | | | | - | |
| | | | | | | | | | | | | | | | | | | | | |
| Loans with a Specific Valuation Allowance: | | | | | | | | | | | | | | | | | | | | |
| Real Estate | | | 30,379 | | | | 30,379 | | | | 5,199 | | | | 23,126 | | | | 20 | |
| | | | | | | | | | | | | | | | | | | | | |
| Total by Category: | | | | | | | | | | | | | | | | | | | | |
| Real Estate | | | 161,577 | | | | 161,577 | | | | 5,199 | | | | 151,820 | | | | 3,966 | |
| Commercial and Industrial | | | - | | | | - | | | | - | | | | 187,978 | | | | - | |
| Total Impaired Loans | | $ | 161,577 | | | $ | 161,577 | | | $ | 5,199 | | | $ | 339,798 | | | $ | 3,966 | |
CARTER BANK & TRUST
NOTES TO CONSOLIDATED FINANCIAL STATEMENTS (continued)
| (Dollars in Thousands) | | Unpaid Principal | | | Recorded | | | Specific | | | Average Investment | | | Estimated Interest | |
| December 31, 2017 | | Balance | | | Balance | | | Allowance | | | in Impaired Loans | | | Income Recognized | |
| Loans without a Specific Valuation Allowance: | | | | | | | | | | | | | | | | | | | | |
Real Estate | | $ | 229,894 | | | $ | 229,894 | | | $ | - | | | $ | 252,714 | | | $ | 6,660 | |
| Consumer | | | 21 | | | | 21 | | | | - | | | | 64 | | | | - | |
| Commercial and Industrial | | | 215,802 | | | | 215,802 | | | | - | | | | 301,649 | | | | 14,932 | |
| | | | | | | | | | | | | | | | | | | | | |
| Loans with a Specific Valuation Allowance: | | | | | | | | | | | | | | | | | | | | |
| Real Estate | | | 981 | | | | 981 | | | | 32 | | | | 879 | | | | 45 | |
| | | | | | | | | | | | | | | | | | | | | |
| Total by Category: | | | | | | | | | | | | | | | | | | | | |
| Real Estate | | | 230,875 | | | | 230,875 | | | | 32 | | | | 253,593 | | | | 6,705 | |
| Consumer | | | 21 | | | | 21 | | | | - | | | | 64 | | | | - | |
| Commercial and Industrial | | | 215,802 | | | | 215,802 | | | | - | | | | 301,649 | | | | 14,932 | |
| Total Impaired Loans | | $ | 446,698 | | | $ | 446,698 | | | $ | 32 | | | $ | 555,306 | | | $ | 21,637 | |
For the years ended December 31, 2019, 2018 and 2017, interest income recognized on impaired loans was $9.0 million, $4.0 million, and $21.6 million, respectively.
CARTER BANK & TRUST
NOTES TO CONSOLIDATED FINANCIAL STATEMENTS (continued)
Age Analysis of Past-Due Loans by Class
The following table includes an aging analysis of the recorded investment of past-due loans as of December 31, 2019 and 2018:
| | | | | | | | | | | | | | | | | | | | | | | | Accruing | |
| | | Loans | | | Loans | | | Loans 90 or | | | | | | | | | | | | | | | Loans More | |
| (Dollars in Thousands) | | 30-59 Days | | | 60-89 Days | | | More Days | | | Total | | | Current | | | Non-Accrual | | | Total | | | Than 90 Days | |
| December 31, 2019 | | Past Due | | | Past Due | | | Past Due | | | Past Due | | | Loans | | | Loans | | | Loans | | | Past Due | |
| Real Estate Loans | | $ | 1,302 | | | $ | 1,088 | | | $ | - | | | $ | 2,390 | | | $ | 2,145,622 | | | $ | 41,399 | | | $ | 2,189,411 | | | $ | - | |
| Consumer Loans | | | 894 | | | | 389 | | | | - | | | | 1,283 | | | | 72,138 | | | | 267 | | | | 73,688 | | | | - | |
| C & I Loans | | | 146 | | | | 15 | | | | - | | | | 161 | | | | 256,170 | | | | 467 | | | | 256,798 | | | | - | |
| States and Political Sub. | | | 236 | | | | - | | | | - | | | | 236 | | | | 364,633 | | | | - | | | | 364,869 | | | | - | |
| Total | | $ | 2,578 | | | $ | 1,492 | | | $ | - | | | $ | 4,070 | | | $ | 2,838,563 | | | $ | 42,133 | | | $ | 2,884,766 | | | $ | - | |
| | | | | | | | | | | | | | | | | | | | | | | | Accruing | |
| | | Loans | | | Loans | | | Loans 90 or | | | | | | | | | | | | | | | Loans More | |
| (Dollars in Thousands) | | 30-59 Days | | | 60-89 Days | | | More Days | | | Total | | | Current | | | Non-Accrual | | | Total | | | Than 90 Days | |
| December 31, 2018 | | Past Due | | | Past Due | | | Past Due | | | Past Due | | | Loans | | | Loans | | | Loans | | | Past Due | |
| Real Estate Loans | | $ | 678 | | | $ | 5,368 | | | $ | - | | | $ | 6,046 | | | $ | 1,912,758 | | | $ | 50,060 | | | $ | 1,968,864 | | | $ | - | |
| Consumer Loans | | | 1,053 | | | | 457 | | | | - | | | | 1,510 | | | | 71,483 | | | | 65 | | | | 73,058 | | | | - | |
| C & I Loans | | | 39 | | | | 23 | | | | - | | | | 62 | | | | 228,800 | | | | 606 | | | | 229,468 | | | | - | |
| States and Political Sub. | | | - | | | | - | | | | - | | | | - | | | | 432,402 | | | | - | | | | 432,402 | | | | - | |
| Total | | $ | 1,770 | | | $ | 5,848 | | | $ | - | | | $ | 7,618 | | | $ | 2,645,443 | | | $ | 50,731 | | | $ | 2,703,792 | | | $ | - | |
As of December 31, 2019 or 2018, there were no nonaccrual or past due loans related to loans held-for-sale.
NOTE 7 - FAIR VALUE MEASUREMENTS
Fair value is the exchange price that would be received for an asset or paid to transfer a liability (exit price) in the principal or most advantageous market for the asset or liability in an orderly transaction between market participants on the measurement date. We use various valuation techniques to determine fair value, including market, income and cost approaches. There are three levels of inputs that may be used to measure fair values:
Level 1: Quoted prices (unadjusted) for identical assets or liabilities in active markets that an entity has the ability to access as of the measurement date, or observable inputs.
Level 2: Significant other observable inputs other than Level 1 prices, such as quoted prices for similar assets or liabilities, quoted prices in markets that are not active, and other inputs that are observable or can be corroborated by observable market data.
Level 3: Significant unobservable inputs that reflect an entity’s own assumptions about the assumptions that market participants would use in pricing an asset or liability.
In certain cases, the inputs used to measure fair value may fall into different levels of the fair value hierarchy. When that occurs, we classify the fair value hierarchy on the lowest level of input that is significant to the fair value measurement. We used the following methods and significant assumptions to estimate fair value:
CARTER BANK & TRUST
NOTES TO CONSOLIDATED FINANCIAL STATEMENTS (continued)
Securities: The fair values of securities available-for-sale are determined by obtaining quoted prices on nationally recognized securities exchanges, if available. This valuation method is classified as Level 1 in the fair value hierarchy. For securities where quoted prices are not available, fair values are calculated on market prices of similar securities, or matrix pricing, which is a mathematical technique, used widely in the industry to value debt securities without relying exclusively on quoted prices for the specific securities but rather by relying on the securities’ relationship to other benchmark quoted securities. Matrix pricing relies on the securities’ relationship to similarly traded securities, benchmark curves, and the benchmarking of like securities. Matrix pricing utilizes observable market inputs such as benchmark yields, reported trades, broker/dealer quotes, issuer spreads, two-sided markets, benchmark securities, bids, offers, reference data, and industry and economic events. In instances where broker quotes are used, these quotes are obtained from market makers or broker-dealers recognized to be market participants. This valuation method is classified as Level 2 in the fair value hierarchy. For securities where quoted prices or market prices of similar securities are not available, fair values are calculated using discounted cash flows or other market indicators. This valuation method is classified as Level 3 in the fair value hierarchy.
Impaired Loans: All loans with an outstanding balance greater than $1.0 million are evaluated for potential impairment when based on current information and events, it is probable that CB&T will be unable to collect all amounts due according to the contractual terms of the loan agreement. At the time a loan is initially identified as impaired it is evaluated for potential impairment and is adjusted, if a shortfall exists, to fair value less costs to sell. Fair value is measured based on the value of the underlying collateral securing the loan if repayment is expected solely from the sale or operation of the collateral or present value of estimated future cash flows using the loan’s existing rate if the loan is not determined to be collateral dependent. All impaired loans with a specific reserve are classified as Level 3 in the fair value hierarchy.
Fair value for collateral dependent loans is determined using several methods. Generally, the fair value of real estate is determined based on appraisals by qualified licensed appraisers. These appraisals may utilize a single valuation approach or a combination of approaches including comparable sales and the income approach. Adjustments are routinely made in the appraisal process by the appraisers to adjust for differences between the comparable sales and income data available. These routine adjustments are made to adjust the value of a specific property relative to comparable properties for variations in qualities such as location, size, and income production capacity relative to the subject property of the appraisal. Such adjustments are typically significant and result in a Level 3 classification of the inputs for determining fair value.
Subsequent to the initial impairment date, existing impaired loans are reevaluated quarterly for additional impairment and adjustments to fair value less costs to sell are made, where appropriate. For collateral dependent loans, the first stage of our impairment analysis involves management’s inspection of the property in question to affirm the condition has not deteriorated since the previous impairment analysis date. Management also engages in conversations with local real estate professionals and market participants to determine the likely marketing time and value range for the property. The second stage involves an assessment of current trends in the regional market. After thorough consideration of these factors, management will either internally evaluate fair value or order a new appraisal. In circumstances where the Bank feels confident in its ability to collect and analyze salient information on the subject collateral and its surrounding real estate market, an in house valuation shall be utilized. Factors which should be considered in an in house valuation are timing of sale, location and neighborhood, size of the structure and land component, age of any improvements, and other attributes as warranted by the Bank. This determination is made on a property-by-property basis in light of circumstances in the broader economic climate and our assessment of deterioration of real estate values in the market in which the property is located. When the Bank feels it cannot collect and analyze salient information on the subject collateral or the collateral’s real estate market, a full appraisal will be utilized.
CARTER BANK & TRUST
NOTES TO CONSOLIDATED FINANCIAL STATEMENTS (continued)
For non-collateral dependent loans, the fair value is determined by updating the present value of estimated future cash flows using the loan’s existing rate to reflect the payment schedule for the remaining life of the loan.
OREO: OREO is evaluated at the time of acquisition and is recorded at fair value as determined by an appraisal or evaluation, less costs to sell. After acquisition, most OREO assets are revalued every twelve months, or more frequently when deemed necessary by management based upon changes in market or collateral conditions. For smaller OREO assets with existing carrying values less than $0.5 million, management may elect to re-value the assets, at minimum, once every twenty-four months based on the size of the exposure. At December 31, 2019 Carter Bank’s OREO assets were in compliance with the Bank’s OREO policy as set forth above, and substantially all of the assets were listed for sale with credible third party real estate brokers.
Financial assets measured at fair value on a recurring basis at December 31, 2019 are summarized below:
| | | | | | Quoted Prices In | | | | | | | |
| | | | | | Active Markets for | | | Significant Other | | | Significant | |
| | | Carrying | | | Identical Assets | | | Observable Inputs | | | Inputs | |
| (Dollars in Thousands) | | Value | | | (Level 1) | | | (Level 2) | | | (Level 3) | |
| Assets | | | | | | | | | | | | | | | | |
| Securities Available-for-Sale | | $ | 742,617 | | | $ | — | | | $ | 737,617 | | | $ | 5,000 | |
| Derivatives | | | 626 | | | | — | | | | 626 | | | | — | |
| Total | | $ | 743,243 | | | $ | — | | | $ | 738,243 | | | $ | 5,000 | |
| Liabilities | | | | | | | | | | | | | | | | |
| Derivatives | | $ | 675 | | | $ | — | | | $ | 675 | | | $ | — | |
| Total | | $ | 675 | | | $ | — | | | $ | 675 | | | $ | — | |
Financial assets measured at fair value on a recurring basis at December 31, 2018 are summarized below:
| | | | | | Quoted Prices In | | | | | | | |
| | | | | | Active Markets for | | | Significant Other | | | Significant | |
| | | Carrying | | | Identical Assets | | | Observable Inputs | | | Inputs | |
| (Dollars in Thousands) | | Value | | | (Level 1) | | | (Level 2) | | | (Level 3) | |
| Assets | | | | | | | | | | | | | | | | |
| Securities Available-for-Sale | | $ | 782,758 | | | $ | — | | | $ | 777,758 | | | $ | 5,000 | |
| Derivatives | | | 282 | | | | — | | | | 282 | | | | — | |
| Total | | $ | 783,040 | | | $ | — | | | $ | 778,040 | | | $ | 5,000 | |
| Liabilities | | | | | | | | | | | | | | | | |
| Derivatives | | $ | 309 | | | $ | — | | | $ | 309 | | | $ | — | |
| Total | | $ | 309 | | | $ | — | | | $ | 309 | | | $ | — | |
There were no transfers between Level 1 and Level 2 during 2019 or 2018.
CARTER BANK & TRUST
NOTES TO CONSOLIDATED FINANCIAL STATEMENTS (continued)
Financial assets measured at fair value on a non-recurring basis at December 31, 2019 and 2018 are summarized below:
| (Dollars in Thousands) | | | | | | | | | | | | |
| December 31, 2019 | | Level 1 | | | Level 2 | | | Level 3 | | | Fair Value | |
| OREO | | $ | – | | | $ | – | | | $ | 18,324 | | | $ | 18,324 | |
| Impaired Loans | | $ | – | | | $ | – | | | $ | 22,989 | | | $ | 22,989 | |
| December 31, 2018 | | Level 1 | | | Level 2 | | | Level 3 | | | Fair Value | |
| OREO | | $ | – | | | $ | – | | | $ | 33,681 | | | $ | 33,681 | |
| Impaired Loans | | $ | – | | | $ | – | | | $ | 25,180 | | | $ | 25,180 | |
Impaired loans had a carrying amount of $23.0 million at December 31, 2019 with a valuation allowance of $6.2 million, resulting in a $1.0 million increase in provision for loan losses for the year ended December 31, 2019. Impaired loans had a carrying amount of $25.2 million at December 31, 2018 with a valuation allowance of $5.2 million, resulting in a $5.2 million increase in provision for loan losses for the year ended December 31, 2018.
OREO, which is measured at the lower of carrying or fair value less costs to sell, had a net carrying amount of $18.3 million as of December 31, 2019, compared with $33.7 million at December 31, 2018, respectively. Write-downs of $4.5 million were recorded on OREO for the year ended December 31, 2019 compared to $8.7 million for the year ended December 31, 2018, respectively.
The following tables summarize the Bank’s assets that were measured at fair value on a nonrecurring basis as of December 31, 2019 and 2018:
| (Dollars in Thousands) | | | | | | | | | | | | | |
| December 31, 2019 | | Fair | | | Valuation | | Unobservable | | Weighted | | | | |
| Assets | | Value | | | Technique | | Inputs | | Range | | | Average | |
| Impaired Loans | | $ | 2,700 | | | Purchase Contract | | Pending Close of Contract, Net of Closing Costs | | | 25.0 | % | | | 25.0 | % |
| Impaired Loans | | | 20,289 | | | Discounted Appraisals | | Management’s Disc. & Selling Costs | | | 2.6 – 84.6 | % | | | 24.1 | % |
| Total Impaired Loans | | $ | 22,989 | | | | | | | | | | | | | |
| | | | | | | | | | | | | | | | | |
| Other Real Estate Owned | | $ | 13,596 | | | Appraisals | | Selling Costs | | | 6.0 – 10.0 | % | | | 6.4 | % |
| Other Real Estate Owned | | | 1,735 | | | Discounted Cash Flow | | Discount Rate | | | 6.3 | % | | | 6.3 | % |
| Other Real Estate Owned | | | 2,993 | | | Internal Valuations | | Selling Costs | | | 5.0 | % | | | 5.0 | % |
| Total Other Real Estate Owned | | $ | 18,324 | | | | | | | | | | | | | |
| (Dollars in Thousands) | | | | | | | | | | | | | |
| December 31, 2018 | | Fair | | | Valuation | | Unobservable | | Weighted | | | | |
| Assets | | Value | | | Technique | | Inputs | | Range | | �� | Average | |
| Impaired Loans | | $ | 24,801 | | | Discounted Appraisals | | Management’s Disc. & Selling Costs | | | 0.0 – 100.0 | % | | | 25.5 | % |
| Impaired Loans | | | 379 | | | Net Present Value | | Discount Rate | | | 5.5 | % | | | 5.5 | % |
| Total Impaired Loans | | $ | 25,180 | | | | | | | | | | | | | |
| | | | | | | | | | | | | | | | | |
| Other Real Estate Owned | | $ | 24,644 | | | Appraisals | | Selling Costs | | | 3.0 – 10.0 | % | | | 6.2 | % |
| Other Real Estate Owned | | | 2,282 | | | Discounted Cash Flow | | Discount Rate | | | 6.3 | % | | | 6.3 | % |
| Other Real Estate Owned | | | 1,796 | | | Internal Valuations | | Selling Costs | | | 5.0 | % | | | 5.0 | % |
| Other Real Estate Owned | | | 4,959 | | | Discounted Internal Valuations | | Management’s Disc. & Selling Costs | | | 16.9 – 62.1 | % | | | 44.4 | % |
| Total Other Real Estate Owned | | $ | 33,681 | | | | | | | | | | | | | |
CARTER BANK & TRUST
NOTES TO CONSOLIDATED FINANCIAL STATEMENTS (continued)
The carrying values and estimated fair values of the Bank’s financial instruments at December 31, 2019 and December 31, 2018 are presented in the following tables. Fair values for December 31, 2019 and December 31, 2018 are estimated under the exit price notion in accordance with ASU 2016-01, “Recognition and Measurement of Financial Assets and Financial Liabilities.”
| (Dollars in Thousands) | | | | | Fair Value Measurements at December 31, 2019 | |
| Financial Assets: | | Carrying
Value | | | Level 1 | | | Level 2 | | | Level 3 | | | Total | |
| Cash and Cash Equivalents | | $ | 125,812 | | | $ | 41,386 | | | $ | 84,426 | | | $ | - | | | $ | 125,812 | |
| Securities Available-for-Sale | | | 742,617 | | | | - | | | | 737,617 | | | | 5,000 | | | | 742,617 | |
| Loans Held-for-Sale | | | 19,714 | | | | - | | | | - | | | | 19,714 | | | | 19,714 | |
| Portfolio Loans | | | 2,884,766 | | | | - | | | | - | | | | 2,857,986 | | | | 2,857,986 | |
| Federal Home Loan Bank Stock, at Cost | | | 4,113 | | | | - | | | | - | | | | N/A | | | | N/A | |
| Other Assets- Interest Rate Derivatives | | | 626 | | | | - | | | | 626 | | | | - | | | | 626 | |
| Accrued Interest Receivable | | | 13,751 | | | | - | | | | 3,018 | | | | 10,733 | | | | 13,751 | |
| Financial Liabilities: | | | | | | | | | | | | | | | |
| Deposits | | $ | 3,504,245 | | | $ | 554,875 | | | $ | 988,964 | | | $ | 1,967,563 | | | $ | 3,511,402 | |
| Other Liabilities- Interest Rate Derivatives | | | 675 | | | | - | | | | 675 | | | | - | | | | 675 | |
| FHLB Borrowings | | | 10,000 | | | | - | | | | - | | | | 9,886 | | | | 9,886 | |
| Accrued Interest Payable | | | 3,001 | | | | - | | | | - | | | | 3,001 | | | | 3,001 | |
| (Dollars in Thousands) | | | | | Fair Value Measurements at December 31, 2018 | |
| Financial Assets: | | Carrying Value | | | Level 1 | | | Level 2 | | | Level 3 | | | Total | |
| Cash and Cash Equivalents | | $ | 293,823 | | | $ | 47,413 | | | $ | 246,410 | | | $ | - | | | $ | 293,823 | |
| Securities Available-for-Sale | | | 782,758 | | | | - | | | | 777,758 | | | | 5,000 | | | | 782,758 | |
| Loans Held-for-Sale | | | 2,559 | | | | - | | | | - | | | | 2,559 | | | | 2,559 | |
| Portfolio Loans | | | 2,703,792 | | | | - | | | | - | | | | 2,585,579 | | | | 2,585,579 | |
| Other Assets- Interest Rate Derivatives | | | 282 | | | | - | | | | 282 | | | | - | | | | 282 | |
| Accrued Interest Receivable | | | 18,740 | | | | - | | | | 4,623 | | | | 14,117 | | | | 18,740 | |
| Financial Liabilities: | | | | | | | | | | | | | | | |
| Deposits | | $ | 3,591,181 | | | $ | 547,773 | | | $ | 3,022,117 | | | $ | - | | | $ | 3,569,890 | |
| Other Liabilities- Interest Rate Derivatives | | | 309 | | | | - | | | | 309 | | | | - | | | | 309 | |
| Accrued Interest Payable | | | 2,398 | | | | - | | | | 2,398 | | | | - | | | | 2,398 | |
NOTE 8 - PREMISES AND EQUIPMENT
Premises and equipment are stated at cost less accumulated depreciation as follows:
| | | December 31, | |
| (Dollars in Thousands) | | 2019 | | | 2018 | |
| Bank Premises (including land of $28,526 on December 31, 2019 and $29,729 on December 31, 2018) | | $ | 87,687 | | | $ | 87,458 | |
| Furniture and Equipment | | | 28,783 | | | | 25,934 | |
| Leasehold Improvements | | | 702 | | | | 586 | |
| | | | 117,172 | | | | 113,978 | |
| Accumulated Depreciation | | | (31,230 | ) | | | (28,137 | ) |
| Total | | $ | 85,942 | | | $ | 85,841 | |
CARTER BANK & TRUST
NOTES TO CONSOLIDATED FINANCIAL STATEMENTS (continued)
Depreciation has been included under occupancy expense in the Consolidated Statements of Income (Loss) totaling $5.3 million in 2019, $3.7 million in 2018, and $3.2 million in 2017.
Real estate on closed branches was valued based on recent comparative market values received from a real estate broker. Write-downs in the amount of $1.0 million, $3.5 million and $5.3 million were recognized during 2019, 2018 and 2017, respectively. The net remaining carrying value of $3.0 million and $6.8 million is classified as held-for-sale in OREO in the Consolidated Balance Sheets as of December 31, 2019 and 2018, respectively. The disposition of the remaining 12 properties is expected to be completed during 2020.
The Bank leases offices from non-related parties under various terms, some of which contain contingent rentals tied to a price index. Rental expense for these leases was $156 thousand in 2019, $211 thousand in 2018, and $142 thousand for 2017.
The Bank currently has four depository locations, a loan production office, and a commercial banking office under lease contracts. The lease for our Lexington office has already been extended into its last renewal period and expires November 1, 2020. The lease for our Amherst office expired September 30, 2018, but was renewed effective October 1, 2018 for a period of two years which ends on September 30, 2020. The Bank also leases its Waynesboro office, whose original term expired July 31, 2007. The lease provides an option to extend for three additional six-year terms and is currently in its third renewal period. In addition, the Bank also leases a loan production office in Roanoke, whose initial three year term commenced on November 1, 2018. At the end of the initial term on October 31, 2021, the Bank has the option to extend for three additional five-year terms. The Bank’s commercial banking office in Greensboro has a lease contract whose initial five-year term commenced November 1, 2019, with an option to extend for three additional five-year terms. The lease for our Harrisonburg office commenced on July 1, 2019 with an initial term of twenty-four months. There are no extension terms included in the original lease agreement. The Bank formerly leased its Weyers Cave office, whose original term expired August 31, 2018. The Bank chose not to renew its lease and closed its location.
The Bank has included $1.2 million in right-of-use assets in other assets and $1.5 million in lease liabilities in other liabilities on its Consolidated Balance Sheets at December 31, 2019.
CARTER BANK & TRUST
NOTES TO CONSOLIDATED FINANCIAL STATEMENTS (continued)
NOTE 9 - OTHER REAL ESTATE OWNED
The following table presents OREO owned activity as of the dates presented:
| | | Year Ended December 31, | |
| (Dollars in Thousands) | | 2019 | | | 2018 | | | 2017 | |
| Beginning Balance | | $ | 33,681 | | | $ | 39,793 | | | $ | 23,558 | |
| Loans Transferred to Other Real Estate Owned | | | 302 | | | | 28,212 | | | | 17,912 | |
| Loans to Finance the Sale of Other Real Estate Owned | | | - | | | | (893 | ) | | | (7,347 | ) |
| Transfer of Closed Retail Offices to Other Real Estate Owned | | | 1,694 | | | | 2,177 | | | | 19,009 | |
| Capitalized Expenditures | | | - | | | | 1,272 | | | | 372 | |
| Direct Write-Downs | | | (4,457 | ) | | | (8,714 | ) | | | (9,967 | ) |
| Cash Proceeds from Pay-downs | | | (580 | ) | | | - | | | | - | |
| Sales of Other Real Estate Owned | | | (12,316 | ) | | | (28,166 | ) | | | (3,744 | ) |
| End of Year | | $ | 18,324 | | | $ | 33,681 | | | $ | 39,793 | |
At December 31, 2019, 2018, and 2017, the balance of OREO includes $15.3 million, $26.9 million, and $26.1 million, respectively, of foreclosed properties recorded as a result of obtaining physical possession of the asset. At December 31, 2019 and 2018, the recorded investment of foreclosed residential real estate was $69 thousand and $267 thousand, respectively. At December 31, 2019 and 2018, the recorded investment of consumer mortgage loans secured by residential real estate properties for which formal foreclosure proceeds are in process is $290 thousand and $296 thousand, respectively.
Income and expenses applicable to foreclosed assets include the following:
| | | Year Ended December 31, | |
| (Dollars in Thousands) | | 2019 | | | 2018 | | | 2017 | |
| Provision for Losses | | $ | 4,457 | | | $ | 8,714 | | | $ | 9,967 | |
| Operating Expenses, net of rental income | | | (215 | ) | | | (553 | ) | | | 343 | |
| Net Loss (Gain) on Sales | | | 275 | | | | (513 | ) | | | (58 | ) |
| Other Real Estate Owned Expense | | $ | 4,517 | | | $ | 7,648 | | | $ | 10,252 | |
NOTE 10 – GOODWILL AND OTHER INTANGIBLES
The Bank has selected October 1st as the impairment testing date. Based upon the testing, no impairment was identified. No events or circumstances since the October 1, 2019 annual impairment test were noted that would indicate it was more likely than not a goodwill impairment exits.
The following table presents goodwill as of December 31:
| (Dollars in Thousands) | | 2019 | | | 2018 | |
| Balance as of January 1 | | $ | 62,192 | | | $ | 63,228 | |
| Change due to Sale of Subsidiary | | | - | | | | (1,036 | ) |
| Impairment Losses | | | - | | | | - | |
| Balance as of December 31 | | $ | 62,192 | | | $ | 62,192 | |
CARTER BANK & TRUST
NOTES TO CONSOLIDATED FINANCIAL STATEMENTS (continued)
The following table presents other intangibles as of December 31:
| | | 2019 | | | 2018 | |
| Balance as of January 1 | | $ | - | | | $ | 122 | |
| Change due to Sale of Subsidiary | | | - | | | | (122 | ) |
| Impairment Losses | | | - | | | | - | |
| Balance as of December 31 | | $ | - | | | $ | - | |
NOTE 11 – DERIVATIVE INSTRUMENTS AND HEDGING ACTIVITIES
The following table indicated the amounts representing the value of derivative assets and derivative liabilities at December 31:
| | | Fair Values of Derivative Instruments | |
| | | Asset Derivatives (Included in Other Assets) | |
| | | Number of | | | | Notional | | | | 2019 | | | | 2018 | |
| (Dollars in Thousands) | | | Transactions | | | | Amount | | | | Fair Value | | | | Fair Value | |
| Derivatives not Designated as Hedging Instruments | | | | | | | | | | | | | | | | |
| Interest Rate Lock Commitments – Mortgage Loans | | | 5 | | | $ | 937 | | | $ | 1 | | | $ | 1 | |
| Interest Rate Swap Contracts – Commercial Loans | | | 2 | | | | 18,773 | | | | 625 | | | | 281 | |
| Total Derivatives not Designated as Hedging Instruments | | | | | | | | | | $ | 626 | | | $ | 282 | |
| | | Fair Values of Derivative Instruments | |
| | | Liability Derivatives (Included in Other Liabilities) | |
| | | Number of | | | | Notional | | | | 2019 | | | | 2018 | |
| (Dollars in Thousands) | | | Transactions | | | | Amount | | | | Fair Value | | | | Fair Value | |
| Derivatives not Designated as Hedging Instruments | | | | | | | | | | | | | | | | |
| Forward Sale Contracts – Mortgage Loans | | | 5 | | | $ | 937 | | | $ | 1 | | | $ | 1 | |
| Interest Rate Swap Contracts – Commercial Loans | | | 2 | | | | 18,773 | | | | 674 | | | | 308 | |
| Total Derivatives not Designated as Hedging Instruments | | | | | | | | | | $ | 675 | | | $ | 309 | |
The following table indicates the gain or loss recognized in income on derivatives for the years ended December 31:
| (Dollars in Thousands) | | 2019 | | | 2018 | | | 2017 | |
| Derivatives not Designated as Hedging Instruments | | | | | | | | | | | | |
| Interest Rate Lock Commitments – Mortgage Loans | | $ | - | | | $ | 1 | | | $ | - | |
| Forward Sale Contracts – Mortgage Loans | | | - | | | | (1 | ) | | | - | |
| Interest Rate Swap Contracts – Commercial Loans | | | (22 | ) | | | (27 | ) | | | - | |
| Total Derivative Loss | | $ | (22 | ) | | $ | (27 | ) | | $ | - | |
CARTER BANK & TRUST
NOTES TO CONSOLIDATED FINANCIAL STATEMENTS (continued)
Presenting offsetting derivatives that are subject to legally enforceable netting arrangements with the same party is permitted. For example, we may have a derivative asset and a derivative liability with the same counterparty to a swap transaction and are permitted to offset the asset position and the liability position resulting in a net presentation.
The following table indicates the gross amounts of commercial loan swap derivative assets and derivative liabilities, the amounts offset and the carrying values in the Consolidated Balance Sheets at December 31:
| | | Asset Derivatives (Included in
Other Assets) | | | Liability Derivatives
(Included in Other
Liabilities) | |
| (Dollars in Thousands) | | 2019 | | | 2018 | | | 2019 | | | 2018 | |
| Derivatives not Designated as Hedging Instruments | | | | | | | | | | | | | | | | |
| Gross Amounts Recognized | | $ | 625 | | | $ | 281 | | | $ | 674 | | | $ | 308 | |
| Gross Amounts Offset | | | - | | | | - | | | | - | | | | - | |
| Net Amounts Presented in the Consolidated Balance Sheets | | | 625 | | | | 281 | | | | 674 | | | | 308 | |
| Gross Amounts Not Offset (1) | | | - | | | | - | | | | (860 | ) | | | (260 | ) |
| Net Amount | | $ | 625 | | | $ | 281 | | | $ | (186 | ) | | $ | 48 | |
(1) Amounts represent collateral posted for the periods presented.
NOTE 12 – DEPOSITS
The following table presents the composition of deposits at December 31:
| (Dollars in Thousands) | | 2019 | | | 2018 | | | $ Change | | | % Change | |
| Noninterest-Bearing Demand | | $ | 554,875 | | | $ | 547,773 | | | $ | 7,102 | | | | 1.3 | % |
| Interest-Bearing Demand | | | 286,561 | | | | 254,015 | | | | 32,546 | | | | 12.8 | % |
| Money Market | | | 140,589 | | | | 80,835 | | | | 59,754 | | | | 73.9 | % |
| Savings | | | 561,814 | | | | 610,757 | | | | (48,943 | ) | | | (8.0 | )% |
| Certificates of Deposits | | | 1,960,406 | | | | 2,097,801 | | | | (137,395 | ) | | | (6.5 | )% |
| Total | | $ | 3,504,245 | | | $ | 3,591,181 | | | $ | (86,936 | ) | | | (2.4 | )% |
All deposit accounts are insured by the FDIC up to the maximum amount allowed by law. The Dodd-Frank Act, signed into law on July 21, 2010, makes permanent the $250,000 limit for federal deposit insurance and the coverage limit applies per depositor, per insured depository institution for each account ownership. Time deposits that meet or exceed the FDIC Insurance limit of $250,000 at year-end 2019 and 2018 were $195.3 million and $203.5 million, respectively.
Certificates of Deposit maturing as of December 31:
| (Dollars in Thousands) | | 2019 | |
| 2020 | | $ | 1,034,098 | |
| 2021 | | | 332,864 | |
| 2022 | | | 153,255 | |
| 2023 | | | 294,547 | |
| 2024 | | | 143,666 | |
| Thereafter | | | 1,976 | |
| TOTAL | | $ | 1,960,406 | |
CARTER BANK & TRUST
NOTES TO CONSOLIDATED FINANCIAL STATEMENTS (continued)
Overdrafts reclassified to loans at December 31, 2019 and 2018 were $0.7 million and $0.2 million, respectively.
Total deposit dollars from executive officers, directors, and their related interests at December 31, 2019 and 2018, respectively, were $7.5 million and $3.7 million.
NOTE 13 – LONG-TERM BORROWINGS
Long-term borrowings are for original terms greater than or equal to one year and are comprised of Federal Home Loan Bank (“FHLB”) advances. Our long-term borrowings at the Atlanta FHLB were $10.0 million as of December 31, 2019 and zero as of December 31, 2018. FHLB borrowings are secured by a blanket lien on select residential mortgages and investment securities available-for-sale. Total loans pledged as collateral were $284.6 million at December 31, 2019. Total securities available-for-sale pledged as collateral were $28.6 million at December 31, 2019. The Bank is eligible to borrow up to an additional $242.2 million based upon qualifying collateral, to a maximum borrowing capacity of approximately $1.0 billion, or 25% of the Bank’s assets, as of December 31, 2019.
The following table represents the balance of long-term borrowings, the weighted average interest rate, and interest expense for the years ended December 31:
| (Dollars in Thousands) | | 2019 | | | 2018 | | | 2017 | |
| Long-term Borrowings | | $ | 10,000 | | | $ | - | | | $ | - | |
| Weighted Average Interest Rate | | | 1.63 | % | | | 0.00 | % | | | 0.00 | % |
| Interest Expense | | | 38 | | | | - | | | | - | |
Scheduled annual maturities and average interest rates for all of our long-term debt for each of the five years subsequent to December 31, 2019 and thereafter are as follows:
| | | | | | | Weighted | |
| (Dollars in Thousands) | | | Balance | | | Average Rate | |
| 2020 | | | $ | - | | | | 0.00 | % |
| 2021 | | | | 3,000 | | | | 1.68 | % |
| 2022 | | | | 4,000 | | | | 1.60 | % |
| 2023 | | | | - | | | | 0.00 | % |
| 2024 | | | | 3,000 | | | | 1.63 | % |
| Thereafter | | | | - | | | | 0.00 | % |
| Total FHLB Advances | | | $ | 10,000 | | | | 1.63 | % |
NOTE 14 - EMPLOYEE BENEFIT PLANS
The Bank has adopted an integrated profit sharing plan, which allows for elective deferrals and non-elective contributions. Employees participate in the profit sharing plan following completion of six (6) months of service and upon reaching the age of twenty years and six months as of January 1. Vesting is based on years of service to the Bank, with a year being any year an employee works a minimum of 1,000 hours.
CARTER BANK & TRUST
NOTES TO CONSOLIDATED FINANCIAL STATEMENTS (continued)
The following table details the vesting schedule based on years of service for participants:
| 1 Year of Service | | | | 0% Vested | |
| 2 Years of Service | | | | 20% Vested | |
| 3 Years of Service | | | | 40% Vested | |
| 4 Years of Service | | | | 60% Vested | |
| 5 Years of Service | | | | 100% Vested | |
Any participant who has reached the age of 62 is fully vested regardless of length of service. Each participant in the plan (who has not reached age 62) becomes 100% vested after five (5) years of service. The non-elective contribution to the plan is determined each year by the Board of Directors and thus may fluctuate in amount from year to year. The contribution by the Bank, which includes contributions to the non-qualified plan discussed below, was $1.4 million in 2019, $1.7 million in 2018, and zero in 2017. These amounts are included in salaries and employee benefits in the Consolidated Statements of Income (Loss).
Beginning in 2019, our integrated profit sharing plan includes a Bank match based upon an employee’s elective deferral. This elective deferral is subject to dollar limits announced annually by the Internal Revenue Service (“IRS”). Elective deferrals are matched equal to 100% of the first 3% deferred and 50% of the next 2%, producing a maximum 4% match. Expense for this deferral match was $1.1 million for the year ended December 31, 2019. There was no expense for the calendar years ended 2018 or 2017.
Carter Bank & Trust (the “Bank”) entered into a Non-Qualified Profit Sharing Plan originally on December 30, 1996, which was subsequently amended and restated effective December 20, 2007. The purpose of the Plan was to provide additional benefits to be paid to the Executive upon the occurrence of a Distributable Event, which is either termination or death. The Board of the Bank approved the amended plan on December 20, 2007. Since inception of the Plan, the Bank’s former Chairman and Chief Executive Officer was the only Executive who participated in the Plan. In April 2017, a distributable event occurred, in which distributions will occur over 45 quarterly payments. The value of the plan was $1.1 million as of December 31, 2019, and was solely comprised of cash. The quarterly distributions began on January 1, 2018 and will continue to be paid out in equal quarterly installments approximating $30 thousand.
NOTE 15 – INCENTIVE AND RESTRICTED STOCK PLAN
The Board of Directors of the Bank adopted the Carter Bank & Trust 2018 Omnibus Equity Incentive Plan (the “Plan”) on March 29, 2018 based on the recommendation of the Nominating and Compensation Committee (the “Committee”). The Plan became effective on June 27, 2018 and reserves 2,000,000 shares of common stock for issuance. The Plan provides for the grant to key employees and non-employee directors of awards that may include one or more of the following: stock options, restricted stock, restricted stock units, stock appreciation rights, stock awards, performance units and performance cash awards (collectively, the “awards”). Subject to accelerated vesting under certain circumstances, the Plan requires a minimum vesting period of one year for awards subject to time-based conditions and a minimum performance period of one year for awards subject to achievement or satisfaction of performance goals. These minimums are applicable to awards other than those granted as part of a retainer for the service of non-employee directors. The Committee will set the vesting period on the awards. No awards may be granted under the Plan more than ten years from the effective date of the Plan.
CARTER BANK & TRUST
NOTES TO CONSOLIDATED FINANCIAL STATEMENTS (continued)
Restricted Stock
The Bank periodically issues restricted stock to non-employee directors, executive officers and employees pursuant to our Plan. As of December 31, 2019, 76,871 restricted shares have been granted under the Plan and 403 restricted shares have been forfeited.
The Bank granted 47,309 and 12,413 restricted shares of common stock to key personnel under the Plan during the years ended 2019 and 2018, respectively. These grants were approved by the Committee as compensation for substantial contributions to Bank performance, including contribution during our recent core systems conversion. These key personnel restricted shares fully vest three years after the grant date. The closing price of our stock was used to determine the fair value on the date of the grant.
During 2019, there were 17,149 restricted shares of common stock issued to non-employee directors under the Plan. During 2018, there were no restricted shares of common stock issued to non-employee directors under the Plan. These grants were approved by the Committee as compensation for Bank performance. These restricted shares were originally approved to fully vest three years after the grant date. However, the Committee approved accelerated vesting of these non-employee director restricted shares in January 2020 to fully vest one year after the grant date. The closing price of our stock was used to determine the fair value on the date of the grant.
If any award granted under this Plan terminates, expires, or lapses for any reason other than by virtue of exercise or settlement of the award, or if shares issued pursuant to awards are forfeited, any stock subject to such award again shall be available for future awards under the Plan.
Compensation expense for restricted shares of stock is recognized ratably over the period of service, generally the entire vesting period, based on fair value on the grant date. The Bank recognized compensation expense of $381 thousand $9 thousand for the years ended 2019 and 2018, respectively.
As of December 31, 2019 and 2018, there was $946 thousand and $213 thousand, respectively, of total unrecognized compensation cost related to restricted stock that will be recognized as compensation expense over a weighted average period of 2.13 years and 2.88 years, respectively.
The following table provides information about restricted stock granted under the Plan for the years ended December 31:
| | | | | | | Weighted Average | |
| | | | Restricted Shares | | | Grant Date Fair Value | |
| Non-vested at December 31, 2017 | | | | - | | | $ | - | |
| Granted | | | | 12,413 | | | | 17.86 | |
| Vested | | | | - | | | | - | |
| Forfeited | | | | - | | | | - | |
| Non-vested at December 31, 2018 | | | | 12,413 | | | | 17.86 | |
| Granted | | | | 64,458 | | | | 17.39 | |
| Vested | | | | (3,995 | ) | | | 17.86 | |
| Forfeited | | | | (403 | ) | | | 17.86 | |
| Non-vested at December 31, 2019 | | | | 72,473 | | | $ | 17.44 | |
CARTER BANK & TRUST
NOTES TO CONSOLIDATED FINANCIAL STATEMENTS (continued)
NOTE 16 - FEDERAL AND STATE INCOME TAXES
The components of the provision (benefit) for income tax expense were as follows:
| (Dollars in Thousands) | | 2019 | | | 2018 | | | 2017 | |
| Current | | $ | 1,285 | | | $ | (2,447 | ) | | $ | (7,160 | ) |
| Deferred | | | (76 | ) | | | 4,850 | | | | (10,371 | ) |
| Income Tax Provision (Benefit) | | $ | 1,209 | | | $ | 2,403 | | | $ | (17,531 | ) |
The following is a reconciliation of the differences between the provision (benefit) for income taxes and the amount computed by applying the statutory federal income tax rate (21% for the years ended December 31, 2019 and 2018 and 35% for the year ended December 31, 2017) to income before taxes:
| | | 2019 | | | 2018 | | | 2017 | |
| (Dollars in Thousands) | | Amount | | | Percent | | | Amount | | | Percent | | | Amount | | | Percent | |
| Federal Income Tax at Statutory Rate | | $ | 5,835 | | | | 21.0 | % | | $ | 3,006 | | | | 21.0 | % | | $ | (6,374 | ) | | | 35.0 | % |
| State Income Tax, net of Federal Benefit | | | 220 | | | | 0.8 | % | | | 190 | | | | 1.3 | % | | | - | | | | 0.0 | % |
| Tax-exempt Interest, net of Disallowance | | | (2,128 | ) | | | (7.7 | )% | | | (2,629 | ) | | | (18.4 | )% | | | (5,173 | ) | | | 28.4 | % |
| Federal Tax Credits, net of Basis Reduction | | | (2,032 | ) | | | (7.3 | )% | | | (1,375 | ) | | | (9.6 | )% | | | (5,868 | ) | | | 32.2 | % |
| Change in Valuation Allowance (excluding the effect of the Act) | | | (424 | ) | | | (1.5 | )% | | | (384 | ) | | | (2.7 | )% | | | 3,010 | | | | (16.5 | )% |
| Income from Bank Owned Life Insurance | | | (302 | ) | | | (1.1 | )% | | | (244 | ) | | | (1.7 | )% | | | - | | | | 0.0 | % |
| Enactment of Federal Tax Reform | | | - | | | | 0.0 | % | | | - | | | | 0.0 | % | | | 2,798 | | | | (15.4 | )% |
| True-up of Book and Tax Basis Differences | | | 8 | | | | 0.0 | % | | | 3,742 | | | | 26.1 | % | | | (5,206 | ) | | | 28.6 | % |
| Other | | | 32 | | | | 0.2 | % | | | 97 | | | | 0.8 | % | | | (718 | ) | | | 4.0 | % |
| Income Tax Provision (Benefit) and Effective Income Tax Rate | | $ | 1,209 | | | | 4.4 | % | | $ | 2,403 | | | | 16.8 | % | | | (17,531 | ) | | | 96.3 | % |
On December 22, 2017, H.R.1, commonly known as the Tax Cuts and Jobs Act (the “Act”), was signed into law. The Act includes many provisions that will affect our income tax expense, including reducing our federal tax rate from 35% to 21% effective January 1, 2018. As a result of the rate reduction, we are required to re-measure, through income tax expense in the period of enactment, our deferred tax assets and liabilities using the enacted rate at which we expect them to be recovered or settled. The re-measurement of our net deferred tax asset resulted in additional income tax expense of $2.8 million in 2017.
Also on December 22, 2017, the U.S. Securities and Exchange Commission (“SEC”) released Staff Accounting Bulletin No. 118 (“SAB 118”) to address any uncertainty or diversity of views in practice in accounting for the income tax effects of the Act in situations where a registrant does not have the necessary information available, prepared, or analyzed in reasonable detail to complete this accounting in the reporting period that includes the enactment date. SAB 118 allowed for a measurement period not to extend beyond one year from the Act’s enactment date to complete the necessary accounting.
We recorded provisional amounts of deferred income taxes using reasonable estimates in one area where information necessary to complete the accounting was not available, prepared, or analyzed. Our deferred tax asset for temporary differences associated with equity investments in partnerships was awaiting receipt of Schedules K-1 from outside preparers, which was necessary to determine our 2017 tax impact from these investments.
CARTER BANK & TRUST
NOTES TO CONSOLIDATED FINANCIAL STATEMENTS (continued)
We completed and recorded the income tax effects of these provisional items during the third quarter of 2018 when the information became available.
Realization of deferred tax assets is dependent upon the generation of future taxable income. A valuation allowance is provided when it is more likely than not that some portion of the deferred tax assets will not be realized. In assessing the need for a valuation allowance, management considers the scheduled reversal of the deferred tax liabilities and the projected future taxable income over the periods in which the temporary differences comprising the deferred tax assets will be deductible. Based on its assessment, management recorded a valuation allowance on deferred tax assets related to its equity investments in partnerships that will generate capital losses upon exiting the investments. The Bank has not identified prudent and feasible strategies to generate future capital gains to offset the capital losses. Management has determined that it is more likely than not that all other deferred tax assets will be realized in future periods so no additional valuation allowance is necessary at December 31, 2019 and 2018.
Deferred income taxes reflect the net tax effects of temporary differences between the carrying amounts of assets and liabilities for financial reporting purposes and the amount used for income tax purposes. Significant components of the Bank’s deferred tax assets and liabilities are as follows:
| (Dollars in Thousands) | | | | | | |
| Deferred Tax Assets | | 2019 | | | 2018 | |
| Allowance for Loan Losses | | $ | 8,301 | | | $ | 8,389 | |
| Net Unrealized Loss on Available-for-Sale Securities | | | - | | | | 2,676 | |
| Acquisition-Related Fair Value Adjustments | | | - | | | | - | |
| Valuation Adjustments on Other Real Estate Owned | | | 1,556 | | | | 1,225 | |
| Tax Credit Carryforwards | | | 5,120 | | | | 3,004 | |
| Equity Investment in Partnerships | | | 1,212 | | | | 1,187 | |
| Accrued Interest on Nonaccrual Loans | | | 889 | | | | - | |
| Operating Lease Liabilities | | | 323 | | | | - | |
| Other | | | 1,280 | | | | 1,351 | |
| Gross Deferred Tax Assets | | | 18,681 | | | | 17,832 | |
| Less: Valuation Allowance | | | (1,212 | ) | | | (1,636 | ) |
| Total Deferred Tax Assets | | $ | 17,469 | | | $ | 16,196 | |
| Deferred Tax Liabilities | | 2019 | | | 2018 | |
| Fixed Asset Depreciation | | $ | (5,715 | ) | | $ | (2,616 | ) |
| Acquisition-Related Fair Value Adjustments | | | (4,386 | ) | | | (5,018 | ) |
| Deferred Loan Income | | | (1,088 | ) | | | - | |
| Operating Lease Right-of-Use Assets | | | (263 | ) | | | - | |
| Net Unrealized Gain on Available-for-Sale Securities | | | (34 | ) | | | - | |
| Other | | | (55 | ) | | | - | |
| Total Deferred Tax Liabilities | | | (11,541 | ) | | | (7,634 | ) |
| Net Deferred Tax Assets | | $ | 5,928 | | | $ | 8,562 | |
The Bank had federal tax credit carryforward of $5.1 million at December 31, 2019 and $3.0 million at December 31, 2018. The federal tax credits consist primarily of new markets credits and historic rehabilitation credits that, if not used, will expire from 2037 to 2039.
CARTER BANK & TRUST
NOTES TO CONSOLIDATED FINANCIAL STATEMENTS (continued)
At December 31, 2019 and 2018, the Bank had no ASC 740-10 unrecognized tax benefits or accrued interest and penalties recorded. The Bank does not expect the total amount of unrecognized tax benefits to significantly increase within the next twelve months. The Bank recognizes interest and penalties on unrecognized tax benefits in income tax expense.
The Bank is subject to U.S. federal income tax as well as various other state and local jurisdictions. The Bank is generally no longer subject to examination by federal, state and local taxing authorities for years prior to December 31, 2013.
NOTE 17 - OFF BALANCE SHEET ACTIVITIES AND COMMITMENTS
Commitments to extend credit, which amounted to $488.9 million at December 31, 2019 and $387.7 million at December 31, 2018, represent agreements to lend to customers with fixed expiration dates or other termination clauses. Since many of the commitments are expected to expire without being funded, the total commitment amounts do not necessarily represent future liquidity requirements. Standby letters of credit are conditional commitments issued by the Bank guaranteeing the performance of a customer to a third party. Those guarantees are primarily issued to support public and private borrowing arrangements. The Bank had outstanding letters of credit totaling $39.5 million in 2019 and $34.3 million in 2018.
Our exposure to credit loss in the event of nonperformance by the other party to the financial instrument for commitments to extend credit and standby letters of credit is represented by the contractual amount of those instruments. The Bank uses the same credit policies in making commitments and unconditional obligations as it does for on balance sheet instruments. Unless noted otherwise, collateral or other security is required to support financial instruments with credit risk.
Our allowance for unfunded commitments is determined using a methodology similar to that used to determine the ALL. Amounts are added to the allowance for unfunded commitments through a charge to current earnings in noninterest expense. The balance in the allowance for unfunded commitments was $0.4 million and $0.3 million at December 31, 2019 and 2018, respectively. The allowance for unfunded commitments in included in other liabilities in the Consolidated Balance Sheets. The reserve is calculated by applying historical loss rates to our unfunded commitments.
NOTE 18 – REVENUE FROM CONTRACTS WITH CUSTOMERS
Topic 606 does not apply to revenue associated with financial instruments, including revenue from loans and securities. In addition, certain noninterest income streams such as fees associated with mortgage servicing rights, financial guarantees, derivatives, and certain credit card fees are also not in scope of the new guidance. Topic 606 is applicable to noninterest revenue streams such as trust and asset management income, deposit related fees, interchange fees, merchant income, and annuity and insurance commissions and return on investment. However, the recognition of these revenue streams did not change significantly upon adoption of Topic 606. Substantially all of the Bank’s revenue is generated from contracts with customers. Noninterest revenue streams in-scope of Topic 606 are discussed below.
CARTER BANK & TRUST
NOTES TO CONSOLIDATED FINANCIAL STATEMENTS (continued)
Service Charges on Deposit Accounts: Service charges on deposit accounts consist of overdraft fees, service charges on returned checks, stop payment fees, check chargeback fees, minimum balance fees, and other deposit account related fees. Overdraft fees are recognized at the point in time that the overdraft occurs. Service charges on returned checks are recognized at the point in time that a check is returned. Transaction-based fees, which include services such as stop payment fees, check chargeback fees, and other deposit account related fees are recognized at the point in time the Bank fulfills the customer’s request. Minimum balance fees are system-assessed at the point in time that a customer’s balance is below the required minimum for the product. Service charges on deposits are withdrawn from the customer’s account balance.
Other Fees and Other Income: Other fees and other income consists of safe deposit rents, money order fees, check cashing and cashiers’ check fees, wire transfer fees, letter of credit fees, check order income, and other miscellaneous fees. These fees are largely transaction-based; therefore, the Bank’s performance obligation is satisfied and the resultant revenue is recognized at the point in time the service is rendered. Payments for transaction-based fees are generally received immediately or in the following month by a direct charge to a customer’s account.
Debit Card Interchange Fees: The Bank earns interchange fees from debit cardholder transactions conducted through a card payment network. Interchange fees from cardholder transactions represent a percentage of the underlying transaction value and are recognized daily, concurrently with the transaction processing services provided to the cardholder.
Insurance: Commission income is earned based on customer transactions. The commission income is recognized when the transaction is complete. The Bank also receives a return on its investment in Bankers Insurance, LLC on an annual basis based on the income of the insurance company and percentage of ownership.
OREO Income: The Bank owns properties acquired through foreclosure that are included in other real estate owned, net on the Consolidated Balance Sheet. If the Bank rents any of those properties, the resultant income is recognized at the point of receipt since the performance obligation has been satisfied. The rents are generally received monthly.
Gains/Losses on Sales of OREO: The Bank records a gain or loss from the sale of OREO when control of the property transfers to the buyer, which generally occurs at the time of an executed deed. When the Bank finances the sale of OREO to the buyer, the Bank assesses whether the buyer is committed to perform their obligations under the contract and whether collectability of the transaction price is probable. Once these criteria are met, the OREO asset is derecognized and the gain or loss on sale is recorded upon the transfer of control of the property to the buyer. In determining the gain or loss on the sale, the Bank adjusts the transaction price and related gain (loss) on sale if a significant financing component is present.
CARTER BANK & TRUST
NOTES TO CONSOLIDATED FINANCIAL STATEMENTS (continued)
The following table summarizes the point of revenue recognition and the income recognized for each of the revenue streams for the years ended December 31:
| | | Point of Revenue | | | | | | |
| (Dollars in Thousands) | | Recognition | | 2019 | | | 2018 | |
| In-Scope Revenue Streams | | | | | | | | | | |
| Service Charges on Deposit Accounts | | At a point in time | | $ | 3,919 | | | $ | 3,127 | |
| Other Fees and Other Income | | At a point in time | | | 1,842 | | | | 1,756 | |
| Debit Card Interchange Fees | | At a point in time | | | 5,160 | | | | 4,750 | |
| Insurance | | | | | | | | | | |
| Customer Commissions | | At a point in time | | | 120 | | | | 625 | |
| Annual Commission on Investment | | Over time | | | 1,105 | | | | 1,230 | |
| Other Real Estate Owned Income | | At a point in time | | | 689 | | | | 2,692 | |
| Gains (Losses) on Sales of Other Real Estate Owned | | At a point in time | | | *** | | | | *** | |
| Total In-Scope Revenue Streams | | | | | 12,835 | | | | 14,180 | |
| | | | | | | | | | | |
| Out of Scope Revenue Streams | | | | | | | | | | |
| Gain on Sales of Securities, net | | | | | 2,205 | | | | 1,271 | |
| Bank Owned Life Insurance Income | | | | | 1,436 | | | | 1,161 | |
| Other | | | | | 394 | | | | 374 | |
| Total Noninterest Income | | | | $ | 16,870 | | | $ | 16,986 | |
***Reported net with Losses on Sales and Write-downs of Other Real Owned in Noninterest Expense
NOTE 19 - CAPITAL ADEQUACY
The Bank is subject to capital regulations in accordance with Basel III, as administered by banking regulators. Regulatory agencies measure capital adequacy within a framework that makes capital requirements, in part, dependent on the individual risk profiles of financial institutions. Failure to meet minimum capital requirements can initiate certain mandatory and possibly additional discretionary actions by regulators that, if undertaken, could have a direct material effect on the Bank’s financial statements. The Bank must meet specific capital guidelines that involve quantitative measures of the Bank’s assets, liabilities and certain off-balance sheet items, as calculated under regulatory accounting practices. The capital amounts and classification are also subject to qualitative judgments by the regulators about components, risk weightings and other factors. The final rules implementing Basel Committee on Banking Supervision’s capital guidelines for U.S. Banks (“Basel III rules”) became effective for the Bank on January 1, 2015 with full compliance with all of the requirements being phased in over a multi-year schedule, and fully phased in by January 1, 2019. Under the Basel III rules, the Bank must hold a capital conservation buffer above the adequately capitalized risk-based capital ratios. The capital conservation buffer was phased in at the rate of 0.625% per year and was 2.5% on January 1, 2019. Management believes as of December 31, 2019, the Bank meets all capital adequacy requirements to which it is subject.
Prompt corrective action regulations provide five classifications: well capitalized, adequately capitalized, undercapitalized, significantly undercapitalized, and critically undercapitalized, although these terms are not used to represent overall financial condition. If adequately capitalized, regulatory approval is required to accept brokered deposits. If undercapitalized, capital distributions are limited, as is asset growth and expansion, and capital restoration plans are required. At year-end 2019 and 2018, the most recent regulatory notifications categorized the Bank as well- capitalized under the regulatory framework for prompt corrective action. There are no conditions or events since that notification that management believes have changed the institutions category.
CARTER BANK & TRUST
NOTES TO CONSOLIDATED FINANCIAL STATEMENTS (continued)
| | | | | | Well- | | | December 31, 2019 | | | December 31, 2018 | |
| (Dollars in Thousands) | | Minimum
Value (1) | | | Capitalized
(2) | | | Amount | | | Ratio | | | Minimum
Amount (1) | | | Amount | | | Ratio | | | Minimum
Amount (1) | |
| Tier 1 Leverage Ratio | | | 4.00 | % | | | 5.00 | % | | $ | 410,793 | | | | 10.33 | % | | | 158,993 | | | $ | 384,088 | | | | 9.61 | % | | $ | 159,811 | |
| Common Equity Tier 1 Capital Ratio | | | 4.50 | % | | | 6.50 | % | | | 410,793 | | | | 13.46 | % | | | 137,333 | | | | 384,088 | | | | 13.86 | % | | | 124,707 | |
| Tier 1 Capital Ratio | | | 6.00 | % | | | 8.00 | % | | | 410,793 | | | | 13.46 | % | | | 183,110 | | | | 384,088 | | | | 13.86 | % | | | 166,277 | |
| Total Risk-Based Capital Ratio | | | 8.00 | % | | | 10.00 | % | | | 448,953 | | | | 14.71 | % | | | 244,147 | | | | 418,789 | | | | 15.11 | % | | | 221,702 | |
(1) Minimum requirements to remain adequately capitalized.
(2) Well-capitalized under prompt corrective action regulations.
NOTE 20 - QUARTERLY FINANCIAL DATA (Unaudited)
The following summarizes the quarterly results of operations for the years ended December 31:
| (Dollars in Thousands) | | First | | | Second | | | Third | | | Fourth | |
| 2019 | | Quarter | | | Quarter | | | Quarter | | | Quarter | |
| Total Interest Income | | $ | 39,139 | | | $ | 40,068 | | | $ | 40,154 | | | $ | 39,759 | |
| Total Interest Expense | | | 11,243 | | | | 12,113 | | | | 12,084 | | | | 11,333 | |
| Net Interest Income | | | 27,896 | | | | 27,955 | | | | 28,070 | | | | 28,426 | |
| Provision for Loan Losses | | | 1,627 | | | | 1,369 | | | | 1,390 | | | | (982 | ) |
| Net Interest Income after Provision for Loan Losses | | | 26,269 | | | | 26,586 | | | | 26,680 | | | | 29,408 | |
| Total Non-Interest Income | | | 3,804 | | | | 4,579 | | | | 4,156 | | | | 4,509 | |
| Total Non-Interest Expense | | | 22,110 | | | | 22,834 | | | | 22,777 | | | | 30,486 | |
| Income Before Income Taxes | | | 7,963 | | | | 8,331 | | | | 8,059 | | | | 3,431 | |
| Income Tax Expense (Benefit) | | | 422 | | | | 504 | | | | 458 | | | | (175 | ) |
| Net Income | | $ | 7,541 | | | $ | 7,827 | | | $ | 7,601 | | | $ | 3,606 | |
| Earnings Per Share | | $ | 0.29 | | | $ | 0.30 | | | $ | 0.29 | | | $ | 0.14 | |
| (Dollars in Thousands) | | First | | | Second | | | Third | | | Fourth | |
| 2018 | | Quarter | | | Quarter | | | Quarter | | | Quarter | |
| Total Interest Income | | $ | 35,588 | | | $ | 38,362 | | | $ | 38,207 | | | $ | 39,862 | |
| Total Interest Expense | | | 8,151 | | | | 9,111 | | | | 10,079 | | | | 10,773 | |
| Net Interest Income | | | 27,437 | | | | 29,251 | | | | 28,128 | | | | 29,089 | |
| Provision for Loan Losses | | | 1,515 | | | | 1,730 | | | | 13,743 | | | | (118 | ) |
| Net Interest Income after Provision for Loan Losses | | | 25,922 | | | | 27,521 | | | | 14,385 | | | | 29,207 | |
| Total Non-Interest Income | | | 4,731 | | | | 4,741 | | | | 4,610 | | | | 3,832 | |
| Total Non-Interest Expense | | | 22,559 | | | | 23,022 | | | | 25,360 | | | | 29,700 | |
| Income (Loss) Before Income Taxes | | | 8,094 | | | | 9,240 | | | | (6,365 | ) | | | 3,339 | |
| Income Tax (Benefit) Expense | | | (735 | ) | | | 2,041 | | | | 1,164 | | | | (67 | ) |
| Net Income (Loss) | | $ | 8,829 | | | $ | 7,199 | | | $ | (7,529 | ) | | $ | 3,406 | |
| Earnings (Loss) Per Share | | $ | 0.34 | | | $ | 0.27 | | | $ | (0.29 | ) | | $ | 0.13 | |
CARTER BANK & TRUST
NOTES TO CONSOLIDATED FINANCIAL STATEMENTS (continued)
| (Dollars in Thousands) | | First | | | Second | | | Third | | | Fourth | |
| 2017 | | Quarter | | | Quarter | | | Quarter | | | Quarter | |
| Total Interest Income | | $ | 36,353 | | | $ | 36,084 | | | $ | 35,050 | | | $ | 36,597 | |
| Total Interest Expense | | | 9,844 | | | | 9,476 | | | | 9,122 | | | | 8,669 | |
| Net Interest Income | | | 26,509 | | | | 26,608 | | | | 25,928 | | | | 27,928 | |
| Provision for Loan Losses | | | 3,880 | | | | 12,742 | | | | 13,890 | | | | 12,685 | |
| Net Interest Income after Provision for Loan Losses | | | 22,629 | | | | 13,866 | | | | 12,038 | | | | 15,243 | |
| Total Non-Interest Income | | | 2,947 | | | | 2,521 | | | | 3,930 | | | | 3,436 | |
| Total Non-Interest Expense | | | 17,804 | | | | 20,605 | | | | 20,963 | | | | 35,450 | |
| Income (Loss) Before Income Taxes | | | 7,772 | | | | (4,218 | ) | | | (4,995 | ) | | | (16,771 | ) |
| Income Tax Expense (Benefit) | | | 1,470 | | | | (2,735 | ) | | | (4,566 | ) | | | (11,700 | ) |
| Net Income (Loss) | | $ | 6,302 | | | $ | (1,483 | ) | | $ | (429 | ) | | $ | (5,071 | ) |
| Earnings (Loss) Per Share | | $ | 0.24 | | | $ | (0.06 | ) | | $ | (0.02 | ) | | $ | (0.19 | ) |
NOTE 21 – SUBSEQUENT EVENT
In December 2019, in Wuhan, China, a novel strain of coronavirus causing a previously unknown disease (“COVID-19”) was reported in Wuhan, China. The World Health Organization (the “WHO”) declared the outbreak to constitute a Public Health Emergency of International Concern on January 30, 2020. Over the course of the first quarter of 2020, COVID-19 developed into a worldwide outbreak and, on March 11, 2020, the WHO characterized COVID-19 as a pandemic. On March 13, 2020, President Trump issued a proclamation declaring a national state of emergency in response to COVID-19. During the final two weeks of March 2020, the governors of multiple U.S. states, including Virginia, where the Bank has its principal place of business, and North Carolina, where the Bank has significant operations, issued stay-at-home orders that directed the closing of non-essential businesses and restricted public gatherings. The COVID-19 pandemic continues to grow in the Bank’s areas of operation, the United States and across the globe. The pandemic has severely disrupted supply chains and adversely affected production, demand, sales and employee productivity across a range of industries and dramatically increased unemployment in the Bank’s areas of operation and nationally. These events have affected the Bank’s operations in the first quarter of 2020 and are expected to impact the Bank’s financial results throughout fiscal year 2020. The extent of the impact of the COVID-19 pandemic on the Bank’s operational and financial performance will depend on certain developments, including the duration and spread of the outbreak, the impact on the Bank’s customers, employees and vendors and the nature and effect of past and future federal and state governmental and private sector responses to the pandemic, all of which are uncertain and cannot be predicted.
Future developments with respect to COVID-19 are highly uncertain and cannot be predicted and new information may emerge concerning the severity of the outbreak and the actions to contain the outbreak or treat its impact, among others. Other national health concerns, including the outbreak of other contagious diseases or pandemics may adversely affect us in the future.
In response to the COVID-19 pandemic, the Coronavirus Aid, Relief, and Economic Security Act (the “CARES Act”) was signed into law by President Trump on March 27, 2020. The CARES Act is an emergency stimulus measure providing assistance and relief in a variety of ways to certain individuals, businesses, and industries. The CARES Act established a $2 trillion economic stimulus package, including cash payments to individuals, supplemental unemployment insurance benefits and a $349 billion loan program administered through the U.S. Small Business Administration (“SBA”), referred to as the paycheck protection program (“PPP”). In addition to the general impact of COVID-19, certain provisions of the CARES act as well as other legislative and regulatory relief efforts are expected to have a material impact on our operation. It is impossible to determine the extent of these impacts at the date of this filing, we are disclosing potentially material items of which we are aware.
CARTER BANK & TRUST
NOTES TO CONSOLIDATED FINANCIAL STATEMENTS (continued)
Many of the CARES Act’s programs are dependent upon the direct involvement of U.S. financial institutions and will be implemented through rules and guidance adopted by federal departments and agencies, including the U.S. Department of the Treasury, the FDIC, the FRB and other federal bank regulatory authorities, including those with direct supervisory jurisdiction over the Bank.
Bank’s Response to COVID-19
Lending Operations
The Bank quickly responded to the pandemic and the CARES Act, offering the option of payment deferrals, participation in the PPP, fee waivers and other relief actions to customers. Banks have been identified as essential services and have remained open during the order. The Bank continues to serve its customers through modified hours in both the drive-ins and branch services via appointment. Every opportunity is being taken to protect both customers and employees through enhanced cleaning services, social distancing and personal protective equipment requirements for both. Approximately 20% of the Bank’s workforce is working remotely.
Under the CARES Act, PPP is an amendment to the Small Business Administration (“SBA”) 7-A loan program. The Bank recently became an approved SBA 7-A lender. PPP is a guaranteed, unsecured loan program created to fund certain payroll and operating costs of eligible businesses, organizations and self-employed persons during COVID-19. Initially, $349 billion were approved and designated for PPP in order for the SBA to guarantee 100% of collective loans made under the program to eligible small businesses, nonprofits, veteran’s organizations, and tribal businesses. The Bank participated in the initial round of funding though a referral relationship with a third-party, non-bank lender. When an additional $310 billion in funds were approved and designated for PPP, the Bank opted to stand up an internal, automated loan process utilizing its core system provider.
The FRB implemented a liquidity facility available to financial institutions participating in the PPP. We believe we have sufficient liquidity sources to fund all pending PPP loans and to continue to provide this important service to local businesses. These loans are fully guaranteed by the SBA and do not represent a credit risk.
The Bank is providing deferrals to customers under Section 4013 of the CARES Act. These deferrals typically provide deferrals of both principal and interest for up to 180 days. At the end of the deferral period, for loan terms, payments will be applied to accrued interest first and will resume principal payments once accrued interest is current. Deferred principal will be due at maturity. For interest only loans, such as lines of credit, deferred interest will be due at maturity.
 | | Crowe LLP Independent Member Crowe Global |
REPORT OF INDEPENDENT REGISTERED PUBLIC ACCOUNTING FIRM
Shareholders and the Board of Directors of Carter Bank & Trust
Martinsville, Virginia
Opinion on the Financial Statements
We have audited the accompanying consolidated balance sheet of Carter Bank & Trust (the "Bank") as of December 31, 2019, the related consolidated statements of income (loss), comprehensive income (loss), changes in shareholders’ equity, and cash flows for the year ended December 31, 2019, and the related notes (collectively referred to as the "financial statements"). In our opinion, the financial statements present fairly, in all material respects, the financial position of the Bank as of December 31, 2019, and the results of its operations and its cash flows for the year then ended December 31, 2019, in conformity with accounting principles generally accepted in the United States of America.
We also have audited, in accordance with the standards of the Public Company Accounting Oversight Board (United States) (“PCAOB”), the Bank’s internal control over financial reporting as of December 31, 2019, based on criteria established in Internal Control – Integrated Framework: (2013) issued by the Committee of Sponsoring Organizations of the Treadway Commission (COSO) and our report dated June 5, 2020 expressed an adverse opinion.
Basis for Opinion
These financial statements are the responsibility of the Bank's management. Our responsibility is to express an opinion on the Bank's financial statements based on our audit. We are a public accounting firm registered with the PCAOB and are required to be independent with respect to the Bank in accordance with the U.S. federal securities laws and the applicable rules and regulations of the Securities and Exchange Commission and the PCAOB.
We conducted our audit in accordance with the standards of the PCAOB. Those standards require that we plan and perform the audit to obtain reasonable assurance about whether the financial statements are free of material misstatement, whether due to error or fraud. Our audit included performing procedures to assess the risks of material misstatement of the financial statements, whether due to error or fraud, and performing procedures that respond to those risks. Such procedures included examining, on a test basis, evidence regarding the amounts and disclosures in the financial statements. Our audit also included evaluating the accounting principles used and significant estimates made by management, as well as evaluating the overall presentation of the financial statements. We believe that our audit provides a reasonable basis for our opinion.
| |  |
| | | Crowe LLP |
We have served as the Bank's auditor since 2019.
Washington, D.C.
June 5, 2020
| | Crowe LLP Independent Member Crowe Global |
REPORT OF INDEPENDENT REGISTERED PUBLIC ACCOUNTING FIRM
Shareholders and the Board of Directors of Carter Bank & Trust
Martinsville, Virginia
Opinion on Internal Control Over Financial Reporting
We have audited Carter Bank & Trust’s (the “Bank”) internal control over financial reporting as of December 31, 2019, based on criteria established in Internal Control – Integrated Framework: (2013) issued by the Committee of Sponsoring Organizations of the Treadway Commission (COSO). In our opinion, because of the effects of the material weakness discussed in the following paragraph, the Bank has not maintained, in all material respects, effective internal control over financial reporting as of December 31, 2019, based on criteria established in Internal Control – Integrated Framework: (2013) issued by COSO.
A material weakness is a deficiency, or a combination of deficiencies, in internal control over financial reporting, such that there is a reasonable possibility that a material misstatement of the bank’s annual or interim financial statements will not be prevented or detected on a timely basis. A material weakness related to ineffective control of the valuation and existence of complex collateral associated with two collateral-dependent impaired loans. The Bank relied on stale appraisal information in order to support the underlying assumptions and methodologies to determine fair value and existence of the complex collateral. The appraisals were incomplete and did not adequately support the valuation and existence of the complex collateral which was identified and included in Management’s Report on Internal Control over Financial Reporting.
We also have audited, in accordance with the standards of the Public Company Accounting Oversight Board (United States) (“PCAOB”), the consolidated balance sheet of the Bank as of December 31, 2019, the related consolidated statements of income (loss), comprehensive income (loss), changes in stockholders’ equity, and cash flows for the year ended December 31, 2019, and the related notes (collectively referred to as the "financial statements") and our report dated June 5, 2020 expressed an unqualified opinion. We considered the material weakness identified above in determining the nature, timing, and extent of audit procedures applied in our audit of the 2019 financial statements, and this report on Internal Control over Financial Reporting does not affect such report on the financial statements.
Basis for Opinion
The Bank’s management is responsible for maintaining effective internal control over financial reporting and for its assessment of the effectiveness of internal control over financial reporting, included in the accompanying Management’s Report on Internal Control over Financial Reporting. Our responsibility is to express an opinion on the Bank’s internal control over financial reporting based on our audit. We are a public accounting firm registered with the PCAOB and are required to be independent with respect to the Bank in accordance with the U.S. federal securities laws and the applicable rules and regulations of the Securities and Exchange Commission and the PCAOB.
We conducted our audit in accordance with the standards of the PCAOB. Those standards require that we plan and perform the audit to obtain reasonable assurance about whether effective internal control over financial reporting was maintained in all material respects. Our audit of internal control over financial reporting included obtaining an understanding of internal control over financial reporting, assessing the risk that a material weakness exists, and testing and evaluating the design and operating effectiveness of internal control based on the assessed risk. Our audit also included performing such other procedures as we considered necessary in the circumstances. We believe that our audit provides a reasonable basis for our opinion.
Definition and Limitations of Internal Control Over Financial Reporting
A company’s internal control over financial reporting is a process designed to provide reasonable assurance regarding the reliability of financial reporting and the preparation of financial statements for external purposes in accordance with generally accepted accounting principles. A company’s internal control over financial reporting includes those policies and procedures that (1) pertain to the maintenance of records that, in reasonable detail, accurately and fairly reflect the transactions and dispositions of the assets of the company; (2) provide reasonable assurance that transactions are recorded as necessary to permit preparation of financial statements in accordance with generally accepted accounting principles, and that receipts and expenditures of the company are being made only in accordance with authorizations of management and directors of the company; and (3) provide reasonable assurance regarding prevention or timely detection of unauthorized acquisition, use, or disposition of the company’s assets that could have a material effect on the financial statements.
Because of its inherent limitations, internal control over financial reporting may not prevent or detect misstatements. Also, projections of any evaluation of effectiveness to future periods are subject to the risk that controls may become inadequate because of changes in conditions, or that the degree of compliance with the policies or procedures may deteriorate.
| | |
| | | Crowe LLP |
Washington, D.C.
June 5, 2020

REPORT OF INDEPENDENT REGISTERED PUBLIC ACCOUNTING FIRM
To the Board of Directors and Shareholders
Carter Bank & Trust
Martinsville, Virginia
Opinion on the Financial Statements
We have audited the accompanying consolidated balance sheet of Carter Bank & Trust and subsidiaries’ (the “Bank”) as of December 31, 2018, the related consolidated statements of income (loss), comprehensive income, changes in shareholders' equity and cash flows for each of the two years in the period ended December 31, 2018, and the related notes to the consolidated financial statements (collectively, the financial statements). In our opinion, the financial statements present fairly, in all material respects, the financial position of the Bank as of December 31, 2018, and the results of its operations and its cash flows for each of the two years in the period ended December 31, 2018, in conformity with accounting principles generally accepted in the United States of America.
Basis for Opinion
These financial statements are the responsibility of the Bank’s management. Our responsibility is to express an opinion on the Bank’s financial statements based on our audits. We are a public accounting firm registered with the PCAOB and are required to be independent with respect to the Bank in accordance with U.S. federal securities laws and the applicable rules and regulations of the Securities and Exchange Commission and the PCAOB.
We conducted our audits in accordance with the standards of the PCAOB. Those standards require that we plan and perform the audits to obtain reasonable assurance about whether the financial statements are free of material misstatement, whether due to error or fraud. Our audits included performing procedures to assess the risks of material misstatement of the financial statements, whether due to error or fraud, and performing procedures that respond to those risks. Such procedures included examining, on a test basis, evidence regarding the amounts and disclosures in the financial statements. Our audits also included evaluating the accounting principles used and significant estimates made by management, as well as evaluating the overall presentation of the financial statements. We believe that our audits provide a reasonable basis for our opinion.
/s/ Yount, Hyde & Barbour, P.C.
Roanoke, Virginia
March 14, 2019
ITEM 9. CHANGES IN AND DISAGREEMENTS WITH ACCOUNTANTS ON ACCOUNTING AND FINANCIAL DISCLOSURES
None
ITEM 9A. CONTROLS AND PROCEDURES
Disclosure Controls and Procedures
Under the supervision and with the participation of Bank’s Chief Executive Officer (“CEO”) and Chief Financial Officer (“CFO”) (its principal executive officer and principal financial officer, respectively), management has evaluated the effectiveness of the design and operation of the Bank’s disclosure controls and procedures as of December 31, 2019. In designing and evaluating the disclosure controls and procedures, management recognizes that any controls and procedures, no matter how well designed and operated, can provide only reasonable assurance of achieving the desired control objectives.
We maintain disclosure controls and procedures that are designed to ensure that information required to be disclosed by us in the reports that we file or submit under the Securities Exchange Act of 1934, as amended, is recorded, processed, summarized and reported within the time periods required by the Securities and Exchange Commission, or the SEC, and that such information is accumulated and communicated to the Company’s management, including our CEO and CFO as appropriate, to allow timely decisions regarding required disclosure.
Management, with the participation of the Chief Executive Officer and its Chief Financial Officer, evaluated the effectiveness of the design and operation of the Bank’s disclosure controls and procedures as of December 31, 2019. Based on this evaluation, the Bank’s Chief Executive Officer and Chief Financial Officer have concluded, as of and for the end of the period covered by this report, that such disclosure controls and procedures were ineffective due to the Corporation’s late filing of its Annual Report on Form 10-K for the year ended December 31, 2019. The Corporation attributes the delay in the filing to the evaluation of collateral supporting one impaired loan relationship. The Bank’s evaluation of the collateral was dependent, in part, on the results of an independent appraisal regarding the collateral. Due to the effects of the COVID-19 pandemic, the process of obtaining the independent appraisal and evaluating the collateral was slowed, and, consequently, the Bank was unable to complete preparation of the Annual Report and file with the FDIC within the deadline prescribed by the SEC’s rules. We have since taken appropriate steps to remediate this deficiency in our disclosure controls and procedures.
Management’s Report on Internal Control over Financial Reporting
Our management is responsible for establishing and maintaining adequate internal control over financial reporting, (as defined in Exchange Act Rule 13a-15(f)). Our internal control over financial reporting is a process designed by or under the supervision of, our CEO and CFO to provide reasonable assurance to our management and Board of Directors regarding the reliability of financial reporting and the preparation of financial statements for external purposes in accordance with U.S. generally accepted accounting principles. A Bank’s internal control over financial reporting includes those policies and procedures that (i) pertain to the maintenance of records that, in reasonable detail, accurately and fairly reflect the transactions and dispositions of the assets of the Bank; (ii) provide reasonable assurance that transactions are recorded as necessary to permit preparation of financial statements in accordance with generally accepted accounting principles, and that receipts and expenditures of the Bank are being made only in accordance with authorizations of management and directors of the Bank; and (iii) provide reasonable assurance regarding prevention or timely detection of unauthorized acquisition, use, or disposition of the Bank’s assets that could have a material effect on the financial statements. Because of its inherent limitations, internal control over financial reporting may not prevent or detect misstatements. Also, projections of any evaluation of the effectiveness of specific controls or internal control over financial reporting overall to future periods are subject to the risk that controls may become inadequate because of changes in conditions or that the degree of compliance with the policies or procedures may deteriorate.
As of December 31, 2019, management including the CEO and CFO, assessed the effectiveness of the Bank’s internal control over financial reporting based on the criteria established in “Internal Control—Integrated Framework” issued by the Committee of Sponsoring Organizations of the Treadway Commission (“COSO”).
Based upon this assessment, management determined that, as of December 31, 2019, the control deficiency described in the following paragraph constituted a material weakness. A material weakness is a deficiency, or a combination of deficiencies, in internal control over financial reporting, such that there is a reasonable possibility that a material misstatement of the Bank’s annual or interim financial statements will not be prevented or detected on a timely basis.
As of December 31, 2019, we did not maintain effective controls over the completeness and accuracy of impaired loans, including calculations and supporting information. A material weakness existed related to ineffective control of the valuation and existence of unique, complex collateral associated with two collateral-dependent impaired loans that are part of the same relationship. The Bank relied on stale appraisal information in order to support the underlying assumptions and methodologies to determine fair value and existence of the complex collateral. The appraisals were incomplete and did not adequately support the valuation and existence of the complex, unique collateral.
As a result of this material weakness, we concluded that the Bank did not maintain effective internal control over financial reporting as of December 31, 2019, based on the criteria established in “Internal Control—Integrated Framework” issued by COSO.
Crowe LLP, our independent registered public accounting firm, has issued an adverse opinion on the effectiveness of Bank’s internal control over financial reporting as of December 31, 2019, which is included herein.
Plan for Remediation of Material Weakness that Existed as of December 31, 2019
Management is committed to continuing efforts to improve the design and operation of our internal controls, including taking all necessary steps to remediate the material weakness identified above. We are addressing the material weakness by defining expectations for validating assumptions accompanying appraisals and plan to test in 2020.
Changes in Internal Control Over Financial Reporting
Other than the material weakness which was identified as a result of an error that occurred during the quarter ended December 31, 2019, there have been no other changes in Bank’s internal control over financial reporting that occurred during the quarter ended December 31, 2019 that have materially affected, or are reasonably likely to materially affect, the Banks’s internal control over financial reporting.
ITEM 9B. OTHER INFORMATION
None.
PART III
ITEM 10. DIRECTORS, EXECUTIVE OFFICERS AND CORPORATE GOVERNANCE
DIRECTORS
The exact size of the Board of Directors shall be fixed by the Board of Directors prior to each annual meeting. As established in the Bylaws, the number of Directors shall at no time be less than 5 nor more than 30. On April 14, 2020, Director George W. Lester, II notified the Board of Directors of his decision to not stand for re-election to the Board of Directors at the 2020 Annual Meeting of Shareholders (the “Annual Meeting”). Mr. Lester will continue to serve as a member of the Board of Directors through the end of his current term, which ends at the Annual Meeting. The Board has approved decreasing the size of the Board of Directors from 13 to 12 Directors, effective as of the end of the Annual Meeting.
The Board of Directors is not aware of any family relationship between any Director, executive officer or person nominated by the Bank to become a Director; nor is the Board of Directors aware of any involvement in legal proceedings that would be material to an evaluation of the ability or integrity of any Director, executive officer or person nominated to become a Director.
The following paragraphs provide information regarding each Director’s specific experience, qualifications, attributes and skills that led to the conclusion that he or she should serve as a Director. We also believe that all of our Directors have a reputation for honesty and adherence to high ethical standards.
Michael R. Bird has more than 30 years of experience in the long-term care industry. He retired from Virginia Lutheran Homes Inc., which owns and operates a continuing care retirement community and nursing and rehabilitation center in Roanoke, Virginia and subsidized apartments with supportive services in New Market, Virginia, in April 2020 where he had held the position of Chief Financial Officer since May 2013. Prior to this, he served as Chief Financial Officer of Waveny LifeCare Network, a provider of long-term care, assisted living, independent living and home healthcare in New Canaan, Connecticut. He earned his Bachelor’s Degree in Accounting from Central Connecticut State University in New Britain, Connecticut and MBA from Sacred Heart University in Fairfield, Connecticut. Mr. Bird chairs the Board’s Audit and Compliance Committee as well as the CECL Committee and is a member of the Executive and Governance Committee. Mr. Bird was appointed to the Board of Directors of the Bank in January 2018. Mr. Bird is qualified to serve as a Director and Chair of the Audit and Compliance and CECL Committees due to his broad experience in finance and accounting.
Robert W. Conner is retired Clerk of Circuit Court of Halifax County. Mr. Conner is a long-time farmer in Halifax County. He also served as an organizing director of Community National Bank from 1985 until the merger into Carter Bank & Trust and as a director of Bank Building Corporation from 1995 until its merger with Carter Bank & Trust. He served as a director of CB&T Real Estate Holdings, Inc. from 2008 to 2016. Mr. Conner is a qualified candidate as a Director, as well as Chair of the Credit Risk Committee and as a member of the Nominating and Compensation Committee, due to his skills and knowledge of the business community.
Gregory W. Feldmann is President of Skyline Capital Strategies, LLC, a management consultancy group providing advisory services in the areas of corporate finance, private equity, business and financial strategy, mergers and acquisitions, and performance related studies. He is former President and Director of StellarOne Bank. Mr. Feldmann was appointed to the Board of Directors of the Bank in February 2017. Mr. Feldmann is qualified to serve as a Director and Chair of the Investment/Interest Rate Risk Committee, as well as the Nominating and Compensation Committee and is a member of the Executive and Governance Committee due to his business and banking background in commercial banking, investment banking and brokerage and private equity and experience in other executive and leadership roles, both in private and public companies.
Chester A. Gallimore is President of Wills Ridge Supply. He also served as an organizing director of Blue Ridge Bank, N. A. from 1978 until the merger into Carter Bank & Trust. Mr. Gallimore is a qualified candidate to serve on the Board, as well as the Audit and Compliance Committee, due to his strong business background, knowledge and service as a Director of the Bank and its predecessors for over 41 years.
Charles E. Hall is a farmer. He also served as an organizing director of Blue Ridge Bank, N.A. from 1978 until the merger into Carter Bank & Trust and of Bank Building Corporation since 1995 until its merger with Carter Bank & Trust. He served as a director of CB&T Real Estate Holdings, Inc. from 2008 to 2016. Mr. Hall is qualified to serve as a Director and as a member of the Credit Risk Committee due to his knowledge of the banking industry and the business community.
James W. Haskins is an attorney and principal in the law firm of Young, Haskins, Mann, Gregory and Wall, P. C., Martinsville, Virginia. He also served as a director of Mountain National Bank from 1996 until the merger into Carter Bank & Trust and of Patrick Henry National Bank from 1982 until the merger into Carter Bank & Trust. Mr. Haskins was appointed as Chairman of the Board of Directors in April 2017; prior to that appointment, he served as Vice Chairman of the Board. Mr. Haskins is qualified to serve on the Board as well as Chair of the Executive and Governance Committee, due to his legal expertise and his prominence in the Bank’s market area.
Phyllis Q. Karavatakis is Senior Executive Vice President for Special Projects of Carter Bank & Trust. Prior to serving in this role, she served as President and Chief Banking Officer. Prior to that role, she served as Executive Vice President and Chief Lending Officer and various other roles in her over 41 years employed with the Bank. Ms. Karavatakis was appointed to the Board of Directors of the Bank in February 2017 and was appointed Vice Chairman in April 2017. Ms. Karavatakis is qualified to serve as a Director and member of the Credit Risk Committee due to her business experience along with in-depth knowledge of the banking industry.
Lanny A. Kyle, O. D. is a retired Optometrist. He formerly was Owner and President of Piedmont Optometric Association. He also served as a director of Mountain National Bank from 2003 until the merger into Carter Bank & Trust. Dr. Kyle is qualified to serve as a Director and member of the Nominating and Compensation Committee due to his management and financial skills.
George W. Lester, II is Chairman of the Lester Group, Inc., a forest products company in Martinsville, Virginia. He also served as an organizing director of Patrick Henry National Bank from 1976 until the merger into Carter Bank & Trust and Shenandoah National Bank from 1996 until the merger into Carter Bank & Trust. He served as a director of CB&T Real Estate Holdings Inc. from 2008 to 2016. Mr. Lester is considered to be a qualified candidate to serve on the Board, as well as the Audit and Compliance Committee, due to his strong business background and knowledge, broad community development, and service as a Director of the Bank and its predecessors for over 43 years.
E. Warren Matthews is an attorney in the firm of Harris, Matthews & Crowder, P.C. He also served as a director of Community National Bank from 1998 until the merger into Carter Bank & Trust. Mr. Matthews is considered to be a qualified candidate for service on the Board, as well as the Audit and Compliance, Nominating and Compensation and CECL Committees, due to his legal expertise and his prominence in the Bank’s market area.
Catharine L. Midkiff worked for more than 20 years as an Executive with General Electric Capital Corporation in risk management, operations, and finance in its Asia, Europe, and United States markets. Prior to this, she served as Vice President and Director in other General Electric entities located in the United States, Japan, Korea, Thailand and Hong Kong. A Certified Public Accountant, Ms. Midkiff has a Bachelor’s Degree in Commerce with a specialization in Finance and Accounting from the University of Virginia. She is certified in Six Sigma as a master black belt, the highest level credential in management techniques to improve business processes, primarily by reducing risks, and has completed numerous specialty programs, such as an asset-based finance program from the University of Pennsylvania’s Wharton School and the Commercial Finance Association. Ms. Midkiff was appointed to the Board of Directors of the Bank in January 2018. Ms. Midkiff is qualified to serve as a Director and member of the Audit and Compliance, Investment/Interest Rate Risk, Credit Risk, Executive and Governance and CECL Committees due to her broad based experience in accounting, risk management and finance with executive roles in public companies.
Joseph E. Pigg is President of Stoneville Lumber Company Inc. and has been for more than five years. He also served as an organizing director of Patrick Henry National Bank from 1976 until the merger into Carter Bank & Trust and Shenandoah National Bank from 1996 until the merger into Carter Bank & Trust. His financial experience and prior service of over 43 years as a bank board member qualifies him to be a Director and member of the Investment/Interest Rate Risk Committee.
Litz H. Van Dyke is Chief Executive Officer of Carter Bank & Trust and previously served as Executive Vice President. Prior to joining Carter Bank & Trust in 2016, Mr. Van Dyke was a Practice Manager for CCG Catalyst Consulting Group based in Phoenix, Arizona, assisting banks with strategic advisory services. He served as Chief Operating Officer for StellarOne Corporation from 2008 to 2012. Mr. Van Dyke was appointed to the Board of Directors of the Bank in April 2017. Mr. Van Dyke is a qualified candidate as a Director and member of the Investment/Interest Rate Risk, Credit Risk and Executive and Governance Committees due to his prior experience in senior executive roles with a number of Virginia-based banking institutions with responsibilities including credit administration, regulatory risk management, information technology, operations, marketing, and facilities as well as extensive work with commercial, retail, and mortgage lines of business.
Independence and Committee Memberships
The following individuals are Directors of Carter Bank & Trust. Ages are given as of May 15, 2020:
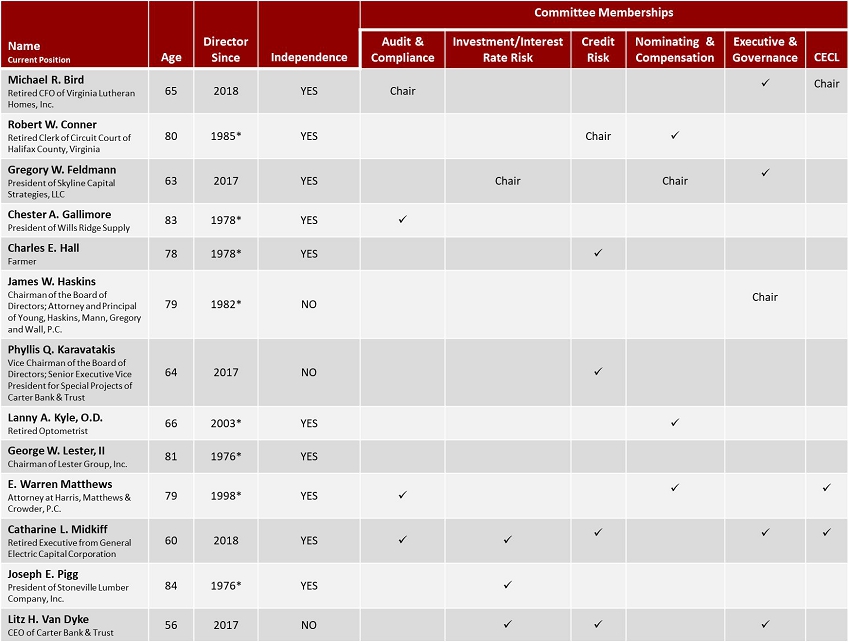
*Indicates year first served as a director of one of the 10 banking institutions that were merged into and created Carter Bank & Trust in 2006 (each a “Merged Bank” and collectively, the “Merged Banks”). The Merged Banks were Blue Ridge Bank, N.A., Central National Bank, Community National Bank, First National Bank, First National Exchange Bank, Mountain National Bank, Patrick Henry National Bank, Patriot Bank, N.A., Peoples National Bank and Shenandoah National Bank.
Information About Our Executive Officers
The following individuals are executive officers of Carter Bank & Trust. Ages are given as of May 15, 2020:
| Name | | Age | | Position | | Business Experience During Past Five Years |
| A. Loran Adams | | 59 | | Executive Vice President and Director of Regulatory Risk Management since 2018 | | Prior to 2018, Senior Vice President and Director of Regulatory Risk Management since 2017; prior to joining Carter Bank & Trust, Director of Internal Audit, Georgia Bank & Trust from 2009 to 2016. |
| Wendy S. Bell | | 56 | | Senior Executive Vice President and Chief Financial Officer since 2020 | | Executive Vice President and Chief Financial Officer from 2017 to 2019; prior to joining Carter Bank & Trust, Senior Vice President and Senior Finance Officer, First Commonwealth Financial Corporation from 2010 to 2017. |
| Jane Ann Davis | | 57 | | Executive Vice President and Chief Administrative Officer since 2017 | | Prior to 2017, Executive Vice President and Chief Financial Officer and Chief Operating Officer. |
| Tony E. Kallsen | | 52 | | Executive Vice President and Chief Credit Officer since 2018 | | Prior to joining Carter Bank & Trust, Senior Vice President and Senior Credit Officer, First Commonwealth Financial Corporation from 2010 to 2017. |
| Phyllis Q. Karavatakis | | 64 | | Senior Executive Vice President for Special Projects since 2020 | | Prior to 2020, President and Chief Banking Officer since 2017, President and Chief Administrative Officer since 2016, Executive Vice President and Chief Lending Officer since 2014. |
| Bradford N. Langs | | 54 | | President and Chief Strategy Officer since 2020 | | Prior to 2020, Executive Vice President and Chief Strategy Officer from 2017 to 2019; prior to joining Carter Bank & Trust, Chief Risk Officer, Chief Credit Officer and Treasurer, Coastal States Bank from 2009 to 2017. |
| Matthew M. Speare | | 53 | | Executive Vice President and Chief Information Officer since 2017 | | Prior to joining Carter Bank & Trust, Executive Vice President and Chief Information Officer, Regions Bank from 2013 to 2017. |
| Litz H. Van Dyke | | 56 | | Chief Executive Officer since 2017 | | Prior to 2017, Executive Vice President since July 2016; prior to joining Carter Bank & Trust, Practice Manager, CCG Catalyst Group from 2012 to 2016 and Chief Operating Officer, StellarOne Corporation from 2008 to 2012. |
DELINQUENT SECTION 16(a) REPORTS
Section 16(a) of the Securities Exchange Act of 1934, as amended (the “Exchange Act”) requires that Directors and executive officers, and persons who beneficially own more than 10% of the Bank’s equity securities, file reports of ownership and reports of changes in ownership of the Bank’s outstanding equity securities. Based on a review of these reports filed by the Bank’s officers and Directors, the Bank believes that its officers and Directors complied with all filing requirements under Section 16(a) of the Exchange Act during 2019, except that Mr. Adams, Ms. Bell, Ms. Davis, Mr. Kallsen, Ms. Karavatakis, Mr. Langs, Mr. Speare and Mr. Van Dyke each reported one transaction on a Form 4 late in relation to restricted stock awards. In addition, with respect to the Directors, Mr. Lester reported three transactions late on two Form 4s and Mr. Pigg reported one transaction late on a Form 4.
MEETINGS AND COMMITTEES OF THE BOARD OF DIRECTORS
The Board of Directors held twelve regular meetings during 2019. During 2019, each member of the Board of Directors attended at least 75% of the aggregate of: (1) the Bank’s Board meetings held during the period and (2) the number of meetings of all committees on which he or she served for the Bank.
The Board of Directors meets regularly once a month. Carter Bank & Trust has not adopted a formal policy on Board members’ attendance at annual meetings of shareholders, although all Board members are encouraged to attend. All Directors attended the 2019 Annual Meeting of Shareholders on June 26, 2019.
Carter Bank & Trust has created and designated a separate committee of its Board of Directors as the Audit and Compliance Committee. Current members of the Bank’s Audit and Compliance Committee are Messrs. Chester A. Gallimore, E. Warren Matthews, Michael R. Bird (Chairman) and Ms. Catharine Midkiff, each of whom is an Independent Director for this purpose according to Nasdaq listing standards and the regulations of the SEC. During 2019, each member of the Audit and Compliance Committee satisfied the independence requirements of the Nasdaq listing standards and the regulations of the SEC. The Audit and Compliance Committee engages the Bank’s independent registered public accounting firm, approves the scope of the independent registered public accounting firm’s audit, reviews the reports of examination by the applicable Bank regulatory agencies and the independent registered public accountant, and the internal auditor, and reports to the Board of Directors periodically. The Audit and Compliance Committee also provides oversight related to the internal audit function and the Chief Audit Executive. The Audit and Compliance Committee met five times during 2019. The Audit and Compliance Committee operates pursuant to a written charter that has been adopted by the Board and is reviewed periodically by the Audit and Compliance Committee for changes to recommend to the Board for approval. The charter is available on the Bank’s website at www.CBTCares.com under “Investor Relations”.
The Board of Directors has determined that Catharine L. Midkiff and Michael R. Bird each qualify as an “audit committee financial expert” within the meaning of applicable regulations of the SEC, promulgated pursuant to the Sarbanes-Oxley Act of 2002.
The Nominating and Compensation Committee consists of four Directors. The current members of the Committee are Chairman Gregory W. Feldmann, and Messrs. Robert W. Conner, Lanny A. Kyle, O.D and E. Warren Matthews. Each Director satisfies the independence requirements of the Nasdaq listing standards. During 2019, each member of the Nominating and Compensation Committee, except for Chairman James W. Haskins, satisfied the independence requirements of the Nasdaq listing standards. A company that lists its stock on Nasdaq in connection with transferring from a market that did not have substantially similar corporate governance requirements, such as the OTCQX on which Carter Bank & Trust was previously listed, is eligible to use applicable Nasdaq transition rules to phase in compliance with certain Nasdaq listing standards over a period of one year from the date of listing its stock on Nasdaq. The Bank relied on this phase-in period with respect to the independence of members of the Nominating and Compensation Committee and adjusted the composition of the committee such that all members satisfied the independence requirements of the Nasdaq listing standards by the end of the phase-in period. Additional information regarding the function of the Committee is provided on the prior page and in the “Compensation Discussion & Analysis” section.
The Nominating and Compensation Committee evaluates Director candidates and recommends to the Board of Directors nominees for election to the Board. The Board has no prescribed minimum qualifications for nominees and will consider recommendations to the Board from shareholders as appropriate. The Committee also administers the annual incentive plan discussed above along with the Carter Bank & Trust 2018 Omnibus Equity Incentive Plan (the “Equity Plan”) and grants equity awards under the plan. In addition to its compensation-related responsibilities, the Committee makes recommendations to the Board of Directors regarding individuals to be nominated to serve on the Board of Directors. The Nominating and Compensation Committee operates pursuant to a written charter, most recently approved by the Board of Directors on August 22, 2019. This charter is reviewed periodically by the Nominating and Compensation Committee for changes to recommend to the Board of Directors for approval. A copy of this charter can be found on the Bank’s website at www.CBTCares.com under “Investor”. The Nominating and Compensation Committee met 11 times during 2019.
Generally, nominees for Director are identified and suggested by the members of the Board or management using their business networks. The Board has not retained any executive search firms or other third parties to identify or evaluate Director candidates in the past and does not intend to in the near future. In evaluating candidates, the Nominating and Compensation Committee considers all appropriate factors, which may include high level leadership experience, knowledge of issues affecting the Bank, availability for meetings and consultation on Bank matters, strength of character, mature judgment, independence of thought and an ability to work collegially. The Nominating and Compensation Committee may also consider the extent to which a candidate would fill a present need on the Board.
Although the Bank has no formal policy regarding diversity, as a matter of practice in its evaluation of candidates, the Nominating and Compensation Committee, may consider whether the Board of Directors, as a whole, is diverse and includes individuals with various backgrounds, career experience, technical skills, industry knowledge and experience financial expertise and local or community ties.
The Board has not established any specific minimum qualifications that a candidate for Director must meet in order to be nominated for Board membership. Rather the Board will evaluate the mix of skills and experience that the candidate offers, consider how a given candidate meets the Board’s current expectations and needs and make a determination regarding whether a candidate should be nominated for election by the shareholders as a Director.
The Nominating and Compensation Committee will evaluate Director recommendations from shareholders if made in writing. Director candidates recommended by shareholders will be considered on the same basis as Director candidates referred from other sources. While there are no formal procedures for shareholders to submit Director candidate recommendations, written recommendations of Director candidates should include the name, address and telephone number of the recommended candidate, along with a brief statement of the candidate’s qualifications to serve as a Director. All such shareholder recommendations should be submitted to the Secretary of the Bank, c/o Executive Assistant, at the address provided on the first page of this Annual Report on Form 10-K, by January 31, 2021 in order to be considered by the Nominating and Compensation Committee, for the next annual election of directors. In addition, in accordance with the Bank’s Articles of Incorporation and/or Bylaws, nominations for election to the Board of Directors may be made by any shareholder of any outstanding class of capital stock of the Bank entitled to vote for the election of Directors. Notices of nominations, other than those made by or on behalf of the existing Board of Directors of the Bank, must be made in writing and be delivered to the Secretary of the Bank, c/o Executive Assistant, at the address provided on the first page of this Annual Report on Form 10-K, not less than 90 days or more than 120 days before the first anniversary of the prior year’s annual meeting; provided that if the annual meeting is changed by more than 30 days from the first anniversary of the prior year’s annual meeting, the notice must be delivered no earlier than 120 days before the annual meeting and no later than 90 days before the annual meeting or the tenth day after notice of the annual meeting was mailed.
Such notice shall contain the following information to the extent known to the notifying shareholder: (a) the name and address of each nominee; (b) the name and residence address of the notifying shareholder; (c) the number of shares of capital stock of the Bank owned by the notifying shareholder; (d) a description of all arrangements or understandings between the notifying shareholder and any other person or persons (including their names) in connection with the nomination and any material interest of the notifying shareholder in the nomination; (e) a brief description of the background and credentials of the person being nominated for Director including name, age, business address and residence address, principal occupation or employment, number of shares of capital stock of the Bank owned by the nominee; (f) any other information relating to such nominee required to be disclosed in solicitations of proxies for election of directors pursuant to Regulation 14A under the Exchange Act, including the nominee’s written consent to being named in the proxy statement as a nominee and to serving as a director if elected; and (g) a written representation and agreement by the notifying shareholder that the shareholder is not and will not become a party to any agreement, arrangement or understanding with any other party or shareholder regarding the nomination. Nominations not made in accordance with these requirements may, in his discretion, be disregarded by the chairman of the meeting, and upon his instructions, the judges of election may disregard all votes cast for each such nominee.
Code of Ethics
The Bank has adopted a Code of Ethics (the “Code”) that applies to its directors, executive officers and employees and is available on the Bank’s website at www.CBTCares.com under “Investor Relations.” The Bank intends to provide any required disclosure of any amendment to or waiver of the Code that applies to its principal executive officer, principal financial officer, principal accounting officer or controller, or persons performing similar functions, on www.CBTCares.com under “Investor Relations” promptly following the amendment or waiver. The Bank may elect to disclose any such amendment or waiver in a report on Form 8-K filed with the FDIC either in addition to or in lieu of the website disclosure. The information contained on or connected to the Bank’s website is not incorporated by reference in this report and should not be considered part of this or any other report that we file or furnish to the FDIC.
ITEM 11. EXECUTIVE COMPENSATION
EXECUTIVE COMPENSATION
Compensation Discussion & Analysis
The Bank’s compensation program is designed to offer competitive compensation to employees based on each individual’s contribution to the Bank’s overall success. As such, the program provides a competitive compensation package to attract and retain capable employees.
The compensation and benefits program consists of salary, annual incentive opportunity, equity compensation, a qualified profit sharing plan, life, health and disability insurance and limited perquisites. The Bank has a single health insurance plan for all officers and full-time employees who meet the eligibility requirements. There is also a group life insurance plan and short-term disability plan for officers and full-time employees. In 2017, the Bank entered into employee agreements with its named executive officers, which are further described under “Employment Agreements,” and in connection therewith granted phantom stock incentive awards to the named executive officers. Three of these agreements were amended in 2019 as described below.
The Nominating and Compensation Committee (formerly, the Nominating, Governance and Compensation Committee) (for purposes of this section, the “Committee”) has the responsibility for administering the Bank’s overall compensation program and for setting the salaries and incentive opportunities for the Bank’s senior officers. In setting the compensation of the Bank’s senior officers, the Committee generally relies on the recommendations of the Chairman and Chief Executive Officer and the Board members’ own significant personal knowledge of the compensation provided to other, similarly situated, executives in banking and other industries in the local area, as well as recommendations from the Committee’s independent compensation consultant, Pearl Meyer. Pearl Meyer annually recommends a peer group of financial institutions with reasonably similar market capitalization and business strategy to the Bank and conducts an external market study for the Nominating and Compensation Committee using the peer group to assess the competitiveness of current pay opportunities for our named executive officers. For 2019 compensation determinations, the peer companies consisted of twenty-seven regional U.S. commercial banks ranging in asset size from approximately $1.8 to $6.8 billion. As of December 31, 2018, the Bank had $4.0 billion in total assets versus the peer group median of $4.0 billion, and $394 million in market capitalization versus the peer group mean of $621 million. The following financial institutions were included in the 2019 peer group:
| American National Bankshares | Danville, VA |
| Summit Financial Group | Moorefield, WV |
| First Community Bancshares | Bluefield, VA |
| SmartFinancial | Knoxville, TN |
| Southern National Bancorp of Virginia | McLean, VA |
| Old Line Bancshares | Bowie, MD |
| Capital City Bank Group | Tallahassee, FL |
| First Bancshares | Hattiesburg, MS |
| CNB Financial | Clearfield, PA |
| Stock Yards Bancorp | Louisville, KY |
| HomeTrust Bancshares, Inc. | Asheville, NC |
| Bar Harbor Bankshares | Bar Harbor, ME |
| Carolina Financial Corporation | Charleston, SC |
| Peoples Bancorp | Marietta, OH |
| Community Trust Bancorp | Pikeville, KY |
| Franklin Financial Network | Franklin, TN |
| Bryn Mawr Bank | Bryn Mawr, PA |
| Great Southern Bancorp | Springfield, MO |
| City Holding | Charleston, WV |
| QCR Holdings | Moline, IL |
| Univest Financial | Souderton, PA |
| Washington Trust Bancorp | Westerly, RI |
| FB Financial Corporation | Nashville, TN |
| Republic Bancorp | Louisville, KY |
| First Bancorp (NC) | Troy, NC |
| Southside Bancshares | Tyler, TX |
| Seacoast Banking Corp of Florida | Stuart, FL |
In 2019, the Nominating and Compensation Committee engaged Pearl Meyer to assist in an evaluation of the competitiveness of the executive compensation program and to provide information on executive compensation at these peer banks, including market trends and developments in executive compensation. The Committee reviews each executive’s performance and contribution to the overall Bank goals, as well as recommendations of Pearl Meyer, in determining the level of salary and other compensation for the coming year. The Committee considers the peer data to ensure that the Bank’s compensation programs are competitive and close to the median of market practices of the peer companies, although for certain positions the Bank’s executive compensation remains below the median of the peer group.
When setting compensation for fiscal 2019 and in determining compensation policies, the Committee also took into account the results of the shareholder advisory vote on executive compensation that took place in June 2017. In that vote, which is advisory and non-binding, shareholders approved the compensation of our named executive officers as disclosed in the proxy statement for the 2017 Annual Meeting of Shareholders. A substantial majority (96%) of votes cast approved the executive compensation program described in the Bank’s proxy statement for the 2017 Annual Meeting of Shareholders. The vote results were taken into consideration when setting the compensation for 2019 and the new say-on-pay vote results will be taken into consideration by the Board when setting the compensation for 2020. The next advisory vote to approve executive compensation will occur at this Annual Meeting, as described above in Proposal 2, “Advisory Vote on Executive Compensation.”
The Committee established the compensation paid to the Bank’s non-employee directors in 2019; beginning in December 2019, however, the Committee reviews and recommends to the Board of Directors for approval the compensation of the Bank’s non-employee directors.
Analysis of Risk Associated with Compensation Policies and Practices
The Committee oversees an annual review of our compensation programs to determine whether such programs encourage excessive risk-taking by our employees. The most recent review was conducted in December 2019. Management and the Committee participated in the review, which included identification of the relevant compensation policies and practices, review of potential related risks, and analysis of risk-mitigating factors, including the Bank’s system of internal controls and oversight. The Committee determined that the potential risks arising from our compensation programs are not reasonably likely to have a material adverse effect on the Bank. In making this determination, the Committee took into account the structure of our compensation programs, the amount of cash compensation available to employees in the form of base salary, the involvement of the Committee in setting compensation for executive officers and in particular for those individuals who can commit the Bank’s capital or who manage the Company’s risk, and the oversight of the Board of Directors in monitoring certain risk tolerances and internal controls.
Employment Agreements
The Bank has entered into employment agreements with Mr. Van Dyke, Ms. Bell, Ms. Karavatakis, Mr. Speare and Mr. Langs. The terms of the agreements are substantially similar to each other as described below.
Van Dyke Employment Agreement
Mr. Van Dyke and the Bank entered into an employment agreement, dated as of September 29, 2017 (the “Van Dyke Agreement”), pursuant to which Mr. Van Dyke continues to serve as Chief Executive Officer of the Bank with an initial term of two years, beginning October 1, 2017. The employment term automatically renewed on October 1, 2019 and will automatically renew on each subsequent two-year anniversary for an additional two-year term unless either party provides at least 60 days’ advance notice of non-renewal.
Pursuant to the Van Dyke Agreement, Mr. Van Dyke’s initial annual base salary is $500,000, subject to increase by the Bank’s Board of Directors at its discretion. Mr. Van Dyke received a phantom stock award with an initial value of $150,000 to be settled in cash, which vests on the third anniversary of the grant date, subject to continued employment by Mr. Van Dyke. He also receives $700 per month as an automobile allowance. Mr. Van Dyke is eligible to participate in the Bank’s annual bonus plan, employee benefit plans and programs on terms offered to similarly situated employees.
The Bank may terminate Mr. Van Dyke’s employment with or without cause (as defined in the Van Dyke Agreement), with or without notice. Mr. Van Dyke also may voluntarily terminate his employment with the Bank at any time for Good Reason (as defined in the Van Dyke Agreement). In the event the Bank terminates Mr. Van Dyke’s employment without cause or Mr. Van Dyke terminates his employment for Good Reason, Mr. Van Dyke will receive any unpaid base salary, any annual bonus compensation earned and awarded but not yet paid, and any vested benefits (collectively, the “Accrued Obligations”). He will also receive a monthly severance payment equal to one-twelfth of his annual base salary for 18 months and continued employee health insurance coverage for 18 months. Payment of these severance benefits is subject to receipt by the Bank of a signed release and waiver of claims and satisfaction of other requirements, conditions, and limitations set forth in the Van Dyke Agreement, including covenants regarding confidentiality, non-competition, non-piracy and non-solicitation.
In the event the Bank terminates Mr. Van Dyke’s employment without cause or Mr. Van Dyke terminates his employment for Good Reason within two years after a Change of Control (as defined in the Van Dyke Agreement), Mr. Van Dyke will receive the Accrued Obligations, plus a lump sum severance payment equal to 2.99 times his annual base salary, continued employee health insurance coverage for 18 months and a lump sum payment equal to Mr. Van Dyke’s highest annual bonus earned from the Bank for the three years prior to termination. The Van Dyke Agreement provides for these Change of Control severance benefits on a “best net” approach, under which Mr. Van Dyke’s Change of Control benefits will be reduced to avoid the golden parachute excise tax under Section 280G of the Internal Revenue Code unless without such a reduction he would receive more after-tax compensation than with a reduction. Payment of these severance benefits is subject to receipt by the Bank of a signed release and waiver of claims and satisfaction of other requirements, conditions, and limitations set forth in the Van Dyke Agreement, including covenants regarding confidentiality, non-competition, non-piracy and non-solicitation.
In the event of a termination for Cause, Mr. Van Dyke will be entitled to receive his Accrued Obligations. If he dies while employed by the Bank, the Bank will pay Mr. Van Dyke’s spouse, if his spouse survives him, or, if not, his estate, his Accrued Obligations and an amount equal to his base salary from the date of his death through the end of the month in which his death occurs.
Bell Employment Agreement
On June 19, 2017, the Bank and Ms. Bell entered into an employment agreement, which was amended on December 17, 2019, pursuant to which Ms. Bell serves as Senior Executive Vice President, Chief Financial Officer of the Bank (as amended, the “Bell Agreement”). The terms of the Bell Agreement are substantially the same as the Van Dyke Agreement, except as follows. The initial term of the Bell Agreement was two years, beginning on July 27, 2017. The employment term automatically renewed on July 24, 2019 and will automatically renew on each subsequent anniversary for an additional one-year term unless either party provides at least 60 days’ advance notice of non-renewal.
Pursuant to the Bell Agreement, Ms. Bell’s initial annual base salary is $330,000, subject to increase by the Bank’s Board of Directors in its discretion. She also received a signing bonus in the amount of $80,000, which was payable $50,000 in 2017 and $30,000 in 2018 and was subject to repayment to the Bank if Ms. Bell were terminated for Cause (as defined in the Bell Agreement) or resigned without Good Reason (as defined in the Bell Agreement) within 12 months of receipt. Ms. Bell also received a phantom stock award with an initial value of $99,000 to be settled in cash, which vests on the third anniversary of the grant date, subject to continued employment by Ms. Bell. Ms. Bell was entitled to up to $20,000 in relocation expenses and up to $1,500 per month for up to six months in temporary housing expenses. She was also entitled to a real estate commission reimbursement of up to $35,000 in connection with the sale of her existing current residence and reimbursement of legal expenses of up to $3,500 in connection with the review and negotiation of the Bell Agreement. She also receives $500 per month as an automobile allowance.
In the event the Bank terminates Ms. Bell’s employment without cause or Ms. Bell terminates her employment for Good Reason, in addition to the Accrued Obligations, she will also receive a monthly severance payment equal to one-twelfth of her annual base salary for 12 months and continued employee health insurance coverage for 12 months. In the event the Bank terminates Ms. Bell’s employment without cause or Ms. Bell terminates her employment for Good Reason within two years after a Change of Control (as defined in the Bell Agreement), Ms. Bell will receive the Accrued Obligations, plus a lump sum severance payment equal to 24 months of her annual base salary, continued employee health insurance coverage for 18 months and a lump sum payment equal to Ms. Bell’s highest annual bonus earned from the Bank for the three years prior to termination.
Karavatakis Employment Agreement
On December 16, 2019, the Bank and Ms. Karavatakis entered into an amended and restated employment agreement, which replaced her September 29, 2017 employment agreement (the “Amended and Restated Karavatakis Agreement”). Pursuant to the Amended and Restated Karavatakis Agreement, Ms. Karavatakis is employed by the Bank as Senior Executive Vice President for Special Projects. The terms of the Amended and Restated Karavatakis Agreement are substantially the same as the Van Dyke Agreement, except as follows. The initial term of the Amended and Restated Karavatakis Agreement is one year, beginning on January 1, 2020. The employment term automatically renews on January 1, 2021 and on each subsequent anniversary for an additional one-year term unless either party provides at least 60 days’ advance notice of non-renewal.
Pursuant to the Amended and Restated Karavatakis Agreement, Ms. Karavatakis’ annual base salary is $250,000, subject to increase by the Bank’s Board of Directors in its discretion. Pursuant to the Amended and Restated Karavatakis Agreement, Ms. Karavatakis is not required to work a full-time schedule. She will regularly work at least 30 hours per week and will receive time off with pay for vacation and sickness as mutually agreed by the Bank and Ms. Karavatakis. She also receives $500 per month as an automobile allowance.
In the event the Bank terminates Ms. Karavatakis’ employment without cause or Ms. Karavatakis terminates her employment for Good Reason, in addition to the Accrued Obligations, she will receive a monthly severance payment equal to one-twelfth of her annual base salary for 12 months and continued employee health insurance coverage for 12 months. In the event the Bank terminates Ms. Karavatakis’ employment without Cause or she terminates her employment for Good Reason within two years after a Change of Control (as defined in the Amended and Restated Karavatakis Agreement), Ms. Karavatakis will receive the Accrued Obligations, plus a lump sum severance payment equal to two times her annual base salary, continued employee health insurance coverage for 18 months and a lump sum payment equal to Ms. Karavatakis’ highest annual bonus earned from the Bank for the three years prior to termination.
Speare Employment Agreement
On June 15, 2017, the Bank and Mr. Speare entered into an employment agreement pursuant to which Mr. Speare serves as Executive Vice President and Chief Information Officer of the Bank (the “Speare Agreement”). The terms of the Speare Agreement are substantially the same as the Van Dyke Agreement, except as follows. The initial term of the Speare Agreement was one year, beginning on July 3, 2017. The employment term automatically renewed on July 3, 2019 and will automatically renew on each subsequent anniversary for an additional one-year term unless either party provides at least 60 days’ advance notice of non-renewal.
Pursuant to the Speare Agreement, Mr. Speare’s initial annual base salary is $325,000, subject to increase by the Bank’s Board of Directors in its discretion. He also received a signing bonus in the amount of $50,000, which was payable $25,000 in 2017 and $25,000 in 2018 and was subject to repayment to the Bank if Mr. Speare were terminated for Cause (as defined in the Speare Agreement) or resigned without Good Reason (as defined in the Speare Agreement) within 12 months of receipt. Mr. Speare also received a phantom stock award with an initial value of $97,500 to be settled in cash, which vests on the third anniversary of the grant date, subject to continued employment by Mr. Speare. Mr. Speare was entitled to up to $20,000 in relocation expenses and up to $1,500 per month for up to six months in temporary housing expenses. He was also entitled to a real estate commission reimbursement of up to $35,000 in connection with the sale of his existing current residence and reimbursement of legal expenses of up to $2,500 in connection with the review and negotiation of the Speare Agreement. He also receives $500 per month as an automobile allowance.
In the event the Bank terminates Mr. Speare’s employment without Cause or Mr. Speare terminates his employment for Good Reason, in addition to the Accrued Obligations, he will also receive a monthly severance payment equal to one-twelfth of his annual base salary for 12 months and continued employee health insurance coverage for 12 months. In the event the Bank terminates Mr. Speare’s employment without Cause or Mr. Speare terminates his employment for Good Reason within two years after a Change of Control (as defined in the Speare Agreement), Mr. Speare will receive the Accrued Obligations, plus a lump sum severance payment equal to 24 months of his annual base salary, continued employee health insurance coverage for 18 months and a lump sum payment equal to Mr. Speare’s highest annual bonus earned from the Bank for the three years prior to termination.
Langs Employment Agreement
On May 31, 2017, the Bank and Mr. Langs entered into an employment agreement, which was amended on December 17, 2019, pursuant to which Mr. Langs serves as President, Chief Strategy Officer of the Bank (as amended, the “Langs Agreement”). The terms of the Langs Agreement are substantially the same as the Van Dyke Agreement, except as follows. The initial term of the Langs Agreement was one year, beginning on June 19, 2017. The employment term automatically renewed on June 19, 2019 and will automatically renew on each subsequent anniversary for an additional one-year term unless either party provides at least 60 days’ advance notice of non-renewal.
Pursuant to the Langs Agreement, Mr. Langs’ initial annual base salary is $297,500, subject to increase by the Bank’s Board of Directors in its discretion. He also received a signing bonus in the amount of $125,000, which was payable $50,000 in 2017 and $75,000 in 2018 and was subject to repayment to the Bank if Mr. Langs were terminated for Cause (as defined in the Langs Agreement) or resigned without Good Reason (as defined in the Langs Agreement) within 12 months of receipt. Mr. Langs also received a phantom stock award with an initial value of $85,500 to be settled in cash, which vests on the third anniversary of the grant date, subject to continued employment by Mr. Langs. Mr. Langs was entitled to up to $20,000 in relocation expenses and up to $1,500 per month for up to six months in temporary housing expenses. He also receives $500 per month as an automobile allowance.
In the event the Bank terminates Mr. Langs’ employment without cause or Mr. Langs terminates his employment for Good Reason, in addition to the Accrued Obligations, he will also receive a monthly severance payment equal to one-twelfth of his annual base salary for 12 months and continued employee health insurance coverage for 12 months. In the event the Bank terminates Mr. Langs’ employment without Cause or Mr. Langs terminates his employment for Good Reason within two years after a Change of Control (as defined in the Langs Agreement), Mr. Langs will receive the Accrued Obligations, plus a lump sum severance payment equal to 24 months of his annual base salary, continued employee health insurance coverage for 18 months and a lump sum payment equal to Mr. Langs’ highest annual bonus earned from the Bank for the three years prior to termination.
Base Salaries
Base salaries provide appropriate fixed cash compensation necessary to attract and retain executive talent. Base salaries are intended to be competitive. The Nominating and Compensation Committee reviews the base salaries of our named executive officers on an annual basis as well as at the time of any promotion or other material change in responsibilities. In addition to engaging independent compensation consultant, Pearl Meyer on base salaries, our Nominating and Compensation Committee also considers the following when setting base salaries: (a) the individual executive’s overall performance and contribution to the Bank’s performance, (b) overall Bank performance and (c) the individual’s base salary relative to other executive officers. While the named executive officers did not receive a base salary increase in 2019, the Committee approved base salary increases for everyone except Ms. Karavatakis in January 2020, effective February 3, 2020.
| Executive | | 2019 Base Salary ($) | | | 2018 Base Salary ($)(1) | | | % Increase | |
| Litz H. Van Dyke | | | 570,000 | | | | 570,000 | | | | 0 | % |
| Wendy S. Bell | | | 350,000 | | | | 350,000 | | | | 0 | % |
| Phyllis Q. Karavatakis | | | 335,000 | | | | 335,000 | | | | 0 | % |
| Matthew M. Speare | | | 345,000 | | | | 345,000 | | | | 0 | % |
| Bradford N. Langs | | | 335,000 | | | | 335,000 | | | | 0 | % |
| (1) | Base Salaries for all named executive officers were effective as of November 26, 2018. |
Annual Incentive Plan
On November 15, 2018, with assistance from its independent compensation consultant, the Governance & Compensation Committee (which became the “Nominating and Compensation Committee” in August 2019) adopted an annual incentive plan for the purpose of awarding annual bonuses to certain employees of the Bank based upon the achievement of annual performance objectives established each year under the plan. The annual incentive plan covers the Bank’s executive officers and certain executive vice presidents (each, a “Participant”), which includes all of the Bank’s named executive officers. The goal of the annual incentive plan is to motivate Participants to maximize shareholder value by achieving performance while limiting risk appropriately and maintaining the safety and soundness of the Bank.
The plan is an annual incentive plan that is approved each year with a performance year running from January 1 through December 31. The Nominating and Compensation Committee oversees the administration of the plan, as well as plan design, determination of performance measures, goals and weightings and award payouts, partly based on input from the Bank’s CEO.
At the beginning of each year, the Nominating and Compensation Committee develops a bonus template for each Participant. The primary elements of each template are:
| · | Percentage of base salary opportunity, |
| · | Performance measures and goals selected from the Bank’s approved budget numbers for the year or other objective measure, and |
| · | Weightings assigned to the selected performance measures. |
Under the annual incentive plan, a Participant can earn a bonus of up to a specific percentage of the Participant’s base salary. For 2019, these percentages are as follows:
| Participant | | % of Base Salary | |
| CEO, CFO, CBO, CSO | | | 50 | % |
| All Other Participants | | | 35 | % |
Performance measures under the plan are determined each year, in the categories of profitability, capital effectiveness and safety and soundness. The performance measures, goals and weightings assigned to them may change from year to year, and will likely be the same for all Participants in any given year, although that is subject to change. The amount of bonus earned by a Participant each year will depend on the Bank’s achievement with respect to the performance measure goals selected for that year, multiplied by the applicable weightings, multiplied by the Participant’s base salary and percentage of base salary opportunity.
Bonus amounts earned based on the Bank’s performance for a year are reviewed and certified by the Nominating and Compensation Committee and paid to the Participant between January 1 and March 15 of the following year, generally shortly after the year’s results have been finalized and the Bank’s earnings for the year have been announced. The plan has both short-term and long-term elements to it, as the bonus amounts will be paid 2/3 in cash and 1/3 in shares of restricted common stock of the Bank, with time-based vesting in three annual installments.
For 2019, the Nominating and Compensation Committee selected the same performance measure goals and weightings for each of the named executive officers. The following table shows the performance measure goals for the annual incentive plan for 2019, as well as the weightings of these goals and the achievement with respect to each goal:
| Performance Measure | | Weighting | | | Maximum Performance
Goal | | | Performance Achieved | |
| Core Earnings per Share (1) | | | 20 | % | | $ | 1.32 | | | | 16 | % |
| Core ROAA (1) | | | 20 | % | | | 0.83 | % | | | 14 | % |
| Core ROATCE (1) | | | 15 | % | | | 8.79 | % | | | 6 | % |
| Core Efficiency (1) | | | 15 | % | | | 68.0 | % | | | 7 | % |
| Loan Growth | | | 20 | % | | | $3.10 Billion | | | | 13 | % |
| Regulatory Rating | | | 10 | % | | | confidential | | | | 7 | % |
| Weighted Average Bonus Amount Earned | | | | | | | | | | | 63 | % |
(1) Core earnings per share, core return on average assets, core return on average tangible common equity and core efficiency are calculated excluding all extraordinary items, whether positive or negative.
The Nominating and Compensation Committee reviewed the Bank’s performance with respect to these goals for 2019, and bonus amounts were determined under the plan based on the achievement of the performance goals, multiplied by the named executive officer’s base salary and percentage of base salary opportunity. As noted above, the bonus amounts were paid in early 2020, 2/3 in cash and 1/3 in shares of restricted common stock of the Bank, with time-based vesting in three annual installments, granted under the Carter Bank & Trust 2018 Omnibus Equity Incentive Plan, which is discussed further below. The bonus amounts earned by the named executive officers for 2019 performance under this plan are reported as “Non-Equity Incentive Plan Compensation” for 2019 in the Summary Compensation Table.
Equity Compensation
On June 27, 2018, the Bank’s shareholders approved the Carter Bank & Trust 2018 Omnibus Equity Incentive Plan (the “Equity Plan”). The Equity Plan authorizes the issuance of up to 2,000,000 shares of common stock for awards to key employees and non-employee directors as determined by the Nominating and Compensation Committee, which has been appointed by the Board of Directors to administer the Equity Plan. The Equity Plan authorizes the grant of stock options, restricted stock, restricted stock units, stock appreciation rights, stock awards, performance units and performance cash awards. With respect to executive compensation, the purpose of the Equity Plan is to provide incentive to certain key employees to associate their personal interests with the long-term financial success of the Bank and with growth in shareholder value, consistent with the Bank’s risk management practices. In November 2018, the Bank granted restricted stock awards to several employees, including Mr. Speare, in connection with their contributions to the successful conversion of the Bank’s core systems. In February 2019, the Bank granted restricted stock awards to several employees, including all of the named executive officers, in connection with the annual incentive plan bonus payouts for 2018 performance. The restricted stock vests in equal installments on each of the first, second and third anniversaries of the grant date, subject to accelerated vesting in certain circumstances.
As discussed above, the Nominating and Compensation Committee anticipates granting future awards of restricted stock to employees, including the named executive officers, in connection with the annual incentive plan and may also grant other equity awards under the Equity Plan as part of the Bank’s compensation program.
LIMITATIONS ON HEDGING AND SPECULATIVE TRANSACTIONS
The Board has approved the Carter Bank & Trust Insider Trading Policy that applies to all directors, officers and employees of the Bank and, among other goals, helps ensure that the Bank’s personnel bear the full risks and benefits of stock ownership. Under this policy, Bank personnel may not sell Carter Bank & Trust stock “short,” trade in Carter Bank & Trust stock in or through a margin account, or other engage in hedging transactions or speculative or short-term trading of Carter Bank & Trust stock.
NOMINATING AND COMPENSATION COMMITTEE REPORT
The Nominating and Compensation Committee of the Board of Directors has reviewed and discussed with management the Compensation Discussion & Analysis included above. Based upon such review, the related discussions and such other matters deemed relevant and appropriate by the Committee, the Committee has recommended to the Board of Directors the inclusion of the Compensation Discussion & Analysis in this Annual Report on Form 10-K.
MEMBERS OF THE NOMINATING AND COMPENSATION COMMITTEE
Robert W. Conner
Gregory W. Feldmann, Chair
E. Warren Matthews
Lanny A. Kyle, O.D.
CEO PAY RATIO
The Bank determined that the 2019 annual total compensation of the median compensated employee of all its employees, other than the CEO, as of December 31, 2019 was $30,659; the CEO’s 2019 annual total compensation was $798,989; and the ratio of these amounts was 26:1.
The Bank identified a new median employee for 2019 due to changes in the Bank’s compensation program since 2018. To do this, we utilized the following methodology. As of December 31, 2019, the Bank’s total population consisted of 994 employees, all of whom work in the United States. This population consisted of all of its full-time and part-time employees. To identify the median compensated employee, we used a Consistently Applied Compensation Measure defined as gross wages as reported on each employee’s 2019 Internal Revenue Service (“IRS”) Form W-2. We further annualized pay for those individuals not employed for a full year in 2019, but who were employed as of December 31, 2019.
Once we identified our median compensated employee, we calculated the median compensated employee’s and our CEO’s 2019 annual total compensation in accordance with the requirements of the Summary Compensation Table.
This pay ratio is a reasonable estimate calculated in a manner consistent with SEC rules based on our payroll and employment records and the methodology described above. The SEC rules for identifying the median compensated employee and calculating the pay ratio based on that employee’s annual total compensation allow companies to adopt a variety of methodologies, to apply certain exclusions, and to make reasonable estimates and assumptions that reflect their compensation practices. As such, the pay ratio reported by other companies may not be comparable to the pay ratio reported above, as other companies may have different employment and compensation practices and may utilize different methodologies, exclusions, estimates and assumptions in calculating their own pay ratios.
SUMMARY COMPENSATION TABLE
Fiscal 2017 - 2019
The table below reflects compensation received by each named executive officer.
Name and Principal Position with
Carter Bank & Trust | | Year | | | Salary
($) | | | Bonus
(1)
($) | | | Stock
Awards
(2) ($) | | | Option
Awards
($) | | | Non-equity
Incentive Plan
Compensation
(3)
($) | | | Change
in
Pension
Value
and Non-
Qualified
Deferred
Compensation
Earnings
($) | | | All Other
Compensation(4)
($) | | | Total ($) | |
| Litz H. Van Dyke | | 2019 | | | $ | 570,000 | | | | — | | | | — | | | | — | | | $ | 178,979 | | | | — | | | $ | 50,010 | | | $ | 798,989 | |
| Chief Executive Officer (5) | | 2018 | | | $ | 497,051 | | | $ | 25,000 | | | | — | | | | — | | | $ | 185,483 | | | | — | | | $ | 27,911 | | | $ | 735,445 | |
| | | 2017 | | | $ | 440,000 | | | $ | 25,000 | | | | — | | | | — | | | $ | 150,000 | | | | — | | | $ | 16,353 | | | $ | 631,353 | |
| | | | | | | | | | | | | | | | | | | | | | | | | | | | | | | | | | | | | |
| Wendy S. Bell | | 2019 | | | $ | 350,000 | | | | — | | | | — | | | | — | | | $ | 109,892 | | | | — | | | $ | 46,685 | | | $ | 506,577 | |
| Senior Executive Vice President and Chief Financial Officer (6) | | 2018 | | | $ | 326,039 | | | $ | 30,000 | | | | — | | | | — | | | $ | 122,419 | | | | — | | | $ | 22,715 | | | $ | 501,173 | |
| | | 2017 | | | $ | 145,962 | | | $ | 50,000 | | | | — | | | | — | | | $ | 99,000 | | | | — | | | $ | 18,709 | | | $ | 313,671 | |
| | | | | | | | | | | | | | | | | | | | | | | | | | | | | | | | | | | | | |
| Phyllis Q. Karavatakis | | 2019 | | | $ | 335,000 | | | | — | | | | — | | | | — | | | $ | 105,185 | | | | — | | | $ | 44,617 | | | $ | 484,802 | |
| Senior Executive Vice President for Special Projects | | 2018 | | | $ | 320,353 | | | $ | 40,000 | | | | — | | | | — | | | $ | 120,564 | | | | — | | | $ | 22,149 | | | $ | 503,066 | |
| | | 2017 | | | $ | 280,000 | | | $ | 40,000 | | | | — | | | | — | | | $ | 97,500 | | | | — | | | $ | 9,734 | | | $ | 427,234 | |
| | | | | | | | | | | | | | | | | | | | | | | | | | | | | | | | | | | | | |
| Matthew M. Speare | | 2019 | | | $ | 335,000 | | | | — | | | | — | | | | — | | | $ | 73,630 | | | | — | | | $ | 42,663 | | | $ | 451,293 | |
Executive Vice President and Chief Information Officer (7) | | 2018 | | | $ | 320,353 | | | $ | 41,250 | | | $ | 29,255 | | | | — | | | $ | 84,395 | | | | — | | | $ | 19,027 | | | $ | 494,280 | |
| | | 2017 | | | $ | 162,500 | | | $ | 25,000 | | | | — | | | | — | | | $ | 97,500 | | | | — | | | $ | 58,649 | | | $ | 343,649 | |
| | | | | | | | | | | | | | | | | | | | | | | | | | | | | | | | | | | | |
| Bradford N. Langs | | 2019 | | | $ | 335,000 | | | | — | | | | — | | | | — | | | $ | 105,185 | | | | — | | | $ | 45,474 | | | $ | 485,659 | |
President and Chief Strategy Officer (8) | | 2018 | | | $ | 315,769 | | | $ | 75,000 | | | | — | | | | — | | | $ | 120,564 | | | | — | | | $ | 21,035 | | | $ | 532,368 | |
| | | 2017 | | | $ | 162,099 | | | $ | 50,000 | | | | — | | | | — | | | $ | 85,500 | | | | — | | | $ | 20,878 | | | $ | 318,477 | |
| (1) | The amounts in the “Bonus” column represent the first installment (paid in 2017) and second installment (paid in 2018) of the sign-on bonuses granted to the named executive officer in connection with entering into an employment agreement with the Bank. |
| (2) | The amount in this column reflects the grant date fair value for restricted stock granted during 2018 pursuant to the Equity Plan, calculated in accordance with ASC Topic 718, based on the closing price of the Bank’s common stock on the date of grant. This column does not include the portion of the annual incentive plan bonus payouts for 2018 and 2019 performance paid in restricted stock, which were granted in February 2019 and February 2020. |
| (3) | The amounts in this column for 2018 and 2019 reflect the bonus amounts earned for 2018 and 2019 performance under the annual incentive plan and include both the portion of the bonus paid in cash and the portion paid in shares of restricted stock that were granted in February 2019 and February 2020. In each case, the cash portion and the portion paid in restricted shares of these bonus amounts were paid in the year following the year in which the performance criteria was achieved. The amounts in this column for 2017 reflect the starting value of the phantom stock awarded to the named executive officers in connection with the entering into of employment agreements with the Bank. Each phantom stock award will be settled in cash in an amount equal to the product of the following: (A) the total number of shares of the Bank’s common stock that could be purchased for the target amount stated on the grant date, based on the average of the closing price for the Bank’s common stock during the 30-day period preceding the grant date, multiplied by (B) the average of the closing price for the Bank’s common stock during the 30-day period immediately preceding the third anniversary of the grant date. |
| (4) | The amount of compensation properly categorized in this column, including perquisites and other personal benefits that total more than $10,000, is listed in the chart below for 2019. |
The following table shows information on all other compensation to the named executive officers during 2019:
| Name | | Medical | | | Qualified Profit
Sharing Plan
Matching/Profit
Sharing
Contributions | | | Disability
Insurance | | | Life
Insurance
Premiums | | | Car
Allowance | | | Gross Ups
Car Allowance | | | Total | |
| Litz H. Van Dyke | | $ | 11,905 | | | $ | 21,878 | | | $ | 726 | | | $ | 3,242 | | | $ | 8,400 | | | $ | 3,859 | | | $ | 50,010 | |
| Wendy S. Bell | | $ | 12,079 | | | $ | 21,878 | | | $ | 726 | | | $ | 3,242 | | | $ | 6,000 | | | $ | 2,760 | | | $ | 46,685 | |
| Phyllis Q. Karavatakis | | $ | 8,952 | | | $ | 21,878 | | | $ | 726 | | | $ | 4,484 | | | $ | 6,000 | | | $ | 2,577 | | | $ | 44,617 | |
| Matthew M. Speare | | $ | 9,108 | | | $ | 21,878 | | | $ | 726 | | | $ | 2,162 | | | $ | 6,000 | | | $ | 2,789 | | | $ | 42,663 | |
| Bradford N. Langs | | $ | 12,079 | | | $ | 21,878 | | | $ | 726 | | | $ | 2,162 | | | $ | 6,000 | | | $ | 2,629 | | | $ | 45,474 | |
| (5) | Mr. Van Dyke transitioned from Executive Vice President to Chief Executive Officer on April 18, 2017. |
| (6) | Ms. Bell became Chief Financial Officer on July 24, 2017. |
| (7) | Mr. Speare became Chief Information Officer on July 3, 2017. |
| (8) | Mr. Langs became Chief Strategy Officer on June 19, 2017. |
The table below reflects information regarding the restricted stock awards and annual incentive plan opportunities granted to the named executive officers during or for the year ended December 31, 2019.
Grants of Plan-Based Awards
Fiscal 2019
The following table shows information on plan-based awards and restricted stock to the named executive officers during 2019:
| | | | | | Estimated Possible Payouts Under
Non-Equity Incentive Plan Awards
(1) | | | All Other
Stock
Awards:
Number
of Shares
of Stock | | | Grant Date
Fair Value of
Stock and
Option | |
| | | Grant | | | Threshold | | | Target | | | Maximum | | | or Units | | | Awards | |
| Name | | Date | | | ($) | | | ($) | | | ($) | | | (#) | | | ($) | |
| Litz H. Van Dyke | | | | | | | | | | | | | | | | | | | | | | | | |
| Annual Incentive Plan | | | | | | | -- | | | | -- | | | $ | 285,000 | | | | -- | | | | -- | |
| Restricted Stock | | | | | | | -- | | | | -- | | | | -- | | | | -- | | | $ | -- | |
| Wendy S. Bell | | | | | | | | | | | | | | | | | | | | | | | | |
| Annual Incentive Plan | | | | | | | -- | | | | -- | | | $ | 175,000 | | | | -- | | | | -- | |
| Restricted Stock | | | | | | | -- | | | | -- | | | | -- | | | | -- | | | $ | -- | |
| Phyllis Q. Karavatakis | | | | | | | | | | | | | | | | | | | | | | | | |
| Annual Incentive Plan | | | | | | | | | | | | | | $ | 167,500 | | | | -- | | | | -- | |
| Restricted Stock | | | | | | | -- | | | | -- | | | | -- | | | | -- | | | $ | -- | |
| Matthew M. Speare | | | | | | | | | | | | | | | | | | | | | | | | |
| Annual Incentive Plan | | | | | | | | | | | | | | $ | 120,750 | | | | -- | | | | -- | |
| Restricted Stock | | | | | | | -- | | | | -- | | | | -- | | | | -- | | | $ | -- | |
| Bradford N. Langs | | | | | | | | | | | | | | | | | | | | | | | | |
| Annual Incentive Plan | | | | | | | | | | | | | | $ | 167,500 | | | | -- | | | | -- | |
| Restricted Stock | | | | | | | -- | | | | -- | | | | -- | | | | -- | | | $ | -- | |
| (1) | Reflects the maximum bonus that each named executive officer could earn for 2019 performance under the annual incentive plan. The annual incentive plan does not have threshold or target performance levels. The actual amounts earned by the named executive officers for 2019 performance under this plan, which were paid partly in cash and partly in shares of restricted stock with a three-year vesting period, are reported as “Non-Equity Incentive Plan Compensation” for 2019 in the Summary Compensation Table. |
Outstanding Equity Awards at Fiscal 2019 Year-End
The table below reflects certain information regarding the phantom stock awards and restricted stock awards held by each named executive officer as of December 31, 2019. None of the named executive officers held any other equity awards as of December 31, 2019.
Stock Awards
| Name | | Grant
Date | | Number of
Shares or
Units of Stock
That Have Not
Vested (#) (1) | | | Market Value
of Shares or
Units of Stock
That Have Not
Vested ($) (2) | | | Equity Incentive
Plan Awards:
Number of
Unearned Shares,
Units or Other
Rights That Have
Not Vested (#) | | | Equity Incentive
Plan Awards:
Market or Payout
Value of
Unearned Shares,
Units or Other
Rights That Have
Not Vested ($)(3) | |
| Litz H. Van Dyke | | 10/1/17 | | | — | | | | — | | | | — | | | $ | 206,285 | |
| | | 2/21/19 | | | 3,579 | | | $ | 84,893 | | | | — | | | | — | |
| Wendy S. Bell | | 7/24/17 | | | — | | | | — | | | | — | | | $ | 150,999 | |
| | | 2/21/19 | | | 2,362 | | | $ | 56,026 | | | | — | | | | — | |
| Phyllis Q. Karavatakis | | 10/1/17 | | | — | | | | — | | | | — | | | $ | 134,085 | |
| | | 2/21/19 | | | 2,327 | | | $ | 55,196 | | | | — | | | | — | |
| Matthew M. Speare | | 7/3/17 | | | — | | | | — | | | | — | | | $ | 150,161 | |
| | 11/19/18 | | | 1,092 | | | $ | 25,902 | | | | — | | | | — | |
| | | 2/21/19 | | | 1,629 | | | $ | 38,639 | | | | — | | | | — | |
| Bradford N. Langs | | 6/19/17 | | | — | | | | — | | | | — | | | $ | 131,949 | |
| | | 2/21/19 | | | 2,327 | | | $ | 55,196 | | | | — | | | | — | |
| (1) | These awards of restricted stock were granted pursuant to the Equity Plan. The restricted stock vests in equal 1/3 installments on the first, second and third anniversaries of the grant date, subject to accelerated vesting under certain circumstances. |
| (2) | The amounts in this column represent the fair market value of the restricted stock as of December 31, 2019. The closing price of the Bank’s common stock was $23.72 on that date. |
| (3) | The amounts in this column reflect the value of each phantom stock award as of December 31, 2019, based on the closing price of the Bank’s common stock on December 31, 2019. The phantom stock awards vest on the third anniversary of the grant date, subject to the named executive officer’s continued employment on such date and will be settled in cash. |
OPTION EXERCISES AND STOCK VESTED
FISCAL 2019
The table below reflects information regarding restricted stock held by each named executive officer that vested during 2019. None of the named executive officers held any stock options or had any phantom stock vest in 2019.
| Stock Awards |
| Name | | Number of shares acquired on
vesting (#) | | | Value realized on vesting ($)(1) | |
| Litz H. Van Dyke | | | — | | | | — | |
| Wendy S. Bell | | | — | | | | — | |
| Phyllis Q. Karavatakis | | | — | | | | — | |
| Matthew M. Speare | | | 546 | | | $ | 11,384 | |
| Bradford N. Langs | | | — | | | | — | |
| (1) | The value realized on vesting is the market value based on the closing price of the Bank’s common stock on the vesting date multiplied by the number of shares that vested. |
Qualified Profit Sharing Plan
The Qualified Profit Sharing Plan covers all full-time employees that have been employed for six (6) months and have reached the age of 20-1/2 as of the first day of the plan year. Persons who have reached the age of 62 are fully vested regardless of length of service. For eligibility and vesting purposes, employees receive credit for previous employment with any of the Merged Banks, the Mortgage Company of Virginia, Bank Services of Virginia, Inc. and Bank Services Insurance, Inc. Vesting is based on the number of Years of Service.
The vesting schedule is as follows:
| Years of Service | | Vested Percentage | | | Forfeitable Percentage | |
| 1 | | | 0 | % | | | 100 | % |
| 2 | | | 20 | % | | | 80 | % |
| 3 | | | 40 | % | | | 60 | % |
| 4 | | | 60 | % | | | 40 | % |
| 5 | | | 100 | % | | | 0 | % |
Each year the Board of Directors determines what amount, if any, is to be allocated to the plan out of accumulated or current earnings of the Bank. These profit sharing contributions to the plan were $1.4 million in 2019, $1.7 million in 2018, and none in 2017.
Beginning in 2019, the Qualified Profit Sharing Plan also includes a Bank match based upon an employee’s elective deferral. This elective deferral is subject to dollar limits announced annually by the IRS. Elective deferrals are matched equal to 100% of the first 3% deferred and 50% of the next 2%, producing a maximum 4% match. Expense for this deferral match was $1.1 million for the year ended December 31, 2019. Each of the named executive officers participates in the Qualified Profit Sharing Plan.
The Bank also has a Non-Qualified Profit Sharing Plan. The purpose of the plan was to provide additional benefits to be paid to an executive upon the occurrence of a distributable event, which is either termination or death. Since inception of the plan, the Bank’s former Chairman and Chief Executive Officer was the only executive who participated in the plan. None of the named executive officers participate in the Non-Qualified Profit Sharing Plan.
The Bank did not have any deferred compensation plans during 2019.
Potential Payments upon Termination or Change of Control
The following table shows the estimated payments to or benefits that would have been received by each of the named executive officers upon the following termination events or upon a change of control of the Bank, in each case assuming that each termination event or the change of control occurred on December 31, 2019, and assuming a stock price of $23.72 which was the closing stock price of the Bank’s common stock on December 31, 2019. The amounts reflected in the following table are estimates, as the actual amounts that would have been paid to or received by a named executive officer can only be determined at the time of termination or change of control.
The following table reports only amounts that are increased, accelerated or otherwise paid or payable as a result of the applicable termination or change of control event and, as a result, excludes amounts accrued through December 31, 2019, such as accrued but unpaid salary and annual bonus compensation amounts for completed performance periods and vested account balances under the Qualified Profit Sharing Plan and other plans. The table also excludes any amounts that are available generally to all salaried employees and in a manner that does not discriminate in favor of the Bank’s executive officers.
Payments and
Benefits | | Death | | | Termination
Due to
Incapacity | | | Termination
Without
Cause
or for Good
Reason Not in
Connection
with Change
of Control
(1)(2) | | | Termination
Without
Cause
or for Good
Reason within
2 Years
Following a
Change of
Control
(3)(4)(5) | | | Termination
For Cause or
Without Good
Reason | | | Change of
Control with
no Related
Termination
of
Employment | |
| Litz H. Van Dyke | | | | | | | | | | | | | | | | | | | | | | | | |
| Cash Severance | | $ | — | | | $ | — | | | $ | 855,000 | | | $ | 1,889,783 | | | $ | — | | | $ | — | |
| Equity Vesting (6) | | | 84,893 | | | | 84,893 | | | | — | | | | — | | | | — | | | | 84,893 | |
| Health Care Coverage | | | — | | | | — | | | $ | 17,858 | | | $ | 17,858 | | | | — | | | | — | |
| Total | | $ | 84,893 | | | $ | 84,893 | | | $ | 872,858 | | | $ | 1,907,641 | | | $ | — | | | $ | 84,893 | |
| | | | | | | | | | | | | | | | | | | | | | | | | |
| Wendy S. Bell | | | | | | | | | | | | | | | | | | | | | | | | |
| Cash Severance | | $ | — | | | $ | — | | | $ | 350,000 | | | $ | 822,419 | | | $ | — | | | $ | — | |
| Equity Vesting (6) | | | 56,026 | | | | 56,026 | | | | — | | | | — | | | | — | | | | 56,026 | |
| Health Care Coverage | | | — | | | | — | | | $ | 12,079 | | | $ | 18,119 | | | | — | | | | — | |
| Total | | $ | 56,026 | | | $ | 56,026 | | | $ | 362,079 | | | $ | 840,538 | | | $ | — | | | $ | 56,026 | |
| | | | | | | | | | | | | | | | | | | | | | | | | |
| Phyllis Q. Karavatakis | | | | | | | | | | | | | | | | | | | | | |
| Cash Severance | | $ | — | | | $ | — | | | $ | 335,000 | | | $ | 790,564 | | | $ | — | | | $ | — | |
| Equity Vesting (6) | | | 55,196 | | | | 55,196 | | | | — | | | | — | | | | — | | | | 55,196 | |
| Health Care Coverage | | | — | | | | — | | | $ | 8,952 | | | $ | 13,428 | | | | — | | | | — | |
| Total | | $ | 55,196 | | | $ | 55,196 | | | $ | 343,952 | | | $ | 803,992 | | | $ | — | | | $ | 55,196 | |
| | | | | | | | | | | | | | | | | | | | | | | | | |
| Matthew M. Speare | | | | | | | | | | | | | | | | | | | | | |
| Cash Severance | | $ | — | | | $ | — | | | $ | 345,000 | | | $ | 787,500 | | | $ | — | | | $ | — | |
| Equity Vesting (6) | | | 64,541 | | | | 64,541 | | | | — | | | | — | | | | — | | | | 64,541 | |
| Health Care Coverage | | | — | | | | — | | | $ | 9,108 | | | $ | 13,662 | | | | — | | | | — | |
| Total | | $ | 64,541 | | | $ | 64,541 | | | $ | 354,108 | | | $ | 801,162 | | | $ | — | | | $ | 64,541 | |
Payments and
Benefits | | Death | | | Termination
Due to
Incapacity | | | Termination
Without
Cause
or for Good
Reason Not in
Connection
with Change
of Control
(1)(2) | | | Termination
Without
Cause
or for Good
Reason within
2 Years
Following a
Change of
Control
(3)(4)(5) | | | Termination
For Cause or
Without Good
Reason | | | Change of
Control with
no Related
Termination
of
Employment | |
| Bradford N. Langs | | | | | | | | | | | | | | | | | | | | | | | | |
| Cash Severance | | $ | — | | | $ | — | | | $ | 335,000 | | | $ | 790,564 | | | $ | — | | | $ | — | |
| Equity Vesting (6) | | | 55,196 | | | | 55,196 | | | | — | | | | — | | | | — | | | | 55,196 | |
| Health Care Coverage | | | — | | | | — | | | $ | 12,079 | | | $ | 18,119 | | | | — | | | | — | |
| Total | | $ | 55,196 | | | $ | 55,196 | | | $ | 347,079 | | | $ | 808,683 | | | $ | — | | | $ | 55,196 | |
| (1) | Under his employment agreement, if Mr. Van Dyke resigns for good reason or his employment is terminated without cause not in connection with a change of control, Mr. Van Dyke will be entitled to receive monthly severance payments equal to one-twelfth of his annual base salary for 18 months and continued employee health insurance coverage for 18 months. Payment of these severance benefits is subject to receipt by the Bank of a signed release and waiver of claims and satisfaction of other requirements, conditions, and limitations set forth in Mr. Van Dyke’s employment agreement, including covenants regarding confidentiality, non-competition, non-piracy and non-solicitation. |
| (2) | For each named executive officer other than Mr. Van Dyke, under his or her employment agreement, if the named executive officer resigns for good reason or his or her employment is terminated without cause not in connection with a change of control, the named executive officer will be entitled to receive monthly severance payments equal to one-twelfth of his or her annual base salary for 12 months and continued employee health insurance coverage for 12 months. Payment of these severance benefits is subject to receipt by the Bank of a signed release and waiver of claims and satisfaction of other requirements, conditions, and limitations set forth in the employment agreement, including covenants regarding confidentiality, non-competition, non-piracy and non-solicitation. |
| (3) | Under his employment agreement, if Mr. Van Dyke resigns for good reason or his employment is terminated without cause within two years after a change of control Mr. Van Dyke will be entitled to receive a lump sum severance payment equal to 2.99 times his annual base salary, continued employee health insurance coverage for 18 months and a lump sum payment equal to Mr. Van Dyke’s highest annual bonus earned from the Bank for the three years prior to termination. Payment of these severance benefits is subject to receipt by the Bank of a signed release and waiver of claims and satisfaction of other requirements, conditions, and limitations set forth in Mr. Van Dyke’s employment agreement, including covenants regarding confidentiality, non-competition, non-piracy and non-solicitation. |
| (4) | For each named executive officer other than Mr. Van Dyke, under his or her employment agreement, if the named executive officer resigns for good reason or his or her employment is terminated without cause within two years after a change of control, the named executive officer will be entitled to receive to receive a lump sum severance payment equal to 2 times his or her annual base salary, continued employee health insurance coverage for 18 months and a lump sum payment equal to the named executive officer’s highest annual bonus earned from the Bank for the three years prior to termination. Payment of these severance benefits is subject to receipt by the Bank of a signed release and waiver of claims and satisfaction of other requirements, conditions, and limitations set forth in the employment agreement, including covenants regarding confidentiality, non-competition, non-piracy and non-solicitation. |
| (5) | Each named executive officer’s employment agreement provides for change of control benefits on a “best net” approach, under which the named executive officer’s change of control benefits will be reduced to avoid the golden parachute excise tax under Section 280G of the Internal Revenue Code unless without such a reduction the named executive officer would receive more after-tax compensation than with a reduction. The amounts shown in this column do not reflect any reductions that might be made pursuant to these provisions. |
| (6) | Restricted shares granted to the named executive officers become fully vested upon termination of the named executive officer’s employment due to (a) death, (b) disability, (c) retirement (with the consent of the Nominating and Compensation Committee) at or after age 59 years and six months, with 7 full years of employment where there is no cause for termination and the named executive officer is subject to a non-competition agreement upon retirement, or (d) a change in control of the Bank. In the event of termination of the named executive officer’s employment for good reason or without cause, all then unvested restricted shares would be forfeited in the absence of the Nominating and Compensation Committee’s exercise of discretion to waive such forfeiture. Ms. Karavatakis was the only named executive officer eligible for retirement under these provisions as of December 31, 2019. |
DIRECTOR COMPENSATION
For 2019 non-employee director compensation, the Nominating and Compensation Committee determined the fees to be paid to non-employee directors based in part on advice of Pearl Meyer, which annually conducts an external market study using the same peer group identified above for executive compensation determinations to assess the competitiveness of current pay for our non-employee directors. As with the executive compensation program, the Committee considers the peer date to ensure that the Bank’s non-employee director compensation is competitive and close to the median of market practices of the peer companies.
Beginning in 2019, any changes to non-employee director compensation are reviewed and recommended by the Nominating and Compensation Committee and approved by the Board of Directors.
Based in part on the recommendations of the Committee’s independent compensation consultant, Pearl Myer (and its predecessor), effective January 1, 2019, the Nominating, Governance and Compensation Committee (now the Nominating and Compensation Committee) recommended and the Board of Directors approved a change in non-employee director compensation. Non-employee directors do not receive per-meeting fees and instead receive an annual cash retainer, payable monthly, and an annual stock retainer in the form of an annual award of time-based restricted stock under the Equity Plan. The Chairman of the Board receives an annual cash retainer in the amount of $48,000, each committee chair receives an annual cash retainer in the amount of $40,000, and each other non-employee director receives an annual cash retainer in the amount of $36,000. The annual stock retainer for each director is paid in the form of restricted stock in the amount of $24,000 based on the closing price of the Bank’s stock on the grant date. The annual stock retainer for 2019 was originally granted to vest in three equal installments on the first, second and third anniversaries of the grant date. Based on the advice of Pearl Meyer, that one-year cliff vesting is more common for non-employee director stock awards, the Nominating and Compensation Committee approved accelerated vesting of these non-employee director restricted shares in January 2020 to fully vest one year after the grant date and future annual stock retainers will be granted with a one-year vest date.
DIRECTOR COMPENSATION TABLE
FISCAL 2019
The following table provides compensation information for the year ended December 31, 2019 for each non-employee member of the Board of Directors.
| Name (1) | | Fees
Earned or
Paid in
Cash
($) | | | Stock Awards
($) (2) | | | Option
Awards
($) | | | Non-Equity
Incentive Plan
Compensation
($) | | | Change in Pension
Value and Nonqualified
Deferred
Compensation
Earnings ($) | | | All Other
Compensation
($) | | | Total ($) | |
| Michael R. Bird | | $ | 40,000 | | | $ | 24,000 | | | | — | | | | — | | | | — | | | | — | | | $ | 64,000 | |
| Robert W. Conner | | $ | 40,000 | | | $ | 24,000 | | | | — | | | | — | | | | — | | | | — | | | $ | 64,000 | |
| Gregory W. Feldmann | | $ | 40,000 | | | $ | 24,000 | | | | — | | | | — | | | | — | | | | — | | | $ | 64,000 | |
| Chester A. Gallimore | | $ | 36,000 | | | $ | 24,000 | | | | — | | | | — | | �� | | — | | | | — | | | $ | 60,000 | |
| Charles E. Hall | | $ | 36,000 | | | $ | 24,000 | | | | — | | | | — | | | | — | | | | — | | | $ | 60,000 | |
| James W. Haskins | | $ | 48,000 | | | $ | 24,000 | | | | — | | | | — | | | | — | | | | — | | | $ | 72,000 | |
| Lanny A. Kyle, O.D. | | $ | 36,000 | | | $ | 24,000 | | | | — | | | | — | | | | — | | | | — | | | $ | 60,000 | |
| George W. Lester, II | | $ | 36,000 | | | $ | 24,000 | | | | — | | | | — | | | | — | | | | — | | | $ | 60,000 | |
| E. Warren Matthews | | $ | 40,000 | | | $ | 24,000 | | | | — | | | | — | | | | — | | | | — | | | $ | 64,000 | |
| Catharine L. Midkiff | | $ | 36,000 | | | $ | 24,000 | | | | — | | | | — | | | | — | | | | — | | | $ | 60,000 | |
| Joseph E. Pigg | | $ | 36,000 | | | $ | 24,000 | | | | — | | | | — | | | | — | | | | — | | | $ | 60,000 | |
| (1) | Litz Van Dyke, Chief Executive Officer, and Phyllis Karavatakis, Vice Chairman of the Board and Senior Executive Vice President for Special Projects, are not included in this table because they are officers of the Bank and did not receive separate compensation for service as a Director. The compensation received by Mr. Van Dyke and Ms. Karavatakis as officers of the Bank in 2019 is included in the Summary Compensation Table on page 143. |
| (2) | The amounts in this column reflect the grant date fair value of grants of restricted stock to each listed director on January 23, 2019, under the Bank’s Equity Plan, calculated in accordance with ASC Topic 718. The grant date fair value of the restricted stock is based on the closing price of the Bank’s common stock on the grant date. As of December 31, 2019, each of the non-employee directors had outstanding 1,559 shares of restricted stock. |
ITEM 12. SECURITY OWNERSHIP OF CERTAIN BENEFICIAL OWNERS AND MANAGEMENT AND RELATED STOCKHOLDER MATTERS
PRINCIPAL BENEFICIAL OWNERS OF CARTER BANK & TRUST COMMON STOCK
To the best of the Bank’s knowledge, there were no beneficial owners of more than 5% of the outstanding shares of the Bank’s common stock as of May 15, 2020.
BENEFICIAL OWNERSHIP OF CARTER BANK & TRUST COMMON STOCK BY DIRECTORS AND OFFICERS
The following table sets forth, as of May 15, 2020, the beneficial ownership of the Bank’s common stock of each Director, the executive officers identified in the Summary Compensation Table (referred to as our “named executive officers”) and the Bank’s current Directors and executive officers as a group. For purposes of the table below, beneficial ownership has been determined in accordance with the provisions of Rule 13d-3 of the Exchange Act under which, in general, a person is deemed to be the beneficial owner of a security if he/she has or shares the power to vote or direct the voting of the security or the power to dispose of or direct the disposition of the security, or if he/she has the right to acquire beneficial ownership of the security within sixty days.
| Name | | Amount and Nature of
Beneficial Ownership (1) | | | Ownership as a
Percentage of Common
Stock Outstanding (2) | |
| Bell, Wendy S. | | | 14,332 | | | | * | |
| Bird, Michael R. | | | 3,526 | | | | * | |
| Conner, Robert W. | | | 69,891 | | | | * | |
| Feldmann, Gregory W. | | | 4,226 | | | | * | |
| Gallimore, Chester A. | | | 117,751 | | | | * | |
| Hall, Charles E. | | | 33,867 | | | | * | |
| Haskins, James W. (3) | | | 56,423 | | | | * | |
| Karavatakis, Phyllis Q. | | | 17,427 | | | | * | |
| Kyle, Lanny A., O.D. | | | 66,413 | | | | * | |
| Langs, Bradford N. | | | 4,117 | | | | * | |
| Lester, George W., II (4) | | | 1,084,608 | | | | 4.11 | % |
| Matthews, E. Warren | | | 6,683 | | | | * | |
| Midkiff, Catharine L. | | | 8,826 | | | | * | |
| Pigg, Joseph E. (5) | | | 221,214 | | | | * | |
| Speare, Matthew M. | | | 17,870 | | | | * | |
| Van Dyke, Litz H. | | | 8,425 | | | | * | |
| | | | | | | | | |
| All Directors and Executive Officers as a Group (19 Persons)(6) | | | 1,743,936 | | | | 6.61 | % |
| (1) | May include shares held by or jointly with spouse or other family members, held in a trust or through a corporation or other entity. |
| (2) | Percentages are based on 26,384,801 shares of common stock issued and outstanding. |
| (3) | Shares reported include 20,000 shares of common stock pledged as security. |
| (4) | Shares reported include 573,607 shares of common stock pledged as security. |
| (5) | Shares reported include 110,601 shares of common stock pledged as security. |
| (6) | Includes shares held by A. Loran Adams, Jane Ann Davis and Tony E. Kallsen |
*Less than 1% of the outstanding common stock.
Securities Authorized for Issuance under Equity Compensation Plans
The following table contains summary information as of December 31, 2019 with respect to the Carter Bank & Trust 2018 Omnibus Equity Incentive Plan, the only equity compensation plan under which Bank securities are authorized for issuance.
Equity Compensation Plan Information
| Plan Category | | Number of Securities to
be Issued upon Exercise
of Outstanding Options,
Rights and Warrants | | | Weighted-Average
Exercise Price of
Outstanding Options,
Rights and Warrants | | | Number of Securities
Remaining Available for
Future Issuance under
Equity Compensation
Plans (Excluding
Securities Reflected in
Column (a)) | |
| | | (a) | | | (b) | | | (c) | |
| Equity compensation plans approved by security holders (1) | | | — | | | | — | | | | 1,923,532 | |
| Equity compensation plans not approved by security holders (2) | | | — | | | | — | | | | — | |
| Total | | | — | | | | — | | | | 1,923,532 | |
| (1) | Shares available to be granted under the Equity Plan as of December 31, 2019, in the form of stock options, restricted stock, restricted stock units, stock appreciation rights, stock awards, performance units and performance cash awards. |
| (2) | The Bank does not have any equity compensation plans that have not been approved by shareholders. |
ITEM 13. CERTAIN RELATIONSHIPS AND RELATED TRANSACTIONS, AND DIRECTOR INDEPENDENCE
RELATED PERSON TRANSACTIONS
In the ordinary course of business, executive officers and their related interests were customers of, and had transactions with the Bank. Loan transactions with Directors and officers, principal security holders and associates were made in the ordinary course of the Bank’s business, on substantially the same terms, including interest rates, collateral and repayment terms, as those prevailing at the time for comparable loans to unrelated parties and did not involve more than normal risk of collectability or present other unfavorable features. These extensions of credit equaled $39.7 million or 8.4% of the equity capital of Carter Bank & Trust as of December 31, 2019 and $23.4 million or 5.4%, as of December 31, 2018. The maximum aggregate amount of such indebtedness outstanding during 2019 was $39.7 million, or 8.4% of total year-end capital. The Bank expects to have similar banking transactions in the future with its Directors, officers, principal security holders and their associates.
Procedures for Approving Related Party Transactions
The Board of Directors has adopted a written policy with respect to related party transactions that governs the review, approval or ratification of covered related party transactions. The Audit and Compliance Committee (for purposes of this section, “the Committee”) oversees this policy. The policy generally provides that the Bank may enter into a related party transaction only if the Committee approves or ratifies such transaction in accordance with the guidelines set forth in the policy and if the transaction is on terms comparable to those that could be obtained in arm’s length dealings with an unrelated third party, the transaction involves compensation approved by the Nominating and Compensation Committee or with respect to loans to or similar relationships with related parties, the loan or other relationship has been approved in accordance with the Bank’s Regulation O loan policy and procedures.
In the event management determines to recommend a related party transaction, the transaction must be presented to the Committee for approval. After review, the Committee will approve or disapprove such transaction and management will update the Audit and Compliance Committee as to any material change to the approved related party transaction. If advance approval by the Committee is not feasible, management may preliminarily enter into a related party transaction and the related party transaction shall be considered and, if the Audit and Compliance Committee determines it to be appropriate, ratified by the Committee at its next meeting. The Audit and Compliance Committee approves only those related party transactions that are in, or are not inconsistent with, the best interests of the Bank and its shareholders, as the Committee determines.
For purposes of this policy, a “related party transaction” is a transaction, arrangement or relationship (or any series of similar transactions, arrangements or relationships) in which the Bank is, was or will be a participant and the amount involved exceeds $120,000 and in which any related party had, has or will have a direct or indirect material interest. For purposes of determining whether a transaction is a related party transaction, the Audit and Compliance Committee refers to Item 404 of Regulation S-K.
Carter Bank & Trust is a party to an agreement with Young, Haskins, Mann, Gregory and Wall, P.C. to provide legal services of which Chairman and Director James W. Haskins is an Attorney and Principal. During 2019, Carter Bank & Trust paid $401,000 in various legal fees to Young, Haskins, Mann, Gregory and Wall, P.C.
A “related party” is (i) any person who is, or at any time since the beginning of the last fiscal year was, an executive officer, Director, or nominee for Director of the Bank, (ii) any person who is known to own more than 5% of the Bank’s outstanding equity securities, (iii) any immediate family member of any of the foregoing persons, which means any child, stepchild, parent, stepparent, spouse, sibling, mother-in-law, father-in-law, son-in-law, daughter-in-law, brother-in-law, or sister-in-law and any person (other than a tenant or employee) sharing the household of any of the foregoing persons, and (iv) any entity owned or controlled by any of the foregoing persons or in which such person has a substantial ownership interest or control.
DIRECTOR INDEPENDENCE
Under the Bank’s Bylaws, a majority of the Board must be “Independent Directors.” All of the Bank’s current Directors, other than the Chief Executive Officer, Mr. Van Dyke, the Vice Chairman of the Board and Senior Executive Vice President for Special Projects, Ms. Karavatakis, and the Chairman of the Board, Mr. Haskins, satisfy the director independence requirements of the Nasdaq listing standards. All of the Bank’s Directors during 2019, other than Mr. Van Dyke, Ms. Karavatakis and Mr. Haskins, satisfied the director independence requirements of the Nasdaq listing standards.
ITEM 14. PRINCIPAL ACCOUNTING FEES AND SERVICES
INDEPENDENT REGISTERED PUBLIC ACCOUNTING FIRM
Crowe LLP served as the independent registered public accounting firm for the year ended December 31, 2019, while Yount, Hyde & Barbour, P.C. served as the independent registered public accounting firm for Carter Bank & Trust for the year ended December 31, 2018. Crowe LLP has been selected by the Audit and Compliance Committee to serve as the independent registered public accounting firm for Carter Bank & Trust for 2020.
The following table presents the aggregate fees for Carter Bank & Trust and its wholly-owned subsidiaries, for professional audit services rendered by Yount, Hyde & Barbour, P.C. for 2018 and Crowe LLP for 2019 for the audit of the annual financial statements for the years ended December 31, 2018 and December 31, 2019, and fees billed for other services rendered by each firm during those periods.
| | | Years Ended December 31, | |
| | | 2019 | | | 2018 | |
| Audit fees1 | | $ | 429,500 | | | $ | 176,748 | |
| Tax fees2 | | | 76,143 | | | | 5,827 | |
| Other fees3 | | | 23,000 | | | | - | |
| Total Fees | | $ | 528,643 | | | $ | 182,575 | |
1Audit fees consist of audit and review services, report on internal control over financial reporting and review of documents filed with the FDIC for both Yount, Hyde & Barbour, P.C. and Crowe LLP.
2 Tax fees for 2019 consist of $5,111 related to assistance on 2015, 2016, and 2017 IRS Audits, during 2019, as well as, research and consultation on various tax matters in 2019 for Crowe LLP. Tax fees for 2018 consist of assistance with 2016 IRS audit, during 2018, as well as, research and consultation on various tax matters in 2017 for Yount, Hyde, & Barbour, P.C.
3 Other fees consist of assistance with the formation of CB&T Investment Company from Crowe LLP in 2019.
The Audit and Compliance Committee, considered the compatibility of the non-audit related services performed by and fees paid to Crowe LLP in 2019 and to Yount, Hyde & Barbour, P.C. in 2018 and determined that such services and fees were compatible with the independence of both Yount, Hyde & Barbour, P.C. and Crowe LLP as the Bank’s independent auditors.
Also, the Audit and Compliance Committee of the Board of Directors of the Bank pre-approves all audits (including audit-related) and permitted non-audit services to be performed by the independent auditors. With respect to other permitted services, the Audit and Compliance Committee pre-approves specific engagements, projects and categories of services on a fiscal year basis.
PART IV
ITEM 15. EXHIBITS, FINANCIAL STATEMENT SCHEDULES
| (a) | The following documents are filed as part of this Report. |
Consolidated Financial Statements: The following consolidated financial statements are included in Part II, Item 8 of this Report. No financial statement schedules are being filed because the required information is inapplicable or is presented in the Consolidated Financial Statements or related notes.
| Consolidated Balance Sheets | | | 76 | |
| | | | | |
| Consolidated Statements of Income (Loss) | | | 77 | |
| | | | | |
| Consolidated Statements of Comprehensive Income (Loss) | | | 78 | |
| | | | | |
| Consolidated Statements of Changes in Shareholders’ Equity | | | 79 | |
| | | | | |
| Consolidated Statements of Cash Flows | | | 80 | |
| | | | | |
| Notes to Consolidated Financial Statements | | | 82 | |
| | | | | |
| Report of Crowe LLP, Independent Registered Public Accounting Firm, on Consolidated Financial Statements | | | 125 | |
| | | | | |
| Report of Crowe LLP, Independent Registered Public Accounting Firm, on Effectiveness of Internal Control Over Financial Reporting | | | 126 | |
| | | | | |
| Report of Yount, Hyde & Barbour, Independent Registered Public Accounting Firm, on Consolidated Financial Statements | | | 128 | |
| 3.1 | Articles of Incorporation (incorporated by reference to Exhibit 3.1 to the Bank’s Form 8-A filed with the FDIC February 23, 2007) |
| | |
| 3.2 | Amended and Restated Bylaws (as adopted by the Board of Directors on December 19, 2018) (incorporated by reference to Exhibit 3.2 to the Bank’s Form 8-K filed with the FDIC December 19, 2018) |
| | |
| 4.1 | Description of Common Stock (filed herewith) |
ITEM 15. EXHIBITS, FINANCIAL STATEMENT SCHEDULES (continued)
| 10.1* | Qualified Profit Sharing Plan of Carter Bank & Trust (formerly the Qualified Profit Sharing Plan of each of the Merged Banks and MCOV) (incorporated by reference to Exhibit 10.1 to the Bank’s Form 10-K filed with the FDIC July 6, 2007) |
| | |
| 10.2* | Nonqualified Profit Sharing Plan of Carter Bank & Trust (formerly the Nonqualified Profit Sharing Plan of MCOV) (incorporated by reference to Exhibit 10.2 to the Bank’s Form 10-K filed with the FDIC July 6, 2007) |
| | |
| 10.3* | Employment Agreement, dated as of June 19, 2017, by and between Carter Bank & Trust and Wendy S. Bell (incorporated by reference to Exhibit 10.3 to the Bank’s Form 8-K filed with the FDIC June 20, 2017) |
| | |
| 10.3.1* | First Amendment to Employment Agreement, dated as of December 17, 2019, by and between Carter Bank & Trust and Wendy S. Bell (filed herewith) |
| | |
| 10.4* | Employment Agreement, dated as of September 29, 2017, by and between Carter Bank & Trust and Litz Van Dyke (incorporated by reference to Exhibit 10.4 to the Bank’s Form 8-K filed with the FDIC October 3, 2017) |
| | |
| 10.5* | First Amended and Restated Employment Agreement, dated as of December 16, 2019, by and between Carter Bank & Trust and Phyllis Q. Karavatakis (incorporated by reference to Exhibit 10.5 to the Bank’s Form 8-K/A filed with the FDIC December 17, 2019) |
| | |
| 10.6* | Employment Agreement, dated as of September 29, 2017, by and between Carter Bank & Trust and Jane Ann Davis (incorporated by reference to Exhibit 10.6 to the Bank’s Form 8-K filed with the FDIC October 3, 2017) |
| | |
| 10.7* | Employment Agreement, dated as of May 31, 2017, by and between Carter Bank & Trust and Bradford N. Langs (incorporated by reference to Exhibit 10.7 to the Bank’s Form 10-K filed with the FDIC March 15, 2018) |
| | |
| 10.7.1* | First Amendment to Employment Agreement, dated as of December 17, 2019, by and between Carter Bank & Trust and Bradford N. Langs (filed herewith) |
| | |
| 10.8* | Employment Agreement, dated as of June 15, 2017, by and between Carter Bank & Trust and Matthew M. Speare (incorporated by reference to Exhibit 10.8 to the Bank’s Form 10-K filed with the FDIC March 15, 2018) |
| | |
| 10.9* | Carter Bank & Trust 2018 Omnibus Equity Incentive Plan (incorporated by reference to the Bank’s Proxy Statement filed with the FDIC April 30, 2018) |
| | |
| 10.9.1* | Form of Time-Based Restricted Stock Agreement (for employee) for use under the Carter Bank & Trust 2018 Omnibus Equity Incentive Plan (filed herewith) |
| | |
| 10.9.2* | Form of Time-Based Restricted Stock Agreement (for non-employee director) for use under the Carter Bank & Trust 2018 Omnibus Equity Incentive Plan (filed herewith) |
| ITEM 15. EXHIBITS, FINANCIAL STATEMENT SCHEDULES (continued) |
| |
| 10.10* | Carter Bank & Trust Annual Incentive Plan as adopted November 15, 2018 (incorporated by reference to Exhibit 10.10 to the Bank’s Form 10-Q filed with the FDIC May 9, 2019) |
| | |
| 31.1 | Certification by principal executive officer pursuant to Rule 13a-14(a) (filed herewith) |
| | |
| 31.2 | Certification by principal financial officer pursuant to Rule 13a-14(a) (filed herewith) |
| | |
| 32.1 | Certification by principal executive officer pursuant to 18 U.S.C. §1350 (filed herewith) |
| | |
| 32.2 | Certification by principal financial officer pursuant to 18 U.S.C. §1350 (filed herewith) |
* Denotes management contract.
ITEM 16. FORM 10-K SUMMARY
Not applicable.
SIGNATURES
Pursuant to the requirements of Section 13 or 15(d) of the Securities Exchange Act of 1934, the registrant has duly caused this report to be signed on its behalf by the undersigned, thereunto duly authorized.
| | CARTER BANK & TRUST |
| | (Registrant) |
| | | |
| | By: | /s/Litz H. Van Dyke |
| | Name: | Litz H. Van Dyke |
| | Title: | Chief Executive Officer |
| | Date: | June 5, 2020 |
| | | |
| | By: | /s/ Wendy S. Bell |
| | Name: | Wendy S. Bell |
| | Title: | Senior Executive VP & Chief Financial Officer |
| | Date: | June 5, 2020 |
Pursuant to the requirements of the Securities Exchange Act of 1934, this report has been signed below by the following persons on behalf of the registrant and in the capacities and on the dates indicated.
| | | | | |
| By: | /s/ James W. Haskins | | By: | /s/ Litz H. Van Dyke |
| Name: | James W. Haskins | | Name: | Litz H. Van Dyke |
| Title: | Chairman of the Board | | Title: | Director and Chief Executive Officer |
| Date: | June 2, 2020 | | Date: | June 2, 2020 |
| | | | | |
| By: | /s/ Phyllis Q. Karavatakis | | By: | /s/ Michael R. Bird |
| Name: | Phyllis Q. Karavatakis | | Name: | Michael R. Bird |
| Title: | Vice Chairman and Senior Executive Vice President of Special Projects | | Title: | Director |
| Date: | June 2, 2020 | | Date: | June 2, 2020 |
| | | | | |
| By: | | | By: | /s/ Gregory W. Feldmann |
| Name: | Robert W. Conner | | Name: | Gregory W. Feldmann |
| Title: | Director | | Title: | Director |
| Date: | June 2, 2020 | | Date: | June 2, 2020 |
| | | | | |
| By: | | | By: | |
| Name: | Chester A. Gallimore | | Name: | Charles E. Hall |
| Title: | Director | | Title: | Director |
| Date: | June 2, 2020 | | Date: | June 2, 2020 |
| By: | | | By: | |
| Name: | Lanny A. Kyle, O.D. | | Name: | George W. Lester, II |
| Title: | Director | | Title: | Director |
| Date: | June 2, 2020 | | Date: | June 2, 2020 |
| | | | | |
| By: | | | By: | /s/ Catharine L. Midkiff |
| Name: | E. Warren Matthews | | Name: | Catharine L. Midkiff |
| Title: | Director | | Title: | Director |
| Date: | June 2, 2020 | | Date: | June 2, 2020 |
| | | | | |
| By: | /s/ J.E. Pigg | | | |
| Name: | Joseph E. Pigg | | | |
| Title: | Director | | | |
| Date: | June 2, 2020 | | | |
EXHIBIT 4.1
DESCRIPTION OF COMMON STOCK
The following is a summary description of the material features of the common stock, par value $1.00 per share, of Carter Bank & Trust (the “Bank”) based on the Bank’s Articles of Incorporation and Bylaws and relevant provisions of the laws of the Commonwealth of Virginia. This summary is not complete, and is qualified in its entirety by reference to the provisions of the Bank’s Articles of Incorporation and Bylaws and the laws of the Commonwealth of Virginia. The Bank’s Articles of Incorporation and Bylaws are included as exhibits to the Annual Report on Form 10-K of which this exhibit is a part.
The Bank’s Articles of Incorporation authorize 100,000,000 shares of common stock, par value $1.00 per share. The Bank’s common stock is traded on the Nasdaq Global Select Market (“NASDAQ”) under the symbol “CARE.”
Holders of the Bank’s common stock are entitled to receive dividends if, as and when declared by the bank’s Board of Directors. Holders of the Bank’s common stock are entitled to one vote per share on each matter submitted to a vote of shareholders. A majority of the outstanding shares of common stock of the Bank entitled to vote constitutes a quorum for a meeting of shareholders. If a quorum exits, action on a matter, other than the election of directors, is approved if the votes cast in favor of the matter exceed the votes opposing the matter, unless Virginia law or the Bank’s Articles of Incorporation require a greater number of affirmative votes. The Bank’s Articles of Incorporation and Bylaws provide for a single class of directors to be elected annually. Directors are elected by a plurality of the votes cast at a meeting at which a quorum exists. There are no cumulative voting rights in the election of directors.
Unless otherwise provided for in the Bank’s Articles of Incorporation, the Bank’s shareholders have no preemptive rights to purchase additional shares of the Bank’s common stock in order to preserve their proportionate ownership interest in the Bank if the Bank issues shares that might dilute the ownership interests of existing shareholders. Holders of the Bank’s common stock have no conversion, redemption or sinking fund rights. The outstanding shares of the Bank’s common stock are fully paid and unassessable.
Except as limited by Virginia law or the Bank’s Articles of Incorporation, the Bank’s Bylaws vest the power to amend the Bylaws in the Board of Directors by a majority vote of the total number of directors.
With regard to indemnification and elimination of liability, the Bank shall indemnify every individual made a party to a proceeding because he or she is or was a director or officer against liability incurred in the proceeding if: (i) he or she conducted himself or herself in good faith; and (ii) he or she believed, in the case of conduct in his or her official capacity with the Bank, that his or her conduct was in the best interests of the Bank and, in all other cases, that his or her conduct was at least not opposed to the Bank’s best interests (or with respect to an employee benefit plan, that his or her conduct was for a purpose he or she believed to be in the interests of the participants of and beneficiaries of the plan); and (iii) he or she had no reasonable cause to believe, in the case of any criminal proceeding, that his or her conduct was unlawful. The Bank shall not indemnify any individual against his or her willful misconduct, a knowing criminal violation, or any liability incurred in any proceeding charging improper personal benefit to him or her, whether or not by or in the right of the Bank or involving action in an official capacity, in which he or she was adjudged liable by a court of competent jurisdiction on the basis that personal benefit was improperly received by him or her.
Except as provided in the Bank’s Articles of Incorporation, in any proceeding brought by or in the right of the Bank or by or on behalf of its shareholders, a director or officer shall not be liable in for monetary damages arising out of or resulting from a single transaction, occurrence or course of conduct. The Bank’s Articles of Incorporation provide that the liability of a director or officer shall not be so eliminated if he or she engaged in willful misconduct or a knowing criminal violation or violation of any federal or state securities law, including any claim of unlawful insider trading or manipulation of the market for any security.
Virginia law contains business combination statues that protect domestic corporations from hostile takeovers, and from actions following such a takeover, by restricting the voting rights of shares acquired by a person who has gained a significant holding in the Bank. The Bank’s Articles of Incorporation and Bylaws are silent with respect to these business combination statues; therefore, the laws of Virginia apply.
In the event of any liquidation, dissolution or winding up of the Bank, the holders of the Bank’s common stock will be entitled to receive, in cash or in kind, the assets of the Bank available for distribution remaining after payment or provision for payment of the Bank’s debts and liabilities.
EXHIBIT 10.3.1
FIRST AMENDMENT TO EMPLOYMENT AGREEMENT
THIS FIRST AMENDMENT TO EMPLOYMENT AGREEMENT (“Amendment”) is made and entered into as of this 17 day of December, 2019, by and between Wendy S. Bell (“Executive”) and Carter Bank & Trust (“Employer”), and is effective as of January 1, 2020.
WHEREAS, Employer and Executive entered into an Employment Agreement, dated July 24, 2017 (the “Original Agreement”); and
WHEREAS, Employer and Executive wish to amend the Original Agreement as set forth herein.
NOW, THEREFORE, the Employer and Executive agree to amend the Original Agreement as follows:
1. Section 1(a) shall be amended by deleting the first sentence thereof and replacing it with the following: “Executive shall be employed as Senior Executive Vice President, Chief Financial Officer (the “Position”) on the terms and subject to the conditions of this Agreement.”
2. All provisions of the Original Agreement that have not been amended by this Amendment shall remain in full force and effect. Notwithstanding the foregoing, to the extent there is any inconsistency between the provisions of the Original Agreement and this Agreement, the provisions of this Amendment shall control.
IN WITNESS WHEREOF, each of the parties hereto has caused this Amendment to be duly executed on its behalf, as of the day and year first written above.
| /s/ Wendy S. Bell | | 12/17/19 | |
| Wendy S. Bell | | Date | |
| | | | |
| | | | |
| CARTER BANK & TRUST | | | |
| | | | |
| | | | |
| /s/ Litz H. Van Dyke | | 12/17/19 | |
| Litz H. Van Dyke, CEO | | Date | |
EXHIBIT 10.7.1
FIRST AMENDMENT TO EMPLOYMENT AGREEMENT
THIS FIRST AMENDMENT TO EMPLOYMENT AGREEMENT (“Amendment”) is made and entered into as of this 17 day of December, 2019, by and between Bradford N. Langs (“Executive”) and Carter Bank & Trust (“Employer”), and is effective as of January 1, 2020.
WHEREAS, Employer and Executive entered into an Employment Agreement, dated May 31, 2017 (the “Original Agreement”); and
WHEREAS, Employer and Executive wish to amend the Original Agreement as set forth herein.
NOW, THEREFORE, the Employer and Executive agree to amend the Original Agreement as follows:
3. Section 1(a) shall be amended by deleting the first sentence thereof and replacing it with the following: “Executive shall be employed as President, Chief Strategy Officer of Employer (the “Position”) on the terms and subject to the conditions of this Agreement.”
4. All provisions of the Original Agreement that have not been amended by this Amendment shall remain in full force and effect. Notwithstanding the foregoing, to the extent there is any inconsistency between the provisions of the Original Agreement and this Agreement, the provisions of this Amendment shall control.
IN WITNESS WHEREOF, each of the parties hereto has caused this Amendment to be duly executed on its behalf, as of the day and year first written above.
| /s/ Bradford N. Langs | | 12/17/19 | |
| Bradford N. Langs | | Date | |
| | | | |
| | | | |
| CARTER BANK & TRUST | | | |
| | | | |
| | | | |
| /s/ Litz H. Van Dyke | | 12/17/19 | |
| Litz H. Van Dyke, CEO | | Date | |
EXHIBIT 10.9.1
CARTER BANK & TRUST
TIME-BASED RESTRICTED STOCK AGREEMENT
(for employees)
Granted <<AWARD DATE>>
This Time-Based Restricted Stock Agreement (this “Agreement”) is entered into as of <<AWARD DATE>> (the “Award Date”) pursuant to Article VII of the Carter Bank & Trust 2018 Omnibus Equity Incentive Plan (the “Plan”), and evidences the grant of Restricted Stock and the terms, conditions and restrictions pertaining thereto (the “Award”) to <<NAME>> (the “Participant”).
WHEREAS, Carter Bank & Trust (the “Bank”) maintains the Plan under which the Committee or the Board may, among other things, award shares of the Bank’s common stock (the “Stock”) to such key employees of the Bank and its Subsidiaries as the Committee or the Board may determine, subject to terms, conditions and restrictions as it may deem appropriate; and
WHEREAS, pursuant to the Plan the Committee has awarded to the Participant a restricted stock award conditioned upon the execution by the Bank and the Participant of this Agreement setting forth all the terms and conditions applicable to such award;
NOW, THEREFORE, in consideration of the benefits which the Bank expects to be derived from the services rendered to it and its subsidiaries by the Participant and of the covenants contained herein, the parties hereby agree as follows:
| 1. | Award of Shares. Under the terms and conditions of the Plan, the Committee has awarded to the Participant a restricted stock award as of the Award Date covering <<NUMBER>> shares of Stock (the “Award Shares”), subject to the terms, conditions and restrictions set forth in this Agreement. |
| 2. | Period of Restriction and Vesting in the Award Shares. |
| (a) | Subject to earlier vesting or forfeiture as provided below, the period of restriction (the “Period of Restriction”) applicable to each portion of the Award Shares is the period from the Award Date through the applicable date provided below, provided the Participant’s employment with the Bank or its subsidiaries continues through such respective date: |
| Vesting Date | Percent of Award Shares Vesting
(in each case, rounded down to a
whole share, with the balance on
the final installment) |
| <<1st ANNIVERSARY OF AWARD DATE>> | 33⅓% |
| <<2nd ANNIVERSARY OF AWARD DATE>> | 33⅓% |
| <<3rd ANNIVERSARY OF AWARD DATE>> | 33⅓% |
| (b) | Notwithstanding any other provision of this Agreement to the contrary (but subject to Section 13): |
| (i) | If the Participant’s employment with the Bank and its subsidiaries is terminated during the Period of Restriction applicable to any portion of the Award Shares due to his death or Disability (as defined in the Plan), any remaining Period of Restriction applicable to any portion of the Award Shares at the date of such termination of employment shall automatically terminate and such Award Shares shall be free of restrictions and freely transferable as of such date. |
| (ii) | If the Participant’s employment with the Bank and its subsidiaries is involuntarily terminated without Cause during the Period of Restriction applicable to any portion of the Award Shares, or if the Participant resigns employment with the Bank and its subsidiaries for Good Reason (as defined in the Plan) during the Period of Restriction applicable to any portion of the Award Shares, or if the Participant’s employment with the Bank and its subsidiaries is terminated during the Period of Restriction applicable to any portion of the Award Shares due to retirement (as determined by the Committee in its sole discretion), in each case not occurring in connection with a Change of Control (as defined in the Plan), the Committee may, in its sole discretion on or before the date of termination of employment, waive the automatic forfeiture of any or all unvested Award Shares otherwise provided in Section 6 and provide for such vesting as it deems appropriate subject to such new restrictions, if any, applicable to the Award Shares as it deems appropriate. |
| (iii) | If a Change of Control of the Bank occurs during the Period of Restriction applicable to any portion of the Award Shares and the Participant has remained in employment with the Bank or any of its subsidiaries through the date such Change of Control occurs, any remaining Period of Restriction applicable to any portion of the Award Shares at the date such Change of Control occurs shall automatically terminate and such Award Shares shall be free of restrictions and freely transferable as of such date. |
| (c) | Except as contemplated in Section 2(a) or 2(b), the Award Shares may not be sold, transferred, pledged, assigned or otherwise alienated or hypothecated by the Participant during the Period of Restriction applicable to such Award Shares; provided, however, that this Section 2(c) shall not prevent transfers by will or by the applicable laws of descent and distribution, or to a Beneficiary upon the death of the Participant and provided further that the Committee may permit, in its sole discretion, transfers of Award Shares pursuant to a domestic relations order during the lifetime of the Participant. |
| 3. | Stock Certificates. The Award Shares shall be registered on the Bank’s stock transfer books in the name of the Participant in book-entry or electronic form or in certificated form as determined by the Committee. During the Period of Restriction applicable to any portion of the Award Shares, any Award Shares issued in book-entry or electronic form shall be subject to the following legend, and any certificate(s) evidencing the Award Shares shall bear the following legend: |
The sale or other transfer of the shares of stock represented by this certificate, whether voluntary, involuntary, or by operation of law, is subject to certain restrictions on transfer set forth in the Carter Bank & Trust 2018 Omnibus Equity Incentive Plan, in the rules and administrative procedures adopted pursuant to such Plan, and in a restricted stock agreement dated <<AWARD DATE>>. A copy of the Plan, such rules and procedures, and such restricted stock agreement may be obtained from the Chief Financial Officer of Carter Bank & Trust.
| 4. | Voting Rights. During the Period of Restriction, the Participant may exercise full voting rights with respect to all of the Award Shares. |
| 5. | Dividends and Other Distributions. During the Period of Restriction, the Participant shall be entitled to receive all dividends and other distributions paid with respect to all of the Award Shares (other than dividends or distributions that are paid in shares of Stock). If, during the Period of Restriction, any dividends or distributions paid with respect to the Award Shares are paid in shares of Stock, such shares shall be registered in the name of the Participant and such shares shall be subject to the same restrictions on vesting and transferability as the Award Shares with respect to which they were paid. |
| 6. | Forfeiture on Termination of Employment. If the Participant’s employment with the Bank and its subsidiaries ceases prior to the end of the Period of Restriction for any portion of the Award Shares and Paragraph 2(b) does not apply or has not applied, then any Award Shares subject to restrictions at the date of such termination of employment shall be automatically forfeited to the Bank upon the date of such termination of employment. For purposes of this Agreement, transfer of employment among the Bank and its subsidiaries shall not be considered a termination of employment. |
| 7. | Employment. Nothing under the Plan or in this Agreement shall confer upon the Participant any right to continue in the employ of the Bank or its subsidiaries or in any way affect the Bank’s right to terminate Participant’s employment without prior notice at any time for any or no reason (subject to the terms of any employment agreement between the Participant and the Bank or a subsidiary). |
| 8. | Withholding Taxes. The Bank or any of its subsidiaries shall have the right to retain and withhold the amount of taxes required by any government to be withheld or otherwise deducted and paid with respect to the Award Shares, provided that the Bank or a subsidiary shall withhold only the minimum amount necessary to satisfy applicable statutory withholding requirements unless the Participant has elected to have an additional amount (up to the maximum allowed by law) withheld. At its discretion, the Committee may require the Participant to reimburse the Bank for any such taxes required to be withheld by the Bank and to withhold any distribution in whole or in part until the Bank is so reimbursed. In the event the Participant does not make other arrangements with the Bank for the satisfaction of taxes, the Bank shall have the right to withhold from any other cash amounts due or to become due from the Bank or a subsidiary to the Participant an amount equal to such taxes required to be withheld by the Bank to reimburse the Bank for any such taxes. |
| 9. | Certain Tax Matters. The Participant shall provide the Bank with a copy of any election made pursuant to Section 83(b) of the Internal Revenue Code of 1986, as amended from time to time, and similar provision of state law (collectively, an “83(b) Election”). If the Participant wishes to make an 83(b) Election, he must do so within a very limited period of time. The Participant acknowledges that he has been advised to consult with his tax advisor to determine if an 83(b) Election is appropriate and further acknowledges that the Participant is solely responsible for the payment of any taxes that may be due to any federal, state or local tax authority and the Bank is under no obligation to ensure any such taxes are paid by the Participant. |
| 10. | Administration. The Committee shall have full authority and discretion (subject only to the express provisions of the Plan) to decide all matters relating to the administration and interpretation of the Plan and this Agreement. All such Committee determinations shall be final, conclusive and binding upon the Bank and the Participant. |
| 11. | Notices. Any notice to the Bank required under or relating to this Agreement shall be in writing and addressed to: |
Carter Bank & Trust
Attention: Director of Human Resources
9112 Virginia Avenue
Bassett, Virginia 24055
Any notice to the Participant required under or relating to this Agreement shall be in writing and addressed to the Participant at the Participant’s address as it appears on the records of the Bank.
| 12. | Governing Law. This Agreement shall be construed and administered in accordance with and governed by the laws of the Commonwealth of Virginia. |
| 13. | Securities Laws. The Bank may require the Participant to make or enter into such written representations, warranties and agreements as the Committee or Board may reasonably request to comply with applicable securities laws. The Award Shares shall be subject to all applicable laws, rules and regulations and to such approvals of any governmental agencies as may be required. |
| 14. | Successors. This Agreement shall be binding upon and inure to the benefit of the successors, assigns, heirs and legal representatives of the respective parties. |
| 15. | Entire Agreement; Amendment and Termination. This Agreement contains the entire understanding of the parties. No amendment or termination of this Agreement that would be adverse to the rights of the Participant shall be made by the Board, the Committee or any plan administrator at any time without the written consent of the Participant. No amendment or termination of the Plan will adversely affect the right, title and interest of the Participant under this Agreement or to the Award granted hereunder without the written consent of the Participant. |
| 16. | Severability. The various provisions of this Agreement are severable in their entirety. Any determination of invalidity or unenforceability of any one provision shall have no effect on the continuing force and effect of the remaining provisions. |
| 17. | Capitalized Terms. Capitalized terms in this Agreement have the meaning assigned to them in the Plan, unless this Agreement provides, or the context requires, otherwise. |
| 18. | Plan. A copy of the Plan has been provided to the Participant, and the Participant acknowledges receipt thereof. |
To evidence its grant of the Award and the terms, conditions and restrictions thereof, the Bank has signed this Agreement as of the Award Date. This Agreement shall not become legally binding unless the Participant has signed this Agreement no later than the thirtieth (30th) day after the Award Date (or such later date as the Chairman of the Committee may accept). If the Participant fails to timely sign this Agreement, the Award shall be cancelled and forfeited ab initio.
| CARTER BANK & TRUST | | PARTICIPANT |
| | | |
| | | |
| | | |
| <<NAME>> | | <<NAME>> |
| <<TITLE>> | | |
| | | |
| Date: <<AWARD DATE>> | | Date: | |
EXHIBIT 10.9.2
CARTER BANK & TRUST
TIME-BASED RESTRICTED STOCK AGREEMENT
(for non-employee directors)
Granted <<AWARD DATE>>
This Time-Based Restricted Stock Agreement (this “Agreement”) is entered into as of <<AWARD DATE>> (the “Award Date”) pursuant to Article VII of the Carter Bank & Trust 2018 Omnibus Equity Incentive Plan (the “Plan”), and evidences the grant of Restricted Stock and the terms, conditions and restrictions pertaining thereto (the “Award”) to <<NAME>> (the “Participant”).
WHEREAS, Carter Bank & Trust (the “Bank”) maintains the Plan under which the Committee or the Board may, among other things, award shares of the Bank’s common stock (the “Stock”) to such non-employee directors of the Bank and its Subsidiaries as the Committee or the Board may determine, subject to terms, conditions and restrictions as it may deem appropriate; and
WHEREAS, pursuant to the Plan the Board has awarded to the Participant a restricted stock award conditioned upon the execution by the Bank and the Participant of this Agreement setting forth all the terms and conditions applicable to such award;
NOW, THEREFORE, in consideration of the benefits which the Bank expects to be derived from the services rendered to it and its subsidiaries by the Participant and of the covenants contained herein, the parties hereby agree as follows:
| 1. | Award of Shares. Under the terms and conditions of the Plan, the Board has awarded to the Participant a restricted stock award as of the Award Date covering <<NUMBER>> shares of Stock (the “Award Shares”), subject to the terms, conditions and restrictions set forth in this Agreement. |
| 2. | Period of Restriction and Vesting in the Award Shares. |
| (c) | Subject to earlier vesting or forfeiture as provided below, the period of restriction (the “Period of Restriction”) applicable to the Award Shares is the period from the Award Date through <<VEST DATE>>, provided the Participant’s service as a member of the Board of Directors of the Bank or its subsidiaries continues through such date. |
| (d) | Notwithstanding any other provision of this Agreement to the contrary (but subject to Section 12): |
| (i) | If the Participant’s service as a member of the Board of Directors of the Bank and its subsidiaries is terminated during the Period of Restriction due to his death or Disability (as defined in the Plan), any remaining Period of Restriction applicable to the Award Shares at the date of such termination of service shall automatically terminate and such Award Shares shall be free of restrictions and freely transferable as of such date. |
| (ii) | If the Participant’s service as a member of the Board of Directors of the Bank and its subsidiaries is terminated during the Period of Restriction due to retirement at or after age 60, with 10 full years of service as a member of the Board of Directors of the Bank or its subsidiaries, with the consent of the Committee or its delegate, any remaining Period of Restriction applicable to the Award Shares at the date of such termination of service shall automatically terminate and such Award Shares shall be free of restrictions and freely transferable as of such date. |
| (iii) | If a Change of Control of the Bank occurs during the Period of Restriction and the Participant has remained in service as a member of the Board of Directors of the Bank or any of its subsidiaries through the date such Change of Control occurs, any remaining Period of Restriction applicable to the Award Shares at the date such Change of Control occurs shall automatically terminate and such Award Shares shall be free of restrictions and freely transferable as of such date. |
| (c) | Except as contemplated in Section 2(a) or 2(b), the Award Shares may not be sold, transferred, pledged, assigned or otherwise alienated or hypothecated by the Participant during the Period of Restriction; provided, however, that this Section 2(c) shall not prevent transfers by will or by the applicable laws of descent and distribution, or to a Beneficiary upon the death of the Participant and provided further that the Board or the Committee may permit, in its sole discretion, transfers of Award Shares pursuant to a domestic relations order during the lifetime of the Participant. |
| 3. | Stock Certificates. The Award Shares shall be registered on the Bank’s stock transfer books in the name of the Participant in book-entry or electronic form or in certificated form as determined by the Board or the Committee. During the Period of Restriction, any Award Shares issued in book-entry or electronic form shall be subject to the following legend, and any certificate(s) evidencing the Award Shares shall bear the following legend: |
The sale or other transfer of the shares of stock represented by this certificate, whether voluntary, involuntary, or by operation of law, is subject to certain restrictions on transfer set forth in the Carter Bank & Trust 2018 Omnibus Equity Incentive Plan, in the rules and administrative procedures adopted pursuant to such Plan, and in a restricted stock agreement dated <<AWARD DATE>>. A copy of the Plan, such rules and procedures, and such restricted stock agreement may be obtained from the Chief Financial Officer of Carter Bank & Trust.
| 4. | Voting Rights. During the Period of Restriction, the Participant may exercise full voting rights with respect to all of the Award Shares. |
| 5. | Dividends and Other Distributions. During the Period of Restriction, the Participant shall be entitled to receive all dividends and other distributions paid with respect to all of the Award Shares (other than dividends or distributions that are paid in shares of Stock). If, during the Period of Restriction, any dividends or distributions paid with respect to the Award Shares are paid in shares of Stock, such shares shall be registered in the name of the Participant and such shares shall be subject to the same restrictions on vesting and transferability as the Award Shares with respect to which they were paid. |
| 6. | Forfeiture on Termination of Service. If the Participant’s service as a member of the Board of Directors of the Bank and its subsidiaries ceases prior to the end of the Period of Restriction and Section 2(b) does not apply or has not applied, then any Award Shares subject to restrictions at the date of such termination of service shall be automatically forfeited to the Bank upon the date of such termination of service. Notwithstanding the immediately preceding sentence, the Board or the Committee may, in its sole discretion, waive the forfeiture of any or all Award Shares and provide for such vesting as it deems appropriate, provided the Board or the Committee, as applicable, does so prior to the date the Participant ceases to serve as a member of the Board of Directors and its subsidiaries. |
| 7. | No Rights to Continued Service. Nothing under the Plan or in this Agreement shall confer upon the Participant any right to continue in the service of the Bank or its subsidiaries or in any way affect the Bank’s right to terminate Participant’s service or other affiliation with the Bank at any time. |
| 8. | Certain Tax Matters. The Participant shall provide the Bank with a copy of any election made pursuant to Section 83(b) of the Internal Revenue Code of 1986, as amended from time to time, and similar provision of state law (collectively, an “83(b) Election”). If the Participant wishes to make an 83(b) Election, he must do so within a very limited period of time. The Participant acknowledges that he has been advised to consult with his tax advisor to determine if an 83(b) Election is appropriate and further acknowledges that the Participant is solely responsible for the payment of any taxes that may be due to any federal, state or local tax authority and the Bank is under no obligation to ensure any such taxes are paid by the Participant. |
| 9. | Administration. The Board or the Committee shall have full authority and discretion (subject only to the express provisions of the Plan) to decide all matters relating to the administration and interpretation of the Plan and this Agreement. All such Board or Committee determinations, as applicable, shall be final, conclusive and binding upon the Bank and the Participant. |
| 10. | Notices. Any notice to the Bank required under or relating to this Agreement shall be in writing and addressed to: |
Carter Bank & Trust
Attention: [Director of Human Resources/Chairman of the Board/other]
9112 Virginia Avenue
Bassett, Virginia 24055
Any notice to the Participant required under or relating to this Agreement shall be in writing and addressed to the Participant at the Participant’s address as it appears on the records of the Bank.
| 11. | Governing Law. This Agreement shall be construed and administered in accordance with and governed by the laws of the Commonwealth of Virginia. |
| 12. | Securities Laws. The Bank may require the Participant to make or enter into such written representations, warranties and agreements as the Committee or Board may reasonably request to comply with applicable securities laws. The Award Shares shall be subject to all applicable laws, rules and regulations and to such approvals of any governmental agencies as may be required. |
| 13. | Successors. This Agreement shall be binding upon and inure to the benefit of the successors, assigns, heirs and legal representatives of the respective parties. |
| 14. | Entire Agreement; Amendment and Termination. This Agreement contains the entire understanding of the parties. No amendment or termination of this Agreement that would be adverse to the rights of the Participant shall be made by the Board, the Committee or any plan administrator at any time without the written consent of the Participant. No amendment or termination of the Plan will adversely affect the right, title and interest of the Participant under this Agreement or to the Award granted hereunder without the written consent of the Participant. |
| 15. | Severability. The various provisions of this Agreement are severable in their entirety. Any determination of invalidity or unenforceability of any one provision shall have no effect on the continuing force and effect of the remaining provisions. |
| 16. | Capitalized Terms. Capitalized terms in this Agreement have the meaning assigned to them in the Plan, unless this Agreement provides, or the context requires, otherwise. |
| 17. | Plan. A copy of the Plan has been provided to the Participant, and the Participant acknowledges receipt thereof. |
To evidence its grant of the Award and the terms, conditions and restrictions thereof, the Bank has signed this Agreement as of the Award Date. This Agreement shall not become legally binding unless the Participant has signed this Agreement no later than the thirtieth (30th) day after the Award Date (or such later date as the Chairman of the Board or the Chairman of the Committee may accept). If the Participant fails to timely sign this Agreement, the Award shall be cancelled and forfeited ab initio.
| CARTER BANK & TRUST | | PARTICIPANT |
| | | |
| | | |
| <<NAME>> | | <<NAME>> |
| <<TITLE>> | | |
| | | |
| Date: <<AWARD DATE>> | | Date: | |
CERTIFICATIONS
Exhibit 31.1
I, Litz H. Van Dyke, certify that:
1. I have reviewed this annual report on Form 10-K of Carter Bank & Trust;
2. Based on my knowledge, this report does not contain any untrue statement of a material fact or omit to state a material fact necessary to make the statements made, in light of the circumstances under which such statements were made, not misleading with respect to the period covered by this report;
3. Based on my knowledge, the financial statements, and other financial information included in this report, fairly present in all material respects the financial condition, results of operations and cash flows of the registrant as of, and for, the periods presented in this report;
4. The registrant’s other certifying officer and I are responsible for establishing and maintaining disclosure controls and procedures (as defined in Exchange Act Rules 13a-15(e) and 15d-15(e)) and internal control over financial reporting (as defined in Exchange Act Rules 13a-15(f) and 15d-15(f)) for the registrant and have:
(a) Designed such disclosure controls and procedures, or caused such disclosure controls and procedures to be designed under our supervision, to ensure that material information relating to the registrant, including its consolidated subsidiaries, is made known to us by others within those entities, particularly during the period in which this report is being prepared;
(b) Designed such internal control over financial reporting, or caused such internal control over financial reporting to be designed under our supervision, to provide reasonable assurance regarding the reliability of financial reporting and the preparation of financial statements for external purposes in accordance with generally accepted accounting principles;
(c) Evaluated the effectiveness of the registrant’s disclosure controls and procedures and presented in this report our conclusions about the effectiveness of the disclosure controls and procedures, as of the end of the period covered by this report based on such evaluation; and
(d) Disclosed in this report any change in the registrant’s internal control over financial reporting that occurred during the registrant’s most recent fiscal quarter (the registrant’s fourth fiscal quarter in the case of an annual report) that has materially affected, or is reasonably likely to materially affect, the registrant’s internal control over financial reporting; and
5. The registrant’s other certifying officer and I have disclosed, based on our most recent evaluation of internal control over financial reporting, to the registrant’s auditors and the audit committee of the registrant’s board of directors (or persons performing the equivalent functions):
(a) All significant deficiencies and material weaknesses in the design or operation of internal control over financial reporting which are reasonably likely to adversely affect the registrant’s ability to record, process, summarize and report financial information; and
(b) Any fraud, whether or not material, that involves management or other employees who have a significant role in the registrant’s internal control over financial reporting.
| Date: | June 5, 2020 | | | /s/ Litz H. Van Dyke |
| | | Litz H. Van Dyke |
| | | Chief Executive Officer |
CERTIFICATIONS
Exhibit 31.2
I, Wendy S. Bell, certify that:
1. I have reviewed this annual report on Form 10-K of Carter Bank & Trust;
2. Based on my knowledge, this report does not contain any untrue statement of a material fact or omit to state a material fact necessary to make the statements made, in light of the circumstances under which such statements were made, not misleading with respect to the period covered by this report;
3. Based on my knowledge, the financial statements, and other financial information included in this report, fairly present in all material respects the financial condition, results of operations and cash flows of the registrant as of, and for, the periods presented in this report;
4. The registrant’s other certifying officer and I are responsible for establishing and maintaining disclosure controls and procedures (as defined in Exchange Act Rules 13a-15(e) and 15d-15(e)) and internal control over financial reporting (as defined in Exchange Act Rules 13a-15(f) and 15d-15(f)) for the registrant and have:
(a) Designed such disclosure controls and procedures, or caused such disclosure controls and procedures to be designed under our supervision, to ensure that material information relating to the registrant, including its consolidated subsidiaries, is made known to us by others within those entities, particularly during the period in which this report is being prepared;
(b) Designed such internal control over financial reporting, or caused such internal control over financial reporting to be designed under our supervision, to provide reasonable assurance regarding the reliability of financial reporting and the preparation of financial statements for external purposes in accordance with generally accepted accounting principles;
(c) Evaluated the effectiveness of the registrant’s disclosure controls and procedures and presented in this report our conclusions about the effectiveness of the disclosure controls and procedures, as of the end of the period covered by this report based on such evaluation; and
(d) Disclosed in this report any change in the registrant’s internal control over financial reporting that occurred during the registrant’s most recent fiscal quarter (the registrant’s fourth fiscal quarter in the case of an annual report) that has materially affected, or is reasonably likely to materially affect, the registrant’s internal control over financial reporting; and
5. The registrant’s other certifying officer and I have disclosed, based on our most recent evaluation of internal control over financial reporting, to the registrant’s auditors and the audit committee of the registrant’s board of directors (or persons performing the equivalent functions):
(a) All significant deficiencies and material weaknesses in the design or operation of internal control over financial reporting which are reasonably likely to adversely affect the registrant’s ability to record, process, summarize and report financial information; and
(b) Any fraud, whether or not material, that involves management or other employees who have a significant role in the registrant’s internal control over financial reporting.
| Date: | June 5, 2020 | | | /s/ Wendy S. Bell |
| | | Wendy S. Bell |
| | | Senior Executive Vice President |
| | | Chief Financial Officer |
Exhibit 32.1
CERTIFICATION OF PRINCIPAL EXECUTIVE OFFICER
Pursuant to § 906 of the Sarbanes-Oxley Act of 2002 (18 U.S.C. § 1350)
Pursuant to § 906 of the Sarbanes-Oxley Act of 2002 (18 U.S.C. § 1350) I, Litz H. Van Dyke, as Chief Executive Officer of Carter Bank & Trust, certify that, to the best of my knowledge and belief, the Annual Report on Form 10-K for the period ended December 31, 2019, which accompanies this certification fully complies with the requirements of Section 13(a) of the Securities Exchange Act of 1934, as amended, and the information contained in the periodic report fairly presents, in all material respects, the financial condition and results of operations of Carter Bank & Trust at the dates and for the periods indicated. The foregoing certification is made pursuant to § 906 of the Sarbanes-Oxley Act of 2002 (18 U.S.C. § 1350) and shall not be relied upon for any other purpose. The undersigned expressly disclaims any obligation to update the foregoing certification except as required by law.
| Date: | June 5, 2020 | | | /s/ Litz H. Van Dyke |
| | | Litz H. Van Dyke |
| | | Chief Executive Officer |
| | | (Principal Executive Officer) |
Exhibit 32.2
CERTIFICATION OF PRINCIPAL FINANCIAL OFFICER
Pursuant to § 906 of the Sarbanes-Oxley Act of 2002 (18 U.S.C. § 1350)
Pursuant to § 906 of the Sarbanes-Oxley Act of 2002 (18 U.S.C. § 1350) I, Wendy S. Bell, as Senior Executive Vice President and Chief Financial Officer of Carter Bank & Trust, certify that, to the best of my knowledge and belief, the Annual Report on Form 10-K for the period ended December 31, 2019, which accompanies this certification fully complies with the requirements of Section 13(a) of the Securities Exchange Act of 1934, as amended, and the information contained in the periodic report fairly presents, in all material respects, the financial condition and results of operations of Carter Bank & Trust at the dates and for the periods indicated. The foregoing certification is made pursuant to § 906 of the Sarbanes-Oxley Act of 2002 (18 U.S.C. § 1350) and shall not be relied upon for any other purpose. The undersigned expressly disclaims any obligation to update the foregoing certification except as required by law.
| Date: | June 5, 2020 | | | /s/ Wendy S. Bell |
| | | Wendy S. Bell |
| | | Senior Executive Vice President |
| | | Chief Financial Officer |
| | | (Principal Financial Officer) |