Exhibit 4.6
Management’s Discussion and Analysis of
Triple Flag Precious Metals Corp.
For the three and six months ended June 30, 2022
(Expressed in United States Dollars)
MANAGEMENT’S DISCUSSION AND ANALYSIS OF
FINANCIAL CONDITION AND RESULTS OF OPERATIONS
This Management’s Discussion and Analysis (‘‘MD&A’’) is intended to help the reader understand Triple Flag Precious Metals Corp. (‘‘TF Precious Metals’’), its operations, financial performance and the present and anticipated future business environment. This MD&A, which has been prepared as of August 9, 2022, should be read in conjunction with the unaudited condensed interim consolidated financial statements of TF Precious Metals as at and for the three and six months ended June 30, 2022 (the “Interim Financial Statements”) which have been prepared in accordance with International Accounting Standard (“IAS”) 34, “Interim Financial Reporting”, as issued by the IASB. The unaudited condensed consolidated interim financial statements have been prepared on a basis consistent with the audited consolidated financial statements of TF Precious Metals for the years ended December 31, 2021 and 2020 (the “Annual Financial Statements”), which have been prepared in accordance with International Financial Reporting Standards as issued by the International Accounting Standards Board (“IFRS”). Certain notes to the Annual Financial Statements are specifically referred to in this MD&A. All amounts in this MD&A are in U.S. dollars unless otherwise indicated. References to “US$”, “$” or “dollars” are to United States dollars, references to “C$” are to Canadian dollars and references to “A$” are to Australian dollars. In this MD&A, all references to ‘‘Triple Flag’’, the ‘‘Company’’, ‘‘we’’, ‘‘us’’ or ‘‘our’’ refer to TF Precious Metals together with its subsidiaries, on a consolidated basis.
This MD&A contains forward-looking information. Forward-looking information is necessarily based on a number of opinions, estimates and assumptions that we considered appropriate and reasonable as of the date such statements are made, are subject to known and unknown risks, uncertainties, assumptions and other factors that may cause the actual results, level of activity, performance or achievements to be materially different from those expressed or implied by such forward-looking information, including but not limited to the risk factors described in the ‘‘Risk Factors” section of the Company’s annual information form (“AIF”) dated March 30, 2022 available on SEDAR at www.sedar.com. There can be no assurance that such forward-looking information will prove to be accurate, as actual results and future events could differ materially from those anticipated in such information. Accordingly, users should not place undue reliance on forward-looking information, which speaks only as of the date made. See ‘‘Forward-Looking Information’’.
Use of Non-IFRS Financial Performance Measures
We use the following non-IFRS financial performance measures in this MD&A:
| · | Gold Equivalent Ounces (“GEOs”) |
| · | Adjusted Net Earnings and Adjusted Net Earnings per Share |
| · | Cash Costs and Cash Costs per GEO |
For a detailed description of each of the non-IFRS financial performance measures used in this MD&A and a detailed reconciliation to the most directly comparable measure under IFRS, please refer to the Non-IFRS Financial Performance Measures section of this MD&A. The non-IFRS financial performance measures set out in this MD&A are intended to provide additional information to investors and do not have any standardized meaning under IFRS, and therefore may not be comparable to other issuers, and should not be considered in isolation or as a substitute for measures of performance prepared in accordance with IFRS.
Table of Contents
| Company Overview | 4 |
| | |
| Market Overview | 5 |
| | |
| Financial and Operating Highlights | 7 |
| | |
| 2022 Guidance | 10 |
| | |
| Sustainability Initiatives | 11 |
| | |
| Portfolio of Streaming and Royalty Interests | 12 |
| | |
| Key Developments | 14 |
| | |
| Operating Assets – Performance | 16 |
| | |
| Development Stage Assets | 18 |
| | |
| Portfolio of Investments | 19 |
| | |
| Financial Condition Review | 20 |
| | |
| Liquidity and Capital Resources | 26 |
| | |
| Quarterly Information | 27 |
| | |
| Commitments and Contingencies | 28 |
| | |
| Internal Controls over Financial Reporting | 30 |
| | |
| Public Securities Filings and Regulatory Announcements | 30 |
| | |
| IFRS Critical Accounting Policies and Accounting Estimates | 31 |
| | |
| Non-IFRS Financial Performance Measures | 31 |
| | |
| Forward-Looking Information | 35 |
| | |
| Technical and Third-Party Information | 36 |
Company Overview
Triple Flag is a gold-focused streaming and royalty company offering bespoke financing solutions to the metals and mining industry. Our mission is to be a preferred funding partner to mining companies throughout the commodity cycle by providing customized streaming and royalty financing, while offering value beyond capital as partners via our networks, capabilities and sustainability support.
From our inception in 2016 to our position now as an emerging senior streaming and royalty company, we have invested in excess of $1.7 billion of capital and systematically developed a long-life, low-cost, high-quality diversified portfolio of streams and royalties providing exposure primarily to gold and silver.
Recent Quarterly Performance
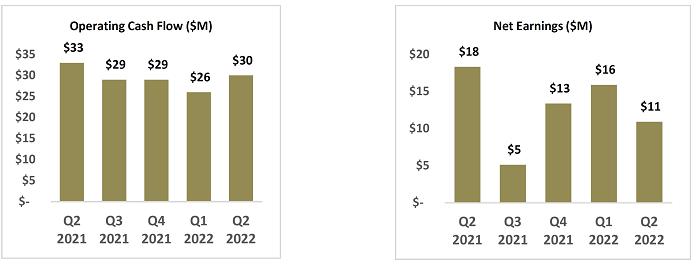
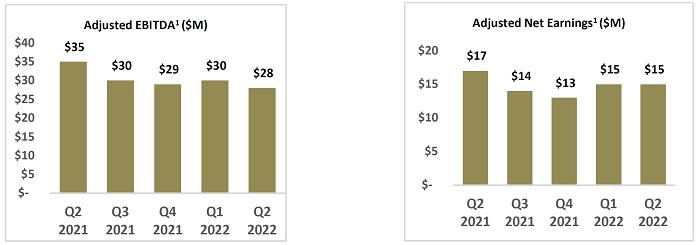
1Adjusted EBITDA and adjusted net earnings as presented above are non-IFRS financial performance measures with no standardized meaning under IFRS and, therefore, may not be comparable to similar measures presented by other issuers. For further information and a detailed reconciliation of each non-IFRS measure to the most directly comparable IFRS measure, see ‘‘Non-IFRS Financial Performance Measures’’ in this MD&A.
We currently have 80 assets, consisting of 9 streams and 71 royalties. These investments are tied to mining assets at various stages of the mine life cycle.
| Asset Count | | | |
| Producing | | | 15 | |
| Development & Exploration | | | 65 | |
| Total | | | 80 | |
Our portfolio is underpinned by a stable base of cash flow generating streams and royalties and is designed to grow intrinsically over time through exposure to potential mine life extensions, exploration success, new mine builds and throughput expansions. In addition, we are focused on further enhancing portfolio quality by executing accretive investments to grow the scale and quality of our portfolio of precious metal streams and royalties. We believe we have a differentiated approach to deal origination and due diligence, increasing the applicability of stream and royalty financing to an underserved mining sector, expanding the application of this form of financing through bespoke deal generation for miners while creating a high-quality, gold-focused portfolio of streams and royalties for our investors. We focus on ‘‘per share’’ metrics with the objective that accretive new investments are pursued with careful management of the capital structure to effectively compete for quality assets without incurring long-term financial leverage.
For a discussion of key trends and factors affecting our results of operations and financial position, see ‘‘Market Overview’’.
Market Overview
The market prices of gold and silver are primary drivers of our profitability and ability to generate free cash flow.
The following table sets forth the average gold and silver prices, and the average exchange rate between the Canadian and U.S. dollars, for the periods indicated.
| | | Three months ended June 30 | | | Six months ended June 30 | |
| Average Metal Prices/Exchange Rates | | 2022 | | | 2021 | | | 2022 | | | 2021 | |
| Gold (US$/oz)1 | | | 1,871 | | | | 1,816 | | | | 1,874 | | | | 1,805 | |
| Silver (US$/oz)2 | | | 22.60 | | | | 26.69 | | | | 23.32 | | | | 26.47 | |
| Exchange rate (US$/C$)3 | | | 1.2768 | | | | 1.2282 | | | | 1.2715 | | | | 1.2470 | |
1 Based on the London Bullion Market Association (“LBMA”) PM fix.
2 Based on the LBMA fix.
3 Based on Bank of Canada daily average exchange rate.
Gold
The market price of gold is subject to volatile price movements over short periods of time and can be affected by numerous macroeconomic factors including, but not limited to, the value of the U.S. dollar; the sale or purchase of gold by central banks and financial institutions; interest rates; inflation or deflation; global and regional supply and demand; and global political and economic conditions. The market price of gold is a significant contributor to the performance of our gold streams and royalty portfolio.
During the three months ended June 30, 2022, the gold price ranged from $1,810 to $1,977 per ounce, averaging $1,871 per ounce for the period, a 3% increase from the same period in the prior year. During the six months ended June 30, 2022, the gold price ranged from $1,788 to $2,039 per ounce, averaging $1,874 per ounce for the period, a 4% increase from the same period in the prior year. At June 30, 2022, the gold price was $1,817 per ounce (based on the LBMA PM fix). The average gold price declined during the second quarter of 2022, after approaching all-time highs in early March. The gold price declined as a result of spiking inflation permeating throughout the global economy and the reactionary interest rate hikes implemented by the U.S. Federal Reserve. The U.S. dollar had strong performance as investors retreated to the safe-haven asset, which typically has a negative impact on the price of gold. Additionally, investors are weighing the impacts of the extended conflict in Ukraine and its potential knock-on effects on global growth. Also, during the quarter, physically backed gold exchange traded funds (“ETFs”) saw global net outflows of $2 billion across all regions.
Silver
The market price of silver is also subject to volatile price movements. Silver, often considered a proxy for gold with a high level of correlation to the metal, is predominantly used in industrial applications and silver demand is also correlated to the Industrial Index. A rebound of manufacturing activity is expected to have a positive effect on silver as silver has many uses. The market price of silver is driven by factors similar to those influencing the market price of gold, as stated above. The market price of silver is a significant contributor to the performance of our silver streams.
During the three months ended June 30, 2022, the silver price ranged from $20.42 to $25.92 per ounce, averaging $22.60 per ounce for the period, a 15% decrease from the same period in the prior year. During the six months ended June 30, 2022, the silver price ranged from $20.42 to $26.18 per ounce, averaging $23.32 per ounce for the period, a 12% decrease from the same period in the prior year. At June 30, 2022, the silver price was $20.42 per ounce (based on the LBMA fix). Similar to gold, silver was influenced by U.S. Federal Reserve policy, the conflict in Ukraine, exchange traded fund flows and fluctuating investor demand.
Currency Exchange Rates
We are subject to minimal currency fluctuations as all our revenue and cost of sales are denominated in U.S. dollars, with the majority of general administration costs denominated in Canadian dollars. Given that general administration costs are not significant for us, movements in the exchange rate between Canadian and U.S. dollars do not have a significant impact on our results. We do not have any hedging programs in place for our non-U.S. dollar expenses given that the impact of currency fluctuation is insignificant.
Financial and Operating Highlights
Three and six months ended June 30, 2022 compared to three and six months ended June 30, 2021
| ($ thousands except GEOs, per share metrics, asset | | Three months ended June 30 | | | Six months ended June 30 | |
| margin, total margin and cash costs per GEO) | | 2022 | | | 2021 | | | 2022 | | | 2021 | |
| IFRS measures: | | | | | | | | | | | | | | | | |
| Revenue | | $ | 36,490 | | | $ | 40,939 | | | $ | 74,245 | | | $ | 76,305 | |
| Gross Profit | | | 21,282 | | | | 23,065 | | | | 42,826 | | | | 42,422 | |
| Depletion | | | 11,485 | | | | 14,083 | | | | 24,664 | | | | 27,114 | |
| General administration costs | | | 3,382 | | | | 2,047 | | | | 7,457 | | | | 3,996 | |
| Net Earnings | | | 10,922 | | | | 18,339 | | | | 26,811 | | | | 27,018 | |
| Net Earnings per Share - basic | | | 0.07 | | | | 0.13 | | | | 0.17 | | | | 0.19 | |
| Operating Cash Flow | | | 29,940 | | | | 32,754 | | | | 56,299 | | | | 61,563 | |
| Operating Cash Flow per Share | | | 0.19 | | | | 0.23 | | | | 0.36 | | | | 0.44 | |
| | | | | | | | | | | | | | | | | |
| Non-IFRS measures1: | | | | | | | | | | | | | | | | |
| GEOs | | | 19,507 | | | | 22,537 | | | | 39,620 | | | | 42,251 | |
| Adjusted Net Earnings | | | 14,854 | | | | 16,650 | | | | 30,326 | | | | 30,441 | |
| Adjusted Net Earnings per Share | | | 0.10 | | | | 0.12 | | | | 0.19 | | | | 0.22 | |
| Adjusted EBITDA | | | 28,144 | | | | 34,959 | | | | 58,601 | | | | 65,056 | |
| Free Cash Flow | | | 29,940 | | | | 32,754 | | | | 56,299 | | | | 61,563 | |
| Asset Margin | | | 90 | % | | | 91 | % | | | 91 | % | | | 91 | % |
| Total Margin | | | 77 | % | | | 85 | % | | | 79 | % | | | 85 | % |
| Cash Costs per GEO | | | 191 | | | | 168 | | | | 170 | | | | 160 | |
| | | | | | | | | | | | | | | | | |
| Acquisition of Mineral Interests | | $ | 5,434 | | | $ | 1,508 | | | $ | 14,562 | | | $ | 46,177 | |
1 GEOs, adjusted net earnings, adjusted net earnings per share, adjusted EBITDA, free cash flow, asset margin, total margin and cash costs per GEO as presented above and in the following discussion are non-IFRS financial performance measures with no standardized meaning under IFRS and therefore may not be comparable to similar measures presented by other issuers. For further information and a detailed reconciliation of each non-IFRS measure to the most directly comparable IFRS measure, see ‘‘Non-IFRS Financial Performance Measures’’ in this MD&A.
Three months ended June 30, 2022 compared to three months ended June 30, 2021
Revenue was $36.5 million, a decrease of 11% from $40.9 million for the same period in the prior year due to $2.4 million lower revenue due to lower volume from streams and royalties and $3.2 million lower revenue due to lower silver prices, partially offset by $0.7 million higher revenue due to higher diamond prices and $0.4 million higher revenue due to higher gold prices. Lower revenue from streams and royalties was largely driven by lower stream deliveries from the Cerro Lindo, Northparkes, and Buriticá streams, partially offset by higher stream deliveries from the ATO stream.
Gross profit was $21.3 million, a decrease of 8% from $23.1 million for the same period in the prior year. The decrease was driven by lower gross profit from the Cerro Lindo, Northparkes and Buriticá streams due to lower stream deliveries and lower silver prices, partially offset by higher gross profit from the ATO stream due to higher stream deliveries and higher gross profit from the Renard stream due to higher diamond prices.
Depletion was $11.5 million, a decrease of 18% from $14.1 million for the same period in the prior year. The decrease was largely driven by lower depletion from the Cerro Lindo and Northparkes streams due to lower metal sales.
General administration costs were $3.4 million, compared to $2.0 million for the same period in the prior year. Higher costs for the three months ended June 30, 2022 were largely due to higher employee costs driven by share-based payments granted to employees and directors, higher office, insurance and other expenses driven by various public company costs, including directors’ and officers’ liability insurance costs and higher professional services driven by increased costs associated with operating as a public company.
Net earnings were $10.9 million, compared to $18.3 million for the same period in the prior year. Lower net earnings in 2022 were driven by lower gross profit across the portfolio, higher general administration costs driven by public company costs, higher business development costs, higher expenditures on sustainability initiatives and higher mark to market losses from equity investments, partially offset by lower finance costs and lower income taxes.
Operating cash flow was $29.9 million, a decrease of 9% from $32.8 million for the same period in the prior year. The decrease was due to lower operating cash flow before working capital and taxes and higher net cash taxes paid, partially offset by working capital adjustments. Operating cash flow before working capital and taxes was $29.5 million, a decrease of 16% from $35.0 million for the same period in the prior year. The decrease was driven by lower cash flows from streams and royalties and higher general administration and business development costs and sustainability initiatives.
We sold 19,507 GEOs, a decrease of 13% from 22,537 GEOs sold for the same period in the prior year largely due to 1,960 GEOs lower from a higher ratio of gold prices to silver prices during the period as well as lower GEOs from the Northparkes and Cerro Lindo streams due to lower deliveries. This was partially offset by higher GEOs from the Renard stream due to higher diamond prices.
Adjusted net earnings were $14.9 million, compared to $16.7 million for the same period in the prior year. Key adjusting items included a $3.8 million mark to market loss on equity investments. Key adjusting items for the same period in the prior year included a $2.6 million mark to market gain on equity investments, a $0.3 million loss related to closing out the interest rate swap and $0.6 million of income tax on the adjustments.
Adjusted EBITDA was $28.1 million, a decrease of 19% from $35.0 million for the same period in the prior year. The decrease was due to lower adjusted EBITDA from streams and royalties, higher general administration and business development costs and higher expenditures on sustainability initiatives.
Free cash flow was $29.9 million, a decrease of 9% from $32.8 million for the same period in the prior year. The decrease reflected lower operating cash flow.
Asset margin was 90%, compared to 91% for the same period in the prior year. Lower margin was driven by an increase in the proportion of revenue from streams with lower margins, partially offset by an increase in the proportion of revenue from royalties, as a percentage of overall revenue, compared to streams. Royalties typically generate nearly a 100% margin.
Total margin was 77%, compared to 85% for the same period in the prior year. Lower total margin was driven by higher general administration costs driven by increased public company costs, higher business development costs and higher expenditures on sustainability initiatives.
Cash costs per GEO were $191, compared to $168 for the same period in the prior year. The increase is largely due to a higher proportion of streams with higher ongoing payments.
Acquisitions of mineral interests were $5.4 million, compared to $1.5 million for the same period in the prior year. Acquisitions in 2022 largely related to $5.2 million for the Sofia NSR Royalty and $0.2 million of stream funding for the Pumpkin Hollow gold and silver stream. Acquisitions in 2021 included a $1.3 million payment towards the IAMGOLD royalty portfolio and $0.2 million stream of funding for the Pumpkin Hollow gold and silver stream.
Six months ended June 30, 2022 compared to six months ended June 30, 2021
Revenue was $74.2 million, a decrease of 3% from $76.3 million for the same period in the prior year due to $4.1 million lower revenue due to lower silver prices and $0.6 million lower revenue due to lower volume from streams and royalties, partially offset by $1.9 million higher revenue due to higher diamond prices and $0.8 million higher revenue due to higher gold prices. Lower revenue from streams and royalties was driven by lower stream deliveries from the Cerro Lindo stream, partially offset by higher stream deliveries from the ATO stream.
Gross profit was $42.8 million, an increase of 1% from $42.4 million for the same period in the prior year. The increase was driven by higher gross profit from the ATO stream due to higher stream deliveries and higher gross profit from the Renard stream due to higher diamond prices, partially offset by lower gross profit from the Cerro Lindo stream due to lower stream deliveries and lower silver prices. The increase was also driven by a higher proportion of royalties compared to the same period in the prior year as royalties typically generate nearly a 100% margin.
Depletion was $24.6 million, a decrease of 9% from $27.1 million for the same period in the prior year. The decrease was largely driven by lower depletion from the Cerro Lindo stream due to lower metal sales.
General administration costs were $7.5 million, compared to $4.0 million for the same period in the prior year. Higher costs for the six months ended June 30, 2022 were largely due to higher employee costs driven by share based payments granted to employees and directors, higher office, insurance and other expenses driven by various public company costs, including directors’ and officers’ liability insurance costs and higher professional services driven by increased costs associated with operating as a public company.
Net earnings were $26.8 million, compared to $27.0 million for the same period in the prior year. Lower net earnings in 2022 were driven by higher general administration costs driven by public company costs, higher business development costs, higher expenditures on sustainability initiatives, higher mark to market losses from equity investments and higher income taxes, partially offset by higher gross profit across the portfolio, lower finance costs and gain on disposition of mineral interests.
Operating cash flow was $56.3 million, a decrease of 9% from $61.6 million for the same period in the prior year. The decrease was due to lower operating cash flow before working capital and taxes, higher net cash taxes paid and working capital adjustments. Operating cash flow before working capital and taxes was $61.0 million, a decrease of 6% from $64.5 million for the same period in the prior year. The decrease was driven by lower cash flows from streams and royalties and higher general administration and business development costs and expenditures on sustainability initiatives.
We sold 39,620 GEOs, a decrease of 6% from 42,251 GEOs sold for the same period in the prior year largely due to a higher ratio of gold prices to silver prices during the period as well as lower GEOs from the Cerro Lindo stream due to lower deliveries, partially offset by higher GEOs from the ATO stream due to higher deliveries as well as higher GEOs from the Renard stream due to higher diamond prices.
Adjusted net earnings were $30.3 million, compared to $30.4 million for the same period in the prior year. Key adjusting items included a $2.1 million gain on the Talon Royalty Buydown, a $4.5 million mark to market loss on equity investments, $0.2 million of foreign currency translation losses and $1.0 million of income tax on the adjustments. Key adjusting items for the same period in the prior year included a $1.9 million mark to market loss on equity investments, $0.7 million of IPO readiness costs related to a potential U.S. listing that was not pursued, a $0.3 million loss related to closing out the interest rate swap as well as $0.6 million of income tax on the adjustments.
Adjusted EBITDA was $58.6 million, a decrease of 10% from $65.1 million for the same period in the prior year. The decrease was due to lower adjusted EBITDA from streams and royalties and higher general administration and business development costs and higher expenditures on sustainability initiatives.
Free cash flow was $56.3 million, a decrease of 9% from $61.6 million for the same period in the prior year. The decrease reflected lower operating cash flow.
Asset margin was 91%, in line with the same period in the prior year.
Total margin was 79%, compared to 85% for the same period in the prior year. Lower total margin was driven by higher general administration costs driven by increased public company costs, higher business development costs and higher expenditures on sustainability initiatives.
Cash costs per GEO were $170, compared to $160 for the same period in the prior year. The increase was largely due to a higher proportion of streams with higher ongoing payments.
Acquisitions of mineral interests were $14.6 million, compared to $46.2 million for the same period in the prior year. Acquisitions in 2022 largely included $8.9 million of funding for the Beaufor royalty acquisition, $5.2 million of funding for the Sofia NSR Royalty acquisition and $0.4 million of stream funding for the Pumpkin Hollow gold and silver stream. Acquisitions in 2021 included $45.8 million of funding for the IAMGOLD royalty portfolio, including capitalized costs and $0.4 million of stream funding for the Pumpkin Hollow gold and silver stream.
2022 Guidance
The following contains forward-looking information. Reference should be made to the “Forward-Looking Information” and “Technical and Third-Party Information” sections at the end of this MD&A.
Our 2022 outlook on stream and royalty interests is based on publicly available forecasts of the owners or operators of properties on which we have stream and royalty interests. When publicly available forecasts on properties are not available, we obtain internal forecasts from the owners or operators, or use our own best estimate. We conduct our own independent analysis of this information to reflect our expectations based on an operator’s historical performance and track record of replenishing Mineral Reserves and the operator’s publicly disclosed guidance on future production, the conversion of Mineral Resources to Mineral Reserves, timing risk adjustments, drill results, our view on opportunities for mine plan optimization and other factors. We may also make allowances for the risk of uneven stream deliveries to factor in the potential for timing differences risking the attainment of public guidance ranges.
For H2 2022, gold, silver, copper, diamond and royalty revenues have been converted to GEOs using commodity prices of $1,750 per ounce of gold, $19.50 per ounce of silver, $3.50 per pound of copper and $110.00 per carat for diamonds. The Company expects its sales volumes of gold and silver for 2022 to be an annual record, and higher than expected in its original guidance. Revising H2 2022 commodity price forecasts to $1,750 per ounce of gold, $19.50 per ounce of silver, $3.50 per pound of copper and $110.00 per carat for diamonds results in a revision of our 2022 full year GEOs sales guidance to 88,000 – 92,000 GEOs from 90,000 – 95,000 GEOs previously, due to the change in the gold-silver ratio. Full-year 2022 GEOs are expected to be weighted to the second half of the year.
We continue to monitor the impact of the COVID-19 pandemic and the emergence of any variation of the virus. Our 2022 expected GEOs and depletion also assume that there will be no further mine suspensions or other operational disruptions as a result of COVID-19.
Sustainability Initiatives
We believe strong performance in the field of sustainability is critical to the long-term success of our organization, the mining industry and host communities. Investing in the pursuit of sensible best practices is simply good business for a long-term-focused organization such as Triple Flag, where we can help enhance the privilege to operate of our mining partners and assist their efforts for decarbonization as a capital provider, while maintaining the carbon neutral status of our attributable production associated with our investing activities for our investors. We believe that strong Environmental, Social and Governance (“ESG”) performance helps to ensure that: the mines and projects we invest in are developed and operated responsibly to protect worker health and safety as well as the environment; social impacts are identified, managed and mitigated; human rights are respected; and benefits accrue to local communities and a broad range of stakeholders.
We do not invest in oil and gas or coal, and we prioritize our non-core, non-precious metals activities in green metals like copper, nickel and related metals that will create the electrification infrastructure needed for the green economy of our future. When conducting due diligence, we engage with experienced ESG practitioners that complement our considerable team experience and capabilities in this area, who understand and can apply sound judgment about the potential materiality of short- and long-term risks so that we can avoid investing in projects that adversely impact the environment and local stakeholders. We aim to achieve net zero emissions by 2050 and are actively exploring pathways to achieve this target.
This quarter, we finalized our carbon credit offset purchase, maintaining our carbon neutrality since inception and offsetting 14,223 tCO2e in 2021 (at a cost of less than $10/t). We also purchased offsets in anticipation of 2022 greenhouse gas emissions to maintain carbon neutrality throughout the year. We are proud of our partnership with Climate Impact Partners, through which we purchase high-quality, independently verified carbon offset credits. To date, all of our purchased carbon offset credits (>50,000 t) have been independently verified by internationally recognized carbon standards, including the Verra Verified Carbon Standard Program, Gold Standard and the United Nations Clean Development Mechanism.
In our ongoing endeavor to provide education and expose the next generation of students to mining-related fields and encourage them to pursue education and careers in the industry, we have joined forces with two charitable organizations – Mining Matters and Young Mining Professionals.
Mining Matters is a Canadian charitable organization dedicated to educating young people to develop knowledge and awareness of Earth Sciences and the minerals industry through meaningful learning activities and innovative STEM education programs. Mining Matters provides engaging, hands-on mineral resources programming and practical mining educational opportunities for indigenous youth.
The Young Mining Professionals Scholarship Fund (“YMPSF”) was established to help fund and promote mining and mining-related education to Canada’s next-generation mining entrepreneurs. YMPSF’s mandate is to attract young people to Canada’s exploration and mining industry by supporting their academic studies in Earth Sciences post-secondary programs.
In continuing to seek to strengthen our ESG networks and stakeholder engagement practices, we are reviewing a number of international ESG initiatives, leadership organizations and industry associations to see where we can best contribute and derive value through meaningful engagement. We recently joined the World Gold Council, a network whose mission is to support a vibrant and sustainable future for the gold market, and to facilitate networking and the sharing of best practices. We also signed on to the United Nations Global Compact (“UNGC”) Target Gender Equality Initiative and the Women’s Empowerment Principles to strengthen our contribution towards equal representation, participation and leadership in business by women globally. Further, we have set a target of 30% women on our board as well as 30% diversity in our senior management, both by 2025.
We published our second annual Sustainability Report, entitled “Taking the Next Step”, in June 2022. This report presents information on our sustainability approach, governance, and performance for the 2021 calendar year, as well as future plans to improve our management of and performance on sustainability issues. This report has been prepared in accordance with the Global Reporting Initiative (“GRI”) Standards ‘Core option’ and serves as our Communication on Progress for the UNGC in support of the Sustainable Development Goals (“SDGs”). This year we have also aligned our disclosures with the Sustainability Accounting Standards Board’s (“SASB”) Metals and Mining Standard and the Asset Management and Custody Activities Standard.
Portfolio of Streaming and Royalty Interests
The following tables present our revenue and GEOs sold by asset for the periods indicated. GEOs are based on stream and royalty interests and are calculated on a quarterly basis by dividing all revenue from such interests for the quarter by the average gold price during that quarter. The gold price is determined based on the LBMA PM fix. For periods longer than one quarter, GEOs are summed for each quarter in the period.
Three and six months ended June 30, 2022 compared to three and six months ended June 30, 2021
| | | Three months ended June 30 | | | Six months ended June 30 | |
| Revenue ($000s) | | 2022 | | | 2021 | | | 2022 | | | 2021 | |
| Streaming Interests | | | | | | | | | | | | | | | | |
| Cerro Lindo | | $ | 10,049 | | | $ | 14,373 | | | $ | 22,402 | | | $ | 30,294 | |
| Northparkes | | | 6,340 | | | | 8,562 | | | | 13,210 | | | | 12,393 | |
| RBPlat | | | 3,377 | | | | 3,699 | | | | 7,609 | | | | 7,850 | |
| ATO | | | 4,846 | | | | 2,714 | | | | 5,616 | | | | 3,151 | |
| Renard | | | 2,287 | | | | 1,473 | | | | 4,630 | | | | 2,789 | |
| Buriticá | | | 1,125 | | | | 2,185 | | | | 3,635 | | | | 3,719 | |
| Other1 | | | 733 | | | | 561 | | | | 1,206 | | | | 988 | |
| | | $ | 28,757 | | | $ | 33,567 | | | $ | 58,308 | | | $ | 61,184 | |
| Royalty Interests | | | | | | | | | | | | | | | | |
| Fosterville | | $ | 4,517 | | | $ | 4,123 | | | $ | 8,587 | | | $ | 8,335 | |
| Young-Davidson | | | 1,411 | | | | 1,311 | | | | 2,936 | | | | 2,515 | |
| Dargues | | | 872 | | | | 750 | | | | 2,272 | | | | 1,777 | |
| Other2 | | | 933 | | | | 1,188 | | | | 2,142 | | | | 2,494 | |
| | | $ | 7,733 | | | $ | 7,372 | | | $ | 15,937 | | | $ | 15,121 | |
| Total | | $ | 36,490 | | | $ | 40,939 | | | $ | 74,245 | | | $ | 76,305 | |
| | | Three months ended June 30 | | | Six months ended June 30 | |
| Revenue ($000s) | | 2022 | | | 2021 | | | 2022 | | | 2021 | |
| Gold | | $ | 21,412 | | | $ | 20,978 | | | $ | 40,600 | | | $ | 36,810 | |
| Silver | | | 12,564 | | | | 18,254 | | | | 28,554 | | | | 36,472 | |
| Other | | | 2,514 | | | | 1,707 | | | | 5,091 | | | | 3,023 | |
| Total | | $ | 36,490 | | | $ | 40,939 | | | $ | 74,245 | | | $ | 76,305 | |
1 Includes revenue from Gunnison and Pumpkin Hollow.
2 Includes revenue from Eagle River, Hemlo, Henty and Stawell.
| | | Three months ended June 30 | | | Six months ended June 30 | |
| GEOs (ounces) | | 2022 | | | 2021 | | | 2022 | | | 2021 | |
| Streaming Interests | | | | | | | | | | | | | | | | |
| Cerro Lindo | | | 5,372 | | | | 7,913 | | | | 11,952 | | | | 16,788 | |
| Northparkes | | | 3,389 | | | | 4,713 | | | | 7,049 | | | | 6,848 | |
| RBPlat | | | 1,805 | | | | 2,036 | | | | 4,059 | | | | 4,350 | |
| ATO | | | 2,591 | | | | 1,494 | | | | 3,001 | | | | 1,738 | |
| Renard | | | 1,223 | | | | 811 | | | | 2,471 | | | | 1,544 | |
| Buriticá | | | 602 | | | | 1,203 | | | | 1,939 | | | | 2,058 | |
| Other1 | | | 392 | | | | 309 | | | | 644 | | | | 547 | |
| | | | 15,374 | | | | 18,479 | | | | 31,115 | | | | 33,873 | |
| Royalty Interests | | | | | | | | | | | | | | | | |
| Fosterville | | | 2,415 | | | | 2,270 | | | | 4,583 | | | | 4,618 | |
| Young-Davidson | | | 754 | | | | 722 | | | | 1,567 | | | | 1,393 | |
| Dargues | | | 466 | | | | 414 | | | | 1,212 | | | | 986 | |
| Other2 | | | 498 | | | | 652 | | | | 1,143 | | | | 1,381 | |
| | | | 4,133 | | | | 4,058 | | | | 8,505 | | | | 8,378 | |
| Total | | | 19,507 | | | | 22,537 | | | | 39,620 | | | | 42,251 | |
1 Includes GEOs from Gunnison and Pumpkin Hollow.
2 Includes GEOs from Eagle River, Hemlo, Henty and Stawell.
| | | Three months ended June 30 | | | Six months ended June 30 | |
| GEOs (ounces) | | 2022 | | | 2021 | | | 2022 | | | 2021 | |
| Gold | | | 11,446 | | | | 11,548 | | | | 21,669 | | | | 20,374 | |
| Silver | | | 6,717 | | | | 10,049 | | | | 15,234 | | | | 20,204 | |
| Other1 | | | 1,344 | | | | 940 | | | | 2,717 | | | | 1,673 | |
| Total | | | 19,507 | | | | 22,537 | | | | 39,620 | | | | 42,251 | |
1 Refers to copper and diamonds.
For the three months ended June 30, 2022, GEOs sold were 19,507 ounces, a decrease of 13% from 22,537 GEOs sold for the same period in the prior year, largely due to 1,960 lower GEOs from a higher ratio of gold prices to silver prices during the period. The balance of the decrease was largely driven by lower GEOs from the Northparkes and Cerro Lindo streams due to lower deliveries. This was partially offset by higher GEOs from the Renard stream due to higher diamond prices.
For the six months ended June 30, 2022, we sold 39,620 GEOs, a decrease of 6% from 42,251 GEOs sold for the same period in the prior year largely due to a higher ratio of gold prices to silver prices during the period as well as lower GEOs from the Cerro Lindo stream due to lower deliveries, partially offset by higher GEOs from the ATO stream due to higher deliveries as well as higher GEOs from the Renard stream due to higher diamond prices.
Key Developments
For the three and six months ended June 30, 2022
Stornoway restructuring
On April 29, 2022, Stornoway Diamonds (Canada) Inc. (“Stornoway”), the Renard Streamers (including TF R&S Canada Limited, a subsidiary of Triple Flag) and the secured creditors of Stornoway (including TF R&S Canada Limited) completed amendments to the Renard stream and secured debt of Stornoway. Key components of the agreements are as follows:
| · | The amounts outstanding under the Stornoway Working Capital Facility were fully repaid on April 29, 2022 (Stornoway repaid C$1.5 million to Triple Flag); |
| · | The Stornoway Working Capital Facility (the “Facility”) remains available to be drawn by Stornoway up to an amount of C$20 million in total (C$2.6 million attributable to Triple Flag). The maturity date of the Facility has been extended to December 31, 2025; |
| · | Stream payments will be required in a given quarter if |
| - | Stornoway satisfies certain minimum cash thresholds, and |
| - | No amounts are outstanding under the Facility; |
| · | In the event that Stornoway does not satisfy minimum cash thresholds at the end of a given quarter, the Renard Streamers will be required to resume reinvesting all or a portion of their net proceeds under the Renard Stream into the Stornoway Bridge Financing Facility (the “Bridge”); and |
| · | The maturity date of the Bridge and other loans has been extended to December 31, 2025, subject to further extension of the maturity of the Bridge to December 2028 in certain events. Certain amounts outstanding under the Bridge are subject to early repayment at the end of each year to the extent that Stornoway then satisfies certain excess cash thresholds. |
For the three months ended June 30, 2022, stream payments have resumed as a result of Stornoway satisfying the minimum cash threshold and having no amounts outstanding under the Facility.
Acquisition of Sofia NSR Royalty
On March 7, 2022, the Company entered into a royalty purchase agreement with a third party to acquire a 1% net smelter returns (“NSR”) royalty over the Sofia Project (“Sofia”), located in Chile, for $5 million. The transaction closed on May 3, 2022. Concurrent with the royalty purchase agreement, the Company also acquired 2 million common shares of 2673502 Ontario Inc., a company with a 96% interest in AndeX Minerals, which in turn owns 100% of Sofia, for C$3 million (the “AndeX Equity Interest”) and received a right of first refusal over an additional 1% NSR royalty covering Sofia.
Beaufor Royalty
On February 4, 2022, the Company entered into a royalty purchase agreement with a third party to acquire a 2% net smelter returns royalty (with a milestone-based stepdown to 1%) on the Beaufor Mine (the “Beaufor Royalty”) for C$6.75 million. In connection with this transaction, the Company entered into a binding agreement with Monarch Mining Corporation (“Monarch”), the operator of the Beaufor mine, to provide Monarch with additional funding of C$4.5 million in consideration for increasing the royalty rate to 2.75% and eliminating the step-down.
Talon Royalty Buydown
On February 15, 2022, Talon Nickel (USA) LLC (“Talon”) exercised its right to reduce the royalty rate under the Tamarack royalty agreement from 3.5% to 1.85% of Talon’s interest in the Tamarack project in exchange for a payment of $4.5 million (“Talon Royalty Buydown”). The Company acquired its royalty on the Tamarack project for $5 million in March 2019. This resulted in a gain on disposition of $2.1 million.
For the year ended December 31, 2021
Gunnison Stream Amendment
On December 22, 2021, the Company and Excelsior Mining Corp. including its subsidiaries (“Excelsior”), agreed to an amendment of the Stream Agreement between the Company and Excelsior, thereby helping facilitate certain transactions. Pursuant to the amendment, the Company and Excelsior agreed to remove Excelsior’s buydown option and concurrently agreed to re-price Triple Flag’s 3.5 million common share purchase warrants to C$0.54 per common share (from the prior exercise price of C$1.50 per common share). This amendment was reflected in our results for the year ended December 31, 2021 and did not have a material impact on our financial statements.
Acquisition of Chilean Royalty Portfolio
On December 21, 2021, we entered into an agreement with Azufres Atacama SCM to acquire 2% NSR royalties on each of the Aster 2, Aster 3 and Helada properties that are proximal to Gold Fields Limited’s (“Gold Fields”) Salares Norte project in Chile for $4.9 million. These properties cover prospective exploration ground that Gold Fields has been exploring. The Salares Norte project is currently under construction with anticipated first production in 2023. The royalties include buydown provisions that would reduce the amount of each NSR royalty from 2% to 1%. The amount to be received by the Company if the buydown provisions are exercised would be $2 million for the Aster 2 royalty and $4 million for each of the Aster 3 and Helada royalties.
Normal Course Issuer Bid and Automatic Share Purchase Plan
In December 2021, we established an Automatic Share Purchase Plan (“ASPP”) with the designated broker responsible for the normal course issuer bid (“NCIB”). The ASPP is intended to allow for the purchase of our common shares under the NCIB at times when we would ordinarily not be permitted to purchase our common shares due to regulatory restrictions and customary self-imposed blackout periods. Pursuant to the ASPP, prior to entering into a blackout period, the Company may instruct the designated broker to make purchases under the NCIB in accordance with the terms of the ASPP. Such purchases will be made by the designated broker in its sole discretion based on parameters established by us prior to the blackout period in accordance with the rules of the Toronto Stock Exchange (“TSX”), applicable securities laws and the terms of the ASPP.
In October 2021, we established an NCIB. Under the NCIB, the Company may acquire up to 2 million of its common shares from time to time in accordance with the NCIB procedures of the TSX. Repurchases under the NCIB are authorized until October 13, 2022. Daily purchases will be limited to 8,218 common shares, representing 25% of the average daily trading volume of the common shares on the TSX for the period from May 20, 2021 to October 5, 2021 (being 32,872 common shares), except where purchases are made in accordance with the “block purchase exemption” of the TSX rules. All common shares that are repurchased by the Company under the NCIB will be cancelled. For the three and six months ended June 30, 2022, the Company had purchased 8,218 and 26,808 of its common shares under the NCIB, respectively, which have been cancelled (three months ended December 31, 2021: 155,978 shares).
Dividend Reinvestment Plan
In October 2021, we announced that we had implemented a Dividend Reinvestment Plan (the “DRIP”). Participation in the DRIP is optional and will not affect shareholders’ cash dividends, unless they elect to participate in the DRIP. At the Company’s discretion, reinvestment will be made by acquiring common shares from the open market or issuing shares from Treasury. The plan is effective for dividends declared by the Company, beginning with dividends declared in November 2021.
Initial Public Offering
We closed our initial public offering (“IPO”) on May 26, 2021. We sold an aggregate of 19,230,770 treasury common shares at an offering price of $13.00 per share. On June 29, 2021, the underwriters of the IPO exercised an over-allotment option granted to purchase a further 1,058,553 treasury common shares at the initial offering price of $13.00 per share. The common shares are listed on the Toronto Stock Exchange in both Canadian and U.S. dollars under the symbols TSX:TFPM and TSX:TFPM.U, respectively. Total proceeds from the IPO, net of underwriter fees and various issue costs, were $245.1 million.
IAMGOLD Royalty Portfolio Purchase
On January 12, 2021, we entered into an agreement (the “IAMGOLD Agreement”) to purchase a royalty portfolio from IAMGOLD Corporation and certain of its subsidiaries (together, “IAMGOLD”). On March 26, 2021, we entered into an amendment to the IAMGOLD Agreement, pursuant to which we agreed to acquire a royalty portfolio consisting of 34 royalties on various exploration and development properties for an aggregate acquisition price of $45.7 million. The acquisition closed during the first half of 2021. Transaction costs incurred of $393 thousand were capitalized at the acquisition date.
Operating Assets – Performance
Our business is organized into a single operating segment, consisting of acquiring and managing precious metals and other high-quality streams and royalties. Our chief operating decision-maker, the CEO, makes capital allocation decisions, reviews operating results and assesses performance.
Asset Performance — Streams (producing)
| 1. | Cerro Lindo (Operator: Nexa Resources) |
Under the stream agreement with Nexa, we receive 65% of payable silver produced from the Cerro Lindo mine until 19.5 million ounces have been delivered and 25% thereafter. At June 30, 2022, 11.1 million ounces of silver had been delivered under the stream agreement with Nexa since inception.
Under the stream agreement, Nexa delivered 472,663 ounces of silver for the three months ended June 30, 2022, a 13% decrease from the same period in the prior year. We sold 472,663 ounces of silver received from the Cerro Lindo stream for the three months ended June 30, 2022, a 12% decrease from the same period in the prior year, driven by lower deliveries during the period. GEOs sold were 5,372 for the three months ended June 30, 2022, compared to 7,913 for the same period in the prior year, driven by a higher ratio of gold to silver prices and lower deliveries during the period.
For the six months ended June 30, 2022, Nexa delivered 939,289 ounces of silver, a 19% decrease from the same period in the prior year. We sold 973,483 ounces of silver received from the Cerro Lindo stream for the six months ended June 30, 2022, a 16% decrease from the same period in the prior year, driven by lower deliveries during the period. GEOs sold were 11,952 for the three months ended June 30, 2022, compared to 16,788 for the same period in the prior year, driven by a higher ratio of gold to silver prices and lower deliveries during the period.
| 2. | RBPlat PGM Operations (Operator: RBPlat) |
Under the stream agreement with RBPlat, we receive 70% of the payable gold until 261,000 ounces are delivered, and 42% of payable gold thereafter on the RBPlat PGM Operations. At June 30, 2022, 18,205 ounces of gold had been delivered under the stream agreement with RBPlat since inception. For the three months ended June 30, 2022, we sold the 1,791 ounces of gold delivered by RBPlat under the stream agreement, a 13% decrease from the ounces delivered and sold for the same period in the prior year. The decrease in metal sales was driven by lower deliveries. GEOs sold were 1,805 for the three months ended June 30, 2022, compared to 2,036 for the same period in the prior year.
For the six months ended June 30, 2022, we sold the 4,031 ounces of gold delivered by RBPlat under the stream agreement, a 7% decrease from the ounces delivered and sold in the prior year. The decrease in metal sales was driven by lower deliveries. GEOs sold were 4,059 for the six months ended June 30, 2022, compared to 4,350 for the prior year.
| 3. | Altan Tsagaan Ovoo (“ATO”) (Operator: Steppe Gold Limited) |
Under the stream agreement with Steppe Gold, we receive 25% of the payable gold until 46,000 ounces of gold have been delivered and thereafter 25% of payable gold subject to an annual cap of 7,125 ounces, and 50% of the payable silver until 375,000 ounces of silver have been delivered and thereafter 50% of payable silver subject to an annual cap of 59,315 ounces produced from the ATO mine in Mongolia. At June 30, 2022, 14,111 ounces of gold and 21,616 ounces of silver had been delivered under the stream agreement with Steppe Gold since inception.
For the three months ended June 30, 2022, we sold the 2,610 ounces of gold and 417 ounces of silver delivered to the Company, a 79% increase and 30% decrease from the same period in the prior year, respectively. GEOs sold were 2,591 for the three months ended June 30, 2022, compared to 1,494 for the same period in the prior year.
For the six months ended June 30, 2022, we sold the 2,978 ounces of gold and 3,514 ounces of silver delivered to the Company, a 76% increase and 376% increase from the same period in the prior year, respectively. GEOs sold were 3,001 for the six months ended June 30, 2022, compared to 1,738 for the same period in the prior year.
| 4. | Northparkes (Operator: CMOC) |
Under the stream agreement with CMOC, we receive 54% of the payable gold until an aggregate of 630,000 ounces have been delivered and thereafter 27% of payable gold, and 80% of the payable silver produced until an aggregate of 9 million ounces of silver have been delivered to us, and 40% of the payable silver thereafter for the remainder of the life of the mine. At June 30, 2022, 22,952 ounces of gold and 403,101 ounces of silver had been delivered under the stream agreement with CMOC since inception.
For the three months ended June 30, 2022, we sold the 2,691 ounces of gold and 56,307 ounces of silver delivered to the Company. This compares to 4,999 ounces of gold and 78,070 ounces of silver delivered and 3,783 ounces of gold and 59,570 ounces of silver sold in the same period in the prior year. GEOs sold were 3,389 for the three months ended June 30, 2022 as compared to 4,713 for the same period in the prior year.
For the six months ended June 30, 2022, 4,728 ounces of gold and 99,864 ounces of silver were delivered to the Company and 5,916 ounces of gold and 99,864 ounces of silver were sold. This compares to 6,875 ounces of gold and 104,509 ounces of silver delivered and 5,659 ounces of gold and 86,009 ounces of silver sold in the same period in the prior year. GEOs sold were 7,049 for the six months ended June 30, 2022, compared to 6,848 for the same period in the prior year.
| 5. | Buriticá (Operator: Zijin Mining) |
Under the stream agreement, we receive 100% of payable silver based on a fixed silver-to-gold ratio of 1.84 over the life of the asset.
For the three months ended June 30, 2022, we sold the 52,487 ounces of silver delivered under the agreement, a 34% decrease from the same period in the prior year. GEOs sold were 602 for the three months ended June 30, 2022 compared to 1,203 for the same period in the prior year.
For the six months ended June 30, 2022, we sold the 157,639 ounces of silver delivered under the agreement, a 13% increase from the same period in the prior year. GEOs sold were 1,939 for the six months ended June 30, 2022, compared to 2,058 for the same period in the prior year.
| 6. | Renard (Operator: Stornoway Diamond Corporation) |
Under the stream agreement with Stornoway Diamond Corporation (“Stornoway”) we receive 4% of payable carats over the life of the asset.
For the three months ended June 30, 2022, there were 18,394 diamond carats attributable to the Company under the agreement, a 5% increase from the same period in the prior year. GEOs sold were 1,223 for the three months ended June 30, 2022, compared to 811 for the same period in the prior year largely driven by higher diamond prices.
For the six months ended June 30, 2022, there were 34,758 diamond carats attributable to the Company under the agreement, a 2% decrease from the same period in the prior year. GEOs sold were 2,471 for the six months ended June 30, 2022, 1,544 compared to 2,058 for the same period in the prior year, largely driven by higher diamond prices.
Asset Performance — Royalties (Producing)
| 1. | Fosterville Gold Mine (Operator: Agnico Eagle effective February 8, 2022) |
We own a 2% NSR royalty interest in Agnico Eagle’s Fosterville mine in Australia. On July 27, 2022, Agnico Eagle reported second quarter 2022 results. For the three months ended June 30, 2022, Fosterville milled 122,000 tonnes of ore at an average grade of 22.24 g/t Au resulting in gold production of 86,065 ounces, compared to 157,993 ounces produced in the same period in the prior year,. Lower gold production resulted from lower ore milled at lower average grade. From February 8, 2022 to June 30, 2022 Fosterville milled 213,000 tonnes of ore, at an average grade of 24.76 g/t Au resulting in gold production of 167,892 ounces. For the six months ended June 30, 2022, Fosterville produced 212,772 ounces of gold, compared to 266,672 ounces produced for the same period in the prior year. Mine production continues to be affected by primary ventilation operating restrictions related to low frequency noise constraints. In the second quarter and first six months of 2022, the Company has successfully adjusted the mining sequence to offset production impacts.
GEOs earned were 2,415 and 4,583 for the three and six months ended June 30, 2022 respectively, compared to 2,270 and 4,618 for the same periods in the prior year.
| 2. | Young-Davidson Gold Mine (Operator: Alamos Gold) |
We own a 1.5% NSR royalty interest in Alamos Gold’s Young-Davidson mine in Canada. On July 27, 2022, Alamos Gold Inc. (‘‘Alamos Gold’’) reported second quarter 2022 results. For the three months ended June 30, 2022, Young-Davidson processed 705,014 tonnes of ore at an average grade of 2.25 g/t Au and a recovery of 91%, resulting in gold production of 46,400 ounces, a 3% increase from the same period in the prior year. For the six months ended June 30, 2022, Young-Davidson processed 1,442,742 tonnes of ore at an average grade of 2.32 g/t Au and a recovery of 91%, resulting in gold production of 98,300 ounces, a 6% increase from the same period in the prior year.
GEOs earned were 754 and 1,567 for the three and six months ended June 30, 2022, respectively, compared to 722 and 1,393 for the same periods in the prior year.
Development Stage Assets
Kemess Project (Operator: Centerra Gold Inc.)
In May 2018, we entered into a silver purchase and sale agreement for a 100% silver stream, subject to a fixed ratio floor of 5.5755 ounces of silver for each 1,000 pounds of payable copper produced from the Kemess underground area, subject to fixed payable metal percentages for copper and silver, in exchange for an initial upfront deposit of $45 million, payable in stages, following the public announcement of a construction decision, plus a payment equal to 10% of the average five-day silver market price for each ounce of silver purchased.
The Kemess project is a brownfield project located in British Columbia approximately 430 kilometers northwest of Prince George. The project is 100% owned by Centerra and includes the Kemess underground deposit, the Kemess East deposit and the existing infrastructure of the former Kemess South mine. Currently, the Kemess site is in care and maintenance with on-site activities focused on surface preparation work for future construction activities should Centerra decide to proceed with development. The public announcement of the construction decision will trigger our funding obligation and commencement of payments, as outlined in the “Contractual Obligations and Commitments” section of this MD&A.
Portfolio of Investments
Our assets include a portfolio of shares and warrants of various companies. We rarely, but occasionally, invest in companies as part of our acquisition of a stream, royalty or other similar interest. These investments are reflected within current assets on the consolidated financial statements. We may, from time to time, and without further notice except as required by law, increase or decrease our investments at our discretion.
The following table includes our investments as of June 30, 2022:
| Company | | Original Cost ($ thousands) | | | Fair Value ($ thousands) | |
| Excelsior Mining Corp.1 | | | 10,000 | | | | 1,927 | |
| Nevada Copper Corp.2 | | | 10,033 | | | | 503 | |
| Steppe Gold Ltd.3 | | | 895 | | | | 491 | |
| Other equity investments4 | | | 2,357 | | | | 2,357 | |
1 Includes 13,818,977 common shares and 3,500,000 common share purchase warrants exercisable to acquire one common share of Excelsior at a purchase price of C$0.54 (the “Excelsior Warrants”). The Excelsior Warrants were out of the money at June 30, 2022. The Excelsior Warrants expire on November 30, 2023.
2 Includes 2,500,000 common shares and 1,500,000 common share purchase warrants exercisable to acquire one common share of Nevada Copper at a purchase price of C$2.25 per common share, which expire on March 27, 2025 (the “Nevada Copper Warrants”). The Nevada Copper Warrants were out of the money at June 30, 2022.
3 Includes 580,000 common shares and 2,080,000 common share purchase warrants, each of which is exercisable to acquire one common share of Steppe Gold at a purchase price equal to the initial public offering price, expiring May 22, 2023 (the “Steppe Warrants”). Also includes 2,300,000 unit purchase warrants, each of which is exercisable to acquire: (i) one common share of Steppe Gold and (ii) one warrant exercisable to acquire one common share of Steppe Gold for a purchase price of C$2.00 per unit, expiring September 15, 2022 (the “Steppe Unit Warrants”).
4 Includes equity investments in private entities.
The following table includes our investments as of December 31, 2021:
| Company | | Original Cost ($ thousands) | | | Fair Value ($ thousands) | |
| Excelsior Mining Corp.1 | | | 10,000 | | | | 4,571 | |
| GoldSpot Discoveries Corp.2 | | | 1,953 | | | | 4,711 | |
| Talon Metals Corp.3 | | | 322 | | | | 2,397 | |
| Nevada Copper Corp.4 | | | 10,033 | | | | 1,389 | |
| Steppe Gold Ltd.5 | | | 895 | | | | 604 | |
1 Includes 13,818,977 common shares and the Excelsior Warrants, which were out of the money at December 31, 2021.
2 Includes 6,444,786 common shares, which were divested in the three months ended March 31, 2022, for C$4.2 million.
3 Includes 5,000,000 common shares, which were divested in the three months ended March 31, 2022, for C$3.7 million.
4 Includes 2,500,000 common shares and the Nevada Copper Warrants, which were out of the money at December 31, 2021.
5 Includes 580,000 common shares, the Steppe Warrants and the Steppe Unit Warrants.
Financial Condition Review
Summary Balance Sheet
The following table presents summarized consolidated balance sheet information as at June 30, 2022 and December 31, 2021:
| ($ thousands) | | As at June 30, 2022 | | | As at
December 31, 2021 | |
| Cash and cash equivalents | | $ | 74,431 | | | $ | 40,672 | |
| Other current assets | | | 14,236 | | | | 31,756 | |
| Non-current assets | | | 1,229,577 | | | | 1,230,981 | |
| Total assets | | $ | 1,318,244 | | | $ | 1,303,409 | |
| | | | | | | | | |
| Current liabilities | | $ | 4,590 | | | $ | 4,470 | |
| Other non-current liabilities | | | 5,637 | | | | 4,317 | |
| Total liabilities | | | 10,227 | | | | 8,787 | |
| Total shareholders’ equity | | | 1,308,017 | | | | 1,294,622 | |
| Total liabilities and shareholders’ equity | | $ | 1,318,244 | | | $ | 1,303,409 | |
Total assets were $1,318.2 million as at June 30, 2022, compared to $1,303.4 million as at December 31, 2021. Our asset base primarily consists of non-current assets such as mineral interests, which consist of our interests in streams and royalties. Our asset base also includes current assets, which generally include cash and cash equivalents, receivables, metal inventory and equity interests in various mining companies with which we have a stream or royalty interest. The increase in total assets from December 31, 2021 was driven by an increase in cash balances from operating cash flows generated and the addition of streams and royalties during the first six months of 2022 as we continued to grow through acquisitions, partially offset by net disposition of equity investments.
Total liabilities were $10.2 million as at June 30, 2022, compared to $8.8 million as at December 31, 2021. Total liabilities consist largely of amounts payable and accrued liabilities, deferred tax liabilities and lease obligations.
Total shareholders’ equity as at June 30, 2022 was $1,308.0 million, compared to $1,294.6 million as at December 31, 2021. The increase in shareholders’ equity included income generated during the period net of dividends paid.
Shareholders’ Equity
| As at June 30, 2022 | | Number of shares | |
| Common shares | | | 156,009,929 | |
| As at December 31, 2021 | | Number of shares | |
| Common shares | | | 156,036,737 | |
Our common shares are listed on the Toronto Stock Exchange in both Canadian and U.S. dollars under the symbols TSX:TFPM and TSX:TFPM.U, respectively. In the second quarter, the Company declared and paid a dividend of $0.0475 per share.
In October 2021, the Company established an NCIB. For the three months ended June 30, 2022, the Company purchased 8,218 of its common shares under the NCIB for $106 thousand. For the six ended June 30, 2022, the Company purchased 26,808 of its common shares under the NCIB for $331 thousand.
As at August 9, 2022, 156,009,929 common shares are issued and outstanding and stock options are outstanding to purchase a total of 3,032,771 common shares.
Comprehensive Income
Comprehensive income consists of net earnings or loss, together with certain other economic gains and losses, which, collectively, are described as ‘‘other comprehensive income (loss)’’ or ‘‘OCI’’ and excluded from the statement of income (loss). OCI includes realized and unrealized gains/losses from derivative contracts (interest rate swaps) designated as cash flow hedges. For the three months ended June 30, 2022, other comprehensive income was nil. For the three months ended June 30, 2021, other comprehensive income was $193 thousand on an after-tax basis, consisting of $25 thousand unrealized losses (after-tax) as well as $218 thousand realized losses (after-tax) from closing out the interest rate swap contracts from interest rate swap contracts designated as cash flow hedges. For the six months ended June 30, 2022, other comprehensive income was nil. For the six months ended June 30, 2021, other comprehensive income was $243 thousand on an after-tax basis, consisting of $25 thousand unrealized gains (after-tax) as well as $218 thousand realized losses (after-tax) from closing out the interest rate swap contracts designated as cash flow hedges. There was a nil balance in accumulated other comprehensive income (“AOCI”) at June 30, 2022.
Condensed Consolidated Statements of Income
Three and six months ended June 30, 2022 compared to three and six months ended June 30, 2021
The following table presents summarized consolidated statements of income information for the three and six months ended June 30, 2022 and 2021:
| ($ thousands except share and | | Three months ended June 30 | | | Six months ended June 30 | |
| per share information) | | 2022 | | | 2021 | | | 2022 | | | 2021 | |
| Revenue | | $ | 36,490 | | | $ | 40,939 | | | $ | 74,245 | | | $ | 76,305 | |
| Cost of sales | | | 15,208 | | | | 17,874 | | | | 31,419 | | | | 33,883 | |
| Gross profit | | | 21,282 | | | | 23,065 | | | | 42,826 | | | | 42,422 | |
| | | | | | | | | | | | | | | | | |
| General administration costs | | | 3,382 | | | | 2,047 | | | | 7,457 | | | | 3,996 | |
| Sustainability initiatives | | | 243 | | | | 22 | | | | 383 | | | | 354 | |
| Business development costs | | | 1,090 | | | | 219 | | | | 1,238 | | | | 329 | |
| IPO readiness costs | | | - | | | | - | | | | - | | | | 670 | |
| Operating income | | | 16,567 | | | | 20,777 | | | | 33,748 | | | | 37,073 | |
| | | | | | | | | | | | | | | | | |
| Gain on disposition of mineral interest | | | - | | | | - | | | | 2,099 | | | | - | |
| (Decrease) increase in fair value of investments | | | (3,834 | ) | | | 2,595 | | | | (4,492 | ) | | | (1,901 | ) |
| Finance costs, net | | | (442 | ) | | | (2,059 | ) | | | (979 | ) | | | (4,577 | ) |
| Loss on derivatives | | | - | | | | (297 | ) | | | - | | | | (297 | ) |
| Foreign currency translation (loss) gain | | | (100 | ) | | | 18 | | | | (153 | ) | | | 22 | |
| Other (expenses) income | | | (4,376 | ) | | | 257 | | | | (3,525 | ) | | | (6,753 | ) |
| Earnings (loss) before income taxes | | | 12,191 | | | | 21,034 | | | | 30,223 | | | | 30,320 | |
| Income tax expense | | | (1,269 | ) | | | (2,695 | ) | | | (3,412 | ) | | | (3,302 | ) |
| Net earnings (loss) | | $ | 10,922 | | | $ | 18,339 | | | $ | 26,811 | | | $ | 27,018 | |
| Weighted average shares outstanding –basic | | | 156,013,993 | | | | 143,534,434 | | | | 156,020,615 | | | | 139,739,993 | |
| Weighted average shares outstanding –diluted | | | 156,044,014 | | | | 143,534,434 | | | | 156,034,617 | | | | 139,739,993 | |
| Earnings per share – basic and diluted | | $ | 0.07 | | | $ | 0.13 | | | $ | 0.17 | | | $ | 0.19 | |
Three months ended June 30, 2022 compared to three months ended June 30, 2021
Revenue was $36.5 million, a decrease of 11% from $40.9 million for the same period in the prior year due to $2.4 million lower revenue due to lower volume from streams and royalties and $3.2 million lower revenue due to lower silver prices, partially offset by $0.7 million higher revenue due to higher diamond prices and $0.4 million higher revenue due to higher gold prices. Lower revenue from streams and royalties was largely driven by lower stream deliveries from the Cerro Lindo, Northparkes and Buriticá streams, partially offset by higher stream deliveries from the ATO stream.
Market gold price and gold sales volume for our streams were $1,871 per ounce and 7,312 ounces, respectively, compared to $1,816 per ounce and 7,433 ounces, respectively, in the prior year. Market silver price and silver sales volume were $22.60 per ounce and 586 thousand ounces, respectively, compared to $26.69 per ounce and 678 thousand ounces, respectively, in the prior year. Market gold price and attributable royalty ounces were $1,871 per ounce and 4,052 ounces, respectively, compared to $1,816 per ounce and 4,047 ounces, respectively, for the same period in the prior year.
Cost of sales primarily represented the price of metals acquired under the stream agreement as well as the depletion expense for streams and royalties, both of which are calculated based on units of metal sold or attributable royalty ounces. Cost of sales was $15.2 million (including depletion) from streams and royalties, compared to $17.9 million (including depletion) from streams and royalties for the same period in the prior year. The decrease in cost of sales for the three months ended June 30, 2022 was largely due to cost of sales associated with lower metal deliveries from streams.
Gross profit was $21.3 million, a decrease of 8% from $23.1 million for the same period in the prior year. The decrease was driven by lower gross profit from the Cerro Lindo, Northparkes and Buriticá streams due to lower stream deliveries and lower silver prices, partially offset by higher gross profit from the ATO stream due to higher stream deliveries and higher gross profit from the Renard stream due to higher diamond prices.
General administration costs were $3.4 million, compared to $2.0 million for the same period in the prior year. Higher costs for the three months ended June 30, 2022 were largely due to higher employee costs driven by share based payments granted to employees and directors, higher office, insurance and other expenses driven by various public company costs, including directors’ and officers’ liability insurance costs and higher professional services driven by increased costs associated with operating as a public company.
Business development costs were $1.1 million compared to $0.2 million for the same period in the prior year. Business development costs represent ongoing business development costs incurred throughout the year including use of third-party service providers, net of costs capitalized, and costs reimbursed from our counterparties.
Sustainability initiatives represent costs incurred to acquire carbon offsets to counter our carbon footprint, which consists of not only the greenhouse gas emissions associated with our direct business activities, but also includes our share of emissions associated with production of our attributable metals production by our counterparties, to the point of saleable metals. Sustainability initiatives also include partial funding of a bursary program in South Africa, community investments around the Northparkes mine as well as various social initiatives, including donations. For the three months ended June 30, 2022, expenditures on various sustainability initiatives were $243 thousand, compared to $22 thousand for the same period in the prior year. Sustainability initiatives for the three months ended June 30, 2022 included expenditures incurred in 2022 to acquire carbon offsets to counter our carbon footprint.
Movements in fair value of investments were a $3.8 million decrease, compared to a $2.6 million increase for the same period in the prior year. This was due to a decrease in market prices of our equity investments in the current period compared to an increase in market prices of our equity investments in the same period in the prior year.,
Finance costs, net were $0.4 million compared to $2.1 million for the same period in the prior year. The finance costs largely reflect interest charges and standby fees on the Credit Facility, net of interest earned on cash balances. Lower finance costs were driven by lower interest on debt, which was fully repaid during the third quarter of 2021, partially offset by higher standby charges driven by the lower outstanding debt balance.
Loss on derivatives was $0.3 million in the prior year. Subsequent to the IPO, the Company repaid most its Credit Facility and closed out the interest rate swap, resulting in a loss of $297 thousand. The Company has no hedge contracts at this time.
Income tax expense was $1.3 million, compared to $2.7 million for the same period in the prior year. The decrease in income tax expense was driven by tax recovery associated with increased general administration costs, business development costs and sustainability initiatives.
Net earnings were $10.9 million, compared to $18.3 million for the same period in the prior year. Lower net earnings in 2022 were driven by lower gross profit across the portfolio, higher general administration costs driven by public company costs, higher business development costs, higher expenditures on sustainability initiatives and higher mark to market losses from equity investments, partially offset by lower finance costs and lower income taxes.
Six months ended June 30, 2022 compared to six months ended June 30, 2021
Revenue was $74.2 million, a decrease of 3% from $76.3 million for the same period in the prior year due to $4.1 million lower revenue due to lower silver prices and $0.6 million lower revenue due to lower volume from streams and royalties, partially offset by $1.9 million higher revenue due to higher diamond prices and $0.8 million higher revenue due to higher gold prices. Lower revenue from streams and royalties was largely driven by lower stream deliveries from the Cerro Lindo stream, partially offset by higher stream deliveries from the ATO stream.
Market gold price and gold sales volume for our streams were $1,874 per ounce and 13,248 ounces, respectively, compared to $1,805 per ounce and 12,035 ounces, respectively, in the prior year. Market silver price and silver sales volume were $23.32 per ounce and 1.2 million ounces, respectively, compared to $26.47 per ounce and 1.4 million ounces, respectively, in the prior year. Market gold price and attributable royalty ounces were $1,874 per ounce and 8,692 ounces, respectively, compared to $1,805 per ounce and 8,359 ounces, respectively, for the same period in the prior year.
Cost of sales primarily represents the price of metals acquired under the stream agreement as well as the depletion expense for streams and royalties, both of which are calculated based on units of metal sold or attributable royalty ounces. Cost of sales was $31.4 million (including depletion) from streams and royalties, compared to $33.9 million (including depletion) from streams and royalties for the same period in the prior year. The decrease in cost of sales for the six months ended June 30, 2022 was largely due to cost of sales associated with lower metal deliveries from streams.
Gross profit was $42.8 million, an increase of 1% from $42.4 million for the same period in the prior year. The increase was driven by higher gross profit from the ATO stream due to higher stream deliveries and higher gross profit from the Renard stream due to higher diamond prices, partially offset by lower gross profit from the Cerro Lindo stream due to lower stream deliveries and lower silver prices.
General administration costs were $7.5 million, compared to $4.0 million for the same period in the prior year. Higher costs for the six months ended June 30, 2022 were largely due to higher employee costs driven by share based payments granted to employees and directors, higher office, insurance and other expenses driven by various public company costs, including directors’ and officers’ liability insurance costs and higher professional services driven by increased costs associated with operating as a public company.
Business development costs were $1.2 million, compared to $0.3 million for the same period in the prior year. Business development costs represent ongoing business development costs incurred throughout the year including use of third-party service providers, net of costs capitalized, and costs reimbursed from our counterparties.
Sustainability initiatives represent costs incurred to acquire carbon offsets to counter our carbon footprint, which consists of not only the greenhouse gas emissions associated with our direct business activities, but also includes our share of emissions associated with production of our attributable metals production by our counterparties, to the point of saleable metals. Sustainability initiatives also include partial funding of a bursary program in South Africa, community investments around the Northparkes mine as well as various social initiatives, including donations. For the six months ended June 30, 2022, expenditures on various sustainability initiatives were $0.4 million, in line with the same period in the prior year.
Movements in fair value of investments were a $4.5 million decrease, compared to a $1.9 million decrease for the same period in the prior year. This was due to a higher decrease in market prices of our equity investments in the current period, compared to the decrease in market prices of our equity investments in the same period in the prior year.
Finance costs, net were $1.0 million, compared to $4.6 million for the same period in the prior year. The finance costs largely reflect interest charges and standby fees on the Credit Facility, net of interest earned on cash balances. Lower finance costs were driven by lower interest on debt, which was fully repaid during the third quarter of 2021, partially offset by higher standby charges driven by the lower outstanding debt balance.
Gain on disposition of mineral interests of $2.1 million represents the gain on the Talon Royalty Buydown.
Loss on derivatives was $0.3 million in the prior year. Subsequent to the IPO, the Company repaid most of its Credit Facility and closed out the interest rate swap, resulting in a loss of $0.3 million. The Company has no hedge contracts at this time.
Income tax expense was $3.4 million, compared to $3.3 million for the same period in the prior year. The increase in income tax expense was driven by higher income tax associated with our Australian royalties, partially offset by tax recovery associated with increased general administration costs, business development costs and sustainability initiatives.
Net earnings were $26.8 million, compared to $27.0 million for the same period in the prior year. Lower net earnings in 2022 were driven by higher general administration costs driven by public company costs, higher business development costs, higher expenditures on sustainability initiatives, higher mark to market losses from equity investments and higher income taxes, partially offset by higher gross profit across the portfolio, gain on disposition of mineral interests and lower finance costs.
Condensed Statements of Cash Flows
Three and six months ended June 30, 2022 compared to three and six months ended June 30, 2021
The following table presents summarized consolidated statements of cash flow information for the three and six months ended June 30, 2022 and June 30, 2021.
| | | Three months ended June 30 | | | Six months ended June 30 | |
| ($ thousands) | | 2022 | | | 2021 | | | 2022 | | | 2021 | |
| Operating cash flow before working capital and taxes | | $ | 29,528 | | | $ | 34,957 | | | $ | 60,960 | | | $ | 64,543 | |
| Income taxes paid | | | (1,815 | ) | | | (52 | ) | | | (3,485 | ) | | | (2,306 | ) |
| Change in working capital | | | 2,227 | | | | (2,151 | ) | | | (1,176 | ) | | | (674 | ) |
| Operating cash flow | | | 29,940 | | | | 32,754 | | | | 56,299 | | | | 61,563 | |
| Net Cash used in investing activities | | | (5,434 | ) | | | (1,508 | ) | | | (6,161 | ) | | | (43,407 | ) |
| Net Cash used in financing activities | | | (8,086 | ) | | | (23,792 | ) | | | (16,301 | ) | | | (27,090 | ) |
| Effect of exchange rate changes on cash and cash equivalents | | | (121 | ) | | | 7 | | | | (78 | ) | | | 16 | |
| Increase (decrease) in cash during the period | | | 16,299 | | | | 7,461 | | | | 33,759 | | | | (8,918 | ) |
| Cash and cash equivalents at beginning of period | | | 58,132 | | | | 4,258 | | | | 40,672 | | | | 20,637 | |
| Cash and cash equivalents at end of period | | $ | 74,431 | | | $ | 11,719 | | | $ | 74,431 | | | $ | 11,719 | |
Three months ended June 30, 2022 compared to three months ended June 30, 2021
Operating cash flow was $29.9 million, a decrease of 9% from $32.8 million for the same period in the prior year. The decrease was due to lower operating cash flow before working capital and taxes and higher net cash taxes paid, partially offset by working capital adjustments. Operating cash flow before working capital and taxes was $29.5 million, a decrease of 16% from $35.0 million for the same period in the prior year. The decrease was driven by lower cash flows from streams and royalties and higher general administration and business development costs and sustainability initiatives.
Net cash used in investing activities was $5.4 million, compared to $1.5 million for the same period in the prior year. Net cash used in investing activities in 2022 largely included $5.2 million of funding for the Sofia NSR Royalty acquisition including transaction costs and $0.2 million of stream funding for the Pumpkin Hollow gold and silver stream. Net cash used in investing activities in 2021 included $1.3 million payment towards the IAMGOLD royalty portfolio and $0.2 million stream funding for the Pumpkin Hollow gold and silver stream.
Net cash used in financing activities was $8.1 million, compared to $23.8 million for the same period in the prior year. Net cash used in financing activities in 2022 largely consisted of dividend payments of $7.4 million, $0.1 million paid to purchase shares under the NCIB as well as interest payments of $0.5 million. Net cash used in financing activities in 2021 largely consisted of debt repayment and interest payments of $267.0 million and $1.8 million, respectively, partially offset by proceeds of $245.1 million from the IPO, including the over-allotment option, net of underwriting and other fees.
Six months ended June 30, 2022 compared to six months ended June 30, 2021
Operating cash flow was $56.3 million, a decrease of 9% from $61.6 million for the same period in the prior year. The decrease was due to lower operating cash flow before working capital and taxes, higher net cash taxes paid and working capital adjustments. Operating cash flow before working capital and taxes was $61.0 million, a decrease of 6% from $64.5 million for the same period in the prior year. The decrease was driven by lower cash flows from streams and royalties and higher general administration and business development costs and expenditures on sustainability initiatives.
Net cash used in investing activities was $6.2 million, compared to $43.4 million for the same period in the prior year. Net cash used in investing activities in 2022 largely included $8.9 million of funding for the Beaufor royalty acquisition including transaction costs, $5.2 million of funding for the Sofia NSR Royalty acquisition, $0.4 million of stream funding for the Pumpkin Hollow gold and silver stream, and C$3 million for the AndeX Equity Interest, partially offset by $4.5 million received for the Talon Royalty Buydown, proceeds of C$3.7 million for the disposition of 5,000,000 Talon Shares and C$4.2 million for the disposition of 6,444,786 GoldSpot shares. Net cash used in investing activities in 2021 included $45.8 million of funding for the IAMGOLD royalty portfolio and $0.4 million stream funding for the Pumpkin Hollow gold and silver stream, partially offset by $2.8 million of proceeds from the sale of 1.5 million of Steppe Gold shares.
Net cash used in financing activities was $16.3 million, compared to $27.1 million for the same period in the prior year. Net cash used in financing activities in 2022 largely consisted of dividend payments of $14.8 million, $0.3 million paid to purchase shares under the NCIB as well as interest payments of $1.0 million. Net cash used in financing activities in 2021 largely consisted of $312.0 million in debt repayments and $4.0 million in interest payments on long-term debt, partially offset by proceeds of $245.1 million from the IPO, including the over-allotment option, net of underwriting and other fees and drawdowns of $44.0 million on the Credit Facility.
Liquidity and Capital Resources
As of June 30, 2022, our cash and cash equivalents were $74.4 million, compared to $40.7 million as at December 31, 2021. Significant variations in the liquidity and capital resources during the period are explained in the ‘‘Condensed Statements of Cash Flows’’ section of this MD&A.
Our primary uses of capital are to finance operations, acquire new stream and royalty assets, general working capital and payment of dividends. Our objectives when managing capital are to ensure that we will continue to have enough liquidity to achieve our acquisition growth strategy, finance working capital requirements and provide returns to our shareholders. The timing of metal sales from inventory from our stream investments is based on commercial considerations, including our assessment of market conditions and our financial requirements. We believe our cash on hand, estimated cash flow from royalties, and the sales of metal credits will be sufficient to fund our anticipated operating cash requirements and payment of dividends for the next twelve months and beyond.
Credit Facility
The Company currently has a Credit Facility of $500 million with an additional uncommitted accordion of up to $100 million for a total availability of up to $600 million, maturing on August 30, 2023. As at June 30, 2022, the Credit Facility balance was nil. Finance costs relating to the credit facility for the three and six months ended June 30, 2022 were $0.8 million and $1.5 million respectively, including amortization of debt issuance costs and standby fees. This compares to finance costs of $2.2 million and $4.9 million respectively in the three and six months ended June 30, 2021, including interest charges, the impact of the pay-fixed receive-float interest rate swap, amortization of debt issuance costs and standby fees. The Credit Facility includes covenants that require us to maintain certain financial ratios including leverage ratios as well as certain non-financial requirements. As at June 30, 2022, all such ratios and requirements were met. The Credit Facility is used for general corporate purposes and investments in the mineral industry, including the acquisition of streams, royalties and other similar interests.
Interest Rate Swap
On April 30, 2020, we entered into a pay-fixed receive-float interest rate swap to hedge the LIBOR rate on $150 million of our Credit Facility. The swap had been designated as a cash flow hedge, as it converted the floating rate debt to fixed. Through the swap, interest on $150 million of the balance outstanding under the facility was fixed at 0.315% plus the applicable margin, depending on our leverage ratio. On May 28, 2021, we paid $297 thousand to terminate the swap. As a result, we discontinued hedge accounting and released a loss of $297 thousand ($218 thousand loss net of tax) from AOCI in the second quarter of 2021.
Quarterly Information1, 2
| | | 2022 | | | 2021 | | | 2020 | |
| | | Q2 | | | Q1 | | | Q4 | | | Q3 | | | Q2 | | | Q1 | | | Q4 | | | Q3 | |
| IFRS measures: | | | | | | | | | | | | | | | | | | | | | | | | | | | | | | | | |
| Cash and cash equivalents | | | 74,431 | | | | 58,132 | | | | 40,672 | | | | 26,705 | | | | 11,719 | | | | 4,258 | | | | 20,637 | | | | 11,827 | |
| Total assets | | | 1,318,244 | | | | 1,311,462 | | | | 1,303,409 | | | | 1,297,722 | | | | 1,306,368 | | | | 1,309,596 | | | | 1,300,919 | | | | 1,344,019 | |
| Revenue | | | 36,490 | | | | 37,755 | | | | 36,990 | | | | 37,126 | | | | 40,939 | | | | 35,366 | | | | 41,999 | | | | 24,470 | |
| Net earnings | | | 10,922 | | | | 15,889 | | | | 13,381 | | | | 5,128 | | | | 18,339 | | | | 8,679 | | | | 53,955 | | | | 8,915 | |
| Earnings per share (basic and diluted) | | | 0.07 | | | | 0.10 | | | | 0.09 | | | | 0.03 | | | | 0.13 | | | | 0.06 | | | | 0.40 | | | | 0.07 | |
| Operating cash flow | | | 29,940 | | | | 26,359 | | | | 28,997 | | | | 29,455 | | | | 32,754 | | | | 28,809 | | | | 30,721 | | | | 19,239 | |
| Operating cash flow per share | | | 0.19 | | | | 0.17 | | | | 0.19 | | | | 0.19 | | | | 0.23 | | | | 0.21 | | | | 0.23 | | | | 0.15 | |
| | | | | | | | | | | | | | | | | | | | | | | | | | | | | | | | | |
| Non-IFRS measures3: | | | | | | | | | | | | | | | | | | | | | | | | | | | | | | | | |
| GEOs | | | 19,507 | | | | 20,113 | | | | 20,605 | | | | 20,746 | | | | 22,537 | | | | 19,714 | | | | 22,409 | | | | 12,821 | |
| Adjusted Net Earnings | | | 14,854 | | | | 15,471 | | | | 13,409 | | | | 13,714 | | | | 16,650 | | | | 13,791 | | | | 16,734 | | | | 5,062 | |
| Adjusted Net Earnings per share | | | 0.10 | | | | 0.10 | | | | 0.09 | | | | 0.09 | | | | 0.12 | | | | 0.10 | | | | 0.12 | | | | 0.04 | |
| Adjusted EBITDA | | | 28,144 | | | | 30,457 | | | | 28,880 | | | | 29,549 | | | | 34,959 | | | | 30,097 | | | | 36,735 | | | | 20,619 | |
| | | | | | | | | | | | | | | | | | | | | | | | | | | | | | | | | |
| Average gold price4 | | | 1,871 | | | | 1,877 | | | | 1,795 | | | | 1,790 | | | | 1,816 | | | | 1,794 | | | | 1,874 | | | | 1,909 | |
| Average silver price5 | | | 22.60 | | | | 24.01 | | | | 23.33 | | | | 24.36 | | | | 26.69 | | | | 26.26 | | | | 24.39 | | | | 24.26 | |
1 All amounts in thousands of U.S. dollars except for GEOs, per share information, and average gold and silver price.
2 Sum of all the quarters may not add up to the annual total due to rounding.
3 GEOs, adjusted net earnings, adjusted net earnings per share and adjusted EBITDA as presented above are non-IFRS financial performance measures with no standardized meaning under IFRS and therefore may not be comparable to similar measures presented by other issuers. For further information and a detailed reconciliation of GEOs, adjusted net earnings, adjusted net earnings per share and adjusted EBITDA to the most directly comparable IFRS measure, see ‘‘Non-IFRS Financial Performance Measures’’ in this MD&A.
4 Based on the LBMA PM fix.
5 Based on the LBMA fix.
Our financial results for the last several quarters reflect significant growth in the business. Our asset base increased significantly as we continue to invest in additional streams and royalties. In the second quarter of 2022 we acquired the Sofia NSR Royalty. In the first quarter of 2022, we acquired the Beaufor royalty. In the fourth quarter of 2021, we completed the Chilean royalty acquisition for $4.9 million. In the third quarter of 2021, we repaid the remaining balance on our Credit Facility, leaving the Company debt-free and paid our inaugural dividend. In the second quarter of 2021, we successfully completed our IPO and paid down the majority of our Credit Facility, while achieving record GEOs and operating cash flow since inception. In the first quarter of 2021, we entered into an agreement with IAMGOLD to purchase a royalty portfolio consisting of 34 royalties on various exploration and development properties for $45.7 million.
In the fourth quarter of 2020, we began receiving metal deliveries from the Buriticá stream, and we received a full quarter of gold and silver deliveries from the Northparkes stream, achieving record quarterly revenues since inception. We also recorded a $30.9 million gain from the disposition of the Buriticá gold stream. In the third quarter of 2020, we entered into a gold and silver purchase and sale agreement in respect of the Northparkes mine in Australia for $550 million, and subsequently received the first gold and silver delivery from the Northparkes stream.
Commitments and Contingencies
From time to time, we may be involved in disputes with other parties arising in the ordinary course of business that may result in litigation. If we are unable to resolve these disputes favorably, it may have a material adverse impact on our financial condition, cash flow and results of operations. We record a liability when it is probable that a loss has been incurred and the amount can be reasonably estimated. We are not currently involved in any material legal proceedings.
Contractual Obligations and Commitments
In the normal course of business, we enter into contracts that give rise to commitments for future minimum payments.
Stream Agreements
As of June 30, 2022, we had significant commitments to make per-ounce cash payments for precious metals, copper and diamonds pursuant to the terms of the metals purchase and sale agreements as detailed in the following table:
| Mineral interest | | Commodity | | Inception date | | Unit | | Attributable
volume
purchased | | | Per unit
cash payment | | Term |
| Cerro Lindo | | Silver | | Dec. 20, 2016 | | Ounce | | | 65 | %1 | | 10% of monthly average | | Life of mine |
| ATO | | Gold | | Aug. 11, 2017 | | Ounce | | | 25 | %2 | | 17% of spot | | Life of mine |
| ATO | | Silver | | Aug. 11, 2017 | | Ounce | | | 50 | %3 | | 17% of spot | | Life of mine |
| Renard | | Diamond | | Nov. 29, 2017 | | Carat | | | 4 | % | | Lesser of 40% of achieved sales price or $40 | | Life of mine |
| Pumpkin Hollow | | Gold | | Dec. 21, 2017 | | Ounce | | | 97.5 | %4 | | 5% of spot | | Life of mine |
| Pumpkin Hollow | | Silver | | Dec. 21, 2017 | | Ounce | | | 97.5 | %4 | | 5% of spot | | Life of mine |
| Gunnison | | Copper | | Oct. 30, 2018 | | Pound | | | 16.5 | %5 | | 25% of spot | | Life of mine |
| Buriticá | | Silver | | Mar. 15, 2019 | | Ounce | | | 100 | %6 | | 5% of spot | | Life of mine |
| RBPlat | | Gold | | Oct. 13, 2019 | | Ounce | | | 70 | %7 | | 5% of spot | | Life of mine |
| Northparkes | | Gold | | Jul. 10, 2020 | | Ounce | | | 54 | %8 | | 10% of spot | | Life of mine |
| Northparkes | | Silver | | Jul. 10, 2020 | | Ounce | | | 80 | %8 | | 10% of spot | | Life of mine |
1 65% of payable silver produced from Cerro Lindo until 19.5 million ounces have been delivered and 25% thereafter.
2 25% of gold from ATO until 46,000 ounces of gold have been delivered and thereafter 25% of gold subject to an annual cap of 7,125 ounces.
3 50% of silver from ATO until 375,000 ounces of silver have been delivered and thereafter 50% of silver subject to an annual cap of 59,315 ounces.
4 Streamed gold is to be based on a fixed gold-to-copper ratio (being 162.5 ounces of gold for each million pounds of payable copper over the life of the asset) multiplied by a 97.5% gold stream percentage and streamed silver is to be based on a fixed silver-to-copper ratio (being 3,131 ounces of silver for each million pounds of payable copper over the life of the asset) multiplied by a 97.5% silver stream percentage.
5 The stream percentage of refined copper produced from the Gunnison mine ranges from 3.5% to 16.5% depending on the Gunnison mine’s total production capacity, with the stream percentage starting at 16.5% and decreasing as the Gunnison mine’s production capacity increases. We have the option to increase our stream participation percentage by paying an additional deposit of an amount up to $65 million.
6 Streamed silver is to be based on a fixed silver-to-gold ratio of 1.84 over the life of the asset.
7 70% of the payable gold until 261,000 ounces have been delivered, and 42% thereafter.
8 54% of the payable gold produced from the Northparkes mine until 630,000 ounces have been delivered and 27% thereafter; 80% of payable silver produced from the Northparkes mine until 9 million ounces have been delivered and 40% thereafter.
Investments in Stream and Royalty Interests
As of June 30, 2022, we had commitments related to the acquisition of streams and royalties as detailed in the following table:
| Company | | Project (Asset) | | Payments | | Triggering Event |
| AuRico Metals Inc. | | Kemess Project | | $10 million | | Positive construction decision |
| | | | | $10 million | | 1st anniversary |
| | | | | $12.5 million | | 2nd anniversary |
| | | | | $12.5 million | | 3rd anniversary |
| Nevada Copper Inc. | | Pumpkin Hollow | | $3.8 million | | 50% of cash flows generated from the stream from May 1, 2020 onwards |
| Nevada Copper Inc. | | Tedeboy Area | | $5 million | | Payment contingent upon commencement of commercial production |
| Stornoway Diamond Corporation | | Renard | | C$2.6 million | | Working capital funding request initiated from Stornoway |
| DS McKinnon Holdings Limited | | Hemlo Royalty | | C$50,000 | | For each 100,000 ounces of gold produced by the Hemlo mine in excess of 675,000 ounces |
| 154619 Canada Inc. | | Eagle River Royalty | | C$50,000 | | For each 50,000 ounces of gold produced by the Eagle River mine in excess of 207,000 ounces |
We have existing commitments, including with respect to the Kemess stream, Pumpkin Hollow stream, Tedeboy Area royalty, Renard diamond stream, as well as Hemlo and Eagle River royalties, which are noted in the above table. These are expected to be funded from operating cash flow over the next few years.
Contractual Obligations and Commitments
| ($ thousands) | | Less than 1 year | | | 1–3 years | | | 3–5 years | | | More than 5 years | | | Total | |
| Lease1 | | $ | 279 | | | $ | 619 | | | $ | 83 | | | $ | - | | | $ | 981 | |
| Lease interest1 | | | 53 | | | | 51 | | | | 1 | | | | - | | | | 105 | |
| Standby charges2 | | | 1,969 | | | | 329 | | | | - | | | | - | | | | 2,298 | |
| | | $ | 2,301 | | | $ | 999 | | | $ | 84 | | | $ | - | | | $ | 3,384 | |
1 We are committed to minimum amounts under long-term lease agreements for office space, which expire in 2025.
2 Represent standby charges on the Credit Facility, which matures on August 30, 2023.
Off-Balance Sheet Arrangements or Commitments
We have not entered into any off-balance sheet arrangements or commitments other than as set forth under ‘‘Contractual Obligations and Commitments’’.
Contingencies
Contingencies can be either possible assets or possible liabilities arising from past events which, by their nature, will be resolved only when one or more future events, not wholly within our control, occur or fail to occur. The assessment of such contingencies inherently involves the exercise of significant judgment and estimates of the outcome of future events. Refer to Note 20 to the Annual Financial Statements for further details on the contingencies.
We are not aware of any known trends, commitments (other than described above), events or uncertainties that will materially affect the Company.
Internal Controls over Financial Reporting
The Chief Executive Officer and Chief Financial Officer of the Company are responsible for designing internal controls over financial reporting or causing them to be designed under their supervision in order to provide reasonable assurance regarding the reliability of financial reporting and the preparation of financial statements for external purposes in accordance with IFRS. The Company’s internal control framework was designed based on the Committee of Sponsoring Organizations (COSO) of the Treadway Commission 2013 Framework.
There was no change in the Company’s internal controls over financial reporting that occurred during the three months ended June 30, 2022 that has materially affected, or is reasonably likely to materially affect, the Company’s internal controls over financial reporting.
Disclosure Controls and Procedures
Disclosure controls and procedures have been designed to provide reasonable assurance that all relevant information required to be disclosed by the Company is accumulated and communicated to senior management as appropriate to allow timely decisions regarding required disclosure.
Limitations of Controls and Procedures
The Company’s management, including the Chief Executive Officer and Chief Financial Officer, believe that any internal controls over financial reporting and disclosure controls and procedures, no matter how well designed, can have inherent limitations. Therefore, even those systems determined to be effective can provide only reasonable assurance that the objectives of the control system are met.
Public Securities Filings and Regulatory Announcements
Additional information related to Triple Flag, including the Company’s AIF dated March 30, 2022 are available on SEDAR at www.sedar.com. These documents contain descriptions of certain of Triple Flag’s stream and royalty interests, as well as a description of risk factors affecting the Company. For additional information, please see our website at www.tripleflagpm.com. The content of any website referred to in this report is not incorporated by reference in, and does not form part of, this report.
IFRS Critical Accounting Policies and Accounting Estimates
Management has discussed the development and selection of our critical accounting estimates with the Audit Committee and Board of Directors, and the Audit Committee has reviewed the disclosure relating to such estimates in conjunction with its review of this MD&A. The accounting policies and methods we utilize determine how we report our financial condition and results of operations, and they may require management to make estimates or rely on assumptions about matters that are inherently uncertain. The consolidated financial statements have been prepared in accordance with IFRS as issued by the IASB under the historical cost convention, as modified by revaluation of certain financial assets. Our significant accounting policies are disclosed in Note 3 to the Annual Financial Statements, including a summary of current and future changes in accounting policies, also included in Note 3 to the Annual Financial Statements.
Critical Accounting Estimates and Judgments
Certain accounting estimates have been identified as being “critical” to the presentation of our financial condition and results of operations because they require us to make subjective and/or complex judgments about matters that are inherently uncertain; or there is a reasonable likelihood that materially different amounts could be reported under different conditions or using different assumptions and estimates. Our significant accounting judgments, estimates and assumptions are disclosed in Note 3 to the accompanying Financial Statements.
Non-IFRS Financial Performance Measures
Gold Equivalent Ounces (“GEOs”)
GEOs are a non-IFRS measure that is based on stream and royalty interests and calculated on a quarterly basis by dividing all revenue from such interests for the quarter by the average gold price during such quarter. The gold price is determined based on the LBMA PM fix. For periods longer than one quarter, GEOs are summed for each quarter in the period. Management uses this measure internally to evaluate our underlying operating performance across our stream and royalty portfolio for the reporting periods presented and to assist with the planning and forecasting of future operating results. GEOs are intended to provide additional information only and do not have any standardized definition under IFRS and should not be considered in isolation or as a substitute for measures of performance prepared in accordance with IFRS. The measures are not necessarily indicative of gross profit or operating cash flow as determined under IFRS. Other companies may calculate these measures differently. The following table reconciles GEOs to revenue, the most directly comparable IFRS measure.
| | | 2022 | |
($ thousands, except average gold price and GEOs
information) | | Three months
ended June 30 | | | Three months
ended March 31 | | | Six months
ended June 30 | |
| Revenue | | | 36,490 | | | | 37,755 | | | | | |
| Average gold price per ounce | | | 1,871 | | | | 1,877 | | | | | |
| GEOs | | | 19,507 | | | | 20,113 | | | | 39,620 | |
| | | 2021 | |
($ thousands, except average gold price and GEOs
information) | | Three months
ended June 30 | | | Three months
ended March 31 | | | Six months
ended June 30 | |
| Revenue | | | 40,939 | | | | 35,366 | | | | | |
| Average gold price per ounce | | | 1,816 | | | | 1,794 | | | | | |
| GEOs | | | 22,537 | | | | 19,714 | | | | 42,251 | |
Adjusted Net Earnings (Loss) and Adjusted Net Earnings (Loss) per Share
Adjusted net earnings (loss) is a non-IFRS financial measure, which excludes the following from net earnings (loss):
| · | gain/loss on sale or disposition of assets/mineral interests |
| · | foreign currency translation gains/losses |
| · | increase/decrease in fair value of investments |
| · | non-recurring charges; and |
| · | impact of income taxes on these items |
Management uses this measure internally to evaluate our underlying operating performance for the reporting periods presented and to assist with the planning and forecasting of future operating results. Management believes that adjusted net earnings (loss) is a useful measure of our performance because impairment charges, gain/loss on sale or disposition of assets/mineral interests, foreign currency translation gains/losses, increase/decrease in fair value of investments and non-recurring charges (such as IPO readiness costs) do not reflect the underlying operating performance of our core business and are not necessarily indicative of future operating results. The tax effect is also excluded to reconcile the amounts on a post-tax basis, consistent with net earnings. Management’s internal budgets and forecasts and public guidance do not reflect the types of items we adjust for. Consequently, the presentation of adjusted net earnings (loss) enables users to better understand the underlying operating performance of our core business through the eyes of management. Management periodically evaluates the components of adjusted net earnings based on an internal assessment of performance measures that are useful for evaluating the operating performance of our business and a review of the non-IFRS measures used by industry analysts and other streaming and royalty companies. Adjusted net earnings (loss) is intended to provide additional information only and does not have any standardized definition under IFRS and should not be considered in isolation or as a substitute for measures of performance prepared in accordance with IFRS. The measures are not necessarily indicative of gross profit or operating cash flow as determined under IFRS. Other companies may calculate these measures differently. The following table reconciles adjusted net earnings to net earnings, the most directly comparable IFRS measure.
Reconciliation of Net Earnings to Adjusted Net Earnings
| ($ thousands, except share and | | Three months ended June 30 | | | Six months ended June 30 | |
| per share information) | | 2022 | | | 2021 | | | 2022 | | | 2021 | |
| Net earnings | | $ | 10,922 | | | $ | 18,339 | | | $ | 26,811 | | | $ | 27,018 | |
| Gain on disposal of mineral interests | | | - | | | | - | | | | (2,099 | ) | | | - | |
| Loss on derivatives | | | - | | | | 297 | | | | - | | | | 297 | |
| Foreign currency translation losses (gains) | | | 100 | | | | (18 | ) | | | 153 | | | | (22 | ) |
| Decrease (increase) in fair value of investments | | | 3,834 | | | | (2,595 | ) | | | 4,492 | | | | 1,901 | |
| IPO readiness costs1 | | | - | | | | - | | | | - | | | | 670 | |
| Income tax effect | | | (2 | ) | | | 627 | | | | 969 | | | | 577 | |
| Adjusted net earnings | | $ | 14,854 | | | $ | 16,650 | | | $ | 30,326 | | | $ | 30,441 | |
| Weighted average shares outstanding - basic | | | 156,013,993 | | | | 143,534,434 | | | | 156,020,615 | | | | 139,739,993 | |
| Net earnings per share | | $ | 0.07 | | | $ | 0.13 | | | $ | 0.17 | | | $ | 0.19 | |
| Adjusted net earnings per share | | $ | 0.10 | | | $ | 0.12 | | | $ | 0.19 | | | $ | 0.22 | |
1 Reflects charges related to a potential U.S. listing that was not pursued.
Free Cash Flow
Free cash flow is a non-IFRS measure that deducts acquisition of other assets (excluding acquisition of mineral interests) from operating cash flow. Management believes this to be a useful indicator of our ability to operate without reliance on additional borrowing or usage of existing cash. Free cash flow is intended to provide additional information only and does not have any standardized definition under IFRS and should not be considered in isolation or as a substitute for measures of performance prepared in accordance with IFRS. The measure is not necessarily indicative of operating profit or operating cash flow as determined under IFRS. Other companies may calculate this measure differently. The following table reconciles free cash flow to operating cash flow, the most directly comparable IFRS measure:
| | | Three months ended June 30 | | | Six months ended June 30 | |
| ($ thousands) | | 2022 | | | 2021 | | | 2022 | | | 2021 | |
| Operating cash flow | | $ | 29,940 | | | $ | 32,754 | | | $ | 56,299 | | | $ | 61,563 | |
| Acquisition of other assets | | | - | | | | - | | | | - | | | | - | |
| Free cash flow | | $ | 29,940 | | | $ | 32,754 | | | $ | 56,299 | | | $ | 61,563 | |
Adjusted EBITDA
Adjusted EBITDA is a non-IFRS financial measure, which excludes the following from net earnings:
| · | depletion and amortization |
| · | gain/loss on sale or disposition of assets/mineral interests |
| · | foreign currency translation gains/losses |
| · | increase/decrease in fair value of investments; and |
Management believes that adjusted EBITDA is a valuable indicator of our ability to generate liquidity by producing operating cash flow to fund working capital needs, service debt obligations and fund acquisitions. Management uses adjusted EBITDA for this purpose. Adjusted EBITDA is also frequently used by investors and analysts for valuation purposes whereby adjusted EBITDA is multiplied by a factor or ‘‘multiple’’ that is based on an observed or inferred relationship between adjusted EBITDA and market values to determine the approximate total enterprise value of a company.
In addition to excluding income tax expense, finance costs, net and depletion and amortization, adjusted EBITDA also removes the effect of impairment charges, gain/loss on sale or disposition of assets/mineral interests, foreign currency translation gains/losses, increase/decrease in fair value of investments and non-recurring charges. We believe these items provide a greater level of consistency with the adjusting items included in our adjusted net earnings reconciliation, with the exception that these amounts are adjusted to remove any impact of income tax expense as they do not affect adjusted EBITDA. We believe this additional information will assist analysts, investors and our shareholders to better understand our ability to generate liquidity from operating cash flow, by excluding these amounts from the calculation as they are not indicative of the performance of our core business and not necessarily reflective of the underlying operating results for the periods presented.
Adjusted EBITDA is intended to provide additional information to investors and analysts and does not have any standardized definition under IFRS and should not be considered in isolation or as a substitute for measures of performance prepared in accordance with IFRS. Adjusted EBITDA is not necessarily indicative of operating profit or operating cash flow as determined under IFRS. Other companies may calculate adjusted EBITDA differently. The following table reconciles adjusted EBITDA to net earnings, the most directly comparable IFRS measure.
Reconciliation of Net Earnings to Adjusted EBITDA
| | | Three months ended June 30 | | | Six months ended June 30 | |
| ($ thousands) | | 2022 | | | 2021 | | | 2022 | | | 2021 | |
| Net earnings | | $ | 10,922 | | | $ | 18,339 | | | $ | 26,811 | | | $ | 27,018 | |
| Finance costs, net | | | 442 | | | | 2,059 | | | | 979 | | | | 4,577 | |
| Income tax expense | | | 1,269 | | | | 2,695 | | | | 3,412 | | | | 3,302 | |
| Depletion and amortization | | | 11,577 | | | | 14,182 | | | | 24,853 | | | | 27,313 | |
| Gain on disposal of mineral interests | | | - | | | | - | | | | (2,099 | ) | | | - | |
| Loss on derivatives | | | - | | | | 297 | | | | - | | | | 297 | |
| Foreign currency translation loss (gain) | | | 100 | | | | (18 | ) | | | 153 | | | | (22 | ) |
| Decrease (increase) in fair value of investments | | | 3,834 | | | | (2,595 | ) | | | 4,492 | | | | 1,901 | |
| IPO readiness costs1 | | | - | | | | - | | | | - | | | | 670 | |
| Adjusted EBITDA | | $ | 28,144 | | | $ | 34,959 | | | $ | 58,601 | | | $ | 65,056 | |
1 Reflects charges related to a potential U.S. listing that was not pursued.
Gross Profit Margin, Asset Margin, and Total Margin
Gross profit margin is an IFRS financial measure which we define as gross profit divided by revenue. Asset margin is a non-IFRS financial measure which we define by taking gross profit and adding back depletion and dividing by revenue. Total margin is a non-IFRS financial measure which we define as adjusted EBITDA divided by revenue. We use gross profit margin to assess profitability of our metal sales and use asset margin and total margin in order to evaluate our performance in increasing revenue and containing costs and providing a useful comparison to our peers. Both asset margin and total margin are intended to provide additional information only and do not have any standardized definition under IFRS and should not be considered in isolation or as substitutes for measures of performance prepared in accordance with IFRS. The following table reconciles asset margin and total margin to gross profit margin, the most directly comparable IFRS measure:
| ($ thousands except Gross profit | | Three months ended June 30 | | | Six months ended June 30 | |
| margin, Asset margin, and Total margin) | | 2022 | | | 2021 | | | 2022 | | | 2021 | |
| Revenue | | $ | 36,490 | | | $ | 40,939 | | | $ | 74,245 | | | $ | 76,305 | |
| Cost of sales | | | 15,208 | | | | 17,874 | | | | 31,419 | | | | 33,883 | |
| Gross profit | | | 21,282 | | | | 23,065 | | | | 42,826 | | | | 42,422 | |
| Gross profit margin | | | 58 | % | | | 56 | % | | | 58 | % | | | 56 | % |
| Gross profit | | $ | 21,282 | | | $ | 23,065 | | | $ | 42,826 | | | $ | 42,422 | |
| Add: Depletion | | | 11,485 | | | | 14,083 | | | | 24,664 | | | | 27,114 | |
| | | | 32,767 | | | | 37,148 | | | | 67,490 | | | | 69,536 | |
| Revenue | | | 36,490 | | | | 40,939 | | | | 74,245 | | | | 76,305 | |
| Asset margin | | | 90 | % | | | 91 | % | | | 91 | % | | | 91 | % |
| | | | | | | | | | | | | | | | | |
| Gross profit | | $ | 21,282 | | | $ | 23,065 | | | $ | 42,826 | | | $ | 42,422 | |
| Add: Depletion and amortization | | | 11,577 | | | | 14,182 | | | | 24,853 | | | | 27,313 | |
| Less: Sustainability initiatives | | | 243 | | | | 22 | | | | 383 | | | | 354 | |
| Less: Business development costs | | | 1,090 | | | | 219 | | | | 1,238 | | | | 329 | |
| Less: General administration costs | | | 3,382 | | | | 2,047 | | | | 7,457 | | | | 3,996 | |
| Adjusted EBITDA | | | 28,144 | | | | 34,959 | | | | 58,601 | | | | 65,056 | |
| Revenue | | | 36,490 | | | | 40,939 | | | | 74,245 | | | | 76,305 | |
| Total margin | | | 77 | % | | | 85 | % | | | 79 | % | | | 85 | % |
Cash Costs and Cash Costs per GEO
Cash costs and cash costs per GEO are non-IFRS measures with no standardized meaning under IFRS and may not be comparable to similar measures presented by other issuers. Cash costs are calculated by starting with total cost of sales, then deducting depletion. Cash costs are then divided by GEOs sold, to arrive at cash costs per GEO. Cash costs and cash costs per GEO are only intended to provide additional information to investors and analysts and should not be considered in isolation or as substitutes for measures of performance prepared in accordance with IFRS.
Management uses cash costs and cash costs per GEO to evaluate our ability to generate positive cash flow from our portfolio of assets. Management and certain investors also use this information to evaluate the Company’s performance relative to peers who present this measure on a similar basis. The following table reconciles cash costs and cash costs per GEO to cost of sales, the most directly comparable IFRS measure:
| ($ thousands, except GEOs | | Three months ended June 30 | | | Six months ended June 30 | |
| and cash costs per GEO) | | 2022 | | | 2021 | | | 2022 | | | 2021 | |
| Cost of sales | | $ | 15,208 | | | $ | 17,874 | | | $ | 31,419 | | | $ | 33,883 | |
| Less: Depletion | | | 11,485 | | | | 14,083 | | | | 24,664 | | | | 27,114 | |
| Cash costs | | $ | 3,723 | | | | 3,791 | | | | 6,755 | | | | 6,769 | |
| GEOs | | | 19,507 | | | $ | 22,537 | | | $ | 39,620 | | | $ | 42,251 | |
| Cash costs per GEO | | | 191 | | | | 168 | | | | 170 | | | | 160 | |
Forward-Looking Information
This MD&A contains “forward-looking information” within the meaning of applicable Canadian securities laws. Forward-looking information may be identified by the use of forward-looking terminology such as “plans”, “targets”, “expects”, “is expected”, “budget”, “scheduled”, “estimates”, “outlook”, “forecasts”, “projection”, “prospects”, “strategy”, “intends”, “anticipates”, “believes”, or variations of such words and phrases or terminology which states that certain actions, events or results “may”, “could”, “would”, “might”, “will”, “will be taken”, “occur” or “be achieved”. Our assessments of, and expectations for future periods described in this MD&A are considered forward-looking information. In addition, any statements that refer to expectations, intentions, projections or other characterizations of future events or circumstances contain forward-looking information. Statements containing forward-looking information are not historical facts but instead represent management’s expectations, estimates and projections regarding possible future events or circumstances.
The forward-looking information included in this MD&A is based on our opinions, estimates and assumptions in light of our experience and perception of historical trends, current conditions and expected future developments, as well as other factors that we currently believe are appropriate and reasonable in the circumstances. The forward-looking statements contained in this MD&A are also based upon the ongoing operation of the properties in which we hold a stream, royalty or other similar interest by the owners or operators of such properties in a manner consistent with past practice; the accuracy of public statements and disclosures made by the owners or operators of such underlying properties; and the accuracy of publicly disclosed expectations for the development of underlying properties that are not yet in production. These assumptions include, but are not limited to, the following: assumptions in respect of current and future market conditions and the execution of our business strategies, that operations, or ramp-up where applicable, at properties in which we hold a royalty, stream or other interest, continue without further interruption through the period, and the absence of any other factors that could cause actions, events or results to differ from those anticipated, estimated, intended or implied. Despite a careful process to prepare and review the forward-looking information, there can be no assurance that the underlying opinions, estimates and assumptions will prove to be correct. Forward-looking information is also subject to known and unknown risks, uncertainties and other factors that may cause the actual results, level of activity, performance or achievements to be materially different from those expressed or implied by such forward-looking information. Such risks, uncertainties and other factors include, but are not limited to, those set forth under the caption “Risk Factors” in our AIF dated March 30, 2022 available on SEDAR. For clarity, Mineral Resources that are not Mineral Reserves do not have demonstrated economic viability and inferred resources are considered too geologically speculative for the application of economic considerations.
Although we have attempted to identify important risk factors that could cause actual results or future events to differ materially from those contained in forward-looking information, there may be other risk factors not presently known to us or that we presently believe are not material that could also cause actual results or future events to differ materially from those expressed in such forward-looking information. There can be no assurance that such information will prove to be accurate, as actual results and future events could differ materially from those anticipated in such information. Accordingly, readers should not place undue reliance on forward-looking information, which speaks only as of the date made. The forward-looking information contained in this MD&A represents our expectations as of the date of this MD&A and is subject to change after such date. We disclaim any intention or obligation or undertaking to update or revise any forward-looking information whether as a result of new information, future events or otherwise, except as required by applicable securities laws. All of the forward-looking information contained in this MD&A is expressly qualified by the foregoing cautionary statements.
Technical and Third-Party Information
Triple Flag does not own, develop or mine the underlying properties on which it holds stream or royalty interests. As a royalty or stream holder, Triple Flag has limited, if any, access to properties included in its asset portfolio. As a result, Triple Flag is dependent on the owners or operators of the properties and their qualified persons to provide information to Triple Flag or on publicly available information to prepare disclosure pertaining to properties and operations on the properties on which Triple Flag holds stream, royalty or other similar interests. Triple Flag generally has limited or no ability to independently verify such information. Although Triple Flag does not believe that such information is inaccurate or incomplete in any material respect, there can be no assurance that such third-party information is complete or accurate.