united states
securities and exchange commission
washington, d.c. 20549
form n-csr
certified shareholder report of registered management
investment companies
Investment Company Act file number 811-23611
James Alpha Funds Trust
(Exact name of registrant as specified in charter)
515 Madison Avenue, 24th Floor, New York, NY 10022
(Address of principal executive offices) (Zip code)
Emile R. Molineaux, Gemini Fund Services, LLC
80 Arkay Drive, Suite 110, Hauppauge, NY 11788
(Name and address of agent for service)
Registrant's telephone number, including area code: 888-814-8180
Date of fiscal year end: 8/31
Date of reporting period: 8/31/2021
Amended to correct the Item 11.(a) and Item 11.(b) responses.
Item 1. Reports to Stockholders.

JAMES ALPHA FUNDS TRUST d/b/a EASTERLY FUNDS TRUST
CLASS A, C, I AND R6 SHARES
ANNUAL REPORT
AUGUST 31, 2021
THIS REPORT IS AUTHORIZED FOR DISTRIBUTION ONLY TO SHAREHOLDERS AND TO OTHERS WHO HAVE RECEIVED A COPY OF THE PROSPECTUS.
James Alpha Funds Trust d/b/a Easterly Funds Trust
ANNUAL REPORT TO SHAREHOLDERS
October 12, 2021
Dear Shareholder:
We are pleased to provide you with this annual report on the investment strategies and performance of the funds in the James Alpha Funds Trust d/b/a Easterly Funds Trust (the “Trust”). This report covers the twelve months from September 1, 2020 through August 31, 2021.
We believe that successful investing requires discipline and patience. Try to stay focused on your long-term investment goals. Don’t let short-term stock and bond market fluctuations or investment manias change your long-term investment strategy. The Easterly Funds are managed by some of the world’s leading institutional investment advisory firms. Combining the strength of the Trust’s performance with a well-designed asset allocation plan can help you to achieve your long-term investment goals.
ECONOMIC OVERVIEW
As measured by Real Gross Domestic Product (GDP), the value of the production of goods and services in the United States increased by an annualized growth rate (AGR) of 12.2% during the second quarter of 2021, a massive growth rate driven by technical ‘base effects’ from Q2 2020. The primary driver of strong performance in the markets in the past 12 months has been the continued recovery in the post-Covid world. Successful vaccination programs, continued support from both monetary and fiscal sources, and consumers who are ready to spend have all supported a robust recovery. New Home Sales were down from their cycle high (around 1 million) to an annualized 740 thousand units in August 2021, still far above average from the past decade. The auto industry suffered a massive decline in sales during the first half of 2020, experienced a cycle high in April 2021 (where an annualized 18.5 million auto sales occurred; a five year high), but has been on a decline each month since. The unemployment rate declined from 14.8% in April 2020 to 5.2% in August 2021. The unemployment claims is an important leading indicator in our work, specifically the 4-week sum of weekly Initial Claims data. That number has dropped to 1.4 million from a pandemic peak of over 21 million claims. For perspective, the historic average from 1967 to present is about 1.5 million. The overall economy in 2021 could be characterized as a ‘boom’ economy, with expanding equity valuations, rising interest rates, and shortages of good and services across the economy driven by robust consumer demand and lingering supply chain issues that have been morphing since the beginning of the pandemic. This market has been largely controlled by the Federal Reserve, who have signaled their commitment to support economic demand through extremely easy monetary policy and continued massive liquidity injections. The Fed’s language around inflation in the past year has meaningfully changed from an absolute target to an inflation averaging target where they have let inflation run hot (above target) in order to achieve a long-term average of their target of 2%. The Fed continues to sustain historic emergency measures even with the strong economic backdrop.
Monetary Policy: The Federal Reserve has remained extraordinarily accommodative since the beginning of the pandemic, but with falling unemployment, strong demand, and persistently high inflation, the tone at the Fed has begun to shift towards reining in their emergency measures. In its most recent FOMC statement, the Committee stated that “last December, the Committee indicated that it would continue to increase its holdings of Treasury securities by at least $80 billion per month and of agency mortgage-backed securities by at least $40 billion per month until substantial further progress has been made towards its maximum employment and price stability goals. Since then, the economy has made progress towards these goals. If progress continues broadly as expected, the Committee judges that a moderation in the pace of asset purchases may soon be warranted.” During the press conference, Powell said “while no decisions were made, participants generally viewed that so long as the recovery remains on track, a
gradual tapering process that concludes around the middle of next year is likely to be appropriate.” In terms of the benchmark Fed Funds rate, the Committee’s updated projection (i.e., the Dot Plot) signaled that rate hikes may come sooner than expected with the median forecast showing one rate hike in 2022 and three more hikes in 2023.
Interest Rates: Treasury yields bottomed in August 2020 and have generally increased ever since, although the rise has been volatile. In the twelve months since the end of August 2020, the yield curve has steepened with the 5-year treasury rate moving from 0.27% to 0.78%, the 10 year rate going from 0.70% to 1.31%, and the 30 year rate going from 1.47% to 1.93%. Short term rates are largely unchanged. With the Fed setting the stage for tapering their asset purchases (and raising the Fed Funds rate soon thereafter), we believe the environment is supportive of rates and yields will remain steady to higher over the next 12 months.
Equity Valuations: Equity markets have rebounded strongly off the pandemic lows with the S&P 500 up 31.2% since the end of August 2020. During 2021, the S&P 500 achieved a new record high close on 54 separate trading sessions with a maximum drawdown of only 4.2%. Depending on the metric, valuations range anywhere from fairly valued to strongly overvalued. As an example, Warren Buffett’s favorite indicator is the ratio of total equity market cap to GDP (termed “the Buffett Indicator”) is at a record high level of 207% with the previous record high of 143% set in March 2000, indicating the market is strongly overvalued. However, the S&P 500 is currently trading at a forward P/E ratio of approximately 23.4 times, which is only modestly above it’s 30 year average of 21.2 times.
Inflation: Inflation, as measured by the consumer price index (CPI) was up 5.25% y-o-y in August 2021, a rate not seen since July 2008 and not experienced on a sustained basis since the early 1980’s. For the last year and a half, the Fed’s objective has been to run the economy hot through ultra-easy monetary policy with the intention of spurring inflation above their target to achieve a long-term average of 2%. Inflation data has come in higher than forecast throughout 2021, which the Fed has called ‘transitory’ due to shortages and supply chain issues. Recently, they have stopped using the term ‘transitory’ with Powell now calling inflation pressures ‘frustrating’, a possible signal of future monetary tightening if inflation persists above forecast into next year.
COMPARING THE FUND PERFORMANCE TO BENCHMARKS
When reviewing the performance of the funds against their benchmarks, it is important to note that the Trust is designed to help investors to implement an asset allocation strategy to meet their individual needs as well as select individual investments within each asset category among the myriad of choices available. Each Easterly Fund was formed to represent an asset class, and each portfolio’s institutional money manager was selected based on their ability to manage money within that class.
Therefore, the Easterly Funds can help investors to properly implement their asset allocation decisions and keep their investments within the risk parameters that they establish with their investment consultants. Without the intended asset class consistency of the Easterly Funds, even the most carefully crafted allocation strategy could be negated. Furthermore, the benchmarks do not necessarily provide precise standards against which to measure the portfolios, in that the characteristics of the benchmarks can vary widely at different points in time from the Easterly Funds (e.g., characteristics such as: average market capitalizations, price-to-earnings and price-to-book ratios, bond quality ratings and maturities, etc.). In addition, the benchmarks can potentially have a survivor bias built into them (i.e., the performance of only funds that are still in existence may remain part of the benchmark’s performance while funds that do not exist anymore may be removed from the benchmark’s performance).
ELECTRONIC DELIVERY AVAILABLE
This report can be delivered to you electronically. Electronic delivery can help simplify your record keeping. With electronic delivery, you’ll receive an email with a link to your James Alpha Funds Trust quarterly statement, daily confirmations and/or semi-annual and annual reports each time one is available. You have the ability to choose which items you want delivered electronically. Choose one item or all items. It’s up to you. Please call our Customer Service Department toll-free at (888) 814-8180 for instructions on how to establish electronic delivery.
Investors should consider the investment objectives, risks, charges and expenses of the Easterly Funds carefully. This and other information about the Easterly Funds is contained in your prospectus, which should be read carefully. To obtain an additional copy of the prospectus, please call 888.814.8180. Past performance is not indicative of future results. Investments in stocks, bonds and mutual funds are not guaranteed and the principal value and investment return can fluctuate. Consequently, investors may receive back less than invested.
The S&P 500 is an unmanaged, capitalization-weighted index. It is not possible to invest directly in the S&P 500.
The security holdings discussed may not be representative of the Funds’ current or future investments. Fund holdings are subject to change and should not be considered to be investment advice. Any statements not of a factual nature constitute opinions which are subject to change without notice. Information contained herein was obtained from recognized statistical services and other sources believed to be reliable and we therefore cannot make any representation as to its completeness or accuracy. The Easterly Funds are distributed by Ultimus Fund Distributors, LLC, member FINRA/SIPC.
13681984-UFD-10202021
Easterly Global Macro Fund
PORTFOLIO REVIEW (Unaudited)
August 31, 2021
The Fund’s performance figures* for the year ended August 31, 2021, as compared to its benchmark:
| | | Annualized | Annualized | Annualized | Annualized |
| | One Year | Five Year | Ten Year | Since Inception (a) | Since Inception (b) |
| Class I | 13.16% | 2.84% | 1.02% | 1.23% | n/a |
| Class R6 | 13.86% | n/a | n/a | n/a | 4.67% |
| Bank of America Merrill Lynch 3-Month Treasury Bill Index (c) | 0.08% | 1.17% | 0.63% | 0.60% | 1.30% |
Comparison of the Change in Value of a $1,000,000 Investment
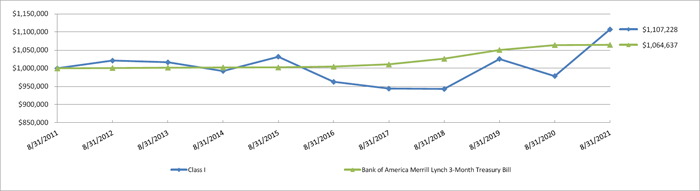
Performance data quoted above is historical. Past performance does not guarantee future results and current performance may be lower or higher than the performance data quoted. The investment return and principal value of an investment will fluctuate, so that shares when redeemed, may be worth more or less than their original cost. For more performance numbers current to the most recent month-end please call (833) 999-2636. The total operating expense ratio as stated in the fee table to the Fund’s prospectus dated March 22, 2021 as amended August 23, 2021, is 2.96% and 2.96% for the I and R6 Classes, respectively.
| (a) | Inception date for Class I is February 11, 2011. |
| (b) | Inception date for Class R6 is August 17, 2017 |
| (c) | The Bank of America Merrill Lynch 3-Month Treasury Bill Index consists of U.S. Treasury Bills maturing in 90 days. |
| Top 10 Holdings by Industry | | % of Net Assets | |
| Open End Funds - Fixed Income | | | 33.2 | % |
| Exchange Traded Funds - Fixed Income | | | 16.4 | % |
| Exchange Traded Funds - Equity | | | 10.9 | % |
| Exchange Traded Funds - Commodity | | | 7.6 | % |
| Exchange Traded Funds - Mixed Allocation | | | 3.6 | % |
| Open End Funds - Alternative | | | 2.2 | % |
| Exchange Traded Funds - Specialty | | | 0.8 | % |
| Other/Cash & Equivalents | | | 25.3 | % |
| | | | 100.0 | % |
Please refer to the Portfolio of Investments for a more detailed breakdown of the Fund’s assets.
Easterly Global Real Estate Fund
PORTFOLIO REVIEW (Unaudited)
August 31, 2021
The Fund’s performance figures* for the year ended August 31, 2021, as compared to its benchmark:
| | | Annualized | Annualized | Annualized | Annualized | Annualized | Annualized |
| | One Year | Five Year | Ten Year | Since Inception (a) | Since Inception (b) | Since Inception (c) | Since Inception (d) |
| Class A | 33.47% | 10.44% | 10.20% | 10.42% | n/a | n/a | n/a |
| Class A With Load | 25.79% | 9.14% | 9.55% | 9.87% | n/a | n/a | n/a |
| Class C | 32.51% | 9.62% | n/a | n/a | 10.13% | n/a | n/a |
| Class I | 34.06% | 10.92% | 10.75% | n/a | n/a | 9.78% | n/a |
| Class R6 | 34.29% | n/a | n/a | n/a | n/a | n/a | 11.34% |
| FTSE EPRA/NAREIT Developed Net Index (e) | 34.55% | 6.56% | 8.46% | 8.96% | 9.42% | 7.69% | 8.12% |
Comparison of the Change in Value of a $1,000,000 Investment
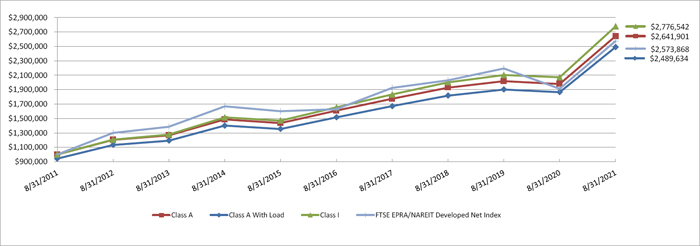
Performance data quoted above is historical. Past performance does not guarantee future results and current performance may be lower or higher than the performance data quoted. The investment return and principal value of an investment will fluctuate, so that shares when redeemed, may be worth more or less than their original cost. For more performance numbers current to the most recent month-end please call (833) 999-2636. The total operating expense ratio as stated in the fee table to the Fund’s prospectus dated March 22, 2021 as amended August 23, 2021, is 1.44%, 2.19%, 1.19% and 1.21% for the A, C, I and R6 Classes, respectively.
| (a) | Inception date for Class A is October 26, 2009. |
| (b) | Inception date for Class C is January 5, 2012. |
| (c) | Inception date for Class I is August 1, 2011. |
| (d) | Inception date for Class R6 is August 17, 2017. |
| (e) | The FTSE EPRA/NAREIT Developed Net Index Series is designed to represent general trends in eligible real estate equities worldwide. Relevant real estate activities are defined as the ownership, disposure and development of income-producing real estate. |
| Top 10 Holdings by Country | | % of Net Assets | |
| United States | | | 49.6 | % |
| Japan | | | 11.2 | % |
| Cayman Islands | | | 10.3 | % |
| United Kingdom | | | 6.2 | % |
| Hong Kong | | | 6.0 | % |
| Bermuda | | | 4.3 | % |
| France | | | 3.9 | % |
| Italy | | | 1.6 | % |
| Singapore | | | 1.6 | % |
| Ireland | | | 1.5 | % |
| Other/Cash & Equivalents | | | 3.8 | % |
| | | | 100.0 | % |
Please refer to the Portfolio of Investments for a more detailed breakdown of the Fund’s assets.
Easterly Multi Strategy Alternative Income Fund
PORTFOLIO REVIEW (Unaudited)
August 31, 2021
The Fund’s performance figures* for the year ended August 31, 2021, as compared to its benchmark:
| | | Annualized | Annualized | Annualized |
| | One Year | Five Year | Since Inception (a) | Since Inception (b) |
| Class A | 14.90% | 6.57% | 3.72% | n/a |
| Class A With Load | 8.33% | 5.32% | 2.84% | n/a |
| Class C | 13.86% | 5.75% | 2.94% | n/a |
| Class I | 15.14% | 6.81% | 3.95% | n/a |
| Class R6 | 15.59% | n/a | n/a | 8.95% |
| Russel 2000 Total Return Index (c) | 47.08% | 14.38% | 12.30% | 15.07% |
Comparison of the Change in Value of a $1,000,000 Investment
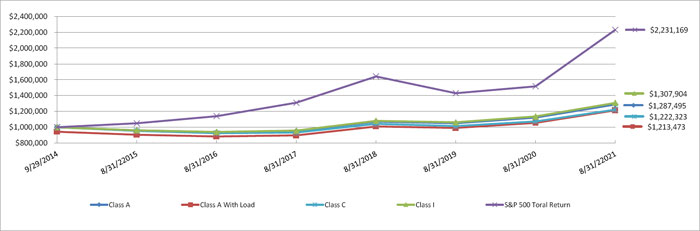
Performance data quoted above is historical. Past performance does not guarantee future results and current performance may be lower or higher than the performance data quoted. The investment return and principal value of an investment will fluctuate, so that shares when redeemed, may be worth more or less than their original cost. For more performance numbers current to the most recent month-end please call (833) 999-2636. The total operating expense ratio as stated in the fee table to the Fund’s prospectus dated March 22, 2021 as amended August 23, 2021, is 4.79%, 5.54%, 4.54% and 4.54% for the A, C, I and R6 Classes, respectively.
| (a) | Inception date for Class A, C and I is September 29, 2014. |
| (b) | Inception date for Class R6 is August 17, 2017. |
| (c) | The Russell 2000 Total Return Index is an unmanaged market capitalization-weighted index which measures the performance of the small-cap sector of the U.S. stock market. Index returns assume reinvestment of dividends. Investors may not invest in the Index directly. Unlike the Fund’s returns, the Index does not reflect any fees or expenses. |
| Top 10 Holdings by Industry/Security Type * | | % of Net Assets | |
| Closed End Funds - Fixed Income | | | 21.5 | % |
| REITS | | | 18.7 | % |
| Software | | | 13.1 | % |
| Liesure Facilities & Services | | | 4.6 | % |
| Technology Services | | | 4.4 | % |
| Real Estate Owners & Developers | | | 4.4 | % |
| Exchanged Traded Funds - Fixed Income | | | 4.2 | % |
| Telecommunications | | | 3.6 | % |
| Health Care Facilities & Services | | | 3.4 | % |
| Banking | | | 3.2 | % |
| Other/Cash & Equivalents | | | 18.9 | % |
| | | | 100.0 | % |
| * | Does not include securities sold short in which the Fund invests. |
Please refer to the Portfolio of Investments for a more detailed breakdown of the Fund’s assets.
Easterly Hedged Equity Fund
PORTFOLIO REVIEW (Unaudited)
August 31, 2021
The Fund’s performance figures* for the year ended August 31, 2021, as compared to its benchmark:
| | | Annualized | Annualized | Annualized |
| | One Year | Five Year | Since Inception (a) | Since Inception (b) |
| Class A | 10.67% | 6.84% | 5.54% | n/a |
| Class A With Load | 4.31% | 5.58% | 4.52% | n/a |
| Class C | 9.77% | 6.00% | 4.72% | n/a |
| Class I | 10.91% | 7.20% | 5.91% | n/a |
| Class R6 | 11.49% | n/a | n/a | 8.64% |
| S&P 500 Total Return Index (c) | 31.17% | 18.02% | 15.64% | 18.80% |
Comparison of the Change in Value of a $1,000,000 Investment
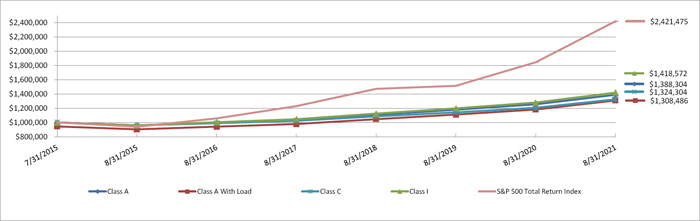
Performance data quoted above is historical. Past performance does not guarantee future results and current performance may be lower or higher than the performance data quoted. The investment return and principal value of an investment will fluctuate, so that shares when redeemed, may be worth more or less than their original cost. For more performance numbers current to the most recent month-end please call (833) 999-2636. The total operating expense ratio as stated in the fee table to the Fund’s prospectus dated March 22, 2021 as amended August 23, 2021, is 1.95%, 2.69%, 1.70% and 1.69% for the A, C, I and R6 Classes, respectively.
| (a) | Inception date for Class A, C and I is July 31, 2015, |
| (b) | Inception date for Class R6 is August 17, 2017. |
| (c) | The S&P 500 Total Return Index is an unmanaged free-float capitalization-weighted index which measures the performance of 500 large-cap common stocks actively traded in the United States. Index returns assume reinvestment of dividends. Investors may not invest in the Index directly. Unlike the Fund’s returns, the Index does not reflect any fees or expenses. |
| Top 10 Holdings by Security Type * | | % of Net Assets | |
| Exchange Traded Funds | | | 91.0 | % |
| Other/Cash & Equivalents | | | 9.0 | % |
| | | | 100.0 | % |
| * | Does not include derivatives in which the Fund invests. |
Please refer to the Portfolio of Investments for a more detailed breakdown of the Fund’s assets.
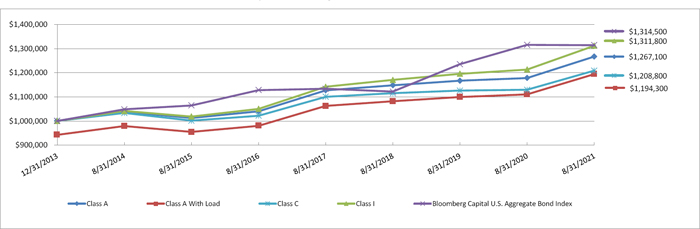
Easterly Hedged High Income Fund
PORTFOLIO REVIEW (Unaudited)
August 31, 2021
The Fund’s performance figures* for the year ended August 31, 2021, as compared to its benchmark:
| | | Annualized | Annualized | Annualized |
| | One Year | Five Year | Since Inception (a) | Since Inception (b) |
| Class A | 7.56% | 4.04% | 3.14% | n/a |
| Class A With Load | 1.40% | 2.80% | 2.34% | n/a |
| Class C | 7.05% | 3.42% | 2.50% | n/a |
| Class I | 8.12% | 4.55% | 3.60% | n/a |
| Class R6 | 8.55% | n/a | n/a | 3.92% |
| Bloomberg Capital U.S. Aggregate Bond Index | (0.08)% | 3.11% | 3.63% | 3.84% |
Comparison of the Change in Value of a $1,000,000 Investment
Performance data quoted above is historical. Past performance does not guarantee future results and current performance may be lower or higher than the performance data quoted. The investment return and principal value of an investment will fluctuate, so that shares when redeemed, may be worth more or less than their original cost. For more performance numbers current to the most recent month-end please call (833) 999-2636. The total operating expense ratio as stated in the fee table to the Fund’s prospectus dated March 22, 2021 as amended August 23, 2021, is 3.16%, 3.92%, 2.93% and 2.91% for the A, C, I and R6 Classes, respectively.
| (a) | Inception date for Class A, C and I is December 31, 2013. |
| (b) | Inception date for Class R6 is August 17, 2017. |
| (c) | The Bloomberg Capital U.S. Aggregate Bond Index, is made up of the Barclays Capital U.S. Government/Corporate Bond Index, Mortgage-Backed Securities Index, and Asset-Backed Securities Index, including securities that are of investment grade quality or better, have at least one year to maturity, and have an outstanding par value of at least $100 million. Investors cannot invest directly in an index. |
| Top 10 Holdings by Industry | | % of Net Assets | |
| Closed End Funds - Fixed Income | | | 18.3 | % |
| Exchange Traded Fund - Equity | | | 0.9 | % |
| Other/Cash & Equivalents | | | 80.8 | % |
| | | | 100.0 | % |
Please refer to the Portfolio of Investments for a more detailed breakdown of the Fund’s assets.
| EASTERLY GLOBAL MACRO FUND |
| CONSOLIDATED SCHEDULE OF INVESTMENTS |
| August 31, 2021 |
| Shares | | | | | Fair Value | |
| | | | | EXCHANGE-TRADED FUNDS — 39.3% | | | | |
| | | | | ALTERNATIVE - 0.0%(a) | | | | |
| | 65 | | | IQ Merger Arbitrage ETF | | $ | 2,135 | |
| | | | | | | | | |
| | | | | COMMODITY - 7.6% | | | | |
| | 63 | | | Invesco Optimum Yield Diversified Commodity Strategy No K-1 ETF | | | 1,262 | |
| | 53 | | | iShares GSCI Commodity Dynamic Roll Strategy ETF | | | 1,825 | |
| | 22,687 | | | iShares S&P GSCI Commodity Indexed Trust(b) | | | 360,951 | |
| | 257 | | | SPDR Gold Shares(b),(c) | | | 43,610 | |
| | 5,629 | | | United States Commodity Index Fund(b) | | | 224,970 | |
| | 1,926 | | | United States Natural Gas Fund, L.P.(b) | | | 29,506 | |
| | 68 | | | United States Oil Fund, L.P.(b) | | | 3,267 | |
| | | | | | | | 665,391 | |
| | | | | EQUITY - 10.9% | | | | |
| | 146 | | | AdvisorShares STAR Global Buy-Write ETF | | | 5,939 | |
| | 9 | | | CI Active Utility & Infrastructure ETF | | | 99 | |
| | 611 | | | Core Alternative ETF | | | 18,489 | |
| | 90 | | | Direxion NASDAQ-100 Equal Weighted Index Shares | | | 7,847 | |
| | 516 | | | First Trust Financial AlphaDEX Fund | | | 23,555 | |
| | 177 | | | Global X MSCI Argentina ETF | | | 6,496 | |
| | 950 | | | Invesco KBW High Dividend Yield Financial ETF | | | 19,646 | |
| | 3,731 | | | Invesco S&P 500 Equal Weight ETF | | | 583,156 | |
| | 114 | | | iShares Currency Hedged MSCI EAFE ETF | | | 3,985 | |
| | 105 | | | iShares Exponential Technologies ETF | | | 6,917 | |
| | 375 | | | iShares Latin America 40 ETF | | | 11,096 | |
| | 832 | | | iShares Mortgage Real Estate ETF | | | 30,900 | |
| | 509 | | | iShares MSCI All Country Asia ex Japan ETF | | | 45,179 | |
| | 572 | | | iShares MSCI Brazil ETF | | | 20,821 | |
| | 878 | | | iShares MSCI Chile ETF | | | 25,093 | |
| | 1,639 | | | iShares MSCI Global Multifactor ETF | | | 63,858 | |
| | 57 | | | iShares MSCI Japan ETF | | | 3,899 | |
| | 26 | | | iShares S&P/TSX Global Gold Index ETF | | | 374 | |
| | 1 | | | SPDR EURO STOXX 50 ETF | | | 48 | |
| | 321 | | | SPDR S&P Metals & Mining ETF | | | 14,217 | |
| | 387 | | | VanEck Africa Index ETF | | | 8,487 | |
| | 547 | | | VanEck Russia ETF | | | 16,016 | |
See accompanying notes to financial statements.
| EASTERLY GLOBAL MACRO FUND |
| CONSOLIDATED SCHEDULE OF INVESTMENTS (Continued) |
| August 31, 2021 |
| Shares | | | | | Fair Value | |
| | | | | EXCHANGE-TRADED FUNDS — 39.3% (Continued) | | | | |
| | | | | EQUITY - 10.9% (Continued) | | | | |
| | 583 | | | Vanguard FTSE Emerging Markets ETF | | $ | 30,450 | |
| | 57 | | | WisdomTree Global ex-US Quality Dividend Growth Fund | | | 2,458 | |
| | | | | | | | 949,025 | |
| | | | | FIXED INCOME - 16.4% | | | | |
| | 933 | | | Highland/iBoxx Senior Loan ETF | | | 14,975 | |
| | 17 | | | iShares 20+ Year Treasury Bond ETF | | | 2,530 | |
| | 354 | | | iShares 7-10 Year Treasury Bond ETF | | | 41,478 | |
| | 8,787 | | | iShares Barclays USD Asia High Yield Bond Index | | | 85,673 | |
| | 499 | | | iShares Floating Rate Bond ETF | | | 25,339 | |
| | 2,661 | | | iShares iBoxx High Yield Corporate Bond ETF | | | 234,407 | |
| | 1,734 | | | iShares JP Morgan USD Emerging Markets Bond ETF | | | 196,618 | |
| | 171 | | | iShares MBS ETF | | | 18,569 | |
| | 3,898 | | | SPDR Bloomberg Barclays Euro High Yield Bond UCITS ETF | | | 264,333 | |
| | 29 | | | SPDR Bloomberg Barclays High Yield Bond ETF | | | 3,190 | |
| | 1,049 | | | SPDR Doubleline Total Return Tactical ETF | | | 50,897 | |
| | 2,537 | | | VanEck Vectors Emerging Markets High Yield Bond ETF | | | 60,203 | |
| | 4,119 | | | Vanguard Total International Bond ETF | | | 237,337 | |
| | 5,969 | | | WisdomTree Emerging Markets Local Debt Fund | | | 193,217 | |
| | | | | | | | 1,428,766 | |
| | | | | MIXED ALLOCATION - 3.6% | | | | |
| | 6,126 | | | iShares Morningstar Multi-Asset Income ETF | | | 149,568 | |
| | 5,842 | | | SPDR SSgA Multi-Asset Real Return ETF | | | 167,548 | |
| | | | | | | | 317,116 | |
| | | | | SPECIALTY - 0.8% | | | | |
| | 1,935 | | | Invesco DB US Dollar Index Bullish Fund(b) | | | 48,162 | |
| | 372 | | | ProShares Short VIX Short-Term Futures ETF(b) | | | 21,546 | |
| | | | | | | | 69,708 | |
| | | | | | | | | |
| | | | | TOTAL EXCHANGE-TRADED FUNDS (Cost $3,290,865) | | | 3,432,141 | |
See accompanying notes to financial statements.
| EASTERLY GLOBAL MACRO FUND |
| CONSOLIDATED SCHEDULE OF INVESTMENTS (Continued) |
| August 31, 2021 |
| Shares | | | | | Fair Value | |
| | | | | EXCHANGE-TRADED NOTES — 0.0%(a) | | | | |
| | | | | COMMODITY - 0.0%(a) | | | | |
| | 44 | | | iPath Series B Bloomberg Grains Subindex Total Return ETN(b) | | $ | 2,742 | |
| | | | | | | | | |
| | | | | TOTAL EXCHANGE-TRADED NOTES (Cost $1,731) | | | 2,742 | |
| | | | | | | | | |
| | | | | OPEN END FUNDS — 35.4% | | | | |
| | | | | ALTERNATIVE - 2.2% | | | | |
| | 1,248 | | | AQR Managed Futures Strategy Fund, Class I | | | 9,538 | |
| | 15,889 | | | Easterly Hedged Equity Fund, Class R6(d) | | | 183,999 | |
| | | | | | | | 193,537 | |
| | | | | FIXED INCOME - 33.2% | | | | |
| | 259,678 | | | Easterly Structured Credit Value Fund, Class R6(d) | | | 2,903,195 | |
| | | | | | | | | |
| | | | | | | | | |
| | | | | TOTAL OPEN END FUNDS (Cost $3,019,704) | | | 3,096,732 | |
| | | | | | | | | |
| | | | | TOTAL INVESTMENTS - 74.7% (Cost $6,312,300) | | $ | 6,531,615 | |
| | | | | OTHER ASSETS IN EXCESS OF LIABILITIES- 25.3% | | | 2,215,248 | |
| | | | | NET ASSETS - 100.0% | | $ | 8,746,863 | |
| | | | | | | | | |
| EAFE | - Europe, Australasia and Far East |
| ETF | - Exchange-Traded Fund |
| MSCI | - Morgan Stanley Capital International |
| SPDR | - Standard & Poor's Depositary Receipt |
| (a) | Percentage rounds to less than 0.1%. |
| (b) | Non-income producing security. |
| (c) | All or a portion of this investment is a holding of the of the James Alpha Cayman Commodity Fund I Ltd. |
| (d) | Affiliated investment. |
See accompanying notes to financial statements.
| EASTERLY GLOBAL MACRO FUND |
| CONSOLIDATED SCHEDULE OF INVESTMENTS (Continued) |
| August 31, 2021 |
| Forward Currency Contracts |
| Settlement | | Units to | | | | | | | | | | | | US Dollar | | | | | Appreciation/ | |
| Date | | Receive/Deliver | | | | | Counterparty | | In Exchange For | | | | | Value | | | | | (Depreciation) | |
| To Buy: | | | | | | | | | | | | | | | | | | | | | | | | |
| 9/24/2021 | | | 2,630 | | | AUD | | Brown Brothers Harriman | | $ | 1,911 | | | USD | | $ | 1,922 | | | | | $ | 11 | |
| 9/24/2021 | | | 6,715 | | | CHF | | Brown Brothers Harriman | | | 7,360 | | | USD | | | 7,335 | | | | | | (25 | ) |
| 9/24/2021 | | | 475,145 | | | EUR | | Brown Brothers Harriman | | | 557,573 | | | USD | | | 561,147 | | | | | | 3,574 | |
| | | | | | | | | | | | | | | | | | | | | Total Unrealized: | | $ | 3,560 | |
| To Sell: | | | | | | | | | | | | | | | | | | | | | | | | |
| 9/24/2021 | | | (28,225 | ) | | CAD | | Brown Brothers Harriman | | $ | (22,377 | ) | | USD | | $ | (22,335 | ) | | | | $ | 42 | |
| 9/24/2021 | | | (11,903 | ) | | GBP | | Brown Brothers Harriman | | | (16,371 | ) | | USD | | | (16,383 | ) | | | | | (12 | ) |
| 9/24/2021 | | | (60,866,012 | ) | | JPY | | Brown Brothers Harriman | | | (555,951 | ) | | USD | | | (554,145 | ) | | | | | 1,806 | |
| 9/24/2021 | | | (246,592 | ) | | MXN | | Brown Brothers Harriman | | | (12,276 | ) | | USD | | | (12,267 | ) | | | | | 9 | |
| | | | | | | | | | | | | | | | | | | | | Total Unrealized: | | $ | 1,845 | |
Currency Abbreviations:
USD - U.S. Dollar
| TOTAL RETURN SWAP - 9.9 % | | Unrealized Gain | |
| The Deutsche Bank Total Return Swap provides exposure to the daily, total returns of the James Alpha Index, a proprietary index of the London Branch of Deutsche Bank AG. The number of shares is 80,351, with a receivable rate of 0.39%. The James Alpha Index features a basket of commodity trading advisor (“CTA”) programs selected by James Alpha Advisors, LLC from an approved list of third-party managers offered through Deutsche Bank AG on its DB Select platform. The James Alpha Index comprises a diversified collection of strategy and style types, including trend following, short-term trading, discretionary, global macro, and sector specialists. According to the terms of the swap, James Alpha Advisors, LLC can modify the James Alpha Index as frequently as daily, on a T+1 basis, by adjusting the notional value of the James Alpha Index, or by adding, deleting, or re-weighting the constituent CTA programs. The swap became effective on December 7, 2016. The maturity date of the swap is December 9, 2022. (Notional Value $8,240,337) | | $ | 868,317 | |
| | | $ | 868,317 | |
| | | | | |
| TOTAL RETURN SWAP - (0.2) % | | Unrealized Loss | |
| The Goldman Sachs i-Select III Series 88 Excess Return Strategy (“GS i-Select”) is a synthetic rules-based proprietary strategy created by Goldman Sachs International as strategy sponsor. The GS i-Select Index includes strategies of the GS Risk Premia Universe that were selected by James Alpha. The GS i-Select Index is actively managed by James Alpha. The Index features 15 Portfolio Constituents that James Alpha Advisors, LLC determines the daily weighting of each constituent within the GS i-Select Index. The GS i-Select Index is comprised a diversified collection of strategy and style types, including equity, interest rates, FX, commodities, and credit based strategies such as imbalance, volatility carry, carry, momentum, low beta, and quality. According to the terms of the GS i-Select Index, James Alpha Advisors, LLC can modify the GS i-Select Index as frequently as daily, by adjusting the notional value of the GS i-Select Index, or by adding, deleting, or re-weighting the constituent Indexes in the GS i-Select Index. The swap became effective on May 28, 2021, and has a maturity date of February 4, 2022. The number of shares is 25,578. (Notional Value $2,555,489) | | $ | — | |
| | | $ | — | |
| | | | | |
| TOTAL RETURN SWAP - (0.0) % | | Unrealized Loss | |
| The Goldman Sachs Intraday Momentum ES Series 1 Excess Return Strategy (“GS Intraday Momentum”) aims to capture intraday trend risk premium on the S&P 500. There is empirical evidence that the returns in the earlier part of the day tend to continue in the same direction in the subsequent part of the day, across several markets, including equities. The strategy attempts to monetize this historical tendency for intraday trends from the previous close to extend unto the following close: 1) Every day after the open, the strategy buys futures if markets are rising since the previous close; conversely, it sells futures if markets are falling since previous close. 2) The strategy monitors market moves every 30-minutes to reactively modify its positioning if a new trend appears. 3) All positions are exited at the close. The swap became effective on May 3, 2021, and has a maturity date of February 1, 2022. The number of shares is 1,766. (Notional Value $202,934) | | $ | (782 | ) |
| | | $ | (782 | ) |
| | | | | |
| TOTAL RETURN SWAP - 0.0 % | | Unrealized Gain | |
| The Goldman Sachs Long Gamma US Series 10 Excess Return Strategy (“GS Long Gamma”) attempts to provide protection in tail scenarios through a levered position in delta-hedged put options. The strategy buys 12m 10-delta S&P Put options and delta-hedges them to attempt to neutralize the inherent short market exposure in typical markets. The strategy takes a long position in volatility and is best-positioned for left-tail events with very high realized volatility. The swap became effective on May 3, 2021, and has a maturity date of February 1, 2022. The number of shares is 1,521. (Notional Value $215,065) | | $ | 907 | |
| | | $ | 907 | |
| | | | | |
| TOTAL RETURN SWAP - (0.0) % | | Unrealized Loss | |
| The Goldman Sachs Calls-vs-Calls US Series 2 Total Return Strategy (“GS Calls vs Calls”) is designed to extract dislocated call premiums from S&P 500 constituents; the strategy sells call options on a daily basis across top 100 constituents of the SPX where the term structure is most inverted. The stocks are picked with constraints on leverage, beta towards SPX and tracking error. The strategy also purchases an ATM call option on SPX to mitigate market risk. The swap became effective on May 28, 2021, and has a maturity date of February 1, 2022. The number of shares is 1,641. (Notional Value $203,000) | | $ | — | |
| | | $ | — | |
| | | | | |
| TOTAL RETURN SWAP - 0.0 % | | Unrealized Gain | |
| The Goldman Sachs Systematic Skew US Series 1D Total Return Strategy (“GS Systematic Skew”) is designed to capture the spot-volatility covariance risk premium in equity markets, while minimizing exposure to volatility risk. The strategy sells 3m 15d puts and buys 3m 40d calls (delta and gamma hedged) that target a constant exposure to skew, with performance driven by Vanna. The strategy also buys 5d tail puts for added risk management. The swap became effective on May 28, 2021, and has a maturity date of February 1, 2022. The number of shares is 1,502. (Notional Value $203,000) | | $ | — | |
| | | $ | — | |
See accompanying notes to financial statements.
| JAMES ALPHA MACRO FUND |
| CONSOLIDATED SCHEDULE OF INVESTMENTS (Continued) |
| August 31, 2021 |
James Alpha Index Swap Top 50 Holdings
| | | | | | | | | | | | | | | | Percentage of | |
| | | | | | | | | | | | | Unrealized | | | Total Return | |
| Number of | | | | | | Notional Value at | | | | | | Appreciation / | | | Swap Unrealized | |
| Contracts | | Open Long Future Contracts | | Counterparty | | August 31, 2021 | | | Expiration | | | (Depreciation) | | | Gain/(Loss) | |
| 4 | | 2 year Euro-Schatz | | Deutsche Bank | | $ | 528,421 | | | | 12/8/2021 | | | $ | (14 | ) | | | (0.00 | )% |
| 4 | | 2 year Euro-Schatz | | Deutsche Bank | | | 504,266 | | | | 9/8/2021 | | | | (47 | ) | | | (0.01 | )% |
| 10 | | 3 month Euro (EURIBOR) | | Deutsche Bank | | | 3,107,677 | | | | 6/19/2023 | | | | 74 | | | | 0.01 | % |
| 2 | | 3 month Euro (EURIBOR) | | Deutsche Bank | | | 732,373 | | | | 12/18/2023 | | | | 194 | | | | 0.02 | % |
| 1 | | 3 month Euro (EURIBOR) | | Deutsche Bank | | | 227,139 | | | | 3/14/2022 | | | | 4 | | | | 0.00 | % |
| 7 | | 3 year Australian Treasury Bond | | Deutsche Bank | | | 576,051 | | | | 9/15/2021 | | | | 1,356 | | | | 0.16 | % |
| 7 | | 10 year Australian Treasury Bond Future | | Deutsche Bank | | | 722,258 | | | | 9/15/2021 | | | | 388 | | | | 0.04 | % |
| 4 | | 10 year Canadian Govt Bond | | Deutsche Bank | | | 452,598 | | | | 12/20/2021 | | | | (843 | ) | | | (0.10 | )% |
| 4 | | 10 year Italian Bond | | Deutsche Bank | | | 781,835 | | | | 9/8/2021 | | | | (2,596 | ) | | | (0.30 | )% |
| 1 | | 10 year Japanese Government Bond | | Deutsche Bank | | | 1,514,730 | | | | 9/13/2021 | | | | (107 | ) | | | (0.01 | )% |
| 8 | | 10 year US Treasury Notes | | Deutsche Bank | | | 1,133,894 | | | | 12/21/2021 | | | | 1,140 | | | | 0.13 | % |
| 3 | | 30 year US Treasury Bonds | | Deutsche Bank | | | 501,072 | | | | 12/21/2021 | | | | 616 | | | | 0.07 | % |
| 4 | | 90 Day Bank Accepted Bill Future | | Deutsche Bank | | | 799,881 | | | | 6/9/2022 | | | | 306 | | | | 0.04 | % |
| 5 | | Brent Crude Monthly Future | | Deutsche Bank | | | 348,133 | | | | 9/30/2021 | | | | 3,546 | | | | 0.41 | % |
| 1 | | DAX Index Future | | Deutsche Bank | | | 361,528 | | | | 9/17/2021 | | | | (1,105 | ) | | | (0.13 | )% |
| 64 | | DJ EURO STOXX Banks Future | | Deutsche Bank | | | 362,516 | | | | 9/17/2021 | | | | (548 | ) | | | (0.06 | )% |
| 3 | | E-Mini Nasdaq-100 | | Deutsche Bank | | | 799,113 | | | | 9/17/2021 | | | | 4,997 | | | | 0.58 | % |
| 1 | | E-Mini S&P 500 | | Deutsche Bank | | | 315,675 | | | | 9/17/2021 | | | | 6,323 | | | | 0.73 | % |
| 10 | | Euro-BOBL | | Deutsche Bank | | | 1,602,822 | | | | 9/8/2021 | | | | 1,114 | | | | 0.13 | % |
| 14 | | Euro-BUND | | Deutsche Bank | | | 2,879,513 | | | | 9/8/2021 | | | | 1,911 | | | | 0.22 | % |
| 1 | | Euro-BUXL | | Deutsche Bank | | | 249,230 | | | | 9/8/2021 | | | | (3,155 | ) | | | (0.36 | )% |
| 2 | | Eurodollar | | Deutsche Bank | | | 463,799 | | | | 9/19/2022 | | | | 81 | | | | 0.01 | % |
| 2 | | Eurodollar | | Deutsche Bank | | | 399,746 | | | | 3/14/2022 | | | | 25 | | | | 0.00 | % |
| 1 | | Eurodollar | | Deutsche Bank | | | 369,980 | | | | 6/13/2022 | | | | (18 | ) | | | (0.00 | )% |
| 1 | | Eurodollar | | Deutsche Bank | | | 229,738 | | | | 12/18/2023 | | | | (25 | ) | | | (0.00 | )% |
| 1 | | Eurodollar | | Deutsche Bank | | | 222,560 | | | | 6/19/2023 | | | | 20 | | | | 0.00 | % |
| 3 | | Euro-OAT Future | | Deutsche Bank | | | 578,374 | | | | 9/8/2021 | | | | (1,243 | ) | | | (0.14 | )% |
| 2 | | Long Gilt Future | | Deutsche Bank | | | 412,118 | | | | 12/29/2021 | | | | (2,319 | ) | | | (0.27 | )% |
| 2 | | Mini Japanese Goverment Bond Future | | Deutsche Bank | | | 233,361 | | | | 9/10/2021 | | | | 42 | | | | 0.00 | % |
| 1 | | S&P Canada 60 Index Future | | Deutsche Bank | | | 234,259 | | | | 9/16/2021 | | | | 4,387 | | | | 0.51 | % |
| 3 | | Three Month Canadian Bankers Acceptance Future | | Deutsche Bank | | | 502,483 | | | | 6/13/2022 | | | | 85 | | | | 0.01 | % |
| 1 | | Three Month Canadian Bankers Acceptance Future | | Deutsche Bank | | | 227,367 | | | | 12/19/2022 | | | | 386 | | | | 0.04 | % |
| 2 | | Ultra Long-Term T Bond | | Deutsche Bank | | | 433,734 | | | | 12/21/2021 | | | | 1,005 | | | | 0.12 | % |
| | | | | | | | | | | | | | | $ | 15,980 | | | | | |
| | | | | | | | | | | | | | | | Percentage of | |
| | | | | | | | | | | | | Unrealized | | | Total Return | |
| Number of | | | | | | Notional Value at | | | | | | Appreciation / | | | Swap Unrealized | |
| Contracts | | Open Short Future Contracts | | Counterparty | | August 31, 2021 | | | Expiration | | | (Depreciation) | | | Gain/(Loss) | |
| (2) | | 2 year US Treasury Notes | | Deutsche Bank | | $ | (397,878 | ) | | | 12/31/2021 | | | $ | (189 | ) | | | (0.02 | )% |
| (2) | | 3 month Sterling | | Deutsche Bank | | | (305,436 | ) | | | 6/15/2022 | | | | (108 | ) | | | (0.01 | )% |
| (11) | | 3 month Sterling | | Deutsche Bank | | | (1,886,785 | ) | | | 6/21/2023 | | | | (312 | ) | | | (0.04 | )% |
| (3) | | 5 year US Treasury Notes | | Deutsche Bank | | | (430,351 | ) | | | 12/31/2021 | | | | (95 | ) | | | (0.01 | )% |
| (4) | | AUD/USD Future | | Deutsche Bank | | | (309,279 | ) | | | 9/13/2021 | | | | 2,221 | | | | 0.26 | % |
| (3) | | CAD/USD Future | | Deutsche Bank | | | (273,055 | ) | | | 9/14/2021 | | | | 344 | | | | 0.04 | % |
| (2) | | CME E-Mini Russell 2000 Index | | Deutsche Bank | | | (244,959 | ) | | | 9/17/2021 | | | | 1,402 | | | | 0.16 | % |
| (6) | | EUR/USD Future | | Deutsche Bank | | | (851,343 | ) | | | 9/13/2021 | | | | 423 | | | | 0.05 | % |
| (2) | | Eurodollar | | Deutsche Bank | | | (382,077 | ) | | | 6/17/2024 | | | | (865 | ) | | | (0.10 | )% |
| (4) | | JPY/USD Future | | Deutsche Bank | | | (483,830 | ) | | | 9/13/2021 | | | | 968 | | | | 0.11 | % |
| (2) | | Three Month Canadian Bankers Acceptance Future | | Deutsche Bank | | | (301,382 | ) | | | 3/14/2022 | | | | 5 | | | | 0.00 | % |
| | | | | | | | | | | | | | | $ | 3,794 | | | | | |
| | | | | | | | | | | | | | | | | | | | | |
| | | TOTAL FUTURES CONTRACTS | | | | | | | | | | | | $ | 19,774 | | | | | |
| | | | | | | | | | | | | | | | | | Percentage of | |
| | | | | | | | | | | | | | | | | | Total Return | |
| | | | | | | Notional Value at | | | | | | | | Unrealized | | | Swap Unrealized | |
| | Description | | Counterparty | | August 31, 2021 | | | Expiration | | Strike Price | | | Appreciation | | | Gain | |
| | CNH/USD | | Deutsche Bank | | $ | 374,707 | | | 11/17/2021 | | $ | 6.00 | | | $ | 0 | | | | 0.00 | % |
| | | TOTAL PURCHASED PUT OPTIONS | | | | | | | | 0 | | | | | |
James Alpha Index Swap Top 50 Holdings (Continued)
| FORWARD CURRENCY CONTRACTS + |
| | | | | | | | | | | | | | | | | | Unrealized | |
| Settlement | | Units to | | | | | | | | | | | | US Dollar | | | Appreciation / | |
| Date | | Receive/Deliver | | | | | Counterparty | | In Exchange For | | | | | Value | | | (Depreciation) | |
| To Buy: | | | | | | | | | | | | | | | | | | | | | | |
| 9/29/2021 | | | 593,479 | | | USD | | Deutsche Bank | | $ | 504,362 | | | EUR | | $ | 506,535 | | | $ | 2,173 | |
| 9/29/2021 | | | 276,750 | | | USD | | Deutsche Bank | | | 381,907 | | | AUD | | | 384,161 | | | | 2,254 | |
| 9/29/2021 | | | 328,504 | | | CHF | | Deutsche Bank | | | 360,928 | | | USD | | | 363,237 | | | | 2,309 | |
| To Sell: | | | | | | | | | | | | | | | | | | | | | | |
| 9/1/2021 | | | 313,130 | | | CHF | | Deutsche Bank | | | 290,888 | | | EUR | | | 289,250 | | | | (1,639 | ) |
| 9/29/2021 | | | 4,104,287 | | | MXN | | Deutsche Bank | | | 201,224 | | | USD | | | 203,759 | | | | 2,535 | |
| TOTAL FORWARD CURRENCY CONTRACTS | | | | | | | 7,632 | |
| + | Foreign currency transactions are done by notional and not by contracts |
Currency Abbreviations:
See accompanying notes to financial statements.
| EASTERLY GLOBAL MACRO FUND |
| CONSOLIDATED SCHEDULE OF INVESTMENTS (Continued) |
| August 31, 2021 |
Goldman Sachs i-Select III Series 88 Excess Return Strategy Top 50 Holdings
| Number of | | | | | | | Notional Value at | | | | |
| Contracts | | Open Long Future Contracts | | | Counterparty | | August 31, 2021 | | | Expiration | |
| 0 | | CBOT 10 Year US Treasury Note 12/21/2021 | | | Goldman Sachs | | $ | 51,374 | | | 12/21/2021 | |
| 1 | | CBOT 2 Year US Treasury Note Future 12/31/2021 | | | Goldman Sachs | | | 281,387 | | | 12/31/2021 | |
| 2 | | CBOT 5 Year US Treasury Note 12/31/2021 | | | Goldman Sachs | | | 284,800 | | | 12/31/2021 | |
| 1 | | CBOT 5 Year US Treasury Note 12/31/2021 | | | Goldman Sachs | | | 93,887 | | | 12/31/2021 | |
| 0 | | CBOT Soybean Future 03/14/2022 | | | Goldman Sachs | | | 11,733 | | | 3/14/2022 | |
| 0 | | CBOT US Long Bond Future 12/21/2021 | | | Goldman Sachs | | | 25,179 | | | 12/21/2021 | |
| 1 | | CBOT Wheat Future 03/14/2022 | | | Goldman Sachs | | | 22,104 | | | 3/14/2022 | |
| 1 | | CME 3 Month Eurodollar Future 03/14/2022 | | | Goldman Sachs | | | 280,951 | | | 3/14/2022 | |
| 1 | | CME 3 Month Eurodollar Future 06/13/2022 | | | Goldman Sachs | | | 280,846 | | | 6/13/2022 | |
| 1 | | CME 3 Month Eurodollar Future 09/19/2022 | | | Goldman Sachs | | | 280,677 | | | 9/19/2022 | |
| 1 | | CME 3 Month Eurodollar Future 12/13/2021 | | | Goldman Sachs | | | 280,936 | | | 12/13/2021 | |
| 1 | | CME 3 Month Eurodollar Future 12/19/2022 | | | Goldman Sachs | | | 280,424 | | | 12/19/2022 | |
| 2 | | CME E-Mini NASDAQ 100 Index Future 09/17/2021 | | | Goldman Sachs | | | 34,108 | | | 9/17/2021 | |
| 7 | | CME E-Mini Standard & Poor's 500 Index Future 09/17/2021 | | | Goldman Sachs | | | 31,338 | | | 9/17/2021 | |
| 1 | | Corn Future | | | Goldman Sachs | | | 16,048 | | | 3/14/2022 | |
| 0 | | Cotton No.2 Future | | | Goldman Sachs | | | 12,305 | | | 3/9/2022 | |
| 0 | | Eurex 10 Year Euro BUND Future 09/08/2021 | | | Goldman Sachs | | | 19,561 | | | 9/8/2021 | |
| 0 | | Eurex 10 Year Euro BUND Future 12/08/2021 | | | Goldman Sachs | | | 39,493 | | | 12/8/2021 | |
| 0 | | Eurex 2 Year Euro SCHATZ Future 44447 | | | Goldman Sachs | | | 58,787 | | | 9/8/2021 | |
| 1 | | Eurex 2 Year Euro SCHATZ Future 44538 | | | Goldman Sachs | | | 117,612 | | | 12/8/2021 | |
| 0 | | Eurex 5 Year Euro BOBL Future | | | Goldman Sachs | | | 69,058 | | | 12/8/2021 | |
| 2 | | Eurex 5 Year Euro BOBL Future 44447 | | | Goldman Sachs | | | 273,542 | | | 9/8/2021 | |
| 0 | | Eurex 5 Year Euro BOBL Future 44447 | | | Goldman Sachs | | | 34,411 | | | 9/8/2021 | |
| 2 | | Eurex Swiss Market New Index Future 09/17/2021 | | | Goldman Sachs | | | 33,722 | | | 9/17/2021 | |
| 0 | | Euro-BTP Future | | | Goldman Sachs | | | 17,870 | | | 12/8/2021 | |
| 34 | | Euronext Amsterdam Index Future 44456 | | | Goldman Sachs | | | 31,269 | | | 9/17/2021 | |
| 2 | | Euronext CAC 40 Index Future 09/17/2021 | | | Goldman Sachs | | | 15,474 | | | 9/17/2021 | |
| 61,985 | | KOPSI 200 Index Future | | | Goldman Sachs | | | 22,427 | | | 9/9/2021 | |
| 0 | | LME Copper Future | | | Goldman Sachs | | | 9,965 | | | 10/18/2021 | |
| 0 | | LME Nickel Future | | | Goldman Sachs | | | 10,131 | | | 10/18/2021 | |
| 0 | | LME Primary Aluminum Future | | | Goldman Sachs | | | 14,405 | | | 2/14/2022 | |
| 0 | | LME Primary Aluminum Future | | | Goldman Sachs | | | 10,818 | | | 1/17/2022 | |
| 0 | | LME Primary Aluminum Future 10/18/2021 | | | Goldman Sachs | | | 10,111 | | | 10/18/2021 | |
| 0 | | LME Zinc Future | | | Goldman Sachs | | | 10,731 | | | 11/15/2021 | |
| 0 | | LME Zinc Future 10/18/2021 | | | Goldman Sachs | | | 9,855 | | | 10/18/2021 | |
| 0 | | Montreal Exchange 10 Year Canadian Bond Future 12/20/2021 | | | Goldman Sachs | | | 28,823 | | | 12/20/2021 | |
| 30 | | Montreal Exchange S&P/TSX 60 Index Future 09/16/2021 | | | Goldman Sachs | | | 28,863 | | | 9/17/2021 | |
| 0 | | NYBOT CSC C Coffee Future | | | Goldman Sachs | | | 26,815 | | | 3/21/2022 | |
| 0 | | NYBOT CSC C Coffee Future 12/20/2021 | | | Goldman Sachs | | | 10,038 | | | 12/20/2021 | |
| 1 | | NYBOT CSC Number 11 World Sugar Future 02/28/2022 | | | Goldman Sachs | | | 28,792 | | | 2/28/2022 | |
| 123 | | OML Stockholm OMXS30 Index Future 09/17/2021 | | | Goldman Sachs | | | 33,469 | | | 9/17/2021 | |
| 0 | | SFE 10 Year Australian Bond Future 09/15/2021 | | | Goldman Sachs | | | 29,418 | | | 9/15/2021 | |
| 5 | | SFE S&P ASX Share Price Index 200 Future 09/16/2021 | | | Goldman Sachs | | | 25,492 | | | 9/16/2021 | |
| 0 | | TSE Japanese 10 Year Bond Futures 09/13/2021 | | | Goldman Sachs | | | 33,756 | | | 9/9/2021 | |
| Number of | | | | | | Notional Value at | | | | | | |
| Contracts | | Open Credit Default Swap | | Counterparty | | August 31, 2021 | | | Expiration | | Value | |
| 84,435 | | Markit CDX North America Investment Grade Index | | Goldman Sachs | | | 84,435 | | | 6/20/2026 | | $ | (2,309 | ) |
| 12,949 | | Markit CDX North America High Yield Index | | Goldman Sachs | | | 12,949 | | | 6/20/2026 | | | (1,400 | ) |
| | | | | | | | | | | | | | (3,709 | ) |
| Number of | | | | | | Notional Value at | | | | | Exercise | | | | |
| Contracts | | Open Put Options | | Counterparty | | August 31, 2021 | | | Expiration | | Price | | | Market Value | |
| 76 | | Apple, Inc. | | Goldman Sachs | | $ | 11,574 | | | 9/17/2021 | | $ | 130 | | | $ | 1,676 | |
| 86 | | Apple, Inc. | | Goldman Sachs | | | 13,117 | | | 9/17/2021 | | | 135 | | | | 1,482 | |
| 83 | | Apple, Inc. | | Goldman Sachs | | | 12,657 | | | 9/17/2021 | | | 140 | | | | 1,025 | |
| 71 | | Apple, Inc. | | Goldman Sachs | | | 10,798 | | | 9/17/2021 | | | 145 | | | | 549 | |
| | | | | | | | | | | | | | | | | | 4,732 | |
| * | The GS i-Select invests in 15 Portfolio Constituents which do not trade individual futures, therefore the Futures do not have any individual unrealized gains/losses. |
See accompanying notes to financial statements.
| EASTERLY GLOBAL MACRO FUND |
| CONSOLIDATED SCHEDULE OF INVESTMENTS (Continued) |
| August 31, 2021 |
Goldman Sachs Intraday Momentum ES Series 1 Excess Return Strategy Top 50 Holdings
Goldman Sachs Long Gamma US Series 10 Total Return Strategy Top 50 Holdings
| Number of | | | | | | Notional Value at | | | | | Exercise | | | | |
| Contracts | | Open Short Equity Forwards | | Counterparty | | August 31, 2021 | | | Expiration | | Price | | | Market Value | |
| 4 | | S&P 500 Index | | Goldman Sachs | | $ | 18,461 | | | 12/17/2021 | | $ | 4,530 | | | | (79 | ) |
| 3 | | S&P 500 Index | | Goldman Sachs | | | 15,073 | | | 3/18/2022 | | | 4,525 | | | | (72 | ) |
| 6 | | S&P 500 Index | | Goldman Sachs | | | 26,825 | | | 6/17/2022 | | | 4,525 | | | | (185 | ) |
| | | | | | | | | | | | | | | | | | (336 | ) |
| Number of | | | | | | Notional Value at | | | | | Exercise | | | | |
| Contracts | | Open Put Options | | Counterparty | | August 31, 2021 | | | Expiration | | Price | | | Market Value | |
| 9 | | S&P 500 Index | | Goldman Sachs | | $ | 41,080 | | | 9/17/2021 | | $ | 1,850 | | | $ | — | |
| 6 | | S&P 500 Index | | Goldman Sachs | | | 29,192 | | | 12/17/2021 | | | 2,125 | | | | 15 | |
| 6 | | S&P 500 Index | | Goldman Sachs | | | 27,971 | | | 12/17/2021 | | | 2,525 | | | | 28 | |
| 6 | | S&P 500 Index | | Goldman Sachs | | | 27,851 | | | 9/17/2021 | | | 2,250 | | | | — | |
| 6 | | S&P 500 Index | | Goldman Sachs | | | 27,435 | | | 9/17/2021 | | | 1,900 | | | | — | |
| 6 | | S&P 500 Index | | Goldman Sachs | | | 27,169 | | | 3/18/2022 | | | 2,150 | | | | 45 | |
| 6 | | S&P 500 Index | | Goldman Sachs | | | 26,537 | | | 12/17/2021 | | | 2,800 | | | | 43 | |
| 5 | | S&P 500 Index | | Goldman Sachs | | | 23,761 | | | 9/17/2021 | | | 2,225 | | | | — | |
| 5 | | S&P 500 Index | | Goldman Sachs | | | 23,541 | | | 12/17/2021 | | | 2,150 | | | | 12 | |
| 5 | | S&P 500 Index | | Goldman Sachs | | | 23,105 | | | 9/17/2021 | | | 2,500 | | | | — | |
| 5 | | S&P 500 Index | | Goldman Sachs | | | 22,487 | | | 12/17/2021 | | | 2,175 | | | | 12 | |
| 5 | | S&P 500 Index | | Goldman Sachs | | | 21,353 | | | 12/17/2021 | | | 2,250 | | | | 13 | |
| 5 | | S&P 500 Index | | Goldman Sachs | | | 20,631 | | | 12/17/2021 | | | 2,450 | | | | 18 | |
| 4 | | S&P 500 Index | | Goldman Sachs | | | 20,186 | | | 3/18/2022 | | | 2,100 | | | | 31 | |
| 4 | | S&P 500 Index | | Goldman Sachs | | | 19,841 | | | 12/17/2021 | | | 2,550 | | | | 21 | |
| 4 | | S&P 500 Index | | Goldman Sachs | | | 19,693 | | | 12/17/2021 | | | 2,500 | | | | 19 | |
| 4 | | S&P 500 Index | | Goldman Sachs | | | 19,443 | | | 3/18/2022 | | | 2,050 | | | | 28 | |
| 4 | | S&P 500 Index | | Goldman Sachs | | | 18,832 | | | 9/17/2021 | | | 2,325 | | | | — | |
| 4 | | S&P 500 Index | | Goldman Sachs | | | 18,512 | | | 9/17/2021 | | | 2,275 | | | | — | |
| 4 | | S&P 500 Index | | Goldman Sachs | | | 18,487 | | | 12/17/2021 | | | 2,575 | | | | 20 | |
| 4 | | S&P 500 Index | | Goldman Sachs | | | 18,466 | | | 9/17/2021 | | | 1,800 | | | | — | |
| 4 | | S&P 500 Index | | Goldman Sachs | | | 17,822 | | | 12/17/2021 | | | 2,200 | | | | 10 | |
| 4 | | S&P 500 Index | | Goldman Sachs | | | 17,812 | | | 4/14/2022 | | | 2,500 | | | | 62 | |
| 4 | | S&P 500 Index | | Goldman Sachs | | | 17,725 | | | 9/17/2021 | | | 1,950 | | | | — | |
| 4 | | S&P 500 Index | | Goldman Sachs | | | 17,454 | | | 7/15/2022 | | | 2,600 | | | | 114 | |
| 4 | | S&P 500 Index | | Goldman Sachs | | | 17,156 | | | 9/17/2021 | | | 2,400 | | | | — | |
| 4 | | S&P 500 Index | | Goldman Sachs | | | 17,023 | | | 3/18/2022 | | | 2,600 | | | | 56 | |
| 4 | | S&P 500 Index | | Goldman Sachs | | | 16,221 | | | 3/18/2022 | | | 2,500 | | | | 46 | |
| 3 | | S&P 500 Index | | Goldman Sachs | | | 15,778 | | | 9/17/2021 | | | 2,525 | | | | — | |
| 3 | | S&P 500 Index | | Goldman Sachs | | | 15,654 | | | 12/17/2021 | | | 2,825 | | | | 26 | |
| 3 | | S&P 500 Index | | Goldman Sachs | | | 15,262 | | | 9/17/2021 | | | 2,050 | | | | — | |
| 3 | | S&P 500 Index | | Goldman Sachs | | | 15,205 | | | 9/17/2021 | | | 2,475 | | | | — | |
| 3 | | S&P 500 Index | | Goldman Sachs | | | 15,087 | | | 12/17/2021 | | | 2,100 | | | | 7 | |
| 3 | | S&P 500 Index | | Goldman Sachs | | | 14,877 | | | 6/17/2022 | | | 2,500 | | | | 75 | |
| 3 | | S&P 500 Index | | Goldman Sachs | | | 14,179 | | | 12/17/2021 | | | 2,425 | | | | 12 | |
| 3 | | S&P 500 Index | | Goldman Sachs | | | 14,092 | | | 9/17/2021 | | | 2,200 | | | | — | |
| 3 | | S&P 500 Index | | Goldman Sachs | | | 13,901 | | | 12/17/2021 | | | 1,800 | | | | 4 | |
| 3 | | S&P 500 Index | | Goldman Sachs | | | 13,869 | | | 9/17/2021 | | | 2,550 | | | | — | |
| 3 | | S&P 500 Index | | Goldman Sachs | | | 13,766 | | | 9/17/2021 | | | 2,000 | | | | — | |
| 3 | | S&P 500 Index | | Goldman Sachs | | | 13,357 | | | 9/17/2021 | | | 1,750 | | | | — | |
| 3 | | S&P 500 Index | | Goldman Sachs | | | 13,170 | | | 12/17/2021 | | | 2,700 | | | | 18 | |
| 3 | | S&P 500 Index | | Goldman Sachs | | | 12,940 | | | 6/17/2022 | | | 2,050 | | | | 33 | |
| 3 | | S&P 500 Index | | Goldman Sachs | | | 12,883 | | | 12/17/2021 | | | 2,675 | | | | 17 | |
| 3 | | S&P 500 Index | | Goldman Sachs | | | 12,838 | | | 3/18/2022 | | | 2,250 | | | | 25 | |
| 3 | | S&P 500 Index | | Goldman Sachs | | | 12,837 | | | 9/17/2021 | | | 2,350 | | | | — | |
| 3 | | S&P 500 Index | | Goldman Sachs | | | 12,657 | | | 3/18/2022 | | | 2,550 | | | | 39 | |
| 3 | | S&P 500 Index | | Goldman Sachs | | | 12,647 | | | 9/17/2021 | | | 2,450 | | | | — | |
| | | | | | | | | | | | | | | | | | 849 | |
See accompanying notes to financial statements.
| EASTERLY GLOBAL MACRO FUND |
| CONSOLIDATED SCHEDULE OF INVESTMENTS (Continued) |
| August 31, 2021 |
Goldman Sachs Calls-vs-Calls US Series 2 Total Return Strategy Top 50 Holdings
| Number of | | | | | | Notional Value at | | | | | Exercise | | | | |
| Contracts | | Open Call Options | | Counterparty | | August 31, 2021 | | | Expiration | | Price | | | Market Value | |
| 6 | | S&P 500 Index | | Goldman Sachs | | $ | 27,382 | | | 9/17/2021 | | $ | 4,400 | | | $ | 825 | |
| 5 | | S&P 500 Index | | Goldman Sachs | | | 21,135 | | | 9/17/2021 | | | 4,475 | | | | 333 | |
| 4 | | S&P 500 Index | | Goldman Sachs | | | 18,031 | | | 9/17/2021 | | | 4,445 | | | | 384 | |
| 3 | | S&P 500 Index | | Goldman Sachs | | | 15,657 | | | 9/17/2021 | | | 4,435 | | | | 363 | |
| 3 | | S&P 500 Index | | Goldman Sachs | | | 13,466 | | | 9/17/2021 | | | 4,405 | | | | 392 | |
| 3 | | S&P 500 Index | | Goldman Sachs | | | 12,573 | | | 9/17/2021 | | | 4,440 | | | | 280 | |
| 3 | | S&P 500 Index | | Goldman Sachs | | | 11,366 | | | 9/17/2021 | | | 4,420 | | | | 297 | |
| 2 | | S&P 500 Index | | Goldman Sachs | | | 11,096 | | | 9/17/2021 | | | 4,485 | | | | 156 | |
| 2 | | S&P 500 Index | | Goldman Sachs | | | 10,907 | | | 10/15/2021 | | | 4,400 | | | | 405 | |
| 2 | | S&P 500 Index | | Goldman Sachs | | | 10,362 | | | 9/17/2021 | | | 4,495 | | | | 128 | |
| 2 | | S&P 500 Index | | Goldman Sachs | | | 9,718 | | | 9/17/2021 | | | 4,470 | | | | 162 | |
| 2 | | S&P 500 Index | | Goldman Sachs | | | 9,586 | | | 9/17/2021 | | | 4,385 | | | | 318 | |
| 2 | | S&P 500 Index | | Goldman Sachs | | | 9,022 | | | 9/17/2021 | | | 4,465 | | | | 159 | |
| 2 | | S&P 500 Index | | Goldman Sachs | | | 8,963 | | | 9/17/2021 | | | 4,505 | | | | 97 | |
| 2 | | S&P 500 Index | | Goldman Sachs | | | 8,695 | | | 9/17/2021 | | | 4,455 | | | | 169 | |
| 2 | | S&P 500 Index | | Goldman Sachs | | | 8,327 | | | 10/15/2021 | | | 4,470 | | | | 208 | |
| 2 | | S&P 500 Index | | Goldman Sachs | | | 8,281 | | | 9/17/2021 | | | 4,525 | | | | 65 | |
| 2 | | S&P 500 Index | | Goldman Sachs | | | 7,845 | | | 9/17/2021 | | | 4,430 | | | | 190 | |
| 2 | | S&P 500 Index | | Goldman Sachs | | | 7,220 | | | 9/17/2021 | | | 4,425 | | | | 182 | |
| 2 | | S&P 500 Index | | Goldman Sachs | | | 6,907 | | | 10/15/2021 | | | 4,430 | | | | 219 | |
| 2 | | S&P 500 Index | | Goldman Sachs | | | 6,901 | | | 10/15/2021 | | | 4,525 | | | | 115 | |
| 2 | | S&P 500 Index | | Goldman Sachs | | | 6,886 | | | 9/17/2021 | | | 4,355 | | | | 271 | |
| 2 | | S&P 500 Index | | Goldman Sachs | | | 6,800 | | | 10/15/2021 | | | 4,480 | | | | 159 | |
| 1 | | S&P 500 Index | | Goldman Sachs | | | 6,502 | | | 9/17/2021 | | | 4,325 | | | | 296 | |
| 1 | | S&P 500 Index | | Goldman Sachs | | | 6,473 | | | 9/17/2021 | | | 4,245 | | | | 405 | |
| 1 | | S&P 500 Index | | Goldman Sachs | | | 6,432 | | | 9/17/2021 | | | 4,370 | | | | 233 | |
| 1 | | S&P 500 Index | | Goldman Sachs | | | 6,378 | | | 10/15/2021 | | | 4,510 | | | | 120 | |
| 1 | | S&P 500 Index | | Goldman Sachs | | | 6,212 | | | 10/15/2021 | | | 4,420 | | | | 208 | |
| 1 | | S&P 500 Index | | Goldman Sachs | | | 6,063 | | | 9/17/2021 | | | 4,225 | | | | 405 | |
| 1 | | S&P 500 Index | | Goldman Sachs | | | 6,039 | | | 9/17/2021 | | | 4,395 | | | | 188 | |
| 1 | | S&P 500 Index | | Goldman Sachs | | | 5,977 | | | 9/17/2021 | | | 4,320 | | | | 279 | |
| 1 | | S&P 500 Index | | Goldman Sachs | | | 5,718 | | | 9/17/2021 | | | 4,415 | | | | 155 | |
| 1 | | S&P 500 Index | | Goldman Sachs | | | 5,716 | | | 10/15/2021 | | | 4,370 | | | | 244 | |
| 1 | | S&P 500 Index | | Goldman Sachs | | | 5,461 | | | 9/17/2021 | | | 4,290 | | | | 289 | |
| 1 | | S&P 500 Index | | Goldman Sachs | | | 5,354 | | | 10/15/2021 | | | 4,495 | | | | 113 | |
| 1 | | S&P 500 Index | | Goldman Sachs | | | 5,294 | | | 10/15/2021 | | | 4,410 | | | | 187 | |
| 1 | | S&P 500 Index | | Goldman Sachs | | | 5,136 | | | 10/15/2021 | | | 4,360 | | | | 229 | |
| 1 | | S&P 500 Index | | Goldman Sachs | | | 4,855 | | | 10/15/2021 | | | 4,485 | | | | 110 | |
| 1 | | S&P 500 Index | | Goldman Sachs | | | 4,849 | | | 10/15/2021 | | | 4,450 | | | | 137 | |
| 1 | | S&P 500 Index | | Goldman Sachs | | | 4,605 | | | 11/19/2021 | | | 4,440 | | | | 176 | |
| 1 | | S&P 500 Index | | Goldman Sachs | | | 4,550 | | | 11/19/2021 | | | 4,400 | | | | 205 | |
| 1 | | S&P 500 Index | | Goldman Sachs | | | 4,440 | | | 9/17/2021 | | | 4,410 | | | | 125 | |
| 1 | | S&P 500 Index | | Goldman Sachs | | | 4,298 | | | 9/17/2021 | | | 4,240 | | | | 273 | |
| 1 | | S&P 500 Index | | Goldman Sachs | | | 4,160 | | | 9/17/2021 | | | 4,200 | | | | 300 | |
| 1 | | S&P 500 Index | | Goldman Sachs | | | 4,155 | | | 9/17/2021 | | | 4,365 | | | | 155 | |
| 1 | | S&P 500 Index | | Goldman Sachs | | | 3,971 | | | 9/17/2021 | | | 4,220 | | | | 270 | |
| 1 | | S&P 500 Index | | Goldman Sachs | | | 3,923 | | | 11/19/2021 | | | 4,470 | | | | 131 | |
| 1 | | S&P 500 Index | | Goldman Sachs | | | 3,842 | | | 10/15/2021 | | | 4,440 | | | | 115 | |
| 1 | | S&P 500 Index | | Goldman Sachs | | | 3,818 | | | 11/19/2021 | | | 4,480 | | | | 122 | |
| 1 | | S&P 500 Index | | Goldman Sachs | | | 3,519 | | | 10/15/2021 | | | 4,325 | | | | 180 | |
| | | | | | | | | | | | | | | | | | 11,527 | |
See accompanying notes to financial statements.
| EASTERLY GLOBAL MACRO FUND |
| CONSOLIDATED SCHEDULE OF INVESTMENTS (Continued) |
| August 31, 2021 |
Goldman Sachs Systematic Skew US Series 1D Total Return Strategy Top 50 Holdings
| Number of | | | | | | Notional Value at | | | | | Exercise | | | | |
| Contracts | | Open Call Options | | Counterparty | | August 31, 2021 | | | Expiration | | Price | | | Market Value | |
| 5 | | S&P 500 Index | | Goldman Sachs | | $ | 24,235 | | | 9/17/2021 | | $ | 4,330 | | | $ | 1,080 | |
| | | | | | | | | | | | | | | | | | 1,080 | |
| Number of | | | | | | Notional Value at | | | | | Exercise | | | | |
| Contracts | | Open Put Options | | Counterparty | | August 31, 2021 | | | Expiration | | Price | | | Market Value | |
| 20 | | S&P 500 Index | | Goldman Sachs | | $ | 90,774 | | | 10/15/2021 | | $ | 2,500 | | | $ | 12 | |
| 16 | | S&P 500 Index | | Goldman Sachs | | | 74,497 | | | 10/15/2021 | | | 2,450 | | | | 8 | |
| 16 | | S&P 500 Index | | Goldman Sachs | | | 74,298 | | | 9/17/2021 | | | 2,650 | | | | 1 | |
| 16 | | S&P 500 Index | | Goldman Sachs | | | 73,776 | | | 10/15/2021 | | | 2,550 | | | | 10 | |
| 15 | | S&P 500 Index | | Goldman Sachs | | | 68,260 | | | 11/19/2021 | | | 2,600 | | | | 42 | |
| 15 | | S&P 500 Index | | Goldman Sachs | | | 67,343 | | | 10/15/2021 | | | 2,600 | | | | 11 | |
| 14 | | S&P 500 Index | | Goldman Sachs | | | 62,910 | | | 10/15/2021 | | | 2,700 | | | | 12 | |
| 13 | | S&P 500 Index | | Goldman Sachs | | | 61,055 | | | 10/15/2021 | | | 2,800 | | | | 15 | |
| 13 | | S&P 500 Index | | Goldman Sachs | | | 61,024 | | | 9/17/2021 | | | 2,740 | | | | 1 | |
| 13 | | S&P 500 Index | | Goldman Sachs | | | 56,974 | | | 10/15/2021 | | | 2,900 | | | | 17 | |
| 12 | | S&P 500 Index | | Goldman Sachs | | | 56,065 | | | 11/19/2021 | | | 2,300 | | | | 19 | |
| 12 | | S&P 500 Index | | Goldman Sachs | | | 53,887 | | | 9/17/2021 | | | 2,500 | | | | — | |
| 10 | | S&P 500 Index | | Goldman Sachs | | | 46,010 | | | 11/19/2021 | | | 2,350 | | | | 18 | |
| 10 | | S&P 500 Index | | Goldman Sachs | | | 44,959 | | | 11/19/2021 | | | 2,250 | | | | 14 | |
| 10 | | S&P 500 Index | | Goldman Sachs | | | 43,660 | | | 9/17/2021 | | | 2,900 | | | | 1 | |
| 10 | | S&P 500 Index | | Goldman Sachs | | | 43,096 | | | 9/17/2021 | | | 2,475 | | | | — | |
| 9 | | S&P 500 Index | | Goldman Sachs | | | 41,436 | | | 11/19/2021 | | | 2,650 | | | | 28 | |
| 9 | | S&P 500 Index | | Goldman Sachs | | | 39,687 | | | 9/17/2021 | | | 2,960 | | | | 1 | |
| 9 | | S&P 500 Index | | Goldman Sachs | | | 39,333 | | | 9/17/2021 | | | 2,625 | | | | 1 | |
| 9 | | S&P 500 Index | | Goldman Sachs | | | 39,069 | | | 9/17/2021 | | | 2,975 | | | | 2 | |
| 8 | | S&P 500 Index | | Goldman Sachs | | | 37,802 | | | 9/17/2021 | | | 2,825 | | | | 1 | |
| 8 | | S&P 500 Index | | Goldman Sachs | | | 37,562 | | | 11/19/2021 | | | 2,550 | | | | 21 | |
| 8 | | S&P 500 Index | | Goldman Sachs | | | 36,584 | | | 11/19/2021 | | | 2,400 | | | | 15 | |
| 8 | | S&P 500 Index | | Goldman Sachs | | | 35,704 | | | 10/15/2021 | | | 2,940 | | | | 12 | |
| 8 | | S&P 500 Index | | Goldman Sachs | | | 35,439 | | | 11/19/2021 | | | 2,450 | | | | 16 | |
| 8 | | S&P 500 Index | | Goldman Sachs | | | 34,326 | | | 9/17/2021 | | | 2,700 | | | | — | |
| 7 | | S&P 500 Index | | Goldman Sachs | | | 33,840 | | | 9/17/2021 | | | 2,325 | | | | — | |
| 7 | | S&P 500 Index | | Goldman Sachs | | | 30,907 | | | 10/15/2021 | | | 2,300 | | | | 2 | |
| 7 | | S&P 500 Index | | Goldman Sachs | | | 30,848 | | | 9/17/2021 | | | 3,200 | | | | 2 | |
| 7 | | S&P 500 Index | | Goldman Sachs | | | 30,760 | | | 9/17/2021 | | | 2,425 | | | | — | |
| 7 | | S&P 500 Index | | Goldman Sachs | | | 30,622 | | | 10/15/2021 | | | 2,250 | | | | 2 | |
| 7 | | S&P 500 Index | | Goldman Sachs | | | 30,470 | | | 10/15/2021 | | | 2,400 | | | | 3 | |
| 7 | | S&P 500 Index | | Goldman Sachs | | | 30,136 | | | 10/15/2021 | | | 3,020 | | | | 12 | |
| 6 | | S&P 500 Index | | Goldman Sachs | | | 28,986 | | | 9/17/2021 | | | 3,080 | | | | 2 | |
| 6 | | S&P 500 Index | | Goldman Sachs | | | 28,714 | | | 9/17/2021 | | | 3,220 | | | | 2 | |
| 6 | | S&P 500 Index | | Goldman Sachs | | | 28,650 | | | 12/17/2021 | | | 2,400 | | | | 23 | |
| 6 | | S&P 500 Index | | Goldman Sachs | | | 28,429 | | | 10/15/2021 | | | 3,080 | | | | 13 | |
| 6 | | S&P 500 Index | | Goldman Sachs | | | 28,126 | | | 10/15/2021 | | | 3,100 | | | | 13 | |
| 6 | | S&P 500 Index | | Goldman Sachs | | | 28,038 | | | 9/17/2021 | | | 3,150 | | | | 2 | |
| 6 | | S&P 500 Index | | Goldman Sachs | | | 27,826 | | | 10/15/2021 | | | 3,025 | | | | 11 | |
| 6 | | S&P 500 Index | | Goldman Sachs | | | 27,802 | | | 9/17/2021 | | | 2,450 | | | | — | |
| 6 | | S&P 500 Index | | Goldman Sachs | | | 27,766 | | | 10/15/2021 | | | 3,180 | | | | 15 | |
| 6 | | S&P 500 Index | | Goldman Sachs | | | 27,722 | | | 9/17/2021 | | | 3,320 | | | | 3 | |
| 6 | | S&P 500 Index | | Goldman Sachs | | | 26,931 | | | 9/17/2021 | | | 3,100 | | | | 2 | |
| 6 | | S&P 500 Index | | Goldman Sachs | | | 26,842 | | | 9/17/2021 | | | 2,100 | | | | — | |
| 6 | | S&P 500 Index | | Goldman Sachs | | | 26,754 | | | 11/19/2021 | | | 2,500 | | | | 14 | |
| 6 | | S&P 500 Index | | Goldman Sachs | | | 25,041 | | | 12/17/2021 | | | 2,225 | | | | 15 | |
| 5 | | S&P 500 Index | | Goldman Sachs | | | 24,628 | | | 9/17/2021 | | | 3,030 | | | | 1 | |
| 5 | | S&P 500 Index | | Goldman Sachs | | | 24,423 | | | 9/17/2021 | | | 2,850 | | | | 1 | |
| | | | | | | | | | | | | | | | | | 416 | |
See accompanying notes to financial statements.
| EASTERLY GLOBAL REAL ESTATE FUND |
| SCHEDULE OF INVESTMENTS |
| August 31, 2021 |
| Shares | | | | | Fair Value | |
| | | | | COMMON STOCKS — 98.5% | | | | |
| | | | | Australia - 1.4% | | | | |
| | 1,322,939 | | | NEXTDC Ltd.(a) | | $ | 12,753,300 | |
| | | | | | | | | |
| | | | | Bermuda - 4.3% | | | | |
| | 9,230,837 | | | Hongkong Land Holdings Ltd. | | | 38,769,515 | |
| | | | | | | | | |
| | | | | Canada - 0.9% | | | | |
| | 808,074 | | | NorthWest Healthcare Properties Real Estate Investment Trust | | | 8,473,059 | |
| | | | | | | | | |
| | | | | Cayman Islands - 10.3% | | | | |
| | 4,797,909 | | | CK Asset Holdings Ltd. | | | 31,244,833 | |
| | 4,840,342 | | | ESR Cayman Ltd.(a) | | | 14,745,758 | |
| | 753,839 | | | GDS Holdings Ltd. - ADR(a) | | | 44,084,504 | |
| | 568,505 | | | Wharf Real Estate Investment Company Ltd. | | | 2,815,390 | |
| | | | | | | | 92,890,485 | |
| | | | | France - 3.9% | | | | |
| | 644,621 | | | Accor S.A.(a) | | | 22,223,770 | |
| | 546,727 | | | Klepierre S.A. | | | 13,400,186 | |
| | | | | | | | 35,623,956 | |
| | | | | Hong Kong - 6.0% | | | | |
| | 5,890,693 | | | Link REIT | | | 54,162,107 | |
| | | | | | | | | |
| | | | | Ireland - 1.5% | | | | |
| | 10,960,197 | | | Glenveagh Properties PLC(a) | | | 14,016,069 | |
| | | | | | | | | |
| | | | | Italy - 1.6% | | | | |
| | 981,321 | | | COIMA RES SpA | | | 7,983,979 | |
| | 563,103 | | | Infrastrutture Wireless Italiane SpA | | | 6,697,771 | |
| | | | | | | | 14,681,750 | |
| | | | | Japan - 11.2% | | | | |
| | 3,887 | | | Daiwa House REIT Investment Corporation | | | 11,496,174 | |
| | 43,357 | | | Japan Hotel REIT Investment Corporation | | | 25,634,232 | |
| | 4,115,901 | | | Mitsubishi Estate Company Ltd. | | | 64,531,004 | |
| | | | | | | | 101,661,410 | |
See accompanying notes to financial statements.
| EASTERLY GLOBAL REAL ESTATE FUND |
| SCHEDULE OF INVESTMENTS (Continued) |
| August 31, 2021 |
| Shares | | | | | Fair Value | |
| | | | | COMMON STOCKS — 98.5% (Continued) | | | | |
| | | | | Singapore - 1.6% | | | | |
| | 5,698,133 | | | Keppel DC REIT | | $ | 10,574,774 | |
| | 2,658,897 | | | Mapletree Commercial Trust | | | 4,003,632 | |
| | | | | | | | 14,578,406 | |
| | | | | United Kingdom - 6.2% | | | | |
| | 5,064,313 | | | Assura PLC | | | 5,502,822 | |
| | 2,165,857 | | | Cushman & Wakefield PLC(a) | | | 39,288,647 | |
| | 4,867,684 | | | Empiric Student Property PLC(a) | | | 6,485,281 | |
| | 411,379 | | | Great Portland Estates PLC | | | 4,425,064 | |
| | | | | | | | 55,701,814 | |
| | | | | United States - 49.6% | | | | |
| | 979,675 | | | Acadia Realty Trust | | | 20,788,704 | |
| | 5,675 | | | American Tower Corporation | | | 1,658,065 | |
| | 49,001 | | | Americold Realty Trust | | | 1,800,297 | |
| | 1,192,505 | | | CatchMark Timber Trust, Inc. | | | 13,761,508 | |
| | 534,310 | | | CoreCivic, Inc. | | | 5,193,493 | |
| | 225,376 | | | Corporate Office Properties Trust | | | 6,351,096 | |
| | 5,496,432 | | | DigitalBridge Group, Inc.(a) | | | 37,925,380 | |
| | 680,978 | | | Easterly Government Properties, Inc. | | | 14,552,500 | |
| | 987,419 | | | Ellington Financial, Inc. | | | 18,287,000 | |
| | 943,652 | | | GEO Group, Inc. | | | 7,313,303 | |
| | 1,000,500 | | | Independence Realty Trust, Inc. | | | 20,490,240 | |
| | 999,914 | | | Kennedy-Wilson Holdings, Inc. | | | 21,988,109 | |
| | 426,803 | | | Kilroy Realty Corporation | | | 28,019,617 | |
| | 297,277 | | | Marriott International, Inc. (a) | | | 40,174,014 | |
| | 297,151 | | | National Retail Properties, Inc. | | | 14,147,359 | |
| | 29,379 | | | National Storage Affiliates Trust | | | 1,681,948 | |
| | 348,824 | | | New Senior Investment Group, Inc. | | | 3,045,234 | |
| | 1,161,533 | | | Retail Opportunity Investments Corporation | | | 21,000,517 | |
| | 504,346 | | | Ventas, Inc. | | | 28,213,115 | |
| | 980,339 | | | VICI Properties, Inc. | | | 30,302,278 | |
| | 95,396 | | | Welltower, Inc. | | | 8,350,012 | |
| | 1,661,635 | | | Weyerhaeuser Company | | | 59,818,859 | |
| | 547,576 | | | WP Carey, Inc. | | | 42,776,636 | |
| | | | | | | | 447,639,284 | |
See accompanying notes to financial statements.
| EASTERLY GLOBAL REAL ESTATE FUND |
| SCHEDULE OF INVESTMENTS (Continued) |
| August 31, 2021 |
| | | | Fair Value | |
| | | | | |
| | TOTAL COMMON STOCKS (Cost $1,015,324,959) | | $ | 890,951,155 | |
| | | | | | |
| | TOTAL INVESTMENTS - 98.5% (Cost $1,015,324,959) | | $ | 890,951,155 | |
| | OTHER ASSETS IN EXCESS OF LIABILITIES- 1.5% | | | 13,815,732 | |
| | NET ASSETS - 100.0% | | $ | 904,766,887 | |
| | | | | | |
| ADR | - American Depositary Receipt |
| PLC | - Public Limited Company |
| REIT | - Real Estate Investment Trust |
| (a) | Non-income producing security. |
See accompanying notes to financial statements.
| EASTERLY GLOBAL REAL ESTATE INVESTMENTS FUND |
| SCHEDULE OF INVESTMENTS (Continued) |
| August 31, 2021 |
Forward Currency Contracts
| Settlement | | Units to | | | | | | | | | | | | US Dollar | | | | | Unrealized | |
| Date | | Receive/Deliver | | | | | Counterparty | | In Exchange For | | | | | Value | | | | | Appreciation/(Depreciation) | |
| To Buy: | | | | | | | | | | | | | | | | | | | | | | | | |
| 9/1/2021 | | $ | 344,640 | | | HKD | | Brown Brothers Harriman | | $ | 44,258 | | | USD | | $ | 44,313 | | | | | $ | 55 | |
| 9/1/2021 | | | 182,482 | | | SGD | | Brown Brothers Harriman | | | 135,698 | | | USD | | | 135,665 | | | | | | (33 | ) |
| 9/2/2021 | | | 12,792,472 | | | HKD | | Brown Brothers Harriman | | | 1,644,672 | | | USD | | | 1,644,837 | | | | | | 165 | |
| 9/2/2021 | | | 914,426,730 | | | JPY | | Brown Brothers Harriman | | | 8,314,104 | | | USD | | | 8,323,564 | | | | | | 9,460 | |
| 9/2/2021 | | | 1,505,313 | | | SGD | | Brown Brothers Harriman | | | 1,119,325 | | | USD | | | 1,119,109 | | | | | | (216 | ) |
| | | | | | | | | | | | | | | | | | | | | Total Unrealized: | | $ | 9,431 | |
| | | | | | | | | | | | | | | | | | | | | | | | | |
| To Sell: | | | | | | | | | | �� | | | | | | | | | | | | | | |
| 9/2/2021 | | $ | (198,247 | ) | | CAD | | Brown Brothers Harriman | | $ | (157,117 | ) | | USD | | $ | (156,885 | ) | | | | $ | 232 | |
| | | | | | | | | | | | | | | | | | | | | Total Unrealized: | | $ | 232 | |
Currency Abbreviations:
| EASTERLY MULTI STRATEGY ALTERNATIVE INCOME FUND |
| SCHEDULE OF INVESTMENTS |
| August 31, 2021 |
| Shares | | | | | Fair Value | |
| | | | | CLOSED END FUNDS — 21.5% | | | | |
| | | | | FIXED INCOME - 21.5% | | | | |
| | 6,500 | | | Apollo Tactical Income Fund, Inc. | | $ | 103,220 | |
| | 8,000 | | | BlackRock Core Bond Trust | | | 130,560 | |
| | 10,000 | | | BlackRock Corporate High Yield Fund, Inc. | | | 126,000 | |
| | 10,482 | | | BlackRock Credit Allocation Income Trust | | | 160,689 | |
| | 10,000 | | | BlackRock Limited Duration Income Trust | | | 173,600 | |
| | 8,000 | | | Blackstone / GSO Strategic Credit Fund | | | 110,880 | |
| | 2,000 | | | DoubleLine Income Solutions Fund | | | 35,800 | |
| | 10,000 | | | Eaton Vance Ltd. Duration Income Fund | | | 133,300 | |
| | 10,000 | | | First Trust High Income Long/Short Fund | | | 159,900 | |
| | 12,000 | | | Franklin Ltd. Duration Income Trust | | | 111,960 | |
| | 10,800 | | | Invesco Dynamic Credit Opportunities Fund | | | 126,360 | |
| | 40,000 | | | Invesco Senior Income Trust | | | 175,200 | |
| | 7,000 | | | John Hancock Preferred Income Fund III | | | 136,430 | |
| | 25,000 | | | Nuveen Credit Strategies Income Fund | | | 162,500 | |
| | 7,000 | | | Nuveen Global High Income Fund | | | 113,540 | |
| | 7,000 | | | Nuveen Preferred & Income Term Fund | | | 178,220 | |
| | 10,000 | | | PGIM Global High Yield Fund, Inc. | | | 157,100 | |
| | 10,000 | | | PGIM High Yield Bond Fund, Inc. | | | 163,000 | |
| | 17,000 | | | PIMCO Income Strategy Fund II | | | 193,460 | |
| | 20,000 | | | Wells Fargo Income Opportunities Fund | | | 181,800 | |
| | 15,000 | | | Western Asset High Income Opportunity Fund, Inc. | | | 78,750 | |
| | | | | | | | 2,912,269 | |
| | | | | | | | | |
| | | | | TOTAL CLOSED END FUNDS (Cost $2,552,761) | | | 2,912,269 | |
| | | | | | | | | |
| | | | | COMMON STOCKS — 80.9% | | | | |
| | | | | APPAREL & TEXTILE PRODUCTS - 0.5% | | | | |
| | 1,263 | | | Canada Goose Holdings, Inc.(a),(b) | | | 48,462 | |
| | 219 | | | Carter's, Inc.(a) | | | 22,421 | |
| | | | | | | | 70,883 | |
| | | | | ASSET MANAGEMENT - 1.8% | | | | |
| | 979 | | | Hamilton Lane, Inc. (a) | | | 84,263 | |
| | 2,819 | | | Kennedy-Wilson Holdings, Inc. | | | 61,990 | |
| EASTERLY MULTI STRATEGY ALTERNATIVE INCOME FUND |
| SCHEDULE OF INVESTMENTS (Continued) |
| August 31, 2021 |
| Shares | | | | | Fair Value | |
| | | | | COMMON STOCKS — 80.9% (Continued) | | | | |
| | | | | ASSET MANAGEMENT - 1.8% (Continued) | | | | |
| | 574 | | | LPL Financial Holdings, Inc.(a) | | $ | 84,865 | |
| | | | | | | | 231,118 | |
| | | | | BANKING - 3.2% | | | | |
| | 400 | | | Atlantic Capital Bancshares, Inc.(b) | | | 9,692 | |
| | 4,100 | | | Cadence BanCorporation(a) | | | 88,191 | |
| | 4,400 | | | CIT Group, Inc.(a) | | | 243,849 | |
| | 1,112 | | | Eagle Bancorp Montana, Inc.(a) | | | 24,620 | |
| | 2,700 | | | Sterling Bancorp(a) | | | 61,803 | |
| | | | | | | | 428,155 | |
| | | | | BEVERAGES - 0.2% | | | | |
| | 1,808 | | | Primo Water Corporation(a) | | | 32,110 | |
| | | | | | | | | |
| | | | | BIOTECH & PHARMA - 0.7% | | | | |
| | 714 | | | AbCellera Biologics, Inc.(a),(b) | | | 11,981 | |
| | 900 | | | Translate Bio, Inc.(a),(b) | | | 33,660 | |
| | 1,302 | | | TransMedics Group, Inc.(a),(b) | | | 42,550 | |
| | | | | | | | 88,191 | |
| | | | | CHEMICALS - 1.0% | | | | |
| | 300 | | | Lydall, Inc.(b) | | | 18,594 | |
| | 1,600 | | | W R Grace & Company(a) | | | 111,424 | |
| | | | | | | | 130,018 | |
| | | | | COMMERCIAL SUPPORT SERVICES - 1.1% | | | | |
| | 127 | | | Avalara, Inc.(a),(b) | | | 22,822 | |
| | 983 | | | Clean Harbors, Inc.(a),(b) | | | 100,875 | |
| | 1,100 | | | Covanta Holding Corporation | | | 22,055 | |
| | | | | | | | 145,752 | |
| | | | | CONSTRUCTION MATERIALS - 0.0%(c) | | | | |
| | 100 | | | Forterra, Inc.(b) | | | 2,304 | |
| | | | | | | | | |
| | | | | E-COMMERCE DISCRETIONARY - 0.9% | | | | |
| | 1,892 | | | Leslie's, Inc.(a),(b) | | | 45,635 | |
| | 605 | | | MYT Netherlands Parent BV - ADR(b) | | | 17,327 | |
| | 1,087 | | | Revolve Group, Inc.(a),(b) | | | 62,459 | |
| | | | | | | | 125,421 | |
| EASTERLY MULTI STRATEGY ALTERNATIVE INCOME FUND |
| SCHEDULE OF INVESTMENTS (Continued) |
| August 31, 2021 |
| Shares | | | | | Fair Value | |
| | | | | COMMON STOCKS — 80.9% (Continued) | | | | |
| | | | | ELECTRIC UTILITIES - 0.5% | | | | |
| | 1,251 | | | Portland General Electric Company(a) | | $ | 64,239 | |
| | | | | | | | | |
| | | | | ELECTRICAL EQUIPMENT - 0.3% | | | | |
| | 673 | | | BWX Technologies, Inc.(a) | | | 38,650 | |
| | | | | | | | | |
| | | | | ENGINEERING & CONSTRUCTION - 0.2% | | | | |
| | 2,609 | | | Infrastrutture Wireless Italiane SpA | | | 31,014 | |
| | | | | | | | | |
| | | | | ENTERTAINMENT CONTENT - 0.2% | | | | |
| | 1,800 | | | Sciplay Corporation(b) | | | 33,678 | |
| | | | | | | | | |
| | | | | FORESTRY, PAPER & WOOD PRODUCTS - 1.1% | | | | |
| | 2,800 | | | Domtar Corporation(a) | | | 153,524 | |
| | | | | | | | | |
| | | | | HEALTH CARE FACILITIES & SERVICES - 3.4% | | | | |
| | 532 | | | Accolade, Inc.(a),(b) | | | 25,206 | |
| | 1,018 | | | Invitae Corporation(a),(b) | | | 30,163 | |
| | 2,200 | | | Magellan Health, Inc.(a),(b) | | | 208,165 | |
| | 2,057 | | | NeoGenomics, Inc.(a),(b) | | | 100,011 | |
| | 1,000 | | | PPD, Inc.(a),(b) | | | 46,310 | |
| | 861 | | | Progyny, Inc.(a),(b) | | | 48,104 | |
| | | | | | | | 457,959 | |
| | | | | HOME CONSTRUCTION - 0.4% | | | | |
| | 38,237 | | | Glenveagh Properties PLC(b) | | | 48,928 | |
| | | | | | | | | |
| | | | | INDUSTRIAL SUPPORT SERVICES - 0.3% | | | | |
| | 696 | | | Ritchie Bros Auctioneers, Inc.(a) | | | 43,563 | |
| | | | | | | | | |
| | | | | INSURANCE - 2.5% | | | | |
| | 300 | | | Athene Holding Ltd.(b) | | | 20,091 | |
| | 1,500 | | | Willis Towers Watson PLC(a) | | | 331,080 | |
| | | | | | | | 351,171 | |
| | | | | INTERNET MEDIA & SERVICES - 0.6% | | | | |
| | 182 | | | Fiverr International Ltd.(a),(b) | | | 32,671 | |
| EASTERLY MULTI STRATEGY ALTERNATIVE INCOME FUND |
| SCHEDULE OF INVESTMENTS (Continued) |
| August 31, 2021 |
| Shares | | | | | Fair Value | |
| | | | | COMMON STOCKS — 80.9% (Continued) | | | | |
| | | | | INTERNET MEDIA & SERVICES - 0.6% (Continued) | | | | |
| | 352 | | | Marqeta, Inc.(b) | | $ | 10,222 | |
| | 391 | | | MediaAlpha, Inc.(a),(b) | | | 8,672 | |
| | 2,900 | | | Sogou, Inc. - ADR(a),(b) | | | 25,607 | |
| | | | | | | | 77,172 | |
| | | | | LEISURE FACILITIES & SERVICES - 4.6% | | | | |
| | 2,490 | | | Accor S.A.(b) | | | 85,711 | |
| | 900 | | | Cineplex, Inc. | | | 9,359 | |
| | 1,620 | | | GAN Ltd.(a),(b) | | | 27,702 | |
| | 2,000 | | | Great Canadian Gaming Corporation(b) | | | 69,880 | |
| | 300 | | | Great Canadian Gaming Corporation(b) | | | 10,458 | |
| | 1,248 | | | Marriott International, Inc. | | | 168,654 | |
| | 2,471 | | | Norwegian Cruise Line Holdings Ltd.(a),(b) | | | 63,851 | |
| | 989 | | | Red Rock Resorts, Inc.(a) | | | 46,295 | |
| | 648 | | | Shake Shack, Inc.(a),(b) | | | 56,214 | |
| | 460 | | | Wingstop, Inc.(a) | | | 79,088 | |
| | | | | | | | 617,212 | |
| | | | | MACHINERY - 0.3% | | | | |
| | 113 | | | Hydrofarm Holdings Group, Inc.(a),(b) | | | 5,713 | |
| | 586 | | | Tennant Company(a) | | | 43,353 | |
| | | | | | | | 49,066 | |
| | | | | MEDICAL EQUIPMENT & DEVICES - 1.1% | | | | |
| | 873 | | | Acutus Medical, Inc.(a),(b) | | | 11,166 | |
| | 409 | | | Axonics, Inc.(a),(b) | | | 30,667 | |
| | 210 | | | CareDx, Inc.(a),(b) | | | 15,389 | |
| | 137 | | | Inspire Medical Systems, Inc.(a),(b) | | | 30,628 | |
| | 1,079 | | | Silk Road Medical, Inc.(a),(b) | | | 63,962 | |
| | | | | | | | 151,812 | |
| | | | | REAL ESTATE OWNERS & DEVELOPERS - 4.4% | | | | |
| | 18,354 | | | CK Asset Holdings Ltd. | | | 119,648 | |
| | 2,502 | | | COIMA RES SpA | | | 20,350 | |
| | 600 | | | Deutsche Wohnen S.E. | | | 37,227 | |
| | 14,872 | | | Empiric Student Property PLC | | | 19,792 | |
| | 35,285 | | | Hongkong Land Holdings Ltd. | | | 148,197 | |
| EASTERLY MULTI STRATEGY ALTERNATIVE INCOME FUND |
| SCHEDULE OF INVESTMENTS (Continued) |
| August 31, 2021 |
| Shares | | | | | Fair Value | |
| | | | | COMMON STOCKS — 80.9% (Continued) | | | | |
| | | | | REAL ESTATE OWNERS & DEVELOPERS - 4.4% (Continued) | | | | |
| | 15,849 | | | Mitsubishi Estate Company Ltd. | | $ | 248,281 | |
| | | | | | | | 593,495 | |
| | | | | REAL ESTATE SERVICES - 1.5% | | | | |
| | 8,342 | | | Cushman & Wakefield PLC(b) | | | 151,324 | |
| | 18,544 | | | ESR Cayman Ltd.(b) | | | 56,509 | |
| | | | | | | | 207,833 | |
| | | | | REITS - 18.7% | | | | |
| | 2,650 | | | Acadia Realty Trust | | | 56,233 | |
| | 62 | | | American Tower Corporation | | | 18,115 | |
| | 900 | | | Americold Realty Trust(a) | | | 33,066 | |
| | 28,684 | | | Assura PLC | | | 31,147 | |
| | 4,633 | | | CatchMark Timber Trust, Inc. | | | 53,465 | |
| | 2,340 | | | CoreCivic, Inc. | | | 22,745 | |
| | 687 | | | Corporate Office Properties Trust | | | 19,360 | |
| | 497 | | | CyrusOne, Inc.(a) | | | 38,259 | |
| | 15 | | | Daiwa House REIT Investment Corporation | | | 44,443 | |
| | 19,443 | | | DigitalBridge Group, Inc.(b) | | | 134,157 | |
| | 3,083 | | | Easterly Government Properties, Inc. | | | 65,884 | |
| | 2,365 | | | GEO Group, Inc. | | | 18,329 | |
| | 3,780 | | | Global Medical REIT, Inc.(a) | | | 58,288 | |
| | 804 | | | Great Portland Estates PLC | | | 8,636 | |
| | 3,840 | | | Independence Realty Trust, Inc. | | | 78,643 | |
| | 166 | | | Japan Hotel REIT Investment Corporation | | | 98,216 | |
| | 21,843 | | | Keppel DC REIT | | | 40,597 | |
| | 1,634 | | | Kilroy Realty Corporation | | | 107,272 | |
| | 1,332 | | | Klepierre S.A. | | | 32,548 | |
| | 14,813 | | | Link REIT | | | 136,277 | |
| | 9,673 | | | Mapletree Commercial Trust | | | 14,598 | |
| | 1,076 | | | National Retail Properties, Inc. | | | 51,228 | |
| | 133 | | | National Storage Affiliates Trust | | | 7,614 | |
| | 1,018 | | | New Senior Investment Group, Inc. | | | 8,887 | |
| | 3,093 | | | NorthWest Healthcare Properties Real Estate Investment Trust | | | 32,432 | |
| | 3,999 | | | QTS Realty Trust, Inc.(a) | | | 311,841 | |
| | 4,451 | | | Retail Opportunity Investments Corporation | | | 80,474 | |
| EASTERLY MULTI STRATEGY ALTERNATIVE INCOME FUND |
| SCHEDULE OF INVESTMENTS (Continued) |
| August 31, 2021 |
| Shares | | | | | Fair Value | |
| | | | | COMMON STOCKS — 80.9% (Continued) | | | | |
| | | | | REITS - 18.7% (Continued) | | | | |
| | 1,942 | | | Ventas, Inc. | | $ | 108,635 | |
| | 5,700 | | | VEREIT, Inc.(a) | | | 288,021 | |
| | 3,738 | | | VICI Properties, Inc. | | | 115,542 | |
| | 369 | | | Welltower, Inc. | | | 32,299 | |
| | 6,376 | | | Weyerhaeuser Company | | | 229,536 | |
| | 1,942 | | | WP Carey, Inc. | | | 151,709 | |
| | | | | | | | 2,528,496 | |
| | | | | RETAIL - CONSUMER STAPLES - 2.3% | | | | |
| | 264 | | | Five Below, Inc.(a),(b) | | | 56,182 | |
| | 1,261 | | | Ollie's Bargain Outlet Holdings, Inc.(a),(b) | | | 91,271 | |
| | 2,480 | | | OptimizeRx Corporation(a),(b) | | | 164,127 | |
| | | | | | | | 311,580 | |
| | | | | RETAIL - DISCRETIONARY - 0.2% | | | | |
| | 499 | | | Designer Brands, Inc.(a) | | | 7,236 | |
| | 458 | | | Driven Brands Holdings, Inc.(b) | | | 13,685 | |
| | | | | | | | 20,921 | |
| | | | | SEMICONDUCTORS – 4.2% | | | | |
| | 1,449 | | | Analog Devices, Inc. | | | 236,115 | |
| | 200 | | | Coherent, Inc.(a),(b) | | | 50,534 | |
| | 1,800 | | | Xilinx, Inc.(a) | | | 280,062 | |
| | | | | | | | 566,711 | |
| | | | | SOFTWARE - 13.1% | | | | |
| | 1,010 | | | 1Life Healthcare, Inc.(a),(b) | | | 24,755 | |
| | 140 | | | Alkami Technology, Inc.(b) | | | 3,998 | |
| | 380 | | | Alteryx, Inc.(a),(b) | | | 28,109 | |
| | 216 | | | Bandwidth, Inc.(a),(b) | | | 22,226 | |
| | 463 | | | BigCommerce Holdings, Inc.(a),(b) | | | 27,567 | |
| | 439 | | | Bill.com Holdings, Inc.(a),(b) | | | 120,456 | |
| | 481 | | | Black Knight, Inc.(a),(b) | | | 36,397 | |
| | 913 | | | Blackline, Inc.(a),(b) | | | 99,608 | |
| | 155 | | | C3.ai, Inc.(a),(b) | | | 7,989 | |
| | 4,467 | | | Cantaloupe, Inc.(a),(b) | | | 45,742 | |
| | 700 | | | Change Healthcare, Inc.(b) | | | 15,281 | |
| | 2,500 | | | Cloudera, Inc.(a),(b) | | | 39,825 | |
| EASTERLY MULTI STRATEGY ALTERNATIVE INCOME FUND |
| SCHEDULE OF INVESTMENTS (Continued) |
| August 31, 2021 |
| Shares | | | | | Fair Value | |
| | | | | COMMON STOCKS — 80.9% (Continued) | | | | |
| | | | | SOFTWARE - 13.1% (Continued) | | | | |
| | 800 | | | Cornerstone OnDemand, Inc.(a),(b) | | $ | 45,840 | |
| | 1,129 | | | Domo, Inc.(a),(b) | | | 101,046 | |
| | 1,105 | | | Duck Creek Technologies, Inc.(a),(b) | | | 51,526 | |
| | 1,471 | | | Dynatrace, Inc.(a),(b) | | | 101,102 | |
| | 1,511 | | | eGain Corporation(a),(b) | | | 17,800 | |
| | 475 | | | Guidewire Software, Inc.(a),(b) | | | 56,268 | |
| | 635 | | | Health Catalyst, Inc.(a),(b) | | | 34,677 | |
| | 1,972 | | | Jamf Holding Corporation(a),(b) | | | 69,316 | |
| | 589 | | | JFrog Ltd.(a),(b) | | | 22,641 | |
| | 200 | | | Medallia, Inc.(b) | | | 6,754 | |
| | 1,324 | | | N-Able, Inc.(a),(b) | | | 17,914 | |
| | 518 | | | nCino, Inc.(a),(b) | | | 32,121 | |
| | 4,500 | | | Nuance Communications, Inc.(a),(b) | | | 247,724 | |
| | 913 | | | Nutanix, Inc.(a),(b) | | | 33,699 | |
| | 642 | | | Oak Street Health, Inc.(a),(b) | | | 30,001 | |
| | 133 | | | ON24, Inc.(b) | | | 3,007 | |
| | 54 | | | Paycor HCM, Inc.(b) | | | 1,995 | |
| | 263 | | | Paylocity Holding Corporation(a),(b) | | | 70,800 | |
| | 49 | | | Paymentus Holdings, Inc.(b) | | | 1,257 | |
| | 801 | | | Phreesia, Inc.(a),(b) | | | 57,312 | |
| | 886 | | | Ping Identity Holding Corporation(a),(b) | | | 22,992 | |
| | 112 | | | Privia Health Group, Inc.(b) | | | 3,339 | |
| | 50 | | | Procore Technologies, Inc.(b) | | | 4,535 | |
| | 1,231 | | | PROS Holdings, Inc.(a),(b) | | | 53,228 | |
| | 842 | | | Sailpoint Technologies Holdings, Inc.(a),(b) | | | 39,456 | |
| | 198 | | | Signify Health, Inc.(a),(b) | | | 5,146 | |
| | 1,132 | | | SolarWinds Corporation(a) | | | 19,323 | |
| | 194 | | | Sprinklr, Inc.(b) | | | 3,042 | |
| | 445 | | | Sprout Social, Inc.(a),(b) | | | 54,112 | |
| | 1,446 | | | Tenable Holdings, Inc.(a),(b) | | | 64,159 | |
| | 425 | | | Vertex, Inc.(a),(b) | | | 8,797 | |
| | 1,990 | | | Zeta Global Holdings Corporation(b) | | | 13,472 | |
| | | | | | | | 1,766,354 | |
| EASTERLY MULTI STRATEGY ALTERNATIVE INCOME FUND |
| SCHEDULE OF INVESTMENTS (Continued) |
| August 31, 2021 |
| Shares | | | | | Fair Value | |
| | | | | COMMON STOCKS — 80.9% (Continued) | | | | |
| | | | | SPECIALTY FINANCE - 0.6% | | | | |
| | 3,521 | | | Ellington Financial, Inc. | | $ | 65,208 | |
| | 48 | | | Flywire Corporation(b) | | | 2,108 | |
| | 844 | | | International Money Express, Inc.(b) | | | 15,395 | |
| | | | | | | | 82,711 | |
| | | | | TECHNOLOGY HARDWARE - 0.2% | | | | |
| | 845 | | | Pure Storage, Inc.(a),(b) | | | 21,826 | |
| | | | | | | | | |
| | | | | TECHNOLOGY SERVICES - 4.4% | | | | |
| | 52 | | | Dlocal Ltd.(b) | | | 3,328 | |
| | 4,200 | | | IHS Markit Ltd.(a) | | | 506,520 | |
| | 939 | | | Paya Holdings, Inc.(a),(b) | | | 9,061 | |
| | 641 | | | Repay Holdings Corporation(a),(b) | | | 14,749 | |
| | 525 | | | Shift4 Payments, Inc.(a),(b) | | | 44,998 | |
| | 601 | | | Telos Corporation(a),(b) | | | 19,833 | |
| | 91 | | | WEX, Inc.(a),(b) | | | 16,705 | |
| | | | | | | | 615,194 | |
| | | | | TELECOMMUNICATIONS - 3.6% | | | | |
| | 4,777 | | | GDS Holdings Ltd. - ADR(b) | | | 279,359 | |
| | 5,067 | | | NEXTDC Ltd.(b) | | | 49,031 | |
| | 8,700 | | | ORBCOMM, Inc.(a),(b) | | | 99,963 | |
| | 4,213 | | | Vonage Holdings Corporation(a),(b) | | | 59,403 | |
| | | | | | | | 487,756 | |
| | | | | TRANSPORTATION & LOGISTICS - 2.5% | | | | |
| | 3,360 | | | AFC Gamma, Inc. | | | 71,602 | |
| | 1,585 | | | CryoPort, Inc.(a),(b) | | | 100,758 | |
| | 400 | | | Kansas City Southern(a) | | | 112,268 | |
| | 987 | | | Knight-Swift Transportation Holdings, Inc.(a) | | | 51,255 | |
| | | | | | | | 335,883 | |
| | | | | WHOLESALE - DISCRETIONARY - 0.3% | | | | |
| | 854 | | | IAA, Inc.(a),(b) | | | 45,364 | |
| | | | | | | | | |
| | | | | TOTAL COMMON STOCKS (Cost $9,831,929) | | | 10,956,064 | |
| EASTERLY MULTI STRATEGY ALTERNATIVE INCOME FUND |
| SCHEDULE OF INVESTMENTS (Continued) |
| August 31, 2021 |
| Shares | | | | | Fair Value | |
| | | | | EXCHANGE-TRADED FUNDS — 4.2% | | | | |
| | | | | EQUITY - 0.0%(c) | | | | |
| | 1 | | | ProShares UltraPro Short S&P 500(b) | | $ | 15 | |
| | 1 | | | ProShares UltraShort Russell2000(b) | | | 14 | |
| | | | | | | | 29 | |
| | | | | FIXED INCOME - 4.2% | | | | |
| | 7,000 | | | Invesco Senior Loan ETF | | | 154,980 | |
| | 6,500 | | | iShares 0-5 Year High Yield Corporate Bond ETF | | | 298,285 | |
| | 3,000 | | | iShares Preferred & Income Securities ETF | | | 118,200 | |
| | 1 | | | ProShares UltraShort 20+ Year Treasury | | | 17 | |
| | | | | | | | 571,482 | |
| | | | | | | | | |
| | | | | TOTAL EXCHANGE-TRADED FUNDS (Cost $571,975) | | | 571,511 | |
| | | | | | | | | |
| | | | | TOTAL INVESTMENTS – 106.6% (Cost $12,956,665) | | $ | 14,439,844 | |
| | | | | LIABILITIES IN EXCESS OF OTHER ASSETS - (6.6)% | | | (888,388 | ) |
| | | | | NET ASSETS - 100.0% | | $ | 13,551,456 | |
| EASTERLY MULTI STRATEGY ALTERNATIVE INCOME FUND |
| SCHEDULE OF SECURITIES SOLD SHORT |
| August 31, 2021 |
| Shares | | | | | Fair Value | |
| | | | | COMMON STOCKS — (17.2)% | | | | |
| | | | | ASSET MANAGEMENT - (0.2)% | | | | |
| | (345 | ) | | Apollo Global Management, Inc. | | $ | (20,624 | ) |
| | | | | | | | | |
| | | | | BANKING - (3.0)% | | | | |
| | (2,870 | ) | | BancorpSouth Bank | | | (84,177 | ) |
| | (271 | ) | | First Citizens BancShares, Inc. | | | (243,277 | ) |
| | (4 | ) | | Huntington Bancshares, Inc. | | | (62 | ) |
| | (1 | ) | | Prosperity Bancshares, Inc. | | | (70 | ) |
| | (144 | ) | | SouthState Corporation | | | (9,875 | ) |
| | (1,251 | ) | | Webster Financial Corporation | | | (63,200 | ) |
| | | | | | | | (400,661 | ) |
| | | | | BIOTECH & PHARMA - (0.3)% | | | | |
| | (572 | ) | | Atara Biotherapeutics, Inc. | | | (8,569 | ) |
| | (237 | ) | | Ionis Pharmaceuticals, Inc. | | | (9,423 | ) |
| | (1,597 | ) | | Sinovac Biotech Ltd. (d) | | | (10,333 | ) |
| | | | | | | | (28,325 | ) |
| | | | | INSURANCE - (3.1)% | | | | |
| | (1,512 | ) | | Aon PLC | | | (433,732 | ) |
| | | | | | | | | |
| | | | | LEISURE FACILITIES & SERVICES - (0.2)% | | | | |
| | (450 | ) | | Scientific Games Corporation | | | (32,557 | ) |
| | | | | | | | | |
| | | | | MACHINERY - 0.0% (a) | | | | |
| | (77 | ) | | Astec Industries, Inc. | | | (4,708 | ) |
| | | | | | | | | |
| | | | | REITS - (2.1)% | | | | |
| | (4,021 | ) | | Realty Income Corporation | | | (290,397 | ) |
| | | | | | | | | |
| | | | | SEMICONDUCTORS - (4.4)% | | | | |
| | (3,096 | ) | | Advanced Micro Devices, Inc. | | | (342,789 | ) |
| | (1,449 | ) | | Analog Devices, Inc. | | | (236,115 | ) |
| | (182 | ) | | II-VI, Inc. | | | (11,462 | ) |
| | | | | | | | (590,366 | ) |
| EASTERLY MULTI STRATEGY ALTERNATIVE INCOME FUND |
| SCHEDULE OF SECURITIES SOLD SHORT (Continued) |
| August 31, 2021 |
| Shares | | | | | Fair Value | |
| | | | | COMMON STOCKS — (17.2)% (Continued) | | | | |
| | | | | TECHNOLOGY SERVICES — (3.8)% | | | | |
| | (1,190 | ) | | S&P Global, Inc. | | $ | (528,145 | ) |
| | | | | | | | | |
| | | | | TRANSPORTATION & LOGISTICS - (0.1)% | | | | |
| | (288 | ) | | Canadian Pacific Railway Ltd. | | | (19,812 | ) |
| | | | | | | | | |
| | | | | EXCHANGE TRADED FUNDS - (13.0)% | | | | |
| | | | | EQUITY - (13.0)% | | | | |
| | (1,602 | ) | | iShares Russell 2000 ETF | | $ | (361,924 | ) |
| | (4,570 | ) | | iShares Russell 2000 Growth ETF | | | (1,396,637 | ) |
| | | | | | | | (1,758,561 | ) |
| | | | | | | | | |
| | | | | TOTAL SECURITIES SOLD SHORT - (Proceeds - $3,005,801) | | $ | (4,107,888 | ) |
| ADR | - American Depositary Receipt |
| ETF | - Exchange-Traded Fund |
| PLC | - Public Limited Company |
| REIT | - Real Estate Investment Trust |
| (a) | All or a portion of this security is held as collateral for securities sold short. |
| (b) | Non-income producing security. |
| (c) | Percentage rounds to less than 0.1%. |
| (d) | The value of this security has been determined in good faith under policies of the Board of Trustees. |
| EASTERLY MULTI STRATEGY ALTERNATIVE INCOME FUND |
| SCHEDULE OF INVESTMENTS (Continued) |
| August 31, 2021 |
Forward Currency Contracts
| Settlement | | Units to | | | | | | | | | | | | US Dollar | | | | | Unrealized | |
| Date | | Receive/Deliver | | | | | Counterparty | | In Exchange For | | | | | Value | | | | | Appreciation/(Depreciation) | |
| To Buy: | | | | | | | | | | | | | | | | | | | | | | | | |
| 9/1/2021 | | $ | 1,317 | | | HKD | | Brown Brothers Harriman | | $ | 169 | | | USD | | $ | 169 | | | | | $ | — | |
| 9/1/2021 | | | 696 | | | SGD | | Brown Brothers Harriman | | | 517 | | | USD | | | 517 | | | | | | — | |
| 9/2/2021 | | | 48,933 | | | HKD | | Brown Brothers Harriman | | | 6,291 | | | USD | | | 6,292 | | | | | | 1 | |
| 9/2/2021 | | | 3,621,492 | | | JPY | | Brown Brothers Harriman | | | 32,931 | | | USD | | | 32,965 | | | | | | 34 | |
| 9/2/2021 | | | 5,757 | | | SGD | | Brown Brothers Harriman | | | 4,281 | | | USD | | | 4,280 | | | | | | (1 | ) |
| | | | | | | | | | | | | | | | | | | | | Total Unrealized: | | $ | 34 | |
| To Sell: | | | | | | | | | | | | | | | | | | | | | | | | |
| 9/2/2021 | | $ | (757 | ) | | CAD | | Brown Brothers Harriman | | $ | (600 | ) | | USD | | $ | (599 | ) | | | | $ | 1 | |
| | | | | | | | | | | | | | | | | | | | | Total Unrealized: | | $ | 1 | |
Currency Abbreviations:
See accompanying notes to financial statements.
| EASTERLY HEDGED EQUITY FUND |
| SCHEDULE OF INVESTMENTS |
| August 31, 2021 |
| Shares | | | | | | | | | | | | | | | Fair Value | |
| | | | | EXCHANGE-TRADED FUNDS — 91.0% | | | | | | | |
| | | | | EQUITY - 91.0% | | | | | | | | | | | | | | | | |
| | 109,000 | | | SPDR S&P 500 ETF Trust(a) | | | | | | | | | | | | | | $ | 49,220,040 | |
| | | | | | | | | | | | | | | | | | | | | |
| | | | | TOTAL EXCHANGE-TRADED FUNDS (Cost $37,723,431) | | | | | | 49,220,040 | |
| | | | | | | | | | | | | | | | | | | | | |
| | | | | | | | | | | | | | | | | | | | | |
| | Contracts(b) | | | | | Counterparty | | Expiration Date | | Exercise Price | | | Notional Value | | | | | |
| | | | | INDEX OPTIONS PURCHASED - 1.4% | | | | | | | | | | | | | | | | |
| | | | | CALL OPTIONS PURCHASED - 0.1% | | | | | | | | | | | | | | | | |
| | 100 | | | Chicago Board Options Exchange Volatility Index | | PER | | 09/15/2021 | | $ | 20 | | | $ | 164,800 | | | $ | 11,000 | |
| | 200 | | | Chicago Board Options Exchange Volatility Index | | PER | | 10/20/2021 | | | 20 | | | | 329,600 | | | | 66,000 | |
| | | | | TOTAL CALL OPTIONS PURCHASED (Cost - $97,145) | | | | | | 77,000 | |
| | | | | | | | | | | | | | | | | | | | | |
| | | | | PUT OPTIONS PURCHASED - 1.3% | | | | | | | | | | | | | | | | |
| | 135 | | | S&P 500 Index | | PER | | 10/01/2021 | | $ | 4,350 | | | $ | 61,056,180 | | | $ | 368,550 | |
| | 105 | | | S&P 500 Index | | PER | | 10/01/2021 | | | 4,410 | | | | 47,488,140 | | | | 362,250 | |
| | | | | TOTAL PUT OPTIONS PURCHASED (Cost - $1,428,800) | | | | | | 730,800 | |
| | | | | | | | | | | | | | | | | | | | | |
| | | | | TOTAL INDEX OPTIONS PURCHASED (Cost - $1,525,945) | | | | | | 807,800 | |
| | | | | | | | | | | | | | | | | | | | | |
| | | | | TOTAL INVESTMENTS - 92.4% (Cost $39,249,376) | | | | | $ | 50,027,840 | |
| | | | | PUT OPTIONS WRITTEN - (0.9)% (Proceeds - $656,485) | | | | | | (268,125 | ) |
| | | | | CALL OPTIONS WRITTEN - (0.4)% (Proceeds - $393,688) | | | | | | (491,838 | ) |
| | | | | OTHER ASSETS IN EXCESS OF LIABILITIES- 8.9% | | | | | | 4,824,628 | |
| | | | | NET ASSETS - 100.0% | | | | | $ | 54,092,505 | |
| | | | | | | | | | | | | | | | | | | | | |
| | | | | | | | | | | | | | | | | | | | | |
| | | | | | | Counterparty | | Expiration Date | | Exercise Price | | | Notional Value | | | | | |
| | | | | WRITTEN INDEX OPTIONS - (0.4)% | | | | | | | |
| | | | | PUT OPTIONS WRITTEN - (0.4)% | | | | | | | |
| | 50 | | | S&P 500 Index | | PER | | 09/17/2021 | | $ | 4,100 | | | $ | 22,613,400 | | | $ | 23,500 | |
| | 55 | | | S&P 500 Index | | PER | | 10/01/2021 | | | 4,100 | | | | 24,874,740 | | | | 67,100 | |
| | 135 | | | S&P 500 Index | | PER | | 10/01/2021 | | | 4,125 | | | | 61,056,180 | | | | 177,525 | |
| | | | | TOTAL PUT OPTIONS WRITTEN (Proceeds - $656,485) | | | | | | 268,125 | |
| | | | | | | | | | | | | | | | | | | | | |
| | | | | TOTAL INDEX OPTIONS WRITTEN (Proceeds - $656,485) | | | | | $ | 268,125 | |
| | | | | | | | | | | | | | | | | | | | | |
| | | | | | | | | | | | | | | | | | | | | |
| | | | | | | Counterparty | | Expiration Date | | Exercise Price | | | Notional Value | | | | | |
| | | | | WRITTEN EQUITY OPTIONS - (0.9)% | | | | | | | |
| | | | | CALL OPTIONS WRITTEN- (0.9)% | | | | | | | |
| | 250 | | | SPDR S&P 500 ETF Trust | | PER | | 09/07/2021 | | $ | 445 | | | $ | 11,289,000 | | | $ | 195,750 | |
See accompanying notes to financial statements.
| EASTERLY HEDGED EQUITY FUND |
| SCHEDULE OF INVESTMENTS (Continued) |
| August 31, 2021 |
| Contracts(b) | | | | | Counterparty | | Expiration Date | | Exercise Price | | | Notional Value | | | Fair Value | |
| | | | | WRITTEN EQUITY OPTIONS - (0.9)% | | | | | | | | | | | | | | | | |
| | | | | CALL OPTIONS WRITTEN- (0.9)% (Continued) | | | | | | | | | | | | | | | | |
| | 475 | | | SPDR S&P 500 ETF Trust | | PER | | 09/07/2021 | | $ | 450 | | | $ | 21,449,100 | | | $ | 166,963 | |
| | 250 | | | SPDR S&P 500 ETF Trust | | PER | | 09/17/2021 | | | 450 | | | | 11,289,000 | | | | 129,125 | |
| | | | | TOTAL CALL OPTIONS WRITTEN (Proceeds - $393,688) | | | | | | 491,838 | |
| | | | | | | | | | | | | | | | | | | | | |
| | | | | TOTAL EQUITY OPTIONS WRITTEN (Proceeds - $393,688) | | | | | $ | 491,838 | |
| | | | | | | | | | | | | | | | | | | | | |
| ETF | - Exchange-Traded Fund |
| SPDR | - Standard & Poor's Depositary Receipt |
| (a) | All or a portion of this security is held as collateral for written options. |
| (b) | Each option contract allows the holder of the option to purchase or sell 100 shares of the underlying security. |
See accompanying notes to financial statements.
| EASTERLY HEDGED EQUITY FUND |
| SCHEDULE OF INVESTMENTS (Continued) |
| August 31, 2021 |
| | | | TOTAL RETURN SWAPS - 1.1 % | | | | | | | | | | | | | | | |
| Notional | | | | | | | | | | Expiration | | Pay/Receive | | Variable | | | Unrealized | |
| Amount | | | Reference Entity | | Shares | | | Counterparty | | Date | | Fixed Rate | | Rate (%) | | | Gain/(Loss) | |
| $ | 2,192,550 | | | SPY SPDR SP 500 ETF Trust | | | 5,000 | | | Goldman Sachs | | 6/29/2022 | | Pay | | | 0.0905 | * | | $ | — | |
| | 6,577,650 | | | SPY SPDR SP 500 ETF Trust | | | 15,000 | | | Goldman Sachs | | 9/21/2021 | | Pay | | | 0.0905 | # | | | — | |
| | 3,069,570 | | | SPY SPDR SP 500 ETF Trust | | | 7,000 | | | Goldman Sachs | | 11/12/2021 | | Pay | | | 0.0905 | * | | | — | |
| | 8,770,200 | | | SPY SPDR SP 500 ETF Trust | | | 20,000 | | | Goldman Sachs | | 12/1/2021 | | Pay | | | 0.0905 | * | | | — | |
| | | | | | | | | | | | | | | | | | | | | $ | — | |
| # | Variable rate is Libor plus 0.50% |
| * | Variable rate is Libor plus 0.40% |
See accompanying notes to financial statements.
| EASTERLY HEDGED HIGH INCOME FUND |
| SCHEDULE OF INVESTMENTS |
| August 31, 2021 |
| Shares | | | | | Fair Value | |
| | | | | CLOSED END FUNDS — 18.3% | | | | |
| | | | | FIXED INCOME - 18.3% | | | | |
| | 10,499 | | | BlackRock Corporate High Yield Fund, Inc. | | $ | 132,287 | |
| | 10,224 | | | BlackRock Credit Allocation Income Trust | | | 156,734 | |
| | 11,997 | | | BlackRock Limited Duration Income Trust | | | 208,268 | |
| | 5,000 | | | Blackstone / GSO Strategic Credit Fund | | | 69,300 | |
| | 10,000 | | | DoubleLine Income Solutions Fund | | | 179,000 | |
| | 9,666 | | | PGIM Global High Yield Fund, Inc. | | | 151,853 | |
| | 15,744 | | | PGIM High Yield Bond Fund, Inc. | | | 256,628 | |
| | 15,980 | | | PIMCO Income Strategy Fund II | | | 181,852 | |
| | 10,520 | | | Wells Fargo Income Opportunities Fund | | | 95,627 | |
| | | | | | | | 1,431,549 | |
| | | | | | | | | |
| | | | | TOTAL CLOSED END FUNDS (Cost $1,330,524) | | | 1,431,549 | |
| | | | | | | | | |
| | | | | EXCHANGE-TRADED FUNDS — 0.9% | | | | |
| | | | | EQUITY - 0.9% | | | | |
| | 5,001 | | | ProShares UltraShort Russell2000(a) | | | 66,764 | |
| | | | | | | | | |
| | | | | TOTAL EXCHANGE-TRADED FUNDS (Cost $77,590) | | | 66,764 | |
| | | | | | | | | |
| | | | | TOTAL INVESTMENTS - 19.2% (Cost $1,408,114) | | $ | 1,498,313 | |
| | | | | OTHER ASSETS IN EXCESS OF LIABILITIES- 80.8% | | | 6,314,114 | |
| | | | | NET ASSETS - 100.0% | | $ | 7,812,427 | |
| | | | | | | | | |
| (a) | Non-income producing security. |
See accompanying notes to financial statements.
| STATEMENTS OF ASSETS AND LIABILITIES |
| August 31, 2021 |
| | | Easterly | | | | | | Easterly | |
| | | Global Macro | | | Easterly | | | Multi Strategy | |
| | | Fund | | | Global Real Estate | | | Alternative Income | |
| | | (Consolidated) | | | Fund | | | Fund | |
| Assets: | | | | | | | | | |
| Investments in Affiliates, at cost | | $ | 3,009,704 | | | $ | — | | | $ | — | |
| Investments in Unaffilated securities, at cost | | | 3,302,596 | | | | 1,015,324,959 | | | | 12,956,665 | |
| Total Investments, at cost | | $ | 6,312,300 | | | $ | 1,015,324,959 | | | $ | 12,956,665 | |
| Investments Affiliates, at value | | $ | 3,087,194 | | | $ | — | | | $ | — | |
| Investments in Unaffiated securities, at value | | | 3,444,421 | | | | 890,951,155 | | | | 14,439,844 | |
| Total Investments, at value | | $ | 6,531,615 | | | $ | 890,951,155 | | | $ | 14,439,844 | |
| Cash | | | 503,841 | | | | 14,815,465 | | | | 1,429,683 | |
| Foreign Cash (Cost $18, $0, $0) | | | 18 | | | | — | | | | — | |
| Deposit at Broker | | | 869,067 | | | | — | | | | 1,642,261 | |
| Unrealized appreciation on swaps | | | 868,442 | | | | — | | | | — | |
| Unrealized appreciation on forward currency contracts | | | 5,405 | | | | 9,663 | | | | 35 | |
| Receivable for securities sold | | | — | | | | 8,079,218 | | | | 67,313 | |
| Receivable for fund shares sold | | | 612 | | | | 1,735,518 | | | | — | |
| Interest and dividends receivable | | | 1,082 | | | | 1,579,312 | | | | 347,565 | |
| Receivable from manager | | | 3,564 | | | | — | | | | — | |
| Prepaid expenses and other assets | | | 20,393 | | | | 144,549 | | | | 9,017 | |
| Total Assets | | | 8,804,039 | | | | 917,314,880 | | | | 17,935,718 | |
| | | | | | | | | | | | | |
| Liabilities: | | | | | | | | | | | | |
| Due to Broker | | | 13,513 | | | | — | | | | — | |
| Securities sold short (Proceeds $0, $0, $3,005,801) | | | — | | | | — | | | | 4,107,888 | |
| Foreign Cash Overdraft (cost $0, $1,596, $120,713) | | | — | | | | 1,596 | | | | 118,954 | |
| Payable for securities purchased | | | — | | | | 11,267,487 | | | | 83,792 | |
| Payable for fund shares redeemed | | | 574 | | | | 150,642 | | | | — | |
| Payable to manager | | | — | | | | 682,133 | | | | 18,932 | |
| Administration fees payable | | | 3,027 | | | | 110,518 | | | | 3,626 | |
| Custody fees payable | | | 9,554 | | | | 34,234 | | | | 19,007 | |
| Trustee fees payable | | | 3,539 | | | | 3,782 | | | | 4,074 | |
| Compliance officer fees payable | | | 1,232 | | | | 772 | | | | 1,231 | |
| Payable for distribution (12b-1) fees | | | 256 | | | | 148,929 | | | | 212 | |
| Dividend Payable | | | — | | | | — | | | | 947 | |
| Accrued expenses and other liabilities | | | 25,481 | | | | 147,900 | | | | 25,599 | |
| Total Liabilities | | | 57,176 | | | | 12,547,993 | | | | 4,384,262 | |
| | | | | | | | | | | | | |
| Net Assets | | $ | 8,746,863 | | | $ | 904,766,887 | | | $ | 13,551,456 | |
| | | | | | | | | | | | | |
| Net Assets: | | | | | | | | | | | | |
| Par value of shares of beneficial interest | | $ | 8,776 | | | $ | 460,267 | | | $ | 13,713 | |
| Paid in capital | | | 10,555,272 | | | | 995,816,675 | | | | 12,357,374 | |
| Accumulated earnings (loss) | | | (1,817,185 | ) | | | (91,510,055 | ) | | | 1,180,369 | |
| Net Assets | | $ | 8,746,863 | | | $ | 904,766,887 | | | $ | 13,551,456 | |
| | | | | | | | | | | | | |
| Net Asset Value Per Share | | | | | | | | | | | | |
| Class A | | | | | | | | | | | | |
| Net Assets | | | | | | $ | 118,586,976 | | | $ | 487,566 | |
| Shares of beneficial interest outstanding | | | | | | | 6,261,344 | | | | 49,417 | |
| Net asset value, redemption price per share | | | | | | $ | 18.94 | | | $ | 9.87 | |
| Offering price per share (maximum sales charge of 0.00%, 5.75% and 2.00%, respectively) | | | | | | $ | 20.10 | | | $ | 10.07 | |
| | | | | | | | | | | | | |
| Class C | | | | | | | | | | | | |
| Net Assets | | | | | | $ | 75,700,804 | | | $ | 17,125 | |
| Shares of beneficial interest outstanding | | | | | | | 3,971,847 | | | | 1,782 | |
| Net asset value, offering price per share (a) | | | | | | $ | 19.06 | | | $ | 9.61 | |
| | | | | | | | | | | | | |
| Class I | | | | | | | | | | | | |
| Net Assets | | $ | 3,713,941 | | | $ | 678,440,049 | | | $ | 13,018,185 | |
| Shares of beneficial interest outstanding | | | 375,436 | | | | 34,198,457 | | | | 1,317,292 | |
| Net asset value, redemption price and offering price per share | | $ | 9.89 | | | $ | 19.84 | | | $ | 9.88 | |
| | | | | | | | | | | | | |
| Class R6 | | | | | | | | | | | | |
| Net Assets | | $ | 5,032,922 | | | $ | 32,039,058 | | | $ | 28,580 | |
| Shares of beneficial interest outstanding | | | 502,202 | | | | 1,595,092 | | | | 2,837 | |
| Net asset value, redemption price and offering price per share | | $ | 10.02 | | | $ | 20.09 | | | $ | 10.07 | |
| (a) | Redemption price per C share varies based on length of time shares are held. |
See accompanying notes to financial statements.
| STATEMENTS OF ASSETS AND LIABILITIES |
| August 31, 2021 |
| | | | | | Easterly | |
| | | Easterly | | | Hedged | |
| | | Hedged Equity | | | High Income | |
| | | Fund | | | Fund | |
| Assets: | | | | | | | | |
| Investments, at cost | | $ | 39,249,376 | | | $ | 1,408,114 | |
| Investments, at value | | | 50,027,840 | | | | 1,498,313 | |
| Cash | | | 5,745,429 | | | | 5,785,662 | |
| Receivable for securities sold | | | — | | | | 584,094 | |
| Receivable on open swap contracts | | | 604,677 | | | | — | |
| Receivable for fund shares sold | | | 4,817 | | | | — | |
| Interest and dividends receivable | | | — | | | | 6,624 | |
| Prepaid expenses and other assets | | | 29,631 | | | | 19,739 | |
| Total Assets | | | 56,412,394 | | | | 7,894,432 | |
| | | | | | | | | |
| Liabilities: | | | | | | | | |
| Options written (premiums received $1,050,173, $0) | | | 759,963 | | | | — | |
| Due to Broker | | | 1,452,260 | | | | — | |
| Payable for fund shares redeemed | | | 21,133 | | | | — | |
| Payable to manager | | | 40,626 | | | | 15,056 | |
| Administration fees payable | | | 9,700 | | | | 14,925 | |
| Custody fees payable | | | 3,335 | | | | 7,398 | |
| Trustee fees payable | | | 2,844 | | | | 4,952 | |
| Compliance officer fees payable | | | 1,192 | | | | 1,110 | |
| Payable for distribution (12b-1) fees | | | 1,586 | | | | 2,851 | |
| Expense Recapture | | | 1,909 | | | | — | |
| Accrued expenses and other liabilities | | | 25,341 | | | | 35,713 | |
| Total Liabilities | | | 2,319,889 | | | | 82,005 | |
| | | | | | | | | |
| Net Assets | | $ | 54,092,505 | | | $ | 7,812,427 | |
| | | | | | | | | |
| Net Assets: | | | | | | | | |
| Par value of shares of beneficial interest | | $ | 47,454 | | | $ | 8,557 | |
| Paid in capital | | | 50,103,091 | | | | 11,893,691 | |
| Accumulated earnings (loss) | | | 3,941,960 | | | | (4,089,821 | ) |
| Net Assets | | $ | 54,092,505 | | | $ | 7,812,427 | |
| | | | | | | | | |
| Net Asset Value Per Share | | | | | | | | |
| Class A | | | | | | | | |
| Net Assets | | $ | 1,899,475 | | | $ | 1,140,092 | |
| Shares of beneficial interest outstanding | | | 169,885 | | | | 126,274 | |
| Net asset value, redemption price per share | | $ | 11.18 | | | $ | 9.03 | |
| Offering price per share (maximum sales charge of 5.75% and 2.00%, respectively) | | $ | 11.86 | | | $ | 9.21 | |
| | | | | | | | | |
| Class C | | | | | | | | |
| Net Assets | | $ | 745,737 | | | $ | 218,458 | |
| Shares of beneficial interest outstanding | | | 68,399 | | | | 24,033 | |
| Net asset value, offering price per share (a) | | $ | 10.90 | | | $ | 9.09 | |
| | | | | | | | | |
| Class I | | | | | | | | |
| Net Assets | | $ | 33,477,593 | | | $ | 5,889,658 | |
| Shares of beneficial interest outstanding | | | 2,954,771 | | | | 644,899 | |
| Net asset value, redemption price and offering price per share | | $ | 11.33 | | | $ | 9.13 | |
| | | | | | | | | |
| Class R6 | | | | | | | | |
| Net Assets | | $ | 17,969,700 | | | $ | 564,219 | |
| Shares of beneficial interest outstanding | | | 1,552,305 | | | | 60,485 | |
| Net asset value, redemption price and offering price per share | | $ | 11.58 | | | $ | 9.33 | |
| (a) | Redemption price per C share varies based on length of time shares are held. |
See accompanying notes to financial statements.
| STATEMENTS OF OPERATIONS |
| For the Year Ended August 31, 2021 |
| | | Easterly | | | | | | Easterly | |
| | | Global Macro | | | Easterly | | | Multi Strategy | |
| | | Fund | | | Global Real Estate | | | Alternative Income | |
| | | (Consolidated) | | | Fund | | | Fund | |
| | | | | | | | | | |
| Investment Income: | | | | | | | | | | | | |
| Dividend income | | $ | 86,835 | | | $ | 17,614,158 | | | $ | 497,375 | |
| Interest income | | | 113 | | | | 923 | | | | 33,788 | |
| Dividend income from Affiliates | | | 180,157 | | | | — | | | | 32,382 | |
| Less: Foreign withholding taxes | | | — | | | | (538,717 | ) | | | (1,793 | ) |
| Total Investment Income | | | 267,105 | | | | 17,076,364 | | | | 561,752 | |
| | | | | | | | | | | | | |
| Operating Expenses: | | | | | | | | | | | | |
| Management fees | | | 91,896 | | | | 7,166,312 | | | | 277,847 | |
| Supervisory fees | | | 4,814 | | | | 269,058 | | | | 4,874 | |
| Distribution (12b-1) fees | | | | | | | | | | | | |
| Class A Shares | | | 374 | | | | 249,526 | | | | 216 | |
| Class C Shares | | | 1,571 | | | | 704,222 | | | | 675 | |
| Administration fees | | | 32,267 | | | | 1,109,828 | | | | 42,249 | |
| Printing and postage expense | | | 5,317 | | | | 219,987 | | | | 5,904 | |
| Custodian fees | | | 14,751 | | | | 197,788 | | | | 36,500 | |
| Registration fees | | | 30,414 | | | | 236,913 | | | | 14,213 | |
| Audit fees | | | 16,613 | | | | 39,297 | | | | 19,145 | |
| Legal fees | | | 13,174 | | | | 61,221 | | | | 12,863 | |
| Compliance officer fees | | | 3,773 | | | | 67,831 | | | | 4,119 | |
| Trustees’ fees | | | 5,440 | | | | 61,122 | | | | 6,199 | |
| Shareholder servicing fees | | | 4,830 | | | | 592,420 | | | | 123 | |
| Insurance expense | | | 264 | | | | 24,794 | | | | 387 | |
| Dividend Expense | | | — | | | | — | | | | 31,086 | |
| Interest Expense | | | 6,251 | | | | 5,271 | | | | 138,829 | |
| Miscellaneous expenses | | | 5,492 | | | | 4,247 | | | | 3,542 | |
| Total Operating Expenses | | | 237,241 | | | | 11,009,837 | | | | 598,771 | |
| Less: Expenses waived and/or reimbursed | | | (122,020 | ) | | | (951,023 | ) | | | (154,226 | ) |
| Net Operating Expenses | | | 115,221 | | | | 10,058,814 | | | | 444,545 | |
| | | | | | | | | | | | | |
| Net Investment Income | | | 151,884 | | | | 7,017,550 | | | | 117,207 | |
| | | | | | | | | | | | | |
| Realized and Unrealized Gain (Loss) on Investments: | | | | | | | | | | | | |
| Net realized gain (loss) from: | | | | | | | | | | | | |
| Investments and Foreign currency transactions | | | 201,369 | | | | 66,259,354 | | | | 1,475,995 | |
| Affiliated Investments | | | 151,625 | | | | — | | | | 66,010 | |
| Securities sold short | | | — | | | | — | | | | (415,549 | ) |
| Options purchased | | | — | | | | — | | | | (23,629 | ) |
| Options written | | | — | | | | — | | | | 354 | |
| Swaps | | | (19,202 | ) | | | — | | | | — | |
| Distribution of realized gains by underlying affiliated and non affiliated investment companies | | | 1,542 | | | | — | | | | 287 | |
| Net realized gain | | | 335,334 | | | | 66,259,354 | | | | 1,103,468 | |
| | | | | | | | | | | | | |
| Net change in unrealized appreciation (depreciation) on: | | | | | | | | | | | | |
| Investments and Foreign currency transactions | | | 49,844 | | | | 153,550,412 | | | | 1,484,193 | |
| Affiliated Investments | | | (81,368 | ) | | | — | | | | (49,833 | ) |
| Securities sold short | | | — | | | | — | | | | (710,519 | ) |
| Swaps | | | 654,774 | | | | — | | | | — | |
| Net change in unrealized appreciation | | | 623,250 | | | | 153,550,412 | | | | 723,841 | |
| | | | | | | | | | | | | |
| Net Realized and Unrealized Gain on investments | | | 958,584 | | | | 219,809,766 | | | | 1,827,309 | |
| | | | | | | | | | | | | |
| Net Increase in Net Assets Resulting From Operations | | $ | 1,110,468 | | | $ | 226,827,316 | | | $ | 1,944,516 | |
See accompanying notes to financial statements.
| STATEMENTS OF OPERATIONS |
| For the Year Ended August 31, 2021 |
| | | | | | Easterly | |
| | | Easterly | | | Hedged | |
| | | Hedged Equity | | | High Income | |
| | | Fund | | | Fund | |
| Investment Income: | | | | | | | | |
| Dividend income | | $ | 613,226 | | | $ | 243,868 | |
| Interest income | | | 276 | | | | 903,692 | |
| Dividend income from Affiliates | | | — | | | | 121,779 | |
| Total Investment Income | | | 613,502 | | | | 1,269,339 | |
| | | | | | | | | |
| Operating Expenses: | | | | | | | | |
| Management fees | | | 562,785 | | | | 402,582 | |
| Supervisory fees | | | 18,247 | | | | 9,685 | |
| Distribution (12b-1) fees | | | | | | | | |
| Class A Shares | | | 4,126 | | | | 3,406 | |
| Class C Shares | | | 11,445 | | | | 3,909 | |
| Administration fees | | | 83,325 | | | | 87,405 | |
| Registration fees | | | 40,625 | | | | 36,646 | |
| Audit fees | | | 18,605 | | | | 19,588 | |
| Legal fees | | | 12,047 | | | | 10,781 | |
| Custodian fees | | | 10,999 | | | | 33,001 | |
| Trustees’ fees | | | 9,016 | | | | 6,935 | |
| Compliance officer fees | | | 7,454 | | | | 5,817 | |
| Printing and postage expense | | | 22,457 | | | | 11,034 | |
| Insurance expense | | | 1,271 | | | | 857 | |
| Shareholder servicing fees | | | 52,667 | | | | 27,736 | |
| Interest Expense | | | 22,009 | | | | 94,862 | |
| Miscellaneous expenses | | | 3,450 | | | | 3,000 | |
| Total Operating Expenses | | | 880,528 | | | | 757,244 | |
| Less: Expenses waived | | | (44,773 | ) | | | (268,707 | ) |
| Net Operating Expenses | | | 835,755 | | | | 488,537 | |
| | | | | | | | | |
| Net Investment Income (Loss) | | | (222,253 | ) | | | 780,802 | |
| | | | | | | | | |
| Realized and Unrealized Gain (Loss) on Investments: | | | | | | | | |
| Net realized gain (loss) from: | | | | | | | | |
| Investments and Foreign currency transactions | | | 3,997,444 | | | | (1,910,907 | ) |
| Affiliated Investments | | | — | | | | 333,580 | |
| Options purchased | | | (17,248,547 | ) | | | — | |
| Options written | | | 6,756,643 | | | | — | |
| Swaps | | | 5,311,082 | | | | (537,911 | ) |
| Securities sold short | | | — | | | | 36,446 | |
| Futures contracts | | | — | | | | 102,538 | |
| Distribution of realized gains by underlying affiliated and non affiliated investment companies | | | — | | | | 879 | |
| Net realized loss | | | (1,183,378 | ) | | | (1,975,375 | ) |
| | | | | | | | | |
| Net change in unrealized appreciation (depreciation) on: | | | | | | | | |
| Investments and Foreign currency transactions | | | 6,074,541 | | | | 3,391,585 | |
| Affiliated Investments | | | — | | | | (258,381 | ) |
| Options purchased | | | (622,519 | ) | | | — | |
| Options written | | | 703,906 | | | | — | |
| Swaps | | | — | | | | 236,378 | |
| Securities sold short | | | 35,685 | | | | 13,424 | |
| Futures contracts | | | — | | | | 14,918 | |
| Net change in unrealized appreciation | | | 6,191,613 | | | | 3,397,924 | |
| | | | | | | | | |
| Net Realized and Unrealized Gain on investments | | | 5,008,235 | | | | 1,422,549 | |
| | | | | | | | | |
| Net Increase in Net Assets Resulting From Operations | | $ | 4,785,982 | | | $ | 2,203,351 | |
See accompanying notes to financial statements.
| STATEMENTS OF CHANGES IN NET ASSETS |
| | | Easterly | | | Easterly | | | Easterly Multi Strategy | |
| | | Global Macro Fund | | | Global Real Estate Fund | | | Alternative Income Fund | |
| | | (Consolidated) | | | | | | | | | | | | | |
| | | Year Ended | | | Year Ended | | | Year Ended | | | Year Ended | | | Year Ended | | | Year Ended | |
| | | August 31, 2021 | | | August 31, 2020 | | | August 31, 2021 | | | August 31, 2020 | | | August 31, 2021 | | | August 31, 2020 | |
| | | | | | | | | | | | | | | | | | | |
| Operations: | | | | | | | | | | | | | | | | | | | | | | | | |
| Net investment income | | $ | 151,884 | | | $ | 165,707 | | | $ | 7,017,550 | | | $ | 13,439,570 | | | $ | 117,207 | | | $ | 46,742 | |
| Net realized gain (loss) on investments, swaps and foreign currency transactions | | | 333,792 | | | | (551,644 | ) | | | 66,259,354 | | | | 78,812,147 | | | | 1,103,181 | | | | 1,397,326 | |
| Distribution of realized gains by underlying investment companies | | | 1,542 | | | | 1,961 | | | | — | | | | — | | | | 287 | | | | 748 | |
| Net change in unrealized appreciation (depreciation) on investments, short sells, swaps and foreign currency transactions | | | 623,250 | | | | (168,896 | ) | | | 153,550,412 | | | | (154,651,589 | ) | | | 723,841 | | | | (571,647 | ) |
| Net increase (decrease) in net assets resulting from operations | | | 1,110,468 | | | | (552,872 | ) | | | 226,827,316 | | | | (62,399,872 | ) | | | 1,944,516 | | | | 873,169 | |
| | | | | | | | | | | | | | | | | | | | | | | | | |
| Distributions to Shareholders: | | | | | | | | | | | | | | | | | | | | | | | | |
| Total Distributions Paid: | | | | | | | | | | | | | | | | | | | | | | | | |
| Class A | | | — | | | | (16,834 | ) | | | (8,868,934 | ) | | | (11,550,263 | ) | | | (348 | ) | | | (1,077 | ) |
| Class C | | | — | | | | (24,761 | ) | | | (5,974,859 | ) | | | (8,308,065 | ) | | | (5,930 | ) | | | (2,658 | ) |
| Class I | | | — | | | | (541,958 | ) | | | (52,450,299 | ) | | | (75,761,135 | ) | | | (1,199,291 | ) | | | (381,517 | ) |
| Class R6 | | | — | | | | (280,551 | ) | | | (3,011,924 | ) | | | (2,046,015 | ) | | | (45,105 | ) | | | (37,008 | ) |
| Return of Capital | | | | | | | | | | | | | | | | | | | | | | | | |
| Class A | | | — | | | | (101 | ) | | | — | | | | — | | | | — | | | | — | |
| Class C | | | — | | | | (178 | ) | | | — | | | | — | | | | — | | | | — | |
| Class I | | | — | | | | (3,134 | ) | | | — | | | | — | | | | — | | | | — | |
| Class R6 | | | — | | | | (1,623 | ) | | | — | | | | — | | | | — | | | | — | |
| Total Dividends and Distributions to Shareholders | | | — | | | | (869,140 | ) | | | (70,306,016 | ) | | | (97,665,478 | ) | | | (1,250,674 | ) | | | (422,260 | ) |
| | | | | | | | | | | | | | | | | | | | | | | | | |
| Share Transactions of Beneficial Interest: | | | | | | | | | | | | | | | | | | | | | | | | |
| | | | | | | | | | | | | | | | | | | | | | | | | |
| Beneficial Interest: | | | | | | | | | | | | | | | | | | | | | | | | |
| Net proceeds from shares sold | | | | | | | | | | | | | | | | | | | | | | | | |
| Class A | | | 548,771 | | | | 1,130 | | | | 26,087,332 | | | | 18,808,078 | | | | 486,620 | | | | 564 | |
| Class C | | | — | | | | 653 | | | | 6,482,935 | | | | 11,744,939 | | | | 9 | | | | 35 | |
| Class I | | | 1,554,963 | * | | | 447,234 | | | | 176,356,375 | | | | 504,892,742 | | | | 158,369 | | | | 114,291 | |
| Class R6 | | | 3,099,330 | | | | 1,934,180 | | | | 8,289,805 | | | | 31,231,154 | | | | 8,694 | | | | 100,438 | |
| Reinvestment of dividends and distributions | | | | | | | | | | | | | | | | | | | | | | | | |
| Class A | | | — | | | | 14,047 | | | | 6,959,103 | | | | 9,065,900 | | | | 348 | | | | 1,077 | |
| Class C | | | — | | | | 22,918 | | | | 4,645,136 | | | | 6,529,449 | | | | 5,930 | | | | 2,544 | |
| Class I | | | — | | | | 541,433 | | | | 32,278,948 | | | | 42,134,779 | | | | 1,199,158 | | | | 381,306 | |
| Class R6 | | | — | | | | 188,893 | | | | 2,767,217 | | | | 1,709,364 | | | | 22,495 | | | | 23,796 | |
| Redemption fee proceeds | | | | | | | | | | | | | | | | | | | | | | | | |
| Class A | | | — | | | | — | | | | — | | | | 5 | | | | — | | | | — | |
| Cost of shares redeemed | | | | | | | | | | | | | | | | | | | | | | | | |
| Class A | | | (712,389 | )* | | | (74,619 | ) | | | (21,783,889 | ) | | | (30,137,619 | ) | | | (532 | ) | | | (64,426 | ) |
| Class C | | | (319,081 | )* | | | (100,981 | ) | | | (14,944,020 | ) | | | (20,767,479 | ) | | | (60,227 | ) | | | (117,747 | ) |
| Class I | | | (4,559,893 | ) | | | (1,254,422 | ) | | | (191,507,550 | ) | | | (515,782,732 | ) | | | (1,634,926 | ) | | | (121,820 | ) |
| Class R6 | | | (1,311,366 | ) | | | (2,348,459 | ) | | | (17,301,151 | ) | | | (10,414,985 | ) | | | (760,026 | ) | | | (922,187 | ) |
| Net increase (decrease) in net assets from share transactions of beneficial interest | | | (1,699,665 | ) | | | (627,993 | ) | | | 18,330,241 | | | | 49,013,595 | | | | (574,088 | ) | | | (602,129 | ) |
| | | | | | | | | | | | | | | | | | | | | | | | | |
| Total Increase (Decrease) in Net Assets | | | (589,197 | ) | | | (2,050,005 | ) | | | 174,851,541 | | | | (111,051,755 | ) | | | 119,754 | | | | (151,220 | ) |
| | | | | | | | | | | | | | | | | | | | | | | | | |
| Net Assets: | | | | | | | | | | | | | | | | | | | | | | | | |
| Beginning of year | | | 9,336,060 | | | | 11,386,065 | | | | 729,915,346 | | | | 840,967,101 | | | | 13,431,702 | | | | 13,582,922 | |
| End of year | | $ | 8,746,863 | | | $ | 9,336,060 | | | $ | 904,766,887 | | | $ | 729,915,346 | | | $ | 13,551,456 | | | $ | 13,431,702 | |
| | | | | | | | | | | | | | | | | | | | | | | | | |
| Share Activity | | | | | | | | | | | | | | | | | | | | | | | | |
| Shares sold | | | | | | | | | | | | | | | | | | | | | | | | |
| Class A | | | 58,507 | | | | 135 | | | | 1,447,209 | | | | 1,115,239 | | | | 49,006 | | | | 62 | |
| Class C | | | — | | | | 75 | | | | 358,950 | | | | 663,725 | | | | 1 | | | | 3 | |
| Class I | | | 163,382 | * | | | 48,080 | | | | 9,640,463 | | | | 28,509,376 | | | | 16,478 | | | | 12,714 | |
| Class R6 | | | 312,630 | | | | 218,041 | | | | 452,945 | | | | 1,781,574 | | | | 899 | | | | 11,693 | |
| Shares Reinvested | | | | | | | | | | | | | | | | | | | | | | | | |
| Class A | | | — | | | | 1,564 | | | | 410,411 | | | | 550,089 | | | | 37 | | | | 124 | |
| Class C | | | — | | | | 2,674 | | | | 272,684 | | | | 391,753 | | | | 652 | | | | 293 | |
| Class I | | | — | | | | 60,092 | | | | 1,821,853 | | | | 2,466,466 | | | | 128,283 | | | | 43,844 | |
| Class R6 | | | — | | | | 20,895 | | | | 154,821 | | | | 108,398 | | | | 2,376 | | | | 2,695 | |
| Shares Redeemed | | | | | | | | | | | | | | | | | | | | | | | | |
| Class A | | | (74,331 | )* | | | (9,028 | ) | | | (1,266,516 | ) | | | (1,880,732 | ) | | | (57 | ) | | | (7,324 | ) |
| Class C | | | (35,480 | )* | | | (11,979 | ) | | | (862,722 | ) | | | (1,312,245 | ) | | | (6,318 | ) | | | (14,017 | ) |
| Class I | | | (476,994 | ) | | | (141,252 | ) | | | (10,884,194 | ) | | | (32,304,180 | ) | | | (168,647 | ) | | | (14,069 | ) |
| Class R6 | | | (138,280 | ) | | | (267,045 | ) | | | (929,981 | ) | | | (632,371 | ) | | | (77,343 | ) | | | (102,188 | ) |
| Net increase (decrease) in shares of beneficial interest | | | (190,566 | ) | | | (77,748 | ) | | | 615,923 | | | | (542,908 | ) | | | (54,633 | ) | | | (66,170 | ) |
| * | Share Transactions of Beneficial Interest and Share Activity include the Conversion of Class A and C shares into I shares (see note 1). |
See accompanying notes to (consolidated) financial statements.
| STATEMENTS OF CHANGES IN NET ASSETS |
| | | Easterly | | | Easterly | |
| | | Hedged Equity Fund | | | Hedged High Income Fund | |
| | | | | | | | | | | | | |
| | | Year Ended | | | Year Ended | | | Year Ended | | | Year Ended | |
| | | August 31, 2021 | | | August 31, 2020 | | | August 31, 2021 | | | August 31, 2020 | |
| | | | | | | | | | | | | | | | | |
| Operations: | | | | | | | | | | | | | | | | |
| Net investment income (loss) | | | (222,253 | ) | | $ | (141,749 | ) | | $ | 780,802 | | | $ | 1,740,982 | |
| Net realized loss on investments | | | (1,183,378 | ) | | | (1,868,377 | ) | | | (1,976,254 | ) | | | (671,773 | ) |
| Distribution of realized gains by underlying investment companies | | | — | | | | — | | | | 879 | | | | 4,387 | |
| Net change in unrealized appreciation (depreciation) on investments | | | 6,191,613 | | | | 4,838,914 | | | | 3,397,924 | | | | (1,003,481 | ) |
| Net increase in net assets resulting from operations | | | 4,785,982 | | | | 2,828,788 | | | | 2,203,351 | | | | 70,115 | |
| | | | | | | | | | | | | | | | | |
| Distributions to Shareholders: | | | | | | | | | | | | | | | | |
| Total Distributions Paid: | | | | | | | | | | | | | | | | |
| Class A | | | (117,453 | ) | | | (25,194 | ) | | | (41,781 | ) | | | (139,790 | ) |
| Class C | | | (89,191 | ) | | | (40,715 | ) | | | (10,221 | ) | | | (25,123 | ) |
| Class I | | | (2,714,717 | ) | | | (785,323 | ) | | | (332,202 | ) | | | (788,835 | ) |
| Class R6 | | | (509,805 | ) | | | (289,991 | ) | | | (403,660 | ) | | | (775,851 | ) |
| Return of Capital | | | | | | | | | | | | | | | | |
| Class A | | | — | | | | — | | | | (11,546 | ) | | | (9,654 | ) |
| Class C | | | — | | | | — | | | | (2,003 | ) | | | (2,615 | ) |
| Class I | | | — | | | | — | | | | (63,550 | ) | | | (87,524 | ) |
| Class R6 | | | — | | | | — | | | | (44,075 | ) | | | (99,529 | ) |
| Total Dividends and Distributions to Shareholders | | | (3,431,166 | ) | | | (1,141,223 | ) | | | (909,038 | ) | | | (1,928,921 | ) |
| | | | | | | | | | | | | | | | | |
| Share Transactions of Beneficial Interest: | | | | | | | | | | | | | | | | |
| Beneficial Interest: | | | | | | | | | | | | | | | | |
| Net proceeds from shares sold | | | | | | | | | | | | | | | | |
| Class A | | | 816,869 | | | | 1,215,699 | | | | 190,105 | | | | 1,409,882 | |
| Class C | | | 114,916 | | | | 1,372,262 | | | | 26,509 | | | | 67,000 | |
| Class I | | | 11,255,894 | | | | 33,839,328 | | | | 1,573,388 | | | | 3,527,409 | |
| Class R6 | | | 11,960,114 | | | | 2,374,471 | | | | 1,498,696 | | | | 4,610,520 | |
| Reinvestment of dividends and distributions | | | | | | | | | | | | | | | | |
| Class A | | | 108,960 | | | | 21,319 | | | | 47,755 | | | | 139,789 | |
| Class C | | | 89,191 | | | | 40,272 | | | | 3,727 | | | | 5,727 | |
| Class I | | | 1,582,085 | | | | 622,819 | | | | 337,321 | | | | 737,112 | |
| Class R6 | | | 335,590 | | | | 225,164 | | | | 267,692 | | | | 605,210 | |
| Redemption fee proceeds | | | | | | | | | | | | | | | | |
| Class C | | | — | | | | — | | | | — | | | | 60 | |
| Cost of shares redeemed | | | | | | | | | | | | | | | | |
| Class A | | | (609,057 | ) | | | (296,846 | ) | | | (750,410 | ) | | | (4,559,390 | ) |
| Class C | | | (1,249,874 | ) | | | (197,692 | ) | | | (388,984 | ) | | | (425,362 | ) |
| Class I | | | (21,367,349 | ) | | | (14,156,733 | ) | | | (10,144,806 | ) | | | (12,911,259 | ) |
| Class R6 | | | (4,461,045 | ) | | | (6,666,196 | ) | | | (17,479,369 | ) | | | (12,345,170 | ) |
| Net increase (decrease) in net assets from share transactions of beneficial interest | | | (1,423,706 | ) | | | 18,393,867 | | | | (24,818,376 | ) | | | (19,138,472 | ) |
| Total Increase (decrease) in Net Assets | | | (68,890 | ) | | | 20,081,432 | | | | (23,524,063 | ) | | | (20,997,278 | ) |
| | | | | | | | | | | | | | | | | |
| Net Assets: | | | | | | | | | | | | | | | | |
| Beginning of year | | | 54,161,395 | | | | 34,079,963 | | | | 31,336,490 | | | | 52,333,768 | |
| End of year | | $ | 54,092,505 | | | $ | 54,161,395 | | | $ | 7,812,427 | | | $ | 31,336,490 | |
| | | | | | | | | | | | | | | | | |
| Share Activity | | | | | | | | | | | | | | | | |
| Shares sold | | | | | | | | | | | | | | | | |
| Class A | | | 74,276 | | | | 118,773 | | | | 20,757 | | | | 161,079 | |
| Class C | | | 11,320 | | | | 133,175 | | | | 2,889 | | | | 7,417 | |
| Class I | | | 1,039,218 | | | | 3,233,242 | | | | 171,930 | | | | 396,497 | |
| Class R6 | | | 1,048,515 | | | | 226,381 | | | | 161,097 | | | | 518,448 | |
| Shares Reinvested | | | | | | | | | | | | | | | | |
| Class A | | | 10,558 | | | | 2,036 | | | | 5,328 | | | | 15,778 | |
| Class C | | | 8,813 | | | | 3,925 | | | | 413 | | | | 652 | |
| Class I | | | 151,541 | | | | 58,920 | | | | 37,374 | | | | 83,728 | |
| Class R6 | | | 31,570 | | | | 21,065 | | | | 29,034 | | | | 67,700 | |
| Shares Redeemed | | | | | | | | | | | | | | | | |
| Class A | | | (56,858 | ) | | | (28,666 | ) | | | (82,840 | ) | | | (510,224 | ) |
| Class C | | | (119,990 | ) | | | (19,800 | ) | | | (42,813 | ) | | | (49,371 | ) |
| Class I | | | (1,990,538 | ) | | | (1,406,776 | ) | | | (1,112,370 | ) | | | (1,390,599 | ) |
| Class R6 | | | (399,153 | ) | | | (631,852 | ) | | | (1,873,525 | ) | | | (1,508,195 | ) |
| Net increase (decrease) in shares of beneficial interest | | | (190,728 | ) | | | 1,710,423 | | | | (2,682,726 | ) | | | (2,207,090 | ) |
See accompanying notes to financial statements.
| FINANCIAL HIGHLIGHTS (For a share outstanding throughout each year/period) |
| Easterly Global Macro Fund (Consolidated) |
| | | CLASS I | |
| | | | | | | | | | | | | | | | |
| | | Year Ended | | | Year Ended | | | Year Ended | | | Year Ended | | | Year Ended | |
| | | August 31, | | | August 31, | | | August 31, | | | August 31, | | | August 31, | |
| | | 2021 | | | 2020 | | | 2019 | | | 2018 | | | 2017 | |
| Net Asset Value, Beginning of Year/Period | | $ | 8.74 | | | $ | 9.95 | | | $ | 9.15 | | | $ | 9.16 | | | $ | 9.34 | |
| Income (Loss) from Investment Operations: | | | | | | | | | | | | | | | | | | | | |
| Net investment income (1) | | | 0.17 | | | | 0.13 | | | | 0.09 | | | | 0.10 | | | | 0.03 | |
| Net realized and unrealized gain (loss) | | | 0.98 | | | | (0.57 | ) | | | 0.71 | | | | (0.11 | ) | | | (0.21 | ) |
| Total from investment operations | | | 1.15 | | | | (0.44 | ) | | | 0.80 | | | | (0.01 | ) | | | (0.18 | ) |
| Dividends and Distributions: | | | | | | | | | | | | | | | | | | | | |
| Dividends from net investment income | | | — | | | | (0.77 | ) | | | — | | | | — | | | | — | |
| Distributions from return of capital | | | — | | | | (0.00 | ) ** | | | — | | | | — | | | | — | |
| Total dividends and distributions | | | — | | | | (0.77 | ) | | | — | | | | — | | | | — | |
| Redemption Fees | | | — | | | | — | | | | (0.00 | ) ** | | | — | | | | (0.00 | ) ** |
| Net Asset Value, End of Year/Period | | $ | 9.89 | | | $ | 8.74 | | | $ | 9.95 | | | $ | 9.15 | | | $ | 9.16 | |
| Total Return* | | | 13.16 | % | | | (4.58 | )% | | | 8.74 | % | | | (0.11 | )% | | | (1.93 | )% |
| Ratios and Supplemental Data: | | | | | | | | | | | | | | | | | | | | |
| Net assets, end of year/period (000s) | | $ | 3,714 | | | $ | 6,020 | | | $ | 7,187 | | | $ | 6,849 | | | $ | 8,448 | |
| Ratio of gross operating expenses (including dividend and interest expense) to average net assets (2) | | | 2.80 | % | | | 2.57 | % | | | 2.46 | % | | | 2.36 | % | | | 2.36 | % |
| Ratio of net operating expenses (including dividend and interest expense) to average net assets (3) | | | 1.57 | % | | | 1.45 | % | | | 1.28 | % | | | 1.30 | % | | | 1.25 | % |
| Ratio of net investment income (including dividend and interest expense) after expense reimbursement/recoupment to average net assets | | | 1.87 | % | | | 1.50 | % | | | 1.00 | % | | | 1.03 | % | | | 0.36 | % |
| Portfolio Turnover Rate | | | 145 | % | | | 125 | % | | | 133 | % | | | 103 | % | | | 83 | % |
| | | | | | | | | | | | | | | | | | | | | |
| | | CLASS R6 | |
| | | | | | | | | | | | | | | | |
| | | | | | | | | | | | | | | For the Period | |
| | | | | | | | | | | | | | | August 17, | |
| �� | | Year Ended | | | Year Ended | | | Year Ended | | | Year Ended | | | 2017 (4) to | |
| | | August 31, | | | August 31, | | | August 31, | | | August 31, | | | August 31, | |
| | | 2021 | | | 2020 | | | 2019 | | | 2018 | | | 2017 | |
| Net Asset Value, Beginning of Year/Period | | $ | 8.80 | | | $ | 9.97 | | | $ | 9.16 | | | $ | 9.17 | | | $ | 9.05 | |
| Income (Loss) from Investment Operations: | | | | | | | | | | | | | | | | | | | | |
| Net investment income (1) | | | 0.18 | | | | 0.18 | | | | 0.10 | | | | 0.13 | | | | 0.00 | ** |
| Net realized and unrealized gain (loss) | | | 1.04 | | | | (0.58 | ) | | | 0.71 | | | | (0.14 | ) | | | 0.12 | |
| Total from investment operations | | | 1.22 | | | | (0.40 | ) | | | 0.81 | | | | (0.01 | ) | | | 0.12 | |
| Dividends and Distributions: | | | | | | | | | | | | | | | | | | | | |
| Dividends from net investment income | | | — | | | | (0.77 | ) | | | — | | | | — | | | | — | |
| Distributions from realized gains | | | — | | | | (0.00 | ) ** | | | — | | | | — | | | | — | |
| Total dividends and distributions | | | — | | | | (0.77 | ) | | | — | | | | — | | | | — | |
| Redemption Fees | | | — | | | | — | | | | 0.00 | ** | | | 0.00 | ** | | | 0.00 | ** |
| Net Asset Value, End of Year/Period | | $ | 10.02 | | | $ | 8.80 | | | $ | 9.97 | | | $ | 9.16 | | | $ | 9.17 | |
| Total Return* | | | 13.86 | % | | | (4.15 | )% | | | 8.84 | % | | | (0.11 | )% | | | 1.33 | % |
| Ratios and Supplemental Data: | | | | | | | | | | | | | | | | | | | | |
| Net assets, end of year/period (000s) | | $ | 5,033 | | | $ | 2,885 | | | $ | 3,550 | | | $ | 4,636 | | | $ | 109 | |
| Ratio of gross operating expenses (including dividend and interest expense) to average net assets (5) | | | 2.89 | % | | | 2.57 | % | | | 2.41 | % | | | 2.39 | % | | | 2.36 | % (7) |
| Ratio of net operating expenses (including dividend and interest expense) to average net assets (6) | | | 1.01 | % | | | 0.98 | % | | | 1.20 | % | | | 1.30 | % | | | 1.25 | % (7) |
| Ratio of net investment income (including dividend and interest expense) after expense reimbursement/recoupment to average net assets | | | 1.91 | % | | | 1.97 | % | | | 1.08 | % | | | 1.39 | % | | | 0.36 | % (7) |
| Portfolio Turnover Rate | | | 145 | % | | | 125 | % | | | 133 | % | | | 103 | % | | | 83 | % (8) |
| |
| (1) Per share amounts calculated using the average shares method, which more appropriately presents the per share data for the period. |
| |
| (2) Ratio of gross expenses to average net assets (excluding dividend and interest expenses) for the Easterly Global Macro Fund - Class I: |
| | | | | | | | | | | | | | | | | | | | | |
| | | | 2.72 | % | | | 2.53 | % | | | 2.43 | % | | | 2.31 | % | | | 2.36 | % (7) |
| |
| (3) Ratio of net operating expenses to average net assets (excluding dividend and interest expenses) for the Easterly Global Macro Fund - Class I: |
| | | | | | | | | | | | | | | | | | | | | |
| | | | 1.49 | % | | | 1.41 | % | | | 1.25 | % | | | 1.25 | % | | | 1.25 | % (7) |
| |
| (4) Commencement of offering. |
| |
| (5) Ratio of gross expenses to average net assets (excluding dividend and interest expenses) for the Easterly Global Macro Fund - Class R6: |
| | | | | | | | | | | | | | | | | | | | | |
| | | | 2.81 | % | | | 2.53 | % | | | 2.38 | % | | | 2.30 | % | | | 2.36 | % (7) |
| |
| (6) Ratio of net operating expenses to average net assets (excluding dividend and interest expenses) for the Easterly Global Macro Fund - Class R6: |
| | | | | | | | | | | | | | | | | | | | | |
| | | | 0.93 | % | | | 0.94 | % | | | 1.17 | % | | | 1.20 | % | | | 1.25 | % (7) |
| |
| (7) Annualized for periods less than one year. |
| |
| (8) Not annualized |
| * | Assumes reinvestment of all dividends and distributions and does not assume the effects of any sales charges. Aggregate (not annualized) total return is shown for any period shorter than one year. Total return does not reflect the deduction of taxes that a shareholder would pay on distributions or on the redemption of shares. |
| ** | Per share amount represents less than $0.01 per share. |
| FINANCIAL HIGHLIGHTS (For a share outstanding throughout each year/period) |
| Easterly Global Real Estate Fund |
| | | CLASS A |
| | | | | | | | | | | | | | | | |
| | | Year Ended | | | Year Ended | | | Year Ended | | | Year Ended | | | Year Ended | |
| | | August 31, | | | August 31, | | | August 31, | | | August 31, | | | August 31, | |
| | | 2021 | | | 2020 | | | 2019 | | | 2018 | | | 2017 | |
| Net Asset Value, Beginning of Year/Period | | $ | 15.56 | | | $ | 17.81 | | | $ | 18.73 | | | $ | 18.98 | | | $ | 19.03 | |
| Income (Loss) from Investment Operations: | | | | | | | | | | | | | | | | | | | | |
| Net investment income (1) | | | 0.11 | | | | 0.19 | | | | 0.09 | | | | 0.33 | | | | 0.27 | |
| Net realized and unrealized gain (loss) | | | 4.85 | | | | (0.51 | ) | | | 0.65 | | | | 1.22 | | | | 1.51 | |
| Total from investment operations | | | 4.96 | | | | (0.32 | ) | | | 0.74 | | | | 1.55 | | | | 1.78 | |
| Dividends and Distributions: | | | | | | | | | | | | | | | | | | | | |
| Dividends from net investment income | | | (0.28 | ) | | | (0.28 | ) | | | (0.64 | ) | | | (0.69 | ) | | | (0.28 | ) |
| Distributions from realized gains | | | (1.30 | ) | | | (1.65 | ) | | | (1.02 | ) | | | (1.11 | ) | | | (1.55 | ) |
| Total dividends and distributions | | | (1.58 | ) | | | (1.93 | ) | | | (1.66 | ) | | | (1.80 | ) | | | (1.83 | ) |
| Redemption Fees | | | — | | | | — | | | | — | | | | — | | | | 0.00 | ** |
| Net Asset Value, End of Year/Period | | $ | 18.94 | | | $ | 15.56 | | | $ | 17.81 | | | $ | 18.73 | | | $ | 18.98 | |
| Total Return* | | | 33.47 | % | | | (1.93 | )% | | | 4.67 | % | | | 8.75 | % | | | 10.27 | % |
| Ratios and Supplemental Data: | | | | | | | | | | | | | | | | | | | | |
| Net assets, end of year/period (000s) | | $ | 118,587 | | | $ | 88,222 | | | $ | 104,815 | | | $ | 109,634 | | | $ | 94,239 | |
| Ratio of gross operating expenses (including dividend and interest expense) to average net assets (2) | | | 1.51 | % | | | 1.60 | % | | | 1.60 | % | | | 1.62 | % | | | 1.93 | % |
| Ratio of net operating expenses (including dividend and interest expense) to average net assets (3) | | | 1.51 | % | | | 1.60 | % | | | 1.60 | % | | | 1.62 | % | | | 1.92 | % |
| Ratio of net investment income (including dividend and interest expense) after expense reimbursement/recoupment to average net assets | | | 0.64 | % | | | 1.16 | % | | | 0.52 | % | | | 1.80 | % | | | 1.46 | % |
| Portfolio Turnover Rate | | | 160 | % | | | 187 | % | | | 172 | % | | | 204 | % | | | 141 | % |
| | | | | | | | | | | | | | | | | | | | | |
| | | CLASS C | |
| | | | | | | | | | | | | | | | |
| | | Year Ended | | | Year Ended | | | Year Ended | | | Year Ended | | | Year Ended | |
| | | August 31, | | | August 31, | | | August 31, | | | August 31, | | | August 31, | |
| | | 2021 | | | 2020 | | | 2019 | | | 2018 | | | 2017 | |
| Net Asset Value, Beginning of Year/Period | | $ | 15.68 | | | $ | 17.95 | | | $ | 18.89 | | | $ | 19.13 | | | $ | 19.15 | |
| Income (Loss) from Investment Operations: | | | | | | | | | | | | | | | | | | | | |
| Net investment income (loss) (1) | | | (0.02 | ) | | | 0.07 | | | | (0.04 | ) | | | 0.20 | | | | 0.13 | |
| Net realized and unrealized gain (loss) | | | 4.89 | | | | (0.51 | ) | | | 0.65 | | | | 1.22 | | | | 1.54 | |
| Total from investment operations | | | 4.87 | | | | (0.44 | ) | | | 0.61 | | | | 1.42 | | | | 1.67 | |
| Dividends and Distributions: | | | | | | | | | | | | | | | | | | | | |
| Dividends from net investment income | | | (0.19 | ) | | | (0.18 | ) | | | (0.53 | ) | | | (0.55 | ) | | | (0.14 | ) |
| Distributions from realized gains | | | (1.30 | ) | | | (1.65 | ) | | | (1.02 | ) | | | (1.11 | ) | | | (1.55 | ) |
| Total dividends and distributions | | | (1.49 | ) | | | (1.83 | ) | | | (1.55 | ) | | | (1.66 | ) | | | (1.69 | ) |
| Redemption Fees | | | — | | | | — | | | | — | | | | — | | | | 0.00 | ** |
| Net Asset Value, End of Year/Period | | $ | 19.06 | | | $ | 15.68 | | | $ | 17.95 | | | $ | 18.89 | | | $ | 19.13 | |
| Total Return* | | | 32.51 | % | | | (2.62 | )% | | | 3.87 | % | | | 7.90 | % | | | 9.56 | % |
| Ratios and Supplemental Data: | | | | | | | | | | | | | | | | | | | | |
| Net assets, end of year/period (000s) | | $ | 75,701 | | | $ | 65,907 | | | $ | 80,048 | | | $ | 82,262 | | | $ | 73,602 | |
| Ratio of gross operating expenses (including dividend and interest expense) to average net assets (4) | | | 2.26 | % | | | 2.35 | % | | | 2.37 | % | | | 2.37 | % | | | 2.68 | % |
| Ratio of net operating expenses (including dividend and interest expense) to average net assets (5) | | | 2.26 | % | | | 2.35 | % | | | 2.37 | % | | | 2.37 | % | | | 2.61 | % |
| Ratio of net investment income (loss) (including dividend and interest expense) after expense reimbursement/recoupment to average net assets | | | (0.11 | )% | | | 0.42 | % | | | (0.25 | )% | | | 1.06 | % | | | 0.73 | % |
| Portfolio Turnover Rate | | | 160 | % | | | 187 | % | | | 172 | % | | | 204 | % | | | 141 | % |
| |
| (1) Per share amounts calculated using the average shares method, which more appropriately presents the per share data for the period. |
| |
| (2) Ratio of gross expenses to average net assets (excluding dividend and interest expenses) for the Easterly Global Real Estate Fund - Class A: |
| | | | | | | | | | | | | | | | | | | | | |
| | | | 1.51 | % | | | 1.60 | % | | | 1.60 | % | | | 1.62 | % | | | 1.93 | % |
| |
| (3) Ratio of net operating expenses to average net assets (excluding dividend and interest expenses) for the Easterly Global Real Estate Fund - Class A: |
| | | | | | | | | | | | | | | | | | | | | |
| | | | 1.51 | % | | | 1.60 | % | | | 1.60 | % | | | 1.62 | % | | | 1.92 | % |
| |
| (4) Ratio of gross expenses to average net assets (excluding dividend and interest expenses) for the Easterly Global Real Estate Fund - Class C: |
| | | | | | | | | | | | | | | | | | | | | |
| | | | 2.26 | % | | | 2.35 | % | | | 2.37 | % | | | 2.37 | % | | | 2.68 | % |
| |
| (5) Ratio of net operating expenses to average net assets (excluding dividend and interest expenses) for the Easterly Global Real Estate Fund - Class C: |
| | | | | | | | | | | | | | | | | | | | | |
| | | | 2.26 | % | | | 2.35 | % | | | 2.37 | % | | | 2.37 | % | | | 2.61 | % |
| * | Assumes reinvestment of all dividends and distributions and does not assume the effects of any sales charges. Aggregate (not annualized) total return is shown for any period shorter than one year. Total return does not reflect the deduction of taxes that a shareholder would pay on distributions or on the redemption of shares. |
| ** | Per share amount represents less than $0.01 per share. |
| FINANCIAL HIGHLIGHTS (For a share outstanding throughout each year/period) |
| Easterly Global Real Estate Fund |
| | | CLASS I |
| | | | | | | | | | | | | | | | |
| | | Year Ended | | | Year Ended | | | Year Ended | | | Year Ended | | | Year Ended | |
| | | August 31, | | | August 31, | | | August 31, | | | August 31, | | | August 31, | |
| | | 2021 | | | 2020 | | | 2019 | | | 2018 | | | 2017 | |
| Net Asset Value, Beginning of Year/Period | | $ | 16.19 | | | $ | 18.42 | | | $ | 19.29 | | | $ | 19.46 | | | $ | 19.42 | |
| Income (Loss) from Investment Operations: | | | | | | | | | | | | | | | | | | | | |
| Net investment income (1) | | | 0.18 | | | | 0.28 | | | | 0.17 | | | | 0.41 | | | | 0.34 | |
| Net realized and unrealized gain (loss) | | | 5.08 | | | | (0.54 | ) | | | 0.66 | | | | 1.27 | | | | 1.58 | |
| Total from investment operations | | | 5.26 | | | | (0.26 | ) | | | 0.83 | | | | 1.68 | | | | 1.92 | |
| Dividends and Distributions: | | | | | | | | | | | | | | | | | | | | |
| Dividends from net investment income | | | (0.31 | ) | | | (0.32 | ) | | | (0.68 | ) | | | (0.74 | ) | | | (0.33 | ) |
| Distributions from realized gains | | | (1.30 | ) | | | (1.65 | ) | | | (1.02 | ) | | | (1.11 | ) | | | (1.55 | ) |
| Total dividends and distributions | | | (1.61 | ) | | | (1.97 | ) | | | (1.70 | ) | | | (1.85 | ) | | | (1.88 | ) |
| Redemption Fees | | | — | | | | — | | | | — | | | | — | | | | 0.00 | ** |
| Net Asset Value, End of Year/Period | | $ | 19.84 | | | $ | 16.19 | | | $ | 18.42 | | | $ | 19.29 | | | $ | 19.46 | |
| Total Return* | | | 34.06 | % | | | (1.51 | )% | | | 5.06 | % | | | 9.22 | % | | | 10.82 | % |
| Ratios and Supplemental Data: | | | | | | | | | | | | | | | | | | | | |
| Net assets, end of year/period (000s) | | $ | 678,440 | | | $ | 544,432 | | | $ | 643,866 | | | $ | 591,437 | | | $ | 314,904 | |
| Ratio of gross operating expenses (including dividend and interest expense) to average net assets (2) | | | 1.26 | % | | | 1.35 | % | | | 1.33 | % | | | 1.37 | % | | | 1.68 | % |
| Ratio of net operating expenses (including dividend and interest expense) to average net assets (3) | | | 1.12 | % | | | 1.19 | % | | | 1.19 | % | | | 1.19 | % | | | 1.43 | % |
| Ratio of net investment income (including dividend and interest expense) after expense reimbursement/recoupment to average net assets | | | 1.02 | % | | | 1.68 | % | | | 0.93 | % | | | 2.13 | % | | | 1.79 | % |
| Portfolio Turnover Rate | | | 160 | % | | | 187 | % | | | 172 | % | | | 204 | % | | | 141 | % |
| | | | | | | | | | | | | | | | | | | | | |
| | | CLASS R6 | |
| | | | |
| | | | | | | | | | | | | | | For the Period | |
| | | | | | | | | | | | | | | August 17, | |
| | | Year Ended | | | Year Ended | | | Year Ended | | | Year Ended | | | 2017 (4) to | |
| | | August 31, | | | August 31, | | | August 31, | | | August 31, | | | August 31, | |
| | | 2021 | | | 2020 | | | 2019 | | | 2018 | | | 2017 | |
| Net Asset Value, Beginning of Year/Period | | $ | 16.35 | | | $ | 18.55 | | | $ | 19.35 | | | $ | 19.46 | | | $ | 19.30 | |
| Income (Loss) from Investment Operations: | | | | | | | | | | | | | | | | | | | | |
| Net investment income (loss) (1) | | | 0.22 | | | | 0.31 | | | | 0.22 | | | | 0.42 | | | | (0.36 | ) |
| Net realized and unrealized gain (loss) | | | 5.13 | | | | (0.54 | ) | | | 0.69 | | | | 1.32 | | | | 0.52 | |
| Total from investment operations | | | 5.35 | | | | (0.23 | ) | | | 0.91 | | | | 1.74 | | | | 0.16 | |
| Dividends and Distributions: | | | | | | | | | | | | | | | | | | | | |
| Dividends from net investment income | | | (0.31 | ) | | | (0.32 | ) | | | (0.69 | ) | | | (0.74 | ) | | | — | |
| Distributions from realized gains | | | (1.30 | ) | | | (1.65 | ) | | | (1.02 | ) | | | (1.11 | ) | | | — | |
| Total dividends and distributions | | | (1.61 | ) | | | (1.97 | ) | | | (1.71 | ) | | | (1.85 | ) | | | — | |
| Redemption Fees | | | — | | | | — | | | | — | | | | 0.00 | ** | | | 0.00 | ** |
| Net Asset Value, End of Year/Period | | $ | 20.09 | | | $ | 16.35 | | | $ | 18.55 | | | $ | 19.35 | | | $ | 19.46 | |
| Total Return* | | | 34.29 | % | | | (1.32 | )% | | | 5.44 | % | | | 9.54 | % | | | 0.83 | % |
| Ratios and Supplemental Data: | | | | | | | | | | | | | | | | | | | | |
| Net assets, end of year/period (000s) | | $ | 32,039 | | | $ | 31,355 | | | $ | 12,238 | | | $ | 21,284 | | | $ | 285 | |
| Ratio of gross operating expenses (including dividend and interest expense) to average net assets (5) | | | 1.26 | % | | | 1.36 | % | | | 1.33 | % | | | 1.37 | % | | | 1.68 | % (7) |
| Ratio of net operating expenses (including dividend and interest expense) to average net assets (6) | | | 0.97 | % | | | 1.00 | % | | | 0.88 | % | | | 0.90 | % | | | 1.19 | % (7) |
| Ratio of net investment income (including dividend and interest expense) after expense reimbursement/recoupment to average net assets | | | 1.18 | % | | | 1.86 | % | | | 1.20 | % | | | 2.23 | % | | | 1.79 | % (7) |
| Portfolio Turnover Rate | | | 160 | % | | | 187 | % | | | 172 | % | | | 204 | % | | | 141 | % (8) |
| |
| (1) Per share amounts calculated using the average shares method, which more appropriately presents the per share data for the period. |
| |
| (2) Ratio of gross expenses to average net assets (excluding dividend and interest expenses) for the Easterly Global Real Estate Fund - Class I: |
| | | | | | | | | | | | | | | | | | | | | |
| | | | 1.26 | % | | | 1.35 | % | | | 1.33 | % | | | 1.37 | % | | | 1.68 | % (7) |
| |
| (3) Ratio of net operating expenses to average net assets (excluding dividend and interest expenses) for the Easterly Global Real Estate Fund - Class I: |
| | | | | | | | | | | | | | | | | | | | | |
| | | | 1.12 | % | | | 1.19 | % | | | 1.19 | % | | | 1.19 | % | | | 1.43 | % (7) |
| |
| (4) Commencement of offering. |
| |
| (5) Ratio of gross expenses to average net assets (excluding dividend and interest expenses) for the Easterly Global Real Estate Fund - Class R6: |
| | | | | | | | | | | | | | | | | | | | | |
| | | | 1.26 | % | | | 1.36 | % | | | 1.33 | % | | | 1.37 | % | | | 1.68 | % (7) |
| |
| (6) Ratio of net operating expenses to average net assets (excluding dividend and interest expenses) for the Easterly Global Real Estate Fund - Class R6: |
| | | | | | | | | | | | | | | | | | | | | |
| | | | 0.97 | % | | | 1.00 | % | | | 0.88 | % | | | 0.90 | % | | | 1.19 | % (7) |
| |
| (7) Annualized for periods less than one year. |
| |
| (8) Not annualized. |
| * | Assumes reinvestment of all dividends and distributions and does not assume the effects of any sales charges. Aggregate (not annualized) total return is shown for any period shorter than one year. Total return does not reflect the deduction of taxes that a shareholder would pay on distributions or on the redemption of shares. |
| ** | Per share amount represents less than $0.01 per share. |
| FINANCIAL HIGHLIGHTS (For a share outstanding throughout each year/period) |
| Easterly Multi Strategy Alternative Income Fund |
| | | CLASS A |
| | | | | | | | | | | | | | | | |
| | | Year Ended | | | Year Ended | | | Year Ended | | | Year Ended | | | Year Ended | |
| | | August 31, | | | August 31, | | | August 31, | | | August 31, | | | August 31, | |
| | | 2021 | | | 2020 | | | 2019 | | | 2018 | | | 2017 | |
| Net Asset Value, Beginning of Year/Period | | $ | 9.40 | | | $ | 9.07 | | | $ | 9.59 | | | $ | 8.85 | | | $ | 9.07 | |
| Income (Loss) from Investment Operations: | | | | | | | | | | | | | | | | | | | | |
| Net investment income (loss) (1) | | | 0.43 | | | | 0.01 | | | | 0.03 | | | | (0.01 | ) | | | (0.02 | ) |
| Net realized and unrealized gain (loss) | | | 0.91 | | | | 0.57 | | | | (0.22 | ) | | | 1.10 | | | | 0.16 | |
| Total from investment operations | | | 1.34 | | | | 0.58 | | | | (0.19 | ) | | | 1.09 | | | | 0.14 | |
| Dividends and Distributions: | | | | | | | | | | | | | | | | | | | | |
| Dividends from net investment income | | | (0.19 | ) | | | (0.25 | ) | | | (0.18 | ) | | | — | | | | — | |
| Distributions from realized gains | | | (0.68 | ) | | | — | | | | — | | | | — | | | | (0.20 | ) |
| Distributions from return of capital | | | — | | | | — | | | | (0.15 | ) | | | (0.35 | ) | | | (0.16 | ) |
| Total dividends and distributions | | | (0.87 | ) | | | (0.25 | ) | | | (0.33 | ) | | | (0.35 | ) | | | (0.36 | ) |
| Net Asset Value, End of Year/Period | | $ | 9.87 | | | $ | 9.40 | | | $ | 9.07 | | | $ | 9.59 | | | $ | 8.85 | |
| Total Return* | | | 14.90 | % | | | 6.66 | % | | | (1.92 | )% | | | 12.62 | % | | | 1.53 | % |
| Ratios and Supplemental Data: | | | | | | | | | | | | | | | | | | | | |
| Net assets, end of year/period (000s) | | $ | 488 | | | $ | 4 | | | $ | 69 | | | $ | 78 | | | $ | 99 | |
| Ratio of gross operating expenses (including dividend and interest expense) to average net assets (2) | | | 4.55 | % | | | 4.75 | % | | | 4.78 | % | | | 4.35 | % | | | 4.03 | % |
| Ratio of net operating expenses (including dividend and interest expense) to average net assets (3) | | | 3.46 | % | | | 3.22 | % | | | 3.39 | % | | | 3.63 | % | | | 3.51 | % |
| Ratio of net investment income (loss) (including dividend and interest expense) after expense reimbursement/recoupment to average net assets | | | 4.26 | % | | | 0.25 | % | | | 0.28 | % | | | (0.13 | )% | | | (0.25 | )% |
| Portfolio Turnover Rate | | | 229 | % | | | 185 | % | | | 414 | % | | | 183 | % | | | 118 | % |
| | | | | | | | | | | | | | | | | | | | | |
| | | CLASS C | |
| | | | | | | | | | | | | | | | |
| | | Year Ended | | | Year Ended | | | Year Ended | | | Year Ended | | | Year Ended | |
| | | August 31, | | | August 31, | | | August 31, | | | August 31, | | | August 31, | |
| | | 2021 | | | 2020 | | | 2019 | | | 2018 | | | 2017 | |
| Net Asset Value, Beginning of Year/Period | | $ | 9.21 | | | $ | 8.90 | | | $ | 9.42 | | | $ | 8.69 | | | $ | 8.96 | |
| Income (Loss) from Investment Operations: | | | | | | | | | | | | | | | | | | | | |
| Net investment loss (1) | | | (0.02 | ) | | | (0.06 | ) | | | (0.04 | ) | | | (0.07 | ) | | | (0.09 | ) |
| Net realized and unrealized gain (loss) | | | 1.24 | | | | 0.57 | | | | (0.23 | ) | | | 1.08 | | | | 0.17 | |
| Total from investment operations | | | 1.22 | | | | 0.51 | | | | (0.27 | ) | | | 1.01 | | | | 0.08 | |
| Dividends and Distributions: | | | | | | | | | | | | | | | | | | | | |
| Dividends from net investment income | | | (0.14 | ) | | | (0.20 | ) | | | (0.14 | ) | | | — | | | | — | |
| Distributions from realized gains | | | (0.68 | ) | | | — | | | | — | | | | — | | | | (0.20 | ) |
| Distributions from return of capital | | | — | | | | — | | | | (0.11 | ) | | | (0.28 | ) | | | (0.15 | ) |
| Total dividends and distributions | | | (0.82 | ) | | | (0.20 | ) | | | (0.25 | ) | | | (0.28 | ) | | | (0.35 | ) |
| Net Asset Value, End of Year/Period | | $ | 9.61 | | | $ | 9.21 | | | $ | 8.90 | | | $ | 9.42 | | | $ | 8.69 | |
| Total Return* | | | 13.86 | % | | | 5.89 | % | | | (2.72 | )% | | | 11.88 | % | | | 0.79 | % |
| Ratios and Supplemental Data: | | | | | | | | | | | | | | | | | | | | |
| Net assets, end of year/period (000s) | | $ | 17 | | | $ | 69 | | | $ | 188 | | | $ | 270 | | | $ | 318 | |
| Ratio of gross operating expenses (including dividend and interest expense) to average net assets (4) | | | 5.30 | % | | | 5.50 | % | | | 5.53 | % | | | 5.11 | % | | | 4.79 | % |
| Ratio of net operating expenses (including dividend and interest expense) to average net assets (5) | | | 4.21 | % | | | 3.97 | % | | | 4.14 | % | | | 4.38 | % | | | 4.26 | % |
| Ratio of net investment loss (including dividend and interest expense) after expense reimbursement/recoupment to average net assets | | | (0.24 | )% | | | (0.61 | )% | | | (0.50 | )% | | | (0.84 | )% | | | (1.03 | )% |
| Portfolio Turnover Rate | | | 229 | % | | | 185 | % | | | 414 | % | | | 183 | % | | | 118 | % |
| |
| (1) Per share amounts calculated using the average shares method, which more appropriately presents the per share data for the period. |
| |
| (2) Ratio of gross expenses to average net assets (excluding dividend and interest expenses) for the Easterly Multi Strategy Alternative Fund - Class A: |
| | | | | | | | | | | | | | | | | | | | | |
| | | | 3.33 | % | | | 3.77 | % | | | 3.80 | % | | | 3.47 | % | | | 3.27 | % |
| |
| (3) Ratio of net operating expenses to average net assets (excluding dividend and interest expenses) for the Easterly Multi Strategy Alternative Fund - Class A: |
| | | | | | | | | | | | | | | | | | | | | |
| | | | 2.24 | % | | | 2.24 | % | | | 2.41 | % | | | 2.75 | % | | | 2.75 | % |
| |
| (4) Ratio of gross expenses to average net assets (excluding dividend and interest expenses) for the Easterly Multi Strategy Alternative Fund - Class C: |
| | | | | | | | | | | | | | | | | | | | | |
| | | | 4.08 | % | | | 4.52 | % | | | 4.53 | % | | | 4.23 | % | | | 4.03 | % |
| |
| (5) Ratio of net operating expenses to average net assets (excluding dividend and interest expenses) for the Easterly Multi Strategy Alternative Fund - Class C: |
| | | | | | | | | | | | | | | | | | | | | |
| | | | 2.99 | % | | | 2.99 | % | | | 3.17 | % | | | 3.50 | % | | | 3.50 | % |
| * | Assumes reinvestment of all dividends and distributions and does not assume the effects of any sales charges. Aggregate (not annualized) total return is shown for any period shorter than one year. Total return does not reflect the deduction of taxes that a shareholder would pay on distributions or on the redemption of shares. |
| ** | Per share amount represents less than $0.01 per share. |
| FINANCIAL HIGHLIGHTS (For a share outstanding throughout each year/period) |
| Easterly Multi Strategy Alternative Income Fund |
| | | CLASS I |
| | | | | | | | | | | | | | | | |
| | | Year Ended | | | Year Ended | | | Year Ended | | | Year Ended | | | Year Ended | |
| | | August 31, | | | August 31, | | | August 31, | | | August 31, | | | August 31, | |
| | | 2021 | | | 2020 | | | 2019 | | | 2018 | | | 2017 | |
| Net Asset Value, Beginning of Year/Period | | $ | 9.41 | | | $ | 9.10 | | | $ | 9.62 | | | $ | 8.88 | | | $ | 9.09 | |
| Income (Loss) from Investment Operations: | | | | | | | | | | | | | | | | | | | | |
| Net investment income (1) | | | 0.08 | | | | 0.03 | | | | 0.05 | | | | 0.01 | | | | — | |
| Net realized and unrealized gain (loss) | | | 1.28 | | | | 0.57 | | | | (0.22 | ) | | | 1.10 | | | | 0.16 | |
| Total from investment operations | | | 1.36 | | | | 0.60 | | | | (0.17 | ) | | | 1.11 | | | | 0.16 | |
| Dividends and Distributions: | | | | | | | | | | | | | | | | | | | | |
| Dividends from net investment income | | | (0.21 | ) | | | (0.29 | ) | | | (0.19 | ) | | | — | | | | (0.00 | ) ** |
| Distributions from realized gains | | | (0.68 | ) | | | — | | | | — | | | | — | | | | (0.20 | ) |
| Distributions from return of capital | | | — | | | | — | | | | (0.16 | ) | | | (0.37 | ) | | | (0.17 | ) |
| Total dividends and distributions | | | (0.89 | ) | | | (0.29 | ) | | | (0.35 | ) | | | (0.37 | ) | | | (0.37 | ) |
| Net Asset Value, End of Year/Period | | $ | 9.88 | | | $ | 9.41 | | | $ | 9.10 | | | $ | 9.62 | | | $ | 8.88 | |
| Total Return* | | | 15.14 | % | | | 6.90 | % | | | (1.66 | )% | | | 12.88 | % | | | 1.75 | % |
| Ratios and Supplemental Data: | | | | | | | | | | | | | | | | | | | | |
| Net assets, end of year/period (000s) | | $ | 13,018 | | | $ | 12,625 | | | $ | 11,815 | | | $ | 12,034 | | | $ | 13,380 | |
| Ratio of gross operating expenses (including dividend and interest expense) to average net assets (2) | | | 4.30 | % | | | 4.50 | % | | | 4.53 | % | | | 4.11 | % | | | 3.78 | % |
| Ratio of net operating expenses (including dividend and interest expense) to average net assets (3) | | | 3.21 | % | | | 2.97 | % | | | 3.14 | % | | | 3.38 | % | | | 3.26 | % |
| Ratio of net investment income (loss) (including dividend and interest expense) after expense reimbursement/recoupment to average net assets | | | 0.81 | % | | | 0.32 | % | | | 0.52 | % | | | 0.14 | % | | | (0.02 | )% |
| Portfolio Turnover Rate | | | 229 | % | | | 185 | % | | | 414 | % | | | 183 | % | | | 118 | % |
| | | | | | | | | | | | | | | | | | | | | |
| | | CLASS R6 | |
| | | | |
| | | | | | | | | | | | | | | For the Period | |
| | | | | | | | | | | | | | | August 17, | |
| | | Year Ended | | | Year Ended | | | Year Ended | | | Year Ended | | | 2017 (4) to | |
| | | August 31, | | | August 31, | | | August 31, | | | August 31, | | | August 31, | |
| | | 2021 | | | 2020 | | | 2019 | | | 2018 | | | 2017 | |
| Net Asset Value, Beginning of Year/Period | | $ | 9.54 | | | $ | 9.17 | | | $ | 9.67 | | | $ | 8.87 | | | $ | 8.73 | |
| Income (Loss) from Investment Operations: | | | | | | | | | | | | | | | | | | | | |
| Net investment income (loss) (1) | | | 0.12 | | | | 0.07 | | | | 0.07 | | | | 0.06 | | | | (0.01 | ) |
| Net realized and unrealized gain (loss) | | | 1.30 | | | | 0.59 | | | | (0.22 | ) | | | 1.11 | | | | 0.15 | |
| Total from investment operations | | | 1.42 | | | | 0.66 | | | | (0.15 | ) | | | 1.17 | | | | 0.14 | |
| Dividends and Distributions: | | | | | | | | | | | | | | | | | | | | |
| Dividends from net investment income | | | (0.21 | ) | | | (0.29 | ) | | | (0.19 | ) | | | — | | | | — | |
| Distributions from realized gains | | | (0.68 | ) | | | — | | | | — | | | | — | | | | — | |
| Distributions from return of capital | | | — | | | | — | | | | (0.16 | ) | | | (0.37 | ) | | | — | |
| Total dividends and distributions | | | (0.89 | ) | | | (0.29 | ) | | | (0.35 | ) | | | (0.37 | ) | | | — | |
| Net Asset Value, End of Year/Period | | $ | 10.07 | | | $ | 9.54 | | | $ | 9.17 | | | $ | 9.67 | | | $ | 8.87 | |
| Total Return* | | | 15.59 | % | | | 7.51 | % | | | (1.44 | )% | | | 13.59 | % | | | 1.60 | % |
| Ratios and Supplemental Data: | | | | | | | | | | | | | | | | | | | | |
| Net assets, end of year/period (000s) | | $ | 29 | | | $ | 734 | | | $ | 1,511 | | | $ | 3,206 | | | $ | 89 | |
| Ratio of gross operating expenses (including dividend and interest expense) to average net assets (5) | | | 4.30 | % | | | 4.50 | % | | | 4.45 | % | | | 4.34 | % | | | 3.78 | % (7) |
| Ratio of net operating expenses (including dividend and interest expense) to average net assets (6) | | | 2.71 | % | | | 2.47 | % | | | 2.87 | % | | | 3.08 | % | | | 3.26 | % (7) |
| Ratio of net investment income (loss) (including dividend and interest expense) after expense reimbursement/recoupment to average net assets | | | 1.26 | % | | | 0.87 | % | | | 0.75 | % | | | 0.66 | % | | | (0.02 | )% (7) |
| Portfolio Turnover Rate | | | 229 | % | | | 185 | % | | | 414 | % | | | 183 | % | | | 118 | % (8) |
| |
| (1) Per share amounts calculated using the average shares method, which more appropriately presents the per share data for the period. |
| |
| (2) Ratio of gross expenses to average net assets (excluding dividend and interest expenses) for the Easterly Multi Strategy Alternative Fund - Class I: |
| | | | | | | | | | | | | | | | | | | | | |
| | | | 3.08 | % | | | 3.52 | % | | | 3.55 | % | | | 3.23 | % | | | 3.02 | % (7) |
| |
| (3) Ratio of net operating expenses to average net assets (excluding dividend and interest expenses) for the Easterly Multi Strategy Alternative Fund - Class I: |
| | | | | | | | | | | | | | | | | | | | | |
| | | | 1.99 | % | | | 1.99 | % | | | 2.16 | % | | | 2.50 | % | | | 2.50 | % (7) |
| |
| (4) Commencement of offering. |
| |
| (5) Ratio of gross expenses to average net assets (excluding dividend and interest expenses) for the Easterly Multi Strategy Alternative Fund - Class R6: |
| | | | | | | | | | | | | | | | | | | | | |
| | | | 3.08 | % | | | 3.52 | % | | | 3.47 | % | | | 3.34 | % | | | 3.02 | % (7) |
| |
| (6) Ratio of net operating expenses to average net assets (excluding dividend and interest expenses) for the Easterly Multi Strategy Alternative Fund - Class R6: |
| | | | | | | | | | | | | | | | | | | | | |
| | | | 1.49 | % | | | 1.49 | % | | | 1.89 | % | | | 2.09 | % | | | 2.50 | % (7) |
| |
| (7) Annualized for periods less than one year. |
| |
| (8) Not annualized |
| * | Assumes reinvestment of all dividends and distributions and does not assume the effects of any sales charges. Aggregate (not annualized) total return is shown for any period shorter than one year. Total return does not reflect the deduction of taxes that a shareholder would pay on distributions or on the redemption of shares. |
| ** | Per share amount represents less than $0.01 per share. |
| FINANCIAL HIGHLIGHTS (For a share outstanding throughout each year/period) |
| Easterly Hedged Equity Fund |
| | | CLASS A | |
| | | | | | | | | | | | | | | | |
| | | Year Ended | | | Year Ended | | | Year Ended | | | Year Ended | | | Year Ended | |
| | | August 31, | | | August 31, | | | August 31, | | | August 31, | | | August 31, | |
| | | 2021 | | | 2020 | | | 2019 | | | 2018 | | | 2017 | |
| Net Asset Value, Beginning of Year/Period | | $ | 10.83 | | | $ | 10.42 | | | $ | 10.80 | | | $ | 10.33 | | | $ | 9.94 | |
| Income (Loss) from Investment Operations: | | | | | | | | | | | | | | | | | | | | |
| Net investment (loss) (1) | | | (0.08 | ) | | | (0.05 | ) | | | (0.13 | ) | | | (0.11 | ) | | | (0.08 | ) |
| Net realized and unrealized gain | | | 1.17 | | | | 0.72 | | | | 0.75 | | | | 0.81 | | | | 0.46 | |
| Total from investment operations | | | 1.09 | | | | 0.67 | | | | 0.62 | | | | 0.70 | | | | 0.38 | |
| Dividends and Distributions: | | | | | | | | | | | | | | | | | | | | |
| Dividends from net investment income | | | (0.74 | ) | | | — | | | | (0.31 | ) | | | (0.23 | ) | | | — | |
| Distributions from realized gains | | | — | | | | (0.26 | ) | | | (0.69 | ) | | | — | | | | — | |
| Total dividends and distributions | | | (0.74 | ) | | | (0.26 | ) | | | (1.00 | ) | | | (0.23 | ) | | | — | |
| Redemption Fees | | | — | | | | — | | | | — | | | | — | | | | 0.01 | |
| Net Asset Value, End of Year/Period | | $ | 11.18 | | | $ | 10.83 | | | $ | 10.42 | | | $ | 10.80 | | | $ | 10.33 | |
| Total Return* | | | 10.67 | % | | | 6.56 | % | | | 6.26 | % | | | 6.91 | % | | | 3.92 | % |
| Ratios and Supplemental Data: | | | | | | | | | | | | | | | | | | | | |
| Net assets, end of year/period (000s) | | $ | 1,899 | | | $ | 1,537 | | | $ | 519 | | | $ | 230 | | | $ | 373 | |
| Ratio of gross operating expenses (including dividend and interest expense) to average net assets (2) | | | 2.04 | % | | | 2.07 | % | | | 2.22 | % | | | 2.70 | % | | | 3.20 | % |
| Ratio of net operating expenses (including dividend and interest expense) to average net assets (3) | | | 2.04 | % | | | 2.01 | % | | | 2.20 | % | | | 2.76 | % | | | 2.67 | % |
| Ratio of net investment loss (including dividend and interest expense) after expense reimbursement/recoupment to average net assets | | | (0.73 | )% | | | (0.44 | )% | | | (1.28 | )% | | | (1.04 | )% | | | (0.81 | )% |
| Portfolio Turnover Rate | | | 44 | % | | | 173 | % | | | 245 | % | | | 84 | % | | | 11 | % |
| | | | | | | | | | | | | | | | | | | | | |
| | | CLASS C |
| | | | | | | | | | | | | | | | |
| | | Year Ended | | | Year Ended | | | Year Ended | | | Year Ended | | | Year Ended | |
| | | August 31, | | | August 31, | | | August 31, | | | August 31, | | | August 31, | |
| | | 2021 | | | 2020 | | | 2019 | | | 2018 | | | 2017 | |
| Net Asset Value, Beginning of Year/Period | | $ | 10.57 | | | $ | 10.28 | | | $ | 10.66 | | | $ | 10.21 | | | $ | 9.89 | |
| Income (Loss) from Investment Operations: | | | | | | | | | | | | | | | | | | | | |
| Net investment loss (1) | | | (0.14 | ) | | | (0.14 | ) | | | (0.18 | ) | | | (0.19 | ) | | | (0.15 | ) |
| Net realized and unrealized gain | | | 1.12 | | | | 0.69 | | | | 0.72 | | | | 0.81 | | | | 0.46 | |
| Total from investment operations | | | 0.98 | | | | 0.55 | | | | 0.54 | | | | 0.62 | | | | 0.31 | |
| Dividends and Distributions: | | | | | | | | | | | | | | | | | | | | |
| Dividends from net investment income | | | (0.65 | ) | | | — | | | | (0.23 | ) | | | (0.17 | ) | | | — | |
| Distributions from realized gains | | | — | | | | (0.26 | ) | | | (0.69 | ) | | | — | | | | — | |
| Total dividends and distributions | | | (0.65 | ) | | | (0.26 | ) | | | (0.92 | ) | | | (0.17 | ) | | | — | |
| Redemption Fees | | | — | | | | — | | | | — | | | | — | | | | 0.01 | |
| Net Asset Value, End of Year/Period | | $ | 10.90 | | | $ | 10.57 | | | $ | 10.28 | | | $ | 10.66 | | | $ | 10.21 | |
| Total Return* | | | 9.77 | % | | | 5.47 | % + | | | 5.51 | % + | | | 6.11 | % | | | 3.24 | % |
| Ratios and Supplemental Data: | | | | | | | | | | | | | | | | | | | | |
| Net assets, end of year/period (000s) | | $ | 746 | | | $ | 1,781 | | | $ | 524 | | | $ | 322 | | | $ | 307 | |
| Ratio of gross operating expenses (including dividend and interest expense) to average net assets (4) | | | 2.68 | % | | | 2.81 | % | | | 2.96 | % | | | 3.45 | % | | | 3.94 | % |
| Ratio of net operating expenses (including dividend and interest expense) to average net assets (5) | | | 2.68 | % | | | 2.94 | % | | | 2.96 | % | | | 3.51 | % | | | 3.42 | % |
| Ratio of net investment loss (including dividend and interest expense) after expense reimbursement/recoupment to average net assets | | | (1.31 | )% | | | (1.36 | )% | | | (1.74 | )% | | | (1.83 | )% | | | (1.52 | )% |
| Portfolio Turnover Rate | | | 44 | % | | | 173 | % | | | 245 | % | | | 84 | % | | | 11 | % |
| |
| (1) Per share amounts calculated using the average shares method, which more appropriately presents the per share data for the period. |
| |
| (2) Ratio of gross expenses to average net assets (excluding dividend and interest expenses) for the Easterly Hedged Equity Fund - Class A: |
| | | | | | | | | | | | | | | | | | | | | |
| | | | 1.99 | % | | | 2.05 | % | | | 2.19 | % | | | 2.39 | % | | | 2.98 | % |
| |
| (3) Ratio of net operating expenses to average net assets (excluding dividend and interest expenses) for the Easterly Hedged Equity Fund - Class A: |
| | | | | | | | | | | | | | | | | | | | | |
| | | | 1.99 | % | | | 1.99 | % | | | 2.17 | % | | | 2.45 | % | | | 2.45 | % |
| |
| (4) Ratio of gross expenses to average net assets (excluding dividend and interest expenses) for the Easterly Hedged Equity Fund - Class C: |
| | | | | | | | | | | | | | | | | | | | | |
| | | | 2.63 | % | | | 2.79 | % | | | 2.93 | % | | | 3.14 | % | | | 3.72 | % |
| |
| (5) Ratio of net operating expenses to average net assets (excluding dividend and interest expenses) for the Easterly Hedged Equity Fund - Class C: |
| | | | | | | | | | | | | | | | | | | | | |
| | | | 2.63 | % | | | 2.92 | % | | | 2.93 | % | | | 3.20 | % | | | 3.20 | % |
| + | Includes adjustments in accordance with accounting principles generally accepted in the United States and, consequently, the net asset value for financial reporting purposes and the returns based upon those net asset values may differ from the net asset values and returns for shareholder transactions. |
| * | Assumes reinvestment of all dividends and distributions and does not assume the effects of any sales charges. Aggregate (not annualized) total return is shown for any period shorter than one year. Total return does not reflect the deduction of taxes that a shareholder would pay on distributions or on the redemption of shares. |
| ** | Per share amount represents less than $0.01 per share. |
| FINANCIAL HIGHLIGHTS (For a share outstanding throughout each year/period) |
| Easterly Hedged Equity Fund |
| | | CLASS I | |
| | | | | | | | | | | | | | | | |
| | | Year Ended | | | Year Ended | | | Year Ended | | | Year Ended | | | Year Ended | |
| | | August 31, | | | August 31, | | | August 31, | | | August 31, | | | August 31, | |
| | | 2021 | | | 2020 | | | 2019 | | | 2018 | | | 2017 | |
| Net Asset Value, Beginning of Year/Period | | $ | 10.96 | | | $ | 10.53 | | | $ | 10.90 | | | $ | 10.41 | | | $ | 9.98 | |
| Income (Loss) from Investment Operations: | | | | | | | | | | | | | | | | | | | | |
| Net investment loss (1) | | | (0.06 | ) | | | (0.03 | ) | | | (0.10 | ) | | | (0.06 | ) | | | (0.04 | ) |
| Net realized and unrealized gain | | | 1.19 | | | | 0.72 | | | | 0.76 | | | | 0.82 | | | | 0.47 | |
| Total from investment operations | | | 1.13 | | | | 0.69 | | | | 0.66 | | | | 0.76 | | | | 0.43 | |
| Dividends and Distributions: | | | | | | | | | | | | | | | | | | | | |
| Dividends from net investment income | | | (0.76 | ) | | | — | | | | (0.34 | ) | | | (0.27 | ) | | | (0.01 | ) |
| Distributions from realized gains | | | — | | | | (0.26 | ) | | | (0.69 | ) | | | — | | | | — | |
| Total dividends and distributions | | | (0.76 | ) | | | (0.26 | ) | | | (1.03 | ) | | | (0.27 | ) | | | (0.01 | ) |
| Redemption Fees | | | — | | | | — | | | | — | | | | — | | | | 0.01 | |
| Net Asset Value, End of Year/Period | | $ | 11.33 | | | $ | 10.96 | | | $ | 10.53 | | | $ | 10.90 | | | $ | 10.41 | |
| Total Return* | | | 10.91 | % | | | 6.69 | % | | | 6.68 | % | | | 7.40 | % | | | 4.42 | % |
| Ratios and Supplemental Data: | | | | | | | | | | | | | | | | | | | | |
| Net assets, end of year/period (000s) | | $ | 33,478 | | | $ | 41,145 | | | $ | 19,673 | | | $ | 3,742 | | | $ | 4,705 | |
| Ratio of gross operating expenses (including dividend and interest expense) to average net assets (3) | | | 1.84 | % | | | 1.82 | % | | | 1.99 | % | | | 2.25 | % | | | 2.96 | % |
| Ratio of net operating expenses (including dividend and interest expense) to average net assets (4) | | | 1.84 | % | | | 1.81 | % | | | 1.86 | % | | | 2.30 | % | | | 2.21 | % |
| Ratio of net investment loss (including dividend and interest expense) after expense reimbursement/recoupment to average net assets | | | (0.51 | )% | | | (0.29 | )% | | | (0.93 | )% | | | (0.61 | )% | | | (0.37 | )% |
| Portfolio Turnover Rate | | | 44 | % | | | 173 | % | | | 245 | % | | | 84 | % | | | 11 | % |
| | | | | | | | | | | | | | | | | | | | | |
| | | CLASS R6 | |
| | | | |
| | | | | | | | | | | | | | | For the Period | |
| | | | | | | | | | | | | | | August 17, | |
| | | Year Ended | | | Year Ended | | | Year Ended | | | Year Ended | | | 2017 (4) to | |
| | | August 31, | | | August 31, | | | August 31, | | | August 31, | | | August 31, | |
| | | 2021 | | | 2020 | | | 2019 | | | 2018 | | | 2017 | |
| Net Asset Value, Beginning of Year/Period | | $ | 11.13 | | | $ | 10.64 | | | $ | 10.95 | | | $ | 10.38 | | | $ | 10.30 | |
| Income (Loss) from Investment Operations: | | | | | | | | | | | | | | | | | | | | |
| Net investment income (loss) (1) | | | (0.02 | ) | | | 0.02 | | | | — | | | | (0.01 | ) | | | (0.08 | ) |
| Net realized and unrealized gain | | | 1.23 | | | | 0.73 | | | | 0.72 | | | | 0.85 | | | | 0.16 | |
| Total from investment operations | | | 1.21 | | | | 0.75 | | | | 0.72 | | | | 0.84 | | | | 0.08 | |
| Dividends and Distributions: | | | | | | | | | | | | | | | | | | | | |
| Dividends from net investment income | | | (0.76 | ) | | | — | | | | (0.34 | ) | | | (0.27 | ) | | | — | |
| Distributions from realized gains | | | — | | | | (0.26 | ) | | | (0.69 | ) | | | — | | | | — | |
| Total dividends and distributions | | | (0.76 | ) | | | (0.26 | ) | | | (1.03 | ) | | | (0.27 | ) | | | — | |
| Redemption Fees | | | — | | | | — | | | | — | | | | 0.00 | ** | | | 0.00 | ** |
| Net Asset Value, End of Year/Period | | $ | 11.58 | | | $ | 11.13 | | | $ | 10.64 | | | $ | 10.95 | | | $ | 10.38 | |
| Total Return* | | | 11.49 | % | | | 7.19 | % | | | 7.23 | % | | | 8.21 | % | | | 0.78 | % |
| Ratios and Supplemental Data: | | | | | | | | | | | | | | | | | | | | |
| Net assets, end of year/period (000s) | | $ | 17,970 | | | $ | 9,702 | | | $ | 13,365 | | | $ | 21,023 | | | $ | 369 | |
| Ratio of gross operating expenses (including dividend and interest expense) to average net assets (5) | | | 1.84 | % | | | 1.81 | % | | | 1.94 | % | | | 2.22 | % | | | 2.96 | % (7) |
| Ratio of net operating expenses (including dividend and interest expense) to average net assets (6) | | | 1.38 | % | | | 1.36 | % | | | 1.33 | % | | | 1.62 | % | | | 2.21 | % (7) |
| Ratio of net investment income (loss) (including dividend and interest expense) after expense reimbursement/recoupment to average net assets | | | (0.20 | )% | | | 0.16 | % | | | (0.03 | )% | | | (0.13 | )% | | | (0.37 | )% (7) |
| Portfolio Turnover Rate | | | 44 | % | | | 173 | % | | | 245 | % | | | 84 | % | | | 11 | % (8) |
| |
| (1) Per share amounts calculated using the average shares method, which more appropriately presents the per share data for the period. |
| |
| (2) Ratio of gross expenses to average net assets (excluding dividend and interest expenses) for the Easterly Hedged Equity Fund - Class I: |
| | | | | | | | | | | | | | | | | | | | | |
| | | | 1.79 | % | | | 1.79 | % | | | 1.95 | % | | | 1.93 | % | | | 2.74 | % (7) |
| |
| (3) Ratio of net operating expenses to average net assets (excluding dividend and interest expenses) for the Easterly Hedged Equity Fund - Class I: |
| | | | | | | | | | | | | | | | | | | | | |
| | | | 1.79 | % | | | 1.79 | % | | | 1.82 | % | | | 1.99 | % | | | 1.99 | % (7) |
| |
| (4) Commencement of operations. |
| |
| (5) Ratio of gross expenses to average net assets (excluding dividend and interest expenses) for the Easterly Hedged Equity Fund - Class R6: |
| | | | | | | | | | | | | | | | | | | | | |
| | | | 1.79 | % | | | 1.78 | % | | | 1.90 | % | | | 1.89 | % | | | 2.74 | % (7) |
| |
| (6) Ratio of net operating expenses to average net assets (excluding dividend and interest expenses) for the Easterly Hedged Equity Fund - Class R6: |
| | | | | | | | | | | | | | | | | | | | | |
| | | | 1.33 | % | | | 1.34 | % | | | 1.30 | % | | | 1.29 | % | | | 1.99 | % (7) |
| |
| (7) Annualized for periods less than one year. |
| |
| (8) Not annualized |
| * | Assumes reinvestment of all dividends and distributions and does not assume the effects of any sales charges. Aggregate (not annualized) total return is shown for any period shorter than one year. Total return does not reflect the deduction of taxes that a shareholder would pay on distributions or on the redemption of shares. |
| ** | Per share amount represents less than $0.01 per share. |
| FINANCIAL HIGHLIGHTS (For a share outstanding throughout each year/period) |
| Easterly Hedged High Income Fund |
| | | CLASS A | |
| | | | |
| | | Year Ended | | | Year Ended | | | Year Ended | | | Year Ended | | | Year Ended | |
| | | August 31, | | | August 31, | | | August 31, | | | August 31, | | | August 31, | |
| | | 2021 | | | 2020 | | | 2019 | | | 2018 | | | 2017 | |
| Net Asset Value, Beginning of Year/Period | | $ | 8.72 | | | $ | 9.02 | | | $ | 9.25 | | | $ | 9.46 | | | $ | 9.10 | |
| Income (Loss) from Investment Operations: | | | | | | | | | | | | | | | | | | | | |
| Net investment income (1) | | | 0.21 | | | | 0.32 | | | | 0.32 | | | | 0.36 | | | | 0.43 | |
| Net realized and unrealized gain (loss) | | | 0.44 | | | | (0.24 | ) | | | (0.17 | ) | | | (0.19 | ) | | | 0.32 | |
| Total from investment operations | | | 0.65 | | | | 0.08 | | | | 0.15 | | | | 0.17 | | | | 0.75 | |
| Dividends and Distributions: | | | | | | | | | | | | | | | | | | | | |
| Dividends from net investment income | | | (0.25 | ) | | | (0.33 | ) | | | (0.32 | ) | | | (0.34 | ) | | | (0.39 | ) |
| Distributions from return of capital | | | (0.09 | ) | | | (0.05 | ) | | | (0.06 | ) | | | (0.04 | ) | | | — | |
| Total dividends and distributions | | | (0.34 | ) | | | (0.38 | ) | | | (0.38 | ) | | | (0.38 | ) | | | (0.39 | ) |
| Net Asset Value, End of Year/Period | | $ | 9.03 | | | $ | 8.72 | | | $ | 9.02 | | | $ | 9.25 | | | $ | 9.46 | |
| Total Return* | | | 7.56 | % | | | 0.97 | % | | | 1.63 | % | | | 1.84 | % | | | 8.43 | % |
| Ratios and Supplemental Data: | | | | | | | | | | | | | | | | | | | | |
| Net assets, end of year/period (000s) | | $ | 1,140 | | | $ | 1,595 | | | $ | 4,659 | | | $ | 2,931 | | | $ | 1,308 | |
| Ratio of gross operating expenses (including dividend and interest expense) to average net assets (2) | | | 3.72 | % | | | 3.10 | % | | | 3.11 | % | | | 2.76 | % | | | 3.12 | % |
| Ratio of net operating expenses (including dividend and interest expense) to average net assets (3) | | | 2.82 | % | | | 2.65 | % | | | 2.68 | % | | | 2.52 | % | | | 2.39 | % |
| Ratio of net investment income (including dividend and interest expense) after expense reimbursement/recoupment to average net assets | | | 2.38 | % | | | 3.57 | % | | | 3.50 | % | | | 3.85 | % | | | 4.68 | % |
| Portfolio Turnover Rate | | | 310 | % | | | 277 | % | | | 195 | % | | | 171 | % | | | 106 | % |
| | | | | | | | | | | | | | | | | | | | | |
| | | CLASS C | |
| | | | | | | | | | | | | | | | |
| | | Year Ended | | | Year Ended | | | Year Ended | | | Year Ended | | | Year Ended | |
| | | August 31, | | | August 31, | | | August 31, | | | August 31, | | | August 31, | |
| | | 2021 | | | 2020 | | | 2019 | | | 2018 | | | 2017 | |
| Net Asset Value, Beginning of Year/Period | | $ | 8.75 | | | $ | 9.04 | | | $ | 9.26 | | | $ | 9.45 | | | $ | 9.10 | |
| Income (Loss) from Investment Operations: | | | | | | | | | | | | | | | | | | | | |
| Net investment income (1) | | | 0.18 | | | | 0.24 | | | | 0.27 | | | | 0.30 | | | | 0.38 | |
| Net realized and unrealized gain (loss) | | | 0.43 | | | | (0.22 | ) | | | (0.18 | ) | | | (0.17 | ) | | | 0.32 | |
| Total from investment operations | | | 0.61 | | | | 0.02 | | | | 0.09 | | | | 0.13 | | | | 0.70 | |
| Dividends and Distributions: | | | | | | | | | | | | | | | | | | | | |
| Dividends from net investment income | | | (0.20 | ) | | | (0.27 | ) | | | (0.26 | ) | | | (0.29 | ) | | | (0.35 | ) |
| Distributions from return of capital | | | (0.07 | ) | | | (0.04 | ) | | | (0.05 | ) | | | (0.03 | ) | | | — | |
| Total dividends and distributions | | | (0.27 | ) | | | (0.31 | ) | | | (0.31 | ) | | | (0.32 | ) | | | (0.35 | ) |
| Net Asset Value, End of Year/Period | | $ | 9.09 | | | $ | 8.75 | | | $ | 9.04 | | | $ | 9.26 | | | $ | 9.45 | |
| Total Return* | | | 7.05 | % | | | 0.29 | % | | | 0.96 | % | | | 1.34 | % | | | 7.76 | % |
| Ratios and Supplemental Data: | | | | | | | | | | | | | | | | | | | | |
| Net assets, end of year/period (000s) | | $ | 218 | | | $ | 556 | | | $ | 948 | | | $ | 824 | | | $ | 717 | |
| Ratio of gross operating expenses (including dividend and interest expense) to average net assets (4) | | | 4.31 | % | | | 3.86 | % | | | 3.82 | % | | | 3.46 | % | | | 3.75 | % |
| Ratio of net operating expenses (including dividend and interest expense) to average net assets (5) | | | 3.41 | % | | | 3.25 | % | | | 3.28 | % | | | 3.10 | % | | | 2.99 | % |
| Ratio of net investment income (including dividend and interest expense) after expense reimbursement/recoupment to average net assets | | | 1.99 | % | | | 2.74 | % | | | 2.90 | % | | | 3.32 | % | | | 4.06 | % |
| Portfolio Turnover Rate | | | 310 | % | | | 277 | % | | | 195 | % | | | 171 | % | | | 106 | % |
| |
| (1) Per share amounts calculated using the average shares method, which more appropriately presents the per share data for the period. |
| |
| (2) Ratio of gross expenses to average net assets (excluding dividend and interest expenses) for the Easterly Hedged High Income Fund - Class A: |
| | | | | | | | | | | | | | | | | | | | | |
| | | | 3.29 | % | | | 2.84 | % | | | 2.81 | % | | | 2.64 | % | | | 2.39 | % |
| |
| (3) Ratio of net operating expenses to average net assets (excluding dividend and interest expenses) for the Easterly Hedged High Income Fund - Class A: |
| | | | | | | | | | | | | | | | | | | | | |
| | | | 2.39 | % | | | 2.39 | % | | | 2.39 | % | | | 2.39 | % | | | 2.39 | % |
| |
| (4) Ratio of gross expenses to average net assets (excluding dividend and interest expenses) for the Easterly Hedged High Income Fund - Class C: |
| | | | | | | | | | | | | | | | | | | | | |
| | | | 3.89 | % | | | 3.60 | % | | | 3.53 | % | | | 3.35 | % | | | 3.75 | % |
| |
| (5) Ratio of net operating expenses to average net assets (excluding dividend and interest expenses) for the Easterly Hedged High Income Fund - Class C: |
| | | | | | | | | | | | | | | | | | | | | |
| | | | 2.99 | % | | | 2.99 | % | | | 2.99 | % | | | 2.99 | % | | | 2.99 | % |
| * | Assumes reinvestment of all dividends and distributions and does not assume the effects of any sales charges. Aggregate (not annualized) total return is shown for any period shorter than one year. Total return does not reflect the deduction of taxes that a shareholder would pay on distributions or on the redemption of shares. |
| ** | Per share amount represents less than $0.01 per share. |
| FINANCIAL HIGHLIGHTS (For a share outstanding throughout each year/period) |
| Easterly Hedged High Income Fund |
| | | CLASS I | |
| | | | | | | | | | | | | | | | |
| | | Year Ended | | | Year Ended | | | Year Ended | | | Year Ended | | | Year Ended | |
| | | August 31, | | | August 31, | | | August 31, | | | August 31, | | | August 31, | |
| | | | 2021 | | | | 2020 | | | | 2019 | | | | 2018 | | | | 2017 | |
| Net Asset Value, Beginning of Year/Period | | $ | 8.79 | | | $ | 9.07 | | | $ | 9.27 | | | $ | 9.46 | | | $ | 9.10 | |
| Income (Loss) from Investment Operations: | | | | | | | | | | | | | | | | | | | | |
| Net investment income (1) | | | 0.28 | | | | 0.35 | | | | 0.37 | | | | 0.40 | | | | 0.47 | |
| Net realized and unrealized gain (loss) | | | 0.43 | | | | (0.23 | ) | | | (0.18 | ) | | | (0.18 | ) | | | 0.32 | |
| Total from investment operations | | | 0.71 | | | | 0.12 | | | | 0.19 | | | | 0.22 | | | | 0.79 | |
| Dividends and Distributions: | | | | | | | | | | | | | | | | | | | | |
| Dividends from net investment income | | | (0.27 | ) | | | (0.35 | ) | | | (0.33 | ) | | | (0.37 | ) | | | (0.43 | ) |
| Distributions from return of capital | | | (0.10 | ) | | | (0.05 | ) | | | (0.06 | ) | | | (0.04 | ) | | | — | |
| Total dividends and distributions | | | (0.37 | ) | | | (0.40 | ) | | | (0.39 | ) | | | (0.41 | ) | | | (0.43 | ) |
| Net Asset Value, End of Year/Period | | $ | 9.13 | | | $ | 8.79 | | | $ | 9.07 | | | $ | 9.27 | | | $ | 9.46 | |
| Total Return* | | | 8.12 | % | | | 1.45 | % | | | 2.36 | % + | | | 2.36 | %+ | | | 8.86 | %+ |
| Ratios and Supplemental Data: | | | | | | | | | | | | | | | | | | | | |
| Net assets, end of year/period (000s) | | $ | 5,890 | | | $ | 13,601 | | | $ | 24,647 | | | $ | 24,647 | | | $ | 16,820 | |
| Ratio of gross operating expenses (including dividend and interest expense) to average net assets (2) | | | 3.18 | % | | | 2.86 | % | | | 2.45 | % | | | 2.45 | % | | | 2.70 | % |
| Ratio of net operating expenses (including dividend and interest expense) to average net assets (3) | | | 2.28 | % | | | 2.11 | % | | | 2.04 | % | | | 2.04 | % | | | 1.99 | % |
| Ratio of net investment income (including dividend and interest expense) after expense reimbursement/recoupment to average net assets | | | 3.10 | % | | | 3.93 | % | | | 4.37 | % | | | 4.37 | % | | | 5.07 | % |
| Portfolio Turnover Rate | | | 310 | % | | | 277 | % | | | 171 | % | | | 171 | % | | | 106 | % |
| | | | | | | | | | | | | | | | | | | | | |
| | | CLASS R6 | |
| | | | | | | | | | | | | | | | |
| | | | | | | | | | | | | | | For the Period | |
| | | | | | | | | | | | | | | August 17, | |
| | | Year Ended | | | Year Ended | | | Year Ended | | | Year Ended | | | 2017 (4) to | |
| | | August 31, | | | August 31, | | | August 31, | | | August 31, | | | August 31, | |
| | | 2021 | | | 2020 | | | 2019 | | | 2018 | | | 2017 | |
| Net Asset Value, Beginning of Year/Period | | $ | 8.94 | | | $ | 9.17 | | | $ | 9.33 | | | $ | 9.47 | | | $ | 9.48 | |
| Income (Loss) from Investment Operations: | | | | | | | | | | | | | | | | | | | | |
| Net investment income (1) | | | 0.34 | | | | 0.39 | | | | 0.41 | | | | 0.46 | | | | 0.01 | |
| Net realized and unrealized gain (loss) | | | 0.42 | | | | (0.22 | ) | | | (0.18 | ) | | | (0.19 | ) | | | (0.02 | ) |
| Total from investment operations | | | 0.76 | | | | 0.17 | | | | 0.23 | | | | 0.27 | | | | (0.01 | ) |
| Dividends and Distributions: | | | | | | | | | | | | | | | | | | | | |
| Dividends from net investment income | | | (0.27 | ) | | | (0.34 | ) | | | (0.33 | ) | | | (0.37 | ) | | | — | |
| Distributions from return of capital | | | (0.10 | ) | | | (0.06 | ) | | | (0.06 | ) | | | (0.04 | ) | | | — | |
| Total dividends and distributions | | | (0.37 | ) | | | (0.40 | ) | | | (0.39 | ) | | | (0.41 | ) | | | — | |
| Redemption Fees | | | — | | | | — | | | | — | | | | — | | | | 0.00 | ** |
| Net Asset Value, End of Year/Period | | $ | 9.33 | | | $ | 8.94 | | | $ | 9.17 | | | $ | 9.33 | | | $ | 9.47 | |
| Total Return* | | | 8.55 | % | | | 1.99 | % | | | 2.63 | % | | | 2.89 | % | | | (0.11 | )% |
| Ratios and Supplemental Data: | | | | | | | | | | | | | | | | | | | | |
| Net assets, end of year/period (000s) | | $ | 564 | | | $ | 15,584 | | | $ | 23,374 | | | $ | 39,016 | | | $ | 621 | |
| Ratio of gross operating expenses (including dividend and interest expense) to average net assets (5) | | | 3.18 | % | | | 2.85 | % | | | 2.78 | % | | | 2.50 | % | | | 2.70 | % (7) |
| Ratio of net operating expenses (including dividend and interest expense) to average net assets (6) | | | 1.82 | % | | | 1.64 | % | | | 1.68 | % | | | 1.51 | % | | | 1.99 | % (7) |
| Ratio of net investment income (including dividend and interest expense) after expense reimbursement/recoupment to average net assets | | | 3.63 | % | | | 4.34 | % | | | 4.48 | % | | | 4.74 | % | | | 5.07 | % (7) |
| Portfolio Turnover Rate | | | 310 | % | | | 277 | % | | | 195 | % | | | 171 | % | | | 106 | % (8) |
| |
| (1) Per share amounts calculated using the average shares method, which more appropriately presents the per share data for the period. |
| |
| (2) Ratio of gross expenses to average net assets (excluding dividend and interest expenses) for the Easterly Hedged High Income Fund - Class I: |
| | | | | | | | | | | | | | | | | | | | | |
| | | | 2.75 | % | | | 2.60 | % | | | 1.95 | % | | | 1.93 | % | | | 2.74 | % (7) |
| |
| (3) Ratio of net operating expenses to average net assets (excluding dividend and interest expenses) for the Easterly Hedged High Income Fund - Class I: |
| | | | | | | | | | | | | | | | | | | | | |
| | | | 1.85 | % | | | 1.85 | % | | | 1.82 | % | | | 1.99 | % | | | 1.99 | % (7) |
| |
| (4) Commencement of offering. |
| |
| (5) Ratio of gross expenses to average net assets (excluding dividend and interest expenses) for the Easterly Hedged High Income Fund - Class R6: |
| | | | | | | | | | | | | | | | | | | | | |
| | | | 2.75 | % | | | 2.60 | % | | | 2.49 | % | | | 2.35 | % | | | 2.70 | % (7) |
| |
| (6) Ratio of net operating expenses to average net assets (excluding dividend and interest expenses) for the Easterly Hedged High Income Fund - Class R6: |
| | | | | | | | | | | | | | | | | | | | | |
| | | | 1.39 | % | | | 1.39 | % | | | 1.39 | % | | | 1.35 | % | | | 1.99 | % (7) |
| |
| (7) Annualized for periods less than one year. |
| |
| (8) Not annualized |
| + | Includes adjustments in accordance with accounting principles generally accepted in the United States and, consequently, the net asset value for financial reporting purposes and the returns based upon those net asset values may differ from the net asset values and returns for shareholder transactions. |
| * | Assumes reinvestment of all dividends and distributions and does not assume the effects of any sales charges. Aggregate (not annualized) total return is shown for any period shorter than one year. Total return does not reflect the deduction of taxes that a shareholder would pay on distributions or on the redemption of shares. |
| ** | Per share amount represents less than $0.01 per share. |
CONSOLIDATED NOTES TO FINANCIAL STATEMENTS
Year Ended August 31, 2021
| 1. | ORGANIZATION AND SIGNIFICANT ACCOUNTING POLICIES |
James Alpha Fund Trust (the “Trust”) was organized in 2020, as a Delaware Statutory Trust and is registered under the Investment Company Act of 1940, as amended, as an open-end management investment company. The Trust currently consists of eight series. These financial statements include the following five series:
| New Fund Name Effective August 23, 2021 | Formerly Known As Prior to August 23, 2021 |
| Easterly Global Macro Fund | James Alpha Macro Fund |
| Easterly Global Real Estate Fund | James Alpha Global Real Estate Investments Fund |
| Easterly Multi Strategy Alternative Income Fund | James Alpha Multi Strategy Alternative Income Fund |
| Easterly Hedged Equity Fund | James Alpha Managed Risk Domestic Equity Fund |
| Easterly Hedged High Income Fund | James Alpha Hedged High Income Fund |
| |
Easterly Funds LLC serves as the Funds’ Advisor.
The following serve as Sub-Advisors (the “Sub-Advisors”) to their respective Fund(s):
| Fund | Sub-Advisor |
| Easterly Global Real Estate Fund | Ranger Global Real Estate Advisors, LLC |
| Easterly Multi Strategy Alternative Income Fund | Ranger Global Real Estate Advisors, LLC |
| | Bullseye Asset Management LLC |
| | Kellner Private Fund Management, LP |
| | Lazard Asset Management LLC |
| Easterly Hedged Equity Fund | EAB Investment Group, LLC |
| Easterly Hedged High Income Fund * | Lazard Asset Management LLC. |
| * | Prior to August 5, 2021 Concise Capital Management, LP and Amundi Asset Management US, Inc. served as sub-advisors to the Easterly Hedged High Income Fund. |
Ultimus Fund Solutions, LLC (the “Administrator”), serves the Trust as administrator, custody administrator, transfer agent and fund accounting agent. Ultimus Fund Distributors, LLC (“NLD” or the “Distributor”) is the Trust’s Distributor.
The Easterly Global Macro Fund, the Easterly Global Real Estate Fund, the Easterly Multi Strategy Alternative Income Fund, the Easterly Hedged Equity Fund and the Easterly Hedged High Income Fund are diversified Funds.
The James Alpha Global Macro Portfolio, the James Alpha Global Real Estate Investments Portfolio, the James Alpha Multi Strategy Alternative Income Portfolio, the James Alpha Managed Risk Domestic Equity Portfolio, and the James Alpha Hedged High Income Portfolio (each an “Existing Fund”) were reorganized on March 19, 2021, from a series of The Saratoga Advantage Trust, a Delaware statutory trust, to a series of the Trust, into the Easterly Global Macro Fund, Easterly Global Real Estate Fund, Easterly Multi Strategy Alternative Income Fund, the Easterly Hedged Equity Fund and the Easterly Hedged High Income Fund (each a “Survivor Fund”). As a series of the Trust, Class A, Class C, Class I and Class S of the Existing Funds converted to Class A, Class C, Class I and Class R6 of the Surviving Funds, respectively. Class A and Class C of the James Alpha Global Macro Portfolio converted to Class I of the Surviving Fund. Each Existing Fund and its corresponding Survivor Fund have the same investment objective, principal investment strategies. The details of this re-organization are shown below.
At the Close of Business on March 19, 2021
| | James Alpha Global Macro Fund | Easterly Global Macro Fund | NAVs |
| Net Assets Class A | 688,653 | — | |
| Net Assets Class C | 280,090 | — | |
| Net Assets Class I | 2,508,811 | 3,475,578 | 9.65 |
| Net Asset Class S/R6 | 3,074,959 | 3,074,959 | 9.75 |
| | | | |
| Shares Redeemed/ Received Class A | 71,823 | — | |
| Shares Redeemed/ Received Class C | 30,907 | — | |
| Shares Redeemed/ Received Class I | 259,965 | 360,150 | |
| Shares Redeemed/ Received Class S/R6 | 315,369 | 315,278 | |
| | James Alpha Global Real Estate
Portfolio | Easterly Global Real Estate
Fund | NAVs |
| Net Assets Class A | 98,594,394 | 98,594,394 | 17.94 |
| Net Assets Class C | 71,454,431 | 71,454,431 | 18.05 |
| Net Assets Class I | 598,977,506 | 598,977,506 | 18.75 |
| Net Asset Class S/R6 | 35,516,303 | 35,516,303 | 18.97 |
| | | | |
| Shares Redeemed/ Received Class A | 5,495,262 | 5,495,867 | |
| Shares Redeemed/ Received Class C | 3,957,955 | 3,957,691 | |
| Shares Redeemed/ Received Class I | 31,938,901 | 31,949,125 | |
| Shares Redeemed/ Received Class S/R6 | 1,872,178 | 1,872,501 | |
CONSOLIDATED NOTES TO FINANCIAL STATEMENTS
Year Ended August 31, 2021 (Continued)
| | James Alpha Multi Strategy
Alternative Income Portfolio | Easterly Multi Strategy
Alternative Income Fund | NAVs |
| Net Assets Class A | 3,894 | 3,894 | 9.57 |
| Net Assets Class C | 70,471 | 70,471 | 9.33 |
| Net Assets Class I | 13,261,926 | 13,261,926 | 9.58 |
| Net Asset Class S/R6 | 370,352 | 370,352 | 9.75 |
| | | | |
| Shares Redeemed/ Received Class A | 407 | 407 | |
| Shares Redeemed/ Received Class C | 7,556 | 7,556 | |
| Shares Redeemed/ Received Class I | 1,383,887 | 1,383,680 | |
| Shares Redeemed/ Received Class S/R6 | 37,973 | 37,973 | |
| | James Alpha Managed Risk
Domestic Equity Portfolio | Easterly Hedged Equity
Fund | NAVs |
| Net Assets Class A | 1,582,640 | 1,582,640 | 10.67 |
| Net Assets Class C | 951,173 | 951,173 | 10.44 |
| Net Assets Class I | 31,579,986 | 31,579,986 | 10.80 |
| Net Asset Class S/R6 | 7,860,069 | 7,860,069 | 11.02 |
| | | | |
| Shares Redeemed/ Received Class A | 148,295 | 148,295 | |
| Shares Redeemed/ Received Class C | 91,074 | 91,074 | |
| Shares Redeemed/ Received Class I | 2,922,835 | 3,054,198 | |
| Shares Redeemed/ Received Class S/R6 | 713,439 | 713,285 | |
| | James Alpha Hedged High
Income Portfolio | Easterly Hedged High
Income Fund | NAVs |
| Net Assets Class A | 1,212,919 | 1,212,919 | 9.15 |
| Net Assets Class C | 304,557 | 304,557 | 9.20 |
| Net Assets Class I | 9,463,898 | 9,463,898 | 9.24 |
| Net Asset Class S/R6 | 13,085,705 | 13,085,705 | 9.43 |
| | | | |
| Shares Redeemed/ Received Class A | 132,539 | 132,539 | |
| Shares Redeemed/ Received Class C | 33,104 | 33,104 | |
| Shares Redeemed/ Received Class I | 1,023,847 | 1,023,847 | |
| Shares Redeemed/ Received Class S/R6 | 1,387,914 | 1,387,757 | |
| Fund | Primary Objective |
| Easterly Global Macro | Attractive long-term risk-adjusted returns relative to traditional financial market indices |
| Easterly Global Real Estate | Total return through a combination of current income and capital appreciation |
| Easterly Multi Strategy Alternative Income | Long-term capital appreciation as its primary objective, with a secondary objective of providing income for its shareholders. |
| Easterly Hedged Equity | Capital appreciation |
| Easterly Hedged High Income | High current income as its primary investment objective and, as a secondary investment objective, seeks capital preservation, with the potential for capital appreciation. |
Currently, all Funds offer Class A, Class C, Class I shares and Class R6 shares with the exception of the Easterly Global Macro Fund which offers Class I and Class R6 Shares. Class A shares of Easterly Multi Strategy Alternative Income Fund and the Easterly Hedged High Income Fund are offered at net asset value plus a maximum sales load of 2.00%. Class A shares of the Easterly Global Real Estate Investments Fund and the Easterly Hedged Equity Fund are offered at net asset value plus a maximum sales load of 5.75%. Class C shares are offered subject to a CDSC of 1.00%. Class I and Class R6 shares are offered at net asset value. Each class represents an interest in the same assets of the applicable Fund, and the classes are identical except for differences in their sales charge structures, ongoing service and distribution charges. Class R6 shares are only available to certain qualified investors and the minimum initial investment will vary depending on the type of qualified investor. All classes of shares have equal voting privileges except that each class has exclusive voting rights with respect to its service and/or distribution plans.
The following is a summary of significant accounting policies followed by the Funds in preparation of its financial statements. These policies are in conformity with accounting principles generally accepted in the United States of America (“GAAP”). The preparation of financial statements in conformity with GAAP requires management to make estimates and assumptions that affect the reported amounts of assets and liabilities and disclosure of contingent assets and liabilities at the date of the financial statements and the reported amounts of increases and decreases in net assets from operations during the reporting period. Actual results could differ from those estimates. Each Fund is an investment company and accordingly follows the investment company accounting and reporting guidance of the Financial Accounting Standards Board (FASB) Accounting Standard Codification Topic 946 “Financial Services – Investment Companies” including FASB Accounting Standard Update ASU 2013-08.
(a) Valuation of Investments
Investment securities listed on a national securities exchange are valued at the last reported sale price on the valuation date. NASDAQ traded securities are valued at the NASDAQ Official Closing Price (NOCP). If there are no such reported sales, the securities are valued at the mean between current bid and ask. Debt securities
CONSOLIDATED NOTES TO FINANCIAL STATEMENTS
Year Ended August 31, 2021 (Continued)
(other than short-term obligations) are valued each day by an independent pricing service approved by the Board of Trustees using methods which include current market quotations from a major market maker in the securities and trader-reviewed “matrix” prices. Short-term debt securities having a remaining maturity of sixty days or less may be valued at amortized cost or amortized value, which approximates market value. U.S. Government Money Market values all of its securities on the basis of amortized cost, which approximates market value. Options listed on a securities exchange or board of trade for which market quotations are readily available shall be valued at the last quoted sales price or, in the absence of a sale, at the mean between the last bid and ask price. Options not listed on a securities exchange or board of trade for which over-the-counter market quotations are readily available shall be valued at the mean of the current bid and asked prices. Futures are valued based on their daily settlement value. Swap transactions are valued through an independent pricing service or at fair value based on daily price reporting from the swap counterparty issuing the swap. Total return swaps on securities listed on an exchange shall be valued at the last quoted sales price or, in the absence of a sale, at the mean between the current bid and ask prices. Any securities or other assets for which market quotations are not readily available are valued at their fair value as determined in good faith under procedures established by the Board of Trustees. There is no single standard for determining the fair value of such securities. Rather, in determining the fair value of a security, the board-appointed Fair Valuation Committee shall take into account the relevant factors and surrounding circumstances, a few of which may include: (i) the nature and pricing history (if any) of the security; (ii) whether any dealer quotations for the security are available; and (iii) possible valuation methodologies that could be used to determine the fair value of a security. The Easterly Global Real Estate Fund uses fair value prices as provided by an independent pricing vendor on a daily basis for those securities traded on a foreign exchange. Foreign currency and Forward currency exchange contracts are valued daily at the London close each day. The ability of issuers of debt securities held by the Funds to meet their obligations may be affected by economic or political developments in a specific state, industry or region. Investments in foreign countries may involve certain considerations and risks not typically associated with domestic investments, including, but not limited to, the possibility of future political and economic developments and the level of government supervision and regulation of foreign securities markets.
The Funds utilize various methods to measure the fair value of most of its investments on a recurring basis. GAAP establishes a hierarchy that prioritizes inputs to valuation methods. The three levels of input are:
Level 1 – Unadjusted quoted prices in active markets for identical assets and liabilities that the Funds have the ability to access.
Level 2 – Observable inputs other than quoted prices included in level 1 that are observable for the asset or liability, either directly or indirectly. These inputs may include quoted prices for the identical instrument on an inactive market, prices for similar instruments, interest rates, prepayment speeds, credit risk, yield curves, default rates and similar data.
Level 3 – Unobservable inputs for the asset or liability, to the extent relevant observable inputs are not available, representing the Funds’ own assumptions about the assumptions a market participant would use in valuing the asset or liability, and would be based on the best information available.
The availability of observable inputs can vary from security to security and is affected by a wide variety of factors, including, for example, the type of security, whether the security is new and not yet established in the marketplace, the liquidity of markets, and other characteristics particular to the security. To the extent that valuation is based on models or inputs that are less observable or unobservable in the market, the determination of fair value requires more judgment. Accordingly, the degree of judgment exercised in determining fair value is greatest for instruments categorized in Level 3.
The inputs used to measure fair value may fall into different levels of the fair value hierarchy. In such cases, for disclosure purposes, the level in the fair value hierarchy within which the fair value measurement falls in its entirety, is determined based on the lowest level input that is significant to the fair value measurement in its entirety.
The inputs or methodology used for valuing securities are not necessarily an indication of the risk associated with investing in those securities. The following tables summarize the inputs used as of August 31, 2021, for the Funds’ assets and liabilities measured at fair value:
| Easterly Global Macro Fund | | |
| | | | | | | | | | | | | |
| Assets* | | Level 1 | | | Level 2 | | | Level 3 | | | Total | |
| Exchange Traded Funds | | $ | 3,432,141 | | | $ | — | | | $ | — | | | $ | 3,432,141 | |
| Exchange Traded Notes | | | 2,742 | | | | — | | | | — | | | | 2,742 | |
| Open End Funds | | | 3,096,732 | | | | — | | | | — | | | | 3,096,732 | |
| Total | | $ | 6,531,615 | | | $ | — | | | $ | — | | | $ | 6,531,615 | |
| | | | | | | | | | | | | | | | | |
| Derivatives | | | | | | | | | | | | | | | | |
| Total Return Swaps | | $ | — | | | $ | 868,442 | | | $ | — | | | $ | 868,442 | |
| Forward Currency Contracts | | | — | | | | 5,405 | | | | — | | | | 5,405 | |
| | | | | | | | | | | | | | | | | |
| Easterly Global Real Estate Fund | | |
| | | | | | | | | | | | | | | | | |
| Assets* | | Level 1 | | | Level 2 | | | Level 3 | | | Total | |
| Common Stock | | $ | 578,255,009 | | | $ | 312,696,146 | | | $ | — | | | $ | 890,951,155 | |
| Total | | $ | 578,255,009 | | | $ | 312,696,146 | | | $ | — | | | $ | 890,951,155 | |
| Derivatives | | | | | | | | | | | | | | | | |
| Forward Currency Contracts | | | — | | | $ | 9,663 | | | | — | | | $ | 9,663 | |
CONSOLIDATED NOTES TO FINANCIAL STATEMENTS
Year Ended August 31, 2021 (Continued)
| Easterly Multi Strategy Alternative Income Fund | | |
| | | | | | | | | | | | | |
| Assets* | | Level 1 | | | Level 2 | | | Level 3 | | | Total | |
| Closed End Funds | | $ | 2,912,269 | | | $ | — | | | $ | — | | | $ | 2,912,269 | |
| Common Stock | | | 10,956,064 | | | | — | | | | — | | | | 10,956,064 | |
| Exchange Traded Funds | | | 571,511 | | | | — | | | | — | | | | 571,511 | |
| Total | | $ | 14,439,844 | | | $ | — | | | $ | — | | | $ | 14,439,844 | |
| Liabilities* | | | | | | | | | | | | | | | | |
| Securities Sold Short | | $ | (4,097,555 | ) | | $ | — | | | $ | (10,333 | ) | | | (4,107,888 | ) |
| Total | | $ | (4,097,555 | ) | | $ | — | | | $ | (10,333 | ) | | $ | (4,107,888 | ) |
| Derivatives | | | | | | | | | | | | | | | | |
| Forward Currency Contracts | | $ | — | | | $ | 35 | | | $ | — | | | $ | 35 | |
| Total | | $ | — | | | $ | 35 | | | $ | — | | | $ | 35 | |
| | | | | | | | | | | | | | | | | |
| Easterly Hedged Equity Fund | | |
| | | | | | | | | | | | | | | | | |
| Assets* | | Level 1 | | | Level 2 | | | Level 3 | | | Total | |
| Exchange Traded Funds | | $ | 49,220,040 | | | $ | — | | | $ | — | | | $ | 49,220,040 | |
| Call Options Purchased | | | — | | | | 77,000 | | | | — | | | | 77,000 | |
| Put Options Purchased | | | — | | | | 730,800 | | | | — | | | | 730,800 | |
| Total | | $ | 49,220,040 | | | $ | 807,800 | | | $ | — | | | $ | 50,027,840 | |
| Derivatives* - Assets | | | | | | | | | | | | | | | | |
| Total Return Swaps | | $ | — | | | $ | — | | | $ | — | | | $ | — | |
| Total | | $ | — | | | $ | — | | | $ | — | | | $ | — | |
| Derivatives* - Liabilities | | | | | | | | | | | | | | | | |
| Call Options Written | | $ | — | | | $ | (491,838 | ) | | $ | — | | | $ | (491,838 | ) |
| Put Options Written | | | — | | | | (268,125 | ) | | | — | | | | (268,125 | ) |
| Total | | $ | — | | | $ | (759,963 | ) | | $ | — | | | $ | (759,963 | ) |
| | | | | | | | | | | | | | | | | |
| Easterly Hedged High Income Fund | | |
| | | | | | | | | | | | | | | | | |
| Assets* | | Level 1 | | | Level 2 | | | Level 3 | | | Total | |
| Closed End Funds | | $ | 1,431,549 | | | $ | — | | | $ | — | | | $ | 1,431,549 | |
| Exchange Traded Fund | | | 66,764 | | | | — | | | | — | | | | 66,764 | |
| Total | | $ | 1,498,313 | | | $ | — | | | $ | — | | | $ | 1,498,313 | |
It is the Funds’ policy to recognize transfers into and out of Levels at the end of the reporting period.
| * | Refer to the Schedules of Investments for industry or category classifications. |
The following is a reconciliation for the Easterly Hedged High Income Fund for which Level 3 inputs were used in determining value:
| | | Beginning
balance August
31, 2020 | | | Total Realized
Gain/(Loss) | | | Change in
unrealized
appreciation | | | Conversion | | | Net Purchases | | | Net Sales | | | Net transfers
in/(out) of
Level 3 | | | Ending balance
August 31,
2021 | |
| Term Loans | | $ | 314,692 | | | $ | 6,568 | | | $ | 837 | | | $ | — | | | $ | — | | | $ | (322,097 | ) | | $ | — | | | $ | — | |
| Corporate Bonds | | | 324,624 | | | | (104,998 | ) | | | 465,055 | | | | — | | | | — | | | | (684,681 | ) | | | — | | | | — | |
| Convertible Bonds | | | 13 | | | | (221,711 | ) | | | 221,698 | | | | — | | | | — | | | | — | | | | — | | | | — | |
| Common Stock | | | 547,570 | | | | (522,434 | ) | | | 173,627 | | | | — | | | | 105,511 | | | | (304,274 | ) | | | — | | | | — | |
| Warrants | | | 1,999 | | | | (3,131 | ) | | | 1,132 | | | | — | | | | — | | | | — | | | | — | | | | — | |
The following is a reconciliation for the Easterly Multi Strategy Alternative Income Fund for which Level 3 inputs were used in determining value:
| | | Beginning
balance August
31, 2020 | | | Total Realized
Gain/(Loss) | | | Change in
unrealized
appreciation | | | Conversion | | | Net Purchases | | | Net Sales | | | Net transfers
in/(out) of
Level 3 | | | Ending balance
August 31,
2021 | |
| Common Stock | | $ | — | | | $ | — | | | $ | — | | | $ | — | | | $ | — | | | $ | — | | | $ | (10,333 | ) | | $ | (10,333 | ) |
Quantitative disclosures of unobservable inputs and assumptions used by Easterly Multi Strategy Alternative Income Fund are below:
| Common Stock | | Fair Value | | | Valuation Techniques | | Unobservable Input |
| Sinovac Biotech Ltd. | | $ | (10,333 | ) | | Last Price | | Discount for lack of marketability |
CONSOLIDATED NOTES TO FINANCIAL STATEMENTS
Year Ended August 31, 2021 (Continued)
Consolidation of Subsidiary – James Alpha Cayman Commodity Fund I Ltd. (JACC-SPC)
The Consolidated Schedule of Investments, Consolidated Statement of Assets and Liabilities, Consolidated Statement of Operations and Consolidated Statement of Changes in Net Assets and the Consolidated Financial Highlights of the Easterly Global Macro Fund includes the accounts of JACC-SPC, a wholly owned and controlled subsidiary. JACC-SPC is a closed-end fund incorporated as an exempted company under the company’s law of the Cayman Islands on February 2, 2011, and is a disregarded entity for tax purposes. All inter-company accounts and transactions have been eliminated in consolidation.
The Easterly Global Macro Fund may invest up to 25% of its total assets in the segregated portfolio company (“SPC”) which acts as an investment vehicle in order to effect certain investments consistent with the Fund’s investment objectives and policies.
A summary of the Easterly Global Macro Fund’s investments in the SPC is as follows:
| | | SPC Net Assets at | % of Fund Net Assets at August |
| | Inception Date of SPC | August 31, 2021 | 31, 2021 |
| James Alpha Cayman Commodity Fund I Ltd. | August 5, 2011 | $ 270,150 | 3.09% |
(b) Federal Income Tax
It is each Fund’s policy to continue to qualify as a regulated investment company by complying with the provisions of the Internal Revenue Code that are applicable to regulated investment companies and to distribute substantially all of its taxable income and net realized gains to shareholders. Therefore, no federal income tax provision is required.
Capital loss carry forwards, as of each Fund’s most recent tax year-ended August 31, 2021 (for the tax year ended December 31, 2020 for the Easterly Global Real Estate Fund), available to offset future capital gains, utilized capital gains, if any, are as follows:
| | | Short-Term | | | Long-Term | | | Capital Loss Carry Forward
Utilized | | | Total | |
| Easterly Global Macro Fund | | | 742,034 | | | | 1,106,761 | | | | 242,125 | | | | 1,848,795 | |
| Easterly Global Real Estate Fund | | | — | | | | — | | | | — | | | | — | |
| Easterly Multi Strategy Alternative Income Fund | | | — | | | | — | | | | — | | | | — | |
| Easterly Hedged Equity Fund | | | 1,457,549 | | | | 552,636 | | | | — | | | | 2,010,185 | |
| Easterly Hedged High Income Fund | | | — | | | | 2,392,621 | | | | — | | | | 2,392,621 | |
The Funds recognize the tax benefits of uncertain tax positions only when the position is “more likely than not” to be sustained assuming examination by tax authorities. Management has reviewed the tax positions taken on its 2018-2020 returns and expected to be taken in the Funds’ 2021 returns and concluded that no liability for unrecognized tax benefits should be recorded related to uncertain tax positions. The Funds identify its major tax jurisdictions as U.S. Federal, Arizona and foreign jurisdictions where the Funds make significant investments. The Funds recognize interest and penalties, if any, related to unrecognized tax benefits as income tax expense in the Statements of Operations. During the year ended August 31, 2021, the Funds did not incur any interest or penalties.
(c) Security Transactions and Other Income
Security transactions are reflected for financial reporting purposes as of the trade date. Dividend income is recognized on the ex-dividend date, and interest income is recognized on an accrual basis including premium amortized and discount accreted. All paydown gains and losses are classified as interest income in the accompanying Statements of Operations in accordance with U.S. GAAP. Discounts and premiums on securities purchased are accreted and amortized, over the lives of the respective securities with a corresponding increase/decrease in the cost basis of that security using the yield to maturity method, or where applicable, the first call date of the security. Realized gains or losses from sales of securities are determined by comparing the identified cost of the security lot sold with the net sales proceeds. Withholding taxes on foreign dividends have been provided for in accordance with the Trust’s understanding of the applicable country’s tax rules and rates.
(d) Dividends and Distributions
The following table summarizes each Fund’s intended dividend and capital gain declaration policy:
| Fund | | Income Dividends | | Capital Gains |
| Easterly Global Macro Fund | | Annually | | Annually |
| Easterly Global Real Estate Fund | | Quarterly | | Quarterly |
| Easterly Multi Strategy Alternative Income Fund | | Quarterly | | Annually |
| Easterly Hedged Equity Fund | | Annually | | Annually |
| Easterly Hedged High Income Fund | | Monthly | | Annually |
Each Fund records dividends and distributions to its shareholders on the ex-dividend date. The amount of dividends and distributions from net investment income and net realized gains are determined in accordance with federal income tax regulations, which may differ from GAAP. These “book-tax” differences are either permanent or temporary in nature. To the extent these differences are permanent in nature, such amounts are reclassified within the net asset accounts based on their federal tax-basis treatment; temporary differences do not require reclassification. To the extent dividends and distributions exceed current and accumulated earnings and profits for federal income tax purposes, they are reported as distributions of paid-in-surplus or tax return of capital. These reclassifications have no effect on net assets, results from operations or net asset value per share of each Fund.
CONSOLIDATED NOTES TO FINANCIAL STATEMENTS
Year Ended August 31, 2021 (Continued)
(e) Allocation of Expenses
Expenses of the Trust that are directly identifiable to a specific fund are charged to that fund. Expenses incurred by the Trust that do not relate to a specific Fund of the Trust are allocated to the individual Funds on an equal basis or another reasonable basis.
(f) Repurchase Agreements
In connection with transactions in repurchase agreements, it is the Trust’s policy that its custodian take possession of the underlying collateral securities, the fair value of which exceeds the principal amount of the repurchase transaction, including accrued interest, at all times. If the seller defaults, and the fair value of the collateral declines, realization of the collateral by the Trust may be delayed or limited.
(g) Indemnification
The Trust indemnifies its Officers and Trustees for certain liabilities that may arise from the performance of their duties to the Trust. Additionally, in the normal course of business, the Funds enter into contracts that contain a variety of representations and warranties and which provide general indemnities. The Funds’ maximum exposure under these arrangements is unknown, as this would involve future claims that may be made against the Funds that have not yet occurred. However, based on experience, the risk of loss due to these warranties and indemnities appears to be remote.
(h) Other
The preparation of the financial statements in accordance with accounting principles generally accepted in the United States of America requires management to make estimates and assumptions that affect the reported amounts and disclosures in the financial statements. Actual results could differ from those estimates.
Foreign currency. Investment securities and other assets and liabilities denominated in foreign currencies are translated into U.S. dollar amounts at the date of valuation. Purchases and sales of investment securities and income and expense items denominated in foreign currencies are translated into U.S. dollar amounts on the respective dates of such transactions. The Trust does not isolate that portion of the results of operations resulting from changes in foreign exchange rates on investments from the fluctuations arising from changes in market prices of securities held. Such fluctuations are included with the net realized and unrealized gain or loss from investments.
Reported net realized foreign exchange gains or losses arise from sales of foreign currencies, currency gains or losses realized between the trade and settlement dates on securities transactions, and the difference between the amounts of dividends, interest, and foreign withholding taxes recorded on the company’s books and the U.S. dollar equivalent of the amounts actually received or paid. Net unrealized foreign exchange gains and losses arise from changes in the fair values of assets and liabilities, other than investments in securities at fiscal period end, resulting from changes in exchange rates.
Market Disruptions Risk. The Funds are subject to investment and operational risks associated with financial, economic and other global market developments and disruptions, including the recent spread of an infectious respiratory illness caused by a novel strain of coronavirus (known as COVID-19), which can negatively impact the securities markets and cause the Funds to lose value.
The spread of COVID-19 has caused volatility, severe market dislocations and liquidity constraints in many markets, including markets for the securities the Funds hold, and may adversely affect the Funds’ investments and operations. The transmission of COVID-19 and efforts to contain its spread have resulted in travel restrictions and disruptions, closed international borders, enhanced health screenings at ports of entry and elsewhere, disruption of and delays in healthcare service preparation and delivery, quarantines, event and service cancellations or interruptions, disruptions to business operations and supply chains, and a reduction in consumer and business spending, as well as general concern and uncertainty that has negatively affected the economy. These disruptions have led to instability in the marketplace and the jobs market. The impact of COVID-19 could adversely affect the economies of many nations or the entire global economy, the financial well-being and performance of individual issuers, borrowers and sectors and the health of the markets generally in potentially significant and unforeseen ways.
The foregoing could lead to a significant economic downturn or recession, increased market volatility, a greater number of market closures, higher default rates and adverse effects on the values and liquidity of the Funds’ securities or other assets. Such impacts may adversely affect the performance of the Funds.
| 2. | MANAGEMENT FEE, ADMINISTRATION FEE AND OTHER TRANSACTIONS WITH AFFILIATES |
(a) Easterly Funds, LLC acts as investment manager for the Funds pursuant to the terms of a Management Agreement with the Trust, on behalf of the Funds (the “Management Agreement”). Under the terms of the Management Agreement, the Manager manages the investment operations of the Funds in accordance with each Fund’s respective investment policies and restrictions. Each investment sub-advisor is responsible for the day-to-day management of its Fund’s portfolios. Easterly Funds, LLC serves the Funds in a supervision capacity with responsibility to monitor the performance of the Funds’ outside service providers, assist in the review of financial statements and other regulatory filings and board meeting materials related to each Fund. The management fees are payable to Easterly Funds, LLC monthly by each Fund and are computed daily as shown in the table below. The Funds’ subadvisors are paid by the manager, not the Funds.
(b) Pursuant to an operating expense limitation agreement between Easterly Funds, LLC and the Funds, Easterly Funds, LLC has contractually agreed to waive all or a portion of its advisory fee and/or pay expenses of the Fund so that total annual Fund operating expenses (excluding front-end and contingent deferred sales loads, leverage, interest and tax expenses, dividends and interest on short positions, brokerage commissions, expenses incurred in connection with any merger, reorganization or liquidation, extraordinary or non-routine expenses and Acquired Fund Fees and Expenses) do not exceed the expense limitation shown in the table below, and is based on the Funds’ average daily net assets. This operating expense limitation agreement cannot be terminated during its term. Easterly Funds, LLC is permitted to seek reimbursement from the Fund, subject to limitations, for management fees waived and Fund expenses it paid within three (3) years of the end of the fiscal year in which such management fees were waived or expenses paid, as long as the reimbursement does not cause the Fund’s operating expenses to exceed (i) the expense cap in place at the time the fees were waived or the expenses were incurred; or (ii) the current expense cap, whichever is less. The expense limitation agreement will be in effect through March 19, 2023.
CONSOLIDATED NOTES TO FINANCIAL STATEMENTS
Year Ended August 31, 2021 (Continued)
| Fund | | Management
Agreement | | Cl A | | Cl C | | Expenses
Cl I | | Limitation
CL R6 | | Expires | | Management
Fee Waived/
Expenses Reimbursed
YTD 8/31/2021 | |
| Easterly Global Macro Fund | | 1.10% | | N/A | | N/A | | 1.48% | | 0.93% | | 3/19/2023 | | $ | 122,020 | |
| Easterly Global Real Estate Fund | | 0.90% | | 1.69% | | 2.37% | | 1.04% | | 0.94% | | 3/19/2023 | | | 951,023 | |
| Easterly Multi Strategy Alternative Income Fund | | 2.00% | | 2.23% | | 2.98% | | 1.98% | | 1.48% | | 3/19/2023 | | | 154,226 | |
| Easterly Hedged Equity Fund | | 1.20% | | 1.99% | | 3.00% | | 1.79% | | 1.34% | | 3/19/2023 | | | 44,773 | |
| Easterly Hedged High Income Fund | | 1.70% | | 2.38% | | 2.98% | | 1.84% | | 1.38% | | 3/19/2023 | | | 268,707 | |
Prior to March 19, 2021 the expense limitation was as follows:
| | Expenses Limitation |
| Fund | Cl A | Cl C | Cl I | CL R6 |
| Easterly Global Macro Fund | 1.74% | 2.49% | 1.49% | 0.94% |
| Easterly Global Real Estate Fund | 1.69% | 2.37% | 1.19% | 0.99% |
| Easterly Multi Strategy Alternative Income Fund | 2.24% | 2.99% | 1.99% | 1.49% |
| Easterly Hedged Equity Fund | 1.99% | 3.00% | 1.79% | 1.34% |
| Easterly Hedged High Income Fund | 2.39% | 2.99% | 1.85% | 1.39% |
The following table shows the available waived expenses and expiration date for each Fund subject to potential recovery.
| Fund | | 8/31/2022 | | | 8/31/2023 | | | 8/31/2024 | |
| Easterly Global Macro Fund | | $ | 99,260 | | | $ | 129,870 | | | $ | 122,020 | |
| Easterly Global Real Estate Fund | | | 808,019 | | | | 1,158,275 | | | | 951,023 | |
| Easterly Multi Strategy Alternative Income Fund | | | 176,432 | | | | 205,534 | | | | 154,226 | |
| Easterly Hedged Equity Fund | | | 117,016 | | | | 52,139 | | | | 44,773 | |
| Easterly Hedged High Income Fund | | | 270,139 | | | | 399,006 | | | | 268,707 | |
(c) Ultimus Fund Distributors, LLC (“UFD”) is the Trust’s Distributor. The Trust with respect to the Funds has adopted a Plan of Distribution pursuant to Rule 12b-1 under the 1940 Act (the “Plan”) with respect to the sale and distribution of Class A and C shares of the Funds. The Plan provides that the Funds will pay UFD and other entities, including a broker-dealer affiliate of the Adviser, are paid pursuant to the Plans provided and the expenses borne by the distributor and others in the distribution of Fund shares a fee, which is accrued daily and paid monthly, at the annual rate of 0.25% of the average daily net assets of Class A shares and 1.00% of the average daily net assets of each of the Funds’ Class C shares. The aggregate of such service fee payments will not exceed 0.25% of average daily net assets. Prior to March 19, 2021, Northern Lights Distributor, LLC (“NLD”) was the Funds’ Distributor.
For the year ended, August 31, 2021, NLD and UFD received sales charges on sales of the Funds’ Class A shares.
| | | Northern Lights Distributors, LLC | |
| | | Sales Charges | |
| Fund | | Class A | |
| Easterly Global Real Estate Fund | | $ | 179,417 | |
| Easterly Multi Strategy Alternative Income Fund | | | — | |
| Easterly Hedged Equity Fund | | | 11,304 | |
| Easterly Hedged High Income Fund | | | 2,864 | |
| | | | | |
| | | UFD Sales Charges | |
| Fund | | Class A | |
| Easterly Global Real Estate Fund | | $ | 886,836 | |
| Easterly Multi Strategy Alternative Income Fund | | | — | |
| Easterly Hedged Equity Fund | | | 246 | |
| Easterly Hedged High Income Fund | | | 606 | |
| | | | | |
| For the year ended August 31, 2021 CDSC fees were as follows. |
| | | | | |
| | | CDSC Fees | |
| Fund | | Class C | |
| Easterly Global Real Estate Fund | | $ | 1,630 | |
| Easterly Hedged High Income Fund | | | 78 | |
(d) Ultimus Fund Solutions, LLC (“UFS”), an affiliate of UFD provides administrative, fund accounting and transfer agency services to the Funds pursuant to agreements with the Trust, for which it receives from each Fund: (i) a minimum annual fee or basis points in decreasing amounts as assets reach certain breakpoints; and (ii) any related out-of-pocket expenses.
CONSOLIDATED NOTES TO FINANCIAL STATEMENTS
Year Ended August 31, 2021 (Continued)
Prior to March 19, 2021 Pursuant to the terms of the Trust’s Custody Administration Agreement with UFS (the “Custody Administration Agreement”), the Trust pays an asset-based fee in decreasing amounts as Trust assets reach certain breakpoints. The Trust also pays certain transaction fees and out-of-pocket expenses pursuant to the Custody Administration Agreement.
(e) Affiliated Investments — The Funds’ transactions with affiliates represent holdings for which the respective Fund and the underlying investee fund have the same investment advisor or where the investee fund’s investment advisor is under common control with the Fund’s investment advisor. Companies which are affiliates of the Funds at August 31, 2021, are noted in the Fund’s Schedule of Investments.
| Affiliated Holding | | Value at
8/31/2020 | | | Purchases | | | Sales | | | Realized Gain
(Loss) | | | Change in
Unrealized
Appreciation
(Depreciation) | | | Income | | | Value at
8/31/2021 | | | Shares at
8/31/2021 | |
| Easterly Global Macro Fund | | | | | | | | | | | | | | | | | | | | | | | | | | | | | | | | |
| Easterly Hedged Equity Fund, CL R6 | | | — | | | | 180,000 | | | | | | | | | | | | 3,999 | | | | | | | | 183,999 | | | | 15,889 | |
| Easterly Structured Credit Value Fund, Cl I | | | — | | | | 500,000 | | | | (500,452 | ) | | | 452 | | | | — | | | | — | | | | — | | | | — | |
| Easterly Structured Credit Value Fund, Cl R6 | | | 3,091,078 | | | | 1,946,311 | | | | (2,200,000 | ) | | | 151,173 | | | | (85,367 | ) | | | 180,157 | | | | 2,903,195 | | | | 259,678 | |
| Easterly Multi Strategy Alternative Income Fund | | | | | | | | | | | | | | | | | | | | | | | | | | | | | | | | |
| Easterly Structured Credit Value Fund, Cl R6 | | | 763,594 | | | | 5,070 | | | | (784,841 | ) | | | 66,010 | | | | (49,833 | ) | | | 32,382 | | | | — | | | | — | |
| Easterly Hedged High Income | | | | | | | | | | | | | | | | | | | | | | | | | | | | | | | | |
| Easterly Structured Credit Value Fund, Cl R6 | | | 3,066,873 | | | | 13,587 | | | | (3,155,659 | ) | | | 333,580 | | | | (258,381 | ) | | | 121,779 | | | | — | | | | — | |
In addition, certain affiliates of the Distributor provide services to the Trust as follows:
Northern Lights Compliance Services, LLC (“NLCS”) - NLCS, an affiliate of UFS and the Distributor, provides a Chief Compliance Officer to the Trust, as well as related compliance services, pursuant to a consulting agreement between NLCS and the Trust. Under the terms of such agreement, NLCS receives customary fees from the Funds.
Blu Giant, LLC (“Blu Giant”) – Blu Giant, an affiliate of UFS and the Distributor, provides EDGAR conversion and filing services as well as print management services for the Trust on an ad-hoc basis. For the provision of these services, Blu Giant receives customary fees from the Funds.
Certain employees of UFS and NLCS are also officers of the Trust, and are not paid any fees directly by the Trust for serving in such capacity.
| 3. | INVESTMENT TRANSACTIONS |
(a) For the year ended August 31, 2021, the cost of purchases and proceeds from sales of investment securities, other than short-term securities, for the Funds were as follows:
| Fund | | Purchases | | | Sales | |
| Easterly Global Macro Fund | | | 8,645,714 | | | | 9,845,337 | |
| Easterly Global Real Estate Fund | | | 1,244,520,107 | | | | 1,296,499,822 | |
| Easterly Multi Strategy Alternative Income Fund | | | 23,758,206 | | | | 25,402,193 | |
| Easterly Hedged Equity Fund | | | 18,301,759 | | | | 28,755,753 | |
| Easterly Hedged High Income Fund | | | 57,733,366 | | | | 84,897,609 | |
(b) Certain Funds may enter into options contracts. An option contract is a contract in which the writer of the option grants the buyer of the option the right to purchase from (call option), or sell to (put option), the writer a designated instrument at a specified price within a specified period of time. Certain options, including options on indices, will require cash settlement by the Fund if the option is exercised.
Premiums paid when put or call options are purchased by the Fund, represent investments, which are marked-to-market daily. When a purchase option expires, the Fund will realize a loss in the amount of the premium paid. When the Fund enters into a closing sales transaction, the Fund will realize a gain or loss depending on whether the proceeds from the closing sales transaction are greater or less than the premium paid for the option. When the Fund exercises a put option, it will realize a gain or loss from the sale of the underlying security and the proceeds from such sale will be decreased by the premium originally paid. When the Fund exercises a call option, the cost of the security, which the Fund purchases upon exercise, will be increased by the premium originally paid.
Certain Funds may write covered call options. This means that the Fund will own the security subject to the option or an option to purchase the same underlying security, having an exercise price equal to or less than the exercise price of the covered option, or will establish and maintain with its custodian for the term of the option, an account consisting of cash, U.S. government securities or other liquid securities having a value equal to the fluctuating market value of the securities on which the Fund holds a covered call position.
When a Fund writes a call option, an amount equal to the premium received by the Fund is recorded as a liability, the value of which is marked-to-market daily. When a written option expires, the Fund realizes a gain equal to the amount of the premium received. When the Fund enters into a closing purchase transaction, the Fund realizes a gain or loss depending upon whether the cost of the closing transaction is greater or less than the premium originally received, without regard to any unrealized gain or loss on the underlying security, and the liability related to such option is eliminated. When a written call option is exercised the proceeds of the security sold will be increased by the premium originally received.
The liability representing a Fund’s obligation under an exchange traded written option or investment in a purchased option is valued at the last sale price or, in the absence of a sale, the last available bid price.
CONSOLIDATED NOTES TO FINANCIAL STATEMENTS
Year Ended August 31, 2021 (Continued)
The Funds may enter into options for hedging purposes. The risk associated with purchasing options is limited to the premium originally paid. The risk in writing a covered call option is that the Fund gives up the opportunity to participate in any increase in the price of the underlying security beyond the exercise price.
(c) Certain Funds may enter into futures contracts. The Funds are subject to equity price risk in the normal course of pursuing their investment objective. To manage equity price risk, the Funds may enter into futures contracts. Upon entering into a futures contract with a broker, the Funds are required to deposit in a segregated account a specified amount of cash or U.S. government securities. Futures contracts are valued daily and unrealized gains or losses are recorded in a “variation margin” account. Periodically, the Funds receive from or pays to the broker a specified amount of cash based upon changes in the variation margin account. When a contract is closed, the Funds recognize a realized gain or loss. Futures contracts have market risks, including the risk that the change in the value of the contract may not correlate with changes in the value of the underlying securities. With futures contracts, there is minimal counterparty credit risk to the Funds since futures are exchange traded and the exchange’s clearinghouse, as counterparty to all exchange traded futures, guarantees the futures against default. Futures contracts outstanding at period end are listed after the Funds’ portfolio of investments.
(d) Certain Funds may enter into foreign currency exchange contracts. Because various Funds may invest in securities denominated in foreign currencies, they may seek to hedge foreign currency risks by engaging in foreign currency exchange transactions. These may include buying or selling foreign currencies on a spot basis, entering into foreign currency forward contracts, and buying and selling foreign currency options, foreign currency futures, and options on foreign currency futures. Currency exchange rates may fluctuate significantly over short periods and can be subject to unpredictable change based on such factors as political developments and currency controls by foreign governments.
(e) Swap Agreements – Certain funds are subject to equity price risk and/or interest rate risk in the normal course of pursuing their respective investment objectives. The Funds may enter into various swap transactions for investment purposes or to manage interest rate, equity, foreign exchange (currency), commodity or credit risk. These would be two-party contracts entered into primarily to exchange the returns (or differentials in rates of returns) earned or realized on particular pre-determined investments or instruments.
The gross returns to be exchanged or “swapped” between parties are calculated with respect to a notional amount, i.e., the return on or increase in value of a particular dollar amount invested at a particular interest rate, in a particular foreign currency, or in a “basket” of securities representing a particular index or market segment. Changes in the value of swap agreements are recognized as unrealized gains or losses in the Statements of Operations by “marking to market” on a daily basis to reflect the value of the swap agreement at the end of each trading day. Payments received or paid at the beginning of the agreement are reflected as such on the Statements of Assets and Liabilities and may be referred to as upfront payments. The Funds amortize upfront payments and/or accrue for the fixed payment stream on swap agreements on a daily basis with the net amount recorded as a component of unrealized gain or loss on the Statements of Operations. A liquidation payment received or made at the termination of the swap agreement is recorded as a realized gain or loss on the Statements of Operations. The Funds segregate liquid securities having a value at least equal to the amount of their current obligation under any swap transaction. Entering into these agreements involves, to varying degrees, lack of liquidity and elements of credit, market, and counterparty risk in excess of amounts recognized on the Statements of Assets and Liabilities. The Funds’ maximum risk of loss from counterparty credit risk is the discounted net value of the cash flows to be received from the counterparty over the contract’s remaining life, to the extent that that amount is positive.
(f) Short Sales – Certain funds may sell securities short. A short sale is a transaction in which the Fund sells a security it does not own or have the right to acquire (or that it owns but does not wish to deliver) in anticipation that the market price of that security will decline.
When the Fund makes a short sale, the broker-dealer through which the short sale is made must borrow the security sold short and deliver it to the party purchasing the security. The Fund is required to make a margin deposit in connection with such short sales; the Fund may have to pay a fee to borrow particular securities and will often be obligated to pay over any dividends and accrued interest on borrowed securities.
If the price of the security sold short increases between the time of the short sale and the time the Fund covers its short position, the Fund will incur a loss; conversely, if the price declines, the Fund will realize a capital gain. Any gain will be decreased, and any loss increased, by the transaction costs described above. The successful use of short selling may be adversely affected by imperfect correlation between movements in the price of the security sold short and the securities being hedged.
To the extent the Fund sells securities short, it will provide collateral to the broker-dealer and (except in the case of short sales “against the box”) will maintain additional asset coverage in the form of cash, U.S. government securities or other liquid securities with its custodian in a segregated account in an amount at least equal to the difference between the current market value of the securities sold short and any amounts required to be deposited as collateral with the selling broker (not including the proceeds of the short sale). A short sale is “against the box” to the extent the Fund contemporaneously owns, or has the right to obtain at no added cost, securities identical to those sold short.
(g) Other Investment Companies or Exchange Traded Funds – Certain Funds may invest up to 100% of their net assets in shares of affiliated and unaffiliated investment companies, including money market mutual funds, other mutual funds or exchange-traded funds (“ETFs”). An ETF generally is an open-end investment company, unit investment trust or a portfolio of securities deposited with a depository in exchange for depository receipts. ETFs provide investors the opportunity to buy or sell throughout the day an entire portfolio of securities in a single security. Although index mutual funds are similar to index-based ETFs, they are generally sold and redeemed only once per day at market close. The ETFs in which a Fund invests may be subject to liquidity risk. Liquidity risk exists when particular investments are difficult to purchase or sell, possibly preventing the sale of the security at an advantageous time or price. To the extent that the ETFs in which a Fund invests hold securities of companies with smaller market capitalizations or securities with substantial market risk, they will have a greater exposure to liquidity risk. In addition, ETFs are subject to the following risks that do not apply to conventional mutual funds that can be found in “Exchange-Traded Funds” below: (1) the market price of the ETF’s shares may trade at a discount to their net asset value; (2) an active trading market for an ETF’s shares may not develop or be maintained; or (3) trading of an ETF’s shares may be halted if the listing exchange deem such action appropriate, the shares are de-listed from the exchange, or the activation of market-wide “circuit breakers” (which are tied to large decreases in stock prices) halts stock trading generally. Additionally, ETFs have management fees, which increase their cost. In addition to the advisory and operational fees a Fund bears directly in connection with its own operation, the Fund also bears its pro rata portion of the advisory and operational expenses incurred indirectly through investments in other investment companies.
CONSOLIDATED NOTES TO FINANCIAL STATEMENTS
Year Ended August 31, 2021 (Continued)
The derivatives are not accounted for as hedging instruments under GAAP. The effect of derivative instruments on the Statements of Assets and Liabilities at August 31, 2021, were as follows:
| Fund | | Derivative | | Risk Type | | Location of derivatives on Statements
of Assets and Liabilities | | Fair value of asset/liability
derivatives | |
| Easterly Global Macro Fund | | | | |
| | | Forward Exchange Contracts | | Foreign Exchange | | Unrealized appreciation on forward currency contracts | | $ | 1,177,379 | |
| | | Forward Exchange Contracts | | Foreign Exchange | | Unrealized depreciation on forward currency exchange contracts | | | (1,171,974 | ) |
| | | Swap Contracts | | Equity | | Unrealized appreciation on swaps | | | 868,442 | |
| | | | | | | Totals | | $ | 873,847 | |
| | | | | | | | | | | |
| Easterly Global Real Estate Fund | | | | |
| | | Forward Exchange Contracts | | Foreign Exchange | | Unrealized appreciation on forward currency exchange contracts | | $ | 11,424,604 | |
| | | Forward Exchange Contracts | | Foreign Exchange | | Unrealized depreciation on forward currency exchange contracts | | $ | (11,414,941 | ) |
| | | | | | | Totals | | $ | 9,663 | |
| | | | | | | | | | | |
| Easterly Multi Strategy Alternative Income Fund | | | | |
| | | Forward Exchange Contracts | | Foreign Exchange | | Unrealized appreciation on forward currency contracts | | $ | 44,823 | |
| | | Forward Exchange Contracts | | Foreign Exchange | | Unrealized depreciation on forward currency exchange contracts | | $ | (44,788 | ) |
| | | | | | | Totals | | $ | 35 | |
| | | | | | | | | | | |
| Easterly Hedged Equity Fund | | | | |
| | | Call options purchased | | Equity | | Investments, at value | | $ | 77,000 | |
| | | Put options purchased | | Equity | | Investments, at value | | $ | 730,800 | |
| | | Call options written | | Equity | | Options written | | | (491,838 | ) |
| | | Put options written | | Equity | | Options written | | | (268,125 | ) |
| | | | | | | Totals | | $ | 47,837 | |
CONSOLIDATED NOTES TO FINANCIAL STATEMENTS
Year Ended August 31, 2021 (Continued)
The effect of derivative instruments on the Statements of Operations for the year ended August 31, 2021, were as follows:
| Fund | | Derivative | | Location of gain (loss) on derivatives | | Risk Type | | Realized and unrealized gain (loss)
on derivatives | |
| Easterly Global Macro Fund | | | | |
| | | Swaps Contracts | | | | |
| | | | | Net realized loss on swaps | | | | |
| | | | | | | Equity | | $ | (19,202 | ) |
| | | | | Net change in unrealized appreciation on swaps | | | | |
| | | | | | | Equity | | $ | 654,774 | |
| | | | | | | | | | | |
| | | Forward Currency Contracts | | | | |
| | | | | Net realized loss on Investments and foreign currency translations | | | | |
| | | | | | | Foreign Exchange | | $ | (11,204 | ) |
| | | | | Net change in unrealized appreciation on investments and foreign currency transactions | | | | |
| | | | | | | Foreign Exchange | | $ | 4,328 | |
| Easterly Global Real Estate Fund | | | | |
| | | Forward Currency Contracts | | | | |
| | | | | Net realized loss on Investments and foreign currency translations | | | | |
| | | | | | | Foreign Exchange | | $ | (263,421 | ) |
| | | | | Net change in unrealized appreciation on investments and foreign currency transactions | | | | |
| | | | | | | Foreign Exchange | | $ | 95,670 | |
| | | | | | | Totals | | $ | (167,751 | ) |
| Easterly Multi Strategy Alternative Income Fund | | | | |
| | | Options | | | | |
| | | | | Net realized loss on options purchased | | | | |
| | | | | | | Equity | | $ | (23,629 | ) |
| | | | | Net realized gain on options written | | | | |
| | | | | | | Equity | | | 354 | |
| | | | | | | Totals | | $ | (23,275 | ) |
| | | Forward Currency Contracts | | | | |
| | | | | Net realized loss from investments and foreign currency transactions | | | | |
| | | | | | | Foreign Exchange | | $ | (286 | ) |
| | | | | Net change in unrealized appreciation on investments and foreign currency transactions | | | | |
| | | | | | | Foreign Exchange | | $ | 2,166 | |
| Easterly Hedged Equity Fund | | | | |
| | | Options | | | | |
| | | | | Net realized loss on options purchased | | | | |
| | | | | | | Equity | | $ | (17,248,547 | ) |
| | | | | Net realized gain on options written | | | | |
| | | | | | | Equity | | | 6,756,643 | |
| | | | | | | Totals | | $ | (10,491,904 | ) |
| | | | | Net change in unrealized depreciation on options purchased | | | | |
| | | | | | | Equity | | | (622,519 | ) |
| | | | | Net change in unrealized appreciation on options written | | | | |
| | | | | | | Equity | | | 703,906 | |
| | | | | | | Totals | | $ | 81,387 | |
| | | Swaps | | | | |
| | | | | Net realized gain on swaps | | | | | | |
| | | | | | | Equity | | $ | 5,311,082 | |
| | | | | Net change in unrealized appreciation on swaps | | | | |
| | | | | | | Equity | | $ | — | |
| | | | | | | | | | | |
| | | | | | | Totals | | $ | 5,311,082 | |
| Easterly Hedged High Income Fund | | | | |
| | | Futures | | | | |
| | | | | Net realized gain from futures contracts | | | | |
| | | | | | | Interest Rate | | $ | 102,538 | |
| | | | | Net change in unrealized appreciation on futures contracts | | | | |
| | | | | | | Interest Rate | | $ | 14,918 | |
| | | Swaps | | | | |
| | | | | Net realized loss from swaps | | | | |
| | | | | | | Interest Rate | | $ | (537,911 | ) |
| | | | | Net change in unrealized appreciation on swaps | | | | |
| | | | | | | Interest Rate | | $ | 236,378 | |
| | | | | | | | | | | |
| | | Forward Contracts | | | | |
| | | | | Net realized loss from forward contracts | | | | |
| | | | | | | Foreign Exchange | | $ | (28,091 | ) |
| | | | | Net change in unrealized appreciation on forward contracts | | | | |
| | | | | | | Foreign Exchange | | $ | 4,753 | |
The amounts of realized and changes in unrealized gains and losses on derivative instruments during the period as disclosed in the Statements of Operations serve as indicators of the volume of derivative activity for the Funds.
CONSOLIDATED NOTES TO FINANCIAL STATEMENTS
Year Ended August 31, 2021 (Continued)
| 4. | AGGREGATE UNREALIZED APPRECIATION AND DEPRECIATION – TAX BASIS |
The identified cost of investments in securities owned by each Fund for federal income tax purposes, and its respective gross unrealized appreciation and depreciation at August 31, 2021, were as follows:
| | | | | | Gross | | | Gross | | | Net Unrealized | |
| | | Tax | | | Unrealized | | | Unrealized | | | Appreciation/ | |
| | | Cost | | | Appreciation | | | Depreciation | | | (Depreciation) | |
| Easterly Global Macro Fund | | | 6,374,152 | | | | 236,730 | | | | (73,862 | ) | | | 162,868 | |
| Easterly Global Real Estate Fund | | | 1,015,891,819 | | | | 18,791,755 | | | | (143,732,419 | ) | | | (124,940,664 | ) |
| Easterly Multi Strategy Alternative Income Fund | | | 9,964,157 | | | | 2,005,337 | | | | (1,637,538 | ) | | | 367,799 | |
| Easterly Hedged Equity Fund | | | 37,869,418 | | | | 11,496,692 | | | | (98,233 | ) | | | 11,398,459 | |
| Easterly Hedged High Income Fund | | | 1,491,407 | | | | 102,401 | | | | (95,495 | ) | | | 6,906 | |
| 5. | DISTRIBUTIONS TO SHAREHOLDERS AND TAX COMPONENTS OF CAPITAL |
The tax character of dividends paid during the periods ended August 31, 2021 and August 31, 2020 (for the period ended December 31, 2020 and December 31, 2019 for the Easterly Global Real Estate Fund) was as follows:
| For fiscal year ended | | Ordinary | | | Long-Term | | | Return of | | | | |
| 8/31/2021 | | Income | | | Capital Gains | | | Capital | | | Total | |
| Easterly Global Macro Fund | | | — | | | | — | | | | — | | | | — | |
| Easterly Global Real Estate Fund | | | 73,730,837 | | | | — | | | | — | | | | 73,730,837 | |
| Easterly Multi Strategy Alternative Income Fund | | | 299,447 | | | | 951,227 | | | | — | | | | 1,250,674 | |
| Easterly Hedged Equity Fund | | | 3,431,166 | | | | — | | | | — | | | | 3,431,166 | |
| Easterly Hedged High Income Fund | | | 787,864 | | | | — | | | | 121,174 | | | | 909,038 | |
| For fiscal year ended | | Ordinary | | | Long-Term | | | Return of | | | | |
| 8/31/2020 | | Income | | | Capital Gains | | | Capital | | | Total | |
| Easterly Global Macro Fund | | | 864,105 | | | | — | | | | 5,035 | | | | 869,140 | |
| Easterly Global Real Estate Fund | | | 98,979,566 | | | | — | | | | — | | | | 98,979,566 | |
| Easterly Multi Strategy Alternative Income Fund | | | 45,489 | | | | 376,771 | | | | — | | | | 422,260 | |
| Easterly Hedged Equity Fund | | | 1,016,443 | | | | 124,780 | | | | — | | | | 1,141,223 | |
| Easterly Hedged High Income Fund | | | 1,729,599 | | | | — | | | | 199,322 | | | | 1,928,921 | |
As of each of the Fund’s tax year-ended August 31, 2021 (except for the Easterly Global Real Estate Fund in which its December 31, 2020 components of distributable earnings have been adjusted for August 31, 2021 activity), the components of distributable earnings on a tax basis were as follows:
| | | Undistributed | | | Undistributed | | | Post October Loss | | | Capital Loss | | | Other | | | Unrealized | | | Total | |
| | | Ordinary | | | Long-Term | | | and | | | Carry | | | Book/Tax | | | Appreciation/ | | | Accumulated | |
| | | Income | | | Capital Gains | | | Late Year Loss | | | Forwards | | | Differences | | | (Depreciation) | | | Earnings/(Deficits) | |
| Easterly Global Macro Fund | | | 772,267 | | | | — | | | | — | | | | (1,848,795 | ) | | | (903,529 | ) | | | 162,872 | | | | (1,817,185 | ) |
| Easterly Global Real Estate Fund | | | 33,267,347 | | | | 161,379 | | | | — | | | | — | | | | — | | | | (124,938,781 | ) | | | (91,510,055 | ) |
| Easterly Multi Strategy Alternative Income Fund | | | 24,862 | | | | 786,004 | | | | — | | | | — | | | | — | | | | 369,503 | | | | 1,180,369 | |
| Easterly Hedged Equity Fund | | | 5,283,529 | | | | — | | | | (10,729,760 | ) | | | (2,010,185 | ) | | | (83 | ) | | | 11,398,459 | | | | 3,941,960 | |
| Easterly Hedged High Income Fund | | | — | | | | — | | | | (1,704,106 | ) | | | (2,392,621 | ) | | | — | | | | 6,906 | | | | (4,089,821 | ) |
The difference between book basis and tax basis unrealized appreciation (depreciation), undistributed net investment income and accumulated net realized gain from security transactions are primarily attributable to the tax deferral of losses on wash sales, adjustments for a wholly owned subsidiary, mark-to-market on open forward foreign currency contracts, swap contracts and passive foreign investment companies, adjustments for real estate investment trusts, partnerships and C-Corporations adjustments. The unrealized appreciation (depreciation) in the table above includes unrealized foreign currency gains of $4, $1,883 and $1,704 for Easterly Global Macro Fund, Easterly Global Real Estate Fund and Easterly Multi Strategy Alternative Income Fund, respectively.
Capital losses incurred after October 31 within the fiscal year are deemed to arise on the first business day of the following fiscal year for tax purposes. The Funds below incurred and elected to defer such capital losses as follows:
| | | Post October | |
| | | Losses | |
| Easterly Global Macro Fund | | | — | |
| Easterly Global Real Estate Fund | | | — | |
| Easterly Multi Strategy Alternative Income Fund | | | — | |
| Easterly Hedged Equity Fund | | | 10,729,760 | |
| Easterly Hedged High Income Fund | | | 1,704,106 | |
CONSOLIDATED NOTES TO FINANCIAL STATEMENTS
Year Ended August 31, 2021 (Continued)
| 6. | UNDERLYING INVESTMENTS IN OTHER INVESTMENT COMPANIES |
Each underlying fund, including each exchange-traded fund (“ETF”), is subject to specific risks, depending on the nature of the underlying fund. These risks could include liquidity risk, sector risk, foreign and related currency risk, as well as risks associated with real estate investments and commodities. Investors in the Fund will indirectly bear fees and expenses charged by the underlying investment companies in which the Fund invests in addition to the Fund’s direct fees and expenses.
The performance of the Easterly Global Macro Fund will be directly affected by the performance of the Easterly Structured Credit Value Fund. The Fund seeks to provide a high level of risk-adjusted current income and capital appreciation with a secondary objective of capital appreciation. The financial statements of the Easterly Structured Credit Value Fund, including the schedule of investments, can be found on the Securities and Exchange Commission’s (“SEC”) website www.sec.gov and should be read in conjunction with the Fund’s financial statements. As of August 31, 2021, the percentage of net assets invested in the Easterly Structured Credit Value Fund was 33.2%.
The performance of the Easterly Hedged Equity Fund will be directly affected by the performance of the SPDR S&P 500 ETF Trust. The Trust seeks to provide investment results that, before expenses, correspond generally to the price and yield performance of the S&P 500 Index. The financial statements of the SPDR S&P 500 ETF Trust, including the schedule of investments, can be found on the Securities and Exchange Commission’s (“SEC”) website www.sec.gov and should be read in conjunction with the Fund’s financial statements. As of August 31, 2021, the percentage of net assets invested in the SPDR S&P 500 ETF Trust was 91.0%.
| 7. | BENEFICIAL OWNERSHIP (Unaudited) |
The beneficial ownership, either directly or indirectly, of more than 25% of the voting securities of a Fund creates a presumption of control of the Fund under Section 2(a)(9) of the 1940 Act. As of August 31, 2021, the below entities held more than 25% of the voting securities for each of the Funds listed.
| | | | | | National | | | | | | The Dennis & | |
| | | Denis | | | Financial | | | LPL | | | Britta Nayden | |
| | | Nayden | | | Services * | | | Financial * | | | Gifting Trust | |
| Easterly Global Macro Fund | | | 25.84 | % | | | 57.53 | % | | | — | | | | — | |
| Easterly Multi Strategy Alternative Income Fund | | | — | | | | — | | | | — | | | | 77.33 | % |
| Easterly Hedged Equity Fund | | | — | | | | 56.69 | % | | | — | | | | — | |
| Easterly Hedged High Income Fund | | | — | | | | 35.04 | % | | | 34.25 | % | | | — | |
| * | Comprised of multiple investors and accounts |
| 8. | NEW ACCOUNTING PRONOUNCEMENTS |
In March 2020, FASB issued ASU 2020-04, Reference Rate Reform (Topic 848): Facilitation of the Effects of Reference Rate Reform on Financial Reporting (’‘ASU 2020-04’’). The amendments in ASU 2020-04 provide optional temporary financial reporting relief from the effect of certain types of contract modifications due to the planned discontinuation of LIBOR and other interbank-offered based reference rates as of the end of 2021. ASU 2020-04 is effective for certain reference rate-related contract modifications that occur during the period March 12, 2020 through December 31, 2022. Management is currently evaluating the impact, if any of applying this ASU.
In October 2020, the Securities and Exchange Commission (“SEC”) adopted new regulations governing the use of derivative by registered investment companies (“Rule 18f-4”). Rule 18f-4 will impose limits on the amount of derivatives a Fund can enter into, eliminate the asset segregation framework currently used by funds to comply with Section 18 of the 1940 Act, and require funds whose use of derivatives is greater than a limited specified amount to establish and maintain a comprehensive derivatives risk management program and appoint a derivatives risk manager. Funds will be required to comply with Rule 18f-4 by August 19,2022. It is not currently clear what impact, if any, Rule 18f-4 will have on the availability, liquidity or performance of derivatives. Management is currently evaluating the potential impact of Rule 18f-4 on the Funds. When fully implemented, Rule 18f-4 may require changes in how a Fund uses derivatives, adversely affect the Fund’s performance and increase costs related to the Funds’ use of derivatives.
In December 2020, the Securities and Exchange Commission (“SEC”) adopted a new rule providing a framework for fund valuation practices (“Rule 2a-5”). Rule 2a-5 establishes requirements for determining fair value in good faith for purposes of the 1940 Act. Rule 2a -5 will permit fund boards to designate certain parties to perform fair value determinations, subject to board oversight and certain other conditions. Rule 2a-5 also defines when market quotations are “readily available” for purposes of the 1940 Act and the threshold for determining whether a fund must fair value a security. In connection with Rule 2a-5, the SEC also adopted related recordkeeping requirements and is rescinding previously issued guidance, including with respect to the role of a board in determining fair value and the accounting and auditing of fund investments. The Funds will be required to comply with the rules by September 8, 2022. Management is currently assessing the potential impact of the new rules on the Funds’ financial statements.
Subsequent events after the date of the Statements of Assets and Liabilities have been evaluated through the date the financial statements were issued. Management has determined that no events or transactions occurred requiring adjustment or disclosure in the financial statements other than the following. Effective October 13, 2021 the Easterly Hedged High Income has been liquidated and dissolved.
REPORT OF INDEPENDENT REGISTERED PUBLIC ACCOUNTING FIRM
To the Shareholders and Board of Trustees
of James Alpha Funds Trust d/b/a Easterly
Funds Trust
Opinion on the Financial Statements
We have audited the accompanying consolidated statements of assets and liabilities of the Easterly Global Macro Fund (formerly James Alpha Macro Portfolio), a series of the James Alpha Funds Trust d/b/a Easterly Funds Trust (the “Trust”), including the consolidated schedule of investments as of August 31, 2021, and the related consolidated statement of operations for the year then ended, the consolidated statements of changes in net assets for the two years in the period then ended and the consolidated financial highlights for each of the five years in the period then ended, and the related notes (collectively referred to as the “consolidated financial statements”).
We have also audited the accompanying statements of assets and liabilities of Easterly Global Real Estate Fund (formerly James Alpha Global Real Estate Portfolio), Easterly Multi Strategy Alternative Income Fund (formerly James Alpha Multi Strategy Alternative Income Portfolio), Easterly Hedged Equity Fund (formerly James Alpha Managed Risk Domestic Equity Portfolio) and Easterly Hedged High Income Fund (formerly James Alpha Hedged High Income Portfolio), (collectively, along with Easterly Global Macro Fund, referred to as the “Funds”) each a series of the James Alpha Funds Trust d/b/a Easterly Funds Trust, including the schedules of investments, as of August 31, 2021, the related statements of operations, the statement of changes in net assets for the two years in the period then ended and the financial highlights for each of the five years in the period then ended, and the related notes (collectively referred to as the “financial statements”). In our opinion, the financial statements present fairly, in all material respects, the financial position of the Funds as of August 31, 2021, the results of their operations, the changes in their net assets and their financial highlights for the periods indicated thereon, in conformity with accounting principles generally accepted in the United States of America.
Basis for Opinion
These consolidated financial statements and financial statements are the responsibility of the Funds’ management. Our responsibility is to express an opinion on the Funds’ consolidated financial statements and financial statements based on our audits. We are a public accounting firm registered with the Public Company Accounting Oversight Board (United States) (“PCAOB”) and are required to be independent with respect to the Funds in accordance with the U.S. federal securities laws and the applicable rules and regulations of the Securities and Exchange Commission and the PCAOB. We have served as the auditor of one or more of the funds in the Trust since 2011.
We conducted our audits in accordance with the standards of the PCAOB. Those standards require that we plan and perform the audits to obtain reasonable assurance about whether the consolidated financial statements and financial statements are free of material misstatement, whether due to error or fraud. The Funds are not required to have, nor were we engaged to perform, an audit of the Funds’ internal control over financial reporting. As part of our audits we are required to obtain an understanding of internal control over financial reporting, but not for the purpose of expressing an opinion on the effectiveness of the Funds’ internal control over financial reporting. Accordingly, we express no such opinion.
To the Shareholders and Board of Trustees
of James Alpha Funds Trust d/b/a Easterly
Funds Trust
Page Two
Our audits included performing procedures to assess the risks of material misstatement of the consolidated financial statements and financial statements, whether due to error or fraud, and performing procedures that respond to those risks. Such procedures included examining, on a test basis, evidence regarding the amounts and disclosures in the consolidated financial statements and financial statements. Our audits also included evaluating the accounting principles used and significant estimates made by management, as well as evaluating the overall presentation of the consolidated financial statements and financial statements. Our procedures included confirmation of securities owned as of August 31, 2021 by correspondence with the custodian and brokers; when replies were not received from brokers, we performed other auditing procedures. We believe that our audits provide a reasonable basis for our opinion.
Philadelphia, Pennsylvania
October 29, 2021
| SUPPLEMENTAL INFORMATION (Unaudited) |
Shareholders of funds will pay ongoing expenses, such as advisory fees, distribution and services fees (12b-1 fees), and other fund expenses. The following examples are intended to help the shareholder understand the ongoing cost (in dollars) of investing in a fund and to compare these costs with the ongoing costs of investing in other mutual funds. Please note, the expenses shown in the tables are meant to highlight ongoing costs only and do not reflect any transactional costs, such as sales charges (loads), or contingent deferred sales charges (CDSCs) on redemptions.
This example is based on an investment of $1,000 invested at the beginning of the period and held for the six-month period from March 1, 2021, through August 31, 2021.
Actual Expenses: The first table provides information about actual account values and actual expenses. The shareholder may use the information in this line, together with the amount invested, to estimate the expenses that would be paid over the period. Simply divide account value by $1,000 (for example, an $8,600 account value divided by $1,000 = 8.6), then multiply the result by the number under the heading entitled “Expenses Paid” to estimate the expenses paid on the account during the period.
| | | Beginning Account | | Ending Account | | Expense Paid | | Expense Ratio |
| | | Value - 3/1/2021 | | Value - 8/31/2021 | | 03/1/2021-8/31/2021* | | [Annualized] |
| Actual Expenses: | | | | | | | | |
| Easterly Global Macro Fund - Class I | | 1,000.00 | | 1,030.20 | | 7.58 | | 1.48% |
| Easterly Global Macro Fund - Class R6 | | 1,000.00 | | 1,034.10 | | 4.77 | | 0.93% |
| Easterly Global Real Estate Investments Fund - Class A | | 1,000.00 | | 1,121.80 | | 7.28 | | 1.36% |
| Easterly Global Real Estate Investments Fund - Class C | | 1,000.00 | | 1,117.80 | | 11.35 | | 2.13% |
| Easterly Global Real Estate Investments Fund - Class I | | 1,000.00 | | 1,124.40 | | 5.65 | | 1.06% |
| Easterly Global Real Estate Investments Fund - Class R6 | | 1,000.00 | | 1,125.10 | | 5.07 | | 0.95% |
| Easterly Multi Strategy Alternative Income Fund - Class A | | 1,000.00 | | 1,053.40 | | 11.55 | | 2.23% |
| Easterly Multi Strategy Alternative Income Fund - Class C | | 1,000.00 | | 1,048.20 | | 15.39 | | 2.98% |
| Easterly Multi Strategy Alternative Income Fund - Class I | | 1,000.00 | | 1,054.00 | | 10.26 | | 1.98% |
| Easterly Multi Strategy Alternative Income Fund - Class R6 | | 1,000.00 | | 1,055.10 | | 7.67 | | 1.48% |
| Easterly Hedged Equity Fund - Class A | | 1,000.00 | | 1,065.80 | | 10.36 | | 1.99% |
| Easterly Hedged Equity Fund - Class C | | 1,000.00 | | 1,061.30 | | 12.24 | | 2.36% |
| Easterly Hedged Equity Fund - Class I | | 1,000.00 | | 1,066.90 | | 9.33 | | 1.79% |
| Easterly Hedged Equity Fund - Class R6 | | 1,000.00 | | 1,069.30 | | 6.99 | | 1.34% |
| Easterly Hedged High Income Fund - Class A | | 1,000.00 | | 1,005.70 | | 12.04 | | 2.38% |
| Easterly Hedged High Income Fund - Class C | | 1,000.00 | | 1,002.90 | | 15.05 | | 2.98% |
| Easterly Hedged High Income Fund - Class I | | 1,000.00 | | 1,008.00 | | 9.32 | | 1.84% |
| Easterly Hedged High Income Fund - Class R6 | | 1,000.00 | | 1,010.00 | | 7.00 | | 1.38% |
| SUPPLEMENTAL INFORMATION (Unaudited) (Continued) |
Hypothetical Examples for Comparison Purposes: The second table below provides information about hypothetical account values and hypothetical expenses based on the fund’s actual expense ratio and an assumed rate of return of 5% per year before expenses, which is not the fund’s actual return. The hypothetical account values and expenses may not be used to estimate the actual ending account balance or expenses paid for the period. This information may be used to compare the ongoing costs of investing in the fund and other mutual funds. To do so, a shareholder would compare this 5% hypothetical example with the 5% hypothetical examples that appear in the shareholder reports of the other mutual funds.
| | | Beginning Account | | Ending Account | | Expense Paid | | Expense Ratio |
| Hypothetical | | Value - 3/1/2021 | | Value - 8/31/2021 | | 03/1/2021-8/31/2021* | | [Annualized] |
| [5% Return Before Expenses] | | | | | | | | |
| Easterly Global Macro Fund - Class I | | 1,000.00 | | 1,017.74 | | 7.53 | | 1.48% |
| Easterly Global Macro Fund - Class R6 | | 1,000.00 | | 1,020.51 | | 4.74 | | 0.93% |
| Easterly Global Real Estate Investments Fund - Class A | | 1,000.00 | | 1,018.35 | | 6.92 | | 1.36% |
| Easterly Global Real Estate Investments Fund - Class C | | 1,000.00 | | 1,014.49 | | 10.79 | | 2.13% |
| Easterly Global Real Estate Investments Fund - Class I | | 1,000.00 | | 1,019.88 | | 5.37 | | 1.06% |
| Easterly Global Real Estate Investments Fund - Class R6 | | 1,000.00 | | 1,020.43 | | 4.82 | | 0.95% |
| Easterly Multi Strategy Alternative Income Fund - Class A | | 1,000.00 | | 1,013.96 | | 11.33 | | 2.23% |
| Easterly Multi Strategy Alternative Income Fund - Class C | | 1,000.00 | | 1,010.18 | | 15.10 | | 2.98% |
| Easterly Multi Strategy Alternative Income Fund - Class I | | 1,000.00 | | 1,015.22 | | 10.06 | | 1.98% |
| Easterly Multi Strategy Alternative Income Fund - Class R6 | | 1,000.00 | | 1,017.74 | | 7.53 | | 1.48% |
| Easterly Hedged Equity Fund - Class A | | 1,000.00 | | 1,015.17 | | 10.11 | | 1.99% |
| Easterly Hedged Equity Fund - Class C | | 1,000.00 | | 1,013.33 | | 11.95 | | 2.36% |
| Easterly Hedged Equity Fund - Class I | | 1,000.00 | | 1,016.18 | | 9.10 | | 1.79% |
| Easterly Hedged Equity Fund - Class R6 | | 1,000.00 | | 1,018.45 | | 6.82 | | 1.34% |
| Easterly Hedged High Income Fund - Class A | | 1,000.00 | | 1,013.20 | | 12.08 | | 2.38% |
| Easterly Hedged High Income Fund - Class C | | 1,000.00 | | 1,010.18 | | 15.10 | | 2.98% |
| Easterly Hedged High Income Fund - Class I | | 1,000.00 | | 1,015.92 | | 9.36 | | 1.84% |
| Easterly Hedged High Income Fund - Class R6 | | 1,000.00 | | 1,018.24 | | 7.03 | | 1.38% |
| * | Expenses are equal to the Portfolio’s annualized expense ratio, multiplied by the average account value over the period, multiplied by 184/365 (to reflect the days in reporting period). |
Supplemental Information (Unaudited)
August 31, 2021
LIQUIDITY RISK MANAGEMENT PROGRAM
The Funds have adopted and implemented a written liquidity risk management program as required by Rule 22e-4 (the “Liquidity Rule”) under the Investment Company Act. The program is reasonably designed to assess and manage each Fund’s liquidity risk, taking into consideration, among other factors, each respective Fund’s investment strategy and the liquidity of its portfolio investments during normal and reasonably foreseeable stressed conditions; its short and long-term cash flow projections; and its cash holdings and access to other funding sources.
During the fiscal period ended August 31, 2021, the Trust’s Liquidity Risk Management Program Committee (the “Committee”) reviewed the Funds’ investments and determined that the Funds held adequate levels of cash and highly liquid investments to meet shareholder redemption activities in accordance with applicable requirements. Accordingly, the Committee concluded that (i) the Funds’ liquidity risk management program is reasonably designed to prevent violations of the Liquidity Rule and (ii) the Funds’ liquidity risk management program has been effectively implemented.
Supplemental Information (Unaudited)
August 31, 2021
Board of Trustees (the “Board”) Meeting of January 8, 2021
On January 8, 2021, the Board of Trustees (the “Board”) of James Alpha Funds Trust d/b/a Easterly Funds Trust (the “Trust”), a Delaware business trust, met to consider, among other things, (i) the approval of the investment advisory agreements between the Trust and Easterly Funds LLC (the “Adviser”) on behalf of the Easterly Macro Fund, Easterly Global Real Estate Fund, Easterly Multi Strategy Alternative Income Fund, Easterly Hedged Equity Fund, and Easterly Hedged High Income Fund (each, a “Fund” and together the “Funds”), and (ii) the approval of sub-advisory agreements for sub-advisers (the “Sub-Advisers”) for certain Funds. The investment advisory agreements and the sub-advisory agreements collectively are referred to as the “Advisory Agreements.”
The Independent Trustees discussed the information received respecting (i) the nature, quality and scope of services provided by the Adviser and the Sub-Advisers; (ii) the investment performance of the Funds relative to comparable funds; (iii) the costs of services provided and profits realized by the Adviser; (iv) fees and expenses relative to other comparable funds; (v) the extent to which economies of scale are realized as the Funds grow and whether fee levels appropriately reflect economies of scale; and (vi) benefits realized by the Adviser from its relationship with the Funds.
The Independent Trustees received a memorandum from their independent legal counsel describing their duties in connection with advisory contract approvals and discussing the factors to be considered by the Board.
Nature, Extent and Quality of Services. In considering the approval of the Investment Management Agreements with the Adviser, the Board considered the nature, extent and quality of services that the Adviser will provide to the Funds, including the Adviser’s personnel and resources and the Adviser’s criteria for reviewing a Sub-Adviser’s performance. The Board reviewed the services the Adviser will provide in serving as investment adviser, including the backgrounds of the personnel providing the investment management services and compliance staff. The Board also reviewed information provided regarding the structure of portfolio manager compensation, trading and brokerage practices, soft dollar usage, risk management and compliance matters.
The Board noted that certain Funds employ a “manager of managers” structure, whereby the Adviser is responsible for selecting sub-advisers (subject to Board approval), allocating the Fund’s assets among them, and overseeing the sub-advisers’ day-to-day management of the Fund’s assets. The Board noted the responsibilities that the Adviser has as the Fund’s investment manager, including (1) overseeing the investment decisions of each of the Sub- Advisers and conduct ongoing performance reviews; (2) reviewing and monitoring the portfolio trading by the Sub-Advisers, including without limitation, trade allocation policies and procedures, best execution and the use of soft-dollars; (3) overseeing the Sub-Advisers’ compliance with prospectus limitations and other relevant investment restrictions; (4) coordinating communications with any Sub-Advisers; and (5) if deemed necessary, recommending to the Board changing one or more Sub-Advisers. The Board considered the investment management services that the Adviser will provide to the Cayman Islands based companies that are wholly owned by certain Funds (Cayman Subsidiaries). The Board concluded that the services the Adviser will provide are satisfactory.
In considering the approval of the Sub-Advisory Agreements, as applicable, between the Fund and the Fund’s respective Sub-Adviser(s), the Board considered the nature, extent and quality of services the Sub-Adviser will provide under the Sub-Advisory Agreement. The Board reviewed the services the Sub-Adviser will provide, the background of the investment professionals servicing the Fund, and the Sub-Adviser’s reputation, resources and investment approach. The Board also reviewed information provided regarding the structure of portfolio manager compensation, trading and brokerage practices, soft dollar usage, risk management and compliance matters. The Board concluded that the services each Sub-Adviser will provide are satisfactory.
Performance. The Board reviewed performance information that the Adviser provided for each corresponding Predecessor Fund compared to the performance of a Morningstar category average, for the year-to-date, one-, three-, and five-year periods, as applicable.
Easterly Global Real Estate Fund: The Board noted that Ranger became sub-adviser to the Predecessor Fund in November 2016 and that prior to that Ranger’s predecessor was the manager of the Predecessor Fund since August 2011. The Board noted that the Class I shares of the Predecessor Fund had outperformed its Morningstar category average for the year-to-date, one-, three- and five-year periods.
Easterly Macro Fund: The Board noted that the Adviser became the Adviser to the Predecessor Fund in December 2015. The Board noted that the Class I shares of the Predecessor Fund had outperformed its Morningstar category average for the year-to-date, one-, three- and five-year periods.
Easterly Multi Strategy Alternative Income Fund: The Board noted that the Adviser has been the Adviser to the Predecessor Fund since its inception in September 2014. The Board further noted that Ranger and Bullseye have sub-advised a portion of the Predecessor Fund since inception, Kellner has sub-advised a portion of the Predecessor Fund since May 2015, and Lazard, and its predecessor, has sub-advised a portion of the Predecessor Fund since November 2017. The Board noted that the Class I shares of the Predecessor Fund had outperformed its Morningstar category average for the year-to-date, one-, three- and five-year periods.
Easterly Hedged Equity Fund: The Board noted that the Adviser has been the Adviser, and EAB has been the sub-adviser, to the Predecessor Fund since its inception in July 2015. The Board noted that the Class I shares of the Predecessor Fund had outperformed its Morningstar category average for the year-to-date, one-, three- and five-year periods.
Supplemental Information (Unaudited) (Continued)
August 31, 2021
Easterly Hedged High Income Fund: The Board noted that the Adviser has been the Adviser to the Predecessor Fund since its inception in July 2016. The Board further noted that Concise and Amundi US have sub-advised a portion of the Predecessor Fund since inception, and Lazard, and its predecessor, has sub-advised a portion of the Predecessor Fund since September 2017. The Board noted that the Class I shares of the Predecessor Fund had outperformed its Morningstar category average for the three- and five-year period, and underperformed its Morningstar category average for the year-to-date and one-year periods.
Advisory and Sub-Advisory Fees and Fund Expenses. The Board reviewed each Fund’s proposed contractual advisory fee and estimated expense ratio and reviewed information comparing the contractual advisory fee and expense ratio to those of funds in a peer group (the “Peer Group”) and a Morningstar category. The Board noted that the Adviser has contractually agreed to waive fees and/or limit expenses of the Fund for two years from the closing of the Reorganization in an amount necessary to limit total annual operating expenses to a specified percentage of average daily net assets for each class of the Fund. The Board discussed the level of work involved in the Adviser’s oversight of the Funds, the Adviser’s ongoing quantitative and qualitative analysis of each Sub-Adviser (as applicable), and the other services that the Adviser would provide to the Funds. The Board also considered the investment management services that the Adviser will provide to the Cayman Subsidiaries for applicable Funds and the related fee waivers that were in place.
The Board considered each sub-advised Fund’s sub-advisory fee schedule. The Board noted that the fee schedule was negotiated at arm’s length between the Adviser and each Sub-Adviser, an unaffiliated third party. The Board also evaluated the reasonableness of the fee split between the Adviser and each Sub-Adviser. He further noted that certain Sub-Advisers had agreed to enter into an agreement to share with the Adviser the responsibility of limiting certain Fund’s operating expenses. Mr. Colandrea also reported that certain Sub-Advisers had entered into marketing and distribution support agreements whereby the Sub -Adviser had agreed to support the Adviser’s efforts to support marketing and distribution activities for certain Funds. The Board noted that, if not paid separately by the Sub-Adviser, fees paid under such agreements will reduce the amount of the fee payable by the Adviser to the Sub-Adviser. In this regard, they considered the nature and scope of the services provided by the Adviser, including (i) ongoing monitoring of performance, (ii) supervision of outside service providers, (iii) responding to questions from brokers and sub-advisers, and (iv) research of Sub-Advisers and potential replacement Sub-Advisers to present to the Board for their consideration. The Board also took note of the Adviser’s representation that with respect to the more complex Funds, these services are expected to be more resource intensive for the Adviser. The Board noted that the sub-advisory fees are paid by the Adviser to each Sub-Adviser and are not additional fees borne by the Funds. In light of the nature, quality and extent of services the Adviser and Sub-Advisers (as applicable) would provide, the Board concluded that each Fund’s proposed advisory fee and sub-advisory fee was reasonable.
Economies of Scale. The Board considered the extent to which economies of scale would be realized as each Fund grows and whether fee levels reflect a reasonable sharing of economies of scale for the benefit of Fund investors. The Board also considered that a Fund may benefit from economies of scale through contractual breakpoints in the Fund’s advisory fee schedule, which generally operate to reduce the Fund’s expense ratio as it grows in size. The Board noted that the Funds may also benefit from economies of scale through initial fee setting, fee waivers and expense reimbursements.
Profitability. The Board reviewed the profitability of the Adviser with respect to each Predecessor Fund on an individual fund-by-fund basis and in the aggregate. The Board considered the methodology for calculating profitability. Using such methodology, the Board considered the Funds expected to be profitable to the Adviser and the Funds that are not expected to be profitable to the Adviser at current levels of Predecessor Fund assets under management. The Board concluded that the estimated profitability of the Adviser in connection with the management of each Fund was not excessive given the nature, extent and quality of the services provided. The Board noted that the sub-advisory fee schedule was negotiated at arm’s length between the Adviser and each Sub-Adviser (as applicable), an unaffiliated third party.
Fallout Benefits. Because of its relationship with the Funds, the Adviser, Sub-Advisers, and their affiliates may derive ancillary benefits from Fund operations, including those derived from the allocation of Fund brokerage and the use of commission dollars to pay for research and other similar services (as applicable). The Board reviewed information provided by the Adviser and the Sub-Advisers as to any such benefits.
Conclusion. Based on all of the information considered and the conclusions reached, the Board determined that the compensation to be paid under the Advisory Agreement(s) for each Fund are fair and reasonable, and that the Advisory Agreements be approved for an initial two-year term.
SUPPLEMENTAL INFORMATION (Unaudited)
August 31, 2021
TRUSTEES AND OFFICERS
The Trustees and executive officers of the Trust, and their principal occupations during the past five years, are set forth in the table below. Darrell Crate is an “interested person” of the Trust (as that term is defined in the 1940 Act) by virtue of their position as an officer of Easterly.
Name, Year of Birth, and
Address | Position(s)
Held with
Trust | Term*/
Length of
Time
Served | Principal Occupation(s) During
Past 5 Years | Number of
Funds in
Fund Complex
Overseen | Other
Directorships
Held by Trustee During
Past 5 Years |
| INTERESTED TRUSTEE: |
Darrell Crate,
Year of Birth: 1967
515 Madison Avenue
24th Floor
New York, NY 10022 | President and Chairperson of the Board | Since 2021 | Chief Executive Officer of Easterly Funds LLC (May 2020 – Present) and Managing Principal of Easterly Asset Management LP | 9 | Chairman of the Board and Director of Easterly Government Properties Inc. (May 2015 – Present); Chairman of the Board and Director of Easterly Acquisition Corp. (August 2015 to November 2018) |
| INDEPENDENT TRUSTEES: |
David Knowlton,
Year of Birth: 1957
515 Madison Avenue
24th Floor
New York, NY 10022 | Trustee | Since 2021 | Managing Partner of Three Ocean Partners LLC | 9 | Director of Easterly Acquisition Corp. (August 2015 to November 2018) |
Neil Medugno,
Year of Birth: 1957
515 Madison Avenue
24th Floor
New York, NY 10022 | Trustee | Since 2021 | Retired; Partner, Wellington Management Company LLP, Chief Financial Officer, Wellington Funds Group (investment management) (1994–2017) | 9 | Trustee of Six Circles Trust (July 2017 – Present) |
Patricia Walker,
Year of Birth: 1966
515 Madison Avenue
24th Floor
New York, NY 10022 | Trustee | Since 2021 | Retired; Senior Advisor of Best Buy Co., Inc. (March 2020 – August 2020); President, Home and Services of Best Buy Co., Inc. (April 2016 – March 2020); Senior Managing Director of Accenture plc (July 2000 –April 2016) | 9 | Director of BUILD Boston (June 2020 – Present) |
SUPPLEMENTAL INFORMATION (Unaudited) (Continued)
August 31, 2021
| OFFICERS: |
Michael Montague,
Year of Birth: 1975
515 Madison Avenue
24th Floor
New York, NY 10022 | Treasurer | Since 2021 | Chief Operating Officer of Easterly Funds LLC and James Alpha Management, LLC | Not Applicable | Not Applicable |
Emile Molineaux,
Year of Birth: 1962
4221 North 203rd Street,
Ste. 100
Elkhorn, NE 68022 | Chief Compliance Officer | Since 2021 | Senior Compliance Officer (2011 – Present) Northern Lights Compliance Services, LLC | Not Applicable | Not Applicable |
Chad Bitterman,
Year of Birth: 1972
4221 North 203rd Street,
Ste. 100
Elkhorn, NE 68022 | Anti-Money Laundering Compliance Officer | Since 2021 | Compliance Officer (2010 – Present) Northern Lights Compliance Services, LLC | Not Applicable | Not Applicable |
Amaris Sahota,
Year of Birth: 1992
515 Madison Avenue
24th Floor
New York, NY 10022
| Secretary | Since 2021 | Chief Operating Officer, Easterly Management Operations LLC (May 2021 – Present); Senior Management Consultant, The Poirier Group (2018 – 2021); Rotational Program, Sun Life Financial (2015 – 2018) | Not Applicable | Not Applicable |
Eric Colandrea,
Year of Birth: 1974
515 Madison Avenue
24th Floor
New York, NY 10022 | Chief Legal Officer and Senior Vice President | Since 2021 | General Counsel of Easterly Funds LLC (May 2020 – Present) and Easterly Asset Management LP (February 2016 – Present) | Not Applicable | Not Applicable |
Erik Naviloff,
Year of Birth: 1968
4221 North 203rd Street,
Ste. 100
Elkhorn, NE 68022 | Assistant Treasurer | Since 2021 | Vice President, Gemini Fund Services, LLC (2011 – present) | Not Applicable | Not Applicable |
Timothy Burdick,
Year of Birth: 1986
4221 North 203rd Street,
Ste. 100
Elkhorn, NE 68022 | Assistant Secretary | Since 2021 | Assistant Vice President, Gemini Fund Services, LLC (2019 –present); Senior Program Compliance Manager, CJ Affiliate (2016 –2019) | Not Applicable | Not Applicable |
| * | Each Trustee will serve an indefinite term until they resign or retire and/or their successor, if any, is duly elected and qualified. Officers of the Trust serve at the pleasure of the Board. |
PRIVACY NOTICE
JAMES ALPHA FUNDS TRUST
March 2021
| FACTS | WHAT DOES JAMES ALPHA FUNDS TRUST DO WITH YOUR PERSONAL INFORMATION? |
| | |
| Why? | Financial companies choose how they share your personal information. Federal law gives consumers the right to limit some, but not all sharing. Federal law also requires us to tell you how we collect, share, and protect your personal information. Please read this notice carefully to understand what we do. |
| | |
| What? | The types of personal information we collect and share depends on the product or service that you have with us. This information can include: ● Social Security number and wire transfer instructions ● account transactions and transaction history ● investment experience and purchase history When you are no longer our customer, we continue to share your information as described in this notice. |
| | |
| How? | All financial companies need to share customers’ personal information to run their everyday business. In the section below, we list the reasons financial companies can share their customers’ personal information; the reasons James Alpha Funds Trust chooses to share; and whether you can limit this sharing. |
| | |
Reasons we can share your personal
information: | Does James Alpha Funds Trust
share information? | Can you limit
this sharing? |
For our everyday business purposes - such as to process your transactions, maintain your account(s), respond to court orders and legal investigations, or report to credit bureaus. | YES | NO |
For our marketing purposes - to offer our products and services to you. | YES | YES |
| For joint marketing with other financial companies. | NO | We don’t share |
For our affiliates’ everyday business purposes - information about your transactions and records. | NO | We don’t share |
For our affiliates’ everyday business purposes - information about your credit worthiness. | NO | We don’t share |
| For nonaffiliates to market to you | NO | We don’t share |
| | | |
| QUESTIONS? | Call (888) 814-8180 | | |
| What we do: |
How does James Alpha Funds Trust
protect my personal information? | To protect your personal information from unauthorized access and use, we use security measures that comply with federal law. These measures include computer safeguards and secured files and buildings. Our service providers are held accountable for adhering to strict policies and procedures to prevent any misuse of your nonpublic personal information. |
How does James Alpha Funds Trust
collect my personal information? | We collect your personal information, for example, when you ● open an account or deposit money ● direct us to buy securities or direct us to sell your securities ● seek advice about your investments We also collect your personal information from others, such as credit bureaus, affiliates, or other companies. |
| Why can’t I limit all sharing? | Federal law gives you the right to limit only: ● sharing for affiliates’ everyday business purposes – information about your creditworthiness. ● affiliates from using your information to market to you. ● sharing for nonaffiliates to market to you. State laws and individual companies may give you additional rights to limit sharing. |
| |
| Definitions |
| Affiliates | Companies related by common ownership or control. They can be financial and nonfinancial companies. ● James Alpha Funds Trust does not share with our affiliates. |
| Nonaffiliates | Companies not related by common ownership or control. They can be financial and nonfinancial companies. ● James Alpha Funds Trust does not share with nonaffiliates so they can market to you. |
| Joint marketing | A formal agreement between nonaffiliated financial companies that together market financial products or services to you. ● James Alpha Funds Trust doesn’t jointly market. |
How to Obtain Proxy Voting Information
Information regarding how the Portfolios voted proxies relating to portfolio securities during the most recent twelve month period ended June 30 as well as a description of the policies and procedures that the Portfolios use to determine how to vote proxies is available without charge, upon request, by calling 1-888-672-4839 or by referring to the Securities and Exchange Commission’s (“SEC”) website at http://www.sec.gov.
How to Obtain 1st and 3rd Fiscal Quarter Portfolio Holdings
Funds file a complete schedule of portfolio holdings with the Securities and Exchange Commission (the “SEC”) for the first and third quarters of each fiscal year as an exhibit to its reports on Form N-PORT, within sixty days after the end of the period. Form N-PORT reports are available at the SEC’s website at www.sec.gov.
Easterly Funds-AR21
Item 2. Code of Ethics.
(a) As of the end of the period covered by this report, the registrant has adopted a code of ethics that applies to the registrant's principal executive officer, principal financial officer, principal accounting officer or controller, or persons performing similar functions, regardless of whether these individuals are employed by the registrant or a third party.
(b) For purposes of this item, “code of ethics” means written standards that are reasonably designed to deter wrongdoing and to promote:
| (1) | Honest and ethical conduct, including the ethical handling of actual or apparent conflicts of interest between personal and professional relationships; |
| (2) | Full, fair, accurate, timely, and understandable disclosure in reports and documents that a registrant files with, or submits to, the Commission and in other public communications made by the registrant; |
(3) Compliance with applicable governmental laws, rules, and regulations;
| (4) | The prompt internal reporting of violations of the code to an appropriate person or persons identified in the code; and |
(5) Accountability for adherence to the code.
(c) Amendments: During the period covered by the report, there have not been any amendments to the provisions of the code of ethics.
(d) Waivers: During the period covered by the report, the registrant has not granted any express or implicit waivers from the provisions of the code of ethics.
Item 3. Audit Committee Financial Expert.
The Registrant’s board of trustees has determined that Neil Medugno is an audit committee financial expert, as defined in Item 3 of Form N-CSR. Mr. Medugno is independent for purposes of this Item 3.
Item 4. Principal Accountant Fees and Services.
| (a) Audit Fees | | 2021 |
| | | |
| Easterly Global Macro Fund | | $14,000 | |
| Easterly Global Real Estate Fund | | $38,500 | |
| Easterly Multi Strategy Alternative Income Fund | | $12,500 | |
| Easterly Hedged Equity Fund | | $16,500 | |
| Easterly Hedged High Income Fund | | $18,000 | |
| (b) Audit-Related Fees | | | 2021 | |
| | | | | |
| Easterly Global Macro Fund | | | None | |
| Easterly Global Real Estate Fund | | | None | |
| Easterly Multi Strategy Alternative Income Fund | | | None | |
| Easterly Hedged Equity Fund | | | None | |
| Easterly Hedged High Income Fund | | | None | |
| (c) Tax Fees | | 2021 |
| | | |
| Easterly Global Macro Fund | | $3,000 | |
| Easterly Global Real Estate Fund | | $3,500 | |
| Easterly Multi Strategy Alternative Income Fund | | $3,000 | |
| Easterly Hedged Equity Fund | | $2,500 | |
| Easterly Hedged High Income Fund | | $2,500 | |
Preparation of Federal & State income tax returns, assistance with calculation of required income, capital gain and excise distributions and preparation of Federal excise tax returns.
| (d) All Other Fees | | | 2021 | |
| | | | | |
| Easterly Global Macro Fund | | | None | |
| Easterly Global Real Estate Fund | | | None | |
| Easterly Multi Strategy Alternative Income Fund | | | None | |
| Easterly Hedged Equity Fund | | | None | |
| Easterly Hedged High Income Fund | | | None | |
(e) (1) Audit Committee’s Pre-Approval Policies
The registrant’s Audit Committee is required to pre-approve all audit services and, when appropriate, any non-audit services (including audit-related, tax and all other services) to the registrant. The registrant’s Audit Committee also is required to pre-approve, when appropriate, any non-audit services (including audit-related, tax and all other services) to its adviser, or any entity controlling, controlled by or under common control with the adviser that provides ongoing services to the registrant, to the extent that the services may be determined to have an impact on the operations or financial reporting of the registrant. Services are reviewed on an engagement by engagement basis by the Audit Committee.
(2) Percentages of Services Approved by the Audit Committee
| Easterly Global Macro Fund | | 2021 |
| Audit-Related Fees: | | 0.00% | |
| Tax Fees: | | 0.00% | |
| All Other Fees: | | 0.00% | | |
| Easterly Global Real Estate Fund | | 2021 |
| Audit-Related Fees: | | 0.00% | |
| Tax Fees: | | 0.00% | |
| All Other Fees: | | 0.00% | | |
| Easterly Multi Strategy Alternative Income Fund | | 2021 |
| Audit-Related Fees: | | 0.00% | |
| Tax Fees: | | 0.00% | |
| All Other Fees: | | 0.00% | |
| Easterly Hedged Equity Fund | | 2021 |
| Audit-Related Fees: | | 0.00% | |
| Tax Fees: | | 0.00% | |
| All Other Fees: | | 0.00% | |
| Easterly Hedged High Income Fund | | 2021 |
| Audit-Related Fees: | | 0.00% | |
| Tax Fees: | | 0.00% | |
| All Other Fees: | | 0.00% | |
(f) During the audit of registrant's financial statements for the most recent fiscal year, less than 50 percent of the hours expended on the principal accountant's engagement were attributed to work performed by persons other than the principal accountant's full-time, permanent employees.
(g) The aggregate non-audit fees billed by the registrant's accountant for services rendered to the registrant, and rendered to the registrant's investment adviser (not including any sub-adviser whose role is primarily portfolio management and is subcontracted with or overseen by another investment adviser), and any entity controlling, controlled by, or under common control with the adviser that provides ongoing services to the registrant:
| | | 2021 |
| Easterly Global Macro Fund | | $ | 3,000 | |
| Easterly Global Real Estate Fund | | $ | 3,500 | |
| Easterly Multi Strategy Alternative Income Fund | | $ | 3,000 | |
| Easterly Hedged Equity Fund | | $ | 2,500 | |
| Easterly Hedged High Income Fund | | $ | 2,500 | |
(h) The registrant's audit committee has considered whether the provision of non-audit services to the registrant's investment adviser (not including any sub-adviser whose role is primarily portfolio management and is subcontracted with or overseen by another investment adviser), and any entity controlling, controlled by, or under common control with the investment adviser that provides ongoing services to the registrant, that were not pre-approved pursuant to paragraph (c)(7)(ii) of Rule 2-01 of Regulation S-X, is compatible with maintaining the principal accountant's independence.
Item 5. Audit Committee of Listed Companies. Not applicable to open-end investment companies.
Item 6. Schedule of Investments. See Item 1.
Item 7. Disclosure of Proxy Voting Policies and Procedures for Closed-End Funds. Not applicable to
open-end investment companies.
Item 8. Portfolio Managers of Closed-End Management Investment Companies. Not applicable to open-end investment companies.
Item 9. Purchases of Equity Securities by Closed-End Management Investment Company and Affiliated Purchasers. Not applicable to open-end investment companies.
Item 10. Submission of Matters to a Vote of Security Holders. None.
Item 11. Controls and Procedures.
(a) Based on an evaluation of the Registrant’s disclosure controls and procedures as of a date within 90 days of filing date of this Form N-CSR, the principal executive officer and principal financial officer of the Registrant have concluded that the disclosure controls and procedures of the Registrant are reasonably designed to ensure that the information required in filings on Form N-CSR is recorded, processed, summarized, and reported by the filing date, including that information required to be disclosed is accumulated and communicated to the Registrant’s management, including the Registrant’s principal executive officer and principal financial officer, as appropriate to allow timely decisions regarding required disclosure.
(b) There were no significant changes in the Registrant’s internal control over financial reporting that occurred during the Registrant’s last fiscal half-year that have materially affected, or are reasonably likely to materially affect, the Registrant’s internal control over financial reporting.
Item 12. Disclosure of Securities Lending Activities for Closed-Ended Management Investment Companies.
Not applicable
Item 13. Exhibits.
(a)(1) Code of Ethics filed herewith.
(a)(2) Certification(s) required by Section 302 of the Sarbanes-Oxley Act of 2002 (and Item 11(a)(2) of Form N-CSR) are filed herewith.
(a)(3) Not applicable.
(b) Certification(s) required by Section 906 of the Sarbanes-Oxley Act of 2002 (and Item 11(b) of Form N-CSR) are filed herewith.
SIGNATURES
Pursuant to the requirements of the Securities Exchange Act of 1934 and the Investment Company Act of 1940, the registrant has duly caused this report to be signed on its behalf by the undersigned, thereunto duly authorized.
(Registrant) James Alpha Funds Trust
By (Signature and Title)
* /s/ Darrell Crate
Darrell Crate, President and Chief Executive Officer
Date 8/23/22
Pursuant to the requirements of the Securities Exchange Act of 1934 and the Investment Company Act of 1940, this report has been signed below by the following persons on behalf of the registrant and in the capacities and on the dates indicated.
By (Signature and Title)
* /s/ Michael Montague
Michael Montague, Treasurer and Principal Financial Officer
Date 8/23/22
By (Signature and Title)
* /s/ Darrell Crate
Darrell Crate, President and Chief Executive Officer
Date 8/23/22
* Print the name and title of each signing officer under his or her signature.