UNITED STATES
SECURITIES AND EXCHANGE COMMISSION
WASHINGTON, D.C. 20549
FORM N-CSR
CERTIFIED SHAREHOLDER REPORT OF REGISTERED
MANAGEMENT INVESTMENT COMPANIES
| Investment Company Act file number | 811-23611 | |
James alpha Funds Trust
(Exact name of registrant as specified in charter)
515 Madison Avenue, 24th Floor, New York, NY 10022 |
| (Address of principal executive offices) | | (Zip code) |
Emile R. Molineaux, Gemini Fund Services, LLC
80 Arkay Drive, Suite 110, Hauppauge, NY 11788
(Name and address of agent for service)
| Registrant’s telephone number, including area code: | 623-266-4567 | |
| Date of fiscal year end: | 11/30 | |
| | | |
| Date of reporting period: | 05/31/2024 | |
Item 1. Reports to Stockholders.
(a)
Easterly Income Opportunities Fund Class A (JASVX) Semi-Annual Shareholder Report - May 31, 2024 | |  |
Fund Overview This semi-annual shareholder report contains important information about Easterly Income Opportunities Fund for the period of December 1, 2023 to May 31, 2024. You can find additional information about the Fund at https://funds.easterlyam.com/resources/. You can also request this information by contacting us at 1-833-999-2636. |
What were the Fund’s costs for the last six months?
(based on a hypothetical $10,000 investment)
| Class Name | | Costs of a $10,000 investment | | Costs paid as a percentage of a $10,000 investment |
| Class A | | $93 | | 1.86% |
| Average Annual Total Returns |
| | | 6 months | | 1 Year | | 5 Years | | Since Inception
(8/21/2018) |
| Easterly Income Opportunities Fund | | | | | | | | |
| Without Load | | 3.18% | | 4.40% | | 4.15% | | 4.95% |
| With Load | | 1.11% | | 2.33% | | 2.92% | | 3.88% |
| Bloomberg U.S. Aggregate Bond Index | | 2.12% | | 1.31% | | -0.17% | | 0.83% |
Load Information: 2% is the maximum sales charge on purchase of A Shares.
The Fund’s past performance is not a good predictor of the Fund’s future performance. The table does not reflect the deduction of taxes that a shareholder would pay on fund distributions or redemption of fund shares.
For the most recent month-end performance, visit funds.easterlyam.com/income-opportunities-fund/ or call 888-814-8180.
Important Information:
The Fund has adopted the performance of the James Alpha Structured Credit Value Portfolio, a series of The Saratoga Advantage Trust (the “Predecessor Portfolio”) as the result of a reorganization of the Predecessor Portfolio into the Fund, which was consummated after the close of business on March 19, 2021 (the “Reorganization”). Prior to the Reorganization, the Fund had not yet commenced operations. The returns shown for periods ending on or prior to March 19, 2021 are those of the Class A shares of the Predecessor Portfolio. Class A shares of the Predecessor Portfolio were reorganized into Class A of the Fund, respectively, after the close of business on March 19, 2021. Class A shares’ returns of the Fund will be different from the returns of the Predecessor Portfolio’s Class A shares as they have different expenses.
Performance information reflects the impact of fee waivers, expense caps and/or reimbursements in effect during the period shown. If terminated, future expenses may be higher which would impact the Fund’s performance. Periods less than one year are not annualized.
| Fund Statistics |
| Net Assets | | $328,506,106 |
| Number of Portfolio Holdings | | 826 |
| Advisory Fee (net of waivers) | | $1,561,592 |
| Portfolio Turnover | | 16% |
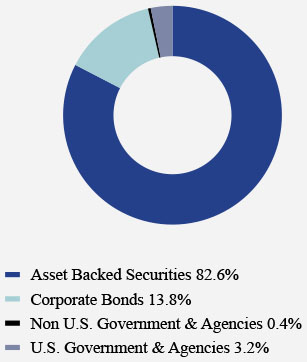
What did the Fund invest in?
| Asset Weighting (% of total investments) |

|
|
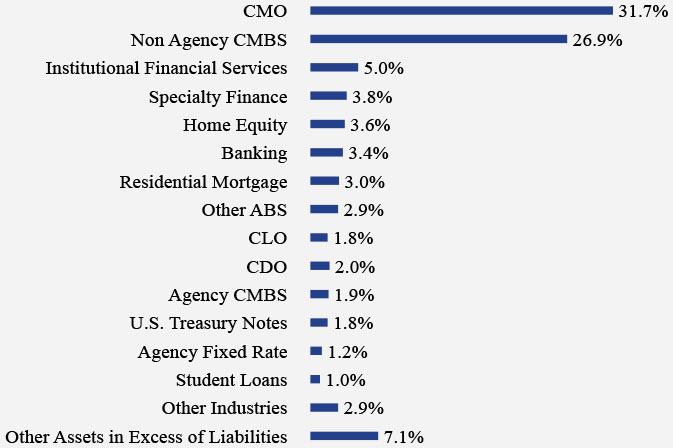
| Industry Weighting (% of net assets) |

|
|
| Asset Backed Securities | 82.6% |
| Corporate Bonds | 13.8% |
| Non U.S. Government & Agencies | 0.4% |
| U.S. Government & Agencies | 3.2% |
| CMO | 31.7% |
| Non Agency CMBS | 26.9% |
| Institutional Financial Services | 5.0% |
| Specialty Finance | 3.8% |
| Home Equity | 3.6% |
| Banking | 3.4% |
| Residential Mortgage | 3.0% |
| Other ABS | 2.9% |
| CLO | 1.8% |
| CDO | 2.0% |
| Agency CMBS | 1.9% |
| U.S. Treasury Notes | 1.8% |
| Agency Fixed Rate | 1.2% |
| Student Loan | 1.0% |
| Other Industries | 2.9% |
| Other Assets in Excess of Liabilities | 7.1% |
| Top 10 Holdings (% of net assets) |
| Holding Name | | % of Net
Assets |
| RBSSP Resecuritization Trust, 2009-12, 4.159%, 12/25/35 | | 1.7% |
| Morgan Stanley Bank of America Merrill Lynch Trust, 2013-C11, 4.077%, 08/15/46 | | 1.7% |
| RMF Buyout Issuance Trust, 2022-HB1, 4.500%, 04/25/32 | | 1.3% |
| Galleria CDO V Ltd., 5A, 7.991%, 09/19/37 | | 1.2% |
| United States Treasury Note, 4.500%, 11/15/33 | | 1.2% |
| Fannie Mae Pool, 6.000%, 08/1/53 | | 1.1% |
| Peaks CLO 2 Ltd., 2017-2A, 10.586%, 07/20/31 | | 0.8% |
| FREMF Mortgage Trust, 2017-KF37, 8.192%, 06/25/27 | | 0.8% |
| Morgan Stanley Finance, LLC, –%, 11/29/36 | | 0.8% |
| BWAY Mortgage Trust, 2022-26BW, 3.402%, 02/10/44 | | 0.8% |
Where can I find additional information about the Fund? Additional information is available on the Fund’s website (https://funds.easterlyam.com/resources/), including its: |
| | ● | Prospectus |
| | ● | Financial information |
| | ● | Holdings |
| | ● | Proxy voting information |
| | | |
Easterly Income Opportunities Fund Class C (JSVCX) Semi-Annual Shareholder Report - May 31, 2024 | | |
Fund Overview This semi-annual shareholder report contains important information about Easterly Income Opportunities Fund for the period of December 1, 2023 to May 31, 2024. You can find additional information about the Fund at https://funds.easterlyam.com/resources/. You can also request this information by contacting us at 1-833-999-2636. |
What were the Fund’s costs for the last six months?
(based on a hypothetical $10,000 investment)
| Class Name | | Costs of a $10,000 investment | | Costs paid as a percentage of a $10,000 investment |
| Class C | | $131 | | 2.61% |
| Average Annual Total Returns |
| | | 6 months | | 1 Year | | 5 Years | | Since Inception
(8/21/2018) |
| Easterly Income Opportunities Fund | | | | | | | | |
| Without Load | | 2.67% | | 3.54% | | 3.38% | | 3.94% |
| With Load | | 1.67% | | 2.55% | | 3.38% | | 3.94% |
| Bloomberg U.S. Aggregate Bond Index | | 2.12% | | 1.31% | | -0.17% | | 0.83% |
The Fund’s past performance is not a good predictor of the Fund’s future performance. The table does not reflect the deduction of taxes that a shareholder would pay on fund distributions or redemption of fund shares.
Class C charges a maximum contingent deferred sales charge of 1.00% if you redeem Class C shares within one year after purchase.
For the most recent month-end performance, visit funds.easterlyam.com/income-opportunities-fund/ or call 888-814-8180.
Important Information:
The Fund has adopted the performance of the James Alpha Structured Credit Value Portfolio, a series of The Saratoga Advantage Trust (the “Predecessor Portfolio”) as the result of a reorganization of the Predecessor Portfolio into the Fund, which was consummated after the close of business on March 19, 2021 (the “Reorganization”). Prior to the Reorganization, the Fund had not yet commenced operations. The returns shown for periods ending on or prior to March 19, 2021 are those of the Class C shares of the Predecessor Portfolio. Class C shares of the Predecessor Portfolio were reorganized into Class C of the Fund, respectively, after the close of business on March 19, 2021. Class C shares’ returns of the Fund will be different from the returns of the Predecessor Portfolio’s Class C shares as they have different expenses.
Performance information reflects the impact of fee waivers, expense caps and/or reimbursements in effect during the period shown. If terminated, future expenses may be higher which would impact the Fund’s performance. Periods less than one year are not annualized.
| Fund Statistics |
| Net Assets | | $328,506,106 |
| Number of Portfolio Holdings | | 826 |
| Advisory Fee (net of waivers) | | $1,561,592 |
| Portfolio Turnover | | 16% |
What did the Fund invest in?
| Asset Weighting (% of total investments) |
|
|
| Industry Weighting (% of net assets) |

|
|
| Asset Backed Securities | 82.6% |
| Corporate Bonds | 13.8% |
| Non U.S. Government & Agencies | 0.4% |
| U.S. Government & Agencies | 3.2% |
| CMO | 31.7% |
| Non Agency CMBS | 26.9% |
| Institutional Financial Services | 5.0% |
| Specialty Finance | 3.8% |
| Home Equity | 3.6% |
| Banking | 3.4% |
| Residential Mortgage | 3.0% |
| Other ABS | 2.9% |
| CLO | 1.8% |
| CDO | 2.0% |
| Agency CMBS | 1.9% |
| U.S. Treasury Notes | 1.8% |
| Agency Fixed Rate | 1.2% |
| Student Loan | 1.0% |
| Other Industries | 2.9% |
| Other Assets in Excess of Liabilities | 7.1% |
| Top 10 Holdings (% of net assets) |
| Holding Name | | % of Net
Assets |
| RBSSP Resecuritization Trust, 2009-12, 4.159%, 12/25/35 | | 1.7% |
| Morgan Stanley Bank of America Merrill Lynch Trust, 2013-C11, 4.077%, 08/15/46 | | 1.7% |
| RMF Buyout Issuance Trust, 2022-HB1, 4.500%, 04/25/32 | | 1.3% |
| Galleria CDO V Ltd., 5A, 7.991%, 09/19/37 | | 1.2% |
| United States Treasury Note, 4.500%, 11/15/33 | | 1.2% |
| Fannie Mae Pool, 6.000%, 08/1/53 | | 1.1% |
| Peaks CLO 2 Ltd., 2017-2A, 10.586%, 07/20/31 | | 0.8% |
| FREMF Mortgage Trust, 2017-KF37, 8.192%, 06/25/27 | | 0.8% |
| Morgan Stanley Finance, LLC, –%, 11/29/36 | | 0.8% |
| BWAY Mortgage Trust, 2022-26BW, 3.402%, 02/10/44 | | 0.8% |
Where can I find additional information about the Fund? Additional information is available on the Fund’s website (https://funds.easterlyam.com/resources/), including its: |
| | ● | Prospectus |
| | ● | Financial information |
| | ● | Holdings |
| | ● | Proxy voting information |
| | | |
Easterly Income Opportunities Fund Class I (JSVIX) Semi-Annual Shareholder Report - May 31, 2024 | | |
Fund Overview This semi-annual shareholder report contains important information about Easterly Income Opportunities Fund for the period of December 1, 2023 to May 31, 2024. You can find additional information about the Fund at https://funds.easterlyam.com/resources/. You can also request this information by contacting us at 1-833-999-2636. |
What were the Fund’s costs for the last six months?
(based on a hypothetical $10,000 investment)
| Class Name | | Costs of a $10,000 investment | | Costs paid as a percentage of a $10,000 investment |
| Class I | | $81 | | 1.61% |
| Average Annual Total Returns |
| | | 6 Months | | 1 Year | | 5 years | | Since Inception
(8/21/2018) |
| Easterly Income Opportunities Fund | | 3.18% | | 4.58% | | 4.42% | | 4.86% |
| Bloomberg U.S. Aggregate Bond Index | | 2.12% | | 1.31% | | -0.17% | | 0.83% |
The Fund’s past performance is not a good predictor of the Fund’s future performance. The table does not reflect the deduction of taxes that a shareholder would pay on fund distributions or redemption of fund shares.
For the most recent month-end performance, visit funds.easterlyam.com/income-opportunities-fund/ or call 888-814-8180.
Important Information:
The Fund has adopted the performance of the James Alpha Structured Credit Value Portfolio, a series of The Saratoga Advantage Trust (the “Predecessor Portfolio”) as the result of a reorganization of the Predecessor Portfolio into the Fund, which was consummated after the close of business on March 19, 2021 (the “Reorganization”). Prior to the Reorganization, the Fund had not yet commenced operations. The returns shown for periods ending on or prior to March 19, 2021 are those of the Class I shares of the Predecessor Portfolio. Class I shares of the Predecessor Portfolio were reorganized into Class I of the Fund, respectively, after the close of business on March 19, 2021. Class I shares’ returns of the Fund will be different from the returns of the Predecessor Portfolio’s Class I shares as they have different expenses.
Performance information reflects the impact of fee waivers, expense caps and/or reimbursements in effect during the period shown. If terminated, future expenses may be higher which would impact the Fund’s performance. Periods less than one year are not annualized.
| Fund Statistics |
| Net Assets | | $328,506,106 |
| Number of Portfolio Holdings | | 826 |
| Advisory Fee (net of waivers) | | $1,561,592 |
| Portfolio Turnover | | 16% |
What did the Fund invest in?
| Asset Weighting (% of total investments) |

|
|
| Industry Weighting (% of net assets) |
|
|
| Asset Backed Securities | 82.6% |
| Corporate Bonds | 13.8% |
| Non U.S. Government & Agencies | 0.4% |
| U.S. Government & Agencies | 3.2% |
| CMO | 31.7% |
| Non Agency CMBS | 26.9% |
| Institutional Financial Services | 5.0% |
| Specialty Finance | 3.8% |
| Home Equity | 3.6% |
| Banking | 3.4% |
| Residential Mortgage | 3.0% |
| Other ABS | 2.9% |
| CLO | 1.8% |
| CDO | 2.0% |
| Agency CMBS | 1.9% |
| U.S. Treasury Notes | 1.8% |
| Agency Fixed Rate | 1.2% |
| Student Loan | 1.0% |
| Other Industries | 2.9% |
| Other Assets in Excess of Liabilities | 7.1% |
| Top 10 Holdings (% of net assets) |
| Holding Name | | % of Net
Assets |
| RBSSP Resecuritization Trust, 2009-12, 4.159%, 12/25/35 | | 1.7% |
| Morgan Stanley Bank of America Merrill Lynch Trust, 2013-C11, 4.077%, 08/15/46 | | 1.7% |
| RMF Buyout Issuance Trust, 2022-HB1, 4.500%, 04/25/32 | | 1.3% |
| Galleria CDO V Ltd., 5A, 7.991%, 09/19/37 | | 1.2% |
| United States Treasury Note,4.500%, 11/15/33 | | 1.2% |
| Fannie Mae Pool,6.000%, 08/1/53 | | 1.1% |
| Peaks CLO 2 Ltd., 2017-2A, 10.586%, 07/20/31 | | 0.8% |
| FREMF Mortgage Trust, 2017-KF37, 8.192%, 06/25/27 | | 0.8% |
| Morgan Stanley Finance, LLC, –%, 11/29/36 | | 0.8% |
| BWAY Mortgage Trust, 2022-26BW, 3.402%, 02/10/44 | | 0.8% |
Where can I find additional information about the Fund? Additional information is available on the Fund’s website (https://funds.easterlyam.com/resources/), including its: |
| | ● | Prospectus |
| | ● | Financial information |
| | ● | Holdings |
| | ● | Proxy voting information |
| | | |
Easterly Income Opportunities Fund Class R6 (JASSX) Semi-Annual Shareholder Report - May 31, 2024 | | |
Fund Overview This semi-annual shareholder report contains important information about Easterly Income Opportunities Fund for the period of December 1, 2023 to May 31, 2024. You can find additional information about the Fund at https://funds.easterlyam.com/resources/. You can also request this information by contacting us at 1-833-999-2636. |
What were the Fund’s costs for the last six months?
(based on a hypothetical $10,000 investment)
| Class Name | | Costs of a $10,000 investment | | Costs paid as a percentage of a $10,000 investment |
| Class R6 | | $51 | | 1.02% |
| Average Annual Total Returns |
| | | 6 Months | | 1 Year | | 5 years | | Since Inception
(8/21/2018) |
| Easterly Income Opportunities Fund | | 3.53% | | 5.11% | | 4.84% | | 5.27% |
| Bloomberg U.S. Aggregate Bond Index | | 2.12% | | 1.31% | | -0.17% | | 0.83% |
The Fund’s past performance is not a good predictor of the Fund’s future performance. The table does not reflect the deduction of taxes that a shareholder would pay on fund distributions or redemption of fund shares.
For the most recent month-end performance, visit funds.easterlyam.com/income-opportunities-fund/ or call 888-814-8180.
Important Information:
The Fund has adopted the performance of the James Alpha Structured Credit Value Portfolio, a series of The Saratoga Advantage Trust (the “Predecessor Portfolio”) as the result of a reorganization of the Predecessor Portfolio into the Fund, which was consummated after the close of business on March 19, 2021 (the “Reorganization”). Prior to the Reorganization, the Fund had not yet commenced operations. The returns shown for periods ending on or prior to March 19, 2021 are those of the Class S shares of the Predecessor Portfolio. Class S shares of the Predecessor Portfolio were reorganized into Class R6 of the Fund, respectively, after the close of business on March 19, 2021. Class R6 shares’ returns of the Fund will be different from the returns of the Predecessor Portfolio’s Class S shares as they have different expenses.
Performance information reflects the impact of fee waivers, expense caps and/or reimbursements in effect during the period shown. If terminated, future expenses may be higher which would impact the Fund’s performance. Periods less than one year are not annualized.
| Fund Statistics |
| Net Assets | | $328,506,106 |
| Number of Portfolio Holdings | | 826 |
| Advisory Fee (net of waivers) | | $1,561,592 |
| Portfolio Turnover | | 16% |
What did the Fund invest in?
| Asset Weighting (% of total investments) |

|
|
| Industry Weighting (% of net assets) |

|
|
| Asset Backed Securities | 82.6% |
| Corporate Bonds | 13.8% |
| Non U.S. Government & Agencies | 0.4% |
| U.S. Government & Agencies | 3.2% |
| CMO | 31.7% |
| Non Agency CMBS | 26.9% |
| Institutional Financial Services | 5.0% |
| Specialty Finance | 3.8% |
| Home Equity | 3.6% |
| Banking | 3.4% |
| Residential Mortgage | 3.0% |
| Other ABS | 2.9% |
| CLO | 1.8% |
| CDO | 2.0% |
| Agency CMBS | 1.9% |
| U.S. Treasury Notes | 1.8% |
| Agency Fixed Rate | 1.2% |
| Student Loan | 1.0% |
| Other Industries | 2.9% |
| Other Assets in Excess of Liabilities | 7.1% |
| Top 10 Holdings (% of net assets) |
| Holding Name | | % of Net
Assets |
| RBSSP Resecuritization Trust, 2009-12, 4.159%, 12/25/35 | | 1.7% |
| Morgan Stanley Bank of America Merrill Lynch Trust, 2013-C11, 4.077%, 08/15/46 | | 1.7% |
| RMF Buyout Issuance Trust, 2022-HB1, 4.500%, 04/25/32 | | 1.3% |
| Galleria CDO V Ltd., 5A, 7.991%, 09/19/37 | | 1.2% |
| United States Treasury Note, 4.500%, 11/15/33 | | 1.2% |
| Fannie Mae Pool, 6.000%, 08/1/53 | | 1.1% |
| Peaks CLO 2 Ltd., 2017-2A, 10.586%, 07/20/31 | | 0.8% |
| FREMF Mortgage Trust, 2017-KF37, 8.192%, 06/25/27 | | 0.8% |
| Morgan Stanley Finance, LLC, –%, 11/29/36 | | 0.8% |
| BWAY Mortgage Trust, 2022-26BW, 3.402%, 02/10/44 | | 0.8% |
Where can I find additional information about the Fund? Additional information is available on the Fund’s website (https://funds.easterlyam.com/resources/), including its: |
| | ● | Prospectus |
| | ● | Financial information |
| | ● | Holdings |
| | ● | Proxy voting information |
| | | |
Item 2. Code of Ethics. Not applicable for semi-annual reports.
Item 3. Audit Committee Financial Expert. Not applicable for semi-annual reports.
Item 4. Principal Accountant Fees and Services. Not applicable for semi-annual reports.
Item 5. Audit Committee of Listed Registrants. Not applicable to open-end investment companies.
Item 6. Investments.
The Registrant’s schedule of investments in unaffiliated issuers is included in the Financial Statements under Item 7 of this form.
Item 7. Financial Statements and Financial Highlights for Open-End Management Investment Companies.
| (a) | Long Form Financial Statements |

JAMES ALPHA FUNDS TRUST d/b/a EASTERLY FUNDS TRUST
CLASS A, C, I AND R6 SHARES
SEMI-ANNUAL REPORT
May 31, 2024
THIS REPORT IS AUTHORIZED FOR DISTRIBUTION ONLY TO SHAREHOLDERS AND TO OTHERS WHO
HAVE RECEIVED A COPY OF THE PROSPECTUS.
EASTERLY INCOME OPPORTUNITIES FUND
SCHEDULE OF INVESTMENTS (Unaudited)
May 31, 2024
Principal
Amount ($) | | | | | Spread | | | Coupon Rate (%) | | | Maturity | | | Fair Value | |
| | | | | ASSET BACKED SECURITIES — 76.8% | | | | | | | | | | | | | |
| | | | | AGENCY CMBS — 1.9% | | | | | | | | | | | | | |
| | 847,054 | | | Freddie Mac Multifamily Structured Pass Through Series K092 X3(a),(b) | | | | | 2.3260 | | | 05/25/47 | | | $ | 79,384 | |
| | 2,848,068 | | | FREMF Mortgage Trust Series 2017-KF37 B(c),(d) | | SOFR30A + 2.864% | | | 8.1920 | | | 06/25/27 | | | | 2,748,895 | |
| | 2,644,537 | | | FREMF Mortgage Trust Series 2019-KF63(c),(d) | | SOFR30A + 2.464% | | | 7.7920 | | | 05/25/29 | | | | 2,357,528 | |
| | 55,151 | | | Government National Mortgage Association Series 2012-27 IO(a),(b) | | | | | 0.2230 | | | 04/16/53 | | | | 116 | |
| | 95,824 | | | Government National Mortgage Association Series 3 IO(a),(b) | | | | | 0.6400 | | | 02/16/61 | | | | 4,307 | |
| | 228,869 | | | Government National Mortgage Association Series 2012-H27 AI(a),(b) | | | | | 1.7300 | | | 10/20/62 | | | | 5,510 | |
| | 692,796 | | | Government National Mortgage Association Series 210 IO(a),(b) | | | | | 0.6980 | | | 07/16/64 | | | | 40,945 | |
| | 40,000 | | | Government National Mortgage Association Series 196 BE(b) | | | | | 3.0000 | | | 10/16/64 | | | | 28,998 | |
| | 40,000 | | | Government National Mortgage Association Series 220 E(b) | | | | | 3.0000 | | | 10/16/64 | | | | 27,013 | |
| | 692,946 | | | Government National Mortgage Association Series 216 IO(a),(b) | | | | | 0.7490 | | | 07/16/65 | | | | 40,478 | |
| | 1,131,445 | | | Government National Mortgage Association Series 2016-H24 AI(a),(b) | | | | | 0.7570 | | | 11/20/66 | | | | 44,118 | |
| | 916,945 | | | Multifamily Connecticut Avenue Securities Trust Series 2019-01 M10(c),(d) | | SOFR30A + 3.364% | | | 8.6880 | | | 10/25/49 | | | | 918,532 | |
| | | | | | | | | | | | | | | | | 6,295,824 | |
| | | | | AUTO LOAN — 0.5% | | | | | | | | | | | | | |
| | 284,441 | | | ACM Auto Trust Series 2023-2A A(c) | | | | | 7.9700 | | | 06/20/30 | | | | 286,183 | |
| | 334,000 | | | Flagship Credit Auto Trust Series 2020-3 E(c) | | | | | 4.9800 | | | 12/15/27 | | | | 325,799 | |
| | 100,000 | | | SFS Auto Receivables Securitization Trust Series 2023-1A C(c) | | | | | 5.9700 | | | 02/20/31 | | | | 101,040 | |
| | 3,500,000 | | | US Auto Funding Series 2021-1A D(c) | | | | | 4.3600 | | | 03/15/27 | | | | 941,577 | |
| | 17,589 | | | US Auto Funding Trust Series 2022-1A A(c) | | | | | 3.9800 | | | 04/15/25 | | | | 17,288 | |
| | | | | | | | | | | | | | | | | 1,671,887 | |
| | | | | CDO — 2.0% | | | | | | | | | | | | | |
| | 4,199,584 | | | Galleria CDO V Ltd. Series 5A B(c),(d) | | TSFR1M + 2.662% | | | 7.9910 | | | 09/19/37 | | | | 4,075,546 | |
| | 3,417,418 | | | Mid Ocean CBO Ltd. Series 2001-1X A1L(d) | | TSFR1M + 0.762% | | | 2.3910 | | | 11/05/36 | | | | 267,642 | |
| | 3,000,000 | | | Tropic CDO IV Ltd. Series 2004-4A A3L(c),(d) | | TSFR1M + 1.262% | | | 6.5900 | | | 04/15/35 | | | | 2,373,000 | |
| | | | | | | | | | | | | | | | | 6,716,188 | |
| | | | | CLO — 1.8% | | | | | | | | | | | | | |
| | 500,000 | | | Ellington Clo III Ltd. Series 2018-3A D(c),(d) | | TSFR3M + 4.002% | | | 9.3260 | | | 07/20/30 | | | | 494,232 | |
| | 200,000 | | | GC FTPYME Pastor FTA Series 4(d) | | EUR003M + 2.400% | | | 6.2280 | | | 07/15/45 | | | | 77,295 | |
| | 877,710 | | | Halcyon Loan Advisors Funding Ltd. Series 2013-2A D(c),(d) | | TSFR3M + 4.062% | | | 9.3880 | | | 08/01/25 | | | | 681,042 | |
| | 250,000 | | | Nassau Ltd. Series 2018-IA E(c),(d) | | TSFR3M + 6.112% | | | 11.4400 | | | 07/15/31 | | | | 174,272 | |
| | 500,000 | | | Peaks CLO 2 Ltd. Series 2017-2A CR(c),(d) | | TSFR3M + 3.862% | | | 9.1860 | | | 07/20/31 | | | | 500,513 | |
| | 2,750,000 | | | Peaks CLO 2 Ltd. Series 2017-2A DR(c),(d) | | TSFR3M + 5.262% | | | 10.5860 | | | 07/20/31 | | | | 2,751,991 | |
| | 500,000 | | | Steele Creek Clo Ltd. Series 2018-2A D(c),(d) | | TSFR3M + 3.662% | | | 8.9870 | | | 08/18/31 | | | | 493,799 | |
See accompanying notes to financial statements
EASTERLY INCOME OPPORTUNITIES FUND
SCHEDULE OF INVESTMENTS (Unaudited) (Continued)
May 31, 2024
Principal
Amount ($) | | | | | Spread | | | Coupon Rate (%) | | | Maturity | | | Fair Value | |
| | | | | ASSET BACKED SECURITIES — 76.8% (Continued) | | | | | | | | | | | | | |
| | | | | CLO — 1.8% (Continued) | | | | | | | | | | | | | |
| | 408,500 | | | STWD Ltd. Series 2022-FL3 C(c),(d) | | SOFR30A + 2.200% | | | 7.5240 | | | 11/15/38 | | | $ | 365,936 | |
| | 500,000 | | | Zais Clo Ltd. Series 2019-13A D1(c),(d) | | TSFR3M + 4.782% | | | 10.1100 | | | 07/15/32 | | | | 470,291 | |
| | | | | | | | | | | | | | | | | 6,009,371 | |
| | | | | COLLATERALIZED MORTGAGE OBLIGATIONS — 31.7% | | | | | | | | | | | | | |
| | 76,808 | | | ABN Amro Mortgage Corporation Series 2003-11 A4 | | | | | 5.5000 | | | 10/25/33 | | | | 72,557 | |
| | 245,799 | | | Adjustable Rate Mortgage Trust Series 2005-3 7A1(b) | | | | | 6.1690 | | | 07/25/35 | | | | 215,167 | |
| | 447,362 | | | Adjustable Rate Mortgage Trust Series 2005-6A 2A2(d) | | TSFR1M + 0.954% | | | 6.2790 | | | 11/25/35 | | | | 121,843 | |
| | 30,839 | | | Alternative Loan Trust Series 1998-4 IIA3(e) | | | | | 5.7330 | | | 08/25/28 | | | | 29,632 | |
| | 85,450 | | | Alternative Loan Trust Series 2005-J1 3A1 | | | | | 6.5000 | | | 08/25/32 | | | | 82,491 | |
| | 23,143 | | | Alternative Loan Trust Series 2004-J11 3A1 | | | | | 7.2500 | | | 08/25/32 | | | | 23,165 | |
| | 104,914 | | | Alternative Loan Trust Series 2003-J2 A1 | | | | | 6.0000 | | | 10/25/33 | | | | 101,723 | |
| | 97,772 | | | Alternative Loan Trust Series 2003-J3 1A3 | | | | | 5.2500 | | | 11/25/33 | | | | 90,950 | |
| | 15,952 | | | Alternative Loan Trust Series 2003-22CB 1A1 | | | | | 5.7500 | | | 12/25/33 | | | | 15,503 | |
| | 33,670 | | | Alternative Loan Trust Series 2003-J3 2A1 | | | | | 6.2500 | | | 12/25/33 | | | | 33,805 | |
| | 8,614 | | | Alternative Loan Trust Series 2004-16CB 1A1 | | | | | 5.5000 | | | 07/25/34 | | | | 8,268 | |
| | 131,156 | | | Alternative Loan Trust Series 2004-J8 2A1 | | | | | 7.0000 | | | 08/25/34 | | | | 114,244 | |
| | 31,824 | | | Alternative Loan Trust Series 2004-J10 2CB1 | | | | | 6.0000 | | | 09/25/34 | | | | 30,810 | |
| | 39,374 | | | Alternative Loan Trust Series 2004-15 1A2(b) | | | | | 6.2410 | | | 09/25/34 | | | | 37,759 | |
| | 549,151 | | | Alternative Loan Trust Series 2004-J10 5CB1 | | | | | 5.5000 | | | 11/25/34 | | | | 518,327 | |
| | 405,156 | | | Alternative Loan Trust Series 2004-28CB 2A4 | | | | | 5.7500 | | | 01/25/35 | | | | 360,832 | |
| | 77,752 | | | Alternative Loan Trust Series 2004-28CB 3A1 | | | | | 6.0000 | | | 01/25/35 | | | | 66,820 | |
| | 35,947 | | | Alternative Loan Trust Series 2004-28CB 6A1 | | | | | 6.0000 | | | 01/25/35 | | | | 32,106 | |
| | 30,037 | | | Alternative Loan Trust Series 2005-3CB 1A9 | | | | | 5.0000 | | | 03/25/35 | | | | 23,981 | |
| | 126,112 | | | Alternative Loan Trust Series 2005-6CB 1A6 | | | | | 5.5000 | | | 04/25/35 | | | | 103,937 | |
| | 74,126 | | | Alternative Loan Trust Series 2005-14 2A1(d) | | TSFR1M + 0.534% | | | 5.6490 | | | 05/25/35 | | | | 62,263 | |
| | 135,096 | | | Alternative Loan Trust Series 2005-J8 1A5 | | | | | 5.5000 | | | 07/25/35 | | | | 93,049 | |
| | 172,725 | | | Alternative Loan Trust Series 2005-27 2A1(d) | | 12MTA + 1.350% | | | 6.4390 | | | 08/25/35 | | | | 138,037 | |
| | 39,059 | | | Alternative Loan Trust Series 2005-J11 2A1 | | | | | 6.0000 | | | 10/25/35 | | | | 19,079 | |
| | 30,749 | | | Alternative Loan Trust Series 2005-54CB 1A11 | | | | | 5.5000 | | | 11/25/35 | | | | 23,111 | |
| | 52,481 | | | Alternative Loan Trust Series 2005-J11 1A3 | | | | | 5.5000 | | | 11/25/35 | | | | 29,223 | |
| | 94,966 | | | Alternative Loan Trust Series 2005-61 2A1(d) | | TSFR1M + 0.674% | | | 5.9990 | | | 12/25/35 | | | | 82,393 | |
| | 117,612 | | | Alternative Loan Trust Series 2005-72 A3(d) | | TSFR1M + 0.714% | | | 6.0390 | | | 01/25/36 | | | | 109,096 | |
| | 105,858 | | | Alternative Loan Trust Series 2006-40T1 2A1 | | | | | 6.0000 | | | 12/25/36 | | | | 31,245 | |
| | 891,071 | | | Alternative Loan Trust Resecuritization Series 2005-12R A4 | | | | | 6.0000 | | | 11/25/34 | | | | 832,720 | |
See accompanying notes to financial statements
EASTERLY INCOME OPPORTUNITIES FUND
SCHEDULE OF INVESTMENTS (Unaudited) (Continued)
May 31, 2024
Principal
Amount ($) | | | | | Spread | | | Coupon Rate (%) | | | Maturity | | | Fair Value | |
| | | | | ASSET BACKED SECURITIES — 76.8% (Continued) | | | | | | | | | | | | | |
| | | | | COLLATERALIZED MORTGAGE OBLIGATIONS — 31.7% (Continued) | | | | | | | | | | | | | |
| | 36,171 | | | Alternative Loan Trust Resecuritization Series 2005-12R A3 | | | | | 6.0000 | | | 11/25/34 | | | $ | 33,802 | |
| | 369,552 | | | Alternative Loan Trust Resecuritization Series 2008-2R 2A1(b) | | | | | 4.1160 | | | 08/25/37 | | | | 152,426 | |
| | 93,416 | | | American Home Mortgage Investment Trust Series 2004-1 2M1(d) | | TSFR6M + 2.428% | | | 7.7370 | | | 04/25/44 | | | | 84,208 | |
| | 12,335 | | | APS Resecuritization Trust Series 2016-3 3A(c),(d) | | TSFR1M + 2.964% | | | 8.2890 | | | 09/27/46 | | | | 12,341 | |
| | 176,876 | | | Banc of America Alternative Loan Trust Series 2003-8 1CB1 | | | | | 5.5000 | | | 10/25/33 | | | | 168,982 | |
| | 99,160 | | | Banc of America Alternative Loan Trust Series 2004-6 3A1 | | | | | 6.0000 | | | 07/25/34 | | | | 93,653 | |
| | 57,537 | | | Banc of America Alternative Loan Trust Series 2007-1 1A1(b) | | | | | 3.9850 | | | 02/25/57 | | | | 47,097 | |
| | 1,057,838 | | | Banc of America Funding Trust Series 2004-B 3A2(b) | | | | | 4.3900 | | | 12/20/34 | | | | 822,190 | |
| | 41,809 | | | Banc of America Funding Trust Series 2005-E 8A1(d) | | 12MTA + 1.430% | | | 6.5450 | | | 06/20/35 | | | | 30,047 | |
| | 1,091,823 | | | Banc of America Funding Trust Series 2010-R3 4A3(b),(c) | | | | | 6.0000 | | | 06/26/36 | | | | 874,011 | |
| | 18,255 | | | Banc of America Funding Trust Series 2015-R4 5A1(c),(d) | | TSFR1M + 0.264% | | | 5.5810 | | | 10/25/36 | | | | 18,181 | |
| | 87,170 | | | Banc of America Funding Trust Series 2007-2 1A8(a) | | | | | 6.0000 | | | 03/25/37 | | | | 15,737 | |
| | 193,494 | | | Banc of America Funding Trust Series 2006-H 2A2(b) | | | | | 4.6100 | | | 09/20/46 | | | | 152,376 | |
| | 697,665 | | | Banc of America Funding Trust Series 2006-I 4A1(b) | | | | | 4.4510 | | | 10/20/46 | | | | 561,437 | |
| | 16,473 | | | Banc of America Mortgage Trust Series 2002-L 1A1(b) | | | | | 3.2060 | | | 12/25/32 | | | | 12,167 | |
| | 49,432 | | | Banc of America Mortgage Trust Series 2005-E 2A1(b) | | | | | 4.5680 | | | 06/25/35 | | | | 42,152 | |
| | 42,821 | | | Banc of America Mortgage Trust Series 2005-F 3A1(b) | | | | | 5.2340 | | | 07/25/35 | | | | 34,325 | |
| | 65,539 | | | Banc of America Mortgage Trust Series 2005-G 2A1(b) | | | | | 5.1500 | | | 08/25/35 | | | | 55,444 | |
| | 24,277 | | | Banc of America Mortgage Trust Series 2005-H 2A1(b) | | | | | 5.1450 | | | 09/25/35 | | | | 20,384 | |
| | 125,074 | | | Banc of America Mortgage Trust Series 2005-L 2A4(b) | | | | | 5.4220 | | | 01/25/36 | | | | 99,296 | |
| | 747,302 | | | BCAP, LLC Series 2014-RR2 7A2(c),(d) | | TSFR1M + 0.314% | | | 4.6000 | | | 01/26/38 | | | | 725,974 | |
| | 1,437,738 | | | BCAP, LLC Trust Series 2011-RR5 12A1(c),(e) | | | | | 4.5160 | | | 03/26/37 | | | | 1,387,932 | |
| | 740,839 | | | BCAP, LLC Trust Series 2011-RR10 1A2(b),(c) | | | | | 5.0000 | | | 03/26/37 | | | | 575,059 | |
| | 3,546 | | | Bear Stearns ALT-A Trust Series 2004-11 2A1(b) | | | | | 3.1880 | | | 11/25/34 | | | | 3,230 | |
| | 35,177 | | | Bear Stearns ALT-A Trust Series 2005-4 23A2(b) | | | | | 5.2600 | | | 05/25/35 | | | | 29,260 | |
| | 68,780 | | | Bear Stearns ARM Trust Series 2003-4 B1(b) | | | | | 5.3730 | | | 07/25/33 | | | | 60,603 | |
| | 30,488 | | | Bear Stearns ARM Trust Series 2003-5 1A1(b) | | | | | 6.2280 | | | 08/25/33 | | | | 28,425 | |
| | 4,024 | | | Bear Stearns ARM Trust Series 2003-7 6A(b) | | | | | 5.7570 | | | 10/25/33 | | | | 3,761 | |
| | 41,583 | | | Bear Stearns ARM Trust Series 2003-8 2A1(b) | | | | | 5.7070 | | | 01/25/34 | | | | 37,912 | |
| | 102,399 | | | Bear Stearns ARM Trust Series 2004-1 124M(b) | | | | | 5.1480 | | | 04/25/34 | | | | 86,757 | |
| | 11,055 | | | Bear Stearns ARM Trust Series 2004-1 21A1(b) | | | | | 5.9850 | | | 04/25/34 | | | | 9,912 | |
| | 94,693 | | | Bear Stearns ARM Trust Series 2004-5(b) | | | | | 4.0690 | | | 07/25/34 | | | | 76,281 | |
| | 92,811 | | | Bear Stearns ARM Trust Series 2004-6 3A(b) | | | | | 5.8780 | | | 09/25/34 | | | | 85,355 | |
| | 44,639 | | | Bear Stearns ARM Trust Series 2004-8 2A1(b) | | | | | 2.1580 | | | 11/25/34 | | | | 40,347 | |
See accompanying notes to financial statements
EASTERLY INCOME OPPORTUNITIES FUND
SCHEDULE OF INVESTMENTS (Unaudited) (Continued)
May 31, 2024
Principal
Amount ($) | | | | | Spread | | | Coupon Rate (%) | | | Maturity | | | Fair Value | |
| | | | | ASSET BACKED SECURITIES — 76.8% (Continued) | | | | | | | | | | | | | |
| | | | | COLLATERALIZED MORTGAGE OBLIGATIONS — 31.7% (Continued) | | | | | | | | | | | | | |
| | 865,231 | | | Bear Stearns ARM Trust Series 2004-8 13A1(b) | | | | | 2.1580 | | | 11/25/34 | | | $ | 768,896 | |
| | 40,926 | | | Bear Stearns ARM Trust Series 2004-10 12A5(b) | | | | | 4.8820 | | | 01/25/35 | | | | 38,300 | |
| | 901,958 | | | Bear Stearns ARM Trust Series 2007-3 2A1(b) | | | | | 4.0540 | | | 05/25/47 | | | | 742,297 | |
| | 582,640 | | | Bear Stearns Asset Backed Securities I Trust Series 2006-AC2 21A6 | | | | | 6.0000 | | | 03/25/36 | | | | 230,211 | |
| | 583,276 | | | Bear Stearns Asset Backed Securities Trust Series 2003-AC7 A1(e) | | | | | 5.5000 | | | 01/25/34 | | | | 475,907 | |
| | 142,832 | | | Bear Stearns Structured Products Inc Trust Series 2007-R6 1A1(b) | | | | | 5.1320 | | | 01/26/36 | | | | 105,019 | |
| | 24,273 | | | Bella Vista Mortgage Trust Series 2004-1 1A(d) | | TSFR1M + 0.814% | | | 6.1350 | | | 11/20/34 | | | | 23,298 | |
| | 63,846 | | | BlackRock Capital Finance, L.P. Series 1997-R2 1B1(b),(c) | | | | | 3.5020 | | | 12/25/35 | | | | 50,119 | |
| | 171,634 | | | Brean Asset Backed Securities Trust Series 2022-RM5 A(b),(c) | | | | | 4.5000 | | | 09/25/62 | | | | 148,621 | |
| | 2,133,511 | | | Brean Asset Backed Securities Trust Series 2023-RM6 A2(c),(e) | | | | | 5.2500 | | | 01/25/63 | | | | 1,912,983 | |
| | 3,267,686 | | | Brean Asset Backed Securities Trust Series 2021-RM1 M1(c) | | | | | 1.6000 | | | 10/25/63 | | | | 2,290,929 | |
| | 621,228 | | | Cascade Funding Mortgage Trust Series 2018-RM2 D(b),(c) | | | | | 4.0000 | | | 10/25/68 | | | | 531,338 | |
| | 2,912,387 | | | Cascade Funding Mortgage Trust Series 2019-RM3 D(b),(c) | | | | | 4.0000 | | | 06/25/69 | | | | 2,458,793 | |
| | 70,037 | | | CDMC Mortgage Pass-Through Certificates Series 2004-4 A8(b) | | | | | 5.4260 | | | 09/25/34 | | | | 65,382 | |
| | 81,771 | | | CDMC Mortgage Pass-Through Certificates Series 2005-1 A4(b) | | | | | 5.1050 | | | 02/18/35 | | | | 75,835 | |
| | 1,003,415 | | | Cendant Mortgage Capital, LLC CDMC Mort Pas Thr Ce Series 2004-1 A7 | | | | | 5.5000 | | | 02/25/34 | | | | 939,443 | |
| | 230,000 | | | CFMT, LLC Series 2022-HB9 M3(b),(c) | | | | | 3.2500 | | | 09/25/37 | | | | 195,582 | |
| | 91,280 | | | Chase Home Lending Mortgage Trust Series 2019-1 B4(b),(c) | | | | | 3.8840 | | | 03/25/50 | | | | 75,331 | |
| | 147,815 | | | Chase Mortgage Finance Trust Series 2004-S2 2A4 | | | | | 5.5000 | | | 02/25/34 | | | | 138,978 | |
| | 277,791 | | | Chase Mortgage Finance Trust Series 2006-A1 2A3(b) | | | | | 5.1180 | | | 09/25/36 | | | | 223,173 | |
| | 483,864 | | | Chase Mortgage Finance Trust Series 2007-S3 AP(f) | | | | | 0.0000 | | | 05/25/37 | | | | 4,443 | |
| | 267,879 | | | Chase Mortgage Finance Trust Series 2007-S3 1A17(a) | | | | | 4.0000 | | | 05/25/37 | | | | 64,486 | |
| | 174,173 | | | Chevy Chase Funding, LLC Mortgage-Backed Series 2005-4A A2(c),(d) | | TSFR1M + 0.364% | | | 5.6890 | | | 10/25/36 | | | | 123,067 | |
| | 352,198 | | | CHL Mortgage Pass-Through Trust Series 2002-19 1A1 | | | | | 6.2500 | | | 11/25/32 | | | | 286,712 | |
| | 89,702 | | | CHL Mortgage Pass-Through Trust Series 2002-39 A37 | | | | | 5.7500 | | | 02/25/33 | | | | 81,988 | |
| | 108,806 | | | CHL Mortgage Pass-Through Trust Series 2003-60 2A1(b) | | | | | 6.1160 | | | 02/25/34 | | | | 90,928 | |
| | 25,280 | | | CHL Mortgage Pass-Through Trust Series 2004-3 A4 | | | | | 5.7500 | | | 04/25/34 | | | | 23,844 | |
| | 48,327 | | | CHL Mortgage Pass-Through Trust Series 2004-6 2A1(b) | | | | | 4.7280 | | | 05/25/34 | | | | 43,835 | |
| | 55,692 | | | CHL Mortgage Pass-Through Trust Series 2004-5 2A9 | | | | | 5.2500 | | | 05/25/34 | | | | 53,862 | |
| | 62,426 | | | CHL Mortgage Pass-Through Trust Series 2004-5 2A2 | | | | | 5.5000 | | | 05/25/34 | | | | 60,844 | |
| | 34,488 | | | CHL Mortgage Pass-Through Trust Series 2004-HYB2 2A(b) | | | | | 6.7410 | | | 07/20/34 | | | | 32,238 | |
| | 106,923 | | | CHL Mortgage Pass-Through Trust Series 2004-J5 A4 | | | | | 5.5000 | | | 07/25/34 | | | | 101,566 | |
| | 38,220 | | | CHL Mortgage Pass-Through Trust Series 2004-14 4A1(b) | | | | | 5.3600 | | | 08/25/34 | | | | 33,954 | |
| | 56,143 | | | CHL Mortgage Pass-Through Trust Series 2004-J9 2A6 | | | | | 5.5000 | | | 01/25/35 | | | | 51,088 | |
See accompanying notes to financial statements
EASTERLY INCOME OPPORTUNITIES FUND
SCHEDULE OF INVESTMENTS (Unaudited) (Continued)
May 31, 2024
Principal
Amount ($) | | | | | Spread | | | Coupon Rate (%) | | | Maturity | | | Fair Value | |
| | | | | ASSET BACKED SECURITIES — 76.8% (Continued) | | | | | | | | | | | | | |
| | | | | COLLATERALIZED MORTGAGE OBLIGATIONS — 31.7% (Continued) | | | | | | | | | | | | | |
| | 51,619 | | | CHL Mortgage Pass-Through Trust Series 2004-HYB5 6A2(b) | | | | | 5.0010 | | | 04/20/35 | | | $ | 45,673 | |
| | 407,029 | | | CHL Mortgage Pass-Through Trust Series 2005-14 A2 | | | | | 5.5000 | | | 07/25/35 | | | | 149,960 | |
| | 2,971,184 | | | CHL Mortgage Pass-Through Trust Series 2005-14 A1 | | | | | 6.0000 | | | 07/25/35 | | | | 1,223,104 | |
| | 519,320 | | | CHL Mortgage Pass-Through Trust Series 2005-J2 3A12 | | | | | 5.0000 | | | 08/25/35 | | | | 303,724 | |
| | 92,159 | | | CHL Mortgage Pass-Through Trust Series 2006-J1 3A1 | | | | | 6.0000 | | | 02/25/36 | | | | 33,912 | |
| | 79,476 | | | CHL Mortgage Pass-Through Trust Series 2007-HY1 2A1(b) | | | | | 4.1550 | | | 03/25/37 | | | | 69,366 | |
| | 292,605 | | | CHL Mortgage Pass-Through Trust Series 2007-15 2A2 | | | | | 6.5000 | | | 09/25/37 | | | | 109,209 | |
| | 250,000 | | | CHNGE Mortgage Trust Series 2023-1 M1(b),(c) | | | | | 8.2880 | | | 03/25/58 | | | | 249,891 | |
| | 225,000 | | | CHNGE Mortgage Trust Series 2022-2 B2(b),(c) | | | | | 4.6250 | | | 03/25/67 | | | | 141,548 | |
| | 116,781 | | | Citicorp Mortgage Securities REMIC Pass-Through Series 2005-4 1A5 | | | | | 5.5000 | | | 07/25/35 | | | | 107,786 | |
| | 36,364 | | | Citicorp Mortgage Securities Trust Series Series 2006-6 A4 | | | | | 6.0000 | | | 11/25/36 | | | | 34,663 | |
| | 72,242 | | | Citicorp Mortgage Securities Trust Series Series 2007-2 APO(f) | | | | | 0.0000 | | | 02/25/37 | | | | 36,848 | |
| | 177,779 | | | Citicorp Mortgage Securities Trust Series Series 2007-4 1A5 | | | | | 6.0000 | | | 05/25/37 | | | | 152,119 | |
| | 98,220 | | | Citigroup Global Markets Mortgage Securities VII, Series 1997-HUD2 B2(b) | | | | | 6.9780 | | | 07/25/24 | | | | 122 | |
| | 3,653 | | | Citigroup Global Markets Mortgage Securities VII, Series 2002-HYB1 B2(b) | | | | | 6.2320 | | | 09/25/32 | | | | 3,220 | |
| | 154,369 | | | Citigroup Mortgage Loan Trust Series 2009-10 6A2(b),(c) | | | | | 5.8780 | | | 09/25/34 | | | | 134,984 | |
| | 172,251 | | | Citigroup Mortgage Loan Trust Series 2009-4 7A5(b),(c) | | | | | 5.4830 | | | 05/25/35 | | | | 154,750 | |
| | 44,110 | | | Citigroup Mortgage Loan Trust Series 2014-10 4A1(c),(b) | | | | | 5.6000 | | | 02/25/37 | | | | 43,652 | |
| | 226 | | | Citigroup Mortgage Loan Trust Series 2010-9 5A3(c),(e) | | | | | 5.7020 | | | 03/25/37 | | | | 223 | |
| | 39,777 | | | Citigroup Mortgage Loan Trust Series 2015-RP2 A(c) | | | | | 4.2500 | | | 01/25/53 | | | | 36,380 | |
| | 300,000 | | | Citigroup Mortgage Loan Trust Series 2020-EXP1 B1(b),(c) | | | | | 4.4670 | | | 05/25/60 | | | | 239,572 | |
| | 1,366,327 | | | Citigroup Mortgage Loan Trust Inc Mortgage Series 7 2A2A(b) | | | | | 5.8530 | | | 09/25/35 | | | | 1,020,179 | |
| | 10,991 | | | Citigroup Mortgage Loan Trust, Inc. Series 2003-1 3A4 | | | | | 5.2500 | | | 09/25/33 | | | | 9,790 | |
| | 23,390 | | | Citigroup Mortgage Loan Trust, Inc. Series 2004-UST1 A6(b) | | | | | 5.9110 | | | 08/25/34 | | | | 20,174 | |
| | 89,995 | | | Citigroup Mortgage Loan Trust, Inc. Series 2004-UST1 A4(b) | | | | | 6.1030 | | | 08/25/34 | | | | 78,974 | |
| | 41,527 | | | Citigroup Mortgage Loan Trust, Inc. Series 2004-NCM2 1CB2 | | | | | 6.7500 | | | 08/25/34 | | | | 40,594 | |
| | 40,356 | | | Citigroup Mortgage Loan Trust, Inc. Series 2005-2 2A11 | | | | | 5.5000 | | | 05/25/35 | | | | 38,700 | |
| | 36,217 | | | COLT Funding, LLC Series 2021-3R A2(b),(c) | | | | | 1.2570 | | | 12/25/64 | | | | 29,863 | |
| | 422,000 | | | COLT Mortgage Loan Trust Series 2020-2 M1(b),(c) | | | | | 5.2500 | | | 03/25/65 | | | | 405,970 | |
| | 127,656 | | | Credit Suisse First Boston Mortgage Securities Series 2001-26 5A1(b) | | | | | 4.0010 | | | 11/25/31 | | | | 127,197 | |
| | 238,030 | | | Credit Suisse First Boston Mortgage Securities Series 2002-NP14 M1(c),(d) | | TSFR1M + 2.302% | | | 4.5440 | | | 11/25/31 | | | | 139,934 | |
| | 139,173 | | | Credit Suisse First Boston Mortgage Securities Series 2001-33 3B1(b) | | | | | 7.2040 | | | 01/25/32 | | | | 122,918 | |
| | 64,903 | | | Credit Suisse First Boston Mortgage Securities Series 2003-11 1A31 | | | | | 5.5000 | | | 06/25/33 | | | | 61,737 | |
See accompanying notes to financial statements
EASTERLY INCOME OPPORTUNITIES FUND
SCHEDULE OF INVESTMENTS (Unaudited) (Continued)
May 31, 2024
Principal
Amount ($) | | | | | Spread | | | Coupon Rate (%) | | | Maturity | | | Fair Value | |
| | | | | ASSET BACKED SECURITIES — 76.8% (Continued) | | | | | | | | | | | | | |
| | | | | COLLATERALIZED MORTGAGE OBLIGATIONS — 31.7% (Continued) | | | | | | | | | | | | | |
| | 514,207 | | | Credit Suisse First Boston Mortgage Securities Series 2003-19 1A19 | | | | | 5.2500 | | | 07/25/33 | | | $ | 492,581 | |
| | 20,940 | | | Credit Suisse First Boston Mortgage Securities Series 2003-21 1A4 | | | | | 5.2500 | | | 09/25/33 | | | | 19,185 | |
| | 70,754 | | | Credit Suisse First Boston Mortgage Securities Series 2003-25 1A8(d) | | 8*(USISOA30-USISOA02) | | | 5.5000 | | | 10/25/33 | | | | 64,844 | |
| | 212,262 | | | Credit Suisse First Boston Mortgage Securities Series 2003-25 1A11 | | | | | 5.5000 | | | 10/25/33 | | | | 194,894 | |
| | 155,505 | | | Credit Suisse First Boston Mortgage Securities Series 2004-6 1A3 | | | | | 5.5000 | | | 10/25/34 | | | | 140,988 | |
| | 104,209 | | | Credit Suisse First Boston Mortgage Securities Series 2005-8 9A9(d) | | TSFR1M + 0.764% | | | 6.0890 | | | 09/25/35 | | | | 68,947 | |
| | 5,680 | | | CSFB Mortgage-Backed Pass-Through Certificates Series 2005-10 2A1 | | | | | 5.2500 | | | 01/01/25 | | | | — | |
| | 405,630 | | | CSFB Mortgage-Backed Pass-Through Certificates Series 2002-9 1A2 | | | | | 7.5000 | | | 03/25/32 | | | | 360,767 | |
| | 83,151 | | | CSFB Mortgage-Backed Pass-Through Certificates Series 2003-AR24 3A1(b) | | | | | 5.7370 | | | 10/25/33 | | | | 76,309 | |
| | 61,933 | | | CSFB Mortgage-Backed Pass-Through Certificates Series 2003-27 4A4 | | | | | 5.7500 | | | 11/25/33 | | | | 57,357 | |
| | 397,386 | | | CSFB Mortgage-Backed Pass-Through Certificates Series 2004-4 1A5 | | | | | 6.0000 | | | 08/25/34 | | | | 357,813 | |
| | 25,816 | | | CSFB Mortgage-Backed Pass-Through Certificates Series 2005-3 7A5 | | | | | 5.7500 | | | 07/25/35 | | | | 25,233 | |
| | 33,258 | | | CSMC Series Series 2010-18R 4A4(b),(c) | | | | | 3.5000 | | | 04/26/38 | | | | 31,512 | |
| | 1,750,649 | | | CSMC Series Series 2022-7R 1A1(c),(d) | | SOFR30A + 4.500% | | | 9.8240 | | | 10/25/66 | | | | 1,679,246 | |
| | 308,713 | | | CSMC Trust Series 2007-5R A5 | | | | | 6.5000 | | | 07/26/36 | | | | 74,375 | |
| | 279,423 | | | CSMC Trust Series 2021-RPL2 M3(b),(c) | | | | | 3.6350 | | | 01/25/60 | | | | 191,330 | |
| | 500,782 | | | Deutsche Alt-B Securities Mortgage Loan Trust Series AB1 PO(f) | | | | | 0.0000 | | | 04/25/37 | | | | 228,941 | |
| | 30,559 | | | Deutsche Mortgage Sec Inc Mort Loan Tr Series 2004-1 1A1 | | | | | 5.5000 | | | 09/25/33 | | | | 29,380 | |
| | 2,799,804 | | | Deutsche Mortgage Securities Inc Mortgage Loan Series PR1 5AF4(c),(d) | | TSFR1M + 0.454% | | | 5.7710 | | | 04/15/36 | | | | 2,281,649 | |
| | 303,881 | | | DSLA Mortgage Loan Trust Series 2004-AR4 2A1A(d) | | TSFR1M + 0.834% | | | 6.1550 | | | 01/19/45 | | | | 228,076 | |
| | 400,000 | | | Ellington Financial Mortgage Trust Series 2022-1 B2(b),(c) | | | | | 3.8740 | | | 01/25/67 | | | | 262,003 | |
| | 620,914 | | | Fannie Mae Grantor Trust Series 2004-T5 AB1(b) | | | | | 8.2100 | | | 05/28/35 | | | | 562,877 | |
| | 186,220 | | | Fannie Mae Trust Series 2005-W3 3A(b) | | | | | 4.2620 | | | 04/25/45 | | | | 176,568 | |
| | 41,117 | | | Financial Asset Securities Corp AAA Trust Series 2005-2 A3(c),(d) | | TSFR1M + 0.414% | | | 5.7420 | | | 11/26/35 | | | | 34,055 | |
| | 128,095 | | | First Horizon Alternative Mortgage Securities Series 2004-AA1 A1(b) | | | | | 6.8760 | | | 06/25/34 | | | | 117,962 | |
| | 8,772 | | | First Horizon Alternative Mortgage Securities Series 2004-AA3 A1(b) | | | | | 5.8220 | | | 09/25/34 | | | | 8,534 | |
| | 56,670 | | | First Horizon Alternative Mortgage Securities Series AA7 2A2(b) | | | | | 6.8460 | | | 02/25/35 | | | | 48,299 | |
| | 72,257 | | | First Horizon Alternative Mortgage Securities Series 2007-FA4 1A8 | | | | | 6.2500 | | | 08/25/37 | | | | 28,363 | |
| | 511,338 | | | First Horizon Mortgage Pass-Through Trust Series 2005-AR3 2A1(b) | | | | | 5.4610 | | | 08/25/35 | | | | 352,112 | |
| | 29,935 | | | First Horizon Mortgage Pass-Through Trust Series 2005-AR5 3A1(b) | | | | | 0.0000 | | | 10/25/35 | | | | 16,591 | |
| | 501 | | | First Horizon Mortgage Pass-Through Trust Series 2005-AR5 1A1(b) | | | | | 0.0000 | | | 11/25/35 | | | | 445 | |
| | 98,235 | | | First Horizon Mortgage Pass-Through Trust Series 2006-AR3 1A1(b) | | | | | 4.0100 | | | 11/25/36 | | | | 53,812 | |
| | 237,306 | | | First Horizon Mortgage Pass-Through Trust Series 2007-AR3 1A1(b) | | | | | 4.8450 | | | 11/25/37 | | | | 100,394 | |
See accompanying notes to financial statements
EASTERLY INCOME OPPORTUNITIES FUND
SCHEDULE OF INVESTMENTS (Unaudited) (Continued)
May 31, 2024
Principal
Amount ($) | | | | | Spread | | | Coupon Rate (%) | | | Maturity | | | Fair Value | |
| | | | | ASSET BACKED SECURITIES — 76.8% (Continued) | | | | | | | | | | | | | |
| | | | | COLLATERALIZED MORTGAGE OBLIGATIONS — 31.7% (Continued) | | | | | | | | | | | | | |
| | 1,109,000 | | | Flagstar Mortgage Trust Series 2017-1 B5(b),(c) | | | | | 3.6420 | | | 03/25/47 | | | $ | 727,418 | |
| | 348,387 | | | Flagstar Mortgage Trust Series 2018-3INV B4(b),(c) | | | | | 4.4550 | | | 05/25/48 | | | | 289,339 | |
| | 270,759 | | | Flagstar Mortgage Trust Series 2019-2 B3(b),(c) | | | | | 4.0070 | | | 12/25/49 | | | | 210,116 | |
| | 94,953 | | | Flagstar Mortgage Trust Series 2021-13IN B5(b),(c) | | | | | 3.3580 | | | 12/30/51 | | | | 60,036 | |
| | 1,000,000 | | | Freddie Mac STACR REMIC Trust Series 2022-HQA1 M2(c),(d) | | SOFR30A + 5.250% | | | 10.5740 | | | 03/25/42 | | | | 1,084,708 | |
| | 1,000,000 | | | Freddie Mac STACR Trust Series 2019-DNA3 B2(c),(d) | | SOFR30A + 8.264% | | | 13.5880 | | | 07/25/49 | | | | 1,159,491 | |
| | 84,100 | | | Freddie Mac Structured Pass-Through Certificates Series T-61 1A1(d) | | 12MTA + 1.400% | | | 6.4890 | | | 07/25/44 | | | | 77,940 | |
| | 133,554 | | | Freddie Mac Structured Pass-Through Certificates Series T-62 1A1(d) | | 12MTA + 1.200% | | | 6.2890 | | | 10/25/44 | | | | 120,939 | |
| | 845,411 | | | Global Mortgage Securitization Ltd. Series 2004-A A3(c),(b) | | | | | 7.5720 | | | 11/25/32 | | | | 819,795 | |
| | 81,349 | | | GMACM Mortgage Loan Trust Series 2004-J2 A8 | | | | | 5.7500 | | | 06/25/34 | | | | 78,067 | |
| | 1,861,058 | | | GMACM Mortgage Loan Trust Series 2005-AR5 4A1(b) | | | | | 4.1370 | | | 09/19/35 | | | | 1,551,472 | |
| | 111,769 | | | GMACM Mortgage Loan Trust Series 2006-AR1 1A1(b) | | | | | 3.6420 | | | 04/19/36 | | | | 82,405 | |
| | 102,318 | | | GS Mortgage Securities Corporation II Series 2000-1A A(c),(d) | | TSFR1M + 0.464% | | | 5.7850 | | | 06/20/24 | | | | 96,394 | |
| | 401,423 | | | GS Mortgage-Backed Securities Corp Trust Series 2019-PJ1 B3(b),(c) | | | | | 4.0420 | | | 08/25/49 | | | | 308,314 | |
| | 1,083,609 | | | GSMPS Mortgage Loan Trust Series 2000-1 A(b),(c) | | | | | 8.5000 | | | 06/19/29 | | | | 987,206 | |
| | 992,545 | | | GSMPS Mortgage Loan Trust Series 2004-4 1AF(c),(d) | | TSFR1M + 0.514% | | | 5.8390 | | | 06/25/34 | | | | 872,660 | |
| | 1,682,547 | | | GSMPS Mortgage Loan Trust Series 2004-4 1A2(c) | | | | | 7.5000 | | | 06/25/34 | | | | 1,608,200 | |
| | 299,909 | | | GSMPS Mortgage Loan Trust Series 2004-4 1A3(c) | | | | | 8.0000 | | | 06/25/34 | | | | 285,672 | |
| | 30,067 | | | GSMPS Mortgage Loan Trust Series 2005-RP2 1AF(c),(d) | | TSFR1M + 0.464% | | | 5.7890 | | | 03/25/35 | | | | 27,341 | |
| | 158,050 | | | GSMPS Mortgage Loan Trust Series 2005-RP3 1AF(c),(d) | | TSFR1M + 0.464% | | | 5.7890 | | | 09/25/35 | | | | 127,656 | |
| | 110,106 | | | GSMPS Mortgage Loan Trust Series 2006-RP1 1A2(c) | | | | | 7.5000 | | | 01/25/36 | | | | 94,415 | |
| | 784,959 | | | GSMSC Pass-Through Trust Series 2008-2R 2A1(b),(c) | | | | | 7.5000 | | | 10/25/36 | | | | 89,617 | |
| | 102,287 | | | GSR Mortgage Loan Trust Series 2003-3F 1A6 | | | | | 6.0000 | | | 04/25/33 | | | | 93,483 | |
| | 96,044 | | | GSR Mortgage Loan Trust Series 2004-7 1A1(b) | | | | | 4.0900 | | | 06/25/34 | | | | 82,405 | |
| | 557,965 | | | GSR Mortgage Loan Trust Series 2004-12 1B1(d) | | TSFR1M + 0.714% | | | 6.0390 | | | 12/25/34 | | | | 234,496 | |
| | 41,155 | | | GSR Mortgage Loan Trust Series 2005-4F 6A1 | | | | | 6.5000 | | | 02/25/35 | | | | 38,168 | |
| | 14,111 | | | GSR Mortgage Loan Trust Series 2005-AR3 2A1(d) | | TSFR1M + 0.554% | | | 5.8790 | | | 05/25/35 | | | | 10,451 | |
| | 26,478 | | | GSR Mortgage Loan Trust Series 2005-AR3 1A1(d) | | TSFR1M + 0.554% | | | 5.8790 | | | 05/25/35 | | | | 22,300 | |
| | 4,478 | | | GSR Mortgage Loan Trust Series 2005-6F 1A7 | | | | | 5.2500 | | | 07/25/35 | | | | 3,975 | |
| | 527,985 | | | GSR Mortgage Loan Trust Series 2005-AR4 2A1(b) | | | | | 5.3370 | | | 07/25/35 | | | | 277,548 | |
| | 27,593 | | | GSR Mortgage Loan Trust Series 2005-8F 3A4 | | | | | 6.0000 | | | 11/25/35 | | | | 10,019 | |
| | 111,245 | | | GSR Mortgage Loan Trust Series 2006-1F 2A16 | | | | | 6.0000 | | | 02/25/36 | | | | 48,938 | |
| | 2,358,115 | | | GSR Mortgage Loan Trust Series 2006-10F 4A1(d) | | TSFR1M + 0.464% | | | 5.7890 | | | 01/25/37 | | | | 352,917 | |
| | 70,948 | | | GSR Mortgage Loan Trust Series 2007-AR2 2A1(b) | | | | | 5.0330 | | | 05/25/37 | | | | 38,111 | |
See accompanying notes to financial statements
EASTERLY INCOME OPPORTUNITIES FUND
SCHEDULE OF INVESTMENTS (Unaudited) (Continued)
May 31, 2024
Principal
Amount ($) | | | | | Spread | | | Coupon Rate (%) | | | Maturity | | | Fair Value | |
| | | | | ASSET BACKED SECURITIES — 76.8% (Continued) | | | | | | | | | | | | | |
| | | | | COLLATERALIZED MORTGAGE OBLIGATIONS — 31.7% (Continued) | | | | | | | | | | | | | |
| | 212,809 | | | HarborView Mortgage Loan Trust Series 2003-1 A(b) | | | | | 5.7820 | | | 05/19/33 | | | $ | 175,767 | |
| | 1,329,962 | | | HarborView Mortgage Loan Trust Series 2004-7 4A(b) | | | | | 5.2650 | | | 11/19/34 | | | | 1,195,377 | |
| | 106,955 | | | HarborView Mortgage Loan Trust Series 2005-4 3A1(b) | | | | | 5.0710 | | | 07/19/35 | | | | 74,136 | |
| | 35,899 | | | HarborView Mortgage Loan Trust Series 2005-14 2A1A(b) | | | | | 6.5680 | | | 12/19/35 | | | | 22,978 | |
| | 85,000 | | | HomeBanc Mortgage Trust Series 2005-3 M3(d) | | TSFR1M + 0.879% | | | 6.2040 | | | 07/25/35 | | | | 84,188 | |
| | 183,583 | | | HSI Asset Loan Obligation Trust Series 2007-AR1 4A1(b) | | | | | 4.4860 | | | 01/25/37 | | | | 138,149 | |
| | 201,637 | | | HSI Asset Loan Obligation Trust Series 2007-1 2A12 | | | | | 6.5000 | | | 06/25/37 | | | | 75,898 | |
| | 158,417 | | | HSI Asset Loan Obligation Trust Series 2007-AR2 4A1(b) | | | | | 4.5170 | | | 09/25/37 | | | | 114,753 | |
| | 263,202 | | | Hundred Acre Wood Trust Series 2021-INV1 B1(b),(c) | | | | | 3.2260 | | | 07/25/51 | | | | 217,263 | |
| | 165,991 | | | Hundred Acre Wood Trust Series 2021-INV1 B2(b),(c) | | | | | 3.2260 | | | 07/25/51 | | | | 130,572 | |
| | 757,724 | | | Hundred Acre Wood Trust Series 2021-INV3 B1(b),(c) | | | | | 3.3120 | | | 10/25/51 | | | | 620,180 | |
| | 138,209 | | | Hundred Acre Wood Trust Series 2021-INV3 B3(b),(c) | | | | | 3.3120 | | | 12/25/51 | | | | 102,623 | |
| | 48,855 | | | Impac CMB Trust Series 2003-2F M2(e) | | | | | 6.5700 | | | 01/25/33 | | | | 47,222 | |
| | 53,263 | | | Impac CMB Trust Series 2003-4 3M2(e) | | | | | 5.7290 | | | 07/25/33 | | | | 50,519 | |
| | 25,055 | | | Impac CMB Trust Series 2004-7 M4(d) | | TSFR1M + 1.914% | | | 7.2390 | | | 11/25/34 | | | | 24,597 | |
| | 35,090 | | | Impac CMB Trust Series 2004-10 3M2(d) | | TSFR1M + 0.999% | | | 6.3240 | | | 03/25/35 | | | | 30,555 | |
| | 277,436 | | | Impac CMB Trust Series 2005-4 2M1(d) | | TSFR1M + 0.614% | | | 6.1890 | | | 05/25/35 | | | | 253,393 | |
| | 705,666 | | | Impac CMB Trust Series 2005-4 2M2(d) | | TSFR1M + 0.864% | | | 6.5640 | | | 05/25/35 | | | | 659,137 | |
| | 574,852 | | | Impac CMB Trust Series 2005-8 2M1(d) | | TSFR1M + 0.864% | | | 6.1890 | | | 02/25/36 | | | | 518,581 | |
| | 35,585 | | | Impac CMB Trust Series Series 2004-10 3M3(d) | | TSFR1M + 1.089% | | | 6.4140 | | | 03/25/35 | | | | 32,647 | |
| | 36,049 | | | Impac CMB Trust Series Series 2005-2 2B(d) | | TSFR1M + 2.589% | | | 7.9140 | | | 04/25/35 | | | | 33,966 | |
| | 124,707 | | | Impac CMB Trust Series Series 2005-8 2M3(d) | | TSFR1M + 2.364% | | | 7.6890 | | | 02/25/36 | | | | 117,824 | |
| | 112,610 | | | Impac CMB Trust Series Series 2005-8 2B(d) | | TSFR1M + 2.364% | | | 7.6890 | | | 02/25/36 | | | | 104,560 | |
| | 185,531 | | | Impac Secured Assets CMN Owner Trust Series 2003-2 A2 | | | | | 6.0000 | | | 08/25/33 | | | | 144,952 | |
| | 81,061 | | | Impac Secured Assets Trust Series 2006-1 2A1(d) | | TSFR1M + 0.814% | | | 6.1390 | | | 05/25/36 | | | | 77,938 | |
| | 867,261 | | | IndyMac INDA Mortgage Loan Trust Series 2006-AR1 A2(d) | | TSFR1M + 0.714% | | | 6.0390 | | | 08/25/36 | | | | 632,345 | |
| | 17,884 | | | IndyMac INDX Mortgage Loan Trust Series 2004-AR11 2A(b) | | | | | 4.6890 | | | 12/25/34 | | | | 15,236 | |
| | 233,199 | | | IndyMac INDX Mortgage Loan Trust Series 2004-AR15 3A1(b) | | | | | 4.9360 | | | 02/25/35 | | | | 205,957 | |
| | 236,097 | | | IndyMac INDX Mortgage Loan Trust Series 2005-AR8 2A1A(d) | | TSFR1M + 0.574% | | | 5.8990 | | | 04/25/35 | | | | 194,034 | |
| | 196,256 | | | IndyMac INDX Mortgage Loan Trust Series 2005-AR13 1A1(b) | | | | | 4.1660 | | | 08/25/35 | | | | 86,453 | |
| | 245,962 | | | JP Morgan Alternative Loan Trust Series 2005-S1 1A8(a),(d) | | TSFR1M + 7.036% | | | 1.7110 | | | 12/25/35 | | | | 19,121 | |
| | 873,132 | | | JP Morgan Alternative Loan Trust Series A1 1A2(d) | | TSFR1M + 0.714% | | | 6.0390 | | | 03/25/36 | | | | 775,214 | |
| | 938,563 | | | JP Morgan Alternative Loan Trust Series 2008-R4 1A1(c) | | | | | 6.0000 | | | 12/27/36 | | | | 477,049 | |
| | 362,038 | | | JP Morgan MBS Series Series 2006-R1 6A1(b),(c) | | | | | 5.7180 | | | 09/28/44 | | | | 275,261 | |
See accompanying notes to financial statements
EASTERLY INCOME OPPORTUNITIES FUND
SCHEDULE OF INVESTMENTS (Unaudited) (Continued)
May 31, 2024
Principal
Amount ($) | | | | | Spread | | | Coupon Rate (%) | | | Maturity | | | Fair Value | |
| | | | | ASSET BACKED SECURITIES — 76.8% (Continued) | | | | | | | | | | | | | |
| | | | | COLLATERALIZED MORTGAGE OBLIGATIONS — 31.7% (Continued) | | | | | | | | | | | | | |
| | 25,550 | | | JP Morgan Mortgage Trust Series 2006-A2 5A4(b) | | | | | 6.0930 | | | 11/25/33 | | | $ | 22,956 | |
| | 5,058 | | | JP Morgan Mortgage Trust Series 2004-A3 3A3(b) | | | | | 4.9930 | | | 07/25/34 | | | | 4,663 | |
| | 21,379 | | | JP Morgan Mortgage Trust Series 2004-S2 4A5 | | | | | 6.0000 | | | 11/25/34 | | | | 18,700 | |
| | 26,857 | | | JP Morgan Mortgage Trust Series 2005-A7 1A4(b) | | | | | 5.3080 | | | 10/25/35 | | | | 25,494 | |
| | 823,703 | | | JP Morgan Mortgage Trust Series 2005-S3 1A22 | | | | | 5.5000 | | | 01/25/36 | | | | 353,672 | |
| | 15,000 | | | JP Morgan Mortgage Trust Series 2006-A4 3A1(b) | | | | | 4.8930 | | | 06/25/36 | | | | 10,378 | |
| | 173,001 | | | JP Morgan Mortgage Trust Series 2006-A7 2A4R(b) | | | | | 4.3690 | | | 01/25/37 | | | | 124,896 | |
| | 142,057 | | | JP Morgan Mortgage Trust Series 2006-A7 2A1R(b) | | | | | 4.3690 | | | 01/25/37 | | | | 100,423 | |
| | 19,084 | | | JP Morgan Mortgage Trust Series 2018-8 A3(b),(c) | | | | | 4.0000 | | | 01/25/49 | | | | 16,626 | |
| | 181,180 | | | JP Morgan Mortgage Trust Series 2019-8 B4(b),(c) | | | | | 4.1750 | | | 03/25/50 | | | | 146,318 | |
| | 208,033 | | | JP Morgan Mortgage Trust Series Series 2008-R2 2A(b),(c) | | | | | 5.5000 | | | 12/27/35 | | | | 157,809 | |
| | 116,511 | | | JP Morgan Tax-Emept Pass-Through Trust Series Series 2012-3 A(b),(c) | | | | | 3.0000 | | | 10/27/42 | | | | 102,212 | |
| | 154,641 | | | JPMorgan Chase Bank NA - CHASE Series 2020-CL1 M3(d) | | TSFR1M + 3.464% | | | 8.7890 | | | 10/25/57 | | | | 160,552 | |
| | 2,500,392 | | | La Hipotecaria Panamanian Mortgage Trust Series 2021-1 GA(c) | | | | | 4.3500 | | | 07/13/52 | | | | 2,213,069 | |
| | 132,971 | | | Lehman Mortgage Trust Series 2006-2 2A3 | | | | | 5.7500 | | | 04/25/36 | | | | 126,676 | |
| | 39,884 | | | MASTR Adjustable Rate Mortgages Trust Series 2003-1 2A1(b) | | | | | 4.3410 | | | 12/25/32 | | | | 35,514 | |
| | 16,363 | | | MASTR Adjustable Rate Mortgages Trust Series 2003-2 4A1(b) | | | | | 5.5420 | | | 07/25/33 | | | | 14,543 | |
| | 36,502 | | | MASTR Adjustable Rate Mortgages Trust Series 2003-6 2A1(b) | | | | | 4.8400 | | | 12/25/33 | | | | 32,548 | |
| | 18,823 | | | MASTR Adjustable Rate Mortgages Trust Series 2003-6 7A1(b) | | | | | 6.1250 | | | 12/25/33 | | | | 18,542 | |
| | 43,947 | | | MASTR Adjustable Rate Mortgages Trust Series 2003-7 B1(b) | | | | | 6.3170 | | | 01/25/34 | | | | 38,697 | |
| | 47,508 | | | MASTR Adjustable Rate Mortgages Trust Series 2004-4 1A1(b) | | | | | 7.2830 | | | 04/25/34 | | | | 41,586 | |
| | 28,527 | | | MASTR Adjustable Rate Mortgages Trust Series 2004-10(b) | | | | | 5.4740 | | | 10/25/34 | | | | 22,123 | |
| | 170,869 | | | MASTR Adjustable Rate Mortgages Trust Series 2004-15 4A1(b) | | | | | 4.5810 | | | 12/25/34 | | | | 158,936 | |
| | 222,731 | | | MASTR Adjustable Rate Mortgages Trust Series 2005-7 3A1(b) | | | | | 3.8660 | | | 09/25/35 | | | | 131,361 | |
| | 98,600 | | | MASTR Adjustable Rate Mortgages Trust Series 2006-2 5A1(b) | | | | | 4.3590 | | | 05/25/36 | | | | 32,101 | |
| | 133,251 | | | MASTR Alternative Loan Trust Series 2003-3 B2(b) | | | | | 6.1810 | | | 05/25/33 | | | | 117,808 | |
| | 510,182 | | | MASTR Alternative Loan Trust Series 2003-5 8A1 | | | | | 5.5000 | | | 06/25/33 | | | | 461,940 | |
| | 51,899 | | | MASTR Alternative Loan Trust Series 2003-7 6A1 | | | | | 6.5000 | | | 12/25/33 | | | | 51,887 | |
| | 98,032 | | | MASTR Alternative Loan Trust Series 2004-1 2A1 | | | | | 7.0000 | | | 01/25/34 | | | | 90,604 | |
| | 170,118 | | | MASTR Alternative Loan Trust Series 2004-1 4A1 | | | | | 5.5000 | | | 02/25/34 | | | | 157,287 | |
| | 53,114 | | | MASTR Alternative Loan Trust Series 2004-3 2A1 | | | | | 6.2500 | | | 04/25/34 | | | | 52,158 | |
| | 195,216 | | | MASTR Alternative Loan Trust Series 2004-3 6A1 | | | | | 6.5000 | | | 04/25/34 | | | | 183,116 | |
| | 22,490 | | | MASTR Alternative Loan Trust Series 2004-4 1A1 | | | | | 5.5000 | | | 05/25/34 | | | | 21,302 | |
| | 51,576 | | | MASTR Alternative Loan Trust Series 2004-7 10A1 | | | | | 6.0000 | | | 06/25/34 | | | | 46,323 | |
See accompanying notes to financial statements
EASTERLY INCOME OPPORTUNITIES FUND
SCHEDULE OF INVESTMENTS (Unaudited) (Continued)
May 31, 2024
Principal
Amount ($) | | | | | Spread | | | Coupon Rate (%) | | | Maturity | | | Fair Value | |
| | | | | ASSET BACKED SECURITIES — 76.8% (Continued) | | | | | | | | | | | | | |
| | | | | COLLATERALIZED MORTGAGE OBLIGATIONS — 31.7% (Continued) | | | | | | | | | | | | | |
| | 39,407 | | | MASTR Alternative Loan Trust Series 2004-6 10A1 | | | | | 6.0000 | | | 07/25/34 | | | $ | 36,465 | |
| | 161,680 | | | MASTR Alternative Loan Trust Series 2004-6 7A1 | | | | | 6.0000 | | | 07/25/34 | | | | 149,506 | |
| | 668,387 | | | MASTR Alternative Loan Trust Series 2004-6 6A1 | | | | | 6.5000 | | | 07/25/34 | | | | 642,108 | |
| | 811,245 | | | MASTR Alternative Loan Trust Series 2004-7 9A1 | | | | | 6.0000 | | | 08/25/34 | | | | 787,854 | |
| | 1,637,141 | | | MASTR Alternative Loan Trust Series 2004-13 10A3 | | | | | 5.7500 | | | 01/25/35 | | | | 1,360,702 | |
| | 24,753 | | | MASTR Alternative Loan Trust Series 2007-1 30PO(f) | | | | | 0.0000 | | | 10/25/36 | | | | 13,533 | |
| | 2,139 | | | MASTR Alternative Loan Trust Series 2005-1 5A1 | | | | | 5.5000 | | | 12/25/41 | | | | 1,822 | |
| | 300,341 | | | MASTR Alternative Loan Trust Series 2005-2 6A1 | | | | | 5.0000 | | | 03/25/43 | | | | 223,123 | |
| | 866,086 | | | MASTR Alternative Loan Trust Series 2007-HF1 4PO(f) | | | | | 0.0000 | | | 10/25/47 | | | | 9 | |
| | 19,713 | | | MASTR Asset Securitization Trust Series 2003-12 6A1 | | | | | 5.0000 | | | 12/25/33 | | | | 18,368 | |
| | 46,694 | | | MASTR Asset Securitization Trust Series 2003-12 6A2 | | | | | 5.0000 | | | 12/25/33 | | | | 38,952 | |
| | 46,305 | | | MASTR Asset Securitization Trust Series 2003-11 9A6 | | | | | 5.2500 | | | 12/25/33 | | | | 44,123 | |
| | 60,770 | | | MASTR Asset Securitization Trust Series 2003-11 7A5 | | | | | 5.2500 | | | 12/25/33 | | | | 56,621 | |
| | 8,342 | | | MASTR Asset Securitization Trust Series 2003-11 2A10 | | | | | 5.5000 | | | 12/25/33 | | | | 7,796 | |
| | 177,852 | | | MASTR Asset Securitization Trust Series 2003-11 8A1 | | | | | 5.5000 | | | 12/25/33 | | | | 153,445 | |
| | 8,467 | | | MASTR Asset Securitization Trust Series 2004-1 1A12 | | | | | 5.5000 | | | 02/25/34 | | | | 7,900 | |
| | 2,874,522 | | | MASTR Asset Securitization Trust Series 2004-9 4A1 | | | | | 6.0000 | | | 09/25/34 | | | | 2,136,743 | |
| | 67,705 | | | MASTR Asset Securitization Trust Series 2005-1 2A9 | | | | | 5.5000 | | | 05/25/35 | | | | 51,795 | |
| | 4,115,554 | | | MASTR Asset Securitization Trust Series 2006-2 2A2(d) | | TSFR1M + 0.614% | | | 5.9390 | | | 06/25/36 | | | | 829,439 | |
| | 2,174,712 | | | MASTR Asset Securitization Trust Series 2006-3 2A1(d) | | TSFR1M + 0.564% | | | 5.8890 | | | 10/25/36 | | | | 367,526 | |
| | 16,747 | | | MASTR Reperforming Loan Trust Series 2005-2 1A4(c) | | | | | 8.0000 | | | 05/25/35 | | | | 12,265 | |
| | 132,927 | | | MASTR Reperforming Loan Trust Series 2006-2 2A1(b),(c) | | | | | 3.6560 | | | 05/25/36 | | | | 118,298 | |
| | 15,924 | | | MASTR Seasoned Securitization Trust Series 2005-1 3A1(b) | | | | | 4.9530 | | | 10/25/32 | | | | 12,916 | |
| | 54,332 | | | MASTR Seasoned Securitization Trust Series 2004-1 4A1(b) | | | | | 6.2190 | | | 10/25/32 | | | | 48,841 | |
| | 352,055 | | | MASTR Seasoned Securitization Trust Series 2003-1 2A1 | | | | | 6.0000 | | | 02/25/33 | | | | 329,666 | |
| | 880,000 | | | Mello Mortgage Capital Acceptance Series 2018-MTG2 B5(b),(c) | | | | | 4.3170 | | | 10/25/48 | | | | 653,313 | |
| | 553,134 | | | Mello Mortgage Capital Acceptance Series 2021-MTG1 B1(b),(c) | | | | | 2.6470 | | | 04/25/51 | | | | 427,158 | |
| | 33,773 | | | Merrill Lynch Mortgage Investors Trust MLMI Series Series 2003-A4 3A(b) | | | | | 6.2660 | | | 05/25/33 | | | | 30,265 | |
| | 154,407 | | | Merrill Lynch Mortgage Investors Trust MLMI Series Series 2005-A4 1A(b) | | | | | 5.1340 | | | 07/25/35 | | | | 60,212 | |
| | 30,886 | | | Merrill Lynch Mortgage Investors Trust Series Series 2003-A6 1A(b) | | | | | 5.6270 | | | 09/25/33 | | | | 28,501 | |
| | 130,558 | | | Merrill Lynch Mortgage Investors Trust Series MLCC Series 2004-HB1(b) | | | | | 5.0820 | | | 04/25/29 | | | | 113,185 | |
| | 267,050 | | | Merrill Lynch Mortgage Investors Trust Series MLCC Series B B1(d) | | TSFR1M + 0.714% | | | 6.0390 | | | 07/25/30 | | | | 228,063 | |
See accompanying notes to financial statements
EASTERLY INCOME OPPORTUNITIES FUND
SCHEDULE OF INVESTMENTS (Unaudited) (Continued)
May 31, 2024
Principal
Amount ($) | | | | | Spread | | | Coupon Rate (%) | | | Maturity | | | Fair Value | |
| | | | | ASSET BACKED SECURITIES — 76.8% (Continued) | | | | | | | | | | | | | |
| | | | | COLLATERALIZED MORTGAGE OBLIGATIONS — 31.7% (Continued) | | | | | | | | | | | | | |
| | 43,523 | | | Merrill Lynch Mortgage Investors Trust Series MLCC Series 2007-3 2A2(b) | | | | | 3.6600 | | | 09/25/37 | | | $ | 32,200 | |
| | 1,000,000 | | | MFA Trust Series 2022-RPL1 M1(b),(c) | | | | | 4.2970 | | | 08/25/61 | | | | 816,420 | |
| | 50,581 | | | Morgan Stanley Dean Witter Capital I Inc Trust Series 2003-HYB1 A3(b) | | | | | 6.2860 | | | 03/25/33 | | | | 43,381 | |
| | 94,215 | | | Morgan Stanley Mortgage Loan Trust Series 2006-7 1A | | | | | 5.0000 | | | 04/25/25 | | | | 72,798 | |
| | 15,842 | | | Morgan Stanley Mortgage Loan Trust Series 2004-2AR 2A(b) | | | | | 6.8460 | | | 02/25/34 | | | | 14,598 | |
| | 23,118 | | | Morgan Stanley Mortgage Loan Trust Series 2004-8AR 2A(b) | | | | | 4.1060 | | | 10/25/34 | | | | 20,458 | |
| | 17,151 | | | Morgan Stanley Mortgage Loan Trust Series 2004-8AR 4A1(b) | | | | | 5.5500 | | | 10/25/34 | | | | 14,862 | |
| | 14,083 | | | Morgan Stanley Mortgage Loan Trust Series 2004-10AR 2A2(b) | | | | | 6.1590 | | | 11/25/34 | | | | 12,586 | |
| | 705,205 | | | Morgan Stanley Mortgage Loan Trust Series 2005-1 4A1(d) | | TSFR1M + 0.414% | | | 5.7390 | | | 03/25/35 | | | | 654,443 | |
| | 73,878 | | | Morgan Stanley Mortgage Loan Trust Series 2005-10 5A1 | | | | | 6.0000 | | | 12/25/35 | | | | 28,424 | |
| | 11,434 | | | Morgan Stanley Mortgage Loan Trust Series 2006-8AR 4A2(b) | | | | | 7.5000 | | | 06/25/36 | | | | 9,798 | |
| | 1,978,928 | | | Mortgage Equity Conversion Asset Trust Series 2007-FF2 A(c),(d) | | H15T1Y + 0.470% | | | 5.4600 | | | 02/25/42 | | | | 1,941,198 | |
| | 2,695,194 | | | Mortgage Loan Resecuritization Trust Series 2009-RS1 B15(c),(d) | | TSFR1M + 0.454% | | | 5.7680 | | | 04/16/36 | | | | 1,700,887 | |
| | 122,392 | | | MortgageIT Trust Series 2004-2 B2(d) | | TSFR1M + 3.339% | | | 8.6640 | | | 12/25/34 | | | | 117,311 | |
| | 222,838 | | | MortgageIT Trust Series 2005-3 M2(d) | | TSFR1M + 0.909% | | | 6.2340 | | | 08/25/35 | | | | 207,967 | |
| | 115,084 | | | MRFC Mortgage Pass-Through Trust Series Series 2000-TBC3 B4(b),(c) | | | | | 6.0330 | | | 12/15/30 | | | | 103,518 | |
| | 535,397 | | | National City Mortgage Capital Trust Series 2008-1 2A1 | | | | | 6.0000 | | | 03/25/38 | | | | 518,025 | |
| | 26,110 | | | National City Mortgage Capital Trust Series 2008-1 2A2 | | | | | 6.0000 | | | 03/25/38 | | | | 25,261 | |
| | 313,367 | | | New Residential Mortgage Loan Trust Series 2017-2A B2(b),(c) | | | | | 4.7500 | | | 03/25/57 | | | | 261,592 | |
| | 720,000 | | | New Residential Mortgage Loan Trust Series 2020-RPL1 B3(b),(c) | | | | | 3.8730 | | | 11/25/59 | | | | 489,429 | |
| | 142,841 | | | Nomura Asset Acceptance Corp Alternative Loan Series 2004-R1 A2(c) | | | | | 7.5000 | | | 03/25/34 | | | | 125,826 | |
| | 512,879 | | | Nomura Asset Acceptance Corp Alternative Loan Series 2005-AR3 1A1(d) | | TSFR1M + 0.634% | | | 5.9590 | | | 07/25/35 | | | | 357,039 | |
| | 76,212 | | | Nomura Asset Acceptance Corp Alternative Loan Series 2007-1 1A3(e) | | | | | 6.4570 | | | 03/25/47 | | | | 70,952 | |
| | 3,599,046 | | | Ocwen Residential MBS Corporation Series 1998-R3 AWAC(b),(c) | | | | | 0.0000 | | | 09/25/38 | | | | 206,945 | |
| | 131,533 | | | Ocwen Residential MBS Corporation Series 1999-R2 B2(b),(c) | | | | | 0.6610 | | | 06/25/39 | | | | 90,191 | |
| | 364,223 | | | PHHMC Series Trust Series 2005-4 A8(b) | | | | | 5.8840 | | | 07/18/35 | | | | 342,486 | |
| | 345,383 | | | Prime Mortgage Trust Series 2003-3 A9 | | | | | 5.5000 | | | 01/25/34 | | | | 323,428 | |
| | 450,476 | | | Provident Funding Mortgage Trust Series 2020-1 B3(b),(c) | | | | | 3.2450 | | | 02/25/50 | | | | 362,919 | |
| | 17,693 | | | RAAC Series Trust Series 2005-SP1 4A1 | | | | | 7.0000 | | | 09/25/34 | | | | 16,883 | |
| | 2,320 | | | RALI Series Trust Series 2005-QA4 A41(b) | | | | | 4.4050 | | | 04/25/35 | | | | 2,230 | |
| | 106,630 | | | RALI Series Trust Series 2005-QA12 CB1(b) | | | | | 5.9160 | | | 12/25/35 | | | | 45,822 | |
| | 330,588 | | | RAMP Series Trust Series 2002-SL1 AII4(b) | | | | | 5.1270 | | | 06/25/32 | | | | 306,799 | |
| | 10,049 | | | RBSGC Mortgage Loan Trust Series 2007-B 3B1(b) | | | | | 5.6220 | | | 01/25/37 | | | | 9,301 | |
See accompanying notes to financial statements
EASTERLY INCOME OPPORTUNITIES FUND
SCHEDULE OF INVESTMENTS (Unaudited) (Continued)
May 31, 2024
Principal
Amount ($) | | | | | Spread | | | Coupon Rate (%) | | | Maturity | | | Fair Value | |
| | | | | ASSET BACKED SECURITIES — 76.8% (Continued) | | | | | | | | | | | | | |
| | | | | COLLATERALIZED MORTGAGE OBLIGATIONS — 31.7% (Continued) | | | | | | | | | | | | | |
| | 315,689 | | | RBSGC Structured Trust Series 2008-A A1(b),(c) | | | | | 5.5000 | | | 11/25/35 | | | $ | 254,824 | |
| | 8,316,763 | | | RBSSP Resecuritization Trust Series 2009-12 19A2(b),(c) | | | | | 4.1590 | | | 12/25/35 | | | | 5,658,555 | |
| | 110,274 | | | Reperforming Loan REMIC Trust Series 2003-R4 2A(b),(c) | | | | | 4.7310 | | | 01/25/34 | | | | 88,181 | |
| | 15,549 | | | Reperforming Loan REMIC Trust Series 2004-R1 2A(c) | | | | | 6.5000 | | | 11/25/34 | | | | 14,429 | |
| | 11,100 | | | Reperforming Loan REMIC Trust Series 2005-R2 2A4(c) | | | | | 8.5000 | | | 06/25/35 | | | | 10,736 | |
| | 76,508 | | | Reperforming Loan REMIC Trust Series 2006-R2 AF1(c),(d) | | TSFR1M + 0.534% | | | 5.8590 | | | 07/25/36 | | | | 67,643 | |
| | 132,027 | | | Resecuritization Pass-Through Trust Series 2005-8R A5 | | | | | 6.0000 | | | 10/25/34 | | | | 124,206 | |
| | 30,000 | | | Residential Asset Securitization Trust Series 2003-A7 A8 | | | | | 5.0000 | | | 07/25/33 | | | | 27,384 | |
| | 1,330,085 | | | Residential Asset Securitization Trust Series 2003-A9 A3(d) | | TSFR1M + 0.664% | | | 5.9890 | | | 08/25/33 | | | | 1,200,878 | |
| | 475,209 | | | Residential Asset Securitization Trust Series 2003-A10 A5 | | | | | 5.2500 | | | 09/25/33 | | | | 427,524 | |
| | 5,210,000 | | | RMF Buyout Issuance Trust Series 2022-HB1 M3(b),(c) | | | | | 4.5000 | | | 04/25/32 | | | | 4,360,818 | |
| | 265,211 | | | RMF Proprietary Issuance Trust Series 2021-2 A(b),(c) | | | | | 2.1250 | | | 09/25/61 | | | | 226,567 | |
| | 1,056,193 | | | RMF Proprietary Issuance Trust Series 2021-2 M1(b),(c) | | | | | 2.1250 | | | 09/25/61 | | | | 814,282 | |
| | 1,000,000 | | | RMF Proprietary Issuance Trust Series 2022-1 M1(b),(c) | | | | | 3.0000 | | | 01/25/62 | | | | 735,698 | |
| | 228,790 | | | RMF Proprietary Issuance Trust Series 2022-1 A1(b),(c) | | | | | 3.0000 | | | 01/25/62 | | | | 188,891 | |
| | 1,000,000 | | | RMF Proprietary Issuance Trust Series 2022-2 M3(b),(c) | | | | | 3.7500 | | | 06/25/62 | | | | 598,207 | |
| | 225,000 | | | RMF Proprietary Issuance Trust Series 2022-3 A(b),(c) | | | | | 4.0000 | | | 08/25/62 | | | | 182,417 | |
| | 1,414 | | | Ryland Mortgage Securities Corporation Series 1994-1 B(b) | | | | | 0.0000 | | | 04/29/30 | | | | — | |
| | 650,000 | | | SBALR Commercial Mortgage Trust Series 2020-RR1 C(b),(c) | | | | | 3.9790 | | | 02/13/53 | | | | 452,775 | |
| | 46,442 | | | Seasoned Credit Risk Transfer Trust Series Series 2017-3 B(f) | | | | | 0.0000 | | | 07/25/56 | | | | 6,047 | |
| | 848,576 | | | Seasoned Credit Risk Transfer Trust Series Series 2019-1 M(b) | | | | | 4.7500 | | | 07/25/58 | | | | 803,655 | |
| | 293,434 | | | Sequoia Mortgage Trust Series 2003-4 1A1(d) | | TSFR1M + 0.734% | | | 6.0550 | | | 07/20/33 | | | | 248,695 | |
| | 30,007 | | | Sequoia Mortgage Trust Series 2004-10 A1A(d) | | TSFR1M + 0.734% | | | 6.0550 | | | 11/20/34 | | | | 27,443 | |
| | 39,776 | | | Sequoia Mortgage Trust Series 2004-10 A3B(d) | | TSFR6M + 1.208% | | | 6.5080 | | | 11/20/34 | | | | 31,879 | |
| | 55,881 | | | Sequoia Mortgage Trust Series 2005-2 A1(d) | | TSFR1M + 0.554% | | | 5.8750 | | | 03/20/35 | | | | 48,391 | |
| | 331,864 | | | Sequoia Mortgage Trust Series 2005-3 B1(d) | | TSFR1M + 0.669% | | | 5.9900 | | | 05/20/35 | | | | 210,467 | |
| | 314,168 | | | Sequoia Mortgage Trust Series 2007-4 1A1(d) | | TSFR1M + 0.894% | | | 6.2150 | | | 01/20/36 | | | | 212,726 | |
| | 302,275 | | | Sequoia Mortgage Trust Series 2007-2 1B1(d) | | TSFR1M + 0.714% | | | 6.0350 | | | 06/20/36 | | | | 233,140 | |
| | 125,023 | | | Sequoia Mortgage Trust Series 2013-6 B1(b),(c) | | | | | 3.5150 | | | 05/25/43 | | | | 117,270 | |
| | 254,937 | | | Sequoia Mortgage Trust Series 2014-4 A6(b),(c) | | | | | 3.5000 | | | 11/25/44 | | | | 225,471 | |
| | 74,418 | | | Sequoia Mortgage Trust Series 2017-1 B3(b),(c) | | | | | 3.6060 | | | 02/25/47 | | | | 55,161 | |
| | 75,382 | | | Shellpoint Co-Originator Trust Series 2017-1 B4(b),(c) | | | | | 3.5890 | | | 04/25/47 | | | | 52,792 | |
| | 100,000 | | | Spruce Hill Mortgage Loan Trust Series 2020-SH1 B2(b),(c) | | | | | 4.6760 | | | 01/28/50 | | | | 84,901 | |
| | 509,334 | | | STARM Mortgage Loan Trust Series 2007-4 3A1(b) | | | | | 4.3810 | | | 10/25/37 | | | | 400,383 | |
See accompanying notes to financial statements
EASTERLY INCOME OPPORTUNITIES FUND
SCHEDULE OF INVESTMENTS (Unaudited) (Continued)
May 31, 2024
Principal
Amount ($) | | | | | Spread | | | Coupon Rate (%) | | | Maturity | | | Fair Value | |
| | | | | ASSET BACKED SECURITIES — 76.8% (Continued) | | | | | | | | | | | | | |
| | | | | COLLATERALIZED MORTGAGE OBLIGATIONS — 31.7% (Continued) | | | | | | | | | | | | | |
| | 45,668 | | | Structured Adjustable Rate Mortgage Loan Trust Series 2004-2 4A1(b) | | | | | 6.0010 | | | 03/25/34 | | | $ | 40,715 | |
| | 61,274 | | | Structured Adjustable Rate Mortgage Loan Trust Series 2004-18 1A3(b) | | | | | 5.2650 | | | 12/25/34 | | | | 51,644 | |
| | 195,733 | | | Structured Adjustable Rate Mortgage Loan Trust Series 2005-4 1A1(b) | | | | | 4.6450 | | | 03/25/35 | | | | 158,823 | |
| | 334,776 | | | Structured Adjustable Rate Mortgage Loan Trust Series 2005-15 1A1(b) | | | | | 4.7470 | | | 07/25/35 | | | | 172,745 | |
| | 738,343 | | | Structured Adjustable Rate Mortgage Loan Trust Series 2006-1 2A2(b) | | | | | 5.0410 | | | 02/25/36 | | | | 649,550 | |
| | 7,168 | | | Structured Adjustable Rate Mortgage Loan Trust Series 2006-8 3AF(d) | | TSFR1M + 0.494% | | | 5.8190 | | | 09/25/36 | | | | 6,184 | |
| | 311,155 | | | Structured Adjustable Rate Mortgage Loan Trust Series 9 2A1(b) | | | | | 4.4200 | | | 10/25/47 | | | | 188,175 | |
| | 155,553 | | | Structured Asset Sec Corp Mort Passthr Certs Ser Series 2003-40A 3A1(b) | | | | | 5.8930 | | | 01/25/34 | | | | 134,901 | |
| | 27,450 | | | Structured Asset Sec Corp Mort Passthr Certs Ser Series 2003-40A 3A2(b) | | | | | 5.8930 | | | 01/25/34 | | | | 26,177 | |
| | 59,389 | | | Structured Asset Securities Corp Mortgage Series 2000-5 B3(b) | | | | | 0.0000 | | | 11/25/30 | | | | 34,763 | |
| | 1,451 | | | Structured Asset Securities Corporation Series 2003-37A B1I(d) | | TSFR1M + 0.894% | | | 6.2220 | | | 12/25/33 | | | | 1,327 | |
| | 15,927 | | | Structured Asset Securities Corporation Series 2004-4XS A3A(e) | | | | | 4.8700 | | | 02/25/34 | | | | 14,895 | |
| | 98,212 | | | Structured Asset Securities Corporation Series 2004-4XS 1A5(e) | | | | | 4.8700 | | | 02/25/34 | | | | 91,814 | |
| | 391,934 | | | Structured Asset Securities Corporation Series 2004-4XS 1M1(e) | | | | | 4.8700 | | | 02/25/34 | | | | 332,156 | |
| | 74,181 | | | Structured Asset Securities Corporation Series 2005-RF2 A(c),(d) | | TSFR1M + 0.464% | | | 5.7890 | | | 04/25/35 | | | | 64,365 | |
| | 91,152 | | | Structured Asset Securities Corporation Series 2005-RF3 2A(b),(c) | | | | | 4.1130 | | | 06/25/35 | | | | 75,936 | |
| | 57,401 | | | Suntrust Alternative Loan Trust Series Series 2005-1F 1A1(d) | | TSFR1M + 0.764% | | | 5.7500 | | | 12/25/35 | | | | 42,960 | |
| | 206,590 | | | TIAA Bank Mortgage Loan Trust Series 2018-2 B3(b),(c) | | | | | 3.6750 | | | 07/25/48 | | | | 168,546 | |
| | 233,635 | | | TIAA Bank Mortgage Loan Trust Series 2018-3 B4(b),(c) | | | | | 4.1020 | | | 11/25/48 | | | | 162,680 | |
| | 230,000 | | | Towd Point Mortgage Trust Series 2015-1 B1(b),(c) | | | | | 4.5780 | | | 10/25/53 | | | | 209,245 | |
| | 580,000 | | | Towd Point Mortgage Trust Series 2015-2 1B3(b),(c) | | | | | 3.7300 | | | 11/25/60 | | | | 497,747 | |
| | 100,000 | | | Verus Securitization Trust Series 2020-INV1 B2(b),(c) | | | | | 6.0000 | | | 03/25/60 | | | | 96,609 | |
| | 31,458 | | | Wachovia Mortgage Loan Trust, LLC Series Series 2006-A 4A1(b) | | | | | 6.2820 | | | 05/20/36 | | | | 30,586 | |
| | 40,710 | | | WaMu Mortgage Pass-Through Certificates Series Series 2002-AR14 B1(b) | | | | | 4.3860 | | | 11/25/32 | | | | 35,528 | |
| | 36,627 | | | WaMu Mortgage Pass-Through Certificates Series Series 2002-AR18 A(b) | | | | | 6.1530 | | | 01/25/33 | | | | 35,147 | |
| | 34,923 | | | WaMu Mortgage Pass-Through Certificates Series Series 2003-S3 1A4 | | | | | 5.5000 | | | 06/25/33 | | | | 31,855 | |
| | 37,988 | | | WaMu Mortgage Pass-Through Certificates Series Series 2003-S5 1A13 | | | | | 5.5000 | | | 06/25/33 | | | | 36,168 | |
| | 232,209 | | | WaMu Mortgage Pass-Through Certificates Series Series 2003-AR9 1A7(b) | | | | | 5.6850 | | | 09/25/33 | | | | 203,698 | |
| | 20,609 | | | WaMu Mortgage Pass-Through Certificates Series Series 2002-AR2 A(d) | | ECOFC + 1.250% | | | 4.4140 | | | 02/27/34 | | | | 17,797 | |
| | 118,497 | | | WaMu Mortgage Pass-Through Certificates Series Series CB3 2A | | | | | 6.5000 | | | 10/25/34 | | | | 116,773 | |
| | 41,297 | | | WaMu Mortgage Pass-Through Certificates Series Series 2006-AR2 1A1(b) | | | | | 4.5850 | | | 03/25/36 | | | | 36,313 | |
See accompanying notes to financial statements
EASTERLY INCOME OPPORTUNITIES FUND
SCHEDULE OF INVESTMENTS (Unaudited) (Continued)
May 31, 2024
Principal
Amount ($) | | | | | Spread | | | Coupon Rate (%) | | | Maturity | | | Fair Value | |
| | | | | ASSET BACKED SECURITIES — 76.8% (Continued) | | | | | | | | | | | | | |
| | | | | COLLATERALIZED MORTGAGE OBLIGATIONS — 31.7% (Continued) | | | | | | | | | | | | | |
| | 84,925 | | | WaMu Mortgage Pass-Through Certificates Series Series 2002-AR17 1A(d) | | 12MTA + 1.200% | | | 6.2890 | | | 11/25/42 | | | $ | 73,186 | |
| | 118,464 | | | WaMu Mortgage Pass-Through Certificates Series Series 2006-AR8 1A1(b) | | | | | 4.3820 | | | 08/25/46 | | | | 104,971 | |
| | 166,407 | | | Washington Mutual MSC Mortgage Pass-Through Series 2003-MS7 A12 | | | | | 5.5000 | | | 03/25/33 | | | | 158,080 | |
| | 46,588 | | | Washington Mutual MSC Mortgage Pass-Through Series 2003-MS9 2A | | | | | 7.5000 | | | 04/25/33 | | | | 45,989 | |
| | 176,291 | | | Washington Mutual MSC Mortgage Pass-Through Series 2003-AR3 B1(b) | | | | | 4.7420 | | | 06/25/33 | | | | 144,575 | |
| | 9,521 | | | Washington Mutual MSC Mortgage Pass-Through Series 2005-RA1 3B4(b),(c) | | | | | 4.9520 | | | 01/25/35 | | | | 7,794 | |
| | 124,119 | | | Washington Mutual MSC Mortgage Pass-Through Series RA3 CB1(b) | | | | | 5.6650 | | | 08/25/38 | | | | 103,061 | |
| | 930,049 | | | Wells Fargo Alternative Loan Trust Series 2005-1 2A3 | | | | | 5.5000 | | | 02/25/35 | | | | 890,556 | |
| | 557,872 | | | Wells Fargo Alternative Loan Trust Series 2005-1 2A1 | | | | | 5.5000 | | | 02/25/35 | | | | 505,988 | |
| | 51,749 | | | Wells Fargo Mortgage Backed Securities Series 2006-AR14 2A1(b) | | | | | 6.3680 | | | 10/25/36 | | | | 45,000 | |
| | 67,779 | | | Wells Fargo Mortgage Backed Securities Series 2007-7 A6 | | | | | 6.0000 | | | 06/25/37 | | | | 57,591 | |
| | 234,000 | | | Wells Fargo Mortgage Backed Securities Series 2018-1 B4(b),(c) | | | | | 3.6580 | | | 07/25/47 | | | | 162,447 | |
| | 62,497 | | | Wells Fargo Mortgage Backed Securities Series 2019-4 A2(b),(c) | | | | | 3.0000 | | | 09/25/49 | | | | 50,328 | |
| | 205,334 | | | WinWater Mortgage Loan Trust Series 2015-1 B2(b),(c) | | | | | 3.8700 | | | 01/20/45 | | | | 183,734 | |
| | | | | | | | | | | | | | | | | 104,081,993 | |
| | | | | CREDIT CARD — 0.3% | | | | | | | | | | | | | |
| | 1,000,000 | | | Continental Finance Credit Card A.B.S Master Trust Series 2022-A A(c) | | | | | 6.1900 | | | 10/15/30 | | | | 994,212 | |
| | | | | | | | | | | | | | | | | | |
| | | | | HOME EQUITY — 3.6% | | | | | | | | | | | | | |
| | 58,033 | | | ABFC Trust Series 2004-OPT2 A2(d) | | TSFR1M + 0.674% | | | 5.9990 | | | 10/25/33 | | | | 55,338 | |
| | 153,279 | | | AFC Trust Series Series 1999-3 1A(d) | | TSFR1M + 1.094% | | | 6.4110 | | | 09/28/29 | | | | 127,647 | |
| | 33,968 | | | American Residential Home Equity Loan Trust Series 1998-1 B(d) | | TSFR1M + 2.289% | | | 7.6140 | | | 05/25/29 | | | | 47,350 | |
| | 470,514 | | | Bayview Financial Asset Trust Series 2007-SR1A A(c),(d) | | TSFR1M + 0.564% | | | 5.8890 | | | 03/25/37 | | | | 462,087 | |
| | 1,112,000 | | | Bayview Financial Mortgage Pass-Through Trust Series D M2(b) | | | | | 5.5000 | | | 12/28/35 | | | | 1,046,799 | |
| | 2,829,545 | | | Bayview Financial Mortgage Pass-Through Trust Series 2004-B A1(c),(d) | | TSFR1M + 1.114% | | | 6.4390 | | | 05/28/39 | | | | 2,305,631 | |
| | 1,261,619 | | | Bayview Financial Mortgage Pass-Through Trust Series 2005-A M1(c),(d) | | TSFR1M + 1.614% | | | 6.9390 | | | 02/28/40 | | | | 1,205,446 | |
| | 29,194 | | | Bear Stearns Asset Backed Securities I Trust Series 2004-FR2 M4(d) | | TSFR1M + 2.214% | | | 4.6390 | | | 06/25/34 | | | | 27,087 | |
| | 277,622 | | | Bear Stearns Home Loan Owner Trust Series 2001-A B(e) | | | | | 10.5000 | | | 02/15/31 | | | | 281,640 | |
| | 216,496 | | | CHEC Loan Trust Series 2004-1 M2(c),(d) | | TSFR1M + 1.089% | | | 6.4140 | | | 07/25/34 | | | | 213,473 | |
| | 10,462 | | | Citigroup Global Markets Mortgage Securities VII, Series 2002-WMC1 M1(d) | | TSFR1M + 1.464% | | | 6.3390 | | | 01/25/32 | | | | 10,883 | |
| | 119,044 | | | Delta Funding Home Equity Loan Trust Series 1999-3 A2F(e) | | | | | 8.0610 | | | 09/15/29 | | | | 111,459 | |
See accompanying notes to financial statements
EASTERLY INCOME OPPORTUNITIES FUND
SCHEDULE OF INVESTMENTS (Unaudited) (Continued)
May 31, 2024
Principal
Amount ($) | | | | | Spread | | | Coupon Rate (%) | | | Maturity | | | Fair Value | |
| | | | | ASSET BACKED SECURITIES — 76.8% (Continued) | | | | | | | | | | | | | |
| | | | | HOME EQUITY — 3.6% (Continued) | | | | | | | | | | | | | |
| | 281,238 | | | Delta Funding Home Equity Loan Trust Series 2000-1 M2(e) | | | | | 8.0900 | | | 05/15/30 | | | $ | 259,610 | |
| | 97,291 | | | Delta Funding Home Equity Loan Trust Series 1999-2 A1A(d) | | TSFR1M + 0.434% | | | 6.0710 | | | 08/15/30 | | | | 96,199 | |
| | 174,738 | | | EMC Mortgage Loan Trust Series 2001-A M1(c),(d) | | TSFR1M + 1.164% | | | 6.4890 | | | 05/25/40 | | | | 179,305 | |
| | 165,727 | | | Financial Asset Securities Corp AAA Trust Series 2005-1A 1A3B(c),(d) | | TSFR1M + 0.524% | | | 5.8530 | | | 02/27/35 | | | | 151,889 | |
| | 52,085 | | | GE Capital Mortgage Services Inc Trust Series 1999-HE1 A6(b) | | | | | 6.7000 | | | 04/25/29 | | | | 51,402 | |
| | 236,013 | | | Home Equity Asset Trust Series 2002-2 A2(d) | | TSFR1M + 0.714% | | | 6.0310 | | | 06/25/32 | | | | 226,947 | |
| | 963,445 | | | Mastr Asset Backed Securities Trust Series 2004-FRE1 M7(d) | | TSFR1M + 2.814% | | | 8.1390 | | | 07/25/34 | | | | 879,209 | |
| | 220,545 | | | Mastr Asset Backed Securities Trust Series 2005-NC1 M2(d) | | TSFR1M + 0.864% | | | 6.1890 | | | 12/25/34 | | | | 214,379 | |
| | 234,082 | | | Mastr Asset Backed Securities Trust Series 2007-NCW A2(c),(d) | | TSFR1M + 0.714% | | | 6.0390 | | | 05/25/37 | | | | 185,737 | |
| | 272,316 | | | Morgan Stanley A.B.S Capital I Inc Trust Series Series 2003-SD1 M2(d) | | TSFR1M + 4.014% | | | 9.3390 | | | 03/25/33 | | | | 239,058 | |
| | 38,418 | | | New Century Home Equity Loan Trust Series 2003-5 AII(d) | | TSFR1M + 0.914% | | | 3.7210 | | | 11/25/33 | | | | 29,674 | |
| | 93,306 | | | Nomura Home Equity Loan Inc Home Equity Loan Trust Series 2006-HE2 M1(d) | | TSFR1M + 0.609% | | | 5.9340 | | | 03/25/36 | | | | 78,834 | |
| | 220,605 | | | NovaStar Mortgage Funding Trust Series Series 2003-4 A1(d) | | TSFR1M + 0.854% | | | 6.1790 | | | 02/25/34 | | | | 216,403 | |
| | 28,334 | | | RAAC Series Trust Series 2004-SP1 AII(d) | | TSFR1M + 0.814% | | | 6.1390 | | | 03/25/34 | | | | 26,374 | |
| | 209,386 | | | RBSSP Resecuritization Trust Series 2010-4 6A2(c),(e) | | | | | 5.8250 | | | 02/26/36 | | | | 201,025 | |
| | 425,887 | | | Renaissance Home Equity Loan Trust Series 2002-3 M1(d) | | TSFR1M + 1.614% | | | 6.9390 | | | 12/25/32 | | | | 385,363 | |
| | 83,936 | | | Renaissance Home Equity Loan Trust Series 2002-3 M2(d) | | TSFR1M + 2.664% | | | 7.9890 | | | 12/25/32 | | | | 67,254 | |
| | 23,690 | | | Saxon Asset Securities Trust Series 2001-2 AF5(e) | | | | | 7.1700 | | | 03/25/29 | | | | 23,571 | |
| | 30,005 | | | Saxon Asset Securities Trust Series 2003-3 M2(d) | | TSFR1M + 2.514% | | | 3.8470 | | | 12/25/33 | | | | 26,464 | |
| | 198,502 | | | Saxon Asset Securities Trust Series 2003-3 AF5(e) | | | | | 4.1660 | | | 12/25/33 | | | | 181,885 | |
| | 145,145 | | | Saxon Asset Securities Trust Series 2004-1 A(d) | | TSFR1M + 0.654% | | | 1.4610 | | | 03/25/35 | | | | 114,488 | |
| | 1,500,000 | | | Security National Mortgage Loan Trust Series 2005-2A A4(b),(c) | | | | | 6.8670 | | | 02/25/35 | | | | 1,442,798 | |
| | 279,821 | | | Security National Mortgage Loan Trust Series 2005-2A A3(b),(c) | | | | | 6.2130 | | | 02/25/36 | | | | 272,989 | |
| | 30,229 | | | Soundview Home Loan Trust Series 2006-OPT4 1A1(d) | | TSFR1M + 0.414% | | | 5.7390 | | | 06/25/36 | | | | 29,705 | |
| | 168,071 | | | Southern Pacific Secured Asset Corporation Series 1997-2 M1F | | | | | 7.3200 | | | 05/25/27 | | | | 190,851 | |
| | | | | | | | | | | | | | | | | 11,666,253 | |
| | | | | MANUFACTURED HOUSING — 0.3% | | | | | | | | | | | | | |
| | 1,000,000 | | | Cascade MH Asset Trust Series 2019-MH1 M(b),(c) | | | | | 5.9850 | | | 11/25/44 | | | | 870,185 | |
| | 87,573 | | | Conseco Finance Corporation Series 5 B1(b) | | | | | 8.1000 | | | 07/15/26 | | | | 80,325 | |
| | | | | | | | | | | | | | | | | 950,510 | |
| | | | | NON AGENCY CMBS — 26.9% | | | | | | | | | | | | | |
| | 3,204,350 | | | Angel Oak SB Commercial Mortgage Trust Series 2020-SBC1 B1(b),(c) | | | | | 3.6530 | | | 05/25/50 | | | | 2,324,109 | |
| | 2,124,264 | | | Angel Oak SB Commercial Mortgage Trust Series 2020-SBC1 B2(b),(c) | | | | | 5.3780 | | | 05/25/50 | | | | 1,481,604 | |
See accompanying notes to financial statements
EASTERLY INCOME OPPORTUNITIES FUND
SCHEDULE OF INVESTMENTS (Unaudited) (Continued)
May 31, 2024
Principal
Amount ($) | | | | | Spread | | | Coupon Rate (%) | | | Maturity | | | Fair Value | |
| | | | | ASSET BACKED SECURITIES — 76.8% (Continued) | | | | | | | | | | | | | |
| | | | | NON AGENCY CMBS — 26.9% (Continued) | | | | | | | | | | | | | |
| | 723,000 | | | Arbor Multifamily Mortgage Securities Trust Series 2020-MF1 D(c) | | | | | 1.7500 | | | 05/15/53 | | | $ | 504,283 | |
| | 1,000,000 | | | Arbor Multifamily Mortgage Securities Trust Series 2020-MF1 E(c) | | | | | 1.7500 | | | 05/15/53 | | | | 666,901 | |
| | 300,000 | | | BAMLL Commercial Mortgage Securities Trust Series 2014-520M C(b),(c) | | | | | 4.2140 | | | 08/15/46 | | | | 164,063 | |
| | 175,000 | | | BANK Series 2017-BNK8 C(b) | | | | | 4.0930 | | | 11/15/50 | | | | 128,903 | |
| | 868,000 | | | BANK Series 2019-BN19 D(c) | | | | | 3.0000 | | | 08/15/61 | | | | 402,251 | |
| | 2,000,000 | | | BANK Series 2019-BNK19 E(c) | | | | | 3.0000 | | | 08/15/61 | | | | 460,000 | |
| | 1,625,000 | | | BANK Series 2019-BN19 B | | | | | 3.6470 | | | 08/15/61 | | | | 1,316,528 | |
| | 980,000 | | | BANK Series 2019-BNK20 B(b) | | | | | 3.3950 | | | 09/15/62 | | | | 775,924 | |
| | 474,000 | | | BANK Series 2020-BNK27 B(b) | | | | | 2.9060 | | | 04/15/63 | | | | 350,482 | |
| | 27,334 | | | Bayview Commercial Asset Trust Series 2005-2A M1(c),(d) | | TSFR1M + 0.759% | | | 6.0840 | | | 08/25/35 | | | | 24,656 | |
| | 42,296 | | | Bayview Commercial Asset Trust Series 2005-2A B1(c),(d) | | TSFR1M + 1.839% | | | 7.1640 | | | 08/25/35 | | | | 41,955 | |
| | 172,714 | | | Bayview Commercial Asset Trust Series 2005-3A A1(c),(d) | | TSFR1M + 0.594% | | | 5.7590 | | | 11/25/35 | | | | 159,868 | |
| | 22,726 | | | Bayview Commercial Asset Trust Series 2005-4A M1(c),(d) | | TSFR1M + 0.789% | | | 6.1140 | | | 01/25/36 | | | | 20,739 | |
| | 75,532 | | | Bayview Commercial Asset Trust Series 2007-1 M2(c),(d) | | TSFR1M + 0.549% | | | 5.8740 | | | 03/25/37 | | | | 63,781 | |
| | 1,413,709 | | | Bayview Commercial Asset Trust Series 2007-3 M1(c),(d) | | TSFR1M + 0.579% | | | 5.9040 | | | 07/25/37 | | | | 1,326,050 | |
| | 340,507 | | | Bayview Commercial Asset Trust Series 2007-3 M2(c),(d) | | TSFR1M + 0.624% | | | 5.9490 | | | 07/25/37 | | | | 309,120 | |
| | 446,376 | | | Bayview Commercial Asset Trust Series 2007-3 M3(c),(d) | | TSFR1M + 0.669% | | | 5.9940 | | | 07/25/37 | | | | 406,663 | |
| | 841,725 | | | Bayview Commercial Asset Trust Series 2007-3 M4(c),(d) | | TSFR1M + 0.864% | | | 6.1890 | | | 07/25/37 | | | | 767,209 | |
| | 500,000 | | | Bayview Commercial Asset Trust Series 2008-1 M1(c),(d) | | TSFR1M + 2.214% | | | 7.5390 | | | 01/25/38 | | | | 444,732 | |
| | 324,000 | | | BBCMS Mortgage Trust Series 2019-BWAY A(c),(d) | | TSFR1M + 1.070% | | | 6.3870 | | | 11/15/34 | | | | 210,361 | |
| | 350,000 | | | BBCMS Mortgage Trust Series 2024-C24 D(c) | | | | | 4.2500 | | | 02/15/57 | | | | 247,706 | |
| | 350,000 | | | BBSG Mortgage Trust Series 2016-MRP A(c) | | | | | 3.2750 | | | 06/05/36 | | | | 259,340 | |
| | 100,000 | | | Benchmark Mortgage Trust Series 2020-IG3 A4(c) | | | | | 2.4370 | | | 09/15/48 | | | | 76,332 | |
| | 1,000,000 | | | Benchmark Mortgage Trust Series 2020-IG3 B(b),(c) | | | | | 3.2870 | | | 09/15/48 | | | | 572,735 | |
| | 220,000 | | | Benchmark Mortgage Trust Series 2020-IG3 C(b),(c) | | | | | 3.2870 | | | 09/15/48 | | | | 103,460 | |
| | 2,500,000 | | | Benchmark Mortgage Trust Series 2020-IG2 B(b),(c) | | | | | 3.2930 | | | 09/15/48 | | | | 1,528,918 | |
| | 88,283 | | | Benchmark Mortgage Trust Series 2018-B5 A2 | | | | | 4.0770 | | | 07/15/51 | | | | 83,567 | |
| | 130,000 | | | Benchmark Mortgage Trust Series 2019-B9 B | | | | | 4.4680 | | | 03/15/52 | | | | 107,051 | |
| | 900,000 | | | Benchmark Mortgage Trust Series 2020-B17 E(c) | | | | | 2.2500 | | | 03/15/53 | | | | 446,840 | |
| | 470,000 | | | Benchmark Mortgage Trust Series 2020-B17 C(b) | | | | | 3.3710 | | | 03/15/53 | | | | 337,647 | |
| | 500,000 | | | Benchmark Mortgage Trust Series 2020-B19 B | | | | | 2.3510 | | | 09/15/53 | | | | 368,250 | |
| | 495,000 | | | Benchmark Mortgage Trust Series 2021-B24 A2 | | | | | 1.9530 | | | 03/15/54 | | | | 439,787 | |
| | 328,000 | | | Benchmark Mortgage Trust Series 2021-B31 C(b) | | | | | 3.1950 | | | 12/15/54 | | | | 224,166 | |
| | 565,000 | | | Benchmark Mortgage Trust Series 2022-B32 A3 | | | | | 3.0420 | | | 01/15/55 | | | | 469,937 | |
See accompanying notes to financial statements
EASTERLY INCOME OPPORTUNITIES FUND
SCHEDULE OF INVESTMENTS (Unaudited) (Continued)
May 31, 2024
Principal
Amount ($) | | | | | Spread | | | Coupon Rate (%) | | | Maturity | | | Fair Value | |
| | | | | ASSET BACKED SECURITIES — 76.8% (Continued) | | | | | | | | | | | | | |
| | | | | NON AGENCY CMBS — 26.9% (Continued) | | | | | | | | | | | | | |
| | 350,000 | | | BFLD Trust Series 2020-EYP A(c),(d) | | TSFR1M + 1.264% | | | 6.5810 | | | 10/15/35 | | | $ | 283,242 | |
| | 555,000 | | | BMD2 Re-Remic Trust Series 2019-FRR1 5A1(b),(c) | | | | | 3.4710 | | | 05/25/52 | | | | 436,277 | |
| | 3,300,000 | | | BWAY Mortgage Trust Series 2022-26BW A(c) | | | | | 3.4020 | | | 02/10/44 | | | | 2,594,338 | |
| | 1,500,000 | | | BXP Trust Series 2017-CQHP A(c),(d) | | TSFR1M + 0.897% | | | 6.2140 | | | 11/15/34 | | | | 1,407,095 | |
| | 500,000 | | | Cantor Commercial Real Estate Lending Series 2019-CF3 E(b),(c) | | | | | 2.5000 | | | 01/15/53 | | | | 258,753 | |
| | 181,802 | | | Capital Funding Mortgage Trust Series 2021-15 A(c),(d) | | TSFR1M + 3.400% | | | 8.7100 | | | 03/12/25 | | | | 181,295 | |
| | 121,757 | | | CARBON CAPITAL VI COMMERCIAL MORTGAGE Series 2019-FL2 B(c),(d) | | TSFR1M + 2.964% | | | 8.2810 | | | 10/15/35 | | | | 98,904 | |
| | 2,025,100 | | | CBA Commercial Small Balance Commercial Mortgage Series 2007-1A A(c),(e) | | | | | 6.2600 | | | 07/25/39 | | | | 1,863,391 | |
| | 1,000,000 | | | CD Mortgage Trust Series 2016-CD2 B(b) | | | | | 3.8790 | | | 11/10/49 | | | | 819,181 | |
| | 72,000 | | | CD Mortgage Trust Series 2017-CD3 D(c) | | | | | 3.2500 | | | 02/10/50 | | | | 26,464 | |
| | 1,000,000 | | | CD Mortgage Trust Series 2017-CD3 AS | | | | | 3.8330 | | | 02/10/50 | | | | 812,989 | |
| | 385,453 | | | CFCRE Commercial Mortgage Trust Series 2011-C2 D(b),(c) | | | | | 5.2490 | | | 12/15/47 | | | | 358,418 | |
| | 100,000 | | | CFK Trust Series 2020-MF2 A(c) | | | | | 2.3870 | | | 03/15/39 | | | | 84,437 | |
| | 1,990,236 | | | CG-CCRE Commercial Mortgage Trust Series 2014-FL1 B(c),(d) | | TSFR1M + 1.264% | | | 6.5810 | | | 06/15/31 | | | | 1,917,593 | |
| | 1,988,931 | | | CG-CCRE Commercial Mortgage Trust Series 2014-FL2 A(c),(d) | | TSFR1M + 1.968% | | | 7.2850 | | | 11/15/31 | | | | 1,923,255 | |
| | 50,000 | | | Citigroup Commercial Mortgage Trust Series 2015-GC31 B(b) | | | | | 4.0330 | | | 06/10/48 | | | | 38,238 | |
| | 100,000 | | | Citigroup Commercial Mortgage Trust Series 2016-C2 B | | | | | 3.1760 | | | 08/10/49 | | | | 91,698 | |
| | 295,438 | | | CNL Commercial Mortgage Loan Trust Series 2003-1A A1(c),(d) | | TSFR1M + 0.614% | | | 5.9310 | | | 05/15/31 | | | | 287,777 | |
| | 60,690 | | | COMM Mortgage Trust Series 2012-LC4 B(b) | | | | | 4.9340 | | | 12/10/44 | | | | 55,369 | |
| | 1,936,687 | | | COMM Mortgage Trust Series 2013-CR12 AM | | | | | 4.3000 | | | 10/10/46 | | | | 1,786,927 | |
| | 2,385,000 | | | COMM Mortgage Trust Series 2013-CR12 B(b) | | | | | 4.7620 | | | 10/10/46 | | | | 1,228,275 | |
| | 135,000 | | | COMM Mortgage Trust Series 2014-CCRE18 B(b) | | | | | 4.4560 | | | 07/15/47 | | | | 132,995 | |
| | 175,500 | | | COMM Mortgage Trust Series 2016-COR1 C(b) | | | | | 4.3250 | | | 10/10/49 | | | | 135,521 | |
| | 1,850,000 | | | Csail Commercial Mortgage Trust Series 2015-C2 C(b) | | | | | 4.1730 | | | 06/15/57 | | | | 1,642,996 | |
| | 265,000 | | | CSAIL Commercial Mortgage Trust Series 2018-C14 D(b),(c) | | | | | 4.8780 | | | 11/15/51 | | | | 208,855 | |
| | 470,000 | | | CSAIL Commercial Mortgage Trust Series 2019-C16 C(b) | | | | | 4.2370 | | | 06/15/52 | | | | 375,644 | |
| | 360,000 | | | CSMC Series 2017-TIME A(c) | | | | | 3.6460 | | | 11/13/39 | | | | 261,366 | |
| | 270,000 | | | CSMC OA, LLC Series 2014-USA(c) | | | | | 3.9500 | | | 09/15/37 | | | | 222,433 | |
| | 1,390,000 | | | CSMC OA, LLC Series 2014-USA D(c) | | | | | 4.3730 | | | 09/15/37 | | | | 1,051,178 | |
| | 524,337 | | | FREMF Mortgage Trust Series 2017-KF38 B(c),(d) | | SOFR30A + 2.614% | | | 7.9420 | | | 09/25/24 | | | | 484,334 | |
| | 55,105 | | | FREMF Mortgage Trust Series 2018-KF49 B(c),(d) | | SOFR30A + 2.014% | | | 7.3420 | | | 06/25/25 | | | | 51,387 | |
| | 1,470,000 | | | GS Mortgage Securities Corp Trust Series 2021-ROSS A(c),(d) | | TSFR1M + 1.264% | | | 6.5810 | | | 05/15/26 | | | | 1,369,179 | |
| | 1,000,000 | | | GS Mortgage Securities Corp Trust Series 2013-PEMB A(b),(c) | | | | | 3.5490 | | | 03/05/33 | | | | 828,295 | |
| | 47,000 | | | GS Mortgage Securities Corporation II Series 2005-ROCK F(c) | | | | | 5.5150 | | | 05/03/32 | | | | 41,591 | |
See accompanying notes to financial statements
EASTERLY INCOME OPPORTUNITIES FUND
SCHEDULE OF INVESTMENTS (Unaudited) (Continued)
May 31, 2024
Principal
Amount ($) | | | | | Spread | | | Coupon Rate (%) | | | Maturity | | | Fair Value | |
| | | | | ASSET BACKED SECURITIES — 76.8% (Continued) | | | | | | | | | | | | | |
| | | | | NON AGENCY CMBS — 26.9% (Continued) | | | | | | | | | | | | | |
| | 1,500,000 | | | GS Mortgage Securities Trust Series 2011-GC5 B(b),(c) | | | | | 5.1510 | | | 08/10/44 | | | $ | 1,334,082 | |
| | 65,000 | | | GS Mortgage Securities Trust Series 2014-GC20 C(b) | | | | | 4.9680 | | | 04/10/47 | | | | 58,825 | |
| | 1,000,000 | | | GS Mortgage Securities Trust Series 2016-GS4 C(b) | | | | | 3.9510 | | | 11/10/49 | | | | 839,486 | |
| | 1,300,000 | | | Harvest Commercial Capital Loan Trust Series 2019-1 M5(b),(c) | | | | | 5.7300 | | | 11/25/31 | | | | 1,179,956 | |
| | 2,000,000 | | | Harvest Commercial Capital Loan Trust Series 2020-1 M5(b),(c) | | | | | 5.9640 | | | 04/25/52 | | | | 1,713,159 | |
| | 700,000 | | | HMH Trust Series 2017-NSS A(c) | | | | | 3.0620 | | | 07/05/31 | | | | 586,239 | |
| | 1,739,742 | | | Hudsons Bay Simon JV Trust Series 2015-HB7 A7(c) | | | | | 3.9140 | | | 08/05/34 | | | | 1,698,391 | |
| | 100,000 | | | Hudsons Bay Simon JV Trust Series 2015-HB10 A10(c) | | | | | 4.1540 | | | 08/05/34 | | | | 83,802 | |
| | 74,386 | | | Impac CMB Trust Series 2004-8 3B(d) | | TSFR1M + 2.739% | | | 8.0640 | | | 08/25/34 | | | | 67,724 | |
| | 77,636 | | | Impact Funding Affordable Multifamily Housing Series 1 A1(c) | | | | | 5.3140 | | | 01/25/51 | | | | 76,508 | |
| | 387,000 | | | J.P. Morgan Chase Commercial Mortgage Series MINN A(c),(d) | | TSFR1M + 1.317% | | | 6.6340 | | | 11/15/35 | | | | 357,406 | |
| | 453,936 | | | JP Morgan Chase Commercial Mortgage Securities Series 2015-FL7 D(c),(d) | | PRIME + 0.693% | | | 9.1930 | | | 05/15/28 | | | | 391,406 | |
| | 1,900,000 | | | JP Morgan Chase Commercial Mortgage Securities Series 2018-PTC A(c),(d) | | TSFR1M + 1.497% | | | 6.8140 | | | 04/15/31 | | | | 1,289,150 | |
| | 560,000 | | | JP Morgan Chase Commercial Mortgage Securities Series MKST A(c),(d) | | TSFR1M + 1.464% | | | 6.7810 | | | 12/15/36 | | | | 431,354 | |
| | 193,000 | | | JP Morgan Chase Commercial Mortgage Securities Series 2011-C3 E(b),(c) | | | | | 5.5250 | | | 02/15/46 | | | | 81,896 | |
| | 500,000 | | | JP Morgan Chase Commercial Mortgage Securities Series 2013-LC11 E(b),(c) | | | | | 3.2500 | | | 04/15/46 | | | | 128,646 | |
| | 5,674,155 | | | JP Morgan Chase Commercial Mortgage Securities Series 2007-LD11 AJ(b) | | | | | 5.8820 | | | 06/15/49 | | | | 1,310,732 | |
| | 2,951,168 | | | JP Morgan Chase Commercial Mortgage Securities Trust Series 2012-WLDN A(c) | | | | | 3.9100 | | | 05/05/30 | | | | 2,557,298 | |
| | 339,000 | | | JPMBB Commercial Mortgage Securities Trust Series 2015-C29 C(b) | | | | | 4.1860 | | | 05/15/48 | | | | 304,417 | |
| | 345,000 | | | JPMBB Commercial Mortgage Securities Trust Series 2015-C32 D(b) | | | | | 4.1530 | | | 11/15/48 | | | | 35,005 | |
| | 210,000 | | | JPMDB Commercial Mortgage Securities Trust Series 2017-C5 AS(b) | | | | | 3.8580 | | | 03/15/50 | | | | 181,809 | |
| | 825,000 | | | JPMDB Commercial Mortgage Securities Trust Series 2017-C5 B(b) | | | | | 4.0090 | | | 03/15/50 | | | | 636,559 | |
| | 165,000 | | | JPMDB Commercial Mortgage Securities Trust Series COR7 B(b) | | | | | 3.2940 | | | 05/13/53 | | | | 104,623 | |
| | 381,000 | | | LSTAR Commercial Mortgage Trust Series 2016-4 C(b),(c) | | | | | 4.6060 | | | 03/10/49 | | | | 318,865 | |
| | 2,000,000 | | | LSTAR Commercial Mortgage Trust Series 2016-4 D(b),(c) | | | | | 4.6060 | | | 03/10/49 | | | | 1,728,958 | |
| | 1,500,000 | | | LSTAR Commercial Mortgage Trust Series 2017-5 D(b),(c) | | | | | 4.6680 | | | 03/10/50 | | | | 1,162,916 | |
| | 6,218,432 | | | Morgan Stanley Bank of America Merrill Lynch Trust Series 2013-C11 AS(b) | | | | | 4.0770 | | | 08/15/46 | | | | 5,468,162 | |
| | 130,000 | | | Morgan Stanley Bank of America Merrill Lynch Trust Series C16 C(b) | | | | | 4.7640 | | | 06/15/47 | | | | 102,005 | |
| | 500,000 | | | Morgan Stanley Bank of America Merrill Lynch Trust Series 2017-C33 AS | | | | | 3.8520 | | | 05/15/50 | | | | 466,592 | |
| | 240,000 | | | Morgan Stanley Capital I Trust Series 2014-150E A(c) | | | | | 3.9120 | | | 09/09/32 | | | | 209,953 | |
See accompanying notes to financial statements
EASTERLY INCOME OPPORTUNITIES FUND
SCHEDULE OF INVESTMENTS (Unaudited) (Continued)
May 31, 2024
Principal
Amount ($) | | | | | Spread | | | Coupon Rate (%) | | | Maturity | | | Fair Value | |
| | | | | ASSET BACKED SECURITIES — 76.8% (Continued) | | | | | | | | | | | | | |
| | | | | NON AGENCY CMBS — 26.9% (Continued) | | | | | | | | | | | | | |
| | 420,000 | | | Morgan Stanley Capital I Trust Series 2014-150E AS(c) | | | | | 4.0120 | | | 09/09/32 | | | $ | 333,769 | |
| | 347,000 | | | Morgan Stanley Capital I Trust Series 2014-150E D(b),(c) | | | | | 4.2950 | | | 09/09/32 | | | | 183,651 | |
| | 600,000 | | | Morgan Stanley Capital I Trust Series 2021-PLZA C(b),(c) | | | | | 2.8100 | | | 11/09/43 | | | | 400,991 | |
| | 200,000 | | | Morgan Stanley Capital I Trust Series 2015-MS1 D(b),(c) | | | | | 4.0230 | | | 05/15/48 | | | | 142,356 | |
| | 72,000 | | | Morgan Stanley Capital I Trust Series 2018-L1 B(b) | | | | | 4.7080 | | | 10/15/51 | | | | 63,078 | |
| | 500,000 | | | MSSG Trust Series 2017-237P A(c) | | | | | 3.3970 | | | 09/13/39 | | | | 399,370 | |
| | 226,787 | | | Multi Security Asset Trust, L.P. Commercial Series 2005-RR4A N(b),(c) | | | | | 0.0000 | | | 11/28/35 | | | | 230,056 | |
| | 681,280 | | | Multifamily Trust Series 2016-1 A(c),(d) | | TSFR1M + 2.114% | | | 7.4390 | | | 04/25/46 | | | | 611,860 | |
| | 470,000 | | | Olympic Tower Mortgage Trust Series 2017-OT E(b),(c) | | | | | 3.9450 | | | 05/10/39 | | | | 301,934 | |
| | 2,250,000 | | | Ready Capital Mortgage Trust Series 2019-5 E(b),(c) | | | | | 5.3190 | | | 02/25/52 | | | | 1,886,864 | |
| | 401,910 | | | Sutherland Commercial Mortgage Trust Series 2021-SB10 C(b),(c) | | | | | 2.6400 | | | 12/25/41 | | | | 316,751 | |
| | 457,352 | | | UBS-BAMLL Trust Series 2012-WRM A(c) | | | | | 3.6630 | | | 06/10/30 | | | | 430,849 | |
| | 1,305,026 | | | UBS-Barclays Commercial Mortgage Trust Series 2013-C5 C(b),(c) | | | | | 3.7280 | | | 03/10/46 | | | | 1,044,043 | |
| | 1,588,789 | | | Velocity Commercial Capital Loan Trust Series 2017-2 M5(b),(c) | | | | | 6.4200 | | | 11/25/47 | | | | 1,350,306 | |
| | 1,539,808 | | | Velocity Commercial Capital Loan Trust Series 2017-2 M6(b),(c) | | | | | 7.7500 | | | 11/25/47 | | | | 1,307,018 | |
| | 807,590 | | | Velocity Commercial Capital Loan Trust Series 2018-1 M6(c) | | | | | 7.2600 | | | 04/25/48 | | | | 663,930 | |
| | 318,417 | | | Velocity Commercial Capital Loan Trust Series 2018-2 M5(b),(c) | | | | | 6.3600 | | | 10/26/48 | | | | 262,712 | |
| | 1,803,281 | | | Velocity Commercial Capital Loan Trust Series 2019-2 M6(b),(c) | | | | | 6.3000 | | | 07/25/49 | | | | 1,387,254 | |
| | 566,120 | | | Velocity Commercial Capital Loan Trust Series 2019-3 M3(b),(c) | | | | | 3.3800 | | | 10/25/49 | | | | 459,030 | |
| | 74,935 | | | Velocity Commercial Capital Loan Trust Series 2020-1 M2(b),(c) | | | | | 2.9800 | | | 02/25/50 | | | | 60,874 | |
| | 2,058,407 | | | Velocity Commercial Capital Loan Trust Series 2021-2 M1(b),(c) | | | | | 1.8200 | | | 08/25/51 | | | | 1,593,223 | |
| | 1,263,144 | | | Velocity Commercial Capital Loan Trust Series 2022-2 M1(b),(c) | | | | | 5.4100 | | | 04/25/52 | | | | 1,161,741 | |
| | 1,286,192 | | | Velocity Commercial Capital Loan Trust Series 2022-3 M1(b),(c) | | | | | 6.1300 | | | 06/25/52 | | | | 1,260,611 | |
| | 874,868 | | | Velocity Commercial Capital Loan Trust Series 2022-4 M4(b),(c) | | | | | 7.5340 | | | 08/25/52 | | | | 747,114 | |
| | 472,812 | | | Velocity Commercial Capital Loan Trust Series 2023-1 M1(b),(c) | | | | | 7.1500 | | | 01/25/53 | | | | 473,750 | |
| | 248,920 | | | Velocity Commercial Capital Loan Trust Series 2024-1 M2(b),(c) | | | | | 7.2300 | | | 01/25/54 | | | | 249,893 | |
| | 671,932 | | | Wachovia Bank Commercial Mortgage Trust Series 2004-C12 IO(a),(b),(c) | | | | | 0.7840 | | | 07/15/41 | | | | 1,694 | |
| | 65,225 | | | Waterfall Commercial Mortgage Trust Series 2015-SBC5 A(b),(c) | | | | | 4.1040 | | | 12/14/32 | | | | 63,008 | |
| | 639,512 | | | Wells Fargo Commercial Mortgage Trust Series 2013-LC12 B(b) | | | | | 3.9520 | | | 07/15/46 | | | | 590,294 | |
| | 346,000 | | | Wells Fargo Commercial Mortgage Trust Series 2015-C27 C | | | | | 3.8940 | | | 02/15/48 | | | | 275,152 | |
| | 220,000 | | | Wells Fargo Commercial Mortgage Trust Series 2016-C36 C(b) | | | | | 4.1170 | | | 11/15/59 | | | | 171,775 | |
| | 40,446 | | | WFRBS Commercial Mortgage Trust Series 2011-C4 C(b),(c) | | | | | 4.9780 | | | 06/15/44 | | | | 37,360 | |
| | 950,000 | | | WFRBS Commercial Mortgage Trust Series 2013-C14 B(b) | | | | | 3.8410 | | | 06/15/46 | | | | 833,126 | |
| | 1,688,334 | | | WFRBS Commercial Mortgage Trust Series 2013-C15 B(b) | | | | | 4.1880 | | | 08/15/46 | | | | 1,484,637 | |
See accompanying notes to financial statements
EASTERLY INCOME OPPORTUNITIES FUND
SCHEDULE OF INVESTMENTS (Unaudited) (Continued)
May 31, 2024
Principal
Amount ($) | | | | | Spread | | | Coupon Rate (%) | | | Maturity | | | Fair Value | |
| | | | | ASSET BACKED SECURITIES — 76.8% (Continued) | | | | | | | | | | | | | |
| | | | | NON AGENCY CMBS — 26.9% (Continued) | | | | | | | | | | | | | |
| | 460,148 | | | WFRBS Commercial Mortgage Trust Series 2014-C25 D(b),(c) | | | | | 3.8030 | | | 11/15/47 | | | $ | 398,271 | |
| | 110,000 | | | WFRBS Commercial Mortgage Trust Series 2014-C24 B(b) | | | | | 4.2040 | | | 11/15/47 | | | | 102,960 | |
| | 40,000 | | | WFRBS Commercial Mortgage Trust Series 2014-C22 B(b) | | | | | 4.3710 | | | 09/15/57 | | | | 33,924 | |
| | 1,800,000 | | | Worldwide Plaza Trust Series 2017-WWP A(c) | | | | | 3.5260 | | | 11/10/36 | | | | 1,280,631 | |
| | | | | | | | | | | | | | | | | 88,477,392 | |
| | | | | OTHER ABS — 2.9% | | | | | | | | | | | | | |
| | 120,850 | | | 321 Henderson Receivables I, LLC Series 2004-A A1(c),(d) | | TSFR1M + 0.464% | | | 5.7810 | | | 09/15/45 | | | | 120,470 | |
| | 125,476 | | | AASET Trust Series 2020-1A A(c) | | | | | 3.3510 | | | 01/16/40 | | | | 115,544 | |
| | 246,188 | | | AFN A.B.SPROP001, LLC Series 2019-1A A2(c) | | | | | 4.4600 | | | 05/20/49 | | | | 183,801 | |
| | 390,000 | | | Amur Equipment Finance Receivables XIII, LLC Series 1A B(c) | | | | | 5.3700 | | | 01/21/31 | | | | 372,514 | |
| | 11,994,455 | | | Corevest American Finance Trust Series 2019-3 XA(a),(b),(c) | | | | | 2.0100 | | | 10/15/52 | | | | 127,878 | |
| | 1,000,000 | | | CoreVest American Finance Trust Series 2021-2 D(c) | | | | | 2.8310 | | | 07/15/54 | | | | 773,689 | |
| | 41,026 | | | FCI Funding, LLC Series 2021-1A A(c) | | | | | 1.1300 | | | 04/15/33 | | | | 38,135 | |
| | 656,085 | | | Goldman Home Improvement Trust Issuer Series 2022-GRN1 D(c) | | | | | 7.3000 | | | 06/25/52 | | | | 638,708 | |
| | 1,879,363 | | | Goodgreen Trust Series 2021-1A C(c) | | | | | 5.7400 | | | 10/15/56 | | | | 1,504,060 | |
| | 58,797 | | | HERO Funding Trust Series 2015-2A A(c) | | | | | 3.9900 | | | 09/20/40 | | | | 52,568 | |
| | 143,674 | | | Home Partners of America Trust Series 2020-2 F(c) | | | | | 4.0550 | | | 01/17/41 | | | | 110,555 | |
| | 472,486 | | | HTS Fund I, LLC Series 2021-1 A(c) | | | | | 1.4110 | | | 08/25/36 | | | | 412,525 | |
| | 363,773 | | | J.G. Wentworth XXXIX, LLC Series 2A B(c) | | | | | 5.0900 | | | 09/17/74 | | | | 301,685 | |
| | 39,505 | | | Longtrain Leasing III, LLC Series 2015-1A A1(c) | | | | | 2.9800 | | | 01/15/45 | | | | 36,960 | |
| | 350,002 | | | Longtrain Leasing III, LLC Series 2015-1A A2(c) | | | | | 4.0600 | | | 01/15/45 | | | | 343,812 | |
| | 1,500,000 | | | NP SPE II, LLC Series 1A B1(c) | | | | | 5.6070 | | | 10/21/47 | | | | 1,294,884 | |
| | 130,527 | | | Sunrun Demeter Issuer, LLC Series 2021-2A A(c) | | | | | 2.2700 | | | 01/30/57 | | | | 106,089 | |
| | 129,097 | | | Sunrun Vulcan Issuer, LLC Series 2021-1A A(c) | | | | | 2.4600 | | | 01/30/52 | | | | 103,329 | |
| | 2,600,000 | | | VCP RRL A.B.S II Ltd. Series 1A A(c) | | | | | 5.4800 | | | 01/20/33 | | | | 2,443,050 | |
| | 400,000 | | | VCP RRL A.B.S II Ltd. Series 1A B(c) | | | | | 6.4800 | | | 01/20/33 | | | | 333,744 | |
| | 113,691 | | | Vivint Solar Financing VII, LLC Series 1A A(c) | | | | | 2.2100 | | | 07/31/51 | | | | 94,399 | |
| | | | | | | | | | | | | | | | | 9,508,399 | |
| | | | | RESIDENTIAL MORTGAGE — 3.0% | | | | | | | | | | | | | |
| | 321,478 | | | Amresco Residential Securities Corp Mort Loan Series 1999-1 A(d) | | TSFR1M + 0.584% | | | 6.3790 | | | 06/25/29 | | | | 304,625 | |
| | 7,332,870 | | | Belvedere SPV Srl Series 1 A(d) | | EUR006M + 3.250% | | | 7.1350 | | | 12/31/38 | | | | 2,450,083 | |
| | 46,160 | | | CFMT, LLC Series 2021-HB7 A(b),(c) | | | | | 1.1510 | | | 10/27/31 | | | | 43,390 | |
| | 100,000 | | | CFMT, LLC Series 2021-HB7 M1(b),(c) | | | | | 2.1250 | | | 10/27/31 | | | | 91,566 | |
| | 6,414 | | | Chase Funding Trust Series Series 2002-4 2A1(d) | | TSFR1M + 0.854% | | | 6.1790 | | | 10/25/32 | | | | 6,257 | |
See accompanying notes to financial statements
EASTERLY INCOME OPPORTUNITIES FUND
SCHEDULE OF INVESTMENTS (Unaudited) (Continued)
May 31, 2024
Principal
Amount ($) | | | | | Spread | | | Coupon Rate (%) | | | Maturity | | | Fair Value | |
| | | | | ASSET BACKED SECURITIES — 76.8% (Continued) | | | | | | | | | | | | | |
| | | | | RESIDENTIAL MORTGAGE — 3.0% (Continued) | | | | | | | | | | | | | |
| | 44,420 | | | Chase Funding Trust Series Series 2004-1 1A7(e) | | | | | 4.9850 | | | 11/25/33 | | | $ | 42,099 | |
| | 781,520 | | | Credit-Based Asset Servicing and Securitization, Series 2002-CB3 B2(d) | | TSFR1M + 3.489% | | | 8.8140 | | | 06/25/32 | | | | 771,032 | |
| | 92,241 | | | Credit-Based Asset Servicing and Securitization, Series 2004-CB3 B1(d) | | TSFR1M + 2.889% | | | 3.0970 | | | 03/25/34 | | | | 102,774 | |
| | 1,360,918 | | | Credit-Based Asset Servicing and Securitization, Series 2004-RP1(c),(d) | | TSFR1M + 3.864% | | | 9.1890 | | | 05/25/50 | | | | 1,329,717 | |
| | 1,111,820 | | | CSMC Trust Series 2017-RPL1(b),(c) | | | | | 2.9680 | | | 07/25/57 | | | | 615,389 | |
| | 207,499 | | | CWABS Asset-Backed Certificates Trust Series 2007-13 2A1(d) | | TSFR1M + 1.014% | | | 6.3390 | | | 10/25/47 | | | | 184,436 | |
| | 11,961 | | | CWABS Inc Asset-Backed Certificates Trust Series 2004-6 2A3(d) | | TSFR1M + 1.314% | | | 6.6390 | | | 11/25/34 | | | | 10,863 | |
| | 29,250 | | | Equity One Mortgage Pass-Through Trust Series 2002-3 M1(b) | | | | | 6.0390 | | | 11/25/32 | | | | 28,956 | |
| | 5,736 | | | Fannie Mae Grantor Trust Series 2002-T10 A1(d) | | TSFR1M + 0.354% | | | 5.6790 | | | 06/25/32 | | | | 5,601 | |
| | 531,946 | | | Fannie Mae Grantor Trust Series 2003-T4 1A(d) | | TSFR1M + 0.334% | | | 2.7880 | | | 09/26/33 | | | | 514,498 | |
| | 400,000 | | | Finance of America HECM Buyout Series 2022-HB2 M3(b),(c) | | | | | 6.0000 | | | 08/01/32 | | | | 369,489 | |
| | 362,293 | | | First Franklin Mortgage Loan Trust Series 2002-FF1 M2(d) | | TSFR1M + 1.914% | | | 7.2390 | | | 04/25/32 | | | | 351,493 | |
| | 84,675 | | | GE-WMC Asset-Backed Pass-Through Certificates Series 2005-2 M1(d) | | TSFR1M + 0.774% | | | 6.0990 | | | 12/25/35 | | | | 66,106 | |
| | 10,263 | | | GSAMP Trust Series 2002-WF A2B(d) | | TSFR1M + 1.214% | | | 6.5350 | | | 10/20/32 | | | | 10,225 | |
| | 489,100 | | | Legacy Mortgage Asset Trust Series 2019-SL2 A(b),(c) | | | | | 3.3750 | | | 02/25/59 | | | | 464,105 | |
| | 53,147 | | | Long Beach Mortgage Loan Trust Series 2003-2 M2(d) | | TSFR1M + 2.964% | | | 8.2890 | | | 06/25/33 | | | | 58,361 | |
| | 64,301 | | | Mastr Specialized Loan Trust Series 2005-3 M1(c),(d) | | TSFR1M + 1.239% | | | 6.5640 | | | 11/25/35 | | | | 60,179 | |
| | 585,000 | | | Mill City Mortgage Trust Series 2015-2 B1(b),(c) | | | | | 3.7060 | | | 09/25/57 | | | | 531,986 | |
| | 372,754 | | | RAAC Series Trust Series 2005-SP2 2A(d) | | TSFR1M + 0.714% | | | 6.0390 | | | 06/25/44 | | | | 292,723 | |
| | 482,355 | | | RAAC Series Trust Series 2007-RP3 A(c),(d) | | TSFR1M + 0.494% | | | 6.1990 | | | 10/25/46 | | | | 461,110 | |
| | 527,273 | | | Structured Asset Investment Loan Trust Series 2003-BC9 M3(d) | | TSFR1M + 3.264% | | | 8.5890 | | | 08/25/33 | | | | 471,368 | |
| | 145,141 | | | Structured Asset Securities Corp Mortgage Loan Series 2005-WF2 M7(d) | | TSFR1M + 1.764% | | | 7.0890 | | | 05/25/35 | | | | 135,831 | |
| | | | | | | | | | | | | | | | | 9,774,262 | |
| | | | | STUDENT LOANS — 1.0% | | | | | | | | | | | | | |
| | 32,458 | | | AccessLex Institute Series 2004-2 B(d) | | SOFR90A + 0.962% | | | 6.3090 | | | 01/25/43 | | | | 29,506 | |
| | 1,733,976 | | | EdLinc Student Loan Funding Trust Series 2012-1 B(c),(d) | | SOFR30A + 4.354% | | | 9.6780 | | | 11/26/40 | | | | 2,096,486 | |
| | 179,841 | | | ELFI Graduate Loan Program, LLC Series 2020-A A(c) | | | | | 1.7300 | | | 08/25/45 | | | | 152,245 | |
| | 41,541 | | | L2L Education Loan Trust Series 2006-1A A3(c),(d) | | TSFR1M + 0.454% | | | 5.7710 | | | 06/15/31 | | | | 40,119 | |
| | 23,342 | | | National Collegiate Trust (The) Series 2005-GATE B(c),(d) | | TSFR1M + 0.564% | | | 5.8870 | | | 07/27/26 | | | | 21,608 | |
| | 300,000 | | | Navient Private Education Refi Loan Trust Series 2021-A B(c) | | | | | 2.2400 | | | 05/15/69 | | | | 202,714 | |
| | 193,514 | | | Nelnet Student Loan Trust Series 2023-A AFX(c) | | | | | 6.6400 | | | 02/20/41 | | | | 193,043 | |
| | 14,936 | | | SLM Student Loan Trust Series 2005-5 B(d) | | SOFR90A + 0.512% | | | 5.8590 | | | 10/25/40 | | | | 12,468 | |
| | 68,883 | | | SLM Student Loan Trust Series 2005-8 B(d) | | SOFR90A + 0.572% | | | 5.9190 | | | 01/25/55 | | | | 65,213 | |
See accompanying notes to financial statements
EASTERLY INCOME OPPORTUNITIES FUND
SCHEDULE OF INVESTMENTS (Unaudited) (Continued)
May 31, 2024
Principal
Amount ($) | | | | | Spread | | | Coupon Rate (%) | | | Maturity | | | Fair Value | |
| | | | | ASSET BACKED SECURITIES — 76.8% (Continued) | | | | | | | | | | | | | |
| | | | | STUDENT LOANS — 1.0% (Continued) | | | | | | | | | | | | | |
| | 340,000 | | | SMB Private Education Loan Trust Series 2023-C B(c) | | | | | 6.3600 | | | 11/15/52 | | | $ | 306,548 | |
| | 10,080 | | | Student Loan A.B.S Repackaging Trust Series Series 2007-1 3A1(c),(d) | | TSFR3M + 0.477% | | | 5.8120 | | | 11/27/30 | | | | 10,086 | |
| | | | | | | | | | | | | | | | | 3,130,036 | |
| | | | | WHOLE BUSINESS — 0.9% | | | | | | | | | | | | | |
| | 2,183,816 | | | Business Loan Express Business Loan Trust Series 2007-AA A(c),(d) | | TSFR1M + 0.514% | | | 5.8350 | | | 10/20/40 | | | | 1,945,306 | |
| | 52,241 | | | Business Loan Express Business Loan Trust Series 2007-AA C(c),(d) | | TSFR1M + 2.264% | | | 7.5850 | | | 10/20/40 | | | | 42,557 | |
| | 104,641 | | | Business Loan Express Business Loan Trust Series 2007-AX C(d) | | TSFR1M + 2.264% | | | 7.5850 | | | 10/20/40 | | | | 85,244 | |
| | 2,138,740 | | | KGS-Alpha SBA COOF Trust Series 2015-1 A(a),(b),(c) | | | | | 2.0180 | | | 10/25/35 | | | | 75,322 | |
| | 3,832,709 | | | KGS-Alpha SBA COOF Trust Series 2014-5 A(a),(b),(c) | | | | | 2.0660 | | | 10/25/40 | | | | 160,032 | |
| | 360,042 | | | ReadyCap Lending Small Business Loan Trust Series 2019-2 A(c),(d) | | PRIME - 0.500% | | | 8.0000 | | | 12/27/44 | | | | 360,832 | |
| | 351,772 | | | ReadyCap Lending Small Business Loan Trust Series 2023-3 A(c),(d) | | PRIME + 0.070% | | | 8.5700 | | | 04/25/48 | | | | 355,932 | |
| | | | | | | | | | | | | | | | | 3,025,225 | |
| | | | | TOTAL ASSET BACKED SECURITIES (Cost $261,845,812) | | | | | | | | | | | | 252,301,552 | |
| | | | | | | | | | | | | | | | | | |
| | | | | CORPORATE BONDS — 12.8% | | | | | | | | | | | | | |
| | | | | ASSET MANAGEMENT — 0.2% | | | | | | | | | | | | | |
| | 70,000 | | | Morgan Stanley & Company, LLC(d) | | 5*(USISOA30-USISOA02) | | | 0.0000 | | | 01/21/26 | | | | 62,300 | |
| | 274,000 | | | Nomura America Finance, LLC(d) | | 4*(USISOA30-USISOA02) | | | 0.0000 | | | 12/31/33 | | | | 169,880 | |
| | 65,000 | | | Nomura America Finance, LLC(d) | | 4*(USISOA30-USISOA02) | | | 0.0000 | | | 02/28/34 | | | | 36,003 | |
| | 890,000 | | | Nomura America Finance, LLC(d) | | 4*(USISOA30 - USISOA02) - 1.000% | | | 0.0000 | | | 07/29/34 | | | | 551,800 | |
| | | | | | | | | | | | | | | | | 819,983 | |
| | | | | BANKING — 3.4% | | | | | | | | | | | | | |
| | 190,000 | | | Bank of Nova Scotia (The)(d) | | 4*(USISOA30-USISOA02) - 2.738% | | | 0.0000 | | | 06/27/33 | | | | 117,800 | |
| | 120,000 | | | Bank of Nova Scotia (The)(d) | | 4*(USISOA30-USISOA02) - 0.738% | | | 0.0000 | | | 01/30/34 | | | | 75,600 | |
| | 100,000 | | | Bank of Nova Scotia (The)(d) | | 4*(USISOA30-USISOA02) - 1.738% | | | 0.0000 | | | 08/28/34 | | | | 62,000 | |
| | 75,000 | | | Barclays Bank PLC(b) | | | | | 7.0000 | | | 01/23/26 | | | | 74,623 | |
See accompanying notes to financial statements
EASTERLY INCOME OPPORTUNITIES FUND
SCHEDULE OF INVESTMENTS (Unaudited) (Continued)
May 31, 2024
Principal
Amount ($) | | | | | Spread | | | Coupon Rate (%) | | | Maturity | | | Fair Value | |
| | | | | CORPORATE BONDS — 12.8% (Continued) | | | | | | | | | | | | | |
| | | | | BANKING — 3.4% (Continued) | | | | | | | | | | | | | |
| | 525,000 | | | Barclays Bank PLC(d) | | 4.250*(USISOA30-USISOA02) | | | 0.0000 | | | 09/13/28 | | | $ | 414,750 | |
| | 50,000 | | | Barclays Bank PLC(d) | | 4*(USISOA30-USISOA02) | | | 0.0000 | | | 10/18/28 | | | | 39,000 | |
| | 75,000 | | | Barclays Bank PLC(d) | | 4*(USISOA10-USISOA02)-1.000% | | | 0.0000 | | | 08/15/33 | | | | 47,063 | |
| | 58,000 | | | Barclays Bank PLC(d) | | 4*(USISOA30-USISOA02-2.000%) | | | 0.0000 | | | 04/25/34 | | | | 35,960 | |
| | 70,000 | | | Barclays Bank PLC(d) | | 8*(USISOA30 - USISOA05 - 2.000%) | | | 0.0000 | | | 07/31/34 | | | | 44,100 | |
| | 177,000 | | | BNP Paribas S.A.(d) | | 4*(CMS30-CMS5) | | | 0.0000 | | | 04/30/33 | | | | 110,846 | |
| | 430,000 | | | Citigroup, Inc.(d) | | 4*(USISOA30-USISOA05)-1.000% | | | 0.0000 | | | 06/11/33 | | | | 270,900 | |
| | 1,037,000 | | | Citigroup, Inc.(d) | | 4.5*(USISOA30-USISOA05) | | | 0.0000 | | | 11/26/33 | | | | 659,791 | |
| | 507,000 | | | Citigroup, Inc.(d) | | 4*(USISOA30-USISOA02)-1.000% | | | 0.0000 | | | 12/29/34 | | | | 316,875 | |
| | 55,000 | | | Citigroup, Inc.(d) | | 20*(USISOA30-USISOA02 -17.500%) | | | 0.0000 | | | 08/31/35 | | | | 33,275 | |
| | 220,000 | | | Credit Suisse A.G.(d) | | 10*(USISOA30-USISOA02) | | | 0.0000 | | | 01/29/31 | | | | 151,800 | |
| | 1,024,000 | | | Credit Suisse A.G.(d) | | 15*(USISOA30-USISOA02) | | | 0.0000 | | | 10/31/31 | | | | 725,760 | |
| | 120,000 | | | Deutsche Bank A.G.(d) | | 4*(USISOA30-USISOA05-2.200%) | | | 0.0000 | | | 01/31/33 | | | | 72,000 | |
| | 245,000 | | | Deutsche Bank A.G.(d) | | 4*(USISOA30-USISOA02-1.600%) | | | 0.0000 | | | 06/30/34 | | | | 150,981 | |
| | 1,257,000 | | | Deutsche Bank A.G.(d) | | 4*(USISOA30-USISOA02-2.000%) | | | 0.0000 | | | 08/28/34 | | | | 747,915 | |
| | 4,009,000 | | | Deutsche Bank A.G.(d) | | 4.5*(USISOA30 - USISOA02 - 0.250%) | | | 0.0000 | | | 10/31/34 | | | | 2,505,625 | |
| | 961,000 | | | Deutsche Bank A.G.(d) | | 4*(USISOA30 - USISOA02 - 1.000%) | | | 0.0000 | | | 11/26/34 | | | | 586,210 | |
| | 738,000 | | | Deutsche Bank A.G.(d) | | 10*(USISOA30-USISOA02) - 8.750% | | | 0.0000 | | | 03/27/35 | | | | 442,800 | |
See accompanying notes to financial statements
EASTERLY INCOME OPPORTUNITIES FUND
SCHEDULE OF INVESTMENTS (Unaudited) (Continued)
May 31, 2024
Principal
Amount ($) | | | | | Spread | | | Coupon Rate (%) | | | Maturity | | | Fair Value | |
| | | | | CORPORATE BONDS — 12.8% (Continued) | | | | | | | | | | | | | |
| | | | | BANKING — 3.4% (Continued) | | | | | | | | | | | | | |
| | 75,000 | | | Deutsche Bank A.G.(d) | | 15*(USISOA30 - USISOA02 - 13.125%) | | | 0.0000 | | | 12/23/35 | | | $ | 43,688 | |
| | 100,000 | | | HSBC USA, Inc.(d) | | 6.250*(USISOA30-USISOA05) | | | 0.0000 | | | 05/21/29 | | | | 78,000 | |
| | 200,000 | | | Lloyds Bank plc(d) | | 4.3*(USISOA30-USISOA05-0.500%) | | | 0.0000 | | | 01/31/33 | | | | 124,000 | |
| | 136,000 | | | Lloyds Bank plc(d) | | 4*(USISOA30-USISOA02 -1.000%) | | | 0.0000 | | | 10/25/33 | | | | 85,000 | |
| | 655,000 | | | Lloyds Bank plc(d) | | 4*(USISOA30-USISOA02) - 1.400% | | | 0.0000 | | | 11/27/33 | | | | 416,746 | |
| | 282,000 | | | Natixis US Medium-Term Note Program, LLC(d) | | 4*(USISOA30-USISOA02) | | | 0.0000 | | | 04/30/34 | | | | 177,660 | |
| | 1,414,000 | | | Natixis US Medium-Term Note Program, LLC(d) | | 7.5*(USISOA30-USISOA05-1.875%) | | | 0.0000 | | | 07/31/34 | | | | 873,145 | |
| | 618,000 | | | Natixis US Medium-Term Note Program, LLC(d) | | 10*(USISOA30-USISOA02) | | | 0.0000 | | | 03/31/36 | | | | 370,800 | |
| | 125,000 | | | NatWest Markets plc(d) | | 4*(USISOA30-USISOA02-0.250%) | | | 0.0000 | | | 08/18/31 | | | | 83,438 | |
| | 100,000 | | | NatWest Markets plc(d) | | 4*(USISOA30 - USISOA02 - 0.500%) | | | 0.0000 | | | 08/26/31 | | | | 64,750 | |
| | 202,000 | | | SG Structured Products, Inc.(b) | | | | | 1.0000 | | | 03/31/26 | | | | 171,700 | |
| | 185,000 | | | SG Structured Products, Inc.(d) | | 4*(USISOA30 - USISOA02 - 2.000%) | | | 0.0000 | | | 07/29/31 | | | | 131,350 | |
| | 744,000 | | | Societe Generale S.A.(d) | | 10*(USISOA30-USISOA02) | | | 0.0000 | | | 10/29/32 | | | | 515,220 | |
| | 203,000 | | | Societe Generale S.A.(d) | | 50*(USISOA30-USISOA02) | | | 0.0000 | | | 01/31/35 | | | | 148,951 | |
| | 135,000 | | | STRATS, LLC(d) | | TSFR1M + 1.428% | | | 6.7170 | | | 02/15/34 | | | | 108,260 | |
| | | | | | | | | | | | | | | | | 11,078,382 | |
| | | | | INSTITUTIONAL FINANCIAL SERVICES — 5.0% | | | | | | | | | | | | | |
| | 41,000 | | | Citigroup Global Markets Holdings, Inc.(d) | | 8*(USISOA30-USISOA02) | | | 0.0000 | | | 04/25/32 | | | | 29,752 | |
| | 35,000 | | | Citigroup Global Markets Holdings, Inc.(d) | | 9.5*(USISOA30-USISOA02) | | | 0.0000 | | | 11/22/32 | | | | 24,500 | |
| | 200,000 | | | Citigroup Global Markets Holdings, Inc.(d) | | 30*(USISOA30-USISOA02) | | | 0.0000 | | | 03/29/34 | | | | 140,000 | |
| | 60,000 | | | Citigroup Global Markets Holdings, Inc.(d) | | 50*(USISOA30-USISOA02) | | | 0.0000 | | | 03/29/34 | | | | 45,225 | |
See accompanying notes to financial statements
EASTERLY INCOME OPPORTUNITIES FUND
SCHEDULE OF INVESTMENTS (Unaudited) (Continued)
May 31, 2024
Principal
Amount ($) | | | | | Spread | | | Coupon Rate (%) | | | Maturity | | | Fair Value | |
| | | | | CORPORATE BONDS — 12.8% (Continued) | | | | | | | | | | | | | |
| | | | | INSTITUTIONAL FINANCIAL SERVICES — 5.0% (Continued) | | | | | | | | | | | | | |
| | 553,000 | | | Citigroup Global Markets Holdings, Inc.(d) | | 30*(USISOA30-USISOA02) | | | 0.0000 | | | 04/01/41 | | | $ | 346,316 | |
| | 170,000 | | | Credit Suisse A.G.(d) | | 8*(USISOA30-USISOA02) | | | 0.0000 | | | 07/31/30 | | | | 96,900 | |
| | 300,000 | | | Credit Suisse A.G.(d) | | 7.5*(USISOA30-USISOA02) | | | 0.0000 | | | 09/30/30 | | | | 204,750 | |
| | 627,000 | | | Credit Suisse A.G.(d) | | 10*(USISOA30-USISOA02) | | | 0.0000 | | | 09/30/30 | | | | 445,170 | |
| | 95,000 | | | Credit Suisse A.G.(d) | | 8*(USISOA30 - USISOA02) | | | 0.0000 | | | 10/30/30 | | | | 65,075 | |
| | 791,000 | | | Credit Suisse A.G.(d) | | 12*(USISOA30-USISOA02) | | | 0.0000 | | | 04/29/31 | | | | 555,678 | |
| | 365,000 | | | Goldman Sachs Group, Inc. (The)(d) | | 5*(USISOA30-USISOA05) | | | 0.0000 | | | 03/19/29 | | | | 287,438 | |
| | 500,000 | | | GS Finance Corporation(d) | | 7*(USISOA30-USISOA05)-1.750% | | | 0.0000 | | | 03/24/31 | | | | 295,000 | |
| | 97,000 | | | Jefferies Financial Group, Inc.(d) | | 7.5*(USISOA30-USISOA02) | | | 0.0000 | | | 05/31/34 | | | | 60,989 | |
| | 30,000 | | | Jefferies Financial Group, Inc.(d) | | 10*(USISOA10-USISOA02) | | | 0.0000 | | | 06/30/37 | | | | 18,525 | |
| | 1,168,000 | | | Jefferies Financial Group, Inc.(d) | | 9*(USISOA30-USISOA02) | | | 0.0000 | | | 07/31/37 | | | | 735,840 | |
| | 1,071,000 | | | Jefferies Financial Group, Inc.(d) | | 9*(USISOA10-USISOA02) | | | 0.0000 | | | 08/31/37 | | | | 661,343 | |
| | 150,000 | | | Jefferies Financial Group, Inc.(d) | | 10*(USISOA10-USISOA02) | | | 0.0000 | | | 08/31/37 | | | | 92,625 | |
| | 248,000 | | | Jefferies Financial Group, Inc.(d) | | 8*(USISOA10-USISOA02) | | | 0.0000 | | | 09/30/37 | | | | 151,280 | |
| | 240,000 | | | Jefferies Financial Group, Inc.(d) | | 10*(USISOA10-USISOA02) | | | 0.0000 | | | 10/31/37 | | | | 148,200 | |
| | 110,000 | | | Jefferies Financial Group, Inc.(d) | | 8*(USISOA30-USISOA02) | | | 0.0000 | | | 01/31/38 | | | | 68,750 | |
| | 762,000 | | | Jefferies Financial Group, Inc.(d) | | USISOA30 + 0.750% | | | 5.0290 | | | 02/28/38 | | | | 504,825 | |
| | 673,000 | | | Jefferies Financial Group, Inc.(d) | | TSFR3M + 1.762% | | | 7.0000 | | | 08/31/39 | | | | 536,953 | |
| | 280,000 | | | Jefferies Financial Group, Inc.(d) | | TSFR3M + 4.262% | | | 5.0000 | | | 03/20/40 | | | | 238,307 | |
| | 115,000 | | | Morgan Stanley(d) | | (USISOA30-USISOA02) | | | 0.0000 | | | 03/21/27 | | | | 97,750 | |
| | 56,000 | | | Morgan Stanley(d) | | 4*(USISOA30-USISOA05) | | | 0.0000 | | | 06/28/28 | | | | 43,610 | |
| | 1,015,000 | | | Morgan Stanley(d) | | 8*(USISOA30-USISOA05) | | | 0.0000 | | | 09/27/28 | | | | 786,625 | |
| | 772,000 | | | Morgan Stanley(d) | | 5*(USISOA30-USISOA02) | | | 0.0000 | | | 10/15/28 | | | | 596,370 | |
| | 100,000 | | | Morgan Stanley(b) | | | | | 6.0000 | | | 06/29/29 | | | | 85,000 | |
See accompanying notes to financial statements
EASTERLY INCOME OPPORTUNITIES FUND
SCHEDULE OF INVESTMENTS (Unaudited) (Continued)
May 31, 2024
Principal
Amount ($) | | | | | Spread | | | Coupon Rate (%) | | | Maturity | | | Fair Value | |
| | | | | CORPORATE BONDS — 12.8% (Continued) | | | | | | | | | | | | | |
| | | | | INSTITUTIONAL FINANCIAL SERVICES — 5.0% (Continued) | | | | | | | | | | | | | |
| | 3,598,000 | | | Morgan Stanley(d) | | 10*(USISOA30-USISOA02) | | | 0.0000 | | | 04/30/30 | | | $ | 2,500,609 | |
| | 1,593,000 | | | Morgan Stanley(d) | | 10*(USISOA30-USISOA02) | | | 0.0000 | | | 05/29/30 | | | | 1,107,134 | |
| | 488,000 | | | Morgan Stanley(d) | | 10*(USISOA30-USISOA02) | | | 0.0000 | | | 06/30/30 | | | | 339,160 | |
| | 221,000 | | | Morgan Stanley(d) | | 8*(USISOA30-USISOA02) | | | 0.0000 | | | 07/31/30 | | | | 151,109 | |
| | 290,000 | | | Morgan Stanley(d) | | 8.5*(USISOA30-USISOA02) | | | 0.0000 | | | 08/19/30 | | | | 199,375 | |
| | 216,000 | | | Morgan Stanley(d) | | 8*(USISOA30-USISOA02) | | | 0.0000 | | | 08/31/30 | | | | 147,690 | |
| | 428,000 | | | Morgan Stanley(d) | | 10*(USISOA30-USISOA02) | | | 0.0000 | | | 09/30/30 | | | | 297,460 | |
| | 151,000 | | | Morgan Stanley(d) | | 7*(USISOA30-USISOA02) | | | 0.0000 | | | 10/30/30 | | | | 102,303 | |
| | 171,000 | | | Morgan Stanley Series 10(d) | | 5*(USISOA30-USISOA02) | | | 0.0000 | | | 10/30/30 | | | | 100,934 | |
| | 50,000 | | | Morgan Stanley(d) | | 5*(USISOA30-USISOA02) | | | 0.0000 | | | 11/30/30 | | | | 33,250 | |
| | 66,000 | | | Morgan Stanley(d) | | 10*(USISOA30-USISOA02) | | | 0.0000 | | | 11/30/30 | | | | 45,540 | |
| | 30,000 | | | Morgan Stanley(d) | | 10*(USISOA30-USISOA02) | | | 0.0000 | | | 01/29/31 | | | | 20,400 | |
| | 20,000 | | | Morgan Stanley(d) | | (USISOA30-USISOA02) | | | 0.0000 | | | 03/31/31 | | | | 14,450 | |
| | 167,000 | | | Morgan Stanley(d) | | 9*(USISOA30-USISOA02) | | | 0.0000 | | | 03/31/31 | | | | 130,260 | |
| | 89,000 | | | Morgan Stanley(d) | | (USISOA30-USISOA02) | | | 0.0000 | | | 05/31/31 | | | | 68,975 | |
| | 125,000 | | | Morgan Stanley(d) | | 9*(USISOA30-USISOA02) | | | 0.0000 | | | 06/30/31 | | | | 97,500 | |
| | 114,000 | | | Morgan Stanley(d) | | (USISOA30-USISOA02) | | | 0.0000 | | | 07/29/31 | | | | 88,350 | |
| | 268,200 | | | Morgan Stanley(d) | | 7*(USISOA30-USISOA02) | | | 0.0000 | | | 09/16/31 | | | | 178,688 | |
| | 197,000 | | | Morgan Stanley(d) | | 8*(USISOA30-USISOA02) | | | 0.0000 | | | 01/30/34 | | | | 118,200 | |
| | 345,000 | | | Morgan Stanley(d) | | 4*(USISOA30-USISOA02) | | | 0.0000 | | | 02/28/34 | | | | 198,375 | |
| | 209,000 | | | Morgan Stanley(d) | | 4*(USISOA30-USISOA02) | | | 0.0000 | | | 03/31/34 | | | | 119,130 | |
| | 287,000 | | | Morgan Stanley(d) | | 4*(USISOA30-USISOA02) | | | 0.0000 | | | 05/30/34 | | | | 163,590 | |
| | 121,000 | | | Morgan Stanley(d) | | 5*(USISOA30-USISOA02) | | | 0.0000 | | | 08/29/34 | | | | 70,180 | |
See accompanying notes to financial statements
EASTERLY INCOME OPPORTUNITIES FUND
SCHEDULE OF INVESTMENTS (Unaudited) (Continued)
May 31, 2024
Principal
Amount ($) | | | | | Spread | | | Coupon Rate (%) | | | Maturity | | | Fair Value | |
| | | | | CORPORATE BONDS — 12.8% (Continued) | | | | | | | | | | | | | |
| | | | | INSTITUTIONAL FINANCIAL SERVICES — 5.0% (Continued) | | | | | | | | | | | | | |
| | 120,000 | | | Morgan Stanley(d) | | 5*(USISOA30-USISOA02) | | | 0.0000 | | | 09/30/34 | | | $ | 69,600 | |
| | 238,000 | | | Morgan Stanley(d) | | 5*(USISOA30-USISOA02) | | | 0.0000 | | | 10/08/34 | | | | 138,040 | |
| | 233,000 | | | Morgan Stanley(d) | | 7*(USISOA30-USISOA02) | | | 0.0000 | | | 10/31/34 | | | | 139,800 | |
| | 30,000 | | | Morgan Stanley(d) | | 5*(USISOA30-USISOA02) | | | 0.0000 | | | 11/28/34 | | | | 17,400 | |
| | 230,000 | | | Morgan Stanley(d) | | 4.5*(USISOA30-USISOA02) | | | 0.0000 | | | 12/31/34 | | | | 131,963 | |
| | 467,000 | | | Morgan Stanley(d) | | 8*(USISOA30-USISOA02) | | | 0.0000 | | | 01/30/35 | | | | 283,703 | |
| | 438,000 | | | Morgan Stanley(d) | | 6*(USISOA30-USISOA02) | | | 0.0000 | | | 03/31/35 | | | | 257,325 | |
| | 855,000 | | | Morgan Stanley(d) | | 9*(CMS30-CMS2) | | | 0.0000 | | | 04/30/35 | | | | 572,850 | |
| | 73,000 | | | Morgan Stanley(d) | | 9*(CMS30-CMS2) | | | 0.0000 | | | 05/29/35 | | | | 48,910 | |
| | 185,000 | | | Morgan Stanley(d) | | 9*(CMS30-CMS2) | | | 0.0000 | | | 06/30/35 | | | | 123,950 | |
| | 384,000 | | | Morgan Stanley(d) | | 9*(CMS30-CMS2) | | | 0.0000 | | | 07/31/35 | | | | 257,280 | |
| | 134,000 | | | Morgan Stanley(d) | | 9*(USISOA30-USISOA02) | | | 0.0000 | | | 09/30/35 | | | | 90,785 | |
| | 109,000 | | | Morgan Stanley(d) | | 9*(USISOA30-USISOA02) | | | 0.0000 | | | 11/30/35 | | | | 73,030 | |
| | 134,000 | | | Morgan Stanley(d) | | 9*(CMS30-CMS2) | | | 0.0000 | | | 12/23/35 | | | | 89,780 | |
| | 828,000 | | | Morgan Stanley(d) | | 10*(USISOA30-USISOA02) | | | 0.0000 | | | 02/29/36 | | | | 507,150 | |
| | 45,000 | | | Morgan Stanley Finance, LLC(d) | | 20*(USISOA30-USISOA02) | | | 0.0000 | | | 08/31/36 | | | | 27,900 | |
| | | | | | | | | | | | | | | | | 16,484,924 | |
| | | | | LEISURE FACILITIES & SERVICES — 0.1% | | | | | | | | | | | | | |
| | 395,033 | | | Times Square Hotel Trust(c) | | | | | 8.5280 | | | 08/01/26 | | | | 393,090 | |
| | | | | | | | | | | | | | | | | | |
| | | | | OIL & GAS PRODUCERS — 0.3% | | | | | | | | | | | | | |
| | 250,000 | | | Petroleos Mexicanos(c) | | | | | 10.0000 | | | 02/07/33 | | | | 252,488 | |
| | 870,000 | | | Petroleos Mexicanos | | | | | 6.7500 | | | 09/21/47 | | | | 584,999 | |
| | | | | | | | | | | | | | | | | 837,487 | |
| | | | | REAL ESTATE INVESTMENT TRUSTS — 0.0%(g) | | | | | | | | | | | | | |
| | 110,000 | | | American Tower Trust #1 Series 2018-1 A(c) | | | | | 3.6520 | | | 03/23/28 | | | | 102,920 | |
| | | | | | | | | | | | | | | | | | |
| | | | | SPECIALTY FINANCE — 3.8% | | | | | | | | | | | | | |
| | 182,416 | | | Fort Knox Military Housing Privatization Project(d) | | TSFR1M + 0.454% | | | 5.7710 | | | 02/15/52 | | | | 144,052 | |
See accompanying notes to financial statements
EASTERLY INCOME OPPORTUNITIES FUND
SCHEDULE OF INVESTMENTS (Unaudited) (Continued)
May 31, 2024
Principal
Amount ($) | | | | | Spread | | | Coupon Rate (%) | | | Maturity | | | Fair Value | |
| | | | | CORPORATE BONDS — 12.8% (Continued) | | | | | | | | | | | | | |
| | | | | SPECIALTY FINANCE — 3.8% (Continued) | | | | | | | | | | | | | |
| | 2,548,787 | | | MM Community Funding III Ltd. / MM Community(c),(d) | | TSFR6M + 2.478% | | | 7.7870 | | | 05/01/32 | | | $ | 2,421,348 | |
| | 737,000 | | | Morgan Stanley Finance, LLC(d) | | 15(USISOA30-USISOA02) | | | 0.0000 | | | 04/30/33 | | | | 505,766 | |
| | 541,000 | | | Morgan Stanley Finance, LLC(d) | | 10*(USISOA30-USISOA02) | | | 0.0000 | | | 06/30/36 | | | | 330,010 | |
| | 215,000 | | | Morgan Stanley Finance, LLC(d) | | 15*(USISOA30-USISOA02) | | | 0.0000 | | | 07/29/36 | | | | 131,956 | |
| | 3,642,000 | | | Morgan Stanley Finance, LLC(d) | | 20*(USISOA30-USISOA02) | | | 0.0000 | | | 08/31/36 | | | | 2,258,040 | |
| | 992,000 | | | Morgan Stanley Finance, LLC(d) | | 20*(USISOA30-USISOA02) | | | 0.0000 | | | 09/30/36 | | | | 615,040 | |
| | 4,293,000 | | | Morgan Stanley Finance, LLC(d) | | 20*(USISOA30-USISOA02) | | | 0.0000 | | | 11/29/36 | | | | 2,661,660 | |
| | 40,000 | | | Morgan Stanley Finance, LLC(d) | | 20*(USISOA30-USISOA02) | | | 0.0000 | | | 12/30/36 | | | | 24,800 | |
| | 1,670,000 | | | Morgan Stanley Finance, LLC(d) | | 20*(USISOA30-USISOA02) | | | 0.0000 | | | 01/31/37 | | | | 1,035,400 | |
| | 100,000 | | | Morgan Stanley Finance, LLC(d) | | 15*(USISOA30-USISOA02) | | | 0.0000 | | | 03/31/37 | | | | 61,750 | |
| | 396,000 | | | Morgan Stanley Finance, LLC(d) | | 20*(USISOA30-USISOA02) | | | 0.0000 | | | 04/28/37 | | | | 245,520 | |
| | 267,000 | | | Morgan Stanley Finance, LLC(d) | | 20*(USISOA30-USISOA02) | | | 0.0000 | | | 07/31/37 | | | | 165,540 | |
| | 168,000 | | | Morgan Stanley Finance, LLC(d) | | 20*(USISOA30-USISOA02) | | | 0.0000 | | | 09/29/37 | | | | 104,160 | |
| | 2,014,000 | | | Morgan Stanley Finance, LLC(d) | | 10*(USISOA30-USISOA02) | | | 0.0000 | | | 09/29/37 | | | | 1,228,540 | |
| | 25,433 | | | Preferred Term Securities X Ltd. / Preferred Term(c),(d) | | TSFR3M + 1.122% | | | 6.4340 | | | 07/03/33 | | | | 24,309 | |
| | 634,876 | | | Select Notes Trust LT | | | | | 5.9100 | | | 02/22/33 | | | | 566,331 | |
| | | | | | | | | | | | | | | | | 12,524,222 | |
| | | | | TOTAL CORPORATE BONDS (Cost $57,576,041) | | | | | | | | | | | | 42,241,008 | |
| | | | | | | | | | | | | | | | | | |
| | | | | NON U.S. GOVERNMENT & AGENCIES — 0.3% | | | | | | | | | | | | | |
| | | | | SOVEREIGN — 0.1% | | | | | | | | | | | | | |
| | 200,000 | | | Argentina Bonar Bonds(e) | | | | | 0.7500 | | | 07/09/30 | | | | 110,726 | |
| | 24,086 | | | Argentine Republic Government International Bond | | | | | 1.0000 | | | 07/09/29 | | | | 14,075 | |
| | 685,000 | | | Argentine Republic Government International Bond(e) | | | | | 3.6250 | | | 07/09/35 | | | | 302,396 | |
| | | | | | | | | | | | | | | | | 427,197 | |
| | | | | SUPRANATIONAL — 0.2% | | | | | | | | | | | | | |
| | 964,000 | | | International Bank for Reconstruction & Development(b) | | | | | 0.0000 | | | 06/30/34 | | | | 621,780 | |
See accompanying notes to financial statements
EASTERLY INCOME OPPORTUNITIES FUND
SCHEDULE OF INVESTMENTS (Unaudited) (Continued)
May 31, 2024
Principal
Amount ($) | | | | | Coupon Rate (%) | | | Maturity | | | Fair Value | |
| | | | | NON U.S. GOVERNMENT & AGENCIES — 0.3% (Continued) | | | | | | | | | | |
| | | | | TOTAL NON U.S. GOVERNMENT & AGENCIES (Cost $1,169,240) | | | | | | | | $ | 1,048,977 | |
| | | | | | | | | | | | | | | |
| | | | | U.S. GOVERNMENT & AGENCIES — 3.0% | | | | | | | | | | |
| | | | | AGENCY FIXED RATE — 1.2% | | | | | | | | | | |
| | 3,760,048 | | | Fannie Mae Pool BY8354 | | 6.0000 | | | 08/01/53 | | | | 3,767,002 | |
| | | | | | | | | | | | | | | |
| | | | | AGENCY MBS OTHER — 0.0%(g) | | | | | | | | | | |
| | 34,499 | | | Fannie Mae Pool 257064 | | 4.5000 | | | 11/01/37 | | | | 33,570 | |
| | 8,292 | | | Ginnie Mae II Pool BU6365(b) | | 4.6150 | | | 04/20/70 | | | | 8,141 | |
| | | | | | | | | | | | | | 41,711 | |
| | | | | U.S. TREASURY NOTES — 1.8% | | | | | | | | | | |
| | 1,000,000 | | | United States Treasury Note | | 4.0000 | | | 06/30/28 | | | | 978,125 | |
| | 1,000,000 | | | United States Treasury Note | | 3.7500 | | | 06/30/30 | | | | 958,359 | |
| | 4,004,000 | | | United States Treasury Note | | 4.5000 | | | 11/15/33 | | | | 3,997,431 | |
| | | | | | | | | | | | | | 5,933,915 | |
| | | | | TOTAL U.S. GOVERNMENT & AGENCIES (Cost $9,895,457) | | | | | | | | | 9,742,628 | |
| | | | | | | | | | | | | | | |
| | | | | TOTAL INVESTMENTS - 92.9% (Cost $330,486,550) | | | | | | | | $ | 305,334,165 | |
| | | | | OTHER ASSETS IN EXCESS OF LIABILITIES- 7.1% | | | | | | | | | 23,171,941 | |
| | | | | NET ASSETS - 100.0% | | | | | | | | $ | 328,506,106 | |
| OPEN FUTURES CONTRACTS | | | | |
Number of
Contracts | | | Open Long Futures Contracts | | Expiration | | | Notional Amount(h) | | | Value and Unrealized Appreciation | |
| | 195 | | | CBOT 3 Year US Treasury Note Future | | 10/01/2024 | | | $ | 40,377,187 | | | $ | 100,262 | |
| | 195 | | | Ultra 10-Year US Treasury Note Futures | | 09/20/2024 | | | | 21,846,094 | | | | 160,266 | |
| | | | | TOTAL FUTURES CONTRACTS | | | | | | | | | $ | 260,528 | |
See accompanying notes to financial statements
EASTERLY INCOME OPPORTUNITIES FUND
SCHEDULE OF INVESTMENTS (Unaudited) (Continued)
May 31, 2024
CREDIT DEFAULT SWAP AGREEMENTS
| Description | | Payment
Frequency | | Counterparty | | | Fixed Deal (Pay) Rate | | | Maturity Date | | Notional Value | | | Fair Value | | | Amortized
Upfront Payments
Paid/ (Received) | | | Unrealized
Appreciation/ (Depreciation) | |
| CDX.NA.HY Series 42 | | Annual | | GS | | | 5.00% | | | 6/20/2029 | | $ | 54,000,000 | | | $ | (4,154,745 | ) | | $ | (3,791,496 | ) | | $ | (363,249 | ) |
| Morgan Stanley 7.25% 04/01/2032 | | Annual | | GS | | | 1.00% | | | 6/20/2025 | | | 20,000,000 | | | | (201,636 | ) | | | (82,727 | ) | | | (118,909 | ) |
| TOTAL | | | | | | | | | | | | | | | | $ | (4,356,381 | ) | | $ | (3,874,223 | ) | | $ | (482,158 | ) |
GS LLC | - Goldman Sachs - Limited Liability Company |
| LP | - Limited Partnership |
| LTD | - Limited Company |
| PLC | - Public Limited Company |
| REMIC | - Real Estate Mortgage Investment Conduit |
| S.A. | - Société Anonyme |
| | |
12MTA | Federal Reserve US 12 Month Cumulative Avg 1 Year Constant Maturity Treasury |
| CMS2 | 2 Year Constant Maturity Swap Rate |
| CMS5 | 5 Year Constant Maturity Swap Rate |
| CMS30 | 30 Year Constant Maturity Swap Rate |
| ECOFC | Enterprise 11th District Cost of Funds Index |
| EUR003M | Euribor 3 Month |
| EUR006M | Euribor 6 Month |
| H15T1Y | US Treasury Yield Curve Rate T Note Constant Maturity 1 Year |
| PRIME | Prime Rate by U.S. |
| SOFR30A | United States 30 Day Average Secured Overnight Financing Rate |
| SOFR90A | United States 90 Day Average Secured Overnight Financing Rate |
| TSFR1M | Secured Overnight Financing Rate 1 Month |
| TSFR3M | Secured Overnight Financing Rate 3 Month |
| TSFR6M | Secured Overnight Financing Rate 6 Month |
| USISOA02 | USD SOFR Spread-Adj. ICE Swap Rate 2Y |
| USISOA05 | USD SOFR Spread-Adj. ICE Swap Rate 5Y |
| USISOA10 | USD SOFR Spread-Adj. ICE Swap Rate 10Y |
| USISOA30 | USD SOFR Spread-Adj. ICE Swap Rate 30Y |
See accompanying notes to financial statements
EASTERLY INCOME OPPORTUNITIES FUND
SCHEDULE OF INVESTMENTS (Unaudited) (Continued)
May 31, 2024
| (a) | Interest only securities. |
| (b) | Variable or floating rate security, the interest rate of which adjusts periodically based on changes in current interest rates and prepayments on the underlying pool of assets. |
| (c) | Security exempt from registration under Rule 144A or Section 4(2) of the Securities Act of 1933. The security may be resold in transactions exempt from registration, normally to qualified institutional buyers. As of May 31, 2024 the total market value of 144A securities is $168,742,179 or 51.4% of net assets. |
| (d) | Variable rate security; the rate shown represents the rate on May 31, 2024. |
| (e) | Step bond. Coupon rate is fixed rate that changes on a specified date. The rate shown is the current rate at May 31, 2024. |
| (f) | Zero coupon bond. |
| (g) | Percentage rounds to less than 0.1%. |
| (h) | The amounts shown are the underlying reference notional amounts to stock exchange indices and equities upon which the fair value of the futures contracts held by the Fund are based. Notional values do not represent the current fair value of, and are not necessarily indicative of the future cash flows of the Fund’s futures contracts. Further, the underlying price changes in relation to the variables specified by the notional values affects the fair value of these derivative financial instruments. The notional values as set forth within this schedule do not purport to represent economic value at risk to the Fund. |
See accompanying notes to financial statements
EASTERLY INCOME OPPORTUNITIES FUND
STATEMENT OF ASSETS AND LIABILITIES (Unaudited)
May 31, 2024
| Assets: | | | | |
| Total Investments, at cost | | $ | 330,486,550 | |
| | | | | |
| Total Investments, at value | | $ | 305,334,165 | |
| Cash | | | 16,079,723 | |
| Foreign cash ($173,503) | | | 175,951 | |
| Deposit in collateral account for swaps | | | 4,361,525 | |
| Deposit at broker for swaps | | | 4,338,883 | |
| Deposit at broker for futures | | | 1,099,286 | |
| Unrealized appreciation on futures | | | 260,528 | |
| Receivable for securities sold | | | 147,805 | |
| Receivable for fund shares sold | | | 406,224 | |
| Interest and dividends receivable | | | 1,651,718 | |
| Prepaid expenses and other assets | | | 131,114 | |
| Total Assets | | | 333,986,922 | |
| | | | | |
| Liabilities: | | | | |
| Payable for securities purchased | | | 460,000 | |
| Payable for fund shares redeemed | | | 152,668 | |
| Premiums received on swaps | | | 3,874,223 | |
| Unrealized depreciation on swaps | | | 482,158 | |
| Administrator fees payable | | | 109,474 | |
| Payable to manager | | | 271,154 | |
| Trustee fees payable | | | 5,022 | |
| Payable for distribution (12b-1) fees | | | 10,730 | |
| Compliance officer fees payable | | | 665 | |
| Accrued expenses and other liabilities | | | 114,722 | |
| Total Liabilities | | | 5,480,816 | |
| | | | | |
| Net Assets | | $ | 328,506,106 | |
| | | | | |
| Net Assets: | | | | |
| Paid in capital | | $ | 364,944,659 | |
| Accumulated loss | | | (36,438,553 | ) |
| Net Assets | | $ | 328,506,106 | |
| | | | | |
| Net Asset Value Per Share | | | | |
| Class A | | | | |
| Net Assets | | $ | 5,828,374 | |
| Shares of beneficial interest outstanding [$0 par value, unlimited shares authorized] | | | 595,440 | |
| Net asset value and redemption price per share | | $ | 9.79 | |
| Offering price per share (maximum sales charge of 2.00%) | | $ | 9.99 | |
| | | | | |
| Class C | | | | |
| Net Assets | | $ | 3,557,558 | |
| Shares of beneficial interest outstanding [$0 par value, unlimited shares authorized] | | | 373,192 | |
| Net asset value/offering/redemption price per share (a) | | $ | 9.53 | |
| | | | | |
| Class I | | | | |
| Net Assets | | $ | 240,448,688 | |
| Shares of beneficial interest outstanding [$0 par value, unlimited shares authorized] | | | 25,226,018 | |
| Net asset value/offering/redemption price per share | | $ | 9.53 | |
| | | | | |
| Class R6 | | | | |
| Net Assets | | $ | 78,671,486 | |
| Shares of beneficial interest outstanding [$0 par value, unlimited shares authorized] | | | 8,037,165 | |
| Net asset value/offering/redemption price per share | | $ | 9.79 | |
| (a) | A contingent deferred sales charge (“CDSC”) of 1.00% may be charged on shares held less than 12 months. |
See accompanying notes to financial statements.
EASTERLY INCOME OPPORTUNITIES FUND
STATEMENT OF OPERATIONS (Unaudited)
For the Six Months Ended May 31, 2024
| Investment Income: | | | | |
| Interest income | | $ | 10,761,202 | |
| Total Investment Income | | | 10,761,202 | |
| | | | | |
| Operating Expenses: | | | | |
| Management fees | | | 1,925,212 | |
| Distribution (12b-1) fees | | | | |
| Class A Shares | | | 7,529 | |
| Class C Shares | | | 18,479 | |
| Administration fees | | | 250,012 | |
| Interest expenses | | | 216,606 | |
| Shareholder servicing fees | | | 103,435 | |
| Legal fees | | | 56,723 | |
| Transfer Agent fees | | | 47,642 | |
| Registration fees | | | 32,849 | |
| Custodian fees | | | 26,009 | |
| Printing and postage expense | | | 17,520 | |
| Trustees’ fees | | | 12,689 | |
| Audit fees | | | 11,363 | |
| Insurance expense | | | 8,904 | |
| Compliance officer fees | | | 3,470 | |
| Miscellaneous expenses | | | 4,651 | |
| Total Operating Expenses | | | 2,743,093 | |
| | | | | |
| Less: Expenses waived | | | (363,620 | ) |
| Total Waivers | | | (363,620 | ) |
| | | | | |
| Net Operating Expenses | | | 2,379,473 | |
| | | | | |
| Net Investment Income | | | 8,381,729 | |
| | | | | |
| Realized and Unrealized Gain (Loss) on Investments: | | | | |
| Net realized gain (loss) from: | | | | |
| Investments | | | (508,878 | ) |
| Futures | | | (1,263,055 | ) |
| Swaps | | | 872,286 | |
| Net realized (loss) | | | (899,647 | ) |
| | | | | |
| Net change in unrealized appreciation/(depreciation) on: | | | | |
| Investments | | | 6,513,592 | |
| Futures | | | 279,143 | |
| Swaps | | | (3,864,565 | ) |
| Net change in unrealized appreciation | | | 2,928,170 | |
| Net Realized and Unrealized Gain on investments | | | 2,028,523 | |
| | | | | |
| Net Increase in Net Assets Resulting From Operations | | $ | 10,410,252 | |
See accompanying notes to financial statements.
EASTERLY INCOME OPPORTUNITIES FUND
STATEMENTS OF CHANGES IN NET ASSETS
| | | Six Months Ended
May 31,
2024 | | | Year Ended
November 30,
2023 | |
| | | (Unaudited) | | | | |
| Operations: | | | | | | | | |
| Net investment income | | $ | 8,381,729 | | | $ | 15,342,614 | |
| Net realized (loss) on investments | | | (899,647 | ) | | | (425,745 | ) |
| Net change in unrealized appreciation (depreciation) on investments | | | 2,928,170 | | | | (700,168 | ) |
| Net increase in net assets resulting from operations | | | 10,410,252 | | | | 14,216,701 | |
| | | | | | | | | |
| Distributions to Shareholders: | | | | | | | | |
| Total Distributions: | | | | | | | | |
| Class I | | | (6,753,680 | ) | | | (15,460,411 | ) |
| Class A | | | (163,250 | ) | | | (659,176 | ) |
| Class C | | | (89,685 | ) | | | (233,492 | ) |
| Class R6 | | | (2,288,862 | ) | | | (5,964,481 | ) |
| Total Dividends and Distributions to Shareholders | | | (9,295,477 | ) | | | (22,317,560 | ) |
| | | | | | | | | |
| Share Transactions of Beneficial Interest: | | | | | | | | |
| Net proceeds from shares sold | | | | | | | | |
| Class I | | | 55,167,256 | | | | 121,236,095 | |
| Class A | | | 943,554 | | | | 4,102,974 | |
| Class C | | | 562,025 | | | | 725,489 | |
| Class R6 | | | 3,788,490 | | | | 13,420,081 | |
| Reinvestment of dividends and distributions | | | | | | | | |
| Class I | | | 6,024,821 | | | | 13,780,377 | |
| Class A | | | 113,780 | | | | 530,834 | |
| Class C | | | 67,854 | | | | 164,808 | |
| Class R6 | | | 1,928,487 | | | | 4,724,777 | |
| Cost of shares redeemed | | | | | | | | |
| Class I | | | (51,071,429 | ) | | | (105,969,267 | ) |
| Class A | | | (1,282,553 | ) | | | (9,568,819 | ) |
| Class C | | | (620,431 | ) | | | (1,716,476 | ) |
| Class R6 | | | (7,006,270 | ) | | | (29,892,214 | ) |
| Net increase in net assets from share transactions of beneficial interest | | | 8,615,584 | | | | 11,538,659 | |
| | | | | | | | | |
| Total Increase in Net Assets | | | 9,730,359 | | | | 3,437,800 | |
| | | | | | | | | |
| Net Assets: | | | | | | | | |
| Beginning of year/period | | | 318,775,747 | | | | 315,337,947 | |
| End of year/period | | $ | 328,506,106 | | | $ | 318,775,747 | |
| | | | | | | | | |
| Share Activity | | | | | | | | |
| Shares sold | | | | | | | | |
| Class I | | | 5,747,935 | | | | 12,562,281 | |
| Class A | | | 95,585 | | | | 414,956 | |
| Class C | | | 58,358 | | | | 75,174 | |
| Class R6 | | | 384,189 | | | | 1,360,347 | |
| Shares Reinvested | | | | | | | | |
| Class I | | | 629,808 | | | | 1,438,071 | |
| Class A | | | 11,587 | | | | 53,971 | |
| Class C | | | 7,092 | | | | 17,190 | |
| Class R6 | | | 196,638 | | | | 483,125 | |
| Shares redeemed | | | | | | | | |
| Class I | | | (5,319,228 | ) | | | (11,001,893 | ) |
| Class A | | | (130,002 | ) | | | (975,479 | ) |
| Class C | | | (64,565 | ) | | | (177,742 | ) |
| Class R6 | | | (712,756 | ) | | | (3,034,920 | ) |
| Net Increase in shares of beneficial interest | | | 904,641 | | | | 1,215,081 | |
See accompanying notes to financial statements.
EASTERLY INCOME OPPORTUNITIES FUND
FINANCIAL HIGHLIGHTS (For a share outstanding throughout each year/period)
| | | Class A | |
| | | For the
Six Months Ended
May 31
2024 | | | For the
Year Ended
November 30,
2023 | | | For the
Year Ended
November 30,
2022 | | | For the
Year Ended
November 30,
2021 | | | For the
Year Ended
November 30,
2020 | | | For the
Year Ended
November 30,
2019 | |
| | | (Unaudited) | | | | | | | | | | | | | | | | |
| Net Asset Value, Beginning of Year/Period | | $ | 9.75 | | | $ | 10.00 | | | $ | 11.26 | | | $ | 11.35 | | | $ | 10.68 | | | $ | 10.16 | |
| Income (Loss) from Investment Operations: | | | | | | | | | | | | | | | | | | | | | | | | |
| Net investment income (1) | | | 0.24 | | | | 0.43 | | | | 0.32 | | | | 0.36 | | | | 0.42 | | | | 0.41 | |
| Net realized and unrealized gain (loss) | | | 0.07 | | | | (0.04 | ) | | | (1.07 | ) | | | 0.24 | | | | 0.95 | | | | 0.46 | |
| Total from investment operations | | | 0.31 | | | | 0.39 | | | | (0.75 | ) | | | 0.60 | | | | 1.37 | | | | 0.87 | |
| Dividends and Distributions: | | | | | | | | | | | | | | | | | | | | | | | | |
| Dividends from net investment income | | | (0.27 | ) | | | (0.64 | ) | | | (0.34 | ) | | | (0.38 | ) | | | (0.52 | ) | | | (0.34 | ) |
| Distributions from realized gains | | | - | | | | - | | | | (0.17 | ) | | | (0.31 | ) | | | (0.18 | ) | | | (0.01 | ) |
| Total dividends and distributions | | | (0.27 | ) | | | (0.64 | ) | | | (0.51 | ) | | | (0.69 | ) | | | (0.70 | ) | | | (0.35 | ) |
| | | | | | | | | | | | | | | | | | | | | | | | | |
| Redemption Fees | | | - | | | | - | | | | - | | | | - | | | | - | | | | 0.00 | ** |
| | | | | | | | | | | | | | | | | | | | | | | | | |
| Net Asset Value, End of Year/Period | | $ | 9.79 | | | $ | 9.75 | | | $ | 10.00 | | | $ | 11.26 | | | $ | 11.35 | | | $ | 10.68 | |
| | | | | | | | | | | | | | | | | | | | | | | | | |
| Total Return* | | | 3.18 | % | | | 4.04 | % | | | (6.84 | )% | | | 5.44 | % # | | | 13.54 | % # | | | 8.67 | % # |
| | | | | | | | | | | | | | | | | | | | | | | | | |
| Ratios and Supplemental Data: | | | | | | | | | | | | | | | | | | | | | | | | |
| Net assets, end of year/period (000s) | | $ | 5,828 | | | $ | 6,031 | | | $ | 11,247 | | | $ | 15,664 | | | $ | 12,466 | | | $ | 435 | |
| Ratio of gross operating expenses to average net assets including interest expense (2,3) | | | 1.94 | % (8) | | | 1.93 | % | | | 1.86 | % | | | 1.86 | % | | | 2.01 | % | | | 2.38 | % |
| Ratio of net operating expenses to average net assets including interest expense (2,4) | | | 1.86 | % (8) | | | 1.84 | % | | | 1.80 | % | | | 1.76 | % | | | 1.79 | % | | | 1.74 | % |
| Ratio of net investment income (loss) after expense reimbursement to average net assets (2,7) | | | 4.84 | % (8) | | | 4.32 | % | | | 3.01 | % | | | 3.18 | % | | | 3.89 | % | | | 3.84 | % |
| Portfolio Turnover Rate | | | 16 | % (9) | | | 42 | % | | | 77 | % | | | 84 | % | | | 132 | % | | | 111 | % |
| | | Class C | |
| | | For the
Six Months Ended
May 31
2024 | | | For the
Year Ended
November 30,
2023 | | | For the
Year Ended
November 30,
2022 | | | For the
Year Ended
November 30,
2021 | | | For the
Year Ended
November 30,
2020 | | | For the
Year Ended
November 30,
2019 | |
| | | (Unaudited) | | | | | | | | | | | | | | | | |
| Net Asset Value, Beginning of Year/Period | | $ | 9.51 | | | $ | 9.76 | | | $ | 11.00 | | | $ | 11.10 | | | $ | 10.45 | | | $ | 10.16 | |
| Income (Loss) from Investment Operations: | | | | | | | | | | | | | | | | | | | | | | | | |
| Net investment income (1) | | | 0.20 | | | | 0.35 | | | | 0.23 | | | | 0.27 | | | | 0.33 | | | | 0.32 | |
| Net realized and unrealized gain (loss) | | | 0.05 | | | | (0.03 | ) | | | (1.04 | ) | | | 0.24 | | | | 0.93 | | | | 0.31 | |
| Total from investment operations | | | 0.25 | | | | 0.32 | | | | (0.81 | ) | | | 0.51 | | | | 1.26 | | | | 0.63 | |
| Dividends and Distributions: | | | | | | | | | | | | | | | | | | | | | | | | |
| Dividends from net investment income | | | (0.23 | ) | | | (0.57 | ) | | | (0.26 | ) | | | (0.30 | ) | | | (0.43 | ) | | | (0.33 | ) |
| Distributions from realized gains | | | - | | | | - | | | | (0.17 | ) | | | (0.31 | ) | | | (0.18 | ) | | | (0.01 | ) |
| Total dividends and distributions | | | (0.23 | ) | | | (0.57 | ) | | | (0.43 | ) | | | (0.61 | ) | | | (0.61 | ) | | | (0.34 | ) |
| | | | | | | | | | | | | | | | | | | | | | | | | |
| Redemption Fees | | | - | | | | - | | | | - | | | | - | | | | - | | | | - | |
| | | | | | | | | | | | | | | | | | | | | | | | | |
| Net Asset Value, End of Year/Period | | $ | 9.53 | | | $ | 9.51 | | | $ | 9.76 | | | $ | 11.00 | | | $ | 11.10 | | | $ | 10.45 | |
| | | | | | | | | | | | | | | | | | | | | | | | | |
| Total Return* | | | 2.67 | % | | | 3.37 | % | | | (7.50 | )% | | | 4.71 | % | | | 12.62 | % | | | 6.24 | % # |
| | | | | | | | | | | | | | | | | | | | | | | | | |
| Ratios and Supplemental Data: | | | | | | | | | | | | | | | | | | | | | | | | |
| Net assets, end of year/period (000s) | | $ | 3,558 | | | $ | 3,540 | | | $ | 4,467 | | | $ | 5,616 | | | $ | 3,262 | | | $ | 1,468 | |
| Ratio of gross operating expenses to average net assets including interest expense (2,5) | | | 2.69 | % (8) | | | 2.68 | % | | | 2.61 | % | | | 2.61 | % | | | 2.81 | % | | | 3.11 | % |
| Ratio of net operating expenses to average net assets including interest expense (2,6) | | | 2.61 | % (8) | | | 2.59 | % | | | 2.55 | % | | | 2.51 | % | | | 2.54 | % | | | 2.49 | % |
| Ratio of net investment income (loss) after expense reimbursement to average net assets (2,7) | | | 4.10 | % (8) | | | 3.58 | % | | | 2.28 | % | | | 2.41 | % | | | 3.12 | % | | | 3.09 | % |
| Portfolio Turnover Rate | | | 16 | % (9) | | | 42 | % | | | 77 | % | | | 84 | % | | | 132 | % | | | 111 | % |
| | | | | | | | | | | | | | | | | | | | | | | | | | |
| (1) | Per share amounts calculated using the average shares method, which more appropriately presents the per share data for the year/period. |
| (2) | The ratios of expenses and net investment income (loss) to average net assets do not reflect the Fund’s proportionate share of income and expenses of underlying investment companies in which the Fund invests. |
| (3) | Ratio of gross operating expenses to average net assets excluding interest expense (2) | | | 1.81 | % (8) | | | 1.82 | % | | | 1.79 | % | | | 1.83 | % | | | 1.96 | % | | | 2.38 | % |
| (4) | Ratio of net operating expenses to average net assets excluding interest expense (2) | | | 1.73 | % (8) | | | 1.73 | % | | | 1.73 | % | | | 1.73 | % | | | 1.74 | % | | | 1.74 | % |
| (5) | Ratio of gross operating expenses to average net assets excluding interest expense (2) | | | 2.56 | % (8) | | | 2.57 | % | | | 2.54 | % | | | 2.58 | % | | | 2.76 | % | | | 3.11 | % |
| (6) | Ratio of net operating expenses to average net assets excluding interest expense (2) | | | 2.48 | % (8) | | | 2.48 | % | | | 2.48 | % | | | 2.48 | % | | | 2.49 | % | | | 2.49 | % |
| (7) | Recognition of net investment income (loss) by the Fund is affected by the timing of the declaration of dividends by the underlying investment companies in which the Fund invests. |
| (8) | Annualized. |
| (9) | Not annualized. |
| * | Assumes reinvestment of all dividends and distributions and does not assume the effects of any sales charges. Aggregate (not annualized) total return is shown for any period shorter than one year. Total return does not reflect the deduction of taxes that a shareholder would pay on distributions or on the redemption of shares. |
| ** | Per share amount represents less than $0.01 per share. |
| # | Includes adjustments in accordance with accounting principles generally accepted in the United States and, consequently, the net asset value for financial reporting purposes and the returns based upon those net asset values may differ from the net asset values and returns for shareholder transactions. Adjustments may apply to some but not all years and classes. |
See accompanying notes to financial statements.
EASTERLY INCOME OPPORTUNITIES FUND
FINANCIAL HIGHLIGHTS (For a share outstanding throughout each year/period)
| | | Class I | |
| | | For the
Six Months Ended
May 31
2024 | | | For the
Year Ended
November 30,
2023 | | | For the
Year Ended
November 30,
2022 | | | For the
Year Ended
November 30,
2021 | | | For the
Year Ended
November 30,
2020 | | | For the
Year Ended
November 30,
2019 | |
| | | (Unaudited) | | | | | | | | | | | | | | | | |
| Net Asset Value, Beginning of Year/Period | | $ | 9.51 | | | $ | 9.76 | | | $ | 11.00 | | | $ | 11.10 | | | $ | 10.46 | | | $ | 10.15 | |
| Income (Loss) from Investment Operations: | | | | | | | | | | | | | | | | | | | | | | | | |
| Net investment income (1) | | | 0.24 | | | | 0.44 | | | | 0.34 | | | | 0.38 | | | | 0.44 | | | | 0.40 | |
| Net realized and unrealized gain (loss) | | | 0.06 | | | | (0.02 | ) | | | (1.05 | ) | | | 0.23 | | | | 0.93 | | | | 0.30 | |
| Total from investment operations | | | 0.30 | | | | 0.42 | | | | (0.71 | ) | | | 0.61 | | | | 1.37 | | | | 0.70 | |
| Dividends and Distributions: | | | | | | | | | | | | | | | | | | | | | | | | |
| Dividends from net investment income | | | (0.28 | ) | | | (0.67 | ) | | | (0.36 | ) | | | (0.40 | ) | | | (0.55 | ) | | | (0.38 | ) |
| Distributions from realized gains | | | - | | | | - | | | | (0.17 | ) | | | (0.31 | ) | | | (0.18 | ) | | | (0.01 | ) |
| Total dividends and distributions | | | (0.28 | ) | | | (0.67 | ) | | | (0.53 | ) | | | (0.71 | ) | | | (0.73 | ) | | | (0.39 | ) |
| | | | | | | | | | | | | | | | | | | | | | | | | |
| Redemption Fees | | | - | | | | - | | | | - | | | | - | | | | - | | | | 0.00 | ** |
| | | | | | | | | | | | | | | | | | | | | | | | | |
| Net Asset Value, End of Year/Period | | $ | 9.53 | | | $ | 9.51 | | | $ | 9.76 | | | $ | 11.00 | | | $ | 11.10 | | | $ | 10.46 | |
| | | | | | | | | | | | | | | | | | | | | | | | | |
| Total Return* | | | 3.18 | % | | | 4.42 | % | | | (6.58 | )% | | | 5.74 | % | | | 13.80 | % | | | 6.97 | % |
| | | | | | | | | | | | | | | | | | | | | | | | | |
| Ratios and Supplemental Data: | | | | | | | | | | | | | | | | | | | | | | | | |
| Net assets, end of year/period (000s) | | $ | 240,449 | | | $ | 229,747 | | | $ | 206,630 | | | $ | 215,003 | | | $ | 112,226 | | | $ | 4,982 | |
| Ratio of gross operating expenses to average net assets including interest expense (2,3) | | | 1.69 | % (8) | | | 1.68 | % | | | 1.61 | % | | | 1.61 | % | | | 1.79 | % | | | 1.99 | % |
| Ratio of net operating expenses to average net assets including interest expense (2,4) | | | 1.61 | % (8) | | | 1.59 | % | | | 1.55 | % | | | 1.51 | % | | | 1.54 | % | | | 1.49 | % |
| Ratio of net investment income (loss) after expense reimbursement to average net assets (2,7) | | | 5.09 | % (8) | | | 4.59 | % | | | 3.29 | % | | | 3.40 | % | | | 4.11 | % | | | 3.88 | % |
| Portfolio Turnover Rate | | | 16 | % (9) | | | 42 | % | | | 77 | % | | | 84 | % | | | 132 | % | | | 111 | % |
| | | Class R6 | |
| | | For the
Six Months Ended
May 31
2024 | | | For the
Year Ended
November 30,
2023 | | | For the
Year Ended
November 30,
2022 | | | For the
Year Ended
November 30,
2021 | | | For the
Year Ended
November 30,
2020 | | | For the
Year Ended
November 30,
2019 | |
| | | (Unaudited) | | | | | | | | | | | | | | | | |
| Net Asset Value, Beginning of Year/Period | | $ | 9.73 | | | $ | 9.93 | | | $ | 11.15 | | | $ | 11.20 | | | $ | 10.51 | | | $ | 10.16 | |
| Income (Loss) from Investment Operations: | | | | | | | | | | | | | | | | | | | | | | | | |
| Net investment income (1) | | | 0.28 | | | | 0.49 | | | | 0.38 | | | | 0.43 | | | | 0.48 | | | | 0.43 | |
| Net realized and unrealized gain (loss) | | | 0.06 | | | | (0.02 | ) | | | (1.07 | ) | | | 0.23 | | | | 0.94 | | | | 0.31 | |
| Total from investment operations | | | 0.34 | | | | 0.47 | | | | (0.69 | ) | | | 0.66 | | | | 1.42 | | | | 0.74 | |
| Dividends and Distributions: | | | | | | | | | | | | | | | | | | | | | | | | |
| Dividends from net investment income | | | (0.28 | ) | | | (0.67 | ) | | | (0.36 | ) | | | (0.40 | ) | | | (0.55 | ) | | | (0.38 | ) |
| Distributions from realized gains | | | - | | | | - | | | | (0.17 | ) | | | (0.31 | ) | | | (0.18 | ) | | | (0.01 | ) |
| Total dividends and distributions | | | (0.28 | ) | | | (0.67 | ) | | | (0.53 | ) | | | (0.71 | ) | | | (0.73 | ) | | | (0.39 | ) |
| | | | | | | | | | | | | | | | | | | | | | | | | |
| Redemption Fees | | | - | | | | - | | | | - | | | | - | | | | - | | | | 0.00 | ** |
| | | | | | | | | | | | | | | | | | | | | | | | | |
| Net Asset Value, End of Year/Period | | $ | 9.79 | | | $ | 9.73 | | | $ | 9.93 | | | $ | 11.15 | | | $ | 11.20 | | | $ | 10.51 | |
| | | | | | | | | | | | | | | | | | | | | | | | | |
| Total Return* | | | 3.53 | % | | | 4.86 | % | | | (6.30 | )% | | | 6.16 | % | | | 14.23 | % | | | 7.36 | % |
| | | | | | | | | | | | | | | | | | | | | | | | | |
| Ratios and Supplemental Data: | | | | | | | | | | | | | | | | | | | | | | | | |
| Net assets, end of year/period (000s) | | $ | 78,671 | | | $ | 79,458 | | | $ | 92,994 | | | $ | 61,289 | | | $ | 62,369 | | | $ | 30,209 | |
| Ratio of gross operating expenses to average net assets including interest expense (2,5) | | | 1.69 | % (8) | | | 1.68 | % | | | 1.61 | % | | | 1.63 | % | | | 1.80 | % | | | 1.93 | % |
| Ratio of net operating expenses to average net assets including interest expense (2,6) | | | 1.02 | % (8) | | | 1.20 | % | | | 1.18 | % | | | 1.14 | % | | | 1.17 | % | | | 1.13 | % |
| Ratio of net investment income (loss) after expense reimbursement to average net assets (2,7) | | | 5.69 | % (8) | | | 4.97 | % | | | 3.68 | % | | | 3.82 | % | | | 4.51 | % | | | 4.11 | % |
| Portfolio Turnover Rate | | | 16 | % (9) | | | 42 | % | | | 77 | % | | | 84 | % | | | 132 | % | | | 111 | % |
| | | | | | | | | | | | | | | | | | | | | | | | | | |
| (1) | Per share amounts calculated using the average shares method, which more appropriately presents the per share data for the year/period. |
| (2) | The ratios of expenses and net investment income (loss) to average net assets do not reflect the Fund’s proportionate share of income and expenses of underlying investment companies in which the Fund invests. |
| (3) | Ratio of gross operating expenses to average net assets excluding interest expense (2) | | | 1.56 | % (8) | | | 1.57 | % | | | 1.54 | % | | | 1.58 | % | | | 1.74 | % | | | 2.00 | % |
| (4) | Ratio of net operating expenses to average net assets excluding interest expense (2) | | | 1.48 | % (8) | | | 1.48 | % | | | 1.48 | % | | | 1.48 | % | | | 1.49 | % | | | 1.49 | % |
| (5) | Ratio of gross operating expenses to average net assets excluding interest expense (2) | | | 1.56 | % (8) | | | 1.57 | % | | | 1.54 | % | | | 1.61 | % | | | 1.75 | % | | | 1.93 | % |
| (6) | Ratio of net operating expenses to average net assets excluding interest expense (2) | | | 0.89 | % (8) | | | 1.09 | % | | | 1.11 | % | | | 1.11 | % | | | 1.12 | % | | | 1.13 | % |
| (7) | Recognition of net investment income (loss) by the Fund is affected by the timing of the declaration of dividends by the underlying investment companies in which the Fund invests. |
| (8) | Annualized. |
| (9) | Not annualized. |
| * | Assumes reinvestment of all dividends and distributions and does not assume the effects of any sales charges. Aggregate (not annualized) total return is shown for any period shorter than one year. Total return does not reflect the deduction of taxes that a shareholder would pay on distributions or on the redemption of shares. |
| ** | Per share amount represents less than $0.01 per share. |
See accompanying notes to financial statements.
EASTERLY INCOME OPPORTUNITIES FUND
NOTES TO FINANCIAL STATEMENTS
Six Months Ended May 31, 2024 (Unaudited)
| 1. | ORGANIZATION AND SIGNIFICANT ACCOUNTING POLICIES |
Easterly Income Opportunities Fund (the “Fund”) is a series of the James Alpha Fund Trust dba Easterly Funds Trust (the “Trust”) and was organized in 2020, as a Delaware Statutory Trust and is registered under the Investment Company Act of 1940, as amended, as a diversified open-end management investment company. The Trust currently consists of five series. Easterly Investment Partners LLC serves as the Fund’s Advisor. Prior to March 15, 2024, Easterly Funds LLC served as the Fund’s Advisor. Orange Investment Advisors LLC serves as the Sub-Advisor.
Primary Objective
High level of risk adjusted current income and capital appreciation with a secondary objective of capital preservation.
Currently, the Fund offers Class A, Class C, Class I and Class R6 shares. Class A shares are offered at net asset value plus a maximum sales load of 2.00%. Class C shares are offered subject to a CDSC of 1.00%. Class I and Class R6 shares are offered at net asset value. Each class represents an interest in the same assets of the Fund, and the classes are identical except for differences in their sales charge structures, ongoing service and distribution charges. Class R6 shares are only available to certain qualified investors and the minimum initial investment will vary depending on the type of qualified investor. All classes of shares have equal voting privileges except that each class has exclusive voting rights with respect to its service and/or distribution plans. The Fund’s income, expenses (other than class specific distribution fees) and realized and unrealized gains and losses are allocated proportionately each day based upon the relative net assets of each class.
The following is a summary of significant accounting policies followed by the Fund in preparation of its financial statements. These policies are in conformity with accounting principles generally accepted in the United States of America (“GAAP”). The preparation of financial statements in conformity with GAAP requires management to make estimates and assumptions that affect the reported amounts of assets and liabilities and disclosure of contingent assets and liabilities at the date of the financial statements and the reported amounts of increases and decreases in net assets from operations during the reporting period. Actual results could differ from those estimates. The Fund is an investment company and accordingly follows the investment company accounting and reporting guidance of the Financial Accounting Standards Board (FASB) Accounting Standard Codification Topic 946 “Financial Services – Investment Companies”.
| (a) | Valuation of Investments |
Investment securities listed on a national securities exchange are valued at the last reported sale price on the valuation date. NASDAQ traded securities are valued at the NASDAQ Official Closing Price (NOCP). If there are no such reported sales, the securities are valued at the mean between current bid and ask. Short-term debt securities having a remaining maturity of sixty days or less may be valued at amortized cost or amortized value, which approximates market value. Debt securities may be valued at prices supplied by the Fund’s pricing services based on broker or dealer supplied valuations or matrix pricing, a method of valuing securities by reference to the value of other securities with similar characteristics, such as rating, interest rate and maturity. Swap transactions are valued through an independent pricing service. Total return swaps on securities listed on an exchange shall be valued at the last quoted sales price or, in the absence of a sale, at the mean between the current bid and ask prices. Any securities or other assets for which market quotations are not readily available are valued at their fair value as determined in good faith under procedures established by the Board of Trustees (the “Board”). There is no single standard for determining the fair value of such securities. Rather, in determining the fair value of a security, the board-appointed Valuation Designee shall take into account the relevant factors and surrounding circumstances, a few of which may include: (I) the nature and pricing history (if any) of the security; (ii) whether any dealer quotations for the security are available; and (iii) possible valuation methodologies that could be used to determine the fair value of a security. Futures, which are traded on an exchange, are valued at the settlement price determined by the exchange. Foreign currency and Forward currency exchange contracts are valued daily at the London close each day. Investments in foreign countries may involve certain considerations and risks not typically associated with domestic investments, including, but not limited to, the possibility of future political and economic developments and the level of government supervision and regulation of foreign securities markets.
Special valuation considerations may apply with respect to “odd-lot” fixed-income transactions which, due to their small size, may receive evaluated prices by pricing services which reflect a large block trade and not what actually could be obtained for the odd-lot position. Easterly and the sub-adviser to the Fund may, in their discretion, value an odd lot fixed income security at what Easterly and the sub-adviser believe is a fair price and not the pricing service price if Easterly and the sub-adviser deem the price provided by the pricing service to not represent its fair value.
The Fund utilizes various methods to measure the fair value of most of its investments on a recurring basis. GAAP establishes a hierarchy that prioritizes inputs to valuation methods. The three levels of input are:
Level 1 – Unadjusted quoted prices in active markets for identical assets and liabilities that the Fund has the ability to access.
Level 2 – Observable inputs other than quoted prices included in level 1 that are observable for the asset or liability, either directly or indirectly. These inputs may include quoted prices for the identical instrument on an inactive market, prices for similar instruments, interest rates, prepayment speeds, credit risk, yield curves, default rates and similar data.
Level 3 – Unobservable inputs for the asset or liability, to the extent relevant observable inputs are not available, representing the Fund’s own assumptions about the assumptions a market participant would use in valuing the asset or liability, and would be based on the best information available.
The availability of observable inputs can vary from security to security and is affected by a wide variety of factors, including, for example, the type of security, whether the security is new and not yet established in the marketplace, the liquidity of markets, and other characteristics particular to the security. To the extent that valuation is based on models or inputs that are less observable or unobservable in the market, the determination of fair value requires more judgment. Accordingly, the degree of judgment exercised in determining fair value is greatest for instruments categorized in Level 3.
The inputs used to measure fair value may fall into different levels of the fair value hierarchy. In such cases, for disclosure purposes, the level in the fair value hierarchy within which the fair value measurement falls in its entirety, is determined based on the lowest level input that is significant to the fair value measurement in its entirety.
EASTERLY INCOME OPPORTUNITIES FUND
NOTES TO FINANCIAL STATEMENTS
Six Months Ended May 31, 2024 (Unaudited) (Continued)
The inputs or methodology used for valuing securities are not necessarily an indication of the risk associated with investing in those securities. The following tables summarize the inputs used as of May 31, 2024, for the Fund’s assets and liabilities measured at fair value:
| Assets* | | Level 1 | | | Level 2 | | | Level 3 | | | Total | |
| Asset Backed Securities | | $ | - | | | $ | 252,301,552 | | | $ | - | | | $ | 252,301,552 | |
| Corporate Bonds | | | - | | | | 42,241,008 | | | | - | | | | 42,241,008 | |
| Non U.S. Government & Agencies | | | - | | | | 1,048,977 | | | | - | | | | 1,048,977 | |
| U.S. Government & Agencies | | | - | | | | 9,742,628 | | | | - | | | | 9,742,628 | |
| Total Assets | | $ | - | | | $ | 305,334,165 | | | $ | - | | | $ | 305,334,165 | |
| Assets - Derivatives | | | | | | | | | | | | | | | | |
| Futures** | | $ | 260,528 | | | $ | - | | | $ | - | | | $ | 260,528 | |
| Total Asset Derivatives | | $ | 260,528 | | | $ | - | | | $ | - | | | $ | 260,528 | |
| Liabilities - Derivatives | | | | | | | | | | | | | | | | |
| Credit Default Swap** | | $ | - | | | $ | 482,158 | | | $ | - | | | $ | 482,158 | |
| Total Liability Derivatives | | $ | - | | | $ | 482,158 | | | $ | - | | | $ | 482,158 | |
There were no level 3 securities held during the year.
| * | Refer to the Schedules of Investments for industry or category classifications. |
| ** | Amounts shown for swaps and futures are unrealized appreciation/depreciation. |
It is the Fund’s policy to continue to qualify as a regulated investment company by complying with the provisions of the Internal Revenue Code that are applicable to regulated investment companies and to distribute substantially all of its taxable income and net realized gains to shareholders. The Fund recognizes the tax benefits of uncertain tax positions only when the position is “more likely than not” to be sustained assuming examination by tax authorities. Management has analyzed the Fund’s tax positions and has concluded that no liability for unrecognized tax benefits should be recorded related to uncertain tax positions taken on returns filed for open tax years ended November 30, 2021, to November 30, 2023, or expected to be taken in the Fund’s November 30, 2024 year-end tax returns. The Fund identifies its major tax jurisdictions as U.S. Federal, New York and foreign jurisdictions where the Fund makes significant investments. The Fund recognizes interest and penalties, if any, related to unrecognized tax benefits as income tax expense in the Statements of Operations. During the six months ended May 31, 2024, the Fund did not incur any interest or penalties.
| (c) | Security Transactions and Other Income |
Security transactions are reflected for financial reporting purposes as of the trade date. Dividend income is recognized on the ex-dividend date, and interest income is recognized on an accrual basis including premium amortized and discount accreted. All paydown gains and losses are classified as interest income in the accompanying Statement of Operations in accordance with U.S. GAAP. Discounts and premiums on securities purchased are accreted and amortized, over the lives of the respective securities with a corresponding increase/decrease in the cost basis of that security using the yield to maturity method, or where applicable, the first call date of the security. Realized gains or losses from sales of securities are determined by comparing the identified cost of the security lot sold with the net sales proceeds.
| (d) | Dividends and Distributions |
The following table summarizes the Fund’s intended dividend and capital gain declaration policy:
| Income Dividends | | Capital Gains |
| Monthly | | Annually |
The Fund records dividends and distributions to its shareholders on the ex-dividend date. The amount of dividends and distributions from net investment income and net realized gains are determined in accordance with federal income tax regulations, which may differ from GAAP. These “book-tax” differences are either permanent or temporary in nature. To the extent these differences are permanent in nature, such amounts are reclassified within the net asset accounts based on their federal tax-basis treatment; temporary differences do not require reclassification. To the extent dividends and distributions exceed current and accumulated earnings and profits for federal income tax purposes, they are reported as distributions of paid-in-surplus or tax return of capital. These reclassifications have no effect on net assets, results from operations or net asset value per share of the Fund.
| (e) | Allocation of Expenses |
Expenses of the Trust that are directly identifiable to a specific fund are charged to that fund. Expenses which are not readily identifiable to a specific fund, are allocated in such a manner as deemed equitable, taking into consideration the nature and type of expense and the relative sizes of the funds in the Trust.
The Trust indemnifies its Officers and Trustees for certain liabilities that may arise from the performance of their duties to the Trust. Additionally, in the normal course of business, the Funds enter into contracts that contain a variety of representations and warranties and which provide general indemnities. The Fund’s maximum exposure under these arrangements is unknown, as this would involve future claims that may be made against the Funds that have not yet occurred. However, based on experience, the risk of loss due to these warranties and indemnities appears to be remote.
EASTERLY INCOME OPPORTUNITIES FUND
NOTES TO FINANCIAL STATEMENTS
Six Months Ended May 31, 2024 (Unaudited) (Continued)
Foreign currency. Investment securities and other assets and liabilities denominated in foreign currencies are translated into U.S. dollar amounts at the date of valuation. Purchases and sales of investment securities and income and expense items denominated in foreign currencies are translated into U.S. dollar amounts on the respective dates of such transactions.
The Trust does not isolate that portion of the results of operations resulting from changes in foreign exchange rates on investments from the fluctuations arising from changes in market prices of securities held. Such fluctuations are included with the net realized and unrealized gain or loss from investments.
Reported net realized foreign exchange gains or losses arise from sales of foreign currencies, currency gains or losses realized between the trade and settlement dates on securities transactions, and the difference between the amounts of dividends, interest, and foreign withholding taxes recorded on the company’s books and the U.S. dollar equivalent of the amounts actually received or paid. Net unrealized foreign exchange gains and losses arise from changes in the fair values of assets and liabilities, other than investments in securities at fiscal period end, resulting from changes in exchange rates.
| 2. | MANAGEMENT FEE, ADMINISTRATION FEE AND OTHER TRANSACTIONS WITH AFFILIATES |
(a) Easterly Investment Partners LLC acts as investment manager for the Fund pursuant to the terms of a Management Agreement with the Trust, on behalf of the Fund (the “Management Agreement”). Prior to March 15, 2024, Easterly Funds LLC served as the Fund’s Advisor. Under the terms of the Management Agreement, the Manager manages the investment operations of the Fund in accordance with the Fund’s respective investment policies and restrictions. The Fund’s investment sub-advisor is responsible for the day-to-day management of its Fund’s portfolios. Easterly Investment Partners LLC serves the Fund in a supervision capacity with responsibility to monitor the performance of the Fund’s outside service providers, assist in the review of financial statements and other regulatory filings and board meeting materials related to the Fund. The management fees are payable to Easterly Investment Partners LLC monthly by the Fund and are computed daily as shown in the table below. The Fund’s subadvisor is paid by the manager, not the Fund.
(b) Pursuant to an operating expense limitation agreement between Easterly Investment Partners LLC and the Fund, Easterly Investment Partners LLC has contractually agreed to waive all or a portion of its advisory fee and/or pay expenses of the Fund so that total annual Fund operating expenses (excluding front-end and contingent deferred sales loads, leverage, interest and tax expenses, dividends and interest on short positions, brokerage commissions, expenses incurred in connection with any merger, reorganization or liquidation, extraordinary or non-routine expenses and Acquired Fund Fees and Expenses) do not exceed the expense limitation shown in the table below, and is based on the Fund’s average daily net assets. This operating expense limitation agreement cannot be terminated during its term. Easterly Investment Partners LLC is permitted to seek reimbursement from the Fund, subject to limitations, for management fees waived and Fund expenses it paid within three (3) years of the end of the fiscal year in which such management fees were waived or expenses paid, as long as the reimbursement does not cause the Fund’s operating expenses to exceed (i) the expense cap in place at the time the fees were waived or the expenses were incurred; or (ii) the current expense cap, whichever is less. The expense limitation agreement will be in effect through March 31, 2024.
| | | | | | | | | | | | | Fee Waived/ |
| Management | | Expenses Limitation | | | | Expenses Reimbursed |
| Agreement | | Cl A | | Cl C | | Cl I | | CL R6 | | Expires | | YTD 5/31/2024 |
| 1.20% | | 1.73% | | 2.48% | | 1.48% | | 0.89%* | | 3/31/2025 | | $363,620 |
The following table shows the available waived expenses and expiration date for the Fund subject to potential recovery.
| 11/30/2024 | | | 11/30/2025 | | | 11/30/2026 | |
| $472,087 | | | $552,449 | | | $619,614 | |
(c) Easterly Securities LLC (the “Distributor”) is the Trust’s Distributor and is an affiliate of the Advisor. The Trust with respect to the Fund has adopted a Plan of Distribution pursuant to Rule 12b-1 under the 1940 Act (the “Plan”) with respect to the sale and distribution of Class A and C shares of the Fund. The Plan provides that the Fund will pay the Distributor and other entities, including a broker-dealer affiliate of the Adviser, are paid pursuant to the Plans provided and the expenses borne by the distributor and others in the distribution of Fund shares a fee, which is accrued daily and paid monthly, at the annual rate of 0.25% of the average daily net assets of Class A shares and 1.00% of the average daily net assets of each of the Fund’s Class C shares. For the six months ended, May 31, 2024, sales charges on sales of the Fund’s Class A shares were $10,690.
(d) Ultimus Fund Solutions, LLC (“UFS”), an affiliate of UFD provides administrative, fund accounting and transfer agency services to the Fund pursuant to agreements with the Trust, for which it receives from the Fund: (i) a minimum annual fee or basis points in decreasing amounts as assets reach certain breakpoints; and (ii) any related out-of-pocket expenses.
In addition, certain affiliates of the Distributor provide services to the Trust as follows:
Northern Lights Compliance Services, LLC (“NLCS”) - NLCS, an affiliate of UFS, provides a Chief Compliance Officer to the Trust, as well as related compliance services, pursuant to a consulting agreement between NLCS and the Trust. Under the terms of this agreement, NLCS receives customary fees from the Fund.
Blu Giant, LLC (“Blu Giant”) – Blu Giant, an affiliate of UFS and the Distributor, provides EDGAR conversion and filing services as well as print management services for the Trust on an ad-hoc basis. For the provision of these services, Blu Giant receives customary fees from the Fund.
Certain employees of UFS and NLCS are also officers of the Trust,and are not paid any fees directly by the Trust for serving in such capacity.
EASTERLY INCOME OPPORTUNITIES FUND
NOTES TO FINANCIAL STATEMENTS
Six Months Ended May 31, 2024 (Unaudited) (Continued)
| 3. | INVESTMENT TRANSACTIONS |
(a) For the six months ended May 31, 2024, the cost of purchases and proceeds from sales of investment securities, other than short-term securities, for the Fund were $62,854,722 and $47,840,628, respectively.
(b) Futures Contracts – The Fund may purchase and sell futures contracts. The Fund may use futures contracts to gain exposure to, or hedge against changes in the value of equities, interest rates or foreign currencies. Upon entering into a contract, the Fund deposits and maintains as collateral such initial margin as required by the exchange on which the transaction is affected. Pursuant to the contract, the Fund agrees to receive from or pay to the broker an amount of cash equal to the daily fluctuation in value of the contract. Such receipts or payments are known as “variation margin” and are recorded by the Fund as unrealized gains and losses. When the contract is closed, the Fund records a realized gain or loss equal to the difference between the value of the contract at the time it was opened and the value at the time it was closed. As collateral for futures contracts, the Fund is required under the 1940 Act to maintain assets consisting of cash, cash equivalents or liquid securities. This collateral is required to be adjusted daily to reflect the market value of the purchase obligation for long futures contracts or the market value of the instrument underlying the contract, but not less than the market price at which the futures contract was established, for short futures contracts.
(c) Swap Agreements – The Fund is subject to interest rate risk in the normal course of pursuing their respective investment objectives. The Fund may enter into various swap transactions for investment purposes or to manage interest rate, equity, foreign exchange (currency), commodity or credit risk. These would be two-party contracts entered into primarily to exchange the returns (or differentials in rates of returns) earned or realized on particular pre-determined investments or instruments.
The gross returns to be exchanged or “swapped” between parties are calculated with respect to a notional amount, i.e., the return on or increase in value of a particular dollar amount invested at a particular interest rate, in a particular foreign currency, or in a “basket” of securities representing a particular index or market segment. Changes in the value of swap agreements are recognized as unrealized gains or losses in the Statement of Operations by “marking to market” on a daily basis to reflect the value of the swap agreement at the end of each trading day. Payments received or paid at the beginning of the agreement are reflected as such on the Statement of Assets and Liabilities and may be referred to as upfront payments. The Fund amortizes upfront payments and/or accrues for the fixed payment stream on swap agreements on a daily basis with the net amount recorded as a component of unrealized gain or loss on the Statement of Operations. A liquidation payment received or made at the termination of the swap agreement is recorded as a realized gain or loss on the Statement of Operations. The Fund segregates liquid securities having a value at least equal to the amount of their current obligation under any swap transaction. Entering into these agreements involves, to varying degrees, lack of liquidity and elements of credit, market, and counterparty risk in excess of amounts recognized on the Statement of Assets and Liabilities. The Fund’s maximum risk of loss from counterparty credit risk is the discounted net value of the cash flows to be received from the counterparty over the contract’s remaining life, to the extent that that amount is positive.
The derivatives are not accounted for as hedging instruments under GAAP. The effect of derivative instruments on the Statement of Assets and Liabilities at May 31, 2024, was as follows:
| Derivative | | Risk Type | | Location of derivatives on
Statement of Assets and
Liabilities | | Fair value of asset/liability derivatives | |
| Futures | | Interest Rate | | Unrealized appreciation on futures | | $ | 260,528 | |
| | | | | Totals | | $ | 260,528 | |
| | | | | | | | | |
| Swap Contracts | | Credit Default | | Unrealized depreciation on swaps | | $ | (482,158 | ) |
| | | | | Totals | | $ | (482,158 | ) |
The effect of derivative instruments on the Statement of Operations for the six months ended May 31, 2024, was as follows:
| Derivative | | Location of gain (loss) on derivatives | | Risk Type | | Realized and unrealized gain (loss) on derivatives | |
| Swap Contracts | | | | | | |
| | | Net realized gain on swaps | | Credit Default | | $ | 872,286 | |
| | | Net change in unrealized (depreciation) on swaps | | Credit Default | | $ | (3,864,565 | ) |
| | | | | | | | | |
| Futures | | | | | | |
| | | Net realized loss from futures | | Interest Rate | | $ | (1,263,055 | ) |
| | | Net change in unrealized appreciation on futures | | Interest Rate | | $ | 279,143 | |
The amounts of realized and changes in unrealized gains and losses on derivative instruments during the period as disclosed in the Statement of Operations serve as indicators of the volume of derivative activity for the Fund.
The following table presents the Fund’s assets and liabilities available for offset under a master netting arrangement net of collateral pledged as of May 31, 2024.
| | | Gross Amounts | | | Gross Amounts not offset in the Statement of Assets and Liabilities | | | | |
| | | of
Recognized
Liabilities | | | Financial
Instruments
Pledged | | | Cash
Collateral
Pledged * | | | Net Amount
of Liabilities | |
| Description of Liability: | | | | | | | | | | | | |
| Credit Default Swap | | $ | (482,158 | ) | | $ | - | | | $ | - | | | $ | (482,158 | ) |
| Total | | $ | (482,158 | ) | | $ | - | | | $ | - | | | $ | (482,158 | ) |
| * | Excess collateral not included. |
EASTERLY INCOME OPPORTUNITIES FUND
NOTES TO FINANCIAL STATEMENTS
Six Months Ended May 31, 2024 (Unaudited) (Continued)
| 4. | AGGREGATE UNREALIZED APPRECIATION AND DEPRECIATION – TAX BASIS |
Cost for
Federal Tax
Purposes | | Unrealized
Appreciation | | Unrealized
Depreciation | | Tax Net
Unrealized
App/Dep |
| 330,799,103 | | 7,310,513 | | (32,775,451) | | (25,464,938) |
| 5. | DISTRIBUTIONS TO SHAREHOLDERS AND TAX COMPONENTS OF CAPITAL |
The tax character of fund distributions paid for the years ended November 30, 2023, and November 30, 2022, was as follows:
| | | Fiscal Year Ended November 30,
2023 | | | Fiscal Year Ended November 30,
2022 | |
| Ordinary Income | | $ | 22,317,560 | | | $ | 13,855,861 | |
| Long-Term Capital Gains | | | - | | | | 2,521,242 | |
| Return of Capital | | | - | | | | - | |
| | | $ | 22,317,560 | | | $ | 16,377,103 | |
As of November 30, 2023, the components of accumulated earnings/ (deficit) on a tax basis were as follows:
Undistributed
Ordinary
Income | | | Undistributed
Long-Term
Capital Gains | | | Post October Loss
and
Late Year Loss | | | Capital Loss
Carry
Forwards | | | Other
Book/Tax
Differences | | | Unrealized
Appreciation/
(Depreciation) | | | Total
Accumulated
Earnings/(Deficits) | |
| $638,788 | | | $- | | | $(1,194,613) | | | $(5,019,971) | | | $- | | | $(31,977,532) | | | $(37,553,328) | |
The difference between book basis and tax basis undistributed net investment income (loss), accumulated net realized gains (losses), and unrealized appreciation/(depreciation) from investments is primarily attributable to the tax deferral of losses on wash sales, mark-to-market on open forward foreign currency contracts, 1256 options, swaps, and adjustments for contingent convertible debt securities. The unrealized appreciation/(depreciation) in the table above includes unrealized foreign currency gains (losses) of $1,029 for the Fund.
Late year losses incurred after December 31 within the fiscal year are deemed to arise on the first business day of the following fiscal year for tax purposes. The Fund incurred and elected to defer such late year losses of $1,194,613.
At November 30, 2023, the Fund had capital loss carry forwards for federal income tax purposes available to offset future capital gains, as follows:
Non-Expiring
Short-Term | | | Non-Expiring
Long-Term | | | Total | | | CLCF
Utilized | |
| $- | | | $5,019,971 | | | $5,019,971 | | | $- | |
The beneficial ownership, either directly or indirectly, of more than 25% of the voting securities of a Fund creates a presumption of control of the Fund under Section 2(a)(9) of the 1940 Act. As of May 31, 2024, the shareholders that own 25% or more of the voting securities are as follows:
| Shareholder | | Ownership % | |
| American Enterprise Inv Svcs | | | 26.45 | % |
Currently, the Fund has a $33,000,000 line of credit provided by Cogent Bank (the “Bank”) under an agreement (the “Line of Credit”). Any advance under the Line of Credit is contemplated primarily for temporary or emergency purposes, including the meeting of redemption requests that otherwise might require the untimely disposition of securities. Interest on borrowings is payable Monthly. There were no borrowings outstanding for the six months ended.
Subsequent events after the date of the Statements of Assets and Liabilities have been evaluated through the date the financial statements were issued. Management has determined that no events or transactions occurred requiring adjustment or disclosure in the financial statements.
SUPPLEMENTAL INFORMATION (Unaudited)
May 31, 2024
SHAREHOLDER VOTING RESULTS
On December 19, 2023 a Special Meeting of Shareholders of the Easterly Income Opportunities Fund was held and adjourned until February 15, 2024. At the meeting on February 15, 2024 shareholders of record of the Easterly Income Opportunities Fund at the close of business on October 20, 2023, voted to approve the following proposals:
To approve a new investment advisory agreement with Easterly Investment Partners LLC.
| FOR | AGAINST | ABSTAIN |
| 16,949,247.00 Shares | 170,062.00 Shares | 925,030.00 Shares |
To approve a new investment sub-advisory agreement between Easterly Investment Partners LLC and Orange Investment Advisors, LLC.
| FOR | AGAINST | ABSTAIN |
| 16,925,125.00 Shares | 189,126.00 Shares | 930,089.00 Shares |
Privacy Notice
JAMES ALPHA FUNDS TRUST dba EASTERLY FUNDS TRUST
March 2021
| FACTS | WHAT DOES JAMES ALPHA FUNDS TRUST dba EASTERLY FUNDS TRUST DO WITH YOUR PERSONAL INFORMATION? |
| Why? | Financial companies choose how they share your personal information. Federal law gives consumers the right to limit some, but not all sharing. Federal law also requires us to tell you how we collect, share, and protect your personal information. Please read this notice carefully to understand what we do. |
| What? | The types of personal information we collect and share depends on the product or service that you have with us. This information can include: |
| | | ● | Social Security number and wire transfer instructions |
| | | ● | account transactions and transaction history |
| | | ● | investment experience and purchase history |
| | When you are no longer our customer, we continue to share your information as described in this notice. |
| How? | All financial companies need to share customers’ personal information to run their everyday business. In the section below, we list the reasons financial companies can share their customers’ personal information; the reasons James Alpha Funds Trust chooses to share; and whether you can limit this sharing. |
| Reasons we can share your personal information: | Does James Alpha Funds Trust
dba Easterly Funds Trust
share information? | Can you limit
this sharing? |
For our everyday business purposes -
such as to process your transactions, maintain your account(s), respond to court orders and legal investigations, or report to credit bureaus. | YES | NO |
For our marketing purposes -
to offer our products and services to you. | YES | YES |
| For joint marketing with other financial companies. | NO | We don’t share |
For our affiliates’ everyday business purposes - information about your transactions and records. | NO | We don’t share |
For our affiliates’ everyday business purposes -
information about your credit worthiness. | NO | We don’t share |
| For nonaffiliates to market to you | NO | We don’t share |
| QUESTIONS? | Call (888) 814-8180 |
| What we do: |
| How does James Alpha Funds Trust dba Easterly Funds Trust protect my personal information? | To protect your personal information from unauthorized access and use, we use security measures that comply with federal law. These measures include computer safeguards and secured files and buildings. Our service providers are held accountable for adhering to strict policies and procedures to prevent any misuse of your nonpublic personal information. |
| How does James Alpha Funds Trust dba Easterly Funds Trust collect my personal information? | We collect your personal information, for example, when you |
| | ● | open an account or deposit money |
| | ● | direct us to buy securities or direct us to sell your securities |
| | ● | seek advice about your investments |
| We also collect your personal information from others, such as credit bureaus, affiliates, or other companies. |
| Why can’t I limit all sharing? | Federal law gives you the right to limit only: |
| | ● | sharing for affiliates’ everyday business purposes – information about your creditworthiness. |
| | ● | affiliates from using your information to market to you. |
| | ● | sharing for nonaffiliates to market to you. |
| State laws and individual companies may give you additional rights to limit sharing. |
| | | | |
Definitions |
| Affiliates | Companies related by common ownership or control. They can be financial and nonfinancial companies. |
| | ● | James Alpha Funds Trust dba Easterly Funds Trust does not share with our affiliates. |
| Nonaffiliates | Companies not related by common ownership or control. They can be financial and nonfinancial companies. |
| | ● | James Alpha Funds Trust dba Easterly Funds Trust does not share with nonaffiliates so they can market to you. |
| Joint marketing | A formal agreement between nonaffiliated financial companies that together market financial products or services to you. |
| | ● | James Alpha Funds Trust dba Easterly Funds Trust doesn’t jointly market. |
| | | | |
How to Obtain Proxy Voting Information
Information regarding how the Portfolios voted proxies relating to portfolio securities during the most recent twelve month period ended June 30 as well as a description of the policies and procedures that the Portfolios use to determine how to vote proxies is available without charge, upon request, by calling 1-833- 999-2636 or by referring to the Securities and Exchange Commission’s (“SEC”) website at http://www.sec.gov.
How to Obtain 1st and 3rd Fiscal Quarter Portfolio Holdings
Funds file a complete schedule of portfolio holdings with the Securities and Exchange Commission (the “SEC”) for the first and third quarters of each fiscal year as an exhibit to its reports on Form N-PORT, within sixty days after the end of the period. Form N-PORT reports are available at the SEC’s website at www.sec.gov.
Item 8. Changes in and Disagreements with Accountants for Open-End Management Investment Companies.
Not applicable
Item 9. Proxy Disclosures for Open-End Management Investment Companies.
Not applicable
Item 10. Remuneration Paid to Directors, Officers, and Others of Open-End Management Investment Companies.
Included under Item 7
Item 11. Statement Regarding Basis for Approval of Investment Advisory Contract.
Included under Item 7
Item 12. Disclosure of Proxy Voting Policies and Procedures for Closed-End Management Investment Companies.
Not applicable
Item 13. Portfolio Managers of Closed-End Management Investment Companies.
Not applicable
Item 14. Purchases of Equity Securities by Closed-End Management Investment Company and Affiliated Purchasers.
Not applicable
Item 15. Submission of Matters to a Vote of Security Holders.
On December 19, 2023 a Special Meeting of Shareholders of the Easterly Income Opportunities Fund was held and adjourned until February 15, 2024. At the meeting on February 15, 2024 shareholders of record of the Easterly Income Opportunities Fund at the close of business on October 20, 2023, voted to approve the following proposals:
To approve a new investment advisory agreement with Easterly Investment Partners LLC.
| FOR | AGAINST | ABSTAIN |
| 16,949,247.00 Shares | 170,062.00 Shares | 925,030.00 Shares |
To approve a new investment sub-advisory agreement between Easterly Investment Partners LLC and Orange Investment Advisors, LLC.
| FOR | AGAINST | ABSTAIN |
| 16,925,125.00 Shares | 189,126.00 Shares | 930,089.00 Shares |
Item 16. Controls and Procedures [No Change]
| (a) | The registrant’s Principal Executive Officer and Principal Financial Officer have concluded that the registrant’s disclosure controls and procedures (as defined in Rule 30a-3(c) under the Act) are effective in design and operation and are sufficient to form the basis of the certifications required by Rule 30a-(2) under the Act, based on their evaluation of these disclosure controls and procedures as of a date within 90 days of this report on Form N-CSR. |
| (b) | There were no changes in the registrant’s internal control over financial reporting (as defined in Rule 30a-3(d) under the Act) during the period covered by this report that have materially affected, or are reasonably likely to materially affect, the registrant’s internal control over financial reporting. |
Item 17. Disclosure of Securities Lending Activities for Closed-End Management Investment Companies.
Not applicable
Item 18. Recovery of Erroneously Awarded Compensation.
Item 19. Exhibits.
SIGNATURES
Pursuant to the requirements of the Securities Exchange Act of 1934 and the Investment Company Act of 1940, the registrant has duly caused this report to be signed on its behalf by the undersigned, thereunto duly authorized.
James Alpha Fund Trust
By | /s/ Darrell Crate | |
| | Darrell Crate | |
| | President and Principal Executive Officer |
| | |
| Date: | 8/5/2024 | |
Pursuant to the requirements of the Securities Exchange Act of 1934 and the Investment Company Act of 1940, this report has been signed below by the following persons on behalf of the registrant and in the capacities and on the dates indicated.
| By | /s/ Darrell Crate | |
| | Darrell Crate |
| President and Principal Executive Officer | |
| | | |
| | 8/5/2024 | |
By | /s/ Michael Montague | |
| | Michael Montague | |
| | Treasurer and Principal Financial Officer |
| | |
| Date: | 8/5/2024 | |