united states
securities and exchange commission
washington, d.c. 20549
form n-csr
certified shareholder report of registered management
investment companies
Investment Company Act file number 811-23611
James Alpha Funds Trust
(Exact name of registrant as specified in charter)
515 Madison Avenue, 24th Floor, New York, NY 10022
(Address of principal executive offices) (Zip code)
Emile R. Molineaux, Gemini Fund Services, LLC
80 Arkay Drive, Suite 110, Hauppauge, NY 11788
(Name and address of agent for service)
Registrant's telephone number, including area code: 623-266-4567
Date of fiscal year end: 2/28
Date of reporting period: 08/31/2024
Item 1. Reports to Stockholders.
(a)
Easterly Snow Long/Short Opportunity Fund
Semi-Annual Shareholder Report - August 31, 2024
This semi-annual shareholder report contains important information about Easterly Snow Long/Short Opportunity Fund for the period of March 1, 2024 to August 31, 2024. You can find additional information about the Fund at https://funds.easterlyam.com/resources/. You can also request this information by contacting us at 1-833-999-2636.
What were the Fund’s costs for the last six months?
(based on a hypothetical $10,000 investment)
| Class Name | Costs of a $10,000 investment | Costs paid as a percentage of a $10,000 investment |
|---|
| Class A | $108 | 2.09% |
Average Annual Total Returns
| 1 Year | 5 Years | 10 Years |
|---|
| Easterly Snow Long/Short Opportunity Fund | | | |
| Without Load | 10.00% | 10.29% | 4.37% |
| With Load | 3.66% | 8.99% | 3.75% |
Russell 3000® Total Return Index | 26.14% | 15.19% | 12.36% |
Russell 3000® Value Index | 21.02% | 11.11% | 8.76% |
Load Information: 5.75% is the maximum sales charge on purchase of A Shares.
The Fund's past performance is not a good predictor of the Fund's future performance. The table does not reflect the deduction of taxes that a shareholder would pay on fund distributions or redemption of fund shares.
For the most recent month-end performance, visit https://funds.easterlyam.com/snow-long-short-opportunity-fund/ or call 888-814-8180.
The Fund has adopted the performance of the Snow Capital Long/Short Opportunity Fund, a series of the Trust for Professional Managers (the “Predecessor Portfolio”) as the result of a reorganization of the Predecessor Portfolio into the Fund, which was consummated after the close of business on November 5, 2021 (the “Reorganization”). Prior to the Reorganization, the Fund had not yet commenced operations. The returns shown for periods ending on or prior to November 5, 2021 are those of the Class A shares of the Predecessor Portfolio. Class A shares of the Predecessor Portfolio were reorganized into Class A of the Fund, respectively, after the close of business on November 5, 2021. Class A shares' returns of the Fund will be different from the returns of the Predecessor Portfolio's Class A shares as they have different expenses.
Performance information reflects the impact of fee waivers, expense caps and/or reimbursements in effect during the period shown. If terminated, future expenses may be higher which would impact the Fund’s performance.
What did the Fund invest in?
| Net Assets | $92,560,271 |
| Number of Portfolio Holdings | 111 |
| Advisory Fee | $380,749 |
| Portfolio Turnover | 21% |
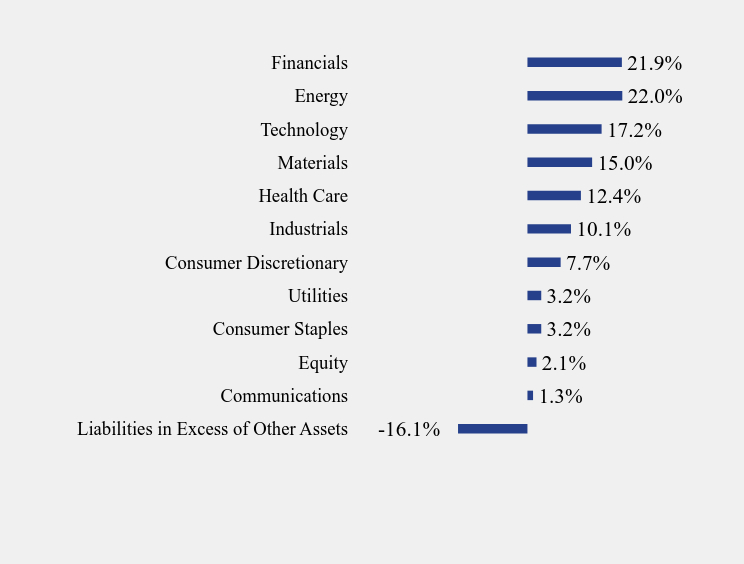
Long Sector Weighting (% of net assets)
| Value | Value |
|---|
| Liabilities in Excess of Other Assets | -16.1% |
| Communications | 1.3% |
| Equity | 2.1% |
| Consumer Staples | 3.2% |
| Utilities | 3.2% |
| Consumer Discretionary | 7.7% |
| Industrials | 10.1% |
| Health Care | 12.4% |
| Materials | 15.0% |
| Technology | 17.2% |
| Energy | 22.0% |
| Financials | 21.9% |
Top 10 Holdings (% of net assets)
| Holding Name | % of Net Assets |
| JPMorgan Chase & Company | 4.6% |
| Commercial Metals Company | 4.5% |
| Suncor Energy, Inc. | 3.9% |
| Amgen, Inc. | 3.4% |
| Sanofi - ADR | 3.2% |
| Open Text Corporation | 3.0% |
| Alamos Gold, Inc. | 2.9% |
| Johnson & Johnson | 2.8% |
| Kenvue, Inc. | 2.7% |
| Citigroup, Inc. | 2.6% |
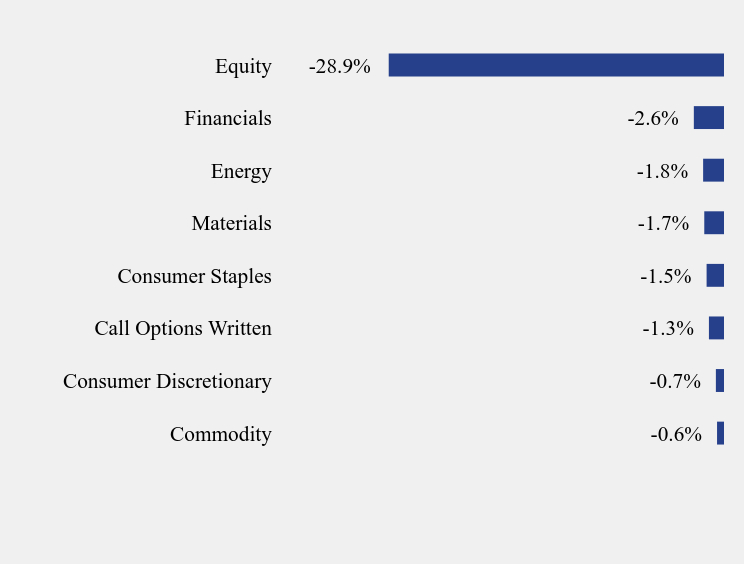
Short Sector Weighting (% of net assets)
| Value | Value |
|---|
| Commodity | -0.6% |
| Consumer Discretionary | -0.7% |
| Call Options Written | -1.3% |
| Consumer Staples | -1.5% |
| Materials | -1.7% |
| Energy | -1.8% |
| Financials | -2.6% |
| Equity | -28.9% |
Where can I find additional information about the Fund?
Additional information is available on the Fund's website ( https://funds.easterlyam.com/resources/ ), including its:
Prospectus
Financial information
Holdings
Proxy voting information
Easterly Snow Long/Short Opportunity Fund
Semi-Annual Shareholder Report - August 31, 2024
This semi-annual shareholder report contains important information about Easterly Snow Long/Short Opportunity Fund for the period of March 1, 2024 to August 31, 2024. You can find additional information about the Fund at https://funds.easterlyam.com/resources/. You can also request this information by contacting us at 1-833-999-2636.
What were the Fund’s costs for the last six months?
(based on a hypothetical $10,000 investment)
| Class Name | Costs of a $10,000 investment | Costs paid as a percentage of a $10,000 investment |
|---|
| Class C | $145 | 2.83% |
Average Annual Total Returns
| 1 Year | 5 Years | 10 Years |
|---|
| Easterly Snow Long/Short Opportunity Fund | | | |
| Without Load | 9.15% | 9.48% | 3.60% |
| With Load | 8.15% | 9.48% | 3.60% |
Russell 3000® Total Return Index | 26.14% | 15.19% | 12.36% |
Russell 3000® Value Index | 21.02% | 11.11% | 8.76% |
The Fund's past performance is not a good predictor of the Fund's future performance. The table does not reflect the deduction of taxes that a shareholder would pay on fund distributions or redemption of fund shares.
Class C charges a maximum contingent deferred sales charge of 1.00% if you redeem Class C shares within one year after purchase.
For the most recent month-end performance, visit https://funds.easterlyam.com/snow-long-short-opportunity-fund/ or call 888-814-8180.
The Fund has adopted the performance of the Snow Capital Long/Short Opportunity Fund, a series of the Trust for Professional Managers (the “Predecessor Portfolio”) as the result of a reorganization of the Predecessor Portfolio into the Fund, which was consummated after the close of business on November 5, 2021 (the “Reorganization”). Prior to the Reorganization, the Fund had not yet commenced operations. The returns shown for periods ending on or prior to November 5, 2021 are those of the Class C shares of the Predecessor Portfolio. Class C shares of the Predecessor Portfolio were reorganized into Class C of the Fund, respectively, after the close of business on November 5, 2021. Class C shares' returns of the Fund will be different from the returns of the Predecessor Portfolio's Class C shares as they have different expenses.
Performance information reflects the impact of fee waivers, expense caps and/or reimbursements in effect during the period shown. If terminated, future expenses may be higher which would impact the Fund’s performance.
What did the Fund invest in?
| Net Assets | $92,560,271 |
| Number of Portfolio Holdings | 111 |
| Advisory Fee | $380,749 |
| Portfolio Turnover | 21% |
Long Sector Weighting (% of net assets)
| Value | Value |
|---|
| Liabilities in Excess of Other Assets | -16.1% |
| Communications | 1.3% |
| Equity | 2.1% |
| Consumer Staples | 3.2% |
| Utilities | 3.2% |
| Consumer Discretionary | 7.7% |
| Industrials | 10.1% |
| Health Care | 12.4% |
| Materials | 15.0% |
| Technology | 17.2% |
| Energy | 22.0% |
| Financials | 21.9% |
Top 10 Holdings (% of net assets)
| Holding Name | % of Net Assets |
| JPMorgan Chase & Company | 4.6% |
| Commercial Metals Company | 4.5% |
| Suncor Energy, Inc. | 3.9% |
| Amgen, Inc. | 3.4% |
| Sanofi - ADR | 3.2% |
| Open Text Corporation | 3.0% |
| Alamos Gold, Inc. | 2.9% |
| Johnson & Johnson | 2.8% |
| Kenvue, Inc. | 2.7% |
| Citigroup, Inc. | 2.6% |
Short Sector Weighting (% of net assets)
| Value | Value |
|---|
| Commodity | -0.6% |
| Consumer Discretionary | -0.7% |
| Call Options Written | -1.3% |
| Consumer Staples | -1.5% |
| Materials | -1.7% |
| Energy | -1.8% |
| Financials | -2.6% |
| Equity | -28.9% |
Where can I find additional information about the Fund?
Additional information is available on the Fund's website ( https://funds.easterlyam.com/resources/ ), including its:
Prospectus
Financial information
Holdings
Proxy voting information
Easterly Snow Long/Short Opportunity Fund
Semi-Annual Shareholder Report - August 31, 2024
This semi-annual shareholder report contains important information about Easterly Snow Long/Short Opportunity Fund for the period of March 1, 2024 to August 31, 2024. You can find additional information about the Fund at https://funds.easterlyam.com/resources/. You can also request this information by contacting us at 1-833-999-2636.
What were the Fund’s costs for the last six months?
(based on a hypothetical $10,000 investment)
| Class Name | Costs of a $10,000 investment | Costs paid as a percentage of a $10,000 investment |
|---|
| Class I | $95 | 1.84% |
Average Annual Total Returns
| 1 Year | 5 Years | 10 Years |
|---|
| Easterly Snow Long/Short Opportunity Fund | 10.27% | 10.56% | 4.63% |
Russell 3000® Total Return Index | 26.14% | 15.19% | 12.36% |
Russell 3000® Value Index | 21.02% | 11.11% | 8.76% |
The Fund's past performance is not a good predictor of the Fund's future performance. The table does not reflect the deduction of taxes that a shareholder would pay on fund distributions or redemption of fund shares.
For the most recent month-end performance, visit https://funds.easterlyam.com/snow-long-short-opportunity-fund/ or call 888-814-8180.
The Fund has adopted the performance of the Snow Capital Long/Short Opportunity Fund, a series of the Trust for Professional Managers (the “Predecessor Portfolio”) as the result of a reorganization of the Predecessor Portfolio into the Fund, which was consummated after the close of business on November 5, 2021 (the “Reorganization”). Prior to the Reorganization, the Fund had not yet commenced operations. The returns shown for periods ending on or prior to November 5, 2021 are those of the Institutional Class shares of the Predecessor Portfolio. Institutional Class shares of the Predecessor Portfolio were reorganized into Class I of the Fund, respectively, after the close of business on November 5, 2021. Class I shares' returns of the Fund will be different from the returns of the Predecessor Portfolio's Institutional Class shares as they have different expenses.
Performance information reflects the impact of fee waivers, expense caps and/or reimbursements in effect during the period shown. If terminated, future expenses may be higher which would impact the Fund’s performance.
What did the Fund invest in?
| Net Assets | $92,560,271 |
| Number of Portfolio Holdings | 111 |
| Advisory Fee | $380,749 |
| Portfolio Turnover | 21% |
Long Sector Weighting (% of net assets)
| Value | Value |
|---|
| Liabilities in Excess of Other Assets | -16.1% |
| Communications | 1.3% |
| Equity | 2.1% |
| Consumer Staples | 3.2% |
| Utilities | 3.2% |
| Consumer Discretionary | 7.7% |
| Industrials | 10.1% |
| Health Care | 12.4% |
| Materials | 15.0% |
| Technology | 17.2% |
| Energy | 22.0% |
| Financials | 21.9% |
Top 10 Holdings (% of net assets)
| Holding Name | % of Net Assets |
| JPMorgan Chase & Company | 4.6% |
| Commercial Metals Company | 4.5% |
| Suncor Energy, Inc. | 3.9% |
| Amgen, Inc. | 3.4% |
| Sanofi - ADR | 3.2% |
| Open Text Corporation | 3.0% |
| Alamos Gold, Inc. | 2.9% |
| Johnson & Johnson | 2.8% |
| Kenvue, Inc. | 2.7% |
| Citigroup, Inc. | 2.6% |
Short Sector Weighting (% of net assets)
| Value | Value |
|---|
| Commodity | -0.6% |
| Consumer Discretionary | -0.7% |
| Call Options Written | -1.3% |
| Consumer Staples | -1.5% |
| Materials | -1.7% |
| Energy | -1.8% |
| Financials | -2.6% |
| Equity | -28.9% |
Where can I find additional information about the Fund?
Additional information is available on the Fund's website ( https://funds.easterlyam.com/resources/ ), including its:
Prospectus
Financial information
Holdings
Proxy voting information
Easterly Snow Long/Short Opportunity Fund
Semi-Annual Shareholder Report - August 31, 2024
This semi-annual shareholder report contains important information about Easterly Snow Long/Short Opportunity Fund for the period of March 1, 2024 to August 31, 2024. You can find additional information about the Fund at https://funds.easterlyam.com/resources/. You can also request this information by contacting us at 1-833-999-2636.
What were the Fund’s costs for the last six months?
(based on a hypothetical $10,000 investment)
| Class Name | Costs of a $10,000 investment | Costs paid as a percentage of a $10,000 investment |
|---|
| Class R6 | $83 | 1.61% |
Average Annual Total Returns
| 1 Year | Since Inception (November 4, 2021) |
|---|
| Easterly Snow Long/Short Opportunity Fund | 10.27% | 4.78% |
Russell 3000® Total Return Index | 26.14% | 6.96% |
Russell 3000® Value Index | 21.02% | 6.49% |
The Fund's past performance is not a good predictor of the Fund's future performance. The table does not reflect the deduction of taxes that a shareholder would pay on fund distributions or redemption of fund shares.
For the most recent month-end performance, visit https://funds.easterlyam.com/snow-long-short-opportunity-fund/ or call 888-814-8180.
Performance information reflects the impact of fee waivers, expense caps and/or reimbursements in effect during the period shown. If terminated, future expenses may be higher which would impact the Fund’s performance.
What did the Fund invest in?
| Net Assets | $92,560,271 |
| Number of Portfolio Holdings | 111 |
| Advisory Fee | $380,749 |
| Portfolio Turnover | 21% |
Long Sector Weighting (% of net assets)
| Value | Value |
|---|
| Liabilities in Excess of Other Assets | -16.1% |
| Communications | 1.3% |
| Equity | 2.1% |
| Consumer Staples | 3.2% |
| Utilities | 3.2% |
| Consumer Discretionary | 7.7% |
| Industrials | 10.1% |
| Health Care | 12.4% |
| Materials | 15.0% |
| Technology | 17.2% |
| Energy | 22.0% |
| Financials | 21.9% |
Top 10 Holdings (% of net assets)
| Holding Name | % of Net Assets |
| JPMorgan Chase & Company | 4.6% |
| Commercial Metals Company | 4.5% |
| Suncor Energy, Inc. | 3.9% |
| Amgen, Inc. | 3.4% |
| Sanofi - ADR | 3.2% |
| Open Text Corporation | 3.0% |
| Alamos Gold, Inc. | 2.9% |
| Johnson & Johnson | 2.8% |
| Kenvue, Inc. | 2.7% |
| Citigroup, Inc. | 2.6% |
Short Sector Weighting (% of net assets)
| Value | Value |
|---|
| Commodity | -0.6% |
| Consumer Discretionary | -0.7% |
| Call Options Written | -1.3% |
| Consumer Staples | -1.5% |
| Materials | -1.7% |
| Energy | -1.8% |
| Financials | -2.6% |
| Equity | -28.9% |
Where can I find additional information about the Fund?
Additional information is available on the Fund's website ( https://funds.easterlyam.com/resources/ ), including its:
Prospectus
Financial information
Holdings
Proxy voting information
Easterly Snow Small Cap Value Fund
Semi-Annual Shareholder Report - August 31, 2024
This semi-annual shareholder report contains important information about Easterly Snow Small Cap Value Fund for the period of March 1, 2024 to August 31, 2024. You can find additional information about the Fund at https://funds.easterlyam.com/resources/. You can also request this information by contacting us at 1-833-999-2636.
What were the Fund’s costs for the last six months?
(based on a hypothetical $10,000 investment)
| Class Name | Costs of a $10,000 investment | Costs paid as a percentage of a $10,000 investment |
|---|
| Class A | $80 | 1.50% |
Average Annual Total Returns
| 1 Year | 5 Years | 10 Years |
|---|
| Easterly Snow Small Cap Value Fund | | | |
| Without Load | 22.58% | 17.56% | 6.45% |
| With Load | 15.53% | 16.18% | 5.82% |
Russell 3000® Total Return Index | 26.14% | 15.19% | 12.36% |
Russell 2000® Value Index | 19.25% | 10.38% | 7.46% |
Load Information: 5.75% is the maximum sales charge on purchase of A Shares.
The Fund's past performance is not a good predictor of the Fund's future performance. The table does not reflect the deduction of taxes that a shareholder would pay on fund distributions or redemption of fund shares.
For the most recent month-end performance, visit https://funds.easterlyam.com/snow-small-cap-value-fund/ or call 888-814-8180.
The Fund has adopted the performance of the Snow Capital Small Cap Value Fund, a series of the Trust for Professional Managers (the “Predecessor Portfolio”) as the result of a reorganization of the Predecessor Portfolio into the Fund, which was consummated after the close of business on November 5, 2021 (the “Reorganization”). Prior to the Reorganization, the Fund had not yet commenced operations. The returns shown for periods ending on or prior to November 5, 2021 are those of the Class A shares of the Predecessor Portfolio. Class A shares of the Predecessor Portfolio were reorganized into Class A of the Fund, respectively, after the close of business on November 5, 2021. Class A shares' returns of the Fund will be different from the returns of the Predecessor Portfolio's Class A shares as they have different expenses.
Performance information reflects the impact of fee waivers, expense caps and/or reimbursements in effect during the period shown. If terminated, future expenses may be higher which would impact the Fund’s performance.
| Net Assets | $27,815,793 |
| Number of Portfolio Holdings | 46 |
| Advisory Fee (net of waivers) | $20,469 |
| Portfolio Turnover | 14% |
Asset Weighting (% of total investments)
| Value | Value |
|---|
| Common Stocks | 100.0% |
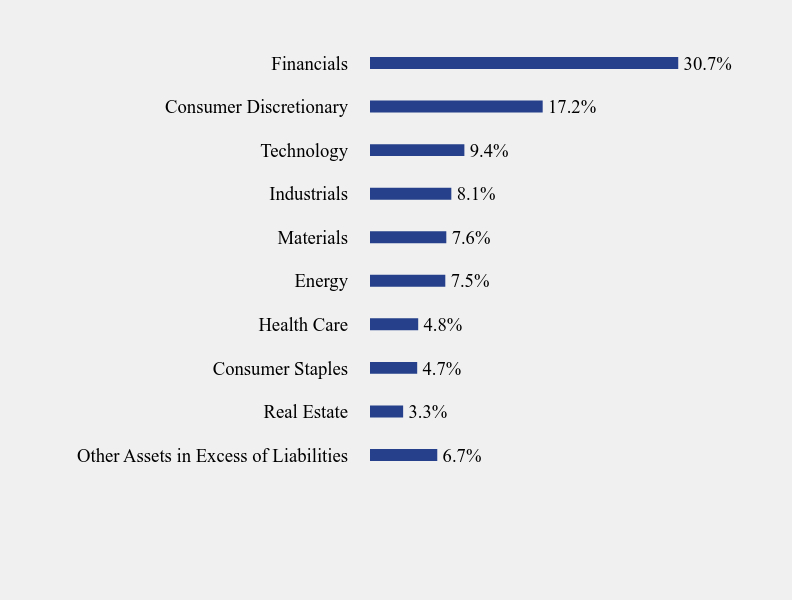
What did the Fund invest in?
Sector Weighting (% of net assets)
| Value | Value |
|---|
| Other Assets in Excess of Liabilities | 6.7% |
| Real Estate | 3.3% |
| Consumer Staples | 4.7% |
| Health Care | 4.8% |
| Energy | 7.5% |
| Materials | 7.6% |
| Industrials | 8.1% |
| Technology | 9.4% |
| Consumer Discretionary | 17.2% |
| Financials | 30.7% |
Top 10 Holdings (% of net assets)
| Holding Name | % of Net Assets |
| Jackson Financial, Inc., Class A | 4.9% |
| CNO Financial Group, Inc. | 4.8% |
| Pilgrim's Pride Corporation | 4.7% |
| Lincoln National Corporation | 3.7% |
| FMC Corporation | 3.6% |
| Bloomin' Brands, Inc. | 3.4% |
| Highwoods Properties, Inc. | 3.3% |
| Photronics, Inc. | 3.2% |
| Delek US Holdings, Inc. | 3.1% |
| Columbia Banking System, Inc. | 3.1% |
Where can I find additional information about the Fund?
Additional information is available on the Fund's website ( https://funds.easterlyam.com/resources/ ), including its:
Prospectus
Financial information
Holdings
Proxy voting information
Easterly Snow Small Cap Value Fund
Semi-Annual Shareholder Report - August 31, 2024
This semi-annual shareholder report contains important information about Easterly Snow Small Cap Value Fund for the period of March 1, 2024 to August 31, 2024. You can find additional information about the Fund at https://funds.easterlyam.com/resources/. You can also request this information by contacting us at 1-833-999-2636.
What were the Fund’s costs for the last six months?
(based on a hypothetical $10,000 investment)
| Class Name | Costs of a $10,000 investment | Costs paid as a percentage of a $10,000 investment |
|---|
| Class C | $120 | 2.25% |
Average Annual Total Returns
| 1 Year | 5 Years | 10 Years |
|---|
| Easterly Snow Small Cap Value Fund | | | |
| Without Load | 21.65% | 16.69% | 5.65% |
| With Load | 20.65% | 16.69% | 5.65% |
Russell 3000® Total Return Index | 26.14% | 15.19% | 12.36% |
Russell 2000® Value Index | 19.25% | 10.38% | 7.46% |
The Fund's past performance is not a good predictor of the Fund's future performance. The table does not reflect the deduction of taxes that a shareholder would pay on fund distributions or redemption of fund shares.
Class C charges a maximum contingent deferred sales charge of 1.00% if you redeem Class C shares within one year after purchase.
For the most recent month-end performance, visit https://funds.easterlyam.com/snow-small-cap-value-fund/ or call 888-814-8180.
The Fund has adopted the performance of the Snow Capital Small Cap Value Fund, a series of the Trust for Professional Managers (the “Predecessor Portfolio”) as the result of a reorganization of the Predecessor Portfolio into the Fund, which was consummated after the close of business on November 5, 2021 (the “Reorganization”). Prior to the Reorganization, the Fund had not yet commenced operations. The returns shown for periods ending on or prior to November 5, 2021 are those of the Class C shares of the Predecessor Portfolio. Class C shares of the Predecessor Portfolio were reorganized into Class C of the Fund, respectively, after the close of business on November 5, 2021. Class C shares' returns of the Fund will be different from the returns of the Predecessor Portfolio's Class C shares as they have different expenses.
Performance information reflects the impact of fee waivers, expense caps and/or reimbursements in effect during the period shown. If terminated, future expenses may be higher which would impact the Fund’s performance.
| Net Assets | $27,815,793 |
| Number of Portfolio Holdings | 46 |
| Advisory Fee (net of waivers) | $20,469 |
| Portfolio Turnover | 14% |
Asset Weighting (% of total investments)
| Value | Value |
|---|
| Common Stocks | 100.0% |
What did the Fund invest in?
Sector Weighting (% of net assets)
| Value | Value |
|---|
| Other Assets in Excess of Liabilities | 6.7% |
| Real Estate | 3.3% |
| Consumer Staples | 4.7% |
| Health Care | 4.8% |
| Energy | 7.5% |
| Materials | 7.6% |
| Industrials | 8.1% |
| Technology | 9.4% |
| Consumer Discretionary | 17.2% |
| Financials | 30.7% |
Top 10 Holdings (% of net assets)
| Holding Name | % of Net Assets |
| Jackson Financial, Inc., Class A | 4.9% |
| CNO Financial Group, Inc. | 4.8% |
| Pilgrim's Pride Corporation | 4.7% |
| Lincoln National Corporation | 3.7% |
| FMC Corporation | 3.6% |
| Bloomin' Brands, Inc. | 3.4% |
| Highwoods Properties, Inc. | 3.3% |
| Photronics, Inc. | 3.2% |
| Delek US Holdings, Inc. | 3.1% |
| Columbia Banking System, Inc. | 3.1% |
Where can I find additional information about the Fund?
Additional information is available on the Fund's website ( https://funds.easterlyam.com/resources/ ), including its:
Prospectus
Financial information
Holdings
Proxy voting information
Easterly Snow Small Cap Value Fund
Semi-Annual Shareholder Report - August 31, 2024
This semi-annual shareholder report contains important information about Easterly Snow Small Cap Value Fund for the period of March 1, 2024 to August 31, 2024. You can find additional information about the Fund at https://funds.easterlyam.com/resources/. You can also request this information by contacting us at 1-833-999-2636.
What were the Fund’s costs for the last six months?
(based on a hypothetical $10,000 investment)
| Class Name | Costs of a $10,000 investment | Costs paid as a percentage of a $10,000 investment |
|---|
| Class I | $64 | 1.20% |
Average Annual Total Returns
| 1 Year | 5 Years | 10 Years |
|---|
| Easterly Snow Small Cap Value Fund | 22.90% | 17.87% | 6.72% |
Russell 2000® Value Index | 19.25% | 10.38% | 7.46% |
Russell 3000® Total Return Index | 26.14% | 15.19% | 12.36% |
The Fund's past performance is not a good predictor of the Fund's future performance. The table does not reflect the deduction of taxes that a shareholder would pay on fund distributions or redemption of fund shares.
For the most recent month-end performance, visit https://funds.easterlyam.com/snow-small-cap-value-fund/ or call 888-814-8180.
The Fund has adopted the performance of the Snow Capital Small Cap Value Fund, a series of the Trust for Professional Managers (the “Predecessor Portfolio”) as the result of a reorganization of the Predecessor Portfolio into the Fund, which was consummated after the close of business on November 5, 2021 (the “Reorganization”). Prior to the Reorganization, the Fund had not yet commenced operations. The returns shown for periods ending on or prior to November 5, 2021 are those of the Institutional Class shares of the Predecessor Portfolio. Institutional Class shares of the Predecessor Portfolio were reorganized into Class I of the Fund, respectively, after the close of business on November 5, 2021. Class I shares' returns of the Fund will be different from the returns of the Predecessor Portfolio's Institutional Class shares as they have different expenses.
Performance information reflects the impact of fee waivers, expense caps and/or reimbursements in effect during the period shown. If terminated, future expenses may be higher which would impact the Fund’s performance.
| Net Assets | $27,815,793 |
| Number of Portfolio Holdings | 46 |
| Advisory Fee (net of waivers) | $20,469 |
| Portfolio Turnover | 14% |
Asset Weighting (% of total investments)
| Value | Value |
|---|
| Common Stocks | 100.0% |
What did the Fund invest in?
Sector Weighting (% of net assets)
| Value | Value |
|---|
| Other Assets in Excess of Liabilities | 6.7% |
| Real Estate | 3.3% |
| Consumer Staples | 4.7% |
| Health Care | 4.8% |
| Energy | 7.5% |
| Materials | 7.6% |
| Industrials | 8.1% |
| Technology | 9.4% |
| Consumer Discretionary | 17.2% |
| Financials | 30.7% |
Top 10 Holdings (% of net assets)
| Holding Name | % of Net Assets |
| Jackson Financial, Inc., Class A | 4.9% |
| CNO Financial Group, Inc. | 4.8% |
| Pilgrim's Pride Corporation | 4.7% |
| Lincoln National Corporation | 3.7% |
| FMC Corporation | 3.6% |
| Bloomin' Brands, Inc. | 3.4% |
| Highwoods Properties, Inc. | 3.3% |
| Photronics, Inc. | 3.2% |
| Delek US Holdings, Inc. | 3.1% |
| Columbia Banking System, Inc. | 3.1% |
Where can I find additional information about the Fund?
Additional information is available on the Fund's website ( https://funds.easterlyam.com/resources/ ), including its:
Prospectus
Financial information
Holdings
Proxy voting information
Easterly Snow Small Cap Value Fund
Semi-Annual Shareholder Report - August 31, 2024
This semi-annual shareholder report contains important information about Easterly Snow Small Cap Value Fund for the period of March 1, 2024 to August 31, 2024. You can find additional information about the Fund at https://funds.easterlyam.com/resources/. You can also request this information by contacting us at 1-833-999-2636.
What were the Fund’s costs for the last six months?
(based on a hypothetical $10,000 investment)
| Class Name | Costs of a $10,000 investment | Costs paid as a percentage of a $10,000 investment |
|---|
| Class R6 | $52 | 0.98% |
Average Annual Total Returns
| 1 Year | Since Inception (November 4, 2021) |
|---|
| Easterly Snow Small Cap Value Fund | 22.90% | 8.73% |
Russell 2000® Value Index | 19.25% | 1.16% |
Russell 3000® Total Return Index | 26.14% | 6.96% |
The Fund's past performance is not a good predictor of the Fund's future performance. The table does not reflect the deduction of taxes that a shareholder would pay on fund distributions or redemption of fund shares.
For the most recent month-end performance, visit https://funds.easterlyam.com/snow-small-cap-value-fund/ or call 888-814-8180.
Performance information reflects the impact of fee waivers, expense caps and/or reimbursements in effect during the period shown. If terminated, future expenses may be higher which would impact the Fund’s performance.
| Net Assets | $27,815,793 |
| Number of Portfolio Holdings | 46 |
| Advisory Fee (net of waivers) | $20,469 |
| Portfolio Turnover | 14% |
Asset Weighting (% of total investments)
| Value | Value |
|---|
| Common Stocks | 100.0% |
What did the Fund invest in?
Sector Weighting (% of net assets)
| Value | Value |
|---|
| Other Assets in Excess of Liabilities | 6.7% |
| Real Estate | 3.3% |
| Consumer Staples | 4.7% |
| Health Care | 4.8% |
| Energy | 7.5% |
| Materials | 7.6% |
| Industrials | 8.1% |
| Technology | 9.4% |
| Consumer Discretionary | 17.2% |
| Financials | 30.7% |
Top 10 Holdings (% of net assets)
| Holding Name | % of Net Assets |
| Jackson Financial, Inc., Class A | 4.9% |
| CNO Financial Group, Inc. | 4.8% |
| Pilgrim's Pride Corporation | 4.7% |
| Lincoln National Corporation | 3.7% |
| FMC Corporation | 3.6% |
| Bloomin' Brands, Inc. | 3.4% |
| Highwoods Properties, Inc. | 3.3% |
| Photronics, Inc. | 3.2% |
| Delek US Holdings, Inc. | 3.1% |
| Columbia Banking System, Inc. | 3.1% |
Where can I find additional information about the Fund?
Additional information is available on the Fund's website ( https://funds.easterlyam.com/resources/ ), including its:
Prospectus
Financial information
Holdings
Proxy voting information
Item 2. Code of Ethics. Not applicable for semi-annual reports.
Item 3. Audit Committee Financial Expert. Not applicable for semi-annual reports.
Item 4. Principal Accountant Fees and Services. Not applicable for semi-annual reports.
Item 5. Audit Committee of Listed Registrants. Not applicable to open-end investment companies.
Item 6. Investments.
The Registrant’s schedule of investments in unaffiliated issuers is included in the Financial Statements under Item 7 of this form.
Item 7. Financial Statements and Financial Highlights for Open-End Management Investment Companies.
(a)
| |
| |
| |
| |
| |
 |
| |
| JAMES ALPHA FUNDS TRUST d/b/a EASTERLY FUNDS TRUST |
| |
| |
| |
| |
| |
| CLASS A, C, I AND R6 SHARES |
| |
| |
| |
| |
| |
| |
| |
| |
| |
| |
SEMI-ANNUAL FINANCIAL
STATEMENTS
August 31, 2024 |
| |
| |
| |
| |
| |
| |
| |
| |
| |
| |
| |
| |
| |
| |
| |
| |
| |
| |
| |
| |
| THIS REPORT IS AUTHORIZED FOR DISTRIBUTION ONLY TO SHAREHOLDERS AND TO OTHERS WHO HAVE RECEIVED A COPY OF THE PROSPECTUS. |
| EASTERLY SNOW SMALL CAP VALUE FUND |
| SCHEDULE OF INVESTMENTS (Unaudited) |
| August 31, 2024 |
| Shares | | | | | Fair Value | |
| | | | | COMMON STOCKS — 93.3% | | | | |
| | | | | AEROSPACE & DEFENSE - 1.4% | | | | |
| | 9,638 | | | Barnes Group, Inc. | | $ | 385,906 | |
| | | | | | | | | |
| | | | | APPAREL & TEXTILE PRODUCTS - 0.7% | | | | |
| | 3,165 | | | Carter’s, Inc. | | | 208,574 | |
| | | | | | | | | |
| | | | | AUTOMOTIVE - 1.7% | | | | |
| | 3,873 | | | Modine Manufacturing Company(a) | | | 470,763 | |
| | | | | | | | | |
| | | | | BANKING - 17.3% | | | | |
| | 33,576 | | | Columbia Banking System, Inc. | | | 845,444 | |
| | 10,061 | | | Comerica, Inc. | | | 574,584 | |
| | 32,292 | | | First Commonwealth Financial Corporation | | | 556,068 | |
| | 40,644 | | | FNB Corporation | | | 608,847 | |
| | 35,954 | | | KeyCorporation | | | 613,375 | |
| | 3,813 | | | OFG Bancorp | | | 175,360 | |
| | 42,200 | | | Old National Bancorp | | | 837,670 | |
| | 11,907 | | | Zions Bancorp NA | | | 590,111 | |
| | | | | | | | 4,801,459 | |
| | | | | BIOTECH & PHARMA - 2.2% | | | | |
| | 16,112 | | | Collegium Pharmaceutical, Inc.(a) | | | 619,668 | |
| | | | | | | | | |
| | | | | CHEMICALS - 4.9% | | | | |
| | 14,611 | | | Chemours Company (The) | | | 284,038 | |
| | 11,237 | | | Ecovyst, Inc.(a) | | | 80,682 | |
| | 15,312 | | | FMC Corporation | | | 988,849 | |
| | | | | | | | 1,353,569 | |
| | | | | COMMERCIAL SUPPORT SERVICES - 2.1% | | | | |
| | 10,299 | | | ABM Industries, Inc. | | | 588,588 | |
| | | | | | | | | |
| | | | | ELECTRICAL EQUIPMENT - 1.0% | | | | |
| | 7,041 | | | Sensata Technologies Holding plc | | | 271,431 | |
| | | | | | | | | |
See accompanying notes to financial statements.
| EASTERLY SNOW SMALL CAP VALUE FUND |
| SCHEDULE OF INVESTMENTS (Unaudited) (Continued) |
| August 31, 2024 |
| Shares | | | | | Fair Value | |
| | | | | COMMON STOCKS — 93.3% (Continued) | | | | |
| | | | | FOOD - 4.7% | | | | |
| | 28,223 | | | Pilgrim’s Pride Corporation(a) | | $ | 1,314,627 | |
| | | | | | | | | |
| | | | | HOME & OFFICE PRODUCTS - 3.5% | | | | |
| | 41,819 | | | ACCO Brands Corporation | | | 229,168 | |
| | 7,441 | | | Whirlpool Corporation | | | 746,258 | |
| | | | | | | | 975,426 | |
| | | | | INDUSTRIAL SUPPORT SERVICES - 0.7% | | | | |
| | 1,095 | | | WESCO International, Inc. | | | 181,091 | |
| | | | | | | | | |
| | | | | INSURANCE - 13.4% | | | | |
| | 38,390 | | | CNO Financial Group, Inc. | | | 1,340,579 | |
| | 15,131 | | | Jackson Financial, Inc., Class A | | | 1,361,336 | |
| | 32,269 | | | Lincoln National Corporation | | | 1,035,835 | |
| | | | | | | | 3,737,750 | |
| | | | | LEISURE FACILITIES & SERVICES - 8.2% | | | | |
| | 55,012 | | | Bloomin’ Brands, Inc. | | | 962,709 | |
| | 7,363 | | | Brinker International, Inc.(a) | | | 526,602 | |
| | 29,103 | | | Cinemark Holdings, Inc.(a) | | | 796,840 | |
| | | | | | | | 2,286,151 | |
| | | | | MACHINERY – 3.0% | | | | |
| | 11,687 | | | Astec Industries, Inc. | | | 395,370 | |
| | 4,005 | | | Kennametal, Inc. | | | 103,609 | |
| | 5,657 | | | Terex Corporation | | | 321,148 | |
| | | | | | | | 820,127 | |
| | | | | MEDICAL EQUIPMENT & DEVICES - 2.6% | | | | |
| | 29,079 | | | Inmode Ltd.(a) | | | 485,910 | |
| | 11,183 | | | Integra LifeSciences Holdings Corporation(a) | | | 227,462 | |
| | | | | | | | 713,372 | |
| | | | | OIL & GAS PRODUCERS - 7.5% | | | | |
| | 17,593 | | | CNX Resources Corporation(a) | | | 486,798 | |
| | 42,768 | | | Delek US Holdings, Inc. | | | 873,323 | |
| | 4,308 | | | HF Sinclair Corporation | | | 211,695 | |
| | 71,026 | | | Veren, Inc. | | | 513,518 | |
| | | | | | | | 2,085,334 | |
See accompanying notes to financial statements.
| EASTERLY SNOW SMALL CAP VALUE FUND |
| SCHEDULE OF INVESTMENTS (Unaudited) (Continued) |
| August 31, 2024 |
| Shares | | | | | Fair Value | |
| | | | | COMMON STOCKS — 93.3% (Continued) | | | | |
| | | | | REITS - 3.3% | | | | |
| | 28,310 | | | Highwoods Properties, Inc. | | $ | 912,148 | |
| | | | | | | | | |
| | | | | RETAIL - DISCRETIONARY - 3.0% | | | | |
| | 6,225 | | | Advance Auto Parts, Inc. | | | 282,055 | |
| | 15,094 | | | Urban Outfitters, Inc.(a) | | | 548,214 | |
| | | | | | | | 830,269 | |
| | | | | SEMICONDUCTORS - 6.2% | | | | |
| | 3,109 | | | Diodes, Inc.(a) | | | 216,666 | |
| | 34,781 | | | Photronics, Inc.(a) | | | 899,437 | |
| | 9,754 | | | Silicon Motion Technology Corporation - ADR | | | 620,062 | |
| | | | | | | | 1,736,165 | |
| | | | | SOFTWARE - 2.7% | | | | |
| | 16,166 | | | Open Text Corporation | | | 514,402 | |
| | 4,829 | | | Ziff Davis, Inc.(a) | | | 235,993 | |
| | | | | | | | 750,395 | |
| | | | | STEEL - 2.7% | | | | |
| | 14,092 | | | Commercial Metals Company | | | 755,190 | |
| | | | | | | | | |
| | | | | TECHNOLOGY HARDWARE - 0.5% | | | | |
| | 3,956 | | | Clearfield, Inc.(a) | | | 147,559 | |
| | | | | | | | | |
| | | | | | | | | |
| | | | | TOTAL COMMON STOCKS (Cost $20,014,191) | | | 25,945,562 | |
| | | | | | | | | |
| | | | | TOTAL INVESTMENTS - 93.3% (Cost $20,014,191) | | $ | 25,945,562 | |
| | | | | OTHER ASSETS IN EXCESS OF LIABILITIES- 6.7% | | | 1,870,231 | |
| | | | | NET ASSETS - 100.0% | | $ | 27,815,793 | |
| ADR | - American Depositary Receipt |
| | |
| LTD | - Limited Company |
| | |
| PLC | - Public Limited Company |
| | |
| REITS | - Real Estate Investment Trust |
| (a) | Non-income producing security. |
See accompanying notes to financial statements.
| EASTERLY SNOW LONG/SHORT OPPORTUNITY FUND |
| SCHEDULE OF INVESTMENTS (Unaudited) |
| August 31, 2024 |
| Shares | | | | | Fair Value | |
| | | | | COMMON STOCKS — 111.0% | | | | |
| | | | | AEROSPACE & DEFENSE - 1.2% | | | | |
| | 1,910 | | | Lockheed Martin Corporation, B | | $ | 1,085,071 | |
| | | | | | | | | |
| | | | | APPAREL & TEXTILE PRODUCTS - 1.3% | | | | |
| | 11,817 | | | PVH Corporation | | | 1,166,220 | |
| | | | | | | | | |
| | | | | AUTOMOTIVE - 1.8% | | | | |
| | 34,790 | | | Phinia, Inc. | | | 1,668,528 | |
| | | | | | | | | |
| | | | | BANKING - 12.8% | | | | |
| | 29,670 | | | Bank of America Corporation | | | 1,209,052 | |
| | 38,740 | | | Citigroup, Inc. | | | 2,426,674 | |
| | 65,770 | | | Columbia Banking System, Inc. | | | 1,656,089 | |
| | 18,953 | | | JPMorgan Chase & Company | | | 4,260,634 | |
| | 38,873 | | | Wells Fargo & Company | | | 2,272,904 | |
| | | | | | | | 11,825,353 | |
| | | | | BIOTECH & PHARMA - 12.4% | | | | |
| | 6,154 | | | AbbVie, Inc. | | | 1,208,092 | |
| | 9,457 | | | Amgen, Inc. | | | 3,157,030 | |
| | 15,830 | | | Johnson & Johnson | | | 2,625,564 | |
| | 700,000 | | | Optinose, Inc.(a) | | | 728,000 | |
| | 51,380 | | | Pacira BioSciences, Inc.(a) | | | 799,473 | |
| | 52,696 | | | Sanofi - ADR | | | 2,964,677 | |
| | | | | | | | 11,482,836 | |
| | | | | CHEMICALS - 3.3% | | | | |
| | 102,130 | | | Ecovyst, Inc.(a) | | | 733,293 | |
| | 15,240 | | | FMC Corporation | | | 984,199 | |
| | 12,500 | | | International Flavors & Fragrances, Inc. | | | 1,299,875 | |
| | | | | | | | 3,017,367 | |
| | | | | DIVERSIFIED INDUSTRIALS - 0.9% | | | | |
| | 9,350 | | | Pentair PLC | | | 829,252 | |
| | | | | | | | | |
| | | | | ELECTRIC UTILITIES - 1.7% | | | | |
| | 18,000 | | | Vistra Corporation | | | 1,537,740 | |
| | | | | | | | | |
See accompanying notes to financial statements.
| EASTERLY SNOW LONG/SHORT OPPORTUNITY FUND |
| SCHEDULE OF INVESTMENTS (Unaudited) (Continued) |
| August 31, 2024 |
| Shares | | | | | Fair Value | |
| | | | | COMMON STOCKS — 111.0% (Continued) | | | | |
| | | | | ELECTRICAL EQUIPMENT - 1.7% | | | | |
| | 41,520 | | | Sensata Technologies Holding plc | | $ | 1,600,596 | |
| | | | | | | | | |
| | | | | GAS & WATER UTILITIES - 1.5% | | | | |
| | 55,950 | | | UGI Corporation | | | 1,393,715 | |
| | | | | | | | | |
| | | | | HOME & OFFICE PRODUCTS - 1.4% | | | | |
| | 13,470 | | | Whirlpool Corporation | | | 1,350,906 | |
| | | | | | | | | |
| | | | | HOUSEHOLD PRODUCTS - 2.7% | | | | |
| | 112,540 | | | Kenvue, Inc. | | | 2,470,253 | |
| | | | | | | | | |
| | | | | INDUSTRIAL SUPPORT SERVICES - 2.6% | | | | |
| | 14,360 | | | WESCO International, Inc. | | | 2,374,857 | |
| | | | | | | | | |
| | | | | INSURANCE - 7.8% | | | | |
| | 66,420 | | | CNO Financial Group, Inc. | | | 2,319,386 | |
| | 14,490 | | | Hartford Financial Services Group, Inc. (The) | | | 1,682,289 | |
| | 36,090 | | | Lincoln National Corporation | | | 1,158,489 | |
| | 26,375 | | | MetLife, Inc. | | | 2,043,535 | |
| | | | | | | | 7,203,699 | |
| | | | | INTERNET MEDIA & SERVICES - 1.3% | | | | |
| | 33,110 | | | Match Group, Inc.(a) | | | 1,232,023 | |
| | | | | | | | | |
| | | | | LEISURE FACILITIES & SERVICES - 1.1% | | | | |
| | 27,150 | | | Las Vegas Sands Corporation | | | 1,058,579 | |
| | | | | | | | | |
| | | | | MACHINERY - 0.5% | | | | |
| | 8,804 | | | Terex Corporation | | | 499,803 | |
| | | | | | | | | |
| | | | | METALS & MINING - 7.3% | | | | |
| | 22,040 | | | Agnico Eagle Mines Ltd. | | | 1,795,599 | |
| | 137,886 | | | Alamos Gold, Inc., Class A | | | 2,658,442 | |
| | 830,222 | | | B2Gold Corporation | | | 2,324,622 | |
| | | | | | | | 6,778,663 | |
See accompanying notes to financial statements.
| EASTERLY SNOW LONG/SHORT OPPORTUNITY FUND |
| SCHEDULE OF INVESTMENTS (Unaudited) (Continued) |
| August 31, 2024 |
| Shares | | | | | Fair Value | |
| | | | | COMMON STOCKS — 111.0% (Continued) | | | | |
| | | | | OIL & GAS PRODUCERS - 21.0% | | | | |
| | 29,476 | | | Coterra Energy, Inc. | | $ | 717,151 | |
| | 16,900 | | | Delek US Holdings, Inc. | | | 345,098 | |
| | 62,900 | | | EQT Corporation | | | 2,107,779 | |
| | 8,400 | | | Exxon Mobil Corporation | | | 990,696 | |
| | 10,000 | | | HF Sinclair Corporation | | | 491,400 | |
| | 75,721 | | | Marathon Oil Corporation | | | 2,169,407 | |
| | 11,385 | | | Marathon Petroleum Corporation | | | 2,016,511 | |
| | 47,370 | | | Northern Oil and Gas, Inc. | | | 1,884,379 | |
| | 71,180 | | | Range Resources Corporation | | | 2,126,858 | |
| | 289,170 | | | Southwestern Energy Company(a) | | | 1,844,904 | |
| | 88,209 | | | Suncor Energy, Inc. | | | 3,575,993 | |
| | 169,090 | | | Veren, Inc. | | | 1,222,521 | |
| | | | | | | | 19,492,697 | |
| | | | | RETAIL - CONSUMER STAPLES - 0.5% | | | | |
| | 6,400 | | | BJ’s Wholesale Club Holdings, Inc.(a) | | | 511,744 | |
| | | | | | | | | |
| | | | | RETAIL - DISCRETIONARY - 1.3% | | | | |
| | 16,630 | | | Advance Auto Parts, Inc. | | | 753,505 | |
| | 1,850 | | | Lululemon Athletica, Inc.(a) | | | 480,020 | |
| | | | | | | | 1,233,525 | |
| | | | | SEMICONDUCTORS - 4.1% | | | | |
| | 13,510 | | | Advanced Micro Devices, Inc.(a) | | | 2,007,046 | |
| | 31,800 | | | Photronics, Inc.(a) | | | 822,348 | |
| | 14,891 | | | Silicon Motion Technology Corporation - ADR | | | 946,621 | |
| | | | | | | | 3,776,015 | |
| | | | | SOFTWARE - 6.5% | | | | |
| | 5,666 | | | Check Point Software Technologies Ltd.(a) | | | 1,090,705 | |
| | 88,151 | | | Open Text Corporation | | | 2,804,965 | |
| | 6,890 | | | Oracle Corporation | | | 973,488 | |
| | 16,930 | | | Zoom Video Communications, Inc., Class A(a) | | | 1,169,524 | |
| | | | | | | | 6,038,682 | |
| | | | | STEEL - 4.5% | | | | |
| | 77,243 | | | Commercial Metals Company | | | 4,139,452 | |
| | | | | | | | | |
See accompanying notes to financial statements.
| EASTERLY SNOW LONG/SHORT OPPORTUNITY FUND |
| SCHEDULE OF INVESTMENTS (Unaudited) (Continued) |
| August 31, 2024 |
| Shares | | | | | | | | | Fair Value | |
| | | | | COMMON STOCKS — 111.0% (Continued) | | | | | | | | |
| | | | | TECHNOLOGY HARDWARE - 6.6% | | | | | | | | |
| | 27,920 | | | Cisco Systems, Inc. | | | | | | $ | 1,411,077 | |
| | 46,690 | | | NCR Atleos Corporation(a) | | | | | | | 1,335,801 | |
| | 104,320 | | | NCR Voyix Corporation(a) | | | | | | | 1,407,277 | |
| | 16,019 | | | NetApp, Inc. | | | | | | | 1,933,813 | |
| | | | | | | | | | | | 6,087,968 | |
| | | | | TRANSPORTATION & LOGISTICS - 2.4% | | | | | | | | |
| | 25,680 | | | Delta Air Lines, Inc. | | | | | | | 1,091,143 | |
| | 8,880 | | | United Parcel Service, Inc., B | | | | | | | 1,141,524 | |
| | | | | | | | | | | | 2,232,667 | |
| | | | | TRANSPORTATION EQUIPMENT - 0.8% | | | | | | | | |
| | 7,275 | | | PACCAR, Inc. | | | | | | | 699,710 | |
| | | | | | | | | | | | | |
| | | | | | | | | | | | | |
| | | | | TOTAL COMMON STOCKS (Cost $81,638,152) | | | | | | | 102,787,921 | |
| | | | | | | | | | | | | |
| | | | | | | | | | | | | |
| | | | | EXCHANGE-TRADED FUNDS — 2.1% | | | | | | | | |
| | | | | EQUITY - 2.1% | | | | | | | | |
| | 42,300 | | | VanEck Junior Gold Miners ETF | | | | | | | 1,944,531 | |
| | | | | | | | | | | | | |
| | | | | TOTAL EXCHANGE-TRADED FUNDS (Cost $1,596,373) | | | | | | | 1,944,531 | |
| | | | | | | | | | | | | |
Principal
Amount ($) | | | | | Coupon
Rate (%) | | Maturity | | | | |
| | | | | CORPORATE BONDS — 3.0% | | | | | | | | |
| | | | | OIL & GAS SERVICES & EQUIPMENT — 0.9% | | | | | | | | |
| | 1,000,000 | | | Transocean, Inc. | | 6.8000 | | 03/15/38 | | | 848,877 | |
| | | | | | | | | | | | | |
| | | | | RETAIL - DISCRETIONARY — 0.7% | | | | | | | | |
| | 1,000,000 | | | Kohl’s Corporation | | 5.5500 | | 07/17/45 | | | 652,182 | |
| | | | | | | | | | | | | |
| | | | | SPECIALTY FINANCE — 1.4% | | | | | | | | |
| | 500,000 | | | Ally Financial, Inc. Series B | | 4.7000 | | 08/15/69 | | | 455,967 | |
| | 1,000,000 | | | Ally Financial, Inc. | | 4.7000 | | 08/15/69 | | | 835,044 | |
| | | | | | | | | | | | 1,291,011 | |
See accompanying notes to financial statements.
| EASTERLY SNOW LONG/SHORT OPPORTUNITY FUND |
| SCHEDULE OF INVESTMENTS (Unaudited) (Continued) |
| August 31, 2024 |
Principal
Amount ($) | | | | | Coupon
Rate (%) | | Maturity | | Fair Value | |
| | | | | CORPORATE BONDS — 3.0% (Continued) | | | | | | | | |
| | | | | TOTAL CORPORATE BONDS (Cost $2,374,276) | | | | | | $ | 2,792,070 | |
| | | | | | | | | | | | | |
| | | | | TOTAL INVESTMENTS - 116.1% (Cost $85,608,801) | | | | | | $ | 107,524,522 | |
| | | | | CALL OPTIONS WRITTEN - (1.2)% (Premiums received - $1,054,909) | | | | | | | (1,127,363 | ) |
| | | | | PUT OPTIONS WRITTEN - (0.1)% (Premiums received - $125,383) | | | | | | | (102,695 | ) |
| | | | | LIABILITIES IN EXCESS OF OTHER ASSETS - (14.8)% | | | | | | | (13,734,193 | ) |
| | | | | NET ASSETS - 100.0% | | | | | | $ | 92,560,271 | |
| | | | | | | | | | | | | |
| Contracts(b) | | | | | Counterparty | | Expiration
Date | | Exercise
Price | | | Notional
Value | | | Fair Value | |
| | | | WRITTEN EQUITY OPTIONS - (1.3)% | | | | | | | | | | | | | |
| | | | | CALL OPTIONS WRITTEN- (1.2)% | | | | | | | | | | | | | | | | |
| | 30 | | | AbbVie, Inc. | | JEF | | 11/15/2024 | | $ | 195 | | | $ | 585,000 | | | $ | 24,420 | |
| | 60 | | | Advanced Micro Devices, Inc. | | JEF | | 12/20/2024 | | | 175 | | | | 1,050,000 | | | | 41,520 | |
| | 350 | | | Alamos Gold, Inc. | | JEF | | 12/20/2024 | | | 18 | | | | 630,000 | | | | 73,500 | |
| | 350 | | | Alamos Gold, Inc. | | JEF | | 01/17/2025 | | | 23 | | | | 787,500 | | | | 22,750 | |
| | 25 | | | Amgen, Inc. | | JEF | | 01/17/2025 | | | 350 | | | | 875,000 | | | | 46,875 | |
| | 25 | | | Amgen, Inc. | | JEF | | 03/21/2025 | | | 370 | | | | 925,000 | | | | 37,500 | |
| | 30 | | | Check Point Software Technologies Ltd. | | JEF | | 11/15/2024 | | | 195 | | | | 585,000 | | | | 24,240 | |
| | 100 | | | Citigroup, Inc. | | JEF | | 11/15/2024 | | | 70 | | | | 700,000 | | | | 5,800 | |
| | 80 | | | Citigroup, Inc. | | JEF | | 12/20/2024 | | | 65 | | | | 520,000 | | | | 20,960 | |
| | 250 | | | Commercial Metals Company | | JEF | | 09/20/2024 | | | 60 | | | | 1,500,000 | | | | 12,500 | |
| | 250 | | | Commercial Metals Company | | JEF | | 12/20/2024 | | | 55 | | | | 1,375,000 | | | | 77,500 | |
| | 250 | | | Commercial Metals Company | | JEF | | 12/20/2024 | | | 65 | | | | 1,625,000 | | | | 12,500 | |
| | 65 | | | International Flavors & Fragrances, Inc. | | JEF | | 12/20/2024 | | | 110 | | | | 715,000 | | | | 27,300 | |
| | 10 | | | Lockheed Martin Corporation | | JEF | | 12/20/2024 | | | 550 | | | | 550,000 | | | | 34,000 | |
| | 40 | | | Marathon Petroleum Corporation | | JEF | | 09/20/2024 | | | 240 | | | | 960,000 | | | | 1,500 | |
| | 80 | | | NetApp, Inc. | | JEF | | 09/20/2024 | | | 110 | | | | 880,000 | | | | 91,200 | |
| | 80 | | | NetApp, Inc. | | JEF | | 12/20/2024 | | | 120 | | | | 960,000 | | | | 65,600 | |
| | 35 | | | Oracle Corporation | | JEF | | 12/20/2024 | | | 155 | | | | 542,500 | | | | 17,938 | |
| | 35 | | | PACCAR, Inc. | | JEF | | 11/15/2024 | | | 115 | | | | 402,500 | | | | 4,200 | |
| | 180 | | | Range Resources Corporation | | JEF | | 12/20/2024 | | | 43 | | | | 774,000 | | | | 9,000 | |
| | 180 | | | Vistra Corporation | | JEF | | 10/18/2024 | | | 65 | | | | 1,170,000 | | | | 383,400 | |
| | 80 | | | Wells Fargo & Company | | JEF | | 12/20/2024 | | | 60 | | | | 480,000 | | | | 21,600 | |
| | 50 | | | WESCO International, Inc. | | JEF | | 12/20/2024 | | | 175 | | | | 875,000 | | | | 53,500 | |
| | 42 | | | WESCO International, Inc. | | JEF | | 12/20/2024 | | | 200 | | | | 840,000 | | | | 18,060 | |
| | | | | TOTAL CALL OPTIONS WRITTEN (Proceeds - $1,054,909) | | | | | 1,127,363 | |
| | | | | | | | | | | | | | | | | | | | | |
| | | | | PUT OPTIONS WRITTEN - (0.1)% | | | | | | | | | | | | | | | | |
| | 70 | | | Dell Technologies, Inc. | | JEF | | 10/18/2024 | | $ | 125 | | | $ | 875,000 | | | $ | 86,800 | |
| | 20 | | | Lululemon Athletica, Inc. | | JEF | | 12/20/2024 | | | 220 | | | | 440,000 | | | | 15,520 | |
See accompanying notes to financial statements.
| EASTERLY SNOW LONG/SHORT OPPORTUNITY FUND |
| SCHEDULE OF INVESTMENTS (Unaudited) (Continued) |
| August 31, 2024 |
Contracts(b)
(continued) | | | | | Counterparty | | Expiration
Date | | Exercise
Price | | | Notional
Value | | | Fair Value | |
| | | | | WRITTEN EQUITY OPTIONS - (1.3)% (Continued) | | | | | | | | | | | | | | | | |
| | | | | PUT OPTIONS WRITTEN - (0.1)% (Continued) | | | | | | | | | | | | | | | | |
| | 75 | | | Zoom Video Communications, Inc. | | JEF | | 09/20/2024 | | $ | 60 | | | $ | 450,000 | | | $ | 375 | |
| | | | | TOTAL PUT OPTIONS WRITTEN (Proceeds - $125,383) | | | | | 102,695 | |
| | | | | | | | | | | | | | | | | | | | | |
| | | | | TOTAL EQUITY OPTIONS WRITTEN (Proceeds - $1,180,292) | | | | $ | 1,230,058 | |
| EASTERLY SNOW LONG/SHORT OPPORTUNITY FUND |
| SCHEDULE OF SECURITIES SOLD SHORT (Unaudited) |
| August 31, 2024 |
| Shares | | | | | Fair Value | |
| | | | | COMMON STOCKS — (8.3)% | | | | |
| | | | | ASSET MANAGEMENT - (1.2)% | | | | |
| | (7,780 | ) | | Ares Management Corporation, Class A | | $ | (1,138,992 | ) |
| | | | | | | | | |
| | | | | HOUSEHOLD PRODUCTS - (1.5)% | | | | |
| | (12,800 | ) | | Colgate-Palmolive Company | | | (1,363,200 | ) |
| | | | | | | | | |
| | | | | INSTITUTIONAL FINANCIAL SERVICES - (1.3)% | | | | |
| | (2,410 | ) | | Goldman Sachs Group, Inc. (The) | | | (1,229,702 | ) |
| | | | | | | | | |
| | | | | METALS & MINING - (1.8)% | | | | |
| | (13,150 | ) | | Newmont Corporation | | | (702,079 | ) |
| | (14,700 | ) | | Rio Tinto PLC - ADR | | | (930,069 | ) |
| | | | | | | | (1,632,148 | ) |
| | | | | OIL & GAS PRODUCERS - (1.8)% | | | | |
| | (4,140 | ) | | EOG Resources, Inc. | | | (533,315 | ) |
| | (14,800 | ) | | Occidental Petroleum Corporation | | | (843,304 | ) |
| | (19,930 | ) | | Permian Resources Corporation | | | (283,803 | ) |
| | | | | | | | (1,660,422 | ) |
See accompanying notes to financial statements.
| EASTERLY SNOW LONG/SHORT OPPORTUNITY FUND |
| SCHEDULE OF SECURITIES SOLD SHORT (Unaudited) (Continued) |
| August 31, 2024 |
| Shares | | | | | Fair Value | |
| | | | | COMMON STOCKS — (8.3)% (Continued) | | | | |
| | | | | RETAIL - DISCRETIONARY - (0.7)% | | | | |
| | (550 | ) | | O’Reilly Automotive, Inc. | | $ | (621,484 | ) |
| | | | | | | | | |
| | | | | EXCHANGE-TRADED FUNDS — (29.5)% | | | | |
| | | | | COMMODITY - (0.6)% | | | | |
| | (2,400 | ) | | SPDR Gold Shares | | | (555,096 | ) |
| | | | | | | | | |
| | | | | EQUITY - (28.9)% | | | | |
| | (16,700 | ) | | iShares Russell 1000 Value ETF | | | (3,144,944 | ) |
| | (12,600 | ) | | iShares Russell 2000 Value ETF | | | (2,113,398 | ) |
| | (7,980 | ) | | iShares Russell 3000 ETF | | | (2,560,542 | ) |
| | (75,480 | ) | | VanEck Gold Miners ETF | | | (2,915,038 | ) |
| | (31,000 | ) | | Vanguard S&P 500 ETF | | | (16,059,240 | ) |
| | | | | | | | (26,793,162 | ) |
| | | | | | | | | |
| | | | | TOTAL SECURITIES SOLD SHORT - (Proceeds - $30,105,053) | | $ | (34,994,206 | ) |
| ADR | - American Depositary Receipt |
| | |
| ETF | - Exchange-Traded Fund |
| | |
| JEF | - Jefferies |
| | |
| LTD | - Limited Company |
| | |
| PLC | - Public Limited Company |
| | |
| SPDR | - Standard & Poor’s Depositary Receipt |
| (a) | Non-income producing security. |
| | |
| (b) | Each option contract allows the holder of the option to purchase or sell 100 shares of the underlying security. |
See accompanying notes to financial statements.
| EASTERLY FUNDS |
| STATEMENTS OF ASSETS AND LIABILITIES (Unaudited) |
| August 31, 2024 |
| | | Easterly Snow | | | Easterly Snow | |
| | | Small Cap Value | | | Long/Short | |
| | | Fund | | | Opportunity Fund | |
| Assets: | | | | | | | | |
| Total Investments, at cost | | $ | 20,014,191 | | | $ | 85,608,801 | |
| Total Investments, at value | | $ | 25,945,562 | | | $ | 107,524,522 | |
| Cash | | | 1,819,222 | | | | 2,761,800 | |
| Deposit at Broker | | | — | | | | 17,819,450 | |
| Cash Collateral Held at Custodian | | | — | | | | 487,209 | |
| Receivable for fund shares sold | | | 52 | | | | — | |
| Interest and dividends receivable | | | 79,806 | | | | 289,297 | |
| Prepaid expenses and other assets | | | 20,033 | | | | 27,288 | |
| Total Assets | | | 27,864,675 | | | | 128,909,566 | |
| | | | | | | | | |
| Liabilities: | | | | | | | | |
| Options Written (premiums received $0 and $1,180,292) | | | — | | | | 1,230,058 | |
| Securities sold short (proceeds $0 and $30,105,053) | | | — | | | | 34,994,206 | |
| Payable for fund shares redeemed | | | 1,493 | | | | — | |
| Administration fees payable | | | 10,361 | | | | 18,832 | |
| Payable to manager | | | 1,666 | | | | 49,841 | |
| Trustee fees payable | | | 5,834 | | | | 6,432 | |
| Payable for distribution (12b-1) fees | | | 3,699 | | | | 15,819 | |
| Compliance officer fees payable | | | 1,697 | | | | 1,274 | |
| Accrued expenses and other liabilities | | | 24,132 | | | | 32,833 | |
| Total Liabilities | | | 48,882 | | | | 36,349,295 | |
| | | | | | | | | |
| Net Assets | | $ | 27,815,793 | | | $ | 92,560,271 | |
| | | | | | | | | |
| Net Assets: | | | | | | | | |
| Paid in capital | | $ | 22,576,433 | | | $ | 70,252,534 | |
| Accumulated earnings | | | 5,239,360 | | | | 22,307,737 | |
| Net Assets | | $ | 27,815,793 | | | $ | 92,560,271 | |
| | | | | | | | | |
| Net Asset Value Per Share | | | | | | | | |
| Class A | | | | | | | | |
| Net Assets | | $ | 12,256,848 | | | $ | 47,290,207 | |
| Shares of beneficial interest outstanding (no par value; unlimited shares authorized) | | | 200,651 | | | | 1,399,236 | |
| Net asset value and redemption price per share (a) | | $ | 61.09 | | | $ | 33.80 | |
| Offering price per share (maximum sales charge of 5.75%) | | $ | 64.82 | | | $ | 35.86 | |
| | | | | | | | | |
| Class C | | | | | | | | |
| Net Assets | | $ | 1,198,837 | | | $ | 2,154,172 | |
| Shares of beneficial interest outstanding | | | 21,861 | | | | 68,554 | |
| Net asset value/offering/redemption price per share (b) | | $ | 54.84 | | | $ | 31.42 | |
| | | | | | | | | |
| Class I | | | | | | | | |
| Net Assets | | $ | 14,360,045 | | | $ | 43,115,851 | |
| Shares of beneficial interest outstanding | | | 227,564 | | | | 1,260,734 | |
| Net asset value/offering/redemption price per share | | $ | 63.10 | | | $ | 34.20 | |
| | | | | | | | | |
| Class R6 | | | | | | | | |
| Net Assets | | $ | 63 | | | $ | 41 | |
| Shares of beneficial interest outstanding | | | 1 | | | | 1 | |
| Net asset value/offering/redemption price per share | | $ | 63.10 | (c) | | $ | 34.20 | (c) |
| (a) | Class A shares that are purchased at NAV in amounts of $500,000 or more may be assessed a 1.00% contingent deferred sales charge (“CDSC”), if they are redeemed within one year from the date of purchase. |
| | |
| (b) | Class C charges a maximum contingent deferred sales charge (“CDSC”) of 1.00% if you redeem Class C shares within one year after purchase. |
| | |
| (c) | Doesn’t recalculate due to rounding. |
See accompanying notes to financial statements.
| EASTERLY FUNDS |
| STATEMENTS OF OPERATIONS (Unaudited) |
| For the Six Months Ended August 31, 2024 |
| | | Easterly Snow | | | Easterly Snow | |
| | | Small Cap Value | | | Long/Short | |
| | | Fund | | | Opportunity Fund | |
| Investment Income: | | | | | | | | |
| Dividend income | | $ | 344,232 | | | $ | 1,223,873 | |
| Interest income | | | 45,646 | | | | 366,308 | |
| Less: Foreign withholding taxes | | | (2,498 | ) | | | (49,390 | ) |
| Total Investment Income | | | 387,380 | | | | 1,540,791 | |
| | | | | | | | | |
| Operating Expenses: | | | | | | | | |
| Management fees | | | 120,631 | | | | 380,749 | |
| Distribution (12b-1) fees | | | | | | | | |
| Class A Shares | | | 14,804 | | | | 60,538 | |
| Class C Shares | | | 6,035 | | | | 12,419 | |
| Dividend expenses | | | — | | | | 292,102 | |
| Legal fees | | | 38,376 | | | | 37,547 | |
| Shareholder servicing fees | | | 8,536 | | | | 35,642 | |
| Registration fees | | | 20,229 | | | | 22,928 | |
| Administration fees | | | 14,470 | | | | 38,886 | |
| Transfer Agent fees | | | 13,479 | | | | 14,231 | |
| Custodian fees | | | 12,408 | | | | 16,287 | |
| Trustees’ fees | | | 15,730 | | | | 15,319 | |
| Audit fees | | | 8,182 | | | | 9,688 | |
| Printing and postage expenses | | | 2,385 | | | | 7,003 | |
| Compliance officer fees | | | 4,033 | | | | 3,925 | |
| Insurance expenses | | | 1,080 | | | | 3,540 | |
| Miscellaneous expenses | | | 1,960 | | | | 1,910 | |
| Total Operating Expenses | | | 282,338 | | | | 952,714 | |
| Less: Fees waived | | | (100,162 | ) | | | — | |
| Net Operating Expenses | | | 182,176 | | | | 952,714 | |
| | | | | | | | | |
| Net Investment Income | | | 205,204 | | | | 588,077 | |
| | | | | | | | | |
| Realized and Unrealized Gain/(Loss) on Investments: | | | | | | | | |
| Net realized gain/(loss) from: | | | | | | | | |
| Investments and Foreign currency transactions | | | 1,114,946 | | | | 4,170,682 | |
| Short Sales | | | — | | | | — | |
| Options Purchased | | | — | | | | (35,545 | ) |
| Options Written | | | — | | | | 268,264 | |
| Net realized gain | | | 1,114,946 | | | | 4,403,401 | |
| | | | | | | | | |
| Net change in unrealized appreciation/(depreciation) on: | | | | | | | | |
| Investments and Foreign currency translations | | | 1,510,085 | | | | 2,232,726 | |
| Short Sales | | | — | | | | (4,088,370 | ) |
| Options Purchased | | | — | | | | 33,745 | |
| Options Written | | | — | | | | 875,369 | |
| Net change in unrealized appreciation/(depreciation) | | | 1,510,085 | | | | (946,530 | ) |
| | | | | | | | | |
| Net Realized and Unrealized Gain on Investments: | | | 2,625,031 | | | | 3,456,871 | |
| | | | | | | | | |
| Net Increase in Net Assets Resulting From Operations | | $ | 2,830,235 | | | $ | 4,044,948 | |
See accompanying notes to financial statements.
| EASTERLY FUNDS |
| STATEMENTS OF CHANGES IN NET ASSETS |
| | | Easterly Snow Small Cap Value Fund | | | Easterly Snow Long/Short Opportunity Fund | |
| | | Six Months Ended | | | Year Ended | | | Six Months Ended | | | Year Ended | |
| | | August 31, 2024 | | | February 29, 2024 | | | August 31, 2024 | | | February 29, 2024 | |
| | | (Unaudited) | | | | | | (Unaudited) | | | | |
| Operations: | | | | | | | | | | | | | | | | |
| Net investment income | | $ | 205,204 | | | $ | 223,003 | | | $ | 588,077 | | | $ | 1,653,705 | |
| Net realized gain on investments | | | 1,114,946 | | | | 473,839 | | | | 4,403,401 | | | | 386,368 | |
| Net change in unrealized appreciation/(depreciation) on investments | | | 1,510,085 | | | | 2,372,815 | | | | (946,530 | ) | | | 4,135,869 | |
| Net increase in net assets resulting from operations | | | 2,830,235 | | | | 3,069,657 | | | | 4,044,948 | | | | 6,175,942 | |
| | | | | | | | | | | | | | | | | |
| Distributions to Shareholders: | | | | | | | | | | | | | | | | |
| Total Distributions: | | | | | | | | | | | | | | | | |
| Class I | | | — | | | | (29,406 | ) | | | — | | | | (1,014,331 | ) |
| Class A | | | — | | | | (4,350 | ) | | | — | | | | (990,430 | ) |
| Class C | | | — | | | | — | | | | — | | | | (41,841 | ) |
| Class R6 | | | — | | | | (0 | ) * | | | — | | | | (1 | ) |
| Total Dividends and Distributions to Shareholders | | | — | | | | (33,756 | ) | | | — | | | | (2,046,603 | ) |
| | | | | | | | | | | | | | | | | |
| Share Transactions of Beneficial Interest: | | | | | | | | | | | | | | | | |
| Net proceeds from shares sold | | | | | | | | | | | | | | | | |
| Class I | | | 1,423,916 | | | | 2,370,958 | | | | 393,555 | | | | 946,681 | |
| Class A | | | 473,274 | | | | 109,541 | | | | 41,539 | | | | 748,670 | |
| Class C | | | 60,488 | | | | 29,061 | | | | — | | | | 25 | |
| Class R6 | | | — | | | | — | | | | — | | | | — | |
| Reinvestment of dividends and distributions | | | | | | | | | | | | | | | | |
| Class I | | | — | | | | 17,262 | | | | — | | | | 822,234 | |
| Class A | | | — | | | | 874 | | | | — | | | | 273,796 | |
| Class C | | | — | | | | — | | | | — | | | | 39,830 | |
| Class R6 | | | — | | | | 0 | * | | | — | | | | 1 | |
| Cost of shares redeemed | | | | | | | | | | | | | | | | |
| Class I | | | (658,347 | ) | | | (7,624,755 | ) | | | (4,586,904 | ) | | | (5,195,251 | ) |
| Class A | | | (427,596 | ) | | | (357,123 | ) | | | (3,704,527 | ) | | | (4,684,032 | ) |
| Class C | | | (169,057 | ) | | | (950,391 | ) | | | (621,401 | ) | | | (229,262 | ) |
| Class R6 | | | — | | | | — | | | | — | | | | — | |
| Net increase/(decrease) in net assets from share transactions of beneficial interest | | | 702,678 | | | | (6,404,573 | ) | | | (8,477,738 | ) | | | (7,277,308 | ) |
| | | | | | | | | | | | | | | | | |
| Total Increase/(Decrease) in Net Assets | | | 3,532,913 | | | | (3,368,672 | ) | | | (4,432,790 | ) | | | (3,147,969 | ) |
| | | | | | | | | | | | | | | | | |
| Net Assets: | | | | | | | | | | | | | | | | |
| Beginning of year | | | 24,282,880 | | | | 27,651,552 | | | | 96,993,061 | | | | 100,141,030 | |
| End of year | | $ | 27,815,793 | | | $ | 24,282,880 | | | $ | 92,560,271 | | | $ | 96,993,061 | |
| | | | | | | | | | | | | | | | | |
| Share Activity | | | | | | | | | | | | | | | | |
| Shares sold | | | | | | | | | | | | | | | | |
| Class I | | | 23,772 | | | | 49,446 | | | | 11,728 | | | | 31,284 | |
| Class A | | | 8,242 | | | | 2,151 | | | | 1,229 | | | | 24,492 | |
| Class C | | | 1,155 | | | | 645 | | | | — | | | | 1 | |
| Class R6 | | | — | | | | — | | | | — | | | | — | |
| Shares Reinvested | | | | | | | | | | | | | | | | |
| Class I | | | — | | | | 340 | | | | — | | | | 26,507 | |
| Class A | | | — | | | | 18 | | | | — | | | | 8,915 | |
| Class C | | | — | | | | — | | | | — | | | | 1,387 | |
| Class R6 | | | — | | | | 0 | ** | | | — | | | | 0 | ** |
| Shares redeemed | | | | | | | | | | | | | | | | |
| Class I | | | (11,110 | ) | | | (164,101 | ) | | | (133,943 | ) | | | (166,908 | ) |
| Class A | | | (7,546 | ) | | | (7,343 | ) | | | (111,114 | ) | | | (153,820 | ) |
| Class C | | | (3,172 | ) | | | (22,098 | ) | | | (19,874 | ) | | | (7,852 | ) |
| Class R6 | | | — | | | | — | | | | — | | | | — | |
| Net increase/(decrease) in shares of beneficial interest | | | 11,341 | | | | (140,942 | ) | | | (251,974 | ) | | | (235,994 | ) |
| * | Less than $1.00. |
| | |
| ** | Less than 1 share. |
See accompanying notes to financial statements.
| EASTERLY FUNDS |
| FINANCIAL HIGHLIGHTS (For a share outstanding throughout each year/period) |
| | | Easterly Snow Small Cap Value Fund | |
| | | Class A | |
| | | For the | | | For the | | | For the | | | For the | | | For the | | | For the | |
| | | Six Months Ended | | | Year Ended | | | Year Ended | | | Year Ended | | | Year Ended | | | Year Ended | |
| | | August 31, | | | February 29, | | | February 28, | | | February 28, | | | February 28, | | | February 29, | |
| | | 2024 | | | 2024 | | | 2023 | | | 2022 | | | 2021 | | | 2020 | |
| | | (Unaudited) | | | | | | | | | | | | | | | | |
| Net Asset Value, Beginning of Year/Period | | $ | 54.80 | | | $ | 47.21 | | | $ | 47.22 | | | $ | 44.01 | | | $ | 26.39 | | | $ | 31.57 | |
| Income (Loss) from Investment Operations: | | | | | | | | | | | | | | | | | | | | | | | | |
| Net investment income (loss) (1) | | | 0.42 | | | | 0.42 | | | | 0.10 | | | | (0.14 | ) | | | 0.09 | | | | 0.01 | |
| Net realized and unrealized gain (loss) | | | 5.87 | | | | 7.19 | | | | (0.11 | ) | | | 3.36 | | | | 17.53 | | | | (5.19 | ) |
| Total from investment operations | | | 6.29 | | | | 7.61 | | | | (0.01 | ) | | | 3.22 | | | | 17.62 | | | | (5.18 | ) |
| Dividends and Distributions: | | | | | | | | | | | | | | | | | | | | | | | | |
| Dividends from net investment income | | | — | | | | (0.02 | ) | | | — | | | | (0.01 | ) | | | — | | | | — | |
| Total dividends and distributions | | | — | | | | (0.02 | ) | | | — | | | | (0.01 | ) | | | — | | | | — | |
| Redemption Fees | | | — | | | | — | | | | — | | | | 0.00 | * | | | — | | | | — | |
| Net Asset Value, End of Year/Period | | $ | 61.09 | | | $ | 54.80 | | | $ | 47.21 | | | $ | 47.22 | | | $ | 44.01 | | | $ | 26.39 | |
| Total Return** | | | 11.48 | % (7) | | | 16.14 | % (6) | | | (0.02 | )% (6) | | | 7.32 | % | | | 66.81 | % | | | (16.41 | )% |
| Ratios and Supplemental Data: | | | | | | | | | | | | | | | | | | | | | | | | |
| Net assets, end of year/period (000s) | | $ | 12,257 | | | $ | 10,957 | | | $ | 9,683 | | | $ | 9,893 | | | $ | 9,223 | | | $ | 10,071 | |
| Ratio of gross operating expenses to average net assets including interest expense (2,3) | | | 2.24 | % (8) | | | 2.35 | % | | | 2.45 | % | | | 2.39 | % | | | 3.82 | % | | | 2.41 | % |
| Ratio of net operating expenses to average net assets including interest expense (2,3) | | | 1.50 | % (8) | | | 1.50 | % | | | 1.50 | % | | | 1.50 | % | | | 1.51 | % | | | 1.51 | % |
| Ratio of net investment income (loss) before expense reimbursement to average net assets (2,5) | | | 0.69 | % (8) | | | 0.03 | % | | | (0.71 | )% | | | (1.18 | )% | | | (2.00 | )% | | | (0.90 | )% |
| Ratio of net investment income (loss) after expense reimbursement to average net assets (2,5) | | | 1.43 | % (8) | | | 0.88 | % | | | 0.22 | % | | | (0.30 | )% | | | 0.30 | % | | | 0.02 | % |
| Portfolio Turnover Rate | | | 14 | % (7) | | | 55 | % | | | 38 | % | | | 62 | % | | | 86 | % | | | 44 | % |
| | | | | | | | | | | | | | | | | | | | | | | | | |
| | | Easterly Snow Small Cap Value Fund | |
| | | Class C | |
| | | For the | | | For the | | | For the | | | For the | | | For the | | | For the | |
| | | Six Months Ended | | | Year Ended | | | Year Ended | | | Year Ended | | | Year Ended | | | Year Ended | |
| | | August 31, | | | February 29, | | | February 28, | | | February 28, | | | February 28, | | | February 29, | |
| | | 2024 | | | 2024 | | | 2023 | | | 2022 | | | 2021 | | | 2020 | |
| | | (Unaudited) | | | | | | | | | | | | | | | | |
| Net Asset Value, Beginning of Year/Period | | $ | 49.38 | | | $ | 42.84 | | | $ | 43.17 | | | $ | 40.54 | | | $ | 24.48 | | | $ | 29.51 | |
| Income (Loss) from Investment Operations: | | | | | | | | | | | | | | | | | | | | | | | | |
| Net investment income (loss) (1) | | | 0.18 | | | | 0.05 | | | | (0.22 | ) | | | (0.46 | ) | | | (0.10 | ) | | | (0.21 | ) |
| Net realized and unrealized gain (loss) | | | 5.28 | | | | 6.49 | | | | (0.11 | ) | | | 3.09 | | | | 16.16 | | | | (4.82 | ) |
| Total from investment operations | | | 5.46 | | | | 6.54 | | | | (0.33 | ) | | | 2.63 | | | | 16.06 | | | | (5.03 | ) |
| Redemption Fees | | | — | | | | — | | | | — | | | | 0.00 | * | | | — | | | | — | |
| Net Asset Value, End of Year/Period | | $ | 54.84 | | | $ | 49.38 | | | $ | 42.84 | | | $ | 43.17 | | | $ | 40.54 | | | $ | 24.48 | |
| Total Return** | | | 11.06 | % (7) | | | 15.27 | % (6) | | | (0.76 | )% (6) | | | 6.49 | % | | | 65.60 | % | | | (17.05 | )% |
| Ratios and Supplemental Data: | | | | | | | | | | | | | | | | | | | | | | | | |
| Net assets, end of year/period (000s) | | $ | 1,199 | | | $ | 1,179 | | | $ | 1,942 | | | $ | 1,569 | | | $ | 1,746 | | | $ | 2,695 | |
| Ratio of gross operating expenses to average net assets including interest expense (2,4) | | | 2.99 | % (8) | | | 3.10 | % | | | 3.20 | % | | | 3.08 | % | | | 4.63 | % | | | 3.16 | % |
| Ratio of net operating expenses to average net assets including interest expense (2,4) | | | 2.25 | % (8) | | | 2.25 | % | | | 2.25 | % | | | 2.25 | % | | | 2.26 | % | | | 2.26 | % |
| Ratio of net investment income (loss) before expense reimbursement to average net assets (2,5) | | | (0.06 | )% (8) | | | (0.73 | )% | | | (1.50 | )% | | | (1.88 | )% | | | (2.80 | )% | | | (1.64 | )% |
| Ratio of net investment income (loss) after expense reimbursement to average net assets (2,5) | | | 0.68 | % (8) | | | 0.11 | % | | | (0.55 | )% | | | (1.05 | )% | | | (0.43 | )% | | | (0.73 | )% |
| Portfolio Turnover Rate | | | 14 | % (7) | | | 55 | % | | | 38 | % | | | 62 | % | | | 86 | % | | | 44 | % |
| * | Less than $0.005 cent per share. |
| | |
| ** | Assumes reinvestment of all dividends and distributions and does not assume the effects of any sales charges. Aggregate (not annualized) total return is shown for any period shorter than one year. Total return does not reflect the deduction of taxes that a shareholder would pay on distributions or on the redemption of shares. |
| | |
| (1) | Per share amounts calculated using the average shares method, which more appropriately presents the per share data for the year/period. |
| | |
| (2) | The ratios of expenses to average net assets and net investment income to average net assets do not reflect the expenses of the underlying investment companies in which the Fund invests. |
| | |
| (3) | Ratios to average net assets (excluding interest expense) |
| Expenses, before waiver and reimbursement | | | 2.24 | % (8) | | | 2.35 | % | | | 2.45 | % | | | 2.39 | % | | | 3.80 | % | | | 2.40 | % |
| Expenses, net waiver and reimbursement | | | 1.50 | % (8) | | | 1.50 | % | | | 1.50 | % | | | 1.50 | % | | | 1.50 | % | | | 1.50 | % |
| (4) | Ratios to average net assets (excluding interest expense) |
| Expenses, before waiver and reimbursement | | | 2.99 | % (8) | | | 3.10 | % | | | 3.20 | % | | | 3.08 | % | | | 4.62 | % | | | 3.15 | % |
| Expenses, net waiver and reimbursement | | | 2.25 | % (8) | | | 2.25 | % | | | 2.25 | % | | | 2.25 | % | | | 2.25 | % | | | 2.25 | % |
| (5) | Recognition of net investment income (loss) is affected by the timing and declaration of dividends by the underlying investment companies in which the Fund invests. |
| | |
| (6) | Includes adjustments in accordance with accounting principles generally accepted in the United States and, consequently, the net asset value for financial reporting purposes and the returns based upon those net asset values may differ from the net asset values and returns for shareholder transactions. |
| | |
| (7) | Not annualized. |
| | |
| (8) | Annualized for periods less than one year. |
See accompanying notes to financial statements.
| EASTERLY FUNDS |
| FINANCIAL HIGHLIGHTS (For a share outstanding throughout each year/period) |
| | | Easterly Snow Small Cap Value Fund | |
| | | Class I | |
| | | For the | | | For the | | | For the | | | For the | | | For the | | | For the | |
| | | Six Months Ended | | | Year Ended | | | Year Ended | | | Year Ended | | | Year Ended | | | Year Ended | |
| | | August 31, | | | February 29, | | | February 28, | | | February 28, | | | February 28, | | | February 29, | |
| | | 2024 | | | 2024 | | | 2023 | | | 2022 | | | 2021 | | | 2020 | |
| | | (Unaudited) | | | | | | | | | | | | | | | | |
| Net Asset Value, Beginning of Year/Period | | $ | 56.52 | | | $ | 48.68 | | | $ | 48.57 | | | $ | 45.23 | | | $ | 27.05 | | | $ | 32.28 | |
| Income (Loss) from Investment Operations: | | | | | | | | | | | | | | | | | | | | | | | | |
| Net investment income (loss) (1) | | | 0.53 | | | | 0.56 | | | | 0.20 | | | | (0.03 | ) | | | 0.15 | | | | 0.09 | |
| Net realized and unrealized gain (loss) | | | 6.05 | | | | 7.42 | | | | (0.09 | ) | | | 3.45 | | | | 18.03 | | | | (5.32 | ) |
| Total from investment operations | | | 6.58 | | | | 7.98 | | | | 0.11 | | | | 3.42 | | | | 18.18 | | | | (5.23 | ) |
| Dividends and Distributions: | | | | | | | | | | | | | | | | | | | | | | | | |
| Dividends from net investment income | | | — | | | | (0.14 | ) | | | — | | | | (0.08 | ) | | | — | | | | — | |
| Total dividends and distributions | | | — | | | | (0.14 | ) | | | — | | | | (0.08 | ) | | | — | | | | — | |
| Redemption Fees | | | — | | | | — | | | | — | | | | 0.00 | * | | | 0.00 | * | | | 0.00 | * |
| Net Asset Value, End of Year/Period | | $ | 63.10 | | | $ | 56.52 | | | $ | 48.68 | | | $ | 48.57 | | | $ | 45.23 | | | $ | 27.05 | |
| Total Return** | | | 11.64 | % (6) | | | 16.42 | % (8) | | | 0.23 | % (8) | | | 7.57 | % | | | 67.21 | % | | | (16.20 | )% |
| Ratios and Supplemental Data: | | | | | | | | | | | | | | | | | | | | | | | | |
| Net assets, end of year/period (000s) | | $ | 14,360 | | | $ | 12,147 | | | $ | 16,026 | | | $ | 10,779 | | | $ | 7,926 | | | $ | 7,679 | |
| Ratio of gross operating expenses to average net assets including interest expense (2,3) | | | 1.98 | % (7) | | | 2.09 | % | | | 2.20 | % | | | 2.14 | % | | | 3.58 | % | | | 2.16 | % |
| Ratio of net operating expenses to average net assets including interest expense (2,3) | | | 1.20 | % (7) | | | 1.25 | % | | | 1.25 | % | | | 1.25 | % | | | 1.26 | % | | | 1.26 | % |
| Ratio of net investment income (loss) before expense reimbursement to average net assets (2,5) | | | 0.97 | % (7) | | | 0.29 | % | | | (0.50 | )% | | | (0.95 | )% | | | (1.78 | )% | | | (0.63 | )% |
| Ratio of net investment income (loss) after expense reimbursement to average net assets (2,5) | | | 1.75 | % (7) | | | 1.13 | % | | | 0.45 | % | | | (0.07 | )% | | | 0.54 | % | | | 0.27 | % |
| Portfolio Turnover Rate | | | 14 | % (6) | | | 55 | % | | | 38 | % | | | 62 | % | | | 86 | % | | | 44 | % |
| | | | | | | | | | | | | | | | | | | | | | | | | |
| | | Easterly Snow Small Cap Value Fund | | | | | | | | | |
| | | Class R6*** | | | | | | | | | |
| | | For the | | | For the | | | For the | | | For the | | | | | | | | | |
| | | Six Months Ended | | | Year Ended | | | Year Ended | | | Period Ended | | | | | | | | | |
| | | August 31, | | | February 29, | | | February 28, | | | February 28, | | | | | | | | | |
| | | 2024 | | | 2024 | | | 2023 | | | 2022 | | | | | | | | | |
| | | (Unaudited) | | | | | | | | | | | | | | | | | | |
| Net Asset Value, Beginning of Year/Period | | $ | 56.53 | | | $ | 48.68 | | | $ | 48.57 | | | $ | 50.04 | | | | | | | | | |
| Income (Loss) from Investment Operations: | | | | | | | | | | | | | | | | | | | | | | | | |
| Net investment income (1) | | | 0.60 | | | | 0.55 | | | | 0.20 | | | | — | | | | | | | | | |
| Net realized and unrealized gain (loss) | | | 5.97 | | | | 7.44 | | | | (0.09 | ) | | | (1.39 | ) | | | | | | | | |
| Total from investment operations | | | 6.57 | | | | 7.99 | | | | 0.11 | | | | (1.39 | ) | | | | | | | | |
| Dividends and Distributions: | | | | | | | | | | | | | | | | | | | | | | | | |
| Dividends from net investment income | | | — | | | | (0.14 | ) | | | — | | | | (0.08 | ) | | | | | | | | |
| Total dividends and distributions | | | — | | | | (0.14 | ) | | | — | | | | (0.08 | ) | | | | | | | | |
| Net Asset Value, End of Year/Period | | $ | 63.10 | | | $ | 56.53 | | | $ | 48.68 | | | $ | 48.57 | | | | | | | | | |
| Total Return** | | | 11.62 | % (6) | | | 16.44 | % (8) | | | 0.23 | % (8) | | | (2.77 | )% (6) | | | | | | | | |
| Ratios and Supplemental Data: | | | | | | | | | | | | | | | | | | | | | | | | |
| Net assets, end of year/period (000s) | | $ | 0 | **** | | $ | 0 | **** | | $ | 0 | **** | | $ | 0 | **** | | | | | | | | |
| Ratio of gross operating expenses to average net assets excluding interest expense (2,4) | | | 1.98 | % (7) | | | 2.09 | % | | | 2.20 | % | | | 2.14 | % (7) | | | | | | | | |
| Ratio of net operating expenses to average net assets including interest expense (2,4) | | | 0.98 | % (7) | | | 1.00 | % | | | 1.00 | % | | | 1.00 | % (7) | | | | | | | | |
| Ratio of net investment income (loss) before expense reimbursement to average net assets (2,5) | | | 1.19 | % (7) | | | 2.11 | % | | | 1.65 | % | | | 1.25 | % (7) | | | | | | | | |
| Ratio of net investment income (loss) after expense reimbursement to average net assets (2,5) | | | 1.97 | % (7) | | | 2.14 | % | | | 0.45 | % | | | (0.02 | )% (7) | | | | | | | | |
| Portfolio Turnover Rate | | | 14 | % (6) | | | 55 | % | | | 38 | % | | | 62 | % (6) | | | | | | | | |
| * | Less than $0.005 cent per share. |
| | |
| ** | Assumes reinvestment of all dividends and distributions and does not assume the effects of any sales charges. Aggregate (not annualized) total return is shown for any period shorter than one year. Total return does not reflect the deduction of taxes that a shareholder would pay on distributions or on the redemption of shares. |
| | |
| *** | Class R6 commenced operations on November 4, 2021. |
| | |
| **** | Less than 1,000. |
| | |
| (1) | Per share amounts calculated using the average shares method, which more appropriately presents the per share data for the year/period. |
| | |
| (2) | The ratios of expenses to average net assets and net investment income to average net assets do not reflect the expenses of the underlying investment companies in which the Fund invests. |
| | |
| (3) | Ratios to average net assets (excluding interest expense) |
| Expenses, before waiver and reimbursement | | | 1.98 | % (7) | | | 2.09 | % | | | 2.20 | % | | | 2.14 | % | | | 3.57 | % | | | 2.15 | % |
| Expenses, net waiver and reimbursement | | | 1.20 | % (7) | | | 1.25 | % | | | 1.25 | % | | | 1.25 | % | | | 1.25 | % | | | 1.25 | % |
| (4) | Ratios to average net assets (excluding interest expense) |
| Expenses, before waiver and reimbursement | | | 1.98 | % (7) | | | 2.09 | % | | | 2.20 | % | | | 2.14 | % (7) | | | | | | | | |
| Expenses, net waiver and reimbursement | | | 0.98 | % (7) | | | 1.00 | % | | | 1.00 | % | | | 1.00 | % (7) | | | | | | | | |
| (5) | Recognition of net investment income (loss) is affected by the timing and declaration of dividends by the underlying investment companies in which the Fund invests. |
| | |
| (6) | Not annualized. |
| | |
| (7) | Annualized for periods less than one year. |
| | |
| (8) | Includes adjustments in accordance with accounting principles generally accepted in the United States and, consequently, the net asset value for financial reporting purposes and the returns based upon those net asset values may differ from the net asset values and returns for shareholder transactions. |
See accompanying notes to financial statements.
| EASTERLY FUNDS |
| FINANCIAL HIGHLIGHTS (For a share outstanding throughout each year/period) |
| | | Easterly Snow Long/Short Opportunity Fund | |
| | | Class A | |
| | | For the | | | For the | | | For the | | | For the | | | For the | | | For the | |
| | | Six Months Ended | | | Year Ended | | | Year Ended | | | Year Ended | | | Year Ended | | | Year Ended | |
| | | August 31, | | | February 29, | | | February 28, | | | February 28, | | | February 28, | | | February 29, | |
| | | 2024 | | | 2024 | | | 2023 | | | 2022 | | | 2021 | | | 2020 | |
| | | (Unaudited) | | | | | | | | | | | | | | | | |
| Net Asset Value, Beginning of Year/Period | | $ | 32.45 | | | $ | 31.04 | | | $ | 33.38 | | | $ | 31.48 | | | $ | 25.42 | | | $ | 26.07 | |
| Income (Loss) from Investment Operations: | | | | | | | | | | | | | | | | | | | | | | | | |
| Net investment income (1) | | | 0.19 | | | | 0.51 | | | | 0.36 | | | | 0.17 | | | | 0.16 | | | | 0.27 | |
| Net realized and unrealized gain (loss) | | | 1.16 | | | | 1.57 | | | | (0.66 | ) | | | 4.63 | | | | 6.32 | | | | (0.44 | ) |
| Total from investment operations | | | 1.35 | | | | 2.08 | | | | (0.30 | ) | | | 4.80 | | | | 6.48 | | | | (0.17 | ) |
| Dividends and Distributions: | | | | | | | | | | | | | | | | | | | | | | | | |
| Dividends from net investment income | | | — | | | | (0.62 | ) | | | (0.16 | ) | | | (0.34 | ) | | | (0.42 | ) | | | (0.48 | ) |
| Distributions from realized gains | | | — | | | | (0.05 | ) | | | (1.88 | ) | | | (2.56 | ) | | | — | | | | — | |
| Total dividends and distributions | | | — | | | | (0.67 | ) | | | (2.04 | ) | | | (2.90 | ) | | | (0.42 | ) | | | (0.48 | ) |
| Net Asset Value, End of Year/Period | | $ | 33.80 | | | $ | 32.45 | | | $ | 31.04 | | | $ | 33.38 | | | $ | 31.48 | | | $ | 25.42 | |
| Total Return* | | | 4.16 | % (7) | | | 6.80 | % (6) | | | (0.62 | )% (6) | | | 15.40 | % | | | 25.71 | % | | | (0.85 | )% |
| Ratios and Supplemental Data: | | | | | | | | | | | | | | | | | | | | | | | | |
| Net assets, end of year/period (000s) | | $ | 47,290 | | | $ | 48,966 | | | $ | 50,585 | | | $ | 52,102 | | | $ | 46,551 | | | $ | 51,478 | |
| Ratio of gross operating expenses to average net assets including interest expense (2,3) | | | 2.09 | % (8) | | | 1.61 | % | | | 1.61 | % | | | 1.65 | % | | | 2.04 | % | | | 1.70 | % |
| Ratio of net operating expenses to average net assets including interest expense (2,3) | | | 2.09 | % (8) | | | 1.61 | % | | | 1.58 | % | | | 1.68 | % | | | 2.00 | % | | | 1.70 | % |
| Ratio of net investment income before expense reimbursement to average net assets (2,5) | | | 1.13 | % (8) | | | 1.64 | % | | | 1.11 | % | | | 0.51 | % | | | 0.59 | % | | | 0.98 | % |
| Ratio of net investment income (loss) after expense reimbursement to average net assets (2,5) | | | 1.13 | % (8) | | | 1.64 | % | | | 1.14 | % | | | 0.49 | % | | | 0.63 | % | | | 0.98 | % |
| Portfolio Turnover Rate | | | 21 | % (7) | | | 73 | % | | | 58 | % | | | 51 | % | | | 74 | % | | | 54 | % |
| | | | | | | | | | | | | | | | | | | | | | | | | |
| | | Easterly Snow Long/Short Opportunity Fund | |
| | | Class C | |
| | | For the | | | For the | | | For the | | | For the | | | For the | | | For the | |
| | | Six Months Ended | | | Year Ended | | | Year Ended | | | Year Ended | | | Year Ended | | | Year Ended | |
| | | August 31, | | | February 29, | | | February 28, | | | February 28, | | | February 28, | | | February 29, | |
| | | 2024 | | | 2024 | | | 2023 | | | 2022 | | | 2021 | | | 2020 | |
| | | (Unaudited) | | | | | | | | | | | | | | | | |
| Net Asset Value, Beginning of Year/Period | | $ | 30.28 | | | $ | 29.02 | | | $ | 31.41 | | | $ | 29.75 | | | $ | 23.85 | | | $ | 24.36 | |
| Income (Loss) from Investment Operations: | | | | | | | | | | | | | | | | | | | | | | | | |
| Net investment income (loss) (1) | | | 0.06 | | | | 0.26 | | | | 0.12 | | | | (0.06 | ) | | | (0.03 | ) | | | 0.07 | |
| Net realized and unrealized gain (loss) | | | 1.08 | | | | 1.46 | | | | (0.63 | ) | | | 4.38 | | | | 5.93 | | | | (0.44 | ) |
| Total from investment operations | | | 1.14 | | | | 1.72 | | | | (0.51 | ) | | | 4.32 | | | | 5.90 | | | | (0.37 | ) |
| Dividends and Distributions: | | | | | | | | | | | | | | | | | | | | | | | | |
| Dividends from net investment income | | | — | | | | (0.41 | ) | | | — | | | | (0.10 | ) | | | — | | | | (0.14 | ) |
| Distributions from realized gains | | | — | | | | (0.05 | ) | | | (1.88 | ) | | | (2.56 | ) | | | — | | | | — | |
| Total dividends and distributions | | | — | | | | (0.46 | ) | | | (1.88 | ) | | | (2.66 | ) | | | — | | | | (0.14 | ) |
| Net Asset Value, End of Year/Period | | $ | 31.42 | | | $ | 30.28 | | | $ | 29.02 | | | $ | 31.41 | | | $ | 29.75 | | | $ | 23.85 | |
| Total Return* | | | 3.76 | % (7) | | | 5.99 | % | | | (1.37 | )% | | | 14.64 | % | | | 24.74 | % | | | (1.58 | )% |
| Ratios and Supplemental Data: | | | | | | | | | | | | | | | | | | | | | | | | |
| Net assets, end of year/period (000s) | | $ | 2,154 | | | $ | 2,678 | | | $ | 2,754 | | | $ | 3,158 | | | $ | 3,938 | | | $ | 9,744 | |
| Ratio of gross operating expenses to average net assets including interest expense (2,4) | | | 2.83 | % (8) | | | 2.36 | % | | | 2.35 | % | | | 2.32 | % | | | 2.79 | % | | | 2.45 | % |
| Ratio of net operating expenses to average net assets including interest expense (2,4) | | | 2.83 | % (8) | | | 2.36 | % | | | 2.32 | % | | | 2.35 | % | | | 2.75 | % | | | 2.45 | % |
| Ratio of net investment income before expense reimbursement to average net assets (2,5) | | | 0.39 | % (8) | | | 0.90 | % | | | 0.36 | % | | | (0.16 | )% | | | (0.18 | )% | | | 0.25 | % |
| Ratio of net investment income after expense reimbursement to average net assets (2,5) | | | 0.39 | % (8) | | | 0.90 | % | | | 0.39 | % | | | (0.18 | )% | | | (0.14 | )% | | | 0.25 | % |
| Portfolio Turnover Rate | | | 21 | % (7) | | | 73 | % | | | 58 | % | | | 51 | % | | | 74 | % | | | 54 | % |
| * | Assumes reinvestment of all dividends and distributions and does not assume the effects of any sales charges. Aggregate (not annualized) total return is shown for any period shorter than one year. Total return does not reflect the deduction of taxes that a shareholder would pay on distributions or on the redemption of shares. |
| | |
| (1) | Per share amounts calculated using the average shares method, which more appropriately presents the per share data for the year/period. |
| | |
| (2) | The ratios of expenses to average net assets and net investment income to average net assets do not reflect the expenses of the underlying investment companies in which the Fund invests. |
| | |
| (3) | Ratios to average net assets (excluding interest expense) |
| Expenses, before waiver and reimbursement | | | 1.48 | % (8) | | | 1.43 | % | | | 1.48 | % | | | 1.45 | % | | | 1.59 | % | | | 1.41 | % |
| Expenses, net waiver and reimbursement | | | 1.48 | % (8) | | | 1.43 | % | | | 1.45 | % | | | 1.48 | % | | | 1.55 | % | | | 1.41 | % |
| (4) | Ratios to average net assets (excluding interest expense) |
| Expenses, before waiver and reimbursement | | | 2.22 | % (8) | | | 2.18 | % | | | 2.22 | % | | | 2.10 | % | | | 2.34 | % | | | 2.16 | % |
| Expenses, net waiver and reimbursement | | | 2.22 | % (8) | | | 2.18 | % | | | 2.19 | % | | | 2.13 | % | | | 2.30 | % | | | 2.16 | % |
| (5) | Recognition of net investment income (loss) is affected by the timing and declaration of dividends by the underlying investment companies in which the Fund invests. |
| | |
| (6) | Includes adjustments in accordance with accounting principles generally accepted in the United States and, consequently, the net asset value for financial reporting purposes and the returns based upon those net asset values may differ from the net asset values and returns for shareholder transactions. |
| | |
| (7) | Not annualized. |
| | |
| (8) | Annualized for periods less than one year. |
See accompanying notes to financial statements.
| EASTERLY FUNDS |
| FINANCIAL HIGHLIGHTS (For a share outstanding throughout each year/period) |
| | | Easterly Snow Long/Short Opportunity Fund | |
| | | Class I | |
| | | For the | | | For the | | | For the | | | For the | | | For the | | | For the | |
| | | Six Months Ended | | | Year Ended | | | Year Ended | | | Year Ended | | | Year Ended | | | Year Ended | |
| | | August 31, | | | February 29, | | | February 28, | | | February 28, | | | February 28, | | | February 29, | |
| | | 2024 | | | 2024 | | | 2023 | | | 2022 | | | 2021 | | | 2020 | |
| | | (Unaudited) | | | | | | | | | | | | | | | | |
| Net Asset Value, Beginning of Year/Period | | $ | 32.79 | | | $ | 31.37 | | | $ | 33.71 | | | $ | 31.76 | | | $ | 25.68 | | | $ | 26.34 | |
| Income (Loss) from Investment Operations: | | | | | | | | | | | | | | | | | | | | | | | | |
| Net investment income (1) | | | 0.24 | | | | 0.59 | | | | 0.44 | | | | 0.25 | | | | 0.22 | | | | 0.34 | |
| Net realized and unrealized gain (loss) | | | 1.17 | | | | 1.58 | | | | (0.66 | ) | | | 4.69 | | | | 6.39 | | | | (0.44 | ) |
| Total from investment operations | | | 1.41 | | | | 2.17 | | | | (0.22 | ) | | | 4.94 | | | | 6.61 | | | | (0.10 | ) |
| Dividends and Distributions: | | | | | | | | | | | | | | | | | | | | | | | | |
| Dividends from net investment income | | | — | | | | (0.70 | ) | | | (0.24 | ) | | | (0.43 | ) | | | (0.53 | ) | | | (0.56 | ) |
| Distributions from realized gains | | | — | | | | (0.05 | ) | | | (1.88 | ) | | | (2.56 | ) | | | — | | | | — | |
| Total dividends and distributions | | | — | | | | (0.75 | ) | | | (2.12 | ) | | | (2.99 | ) | | | (0.53 | ) | | | (0.56 | ) |
| Net Asset Value, End of Year/Period | | $ | 34.20 | | | $ | 32.79 | | | $ | 31.37 | | | $ | 33.71 | | | $ | 31.76 | | | $ | 25.68 | |
| Total Return* | | | 4.30 | % (5) | | | 7.03 | % (8) | | | (0.36 | )% (8) | | | 15.69 | % | | | 26.00 | % | | | (0.60 | )% |
| Ratios and Supplemental Data: | | | | | | | | | | | | | | | | | | | | | | | | |
| Net assets, end of year/period (000s) | | $ | 43,116 | | | $ | 45,349 | | | $ | 46,802 | | | $ | 48,198 | | | $ | 45,372 | | | $ | 44,559 | |
| Ratio of gross operating expenses to average net assets including interest expense (2,3) | | | 1.84 | % (6) | | | 1.36 | % | | | 1.36 | % | | | 1.41 | % | | | 1.79 | % | | | 1.45 | % |
| Ratio of net operating expenses to average net assets including interest expense (2,3) | | | 1.84 | % (6) | | | 1.36 | % | | | 1.33 | % | | | 1.44 | % | | | 1.75 | % | | | 1.45 | % |
| Ratio of net investment income (loss) before expense reimbursement to average net assets (2,7) | | | 1.39 | % (6) | | | 1.90 | % | | | 1.36 | % | | | 0.75 | % | | | 0.79 | % | | | 1.24 | % |
| Ratio of net investment income (loss) after expense reimbursement to average net assets (2,7) | | | 1.39 | % (6) | | | 1.90 | % | | | 1.39 | % | | | 0.72 | % | | | 0.83 | % | | | 1.24 | % |
| Portfolio Turnover Rate | | | 21 | % (5) | | | 73 | % | | | 58 | % | | | 51 | % | | | 74 | % | | | 54 | % |
| | | | | | | | | | | | | | | | | | | | | | | | | |
| | | Easterly Snow Long/Short Opportunity Fund | | | | | | | | | |
| | | Class R6** | | | | | | | | | |
| | | For the | | | For the | | | For the | | | For the | | | | | | | | | |
| | | Six Months Ended | | | Year Ended | | | Year Ended | | | Period Ended | | | | | | | | | |
| | | August 31, | | | February 29, | | | February 28, | | | February 28, | | | | | | | | | |
| | | 2024 | | | 2024 | | | 2023 | | | 2022 | | | | | | | | | |
| | | (Unaudited) | | | | | | | | | | | | | | | | | | |
| Net Asset Value, Beginning of Year/Period | | $ | 32.80 | | | $ | 31.37 | | | $ | 33.71 | | | $ | 35.83 | | | | | | | | | |
| Income (Loss) from Investment Operations: | | | | | | | | | | | | | | | | | | | | | | | | |
| Net investment income (1) | | | 0.22 | | | | 0.59 | | | | 0.44 | | | | 0.12 | | | | | | | | | |
| Net realized and unrealized gain (loss) | | | 1.18 | | | | 1.59 | | | | (0.66 | ) | | | 0.75 | | | | | | | | | |
| Total from investment operations | | | 1.40 | | | | 2.18 | | | | (0.22 | ) | | | 0.87 | | | | | | | | | |
| Dividends and Distributions: | | | | | | | | | | | | | | | | | | | | | | | | |
| Dividends from net investment income | | | — | | | | (0.70 | ) | | | (0.24 | ) | | | (0.43 | ) | | | | | | | | |
| Distributions from realized gains | | | — | | | | (0.05 | ) | | | (1.88 | ) | | | (2.56 | ) | | | | | | | | |
| Total dividends and distributions | | | — | | | | (0.75 | ) | | | (2.12 | ) | | | (2.99 | ) | | | | | | | | |
| Net Asset Value, End of Year/Period | | $ | 34.20 | | | $ | 32.80 | | | $ | 31.37 | | | $ | 33.71 | | | | | | | | | |
| Total Return* | | | 4.27 | % (5) | | | 7.07 | % (8) | | | (0.36 | )% (8) | | | 2.55 | % (5) | | | | | | | | |
| Ratios and Supplemental Data: | | | | | | | | | | | | | | | | | | | | | | | | |
| Net assets, end of year/period (000s) | | $ | 0 | *** | | $ | 0 | *** | | $ | 0 | *** | | $ | 0 | *** | | | | | | | | |
| Ratio of gross operating expenses to average net assets including interest expense (2,4) | | | 1.84 | % (6) | | | 1.36 | % | | | 1.36 | % | | | 1.41 | % (6) | | | | | | | | |
| Ratio of net operating expenses to average net assets including interest expense (2,4) | | | 1.61 | % (6) | | | 1.18 | % | | | 1.13 | % | | | 1.23 | % (6) | | | | | | | | |
| Ratio of net investment income (loss) before expense reimbursement to average net assets (2,7) | | | 1.39 | % (6) | | | 2.54 | % | | | 2.25 | % | | | 1.49 | % (6) | | | | | | | | |
| Ratio of net investment income after expense reimbursement to average net assets (2,7) | | | 1.62 | % (6) | | | 2.54 | % | | | 1.77 | % | | | 1.05 | % (6) | | | | | | | | |
| Portfolio Turnover Rate | | | 21 | % (5) | | | 73 | % | | | 58 | % | | | 51 | % (5) | | | | | | | | |
| * | Assumes reinvestment of all dividends and distributions and does not assume the effects of any sales charges. Aggregate (not annualized) total return is shown for any period shorter than one year. Total return does not reflect the deduction of taxes that a shareholder would pay on distributions or on the redemption of shares. |
| | |
| ** | R6 commenced operations on November 4, 2021. |
| | |
| *** | Less than 1,000. |
| | |
| (1) | Per share amounts calculated using the average shares method, which more appropriately presents the per share data for the year/period. |
| | |
| (2) | The ratios of expenses to average net assets and net investment income to average net assets do not reflect the expenses of the underlying investment companies in which the Fund invests. |
| | |
| (3) | Ratios to average net assets (excluding interest expense) |
| Expenses, before waiver and reimbursement | | | 1.23 | % (6) | | | 1.18 | % | | | 1.23 | % | | | 1.18 | % | | | 1.34 | % | | | 1.16 | % |
| Expenses, net waiver and reimbursement | | | 1.23 | % (6) | | | 1.18 | % | | | 1.20 | % | | | 1.21 | % | | | 1.30 | % | | | 1.16 | % |
| (4) | Ratios to average net assets (excluding interest expense) |
| Expenses, before waiver and reimbursement | | | 1.23 | % (6) | | | 1.18 | % | | | 1.23 | % | | | 1.18 | % (6) | | | | | | | | |
| Expenses, net waiver and reimbursement | | | 1.00 | % (6) | | | 1.00 | % | | | 1.00 | % | | | 1.00 | % (6) | | | | | | | | |
| (5) | Not annualized. |
| | |
| (6) | Annualized for periods less than one year. |
| | |
| (7) | Recognition of net investment income (loss) by the Fund is affected by the timing of the declaration of dividends by the underlying investment companies in which the Fund invests. |
| | |
| (8) | Includes adjustments in accordance with accounting principles generally accepted in the United States and, consequently, the net asset value for financial reporting purposes and the returns based upon those net asset values may differ from the net asset values and returns for shareholder transactions. |
See accompanying notes to financial statements.
| EASTERLY FUNDS |
| NOTES TO FINANCIAL STATEMENTS |
| Six Months Ended August 31, 2024 (Unaudited) |
| 1. | ORGANIZATION AND SIGNIFICANT ACCOUNTING POLICIES |
James Alpha Fund Trust dba Easterly Funds Trust (the “Trust”) was organized on September 21, 2020, as a Delaware Statutory Trust and is registered under the Investment Company Act of 1940, as amended, as an open-end management investment company. The Trust consists of five series. These financial statements include the following two diversified series:
| Fund Name | Investment Objective |
| Easterly Snow Small Cap Value Fund | Long Term Capital Appreciation |
| Easterly Snow Long/Short Opportunity Fund | Long Term Capital Appreciation and protection of investment principal |
Currently, Easterly Snow Small Cap Value Fund and Easterly Snow Long/Short Opportunity Fund offers Class A, Class C, Class I and Class R6 shares. Class A shares are offered at net asset value plus a maximum sales load of 5.75%. Purchases of $500,000 or more of Class A shares may be subject to a contingent deferred sales charge (“CDSC”) on shares redeemed during the first year after purchase of up to 1.00%. Class C shares are offered subject to a CDSC of 1.00%. Class I and Class R6 shares are offered at net asset value. Each class represents an interest in the same assets of the applicable Fund, and the classes are identical except for differences in their sales charge structures, ongoing services, and distribution charges. Class R6 shares are only available to certain qualified investors and the minimum initial investment will vary depending on the type of qualified investor. All classes of shares have equal voting privileges except that each class has exclusive voting rights with respect to its service and/or distribution plans.
The following is a summary of significant accounting policies followed by the Funds in preparation of its financial statements. These policies are in conformity with accounting principles generally accepted in the United States of America (“GAAP”). The preparation of financial statements in conformity with GAAP requires management to make estimates and assumptions that affect the reported amounts of assets and liabilities and disclosure of contingent assets and liabilities at the date of the financial statements and the reported amounts of increases and decreases in net assets from operations during the reporting period. Actual results could differ from those estimates. Each Fund is an investment company and accordingly follows the investment company accounting and reporting guidance of the Financial Accounting Standards Board (FASB) Accounting Standard Codification Topic 946 “Financial Services – Investment Companies”.
(a) Valuation of Investments
Investment securities listed on a national securities exchange are valued at the last reported sale price on the valuation date. NASDAQ traded securities are valued at the NASDAQ Official Closing Price (NOCP). If there are no such reported sales, the securities are valued at the mean between current bid and ask. Short-term debt securities having a remaining maturity of sixty days or less may be valued at amortized cost or amortized value, which approximates market value. Options listed on a securities exchange or board of trade for which market quotations are readily available shall be valued at the last quoted sales price or, in the absence of a sale, at the mean between the last bid and ask price. Options not listed on a securities exchange or board of trade for which over-the-counter market quotations are readily available shall be valued at the mean of the current bid and asked prices. Debt securities may be valued at prices supplied by the Fund’s pricing services based on broker or dealer supplied valuations or matrix pricing, a method of valuing securities by reference to the value of other securities with similar characteristics, such as rating, interest rate and maturity. Any securities or other assets for which market quotations are not readily available are valued at their fair value as determined in good faith under procedures established by the Board of Trustees (the “Board”). There is no single standard for determining the fair value of such securities. Rather, in determining the fair value of a security, the board-appointed Valuation Designee shall take into account the relevant factors and surrounding circumstances, a few of which may include: (i) the nature and pricing history (if any) of the security; (ii) whether any dealer quotations for the security are available; and (iii) possible valuation methodologies that could be used to determine the fair value of a security.
Valuation of Fund of Funds – The Funds may invest in portfolios of open-end or closed-end investment companies (the “Underlying Funds”). The Underlying Funds value securities in their portfolios for which market quotations are readily available at their market values (generally the last reported sale price) and all other securities and assets at their fair value based upon the methods established by the board of directors of the Underlying Funds.
Open-end investment companies are valued at their respective net asset values as reported by such investment companies. The shares of many closed-end investment companies, after their initial public offering, frequently trade at a price per share, which is different than the net asset value per share. The difference represents a market premium or market discount of such shares. There can be no assurances that the market discount or market premium on shares of any closed-end investment company purchased by the Funds will not change.
| EASTERLY FUNDS |
| NOTES TO FINANCIAL STATEMENTS |
| Six Months Ended August 31, 2024 (Unaudited) (Continued) |
The Funds utilize various methods to measure the fair value of most of its investments on a recurring basis. GAAP establishes a hierarchy that prioritizes inputs to valuation methods. The three levels of input are:
Level 1 – Unadjusted quoted prices in active markets for identical assets and liabilities that the Funds have the ability to access.
Level 2 – Observable inputs other than quoted prices included in level 1 that are observable for the asset or liability, either directly or indirectly. These inputs may include quoted prices for the identical instrument on an inactive market, prices for similar instruments, interest rates, prepayment speeds, credit risk, yield curves, default rates and similar data.
Level 3 – Unobservable inputs for the asset or liability, to the extent relevant observable inputs are not available, representing the Funds’ own assumptions about the assumptions a market participant would use in valuing the asset or liability, and would be based on the best information available.
The availability of observable inputs can vary from security to security and is affected by a wide variety of factors, including, for example, the type of security, whether the security is new and not yet established in the marketplace, the liquidity of markets, and other characteristics particular to the security. To the extent that valuation is based on models or inputs that are less observable or unobservable in the market, the determination of fair value requires more judgment. Accordingly, the degree of judgment exercised in determining fair value is greatest for instruments categorized in Level 3.
The inputs used to measure fair value may fall into different levels of the fair value hierarchy. In such cases, for disclosure purposes, the level in the fair value hierarchy within which the fair value measurement falls in its entirety, is determined based on the lowest level input that is significant to the fair value measurement in its entirety.
The inputs or methodology used for valuing securities are not necessarily an indication of the risk associated with investing in those securities. The following tables summarize the inputs used as of August 31, 2024, for the Fund’ assets and liabilities measured at fair value:
| Small Cap Value | |
| | | | | | | | | | | | | |
| Assets* | | Level 1 | | | Level 2 | | | Level 3 | | | Total | |
| Common Stocks | | $ | 25,945,562 | | | $ | — | | | $ | — | | | $ | 25,945,562 | |
| Total | | $ | 25,945,562 | | | $ | — | | | $ | — | | | $ | 25,945,562 | |
| | | | | | | | | | | | | | | | | |
| Long/Short Opportunity | |
| | | | | | | | | | | | | |
| Assets* | | Level 1 | | | Level 2 | | | Level 3 | | | Total | |
| Common Stocks | | $ | 102,787,921 | | | $ | — | | | $ | — | | | $ | 102,787,921 | |
| Exchange Traded Funds | | | 1,944,531 | | | | — | | | | — | | | | 1,944,531 | |
| Corporate Bonds | | | — | | | | 2,792,070 | | | | — | | | | 2,792,070 | |
| Total Assets | | $ | 104,732,452 | | | $ | 2,792,070 | | | $ | — | | | $ | 107,524,522 | |
| Liability Derivatives | | | | | | | | | | | | | | | | |
| Call Options Written | | $ | — | | | $ | 1,127,363 | | | $ | — | | | $ | 1,127,363 | |
| Put Options Written | | | — | | | | 102,695 | | | | — | | | | 102,695 | |
| Common Stocks | | | 7,645,948 | | | | — | | | | — | | | | 7,645,948 | |
| Exchange Traded Funds | | | 27,348,258 | | | | — | | | | — | | | | 27,348,258 | |
| Total Liabilities | | $ | 34,994,206 | | | $ | 1,230,058 | | | $ | — | | | $ | 36,224,264 | |
There were no level 3 securities held during the period.
| * | Refer to the Schedules of Investments for industry or category classifications. |
It is each Fund’s policy to continue to qualify as a regulated investment company by complying with the provisions of the Internal Revenue Code that are applicable to regulated investment companies and to distribute substantially all of its taxable income and net realized gains to shareholders. Therefore, no federal income tax provision is required.
The Funds recognize the tax benefits of uncertain tax positions only when the position is “more likely than not” to be sustained assuming examination by tax authorities. Management has analyzed the Fund’s tax positions and has concluded that no liability for
| EASTERLY FUNDS |
| NOTES TO FINANCIAL STATEMENTS |
| Six Months Ended August 31, 2024 (Unaudited) (Continued) |
unrecognized tax benefits should be recorded related to uncertain tax positions taken on returns filed for open tax years ended February 28, 2022 through February 29, 2024 or expected to be taken in the Funds’ February 28, 2025 year-end tax returns. The Funds identify its major tax jurisdictions as U.S. Federal, New York and foreign jurisdictions where the Funds make significant investments. The Funds recognize interest and penalties, if any, related to unrecognized tax benefits as income tax expense in the Statements of Operations. During the six months ended August 31, 2024, the Funds did not incur any interest or penalties.
(c) Security Transactions and Other Income
Security transactions are reflected for financial reporting purposes as of the trade date. Dividend income is recognized on the ex-dividend date, and interest income is recognized on an accrual basis including premium amortized and discount accreted. Realized gains or losses from sales of securities are determined by comparing the identified cost of the security lot sold with the net sales proceeds. Withholding taxes on foreign dividends have been provided for in accordance with the Trust’s understanding of the applicable country’s tax rules and rates.
(d) Dividends and Distributions
The following table summarizes each Fund’s intended dividend and capital gain declaration policy:
| | | Income | | Capital |
| Fund | | Dividends | | Gains |
| Easterly Snow Small Cap Value | | Annually | | Annually |
| Easterly Snow Long/Short Opportunity | | Annually | | Annually |
Each Fund records dividends and distributions to its shareholders on the ex-dividend date. The amount of dividends and distributions from net investment income and net realized gains are determined in accordance with federal income tax regulations, which may differ from GAAP. These “book-tax” differences are either permanent or temporary in nature. To the extent these differences are permanent in nature, such amounts are reclassified within the net asset accounts based on their federal tax-basis treatment; temporary differences do not require reclassification. To the extent dividends and distributions exceed current and accumulated earnings and profits for federal income tax purposes, they are reported as distributions of paid-in-surplus or tax return of capital. These reclassifications have no effect on net assets, results from operations or net asset value per share of each Fund.
(e) Allocation of Expenses
Expenses of the Trust that are directly identifiable to a specific fund are charged to that fund. Expenses, which are not readily identifiable to a specific fund, are allocated in such a manner as deemed equitable, taking into consideration the nature and type of expense and the relative sizes of the funds in the Trust.
(f) Indemnification
The Trust indemnifies its Officers and Trustees for certain liabilities that may arise from the performance of their duties to the Trust. Additionally, in the normal course of business, the Funds enter into contracts that contain a variety of representations and warranties and which provide general indemnities. The Funds’ maximum exposure under these arrangements is unknown, as this would involve future claims that may be made against the Funds that have not yet occurred. However, based on experience, the risk of loss due to these warranties and indemnities appears to be remote.
(g) Other
The preparation of the financial statements in accordance with accounting principles generally accepted in the United States of America requires management to make estimates and assumptions that affect the reported amounts and disclosures in the financial statements. Actual results could differ from those estimates.
Foreign currency. Investment securities and other assets and liabilities denominated in foreign currencies are translated into U.S. dollar amounts at the date of valuation. Purchases and sales of investment securities and income and expense items denominated in foreign currencies are translated into U.S. dollar amounts on the respective dates of such transactions. The Trust does not isolate that portion of the results of operations resulting from changes in foreign exchange rates on investments from the fluctuations arising from
| EASTERLY FUNDS |
| NOTES TO FINANCIAL STATEMENTS |
| Six Months Ended August 31, 2024 (Unaudited) (Continued) |
changes in market prices of securities held. Such fluctuations are included with the net realized and unrealized gain or loss from investments.
Reported net realized foreign exchange gains or losses arise from sales of foreign currencies, currency gains or losses realized between the trade and settlement dates on securities transactions, and the difference between the amounts of dividends, interest, and foreign withholding taxes recorded on the company’s books and the U.S. dollar equivalent of the amounts actually received or paid. Net unrealized foreign exchange gains and losses arise from changes in the fair values of assets and liabilities, other than investments in securities at fiscal period end, resulting from changes in exchange rates.
| 2. | MANAGEMENT FEE, ADMINISTRATION FEE AND OTHER TRANSACTIONS WITH AFFILIATES |
(a) Easterly Investment Partners LLC acts as investment manager for the Funds pursuant to the terms of a Management Agreement with the Trust, on behalf of the Funds (the “Management Agreement”). Under the terms of the Management Agreement, the Manager manages the investment operations of the Funds in accordance with each Fund’s respective investment policies and restrictions. Each investment sub-advisor is responsible for the day-to-day management of its Fund’s portfolios. Easterly Investment Partners LLC serves the Funds in a supervision capacity with responsibility to monitor the performance of the Funds’ outside service providers, assist in the review of financial statements and other regulatory filings and board meeting materials related to each Fund. The management fees are payable to Easterly Investment Partners LLC monthly by each Fund and are computed daily as shown in the table below.
(b) Pursuant to an operating expense limitation agreement between Easterly Investment Partners LLC and the Funds, Easterly Investment Partners LLC has contractually agreed to waive all or a portion of its advisory fee and/or pay expenses of the Fund so that total annual Fund operating expenses (excluding front-end and contingent deferred sales loads, leverage, interest and tax expenses, dividends and interest on short positions, brokerage commissions, expenses incurred in connection with any merger, reorganization or liquidation, extraordinary or non-routine expenses and Acquired Fund Fees and Expenses) do not exceed the expense limitation shown in the table below, and is based on the Funds’ average daily net assets. This operating expense limitation agreement cannot be terminated during its term. Easterly Investment Partners LLC is permitted to seek reimbursement from the Fund, subject to limitations, for management fees waived and Fund expenses it paid within three (3) years from the date on which such management fees were waived or expenses paid, as long as the reimbursement does not cause the Fund’s operating expenses to exceed (i) the expense cap in place at the time the fees were waived or the expenses were incurred; or (ii) the current expense cap, whichever is less. The expense limitation agreement will be in effect through date listed in the table below.
| | | | | | | | | | | | | | | Managament | |
| | | | | | | | | | | | | | | Fee Waived/ | |
| | | Management | | Expenses Limitation | | | | Expenses Reimbursed | |
| Fund | | Agreement | | Cl A | | Cl C | | Cl I | | CL R6 | | Expires | | YTD 8/31/2024 | |
| Small Cap Value | | 0.75% | * | 1.50% | | 2.25% | | 0.95% | * | 0.85% | * | 8/1/2025 | * | $ | 100,162 | |
| Long/Short Opportunity | | 0.80% | | 1.55% | | 2.30% | | 1.30% | | 1.00% | | 6/30/2025 | | | — | |
| * | Effective August 1, 2024, the Easterly Snow Cap Value Fund reduced the management fee of the Fund from 0.95% to 0.75%, reduced the annual expense limitation for Class I from 1.25% to 0.95%, and reduced the annual expense limitation for Class R6 from 1.00% to 0.85%. The expense limitation agreement was extended from June 30, 2025 to August 1, 2025. |
The following table shows the available waived expenses and expiration date for each Fund subject to potential recovery.
| Fund | | 2/28/2025 | | | 2/28/2026 | | | 2/28/2027 | |
| Small Cap Value | | $ | 136,896 | | | $ | 199,708 | | | $ | 194,993 | |
| Long/Short Opportunity | | | — | | | | — | | | | — | |
(c) Easterly Securities LLC (the “Distributor”) is the Trust’s Distributor and is an affiliate of the Advisor. The Trust with respect to the Funds have adopted a Plan of Distribution pursuant to Rule 12b-1 under the 1940 Act (the “Plan”) with respect to the sale and distribution of Class A and C shares of the Funds. The Plan provides that the Fund will pay the Distributor and other entities, including a broker-dealer affiliate of the Adviser, are paid pursuant to the Plans provided and the expenses borne by the distributor and others in the distribution of Fund shares a fee, which is accrued daily and paid monthly, at the annual rate of 0.25% of the average daily net assets of Class A shares and 1.00% of the average daily net assets of each of the Funds’ Class C shares. For the six months ended August 31, 2024, pursuant to the Plan, Class A and Class C shares paid the amounts of:
| Fund | | Class A | | | Class C | |
| Small Cap Value | | $ | 14,804 | | | $ | 6,035 | |
| Long/Short Opportunity | | | 60,538 | | | | 12,419 | |
| EASTERLY FUNDS |
| NOTES TO FINANCIAL STATEMENTS |
| Six Months Ended August 31, 2024 (Unaudited) (Continued) |
For the six months ended August 31, 2024, the Distributor received and retained sales charges on sales of the Funds’ Class A and Class C shares as follows:
| | | Received | | | Retained | |
| Fund | | Class A | | | Class C | | | Class A | | | Class C | |
| Small Cap Value | | $ | 24,931 | | | $ | 665 | | | $ | 3,296 | | | $ | 60 | |
| Long/Short Opportunity | | | 34 | | | | — | | | | 4 | | | | — | |
(d) Ultimus Fund Solutions, LLC (“UFS”), provides administrative, fund accounting and transfer agency services to the Funds pursuant to agreements with the Trust, for which it receives from each Fund: (i) a minimum annual fee or basis points in decreasing amounts as assets reach certain breakpoints; and (ii) any related out-of-pocket expenses.
In addition, certain affiliates of the Distributor provide services to the Trust as follows:
Northern Lights Compliance Services, LLC (“NLCS”) - NLCS, an affiliate of UFS, provides a Chief Compliance Officer to the Trust, as well as related compliance services, pursuant to a consulting agreement between NLCS and the Trust. Under the terms of such agreement, NLCS receives customary fees from the Funds.
Blu Giant, LLC (“Blu Giant”) – Blu Giant, an affiliate of UFS, provides EDGAR conversion and filing services as well as print management services for the Trust on an ad-hoc basis. For the provision of these services, Blu Giant receives customary fees from the Funds.
Certain employees of UFS and NLCS are also officers of the Trust and are not paid any fees directly by the Trust for serving in such capacity.
| 3. | INVESTMENT TRANSACTIONS |
(a) For the six months ended August 31, 2024, the cost of purchases and proceeds from sales of investment securities, other than short-term securities, for the Funds were as follows:
| Fund | | Purchase | | | Sales | |
| Small Cap Value | | $ | 3,781,118 | | | $ | 3,334,868 | |
| Long/Short Opportunity | | | 22,450,152 | | | | 31,850,035 | |
(b) Other Investment Companies or Exchange Traded Funds – The Fund may invest in shares of other investment companies, including money market mutual funds, other mutual funds or exchange traded funds (“ETFs”). An ETF generally is an open-end investment company, unit investment trust or a portfolio of securities deposited with a depository in exchange for depository receipts. ETFs provide investors the opportunity to buy or sell throughout the day an entire portfolio of securities in a single security. Although index mutual funds are similar to index based ETFs, they are generally sold and redeemed only once per day at market close. The ETFs in which a Fund invests may be subject to liquidity risk. Liquidity risk exists when particular investments are difficult to purchase or sell, possibly preventing the sale of the security at an advantageous time or price. To the extent that the ETFs in which a Fund invests hold securities of companies with smaller market capitalizations or securities with substantial market risk, they will have a greater exposure to liquidity risk. In addition, ETFs are subject to the following risks that do not apply to conventional mutual funds that can be found in “Exchange-Traded Funds” below: (1) the market price of the ETF’s shares may trade at a discount to their net asset value; (2) an active trading market for an ETF’s shares may not develop or be maintained; or (3) trading of an ETF’s shares may be halted if the listing exchange deem such action appropriate, the shares are de-listed from the exchange, or the activation of market-wide “circuit breakers” (which are tied to large decreases in stock prices) halts stock trading generally. Additionally, ETFs have management fees, which increase their cost. In addition to the advisory and operational fees a Portfolio bears directly in connection with its own operation, the Portfolio also bears its pro rata portion of the advisory and operational expenses incurred indirectly through investments in other investment companies.
| EASTERLY FUNDS |
| NOTES TO FINANCIAL STATEMENTS |
| Six Months Ended August 31, 2024 (Unaudited) (Continued) |
(c) Options Contracts – Certain Funds may enter into options contracts. An option contract is a contract in which the writer of the option grants the buyer of the option the right to purchase from (call option), or sell to (put option), the writer a designated instrument at a specified price within a specified period of time. Certain options, including options on indices, will require cash settlement by the Fund if the option is exercised.
Premiums paid when put or call options are purchased by the Fund, represent investments, which are marked-to-market daily. When a purchase option expires, the Fund will realize a loss in the amount of the premium paid. When the Fund enters into a closing sales transaction, the Fund will realize a gain or loss depending on whether the proceeds from the closing sales transaction are greater or less than the premium paid for the option. When the Fund exercises a put option, it will realize a gain or loss from the sale of the underlying security and the proceeds from such sale will be decreased by the premium originally paid. When the Fund exercises a call option, the cost of the security, which the Fund purchases upon exercise, will be increased by the premium originally paid.
Certain Funds may write covered call options. This means that the Fund will own the security subject to the option or an option to purchase the same underlying security, having an exercise price equal to or less than the exercise price of the covered option, or will establish and maintain with its custodian for the term of the option, an account consisting of cash, U.S. government securities or other liquid securities having a value equal to the fluctuating market value of the securities on which the Fund holds a covered call position.
When a Fund writes a call option, an amount equal to the premium received by the Fund is recorded as a liability, the value of which is marked-to-market daily. When a written option expires, the Fund realizes a gain equal to the amount of the premium received. When the Fund enters into a closing purchase transaction, the Fund realizes a gain or loss depending upon whether the cost of the closing transaction is greater or less than the premium originally received, without regard to any unrealized gain or loss on the underlying security, and the liability related to such option is eliminated. When a written call option is exercised the proceeds of the security sold will be increased by the premium originally received.
The liability representing a Fund’s obligation under an exchange traded written option or investment in a purchased option is valued at the last sale price or, in the absence of a sale, the last available bid price.
The Funds may enter into options for hedging purposes. The risk associated with purchasing options is limited to the premium originally paid. The risk in writing a covered call option is that the Fund gives up the opportunity to participate in any increase in the price of the underlying security beyond the exercise price.
(c) The Easterly Long/Short Opportunity Fund may sell a security it does not own in anticipation of a decline in the fair value of that security. When the Fund sells a security short, it must borrow the security sold short and deliver it to the broker-dealer through which it made the short sale. A gain, limited to the price at which the Fund sold the security short, or a loss, unlimited in size, will be recognized upon the termination of a short sale. For financial statement purposes, an amount equal to the settlement amount is included in the Statement of Assets and Liabilities as a liability. The amount of the liability is subsequently marked to market to reflect the current value of the short positions. Subsequent fluctuations in the market prices of the securities sold, but not yet purchased, may require purchasing the securities at prices which could differ from the amount reflected in the Statement of Assets and Liabilities. The Fund is liable for any dividends or interest payable on securities while those securities are in a short position. Such amounts are recorded on the ex-dividend date as dividend or interest expense.
The derivatives are not accounted for as hedging instruments under GAAP. The effect of derivative instruments on the Statements of Assets and Liabilities at August 31, 2024, were as follows:
| | | | | | | Location of derivatives on | | Fair value of asset/liability | |
| Fund | | Derivative | | Risk Type | | Statements of Assets and Liabilities | | derivatives | |
| Long/Short Opportunity | | | | |
| | | Call opt ions writ ten | | Equity | | Options written | | $ | (1,230,058 | ) |
| | | | | | | Totals | | $ | (1,230,058 | ) |
| EASTERLY FUNDS |
| NOTES TO FINANCIAL STATEMENTS |
| Six Months Ended August 31, 2024 (Unaudited) (Continued) |
The effect of derivative instruments on the Statements of Operations for the six months ended August 31, 2024, were as follows:
| | | | | | | | | Realized and unrealized gain | |
| Portfolio | | Derivative | | Location of gain (loss) on derivatives | | Risk Type | | (loss) on derivatives | |
| Long/Short Opportunity | | | | | |
| | | Option Contracts | | | | |
| | | | | Net realized loss on options purchased | | Equity | | $ | (35,545 | ) |
| | | | | Net realized gain on options written | | Equity | | | 268,264 | |
| | | | | Net change in unrealized appreciation on options purchased | | Equity | | | 33,745 | |
| | | | | Net change in unrealized appreciation on options written | | Equity | | | 875,369 | |
| | | | | | | | | $ | 1,141,833 | |
The average notional value of the derivative instruments for the Easterly Long/Short Opportunity during the six months ended August 31, 2024, was as follows:
| Options Written | |
| $ | 19,322,750 | |
The Fund is not subject to any Master Netting Arrangements, therefore the Fund did not offset any assets or liabilities.
| 4. | AGGREGATE UNREALIZED APPRECIATION AND DEPRECIATION – TAX BASIS |
| | | Cost for | | | Gross | | | Gross | | | Tax Net | |
| | | Federal Tax | | | Unrealized | | | Unrealized | | | Unrealized | |
| Portfolio | | Purposes | | | Appreciation | | | Depreciation | | | Appreciation/(Depreciation) | |
| Small Cap Value | | $ | 20,206,348 | | | $ | 6,910,914 | | | $ | (1,171,699 | ) | | $ | 5,739,215 | |
| Long/Short Opportunity | | | 54,819,551 | | | | 25,604,123 | | | | (9,123,415 | ) | | | 16,480,708 | |
| 5. | DISTRIBUTIONS TO SHAREHOLDERS AND TAX COMPONENTS OF CAPITAL |
The tax character of fund distributions paid for the years ended February 29, 2024, and February 28, 2023, was as follows:
| |
| | | For the year ended February 29, 2024: | | | | |
| | | Ordinary | | | Long-Term | | | Return | | | | |
| Portfolio | | Income | | | Capital Gains | | | Of Capital | | | Total | |
| Small Cap Value | | $ | 33,756 | | | $ | — | | | $ | — | | | $ | 33,756 | |
| Long/Short Opportunity | | | 1,909,851 | | | | 136,752 | | | | — | | | | 2,046,603 | |
| | | | | | | | | | | | | | | | | |
| | | For the year ended February 28, 2023: | | | | |
| | | Ordinary | | | Long-Term | | | Return | | | | |
| Portfolio | | Income | | | Capital Gains | | | Of Capital | | | Total | |
| Small Cap Value | | $ | — | | | $ | — | | | $ | — | | | $ | — | |
| Long/Short Opportunity | | | 1,082,299 | | | | 5,197,746 | | | | — | | | | 6,280,045 | |
As of February 29, 2024, the components of accumulated earnings/ (deficit) on a tax basis were as follows:
| | | Undistributed | | | Undistributed | | | Post October Loss | | | Capital Loss | | | Other | | | Unrealized | | | Total | |
| | | Ordinary | | | Long-Term | | | and | | | Carry | | | Book/Tax | | | Appreciation/ | | | Accumulated | |
| Portfolio | | Income | | | Capital Gains | | | Late Year Loss | | | Forwards | | | Differences | | | (Depreciation) | | | Earnings/(Deficits) | |
| Small Cap Value | | $ | 223,018 | | | $ | — | | | $ | — | | | $ | (2,043,032 | ) | | $ | — | | | $ | 4,229,139 | | | $ | 2,409,125 | |
| Long/Short Opportunity | | | 329,803 | | | | 131,500 | | | | — | | | | — | | | | — | | | | 17,801,486 | | | | 18,262,789 | |
The difference between book basis and tax basis undistributed net investment income (loss), accumulated net realized gains (losses), and unrealized appreciation/(depreciation) from investments is primarily attributable to the tax deferral of losses on wash sales and perpetual bonds. The unrealized appreciation (depreciation) in the table above includes unrealized foreign currency losses of $9 for the Easterly Snow Small Cap Value Fund and $719 for the Easterly Snow Long/Short Opportunity Fund.
| EASTERLY FUNDS |
| NOTES TO FINANCIAL STATEMENTS |
| Six Months Ended August 31, 2024 (Unaudited) (Continued) |
At February 29, 2024, the Easterly Snow Small Cap Value Fund had capital loss carry forwards for federal income tax purposes available to offset future capital gains, along with capital loss carryforwards utilized as follows:
| | | | | | | | | | | | CLCF | |
| Portfolio | | Short-Term | | | Long-Term | | | Total | | | Utilized | |
| Small Cap Value | | $ | 1,400,441 | | | $ | 642,591 | | | $ | 2,043,032 | | | $ | 563,918 | |
| Long/Short Opportunity | | | — | | | | — | | | | — | | | | — | |
During the fiscal year ended February 29, 2024, the Easterly Snow Long/Short Opportunity Fund utilized tax equalization which is the use of earnings and profits distributions to shareholders on redemption of shares as part of the dividends paid deduction for income tax purposes. Permanent book and tax differences, primarily attributable to the use of equalization resulted in reclassifications for the Fund for the fiscal year ended February 29, 2024, as follows:
| | | | | | Accumulated | |
| Portfolio | | Paid In Capital | | | Earnings (Losses) | |
| Small Cap Value | | $ | — | | | $ | — | |
| Long/Short Opportunity | | | 89,641 | | | | (89,641 | ) |
The beneficial ownership, either directly or indirectly, of more than 25% of the voting securities of a Fund creates a presumption of control of the Fund under Section 2(a)(9) of the 1940 Act. As of August 31, 2024, the shareholders that own 25% or more of the voting securities are as follows:
| | | | | Long/Short |
| Owner | | Small Cap Value | | Opportunity |
| Merrill Lynch | | 40.5% | | 42.9% |
Subsequent events after the date of the Statements of Assets and Liabilities have been evaluated through the date the financial statements were issued. Effective September 6, 2024, the minimum investment amount for Class I shares of the Funds has changed to $100,000. Effective September 6, 2024, Class A shares of the Funds that are purchased at net asset value (“NAV”) in amounts of $500,000 or more may be subject to a 1.00% contingent deferred sales charge (“CDSC”) if they are redeemed within eighteen months of purchase.
| EASTERLY FUNDS |
| SUPPLEMENTAL INFORMATION (Unaudited) (Continued) |
Board of Trustees (the “Board”) Meeting of July 31, 2024
On July 31, 2024, the Board of Trustees (the “Board”) of James Alpha Funds Trust dba Easterly Funds Trust (the “Trust”), a Delaware statutory trust, met to consider, among other things, the renewal of the investment management agreements between the Trust, on behalf of the Easterly Snow Long/Short Opportunity Fund (“Long/Short Fund”) and Easterly Snow Small Cap Value Fund (“Small Cap Fund”) (each a “Fund” and collectively the “Funds”), and Easterly Investment Partners LLC (“EIP”) (the “Investment Management Agreements”).
In the course of consideration of the renewal of the Investment Management Agreements, the Independent Trustees received materials discussing the legal standards applicable to their consideration of the Investment Management Agreements. Prior to voting, the Independent Trustees met with and asked questions of representatives of EIP.
In considering the renewal of the Investment Management Agreements and reaching their conclusion with respect to the Investment Management Agreements, the Board took note of relevant judicial precedent that set forth factors to be considered by a board when evaluating investment advisory agreements. These include, but are not limited to, the following: (i) the nature, extent, and quality of the services to be provided to the Funds; (ii) information comparing the investment performance, advisory fees and operating expense ratio of each Fund to other funds; (iii) information about profits to be realized by EIP and its affiliates from the relationship with the Funds; (iv) the extent to which economies of scale would be realized as each Fund grows; and (v) whether fee levels reflect these economies of scale for the benefit of the Funds’ investors.
As part of the contract renewal process, the Board reviewed and considered information provided in response to a detailed request for information submitted to management by the Independent Trustees and received a presentations from EIP. The Independent Trustees met separately in advance of the meeting to discuss the materials provided to them in connection with the renewal of the Investment Management Agreements, including comparative performance and expenses. The Board also took into account information provided to the Board throughout the year in considering whether to approve the Investment Management Agreements. The Board, including the Independent Trustees, considered a variety of factors, including those described below. The Board also considered other factors and did not treat any single factor as determinative, and each Trustee may have attributed different weights to different factors. The Independent Trustees also had an opportunity to discuss the materials presented and any issues raised by EIP’s presentations. After evaluating the factors discussed below, among others, the Board approved the renewal of the Funds’ Investment Management Agreements and determined that the compensation payable thereunder by each Fund to EIP is fair and reasonable.
Nature, Extent and Quality of Services. In considering the renewal of the Investment Management Agreements with EIP, the Board considered the nature, extent and quality of services that EIP provided to the Long/Short Fund and Small Cap Fund, including EIP’s personnel and resources. The Board reviewed the services EIP provided in serving as investment adviser and the backgrounds of the personnel providing services to the Long/Short Fund and Small Cap Fund, including portfolio managers. They also reviewed information provided regarding risk management and compliance and regulatory matters. The Board acknowledged that EIP continues to invest in the business and noted EIP’s efforts and resources with respect to various regulatory initiatives. The Board also considered EIP’s financial position. The Board concluded that the services EIP provided were satisfactory.
| EASTERLY FUNDS |
| SUPPLEMENTAL INFORMATION (Unaudited) (Continued) |
Performance. The Board reviewed performance information that EIP provided for Long/Short Fund and Small Cap Fund compared to its respective benchmark index (the “Benchmark Index”) and funds in its respective peer universe (the “Peer Group”) (which is comprised of the funds in a Fund’s Morningstar category) for the month-to-date, quarter-to-date, year-to-date, and one-, three-, five- and ten-year periods ended May 31, 2024, as applicable. The Board also received information on the construction of each Fund’s Peer Group.
Long/Short Fund: The Board reviewed the Fund’s total returns compared to the total returns of its Peer Group and its Benchmark Indices (Russell 3000 Value Index and 70% Russell 3000 Value Total Return/30% ICE BofA Merrill Lynch 3 Month U.S. Treasury Bill Blend Index). In this regard, the Board noted that Class I shares of the Long/Short Fund outperformed or was equal to its Peer Group for the month-to-date, quarter-to-date, year-to-date, and one-, three-, five- and ten-year periods. The Board concluded that the performance of the Fund was satisfactory.
Small Cap Fund: The Board reviewed the Fund’s total returns compared to the total returns of its Peer Group and its Benchmark Index (Russell 2000 Value Index). In this regard, the Board noted that Class I shares of the Small Cap Fund outperformed its Peer Group for the year-to-date, and one-, three-, and five-year periods, and underperformed its Peer Group for the month-to-date, quarter-to-date, and ten-year periods. The Board concluded that the performance of the Fund was satisfactory.
Advisory Fees and Fund Expenses. The Board reviewed each Fund’s contractual advisory fee and expense ratio taking into account each Fund’s net asset size, and reviewed information comparing the advisory fee and expense ratio to those of each Fund’s respective Peer Group. The Board noted that EIP had entered into an Operating Expense Limitation Agreement (“OELA”) to waive fees and/or limit expenses of the Long/Short Fund and Small Cap Fund in an amount necessary to limit total annual operating expenses to a specified percentage of average daily net assets for each share class of the Funds. The Board also considered the extent to which EIP waives management fees and/or reimburses expenses for a Fund and its share classes, including the basis for EIP’s determination that any such waivers and/or reimbursements do not and will not result in cross-subsidization by one share class of another share class of a Fund. The Board discussed the level of work involved in EIP’s management and oversight of the Funds, and the other services that EIP provided to the Funds. The Board considered the nature and scope of the services provided by EIP, including the supervision of outside service providers. The Board noted that the contractual management fee and total net expenses for Class I shares of the Long/Short Fund were below the median contractual management fee and total net expenses of the Peer Group. The Board further noted that the contractual management fee and total net expenses for Class I shares of the Small Cap Fund were above the median contractual management fee and total net expenses of the Peer Group. At the Independent Trustees’ request, management discussed factors impacting the Small Cap Fund’s management fee and total expenses as compared to its Peer Group. The Trustees considered management’s proposal to reduce the Small Cap Fund’s management fee from 0.95% to 0.75% and management’s proposal to amend the OELA on behalf of the Small Cap Fund to reduce the expense cap for Class I and Class R6 shares. In light of the nature, quality and extent of services EIP provided and the Funds’ performance, the Board concluded that each Fund’s advisory fee was fair and reasonable.
Economies of Scale. The Board considered the extent to which there may be economies of scale in the provision of advisory services to the Long/Short Fund and Small Cap Fund, and the extent to which such economies of scale are shared with the Funds. The Board noted that EIP had indicated its willingness to discuss the matter of breakpoints with the Board in the future as asset levels grow. The Board noted
| EASTERLY FUNDS |
| SUPPLEMENTAL INFORMATION (Unaudited) (Continued) |
that the Funds may also benefit from economies of scale through initial fee setting and fee waivers and expense reimbursements. The Board agreed that in light of the OELA, which effectively protected shareholders from high expenses despite lower asset levels, and EIP’s willingness to consider breakpoints as each Fund reached higher asset levels, the absence of breakpoints was acceptable.
Profitability. The Board reviewed the profitability of EIP with respect to Long/Short Fund and Small Cap Fund on an individual fund-by-fund basis and in the aggregate. The Board considered the methodology for calculating profitability. Using such methodology, the Board noted that EIP earned a profit from the Long/Short Fund and the Small Cap Fund, in each case without considering marketing related costs. The Board concluded that the profitability of EIP in connection with the management of the Long/Short Fund and Small Cap Fund was not excessive given the nature, extent and quality of the services provided.
Fallout Benefits. Because of its relationship with the Long/Short Fund and Small Cap Fund, EIP, and their affiliates may derive ancillary benefits from Fund operations, including those derived from the allocation of Fund brokerage and the use of commission dollars to pay for research and other similar services (as applicable). The Board reviewed information provided by EIP as to any such benefits.
Conclusion. Based on all of the information considered and the conclusions reached, the Board determined that the compensation to be paid under the Investment Management Agreements are fair and reasonable, and that the continuance of the Investment Management Agreements be approved.
How to Obtain Proxy Voting Information
Information regarding how the Portfolios voted proxies relating to portfolio securities during the most recent twelve month period ended June 30 as well as a description of the policies and procedures that the Portfolios use to determine how to vote proxies is available without charge, upon request, by calling 1-833-999-2636 or by referring to the Securities and Exchange Commission’s (“SEC”) website at http://www.sec.gov.
How to Obtain 1st and 3rd Fiscal Quarter Portfolio Holdings
Funds file a complete schedule of portfolio holdings with the Securities and Exchange Commission (the “SEC”) for the first and third quarters of each fiscal year as an exhibit to its reports on Form N-PORT, within sixty days after the end of the period. Form N-PORT reports are available at the SEC’s website at www.sec.gov.
Item 8. Changes in and Disagreements with Accountants for Open-End Management Investment Companies.
Not applicable
Item 9. Proxy Disclosures for Open-End Management Investment Companies.
Not applicable
Item 10. Remuneration Paid to Directors, Officers, and Others of Open-End Management Investment Companies.
Included under Item 7
Item 11. Statement Regarding Basis for Approval of Investment Advisory Contract.
Included under Item 7
Item 12. Disclosure of Proxy Voting Policies and Procedures for Closed-End Management Investment Companies.
Not applicable
Item 13. Portfolio Managers of Closed-End Management Investment Companies.
Not applicable
Item 14. Purchases of Equity Securities by Closed-End Management Investment Company and Affiliated Purchasers.
Not applicable
Item 15. Submission of Matters to a Vote of Security Holders.
None
Item 16. Controls and Procedures
(a) The registrant’s Principal Executive Officer and Principal Financial Officer have concluded that the registrant’s disclosure controls and procedures (as defined in Rule 30a-3(c) under the Act) are effective in design and operation and are sufficient to form the basis of the certifications required by Rule 30a-(2) under the Act, based on their evaluation of these disclosure controls and procedures as of a date within 90 days of this report on Form N-CSR.
(b) There were no changes in the registrant’s internal control over financial reporting (as defined in Rule 30a-3(d) under the Act) during the period covered by this report that have materially affected, or are reasonably likely to materially affect, the registrant’s internal control over financial reporting.
Item 17. Disclosure of Securities Lending Activities for Closed-End Management Investment Companies.
Not applicable
Item 18. Recovery of Erroneously Awarded Compensation.
(a) Not applicable
(b) Not applicable
Item 19. Exhibits.
(a)(1) Not applicable
(a)(2) A separate certification for each principal executive officer and principal financial officer of the registrant as required by Rule 30a-2(a) under the Act (17 CFR 270.30a-2(a)): Attached hereto.
(a)(3) Not applicable
(a)(4) Not applicable
(b) Certifications required by Rule 30a-2(b) under the Act (17 CFR 270.30a-2(b)): Attached hereto
SIGNATURES
Pursuant to the requirements of the Securities Exchange Act of 1934 and the Investment Company Act of 1940, the registrant has duly caused this report to be signed on its behalf by the undersigned, thereunto duly authorized.
James Alpha Fund Trust
By /s/ Darrell Crate Darrell Crate | |
| President and Principal Executive Officer |
| Date: 11/5/2024 | |
Pursuant to the requirements of the Securities Exchange Act of 1934 and the Investment Company Act of 1940, this report has been signed below by the following persons on behalf of the registrant and in the capacities and on the dates indicated.
| By /s/ Darrell Crate | |
| Darrell Crate |
| President and Principal Executive Officer | |
| 11/5/2024 | |
By /s/ Michael Montague Michael Montague | |
| Treasurer and Principal Financial Officer |
| Date: 11/5/2024 | |