Table of Contents | | 
| |
Shareholder Letter | | | 1 | | |
Management's Discussion of Fund Performance | |
Engine No. 1 Transform 500 ETF | | | 3 | | |
Shareholder Expense Example | | | 5 | | |
Sector Diversification | | | 6 | | |
Schedule of Investments | |
Engine No. 1 Transform 500 ETF | | | 7 | | |
Statement of Assets and Liabilities | | | 15 | | |
Statement of Operations | | | 16 | | |
Statement of Changes in Net Assets | | | 17 | | |
Financial Highlights | | | 18 | | |
Notes to Financial Statements | | | 19 | | |
Report of Independent Registered Public Accounting Firm | | | 26 | | |
Supplemental Information | | | 27 | | |
Board Approval of Investment Advisory Agreement | | | 28 | | |
Board of Trustees and Executive Officers | | | 30 | | |
This report should be read in conjunction with the Trust's prospectus.
The views expressed in the Shareholder Letter are those of Fund Management at Engine No. 1 LLC ("Engine No. 1,") as of October 31, 2021. Management's Discussion of Fund Performance presents information about the Fund's holdings that is believed to be accurate, and the views of the Fund's portfolio manager, as of October 31, 2021. The Shareholder Letter and Management's Discussion of Fund Performance may not necessarily reflect the views or holdings on the date this Annual Report is first published or anytime thereafter. The information in the Shareholder Letter and Management's Discussion of Fund Performance may change, and the Fund disclaims any obligation to advise shareholders of any such changes. Certain information was obtained from sources that Engine No. 1, believes to be reliable; however, Engine No. 1, does not guarantee the accuracy or completeness of any information obtained from any third party.
Portfolio holdings will change and should not be considered as investment advice or a recommendation to buy, sell or hold any particular security. Please visit etf.engine1.com for the most current list of portfolio holdings.
The Engine No. 1 Transform 500 ETF seeks investment results that closely correspond, before fees and expenses, to the period performance of the Morningstar® US Large Cap Select IndexSM (the "Underlying Index"), which measures the performance of the large-capitalization sector of the U.S. equity market, as determined by Morningstar, Inc. The Underlying Index consists of securities from a broad range of industries. As of October 31, 2021, the Underlying Index is represented by securities of companies in sectors including, but not limited to, consumer, energy, financial services, healthcare, technology, and utilities. The components of the Underlying Index are likely to change over time and the Underlying Index and the Fund are rebalanced on a quarterly basis. To the extent that the securities in the Underlying Index are concentrated in one or more industries or groups of industries, the Fund may concentrate in such industries or groups of industries. As of October 31, 2021, the Underlying Index is not concentrated in an industry or group of industries.
Shareholder Letter
(Unaudited) | | 
| |
Dear Shareholder,
At Engine No. 1, we believe that a company's performance depends on the investments it makes in its employees, customers, communities, and the environment. Our research shows that taking environmental, social, and governance (ESG) data into account when you lead or invest in a company drives economic value.1
Many sustainable funds currently available to investors focus on changing investors' exposure to companies through negative screens and divestment. But we think divestment is disengagement—it doesn't incentivize companies or markets to change. Engine No. 1 takes a different but common-sense approach. We work with companies and make it possible for every shareholder to act and vote for changes that strive to both make money and have impact. We do not believe there is a trade-off between investing for the long term and holding companies accountable.
Americans are increasingly demanding corporate action on issues like sustainability, workers' rights, and racial justice, and yet for years the average S&P 500 fund voted against a vast majority of ESG shareholder proposals.2 In 2021 there were more than 400 shareholder proposals on ESG issues in the Russell 30003—an increase of 27% over 2020—but barely one in 10 individual investors voted on them,4 and nearly four out of five proposals failed to receive majority support.
We believe that we can harness the power of investors to transform the economy and increase long-term value. By activating the power of shareholder voting, we can effect change that is accessible, impactful, and transparent:
n Accessible. We give every stock owner the opportunity to vote on values.
n Impactful. We leverage tens of thousands of shareholders.
n Transparent. We share our voting record and push other funds to do the same so that investors can see where their money is truly making a difference.
Our Engine No. 1 Transform 500 ETF (ticker: VOTE) offers investors an exchange-traded fund (ETF) that provides broad market exposure to the 500 largest US public companies5 at a low cost, with the opportunity for active ownership.
We have been thrilled with investors' reception of our strategy since it launched this past June. As of the Fund's fiscal year end, October 31, 2021, assets have grown to more than $235 million. The Fund has been added to custodial, broker-dealer, and fintech platforms and models and is being used by registered investment advisers, multifamily offices, and retail investors.
As shareholder voting undergoes a revolution, Engine No. 1 aims to be a catalyst for change. Our campaign at ExxonMobil resulted in investors' having a voice and electing three independent directors to the board who have the necessary expertise and experience to help guide the transformation of Exxon over the next decade as the energy sector evolves. At General Motors we have had very constructive and collaborative two-way conversations as we support their efforts to transform the auto industry and lower Scope 3 emissions while driving long-term value for both stakeholders and shareholders.
Our goal with VOTE is to bring investors with us on the journey to hold leadership accountable for the key themes we stand behind. In 2021 that included strengthening our workforce, increasing transparency on corporate lobbying, and restoring the climate. The 500 largest companies in the United States employ millions of workers, sell trillions of dollars' worth of products and services, and drive societal and environmental impact every day. We believe that if we can transform these companies, we can help transform the entire economy.
On the following pages, you will find information related to your Engine No. 1 Transform 500 ETF investment. If you have any questions, please contact your financial advisor or Engine No. 1 directly. Additional information, including portfolio holdings and voting updates, is available on the Engine No. 1 ETF website: etf.engine1.com.
Thank you for joining us and taking your seat at the table. Our work has only just begun.
Sincerely,
Jennifer Grancio
Jennifer Grancio
Chief Executive Officer
Engine No. 1

1
Shareholder Letter (concluded)
(Unaudited) | | 
| |
1 Engine No. 1 and Witold Henisz, "A New Way of Seeing Value: Introducing the Engine No. 1 Total Value Framework," 2021, https://engine1.com/files/Engine_No._1_Total_Value_Framework.pdf.
2 S&P 500 ETFs' five-year average is based on a simple average of the most recent Morningstar historical analysis showing support for all ESG proposals 2015–2019 (n = 1,000+ proposals) for BlackRock (3%), Vanguard (4%), and State Street (25%). Data from: https://www.morningstar.com/lp/proxy-voting-esg.
3 Shareholder proposal developments during the 2021 proxy season, Gibson Dunn. Gibson Dunn: Shareholder Proposal Developments During the 2021 Proxy Season.
4 https://www.lebow.drexel.edu/sites/default/files/event/1579898324-brav-cain-zytnicretail-shareholder-participation-proxy-process-monitoring-engagement-and-voting.pdf.
5 VOTE tracks the Morningstar® US Large Cap Select IndexSM capturing more than 80% of the US equity market. The Morningstar US Large Cap Select Index is a market-cap-weighted index of the 500 largest US companies.
Morningstar® and the Morningstar® US Cap Select IndexSM are trademarks or services marks of Morningstar, Inc. and have been licensed for use for certain purposes by Fund Management at Engine No. 1 LLC. The Engine No. 1 Transform 500 ETF is not sponsored, endorsed, sold or promoted by the Morningstar, Inc. or any of its affiliates (all such entities, collectively, "Morningstar Entities"). The Morningstar Entities make no representation or warranty, express or implied, to the owners of the Engine No. 1 Transform 500 ETF or any member of the public regarding the advisability of investing in exchange-traded funds generally or in the Morningstar® US Cap Select IndexSM in particular or the ability of the Morningstar® US Cap Select IndexSM to track general ETF market performance.
THE MORNINGSTAR ENTITIES EXPRESSLY DISCLAIM ANY WARRANTY AROUND THE ACCURACY, COMPLETENESS AND/OR TIMELINESS OF THE Morningstar® US Cap Select IndexSM OR ANY DATA INCLUDED THEREIN AND MORNINGSTAR ENTITIES SHALL HAVE NO LIABILITY FOR ANY ERRORS, OMISSIONS, OR INTERRUPTIONS THEREIN.
Investing involves risk, including the possible loss of principal. Shares of any ETF are bought and sold at market price (not net asset value), may trade at a discount or premium to NAV, and are not individually redeemed from the Fund. Brokerage commissions will reduce returns.
Key risks: The Fund is not actively managed, and the investment adviser, Fund Management at Engine No. 1 LLC, generally does not attempt to take defensive positions under any market conditions, including declining markets. The Fund may be subject to tracking error, which is the divergence of the Fund's performance from that of the underlying index. Large-capitalization companies may be less able than smaller-capitalization companies to adapt to changing market conditions. The Fund can have exposure to derivative instruments. Please see the prospectus for a full list of Fund risks.
When the Fund engages in activism, such activities may not be successful; or, even if successful, the Fund's investment may lose value. Additionally, engaging in activism may cause the Fund to incur additional expenses that a similar index fund may not experience. In addition, while Engine No. 1 may seek an active ownership approach, applicable regulatory restrictions may limit the nature and the extent of engagement in certain circumstances. Nonetheless, Engine No. 1 intends to seek opportunities where possible to employ its active ownership beliefs while being mindful of such regulatory limits. The outbreak of an infectious respiratory illness, COVID-19, has resulted in significant economic impacts. Other infectious illness outbreaks in the future may result in similar impacts. Diversification does not ensure a profit or protect against a loss in a declining market. It is not possible to invest in an index.
Distributed by Foreside Financial Services, LLC.
2
Management's Discussion of Fund Performance
(Unaudited) | | 
| |
Investment Results: Engine No. 1 Transform 500 ETF (VOTE)
The Fund seeks to track the performance (before fees and expenses) of the Morningstar® US Large Cap Select IndexSM (the "Benchmark"). The Benchmark is designed to provide exposure to a select list of the largest companies, as measured by free-float market capitalization in the United States.
From June 22, 2021, through October 31, 2021 (the "Reporting Period"), the Fund's market value return was 8.86% and its net asset value ("NAV") return was 8.87%. The Benchmark returned 8.90% during the same Reporting Period. The Fund's market value per share as of the market close of the last trading day of the Reporting Period was $54.49.
The Fund posted positive performance in four of the five months during the Reporting Period, with returns ranging from -4.76% to 7.03%. The best performing months for the Fund were October 2021 and August 2021, finishing up 7.03% and 2.99%, respectively. The worst performing months for the Fund were June 2021 and September 2021, finishing up 1.29% and down -4.76%, respectively.
All eleven sectors represented in the Fund delivered positive returns during the Reporting Period. Technology, Financial Services, Healthcare, Consumer Cyclical and Communication Services were among the strongest performing sectors. Conversely, Utilities, Basic Materials, Energy and Real Estate generally underperformed the market during the Reporting Period.
Cumulative Total Returns as of 10/31/21
| | | Since
Inception* | |
Engine No. 1 Transform 500 ETF (VOTE) | |
Net Asset Value | | | 8.87 | % | |
Market Value | | | 8.86 | % | |
Morningstar US Large Cap Select Index | | | 8.90 | % | |
Growth of an Assumed $10,000 Investment Since Inception* Through 10/31/21 (At Net Asset Value)

* VOTE's inception date is 6/22/21.
Past performance does not guarantee future results. The performance data quoted represents past performance and current returns may be lower or higher. The investment return and principal will fluctuate so that an investor's shares, when redeemed, may be worth more or less than the original cost. To obtain performance information current to the most recent month end, please visit etf.engine1.com.
As stated in the current prospectus, the expense ratio is 0.05%. Please refer to the Financial Highlights herein for the most recent expense ratio information.
3
Management's Discussion of Fund Performance (concluded)
(Unaudited) | | 
| |
NAV returns are based on the dollar value of a single share of the Fund, calculated by taking the Fund's total assets (including the market value of securities owned), subtracting liabilities, and dividing by the number of shares outstanding. The NAV return is based on the NAV of the Fund, and the Market value return is based on the market price per share of the Fund. The NAV is typically calculated at 4:00 p.m. Eastern Time on each business day the New York Stock Exchange ("NYSE") is open for trading. Market value returns are based on the closing price at 4:00 p.m. Eastern time on the Cboe BZX Exchange, Inc. Market value performance does not represent the returns you would receive if you traded shares at other times. Market value and NAV returns assume that dividends and capital gain distributions have been reinvested in the Fund at NAV.
The returns in the graph and table do not reflect the deduction of taxes that a shareholder would pay on Fund distributions or the redemption of Fund shares. Index returns reflect the reinvestment of dividends but do not reflect any management fees, transaction costs, taxes, or other expenses that would be incurred by the Fund or brokerage commissions on transactions in Fund shares. Such fees, expenses and taxes reduce Fund returns. One cannot invest directly in an index.
4
Shareholder Expense Example
(Unaudited) | | 
| |
As a shareholder, you incur two types of costs: (1) transaction costs for purchasing and selling shares; and (2) ongoing costs, including management fees and other Fund expenses. The following examples are intended to help you understand your ongoing costs (in dollars and cents) of investing in the Fund and to compare these costs with the ongoing costs of investing in other funds.
The examples below are based on an investment of $1,000 invested beginning on the date of Fund's commencement of investment operations and held for the entire period (June 22, 2021 through October 31, 2021).
Actual Expenses
The first line for the Fund in the table below provides information about actual account values and actual expenses. You may use the information in this line, together with the amount you invested, to estimate the expenses that you paid over the period. Simply divide your account value by $1,000 (for example, an $8,600 account value divided by $1,000 = 8.6), then multiply the result by the number in the first line under the heading entitled "Expenses Paid During the Period" to estimate the expenses you paid on your account during the period.
Hypothetical Example for Comparison Purposes
The second line under the Fund in the table below provides information about hypothetical account values and hypothetical expenses based on the Fund's actual expense ratio and an assumed rate of return of 5% per year before expenses, which is not the Fund's actual return. The hypothetical account values and expenses may not be used to estimate your actual ending account balance or expenses you paid for the period. You may use this information to compare the ongoing costs of investing in your Fund to other funds. To do so, compare this 5% hypothetical example with the 5% hypothetical examples that appear in the shareholder reports of other funds.
Please note that the expenses shown in the table are meant to highlight your ongoing costs only and do not reflect any transactional costs, such as brokerage commissions paid on purchases and sales of Fund shares. Therefore, the second line under the Fund in the table is useful in comparing ongoing Fund costs only and will not help you determine the relative total costs of owning different funds. In addition, if these transactional costs were included, your costs would have been higher.
| | | Beginning
Account Value
6/22/2021* | | Ending
Account Value
10/31/2021 | | Annualized
Expense Ratios
for the Period | | Expenses Paid
During the
Period(a) | |
Engine No. 1 Transform 500 ETF | |
Actual | | $ | 1,000.00 | | | $ | 1,088.70 | | | | 0.05 | % | | $ | 0.19 | | |
Hypothetical (5% return before expenses) | | $ | 1,000.00 | | | $ | 1,017.77 | | | | 0.05 | % | | $ | 0.18 | | |
* The Fund commenced investment operations on June 22, 2021.
(a) Expenses are equal to the Fund's annualized expense ratio, multiplied by the average account value over the period, multiplied by 131/365 (the number of days in the period, then divided by 365).
5
Sector Diversification (as a percentage of total investments)
October 31, 2021 (Unaudited) | | 
| |
Engine No. 1 Transform 500 ETF (VOTE)
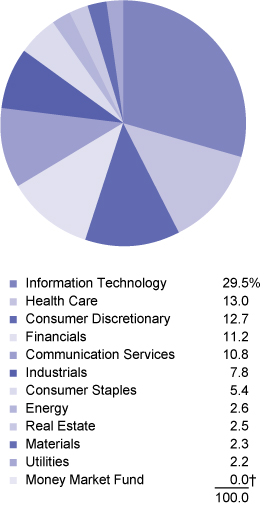
† Represents less than 0.05%.
6
Schedule of Investments
Engine No. 1 Transform 500 ETF | | 
| |
October 31, 2021
Investments | | Shares | | Value | |
COMMON STOCKS - 99.9% | |
Aerospace & Defense - 1.3% | |
Boeing Co.* | | | 3,195 | | | $ | 661,461 | | |
General Dynamics Corp. | | | 1,339 | | | | 271,482 | | |
HEICO Corp. | | | 239 | | | | 33,314 | | |
HEICO Corp., Class A | | | 432 | | | | 54,294 | | |
L3Harris Technologies, Inc. | | | 1,153 | | | | 265,813 | | |
Lockheed Martin Corp. | | | 1,437 | | | | 477,544 | | |
Northrop Grumman Corp. | | | 870 | | | | 310,781 | | |
Raytheon Technologies Corp. | | | 8,829 | | | | 784,545 | | |
TransDigm Group, Inc.* | | | 301 | | | | 187,770 | | |
| | | | 3,047,004 | | |
Air Freight & Logistics - 0.6% | |
Expeditors International of
Washington, Inc. | | | 996 | | | | 122,767 | | |
FedEx Corp. | | | 1,435 | | | | 337,986 | | |
United Parcel Service, Inc., | |
Class B | | | 4,231 | | | | 903,191 | | |
| | | | 1,363,944 | | |
Airlines - 0.2% | |
Delta Air Lines, Inc.* | | | 3,699 | | | | 144,742 | | |
Southwest Airlines Co.* | | | 3,431 | | | | 162,218 | | |
United Airlines Holdings, Inc.* | | | 1,882 | | | | 86,835 | | |
| | | | 393,795 | | |
Auto Components - 0.1% | |
Aptiv plc* | | | 1,561 | | | | 269,881 | | |
Automobiles - 2.6% | |
Ford Motor Co.* | | | 22,721 | | | | 388,075 | | |
General Motors Co.* | | | 8,410 | | | | 457,756 | | |
Tesla, Inc.* | | | 4,704 | | | | 5,240,256 | | |
| | | | 6,086,087 | | |
Banks - 4.1% | |
Bank of America Corp. | | | 42,899 | | | | 2,049,714 | | |
Citigroup, Inc. | | | 11,729 | | | | 811,178 | | |
Citizens Financial Group, Inc. | | | 2,455 | | | | 116,318 | | |
Fifth Third Bancorp | | | 4,013 | | | | 174,686 | | |
First Republic Bank | | | 1,027 | | | | 222,171 | | |
Huntington Bancshares, Inc. | | | 8,561 | | | | 134,750 | | |
JPMorgan Chase & Co. | | | 17,338 | | | | 2,945,553 | | |
KeyCorp | | | 5,546 | | | | 129,055 | | |
M&T Bank Corp. | | | 732 | | | | 107,692 | | |
PNC Financial Services
Group, Inc. (The) | | | 2,450 | | | | 517,024 | | |
Regions Financial Corp. | | | 5,537 | | | | 131,116 | | |
SVB Financial Group* | | | 351 | | | | 251,807 | | |
Truist Financial Corp. | | | 7,734 | | | | 490,877 | | |
Investments | | Shares | | Value | |
US Bancorp | | | 7,807 | | | $ | 471,309 | | |
Wells Fargo & Co. | | | 23,778 | | | | 1,216,482 | | |
| | | | 9,769,732 | | |
Beverages - 1.4% | |
Brown-Forman Corp., Class B | | | 1,061 | | | | 72,031 | | |
Coca-Cola Co. | | | 22,493 | | | | 1,267,930 | | |
Constellation Brands, Inc., Class A | | | 988 | | | | 214,208 | | |
Keurig Dr Pepper, Inc. | | | 4,274 | | | | 154,249 | | |
Monster Beverage Corp.* | | | 2,172 | | | | 184,620 | | |
PepsiCo, Inc. | | | 8,002 | | | | 1,293,124 | | |
| | | | 3,186,162 | | |
Biotechnology - 1.9% | |
AbbVie, Inc. | | | 10,249 | | | | 1,175,254 | | |
Alnylam Pharmaceuticals, Inc.* | | | 681 | | | | 108,660 | | |
Amgen, Inc. | | | 3,284 | | | | 679,689 | | |
Biogen, Inc.* | | | 863 | | | | 230,145 | | |
BioMarin Pharmaceutical, Inc.* | | | 1,064 | | | | 84,301 | | |
Exact Sciences Corp.* | | | 1,006 | | | | 95,791 | | |
Gilead Sciences, Inc. | | | 7,271 | | | | 471,742 | | |
Horizon Therapeutics plc* | | | 1,306 | | | | 156,602 | | |
Incyte Corp.* | | | 1,086 | | | | 72,740 | | |
Moderna, Inc.* | | | 2,032 | | | | 701,467 | | |
Regeneron Pharmaceuticals, Inc.* | | | 615 | | | | 393,563 | | |
Seagen, Inc.* | | | 781 | | | | 137,714 | | |
Vertex Pharmaceuticals, Inc.* | | | 1,504 | | | | 278,135 | | |
| | | | 4,585,803 | | |
Building Products - 0.4% | |
Carrier Global Corp. | | | 5,019 | | | | 262,142 | | |
Johnson Controls International plc | | | 4,121 | | | | 302,358 | | |
Masco Corp. | | | 1,443 | | | | 94,589 | | |
Trane Technologies plc | | | 1,366 | | | | 247,150 | | |
| | | | 906,239 | | |
Capital Markets - 3.3% | |
Ameriprise Financial, Inc. | | | 656 | | | | 198,197 | | |
Bank of New York Mellon Corp. (The) | | | 4,592 | | | | 271,846 | | |
BlackRock, Inc., Class A | | | 834 | | | | 786,846 | | |
Blackstone Group, Inc. (The) | | | 3,962 | | | | 548,420 | | |
Charles Schwab Corp. (The) | | | 8,689 | | | | 712,759 | | |
CME Group, Inc., Class A | | | 2,089 | | | | 460,729 | | |
Coinbase Global, Inc., Class A* | | | 170 | | | | 54,301 | | |
Goldman Sachs Group, Inc. (The) | | | 1,968 | | | | 813,473 | | |
Intercontinental Exchange, Inc. | | | 3,257 | | | | 450,964 | | |
KKR & Co., Inc. | | | 3,386 | | | | 269,763 | | |
MarketAxess Holdings, Inc. | | | 219 | | | | 89,499 | | |
Moody's Corp. | | | 929 | | | | 375,455 | | |
Morgan Stanley | | | 8,448 | | | | 868,284 | | |
MSCI, Inc., Class A | | | 482 | | | | 320,472 | | |
See accompanying Notes to Financial Statements.
7
Schedule of Investments (continued)
Engine No. 1 Transform 500 ETF | | 
| |
October 31, 2021
Investments | | Shares | | Value | |
Nasdaq, Inc. | | | 672 | | | $ | 141,033 | | |
Northern Trust Corp. | | | 1,218 | | | | 149,863 | | |
Raymond James Financial, Inc. | | | 1,071 | | | | 105,590 | | |
S&P Global, Inc. | | | 1,393 | | | | 660,505 | | |
State Street Corp. | | | 2,116 | | | | 208,532 | | |
T Rowe Price Group, Inc. | | | 1,311 | | | | 284,330 | | |
| | | | 7,770,861 | | |
Chemicals - 1.6% | |
Air Products & Chemicals, Inc. | | | 1,284 | | | | 384,956 | | |
Albemarle Corp. | | | 672 | | | | 168,316 | | |
Celanese Corp., Class A | | | 644 | | | | 104,012 | | |
Corteva, Inc. | | | 4,259 | | | | 183,776 | | |
Dow, Inc. | | | 4,319 | | | | 241,734 | | |
DuPont de Nemours, Inc. | | | 3,028 | | | | 210,749 | | |
Eastman Chemical Co. | | | 795 | | | | 82,704 | | |
Ecolab, Inc. | | | 1,449 | | | | 321,997 | | |
FMC Corp. | | | 732 | | | | 66,619 | | |
International Flavors & Fragrances, Inc. | | | 1,450 | | | | 213,803 | | |
Linde plc | | | 2,996 | | | | 956,323 | | |
LyondellBasell Industries NV, Class A | | | 1,527 | | | | 141,736 | | |
PPG Industries, Inc. | | | 1,365 | | | | 219,178 | | |
Sherwin-Williams Co. | | | 1,400 | | | | 443,254 | | |
| | | | 3,739,157 | | |
Commercial Services & Supplies - 0.4% | |
Cintas Corp. | | | 498 | | | | 215,684 | | |
Copart, Inc.* | | | 1,240 | | | | 192,560 | | |
Republic Services, Inc., Class A | | | 1,226 | | | | 165,020 | | |
Rollins, Inc. | | | 1,304 | | | | 45,940 | | |
Waste Management, Inc. | | | 2,233 | | | | 357,793 | | |
| | | | 976,997 | | |
Communications Equipment - 0.7% | |
Arista Networks, Inc.* | | | 328 | | | | 134,378 | | |
Cisco Systems, Inc. (Delaware) | | | 24,406 | | | | 1,366,004 | | |
Motorola Solutions, Inc. | | | 993 | | | | 246,850 | | |
Ubiquiti, Inc. | | | 30 | | | | 9,166 | | |
| | | | 1,756,398 | | |
Construction Materials - 0.1% | |
Martin Marietta Materials, Inc. | | | 369 | | | | 144,958 | | |
Vulcan Materials Co. | | | 781 | | | | 148,484 | | |
| | | | 293,442 | | |
Consumer Finance - 0.6% | |
Ally Financial, Inc. | | | 2,096 | | | | 100,063 | | |
American Express Co. | | | 3,721 | | | | 646,634 | | |
Capital One Financial Corp. | | | 2,585 | | | | 390,413 | | |
Discover Financial Services | | | 1,733 | | | | 196,384 | | |
Synchrony Financial | | | 3,293 | | | | 152,960 | | |
| | | | 1,486,454 | | |
Investments | | Shares | | Value | |
Containers & Packaging - 0.2% | |
Amcor plc | | | 8,920 | | | $ | 107,664 | | |
Avery Dennison Corp. | | | 475 | | | | 103,417 | | |
Ball Corp. | | | 1,896 | | | | 173,447 | | |
Crown Holdings, Inc. | | | 774 | | | | 80,488 | | |
International Paper Co. | | | 2,249 | | | | 111,708 | | |
| | | | 576,724 | | |
Distributors - 0.1% | |
Genuine Parts Co. | | | 835 | | | | 109,477 | | |
Pool Corp. | | | 229 | | | | 117,971 | | |
| | | | 227,448 | | |
Diversified Financial Services - 1.3% | |
Berkshire Hathaway, Inc., Class B* | | | 10,742 | | | | 3,083,061 | | |
Diversified Telecommunication Services - 1.0% | |
AT&T, Inc. | | | 41,338 | | | | 1,044,198 | | |
Verizon Communications, Inc. | | | 23,977 | | | | 1,270,541 | | |
| | | | 2,314,739 | | |
Electric Utilities - 1.4% | |
American Electric Power Co., Inc. | | | 2,885 | | | | 244,388 | | |
Avangrid, Inc. | | | 408 | | | | 21,502 | | |
Duke Energy Corp. | | | 4,465 | | | | 455,474 | | |
Edison International | | | 2,192 | | | | 137,943 | | |
Entergy Corp. | | | 1,153 | | | | 118,782 | | |
Eversource Energy | | | 1,986 | | | | 168,611 | | |
Exelon Corp. | | | 5,658 | | | | 300,949 | | |
FirstEnergy Corp. | | | 3,162 | | | | 121,832 | | |
NextEra Energy, Inc. | | | 11,372 | | | | 970,372 | | |
PG&E Corp.* | | | 8,766 | | | | 101,686 | | |
PPL Corp. | | | 4,465 | | | | 128,592 | | |
Southern Co. | | | 6,121 | | | | 381,461 | | |
Xcel Energy, Inc. | | | 3,106 | | | | 200,617 | | |
| | | | 3,352,209 | | |
Electrical Equipment - 0.6% | |
AMETEK, Inc. | | | 1,335 | | | | 176,754 | | |
Eaton Corp. plc | | | 2,315 | | | | 381,420 | | |
Emerson Electric Co. | | | 3,461 | | | | 335,752 | | |
Generac Holdings, Inc.* | | | 372 | | | | 185,464 | | |
Plug Power, Inc.* | | | 2,998 | | | | 114,733 | | |
Rockwell Automation, Inc. | | | 667 | | | | 213,040 | | |
| | | | 1,407,163 | | |
Electronic Equipment, Instruments & Components - 0.7% | |
Amphenol Corp., Class A | | | 3,463 | | | | 265,855 | | |
CDW Corp. | | | 803 | | | | 149,880 | | |
Cognex Corp. | | | 1,029 | | | | 90,130 | | |
Corning, Inc. | | | 4,461 | | | | 158,678 | | |
Keysight Technologies, Inc.* | | | 1,069 | | | | 192,441 | | |
TE Connectivity Ltd. | | | 1,903 | | | | 277,837 | | |
See accompanying Notes to Financial Statements.
8
Schedule of Investments (continued)
Engine No. 1 Transform 500 ETF | | 
| |
October 31, 2021
Investments | | Shares | | Value | |
Teledyne Technologies, Inc.* | | | 264 | | | $ | 118,594 | | |
Trimble, Inc.* | | | 1,462 | | | | 127,735 | | |
Zebra Technologies Corp., Class A* | | | 308 | | | | 164,457 | | |
| | | | 1,545,607 | | |
Energy Equipment & Services - 0.2% | |
Baker Hughes Co., Class A | | | 4,794 | | | | 120,234 | | |
Halliburton Co. | | | 5,161 | | | | 128,973 | | |
Schlumberger NV | | | 8,084 | | | | 260,790 | | |
| | | | 509,997 | | |
Entertainment - 2.0% | |
Activision Blizzard, Inc. | | | 4,509 | | | | 352,559 | | |
AMC Entertainment Holdings, Inc.
Class A*†† | | | 2,977 | | | | 105,296 | | |
Electronic Arts, Inc. | | | 1,657 | | | | 232,394 | | |
Live Nation Entertainment, Inc.* | | | 776 | | | | 78,492 | | |
Netflix, Inc.* | | | 2,568 | | | | 1,772,716 | | |
Roku, Inc., Class A* | | | 669 | | | | 203,978 | | |
Take-Two Interactive Software, Inc.* | | | 670 | | | | 121,270 | | |
Walt Disney Co.* | | | 10,530 | | | | 1,780,308 | | |
| | | | 4,647,013 | | |
Equity Real Estate Investment Trusts (REITs) - 2.4% | |
Alexandria Real Estate Equities, Inc. | | | 809 | | | | 165,149 | | |
American Tower Corp. | | | 2,632 | | | | 742,146 | | |
AvalonBay Communities, Inc. | | | 814 | | | | 192,658 | | |
Boston Properties, Inc. | | | 825 | | | | 93,753 | | |
Crown Castle International Corp. | | | 2,514 | | | | 453,274 | | |
Digital Realty Trust, Inc. | | | 1,648 | | | | 260,071 | | |
Duke Realty Corp. | | | 2,185 | | | | 122,884 | | |
Equinix, Inc. | | | 521 | | | | 436,113 | | |
Equity Residential | | | 1,968 | | | | 170,035 | | |
Essex Property Trust, Inc. | | | 382 | | | | 129,853 | | |
Extra Space Storage, Inc. | | | 786 | | | | 155,133 | | |
Healthpeak Properties, Inc. | | | 3,108 | | | | 110,365 | | |
Invitation Homes, Inc. | | | 3,325 | | | | 137,156 | | |
Mid-America Apartment
Communities, Inc. | | | 667 | | | | 136,208 | | |
Prologis, Inc. | | | 4,288 | | | | 621,589 | | |
Public Storage | | | 879 | | | | 291,986 | | |
Realty Income Corp. | | | 3,192 | | | | 228,005 | | |
SBA Communications Corp., Class A | | | 636 | | | | 219,630 | | |
Simon Property Group, Inc. | | | 1,905 | | | | 279,235 | | |
Sun Communities, Inc. | | | 667 | | | | 130,719 | | |
Ventas, Inc. | | | 2,293 | | | | 122,377 | | |
VICI Properties, Inc. | | | 3,549 | | | | 104,163 | | |
Welltower, Inc. | | | 2,439 | | | | 196,096 | | |
Weyerhaeuser Co. | | | 4,338 | | | | 154,953 | | |
| | | | 5,653,551 | | |
Investments | | Shares | | Value | |
Food & Staples Retailing - 1.3% | |
Costco Wholesale Corp. | | | 2,565 | | | $ | 1,260,800 | | |
Kroger Co. | | | 3,933 | | | | 157,399 | | |
Sysco Corp. | | | 2,969 | | | | 228,316 | | |
Walgreens Boots Alliance, Inc. | | | 4,152 | | | | 195,227 | | |
Walmart, Inc. | | | 8,292 | | | | 1,238,991 | | |
| | | | 3,080,733 | | |
Food Products - 0.8% | |
Archer-Daniels-Midland Co. | | | 3,239 | | | | 208,073 | | |
Campbell Soup Co. | | | 1,163 | | | | 46,462 | | |
Conagra Brands, Inc. | | | 2,786 | | | | 89,709 | | |
General Mills, Inc. | | | 3,505 | | | | 216,608 | | |
Hershey Co. | | | 845 | | | | 148,171 | | |
Hormel Foods Corp. | | | 1,644 | | | | 69,574 | | |
J M Smucker Co. | | | 630 | | | | 77,402 | | |
Kellogg Co. | | | 1,485 | | | | 91,031 | | |
Kraft Heinz Co. | | | 3,895 | | | | 139,792 | | |
McCormick & Co., Inc. | | | 1,450 | | | | 116,334 | | |
Mondelez International, Inc., Class A | | | 8,081 | | | | 490,839 | | |
Tyson Foods, Inc., Class A | | | 1,710 | | | | 136,749 | | |
| | | | 1,830,744 | | |
Health Care Equipment & Supplies - 3.5% | |
Abbott Laboratories | | | 10,280 | | | | 1,324,989 | | |
ABIOMED, Inc.* | | | 258 | | | | 85,666 | | |
Align Technology, Inc.* | | | 426 | | | | 265,982 | | |
Baxter International, Inc. | | | 2,884 | | | | 227,721 | | |
Becton Dickinson & Co. | | | 1,670 | | | | 400,115 | | |
Boston Scientific Corp.* | | | 8,239 | | | | 355,348 | | |
Cooper Cos, Inc. (The) | | | 277 | | | | 115,487 | | |
Danaher Corp. | | | 3,678 | | | | 1,146,690 | | |
Dexcom, Inc.* | | | 571 | | | | 355,853 | | |
Edwards Lifesciences Corp.* | | | 3,616 | | | | 433,269 | | |
Hologic, Inc.* | | | 1,471 | | | | 107,839 | | |
IDEXX Laboratories, Inc.* | | | 493 | | | | 328,407 | | |
Insulet Corp.* | | | 404 | | | | 125,248 | | |
Intuitive Surgical, Inc.* | | | 2,069 | | | | 747,178 | | |
Masimo Corp.* | | | 284 | | | | 80,525 | | |
Medtronic plc | | | 7,781 | | | | 932,631 | | |
Novocure Ltd.* | | | 505 | | | | 51,798 | | |
ResMed, Inc. | | | 846 | | | | 222,422 | | |
STERIS plc | | | 585 | | | | 136,738 | | |
Stryker Corp. | | | 1,942 | | | | 516,708 | | |
Teleflex, Inc. | | | 265 | | | | 94,589 | | |
Zimmer Biomet Holdings, Inc. | | | 1,220 | | | | 174,606 | | |
| | | | 8,229,809 | | |
See accompanying Notes to Financial Statements.
9
Schedule of Investments (continued)
Engine No. 1 Transform 500 ETF | | 
| |
October 31, 2021
Investments | | Shares | | Value | |
Health Care Providers & Services - 2.5% | |
AmerisourceBergen Corp., Class A | | | 866 | | | $ | 105,669 | | |
Anthem, Inc. | | | 1,425 | | | | 620,060 | | |
Cardinal Health, Inc. | | | 1,684 | | | | 80,512 | | |
Centene Corp.* | | | 3,386 | | | | 241,219 | | |
Cigna Corp. | | | 1,965 | | | | 419,744 | | |
CVS Health Corp. | | | 7,632 | | | | 681,385 | | |
DaVita, Inc.* | | | 391 | | | | 40,367 | | |
Guardant Health, Inc.* | | | 593 | | | | 69,256 | | |
HCA Healthcare, Inc. | | | 1,438 | | | | 360,161 | | |
Humana, Inc. | | | 742 | | | | 343,665 | | |
Laboratory Corp. of America Holdings* | | | 571 | | | | 163,888 | | |
McKesson Corp. | | | 890 | | | | 185,013 | | |
Quest Diagnostics, Inc. | | | 701 | | | | 102,893 | | |
UnitedHealth Group, Inc. | | | 5,466 | | | | 2,516,930 | | |
| | | | 5,930,762 | | |
Health Care Technology - 0.2% | |
Cerner Corp. | | | 1,714 | | | | 127,333 | | |
Teladoc Health, Inc.* | | | 933 | | | | 139,567 | | |
Veeva Systems, Inc., Class A* | | | 807 | | | | 255,828 | | |
| | | | 522,728 | | |
Hotels, Restaurants & Leisure - 2.0% | |
Airbnb, Inc., Class A* | | | 1,948 | | | | 332,446 | | |
Booking Holdings, Inc.* | | | 236 | | | | 571,304 | | |
Caesars Entertainment, Inc.* | | | 1,242 | | | | 135,949 | | |
Carnival Corp.* | | | 4,613 | | | | 102,224 | | |
Chipotle Mexican Grill, Inc., Class A* | | | 162 | | | | 288,203 | | |
Darden Restaurants, Inc. | | | 740 | | | | 106,664 | | |
Domino's Pizza, Inc. | | | 213 | | | | 104,151 | | |
DraftKings, Inc., Class A* | | | 1,920 | | | | 89,453 | | |
Expedia Group, Inc.* | | | 845 | | | | 138,926 | | |
Hilton Worldwide Holdings, Inc.* | | | 1,600 | | | | 230,320 | | |
Las Vegas Sands Corp.* | | | 1,987 | | | | 77,115 | | |
Marriott International, Inc., Class A* | | | 1,575 | | | | 252,032 | | |
McDonald's Corp. | | | 4,324 | | | | 1,061,757 | | |
MGM Resorts International | | | 2,322 | | | | 109,506 | | |
Penn National Gaming, Inc.* | | | 961 | | | | 68,808 | | |
Royal Caribbean Cruises Ltd.* | | | 1,297 | | | | 109,506 | | |
Starbucks Corp. | | | 6,839 | | | | 725,412 | | |
Yum! Brands, Inc. | | | 1,714 | | | | 214,147 | | |
| | | | 4,717,923 | | |
Household Durables - 0.2% | |
DR Horton, Inc. | | | 1,894 | | | | 169,077 | | |
Garmin Ltd. | | | 876 | | | | 125,794 | | |
Lennar Corp., Class A | | | 1,581 | | | | 157,989 | | |
NVR, Inc.* | | | 21 | | | | 102,791 | | |
| | | | 555,651 | | |
Investments | | Shares | | Value | |
Household Products - 1.2% | |
Church & Dwight Co., Inc. | | | 1,433 | | | $ | 125,187 | | |
Clorox Co. | | | 734 | | | | 119,649 | | |
Colgate-Palmolive Co. | | | 4,895 | | | | 372,950 | | |
Kimberly-Clark Corp. | | | 1,949 | | | | 252,376 | | |
Procter & Gamble Co. | | | 14,055 | | | | 2,009,725 | | |
| | | | 2,879,887 | | |
Independent Power & Renewable Electricity
Producers - 0.0%† | |
AES Corp. (The) | | | 3,863 | | | | 97,077 | | |
Industrial Conglomerates - 1.0% | |
3M Co. | | | 3,365 | | | | 601,258 | | |
General Electric Co. | | | 6,345 | | | | 665,400 | | |
Honeywell International, Inc. | | | 4,012 | | | | 877,104 | | |
Roper Technologies, Inc. | | | 616 | | | | 300,528 | | |
| | | | 2,444,290 | | |
Insurance - 1.8% | |
Aflac, Inc. | | | 3,586 | | | | 192,461 | | |
Allstate Corp. (The) | | | 1,715 | | | | 212,094 | | |
American International Group, Inc. | | | 4,955 | | | | 292,791 | | |
Aon plc, Class A | | | 1,305 | | | | 417,496 | | |
Arch Capital Group Ltd.* | | | 2,303 | | | | 96,311 | | |
Arthur J Gallagher & Co. | | | 1,210 | | | | 202,881 | | |
Brown & Brown, Inc. | | | 1,347 | | | | 85,009 | | |
Chubb Ltd. | | | 2,545 | | | | 497,242 | | |
Cincinnati Financial Corp. | | | 867 | | | | 105,288 | | |
Hartford Financial Services
Group, Inc. (The) | | | 2,003 | | | | 146,079 | | |
Markel Corp.* | | | 78 | | | | 102,424 | | |
Marsh & McLennan Cos, Inc. | | | 2,945 | | | | 491,226 | | |
MetLife, Inc. | | | 4,231 | | | | 265,707 | | |
Principal Financial Group, Inc. | | | 1,452 | | | | 97,415 | | |
Progressive Corp. (The) | | | 3,396 | | | | 322,212 | | |
Prudential Financial, Inc. | | | 2,230 | | | | 245,412 | | |
Travelers Cos, Inc. (The) | | | 1,452 | | | | 233,598 | | |
Willis Towers Watson plc | | | 748 | | | | 181,225 | | |
| | | | 4,186,871 | | |
Interactive Media & Services - 6.7% | |
Alphabet, Inc., Class A* | | | 1,744 | | | | 5,163,845 | | |
Alphabet, Inc., Class C* | | | 1,634 | | | | 4,845,480 | | |
Match Group, Inc.* | | | 1,591 | | | | 239,891 | | |
Meta Platforms Inc., Class A* | | | 13,818 | | | | 4,471,090 | | |
Pinterest, Inc., Class A* | | | 3,219 | | | | 143,696 | | |
Snap, Inc., Class A* | | | 6,063 | | | | 318,793 | | |
Twitter, Inc.* | | | 4,610 | | | | 246,819 | | |
| | | | 15,429,614 | | |
See accompanying Notes to Financial Statements.
10
Schedule of Investments (continued)
Engine No. 1 Transform 500 ETF | | 
| |
October 31, 2021
Investments | | Shares | | Value | |
Internet & Direct Marketing Retail - 4.1% | |
Amazon.com, Inc.* | | | 2,524 | | | $ | 8,512,014 | | |
DoorDash, Inc., Class A* | | | 883 | | | | 172,008 | | |
eBay, Inc. | | | 3,753 | | | | 287,930 | | |
Etsy, Inc.* | | | 722 | | | | 180,998 | | |
MercadoLibre, Inc.* | | | 266 | | | | 393,951 | | |
Wayfair, Inc., Class A* | | | 445 | | | | 110,850 | | |
| | | | 9,657,751 | | |
IT Services - 5.2% | |
Accenture plc, Class A | | | 3,672 | | | | 1,317,477 | | |
Akamai Technologies, Inc.* | | | 933 | | | | 98,394 | | |
Automatic Data Processing, Inc. | | | 2,441 | | | | 547,980 | | |
Broadridge Financial Solutions, Inc. | | | 669 | | | | 119,356 | | |
Cloudflare, Inc., Class A* | | | 1,523 | | | | 296,559 | | |
Cognizant Technology Solutions
Corp., Class A | | | 3,040 | | | | 237,394 | | |
EPAM Systems, Inc.* | | | 341 | | | | 229,575 | | |
Fidelity National Information
Services, Inc. | | | 3,589 | | | | 397,446 | | |
Fiserv, Inc.* | | | 3,452 | | | | 339,987 | | |
FleetCor Technologies, Inc.* | | | 474 | | | | 117,272 | | |
Gartner, Inc.* | | | 479 | | | | 158,985 | | |
Global Payments, Inc. | | | 1,705 | | | | 243,798 | | |
GoDaddy, Inc., Class A* | | | 991 | | | | 68,547 | | |
International Business Machines Corp. | | | 5,189 | | | | 649,144 | | |
Mastercard, Inc., Class A | | | 5,045 | | | | 1,692,698 | | |
MongoDB, Inc., Class A* | | | 380 | | | | 198,090 | | |
Okta, Inc., Class A* | | | 715 | | | | 176,734 | | |
Paychex, Inc. | | | 1,865 | | | | 229,917 | | |
PayPal Holdings, Inc.* | | | 6,819 | | | | 1,586,031 | | |
Snowflake, Inc., Class A* | | | 1,316 | | | | 465,653 | | |
Square, Inc., Class A* | | | 2,310 | | | | 587,895 | | |
Twilio, Inc., Class A* | | | 964 | | | | 280,871 | | |
VeriSign, Inc.* | | | 574 | | | | 127,813 | | |
Visa, Inc., Class A | | | 9,768 | | | | 2,068,570 | | |
| | | | 12,236,186 | | |
Leisure Products - 0.1% | |
Peloton Interactive, Inc., Class A* | | | 1,553 | | | | 142,006 | | |
Life Sciences Tools & Services - 1.4% | |
Agilent Technologies, Inc. | | | 1,752 | | | | 275,922 | | |
Avantor, Inc.* | | | 3,391 | | | | 136,929 | | |
Bio-Rad Laboratories, Inc., Class A* | | | 127 | | | | 100,924 | | |
Illumina, Inc.* | | | 852 | | | | 353,631 | | |
IQVIA Holdings, Inc.* | | | 1,104 | | | | 288,608 | | |
Mettler-Toledo International, Inc.* | | | 133 | | | | 196,957 | | |
PerkinElmer, Inc. | | | 649 | | | | 114,802 | | |
Thermo Fisher Scientific, Inc. | | | 2,291 | | | | 1,450,363 | | |
Waters Corp.* | | | 364 | | | | 133,788 | | |
Investments | | Shares | | Value | |
West Pharmaceutical Services, Inc. | | | 429 | | | $ | 184,419 | | |
| | | | 3,236,343 | | |
Machinery - 1.4% | |
Caterpillar, Inc. | | | 3,178 | | | | 648,343 | | |
Cummins, Inc. | | | 837 | | | | 200,746 | | |
Deere & Co. | | | 1,654 | | | | 566,181 | | |
Dover Corp. | | | 838 | | | | 141,689 | | |
Fortive Corp. | | | 2,086 | | | | 157,931 | | |
IDEX Corp. | | | 438 | | | | 97,486 | | |
Illinois Tool Works, Inc. | | | 1,667 | | | | 379,859 | | |
Ingersoll Rand, Inc.* | | | 2,351 | | | | 126,390 | | |
Otis Worldwide Corp. | | | 2,459 | | | | 197,482 | | |
PACCAR, Inc. | | | 2,003 | | | | 179,509 | | |
Parker-Hannifin Corp. | | | 742 | | | | 220,070 | | |
Stanley Black & Decker, Inc. | | | 935 | | | | 168,048 | | |
Westinghouse Air Brake
Technologies Corp. | | | 1,092 | | | | 99,077 | | |
Xylem, Inc./NY | | | 1,049 | | | | 136,989 | | |
| | | | 3,319,800 | | |
Media - 1.1% | |
Charter Communications, Inc.,
Class A* | | | 745 | | | | 502,792 | | |
Comcast Corp., Class A | | | 26,534 | | | | 1,364,643 | | |
Discovery, Inc., Class A* | | | 991 | | | | 23,229 | | |
Discovery, Inc., Class C* | | | 1,755 | | | | 39,593 | | |
Fox Corp., Class A | | | 1,881 | | | | 74,751 | | |
Fox Corp., Class B | | | 860 | | | | 31,786 | | |
Liberty Broadband Corp., Class A* | | | 151 | | | | 24,276 | | |
Liberty Broadband Corp., Class C* | | | 844 | | | | 137,108 | | |
Liberty Media Corp.-Liberty SiriusXM* | | | 454 | | | | 22,600 | | |
Liberty Media Corp.-Liberty SiriusXM* | | | 918 | | | | 45,276 | | |
Omnicom Group, Inc. | | | 1,247 | | | | 84,896 | | |
Sirius XM Holdings, Inc. | | | 5,399 | | | | 32,880 | | |
ViacomCBS, Inc., Class B | | | 3,503 | | | | 126,879 | | |
| | | | 2,510,709 | | |
Metals & Mining - 0.3% | |
Freeport-McMoRan, Inc. | | | 8,492 | | | | 320,319 | | |
Newmont Corp. | | | 4,616 | | | | 249,264 | | |
Nucor Corp. | | | 1,705 | | | | 190,363 | | |
Southern Copper Corp. | | | 485 | | | | 29,095 | | |
| | | | 789,041 | | |
Multiline Retail - 0.5% | |
Dollar General Corp. | | | 1,372 | | | | 303,925 | | |
Dollar Tree, Inc.* | | | 1,339 | | | | 144,291 | | |
Target Corp. | | | 2,859 | | | | 742,254 | | |
| | | | 1,190,470 | | |
See accompanying Notes to Financial Statements.
11
Schedule of Investments (continued)
Engine No. 1 Transform 500 ETF | | 
| |
October 31, 2021
Investments | | Shares | | Value | |
Multi-Utilities - 0.6% | |
Ameren Corp. | | | 1,493 | | | $ | 125,845 | | |
CMS Energy Corp. | | | 1,681 | | | | 101,448 | | |
Consolidated Edison, Inc. | | | 2,032 | | | | 153,213 | | |
Dominion Energy, Inc. | | | 4,690 | | | | 356,112 | | |
DTE Energy Co. | | | 1,118 | | | | 126,725 | | |
Public Service Enterprise Group, Inc. | | | 2,940 | | | | 187,572 | | |
Sempra Energy | | | 1,861 | | | | 237,519 | | |
WEC Energy Group, Inc. | | | 1,813 | | | | 163,279 | | |
| | | | 1,451,713 | | |
Oil, Gas & Consumable Fuels - 2.4% | |
Cheniere Energy, Inc.* | | | 1,358 | | | | 140,417 | | |
Chevron Corp. | | | 11,205 | | | | 1,282,861 | | |
ConocoPhillips | | | 7,758 | | | | 577,893 | | |
EOG Resources, Inc. | | | 3,390 | | | | 313,439 | | |
Exxon Mobil Corp. | | | 24,532 | | | | 1,581,579 | | |
Hess Corp. | | | 1,585 | | | | 130,873 | | |
Kinder Morgan, Inc. | | | 11,655 | | | | 195,221 | | |
Marathon Petroleum Corp. | | | 3,692 | | | | 243,414 | | |
Occidental Petroleum Corp. | | | 5,140 | | | | 172,344 | | |
ONEOK, Inc. | | | 2,582 | | | | 164,267 | | |
Phillips 66 | | | 2,541 | | | | 190,016 | | |
Pioneer Natural Resources Co. | | | 1,310 | | | | 244,944 | | |
Valero Energy Corp. | | | 2,369 | | | | 183,195 | | |
Williams Cos, Inc. (The) | | | 7,047 | | | | 197,950 | | |
| | | | 5,618,413 | | |
Personal Products - 0.2% | |
Estee Lauder Cos, Inc. (The), Class A | | | 1,338 | | | | 433,954 | | |
Pharmaceuticals - 3.4% | |
Bristol-Myers Squibb Co. | | | 12,880 | | | | 752,192 | | |
Catalent, Inc.* | | | 998 | | | | 137,584 | | |
Elanco Animal Health, Inc.* | | | 2,747 | | | | 90,321 | | |
Eli Lilly & Co. | | | 4,601 | | | | 1,172,151 | | |
Johnson & Johnson | | | 15,257 | | | | 2,485,060 | | |
Merck & Co., Inc. | | | 14,665 | | | | 1,291,253 | | |
Pfizer, Inc. | | | 32,462 | | | | 1,419,888 | | |
Royalty Pharma plc, Class A | | | 2,037 | | | | 80,523 | | |
Viatris, Inc. | | | 6,991 | | | | 93,330 | | |
Zoetis, Inc., Class A | | | 2,751 | | | | 594,766 | | |
| | | | 8,117,068 | | |
Professional Services - 0.5% | |
Clarivate plc* | | | 2,155 | | | | 50,535 | | |
CoStar Group, Inc.* | | | 2,298 | | | | 197,743 | | |
Equifax, Inc. | | | 698 | | | | 193,646 | | |
IHS Markit Ltd. | | | 2,316 | | | | 302,747 | | |
Jacobs Engineering Group, Inc. | | | 740 | | | | 103,911 | | |
Leidos Holdings, Inc. | | | 823 | | | | 82,284 | | |
TransUnion | | | 1,104 | | | | 127,280 | | |
Investments | | Shares | | Value | |
Verisk Analytics, Inc., Class A | | | 926 | | | $ | 194,710 | | |
| | | | 1,252,856 | | |
Real Estate Management & Development - 0.1% | |
CBRE Group, Inc., Class A* | | | 1,944 | | | | 202,331 | | |
Zillow Group, Inc., Class A* | | | 213 | | | | 22,518 | | |
Zillow Group, Inc., Class C* | | | 993 | | | | 102,905 | | |
| | | | 327,754 | | |
Road & Rail - 1.2% | |
CSX Corp. | | | 13,044 | | | | 471,801 | | |
JB Hunt Transport Services, Inc. | | | 481 | | | | 94,848 | | |
Kansas City Southern | | | 527 | | | | 163,502 | | |
Lyft, Inc., Class A* | | | 1,686 | | | | 77,337 | | |
Norfolk Southern Corp. | | | 1,440 | | | | 421,992 | | |
Old Dominion Freight Line, Inc. | | | 557 | | | | 190,132 | | |
Uber Technologies, Inc.* | | | 9,372 | | | | 410,681 | | |
Union Pacific Corp. | | | 3,762 | | | | 908,147 | | |
| | | | 2,738,440 | | |
Semiconductors & Semiconductor Equipment - 5.7% | |
Advanced Micro Devices, Inc.* | | | 7,038 | | | | 846,179 | | |
Analog Devices, Inc. | | | 3,103 | | | | 538,339 | | |
Applied Materials, Inc. | | | 5,307 | | | | 725,202 | | |
Broadcom, Inc. | | | 2,376 | | | | 1,263,248 | | |
Enphase Energy, Inc.* | | | 790 | | | | 182,988 | | |
Entegris, Inc. | | | 794 | | | | 111,779 | | |
Intel Corp. | | | 23,500 | | | | 1,151,500 | | |
KLA Corp. | | | 881 | | | | 328,402 | | |
Lam Research Corp. | | | 831 | | | | 468,327 | | |
Marvell Technology, Inc. | | | 4,747 | | | | 325,170 | | |
Microchip Technology, Inc. | | | 3,156 | | | | 233,828 | | |
Micron Technology, Inc. | | | 6,512 | | | | 449,979 | | |
Monolithic Power Systems, Inc. | | | 244 | | | | 128,212 | | |
NVIDIA Corp. | | | 14,439 | | | | 3,691,618 | | |
NXP Semiconductors NV | | | 1,531 | | | | 307,517 | | |
ON Semiconductor Corp.* | | | 2,505 | | | | 120,415 | | |
Qorvo, Inc.* | | | 644 | | | | 108,340 | | |
QUALCOMM, Inc. | | | 6,575 | | | | 874,738 | | |
Skyworks Solutions, Inc. | | | 944 | | | | 157,771 | | |
SolarEdge Technologies, Inc.* | | | 307 | | | | 108,887 | | |
Teradyne, Inc. | | | 943 | | | | 130,360 | | |
Texas Instruments, Inc. | | | 5,351 | | | | 1,003,205 | | |
Xilinx, Inc. | | | 1,442 | | | | 259,560 | | |
| | | | 13,515,564 | | |
Software - 11.1% | |
Adobe, Inc.* | | | 2,763 | | | | 1,796,945 | | |
ANSYS, Inc.* | | | 509 | | | | 193,206 | | |
Autodesk, Inc.* | | | 1,277 | | | | 405,588 | | |
Black Knight, Inc.* | | | 902 | | | | 63,239 | | |
Cadence Design Systems, Inc.* | | | 1,591 | | | | 275,418 | | |
See accompanying Notes to Financial Statements.
12
Schedule of Investments (continued)
Engine No. 1 Transform 500 ETF | | 
| |
October 31, 2021
Investments | | Shares | | Value | |
Ceridian HCM Holding, Inc.* | | | 791 | | | $ | 99,073 | | |
Citrix Systems, Inc. | | | 711 | | | | 67,353 | | |
Coupa Software, Inc.* | | | 426 | | | | 97,000 | | |
Crowdstrike Holdings, Inc., Class A* | | | 1,146 | | | | 322,943 | | |
Datadog, Inc., Class A* | | | 1,376 | | | | 229,861 | | |
DocuSign, Inc., Class A* | | | 1,124 | | | | 312,798 | | |
Fair Isaac Corp.* | | | 169 | | | | 67,296 | | |
Fortinet, Inc.* | | | 794 | | | | 267,054 | | |
HubSpot, Inc.* | | | 261 | | | | 211,470 | | |
Intuit, Inc. | | | 1,582 | | | | 990,316 | | |
Microsoft Corp. | | | 43,557 | | | | 14,444,373 | | |
Oracle Corp. | | | 9,533 | | | | 914,596 | | |
Palantir Technologies, Inc., Class A* | | | 9,076 | | | | 234,887 | | |
Palo Alto Networks, Inc.* | | | 574 | | | | 292,218 | | |
Paycom Software, Inc.* | | | 278 | | | | 152,302 | | |
PTC, Inc.* | | | 617 | | | | 78,575 | | |
RingCentral, Inc., Class A* | | | 464 | | | | 113,114 | | |
salesforce.com, Inc.* | | | 5,624 | | | | 1,685,457 | | |
ServiceNow, Inc.* | | | 1,149 | | | | 801,726 | | |
Splunk, Inc.* | | | 938 | | | | 154,601 | | |
SS&C Technologies Holdings, Inc. | | | 1,287 | | | | 102,278 | | |
Synopsys, Inc.* | | | 880 | | | | 293,198 | | |
Trade Desk, Inc. (The), Class A* | | | 2,523 | | | | 188,998 | | |
Tyler Technologies, Inc.* | | | 233 | | | | 126,570 | | |
VMware, Inc., Class A* | | | 459 | | | | 69,630 | | |
Workday, Inc., Class A* | | | 1,092 | | | | 316,658 | | |
Zendesk, Inc.* | | | 691 | | | | 70,344 | | |
Zoom Video Communications, Inc.,
Class A* | | | 1,255 | | | | 344,686 | | |
Zscaler, Inc.* | | | 448 | | | | 142,849 | | |
| | | | 25,926,620 | | |
Specialty Retail - 2.3% | |
AutoZone, Inc.* | | | 126 | | | | 224,890 | | |
Bath & Body Works, Inc. | | | 1,529 | | | | 105,639 | | |
Best Buy Co., Inc. | | | 1,304 | | | | 159,401 | | |
Burlington Stores, Inc.* | | | 389 | | | | 107,477 | | |
CarMax, Inc.* | | | 934 | | | | 127,883 | | |
Carvana Co., Class A* | | | 483 | | | | 146,436 | | |
Home Depot, Inc. (The) | | | 6,172 | | | | 2,294,378 | | |
Lowe's Cos, Inc. | | | 4,095 | | | | 957,493 | | |
O'Reilly Automotive, Inc.* | | | 405 | | | | 252,040 | | |
Ross Stores, Inc. | | | 2,080 | | | | 235,456 | | |
TJX Cos, Inc. (The) | | | 6,979 | | | | 457,055 | | |
Tractor Supply Co. | | | 659 | | | | 143,115 | | |
Ulta Beauty, Inc.* | | | 314 | | | | 115,351 | | |
| | | | 5,326,614 | | |
Technology Hardware, Storage & Peripherals - 6.1% | |
Apple, Inc. | | | 91,024 | | | | 13,635,395 | | |
Dell Technologies, Inc., Class C* | | | 1,595 | | | | 175,434 | | |
Investments | | Shares | | Value | |
Hewlett Packard Enterprise Co. | | | 7,561 | | | $ | 110,769 | | |
HP, Inc. | | | 6,953 | | | | 210,884 | | |
NetApp, Inc. | | | 1,296 | | | | 115,733 | | |
Seagate Technology Holdings plc | | | 1,222 | | | | 108,844 | | |
Western Digital Corp.* | | | 1,770 | | | | 92,553 | | |
| | | | 14,449,612 | | |
Textiles, Apparel & Luxury Goods - 0.7% | |
Lululemon Athletica, Inc.* | | | 679 | | | | 316,421 | | |
NIKE, Inc., Class B | | | 7,396 | | | | 1,237,276 | | |
VF Corp. | | | 1,893 | | | | 137,962 | | |
| | | | 1,691,659 | | |
Tobacco - 0.6% | |
Altria Group, Inc. | | | 10,736 | | | | 473,565 | | |
Philip Morris International, Inc. | | | 9,030 | | | | 853,696 | | |
| | | | 1,327,261 | | |
Trading Companies & Distributors - 0.2% | |
Fastenal Co. | | | 3,317 | | | | 189,335 | | |
United Rentals, Inc.* | | | 421 | | | | 159,605 | | |
WW Grainger, Inc. | | | 246 | | | | 113,925 | | |
| | | | 462,865 | | |
Water Utilities - 0.1% | |
American Water Works Co., Inc. | | | 1,056 | | | | 183,934 | | |
Wireless Telecommunication Services - 0.2% | |
T-Mobile US, Inc.* | | | 3,403 | | | | 391,447 | | |
Total Common Stocks
(Cost $221,940,166) | | | 235,153,637 | | |
Securities Lending Reinvestment††† | |
Money Market Fund - 0.0%† | |
Fidelity Investments Money Market
Treasury Portfolio – Institutional
Class, 0.01%
(Cost $100,224) | | | 100,224 | | | | 100,224 | | |
Total Investments - 99.9%
(Cost $222,040,390) | | | | $ | 235,253,861 | | |
Other Assets Less Liabilities – 0.1% | | | | | 180,427 | | |
Net Assets - 100.0% | | $ | 235,434,288 | | |
* Non-income producing security.
† Represents less than 0.05%.
†† The security or a portion of this security is on loan at October 31, 2021. The total value of securities on loan at October 31, 2021 was $98,470, collateralized in the form of cash with a value of $100,224 that was reinvested in the securities shown in the Securities Lending Reinvestment section of the Schedule of Investments. The total value of collateral is $100,224.
††† The security was purchased with cash collateral held from securities on loan at October 31, 2021. The total value of securities purchased was $100,224.
See accompanying Notes to Financial Statements.
13
Schedule of Investments (continued)
Engine No. 1 Transform 500 ETF | | 
| |
October 31, 2021
Futures Contract Purchased
Engine No. 1 Transform 500 ETF had the following open long future contract as of October 31, 2021:
| | | Number of
Contracts | | Expiration
Date | | Trading
Currency | | Notional
Amount | | Value and
Unrealized
Appreciation | |
S&P 500 E-Mini Stock Index | | | 1 | | | 12/17/2021 | | USD | | | | $ | 229,850 | | | $ | 8,825 | | |
Fair Value Measurement
The Fund discloses the fair market value of its investments in a hierarchy that distinguishes between: (1) market participant assumptions developed based on market data obtained from sources independent of the Fund (observable inputs) and (2) the Fund' own assumptions about market participant assumptions developed based on the best information available under the circumstances (unobservable inputs). The three levels defined by the hierarchy are as follows:
• Level 1 — Quoted prices in active markets for identical assets that the Fund has the ability to access.
• Level 2 — Other significant observable inputs (including quoted prices for similar securities, interest rates, prepayment speeds, credit risk, etc.).
• Level 3 — Significant unobservable inputs (including the Fund's own assumptions in determining the fair value of investments).
The inputs or methodology used for valuing securities are not necessarily an indication of the risk associated with investing in those securities.
The following is a summary of the valuations as of October 31, 2021 for the Fund based upon the three levels defined above:
Engine No. 1 Transform 500 ETF | | Level 1 | | Level 2 | | Level 3 | | Total | |
Investments | |
Assets | |
Common Stocks* | | $ | 235,153,637 | | | $ | – | | | $ | – | | | $ | 235,153,637 | | |
Money Market Fund | | | 100,224 | | | | – | | | | – | | | | 100,224 | | |
Total Investments | | $ | 235,253,861 | | | $ | – | | | $ | – | | | $ | 235,253,861 | | |
Other Financial Instruments | |
Assets | |
Futures Contracts** | | $ | 8,825 | | | $ | – | | | $ | – | | | $ | 8,825 | | |
Total Other Financial Instruments | | $ | 8,825 | | | $ | – | | | $ | – | | | $ | 8,825 | | |
* Please refer to the Schedule of Investments to view securities segregated by industry type.
** Futures Contracts Purchased.
See accompanying Notes to Financial Statements.
14
Statement of Assets and Liabilities | | 
| |
| | | Engine No. 1
Transform 500
ETF | |
ASSETS: | |
Investments in securities at value (Note 2)(1) | | $ | 235,253,861 | | |
Cash | | | 163,652 | | |
Segregated cash balance with broker for futures contracts | | | 20,982 | | |
Receivables: | |
Dividends and interest | | | 163,282 | | |
Securities lending income | | | 11 | | |
Reclaims | | | 1,036 | | |
Unrealized appreciation on future contracts | | | 8,825 | | |
Total Assets | | | 235,611,649 | | |
LIABILITIES: | |
Payables: | |
Investment securities purchased | | | 67,868 | | |
Management fees (Note 3) | | | 9,269 | | |
Collateral received from securities loaned (Note 2) | | | 100,224 | | |
Total Liabilities | | | 177,361 | | |
NET ASSETS | | $ | 235,434,288 | | |
NET ASSETS CONSIST OF: | |
Paid-in capital | | $ | 222,155,264 | | |
Total distributable earnings | | | 13,279,024 | | |
NET ASSETS | | $ | 235,434,288 | | |
Shares outstanding | | | 4,320,000 | | |
Net asset value, per share | | $ | 54.50 | | |
Investment in securities at cost | | $ | 222,040,390 | | |
(1) Includes securities on loan with market value $98,470.
See accompanying Notes to Financial Statements.
15
Statement of Operations | | 
| |
For the Period Ended October 31, 2021
| | | Engine No. 1
Transform 500
ETF* | |
INVESTMENT INCOME: | |
Dividend income | | $ | 731,949 | | |
Securities lending income (Note 2) | | | 11 | | |
Other income | | | 480 | | |
Foreign withholding tax on dividends | | | (108 | ) | |
Total Income | | | 732,332 | | |
EXPENSES: | |
Management fees (Note 3) | | | 30,587 | | |
Total Expenses | | | 30,587 | | |
Net Investment Income(1) | | | 701,745 | | |
NET REALIZED AND UNREALIZED GAIN (LOSS) ON INVESTMENTS: | |
Net realized gain (loss) on: | |
Investments in securities | | | (194,898 | ) | |
In-kind redemptions of investments | | | 321,052 | | |
Expiration or closing of futures contracts | | | 16,915 | | |
Net realized gain | | | 143,069 | | |
Change in unrealized appreciation on: | |
Investments in securities | | | 13,213,471 | | |
Future contracts | | | 8,825 | | |
Change in net unrealized appreciation | | | 13,222,296 | | |
Net realized and unrealized gain on investments | | | 13,365,365 | | |
Net Increase in Net Assets Resulting From Operations | | $ | 14,067,110 | | |
* The Fund commenced investment operations on June 22, 2021.
(1) Net investment income (loss) represents dividends and other income received by the Fund from its underlying investments less expenses paid by the Fund during the period.
See accompanying Notes to Financial Statements.
16
Statement of Changes in Net Assets | | 
| |
For the Period Ended October 31, 2021
| | | Engine No. 1
Transform 500
ETF* | |
OPERATIONS: | |
Net investment income(1) | | $ | 701,745 | | |
Net realized gain on investments | | | 143,069 | | |
Net change in unrealized appreciation on investments | | | 13,222,296 | | |
Net increase in net assets resulting from operations | | | 14,067,110 | | |
DISTRIBUTIONS TO SHAREHOLDERS: | |
Distributions from distributable earnings | | | (467,032 | ) | |
CAPITAL TRANSACTIONS: | |
Proceeds from shares sold | | | 225,011,715 | | |
Cost of shares redeemed | | | (3,277,505 | ) | |
Net increase in net assets from capital transactions | | | 221,734,210 | | |
Increase in net assets | | | 235,334,288 | | |
NET ASSETS: | |
Beginning of period(2) | | | 100,000 | | |
End of period | | $ | 235,434,288 | | |
CHANGES IN SHARES OUTSTANDING: | |
Shares outstanding, beginning of period(2) | | | 2,000 | | |
Shares sold | | | 4,380,000 | | |
Shares redeemed | | | (62,000 | ) | |
Shares outstanding, end of period | | | 4,320,000 | | |
* The Fund commenced investment operations on June 22, 2021.
(1) Net investment income (loss) represents dividends and other income received by the Fund from its underlying investments less expenses paid by the Fund during the period.
(2) Beginning capital of $100,000 was contributed by Fund Management at Engine No. 1 LLC, investment adviser to the Fund, in exchange for 2,000 Shares of the Fund in connection with the seeding of the Trust. The Shares were redeemed by the adviser on the commencement of investment operations on June 22, 2021.
See accompanying Notes to Financial Statements.
17
Financial Highlights
Engine No. 1 Transform 500 ETF | | 
| |
For a share outstanding throughout the period presented.
| | | For the period
June 22, 2021 through
October 31, 2021(1) | |
Per Share Data: | |
Net asset value, beginning of period | | $ | 50.18 | (2) | |
Net investment income(3) | | | 0.22 | | |
Net realized and unrealized gain on investments | | | 4.23 | | |
Total gain from investment operations | | | 4.45 | | |
Distributions to shareholders: | |
Net investment income | | | (0.13 | ) | |
Total distributions | | | (0.13 | ) | |
Net asset value, end of period | | $ | 54.50 | | |
Market value, end of period (Unaudited) | | $ | 54.49 | | |
Total Return at Net Asset Value(4) | | | 8.87 | % | |
Total Return at Market Value(4) | | | 8.86 | % | |
Ratios/Supplemental Data: | |
Net assets, end of period (000's omitted) | | $ | 235,434 | | |
Ratio to average net assets of: | |
Expenses | | | 0.05 | %(5) | |
Net investment income(6) | | | 1.15 | %(5) | |
Portfolio turnover rate(7) | | | 1 | % | |
(1) Commencement of investment operations on June 22, 2021.
(2) The net asset value at the beginning of the period differs from the beginning net asset value reflected on the Statement of Changes in Net Assets due to a change in unrealized gain/(loss) from the inception date, June 22, 2021, to when the initial basket was created.
(3) Based on average daily shares outstanding.
(4) Net asset value total return is calculated assuming an initial investment made at the net asset value at the beginning of the period, reinvestment of all dividends and distributions at net asset value during the period and redemption on the last day of the period at net asset value. Market value total return is calculated assuming an initial investment made at the market value at the beginning of the period, reinvestment of all dividends, and distributions at market value during the period, and sale at the market value on the last day of the period. Market values are based on the trade price at which shares are bought and sold on the Cboe BZX Exchange, Inc. using the closing price. Total return calculated for a period of less than one year is not annualized.
(5) Annualized.
(6) Net investment income (loss) represents dividends and other income received by the Fund from its underlying investments less expenses paid by the Fund during the period.
(7) Portfolio turnover rate is not annualized and excludes the value of portfolio securities received or delivered as a result of in-kind creations or redemptions of the Fund's capital shares.
See accompanying Notes to Financial Statements.
18
Notes to Financial Statements
October 31, 2021 | | 
| |
1. Organization
The Engine No. 1 ETF Trust (the "Trust") is a Delaware statutory trust organized on October 26, 2020 and is authorized to issue multiple series or portfolios. The Trust is an open-end management investment company, registered under the Investment Company Act of 1940, as amended (the "1940 Act"). The Trust currently consists of one operational exchange-traded fund, Engine No. 1 Transform 500 ETF ("Fund"). The Fund is a diversified series of the Trust and seeks investment results that closely correspond, before fees and expenses, to the performance of the Morningstar® US Large Cap Select IndexSM. There can be no assurance that the Fund will achieve its respective investment objective.
Fund Management at Engine No. 1 LLC (the "Adviser") is the investment adviser to the Fund.
The Trust's fiscal and tax reporting period end is October 31.
2. Significant Accounting Policies
The Trust, which is an investment company, follows accounting and reporting guidance under Financial Accounting Standards Board ("FASB") Accounting Standards Codification Topic 946, "Financial Services — Investment Companies."
The following is a summary of significant accounting policies consistently followed by the Fund in the preparation of the financial statements. These policies have been prepared in conformity with accounting principles generally accepted in the United States of America ("GAAP"). The preparation of financial statements in conformity with U.S. GAAP requires management to make estimates and assumptions that affect the reported amounts and disclosure of contingent assets and liabilities at the date of the financial statements and the reported amounts of increases and decreases in net assets from operations during the reporting period. Actual results could differ from those estimates.
Investment Valuation
The NAV of the Fund's shares is calculated each business day as of the close of regular trading on the NYSE, generally 4:00 p.m., Eastern Time. NAV per share is computed by dividing the net assets by the number of each Fund's shares outstanding.
Generally, securities traded or dealt in upon one or more securities exchanges for which market quotations are readily available and not subject to restrictions against resale are valued at the last quoted sales price on the primary exchange or, in the absence of a sale on the primary exchange, at the mean between the current bid and ask prices on such exchange. Securities primarily traded in the National Association of Securities Dealers' Automated Quotation System ("NASDAQ") National Market System for which market quotations are readily available are valued using the NASDAQ Official Closing Price. Securities that are not traded or dealt in any securities exchange and for which over-the-counter market quotations are readily available generally are valued at the last sale price or, in the absence of a sale, at the mean between the current bid and ask price on such over-the-counter market. Futures contracts listed for trading on a futures exchange or board of trade for which market quotations are generally available are valued at the last quoted sale price, or, in the absence of a sale, at the mean of the last bid and ask price. Investments in open-end regulated investment companies are valued at NAV.
If market quotations are not readily available, securities are priced at their fair value in accordance with the Trust's valuation guidelines, which were approved by the Board of Trustees. The Fund may use fair value pricing in a variety of circumstances, including but not limited to, situations when the value of a Fund's security has been materially affected by events occurring after the close of the market on which such security is principally traded (such as a corporate action or other news that may materially affect the price of such security) or trading in such security has been suspended or halted.
The Fund may use independent pricing services to assist in calculating the value of the Fund's securities or other assets.
Futures Contracts
Futures contracts provide for the future sale by one party and purchase by another party of a specified amount of a specific asset, currency, rate or index at a specified future time and at a specified price. Stock index futures are based on investments that reflect the market value of common stock of the firms included in an underlying index. The Fund may enter into futures contracts to purchase securities indexes when the Adviser anticipates purchasing the underlying securities and believes prices will rise before the purchase will be made. To the extent required by law, liquid assets committed to futures contracts will be maintained.
Futures contracts may be bought and sold on U.S. and non-U.S. exchanges. Futures contracts in the U.S. have been designed by exchanges that have been designated "contract markets" by the CFTC and must be executed through the futures commission merchant ("FCM"). Each exchange guarantees performance of the contracts as between the clearing members of the exchange, thereby reducing the risk
19
Notes to Financial Statements (continued)
October 31, 2021 | | 
| |
of counterparty default. Futures contracts may also be entered into on certain exempt markets, including exempt boards of trade and electronic trading facilities, available to certain market participants. Because all transactions in the futures market are made, offset or fulfilled by an FCM through a clearinghouse associated with the exchange on which the contracts are traded, the Fund will incur brokerage fees when it buys or sells futures contracts.
Upon entering into a futures contract, the Fund will be required to deliver to an account controlled by the FCM an amount of cash or cash equivalents known as "initial margin," which is in the nature of a performance bond or good faith deposit on the contract and is returned to the Fund upon termination of the futures contract, assuming all contractual obligations have been satisfied. Subsequent payments, known as "variation margin," to and from the FCM will be made as the price of the instrument or index underlying the futures contract fluctuates, making the long and short positions in the futures contract more or less valuable, a process known as "marking-to-market."
At any time prior to the expiration of a futures contract, the Fund may elect to close the position by taking an opposite position, which will operate to terminate the Fund's existing position in the contract. This transaction, which is effected through a member of an exchange, cancels the obligation to make or take delivery of the underlying instrument or asset. Although some futures contracts by their terms require the actual delivery or acquisition of the underlying instrument or asset, some require cash settlement.
There are several risks accompanying the utilization of futures contracts. Utilization of futures by the Fund involves the risk of imperfect or even negative correlation to its Underlying Index if the index underlying the futures contract differs from the Underlying Index. There is also the risk of loss of margin deposits in the event of bankruptcy of a broker with whom the Fund has an open position in the futures contract.
Because the futures market generally imposes less burdensome margin requirements than the securities market, an increased amount of participation by speculators in the futures market could result in price fluctuations. Certain financial futures exchanges limit the amount of fluctuation permitted in futures contract prices during a single trading day. The daily limit establishes the maximum amount by which the price of a futures contract may vary either up or down from the previous day's settlement price at the end of a trading session. Once the daily limit has been reached in a particular type of contract, no trades may be made on that day at a price beyond that limit. It is possible that futures contract prices could move to the daily limit for several consecutive trading days with little or no trading, thereby preventing prompt liquidation of futures positions and subjecting the Fund to substantial losses. In the event of adverse price movements, the Fund would be required to make daily cash payments of variation margin.
The following tables indicate the location of derivative-related items on the Statement of Assets and Liabilities as well as the effect of derivative instruments on the Statement of Operations during the reporting period.
Fair Value of Derivative Instruments as of October 31, 2021
Engine No.1 Transform 500 ETF
| | | Asset Derivatives | | Liabilities Derivatives | |
Derivatives Not Accounted for as
Hedging Instruments under ASC 815 | | Statement of Assets
and Liabilities | | Unrealized
Appreciation* | | Statement of Assets
and Liabilities | | Unrealized
Depreciation* | |
| Equity Index Futures Contracts | | Unrealized
appreciation on
futures contracts* | | $ | 8,825 | * | | Unrealized
depreciation on
futures contracts* | | $ | — | | |
* Includes cumulative appreciation (depreciation) of futures contracts as reported in the Schedule of Investments.
Derivatives Not Accounted for as
Hedging Instruments under ASC 815 | | Location of Gain (Loss) on
Derivatives | | Realized Gain (Loss) on
Derivatives | | Change in Unrealized
Appreciation (Depreciation)
on Derivatives | |
Equity Index Futures Contracts | | Net realized gain (loss) on
expiration or closing of futures
contracts; change in net
unrealized appreciation
(depreciation) on futures
contracts | | $ | 16,915 | | | $ | 8,825 | | |
20
Notes to Financial Statements (continued)
October 31, 2021 | | 
| |
Securities Lending
The Fund may lend portfolio securities to certain borrowers. The borrowers provide collateral that is maintained in an amount at least equal to the current market value of the securities loaned. The Fund may terminate a loan at any time and obtain the return of the securities loaned. The Fund receives the value of any interest or cash or noncash distributions paid on the loaned securities. Distributions received on loaned securities in lieu of dividend payments (i.e., substitute payments) would not be considered qualified dividend income.
With respect to loans that are collateralized by cash, the borrower will be entitled to receive a fee based on the amount of cash collateral. The Fund is compensated by the difference between the amount earned on the reinvestment of cash collateral and the fee paid to the borrower. In the case of collateral other than cash, the Fund is compensated by a fee paid by the borrower equal to a percentage of the market value of the loaned securities. Any cash collateral may be reinvested in certain short-term instruments either directly on behalf of the lending Fund or through one or more joint accounts or money market funds, which may include those managed by the Adviser.
The Fund may pay a portion of the interest or fees earned from securities lending to a borrower as described above, and to one or more securities lending agents approved by the Board who administer the lending program for the Fund in accordance with guidelines approved by the Board. In such capacity, the lending agent causes the delivery of loaned securities from the Fund to borrowers, arranges for the return of loaned securities to the Fund at the termination of a loan, requests deposit of collateral, monitors the daily value of the loaned securities and collateral, requests that borrowers add to the collateral when required by the loan agreements, and provides recordkeeping and accounting services necessary for the operation of the program. Securities lending involves exposure to certain risks, including operational risk (i.e., the risk of losses resulting from problems in the settlement and accounting process), "gap" risk (i.e., the risk of a mismatch between the return on cash collateral reinvestments and the fees a Fund has agreed to pay a borrower), and credit, legal, counterparty and market risk. In the event a borrower does not return the Fund's securities as agreed, the Fund may experience losses if the proceeds received from liquidating the collateral do not at least equal the value of the loaned security at the time the collateral is liquidated plus the transaction costs incurred in purchasing replacement securities. Investing cash collateral subjects the Fund to greater market risk, including losses on the collateral and, should the Fund need to look to the collateral in the event of the borrower's default, losses on the loan secured by that collateral.
The following table summarizes the Fund's securities lending agreements by counterparty which are subject to rights of offset as of October 31, 2021:
Engine No. 1 Transform 500 ETF
Counterparty | | Value of
Securities on
Loan | | Cash Collateral
Received(a) | | Fair Value on
Non-Cash
Collateral
Received | | Net Exposure(b) | |
Bank of America Securities, Inc. | | $ | 98,470 | | | $ | 98,470 | | | $ | — | | | $ | — | | |
(a) Collateral with a value of $100,224 has been received in connection with securities lending agreements. The amount of collateral reflected in the table does not include any over-collateralization received by the Fund.
(b) Net exposure represents the receivable (payable) due from (to) the counterparty in the event of default.
The table below represents the disaggregation at October 31, 2021 of the gross amount of recognized liabilities for securities lending transactions. As the securities loaned are subject to termination by the Fund or the borrower at any time, the remaining contractual maturities of the transactions presented below are considered to be overnight and continuous.
| | | Remaining Contractual Maturity of the Agreements
as of October 31, 2021 | |
| | | Overnight and
Continuous | | < 30 days | | Between 30 &
90 days | | > 90 days | | Total | |
Engine No. 1 Transform 500 ETF | |
Securities Lending Transactions
Money Market Fund | | $ | 100,224 | | | $ | — | | | $ | — | | | $ | — | | | $ | 100,224 | | |
Total borrowings | | | | | | | | | | $ | 100,224 | | |
Gross amount of recognized liabilities for securities lending transactions | | | | | | | | | | $ | 100,224 | | |
21
Notes to Financial Statements (continued)
October 31, 2021 | | 
| |
Investment Transactions
Investment transactions are accounted for as of the trade date. Realized gains and losses on sales of investment securities are calculated using the identified cost method. Dividend income is recognized on the ex-dividend date. Interest income and expenses are recognized on the accrual basis.
Dividend Distributions
Distributions to shareholders are recorded on the ex-dividend date and are determined in accordance with federal income tax regulations, which may differ from U.S. GAAP. The Fund intends to declare and make distributions of taxable net investment income quarterly and net capital gains annually. Distributions from net realized gains for book purposes may include short-term capital gains, which are included as ordinary income for tax purposes. Therefore, no provision for federal income tax should be required.
Organizational and Offering Costs
The Adviser has agreed to bear all organizational and offering expenses for the Fund.
3. Management and Other Agreements
Management
The Adviser, located at 710 Sansome Street, San Francisco, CA 94111, furnishes investment advisory services to the Fund pursuant to an Investment Advisory Agreement with the Trust on behalf of the Fund (the "Investment Advisory Agreement"), subject to the supervision and direction of the Board. The Adviser is registered with the Securities and Exchange Commission ("SEC") as an investment adviser under the Investment Advisers Act of 1940, as amended.
For its investment advisory services to the Fund, the Adviser is paid a management fee from the Fund based on a percentage of the Fund's average daily net assets, at the annual rate of 0.05% for the period. The Adviser may from time to time voluntarily waive and/or reimburse fees or expenses in order to limit total annual fund operating expenses, as may be specified in a separate letter of agreement.
Pursuant to the Investment Advisory Agreement between the Adviser and the Trust (entered into on behalf of the Fund), the Adviser is responsible for substantially all expenses of the Fund, except (i) interest and taxes (including, but not limited to, income, excise, transfer and withholding taxes); (ii) expenses of the Fund incurred with respect to the acquisition, holding, voting and/or disposition of portfolio securities and the execution of portfolio transactions, including brokerage commissions; (iii) expenses incurred in connection with any distribution plan adopted by the Trust in compliance with Rule 12b-1 under the 1940 Act, including distribution fees; (iv) the advisory fee payable to the Adviser hereunder; and (v) litigation expenses (including fees and expenses of counsel retained by or on behalf of the Trust or any Fund) and any fees, costs or expenses payable by the Trust or any Fund pursuant to indemnification obligations to which the Trust or such Fund may be subject (pursuant to contract or otherwise); and (vi) any extraordinary expenses, as determined by a majority of the Independent Trustees.
Administrator, Custodian, Transfer Agent and Accounting Agent
Brown Brothers Harriman & Co. ("BBH"), which has its principal office at 50 Post Office Square, Boston, Massachusetts 02110. is the Trust administrator, fund accountant, transfer and dividend agent and custodian. BBH is primarily in the business of providing administrative, fund accounting and transfer agent services to retail and institutional mutual funds.
BBH has entered into an agreement with State Street Corporation ("State Street") under which State Street will acquire BBH's Investor Services business; which includes its custody, fund accounting and administration, transfer agency, depositary services, foreign exchange and securities lending services. The completion of the transaction is subject to customary closing conditions and regulatory approvals. BBH and State Street are committed to providing uninterrupted service and a seamless transition.
Distribution and Fund Officers
Foreside Financial Services, LLC (the "Distributor"), Three Canal Plaza, Suite 100, Portland, Maine 04101, is the distributor for the shares of the Trust. The Distributor is a registered broker-dealer and member of the Financial Industry Regulatory Authority, Inc.("FINRA").
Foreside Fund Officer Services, LLC, Three Canal Plaza, Suite 100, Portland, Maine 04101, provides the Trust with a Chief Compliance Officer and Principal Financial Officer.
22
Notes to Financial Statements (continued)
October 31, 2021 | | 
| |
Legal Counsel
Ropes & Gray, located at 191 North Wacker Drive, 32nd Floor, Chicago, Illinois 60606 serves as legal counsel to the Trust and the Fund.
Independent Registered Public Accounting Firm
Cohen & Company, Ltd. serves as the Trust's independent registered public accounting firm. The independent registered public accounting firm is responsible for auditing the annual financial statements of the Fund.
4. Creation and Redemption Transactions
The Fund offers, issues and redeems shares ("Shares") at NAV only in aggregations of a specified number of Shares (each a "Creation Unit"). The Fund may issue and redeem Creation Units of its Shares in exchange for a designated basket of portfolio investments (including any portion of such investments for which cash may be substituted) ("Deposit Instruments"), together with the deposit of a specified cash payment ("Cash Component"). Shares of the Fund will be listed and trade on Cboe BZX Exchange, Inc. (the "Exchange" or "Cboe BZX"), a national securities exchange. Shares of the Fund are traded in the secondary market and elsewhere at market values that may be at, above or below the Fund's NAV. Shares are redeemable only in Creation Units by authorized participants that have entered into agreements with the Distributor ("Authorized Participants"), and, generally, in exchange for securities in kind and or a cash amount. Creation Units typically are large blocks of a specified number of shares or multiples thereof. In the event of liquidation of a Fund, the Trust may lower the number of shares in a Creation Unit.
Shares may be issued in advance of receipt of Deposit Instruments, subject to various conditions, including a requirement that the Authorized Participant maintain with the Trust a cash deposit marked to the market value of the omitted Deposit Instruments. The Trust may use such cash deposit at any time to purchase Deposit Instruments. Transaction fees and other costs associated with creations or redemptions that include cash may be higher than the transaction fees and other costs associated with in-kind creations or redemptions. In all cases, conditions with respect to creations and redemptions of Shares and fees will be limited in accordance with the requirements of SEC rules and regulations applicable to management investment companies offering redeemable securities.
On October 11, 2021, the Creation Unit size increased from 20,000 to 60,000 shares.
5. Investment Transactions
The cost of purchases and the proceeds from sales of investment securities (excluding in-kind subscriptions and redemptions and short-term investments) for the period ended October 31, 2021 were as follows:
Fund | | Purchases | | Sales | |
Engine No. 1 Transform 500 ETF | | $ | 4,062,485 | | | $ | 2,476,986 | | |
For the period ended October 31, 2021, the cost of in-kind subscriptions and the proceeds from in-kind redemptions were as follows:
| | | In-Kind | |
Fund | | Subscriptions | | Redemptions | |
Engine No. 1 Transform 500 ETF | | $ | 223,447,209 | | | $ | 3,170,393 | | |
6. Federal Income Tax
The Fund intends to qualify as a "regulated investment company" under Subchapter M of the Internal Revenue Code of 1986, as amended. If so qualified, the Fund will not be subject to federal income tax to the extent it distributes substantially all of its net investment income and net capital gains to its shareholders. Therefore, no federal income tax position is required. The Fund recognizes interest and penalties, if any, related to unrecognized tax benefits as income tax expense on the Statement of Operations. Management of the Fund is required to determine whether a tax position taken by the Fund is more likely than not to be sustained upon examination by the applicable taxing authority. Based on its analysis, Management has concluded that the Fund does not have any unrecognized tax benefits or uncertain tax positions that would require a provision for income tax. Accordingly, the Fund did not incur any interest or penalties for the year ended October 31, 2021.
23
Notes to Financial Statements (continued)
October 31, 2021 | | 
| |
At October 31, 2021, the cost of investments and net unrealized appreciation (depreciation) for federal income tax purposes was as follows:
Fund | | Cost | | Gross Unrealized
Appreciation | | Gross Unrealized
Depreciation | | Net Unrealized
Appreciation
(Depreciation) | |
Engine No. 1 Transform 500 ETF | | $ | 222,071,755 | | | $ | 18,275,683 | | | $ | (5,084,752 | ) | | $ | 13,190,931 | | |
The differences between book-basis and tax-basis components of unrealized appreciation/(depreciation) are primarily attributable to tax deferral of losses on wash sales for tax purposes.
At October 31, 2021, the components of distributable earnings/loss on a tax basis were as follows:
Fund | | Undistributed
Income | | Undistributed
Long-term
Capital Gains | | Accumulated
Capital
Gains/(Losses) | | Net
Unrealized
Appreciation
(Depreciation) | | Total Earnings
(Losses) | |
Engine No. 1 Transform 500 ETF | | $ | 228,064 | | | $ | — | | | $ | (139,971 | ) | | $ | 13,190,931 | | | $ | 13,279,024 | | |
At October 31, 2021, the effect of permanent book/tax reclassifications primarily related to in-kind transactions resulted in increase/(decrease) to the components of net assets as follows:
Fund | | Total Distributable
Earnings | | Paid-in Capital | |
Engine No. 1 Transform 500 ETF | | $ | (321,054 | ) | | $ | 321,054 | | |
The tax character of distributions paid during the period indicated was as follows:
| | | Period Ended October 31, 2021 | |
Fund | | Ordinary
Income* | | Long-Term
Capital Gain | |
Engine No. 1 Transform 500 ETF | | $ | 467,032 | | | $ | — | | |
* For tax purposes short-term capital gain distributions are considered ordinary income distributions.
At October 31, 2021, for Federal income tax purposes, the Fund has capital loss carryforwards available as shown in the table below, to the extent provided by regulations, to offset future capital gains for an unlimited period. To the extent that these capital loss carryforwards are used to offset future capital gains, it is probable that the capital gains so offset will not be distributed to shareholders.
Fund | | Short-Term | | Long-Term | | Total Amount | |
Engine No. 1 Transform 500 ETF | | $ | (139,971 | ) | | $ | — | | | $ | (139,971 | ) | |
7. Related Parties
At October 31, 2021, certain officers and Trustees of the Trust are also officers or employees of the Adviser or affiliated with the Distributor.
8. Indemnification Obligations
In the normal course of business, the Trust, on behalf of the Fund, enters into contracts with third-party service providers that contain a variety of representations and warranties and that provide general indemnifications. Additionally, under the Trust organizational documents, the officers and Trustees are indemnified against certain liabilities arising out of the performance of their duties to the Trust. The Fund's maximum exposure under these arrangements is unknown, as it involves possible future claims that may or may not be made against the Fund. The Adviser is of the view that the risk of loss to the Fund in connection with the Fund indemnification obligations is remote; however, there can be no assurance that such obligations will not result in material liabilities that adversely affect the Fund.
24
Notes to Financial Statements (continued)
October 31, 2021 | | 
| |
9. Investment Risks
Principal Investment Risks: Shareholders of the Fund are subject to the risk that their investment could lose money. The Fund is subject to the principal risks, any of which may adversely affect the Fund's NAV, trading price, yield, total return and ability to meet its investment objective.
Technology Sector Risk. Technology companies, including information technology companies, may have limited product lines, markets, financial resources or personnel. Technology companies typically face intense competition and potentially rapid product obsolescence. They are also heavily dependent on intellectual property rights and may be adversely affected by the loss or impairment of those rights. Companies in the technology sector are facing increased government and regulatory scrutiny and may be subject to adverse government or regulatory action.
Infectious Illness Risk. An outbreak of an infectious respiratory illness, COVID-19, caused by a novel coronavirus that was first detected in December 2019 has spread globally. The impact of this outbreak has adversely affected the economies of many nations and the global economy and may impact individual issuers and capital markets in ways that cannot be foreseen. The duration of the outbreak and its effects cannot be predicted with certainty. Any market or economic disruption can be expected to result in elevated tracking error and increased premiums or discounts to the Fund's NAV.
The Fund's prospectus contains additional information regarding the risks associated with an investment in the Fund.
10. Subsequent Events
Management has evaluated subsequent events and transactions for potential recognition or disclosure through the date the financial statements were issued and has determined that there are no material events that would require recognition of disclosure in the Fund's financial statements.
25
Report of Independent Registered Public Accounting Firm | | 
| |
To the Shareholders of Engine No. 1 Transform 500 ETF and
Board of Trustees of Engine No. 1 ETF Trust
Opinion on the Financial Statements
We have audited the accompanying statement of assets and liabilities, including the schedule of investments, of Engine No. 1 ETF Trust comprising Engine No. 1 Transform 500 ETF (the "Fund") as of October 31, 2021, and the related statements of operations and changes in net assets, the related notes, and the financial highlights for the period from June 22, 2021 (commencement of operations) through October 31, 2021 (collectively referred to as the "financial statements"). In our opinion, the financial statements present fairly, in all material respects, the financial position of the Fund as of October 31, 2021, the results of its operations, the changes in net assets, and the financial highlights for the period from June 22, 2021 (commencement of operations) through October 31, 2021, in conformity with accounting principles generally accepted in the United States of America.
Basis for Opinion
These financial statements are the responsibility of the Fund's management. Our responsibility is to express an opinion on the Fund's financial statements based on our audit. We are a public accounting firm registered with the Public Company Accounting Oversight Board (United States) ("PCAOB") and are required to be independent with respect to the Fund in accordance with the U.S. federal securities laws and the applicable rules and regulations of the Securities and Exchange Commission and the PCAOB.
We conducted our audit in accordance with the standards of the PCAOB. Those standards require that we plan and perform the audit to obtain reasonable assurance about whether the financial statements are free of material misstatement whether due to error or fraud.
Our audit included performing procedures to assess the risks of material misstatement of the financial statements, whether due to error or fraud, and performing procedures that respond to those risks. Such procedures included examining, on a test basis, evidence regarding the amounts and disclosures in the financial statements. Our procedures included confirmation of securities owned as of October 31, 2021, by correspondence with the custodian and brokers. Our audit also included evaluating the accounting principles used and significant estimates made by management, as well as evaluating the overall presentation of the financial statements. We believe that our audit provides a reasonable basis for our opinion.
We have served as the Fund's auditor since 2020.

COHEN & COMPANY, LTD.
Milwaukee, Wisconsin
December 21, 2021
26
Supplemental Information (Unaudited) | | 
| |
Quarterly Portfolio Schedule. The Engine No. 1 ETF Trust files its complete schedule of portfolio holdings with the SEC for the first and third quarters of each fiscal year to date on Form N-PORT. The Forms N-PORT will be available on the SEC's website at www.sec.gov. In addition, the Fund's full portfolio holdings are updated daily and available on the Fund's website at etf.engine1.com.
Proxy Voting Policies and Procedures. A description of Fund Management at Engine No. 1 LLC's proxy voting policies and procedures, which are applicable to the funds in the Engine No. 1 ETF Trust, is available on the Fund's website at etf.engine1.com and on the SEC's website at www.sec.gov.
Proxy Voting Record. The Engine No. 1 ETF Trust is required to disclose annually the Fund's complete proxy voting record on Form N-PX covering the period July 1 through June 30 and file it with the SEC no later than August 31. Form N-PX for the Fund is available by writing to the Administrator at 50 Post Office Square, Boston, MA 02110. The Fund's Form N-PX will also be available on the SEC's website at www.sec.gov.
Premium/Discount Information. Information about the difference between daily market values on the secondary market for shares of the funds in Engine No. 1 ETF Trust and such funds' net asset value can be found on our website, etf.engine1.com.
Code of Ethics. The Trust and the Adviser have each adopted codes of ethics pursuant to Rule 17j-1 of the 1940 Act. Each code of ethics may be examined at the office of the SEC in Washington, D.C. or on the Internet at the SEC's website at www.sec.gov.
Tax Information
Form 1099-DIV and other year-end tax information provide shareholders with actual calendar year amounts that should be included in their tax returns. Shareholders should consult their tax advisors. The Fund designates the following amounts or, if subsequently determined to be different, the maximum allowable for its period ended October 31, 2021.
| | | Qualified
Dividend
Income* | | Dividends
Received
Deduction* | |
Engine No. 1 Transform 500 ETF | | | 93.78 | % | | | 90.84 | % | |
* The above percentage is based on ordinary income dividends paid to shareholders during the Fund's fiscal period.
27
Board Approval of Investment Advisory Agreement (Unaudited) | | 
| |
Engine No.1 ETF Trust ("Trust" and, the series thereof, the "Fund") and Engine No. 1 LLC ("Engine No. 1" or "Adviser"), have entered into an investment advisory agreement ("Advisory Agreement").
The Investment Company Act of 1940, as amended (the "1940 Act"), requires that the Advisory Agreement be approved initially, as well as renewed annually thereafter after an initial two-year period, by the Trust's Board of Trustees ("Board") and by a majority of the Trustees who are not "interested persons" (as defined in the 1940 Act) of any party to the Advisory Agreement ("Independent Trustees"), by vote cast in person at a meeting called for the purpose of voting on such approval. In connection with their consideration of any approvals or renewals of the Agreement, the Trustees must request and evaluate such information as may reasonably be necessary to make a reasonable business judgment with respect to the approval of the Advisory Agreement.
At a virtual meeting held on February 23, 2021 (the "February Meeting") the Board, including all of the Independent Trustees, approved the Advisory Agreement for an initial two-year period. In voting its approval of the Advisory Agreement at the February Meeting, the Board relied on an order issued by the Securities and Exchange Commission in response to the impacts of the COVID-19 pandemic that provided temporary relief from the in-person meeting requirements under Section 15 of the 1940 Act. In connection with their consideration and approval of the Advisory Agreement, the Trustees requested and evaluated, with the advice of counsel, information furnished by the Adviser that was reasonably necessary to make a reasonable business judgment regarding the terms of the Advisory Agreement.
Independent Trustees' Counsel discussed with the Board the fact that the 1940 Act and court decisions place the responsibility on a fund's trustees, with special emphasis on the independent trustees, to exercise good faith business judgment when deciding on whether to enter into or renew an investment advisory contract. Independent Trustees' Counsel also noted the Trustees must make a reasonable and good faith attempt to ascertain all facts relevant to their deliberations. The Independent Trustees' Counsel discussed the specific factors the Trustees should consider in evaluating an investment advisory contract and summarized the activities of the Independent Trustees leading up to the February Meeting in their consideration of the proposed Advisory Agreement. In voting to approve the Advisory Agreement at the February Meeting, the Independent Trustees considered whether the approval of the Advisory Agreement would be in the best interests of the respective Fund and its shareholders, an evaluation based on several factors including those discussed below.
Materials Reviewed. In considering the approval of the proposed Advisory Agreement, the Board took into account and discussed materials and information relating to: (i) the nature, extent and quality of services to be provided by the Adviser to the Fund; (ii) the fees and expenses to be borne by the Fund; and (iii) the profitability to be realized by the Adviser from the relationship with the Fund. The Board reviewed information relating to, among other things, proposed operations, including the compliance programs of the Adviser, valuation, and other information related to personnel of the Adviser that would be providing investment management services to the Fund. Among other things, the Board noted the Adviser's limited operating history, as well as the Adviser's limited performance history with respect to the management of investment vehicles with similar structures and strategies as the Fund. They also reviewed comparative fee information and information regarding personnel who would be providing investment management services to the Fund. Independent Trustees' Counsel reminded the Board of its earlier discussion regarding its responsibilities with respect to the approval of the Advisory Agreement.
Review Process. In connection with the approval of the Advisory Agreement, the Board reviewed written materials provided by Engine No. 1, which included, among other things, comparative fee and expense data. The Board also requested and received assistance and advice from counsel to the Independent Trustees regarding applicable legal standards. The Board also heard oral presentations on matters related to the Advisory Agreement. In deciding to approve the Advisory Agreement, the Board did not identify any single factor or particular information that, in isolation, was controlling.
Nature, Extent and Quality of Services. The Board noted that Engine No. 1 was a recently formed investment adviser with no assets under management but noted the overall financial strength and stability of Engine No. 1, and its parent company, as well as the Adviser's commitment to its guiding management principles. The Board considered the background information on the key investment personnel who would be responsible for servicing the Fund, considering their education and noting the investment team's diverse financial industry experience. The Board considered Engine No. 1's research, analysis and portfolio construction, which utilized both top-down and bottom-up fundamental and quantitative research. The Board observed that the Fund would be a passively-managed ETF and Engine No. 1 would have the responsibility to track the Fund's benchmark to the best of its ability, recognizing that an index, unlike the Fund, does not have expenses. The Board also considered the various additional services that Engine No. 1 would provide under the proposed Advisory Agreement, including its total value framework and its strategic plan related to active engagement of portfolio companies. The Board noted Engine No. 1's efforts to attract qualified personnel and to develop other types of resources and systems.
The Board considered its review of Engine No. 1's policies, procedures and systems as described at the February Meeting to assure compliance with applicable laws and regulations, and its intended processes to keep the Board informed about matters relevant to the Fund and its shareholders. The Board concluded that the nature, extent and quality of services proposed to be provided by Engine No. 1 under the Advisory Agreement were likely to benefit the Fund and its shareholders.
28
Board Approval of Investment Advisory Agreement (Unaudited) (concluded) | | 
| |
Performance. The Trustees observed that the Fund was not operational and without historical performance. The Board considered the manner in which Engine No. 1 proposed to manage the Fund. After discussion, the Trustees concluded that Engine No. 1 was qualified to manage an index fund, and should be allowed the opportunity, to manage the Fund, subject to the ongoing supervision of the Board.
Fees and Expenses. The Trustees noted that the Fund's proposed annual advisory fee was at the low end of the range of funds included in the peer group provided by Engine No. 1. The Board considered a number of factors, including the type and complexity of the services proposed to be provided by the Adviser to the Fund, the cost of providing services, the risk assumed by Engine No. 1 in the provision of services, the impact on potential returns from different levels of fees, the competitive marketplace for financial products, and the attractiveness of potential returns to prospective investors in the Fund.
The Board reviewed the proposed advisory fee schedule for the Fund. The Board noted that Engine No. 1 will be responsible for all other costs associated with managing and operating the Fund and that Engine No. 1 intends to pay all distribution costs out of its own profits. The Board considered how these arrangements would affect the expenses borne by Fund shareholders. The Board noted that the total expense ratio was reasonable when taking into account the unitary fee arrangement. Based on these factors, the Trustees concluded that the Fund's proposed advisory fee was not unreasonable.
Economies of Scale. The Trustees reasoned that based on estimated assets over the initial two-year term of the proposed Advisory Agreement, it was premature to make a determination about economies of scale.
Profitability. The Board considered the estimated profits to be realized by Engine No. 1 in connection with the operation of the Fund. The Board also considered the Fund's estimated operating expenses and the expected impact on Engine No. 1's profitability. The Board noted that Engine No. 1 did not expect to be profitable with respect to the Fund during the first two years of operations. The Board noted that despite the lack of profitability with respect to its management of the fund, Engine No.1 has the financial resources to deliver high quality advisory services to the Fund for the foreseeable future. The Board considered whether Engine No. 1 or any of its affiliates might receive other benefits as a result of its proposed relationship with the Trust or the Fund. The Board considered that Engine No. 1 was not affiliated with any of the Fund's proposed service providers, and therefore, would not benefit from those contractual relationships. The Trustees determined that the estimated profits of Engine No. 1, in terms of actual dollars and as a percent of total revenue, would not be excessive.
Conclusion. Having requested and received such information from Engine No. 1 as the Trustees believed to be reasonably necessary to evaluate the terms of the Advisory Agreement, and as assisted by the advice of counsel, the Trustees concluded that the Advisory Agreement was in the best interests of future shareholders of the Fund.
29
Board of Trustees and Executive Officers (Unaudited) | | 
| |
Trustees and Executive Officers. Information about the Trustees and Executive Officers of the Trust as of October 31, 2021, including their business addresses, ages and principal occupations during the past five years, and other directorships of publicly traded companies or funds, is set forth in the table below. Each Trustee serves until resignation, death, retirement or removal. The address for each Trustee is c/o Fund Management at Engine No. 1 LLC, 710 Sansome Street, San Francisco, CA 94111.
Independent Trustees
Name and
Year of Birth | | Position(s)
Held with
Trust | | Year
Appointed
or Elected
To Board | | Principal
Occupation(s)
During Past
Five Years | | Number of
Portfolios
in the Fund
Complex
Overseen | | Other Directorships Held
by Trustee | |
Jack Gee, 1959 | | Trustee | | Since 2021 | | Retired. Managing Director and Chief Financial Officer and Treasurer, U.S. iShares at Blackrock (2004 to 2019). | | 2 | | Trustee, AIM ETF Products Trust, Consultant to Allianz Variable Insurance Products Trust and Allianz Variable Insurance Products Fund of Funds Trust (2020-present); Trustee, Esoterica Thematic Trust (2019-2020). | |
Elaine Orr, 1966 | | Trustee | | Since 2021 | | Director, Investments at Silicon Valley Community Foundation (2014-2016); Director, Global Business Development, Morningstar Investment Management (2012-2014). | | 2 | | Trustee, Board of Trustees for Federated City Employees Retirement System, for the City of San Jose, CA (2018-present). | |
Scott Ebner, 1974 | | Trustee | | Since 2021 | | Senior Managing Director, State Street Global Advisors (2010-2021). | | 2 | | Trustee, State Street Global Advisors Trust Company (2019-2020); Trustee, SSGA Cayman (2016-2020); Trustee, WindWise Global Defensive Long Short Equity Fund, Ltd. (2019-2020); Trustee, WindWise Seeding Fund SPC, Ltd. (2016-2020). | |
Interested Trustee
Name and
Year of Birth | | Position(s)
Held with
Trust | | Year
Appointed
or Elected
To Board | | Principal
Occupation(s)
During Past
Five Years | | Number of
Portfolios
in the Fund
Complex
Overseen | | Other Directorships Held
by Trustee | |
Jennifer Grancio, 1971 | | Chair of the Board | | Since 2020 | | Chief Executive Officer at Engine No. 1 (2020-present); Managing Director and various roles at Blackrock (1999-2018). | | 2 | | Board Member, MannKind Corporation (2020-present); Board Member, Harvest Savings & Wealth Technologies (2020- present); Board Member, Ethic (2019-present). | |
The Board has an Audit Committee consisting solely of three (3) Trustees who are Independent Trustees, including Jack Gee, Elaine Orr and Scott Ebner. Mr. Gee serves as the Chair of the Audit Committee and has been designated as an "audit committee financial expert," as defined under Item 407 of Regulation S-K of the Securities Exchange Act of 1934, as amended.
30
Board of Trustees and Executive Officers (Unaudited) (concluded) | | 
| |
Officer Information
Name and Year of Birth | | Position(s)
Held with
Trust | | Length of
Time
Served | | Principal
Occupation(s)
During Past
Five Years | |
Jennifer Grancio, 1971 | | President and Principal Executive Officer | | Since 2020 | | Chief Executive Officer at Engine No. 1 (2020-present); Managing Director and various roles at Blackrock (1999-2018). | |
Joshua G. Hunter*, 1981 | | Chief Financial Officer and Treasurer | | Since 2021 | | Fund Principal Financial Officer, Foreside Fund Officer Services, LLC (2015-present); Vice President/ Assistant Vice President, Treasury Services, JPMorgan Chase & Co. (2008-2015). | |
Nancy Tyminski*, 1962 | | Chief Compliance and Anti-Money Laundering Officer | | Since 2021 | | Director, Foreside Fund Officer Services, LLC (2019-present); Senior Due Diligence Officer, Foreside Financial Group, LLC (2015-2019); Deputy Chief Compliance Officer, PNC Funds, PNC Bank, N.A. (2011-2015) | |
Jason LaMacchia, 1974 | | Secretary | | Since 2021 | | Director, ETF Product Management, Engine No. 1 (2021-present); Business Consultant, JEL Consulting (2015-present); Head of Relationship Management, ForUsAll (2019-2021); Vice President, AssetMark (2017-2018); Director and Principal, Blackrock (2004-2015). | |
Yasmin Dahya Bilger, 1985 | | Vice President | | Since 2021 | | Managing Director at Engine No. 1 (2021-present); Executive Director and various roles at JPMorgan Chase & Co. (2007-2021). | |
* Mr. Hunter and Ms. Tyminski serve as officers to other unaffiliated funds for which the Distributor (or its affiliates) acts as distributor (or provider of other services).
31
General Information (Unaudited) | | 
| |
Investment Adviser
Fund Management at Engine No. 1 LLC
710 Sansome Street
San Francisco, CA 94111
Administrator, Custodian, Transfer Agent and Accounting Agent
Brown Brothers Harriman & Co.
50 Post Office Square
Boston, MA 02110
Distributor
Foreside Financial Services, LLC
Three Canal Plaza, Suite 100
Portland, ME 04101
Independent Registered Public Accounting Firm
Cohen & Company, Ltd.
342 N. Water Street, Suite 830
Milwaukee, WI 53202
Legal Counsel
Ropes & Gray LLP
191 North Wacker Drive
Chicago, IL 60606
[This Page Intentionally Left Blank]
[This Page Intentionally Left Blank]