UNITED STATES
SECURITIES AND EXCHANGE COMMISSION
Washington, D.C. 20549
SECURITIES AND EXCHANGE COMMISSION
Washington, D.C. 20549
FORM N-CSR
CERTIFIED SHAREHOLDER REPORT OF REGISTERED
MANAGEMENT INVESTMENT COMPANIES
Investment Company Act file number 811-23622
ASYMmetric ETFs Trust
(Exact name of registrant as specified in charter)
(Exact name of registrant as specified in charter)
1516 Park Ave., Suite 7B
New York, NY 10029
(Address of principal executive offices) (Zip code)
(Address of principal executive offices) (Zip code)
Darren Schuringa, President
ASYMmetric ETFs Trust
158 East 126th Street, Suite 304
New York, NY 10035
(Name and address of agent for service)
(Name and address of agent for service)
212-755-1970
Registrant's telephone number, including area code
Date of fiscal year end: December 31, 2023
Date of reporting period: June 30, 2023
Item 1. Reports to Stockholders.
| (a) |
ASYMmetric Smart S&P 500® ETF
Listed on NYSE Arca, Inc.
Ticker: ASPY CUSIP: 04651A101
ASYMmetric Smart Alpha S&P 500® ETF
Listed on NYSE Arca, Inc.
Ticker: ZSPY CUSIP: 04651A200
ASYMmetric Smart Income ETF
Listed on NYSE Arca, Inc.
Ticker: MORE CUSIP: 04651A309
Semi-Annual Report
| www.ASYMshares.com | June 30, 2023 |
ASYMmetric ETFs
Dear Shareholders,
We are happy to report that ASYMmetric ETFs has expanded our selection of Smart Solutions to include Smart Alpha and Smart Income categories. Smart Alpha aims to produce better returns with similar risk and Smart Income aims to generate more income with less risk. All ASYMmetric Smart Solutions are built on a philosophy of capital preservation and powered by our proprietary Smart Technology. Here are a few highlights from an exciting first half of 2023:
| 1. | Listed ASYMmetric Smart Alpha S&P 500 ETF (ZSPY): Engineered to generate up to 2x the performance of the S&P 500 Index with a risk profile generally in line with the index over a market cycle. ZSPY seeks to accomplish these goals by being close to 200% long the S&P 500 Index in a bull market and being net short the S&P 500 Index in a bear market. | |
| 2. | Listed ASYMmetric Smart Income ETF (MORE): Designed to generate high current income with less risk. MORE seeks to accomplish these goals by dynamically allocating to high-income-producing asset classes of MLPs, REITs, and Utilities when they are in a bull market and away from them into the relative safety of U.S Treasuries or the principal security of cash in a bear market. | |
| 3. | Launched Interactive Website: ASYMmetric ETFs unveiled a new website as disruptive as our Smart Solutions www.ASYMshares.com. Our new site clearly articulates the value proposition of our Smart Solutions, investor profiles, portfolio use cases, and how our Smart Technology works. Our interactive site is designed to help investors determine which Smart Solution might be right for them. |
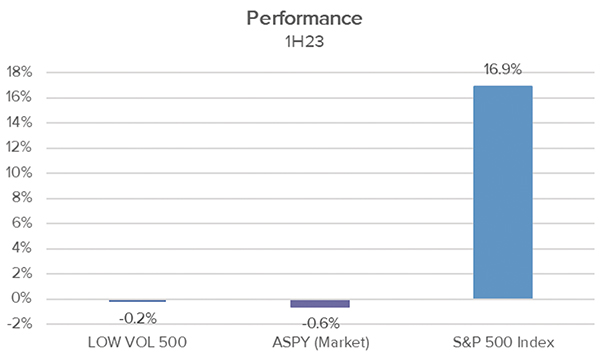
The ASYMmetric Smart S&P 500® ETF (ASPY) did not deliver on its Smart Equity investment goal of producing S&P 500 returns with a fraction of the risk for the first half of 2023. ASPY’s underperformance relative to the S&P 500 was almost entirely due to the underperformance of its LOW VOL equity exposure. ASPY’s LOW VOL 500 Index was down -0.2%, roughly in line with the performance of ASPY -0.6% for the first half of 2023. ASPY’s underperformance was due to MIN VOL equities, not a failure of ASYMmetric Smart Technology.
ASYMmetric Smart Technology correctly identified the S&P 500 as being in a bull market since the end of January. It has positioned ASPY to profit from a rising S&P 500 for the last five months. This was the correct positioning given the S&P 500 has risen 10% over this period. ASYMmetric Smart Technology has been extremely responsive coming off a bear market in 2022 and has correctly positioned ASPY to profit from the majority of S&P 500’s 2023 bull market. ASPY has not captured the return of the S&P 500 because the S&P has primarily been driven up by a few technology companies in the first half of 2023. Other sectors and styles, including MIN VOL equities, have not participated in the S&P 500’s gains off the bear market of 2022.
1
ASYMmetric ETFs
| One | Since | ||||
| As of 6/30/23 | MTD | YTD | Year | Inception* | |
| ASYMmetric Smart S&P 500 ETF (Market) | 4.4% | -0.6% | -2.3% | 2.5% | |
| ASYMmetric Smart S&P 500 ETF (NAV) | 4.4% | -0.7% | -2.4% | 2.5% | |
| S&P 500 Index (Total Return) | 6.6% | 16.9% | 19.6% | 7.9% | |
| Alpha | -2.2% | -17.5% | -21.9% | -5.3% |
*Inception date 3/9/21. Expense ratio 0.95%
Performance quoted represents past performance, which is no guarantee of future results. Investment returns and principal value will fluctuate, so you may have a gain or loss when shares are sold. Current performance may be higher or lower than that quoted. For standardized performance, visit www.ASYMshares.com/ASPY.
ASYMmetric Smart Alpha S&P 500 ETF (ZSPY) delivered on its Smart Alpha investment goal of generating better returns than the S&P 500 with similar risk since its inception on 2/1/23. ZSPY was up 15.5% versus 10.0% for the S&P 500 since its inception on 2/1/23, generating 1.6x greater returns than S&P 500.

ZSPY offers direct exposure to the S&P 500 that is leveraged when the S&P 500 is in a bull market. Our Smart Technology correctly identified the S&P 500 as being in a bull market in 2Q23, positioning ZSPY to generate alpha. ZSPY delivered 1.8x the performance of the S&P 500 for the second quarter of 2023, refer to QTD performance in the table below. ZSPY offers investors a new and potentially more predictable source of alpha.
| Since | |||||
| As of 6/30/23 | MTD | QTD | Inception* | ||
| ASYMmetric Smart Alpha S&P 500 ETF (Market) | 12.2% | 15.7% | 15.5% | ||
| ASYMmetric Smart Alpha S&P 500 ETF (NAV) | 12.0% | 15.4% | 15.2% | ||
| S&P 500 Index (Total Return) | 6.6% | 8.7% | 10.0% | ||
| Alpha | 185% | 179% | 155% |
*Inception date 2/1/23. Expense ratio 0.95%
Performance quoted represents past performance, which is no guarantee of future results. Investment returns and principal value will fluctuate, so you may have a gain or loss when shares are sold. Current performance may be higher or lower than that quoted. For standardized performance, visit www.ASYMshares.com//ZSPY.
2
ASYMmetric ETFs
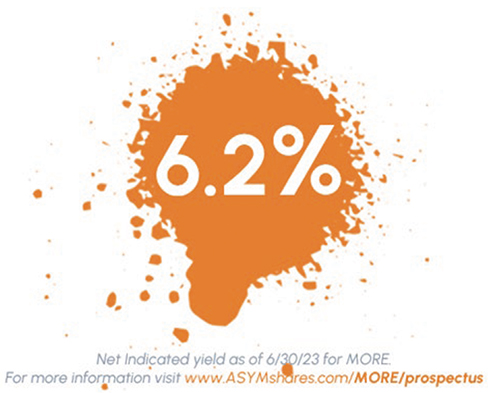
ASYMmetric Smart Income ETF (MORE) delivered on its Smart Income investment goal of generating higher income than the S&P 500 since its inception on 2/1/23. MORE paid its first full-quarter distribution of $0.356 per share. MORE had a net indicated yield of 6.2% based on this distribution. MORE distributed 100% of the income it received from its investments to its shareholders. MORE offers the potential for higher, more secure, current income with the potential for principal appreciation.
The since inception performance for MORE was negatively impacted by its exposure to energy infrastructure equities. The energy sector of the S&P 500 Index was down -9.7% since MORE’s inception.
| Since | |||||
| As of 6/30/23 | MTD | QTD | Inception* | ||
| ASYMmetric Smart Income ETF (Market) | 4.5% | 2.5% | -6.9% | ||
| ASYMmetric Smart Income ETF (NAV) | 4.3% | 2.4% | -7.0% | ||
| S&P 500 Index (Total Return) | 6.6% | 8.7% | 10.0% | ||
| Capture Ratio | 68% | 29% | -69% |
*Inception date 2/1/23. Expense ratio 0.75%
Performance quoted represents past performance, which is no guarantee of future results. Investment returns and principal value will fluctuate, so you may have a gain or loss when shares are sold. Current performance may be higher or lower than that quoted. For standardized performance, visit www.ASYMshares.com/MORE.
ASYMmetric Smart Solutions are engineered on the philosophy of capital preservation. We believe a capital preservation approach is a smarter way to invest because it offers the potential for greater wealth creation with less risk. Our proprietary Smart Technology powers our suite of Smart Solutions, so that investors know what to expect from ASYMmetric ETFs. Dive deeper and discover what Smart Solution may be right for you at www.ASYMshares.com.
On behalf of the entire ASYMmetric ETFs™ team, we are deeply grateful for the trust our investors have placed in us. We will continue to work hard every day to earn it, as ASYMmetric Smart Technology works hard every day to produce smart investment solutions.
Sincerely,
Darren Schuringa
Founder and CEO
3
ASYMmetric ETFs
Important Risk Information
This material must be preceded or accompanied by a prospectus.
There is no guarantee the Fund’s investment strategy will be a success or that the protection sought by the fund will be achieved. Investment loss is possible.
New Fund Risk: The Fund is a recently organized investment company with no operating history. As a result, prospective investors have no track record or history on which to base their investment decision. Leverage Risk: The Fund will invest in futures as a principal investment strategy. Futures and other derivative investments give rise to a form of leverage. Leverage is investment exposure that exceeds the initial amount invested. The loss on a leveraged investment may far exceed the Fund’s principal amount invested. Leverage can magnify the Fund’s gains and losses and therefore increase its volatility. Long/Short Risk: The performance of the Fund will depend on the difference in the rates of return between its long positions and short positions. Unlike with a long position, losses on a short position could be much greater if the value of the security that the Fund is shorting increases because the cost of covering a short position is potentially unlimited. Volatility Risk: The Fund’s investments are designed to respond to historical or realized volatility based on a proprietary model developed and implemented by the Index Provider, which is not intended to predict the future volatility of the S&P 500 Index. If the S&P 500 Index is rapidly rising during periods when the Index Provider’s volatility model has predicted significant volatility, the Fund may be underexposed to the S&P 500 Index due to its short position, and the Fund would not be expected to gain the full benefit of the rise in the S&P 500 Index. Additionally, in periods of rapidly changing volatility, the Fund may not be appropriately hedged or may not respond as expected to current volatility. In periods of extreme market volatility, the Index’s strategy, and consequently the Fund, may underperform due to the backward-looking nature of the Index’s model.
Alpha: the portion of return from an investment that’s incrementally more than a benchmark index, in this case the S&P 500.
Shares of ETFs are bought and sold at market price (not NAV) and are not individually redeemed from the fund. Any applicable brokerage commissions will reduce returns. Market price returns are based on the bid/ask spread at 4 p.m. ET. and do not represent the returns an investor would receive if shares were traded at other times.
Before investing, carefully consider the fund’s investment objectives, risks, charges and expenses. This and other information are in the prospectus and a summary prospectus, copies of which may be obtained at www.ASYMshares.com or 1-866-ASYM777. Read the prospectus carefully before investing.
Distributor: Foreside Fund Services, LLC
4
ASYMmetric Smart S&P 500® ETF
Value of $10,000 Investment (Unaudited)
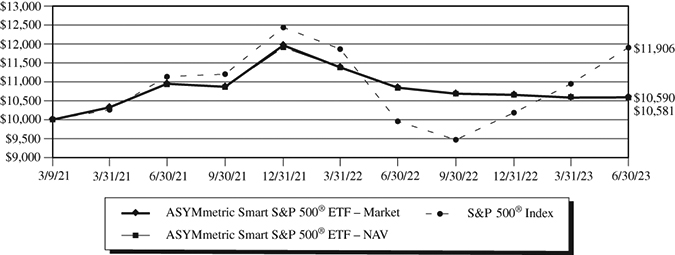
The chart assumes an initial investment of $10,000. Performance reflects operating expenses in effect. Performance data quoted represents past performance and does not guarantee future results. Investment returns and principal value will fluctuate, and when sold, may be worth more or less than their original cost. Performance current to the most recent month-end may be lower or higher than the performance quoted and can be obtained by calling 1-866-279-6777. Performance assumes the reinvestment of capital gains and income distributions. The performance does not reflect the deduction of taxes that a shareholder would pay on Fund distributions or the redemption of Fund shares.
Average Annual Total Returns (%) As of June 30, 2023
1 Year | Since Inception(1) | |
ASYMmetric Smart S&P 500® ETF – Market | -2.34% | 2.51% |
ASYMmetric Smart S&P 500® ETF – NAV | -2.36% | 2.48% |
S&P 500® Index(2) | 19.59% | 7.85% |
| (1) | March 9, 2021 |
| (2) | The Standard & Poor’s 500® Index (S&P 500) is an unmanaged, capitalization-weighted index generally representative of the U.S. market for large capitalization stocks. This Index cannot be invested in directly. |
5
ASYMmetric Smart Alpha S&P 500® ETF
Value of $10,000 Investment (Unaudited)
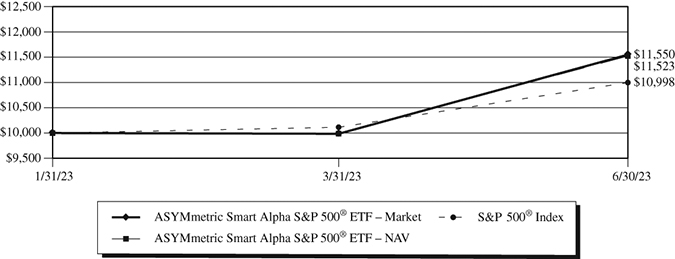
The chart assumes an initial investment of $10,000. Performance reflects operating expenses in effect. Performance data quoted represents past performance and does not guarantee future results. Investment returns and principal value will fluctuate, and when sold, may be worth more or less than their original cost. Performance current to the most recent month-end may be lower or higher than the performance quoted and can be obtained by calling 1-866-279-6777. Performance assumes the reinvestment of capital gains and income distributions. The performance does not reflect the deduction of taxes that a shareholder would pay on Fund distributions or the redemption of Fund shares.
Average Annual Total Returns (%) As of June 30, 2023
Since Inception(1) | ||
ASYMmetric Smart Alpha S&P 500® ETF – Market | 15.50% | |
ASYMmetric Smart Alpha S&P 500® ETF – NAV | 15.23% | |
S&P 500® Index(2) | 9.98% |
| (1) | January 31, 2023 |
| (2) | The Standard & Poor’s 500® Index (S&P 500) is an unmanaged, capitalization-weighted index generally representative of the U.S. market for large capitalization stocks. This Index cannot be invested in directly. |
6
ASYMmetric Smart Income ETF
Value of $10,000 Investment (Unaudited)
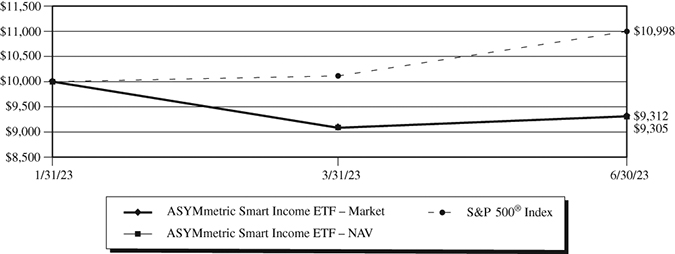
The chart assumes an initial investment of $10,000. Performance reflects operating expenses in effect. Performance data quoted represents past performance and does not guarantee future results. Investment returns and principal value will fluctuate, and when sold, may be worth more or less than their original cost. Performance current to the most recent month-end may be lower or higher than the performance quoted and can be obtained by calling 1-866-279-6777. Performance assumes the reinvestment of capital gains and income distributions. The performance does not reflect the deduction of taxes that a shareholder would pay on Fund distributions or the redemption of Fund shares.
Average Annual Total Returns (%) As of June 30, 2023
Since Inception(1) | ||
| ASYMmetric Smart Income ETF – Market | -6.88% | |
| ASYMmetric Smart Income ETF – NAV | -6.95% | |
S&P 500® Index(2) | 9.98% |
| (1) | January 31, 2023 |
| (2) | The Standard & Poor’s 500® Index (S&P 500) is an unmanaged, capitalization-weighted index generally representative of the U.S. market for large capitalization stocks. This Index cannot be invested in directly. |
7
ASYMmetric ETFs
Expense Example (Unaudited)
June 30, 2023
As a shareholder of the Fund, you incur two types of costs: (1) transaction costs, including brokerage commissions on purchases and sales of Fund shares, and (2) ongoing costs, including management fees and other Fund expenses. This example is intended to help you understand your ongoing costs (in dollars) of investing in the Fund and to compare these costs with the ongoing costs of investing in other funds. The example is based on an investment of $1,000 invested at the beginning of the period and held for the entire period (January 1, 2023 – June 30, 2023).
ACTUAL EXPENSES
The first line of the table below provides information about actual account values based on actual returns and actual expenses. You may use the information in this line, together with the amount you invested, to estimate the expenses that you paid over the period. Simply divide your account value by $1,000 (for example, an $8,600 account value divided by $1,000 = 8.6), then multiply the result by the number in the first line under the heading entitled “Expenses Paid During Period” to estimate the expenses you paid on your account during this period.
HYPOTHETICAL EXAMPLE FOR COMPARISON PURPOSES
The second line of the table below provides information about hypothetical account values and hypothetical expenses based on the Fund’s actual expense ratio and an assumed rate of return of 5% per year before expenses, which is not the Fund’s actual return. The hypothetical account values and expenses may not be used to estimate the actual ending account balance or expenses you paid for the period. You may use this information to compare the ongoing costs of investing in the Fund and other funds. To do so, compare this 5% hypothetical example with the 5% hypothetical examples that appear in the shareholder reports of the other funds.
Please note that the expenses shown in the table are meant to highlight your ongoing costs only and do not reflect any transactional costs, such as redemption fees or exchange fees. Therefore, the second line of the table is useful in comparing ongoing costs only and will not help you determine the relative total costs of owning different funds. In addition, if these transactional costs were included, your costs would have been higher.
ASYMmetric Smart S&P 500® ETF
| Beginning | Ending | Expenses Paid | |
| Account Value | Account Value | During Period(1) | |
(01/01/23) | (06/30/23) | (01/01/23 to 06/30/23) | |
Actual(2) | $1,000.00 | $ 993.20 | $4.69 |
| Hypothetical (5% return before expenses) | $1,000.00 | $1,020.08 | $4.76 |
| (1) | Expenses are equal to the Fund’s annualized expense ratio for the most recent six-month period of 0.95% multiplied by the average account value over the period, multiplied 181/365 to reflect the one-half year period. |
| (2) | Based on the actual returns for the six month period ended June 30, 2023 of -0.68%. |
8
ASYMmetric ETFs
Expense Example (Unaudited) – Continued
June 30, 2023
ASYMmetric Smart Alpha S&P 500® ETF
| Beginning | Ending | Expenses Paid | |
| Account Value | Account Value | During Period(1) | |
(1/31/23) | (06/30/23) | (1/31/23 to 06/30/23) | |
Actual(2) | $1,000.00 | $1,152.30 | $4.17 |
| Hypothetical (5% return before expenses) | $1,000.00 | $1,016.53 | $3.91 |
| (1) | Expenses are equal to the Fund’s annualized expense ratio for the most recent six-month period of 0.95% multiplied by the average account value over the period, multiplied 149/365 to reflect the period since inception. |
| (2) | Based on the actual returns for the period January 31, 2023 through June 30, 2023 of 15.23%. |
ASYMmetric Smart Income ETF
| Beginning | Ending | Expenses Paid | |
| Account Value | Account Value | During Period(1) | |
(1/31/23) | (06/30/23) | (1/31/23 to 06/30/23) | |
Actual(2) | $1,000.00 | $ 930.50 | $2.96 |
| Hypothetical (5% return before expenses) | $1,000.00 | $1,017.35 | $3.09 |
| (1) | Expenses are equal to the Fund’s annualized expense ratio for the most recent six-month period of 0.95% multiplied by the average account value over the period, multiplied 149/365 to reflect the period since inception. |
| (2) | Based on the actual returns for the period January 31, 2023 through June 30, 2023 of -6.95%. |
9
ASYMmetric Smart S&P 500® ETF
Allocation of Portfolio(1) (% of Net Assets) (Unaudited)
June 30, 2023

Top Ten Holdings(1) (Unaudited)
as of June 30, 2023
(% of Net Assets)
| CF Industries Holdings, Inc. | 2.6% |
| Consolidated Edison, Inc. | 2.5% |
| Realty Income Corp. | 2.3% |
| Domino’s Pizza, Inc. | 2.3% |
| Huntington Ingalls Industries, Inc. | 2.2% |
| J.M. Smucker Co. | 2.2% |
| NetApp, Inc. | 2.2% |
| Activision Blizzard, Inc. | 2.2% |
| Valero Energy Corp. | 2.2% |
| Verizon Communications, Inc. | 2.2% |
| (1) | Fund holdings and sector allocations are subject to change at any time and are not recommendations to buy or sell any security. |
10
ASYMmetric Smart Alpha S&P 500® ETF
Allocation of Portfolio(1) (% of Net Assets) (Unaudited)
June 30, 2023
Top Ten Holdings(1) (Unaudited)
as of June 30, 2023
(% of Net Assets)
| Apple, Inc. | 7.2% |
| Microsoft Corp. | 6.2% |
| Amazon.com, Inc. | 2.8% |
| NVIDIA Corp. | 2.5% |
| Alphapet, Inc. | 1.8% |
| Tesla, Inc. | 1.7% |
| Meta Platforms, Inc. | 1.6% |
| Alphabet, Inc. | 1.6% |
| Berkshire Hathaway, Inc. | 1.5% |
| UnitedHealth Group, Inc. | 1.1% |
| (1) | Fund holdings and sector allocations are subject to change at any time and are not recommendations to buy or sell any security. |
11
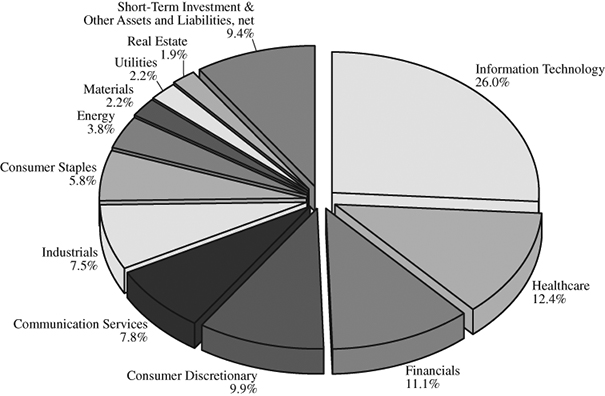
ASYMmetric Smart Income ETF
Allocation of Portfolio(1) (% of Net Assets) (Unaudited)
June 30, 2023

Top Ten Holdings(1)(2) (Unaudited)
as of June 30, 2023
(% of Net Assets)
| United States Treasury Note | 99.4% |
| (1) | Fund holdings and sector allocations are subject to change at any time and are not recommendations to buy or sell any security. |
| (2) | Excludes short-term investments. |
12
ASYMmetric Smart S&P 500® ETF
Schedule of Investments (Unaudited)
June 30, 2023
| Shares | Value | |||||||
| COMMON STOCKS – 99.5% | ||||||||
| Communication Services – 8.5% | ||||||||
| Activision Blizzard, Inc.* | 6,064 | $ | 511,195 | |||||
| AT&T, Inc. | 30,913 | 493,063 | ||||||
| Electronic Arts, Inc. | 3,777 | 489,877 | ||||||
| Verizon Communications, Inc. | 13,648 | 507,569 | ||||||
| 2,001,704 | ||||||||
| Consumer Discretionary – 10.5% | ||||||||
| Domino’s Pizza, Inc. | 1,558 | 525,030 | ||||||
| McDonald’s Corp. | 1,585 | 472,980 | ||||||
| O’Reilly Automotive, Inc.* | 505 | 482,427 | ||||||
| Tractor Supply Co. | 2,152 | 475,807 | ||||||
| Yum! Brands, Inc. | 3,514 | 486,865 | ||||||
| 2,443,109 | ||||||||
| Consumer Staples – 6.2% | ||||||||
| Campbell Soup Co. | 10,094 | 461,397 | ||||||
| General Mills, Inc. | 6,062 | 464,955 | ||||||
| J.M. Smucker Co. | 3,481 | 514,039 | ||||||
| 1,440,391 | ||||||||
| Energy – 4.3% | ||||||||
| Exxon Mobil Corp. | 4,546 | 487,558 | ||||||
| Valero Energy Corp. | 4,332 | 508,144 | ||||||
| 995,702 | ||||||||
| Financials – 12.3% | ||||||||
| Allstate Corp. | 4,261 | 464,619 | ||||||
| Cboe Global Markets, Inc. | 3,487 | 481,241 | ||||||
| Everest Re Group Ltd. | 1,359 | 464,588 | ||||||
| Globe Life, Inc. | 4,476 | 490,659 | ||||||
| Travelers Companies, Inc. | 2,731 | 474,265 | ||||||
| W.R. Berkley Corp. | 8,312 | 495,063 | ||||||
| 2,870,435 | ||||||||
See Notes to the Financial Statements
13
ASYMmetric Smart S&P 500® ETF
Schedule of Investments (Unaudited) – Continued
June 30, 2023
| Shares | Value | |||||||
| Health Care – 13.7% | ||||||||
| AbbVie, Inc. | 3,163 | $ | 426,151 | |||||
| Bristol-Myers Squibb Co. | 6,755 | 431,982 | ||||||
| Cigna Group | 1,771 | 496,943 | ||||||
| DaVita, Inc.* | 4,645 | 466,683 | ||||||
| Incyte Corp.* | 7,069 | 440,045 | ||||||
| Johnson & Johnson | 2,808 | 464,780 | ||||||
| Merck & Co., Inc. | 3,941 | 454,752 | ||||||
| 3,181,336 | ||||||||
| Industrials – 8.4% | ||||||||
| Huntington Ingalls Industries, Inc. | 2,273 | 517,335 | ||||||
| Lockheed Martin Corp. | 1,032 | 475,112 | ||||||
| Northrop Grumman Corp. | 1,054 | 480,413 | ||||||
| Waste Management, Inc. | 2,827 | 490,259 | ||||||
| 1,963,119 | ||||||||
| Information Technology# – 28.2% | ||||||||
| Cisco Systems Inc. | 8,951 | 463,125 | ||||||
| Corning, Inc. | 14,427 | 505,522 | ||||||
| First Solar, Inc.* | 2,193 | 416,867 | ||||||
| Gartner, Inc.* | 1,299 | 455,053 | ||||||
| Gen Digital, Inc. | 25,347 | 470,187 | ||||||
| Intel Corp. | 14,141 | 472,875 | ||||||
| International Business Machines Corp. | 3,461 | 463,117 | ||||||
| Juniper Networks, Inc. | 14,636 | 458,546 | ||||||
| Motorola Solutions, Inc. | 1,587 | 465,435 | ||||||
| NetApp, Inc. | 6,701 | 511,957 | ||||||
| PTC, Inc.* | 3,308 | 470,728 | ||||||
| Roper Technologies, Inc. | 979 | 470,703 | ||||||
| Teledyne Technologies, Inc.* | 1,148 | 471,954 | ||||||
| Texas Instruments, Inc. | 2,560 | 460,851 | ||||||
| 6,556,920 | ||||||||
| Materials – 2.6% | ||||||||
| CF Industries Holdings, Inc. | 8,688 | 603,121 | ||||||
| Real Estate – 2.3% | ||||||||
| Realty Income Corp. | 9,033 | 540,083 | ||||||
| Utilities – 2.5% | ||||||||
| Consolidated Edison, Inc. | 6,388 | 577,476 | ||||||
| Total Common Stocks | ||||||||
| (Cost $23,405,941) | 23,173,396 | |||||||
See Notes to the Financial Statements
14
ASYMmetric Smart S&P 500® ETF
Schedule of Investments (Unaudited) – Continued
June 30, 2023
| Shares | Value | |||||||
| SHORT-TERM INVESTMENT – 0.4% | ||||||||
| Money Market Deposit Account – 0.4% | ||||||||
| U.S. Bank N.A., 5.050% (a) | ||||||||
| (Cost $91,483) | 91,483 | $ | 91,483 | |||||
| Total Investments – 99.9% | ||||||||
| (Cost $23,497,425) | 23,264,879 | |||||||
| Other Assets and Liabilities, Net – 0.1% | 22,857 | |||||||
| Total Net Assets – 100.0% | $ | 23,287,736 | ||||||
| * | Non-income producing security |
| # | The Fund is significantly invested in this sector and therefore is subject to additional risks. The information technology sector may be more sensitive to short product cycles, competition and more aggressive pricing than the overall market. |
| (a) | The Money Market Deposit Account (the “MMDA”) is a short-term investment vehicle in which the Fund holds cash balances. The MMDA will bear interest at a variable rate that is determined based on conditions and may change daily and by any amount. The rate shown is as of June 30, 2023. |
See Notes to the Financial Statements
15
ASYMmetric Smart Alpha S&P 500® ETF
Schedule of Investments (Unaudited)
June 30, 2023
| Shares | Value | |||||||
| COMMON STOCKS – 90.6% | ||||||||
| Communication Services – 7.8% | ||||||||
| Activision Blizzard, Inc.* | 16 | $ | 1,349 | |||||
| Alphabet, Inc.* | 127 | 15,202 | ||||||
| Alphabet, Inc.* | 111 | 13,428 | ||||||
| AT&T, Inc. | 149 | 2,376 | ||||||
| Charter Communications, Inc.* | 2 | 735 | ||||||
| Comcast Corp. | 100 | 4,155 | ||||||
| DISH Network Corp.* | 2 | 13 | ||||||
| Electronic Arts, Inc. | 7 | 908 | ||||||
| Fox Corp. | 1 | 32 | ||||||
| Fox Corp. | 2 | 68 | ||||||
| Interpublic Group of Companies, Inc. | 3 | 116 | ||||||
| Live Nation Entertainment, Inc.* | 1 | 91 | ||||||
| Match Group, Inc.* | 2 | 84 | ||||||
| Meta Platforms, Inc.* | 48 | 13,775 | ||||||
| Netflix, Inc.* | 10 | 4,405 | ||||||
| News Corp. | 3 | 58 | ||||||
| News Corp. | 1 | 20 | ||||||
| Omnicom Group, Inc. | 2 | 190 | ||||||
| Paramount Global | 4 | 64 | ||||||
| Take-Two Interactive Software, Inc.* | 5 | 736 | ||||||
| T-Mobile US, Inc.* | 13 | 1,806 | ||||||
| Verizon Communications, Inc. | 98 | 3,644 | ||||||
| Walt Disney Co.* | 41 | 3,660 | ||||||
| Warner Bros Discovery, Inc.* | 43 | 539 | ||||||
| 67,454 | ||||||||
| Consumer Discretionary – 9.9% | ||||||||
| Amazon.com, Inc.* | 187 | 24,377 | ||||||
| Aptiv Plc* | 7 | 715 | ||||||
| AutoZone, Inc.* | 1 | 2,493 | ||||||
| Bath & Body Works, Inc. | 2 | 75 | ||||||
| Best Buy Co., Inc. | 2 | 164 | ||||||
| Booking Holdings, Inc.* | 1 | 2,700 | ||||||
| BorgWarner, Inc. | 2 | 98 | ||||||
| Caesars Entertainment, Inc.* | 2 | 102 | ||||||
| CarMax, Inc.* | 1 | 84 | ||||||
| Carnival Corp.* | 8 | 151 | ||||||
| Chipotle Mexican Grill, Inc.* | 1 | 2,139 | ||||||
| D.R. Horton, Inc. | 7 | 852 | ||||||
| Darden Restaurants, Inc. | 1 | 167 | ||||||
See Notes to the Financial Statements
16
ASYMmetric Smart Alpha S&P 500® ETF
Schedule of Investments (Unaudited) – Continued
June 30, 2023
| Shares | Value | |||||||
| Consumer Discretionary – 9.9% – Continued | ||||||||
| Dollar Tree, Inc.* | 4 | $ | 574 | |||||
| eBay, Inc. | 15 | 670 | ||||||
| Etsy, Inc.* | 1 | 85 | ||||||
| Expedia Group, Inc.* | 1 | 109 | ||||||
| Ford Motor Co. | 91 | 1,377 | ||||||
| Garmin Ltd. | 1 | 104 | ||||||
| General Motors Co. | 31 | 1,195 | ||||||
| Genuine Parts Co. | 3 | 508 | ||||||
| Hasbro, Inc. | 1 | 65 | ||||||
| Hilton Worldwide Holdings, Inc. | 6 | 873 | ||||||
| Home Depot, Inc. | 22 | 6,834 | ||||||
| Las Vegas Sands Corp.* | 3 | 174 | ||||||
| Lennar Corp. | 6 | 752 | ||||||
| LKQ Corp. | 2 | 117 | ||||||
| Lowe’s Companies, Inc. | 14 | 3,160 | ||||||
| Marriott International, Inc. | 6 | 1,102 | ||||||
| McDonald’s Corp. | 15 | 4,476 | ||||||
| MGM Resorts International | 3 | 132 | ||||||
| Newell Brands, Inc. | 3 | 26 | ||||||
| NIKE, Inc. | 31 | 3,421 | ||||||
| Norwegian Cruise Line Holdings Ltd.* | 3 | 65 | ||||||
| O’Reilly Automotive, Inc.* | 2 | 1,911 | ||||||
| PulteGroup, Inc. | 2 | 155 | ||||||
| Ross Stores, Inc. | 8 | 897 | ||||||
| Royal Caribbean Cruises Ltd.* | 2 | 207 | ||||||
| Starbucks Corp. | 27 | 2,675 | ||||||
| Tapestry, Inc. | 2 | 86 | ||||||
| Target Corp. | 9 | 1,187 | ||||||
| Tesla, Inc.* | 55 | 14,397 | ||||||
| TJX Companies, Inc. | 25 | 2,120 | ||||||
| Tractor Supply Co. | 2 | 442 | ||||||
| Ulta Beauty, Inc.* | 1 | 471 | ||||||
| VF Corp. | 3 | 57 | ||||||
| Wynn Resorts Ltd. | 1 | 106 | ||||||
| Yum! Brands, Inc. | 7 | 970 | ||||||
| 85,617 | ||||||||
| Consumer Staples – 5.8% | ||||||||
| Altria Group, Inc. | 36 | 1,631 | ||||||
| Archer-Daniels-Midland Co. | 13 | 982 | ||||||
| Brown-Forman Corp. | 1 | 67 | ||||||
See Notes to the Financial Statements
17
ASYMmetric Smart Alpha S&P 500® ETF
Schedule of Investments (Unaudited) – Continued
June 30, 2023
| Shares | Value | |||||||
| Consumer Staples – 5.8% – Continued | ||||||||
| Campbell Soup Co. | 2 | $ | 91 | |||||
| Church & Dwight Co, Inc. | 2 | 200 | ||||||
| Clorox Co. | 1 | 159 | ||||||
| Coca-Cola Co. | 83 | 4,998 | ||||||
| Colgate-Palmolive Co. | 18 | 1,387 | ||||||
| Conagra Brands, Inc. | 4 | 135 | ||||||
| Constellation Brands, Inc. | 4 | 985 | ||||||
| Costco Wholesale Corp. | 10 | 5,384 | ||||||
| Dollar General Corp. | 5 | 849 | ||||||
| Estee Lauder Companies Inc. | 5 | 982 | ||||||
| General Mills, Inc. | 14 | 1,074 | ||||||
| Hershey Co. | 3 | 749 | ||||||
| Hormel Foods Corp. | 2 | 80 | ||||||
| J.M. Smucker Co. | 1 | 148 | ||||||
| Kellogg Co. | 2 | 135 | ||||||
| Keurig Dr Pepper, Inc. | 19 | 594 | ||||||
| Kimberly-Clark Corp. | 8 | 1,105 | ||||||
| Kraft Heinz Co. | 17 | 604 | ||||||
| Kroger Co. | 15 | 705 | ||||||
| Lamb Weston Holdings, Inc. | 1 | 115 | ||||||
| McCormick & Co., Inc. | 6 | 523 | ||||||
| Molson Coors Beverage Co. | 2 | 132 | ||||||
| Mondelez International, Inc. | 34 | 2,480 | ||||||
| Monster Beverage Corp.* | 18 | 1,034 | ||||||
| PepsiCo, Inc. | 29 | 5,371 | ||||||
| Philip Morris International, Inc. | 37 | 3,612 | ||||||
| Procter & Gamble Co. | 49 | 7,435 | ||||||
| Sysco Corp. | 12 | 890 | ||||||
| Tyson Foods, Inc. | 2 | 102 | ||||||
| Walgreens Boots Alliance, Inc. | 16 | 456 | ||||||
| Walmart, Inc. | 30 | 4,715 | ||||||
| 49,909 | ||||||||
| Energy – 3.8% | ||||||||
| APA Corp. | 3 | 103 | ||||||
| Baker Hughes Co. | 23 | 727 | ||||||
| Chevron Corp. | 38 | 5,979 | ||||||
| ConocoPhillips | 24 | 2,487 | ||||||
| Coterra Energy, Inc. | 6 | 152 | ||||||
| Devon Energy Corp. | 16 | 774 | ||||||
| Diamondback Energy, Inc. | 4 | 525 | ||||||
See Notes to the Financial Statements
18
ASYMmetric Smart Alpha S&P 500® ETF
Schedule of Investments (Unaudited) – Continued
June 30, 2023
| Shares | Value | |||||||
| Energy – 3.8% – Continued | ||||||||
| EOG Resources, Inc. | 13 | $ | 1,488 | |||||
| EQT Corp. | 3 | 123 | ||||||
| Exxon Mobil Corp. | 86 | 9,224 | ||||||
| Halliburton Co. | 19 | 627 | ||||||
| Hess Corp. | 7 | 952 | ||||||
| Kinder Morgan, Inc. | 38 | 654 | ||||||
| Marathon Oil Corp. | 5 | 115 | ||||||
| Marathon Petroleum Corp. | 9 | 1,049 | ||||||
| Occidental Petroleum Corp. | 18 | 1,058 | ||||||
| ONEOK, Inc. | 10 | 617 | ||||||
| Phillips 66 | 11 | 1,049 | ||||||
| Pioneer Natural Resources Co. | 5 | 1,036 | ||||||
| Schlumberger Ltd. | 32 | 1,572 | ||||||
| Targa Resources Corp. | 2 | 152 | ||||||
| The Williams Company Inc. | 29 | 946 | ||||||
| Valero Energy Corp. | 9 | 1,056 | ||||||
| 32,465 | ||||||||
| Financials – 11.1% | ||||||||
| Aflac, Inc. | 14 | 977 | ||||||
| Allstate Corp. | 6 | 654 | ||||||
| American Express Co. | 12 | 2,090 | ||||||
| American International Group, Inc. | 18 | 1,036 | ||||||
| Ameriprise Financial, Inc. | 2 | 664 | ||||||
| Aon Plc | 4 | 1,381 | ||||||
| Arch Capital Group Ltd.* | 8 | 599 | ||||||
| Arthur J Gallagher & Co. | 5 | 1,098 | ||||||
| Bank of America Corp. | 157 | 4,504 | ||||||
| Bank of New York Mellon Corp. | 18 | 801 | ||||||
| Berkshire Hathaway, Inc.* | 38 | 12,958 | ||||||
| BlackRock, Inc. | 3 | 2,073 | ||||||
| Brown & Brown, Inc. | 2 | 138 | ||||||
| Capital One Financial Corp. | 9 | 984 | ||||||
| Cboe Global Markets, Inc. | 1 | 138 | ||||||
| Charles Schwab Corp. | 30 | 1,700 | ||||||
| Chubb Ltd. | 9 | 1,733 | ||||||
| Cincinnati Financial Corp. | 1 | 97 | ||||||
| Citigroup, Inc. | 41 | 1,888 | ||||||
| Citizens Financial Group, Inc. | 4 | 104 | ||||||
| CME Group, Inc. | 8 | 1,482 | ||||||
| Comerica, Inc. | 1 | 42 | ||||||
See Notes to the Financial Statements
19
ASYMmetric Smart Alpha S&P 500® ETF
Schedule of Investments (Unaudited) – Continued
June 30, 2023
| Shares | Value | |||||||
| Financials – 11.1% – Continued | ||||||||
| Discover Financial Services | 6 | $ | 701 | |||||
| Everest Re Group Ltd. | 1 | 342 | ||||||
| FactSet Research Systems, Inc. | 1 | 401 | ||||||
| Fifth Third Bancorp | 19 | 498 | ||||||
| Fiserv, Inc.* | 13 | 1,640 | ||||||
| Franklin Resources, Inc. | 2 | 53 | ||||||
| Globe Life, Inc. | 1 | 110 | ||||||
| Goldman Sachs Group, Inc. | 7 | 2,258 | ||||||
| Hartford Financial Services Group, Inc. | 6 | 432 | ||||||
| Huntington Bancshares, Inc. | 31 | 334 | ||||||
| Intercontinental Exchange, Inc. | 12 | 1,357 | ||||||
| Invesco Ltd. | 4 | 67 | ||||||
| Jack Henry & Associates, Inc. | 1 | 167 | ||||||
| JPMorgan Chase & Co. | 60 | 8,726 | ||||||
| KeyCorp | 7 | 65 | ||||||
| Lincoln National Corp. | 1 | 26 | ||||||
| Loews Corp. | 2 | 119 | ||||||
| M&T Bank Corp. | 4 | 495 | ||||||
| MarketAxess Holdings, Inc. | 1 | 261 | ||||||
| Marsh & McLennan Companies, Inc. | 12 | 2,257 | ||||||
| Mastercard, Inc. | 19 | 7,473 | ||||||
| MetLife, Inc. | 16 | 905 | ||||||
| Moody’s Corp. | 3 | 1,043 | ||||||
| Morgan Stanley | 32 | 2,733 | ||||||
| MSCI, Inc. | 2 | 939 | ||||||
| Nasdaq, Inc. | 3 | 150 | ||||||
| Northern Trust Corp. | 2 | 148 | ||||||
| PayPal Holdings, Inc.* | 22 | 1,468 | ||||||
| PNC Financial Services Group, Inc. | 8 | 1,008 | ||||||
| Principal Financial Group, Inc. | 2 | 152 | ||||||
| Progressive Corp. | 12 | 1,589 | ||||||
| Prudential Financial, Inc. | 8 | 706 | ||||||
| Raymond James Financial, Inc. | 2 | 208 | ||||||
| Regions Financial Corp. | 20 | 356 | ||||||
| S&P Global, Inc. | 8 | 3,207 | ||||||
| State Street Corp. | 8 | 585 | ||||||
| Synchrony Financial | 4 | 136 | ||||||
| T. Rowe Price Group, Inc. | 5 | 560 | ||||||
| Travelers Companies, Inc. | 6 | 1,042 | ||||||
| Truist Financial Corp. | 27 | 820 | ||||||
| US Bancorp | 29 | 958 | ||||||
See Notes to the Financial Statements
20
ASYMmetric Smart Alpha S&P 500® ETF
Schedule of Investments (Unaudited) – Continued
June 30, 2023
| Shares | Value | |||||||
| Financials – 11.1% – Continued | ||||||||
| Visa, Inc. | 35 | $ | 8,312 | |||||
| W.R. Berkley Corp. | 2 | 119 | ||||||
| Wells Fargo & Co. | 76 | 3,244 | ||||||
| Willis Towers Watson Plc | 2 | 471 | ||||||
| Zions Bancorp | 1 | 27 | ||||||
| 95,809 | ||||||||
| Health Care – 12.4% | ||||||||
| Abbott Laboratories | 40 | 4,361 | ||||||
| AbbVie, Inc. | 40 | 5,389 | ||||||
| Agilent Technologies, Inc. | 7 | 842 | ||||||
| Align Technology, Inc.* | 1 | 354 | ||||||
| AmerisourceBergen Corp. | 4 | 770 | ||||||
| Amgen, Inc. | 13 | 2,886 | ||||||
| Baxter International, Inc. | 15 | 683 | ||||||
| Becton Dickinson and Co. | 6 | 1,584 | ||||||
| Biogen, Inc.* | 3 | 855 | ||||||
| Bio-Techne Corp. | 1 | 82 | ||||||
| Boston Scientific Corp.* | 29 | 1,569 | ||||||
| Bristol-Myers Squibb Co. | 50 | 3,197 | ||||||
| Cardinal Health, Inc. | 2 | 189 | ||||||
| Catalent, Inc.* | 1 | 43 | ||||||
| Centene Corp.* | 14 | 944 | ||||||
| Cigna Group | 7 | 1,964 | ||||||
| Cooper Companies, Inc. | 1 | 383 | ||||||
| CVS Health Corp. | 28 | 1,936 | ||||||
| Danaher Corp. | 15 | 3,600 | ||||||
| DENTSPLY SIRONA, Inc. | 2 | 80 | ||||||
| Dexcom, Inc.* | 9 | 1,157 | ||||||
| Edwards Lifesciences Corp.* | 13 | 1,226 | ||||||
| Elevance Health, Inc. | 5 | 2,221 | ||||||
| Eli Lilly & Co. | 17 | 7,973 | ||||||
| GE HealthCare Technologies, Inc. | 8 | 650 | ||||||
| Gilead Sciences, Inc. | 30 | 2,312 | ||||||
| HCA Healthcare, Inc. | 5 | 1,517 | ||||||
| Henry Schein, Inc.* | 1 | 81 | ||||||
| Hologic, Inc.* | 2 | 162 | ||||||
| Humana, Inc. | 3 | 1,341 | ||||||
| IDEXX Laboratories, Inc.* | 2 | 1,004 | ||||||
| Illumina, Inc.* | 3 | 562 | ||||||
| Incyte Corp.* | 1 | 62 | ||||||
See Notes to the Financial Statements
21
ASYMmetric Smart Alpha S&P 500® ETF
Schedule of Investments (Unaudited) – Continued
June 30, 2023
| Shares | Value | |||||||
| Health Care – 12.4% – Continued | ||||||||
| Insulet Corp.* | 2 | $ | 577 | |||||
| Intuitive Surgical, Inc.* | 7 | 2,394 | ||||||
| IQVIA Holdings, Inc.* | 4 | 899 | ||||||
| Johnson & Johnson | 57 | 9,435 | ||||||
| Laboratory Corp of America Holdings | 1 | 241 | ||||||
| McKesson Corp. | 3 | 1,282 | ||||||
| Medtronic Plc | 26 | 2,291 | ||||||
| Merck & Co., Inc. | 53 | 6,116 | ||||||
| Mettler-Toledo International, Inc.* | 1 | 1,312 | ||||||
| Moderna, Inc.* | 8 | 972 | ||||||
| Molina Healthcare, Inc.* | 1 | 301 | ||||||
| Organon & Co. | 2 | 42 | ||||||
| PerkinElmer, Inc. | 1 | 119 | ||||||
| Pfizer, Inc. | 122 | 4,475 | ||||||
| Quest Diagnostics, Inc. | 1 | 141 | ||||||
| Regeneron Pharmaceuticals, Inc.* | 2 | 1,437 | ||||||
| ResMed, Inc. | 3 | 655 | ||||||
| STERIS Plc | 1 | 225 | ||||||
| Stryker Corp. | 8 | 2,441 | ||||||
| Thermo Fisher Scientific, Inc. | 9 | 4,696 | ||||||
| UnitedHealth Group, Inc. | 20 | 9,613 | ||||||
| Universal Health Services, Inc. | 1 | 158 | ||||||
| Vertex Pharmaceuticals, Inc.* | 6 | 2,111 | ||||||
| Viatris, Inc. | 10 | 100 | ||||||
| Waters Corp.* | 1 | 267 | ||||||
| West Pharmaceutical Services, Inc. | 1 | 382 | ||||||
| Zimmer Biomet Holdings, Inc. | 5 | 728 | ||||||
| Zoetis, Inc. | 10 | 1,722 | ||||||
| 107,111 | ||||||||
| Industrials – 7.5% | ||||||||
| 3M Co. | 11 | 1,101 | ||||||
| A O Smith Corp. | 1 | 73 | ||||||
| Alaska Air Group, Inc.* | 1 | 53 | ||||||
| Allegion Plc | 1 | 120 | ||||||
| American Airlines Group, Inc.* | 5 | 90 | ||||||
| AMETEK, Inc. | 6 | 971 | ||||||
| Automatic Data Processing, Inc. | 9 | 1,978 | ||||||
| Axon Enterprise, Inc.* | 3 | 585 | ||||||
| Boeing Co.* | 14 | 2,956 | ||||||
| Broadridge Financial Solutions, Inc. | 1 | 166 | ||||||
See Notes to the Financial Statements
22
ASYMmetric Smart Alpha S&P 500® ETF
Schedule of Investments (Unaudited) – Continued
June 30, 2023
| Shares | Value | |||||||
| Industrials – 7.5% – Continued | ||||||||
| C.H. Robinson Worldwide, Inc. | 1 | $ | 94 | |||||
| Carrier Global Corp. | 19 | 944 | ||||||
| Caterpillar, Inc. | 11 | 2,707 | ||||||
| Ceridian HCM Holding, Inc.* | 1 | 67 | ||||||
| Cintas Corp. | 2 | 994 | ||||||
| Copart, Inc.* | 10 | 912 | ||||||
| CoStar Group, Inc.* | 9 | 801 | ||||||
| CSX Corp. | 42 | 1,432 | ||||||
| Cummins, Inc. | 3 | 735 | ||||||
| Deere & Co. | 6 | 2,431 | ||||||
| Delta Air Lines, Inc.* | 15 | 713 | ||||||
| Dover Corp. | 1 | 148 | ||||||
| Eaton Corp Plc | 8 | 1,609 | ||||||
| Emerson Electric Co. | 13 | 1,175 | ||||||
| Equifax, Inc. | 3 | 706 | ||||||
| Expeditors International of Washington, Inc. | 1 | 121 | ||||||
| Fastenal Co. | 13 | 767 | ||||||
| FedEx Corp. | 5 | 1,239 | ||||||
| Fortive Corp. | 8 | 598 | ||||||
| Generac Holdings, Inc.* | 1 | 149 | ||||||
| General Dynamics Corp. | 5 | 1,076 | ||||||
| General Electric Co. | 22 | 2,417 | ||||||
| Honeywell International, Inc. | 14 | 2,905 | ||||||
| Howmet Aerospace, Inc. | 3 | 149 | ||||||
| IDEX Corp. | 1 | 215 | ||||||
| Illinois Tool Works, Inc. | 6 | 1,501 | ||||||
| Ingersoll Rand, Inc. | 10 | 654 | ||||||
| Jacobs Solutions, Inc. | 1 | 119 | ||||||
| JB Hunt Transport Services, Inc. | 1 | 181 | ||||||
| Johnson Controls International Plc | 17 | 1,158 | ||||||
| L3Harris Technologies, Inc. | 5 | 979 | ||||||
| Leidos Holdings, Inc. | 1 | 88 | ||||||
| Lockheed Martin Corp. | 4 | 1,842 | ||||||
| Masco Corp. | 2 | 115 | ||||||
| Norfolk Southern Corp. | 5 | 1,134 | ||||||
| Northrop Grumman Corp. | 3 | 1,367 | ||||||
| Old Dominion Freight Line, Inc. | 3 | 1,109 | ||||||
| Otis Worldwide Corp. | 9 | 801 | ||||||
| PACCAR, Inc. | 12 | 1,004 | ||||||
| Parker-Hannifin Corp. | 3 | 1,170 | ||||||
| Pentair Plc | 1 | 65 | ||||||
See Notes to the Financial Statements
23
ASYMmetric Smart Alpha S&P 500® ETF
Schedule of Investments (Unaudited) – Continued
June 30, 2023
| Shares | Value | |||||||
| Industrials – 7.5% – Continued | ||||||||
| Quanta Services, Inc. | 4 | $ | 786 | |||||
| Raytheon Technologies Corp. | 31 | 3,037 | ||||||
| Republic Services, Inc. | 6 | 919 | ||||||
| Robert Half International, Inc. | 1 | 75 | ||||||
| Rockwell Automation, Inc. | 3 | 988 | ||||||
| Rollins, Inc. | 2 | 86 | ||||||
| Snap-on, Inc. | 2 | 576 | ||||||
| Southwest Airlines Co. | 5 | 181 | ||||||
| Stanley Black & Decker, Inc. | 1 | 94 | ||||||
| Textron, Inc. | 2 | 135 | ||||||
| Trane Technologies Plc | 5 | 956 | ||||||
| TransDigm Group, Inc. | 1 | 894 | ||||||
| Union Pacific Corp. | 14 | 2,865 | ||||||
| United Airlines Holdings, Inc.* | 3 | 165 | ||||||
| United Parcel Service, Inc. | 14 | 2,510 | ||||||
| United Rentals, Inc. | 1 | 445 | ||||||
| Verisk Analytics, Inc. | 3 | 678 | ||||||
| W.W. Grainger, Inc. | 1 | 789 | ||||||
| Waste Management, Inc. | 6 | 1,041 | ||||||
| Westinghouse Air Brake Technologies Corp. | 6 | 658 | ||||||
| Xylem Inc. | 6 | 676 | ||||||
| 65,038 | ||||||||
| Information Technology# – 26.0% | ||||||||
| Accenture Plc | 14 | 4,320 | ||||||
| Adobe, Inc.* | 10 | 4,890 | ||||||
| Advanced Micro Devices, Inc.* | 33 | 3,759 | ||||||
| Akamai Technologies, Inc.* | 1 | 90 | ||||||
| Amphenol Corp. | 13 | 1,104 | ||||||
| Analog Devices, Inc. | 10 | 1,948 | ||||||
| ANSYS, Inc.* | 1 | 330 | ||||||
| Apple, Inc. | 319 | 61,876 | ||||||
| Applied Materials, Inc. | 19 | 2,746 | ||||||
| Arista Networks, Inc.* | 6 | 972 | ||||||
| Autodesk, Inc.* | 5 | 1,023 | ||||||
| Broadcom, Inc. | 9 | 7,807 | ||||||
| Cadence Design Systems, Inc.* | 6 | 1,407 | ||||||
| CDW Corp. | 3 | 551 | ||||||
| Cisco Systems Inc. | 96 | 4,967 | ||||||
| Cognizant Technology Solutions Corp. | 11 | 718 | ||||||
| Corning, Inc. | 18 | 631 | ||||||
See Notes to the Financial Statements
24
ASYMmetric Smart Alpha S&P 500® ETF
Schedule of Investments (Unaudited) – Continued
June 30, 2023
| Shares | Value | |||||||
| Information Technology# – 26.0% – Continued | ||||||||
| DXC Technology Co.* | 2 | $ | 54 | |||||
| Enphase Energy, Inc.* | 3 | 503 | ||||||
| EPAM Systems, Inc.* | 1 | 225 | ||||||
| Fair Isaac Corp.* | 1 | 809 | ||||||
| Fidelity National Information Services, Inc. | 14 | 766 | ||||||
| First Solar, Inc.* | 1 | 190 | ||||||
| FleetCor Technologies, Inc.* | 1 | 251 | ||||||
| Fortinet, Inc.* | 16 | 1,209 | ||||||
| Gartner, Inc.* | 1 | 350 | ||||||
| Gen Digital, Inc. | 5 | 93 | ||||||
| Global Payments, Inc. | 6 | 591 | ||||||
| Hewlett Packard Enterprise Co. | 10 | 168 | ||||||
| HP, Inc. | 19 | 584 | ||||||
| Intel Corp. | 97 | 3,244 | ||||||
| International Business Machines Corp. | 22 | 2,944 | ||||||
| Intuit, Inc. | 6 | 2,749 | ||||||
| Juniper Networks, Inc. | 3 | 94 | ||||||
| Keysight Technologies, Inc.* | 4 | 670 | ||||||
| KLA Corp. | 3 | 1,455 | ||||||
| Lam Research Corp. | 3 | 1,929 | ||||||
| Microchip Technology, Inc. | 12 | 1,075 | ||||||
| Micron Technology, Inc. | 22 | 1,388 | ||||||
| Microsoft Corp. | 158 | 53,805 | ||||||
| Monolithic Power Systems, Inc. | 1 | 540 | ||||||
| Motorola Solutions, Inc. | 4 | 1,173 | ||||||
| NetApp, Inc. | 2 | 153 | ||||||
| NVIDIA Corp. | 52 | 21,997 | ||||||
| NXP Semiconductors NV | 6 | 1,228 | ||||||
| ON Semiconductor Corp.* | 9 | 851 | ||||||
| Oracle Corp. | 36 | 4,287 | ||||||
| Paychex, Inc. | 8 | 895 | ||||||
| Paycom Software, Inc. | 1 | 321 | ||||||
| PTC, Inc.* | 1 | 142 | ||||||
| Qorvo, Inc.* | 1 | 102 | ||||||
| QUALCOMM, Inc. | 26 | 3,095 | ||||||
| Roper Technologies, Inc. | 2 | 962 | ||||||
| Salesforce, Inc.* | 23 | 4,859 | ||||||
| Seagate Technology Holdings Plc | 2 | 124 | ||||||
| ServiceNow, Inc.* | 4 | 2,248 | ||||||
| Skyworks Solutions, Inc. | 1 | 111 | ||||||
| SolarEdge Technologies, Inc.* | 1 | 269 | ||||||
See Notes to the Financial Statements
25
ASYMmetric Smart Alpha S&P 500® ETF
Schedule of Investments (Unaudited) – Continued
June 30, 2023
| Shares | Value | |||||||
| Information Technology# – 26.0% – Continued | ||||||||
| Synopsys, Inc.* | 4 | $ | 1,742 | |||||
| TE Connectivity Ltd. | 7 | 981 | ||||||
| Teledyne Technologies, Inc.* | 1 | 411 | ||||||
| Teradyne, Inc. | 1 | 111 | ||||||
| Texas Instruments, Inc. | 18 | 3,240 | ||||||
| Trimble, Inc.* | 2 | 106 | ||||||
| Tyler Technologies, Inc.* | 1 | 416 | ||||||
| VeriSign, Inc.* | 1 | 226 | ||||||
| Western Digital Corp.* | 3 | 114 | ||||||
| Zebra Technologies Corp.* | 1 | 296 | ||||||
| 225,285 | ||||||||
| Materials – 2.2% | ||||||||
| Air Products and Chemicals, Inc. | 5 | 1,498 | ||||||
| Albemarle Corp. | 3 | 669 | ||||||
| Amcor Plc | 12 | 120 | ||||||
| Avery Dennison Corp. | 1 | 172 | ||||||
| Ball Corp. | 3 | 175 | ||||||
| Celanese Corp. | 1 | 116 | ||||||
| CF Industries Holdings, Inc. | 2 | 139 | ||||||
| Corteva, Inc. | 17 | 974 | ||||||
| Dow, Inc. | 16 | 852 | ||||||
| DuPont de Nemours, Inc. | 12 | 857 | ||||||
| Eastman Chemical Co. | 1 | 84 | ||||||
| Ecolab, Inc. | 6 | 1,120 | ||||||
| FMC Corp. | 1 | 104 | ||||||
| Freeport-McMoRan, Inc. | 31 | 1,240 | ||||||
| International Flavors & Fragrances, Inc. | 6 | 477 | ||||||
| International Paper Co. | 3 | 95 | ||||||
| Linde Plc | 11 | 4,192 | ||||||
| LyondellBasell Industries NV | 7 | 643 | ||||||
| Martin Marietta Materials, Inc. | 1 | 462 | ||||||
| Mosaic Co. | 3 | 105 | ||||||
| Newmont Corp. | 20 | 853 | ||||||
| Nucor Corp. | 6 | 984 | ||||||
| Packaging Corp of America | 1 | 132 | ||||||
| PPG Industries, Inc. | 5 | 741 | ||||||
| Sealed Air Corp. | 1 | 40 | ||||||
| Sherwin-Williams Co. | 5 | 1,328 | ||||||
| Steel Dynamics, Inc. | 3 | 327 | ||||||
| Vulcan Materials Co. | 3 | 676 | ||||||
| Westrock Co. | 2 | 58 | ||||||
| 19,233 | ||||||||
See Notes to the Financial Statements
26
ASYMmetric Smart Alpha S&P 500® ETF
Schedule of Investments (Unaudited) – Continued
June 30, 2023
| Shares | Value | |||||||
| Real Estate – 1.9% | ||||||||
| Alexandria Real Estate Equities, Inc. | 4 | $ | 454 | |||||
| American Tower Corp. | 10 | 1,939 | ||||||
| AvalonBay Communities, Inc. | 3 | 568 | ||||||
| Boston Properties, Inc. | 1 | 57 | ||||||
| Camden Property Trust | 1 | 109 | ||||||
| CBRE Group, Inc.* | 7 | 565 | ||||||
| Crown Castle International Corp. | 9 | 1,025 | ||||||
| Digital Realty Trust, Inc. | 7 | 797 | ||||||
| Equinix, Inc. | 2 | 1,568 | ||||||
| Equity Residential | 3 | 198 | ||||||
| Essex Property Trust, Inc. | 1 | 234 | ||||||
| Extra Space Storage, Inc. | 3 | 446 | ||||||
| Federal Realty Investment Trust | 1 | 97 | ||||||
| Healthpeak Properties, Inc. | 4 | 80 | ||||||
| Host Hotels & Resorts, Inc. | 6 | 101 | ||||||
| Invitation Homes, Inc. | 5 | 172 | ||||||
| Iron Mountain, Inc. | 2 | 114 | ||||||
| Kimco Realty Corp. | 5 | 98 | ||||||
| Mid-America Apartment Communities, Inc. | 1 | 152 | ||||||
| Prologis, Inc. | 19 | 2,330 | ||||||
| Public Storage | 3 | 876 | ||||||
| Realty Income Corp. | 15 | 897 | ||||||
| Regency Centers Corp. | 1 | 62 | ||||||
| SBA Communications Corp. | 2 | 463 | ||||||
| Simon Property Group, Inc. | 8 | 924 | ||||||
| UDR, Inc. | 2 | 86 | ||||||
| Ventas, Inc. | 3 | 142 | ||||||
| VICI Properties, Inc. | 20 | 629 | ||||||
| Welltower, Inc. | 9 | 728 | ||||||
| Weyerhaeuser Co. | 21 | 704 | ||||||
| 16,615 | ||||||||
| Utilities – 2.2% | ||||||||
| AES Corp. | 5 | 104 | ||||||
| Alliant Energy Corp. | 2 | 105 | ||||||
| Ameren Corp. | 6 | 490 | ||||||
| American Electric Power Company, Inc. | 12 | 1,010 | ||||||
| American Water Works Co, Inc. | 4 | 571 | ||||||
| Atmos Energy Corp. | 1 | 116 | ||||||
| CenterPoint Energy, Inc. | 5 | 146 | ||||||
| CMS Energy Corp. | 2 | 117 | ||||||
See Notes to the Financial Statements
27
ASYMmetric Smart Alpha S&P 500® ETF
Schedule of Investments (Unaudited) – Continued
June 30, 2023
| Shares | Value | |||||||
| Utilities – 2.2% – Continued | ||||||||
| Consolidated Edison, Inc. | 9 | $ | 813 | |||||
| Constellation Energy Corp. | 8 | 732 | ||||||
| Dominion Energy, Inc. | 20 | 1,036 | ||||||
| DTE Energy Co. | 2 | 220 | ||||||
| Duke Energy Corp. | 16 | 1,436 | ||||||
| Edison International | 8 | 555 | ||||||
| Entergy Corp. | 2 | 195 | ||||||
| Evergy, Inc. | 2 | 117 | ||||||
| Eversource Energy | 8 | 567 | ||||||
| Exelon Corp. | 24 | 978 | ||||||
| FirstEnergy Corp. | 10 | 389 | ||||||
| NextEra Energy, Inc. | 46 | 3,413 | ||||||
| NiSource, Inc. | 3 | 82 | ||||||
| NRG Energy, Inc. | 2 | 75 | ||||||
| PG&E Corp.* | 35 | 605 | ||||||
| Pinnacle West Capital Corp. | 1 | 81 | ||||||
| PPL Corp. | 6 | 159 | ||||||
| Public Service Enterprise Group, Inc. | 11 | 689 | ||||||
| Sempra Energy | 7 | 1,019 | ||||||
| Southern Co. | 23 | 1,616 | ||||||
| WEC Energy Group, Inc. | 7 | 618 | ||||||
| Xcel Energy, Inc. | 10 | 623 | ||||||
| 18,677 | ||||||||
| Total Common Stocks | ||||||||
| (Cost $718,968) | 783,213 | |||||||
See Notes to the Financial Statements
28
ASYMmetric Smart Alpha S&P 500® ETF
Schedule of Investments (Unaudited) – Continued
June 30, 2023
| Shares | Value | |||||||
| SHORT-TERM INVESTMENT – 0.4% | ||||||||
| Money Market Deposit Account – 0.4% | ||||||||
| U.S. Bank N.A., 5.050% (a) | ||||||||
| (Cost $3,491) | 3,491 | $ | 3,491 | |||||
| Total Investments – 91.0% | ||||||||
| (Cost $722,459) | 786,704 | |||||||
| Other Assets and Liabilities, Net – 9.0% | 77,507 | |||||||
| Total Net Assets – 100.0% | $ | 864,211 | ||||||
| * | Non-income producing security |
| # | The Fund is significantly invested in this sector and therefore is subject to additional risks. The information technology sector may be more sensitive to short product cycles, competition and more aggressive pricing than the overall market. |
| (a) | The Money Market Deposit Account (the “MMDA”) is a short-term investment vehicle in which the Fund holds cash balances. The MMDA will bear interest at a variable rate that is determined based on conditions and may change daily and by any amount. The rate shown is as of June 30, 2023. |
Schedule of Open Futures Contracts
Futures Contracts Sold
| Number of | Notional | Value/Unrealized | |||
Description | Contracts Sold | Expiration Date | Amount | Fair Value | Appreciation |
| Micro E-Mini S&P 500 Index | 37 | September 2023 | $830,326 | $9,713 | $25,439 |
See Notes to the Financial Statements
29
ASYMmetric Smart Income ETF
Schedule of Investments (Unaudited)
June 30, 2023
Description | Par | Value | ||||||
| U.S. TREASURY NOTE – 99.4% | ||||||||
| United States Treasury Note – 99.4% | ||||||||
| 4.000%, 12/15/2025 | ||||||||
| (Cost $684,608) | $ | 690,000 | $ | 679,192 | ||||
| Shares | ||||||||
| SHORT-TERM INVESTMENT – 0.5% | ||||||||
| Money Market Deposit Account – 0.5% | ||||||||
| U.S. Bank N.A., 5.050% (a) | ||||||||
| (Cost $3,648) | 3,648 | 3,648 | ||||||
| Total Investments – 99.9% | ||||||||
| (Cost $688,256) | 682,840 | |||||||
| Other Assets and Liabilities, Net – 0.1% | 859 | |||||||
| Total Net Assets – 100.0% | $ | 683,699 | ||||||
| (a) | The Money Market Deposit Account (the “MMDA”) is a short-term investment vehicle in which the Fund holds cash balances. The MMDA will bear interest at a variable rate that is determined based on conditions and may change daily and by any amount. The rate shown is as of June 30, 2023. |
See Notes to the Financial Statements
30
ASYMmetric ETFs
Statement of Assets and Liabilities (Unaudited)
June 30, 2023
| ASYMmetric | ASYMmetric | ASYMmetric | ||||||||||
| Smart | Smart Alpha | Smart | ||||||||||
S&P 500® ETF | S&P 500® ETF | Income ETF | ||||||||||
| ASSETS: | ||||||||||||
| Investments, at fair value | ||||||||||||
| (cost $26,419,758, $722,459 and $688,256, respectively) | $ | 23,264,879 | $ | 786,704 | $ | 682,840 | ||||||
| Cash | — | 9,713 | — | |||||||||
| Cash held as collateral for futures contracts | 30,760 | 67,953 | — | |||||||||
| Dividends & interest receivable | 10,648 | 485 | 1,291 | |||||||||
| Total assets | 23,306,287 | 864,855 | 684,131 | |||||||||
| LIABILITIES: | ||||||||||||
| Payable to Adviser | 18,551 | 644 | 432 | |||||||||
| Total liabilities | 18,551 | 644 | 432 | |||||||||
| NET ASSETS | $ | 23,287,736 | $ | 864,211 | $ | 683,699 | ||||||
| NET ASSETS CONSIST OF: | ||||||||||||
| Capital stock | $ | 28,068,297 | $ | 750,000 | $ | 748,217 | ||||||
| Total accumulated loss | (4,780,561 | ) | 114,211 | (64,518 | ) | |||||||
| Net Assets | $ | 23,287,736 | $ | 864,211 | $ | 683,699 | ||||||
Shares issued and outstanding(1) | 890,000 | 30,000 | 30,000 | |||||||||
| Net asset value, redemption price and offering price per share | $ | 26.17 | $ | 28.81 | $ | 22.79 | ||||||
| (1) | Unlimited shares authorized. |
See Notes to the Financial Statements
31
ASYMmetric ETFs
Statement of Operations (Unaudited)
Six Months Ended June 30, 2023
| ASYMmetric | ASYMmetric | ASYMmetric | ||||||||||
| Smart | Smart Alpha | Smart | ||||||||||
S&P 500® ETF | S&P 500® ETF | Income ETF | ||||||||||
| INVESTMENT INCOME: | ||||||||||||
| Dividend and interest income | $ | 326,904 | $ | 5,370 | $ | 10,102 | ||||||
| Total investment income | 326,904 | 5,370 | 10,102 | |||||||||
| EXPENSES: | ||||||||||||
| Advisory fees (See Note 5) | 121,315 | 2,928 | 2,110 | |||||||||
| Total expenses | 121,315 | 2,928 | 2,110 | |||||||||
| NET INVESTMENT INCOME | 205,589 | 2,442 | 7,992 | |||||||||
| REALIZED AND UNREALIZED | ||||||||||||
| GAIN (LOSS) ON INVESTMENTS: | ||||||||||||
| Net realized loss on investments | (232,922 | ) | (4,217 | ) | (53,059 | ) | ||||||
| Net realized gain (loss) on futures contracts | (371,265 | ) | 26,302 | — | ||||||||
| Net change in unrealized | ||||||||||||
| appreciation/depreciation of investments | 145,073 | 64,245 | (5,415 | ) | ||||||||
| Net change in unrealized | ||||||||||||
| appreciation/depreciation of futures contracts | — | 25,439 | — | |||||||||
| Net realized and unrealized gain (loss) on investments: | (459,114 | ) | 111,769 | (58,474 | ) | |||||||
| NET INCREASE (DECREASE) IN NET ASSETS | ||||||||||||
| RESULTING FROM OPERATIONS | $ | (253,525 | ) | $ | 114,211 | $ | (50,482 | ) | ||||
See Notes to the Financial Statements
32
ASYMmetric ETFs
Statement of Changes in Net Assets
| ASYMmetric | ASYMmetric | |||||||||||||||
| ASYMmetric | Smart Alpha | Smart | ||||||||||||||
Smart S&P 500® ETF | S&P 500® ETF | Income ETF | ||||||||||||||
| Period from | Period from | |||||||||||||||
| January 31, | January 31, | |||||||||||||||
| Year Ended | 2023(1) | 2023(1) | ||||||||||||||
| Period Ended | December 31, | through | through | |||||||||||||
| June 30, 2023 | 2022 | June 30, 2023 | June 30, 2023 | |||||||||||||
| OPERATIONS | ||||||||||||||||
| Net investment income | $ | 205,589 | $ | 243,647 | $ | 2,442 | $ | 7,992 | ||||||||
| Net realized loss on investments | (232,922 | ) | (1,790,717 | ) | (4,217 | ) | (53,059 | ) | ||||||||
| Net realized gain (loss) on futures contracts | (371,265 | ) | (114,833 | ) | 26,302 | — | ||||||||||
| Net change in unrealized | ||||||||||||||||
| appreciation/depreciation of investments | ||||||||||||||||
| and translations of foreign currency | 145,073 | (1,461,185 | ) | 64,245 | (5,415 | ) | ||||||||||
| Net change in unrealized | ||||||||||||||||
| appreciation/depreciation of futures contracts | — | 11,941 | 25,439 | — | ||||||||||||
| Net increase (decrease) in net assets | ||||||||||||||||
| resulting from operations | (253,525 | ) | (3,111,147 | ) | 114,211 | (50,482 | ) | |||||||||
| CAPITAL SHARE TRANSACTIONS | ||||||||||||||||
| Proceeds from shares sold | 9,462,210 | 47,212,863 | 750,000 | 981,097 | ||||||||||||
| Payments for shares redeemed | (12,003,009 | ) | (41,853,306 | ) | — | (232,880 | ) | |||||||||
| Net increase (decrease) in net assets resulting | ||||||||||||||||
| from capital share transactions | (2,540,799 | ) | 5,359,557 | 750,000 | 748,217 | |||||||||||
| DISTRIBUTIONS TO SHAREHOLDERS | — | (231,798 | ) | — | (14,036 | ) | ||||||||||
| TOTAL INCREASE (DECREASE) | ||||||||||||||||
| IN NET ASSETS | (2,794,324 | ) | 2,016,612 | 864,211 | 683,699 | |||||||||||
| NET ASSETS | ||||||||||||||||
| Beginning of period | 26,082,060 | 24,065,448 | — | — | ||||||||||||
| End of period | $ | 23,287,736 | $ | 26,082,060 | $ | 864,211 | $ | 683,699 | ||||||||
| TRANSACTIONS IN SHARES | ||||||||||||||||
| Shares sold | 360,000 | 1,680,000 | 30,000 | 40,000 | ||||||||||||
| Shares redeemed | (460,000 | ) | (1,500,000 | ) | — | (10,000 | ) | |||||||||
| Net increase (decrease) | (100,000 | ) | 180,000 | 30,000 | 30,000 | |||||||||||
| Shares Outstanding: | ||||||||||||||||
| Beginning of period | 990,000 | 810,000 | — | — | ||||||||||||
| End of period | 890,000 | 990,000 | 30,000 | 30,000 | ||||||||||||
| (1) | Inception date of the Fund. |
See Notes to the Financial Statements
33
ASYMmetric Smart S&P 500® ETF
Financial Highlights
| Period from | ||||||||||||
| Period Ended | March 9, 2021(1) | |||||||||||
| June 30, 2023 | Year Ended | to | ||||||||||
| (unaudited) | December 31, 2022 | December 31, 2021 | ||||||||||
PER COMMON SHARE DATA(2) | ||||||||||||
| Net asset value, beginning of period | $ | 26.35 | $ | 29.71 | $ | 25.00 | ||||||
| INVESTMENT OPERATIONS: | ||||||||||||
| Net investment income | 0.24 | 0.24 | 0.05 | |||||||||
| Net realized and unrealized gain (loss) on investments | (0.43 | ) | (3.38 | ) | 4.72 | |||||||
| Total from investment operations | (0.19 | ) | (3.14 | ) | 4.77 | |||||||
| LESS DISTRIBUTIONS FROM: | ||||||||||||
| Net investment income | — | (0.23 | ) | (0.06 | ) | |||||||
| Net realized gains | — | — | — | |||||||||
| Total distributions | — | (0.23 | ) | (0.06 | ) | |||||||
| Net asset value, end of period | $ | 26.16 | $ | 26.34 | $ | 29.71 | ||||||
TOTAL RETURN(3) | -0.68 | % | -10.54 | % | 19.09 | % | ||||||
| SUPPLEMENTAL DATA AND RATIOS | ||||||||||||
| Net assets, end of period (in 000’s) | $ | 23,287 | $ | 26,080 | $ | 24,065 | ||||||
| Ratios to average net assets: | ||||||||||||
Expenses(4) | 0.95 | % | 0.95 | % | 0.95 | % | ||||||
Net investment income(4) | 1.61 | % | 0.83 | % | 0.55 | % | ||||||
Portfolio turnover rate(3)(5) | 150 | % | 369 | % | 41 | % | ||||||
| (1) | Inception date of the Fund. |
| (2) | For a Fund share outstanding for the entire period. |
| (3) | Not annualized for periods less than one year. |
| (4) | Annualized for period less than one year. |
| (5) | Excludes the impact of in-kind transactions. |
See Notes to the Financial Statements
34
ASYMmetric Smart Alpha S&P 500® ETF
Financial Highlights
| Period from | ||||
January 31, 2023(1) | ||||
| through | ||||
| June 30, 2023 | ||||
PER COMMON SHARE DATA(2) | ||||
| Net asset value, beginning of period | $ | 25.00 | ||
| INVESTMENT OPERATIONS: | ||||
| Net investment income | 0.08 | |||
| Net realized and unrealized gain on investments | 3.73 | |||
| Total from investment operations | 3.81 | |||
| LESS DISTRIBUTIONS FROM: | ||||
| Net investment income | — | |||
| Net realized gains | — | |||
| Total distributions | — | |||
| Net asset value, end of period | $ | 28.81 | ||
TOTAL RETURN(3) | 15.23 | % | ||
| SUPPLEMENTAL DATA AND RATIOS | ||||
| Net assets, end of period (in 000’s) | $ | 864 | ||
| Ratios to average net assets: | ||||
Expenses(4) | 0.95 | % | ||
Net investment income(4) | 0.79 | % | ||
Portfolio turnover rate(3)(5) | 12 | % | ||
| (1) | Inception date of the Fund. |
| (2) | For a Fund share outstanding for the entire period. |
| (3) | Not annualized for periods less than one year. |
| (4) | Annualized for period less than one year. |
| (5) | Excludes the impact of in-kind transactions. |
See Notes to the Financial Statements
35
ASYMmetric Smart Income ETF
Financial Highlights
| Period from | ||||
January 31, 2023(1) | ||||
| through | ||||
| June 30, 2023 | ||||
PER COMMON SHARE DATA(2) | ||||
| Net asset value, beginning of period | $ | 25.00 | ||
| INVESTMENT OPERATIONS: | ||||
| Net investment income | 0.27 | |||
| Net realized and unrealized loss on investments | (2.01 | ) | ||
| Total from investment operations | (1.74 | ) | ||
| LESS DISTRIBUTIONS FROM: | ||||
| Net investment income | (0.47 | ) | ||
| Net realized gains | — | |||
| Total distributions | — | |||
| Net asset value, end of period | $ | 23.26 | ||
TOTAL RETURN(3) | -6.95 | % | ||
| SUPPLEMENTAL DATA AND RATIOS | ||||
| Net assets, end of period (in 000’s) | $ | 684 | ||
| Ratios to average net assets: | ||||
Expenses(4) | 0.75 | % | ||
Net investment income(4) | 2.84 | % | ||
Portfolio turnover rate(3)(5) | 215 | % | ||
| (1) | Inception date of the Fund. |
| (2) | For a Fund share outstanding for the entire period. |
| (3) | Not annualized for periods less than one year. |
| (4) | Annualized for period less than one year. |
| (5) | Excludes the impact of in-kind transactions. |
See Notes to the Financial Statements
36
ASYMmetric ETFs
Notes to the Financial Statements (Unaudited)
June 30, 2023
1. ORGANIZATION
ASYMmetric ETFsTM Trust (the “Trust”) was organized as a Delaware statutory trust on August 7, 2020. The Trust is registered under the Investment Company Act of 1940, as amended (the “1940 Act”), as an open-end management investment company. The ASYMmetric Smart S&P® 500 ETF (“Smart S&P 500 ETF”), the ASYMmetric Smart Alpha S&P 500® ETF (“Smart Alpha S&P 500 ETF”) and the ASYMmetric Smart Income ETF (“Smart Income ETF”) (collectively, the “Funds”), are each a diversified series with their own investment objectives and policies within the Trust. The Trust has evaluated the structure, objective and activities of the Funds and determined that they meet the characteristics of an investment company. As such, these financial statements have applied the guidance as set forth in the Accounting Standards Codification (“ASC”) 946, Financial Services Investment Companies.
The investment objective of Smart S&P 500 ETF seeks to track the total return performance, before fees and expenses, of the ASYMmetric 500 Index (the “Index”). The Index is based on proprietary ASYMmetric Risk Management Technology developed and maintained by ASYMmetric Investment Solutions, LLC (the “Index Provider”), an affiliate of ASYMmetric ETFs, LLC, the Fund’s investment adviser (the “Adviser”). The Fund commenced operations on March 9, 2021.
The investment objective of Smart Alpha S&P 500 ETF seeks to track the total return performance, before fees and expenses, of the ASYMmetric Smart Alpha 500 Index (the “Index”). The Index is based on proprietary ASYMmetric Risk Management Technology developed and maintained by ASYMmetric Investment Solutions, LLC (the “Index Provider”), an affiliate of ASYMmetric ETFs, LLC, the Fund’s investment adviser (the “Adviser”). The Fund commenced operations on January 31, 2023.
The investment objective of Smart Income ETF seeks to track the total return performance, before fees and expenses, of the ASYMmetric Smart Income Index (the “Index”). The Index is based on proprietary ASYMmetric Risk Management Technology developed and maintained by ASYMmetric Investment Solutions, LLC (the “Index Provider”), an affiliate of ASYMmetric ETFs, LLC, the Fund’s investment adviser (the “Adviser”). The Fund commenced operations on January 31, 2023.
Shares of the Funds are listed and traded on the NYSE Arca, Inc. (the “NYSE”). Market prices for the shares may be different from their net asset value (“NAV”). The Fund issues and redeems shares on a continuous basis at NAV only in blocks of 30,000 shares, called “Creation Units.” Creation Units are issued and redeemed principally in-kind for securities included in a specified universe, with cash included to balance to the Creation Unit total. Once created, shares generally trade in the secondary market at market prices that change throughout the day in amounts less than a Creation Unit. Except when aggregated in Creation Units, shares are not redeemable securities of the Funds. Shares of the Funds may only be purchased or redeemed by certain financial institutions (“Authorized Participants”). An Authorized Participant is either (i) a broker-dealer or other participant in the clearing process through the Continuous Net Settlement System of the National Securities Clearing Corporation or (ii) a Depository Trust Company participant and, in each case, must have executed a Participation Agreement with the Distributor. Most retail investors do not qualify as Authorized Participants nor have the resources to buy and sell whole Creation Units. Therefore, they are unable to purchase or redeem the shares directly from the Funds. Rather, most retail investors may purchase shares in the secondary market with the assistance of a broker and are subject to customary brokerage commissions or fees.
37
ASYMmetric ETFs
Notes to the Financial Statements (Unaudited) – Continued
June 30, 2023
The Funds currently offer one class of shares, which have no front-end sales load, no deferred sales charge, and no redemption fee. A purchase (i.e. creation) transaction fee is imposed for the transfer and other transaction costs associated with the purchase of Creation Units. The standard fixed creation transaction fee for the Smart S&P 500 ETF and the Smart Income Fund is $300 and the standard fixed creation transaction fee for the Smart Alpha S&P 500 ETF is $750, which is payable by the Authorized Participant. In addition, a variable fee may be charged on all cash transactions or substitutes for Creation Units of up 2% of the value of the Creation Units subject to the transaction. Variable fees are imposed to compensate the Funds for the transaction costs associated with the cash transactions. Variable fees received by the Funds is displayed in the capital shares transaction section of the Statements of Changes in Net Assets. The Funds may issue an unlimited number of shares of beneficial interest, with no par value. All shares of the Funds have equal rights and privileges.
2. SIGNIFICANT ACCOUNTING POLICIES
The following is a summary of significant accounting policies followed by the Funds in the preparation of its financial statements. These policies are in conformity with generally accepted accounting principles in the United States of America (“GAAP”).
Securities Valuation – All investments in securities are recorded at their estimated fair value, as described in Note 3.
Federal Income Taxes – The Funds intend to meet the requirements of subchapter M of the Internal Revenue Code applicable to regulated investment companies and to distribute substantially all net taxable investment income and net realized gains to shareholders in a manner which results in no tax cost to the Funds. Therefore, no federal income or excise tax provision is required. As of June 30, 2023, the Funds did not have any tax positions that did not meet the “more-likely-than-not” threshold of being sustained by the applicable tax authority. The Funds recognize interest and penalties, if any, related to unrecognized tax benefits on uncertain tax positions as income tax expense in the Statement of Operations. During the period ended June 30, 2023, the Funds did not incur any interest or penalties. The Funds are subject to examination by U.S. taxing authorities for the tax periods since the commencement of operations.
Securities Transactions, Income and Distributions – Security transactions are accounted for on the date the securities are purchased or sold (trade date). Realized gains and losses are reported on a specific identified cost basis. Interest income is recognized on an accrual basis, including amortization of premiums and accretion of discounts. Dividend income and distributions are recorded on the ex-dividend date. Withholding taxes on foreign dividends have been provided for in accordance with the Funds’ understanding of the applicable country’s tax rules and regulations. Distributions received from the Funds’ investments generally are comprised of ordinary income and return of capital. The Funds allocate distributions between investment income and return of capital based on estimates made at the time such distributions are received. Such estimates are based on information provided by each portfolio company and other industry sources. These estimates may subsequently be revised based on actual allocations received from the portfolio companies after their tax reporting periods are concluded, as the actual character of these distributions is not known until after the fiscal year end of the Funds.
The Smart S&P 500 ETF and the Smart Alpha S&P 500 ETF will make distributions of net investment income, if any, annually. The Smart Income Fund will make distributions of net investment income, if any, quarterly. The Funds will also distribute net realized capital gains, if any, annually. Distributions to shareholders are recorded on the ex-dividend date. The treatment for financial reporting purposes of distributions made to shareholders during
38
ASYMmetric ETFs
Notes to the Financial Statements (Unaudited) – Continued
June 30, 2023
the year from net investment income or net realized capital gains may differ from their ultimate treatment for federal income tax purposes. These differences are caused primarily by differences in the timing of the recognition of certain components of income, expense or realized capital gain for federal income tax purposes. Where such differences are permanent in nature, GAAP requires that they be reclassified in the components of the net assets based on their ultimate characterization for federal income tax purposes. Any such reclassifications will have no effect on net assets, results of operations or net asset values per share of the Funds.
Futures Contracts – The Smart S&P 500 ETF and Smart Alpha S&P 500 ETF are subject to equity price risk in the normal course of pursuing its investment objectives. The Smart S&P 500 ETF and Smart Alpha S&P 500 ETF use futures contracts and options on futures contracts to gain exposure to, or hedge against, changes in the value of equities. A futures contract represents a commitment for the future purchase or sale of an asset at a specified price on a specified date. Upon entering into such contracts, the Smart S&P 500 ETF and Smart Alpha S&P 500 ETF are required to deposit with the broker, either in cash or securities, an initial margin deposit in an amount equal to a certain percentage of the contract amount. In addition, the Smart S&P 500 ETF and Smart Alpha S&P 500 ETF segregate liquid securities when purchasing or selling futures contracts to comply with Trust policies. Subsequent payments (variation margin) are made or received by the Smart S&P 500 ETF and Smart Alpha S&P 500 ETF each day, depending on the daily fluctuations in the value of the contract, and are recorded for financial statement purposes as unrealized gains or losses by the Smart S&P 500 ETF and Smart Alpha S&P 500 ETF. Upon entering into such contracts, the Smart S&P 500 ETF and Smart Alpha S&P 500 ETF bear the risk of interest or exchange rates or securities prices moving unexpectedly, in which case, the Smart S&P 500 ETF and Smart Alpha S&P 500 ETF may not achieve the anticipated benefits of the futures contracts and may realize a loss. With futures, there is minimal counterparty credit risk to the Smart S&P 500 ETF and Smart Alpha S&P 500 ETF since futures are exchange traded and the exchange’s clearinghouse, as counterparty to all exchange-traded futures, guarantees the futures against default. The use of futures contracts, and options on futures contracts, involves the risk of imperfect correlation in movements in the price of futures contracts and options thereon, interest rates and the underlying hedged assets.
Use of Estimates – The preparation of financial statements in conformity with GAAP requires management to make estimates and assumptions that affect the reported amounts of assets and liabilities and disclosure of contingent assets and liabilities at the date of the financial statements and the reported amounts of revenues and expenses during the reporting period. Actual results could differ from those estimates.
Share Valuation – The NAV per share of the Funds are calculated by dividing the sum of the value of the securities held by the Funds, plus cash and other assets, minus all liabilities (including estimated accrued expenses) by the total number of shares outstanding for the Funds, rounded to the nearest cent. The Funds’ shares will not be priced on the days on which the NYSE is closed for trading. The offering and redemption price per share for the Funds are equal to the Funds’ net asset value per share.
Indemnifications – Under the Trust’s organizational documents, its officers and trustees are indemnified against certain liabilities arising out of the performance of their duties to the Trust. In addition, in the normal course of business, the Trust may enter into contracts that provide general indemnification to other parties. The Trust’s maximum exposure under these arrangements is unknown, as this would involve future claims that may be made against the Trust that have not yet occurred and may not occur. However, the Trust has not had prior claims or losses pursuant to these contracts and expects the risk of loss to be remote.
Cash and Cash Equivalents – Cash and cash equivalents include short-term, liquid investments with an original maturity of three months or less and include money market fund accounts.
39
ASYMmetric ETFs
Notes to the Financial Statements (Unaudited) – Continued
June 30, 2023
Illiquid Securities – A security may be considered illiquid if it lacks a readily available market. Securities are generally considered liquid if they can be sold or disposed of in the ordinary course of business within seven days at approximately the price at which the security is valued by the Fund. Illiquid securities may be valued by the Funds’ Valuation Designee as reflecting fair value. The Funds will not hold more than 15% of the value of their net assets in illiquid securities. At June 30, 2023, the Funds did not hold any illiquid securities.
3. SECURITIES VALUATION
The Funds have adopted fair value accounting standards, which establish an authoritative definition of fair value and set out a hierarchy for measuring fair value. These standards require additional disclosures about the various inputs and valuation techniques used to develop the measurements of fair value, a discussion in changes in valuation techniques and related inputs during the period and expanded disclosure of valuation levels for major security types. These inputs are summarized in the three broad levels listed below:
| Level 1 – | Quoted prices in active markets for identical assets or liabilities. |
| Level 2 – | Observable inputs other than quoted prices included in Level 1. These inputs may include quoted prices for similar instruments, interest rates, prepayment speeds, credit risk, yield curves, default rates and similar data. |
| Level 3 – | Significant unobservable inputs for the asset or liability, representing the Fund’s view of assumptions a market participant would use in valuing the asset or liability. |
Following is a description of the valuation techniques applied to the Funds’ major categories of assets and liabilities measured at fair value on a recurring basis. The Funds’ investments are carried at fair value.
Common Stock – Securities that are primarily traded on a national securities exchange are valued at the last sale price on the exchange on which they are primarily traded on the day of valuation or, if there has been no sale on such day, at the mean between the bid and ask prices. Securities traded primarily on the Nasdaq Global Market System for which market quotations are readily available are valued using the Nasdaq Official Closing Price (“NOCP”). If the NOCP is not available, such securities are valued at the last sale price on the day of valuation, or if there has been no sale on such day, at the mean between the bid and ask prices. To the extent these securities are actively traded and valuation adjustments are not applied, they are categorized in Level 1 of the fair value hierarchy.
Investment Companies – Investments in other mutual funds, including money market funds, are valued at their net asset value per share. To the extent these securities are actively traded and valuation adjustments are not applied, they are categorized in Level 1 of the fair value hierarchy.
Derivative Instruments – Listed derivative, including options, rights, warrants and futures that are actively traded are valued based on quoted prices from the exchange and are categorized in Level 1 of the fair value hierarchy.
The Board of Trustees (the “Board”) has adopted a pricing and valuation policy for use by the Fund and its Valuation Designee (as defined below) in calculating the Fund’s NAV. Pursuant to Rule 2a-5 under the 1940 Act, the Fund has designated ASYMmetric ETFs, LLC (the “Adviser”) as its “Valuation Designee” to perform all of the fair value determinations as well as to perform all of the responsibilities that may be performed by the Valuation Designee in accordance with Rule 2a-5. The Valuation Designee is authorized to make all necessary
40
ASYMmetric ETFs
Notes to the Financial Statements (Unaudited) – Continued
June 30, 2023
determinations of the fair values of portfolio securities and other assets for which market quotations are not readily available or if it is deemed that the prices obtained from brokers and dealers or independent pricing services are unreliable.
The inputs or methodology used for valuing securities are not an indication of the risk associated with investing in those securities.
The following table is a summary of the inputs used to value the Funds’ securities by level within the fair value hierarchy as of December 31, 2022:
| Smart S&P 500 ETF | Level 1 | Level 2 | Level 3 | Total | ||||||||||||
| Common stock | $ | 23,173,396 | $ | — | $ | — | $ | 23,173,396 | ||||||||
| Short-term investment | 91,483 | — | — | 91,483 | ||||||||||||
| Total investments in securities | $ | 23,264,879 | $ | — | $ | — | $ | 23,264,879 | ||||||||
| Smart Alpha S&P 500 ETF | Level 1 | Level 2 | Level 3 | Total | ||||||||||||
| Common stock | $ | 783,213 | $ | — | $ | — | $ | 783,213 | ||||||||
| Short-term investment | 3,491 | — | — | 3,491 | ||||||||||||
| Total investments in securities | $ | 786,704 | $ | — | $ | — | $ | 786,704 | ||||||||
As of June 30, 2023, the Fund’s investments in other financial instruments* were classified as follows:
| Short Futures Contracts | $ | 25,439 | $ | — | $ | — | $ | 25,439 | ||||||||
| Total investments in securities | $ | 25,439 | $ | — | $ | — | $ | 25,439 |
| * | Other financial instruments are derivative instruments not reflected in the Schedule of Investments, such as futures contracts. Futures are presented at the unrealized appreciation (depreciation) on the instruments. |
| Smart Income ETF | Level 1 | Level 2 | Level 3 | Total | ||||||||||||
| U.S. Treasury Note | $ | 679,192 | $ | — | $ | — | $ | 679,192 | ||||||||
| Short-term investment | 3,648 | — | — | 3,648 | ||||||||||||
| Total investments in securities | $ | 682,840 | $ | — | $ | — | $ | 682,840 | ||||||||
Refer to the Funds’ Schedule of Investments for additional industry information.
4. DERIVATIVES TRANSACTIONS
The Funds may use derivatives for different purposes, such as a substitute for taking a position in the underlying asset and/or as part of a strategy designed to reduce exposure to other risks, such as equity, interest rate or currency risk. The various derivative instruments that the Funds may use are options, futures contracts and options on futures contracts and other derivative securities. The Funds may also use derivatives for leverage, in which case their use would involve leveraging risk. A Fund investing in a derivative instrument could lose more than the principal amount invested.
41
ASYMmetric ETFs
Notes to the Financial Statements (Unaudited) – Continued
June 30, 2023
Accounting Standards Codification 815, Derivatives and Hedging (“ASC 815”) requires enhanced disclosures about the Fund’s use of, and accounting for, derivative instruments and the effect of derivative instruments on the Fund’s results of operations and financial position. Tabular disclosure regarding derivative fair value and gain/loss by contract type (e.g., interest rate contracts, foreign exchange contracts, credit contracts, etc.) is required and derivatives accounted for as hedging instruments under ASC 815 must be disclosed separately from those that do not qualify for hedge accounting. Even though the Funds may use derivatives in an attempt to achieve an economic hedge, the Funds’ derivatives are not accounted for as hedging instruments under ASC 815 because investment companies account for their derivatives at fair value and record any changes in fair value in current period earnings.
For the period ended June 30, 2023, the Fund’s average quarterly notional values are as follows:
| Fund | Short Futures Contracts | |
| Smart Alpha S&P 500 ETF | $808,250 |
The locations on the Statement of Assets and Liabilities of the Funds’ derivative positions by type of exposure, all of which are not accounted for as hedging instruments under ASC 815, are as follows:
Values of Derivative Instruments as of June 30, 2023, on the Statement of Assets and Liabilities:
Smart Alpha S&P 500 ETF
| Assets | Liabilities | |||
| Derivatives not accounted for as | ||||
| hedging instruments under ASC 815 | Location | Fair Value | Location | Fair Value |
| Net Assets – | Net Assets – | |||
| unrealized appreciation | unrealized depreciation | |||
| Equity Contracts – Futures | on futures contracts** | $25,439 | on futures contracts** | $ — |
| ** | Includes cumulative appreciation/depreciation on futures contracts as reported in the Schedule of Open Futures Contracts. Cash held as collateral for futures contracts on the Statement of Assets and Liabilities includes the daily change in variation margin as of June 30, 2023. |
The effect of Derivative Instruments on the Statement of Operations for the period ended June 30, 2023:
Smart Alpha S&P 500 ETF
| Amount of Realized | Change in Unrealized | |
| Gain (Loss) on Derivatives | Appreciation (Depreciation) on Derivatives | |
| Derivatives not accounted for as | ||
| hedging instruments under ASC 815 | Futures Contracts | Futures Contracts |
| Equity Contracts | $26,302 | $25,439 |
42
ASYMmetric ETFs
Notes to the Financial Statements (Unaudited) – Continued
June 30, 2023
Balance Sheet Offsetting Information
The following table provides a summary of offsetting financial liabilities and derivatives and the effect of derivative instruments on the Statement of Assets and Liabilities as of June 30, 2023.
Smart Alpha S&P 500 ETF
| Gross Amounts not | ||||||||||||||||||||||||
| Gross | Net Amounts | offset in Statement | ||||||||||||||||||||||
| Amounts | of Assets | of Assets and Liabilities | ||||||||||||||||||||||
| Offset in | Presented in | |||||||||||||||||||||||
| Gross | Statement | Statement | Cash | |||||||||||||||||||||
| Amounts | of Assets | of Assets | Financial | Collateral | Net | |||||||||||||||||||
| Recognized | and Liabilities | and Liabilities | Instruments | Pledged | Amount | |||||||||||||||||||
| Assets: | ||||||||||||||||||||||||
| Equity Contracts | ||||||||||||||||||||||||
| (Futures Contracts – | ||||||||||||||||||||||||
| Phillips Capital) | $ | — | $ | — | $ | — | $ | — | $ | — | $ | — | ||||||||||||
| Liabilities: | ||||||||||||||||||||||||
| Equity Contracts | ||||||||||||||||||||||||
| (Futures Contracts – | ||||||||||||||||||||||||
| Phillips Capital) | $ | 25,439 | $ | — | $ | 25,439 | $ | — | $ | 25,439 | $ | — | ||||||||||||
During the ordinary course of business, the Fund may enter into transactions subject to enforceable netting agreements or other similar arrangements (“netting agreements”). Generally, the right to offset in netting agreements allows the Fund to offset any exposure to a specific counterparty with any collateral received or delivered to that counterparty based on the terms of the agreement. Generally, the fund manages its cash collateral and securities collateral on a counterparty basis. As of June 30, 2023, the Fund did not enter into any netting agreements which would require any portfolio securities to be netted.
5. INVESTMENT ADVISORY FEE AND OTHER TRANSACTIONS WITH AFFILIATES
Pursuant to an Investment Advisory Agreement (“Advisory Agreement”) between the Trust, on behalf of the Funds, and the Adviser, the Adviser provides investment advice to the Fund and oversees the day-to-day operations of the Fund, subject to the direction and control of the Board and the officers of the Trust. Under the Advisory Agreement, the Adviser agrees to pay all expenses of the Trust, except for (i) the fee payment under this Advisory Agreement, (ii) payments under the Fund’s 12b-1 plan, (iii) brokerage expenses, (iv) acquired fund fees and expenses, (v) taxes, (vi) interest (including borrowing costs and dividend expenses on securities sold short), and (vii) litigation expenses and other extraordinary expenses (including litigation to which the Trust or the Fund may be a party and indemnification of the Trustees and officers with respect thereto). For services provided to the Funds, the Smart S&P 500 ETF, the Smart Alpha S&P 500 ETF and the Smart Income Fund pays the Adviser 0.95%, 0.95% and 0.75%, respectively, at an annual rate based on the Funds’ average daily net assets.
The Adviser has engaged Toroso Investments, LLC (the “Sub-Adviser”) as the Sub-Adviser to the Funds. Subject to the supervision of the Adviser, the Sub-Adviser is primarily responsible for the day-to-day management of the Funds’ portfolio, including purchase, retention and sale of securities. Fees associated with these services are paid to the Sub-Adviser by the Adviser.
43
ASYMmetric ETFs
Notes to the Financial Statements (Unaudited) – Continued
June 30, 2023
U.S. Bancorp Fund Services, LLC, doing business as U.S. Bank Global Fund Services (“Fund Services” or the “Administrator”) acts as the Fund’s Administrator, Transfer Agent and Fund Accountant. U.S. Bank, N.A. (the “Custodian”) serves as the custodian to the Funds. The Custodian is an affiliate of the Administrator. The Administrator performs various administrative and accounting services for the Funds. The Administrator prepares various federal and state regulatory filings, reports and returns for the Funds; prepares reports and materials to be supplied to the Trustees and monitors the activities of the Funds’ custodian, transfer agent and accountants. As compensation for its services, the Administrator is entitled to a monthly fee at an annual rate based upon the average daily net assets of the Funds, subject to annual minimums. Fees associated with these services are paid by the Adviser. Foreside serves as the Funds’ distributor pursuant to a distribution agreement.
The Funds have adopted a Distribution and Service (12b-1) Plan (the “Plan”), pursuant to which payments of up to 0.25% of the average daily net assets may be made by the Funds. The Board of Trustees has not currently approved the commencement of any payments under the Plan.
A Trustee and certain officers of the Trust are also employees/officers of the Adviser and/or the Administrator.
6. INVESTMENT TRANSACTIONS
The aggregate purchases and sales, excluding U.S. government securities, short-term investments and in-kind transactions, by the Funds for the period ended June 30, 2023, were as follows:
| Purchases | Sales | |||||||
| Smart S&P 500 ETF | $ | 34,436,635 | $ | 34,576,301 | ||||
| Smart Alpha S&P 500 ETF | $ | 527,966 | $ | 80,135 | ||||
| Smart Income Fund | $ | 1,460,875 | $ | 1,470,691 | ||||
During the period ended June 30, 2023, in-kind transactions associated with creation and redemptions were as follows:
| Purchases | Sales | |||||||
| Smart S&P 500 ETF | $ | 8,860,748 | $ | 11,462,429 | ||||
| Smart Alpha S&P 500 ETF | $ | 275,365 | $ | — | ||||
| Smart Income Fund | $ | 986,921 | $ | 231,694 | ||||
During the period ended June 30, 2023, net capital gains resulting from in-kind redemptions were as follows:
| Smart S&P 500 ETF | $ | 752,636 | ||
| Smart Alpha S&P 500 ETF | $ | — | ||
| Smart Income Fund | $ | 33,807 |
44
ASYMmetric ETFs
Notes to the Financial Statements (Unaudited) – Continued
June 30, 2023
7. TAX INFORMATION
As of December 31, 2022, the Smart S&P 500 ETF’s most recently completed fiscal year end, cost of investments and distributable earnings on a tax basis were as follows:
| Cost of Investments | $ | 26,877,351 | ||
| Gross tax unrealized appreciation | $ | 386,693 | ||
| Gross tax unrealized depreciation | (1,221,905 | ) | ||
| Net unrealized depreciation | (835,212 | ) | ||
| Undistributed ordinary income | 8,590 | |||
| Undistributed long-term capital gain | — | |||
| Other accumulated loss | (3,700,414 | ) | ||
| Distributable earnings | $ | (4,527,036 | ) |
The basis of investments for tax and financial reporting purposes differs principally due to the deferral of losses on wash sales and C-corporation basis adjustments.
The tax character of distributions paid during the period ended June 30, 2023 were as follows:
| Smart S&P 500 ETF | Smart Alpha S&P 500 ETF | Smart Income ETF | ||||||||||
| Ordinary Income | $ | — | $ | — | $ | 14,036 | ||||||
| Long-Term Capital Gain | $ | — | $ | — | $ | — | ||||||
| Return of Capital | $ | — | $ | — | $ | — | ||||||
The tax character of distributions paid during the year ended December 31, 2022 were as follows:
| Smart S&P 500 ETF | Smart Alpha S&P 500 ETF | Smart Income ETF | ||||||||||
| Ordinary Income | $ | 231,798 | $ | — | $ | — | ||||||
| Long-Term Capital Gain | $ | — | $ | — | $ | — | ||||||
| Return of Capital | $ | — | $ | — | $ | — | ||||||
The Fund intends to utilize provisions of the federal income tax laws which allow it to carry a realized capital loss forward and offset such losses against any future realized capital gains. At December 31, 2022, the Fund had $3,457,601 in short-term and $242,813 in long-term capital loss carryovers, which may be carried forward for an unlimited period. A regulated investment company may elect for any taxable year to treat any portion of any qualified late year loss arising on the first day of the next taxable year. Qualified late year losses are certain capital losses which occur during the portion of the Fund’s taxable year subsequent to October 31. The Fund does not plan to defer any late year losses.
8. SUBSEQUENT EVENTS
Management has performed an evaluation of subsequent events through the date the financial statements were issued and has determined that no additional items require recognition or disclosure.
45
ASYMmetric ETFs
Liquidity Risk Management Program (Unaudited)
June 30, 2023
Consistent with Rule 22e-4 under the 1940 Act, the Fund has established a liquidity risk management program to govern its approach to managing liquidity risk (the “Program”). The Fund’s Board of Trustees has approved the designation of the Fund’s investment adviser ASYMmetric ETFs, LLC, as the program administrator (the “Program Administrator”). The Program Administrator is responsible for implementing and monitoring the Program, and the Program’s principal objectives include assessing, managing and periodically reviewing the Fund’s liquidity risk, based on factors specific to the circumstances of the Fund. At a meeting of the Fund’s Board of Trustees held on June 2, 2023, the Trustees received a report from the Program Administrator addressing the operation of the Program and assessing its adequacy and effectiveness of implementation. The Program Administrator determined, and reported to the Board, that the Program is reasonably designed to assess and manage the Fund’s liquidity risk and has operated adequately and effectively to manage the Fund’s liquidity risk since the Program was approved in January 2021. The Program Administrator reported that during the period covered by the report, there were no liquidity events that impacted the Fund or its ability to timely meet redemptions without dilution to existing shareholders. There can be no assurance that the Program will achieve its objective in the future.
Please refer to the prospectus for more information regarding the Fund’s exposure to liquidity risk and other principal risks to which an investment in the Fund may be subject.
46
ASYMmetric ETFs
Additional Information (Unaudited)
June 30, 2023
AVAILABILITY OF FUND PORTFOLIO INFORMATION
The Fund files complete schedules of portfolio holdings with the SEC for the first and third quarters of each fiscal year on Part F of Form N-PORT. The Fund’s Part F of Form N-PORT is available on the SEC’s website at www.sec.gov and may be reviewed and copied at the SEC’s Public Reference Room in Washington, D.C. Information on the operation of the Public Reference Room may be obtained by calling 1-800-732-0330. The Fund’s Part F of Form N-PORT may also be obtained by calling toll-free 1-866-ASYM777 or 1-866-279-6777.
AVAILABILITY OF PROXY VOTING INFORMATION
A description of the Fund’s Proxy Voting Policies and Procedures is available without charge, upon request, by calling 1-866-ASYM777 or 1-866-279-6777. Information regarding how the Fund voted proxies relating to portfolio securities during the most recent 12 month period ended December 31, is available (1) without charge, upon request, by calling 1-866-ASYM777 or 1-866-279-6777, or (2) on the SEC’s website at www.sec.gov.
FREQUENCY DISTRIBUTION OF PREMIUMS AND DISCOUNTS
Information regarding how often shares of the Fund trades on the Exchange at a price about (i.e., at a premium) or below (i.e., at a discount) the NAV of the Fund is available, free of charge, on the Fund’s website at asymshares.com.
47
ASYMmetric ETFs
Privacy Notice (Unaudited)
The Fund collects only relevant information about you that the law allows or requires us to have in order to conduct our business and properly service you. The Fund collects financial and personal information about you (“Personal Information”) directly (e.g., information on account applications and other forms, such as your name, address, and social security number, and information provided to access account information or conduct account transactions online, such as password, account number, e-mail address, and alternate telephone number), and indirectly (e.g., information about your transactions with us, such as transaction amounts, account balance and account holdings).
The Fund does not disclose any non-public personal information about its shareholders or former shareholders other than for everyday business purposes such as to process a transaction, service an account, to respond to court orders and legal investigations or as otherwise permitted by law. Third parties that may receive this information include companies that provide transfer agency, technology and administrative services to the Fund, as well as the Fund’s investment adviser who is an affiliate of the Fund. If you maintain a retirement/educational custodial account directly with the Fund, we may also disclose your Personal Information to the custodian for that account for shareholder servicing purposes. We limit access to your Personal Information provided to unaffiliated third parties to information necessary to carry out their assigned responsibilities to the Fund. All shareholder records will be disposed of in accordance with applicable law. The Trust maintains physical, electronic and procedural safeguards to protect Personal Information and requires its third parties service provides with access to such information to treat the Personal Information with the same high degree of confidentiality.
In the event that you hold shares of a Fund through a financial intermediary, including, but not limited to, a broker-dealer, bank, credit union or trust company, the privacy policy of the your financial intermediary would govern how their non-public personal information would be shared with unaffiliated third parties.
With respect to the Fund, issues and redemptions of their shares at net asset value (“NAV”) occur only in large aggregations of a specified number of shares (e.g., 30,000) called “Creation Units.” Only Authorized Participants (“APs”) may acquire shares directly from an ETF, and only APs may tender their ETF shares for redemption directly to the ETF, at NAV. APs must be (i) a broker-dealer or other participant in the clearing process through the Continuous Net Settlement System of the NSCC, a clearing agency that is registered with the SEC; or (ii) a DTC participant. In addition, each AP must execute a Participant Agreement that has been agreed to by the Fund’s distributor, and that has been accepted by the Fund’s transfer agent, with respect to purchases and redemptions of Creation Units.
Because of this structure, the Fund does not have any information regarding any “consumers” as defined in Rule 3 of Regulation S-P with respect to any ETFs, and consequently are not required by Regulation S-P to deliver a notice of the Fund’s privacy policy to any ETF shareholders.
(This Page Intentionally Left Blank.)
CONTACTS
BOARD OF TRUSTEES
Darren Schuringa
Vivienne Hsu
Winston Lowe
Suzanne Siracuse
William Thomas
INVESTMENT ADVISER
ASYMmetric ETFs, LLC
1516 Park Ave., Suite 7B
New York, NY 10029
INDEPENDENT REGISTERED
PUBLIC ACCOUNTING FIRM
Cohen & Company, Ltd.
1350 Euclid Avenue, Suite 800
Cleveland, OH 44115
TRANSFER AGENT, FUND ACCOUNTANT
AND FUND ADMINISTRATOR
U.S. Bancorp Fund Services, LLC
615 East Michigan Street
Milwaukee, WI 53202
DISTRIBUTOR
Foreside Fund Services, LLC
Three Canal Plaza, Suite 100
Portland, ME 04101
CUSTODIAN
U.S. Bank, N.A.
1555 North Rivercenter Drive
Milwaukee, WI 53212
FUND COUNSEL
K&L Gates LLP
599 Lexington Avenue
New York, NY
866-ASYM777
(866-279-6777)
This report must be accompanied or preceded by a prospectus.
The Fund’s Statement of Additional Information contains additional information about the Fund’s
trustees and is available without charge upon request by calling 1-866-ASYM777 or 1-866-279-6777.
| (b) | Not applicable. |
Item 2. Code of Ethics.
Not applicable for semi-annual reports.
Item 3. Audit Committee Financial Expert.
Not applicable for semi-annual reports.
Item 4. Principal Accountant Fees and Services.
Not applicable for semi-annual reports.
Item 5. Audit Committee of Listed Registrants.
Not applicable to registrants who are not listed issuers (as defined in Rule 10A-3 under the Securities Exchange Act of 1934).
Item 6. Investments.
| (a) | Schedule of Investments is included as part of the report to shareholders filed under Item 1 of this Form. |
| (b) | Not applicable. |
Item 7. Disclosure of Proxy Voting Policies and Procedures for Closed-End Management Investment Companies.
Not applicable to open-end investment companies.
Item 8. Portfolio Managers of Closed-End Management Investment Companies.
Not applicable to open-end investment companies.
Item 9. Purchases of Equity Securities by Closed‑End Management Investment Company and Affiliated Purchasers.
Not applicable to open-end investment companies.
Item 10. Submission of Matters to a Vote of Security Holders.
There have been no material changes to the procedures by which shareholders may recommend nominees to the Registrant’s Board of Trustee.
Item 11. Controls and Procedures.
| (a) | The Registrant’s President and Treasurer have reviewed the Registrant's disclosure controls and procedures (as defined in Rule 30a-3(c) under the Investment Company Act of 1940 (the “Act”)) as of a date within 90 days of the filing of this report, as required by Rule 30a-3(b) under the Act and Rules 13a-15(b) or 15d‑15(b) under the Securities Exchange Act of 1934. Based on their review, such officers have concluded that the disclosure controls and procedures are effective in ensuring that information required to be disclosed in this report is appropriately recorded, processed, summarized and reported and made known to them by others within the Registrant and by the Registrant’s service provider. |
| (b) | There were no changes in the Registrant's internal control over financial reporting (as defined in Rule 30a-3(d) under the Act) that occurred during the period covered by this report that has materially affected, or is reasonably likely to materially affect, the Registrant's internal control over financial reporting. |
Item 12. Disclosure of Securities Lending Activities for Closed-End Management Investment Companies
Not applicable to open-end investment companies.
Item 13. Exhibits.
| (a) | (1) Any code of ethics or amendment thereto, that is the subject of the disclosure required by Item 2, to the extent that the registrant intends to satisfy Item 2 requirements through filing an exhibit. Not applicable for semi-annual reports. |
(3) Any written solicitation to purchase securities under Rule 23c‑1 under the Act sent or given during the period covered by the report by or on behalf of the registrant to 10 or more persons. Not applicable to open-end investment companies.
(4) Change in the registrant’s independent public accountant. There was no change in the registrant’s independent public accountant for the period covered by this report.
SIGNATURES
Pursuant to the requirements of the Securities Exchange Act of 1934 and the Investment Company Act of 1940, the registrant has duly caused this report to be signed on its behalf by the undersigned, thereunto duly authorized.
(Registrant) ASYMmetric ETFs Trust
By (Signature and Title)* /s/Darren Schuringa
Darren Schuringa, President
Date August 30, 2023
Pursuant to the requirements of the Securities Exchange Act of 1934 and the Investment Company Act of 1940, this report has been signed below by the following persons on behalf of the registrant and in the capacities and on the dates indicated.
By (Signature and Title)* /s/Darren Schuringa
Darren Schuringa, President
Date August 30, 2023
By (Signature and Title)* /s/Aaron Berson
Aaron Berson, Treasurer
Date August 30, 2023
* Print the name and title of each signing officer under his or her signature.