As filed with the Securities and Exchange Commission on June 1, 2022
Registration No. 333-264447
UNITED STATES
SECURITIES AND EXCHANGE COMMISSION
WASHINGTON, D.C. 20549
Amendment No. 1
to
FORM
S-1
REGISTRATION STATEMENT
UNDER
THE SECURITIES ACT OF 1933
TERRAN ORBITAL CORPORATION
(Exact Name of Registrant as Specified in Its Charter)
Delaware | 3760 | 98-1572314 | ||
(State or Other Jurisdiction of Incorporation or Organization) | (Primary Standard Industrial Classification Code Number) | (I.R.S. Employer Identification Number) |
6800 Broken Sound Parkway NW, Suite 200
Boca Raton, Florida, 33487
(561)
988-1704
(Address, Including Zip Code, and Telephone Number, Including Area Code, of Registrant’s Principal Executive Offices)
Marc H. Bell
6800 Broken Sound Parkway NW, Suite 200
Boca Raton, Florida, 33487
Tel: (561)
988-1704
(Name, Address, Including Zip Code, and Telephone Number, Including Area Code, of Agent for Service)
Copies to:
Rosa A. Testani, Esq.
Jonathan R. Pavlich, Esq.
Akin Gump Strauss Hauer & Feld LLP
One Bryant Park
New York, New York 10036
Tel: (212)
872-1000
Fax: (212)
872-1002
Approximate date of commencement of proposed sale to the public:
From time to time after the effective date of this registration statement.
If any of the securities being registered on this Form are to be offered on a delayed or continuous basis pursuant to Rule 415 under the Securities Act of 1933, check the following box. ☐
If this Form is filed to register additional securities for an offering pursuant to Rule 462(b) under the Securities Act, check the following box and list the Securities Act registration statement number of the earlier effective registration statement for the same offering. ☐
If this Form is a post-effective amendment filed pursuant to Rule 462(c) under the Securities Act, check the following box and list the Securities Act registration statement number of the earlier effective registration statement for the same offering. ☐
If this Form is a post-effective amendment filed pursuant to Rule 462(d) under the Securities Act, check the following box and list the Securities Act registration statement number of the earlier effective registration statement for the same offering. ☐
Indicate by check mark whether the registrant is a large accelerated filer, an accelerated filer, a
non-accelerated
filer, a smaller reporting company or an emerging growth company. See the definitions of “large accelerated filer,” “accelerated filer,” “smaller reporting company” and “emerging growth company” in Rule12b-2
of the Exchange Act.| Large accelerated filer | ☐ | Accelerated filer | ☐ | |||
| Non-accelerated filer | ☒ | Smaller reporting company | ☒ | |||
| Emerging growth company | ☒ | |||||
If an emerging growth company, indicate by check mark if the registrant has elected not to use the extended transition period for complying with any new or revised financial accounting standards provided pursuant to Section 7(a)(2)(B) of the Securities Act. ☐
The registrant hereby amends this registration statement on such date or dates as may be necessary to delay its effective date until the registrant shall file a further amendment which specifically states that this registration statement shall thereafter become effective in accordance with Section 8(a) of the Securities Act of 1933, as amended, or until the registration statement shall become effective on such date as the Securities and Exchange Commission, acting pursuant to said Section 8(a), may determine.
The information in this preliminary prospectus is not complete and may be changed. The securities may not be sold until the registration statement filed with the Securities and Exchange Commission is effective. This preliminary prospectus is not an offer to sell these securities and is not soliciting an offer to buy these securities in any jurisdiction where the offer or sale is not permitted.
SUBJECT TO COMPLETION, DATED JUNE 1, 2022
PRELIMINARY PROSPECTUS
Terran Orbital Corporation
Up to 140,155,860 Shares of Common Stock
Up to 7,800,000 Warrants to Purchase Shares of Common Stock at $11.50 per Share
Up to 11,055,606 Warrants to Purchase Shares of Common Stock at $10.00 per Share
Up to 19,299,960 Shares of Common Stock Underlying Warrants to Purchase at $11.50 per Share
Up to 11,055,606 Shares of Common Stock Underlying Warrants to Purchase at $10.00 per Share
This prospectus relates to the offer and sale from time to time by the selling securityholders named in this prospectus (the “Selling Securityholders”) of (A) up to 140,155,860 shares of our common stock, par value $0.0001 per share (our “common stock”), consisting of (i) up to 5,080,409 shares of our common stock (the “PIPE Shares”) issued at a purchase price of $10.00 per share in a private placement pursuant to subscription agreements each entered into on October 28, 2021 (the “PIPE Financing”); (ii) up to 8,100,000 shares of our common stock (the “Founder Shares”) issued in connection with the consummation of the Business Combination (as defined in this prospectus), in exchange for Class B ordinary shares originally issued at a price of approximately $0.003 per share in a private placement to Tailwind Two Sponsor LLC (the “Sponsor”) and Tommy Stadlen; (iii) up to 94,952,441 shares of our common stock issued or issuable to certain Selling Securityholders that are former stockholders and equity award holders of Terran Orbital (the “Legacy Terran Orbital equity holders”) in connection with or as a result of the consummation of the Business Combination, consisting of (a) up to 83,481,806 shares of our common stock originally issued to Legacy Terran Orbital stockholders at a weighted-average purchase price of approximately $0.29 per share, after giving effect to the exchange ratio in the Business Combination; (b) up to 82,616 shares of our common stock issuable upon the exercise of certain options with a weighted average exercise price of $1.41 per share; and (c) up to 11,388,019 shares of our common stock that certain Legacy Terran Orbital equity holders have the right to receive upon the settlement of outstanding vested and unvested restricted stock unit awards upon certain conditions; (iv) up to 8,420,569 shares of our common stock issued to certain debt holders pursuant to a stock and warrant purchase agreement, which were originally issued as non-cash consideration for entering into the Francisco Partners Facility (as defined in this prospectus) and Rollover Notes (as defined in this prospectus); (v) up to 7,800,000 shares of our common stock issuable upon the exercise of the private placement warrants (as defined below); (vi) up to 11,055,606 shares of our common stock issuable upon the exercise of the debt provider warrants (as defined below); and (vii) up to 4,746,835 shares of our common stock issuable pursuant to the subscription agreement for the Insider PIPE Investor (as defined below) (with the total shares of our common stock referenced in this clause (A) being referred to herein as the “”); (B) up to 7,800,000 warrants (the “private placement warrants”) originally issued in a private placement to the Sponsor at a price of $1.50 per warrant, which private placement warrants have an exercise price of $11.50 per share; and (C) up to 11,055,606 warrants originally issued in a private placement to certain debt providers as non-cash consideration for entering into the Francisco Partner Facility and Rollover Notes, which debt provider warrants have an exercise price of $10.00 per share (the “debt provider warrants” and together with the private placement warrants, the “Offered Warrants”).
Total Resale Shares
In addition, this prospectus relates to the offer and sale by us of up to (A) 11,499,960 shares of our common stock that are issuable by us upon the exercise of 11,499,960 warrants at a price of $11.50 per share (the “public warrants” and, together with the Offered Warrants, the “”) originally issued in Tailwind Two’s initial public offering (the “IPO”) of units at a price of $10.00 per unit, which each unit consisting of one Class A ordinary share and one-third of one public warrant; (B) 7,800,000 shares of our common stock that are issuable by us upon the exercise of the private placement warrants at a price of $11.50 per share; and (C) 11,055,606 shares of our common stock that are issuable by us upon the exercise of the debt provider warrants at a price of $10.00 per share. We will not receive any proceeds from the sale of shares of common stock underlying the Offered Warrants pursuant to this prospectus, except with respect to amounts received by us upon the exercise of the Offered Warrants for cash. Assuming the exercise in full of all of the Warrants for cash, we will receive up to an aggregate of approximately $332.5 million. We believe the likelihood that warrant holders will exercise their Warrants, and therefore the amount of cash proceeds that we would receive, is dependent upon the market price of our common stock. If the market price for our common stock is less than $10.00 per share, we believe warrant holders will be unlikely to exercise their debt provider warrants, and if the market price for our common stock is less than $11.50 per share, we believe warrant holders will be unlikely to exercise their public warrants and private placement warrants.
Warrants
On March 25, 2022 (the “Closing Date”), we consummated the transactions contemplated by that certain Agreement and Plan of Merger, dated as of October 28, 2021, as amended by Amendment No. 1 thereto dated February 8, 2022 and Amendment No. 2 thereto dated March 9, 2022 (as so amended, the “Merger Agreement” or the “Business Combination Agreement”), by and among Tailwind Two Acquisition Corporation (“Tailwind Two” and, after the consummation of the Business Combination, “Terran Orbital”), Titan Merger Sub, Inc. (“Merger Sub”) and Terran Orbital Corporation (“Legacy Terran Orbital”). In particular, as contemplated by the Business Combination Agreement, on the Closing Date, Tailwind Two filed a notice of deregistration with the
Cayman Islands Registrar of Companies, together with the necessary accompanying documents, and filed a certificate of incorporation and a certificate of corporate domestication with the Secretary of State of the State of Delaware, under which Tailwind Two was domesticated and continued as a Delaware corporation (the “Domestication”). Further, as contemplated by the Business Combination Agreement, on the Closing Date, Merger Sub was merged with and into Terran Orbital, with Terran Orbital surviving the merger (the “Surviving Corporation”) as a wholly-owned subsidiary of us (the “Merger” and, together with the Domestication and the other transactions contemplated by the Business Combination Agreement, including the PIPE Financing, the “Business Combination”). In connection with the consummation of the Business Combination, we changed our name to “Terran Orbital Corporation” and the Surviving Corporation changed its name to “Terran Orbital Operating Corporation.”
The Selling Securityholders may offer, sell or distribute all or a portion of the securities hereby registered publicly or through private transactions at prevailing market prices or at negotiated prices. We will not receive any of the proceeds from such sales of the shares of our common stock or warrants by the Selling Securityholders, except with respect to amounts received by us upon the exercise of the warrants for cash, as described above. We will bear all costs, expenses and fees in connection with the registration of these securities, including with regard to compliance with state securities or “blue sky” laws. The Selling Securityholders will bear all commissions and discounts, if any, attributable to their sale of shares of our common stock or warrants. See “Plan of Distribution” beginning on page 153 of this prospectus.
Our common stock and public warrants are listed on the New York Stock Exchange (the “NYSE”) under the symbols “LLAP” and “LLAP WS”, respectively. On May 25, 2022, the last reported sales price of our common stock was $4.74 per share and the last reported sales price of our public warrants was $0.37 per warrant, which we use in making certain calculations below. On May 31, 2022, the last reported sales price of our common stock was $5.19 per share and the last reported sales price of our public warrants was $0.50 per warrant.
Prior to the extraordinary general meeting of Tailwind Two in connection with the Business Combination, holders of 31,565,677 Tailwind Two’s Class A Ordinary Shares exercised their right to redeem those shares for cash at a price of $10.00 per share, for an aggregate of $315.7 million, which represented approximately 91% of the total Tailwind Two Class A Ordinary Shares then outstanding. The Total Resale Shares being offered in this prospectus represents approximately 102% of the total outstanding shares of our common stock as of May 25, 2022 (and approximately 88% of the total of (a) outstanding shares of common stock, plus (b) underlying shares reserved for issuance related to vested and unvested restricted stock units and options). Additionally, if all the Offered Warrants are exercised for cash, the Selling Securityholders would own an additional 18,855,606 shares of common stock, representing an additional 13.7% of the total outstanding shares of our common stock as of May 25, 2022 (and approximately 10.6% of the total of (a) the total outstanding shares of common stock, plus (b) underlying shares reserved for issuance related to vested and unvested restricted stock units and options, plus (c) such additional shares reserved for issuance related to such Offered Warrants). The sale of all the securities being offered in this prospectus could result in a significant decline in the public trading price of our common stock. Despite such a decline in the public trading price of our common stock and the fact that the closing price of our common stock on May 25, 2022 is below the closing price immediately following the closing of the Business Combination, certain of the Selling Securityholders may still experience a positive rate of return on the securities they purchased prior to the closing of the Business Combination, but our public securityholders may not experience a similar rate of return on the securities they purchased due to differences in the purchase prices and the current trading price. Based on the closing price of our common stock referenced above, the holders of the Founder Shares and the holder of the shares of common stock issuable pursuant to the subscription agreement for the Insider PIPE Investor may experience potential profit of up to $4.74 per share, the Legacy Terran Orbital former stockholders (based on the weighted-average purchase price) may experience potential profit of up to $4.45 per share, the holders who received shares of common stock pursuant to the stock and warrant purchase agreement may experience potential profit of up to $4.74 per share and the holders of common stock issuable upon the exercise of certain options may experience potential profit of $3.33 per share.
We are an “emerging growth company” as defined in Section 2(a) of the Securities Act of 1933, as amended, and, as such, have elected to comply with certain reduced disclosure and regulatory requirements.
Investing in our common stock or warrants involves risks. See the section entitled “Risk Factors” beginning on page 12 of this prospectus to read about factors you should consider before buying our securities.
Neither the Securities and Exchange Commission nor any state securities commission has approved or disapproved of these securities or determined if this prospectus is truthful or complete. Any representation to the contrary is a criminal offense.
The date of this prospectus is , 2022
TABLE OF CONTENTS
Page | ||||
| ii | ||||
| iii | ||||
| vi | ||||
| vi | ||||
| 1 | ||||
| 4 | ||||
| 12 | ||||
| 56 | ||||
| 57 | ||||
| 58 | ||||
| 59 | ||||
| 67 | ||||
| 91 | ||||
| 105 | ||||
| 112 | ||||
| 125 | ||||
| 128 | ||||
| 132 | ||||
| 139 | ||||
| 152 | ||||
| 153 | ||||
| 157 | ||||
| 157 | ||||
| 157 | ||||
| F-1 | ||||
i
ABOUT THIS PROSPECTUS
This prospectus is part of a registration statement that we filed with the U.S. Securities and Exchange Commission, or the SEC, using a “shelf” registration process. By using a shelf registration statement, the Selling Securityholders may sell up to 140,155,860 shares of common stock, up to 7,800,000 private placement warrants and up to 11,055,606 debt provider warrants from time to time in one or more offerings as described in this prospectus. We will not receive any proceeds from the sale by such Selling Securityholders of the securities offered by them described in this prospectus. This prospectus also relates to the issuance by us of up to 19,299,960 shares of common stock issuable upon the exercise of the private placement warrants and the public warrants and up to 11,055,606 shares of common stock issuable upon the exercise of the debt provider warrants. We will not receive any proceeds from the sale of shares of common stock underlying the Offered Warrants pursuant to this prospectus, except with respect to amounts received by us upon the exercise of the Offered Warrants for cash.
We may also file a prospectus supplement or post-effective amendment to the registration statement of which this prospectus forms a part that may contain material information relating to these offerings. The prospectus supplement or post-effective amendment may also add, update or change information contained in this prospectus with respect to that offering. If there is any inconsistency between the information in this prospectus and the applicable prospectus supplement or post-effective amendment, you should rely on the prospectus supplement or post-effective amendment, as applicable. Before purchasing any securities, you should carefully read this prospectus, any post-effective amendment, and any applicable prospectus supplement, together with the additional information described under the heading “Where You Can Find More Information.”
Neither we, nor the Selling Securityholders, have authorized anyone to provide you with any information or to make any representations other than those contained in this prospectus, any post-effective amendment, or any applicable prospectus supplement prepared by or on behalf of us or to which we have referred you. We and the Selling Securityholders take no responsibility for and can provide no assurance as to the reliability of any other information that others may give you. We and the Selling Securityholders will not make an offer to sell these securities in any jurisdiction where the offer or sale is not permitted. You should assume that the information appearing in this prospectus, any post-effective amendment and any applicable prospectus supplement to this prospectus is accurate only as of the date on its respective cover. Our business, financial condition, results of operations and prospects may have changed since those dates. This prospectus contains, and any post-effective amendment or any prospectus supplement may contain, market data and industry statistics and forecasts that are based on independent industry publications and other publicly available information. Although we believe these sources are reliable, we do not guarantee the accuracy or completeness of this information and we have not independently verified this information. In addition, the market and industry data and forecasts that may be included in this prospectus, any post-effective amendment or any prospectus supplement may involve estimates, assumptions and other risks and uncertainties and are subject to change based on various factors, including those discussed under the heading “Risk Factors” contained in this prospectus, any post-effective amendment and the applicable prospectus supplement. Accordingly, investors should not place undue reliance on this information.
As used in this prospectus, unless otherwise indicated or the context otherwise requires, references to “we,” “us,” “our,” the “Company,” “Registrant,” and “Terran Orbital” refer to the consolidated operations of Terran Orbital Corporation and its subsidiaries. References to “Tailwind Two” refer to Tailwind Two Acquisition Corp. prior to the consummation of the Business Combination and references to “Legacy Terran Orbital” refer to Terran Orbital Corporation prior to the consummation of the Business Combination.
ii
SELECTED DEFINITIONS
Unless otherwise stated in this prospectus or the context otherwise requires, references to:
“” means the Terran Orbital Corporation 2021 Omnibus Incentive Plan.
2021 Omnibus Incentive Plan
“” or “” means the board of directors of the Company.
Board
Board of Directors
“” means the restated bylaws of the Company.
Bylaws
“” means the transactions contemplated by the Business Combination Agreement, including the Domestication, the Merger and the PIPE Investment.
Business Combination
“” means that certain Agreement and Plan of Merger, dated as of October 28, 2021, as amended by Amendment No. 1 thereto dated February 8, 2022 and Amendment No. 2 thereto dated March 9, 2022, by and among Tailwind Two Acquisition Corporation, Titan Merger Sub, Inc. and Terran Orbital Corporation.
Business Combination Agreement
“” means the Certificate of Incorporation of the Company as amended by the Certificate of Amendment, each of which was filed with the Secretary of State of the State of Delaware on March 25, 2022.
Certificate of Incorporation
“” means the shares of common stock, par value $0.0001 per share, of the Company.
common stock
“” means the Class A ordinary shares, par value $0.0001 per share, of Tailwind Two, prior to the Domestication, which automatically converted, on abasis, into shares of common stock in connection with the Closing.
Class A ordinary shares
one-for-one
“” means the Class B ordinary shares, par value $0.0001 per share, of Tailwind Two, prior to the Domestication, which automatically converted, on abasis, into shares of common stock in connection with the Closing.
Class B ordinary shares
one-for-one
“” means the closing of the Business Combination.
Closing
“” means March 25, 2022.
Closing Date
“” means the Internal Revenue Code of 1986, as amended.
Code
“” refers to Terran Orbital following the Closing and to Legacy Terran Orbital prior to the Closing.
Company
“” means the 11,055,606 warrants originally issued in a private placement to certain debt providers.
debt provider warrants
“” means the domestication contemplated by the Business Combination Agreement, whereby Tailwind Two effected a deregistration and a transfer by way of continuation from the Cayman Islands to the State of Delaware, pursuant to which Tailwind Two’s jurisdiction of incorporation was changed from the Cayman Islands to the State of Delaware.
Domestication
“” means the General Corporation Law of the State of Delaware.
DGCL
“” means the Securities Exchange Act of 1934, as amended.
Exchange Act
“” means the 8,100,000 shares of our common stock issued to the Sponsor and Tommy Stadlen collectively in connection with the automatic conversion of the Class B ordinary shares in connection with the Closing.
Founder Shares
“” means United States generally accepted accounting principles.
GAAP
“” means the Investment Company Act of 1940, as amended.
Investment Company Act
iii
“” means Tailwind Two’s initial public offering, consummated on March 4, 2021, of 34,500,000 units (including 4,500,000 units that were issued to the underwriters in connection with the exercise in full of their over-allotment option) at $10.00 per unit.
IPO
“means the Jumpstart Our Business Startups Act of 2012.
JOBS Act”
“” means Terran Orbital Corporation, a Delaware corporation, prior to the Closing.
Legacy Terran Orbital
“” means the merger contemplated by the Business Combination Agreement and completed on March 25, 2022, whereby Merger Sub merged with and into Terran Orbital, with Terran Orbital Operating Corporation surviving the merger as a wholly-owned subsidiary of the Company on the Closing Date.
Merger
“” means Titan Merger Sub, Inc., a Delaware corporation.
Merger Sub
“” means the constellation of small satellites being developed by Terran Orbital through its PredaSAR subsidiary to provide Earth observation data and mission solutions using unique Synthetic Aperture Radar data and including secondary payloads that may include electro-optical, optical links or other sensors and capabilities.
NextGen Earth Observation constellation
“” means the New York Stock Exchange.
NYSE
“” means the private placement warrants and the debt provider warrants originally issued by the Company in private placements which will be offered for resale by certain of the Selling Securityholders pursuant to this prospectus.
Offered Warrants
“” means the private placement pursuant to which the PIPE Investors collectively subscribed for 5,080,409 shares of Tailwind Two Class A ordinary shares at $10.00 per share, for an aggregate purchase price of $50,804,090, on the Closing.
PIPE Financing
“” means certain institutional investors that invested in the PIPE Financing.
PIPE Investors
“” means the 5,080,409 shares of our common stock issued in the PIPE Financing.
PIPE Shares
“” means the 7,800,000 warrants originally issued to the Sponsor in a private placement in connection with the IPO.
private placement warrants
“” means the Class A ordinary shares included in the units issued in the IPO.
public shares
“” means holders of public shares.
public shareholders
“” means the 11,499,960 warrants included in the units issued in the IPO.
public warrants
“” or “” means the Sarbanes-Oxley Act of 2002.
Sarbanes-Oxley Act
SOX
“” means the United States Securities and Exchange Commission.
SEC
“” means the Securities Act of 1933, as amended.
Securities Act
“” means the selling securityholders named in this prospectus.
Selling Securityholders
“” means our proposed new campus of approximately 660,000 square foot satellite manufacturing facility, which is currently planned to be located in Brevard County, Florida.
Space Florida Facility
“means Tailwind Two Sponsor LLC, a Delaware limited liability company.
Sponsor”
“” means, collectively, those certain subscription agreements, entered into on October 28, 2021, between Tailwind Two and the PIPE Investors.
Subscription Agreements
“l” refer to Terran Orbital Corporation, a Delaware corporation (f/k/a Tailwind Two Acquisition Corporation, a Cayman Islands exempted company), and its consolidated subsidiary following the Closing.
Terran Orbita
iv
“” means Continental Stock Transfer & Trust Company.
Transfer Agent
“” means the trust account of Tailwind Two that held the proceeds from the IPO and a portion of the proceeds from the sale of the private placement warrants.
Trust Account
“” means the private placement warrants, the public warrants and the debt provider warrants.
Warrants
“” means the warrant agreement between Continental, as warrant agent, and Tailwind Two.
Warrant Agreement
v
MARKET AND INDUSTRY DATA
Where market and industry information has been sourced from a third-party, the source of such information has been identified. Unless otherwise indicated, the information contained in this prospectus on market and industry data in the markets in which we operate is taken from publicly available sources and other third-party sources, or reflects estimates of our management. This market and industry data involves a number of assumptions and limitations, and you are cautioned not to give undue weight to such estimates. While we are not aware of any misstatements regarding the market and industry data presented herein, our estimates involve risks and uncertainties and are subject to change based on various factors, including those discussed under the heading “Risk Factors” and “Management’s Discussion and Analysis of Financial Condition and Results of Operations” in this prospectus.
TRADEMARKS
This prospectus contains references to trademarks, trade names and service marks belonging to other entities. Solely for convenience, trademarks, trade names and service marks referred to in this prospectus may appear without the
®
or TM symbols, but such references are not intended to indicate, in any way, that the applicable licensor will not assert, to the fullest extent under applicable law, its rights to these trademarks and trade names. We do not intend our use or display of other companies’ trade names, trademarks or service marks to imply a relationship with, or endorsement or sponsorship of us by, any other company.vi
CAUTIONARY NOTE REGARDING FORWARD-LOOKING STATEMENTS
Certain statements in this prospectus may constitute “forward-looking statements” for purposes of the federal securities laws. We intend such forward-looking statements to be covered by the safe harbor provisions for forward-looking statements contained in Section 27A of the Securities Act, and Section 21E of the Exchange Act. All statements, other than statements of present or historical fact included in this prospectus, regarding Terran Orbital’s future financial performance, as well as Terran Orbital’s business strategy, future operations, financial position, estimated revenues, and losses, projected costs, earning outlooks, prospects, expectations, plans and objectives of management are forward-looking statements. When used in this prospectus, the words “plan,” “believe,” “expect,” “anticipate,” “intend,” “outlook,” “estimate,” “forecast,” “project,” “continue,” “could,” “may,” “might,” “possible,” “potential,” “predict,” “should,” “would” and other similar words and expressions are intended to identify forward-looking statements, but the absence of these words does not mean that a statement is not forward-looking. These forward-looking statements are based on management’s current expectations, assumptions, hopes, beliefs, intentions and strategies regarding future events and are based on currently available information as to the outcome and timing of future events. Terran Orbital cautions you that these forward-looking statements are subject to all of the risks and uncertainties, most of which are difficult to predict and many of which are beyond the control of Terran Orbital, incident to its business.
These forward-looking statements are based on information available as of the date of this prospectus, and current expectations, forecasts and assumptions, and involve a number of risks and uncertainties. There can be no assurance that future developments will be those that have been anticipated. Accordingly, forward-looking statements in this prospectus should not be relied upon as representing Terran Orbital’s views as of any subsequent date, and Terran Orbital does not undertake any obligation to update forward-looking statements to reflect events or circumstances after the date they were made, whether as a result of new information, future events or otherwise, except as may be required under applicable securities laws.
As a result of a number of known and unknown risks and uncertainties, Terran Orbital’s actual results or performance may be materially different from those expressed or implied by these forward-looking statements. These risks and uncertainties include, but are not limited to:
| • | expectations regarding our strategies and future financial performance, including our future business plans or objectives, anticipated cost, timing and level of deployment of satellites, prospective performance and commercial opportunities and competitors, the timing of obtaining regulatory approvals, the ability to finance our operations, research and development activities and capital expenditures, reliance on government contracts and a strategic cooperation agreement with a significant customer, retention and expansion of our customer base, product and service offerings, pricing, marketing plans, operating expenses, market trends, revenues, margins, liquidity, cash flows and uses of cash, capital expenditures, and our ability to invest in growth initiatives; |
| • | the ability to implement business plans, forecasts, and other expectations, and to identify and realize additional opportunities; |
| • | anticipated timing, cost and performance of our Earth Observation Solutions’ planned satellite constellation and our ability to successfully finance, deploy and commercialize its business; |
| • | anticipated timing, cost, financing and development of our satellite manufacturing capabilities, including the Space Florida Facility; |
| • | prospective performance and commercial opportunities and competitors; |
| • | our ability to finance our operations, research and development activities and capital expenditures; |
| • | our success in retaining or recruiting, or changes required in, our officers, key employees or directors; |
| • | our expansion plans and opportunities; |
1
| • | our ability to comply with domestic and foreign regulatory regimes and the timing of obtaining regulatory approvals; |
| • | our ability to finance and invest in growth initiatives; |
| • | our ability to deal appropriately with conflicts of interest in the ordinary course of our business; |
| • | the outcome of any legal proceedings that may be instituted against us and others; |
| • | the ability to maintain the listing of our common stock and the public warrants on the NYSE and the possibility of limited liquidity and trading of such securities; |
| • | geopolitical risk and changes in applicable laws or regulations; |
| • | the possibility that we may be adversely affected by other economic, business, and/or competitive factors; |
| • | that we have identified material weaknesses in our internal control over financial reporting which, if not corrected, could affect the reliability of our consolidated financial statements; |
| • | the possibility that the COVID-19 pandemic, or another major disease, disrupts our business; |
| • | supply chain disruptions, including delays, increased costs and supplier quality control challenges; |
| • | the ability to attract and retain qualified labor and professionals and our reliance on a highly skilled workforce, including technicians, engineers and other professionals; |
| • | we do not expect to become profitable in the near future and may never achieve our profitability expectations, plus we expect to generate negative cash flow from operations and investments for the foreseeable future; |
| • | our leverage and our ability to service cash debt payments and comply with debt maintenance covenants, including meeting minimum liquidity and operating profit covenants; |
| • | limited access to equity and debt capital markets and other funding sources that will be needed to fund operations and make investments, including investments in our NextGen Earth Observation constellation and the Space Florida Facility; |
| • | delays and costs associated with developing our NextGen Earth Observation constellation, Space Florida Facility and other initiatives whether due to changes in demand, lack of funding, design changes or other conditions or circumstances; |
| • | while immediately after the Closing of the Business Combination on March 25, 2022, approximately 82.7% of the Company’s 137,295,455 total shares of common stock then outstanding were subject to a 180-day lock-up under the Investor Rights Agreement, the expiration or waiver of thislock-up will result in a substantial increase in shares eligible to be traded in the market and could have negative impact on our stock price; |
| • | litigation and regulatory enforcement risks, including the diversion of management time and attention and the additional costs and demands on our resources; and |
| • | other factors detailed under the section titled “Risk Factors” beginning on page 12 of this prospectus. |
The foregoing list of risks and uncertainties is not exhaustive. New risk factors and uncertainties may emerge from time to time and it is not possible to predict all such risk factors, nor can Terran Orbital assess the impact of all such risk factors on its business, or the extent to which any factor or combination of factors may cause actual results to differ materially from those contained in any forward-looking statements.
2
You should read this prospectus completely and with the understanding that our actual future results may be materially different from what we expect. Terran Orbital qualifies all of our forward-looking statements by these cautionary statements.
3
PROSPECTUS SUMMARY
The following summary highlights information contained in greater details elsewhere in this prospectus. This summary is not complete and does not contain all of the information you should consider in making your investment decision. You should read the entire prospectus carefully before making an investment in our common stock or warrants. You should carefully consider, among other things, our financial statements and related notes and the sections titled “Risk Factors” and “Management’s Discussion and Analysis of Financial Condition and Results of Operations” included elsewhere in this prospectus.
Company Overview
Terran Orbital is a U.S.-based manufacturer, owner and operator of satellites and related space-based solutions that provide Earth observation, data and analytics to defense, intelligence, civil and commercial end users. Through its subsidiary Tyvak Nano-Satellite Systems Inc. (“Terran Orbital Satellite Solutions”), Terran Orbital is a leading provider of next-generation, turnkey satellite solutions focused primarily on the small satellite market. Drawing from over a decade of its satellite solutions and mission support experience, Terran Orbital is developing, through its PredaSAR subsidiary (“Terran Orbital Earth Observation Solutions”), a constellation of NextGen Earth observation (“EO”) satellites using unique Synthetic Aperture Radar (“SAR”) data and electro-optical capabilities to provide EO data and mission solutions that it believes will be distinguished by breadth of coverage, revisit rates and ability to observe and detect during day and night and through clouds and other interference. Terran Orbital is a leader in satellite technology and satellite solutions serving U.S. government defense, intelligence and civil agencies, including the U.S. Department of Defense (the “DoD”), the Space Development Agency (the “SDA”) and the National Aeronautics and Space Administration (“NASA”), as well as aerospace and defense prime contractors, including Lockheed Martin and numerous other governmental and commercial businesses that operate in the high-growth sectors of satellite, space-based solutions.
Terran Orbital Satellite Solutions works with established customers across federal agencies, including the DoD, Intelligence Community and major defense prime contractors. It also supports commercial and academic customers. Through Terran Orbital Satellite Solutions, Terran Orbital currently deliverssatellite solutions including spacecraft design, development, launch services and
end-to-end
on-orbit
operations for critical missions across a number of applications in a variety of orbits. Terran Orbital Satellite Solutions has over 65 flight-proven modules and devices which enable Terran Orbital to rapidly respond to customer needs. This deep portfolio of knowledge in design engineering has led to a track record of mission success, demonstrated by Terran Orbital Satellite Solutions’ over 80 missions executed. Terran Orbital Satellite Solutions continues to support numerous successful marquee agencies, including NASA and SDA.In addition, Terran Orbital Earth Observation Solutions has commenced building satellites and intends to continue to develop and launch the largest commercially operated NextGen Earth Observation constellation. Terran Orbital Earth Observation Solutions plans to provide near persistent global coverage and near real-time, mission-critical Earth observation data. Its first constellation of 96 satellites is currently planned to be completed and”). Our NextGen Earth Observation constellation is projected to achieve under
in-orbit
by 2026 (the “NextGen Earth Observation constellation
10-minute
average revisit rates (the rate at which a satellite constellation revisits a certain position over Earth, with higher revisit rates allowing more constant monitoring of the Earth’s surface) once fully deployed. Our NextGen Earth Observation constellation relies on proprietary technology developed and owned by Terran Orbital. The satellites will feature SAR capabilities, which permit day and night observance through clouds and other interference. In addition, Terran Orbital Earth Observation Solutions plans to provide secondary payload solutions and onboard data processing capabilities on its satellite constellation, including additional sensors, optical links or other mission solutions. Terran Orbital Satellite Solutions will manufacture Terran Orbital Earth Observation constellation.Terran Orbital incurred a net loss of $71.4 million for the three months ended March 31, 2022 and Legacy Terran Orbital incurred a net loss of $77.5 million for the three months ended March 31, 2021, and a net loss of $139.0 million and $10.5 million for the years ended December 31, 2021 and December 31, 2020, respectively. Terran Orbital does not expect to become profitable in the near future and may never achieve profitability. Terran Orbital also expects its operating expenses to increase over the next several years as it scales its operations, increases research and development efforts relating to new offerings and technologies, and hires more employees. The Company also has a substantial amount of indebtedness, consisting of $120.0 million under the Francisco Partners Facility and approximately $56.3 million of Rollover Notes (as defined below), as well as $28.1 million of payment obligations owed to the Insider PIPE investor, in each case as of March 31, 2022.
4
Corporate Information
Tailwind Two was incorporated on November 18, 2020 as a special purpose acquisition company and a Cayman Islands exempted company under the name Tailwind Two Acquisition Corp. On March 4, 2021, Tailwind Two completed its initial public offering. On March 25, 2022, Tailwind Two consummated the Business Combination with Terran Orbital pursuant to the Business Combination Agreement. In connection with the Business Combination, Tailwind Two’s jurisdiction of incorporation was changed from the Cayman Islands to the State of Delaware, and Tailwind Two changed its name to Terran Orbital Corporation.
Terran Orbital is a Delaware corporation. Terran Orbital’s principal executive office is located at 6800 Broken Sound Parkway NW, Suite 200, Boca Raton, Florida 33487, and its telephone number is (561)
988-1704.
Terran Orbital’s corporate website address is www.terranorbital.com. Terran Orbital’s website and the information contained on, or that can be accessed through, the website is not deemed to be incorporated by reference in, and is not considered part of, this registration statement.Summary of Risk Factors
In evaluating an investment in our securities, investors should carefully read the risks described below, this prospectus and especially consider the factors discussed in the section entitled “.” If any of the following events occur, our business, financial condition and operating results may be materially adversely affected. In that event, the trading price of our securities could decline, and you could lose all or part of your investment. Such risks include, but are not limited to:
Risk Factors
Risks Related to Our Business and Our Reliance on Government Contracts
| • | We rely directly and indirectly on contracts with U.S. government entities for a substantial portion of our revenues, and our business is concentrated in a small number of primary contracts. The loss or reduction in scope of any one of our primary contracts would materially reduce our revenue. |
| • | Our business with various governmental entities is subject to the policies, security requirements, priorities, regulations, mandates and funding levels of such governmental entities and changes thereto may have a material adverse effect on our revenue and our ability to achieve our growth objectives. |
Other Risks Related to Our Business and Operations
| • | We are an early-stage company in a rapidly evolving industry with a limited operating history and a history of losses and we may not achieve or maintain profitability. |
| • | Our ability to implement our business plan will depend on a number of factors outside of our control. |
| • | We may not be able to convert our orders in backlog or the sales opportunities represented in our pipeline into revenue. |
| • | Our NextGen Earth Observation constellation, which will require significant investment and substantial funding not currently available to us, may not be completed on time or at all, may not work properly, and the costs associated with it may be greater than expected. |
| • | Our satellites have a limited life and may fail prematurely and our products in general could fail to perform or could perform at reduced levels of service because of technological malfunctions or deficiencies, regulatory compliance issues, or events outside of our control. |
| • | A failure to successfully finance, open and operate our planned new manufacturing facility could harm our business, financial condition and results of operations. |
| • | We may require substantial funding to finance our operations and investments, including our investments in our NextGen Earth Observation constellation and Space Florida Facility, but adequate financing may not be available when we need it, on acceptable terms or at all. |
5
| • | We derive a substantial portion of our revenue from Lockheed Martin. If Lockheed Martin changes its business strategy or reduces or eliminates its demand for our products and services, our business, prospects, operating results and financial condition could be adversely affected. |
| • | We rely on third parties for a substantial amount of our materials, supplies, equipment and services, many of which are difficult to source. Existing and future delays in delivery, disruptions in the supply of key raw materials and price increases could adversely affect our financial performance. |
| • | We have experienced and may continue to experience disruptions in our supply chains, including delays, increased costs and quality control challenges. |
| • | We are dependent on third-party launch vehicles to launch our satellites and payloads into space and any delay could have an adverse impact on our financial condition and results of operations. |
| • | Any significant disruption in or unauthorized access to our or our customers’ computer systems and other information technology could result in a loss of service, unauthorized disclosure of data, or theft or tampering of intellectual property, any of which could materially adversely impact our business. Security problems with our networks could cause increased cyber-security protection costs and general service costs and result in liability and increased expense. |
| • | System security and data breaches or cyber security incidents, as well as cyber-attacks could disrupt and damage our business, reputation and brand and substantially harm our business and results of operations. |
| • | Satellites are subject to construction and launch delays, launch failures, damage or destruction during launch, deployment and commissioning, the occurrence of which can materially and adversely affect our operations. We may not be able to secure the launch of our satellites successfully or in a timely manner. |
| • | Our business involves significant risks and uncertainties that may not be covered by insurance or by adequate levels of insurance. |
| • | Legacy Terran Orbital identified material weaknesses in its internal control over financial reporting as of December 31, 2021 and Terran Orbital may identify additional material weaknesses in the future or otherwise fail to maintain effective internal control over financial reporting, which may result in material misstatements of our financial statements or cause us to fail to meet our periodic reporting obligations, cause a default in under our debt covenants, or cause our access to the capital markets to be impaired and have a material adverse effect on our business. |
| • | The Company’s management has limited experience in operating a public company. |
| • | If we are unable to retain Mr. Bell, as well as attract and retain key employees, qualified management, technical and engineering personnel, our ability to compete could be harmed. |
| • | We face substantial risks associated with our international operations. |
Risks Related to Our Legal and Regulatory Matters
| • | Our business is subject to extensive government regulation, which mandates how we may operate our business, may reduce or eliminate our business, and may increase our business costs and prevent our expansion into new markets. |
| • | We have not yet applied for, and may not receive, certain regulatory approvals that are necessary to our business plan, including the deployment and operation of our NextGen Earth Observation constellation. |
6
| • | Investments in the Company may be subject to U.S. foreign investment as well as ownership and control regulations which may impose conditions on or limit certain investors’ ability to purchase our common stock, potentially making our common stock less attractive to investors. |
| • | We are subject to stringent U.S. export and import control laws and regulations as well as governmental law and regulations relating to environmental matters. Unfavorable changes in these laws and regulations or its failure to comply with these laws and regulations could have a material adverse effect on our business, financial condition and results of operation. |
Risks Related to Our Indebtedness
| • | We have a substantial amount of indebtedness and payment obligations that could affect our operations and financial condition and prevent us from fulfilling our obligations under our indebtedness. |
| • | Certain of our debt facilities include financial maintenance covenants that will require us to meet minimum liquidity and Consolidated Adjusted EBITDA thresholds on a quarterly basis. |
| • | Restrictions imposed by our substantial indebtedness could adversely affect our ability to raise additional capital to fund our operations and dividend policy, limit our ability to react to changes in the economy or our industry and prevent us from making debt service payments. |
Risks Related to Resale of Our Common Stock
| • | The securities being offered for resale represent a substantial percentage of our outstanding common stock and the sale of such securities may cause the market price of our common stock to decline significantly. |
Emerging Growth Company
We are an “emerging growth company,” as defined in Section 2(a) of the Securities Act, as modified by the Jumpstart Our Business Startups Act of 2012 (the “JOBS Act”), and we may take advantage of certain exemptions from various reporting requirements that are applicable to other public companies that are not emerging growth companies, including, but not limited to, not being required to comply with the auditor attestation requirements of Section 404 of the Sarbanes-Oxley Act of 2002 (the “Sarbanes-Oxley Act”), reduced disclosure obligations regarding executive compensation in our periodic reports and proxy statements, and exemptions from the requirements of holding a nonbinding advisory vote on executive compensation and stockholder approval of any golden parachute payments not previously approved.
Further, Section 102(b)(1) of the JOBS Act exempts emerging growth companies from being required to comply with new or revised financial accounting standards until private companies (that is, those that have not had a registration statement under the Securities Act declared effective or do not have a class of securities registered under the Exchange Act) are required to comply with the new or revised financial accounting standards. The JOBS Act provides that a company can elect to opt out of the extended transition period and comply with the requirements that apply to
non-emerging
growth companies but any such election to opt out is irrevocable. We have elected not to opt out of such extended transition period, which means that when a standard is issued or revised and it has different application dates for public or private companies, we, as an emerging growth company, can adopt the new or revised standard at the time private companies adopt the new or revised standard. This may make comparison of our financial statements with certain other public companies difficult or impossible because of the potential differences in accounting standards used.We will remain an emerging growth company until the earliest of (i) the last day of the fiscal year: (a) following March 4, 2026, the fifth anniversary of the closing of Tailwind Two’s IPO; (b) in which we have total annual gross revenue of at least $1.07 billion; or (c) in which we are deemed to be a large accelerated filer, which means the market value of our common stock that is held by
non-affiliates
exceeds $700.0 million as of the last business day of our most recently completed second fiscal quarter; and (ii) the date on which we have issued more than $1.0 billion innon-convertible
debt securities during the prior three-year period. References herein to “emerging growth company” have the meaning associated with it in the JOBS Act.7
Smaller Reporting Company
Additionally, we are a “smaller reporting company” as defined in Item 10(f)(1) of Regulation
S-K.
Smaller reporting companies may take advantage of certain reduced disclosure obligations, including, among other things, providing only two years of audited financial statements. We will remain a smaller reporting company until the last day of the fiscal year in which (i) the market value of our common stock held bynon-affiliates
exceeds $250 million as of the prior June 30, or (ii) our annual revenues exceeded $100 million during such completed fiscal year and the market value of our common stock held bynon-affiliates
exceeds $700 million as of the prior June 30.8
The Offering
Issuer | Terran Orbital Corporation | |
Issuance of common stock: | ||
| Shares of common stock offered by us | Up to 30,355,566 shares of common stock issuable upon exercise of the Warrants, consisting of: | |
a. up to 11,499,960 shares of common stock that are issuable upon the exercise of the public warrants; | ||
b. up to 7,800,000 shares of common stock that are issuable upon the exercise of the private placement warrants; and | ||
c. up to 11,055,606 shares of common stock that are issuable upon the exercise of the debt provider warrants | ||
| Shares of common stock outstanding as of May 25, 2022 | 137,556,122 shares of common stock | |
| Exercise price of public warrants and private placement warrants | $11.50 per share, subject to adjustments as described herein | |
| Exercise price of debt provider warrants | $10.00 per share, subject to adjustments as described herein | |
| Use of proceeds | We will receive up to an aggregate of approximately $332.5 million from the exercise of the Warrants, assuming the exercise in full of all of the Warrants for cash. There is no assurance that the holders of the Warrants will elect to exercise for cash any or all of such Warrants. We believe the likelihood that warrant holders will exercise their Warrants, and therefore the amount of cash proceeds that we would receive, is dependent upon the market price of our common stock. If the market price for our common stock is less than $10.00 per share, we believe warrant holders will be unlikely to exercise their debt provider warrants, and if the market price for our common stock is less than $11.50 per share, we believe warrant holders will be unlikely to exercise their public warrants and private placement warrants. We expect to use the net proceeds from the exercise of the Warrants, if any, for investment in growth and general corporate purposes. See “ Use of Proceeds | |
9
Resale of common stock and warrants: | ||
| Shares of common stock offered by the Selling Securityholders | Up to 140,155,860 shares of common stock, consisting of: a. up to 5,080,409 PIPE Shares; | |
b. up to 8,100,000 Founder Shares; | ||
c. up to 94,952,441 shares of common stock issued or issuable to the Legacy Terran Orbital equity holders in connection with or as a result of the consummation of the Business Combination consisting of: | ||
(i) up to 83,481,806 shares of our common stock; and | ||
(ii) up to 82,616 shares of common stock issuable upon the exercise of certain options; and | ||
(iii) up to 11,388,019 shares of common stock issuable upon the settlement of outstanding vested and unvested restricted stock unit awards upon of certain conditions | ||
d. up to 8,420,569 shares of common stock issued to certain debt providers; | ||
e. up to 7,800,000 shares of common stock issuable upon the exercise of the private placement warrants; | ||
f. up to 11,055,606 shares of common stock issuable upon the exercise of the debt provider warrants; and | ||
g. up to 4,746,835 shares of common stock issuable pursuant to the Subscription Agreement for the Insider PIPE Investor. | ||
| Warrants offered by the Selling Securityholders | Up to 18,855,606 warrants, consisting of: | |
a. up to 7,800,000 private placement warrants; and | ||
b. up to 11,055,606 debt provider warrants | ||
| Terms of the offering | The Selling Securityholders will determine when and how they will dispose of the shares of common stock and warrants registered under this prospectus for resale. | |
| Use of proceeds | We will not receive any proceeds from the sale of shares of common stock or Offered Warrants by the Selling Securityholders. | |
| Lock-up restrictions | Certain of our stockholders are subject to certain restrictions on transfer until the termination of applicable lock-up periods. See “ Certain Relationships and Related Person Transactions — Tailwind Two — Investor Rights Agreement | |
NYSE symbols | Our common stock and public warrants are listed on the NYSE under the symbols LLAP and LLAP WS, respectively. | |
10
| Risk factors | See “Risk Factors” and other information included in this prospectus for a discussion of factors you should consider before investing in our common stock or Warrants. |
11
RISK FACTORS
Investing in our securities involves risks. You should consider carefully the risks and uncertainties described below, together with all of the other information in this prospectus, including the section titled “Management’s Discussion and Analysis of Financial Condition and Results of Operations” and our consolidated financial statements and related notes, before deciding whether to purchase any of our securities. Our business, results of operations, financial condition, and prospects could also be harmed by risks and uncertainties that are not presently known to us or that we currently believe are not material. If any of these risks actually occur, our business, results of operations, financial condition, and prospects could be materially and adversely affected. Unless otherwise indicated, references in these risk factors to our business being harmed will include harm to our business, reputation, brand, financial condition, results of operations, and prospects. In such event, the market price of our securities could decline, and you could lose all or part of your investment.
Risks Related to Our Business and Our Reliance on Government Contracts
We rely directly and indirectly on contracts with U.S. government entities for a substantial portion of our revenues, and our business is concentrated in a small number of primary contracts. The loss or reduction in scope of any one of our primary contracts would materially reduce our revenue.
A substantial portion of our revenue is derived from solutions pursuant to prime contracts and subcontracts that are directly or ultimately provided to the U.S. government. For the three months ended March 31, 2022, Terran Orbital generated and for the year ended December 31, 2021, Legacy Terran Orbital generated approximately 82% and 54%, respectively, of their total revenue in connection with contracts supporting the U.S. government. We expect that our direct or indirect support to U.S. government contracts will continue to be a substantial source of our revenue for the foreseeable future. A breach of the underlying contract with government customers or reduction or elimination in service to our customers could have a material adverse effect on our business, financial condition and results of operations. The U.S. government or our other customers may also terminate or suspend these contracts, at any time with or without cause. Although the contracts we provide services under generally involve fixed annual minimum commitments, such commitments, along with all other contracts with the U.S. government, are subject to annual Congressional appropriations and the federal budget process, and as a result, the U.S. government may not continue to fund these contracts at current or anticipated levels. Similarly, contracts in other jurisdictions are also subject to government procurement policies and procedures.
Most of our services for the U.S. government are performed pursuant to our relationship with Lockheed Martin, which presents certain significant risks. See “” and “”
—Other Risks Related to Our Business and Operations—We derive a substantial portion of our revenue from Lockheed Martin. If Lockheed Martin changes its business strategy or reduces or eliminates its demand for our products and services, our business, prospects, operating results and financial condition could be adversely affected
—Other Risks Related to Our Business and Operations—Our strategic cooperation agreement with Lockheed Martin is not a firm order for services and gives Lockheed Martin priority rights, including over satellite manufacturing, and we may not receive the anticipated revenue from this agreement or may be required to prioritize Lockheed Martin over other customers or delay our plans to build out the NextGen Earth Observation constellation, either of which could adversely affect our operating performance and result in a loss of expected revenue.
We have government customers, which subjects us to risks including early termination, audits, investigations, sanctions, debarment and other penalties.
Contracts with the U.S. government contain provisions that give the government substantial rights and remedies, many of which are not typically found in commercial contracts and which are unfavorable to contractors.
For instance, most U.S. government contracts include provisions that allow the government to unilaterally terminate or modify contracts for convenience, and in that event, the counterparty to the contract may generally recover only its incurred or committed costs and settlement expenses and profit on work completed prior to the termination. If the government terminates a contract for default, the defaulting party may be liable for liquidated damages, the government’s administrative costs, and any extra costs incurred by the government in procuring undelivered items from another source. A termination for default may also lead to a suspension or debarment from performing future contracts, typically up to three years. However, reparations for termination may fall short of the financial benefit associated with full completion and operation of a contract.
12
Certain of our U.S. government contracts span one or more base years and include multiple option years. The U.S. government generally has the right not to exercise option periods and may decide not to exercise an option period for various reasons. The U.S. government also may decide to exercise option periods for contracts under which it is expected that our costs may exceed the contract price or ceiling, which could result in losses or unreimbursed costs.
In addition, we may not be able to capture new contracts to offset the revenue or backlog lost as a result of any termination of government contracts or the decision not to exercise options. The loss of one or more large contracts could have a material adverse impact on our business, financial condition, results of operations and cash flows. In addition, on those contracts for which we are teamed with others and are not the prime contractor, the U.S. government could terminate a prime contract under which we are a subcontractor, notwithstanding the fact that our performance and the quality of the products or services we delivered were consistent with our contractual obligations as a subcontractor.
In addition, government contracts normally contain additional requirements that may increase our costs of doing business, reduce our profits, and expose us to liability for failure to comply with these terms and conditions. These requirements include, for example:
| • | specialized disclosure and accounting requirements unique to government contracts; |
| • | financial and compliance audits that may result in potential liability for price adjustments, recoupment of government funds after such funds have been spent, civil and criminal penalties, or administrative sanctions such as suspension or debarment from doing business with the U.S. government; |
| • | public disclosures of certain contract and company information; |
| • | country of origin requirements and restrictions on use of products produced by certain companies or in certain countries; |
| • | U.S. government-imposed cybersecurity and supply chain assurance requirements; and |
| • | mandatory socioeconomic compliance requirements, including labor requirements, nondiscrimination and affirmative action programs and environmental compliance requirements. |
Government contracts are also generally subject to greater scrutiny by the government, which can initiate reviews, audits and investigations regarding our compliance with government contract, legal and regulatory requirements. For additional information, see “Business — Regulatory — U.S. Government Contracts” In addition, if we fail to comply with government contracting laws, regulations and contract requirements, our contracts may be subject to termination, we may be suspended or debarred from performing government contracts, and we may be subject to financial and/or other liability under our contracts, the Federal Civil False Claims Act (the “False Claims Act”) (including treble damages and other penalties), or criminal law. In particular, the False Claims Act’s “whistleblower” provisions also allow private individuals, including present and former employees, to sue on behalf of the U.S. government. Any penalties, damages, fines, suspension, debarment, or damages could adversely affect our ability to operate our business and our financial results.
.
Disruptions in U.S. government operations and funding could have a material adverse effect on our revenues, earnings and cash flows and otherwise adversely affect our financial condition.
Any disruptions in federal government operations could have a material adverse effect on our revenues, earnings and cash flows. A prolonged failure to maintain significant U.S. government operations, particularly those pertaining to our business, could have a material adverse effect on our revenues, earnings and cash flows. Continued uncertainty related to recent and future U.S. government shutdowns, the U.S. budget and/or failure of the U.S. government to enact annual appropriations, such as long-term funding under a continuing resolution, could have a material adverse effect on our revenues, earnings and cash flows.
13
Additionally, disruptions in federal government operations may negatively impact regulatory approvals and guidance that are important to our operations.
Our business with various governmental entities is subject to the policies, priorities, regulations, mandates and funding levels of such governmental entities and may be negatively or positively impacted by any change thereto.
Changes in government policies, priorities, regulations, use of commercial data providers to meet U.S. government imagery needs, government agency mandates, funding levels through agency budget reductions, the imposition of budgetary constraints or a decline in government support or deferment of funding for programs in which we or our customers participate could result in contract terminations, delays in contract awards, reduction in contract scope, performance penalties or breaches of our contracts, the failure to exercise contract options, the cancellation of planned procurements and fewer new business opportunities, all of which could negatively impact our business, financial condition, results of operations and cash flows.
We are subject to the procurement policies and procedures set forth in the Federal Acquisition Regulation (“FAR”), the Defense Federal Acquisition Regulation Supplement (“DFARS”) and other contracting agencies supplemental acquisition regulations. The FAR, DFARS and other supplemental acquisition regulations tightly govern government contracting, including contractor qualifications, acquisition procedures, and compliance requirements. The provisions in U.S. government contracts must be agreed to in order for the government to award a contract and the contracts provide for audits and reviews of contract procurement, performance and administration. Failure to comply with the provisions of the FAR, DFARS or other agency supplemental acquisition regulations could result in contract termination, suspension or debarment from performing government contracts, and subject us to financial and/or other liability under our contracts, the False Claims Act (including treble damages and other penalties), or criminal law.
Changes in U.S. government policy regarding use of commercial data or space infrastructure / mission providers, or material delay or cancellation of certain U.S. government programs, may have a material adverse effect on our revenue and our ability to achieve our growth objectives.
Current U.S. government policy enables the U.S. government’s use of commercial data and space infrastructure / mission providers to support U.S. national security objectives. Under certain of our primary contracts, our contractual counterparty acquires imagery and imagery-derived products on behalf of our customers within the U.S. government. We are considered by the U.S. government to be a commercial data provider. U.S. government policy is subject to change and any change in policy away from supporting the use of commercial data and space infrastructure / mission providers to meet U.S. government imagery and space infrastructure/mission needs, or any material delay or cancellation of planned U.S. government programs could materially adversely affect our revenue and our ability to achieve our growth objectives.
We are subject to the U.S. Government’s security requirements, including the DoD’s National Industrial Security Program Operating Manual, for our facility and personnel security clearances, which are prerequisites to our ability to perform on classified contracts and work for the U.S. Government.
A facility security clearance is required for a company to perform on classified contracts or classified work for the DoD and certain other agencies of the U.S. Government. Security clearances are subject to regulations and requirements including such requirements as those contained in the National Industrial Security Program Operating Manual, 32 C.F.R. Part 117, as amended (the “NISPOM”), which specifies the requirements for the protection of classified information released or disclosed in connection with U.S. Government contracts. The Defense Counterintelligence and Security Agency (“DCSA”) manages the facility clearance process under the NISPOM and conducts various facility audits and inspections throughout the lifecycle of a respective facility clearance.
The U.S. government requires certain facility and personnel security clearances to perform classified U.S. Government business. Any facility not staffed by appropriately cleared personnel, and/or that fails a DCSA inspection places the facility clearance and the ability to perform classified contracts in jeopardy. As such, we must comply with the requirements of the NISPOM and other applicable U.S. government industrial security regulations. If we were to violate the terms and requirements of the NISPOM or such industrial security regulations (which apply to it under the terms of classified contracts, if any), or if one or more of our facilities or personnel security clearances is invalidated or terminated, we may not be able to continue to perform our existing classified contracts,
14
if any, and may not be able to enter into new classified contracts, if any, which could adversely affect our revenues. Failure to comply with the NISPOM or other security requirements may result in loss of access to classified information and subject us to civil and criminal penalties and administrative sanctions, including termination of contracts, forfeiture of profits, suspension of payments, fines and suspension or prohibition from doing business with the U.S. government, which could have an adverse effect on our financial position, results of operations and/or cash flows.
Some of our contracts or work directly or indirectly with the U.S. Government may be classified, or entail classified work, which may limit investor insight into portions of our business.
We derive a portion of our revenues from programs with the U.S. Government that may be subject to security restrictions (classified programs) that preclude the dissemination of information that is classified for national security purposes. We are limited in our ability to provide details about these classified programs, if any, their risks or any disputes or claims relating to such programs. As a result, investors will have less insight into our classified programs than our other programs and, therefore, less ability to fully evaluate the risks related to our classified business. In addition, a change in our ownership that results in control by foreign persons could result in loss of our security clearance and the inability to perform classified contracts for the U.S. government or require mitigation of such control, which may result in changes to the way we manage our operations. Any such foreign control could also impact our relationship with certain U.S. government customers. Furthermore, restrictions on acquisition or purchase of our shares or other limitations on control by foreign persons to avoid such consequences could have a negative impact on our share price.
The U.S. Government could invoke the Defense Production Act of 1950, as amended (the “DPA”) and requires that we accept and prioritize contracts for materials deemed necessary for national defense, regardless of loss in revenue incurred on such contracts.
Under the DPA, the U.S. Government could require that we accept and prioritize contracts for the U.S. Government, which could result in loss in revenue or otherwise cause us to incur unexpected expense and losses. We may be required to reallocate time and resources away from commercial and other customer groups to fulfill U.S. Government requests under the DPA. This could cause us to be unable to fulfill contractual obligations to
non-U.S.
government customers and harm long-term business relationships with commercial and other customers. This could materially and adversely affect our business.Other Risks Related to Our Business and Operations
We are an early stage company with a history of losses and may not achieve or maintain profitability. In addition, we will not be able to pursue, develop and deploy our NextGen Earth Observation constellation as planned and other growth initiatives unless and until we raise additional sufficient capital.
Terran Orbital incurred a net loss of $71.4 million for the three months ended March 31, 2022 and Legacy Terran Orbital incurred a net loss of $77.5 million for the three months ended March 31, 2021, and net losses of $139.0 million and $10.5 million for the years ended December 31, 2021 and December 31, 2020, respectively. The Company has incurred net losses of approximately $269 million from its inception through March 31, 2022. We expect our operating expenses to increase over the next several years as we scale our operations, increase research and development efforts relating to new offerings and technologies, and hire more employees. These efforts may be more costly than we expect and may not result in increased revenue or growth in our business. Any failure to increase our revenue sufficiently to keep pace with our investments and other expenses could prevent us from achieving or maintaining profitability or positive cash flow. The likelihood of success of our business plan must be considered in light of the substantial challenges, expenses, difficulties, complications and delays frequently encountered in connection with developing and expanding early-stage businesses and the competitive environment in which we operate. The development of the NextGen Earth Observation constellation and related intellectual property involves a substantial degree of risk, is a capital-intensive business and may ultimately fail. If we cannot successfully execute our plan to develop the NextGen Earth Observation constellation, our business will not succeed as planned.
Our potential profitability is dependent upon the successful development and successful commercial introduction and acceptance of the NextGen Earth Observation constellation, which may not occur. The development of our NextGen Earth Observation constellation will require significant investment by us to build, launch and operate each satellite to be used in the constellation. We will need to raise substantial capital through
15
public or private financing or other arrangements to finance the NextGen Earth Observation constellation and our other business operations and initiatives. Accordingly, our plans to develop our NextGen Earth Observation constellation have been delayed until we have raised sufficient capital. Additionally, we may determine to focus more capital and business resources to invest in our Satellite Solutions operations. Even if we are able to successfully develop our NextGen Earth Observation constellation, there can be no assurance that we will be commercially successful and become profitable on a sustained basis, if at all. We expect to havefluctuations in revenues, expenses and capital expenditures, some of which could be significant, due to research, development, manufacturing expenses and the significant investments required to manufacture and launch the NextGen Earth Observation constellation satellites.
quarter-to-quarter
We derive a substantial portion of our revenue from Lockheed Martin. If Lockheed Martin changes its business strategy or reduces or eliminates its demand for our products and services, our business, prospects, operating results and financial condition could be adversely affected.
Lockheed Martin is a significant customer of ours and accounts for, and is expected to continue to account for, a substantial portion of our consolidated revenue. Lockheed Martin individually represented approximately 77% of Terran Orbital’s consolidated revenues for the three months ended March 31, 2022 and approximately 50% of Legacy Terran Orbital’s consolidated revenues for the year ended December 31, 2021. In addition, programs associated with Lockheed Martin represent approximately 86% and 56% of our backlog as of March 31, 2022 and December 31, 2021, respectively. Future operating results will continue to depend on the success of Terran Orbital’s relationships with Lockheed Martin, including under the SCA (as defined below).
Orders from Lockheed Martin are subject to fluctuation and may be reduced materially or eliminated entirely due to changes in Lockheed Martin’s needs, our failure to meet Lockheed Martin’s specifications or price expectations or other factors. Any reduction or delay in sales of products to Lockheed Martin could significantly reduce our revenue. Our operating results will also depend on successfully developing relationships with additional key customers. We cannot assure Lockheed Martin will be retained or that additional key customers will be recruited.
Our strategic cooperation agreement with Lockheed Martin is not a firm order for services and gives Lockheed Martin priority rights, including over satellite manufacturing, and we may not receive the anticipated revenue from this agreement or may be required to prioritize Lockheed Martin over other customers or delay our plans to build out the NextGen Earth Observation constellation, either of which could adversely affect our operating performance and result in a loss of expected revenue.
We are party to a strategic cooperation agreement with Lockheed Martin (the “SCA”) pursuant to which the parties agree to (i) collaborate on the development, production and sale of satellites for use in U.S. Government spacecraft and spacecraft procurements and (ii) establish a cooperation framework to enable the parties to enter into projects, research and development agreements and other collaborative business arrangements and “teaming activities.” The SCA only sets forth the basic terms and conditions under which the parties may collaborate and is not a firm order for services. As such, there can be no assurance that the SCA will result in actual revenue during any particular period or at all.
The SCA also contains a number of provisions that require us to prioritize our relationship with Lockheed Martin. For example, under the SCA, if we are awarded a contract to build satellites for Lockheed Martin, then we are required to prioritize the Lockheed Martin order over manufacturing satellites for our other customers. Lockheed Martin also has the right of first refusal over certain large satellite manufacturing orders received from third parties and receives preferential rights to bid on certain ground-based services and products. Accordingly, our business with other current and prospective customers may suffer due to the requirements of the SCA. Furthermore, if we do not have sufficient satellite manufacturing capacity for our own orders, then the development of the NextGen Earth Observation constellation would be delayed. In addition, Lockheed Martin has the right to receive our SAR data, but not commercialize it, without further agreement between the parties, which limits our ability to commercialize our SAR data with respect to Lockheed Martin. For additional information see “Certain Relationships and Related Person Transactions — Terran Orbital — Strategic Cooperation Agreement with Lockheed Martin.” The prioritization of Lockheed Martin over other customers, as well as any potential delay in development of the NextGen Earth Observation constellation could materially adversely affect our business, financial condition and results of operations.
16
We have a limited operating history and operate in a rapidly evolving industry, which makes it difficult to evaluate our business and future prospects and increases the risk of your investment.
We intend to derive a substantial portion of our revenues from the NextGen Earth Observation constellation, which is an innovative technology that is still in the beginning stages of development. The satellite solutions industry is rapidly evolving and there can be no assurance that the NextGen Earth Observation constellation, once completed, will be able to effectively compete with any available alternative technologies at such time. As a result, there is limited information on which investors can base an evaluation of its business, strategy, operating plan, results and prospects. See “— Rapid and significant technological changes or advancements in competitors’ offerings could render our NextGen Earth Observation constellation and our Satellite Solutions offerings obsolete and impair our ability to compete.”
It is difficult to predict future revenues and appropriately budget for expenses, and we have limited insight into trends that may emerge and affect our business. In addition, given that the NextGen Earth Observation constellation is still in the beginning stages of development, will require significant investment by us and raising substantial funding not currently available to us to build, launch and operate each satellite to be used in the constellation and has not been tested, as well the fact that we plan to build out our satellite manufacturing capabilities, we face substantial business and operational risks, which makes forecasting future business results particularly difficult and results in a significant level of execution risk.
Additional risk and challenges we have faced or expect to face include our ability to:
| • | forecast our revenue and budget for and manage our expenses; |
| • | attract new customers and retain existing customers; |
| • | capture new business after we no longer qualify as a small business eligible for government contracts set aside for small businesses; |
| • | effectively manage our growth and business operations, including planning for and managing capital expenditures for our current and future vehicles and services, and managing our supply chain and supplier relationships related to our current and future vehicles and services; |
| • | comply with existing and new or modified laws and regulations applicable to our business; |
| • | anticipate and respond to macroeconomic changes and changes in the markets in which we operate; |
| • | maintain and enhance the value of our reputation and brand; |
| • | develop, maintain, enforce, and protect intellectual property; and |
| • | hire, integrate and retain talented people at all levels of our organization, including employees with security clearances and the additional employees required to design and build our solutions as well as operate and maintain our facilities. |
If we fail to address the risks and difficulties that we face, including those associated with the challenges listed above as well as those described elsewhere in this “Risk Factors” section, our business, financial condition and results of operations could be adversely affected. Further, because we have limited historical financial data and operate in a rapidly evolving market, any predictions about our future revenue and expenses may not be as accurate as they would be if we had a longer operating history or operated in a more developed market. We have encountered in the past, and will encounter in the future, risks and uncertainties frequently experienced by growing companies with limited operating histories in rapidly changing industries. If our assumptions regarding these risks and uncertainties, which we use to plan and operate our business, are incorrect or change, or if we do not address these risks successfully, our results of operations could differ materially from our expectations and our business, financial condition and results of operations could be adversely affected.
17
Our ability to successfully implement our business plan will depend on a number of factors outside of our control.
The success of our business plan is dependent on a number of factors outside of our control, including:
| • | our ability to maintain the functionality, capacity and control of our satellites, including those that will comprise the NextGen Earth Observation constellation once launched; |
| • | the level of market acceptance and demand for our products and services; |
| • | the ability to introduce innovative new products and services that satisfy market demand; |
| • | the ability to comply with all applicable legal and regulatory requirements; |
| • | the effectiveness of competitors in developing and offering similar services and products; |
| • | the ability to maintain competitive prices for our products and services and to control our expenses; |
| • | the ability to obtain necessary government licenses to launch and operate our satellites; |
| • | the disruption of and interference with the global supply chain, including delays, increased costs and supplier quality control challenges; and |
| • | our ability to provide NextGen Earth Observation constellation end-users of with an experience reasonably equivalent to other imaging alternatives available to them, whether in space or terrestrial. |
We may not be able to convert our orders in backlog or the sales opportunities represented in our pipeline into revenue.
Our backlog totaled $221.8 million and $73.9 million as of March 31, 2022 and December 31, 2021, respectively. However, many of these contracts are cancellable by customers for convenience. If a customer cancels a contract before it is required to pay the last deposit prior to launch, we may not receive all potential revenue from these orders, except for an initial
non-refundable
deposit which is paid at the time the contract is signed. In addition, backlog includes both funded (firm orders for which funding is authorized and appropriated) and unfunded portions of such contracts, for which work has not been performed. If a contract is unfunded whole or part, and the customer does not obtain funding or appropriation of funding, there is a risk that we may not receive revenue from that portion of the contract.In addition, backlog is typically subject to large variations from quarter to quarter and comparisons of backlog from period to period are not necessarily indicative of future revenues. Furthermore, some contracts comprising the backlog are for services scheduled many years in the future, and the economic viability of customers with whom we have contracted is not guaranteed over time. As a result, the contracts comprising our backlog may not result in actual revenue in any particular period, or at all, and the actual revenue from such contracts may differ from our backlog estimates. The timing of receipt of revenues, if any, on projects included in backlog could change because many factors affect the scheduling of missions and adjustments to contracts, including additional costs or scope changes, may also occur. The failure to realize some portion of our backlog could adversely affect our revenues and gross margins. Furthermore, the presentation of our financial results requires us to make estimates and assumptions that may affect revenue recognition. In some instances, we could reasonably use different estimates and assumptions, and changes in estimates are likely to occur from period to period. Accordingly, actual results could differ significantly from our estimates.
18
As of March 31, 2022, management has identified 140 or more programs accounting for over $12 billion in potential revenue at its Satellites Solutions segment and refers to this opportunity as its sales pipeline. Management may fail to convert any or all of these potential opportunities into revenue for a variety of reasons both inside of and outside of management’s control.
If we fail to manage our future growth effectively, our business, prospects, operating results and financial condition may be materially adversely affected.
In order to achieve the substantial future revenue growth we have projected, we must develop and market new products and services. We intend to expand our operations significantly, including the development of our NextGen Earth Observation constellation, our Space Florida Facility and our facilities in Irvine, California. To properly manage our growth, we will need to hire and retain additional personnel, upgrade our existing operational management and financial and reporting systems, and improve our business processes and controls. Our future expansion will include:
| • | hiring and training new personnel; |
| • | assembling, licensing and servicing the NextGen Earth Observation constellation; |
| • | developing new technologies; |
| • | controlling expenses and investments in anticipation of expanded operations; |
| • | upgrading the existing operational management and financial reporting systems and team to comply with requirements as a public company; and |
| • | implementing and enhancing administrative infrastructure, systems and processes. |
If our operations continue to grow as planned, of which there can be no assurance, we will need to expand our sales and marketing, research and development, customer and commercial strategy, products and services, supply, and manufacturing functions. These efforts will require us to invest significant financial and other resources, including in industries and sales channels in which we have limited experience to date. We will also need to continue to leverage our manufacturing and operational systems and processes, and there is no guarantee that we will be able to scale the business and the manufacture of vehicles as currently planned or within the planned timeframe. The continued expansion of our business may also require additional manufacturing and operational facilities, as well as space for administrative support, and there is no guarantee that we will be able to find suitable locations for the manufacture of our vehicles.
Our continued growth could increase the strain on our resources, and we could experience operating difficulties, including difficulties in hiring and training employees, finding manufacturing capacity to produce our vehicles and related equipment, and delays in production. These difficulties divert the attention of management and key employees and impact financial and operational results. If we are unable to drive commensurate growth, these costs, which include lease commitments, headcount and capital assets, could result in decreased margins, which could have a material adverse effect on our business, financial condition and results of operations.
Our NextGen Earth Observation constellation, including the SAR technology and satellite bus size, are under design and development, have not been built or launched by us before and may not be completed on time or at all, may not work properly, are not yet licensed, will require significant investment and substantial funding not currently available to us, and the costs associated with it may be greater than expected. There is technology, development and cost risk associated with our Earth Observation Solutions’ satellites that if not successfully managed will have a significant impact on our ability to successfully deploy and commercialize our Earth Observation Solutions’ business.
While we estimate the gross costs associated with designing, building and launching the NextGen Earth Observation constellation and related infrastructure will be approximately $730 million in capital expenditures, there can be no assurance that we will complete the NextGen Earth Observation constellation and related infrastructure, products and services on a timely basis, on budget or at all. Design, manufacture and launch of satellite systems are highly complex and historically have been subject to delays and cost over-runs. Development of the NextGen Earth Observation constellation may suffer from delays, interruptions or increased costs due to many factors, some of which may be beyond our control, including:
19
| • | timing in finalizing the NextGen Earth Observation constellation design and specifications, including its antenna aperture; |
| • | the failure of the NextGen Earth Observation constellation to work as expected as a result of technological or manufacturing difficulties, design issues or other unforeseen matters; |
| • | lower than anticipated demand and acceptance for the NextGen Earth Observation constellation from potential customers; |
| • | the inability to obtain capital to finance the NextGen Earth Observation constellation and related infrastructure, products and services on acceptable terms or at all; |
| • | engineering and/or manufacturing performance failing or falling below expected levels of output or efficiency; |
| • | denial or delays in receipt of regulatory approvals or non-compliance with conditions imposed by regulatory authorities; |
| • | the breakdown or failure of equipment or systems; |
| • | non-performance by third-party contractors or suppliers; |
| • | the inability to develop or license necessary technology on commercially reasonable terms or at all; |
| • | launch delays or failures or deployment failures or in-orbit satellite failures once launched; |
| • | labor disputes or disruptions in labor productivity or the unavailability of skilled labor; |
| • | increases in the costs of, or unavailability of, materials; |
| • | changes in project scope; |
| • | increased competition; |
| • | additional requirements imposed by changes in laws and regulations; or |
| • | severe weather or catastrophic events such as fires, earthquakes, storms or explosions. |
If any of the above events occur, they could have a material adverse effect on our ability to continue to develop the NextGen Earth Observation constellation and related infrastructure, products and services, which would materially adversely affect our business, financial condition and results of operations. In addition, the Company will need to raise additional funding in order to develop, license and deploy the NextGen Earth Observation constellation. See “”
—We are an early stage company with a history of losses and may not achieve or maintain profitability. In addition, we will not be able to pursue, develop and deploy our NextGen Earth Observation constellation as planned and other growth initiatives unless and until we raise additional sufficient capital.
Because our satellites are complex and are deployed in complex environments, our satellites may have defects that are discovered only after full deployment in space, which could seriously harm our business. Our customized hardware and software may be difficult and expensive to service, upgrade and replace.
We produce highly complex products including satellites that incorporate leading-edge technology. They are designed to be deployed across complex networks, which in some cases may include over a million users. Because of the nature of these satellites, there is no assurance that our
pre-shipment
testing programs will be adequate to detect all defects. As a result, our customers may discover errors or defects in our satellites, or our satellites may not operate as expected after they have been fully deployed to space. Hardware and software errors or defects discovered before launch of the spacecraft to orbit may be mediated while the spacecraft is still on the ground.20
However, once launched, we will no longer be able to change or service the hardware. While spacecraft are in orbit, we may be able to fix software errors or defects. If we are unable to cure an anomaly, we could experience damage to our reputation, reduced customer satisfaction, loss of existing customers and failure to attract new customers, failure to achieve market acceptance, cancellation of orders, loss of revenues, reduction in backlog and market share, increased service and warranty costs, diversion of development resources, legal actions by our customers, issuance of credit to customers and increased insurance costs. Defects, integration issues or other performance problems in our satellites could also result in financial or other damages to our customers. Our customers could seek damages for related losses from us, which could seriously harm our business, financial condition and results of operations. The occurrence of any of these problems would seriously harm our business, financial condition and results of operations.
Our products could fail to perform or could perform at reduced levels of service because of technological malfunctions or deficiencies, regulatory compliance issues, or events outside of our control, which would harm our business and reputation.
Our products and services are subject to the risks inherent in a global, complex system employing advanced technology and heavily regulated in the United States and internationally by, among others, the Federal Communications Commission (“FCC”), the National Oceanic and Atmospheric Administration (“NOAA”) and other regulatory authorities that govern such systems in different countries such as the Norwegian Communications Authority (“NKOM”), and the International Telecommunications Union (“ITU”), internationally. The lack of familiarity with, and burdens of complying with, foreign laws, legal standards, privacy and cybersecurity standards, regulatory requirements, tariffs and other barriers, and the risk of penalties for deemed noncompliance, could have a material adverse effect on our business, financial condition and results of operation. Any disruption to our satellites, services, information systems or regulatory compliance issues, could result in the inability or reduced ability of
end-user
customers to receive services for an indeterminate period of time. These customers may include government agencies conducting mission-critical work throughout the world. Any disruption to the NextGen Earth Observation constellation or extended periods of reduced levels of service could cause Terran Orbital to lose customers or revenue, result in delays or cancellations of future implementations of Terran Orbital’s products and services, result in failure to attract customers, or result in litigation, customer service or repair work that would involve substantial costs and distract management from operating our business. The failure of any of the diverse elements of the planned NextGen Earth Observation constellation, including its satellites, to function as required could render the NextGen Earth Observation constellation unable to perform at the quality and capacity levels required for success. Any system failures, repeated product failures or shortened product life, or extended reduced levels of service could reduce our expected sales, increase costs, or result in warranty or liability claims or litigation, and harm our business.Our satellites have a limited life and may fail prematurely, which would materially and adversely affect our business, prospects and potential profitability.
We may experience
in-orbit
malfunctions of our satellites once launched, which could adversely affect the reliability of their service or result in total failure of the satellite.In-orbit
failure of a satellite may result from various causes, including component failure, loss of power or fuel, inability to control positioning of the satellite, solar or other astronomical events, including solar radiation, wind and flares, and space debris. Other factors that could affect the useful lifespan of our satellites include the quality of construction, gradual degradation of solar panels and the durability of components. Radiation-induced failure of satellite components may result in damage to or loss of a satellite before the end of its expected life. In addition, satellites in low earth orbit have a limited life cycle and they could become compromised over their designated operational life span. Mechanical and electrical failures due to manufacturing error or defect as well as equipment degradation during the satellite’s lifetime may affect the actual commercial service lives of satellites. The commercial service lives of our satellites may be shorter than anticipated and we may not be able to adequately predict their useful lifespan. Any satellite anomalies in the future may result in monetary losses, delays, and impairment of services, all of which may adversely affect our business, financial condition, and results of operations. We would also expect to record an impairment charge in our statement of operations to reduce the remaining net book value of any failed satellite to zero, and any such impairment charges could depress our net income for the period in which the failure occurs.21
We will incur significant expenses and capital expenditures in the future to execute our business plan, expand satellite solutions and develop our mission and data solutions within our Earth Observation Solutions, in particular the development of our NextGen Earth Observation constellation, and we may by unable to adequately control our expenses.
We will incur significant expenses and capital expenditures in the future to further our business plan, in particular the development of the NextGen Earth Observation constellation, including expenses to:
| • | design, develop, assemble and launch our satellites; |
| • | design and develop components; |
| • | leasing and other development costs; |
| • | conduct research and development; |
| • | purchase raw materials and components; |
| • | launch, test and successfully operate our systems; |
| • | license our system and ground stations; |
| • | find, compete for and maintain customers for our services; |
| • | expand our design, development, maintenance and repair capabilities; and |
| • | increase our general and administrative functions to support our growing operations and the management of a public company. |
Because we will incur the costs and expenses from these efforts before we receive any revenues with respect thereto, our losses in future periods will be significant. In addition, we may find that these efforts are more expensive than we currently anticipate or that these efforts may not result in revenues or generate our desired margins, which would further increase our losses. Our ability to become profitable in the future will not only depend on our ability to successfully design, build, manufacture, launch, license and service satellites for others and, with respect to the NextGen Earth Observation constellation for ourselves, but also to control costs. If we are unable to efficiently design, manufacture, launch and service our satellites or experience significant delays during such development, our potential margins, potential profitability and prospects would be materially and adversely affected.
A failure to successfully finance, open and operate our planned new or expanded manufacturing facilities could harm our business, financial condition and results of operations. Such new or expanded facilities may not be achieved on time or within our projected budget and may otherwise not provide the capability that we seek.
We are in discussions to lease property for and build the Space Florida Facility. Subject to raising additional funding, we plan to relocate certain of our existing satellite manufacturing, assembly, integrating and testing to our new facility after we enter into a definitive lease agreement. The delay in entering into a definitive lease agreement, the cost of such lease arrangement, once negotiated, as well as the failure to obtain necessary financing for and the costs of opening the Space Florida Facility could cause us to incur costs that vary materially from our projections, as well as impede our ability to generate new business as planned given existing capacity constraints and would adversely affect our business, financial condition and results of operations.
Transferring satellite manufacturing, assembly, integrating and testing to our new manufacturing location will also require significant capital expenditures, including the installation and/or transplantation of complex manufacturing equipment and processes and to hire and train a new workforce. If we are unable to manage this transfer and training smoothly and comprehensively, we could suffer delays in recognizing efficiencies, manufacturing and supply chain delays, adverse impacts on the developments of our NextGen Earth Observation constellation, product quality and delivery schedules, harm to our reputation with our customers, and loss of customers. If we are unable to successfully manage the relocation or initiation of the manufacture of these products, our business, financial condition and results of operations could be harmed.
22
In addition, we have signed leases to expand our Irvine, California operations which involves additional costs and managerial effort throughout 2022 before this expanded facility capacity is brought
on-line
and we may engage in further expansions.Rapid and significant technological changes or advancements in competitors’ offerings could render our NextGen Earth Observation constellation and our Satellite Solutions offerings obsolete and impair our ability to compete.
The satellite industry is subject to rapid advances and innovations in technology. We may face competition in the future from companies using new technologies, including new satellite systems. New technology could render our planned systems and satellites, including our NextGen Earth Observation constellation and/or our Satellite Solutions offerings, obsolete or less competitive. Particular technological developments that could adversely affect our business plan may include the deployment by our competitors of new satellites with greater power, flexibility, efficiency or capabilities than ours. If we do not continue to develop, manufacture and market innovative technologies or applications that meet customers’ requirements, sales may suffer and our business may not grow as planned. For us to keep pace with technological changes and remain competitive, we may need to make significant capital expenditures and incur research and development expenses, including expenditures to design and launch new products and services. Customer acceptance of the products and services that we offer may continually be affected by technology-based differences in product and service offerings compared to those of competitors. New technologies may also be protected by patents or other intellectual property laws and therefore may not be available. Any failure to implement new technology within our NextGen Earth Observation constellation may compromise our ability to compete.
Our satellites may collide with space debris or another spacecraft, which could adversely affect the performance of or destroy any satellite we build and places in orbit, including satellites in our NextGen Earth Observation constellation.
Although we expect to comply with industry practice and orbital debris mitigation requirements to actively maneuver our satellites to avoid potential collisions with space debris or other spacecraft, including an onboard propulsion system and altitude and orbit control system, these abilities are limited by, among other factors, uncertainties and inaccuracies in the projected orbit location of and predicted collisions with debris objects tracked and cataloged by governments or other entities. Additionally, some space debris is too small to be tracked and therefore its orbital location is unknown; nevertheless, this debris is still large enough to potentially cause severe damage or a failure of our satellites should a collision occur. If our satellites collide with space debris or other spacecraft, our NextGen Earth Observation constellation could be impaired. In addition, a failure of one or more of our satellites or the occurrence of equipment failures, collision damage, or other related problems that may result during the
de-orbiting
process could constitute an uninsured loss and could materially harm our financial condition. In addition, while we are exploring collision avoidance technologies to mitigate space debris and collision risks, technology and costs related thereto may be effectual and prohibitively expensive.The future revenue and operating results of our business are dependent on our ability to generate a sustainable order rate for our satellite manufacturing operations and develop new technologies to meet the needs of our customers or potential new customers.
Our satellite solutions business’ financial performance is dependent on our ability to generate a sustainable order rate for our satellite manufacturing operations. This can be challenging and may fluctuate on a quarterly and annual basis as the number of satellite construction contracts awarded varies. The cyclical nature of the commercial satellite market could negatively impact our ability to accurately forecast customer demand. The markets that we serve may not grow in the future and we may not be able to maintain adequate gross margins or profits in these markets. Our growth is dependent on the growth in our customers’ needs, the sales of services provided by our customers, our customers’ ability to anticipate market trends, and our ability to anticipate changes in the businesses of our customers and to successfully identify and enter new markets. If we fail to anticipate such changes in demand, our business, results of operations and financial position could be adversely affected. Our sales efforts also typically require an extensive effort throughout a customer’s organization, a significant investment of human resources, expense and time, and there can be no assurances that we will be successful in making a sale to a potential customer. The individual or cumulative effects of factors discussed above could result in large fluctuations and unpredictability in our quarterly and annual operating results. As a result, comparing our operating results on abasis may not be meaningful.
period-to-period
23
The satellite manufacturing industry is characterized by development of technologies to meet changing customer demand for complex and reliable services. Our systems embody complex technology and may not always be compatible with current and evolving technical standards and systems developed by others. Failure or delays to meet or comply with the requisite and evolving industry or user standards could have a material adverse effect on our business, results of operations and financial condition.
We will require substantial funding to finance our operations, and to make investments in growth initiatives, including our investments in our NextGen Earth Observation constellation and Space Florida Facility, but adequate financing may not be available when we need it, on acceptable terms or at all. If we cannot raise additional funds when needed, our operations and prospects could be negatively affected.
We will be required to raise capital through public or private financing or other arrangements to finance our operations and to make investments in growth initiatives, including our investments in our NextGen Earth Observation Constellation and Space Florida Facility. Such financing may not be available on acceptable terms, or at all, and our failure to raise capital when needed could harm our business. For example, the global
COVID-19
health crisis and related financial impact has resulted in, and may continue to result in, significant disruption and volatility of global financial markets that could adversely impact our ability to access capital. In addition, global conflicts (such as the currently ongoing conflict in Ukraine), inflation concerns and investor willingness to fund emerging growth companies such as ours may negatively impact our access to the financial markets. We may sell equity securities or debt securities in one or more transactions at prices and in a manner as we may determine from time to time. If we sell any such securities in future transactions, our current investors may be materially diluted. Any debt financing, if available, may involve restrictive covenants and could reduce our operational flexibility or profitability. If we cannot raise funds on acceptable terms, we may not be able to grow our business or respond to competitive pressures.The historical financial results of Legacy Terran Orbital and our unaudited pro forma condensed combined financial information included elsewhere in this prospectus may not be indicative of what our actual financial position or results of operations would have been.
The historical financial results of Legacy Terran Orbital included in this prospectus do not reflect the financial condition, results of operations or cash flows we would have achieved as a standalone company during the periods presented or that we will achieve in the future. This is primarily the result of the following factors:
| • | we have incurred and will continue to incur additional ongoing costs as a result of the Business Combination, including costs related to public company reporting, investor relations and compliance with the Sarbanes-Oxley Act; and |
| • | our capital structure is different from that reflected in Legacy Terran Orbital’s historical financial statements prior to the Business Combination. |
Similarly, our unaudited pro forma condensed combined financial information in this prospectus is presented for illustrative purposes only. Accordingly, such unaudited pro forma condensed combined financial information may not be indicative of our future operating or financial performance and our actual financial condition and results of operations may vary materially from our unaudited pro forma condensed combined statements of operations and balance sheet contained elsewhere in this prospectus.
24
We rely on third parties for a supply of equipment, satellite and other components, including semiconductor chip components, and services which creates risks to our operations. In addition, any future delays in delivery could adversely affect our financial performance and future prospects.
Our business depends in large part on our ability to execute our plans to assemble, integrate and test satellites and components at our facilities in Irvine, California, Santa Maria, California and Torino, Italy. We rely on certain key suppliers to supply and produce certain highly technical components. The failure of these suppliers or others to perform could require us to seek alternative suppliers or expand our production capabilities, which could incur additional costs and have a negative impact on our cost or supply of components. In particular, due to theradio communications as well as the flight computers that allow the satellite to deliver its capabilities. The semiconductor shortages, reduced availability of parts, supplier quality controls and longer than historical lead times to deliver parts and supplies have negatively affected our ability to timely deliver our products and services to customers in both 2020 and 2021 and has continued into the2022 period, which primarily affected our ability to recognize revenue on our forecasted timeline and increased our costs due to longer manufacturing durations. To date in 2022, we continue to experience shortages and longer lead times of semiconductor chips and other parts and supplies, and increased costs and we expect this trend will continue in the near future as we manage such longer lead times and/or seek alternative supply arrangements , which could have a material adverse effect on our business and negatively impact our financial condition and operating results by increasing costs, delaying our ability to manufacture and deliver our satellites thereby negatively affecting our ability to meet customer demands, delaying our recognition of revenue as well as increasing our costs, interest and depreciation expenses and inventory levels.
COVID-19
pandemic, labor shortages at our suppliers and various other factors, we have experienced semiconductor chip shortages and longer than historically experienced lead times of semiconductor chips. These parts are vital to our manufacturing of printed circuit board assemblies that control all elements of satellite operations. This includessafety-of-flight
year-to-date
In addition, production or logistics in supply or production areas or transit to final destinations can be disrupted for a variety of reasons including, but not limited to, natural and
man-made
disasters, information technology system failures, commercial disputes, military actions, economic, business, labor, environmental, public health or political issues or international trade disputes. If any of our suppliers terminate their relationships with us, fail to provide equipment or services on a timely basis, or fail to meet performance expectations, we may be unable to provide our products or services to our customers in a competitive manner, as well as delay development of our NextGen Earth Observation constellation, which could in turn negatively affect our financial performance and future prospects.Our business, including the continued development of our NextGen Earth Observation constellation, is and will be subject to risks, including but not limited to:
| • | securing necessary components on acceptable terms and in a timely manner; |
| • | delays and failure in delivery of final component designs to our suppliers; |
| • | our ability to attract, recruit, hire and train skilled employees, including employees with appropriate clearances; |
| • | quality controls; |
| • | cyber and data security; |
| • | obtaining appropriate government licenses for operation; |
| • | satellite launch and operation delays and failures; |
| • | delays or disruptions in supply chain; and |
| • | other delays and cost overruns. |
In addition, in connection with the PIPE Financing, we entered into supply agreements requiring $20 million of purchase commitments over three years with Redwire Space, Inc. and Big Bear AI LLC, which are affiliates of AE Industrial to provide software and satellite supplies. We may not be able to benefit as much as we anticipate, or at all, from these new supply agreements due to the fact that, among other things, the new supply agreements have minimum payment conditions regardless of the services utilized, the supplier goods or services may not be as valuable as we anticipate relative to alternatives and circumstances may changes and we may not need such services.
25
We do not know whether we will be able to develop efficient, automated,
low-cost
production capabilities and processes and reliable sources of component supply that will enable us to successfully operate our satellites and NextGen Earth Observation constellation. Any failure to develop such production processes and capabilities within our projected costs and timelines could have a material adverse effect on our business, prospects, financial condition and operating results.We and our suppliers rely on complex systems and components, which involves a significant degree of risk and uncertainty in terms of operational performance and costs.
We and our suppliers rely on complex systems and components for the operation and assembly of our satellites, which involves a significant degree of uncertainty and risk in terms of operational performance and costs. These components may suffer unexpected malfunctions from time to time and may require repairs and spare parts to resume operations, which may not be readily available when needed. Unexpected malfunctions of these components may significantly affect the intended operational efficiency. Operational performance and costs can be difficult to predict and are often influenced by factors outside of our control, such as, but not limited to, scarcity of natural resources, environmental hazards and remediation, difficulty or delays in obtaining governmental permits, damages or defects in various components, industrial accidents, fire, seismic activity and natural disasters. Should operational risks materialize, it may result in the monetary losses, delays, unanticipated fluctuations in production, environmental damage, administrative fines, increased insurance costs and potential legal liabilities, all of which could have a material adverse effect on our business, prospects, financial condition or operating results.
The ongoing
COVID-19
pandemic and future pandemics and health crises may disrupt our operations and affect our ability to successfully complete the research and development of our NextGen Earth Observation constellation on a timely basis.In March 2020, the World Health Organization declaredorders, business closures, travel restrictions, supply chain disruptions and employee illness or quarantines, which could result in disruptions to our operations and adversely impact our operations and financial condition. In addition, the
COVID-19
a pandemic. TheCOVID-19
pandemic has negatively impacted the global economy, disrupted global supply chains, and created significant volatility and disruption in the financial and capital markets. We are unable to accurately predict the full impact that the ongoingCOVID-19
pandemic will have on our planned development of our NextGen Earth Observation constellation, our financial condition, and operational activities due to numerous factors that are not within our control, including the duration and severity of the outbreak,stay-at-home
COVID-19
pandemic has resulted in ongoing volatility in the financial and capital markets. If our access to capital is restricted or associated borrowing costs increase as a result of developments in financial markets relating to theCOVID-19
pandemic, our operations and financial condition could be adversely impacted. Any future delays as a result ofCOVID-19
would delay Terran Orbital’s phased development.We are dependent on third-party launch vehicles to launch our satellites and payloads into space and any delay or cancellation could have an adverse impact on our financial condition and results of operations. Price increases from these third-party launch providers could negatively impact our business model and profitability. Additionally, errors or defects in launch services provided by these launch service providers could have a material adverse impact on our reputation and future prospects.
Currently there are only a handful of companies who offer launch services, and if this sector of the space industry does not grow or there is consolidation among these companies, we may not be able to secure space on a launch vehicle or such space may be more costly.
Our vehicles are expected to provide “last-mile” transport for satellites to their custom orbit after they are released at a drop off point in space. Therefore, we are dependent on third-party launch vehicles to deliver our vehicles into space. If the number of companies offering launch services or the number of launches does not grow in the future or there is a consolidation among companies who offer these services, this could result in a shortage of space on these launch vehicles, which may cause delays in our ability to meet our customers’ needs. Additionally, a shortage of space available on launch vehicles may cause prices to increase or cause delays in our ability to meet our customers’ needs. Either of these situations could have a material adverse effect on our results of operations and financial condition.
26
Further, in the event that a launch is delayed, our timing for revenue of recognition may be impacted depending on the length of the delay and the nature of the contract with the customers with payloads on such delayed flight. While such delays are common in the space industry, any delay in a launch on which we are booked for missions with paying clients would result in a delay in recognizing revenue which could materially impact our financial statements or result in negative impacts to our earnings during a specified time period, which could have a material effect on our results of operations and financial condition.
We rely on a limited number of suppliers for certain materials and supplied components. We may not be able to obtain sufficient materials or supplied components to meet our manufacturing and operating needs, or obtain such materials on favorable terms or at all, which could impair our ability to fulfill our orders in a timely manner or increase our costs of production. Disruptions in the supply of key raw materials or components and difficulties in the supplier qualification process, as well as increases in prices of raw materials, could adversely impact us.
Our ability to produce our current and future vehicle systems and other components of operation is dependent upon sufficient availability of raw materials and supplied components, which we secure from a limited number of suppliers. Our reliance on suppliers to secure these raw materials and supplied components exposes us to volatility in the prices and availability of these materials. We may not be able to obtain sufficient supplies of raw materials or supplied components on favorable terms or at all, which could result in delays in the manufacture of our vehicles or increased costs.
In addition, we may in the future experience delays in manufacturing or operation as we go through the requalification process with any replacement third-party supplier, as well as the limitations imposed by U.S., international, and foreign trade embargoes as well as import and export controls. The International Traffic in Arms Regulations (“ITAR”), the Export Administration Regulations (“EAR”), or other restrictions on transfer of sensitive services, technologies and data, for example, impose limitations and prohibitions that may impact our international operations and business activities. See “— Terran Orbital’s business is subject to extensive government regulation, which mandates how it may operate its business, may reduce or eliminate its business, and may increase its business costs and prevent its expansion into new markets.”
Moreover, the imposition of tariffs on such raw materials or supplied components could have a material adverse effect on our operations. Prolonged disruptions in the supply of any of our key raw materials or components, difficulty qualifying new sources of supply, implementing use of replacement materials or new sources of supply or any volatility in prices could have a material adverse effect on our ability to operate in a cost-efficient, timely manner and could cause us to experience cancellations or delays of scheduled missions, customer cancellations or reductions in our prices and margins, any of which could harm our business, financial condition and results of operations.
Many raw materials, major components and product equipment items, are procured or subcontracted on a single or sole-source basis. Although we maintain a qualification and performance surveillance process and we believe that sources of supply for raw materials and components are generally adequate, it is difficult to predict what effects shortages or price increases may have in the future. Our ability to manage inventory and meet delivery requirements may be constrained by our suppliers’ inability to scale production and adjust delivery of long-lead time products during times of volatile demand. Our inability to fill our supply needs would jeopardize our ability to fulfill obligations under commercial and government contracts, which could, in turn, result in reduced sales and profits, contract penalties or terminations and damage to customer relationships and could have a material adverse effect on our operating results, financial condition, or cash flows.
Key raw materials used in our operations include metals such as aluminum and titanium, which are usually procured by our suppliers who manufacture parts in accordance with our drawings. We also purchase materials such as chemicals; composites; electronic, electro-mechanical and mechanical components; subassemblies; and subsystems that are integrated with the manufactured parts for final assembly into finished products and systems. We are impacted by increases in the prices of raw materials used in production on fixed-price business.
We monitor sources of supply to attempt to assure that adequate raw materials and other supplies needed in manufacturing processes are available.
27
Prolonged disruptions in the supply of any of our key raw materials or components, difficulty completing qualification of new sources of supply, implementing use of replacement materials, components or new sources of supply, or a continuing increase in the prices of raw materials, energy or components could have a material adverse effect on our operating results, financial condition, or cash flows.
Our business plans are predicated on our ability to vertically integrate our production process, bringing certain component manufacturing processes
in-house
(for example, the production of printed circuit boards) which we do not produce today and which we may not be able to successfully or cost-effectively produce in the future.We are in discussions to lease property for and build the Space Florida Facility. Subject to raising additional funding, we plan to vertically integrate most all of our supply chain by relocating certain of our existing satellite manufacturing, assembly, integrating and testing to our new facility and adding additional capabilities including the production and test of printed circuit boards after we enter into a definitive lease agreement. Transferring satellite manufacturing, assembly, integrating and testing and building out new capabilities to our new manufacturing location will also require significant capital expenditures, including the installation and/or transplantation of complex manufacturing equipment and processes and to hire and train a new workforce. If we are unable to manage this transfer and training smoothly and comprehensively, we may fail to meet our objective of near full vertical integration and could suffer delays in recognizing efficiencies, manufacturing and supply chain delays, adverse impacts on the developments of our NextGen Earth Observation constellation, product quality and delivery schedules, harm to our reputation with our customers, and loss of customers. If we are unable to successfully manage the relocation or initiation of the manufacture of these products, our business, financial condition and results of operations could be harmed.
We may be negatively affected by global economic conditions or geopolitical factors.
Our operations and performance depend significantly on worldwide economic conditions.
Uncertainty about global economic conditions and geopolitical factors, including the current conflict in Ukraine, poses a risk as individual consumers, businesses and governments may postpone spending in response to tighter credit, negative financial news, declines in income or asset values, or budgetary constraints. Reduced demand could cause a significant delay in the launch of our satellites or the development of the NextGen Earth Observation constellation which in turn could cause a decline in our anticipated future revenue and make it more difficult to operate profitably in the future, potentially compromising our ability to pursue our business plan. We expect our future growth rate will be affected by the condition of the global economy, increased competition, maturation of the satellite solutions industry, and the difficulty in sustaining high growth rates as it increases in size.
We may experience setbacks during our commercial and government satellite missions, which could have a material adverse effect on our business, financial condition and results of operation and could harm our reputation.
The success of our satellite solutions business will depend on our ability to successfully and regularly deliver customer satellites. While we have built operational processes to ensure that the design, manufacture, performance and servicing of our
in-space
vehicles meet rigorous performance goals, there can be no assurance that we will not experience operational or process failures and other problems during our inaugural mission or on any other mission. Any failures or setbacks could harm our reputation and have a material adverse effect on our business, financial condition and results of operation.Our business may be adversely affected if we are unable to maintain or protect our intellectual property rights from unauthorized use by third parties.
Failure to adequately maintain or protect Terran Orbital’s intellectual property rights could result in Terran Orbital’s competitors offering similar or competitive services and products, potentially resulting in the loss of some of Terran Orbital’s competitive advantage and a decrease in its revenue, which would adversely affect its business, prospects, financial condition and operating results. Terran Orbital’s success depends, at least in part, on its ability to maintain and protect its core technology and intellectual property and to keep its use of licenses. To accomplish this, Terran Orbital relies on a combination of trade secrets (including
know-how),
employee and third-party nondisclosure agreements, trademarks, intellectual property licenses and other contractual rights to establish and protect its rights in its technology assets.28
The maintenance and protection of Terran Orbital’s intellectual property rights will be important to its future business opportunities. However, the measures Terran Orbital takes to protect its intellectual property from unauthorized use by others may not be effective for various reasons, including the following:
| • | any patent applications Terran Orbital submits may not result in the issuance of patents; |
| • | Terran Orbital’s employees or business partners may breach their inventions assignment, non- disclosure, arbitration and, anon-compete obligations to Terran Orbital; |
| • | third-parties may independently develop or acquire technologies that are the same or similar to Terran Orbital’s; |
| • | the costs associated with enforcing patents, confidentiality and invention agreements or other intellectual property rights may make enforcement impracticable; |
| • | U.S. government restrictions on government contractors retaining intellectual property; and |
| • | current and future competitors may circumvent Terran Orbital’s intellectual property. |
Patent, trademark, copyright and trade secret laws vary throughout the world. Some foreign countries do not protect intellectual property rights to the same extent as do the laws of the U.S. Further, policing the unauthorized use of Terran Orbital’s intellectual property in foreign jurisdictions may be difficult.
Therefore, Terran Orbital’s intellectual property rights may not be as strong or as easily enforced outside of the U.S. In addition, Terran Orbital may have difficulty enforcing its rights against a competitor where an infringement occurs in outer space.
Our intellectual property may become subject to claims that our devices or services violate the patent or intellectual property rights of others, which could be costly and disruptive to our business.
Terran Orbital cannot be certain that it is the first inventor of the subject matter to which it has filed a particular patent application, or if it is the first party to file such a patent application. If another party has filed a patent application to the same subject matter as Terran Orbital has, Terran Orbital may not be entitled to the protection sought by the patent application. Terran Orbital also cannot be certain whether the claims included in a patent application will ultimately be allowed in the applicable issued patent. Further, the scope of protection of issued patent claims is often difficult to determine. As a result, Terran Orbital cannot be certain that the patent applications that it files will issue, or that its issued patents will afford protection against competitors with similar technology. In addition, Terran Orbital’s competitors may design around Terran Orbital’s issued patents, which may adversely affect Terran Orbital’s business, prospects, financial condition and operating results.
Terran Orbital operates in an industry that is susceptible to significant intellectual property litigation. Although Terran Orbital maintains insurance to cover cost of intellectual property litigation, the defense of intellectual property suits is both costly and time-consuming, even if ultimately successful, and may divert management’s attention from other business concerns. An adverse determination in litigation to which Terran Orbital may become a party could, among other things:
| • | subject it to significant liabilities to third parties, including lost profits and treble damages that are not covered by insurance; |
| • | require disputed rights to be licensed from a third party for royalties that may be substantial; |
| • | require it to cease using technology that is important to its business; |
| • | prohibit it from selling some or all of its devices or offering some or all of its services; or |
| • | Terran Orbital’s customized hardware and software may be difficult and expensive to service, upgrade or replace. |
29
Some of the hardware and software Terran Orbital uses in operating its solutions, including its NextGen Earth Observation constellation is significantly customized and tailored to meet Terran Orbital’s requirements and specifications and could be difficult and expensive to service, upgrade or replace. Although Terran Orbital expects to maintain inventories of some spare parts, it nonetheless may be difficult, expensive or impossible to obtain replacement parts for the hardware due to a limited number of those parts being manufactured to its requirements and specifications. In addition, Terran Orbital’s business plan contemplates updating or replacing some of the hardware and software in its network as technology advances, but the complexity of its requirements and specifications may present Terran Orbital with technical and operational challenges that complicate or otherwise make it expensive or infeasible to carry out such upgrades and replacements. If Terran Orbital is not able to suitably service, upgrade or replace its equipment, Terran Orbital’s ability to provide its services and therefore to generate revenue could be harmed.
Any significant disruption in or unauthorized access to our computer systems and other technology or those of our customers, partners and other third parties that we utilize in our operations, could result in a loss or degradation of service, unauthorized disclosure of data, or theft or tampering of intellectual property, any of which could materially adversely impact our business.
Our operations, products, services, data and intellectual property are inherently at risk of loss, inappropriate access, or tampering by both insider threats and external bad actors. In particular, our operations face various cyber and other security threats, including attempts to gain unauthorized access to sensitive information, intellectual property, mission operations, systems and networks. Our systems (internal, customer and partner systems) and assets may also be subject to damage or interruption from natural and other disaster events or disruptions including tsunamis, hurricanes, floods, earthquakes, fires, water shortages, other extreme weather conditions, epidemics or pandemics, acts of terrorism, power shortages and blackouts, aging infrastructures and telecommunications failures. In addition, insider threats, threats to the safety of our directors and employees, threats to the security of our facilities, infrastructure and supply chain and threats from terrorist acts or other acts of aggression could have a material adverse impact on our business.
The products, and services that we develop and deliver to our customers are also at risk of disruption, loss, or tampering. The integrity of the data, information and analysis in our products and services is at risk of being manipulated either before or after delivery to a customer. Our products with derived information characteristics are also at risk of being incorrect due to deceptive practices by others or errors.
Our customers and partners (including our supply chain) face similar threats. Customer or partner proprietary, classified, or sensitive data and information transmitted to, from, or stored on our networks are at risk. Assets and intellectual property and products in customer or partner environments are also at risk. We also have risk where we have access to customer and partner networks and face risks of breach, disruption or loss as well. Our supply chain for products and services is becoming more diverse and therefore that risk is also growing.
While we have implemented reasonable measures consistent with government regulations, including aimed at reducing the risk of cyber threats as well as to help thwart bad actors and protect our data and our systems and assets, the techniques used to gain unauthorized access are constantly evolving, and we may be unable to anticipate or prevent all unauthorized access, disruption, loss, or harm. Because of our highly desired data, intellectual property and our support of the U.S. government and other governments, we (and/or partners we use) may be a particularly attractive target for such attacks, including by hostile foreign governments. From time to time, we have experienced attacks on our systems from bad actors that, to date, have not had a material adverse effect on our business. We cannot offer assurances, however, that future attacks will not materially adversely affect our business or reputation.
Recently, there have been reported a number of significant, widespread cybersecurity attacks and breaches that have compromised network integrity for many companies and governmental agencies, in some cases reportedly originating from outside the United States. In addition, there are reportedly private products available in the market today be used to that may attempt to unlawfully intercept communications made using both public and private networks. Terran Orbital may be required to expend significant resources to respond to, contain, remediate, and protect against these attacks and threats, including compliance with applicable data breach and data security laws and regulations, and to alleviate problems, including reputational harm and litigation, caused by these data security incidents. In addition, in the event of such a data security incident, Terran Orbital’s customer contracts may not adequately protect it against liability to third parties with whom its customers conduct business. Although Terran Orbital has implemented security measures, these measures may prove to be inadequate. Any security incidents could have a significant effect on Terran Orbital’s systems, devices and services, including system failures and delays that could limit network availability, which could harm its business and its reputation and result in substantial liability.
30
We use software that we have developed, which we seek to continually update and improve. Upgrading, improving, and replacing such software or our systems is often time-consuming and expensive and can disrupt daily business operations. Further, we may not always be successful in executing these upgrades and improvements, which may occasionally result in periodic interruptions or a failure of our systems, or could introduce vulnerabilities into our software or systems. Any interruptions or failure of our systems could harm our business, reputation and ability to execute on our business plan, which could materially adversely affect our results of operations.
A cyber security incident or other significant disruption of our operations, products, or services could:
| • | disrupt the proper functioning of our networks, applications and systems and therefore our operations and/or those of certain of our customers, or partners; |
| • | result in the unauthorized access to, and destruction, loss, theft, misappropriation or release of, our or our customers’ or partners’ proprietary, confidential, sensitive or otherwise valuable information, including trade secrets, which others could use to compete against us or for disruptive, destructive or otherwise harmful purposes and outcomes; |
| • | destroy or degrade assets including space, ground and intellectual property assets; |
| • | manipulate or tamper with our products, solutions, analysis, or other systems delivered to our customers or partners; |
| • | result in fines, civil and criminal penalties, or debarment; |
| • | compromise other sensitive government functions; and |
| • | damage our reputation with our customers (particularly agencies of various governments) and the public generally. |
A security event that involves classified or other sensitive government information or certain controlled unclassified information, could subject us to civil or criminal penalties and could result in loss of our secure facility clearance and other accreditations, loss of our government contracts, loss of access to classified information, loss of export privileges or debarment as a government contractor. The risk that these types of events could seriously harm our business is likely to increase as we expand the number of products and services we offer, or increase the number of countries within which we do business.
Security problems with our networks, data processing systems, software products, and systems or services including those of our third-party providers may be vulnerable to security risks, could cause increased cyber-security protection costs and general service costs, harm our reputation, and result in liability and increased expense for litigation, regulatory fines and diversion of management time.
We process and retain large amounts of sensitive data. We have included security features in our products and processes that are intended to protect the privacy and integrity of data, including confidential client data. Security of our products, process and services is critical given the confidential nature of the information contained in our systems. We also rely on employees and contractors in our network operations centers, data centers, and support operations to follow our procedures when handling such information.
However, our network and those of our partners, third-party service providers, banks, and our customers are vulnerable to unauthorized access, ransomware, computer viruses and other security problems. It is possible that our security controls, our selection and training of employees or contractors, and other practices we follow may not prevent the improper disclosure of information. Persons who circumvent security measures could wrongfully obtain or use information on the network or cause interruptions, delays or malfunctions in our operations, or
31
misappropriation of assets, any of which could have a material adverse effect on our business, financial condition and results of operations. Also, such disclosure could harm our reputation and subject us to liability in regulatory proceedings and private litigation, resulting in increased costs or loss of revenue. Improper disclosure of customer data could result in lawsuits or regulatory proceedings alleging damages and perceptions that our products and services do not adequately protect the privacy of customer data and could inhibit sales of our products and services. In addition, our customer and vendor contracts may not sufficiently protect us against third-party claims related to an incident.
Defending these types of claims could result in increased expenses for litigation and claims settlement and a significant diversion of our management’s attention.
Additionally, our software products, the systems on which the products are used, and our processes are not impervious to intentional
break-ins
(“hacking”), email spoofing, phishing, ransomware, cyber-attacks or other disruptive disclosures or problems, whether as a result of inadvertent third-party action, employee action, malfeasance, or otherwise. Hacking, email spoofing, phishing, ransomware, cyber-attacks or other disruptive problems have resulted, and could result, in the diversion of our development resources, damage to our reputation, increased cyber-security protection costs and general service costs. Cyber-security risks may be increased while many of our personnel and those of our third-party providers are working remotely due to theCOVID-19
pandemic. While we have experienced, and expect to continue to experience, threats and attacks on our networks and data processing systems seeking to gain unauthorized access to our systems or data or to cause disruptions in service, based on information known to date, past threats and attacks have not had a material impact on our business, financial condition or results of operations. Although we have implemented, and intend to continue to implement, security measures, these measures may prove to be inadequate to manage these risks, and could have a material adverse effect on our business, financial condition and results of operation.System security and data breaches or cyber security incidents, as well as cyber-attacks could disrupt and damage our business, reputation and brand and substantially harm our business and results of operations.
Cyber-attacks,attacks, ransomware attacks, business email compromises, computer malware, viruses and social engineering (including phishing) could lead to disruption in our operations and harm to our operations. If our data, systems or network infrastructure were to fail, or if we were to suffer an interruption or degradation of services in our data center, third-party cloud, physical facilities or other infrastructure environments, we could lose important manufacturing, technical and other confidential or sensitive data, which could harm our business. Our facilities, as well as the facilities of third-parties that maintain or have access to our data, assets and network infrastructure, are vulnerable to damage or interruption from earthquakes, tsunamis, hurricanes, floods, fires, cybersecurity attacks, terrorist attacks, power losses, telecommunications failures and similar events. In the event that our or any third-party provider’s systems or service abilities are hindered by any such events, our ability to operate may be impaired. Our data center, third-party cloud, and managed service provider infrastructure also could be subject to
denial-of-service
break-ins,
cyberattacks, sabotage, intentional acts of vandalism and other misconduct, from a spectrum of actors ranging in sophistication from threats common to most industries to more advanced and persistent, highly organized adversaries, including state-sponsored acts. Any security breach, including personal data breaches, or security incidents, that we experience could result in unauthorized access to, misuse of or unauthorized acquisition of our internal sensitive corporate or confidential data, such as financial data, intellectual property, or data collected for or related to contracts with commercial or government customers or partners. Such unauthorized access, misuse, acquisition, or modification of such data may result in data loss, corruption or alteration, interruptions in our operations or damage to our computer hardware or systems or those of our employees and customers, and may increase our costs, trigger contractual obligations or regulatory fines, penalties or scrutiny and could lead to a loss of contracts with commercial or government customers or partners. Moreover, negative publicity arising from these types of disruptions could damage our reputation, limiting our ability to secure future contracts. Breaches of data security or significant unavailability of our services due to attacks could cause users to cease using our services and materially and adversely affect our business, prospects, financial condition and results of operations.Our disaster recovery plans, or those of our third-party providers, may be inadequate to restore our operations, or mitigate the harm or losses that could occur.
32
The market may not accept our Earth Observation Solutions and related products and services.
We cannot accurately predict whether our products and services will achieve significant market acceptance or whether there will be a market for our products and services on terms we find acceptable. Market acceptance of our SAR imagery and related products and services depends on a number of factors, including the quality, scope, timeliness, sophistication, price and the availability of substitute products and services. Lack of significant market acceptance of our offerings, or other products and services that utilize our imagery, delays in acceptance, failure of certain markets to develop or our need to make significant investments to achieve acceptance by the market would negatively affect our business, financial condition and results of operations. If we are unable to achieve sustained growth, we may be unable to execute our business strategy, expand our business or fund other liquidity needs and our business prospects, financial condition and results of operations could be materially and adversely affected.
Natural disasters, acts of God, unusual weather conditions, epidemic outbreaks, terrorist acts, supply chain interruptions and geopolitical events could disrupt our business, including our vehicle launch schedules.
The occurrence of one or more natural disasters or acts of God such as fires, floods and earthquakes, unusual weather conditions, epidemic or pandemic outbreaks, terrorist attacks or disruptive political events where our facilities or the launch facilities our transport partners use are located, or where our third-party suppliers’ facilities are located, could adversely affect our business. Natural disasters including tornados, hurricanes, floods and earthquakes may damage our facilities, the launch facilities we use or those of our suppliers, which could have a material adverse effect on our business, financial condition and results of operations. Severe weather, such as rainfall, snowfall or extreme temperatures, may impact the ability for launches to occur as planned, resulting in additional expense to reschedule, thereby reducing our sales and profitability. Terrorist attacks, actual or threatened acts of war or the escalation of current hostilities, or any other military or trade disruptions impacting our domestic or foreign suppliers of components of our products, may impact our operations by, among other things, causing supply chain disruptions and increases in commodity prices, which could adversely affect our raw materials or transportation costs. These events also could cause or act to prolong an economic recession or depression in the United States or abroad, such as the current business disruption and related financial impact resulting from the global
COVID-19
health crisis. To the extent these events also impact one or more of our suppliers or result in the closure of any of their facilities or our facilities, we may be unable to maintain launch schedules or fulfill our other contracts.Our employees and contractors may engage in misconduct or other improper activities, which could have an adverse effect on our business, prospects, financial condition and operating results.
We are exposed to the risk that our employees and contractors may engage in misconduct or other illegal activity. Misconduct by these parties could include intentional, reckless or negligent conduct or other activities that violate U.S. and international laws and regulations. It is not always possible to identify and deter misconduct by employees and other third parties, and the precautions we take to detect and prevent this activity may not be effective in controlling unknown or unmanaged risks or losses or in protecting us from governmental investigations or other actions or lawsuits stemming from a failure to be in compliance with such laws or regulations. In addition, we are subject to the risk that a person or government could allege such fraud or other misconduct, even if none occurred. If any such actions are instituted against us, and we are not successful in defending ourselves or asserting our rights, those actions could have a significant impact on our business, prospects, financial condition and operating results, including, without limitation, the imposition of significant civil, criminal and administrative penalties, damages, monetary fines, disgorgement, integrity oversight and reporting obligations to resolve allegations of
non-compliance,
imprisonment, other sanctions, contractual damages, reputational harm, diminished profits and future earnings and curtailment of our operations, any of which could have a material adverse effect on our business, financial condition and results of operations.Our revenue, results of operations and reputation may be negatively impacted if our programs fail to meet contractual requirements or if our products contain defects or fail to operate in the expected manner.
We sell complex and technologically advanced systems, including satellites, products, hardware and software. Sophisticated software, including software developed by us, may contain defects that can unexpectedly interfere with the software’s intended operation. Defects may also occur in components and products that we manufacture or purchase from third parties. Most of the satellites and systems we have developed must function under demanding and unpredictable operating conditions and in harsh and potentially destructive environments. In addition, we may agree to the
in-orbit
delivery of a satellite, adding further risks to our ability to perform under a contract. Failure to achieve successfulin-orbit
delivery could result in significant penalties and other obligations on us.33
We employ sophisticated design and testing processes and practices, which include a range of stringent factory and
on-site
acceptance tests with criteria and requirements that are jointly developed with customers. Our systems may not be successfully implemented, pass required acceptance criteria, or operate or give the desired output, or we may not be able to detect and fix all defects in the satellites, products, hardware and software we sell or resolve any delays or availability issues in the launch services we procure. Failure to do so could result in increased costs, lost revenue and damage to our reputation and may adversely affect our ability to win new contract awards. Terran Orbital manufactures satellites with the intention of receiving full contractual value for builds; however, due to the inherent complexity, a number of adverse variables could negatively impact Terran Orbital’s ability to collect on the full amount of contractual consideration. Such variables include, among others, schedule delays, including those caused by suppliers or major subcontractors, contractual disputes, failure to meet technological requirements and customer solvency concerns. These variables could lead to termination for convenience or default on our contracts which could have a material adverse effect on our financial results. We have experienced significant delays in the building of certain satellites. We are currently experiencing a number of schedule delays, some of which are significant, in our satellite builds due to a number of factors, inclusive ofCOVID-19
delays, subcontractor issues and technological requirements and we are working closely with our customers as we continue to address these delays. We may, where appropriate, assert force majeure provisions in our contracts but these can be subject to dispute.Satellites are subject to construction and launch delays, launch failures, damage or destruction during launch, the occurrence of which can materially and adversely affect our operations. We may not be able to secure the launch of our satellites successfully or in a timely manner. Loss of a satellite during launch could delay or impair our ability to offer services or reduce our expected potential revenues, and launch insurance, even if it is available, will not fully cover this risk.
Delays in the construction of future satellites and the procurement of requisite components and launch vehicles, limited availability of appropriate launch windows, possible delays in obtaining regulatory approvals, satellite damage or destruction during launch, launch failures, or incorrect orbital placement could have a material adverse effect on our business, financial condition and results of operations. The loss of, or damage to, a satellite due to a launch failure could result in significant delays in anticipated revenue to be generated by that satellite. Any significant delay in the commencement of service of a satellite would delay or potentially permanently reduce the revenue anticipated to be generated by that satellite. In addition, if the loss of a satellite were to occur, we may not be able to accommodate affected customers with our other satellites or data from another source until a replacement satellite is available, and we may not have on hand, or be able to obtain in a timely manner, the necessary funds to cover the cost of any necessary satellite replacement. Any launch delay, launch failure, underperformance, delay or perceived delay could have a material adverse effect on our results of operations, business prospects and financial condition.
Competition within our markets and bid protests may affect our ability to win new contracts and result in reduced revenues and market share.
We operate in highly competitive markets and our competitors may have more financial capacity, more extensive or specialized engineering, manufacturing, or marketing capabilities in some areas, or be willing to accept more risk or lower profitability in competing for contracts. In some instances outside the U.S., foreign companies may receive loans, marketing subsidies and other assistance from their governments that may not be available to U.S. companies and foreign companies may be subject to fewer restrictions on technology transfer. We are also seeing a significant number of bid protests from unsuccessful bidders on new program awards. Bid protests can result in contract modifications or an award decision being reversed and loss of a contract award. Even where a bid protest does not result in the loss of an award, the resolution can extend the time until the contract activity can begin, and delay earnings.
If we are unable to continue to compete successfully against our current or future competitors, or prevail in protests, or to prevail against other attempts to interfere with our ability to obtain and retain awards, we may experience declines in future revenues.
34
We face competition that may cause us to have to either reduce our prices for satellites, launch planning services, mission operation, Earth observation imagery, data and related products and services or to lose market share.
Our products and services compete with satellite and aerial imagery and related products and services offered by a range of private and government providers. Our current or future competitors may have superior technologies or greater financial, personnel and other resources than we have. The value of our imagery may also be diluted by Earth imagery that is available free of charge.
The U.S. government and foreign governments may develop, construct, launch and operate their own imagery satellites, which could reduce their need to rely on us and other commercial suppliers. In addition, such governments could sell or provide free of charge Earth imagery from their satellites and thereby compete with our imagery products and services. Also, governments may at times make our imagery freely available for humanitarian purposes, which could impair our revenue growth with
non-governmental
organizations.These governments could also subsidize the development, launch and operation of imagery satellites by our current or future competitors.
Our competitors or potential competitors could, in the future, offer satellite-based imagery, satellites, launch planning services, mission operations services, or other products and services with more attractive features than our products and services. The emergence of new remote imaging technologies or the continued growth of
low-cost
imaging satellites, could negatively affect our marketing efforts. More importantly, if competitors develop and launch satellites or other imagery-content sources with more advanced capabilities and technologies than ours, or offer products and services at lower prices than ours, our business and results of operations could be harmed. Due to competitive pricing pressures, such as new product introductions by us or our competitors or other factors, the selling price of our products and services may further decrease. If we are unable to offset decreases in our average selling prices by increasing our sales volumes or by adjusting our product mix, our revenue and operating margins may decline and our financial position may be harmed.We operate in highly competitive industries and in various jurisdictions across the world, which may cause us to have to reduce our prices.
We operate in highly competitive industries and many of our competitors are larger and have substantially greater resources than we have. Our primary competitors for satellite manufacturing contracts include L3Harris Technologies, Raytheon Technologies, Northrop Grumman, General Atomics Defense, Blue Canyon Technologies, Millennium Space Systems and York Space Systems. We may also face competition in the future from emerging
low-cost
competitors. Competition in our Imaging and Services business is highly diverse, and while our competitors offer different products, there is often competition for contracts that are part of governmental budgets. Our major existing and potential competitors for our Earth Observation Solutions segment include commercial satellite imagery companies, state-owned imagery providers, aerial imagery companies, free sources of imagery and unmanned aerial vehicles. Our Earth Observation Solutions segment faces competition from companies that provide geospatial analytic information and services to the U.S. government and other customers which we may target, including Maxar Technologies, Imagesat, RADARSAT,e-GEOS,
Planet, Satellogic, Blacksky, Capella Space, ICEYE and Umbra.In addition, some of our foreign competitors currently benefit from, and others may benefit in the future from, protective measures by their home countries where governments are providing financial support, including significant investments in the development of new technologies. Government support of this nature greatly reduces the commercial risks associated with satellite development activities for these competitors. This market environment may result in increased pressures on our pricing and other competitive factors.
Changes in tax laws may materially adversely affect our business, prospects, financial condition and operating results.
New income, sales, use or other tax laws, statutes, rules, regulations or ordinances could be enacted at any time, which could adversely affect Terran Orbital’s business, prospects, financial condition and operating results. Further, existing tax laws, statutes, rules, regulations or ordinances could be interpreted, changed, modified or applied adversely to Terran Orbital. For example, U.S. federal tax legislation enacted in 2017, informally titled the Tax Cuts
35
and Jobs Act (the “Tax Act”), enacted many significant changes to the U.S. tax laws. Future guidance from the IRS with respect to the Tax Act may affect Terran Orbital, and certain aspects of the Tax Act could be repealed or modified in future legislation. The Coronavirus Aid, Relief, and Economic Security Act (the “CARES Act”), has already modified certain provisions of the Tax Act. In addition, it is uncertain if and to what extent various states will conform to the Tax Act, the CARES Act or any newly enacted federal tax legislation. In addition, the Biden administration and members of Congress have proposed various changes to the U.S. federal tax regime, including an increase in the U.S. federal corporate income tax rate from the current 21% rate to, in various proposals, 26.5% or 28%. Congress is currently working on draft legislation, that may include the proposed or other changes to the U.S. federal tax law; however, it is not yet clear what changes will be made or when, or what impact any such changes will have on Terran Orbital.
Our business involves significant risks and uncertainties that may not be covered by insurance.
A significant portion of our business relates to designing, developing and manufacturing advanced space technology products and systems. Although there have been and will continue to be technological advances in spaceflight, it is still an inherently dangerous activity. Explosions and other accidents on launch or during the flight have occurred and will likely occur in the future. If such incident should occur, we will likely experience a total loss of our or our customers’ payloads. The total or partial loss of one or more of our or our customers’ payloads could have a material adverse effect on our results of operations and financial condition. We endeavor to obtain insurance coverage from established insurance carriers to cover these risks and liabilities. However, the amount of insurance coverage that we maintain may not be adequate to cover all claims or liabilities. Existing coverage may be canceled while we remain exposed to the risk and it is not possible to obtain insurance to protect against all operational risks, natural hazards and liabilities.
We have historically insured our satellites to the extent that insurance was available on acceptable premiums and other terms. The insurance proceeds received in connection with a partial or total loss of the functional capacity of any of our satellites would not be sufficient to cover the replacement cost, if we choose to do so, of an equivalent high-resolution satellite. In addition, this insurance will not protect us against all losses to our satellites due to specified exclusions, deductibles and material change limitations and it may be difficult to insure against certain risks, including a partial deterioration in satellite performance and satellite
re-entry.
The price and availability of insurance fluctuate significantly. Although we have historically been able to obtain insurance coverage for
in-orbit
satellites, we cannot guarantee that we will be able to do so in the future. We intend to maintain insurance for our operating satellites, but any determination we make as to whether to obtain insurance coverage will depend on a variety of factors, including the availability of insurance in the market, the cost of available insurance and the redundancy of our operating satellites.Insurance market conditions or factors outside our control at the time we are in the market for the required insurance, such as failure of a satellite using similar components, could cause premiums to be significantly higher than current estimates and could reduce amounts of available coverage. The cost of our insurance has been increasing and may continue to increase. Higher premiums on insurance policies will reduce our operating income by the amount of such increased premiums. If the terms of
in-orbit
insurance policies become less favorable than those currently available, there may be limits on the amount of coverage that we can obtain, or we may not be able to obtain insurance at all.In addition, even though we carry business interruption insurance policies, any business interruption losses could exceed the coverage available or be excluded from our insurance policies. Any disruption of our ability to operate our business could result in a material decrease in our revenues or significant additional costs to replace, repair or insure our assets, which could have a material adverse impact on our financial condition and results of operations.
Legacy Terran Orbital identified material weaknesses in its internal control over financial reporting as of December 31, 2021 which continued to exist as of March 31, 2022 and, as a result, Legacy Terran Orbital and Terran Orbital have determined that their disclosure controls and procedures were not effective as of December 31, 2021 and March 31, 2022, respectively. If Terran Orbital is unable to remediate these material weaknesses, or if it identifies additional material weaknesses in the future or otherwise fails to maintain effective internal control over financial reporting, it may not be able to accurately or timely report its financial condition or results of operations, which may adversely affect Terran Orbital’s business, stock price and operating results.
36
In connection with the preparation and audit of Legacy Terran Orbital’s financial statements, material weaknesses were identified in Legacy Terran Orbital’s internal control over financial reporting. A material weakness is a deficiency, or a combination of deficiencies, in internal control over financial reporting such that there is a reasonable possibility that a material misstatement of its annual or interim financial statements will not be prevented or detected on a timely basis. These material weaknesses are as follows:
| • | Legacy Terran Orbital did not design and maintain an effective control environment commensurate with its financial reporting requirements. Specifically, it lacked a sufficient number of professionals with an (i) appropriate level of accounting knowledge, training and experience to appropriately analyze, record and disclose accounting matters timely and accurately, and (ii) appropriate level of knowledge, training and experience to establish effective processes and controls. Additionally, the limited personnel resulted in an inability to consistently establish appropriate authorities and responsibilities in pursuit of financial reporting objectives, as demonstrated by, among other things, insufficient segregation of duties in its finance and accounting functions. |
This material weakness in the control environment contributed to the following additional material weaknesses:
| • | Legacy Terran Orbital did not design and maintain an effective risk assessment process at a precise enough level to identify new and evolving risks of material misstatement in its financial statements. Specifically, changes to existing controls or the implementation of new controls have not been sufficient to respond to changes to the risks of material misstatement to financial reporting. |
| • | Legacy Terran Orbital did not design and maintain formal accounting policies, procedures and controls to achieve complete, accurate and timely financial accounting, reporting and disclosures, including controls over the preparation and review of business performance reviews, account reconciliations and journal entries. |
| • | Legacy Terran Orbital did not design and maintain effective controls to address the identification of and accounting for complex revenue transactions, including the proper application of U.S. GAAP related to such transactions. Specifically, it did not design and maintain controls over the accurate recording of progress towards completion on loss contracts, subsequent to initial loss recognition. |
| • | Legacy Terran Orbital did not design and maintain effective controls over the accounting for inventory in accordance with U.S. GAAP. Specifically, it did not design and maintain effective controls over complete and accurate inventory costing, appropriate capitalization of inventoriable costs, or classification of inventory between raw materials, work-in-process |
These material weaknesses resulted in material audit adjustments to inventory, revenue, cost of sales, research and development and operating expenses, accounts payable and accruals, and property and equipment account balances and disclosures in the consolidated financial statements in prior periods. Additionally, each of the material weaknesses described above could result in a misstatement of substantially all account balances or disclosures that would result in a material misstatement to the annual or interim consolidated financial statements that would not be prevented or detected.
Legacy Terran Orbital did not design and maintain effective controls over information technology (“IT”) general controls for information systems that are relevant to the preparation of their financial statements. Specifically, Legacy Terran Orbital did not design and maintain:
| • | user access controls to ensure appropriate segregation of duties and that adequately restrict user and privileged access to financial applications, programs, and data to appropriate company personnel; |
| • | program change management controls to ensure that IT program and data changes affecting financial IT applications and underlying accounting records are identified, tested, authorized, and implemented appropriately; |
| • | computer operations controls to ensure that data backups are authorized and monitored; and |
37
| • | testing and approval controls for program development to ensure that new software development is aligned with business and IT requirements. |
The IT deficiencies noted above did not result in a misstatement to the consolidated financial statements, however, the deficiencies, when aggregated, could impact maintaining effective segregation of duties, as well as the effectiveness of
IT-dependent
controls (such as automated controls that address the risk of material misstatement to one or more assertions, along with the IT controls and underlying data that support the effectiveness of system-generated data and reports) that could result in misstatements potentially impacting all financial statement accounts and disclosures that would not be prevented or detected. Accordingly, management has determined these deficiencies in the aggregate constitute a material weakness.Terran Orbital has begun implementation of a plan to remediate these material weaknesses described above. Those remediation measures are ongoing and include (i) hiring additional accounting and IT personnel to bolster its technical reporting, transactional accounting, internal controls and IT capabilities; (ii) designing and implementing controls to formalize roles and review responsibilities and designing and implementing formal controls over segregation of duties; (iii) designing and implementing a formal risk assessment process to identify and evaluate changes in Terran Orbital’s business and the impact on its internal controls; (iv) designing and implementing controls to formally assess complex accounting transactions and other technical accounting and financial reporting matters; (v) designing and implementing formal processes, accounting policies, procedures, and controls supporting Terran Orbital’s financial close process, including completion of business performance reviews, creating standard balance sheet reconciliation templates and journal entry controls; and (vi) designing and implementing IT general controls, including controls over change management, the review and update of user access rights and privileges, controls over data backups, and controls over program development efforts.
While Terran Orbital believes these efforts will remediate the material weaknesses, Terran Orbital may not be able to complete its evaluation, testing or any required remediation in a timely fashion, or at all. Terran Orbital cannot assure you that the measures it has taken to date and may take in the future, will be sufficient to remediate the control deficiencies that led to its material weaknesses in internal control over financial reporting or that they will prevent or avoid potential future material weaknesses. The effectiveness of Terran Orbital’s internal control over financial reporting is subject to various inherent limitations, including cost limitations, judgments used in decision making, assumptions about the likelihood of future events, the possibility of human error and the risk of fraud. Any failure to design or maintain effective internal controls over financial reporting or any difficulties encountered in their implementation or improvement could increase compliance costs, negatively impact share trading prices, or otherwise harm Terran Orbital’s operating results or cause it to fail to meet its reporting obligations.
The Company’s management has limited experience in operating a public company.
Certain of our executive officers have limited experience in the management of a publicly traded company. Terran Orbital’s management team may not successfully or effectively manage its transition to a public company that will be subject to significant regulatory oversight and reporting obligations under federal securities laws. Their limited experience in dealing with the increasingly complex laws pertaining to public companies could result in an increasing amount of their time that may be devoted to these activities which will result in less time being devoted to the management and growth of its NextGen Earth Observation constellation. Terran Orbital may not have adequate personnel with the appropriate level of knowledge, experience and training in the accounting policies, practices or internal control over financial reporting required of public companies in the U.S. Terran Orbital is in the process of upgrading its finance and accounting systems to an enterprise system suitable for a public company, and a delay could impact its ability or prevent it from timely reporting its operating results, timely filing required reports with the SEC and complying with Section 404 of The Sarbanes — Oxley Act of 2002. The development and implementation of the standards and controls necessary for Terran Orbital to achieve the level of accounting standards required of a public company in the U.S. may require costs greater than expected. It is possible that Terran Orbital will be required to expand its employee base and hire additional employees to support its operations as a public company which will increase its operating costs in future periods.
38
We are highly dependent on the services of Marc Bell, our
co-founder
and Chief Executive Officer, and if we are unable to retain Mr. Bell, as well as attract and retain key employees, qualified management, technical and engineering personnel, our ability to compete could be harmed.Our success depends, in part, on our ability to retain our key personnel. The Company is highly dependent on the services of Marc Bell, our
Co-Founder,
Chairman and Chief Executive Officer. If Mr. Bell was to discontinue his employment with the Company due to death, disability or any other reason, we would be significantly disadvantaged. We do not maintain “key person” life insurance policies on any of our employees, including Mr. Bell. The unexpected loss of or failure to retain one or more of our key employees could adversely affect the Company’s business.Our success also depends, in part, on our continuing ability to identify, hire, attract, train, retain and develop other highly qualified personnel, in particular engineers and government compliance personnel. Experienced and highly skilled employees and/or personnel with required security clearances as discussed in more detail under “—” are in high demand and competition for these qualified employees can be intense. Because our satellites are based on a different technology platform than traditional LEO satellites, individuals with sufficient training in our technology may not be available to hire, and as a result, we will need to expend significant time and expense training the employees we do hire. The Company may not be able to attract, assimilate, develop or retain qualified personnel in the future, and our failure to do so could adversely affect our business, including the execution of our global business strategy. Any failure by our management team and employees to perform as expected may have a material adverse effect on our business, prospects, financial condition and operating results.
We are subject to the U.S. Government’s security requirements, including the DoD’s National Industrial Security Program Operating Manual, for our facility and personnel security clearances, which are prerequisites to our ability to perform on classified contracts and work for the U.S. Government
We face substantial risks associated with our international operations.
Approximately 8% of Terran Orbital’s revenue for the three months ended March 31, 2022 and 19% of Legacy Terran Orbital’s revenue for the for the year ended December 31, 2021, was generated internationally. Terran Orbital’s international operations are headquartered in Torino, Italy, where it also has a manufacturing facility. In addition, Terran Orbital also has an international presence in Oslo, Norway. Terran Orbital also sources supplies from international suppliers. Operating in foreign countries poses substantial risks, including:
| • | difficulties in developing products and services that are tailored to the needs of local customers; |
| • | instability of international economies and governments; |
| • | changes in laws and policies affecting trade and investment in other jurisdictions, including the United Kingdom’s exit from the European Union; |
| • | exposure to varying legal standards, including data privacy, security and intellectual property protection in other jurisdictions; |
| • | difficulties in obtaining required legal and regulatory authorizations; |
| • | difficulties in enforcing legal rights in other jurisdictions; |
| • | local domestic ownership requirements; |
| • | requirements that certain operational activities be performed in-country; |
| • | changing and conflicting national and local regulatory requirements; |
| • | foreign currency exchange rates and exchange controls; and |
| • | ongoing compliance with the U.S. Foreign Corrupt Practices Act, U.S. export controls, anti-money laundering and trade sanction laws, and similar anti-corruption and international trade laws in other countries. |
39
We cannot predict the effect of future exchange rate fluctuations on our business and operating results.
Our international operations are sensitive to currency exchange risks. We anticipate having currency exposure arising from both sales and purchases denominated in foreign currencies, as well as intercompany transactions. Significant changes in exchange rates between foreign currencies in which Terran Orbital anticipates transacting business and the U.S. dollar may adversely affect its results of operations and financial condition.
Terran Orbital’s international operations may subject it to greater than anticipated tax liabilities.
The amount of taxes Terran Orbital pays in different jurisdictions depends on the application of the tax laws of various jurisdictions, including the United States, to its international business activities, changes in tax rates, new or revised tax laws or interpretations of existing tax laws and policies, and its ability to operate its business in a manner consistent with its corporate structure and intercompany arrangements. The taxing authorities of the jurisdictions in which Terran Orbital operates may challenge its methodologies for pricing intercompany transactions pursuant to its intercompany arrangements or disagree with its determinations as to the income and expenses attributable to specific jurisdictions. If such a challenge or disagreement were to occur, and Terran Orbital’s position was not sustained, it could be required to pay additional taxes, interest, and penalties, which could result in
one-time
tax charges, higher effective tax rates, reduced cash flows, and lower overall profitability of its operations. Terran Orbital’s financial statements could fail to reflect adequate reserves to cover such a contingency. Similarly, a taxing authority could assert that Terran Orbital is subject to tax in a jurisdiction where Terran Orbital believes it has not established a taxable connection, often referred to as a “permanent establishment” under international tax treaties, and such an assertion, if successful, could increase its expected tax liability in one or more jurisdictions.Terran Orbital’s ability to use net operating loss carryforwards and other tax attributes may be limited in connection with the business combination or other ownership changes.
Terran Orbital has incurred losses during its history, does not expect to become profitable in the near future, and may never achieve profitability. To the extent that Terran Orbital continues to generate taxable losses, unused losses will carry forward to offset future taxable income, if any, until such unused losses expire, if at all. As of December 31, 2021, we had approximately $91 million and $76 million net operating losses (“NOL”) carryforwards in our federal and state tax jurisdictions, respectively.
Under legislation informally known as the Tax Act, as modified by the Cares Act, U.S. federal net operating loss carryforwards generated in taxable periods beginning after December 31, 2017, may be carried forward indefinitely, but the deductibility of such net operating loss carryforwards in taxable years beginning after December 31, 2020, is limited to 80% of taxable income. It is uncertain if and to what extent various states will conform to the Tax Act or the CARES Act.
In addition, Terran Orbital’s net operating loss carryforwards are subject to review and possible adjustment by the IRS and state tax authorities. Under Sections 382 and 383 of the Code, Terran Orbital’s federal net operating loss carryforwards and other tax attributes (such as research tax credits) may become subject to an annual limitation in the event of certain cumulative changes in the ownership of Terran Orbital. An “ownership change” pursuant to Section 382 of the Code generally occurs if one or more stockholders or groups of stockholders who own at least 5% of a company’s stock increase their ownership by more than 50 percentage points over their lowest ownership percentage within a rolling three-year period. Terran Orbital’s ability to utilize its net operating loss carryforwards and other tax attributes to offset future taxable income or tax liabilities may be limited as a result of ownership changes, including potential changes in connection with the Business Combination or other transactions. Similar rules may apply under state tax laws. Terran Orbital has not yet determined the amount of the cumulative change in its ownership resulting from the Business Combination or other transactions, or any resulting limitations on its ability to utilize its net operating loss carryforwards and other tax attributes. If Terran Orbital earns taxable income, such limitations could result in increased future income tax liability and its future cash flows could be adversely affected.
40
Pursuing strategic transactions may cause us to incur additional risks that may adversely affect our business.
We may pursue acquisitions, joint ventures or other strategic transactions from time to time. We may face costs and risks arising from any such transactions, including integrating a new business into our existing business, managing and integrating differing cultures and/or managing a joint venture. Such transactions could bring new regional or international risks not faced by the Company today. Such acquired businesses, joint ventures or strategic transactions could fail to meet desired financial objectives and cause us to incur losses. Such transactions may change the nature of the business and the vision and goals of the Company to the detriment of the Company. These risks may include adverse legal, organizational and financial consequences, loss of key customers and distributors, and diversion of management’s time and attention.
In addition, any major business combination or similar strategic transaction may require significant additional financing. Further, depending on market conditions, investor perceptions of our Company and other factors, we might not be able to obtain financing on acceptable terms, in acceptable amounts, or at appropriate times to implement any such transaction.
Labor-related matters, including labor disputes, may adversely affect our operations.
Terran Orbital relies on its employees in theoperations of its business. Actual or threatened labor arbitrations, labor grievances, labor disputes, strikes, lockouts, picketing, hand-billing, slowdowns, work stoppages or other labor disputes may disrupt our operations and adversely affect our ability to operate as a business. Such labor disputes and disruptions may result in the loss of market share to competitors and/or have a negative impact on the Company’s brand and corporate image.
day-to-day
In addition, Terran Orbital has experienced shortages of qualified labor in the past and may experience them in the future. Any shortages of qualified labor may have a material adverse effect on Terran Orbital’s business, prospects, financial condition and operating results.
Risks Related to Legal and Regulatory Matters
Our business is subject to extensive government regulation, which mandates how we may operate our business, may reduce or eliminate our business, and may increase our business costs and prevent our expansion into new markets.
Terran Orbital’s business, both as the manufacturer / operator of satellites for others and as the owner / operator of the NextGen Earth Observation constellation, is subject to significant regulation in the United States, including by the Department of Commerce, the Department of Homeland Security, the Department of the Interior, the Department of State, the Department of Labor, the FCC (as defined below), the Federal Aviation Administration, the FTC and others, and in foreign jurisdictions by similar local authorities, including the ITU and NKOM. The Department of Commerce, through the NOAA Commercial Remote Sensing Regulatory Affairs (“CRSRA”) office, also licenses certain commercial private Earth remote sensing satellite systems, such as the NextGen Earth Observation constellation. The rules and regulations of these U.S. and foreign authorities may change, and such authorities may adopt regulations that limit or restrict Terran Orbital’s operations as presently conducted or currently contemplated. Such authorities may also make changes in the licenses of Terran Orbital’s partners or competitors that affect their spectrum, and may significantly affect Terran Orbital’s business. Further, because regulations in each country are different, Terran Orbital may not be aware if some of its partners or persons with whom Terran Orbital does business do not hold the requisite licenses and approvals. Terran Orbital’s failure to provide services in accordance with the terms of its licenses or Terran Orbital’s failure to operate its satellites or ground stations as required by its licenses and applicable laws and government regulations, as well as the failure of customers to attain any necessary licenses, could result in the imposition of government sanctions and/or monetary fines, including the suspension or cancellation of Terran Orbital’s licenses.
Terran Orbital’s ability to provide service to its customers and generate revenues could be harmed by adverse governmental regulatory actions or lack of action.
Terran Orbital’s business is subject to extensive government regulation. Terran Orbital’s ability to secure all requisite governmental approvals is not assured, and the process of obtaining governmental authorizations and permits can be very time consuming, time sensitive and require compliance with a wide array of administrative and procedural rules. A failure by Terran Orbital to obtain required approvals could compromise Terran Orbital’s ability to generate revenue or conduct its business in one or more countries.
41
Terran Orbital’s requests for regulatory approvals may be subject to challenges by adverse parties and these challenges may delay or prevent favorable action. Furthermore, regulatory approvals can be issued subject to conditions that have an adverse effect on the ability of Terran Orbital to implement its business plan.
The government approvals required for Terran Orbital to operate its NextGen Earth Observation constellation need to be periodically renewed and renewal is not guaranteed. The approvals also are subject to revocation, and Terran Orbital may be subject to fines, forfeitures, penalties or other sanctions if any issuing authority were to find that Terran Orbital is not in compliance with the applicable rules, regulations or policies. The regulatory obligations Terran Orbital must meet are complex, vary greatly from country to country, and are subject to interpretation. Terran Orbital cannot give any assurance that the governments will agree with or accept its compliance efforts.
The regulations Terran Orbital and its competitors must adhere to are subject to change by the issuing governmental authorities and there is no guarantee that changes will not be made that are adverse to the business of Terran Orbital. Regulatory changes, such as those resulting from judicial decisions or the adoption of treaties, legislation or regulations in countries where Terran Orbital operates or intends to operate may also significantly affect its business.
Terran Orbital has not yet applied for, and may not receive, certain regulatory approvals that are necessary to its business plan. Terran Orbital will rely on certain regulatory approvals to manufacture, launch, operate and transmit controls and data, the failure to obtain these approvals may impact Terran Orbital’s ability to provide certain goods and services. Foreign Ownership, Control or Influence could negatively impact our ability to obtain certain regulatory approvals.
Terran Orbital may be required to obtain additional approvals from international, national and local authorities in connection with the services that we wish to provide in the future. These authorities may refuse to grant the necessary regulatory approvals in the future, or they may impose conditions on these approvals that we are unable to satisfy. License and other regulatory approvals can include an interagency review of safety, operational, national security, and foreign policy and international obligations implications, as well as a review of foreign ownership. Failure to obtain or retain any necessary regulatory approvals would impair our ability to execute our business plan, and would materially adversely affect our financial condition.
We may become involved in litigation that may materially adversely affect us.
From time to time, we may become involved in various legal proceedings relating to matters incidental to the ordinary course of our business, including intellectual property, commercial, product liability, employment, class action, whistleblower and other litigation and claims, and governmental and other regulatory investigations and proceedings. Such matters can be time-consuming, divert management’s attention and resources, cause us to incur significant expenses or liability or require us to change our business practices. Because of the potential risks, expenses and uncertainties of litigation, we may, from time to time, settle disputes, even where we believe that we have meritorious claims or defenses. Because litigation is inherently unpredictable, we cannot assure you that the results of any of these actions will not have a material adverse effect on our business.
Our share price may be volatile and, in the past, companies that have experienced volatility in the market price of their stock have been subject to securities litigation, including class action litigation. We may be the target of this type of litigation in the future.
Litigation of this type could result in substantial costs and diversion of management’s attention and resources, which could have a material adverse effect on our business, financial condition, and results of operations. Any adverse determination in litigation could also subject us to significant liabilities.
42
Investments in Terran Orbital may be subject to U.S. foreign investment as well as ownership and control regulations which may impose conditions on or limit certain investors’ ability to purchase our common stock, potentially making our common stock less attractive to investors.
Under section 721 of the DPA, the Committee on Foreign Investment in the United States (“CFIUS”) has the authority to conduct national security reviews of certain foreign investments, i.e., “covered transactions.” CFIUS has the authority to initiate reviews of covered transactions, suspend transactions, impose mitigation measures, and recommend that the President block pending transactions or order divestitures of completed transactions when national security concerns cannot be mitigated.
CFIUS has jurisdiction to review transactions that afford a foreign person either “control” in a U.S. business or one or more specific
non-control
rights in a “TID U.S. business.” A “TID U.S. business” is one that (1) produces, designs, tests, manufactures, fabricates, or develops critical technologies; (2) owns or operates critical infrastructure; or (3) collects or maintains sensitive personal data of U.S. citizens. Terran Orbital is a TID U.S. business because it develops and designs “critical technologies,” as defined by the DPA.Proposed or existing investments by investors in Terran Orbital may be subject to CFIUS jurisdiction, and in some cases, may be subject to mandatory filing with CFIUS. In the event CFIUS reviews one or more proposed or existing investments by investors in Terran Orbital, there can be no assurances that such investors will be able to maintain, or proceed with, such investments on terms acceptable to such investors. In addition to prohibiting an investment or requiring an existing investor to divest its investment, CFIUS review may also result in limits on information sharing with such investors, modifications to governance agreements, or annual reporting requirements for Terran Orbital, among other things. These restrictions on the ability of foreign persons to invest in us could limit our ability to engage in strategic transactions that could benefit our stockholders, including a change of control, and could also affect the price that an investor may be willing to pay for our common stock.
We are subject to stringent U.S. export and import control laws and regulations. Unfavorable changes in these laws and regulations or U.S. government licensing policies, our failure to secure timely U.S. government authorizations under these laws and regulations, or our failure to comply with these laws and regulations could have a material adverse effect on our business, financial condition and results of operation.
We are required to comply with U.S. export control laws and regulations, including the ITAR, administered by the U.S. Department of State, Bureau of Political Military Affairs’ directorate of Defense Trade controls (“DDTC”) administered by the U.S. Department of State, and the EAR, administered by the U.S. Department of Commerce’s Bureau of Industry and Security (“BIS”). Pursuant to these foreign trade control laws and regulations, we are required, among other things, to (i) maintain a registration under ITAR, (ii) determine the proper licensing jurisdiction and export classification of products, software, and technology, and (iii) obtain licenses or other forms of U.S. government authorization to engage in the conduct of our space transport business. Violations of applicable export control laws and related regulations could result in criminal and administrative penalties, including fines, possible denial of export privileges, and debarment, which could have a material adverse impact on our business, including our ability to enter into contracts or subcontracts for U.S. government customers.
The inability to secure and maintain necessary export authorizations could negatively impact our ability to compete successfully or to operate our spaceflight business as planned. For example, if we were unable to obtain or maintain our licenses to export certain spacecraft hardware, we would be effectively prohibited from launching our vehicles from certain
non-U.S.
locations, which would limit the number of launch providers we could use. In addition, if we were unable to obtain a Department of State Technical Assistance Agreement to export certain launch related services, we would experience difficulties or even be unable to perform integration activities necessary to safely integrate our transfer vehicles tonon-U.S.
launch vehicles. In both cases, these restrictions could lead to higher launch costs which may have a material adverse impact on our results of operations. Similarly, if we were unable to secure effective export licensure to authorize the full scope of activity with a foreign partner or supplier, we may be required to make design changes to spacecraft or updates to our supplier chain, which may result in increased costs to us or delays in vehicle launches.Any changes in the export control regulations or U.S. government licensing policy, such as those necessary to implement U.S. government commitments to multilateral control regimes, may restrict our operations. There is no inherent right to perform an export and given the significant discretion the government has adjudicating such authorizations in furtherance of U.S. national security and foreign policy interests, there can be no assurance we will be successful in our current and future efforts to secure and maintain necessary licenses, registrations, or other U.S. government regulatory approvals.
43
In addition, U.S. export control laws continue to change. For example, the control lists under the ITAR and the EAR are periodically updated to reclassify specific types of export-controlled technology. For example, any changes to the jurisdictional assignment of controlled data or hardware used by Terran Orbital could result in the need for different export authorizations, each then subject to a subsequent approval.
Similarly, should exceptions or exemptions under the EAR or ITAR, respectively, be changed, Terran Orbital’s activities otherwise authorized via these mechanisms may become unavailable and could result in the need for additional export authorizations. Additionally, changes to the administrative implementation of export control laws at the agency level may suddenly change as a result of
geo-political
events, which could result in existing or proposed export authorization applications being viewed in unpredictable ways, or potentially rejected, as a result of the changed agency level protocol.We are exposed to risks related to geopolitical and economic factors, laws and regulations and our international business subjects us to numerous political and economic factors, legal requirements, cross-cultural considerations and other risks associated with doing business globally.
Our international business is subject to both U.S. and foreign laws and regulations, including, without limitation, laws and regulations relating to export/import controls, sanctions, technology transfer restrictions, government contracts and procurement, data privacy and protection, anti-corruption laws, including the “FCPA”, the anti-boycott provisions of the U.S. Export Administration Act, security restrictions and intellectual property. Failure by us, our employees, affiliates, partners or others with whom we work to comply with applicable laws and regulations could result in administrative, civil, commercial or criminal liabilities, including suspension or debarment from government contracts or suspension of our export/import privileges. New regulations and requirements, or changes to existing ones in the various countries in which we operate can significantly increase our costs and risks of doing business internationally.
Changes in laws, regulations, political leadership and environment, and/or security risks may dramatically affect our ability to conduct or continue to conduct business in international markets, including sales to customers and purchases from suppliers outside the United States. We may also be impacted by U.S. and foreign national policies and priorities, political decisions and geopolitical relationships, any of which may be influenced by changes in the threat environment, political leadership, geopolitical uncertainties, world events, bilateral and multi-lateral relationships and economic and political factors, and any of which could impact our operations and/or export authorizations, or delay purchasing decisions or payments and the provision of supplies, goods and services including, without limitation, in connection with any government programs. Global economic conditions and fluctuations in foreign currency exchange rates could further impact our business. For example, the tightening of credit in financial markets outside of the U.S. could adversely affect the ability of our customers and suppliers to obtain financing and could result in a decrease in or cancellation of orders for our products and services or impact the ability of our customers to make payments.
We also increasingly are dependent on
in-country
suppliers and we face risks related to their failure to perform in accordance with the contracts and applicable laws, particularly where we rely on a sole source supplier. The services we provide internationally are sometimes in countries with unstable governments, economic or fiscal challenges, military or political conflicts and/or developing legal systems. This may increase the risk to our employees, subcontractors or other third parties, and/or increase the risk of a wide range of liabilities, as well as loss of property or damage to our products.The occurrence and impact of these factors is difficult to predict, but one or more of them could have a material adverse effect on our financial position, results of operations and/or cash flows.
The ability of Terran Orbital to offer one or more services in certain countries or regions of the world may be limited due to regulatory requirements.
Though anticipated to provide global service, certain of our business operations may be limited in some jurisdictions by local regulations. For example, some countries have local domestic ownership requirements, or requirements for physical facilities or gateways within their jurisdictions, that may be difficult for Terran Orbital to satisfy. The inability to offer or provide the Earth Observation Solutions constellation service in some major international markets could impair Terran Orbital from achieving its revenue and international growth plans.
44
Our business is subject to various regulatory risks that could adversely affect our operations.
The environment in which we operate is highly regulated due to the sensitive nature of our complex and technologically advanced systems, including satellites, products, hardware and software, in addition to those regulations broadly applicable to publicly listed corporations. There are numerous regulatory risks that could adversely affect operations, including but not limited to:
| • | Changes in laws and regulations . It is possible that the laws and regulations governing our business and operations will change in the future. A substantial portion of our revenue is generated from customers outside of the U.S. There may be a material adverse effect on our financial condition and results of operations if we are required to alter our business to comply with changes in both domestic and foreign regulations, foreign policy, tariffs or taxes and other trade barriers that reduce or restrict our ability to sell our products and services on a global basis, or by political and economic instability in the countries in which we conduct business. Any failure to comply with such regulatory requirements could also subject us to various fines, penalties or sanctions. |
| • | Export Restrictions . Certain of our businesses and satellites, systems, products, services or technologies we have developed require the implementation or acquisition of products or technologies from third parties, including those in other jurisdictions. In addition, certain of our satellites, systems, products or technologies may be required to be forwarded or exported to other jurisdictions. In certain cases, if the use of the technologies can be viewed by the jurisdiction in which that supplier or subcontractor resides as being subject to export constraints or restrictions relating to national security, we may not be able to obtain the technologies and products that we require from suppliers or subcontractors who would otherwise be our preferred choice or may not be able to obtain the export permits necessary to transfer or export our technology. To the extent that we are able, we obtainpre-authorization forre-export prior to signing contracts which oblige us to export subject technologies, including specific foreign government approval as needed. In the event of export restrictions, we may have the ability through contract force majeure provisions to be excused from our obligations. Notwithstanding these provisions, the inability to obtain export approvals, export restrictions or changes during contract execution ornon-compliance by our customers could have an adverse effect on our revenues and margins. |
| • | U.S. Government Approval Requirements . For certain aspects of our business operations, we are required to obtain U.S. government licenses and approvals to enter into agreements or engage in commercial transactions with various end users (including government bodies) in order to export satellites and related equipment, disclose technical data or provide defense services to foreign persons. The delayed receipt of or the failure to obtain the necessary U.S. government licenses, approvals and agreements may prohibit entry into or interrupt the completion of contracts which could lead to a customer’s termination of a contract for default, monetary penalties and/or the loss of incentive payments. |
| • | Competitive Impact of U.S. Regulations on Satellite Sales . Some of our customers and potential customers, along with insurance underwriters and brokers, have asserted that U.S. export control laws and regulations governing disclosures to foreign persons excessively restrict their access to information about the satellite during construction andon-orbit. Office of Foreign Assets Control (“OFAC”) sanctions and requirements may also limit certain business opportunities or delay or restrict our ability to contract with potential foreign customers or operators. To the extent that ournon-U.S. competitors are not subject to OFAC or similar export control or economic sanctions laws and regulations, they may enjoy a competitive advantage with foreign customers, and it could become increasingly difficult for the U.S. satellite manufacturing industry, including us, to recapture this lost market share. Customers concerned over the possibility that the U.S. government may deny the export license necessary for us to deliver their purchased satellite to them, or the restrictions or delays imposed by the U.S. government licensing requirements, even where an export license is granted, may elect to choose a satellite that is purportedly free of ITAR offered by anon-U.S. supplier. |
45
| • | Anti-Corruption Laws . As part of the regulatory and legal environments in which we operate, we are subject to global anti-corruption laws that prohibit improper payments directly or indirectly to government officials, authorities or persons defined in those anti-corruption laws in order to obtain or retain business or other improper advantages in the conduct of business. Our policies mandate compliance with anticorruption laws. Failure by our employees, agents, subcontractors, suppliers and/or partners to comply with anti-corruption laws could impact us in various ways that include, but are not limited to, criminal, civil and administrative fines and/or legal sanctions and the inability to bid for or enter into contracts with certain entities, all of which could have a significant adverse effect on our reputation, operations and financial results. |
Our operations are subject to governmental law and regulations relating to environmental matters, which may expose us to significant costs and liabilities that could negatively impact our financial condition.
We are subject to various international, federal, state, provincial and local environmental laws and regulations relating to the operation of our businesses, including those governing pollution, the handling, storage, disposal and transportation of hazardous substances and the cleanup of contamination should it arise. The imposition of more stringent standards or requirements under environmental laws or regulations or a determination that we are responsible for a release of hazardous substances at our sites could result in significant costs, including cleanup costs, fines, sanctions and third-party claims. In addition, we could be affected by future regulations imposed in response to concerns over climate change, other aspects of the environment or natural resources.
Risks Related to Being a Public Company
We will incur increased costs as a result of operating as a public company, and our management will be required to devote substantial time to compliance with our public company responsibilities and corporate governance practices.
As a public company, we will incur significant legal, accounting, and other expenses that we did not incur as a private company, which we expect to further increase after we are no longer an “emerging growth company.” The Sarbanes-Oxley Act, the Dodd-Frank Wall Street Reform and Consumer Protection Act, the listing requirements of the NYSE and other applicable securities rules and regulations impose various requirements on public companies. Our management and other personnel will be required to devote a substantial amount of time to compliance with these requirements. Moreover, these rules and regulations will increase our legal and financial compliance costs and will make some activities more time-consuming and costly. We cannot predict or estimate the amount of additional costs we will incur as a public company or the specific timing of such costs.
We are an “emerging growth company,” and our election to comply with the reduced disclosure requirements as a public company may make our common stock less attractive to investors.
For so long as we remain an “emerging growth company,” as defined in the Jumpstart Our Business Startups Act of 2012 (the “JOBS Act”), we may take advantage of certain exemptions from various requirements that are applicable to public companies that are not “emerging growth companies,” including not being required to comply with the independent auditor attestation requirements of Section 404 of the Sarbanes-Oxley Act, reduced disclosure obligations regarding executive compensation in our periodic reports and proxy statements, being required to provide fewer years of audited financial statements, and exemptions from the requirements of holding a
non-binding
advisory vote on executive compensation and stockholder approval of any golden parachute payments not previously approved.We may lose our emerging growth company status and become subject to the SEC’s internal control over financial reporting management and auditor attestation requirements. If we are unable to certify the effectiveness of our internal controls, or if our internal controls have a material weakness, we could be subject to regulatory scrutiny and a loss of confidence by stockholders, which could harm our business and adversely affect the market price of our common stock. We will cease to be an “emerging growth company” upon the earliest to occur of: (i) the last day of the fiscal year in which we have more than $1.07 billion in annual revenue; (ii) the date we qualify as a large accelerated filer, with at least $700 million of equity securities held by
non-affiliates;
(iii) the date on which we have, in any three-year period, issued more than $1.0 billion innon-convertible
debt securities; and (iv) December 31, 2026 (the last day of the fiscal year following the fifth anniversary of Tailwind Two becoming a public company).46
As an emerging growth company, we may choose to take advantage of some but not all of these reduced reporting burdens. Accordingly, the information we provide to our stockholders may be different than the information you receive from other public companies in which you hold stock. In addition, the JOBS Act also provides that an “emerging growth company” can take advantage of an extended transition period for complying with new or revised accounting standards. We have elected to take advantage of this extended transition period under the JOBS Act. As a result, our operating results and financial statements may not be comparable to the operating results and financial statements of other companies who have adopted the new or revised accounting standards. It is possible that some investors will find our common stock less attractive as a result, which may result in a less active trading market for our common stock and higher volatility in our stock price.
If we fail to maintain an effective system of disclosure controls and internal control over financial reporting, our ability to produce timely and accurate financial statements or comply with applicable regulations could be impaired.
As a public company listed on the NYSE, we are subject to the reporting requirements of the Exchange Act, the Sarbanes-Oxley Act and the NYSE listing standards. These rules and regulations will continue to increase our legal, accounting, and financial compliance costs, make some activities more difficult, time-consuming, and costly and place significant strain on our personnel, systems, and resources.
The Sarbanes-Oxley Act requires, among other things, that we maintain effective disclosure controls and procedures and internal control over financial reporting. We are continuing to develop and refine our disclosure controls and other procedures that are designed to ensure that information required to be disclosed by us in the reports that we will file with the SEC is recorded, processed, summarized, and reported within the time periods specified in SEC rules and forms and that information required to be disclosed in reports under the Exchange Act is accumulated and communicated to our principal executive and financial officers. We are continuing to improve our internal control over financial reporting, which includes hiring additional accounting and financial personnel to implement such processes and controls. In order to maintain and improve the effectiveness of our disclosure controls and procedures and internal control over financial reporting, we have expended, and anticipate that we will continue to expend, significant resources, including accounting-related costs and significant management oversight. If any of these new or improved controls and systems do not perform as expected, we may experience material weaknesses in our controls.
Our current controls and any new controls that we develop may become inadequate because of changes in conditions in our business. Further, weaknesses in our disclosure controls and internal control over financial reporting may be discovered in the future. Any failure to develop or maintain effective controls or any difficulties encountered in their implementation or improvement could harm our results of operations or cause us to fail to meet our reporting obligations and may result in a restatement of our financial statements for prior periods. Failure to file our periodic reports on a timely basis will cause us to be ineligible to use short-form registration statements on Form
S-3,
which may impair our ability to obtain additional capital in a timely fashion. Any failure to implement and maintain effective internal control over financial reporting also could adversely affect the results of periodic management evaluations and annual independent registered public accounting firm attestation reports regarding the effectiveness of our internal control over financial reporting that we will eventually be required to include in our periodic reports that will be filed with the SEC. Ineffective disclosure controls and procedures and internal control over financial reporting could also cause investors to lose confidence in our reported financial and other information, which would likely have a negative effect on the trading price of our common stock. In addition, if we are unable to continue to meet these requirements, we may not be able to remain listed on the NYSE.We will be required pursuant to Section 404 of the Sarbanes-Oxley Act to evaluate and report on our system of internal controls beginning with our Annual Report on Form
10-K
for the year ending December 31, 2022. Our independent registered public accounting firm is not required to formally attest to the effectiveness of our internal control over financial reporting until after we are no longer an “emerging growth company” as defined in the JOBS Act. At such time, our independent registered public accounting firm may issue a report that is adverse in the event it is not satisfied with the level at which our internal control over financial reporting is documented, designed or operating. Any failure to maintain effective disclosure controls and internal control over financial reporting could have an adverse effect on our business and results of operations and could cause a decline in the price of our common stock and public warrants.47
Changes in accounting principles may cause previously unanticipated fluctuations in our financial results, and the implementation of such changes may impact our ability to meet our financial reporting obligations.
We prepare our financial statements in accordance with GAAP in the United States, which are subject to interpretation or changes by the FASB, the SEC, and other various bodies formed to promulgate and interpret appropriate accounting principles. New accounting pronouncements and changes in accounting principles have occurred in the past and are expected to occur in the future which may have a significant effect on our financial results. Furthermore, any difficulties in implementation of changes in accounting principles, including the ability to modify our accounting systems, could cause us to fail to meet our financial reporting obligations, which could result in regulatory discipline and harm investors’ confidence in us.
Risks Related to Our Indebtedness
We have a substantial amount of indebtedness and payment obligations that could affect operations and financial condition and prevent us from fulfilling our obligations under our indebtedness.
As of March 31, 2022, we had a substantial amount of indebtedness, consisting of $120.0 million under the Francisco Partners Facility and approximately $56.3 million of Rollover Notes (as defined below), as well as a $28.1 million payment obligation owed to the Insider PIPE Investor. In addition, under the debt provider warrants issued to affiliates of Francisco Partners pursuant to the Stock and Warrant Purchase Agreement, such warrant holders have the right to require us to exchange such warrants for $25 million in cash on March 25, 2025, which is the third anniversary of the Closing Date. For additional information on the terms of such indebtedness and payment obligations, see “Management’s Discussion and Analysis of Financial Condition and Results of Operations — Liquidity and Capital Resources,” “Certain Relationships and Related Person Transactions – Tailwind Two – PIPE Financing (Private Placement)” and “Description of Securities.”
Our substantial indebtedness and payment obligations could have important consequences. For example, it could:
| • | make it difficult for us to satisfy obligations to holders of our indebtedness; |
| • | increase our vulnerability to general adverse economic and industry conditions; |
| • | require the dedication of a substantial portion of cash flow from operations to payments on indebtedness, thereby reducing the availability of cash flow to fund working capital, capital expenditures, research and development efforts, and other general corporate purposes; |
| • | limit flexibility in planning for, or reacting to, changes in our business and the industry in which we operate; |
| • | place us at a competitive disadvantage compared to competitors that have less debt; and |
| • | limit our ability to borrow additional funds. |
Despite our significant leverage, we may be able to incur significant additional amounts of debt, which could further exacerbate the risks associated with our significant leverage.
48
Restrictions imposed by our substantial indebtedness could adversely affect our ability to raise additional capital to fund our operations and dividend policy, limit our ability to react to changes in the economy or our industry and prevent us from making debt service payments.
Restrictions imposed by our outstanding indebtedness under the FP Note Purchase Agreement and the Amended Note Purchase Agreement (as defined herein) may limit our ability to operate its business and to finance our future operations or capital needs or to engage in other business activities. Each of the FP Note Purchase Agreement and the Amended Note Purchase Agreement contains restrictive covenants that limit our ability to engage in certain types of activities and transactions that may be in its long-term best interests. In addition, the FP Note Purchase Agreement includes a financial liquidity maintenance covenant that is tested on a quarterly basis commencing with the quarter ended March 31, 2022 and a financial minimum Consolidated Adjusted EBITDA maintenance covenant that will be tested on a quarterly basis commencing with the quarter ending December 31, 2023. The failure to comply with those covenants could result in an event of default which, if not cured or waived, could result in the acceleration of all outstanding indebtedness under the FP Notes and/or the Rollover Notes. In the event its lenders accelerate the repayment of its outstanding indebtedness, Terran Orbital and its subsidiaries may not have sufficient cash and assets to repay such indebtedness. These covenants restrict Terran Orbital’s ability and the ability of its restricted subsidiaries, among other things, to:
| • | incur additional indebtedness and create additional liens; |
| • | pay dividends on our capital stock or redeem, repurchase, or retire our capital stock or indebtedness; |
| • | make investments, loans, advances, and acquisitions; |
| • | repay prior to maturity certain other indebtedness; |
| • | engage in transactions with our affiliates; |
| • | sell assets, including capital stock of our subsidiaries; and |
| • | consolidate or merge. |
We may not be able to generate sufficient cash to service all of our indebtedness, and we may be forced to take other actions to satisfy our obligations under our indebtedness that may not be successful.
We have significant indebtedness that could affect operations and financial condition and prevent us from fulfilling our obligations under our indebtedness. Our ability to make scheduled payments on our debt obligations depends on our financial condition and operating performance, which is subject to prevailing economic and competitive conditions and to certain financial, business and other factors beyond our control. We may not be able to maintain a level of cash flows from operating activities sufficient to permit us to pay the principal, premium, if any, and interest on our indebtedness.
If our cash flows and capital resources are insufficient to fund our debt service obligations (including redemption or repayment obligations), we may be forced to reduce or delay investments and capital expenditures, or to sell assets, seek additional capital through equity or debt financing, or restructure or refinance our indebtedness. The terms of existing or future debt instruments may restrict us from adopting some of these alternatives. Such financing may not be available on acceptable terms, or at all, and our failure to raise capital when needed could harm our business. We may sell equity securities or debt securities in one or more transactions at prices and in a manner as we may determine from time to time. If we sell any such securities in subsequent transactions, our current investors may be materially diluted. Any debt financing, if available, may involve restrictive covenants and could reduce our operational flexibility or profitability. If we cannot raise funds on acceptable terms, we may not be able to grow our business or respond to competitive pressures. In the absence of such operating results and additional debt or equity financings, we could face substantial liquidity problems and might be required to dispose of material assets or operations to meet its debt service and other obligations.
Our ability to repay our debt is affected by the cash flow generated by our subsidiaries.
Our subsidiaries own all of our operating assets and conduct all of our operations. As a result, our ability to make future dividend payments, if any, is dependent on the earnings of our subsidiaries and the payment of those earnings to us in the form of dividends, loans or advances and through repayment of loans or advances from us to our subsidiaries. Payments to us by our subsidiaries will be contingent upon our subsidiaries’ earnings and other business considerations and may be subject to statutory or contractual restrictions.
49
Risks Related to Common Stock and Warrants
The securities being offered in this prospectus represent a substantial percentage of our outstanding common stock, and the sales of such securities could cause the market price of our common stock to decline significantly.
This prospectus relates to the offer and sale from time to time by the Selling Securityholders of (A) up to 140,155,860 shares of our common stock, consisting of (i) up to 5,080,409 PIPE Shares issued at a purchase price of $10.00 per share in the PIPE Financing; (ii) up to 8,100,000 Founder Shares issued in connection with the consummation of the Business Combination, in exchange for Class B ordinary shares originally issued at a price of approximately $0.003 per share in a private placement to the Sponsor and Tommy Stadlen; (iii) up to 94,952,441 shares of our common stock issued or issuable to the Legacy Terran Orbital equity holders in connection with or as a result of the consummation of the Business Combination, consisting of (a) up to 83,481,806 shares of our common stock originally issued to Legacy Terran Orbital stockholders at a weighted-average purchase price of approximately $0.29 per share, after giving effect to the exchange ratio in the Business Combination; (b) up to 82,616 shares of our common stock issuable upon the exercise of certain options with a weighted-average exercise price of $1.41 per share; and (c) up to 11,388,019 shares of our common stock that certain Legacy Terran Orbital equity holders have the right to receive upon the settlement of outstanding vested and unvested restricted stock unit awards upon certain conditions; (iv) up to 8,420,569 shares of our common stock issued to certain debt holders pursuant to a stock and warrant purchase agreement, which were originally issued as non-cash consideration for entering into the Francisco Partners Facility and Rollover Notes; (v) up to 7,800,000 shares of our common stock issuable upon the exercise of the private placement warrants; (vi) up to 11,055,606 shares of our common stock issuable upon the exercise of the debt provider warrants; and (vii) up to 4,746,835 shares of our common stock issuable pursuant to the Subscription Agreement for the Insider PIPE Investor (with the total shares of our common stock referenced in this clause (A) being referred to herein as the “”); (B) up to 7,800,000 private placement warrants originally issued in a private placement to the Sponsor at a price of $1.50 per warrant, which private placement warrants have an exercise price of $11.50 per share; and (C) up to 11,055,606 debt provider warrants originally issued in a private placement to certain debt providers as non-cash consideration for entering into the Francisco Partner Facility and Rollover Notes, which debt provider warrants have an exercise price of $10.00 per warrants.
Total Resale Shares
The market price for shares of our common stock could decline as a result of the sales of our common stock being offered in this prospectus, and such declines could be significant. Prior to the extraordinary general meeting of Tailwind Two in connection with the Business Combination, holders of 31,565,677 Tailwind Two’s Class A Ordinary Shares exercised their right to redeem those shares for cash at a price of $10.00 per share, for an aggregate of $315.7 million, which represented approximately 91% of the total Tailwind Two Class A Ordinary Shares then outstanding. The Total Resale Shares being offered in this prospectus represents approximately 102% of the total outstanding shares of our common stock as of May 25, 2022 (and approximately 88% of the total of (a) outstanding shares of common stock, plus (b) underlying shares reserved for issuance related to vested and unvested restricted stock units and options). Additionally, if all the Offered Warrants are exercised for cash, the Selling Securityholders would own an additional 18,855,606 shares of common stock, representing an additional 13.7% of the total outstanding shares of our common stock as of May 25, 2022 (and approximately 10.6% of the total of (a) the total outstanding shares of common stock, plus (b) underlying shares reserved for issuance related to vested and unvested restricted stock units and options, plus (c) such additional shares reserved for issuance related to such Offered Warrants).
The sale of all the securities being offered in this prospectus could result in a significant decline in the public trading price of our common stock. Despite such a decline in the public trading price of our common stock and the fact that the closing price of our common stock on May 25, 2022 of $4.74 a share is below the closing price immediately following the closing of the Business Combination, certain of the Selling Securityholders may still experience a positive rate of return on the securities they purchased prior to the closing of the Business Combination, but our public securityholders may not experience a similar rate of return on the securities they purchased due to differences in the purchase prices and the current trading price. Based on the closing price of our common stock referenced above, the holders of the Founder Shares and the holder of the shares of common stock issuable pursuant to the subscription agreement for the Insider PIPE Investor may experience potential profit of up to $4.74 per share, the Legacy Terran Orbital former stockholders (based on the weighted-average purchase price) may experience potential profit of up to $4.45 per share, the holders who received shares of common stock pursuant to the stock and warrant purchase agreement may experience potential profit of up to $4.74 per share and the holders of common stock issuable upon the exercise of certain options may experience potential profit of $3.33 per share.
Sales, or the perception of sales, by us or our stockholders in the public market could cause the market price for our common stock to decline.
The sale of shares of our common stock in the public market, or the perception that such sales could occur, could harm the prevailing market price of shares of our common stock. These sales, or the possibility that these sales may occur, also might make it more difficult for Terran Orbital to sell equity securities in the future at a time and at a price that it deems appropriate.
Upon consummation of the Business Combination on March 25, 2022, Terran Orbital had a total of 137,295,455 shares of common stock outstanding. All shares issued in the Merger were freely tradable without registration under the Securities Act and without restriction by persons other than Terran Orbital’s “affiliates” (as defined under Rule 144 of the Securities Act, “Rule 144”), including Terran Orbital’s directors, executive officers and other affiliates, and other than pursuant to the Investor Rights Agreement
lock-up
described below.50
In connection with the Business Combination, the Sponsor and certain other holders of our common stock, restricted stock units, stock options and/or other equity awards entered into the Investor Rights Agreement, pursuant to which they agreed, subject to certain exceptions, not to transfer or dispose of our common stock during the period from the date of the closing of the merger through 180 days after the consummation of the Business Combination. Immediately after the closing of the Business Combination on March 25, 2022, approximately 82.7% of the Company’s 137,295,455 total shares of common stock then outstanding were subject to such 180 day lock-up under the Investor Rights Agreement. The expiration or waiver of this lock-up will result in a substantial increase in shares eligible to be traded in the market and could have negative impact on our stock price.
Upon the expiration or waiver of the
lock-up
described above, common stock held by the foregoing holders of Terran Orbital will be eligible for resale, subject to volume, manner of sale and other limitations under Rule 144 when such rule becomes applicable on the date that is one year after the filing of our “Super” Form8-K/A
with Form 10 type information, which was filed on March 31, 2022. In addition, pursuant to the Investor Rights Agreement, Terran Orbital will register the shares of our common stock under the Securities Act of the investors thereunder. By exercising their registration rights and selling a large number of shares, these stockholders could cause the prevailing market price of our common stock to decline.As restrictions on resale end or if these stockholders exercise their registration rights, the market price of shares of our common stock could drop significantly if the holders of such shares sell them or are perceived by the market as intending to sell them. These factors could also make it more difficult for Terran Orbital to raise additional funds through future offerings of our common stock or other securities.
In addition, the shares of our common stock reserved for future issuance under the 2021 Omnibus Incentive Plan will become eligible for sale in the public market once those shares are issued, subject to provisions relating to various vesting agreements,
lock-up
agreements and, in some cases, limitations on volume and manner of sale applicable to affiliates under Rule 144, as applicable. The number of shares of our common stock reserved for future issuance under the 2021 Omnibus Incentive Plan is 13,729,546, subject to an annual increase as set forth therein. Terran Orbital is expected to file one or more registration statements on FormS-8
under the Securities Act to register shares of our common stock or securities convertible into or exchangeable for shares of our common stock issued pursuant to the 2021 Omnibus Incentive Plan. Any such FormS-8
registration statements will automatically become effective upon filing. Accordingly, shares registered under such registration statements will be available for sale in the open market, subject to the provisions relating to various vesting agreements,lock-up
agreements and, in some cases, limitations on volume and manner of sale applicable to affiliates under Rule 144, as applicable.In the future, Terran Orbital may also issue its securities in connection with investments or acquisitions. The amount of shares of our common stock issued in connection with an investment or acquisition could constitute a material portion of our common stock. Any issuance of additional securities in connection with investments or acquisitions may result in additional dilution to Terran Orbital’s stockholders.
The Warrants will become exercisable for our common stock, which would increase the number of shares eligible for future resale in the public market, result in dilution to our stockholders and could adversely affect the market price of our common stock.
We have outstanding public warrants and private placement warrants to purchase an aggregate of 19,299,960 shares of our common stock at a purchase price of $11.50 per share, subject to adjustment, that became exercisable on April 24, 2022, which was thirty (30) days after the Closing Date.
In addition, we have outstanding debt provider warrants issued as follows: (1) to Francisco Partners to purchase an aggregate of 8,291,704 shares of our common stock at a purchase price of $10.00 per share, (2) to Lockheed Martin to purchase an aggregate of 1,381,951 shares of our common stock at a price of $10.00 per share, and (3) to Beach Point to purchase an aggregate of 1,381,951 shares of our common stock at a price of $10.00 per share, in each case, subject to adjustment.
To the extent such warrants are exercised in accordance with the terms of the warrant agreement covering those securities, additional shares of our common stock will be issued, which will result in dilution to the holders of our common stock and increase the number of shares eligible for resale in the public market. Sales of substantial numbers of such shares in the public market could adversely affect the market price of our common stock.
51
We may not be able to satisfy the continued listing standards of the NYSE going forward
Our common stock and public warrants are listed on the NYSE under the symbols “LLAP” and “LLAP WS” respectively. However, an active trading market for our common stock or warrants may not be sustained. Furthermore, we cannot ensure that we will be able to satisfy the continued listing standards of the NYSE going forward. If we cannot satisfy the continued listing standards going forward, the NYSE may commence delisting procedures against us, which could result in our common stock or public warrants being removed from listing on the NYSE. If any of our common stock or public warrants were to be delisted, the liquidity of our common stock or warrants could be adversely affected and the market price of our common stock or warrants could decrease. Delisting could also adversely affect our security holders’ ability to trade or obtain quotations on our securities because of lower trading volumes and transaction delays. These factors could contribute to lower prices and larger spreads in the bid and ask price for our securities. You may also not be able to resell your common stock or warrants at or above the price you paid for such securities or at all.
In addition, the National Securities Markets Improvement Act of 1996, which is a federal statute, prevents or preempts the states from regulating the sale of certain securities, which are referred to as “covered securities.” If our securities were no longer listed on the NYSE, such securities would not qualify as covered securities and we would be subject to regulation in each state in which we offer our securities because states are not preempted from regulating the sale of securities that are not covered securities.
The trading price of our securities may be volatile.
The trading price of our common stock is likely to be volatile. The stock market recently has experienced extreme volatility. This volatility often has been unrelated or disproportionate to the operating performance of particular companies. You may not be able to resell your shares at an attractive price due to a number of factors such as those listed above and the following, to the extent not already stated:
| • | results of operations that vary from the expectations of securities analysts and investors; |
| • | results of operations that vary from those of our competitors; |
| • | the impact of the COVID-19 pandemic and its effect on our business and financial conditions; |
| • | changes in expectations as to our future financial performance, including financial estimates and investment recommendations by securities analysts and investors; |
| • | declines in the market prices of stocks generally; |
| • | strategic actions by us or our competitors; |
| • | announcements by us or our competitors of significant contracts, acquisitions, joint ventures, other strategic relationships or capital commitments; |
| • | any significant change in our management; |
| • | changes in general economic or market conditions or trends in our industry or markets; |
| • | changes in business or regulatory conditions, including new laws or regulations or new interpretations of existing laws or regulations applicable to our business; |
| • | future sales of our common stock or other securities; |
| • | investor perceptions or the investment opportunity associated with our common stock relative to other investment alternatives; |
52
| • | the public’s response to press releases or other public announcements by us or third parties, including our filings with the SEC; |
| • | litigation involving us, our industry, or both, or investigations by regulators into our operations or those of our competitors; |
| • | guidance, if any, that we provide to the public, any changes in this guidance or our failure to meet this guidance; |
| • | the development and sustainability of an active trading market for our stock; |
| • | actions by institutional or activist stockholders; |
| • | changes in accounting standards, policies, guidelines, interpretations or principles; and |
| • | other events or factors, including those resulting from natural disasters, war, acts of terrorism or responses to these events. |
These broad market and industry fluctuations may adversely affect the market price of our common stock, regardless of our actual operating performance. In addition, price volatility may be greater if the public float and trading volume of our common stock is low.
In the past, following periods of market volatility, stockholders have instituted securities class action litigation. If Terran Orbital was involved in securities litigation, it could have a substantial cost and divert resources and the attention of executive management from Terran Orbital’s business regardless of the outcome of such litigation.
Because there are no current plans to pay cash dividends on our common stock for the foreseeable future, you may not receive any return on investment unless you sell your common stock for a price greater than that which you paid for it.
We intend to retain future earnings, if any, for future operations, expansion and debt repayment (if any) and there are no current plans to pay any cash dividends for the foreseeable future. The declaration, amount and payment of any future dividends on shares of our common stock will be at the sole discretion of Terran Orbital’s Board of Directors. Terran Orbital’s Board of Directors may take into account general and economic conditions, Terran Orbital’s financial condition and results of operations, Terran Orbital’s available cash and current and anticipated cash needs, capital requirements, contractual, legal, tax, and regulatory restrictions, implications on the payment of dividends by Terran Orbital to its stockholders or by its subsidiaries to it and such other factors as Terran Orbital’s Board of Directors may deem relevant. In addition, Terran Orbital’s ability to pay dividends is limited by covenants of Terran Orbital’s existing and outstanding indebtedness, including the Francisco Partners Facility, and may be limited by covenants of any future indebtedness Terran Orbital incurs. As a result, you may not receive any return on an investment in our common stock unless you sell our common stock for a price greater than that which you paid for it.
If securities analysts do not publish research or reports about our business or if they downgrade our common stock or our industry, the Company’s stock price and trading volume could decline.
The trading market for our common stock will rely in part on the research and reports that industry or financial analysts publish about us or our business. We do not control these analysts. In addition, some financial analysts may have limited expertise with the Company’s model and operations. Furthermore, if one or more of the analysts who do cover us downgrade our stock or industry, or the stock of any of our competitors, or publish inaccurate or unfavorable research about our business, the price of our common stock could decline. If one or more of these analysts ceases coverage of the Company or fails to publish reports on it regularly, we could lose visibility in the market, which in turn could cause our stock price and/or trading volume to decline.
53
You may only be able to exercise your public warrants on a “cashless basis” under certain circumstances, and if you do so, you will receive fewer shares of common stock from such exercise than if you were to exercise such warrants for cash.
The Warrant Agreement provides that in the following circumstances holders of warrants who seek to exercise their warrants will not be permitted to do for cash and will, instead, be required to do so on a cashless basis in accordance with Section 3(a)(9) of the Securities Act: (i) if the shares of common stock issuable upon exercise of the Warrants are not registered under the Securities Act in accordance with the terms of the warrant agreement; (ii) if we have so elected and the shares of common stock are at the time of any exercise of a warrant are not listed on a national securities exchange such that they satisfy the definition of “covered securities” under Section 18(b)(1) of the Securities Act; and (iii) if we have so elected and we call the public warrants for redemption. If you exercise your public warrants on a cashless basis, you would pay the warrant exercise price by surrendering all of the Warrants for that number of common stock equal to the quotient obtained by dividing (x) the product of the number of common stock underlying the Warrants, multiplied by the excess of the “fair market value” of our common stock (as defined in the next sentence) over the exercise price of the Warrants by (y) the fair market value. The “fair market value” is the average reported last sale price of the common stock for the 10 trading days ending on the third trading day prior to the date on which the notice of exercise is received by the warrant agent or on which the notice of redemption is sent to the holders of warrants, as applicable. As a result, you would receive fewer shares of common stock from such exercise than if you were to exercise such warrants for cash.
We may amend the terms of the public warrants in a manner that may be adverse to holders of public warrants with the approval by the holders of at least 65% of the then outstanding public warrants. As a result, the exercise price of the warrants could be increased, the exercise period could be shortened and the number of shares of our common stock purchasable upon exercise of a public warrant could be decreased, all without your approval.
Our public warrants were issued in registered form under the Warrant Agreement. The Warrant Agreement provides that the terms of the public warrants may be amended without the consent of any holder to cure any ambiguity or correct any defective provision, but requires the approval by the holders of at least 65% of the then outstanding public warrants to make any change that adversely affects the interests of the registered holders of the public warrants. Accordingly, we may amend the terms of the public warrants in a manner adverse to a holder if holders of at least 65% of the then outstanding public warrants approve of such amendment. Although our ability to amend the terms of the public warrants with the consent of at least 65% of the then outstanding warrants is broad, examples of such amendments could be amendments to, among other things, increase the exercise price of the warrants, convert the warrants into cash or stock, shorten the exercise period or decrease the number of our shares of common stock purchasable upon exercise of a warrant.
We may redeem your unexpired public warrants prior to their exercise at a time that is disadvantageous to you, thereby making your warrants worthless.
We have the ability to redeem outstanding public warrants at any time prior to their expiration, at a price of $0.01 per warrant, provided that the last reported sales price of our common stock equals or exceeds $18.00 per share (as adjusted for stock splits, stock dividends, reorganizations, recapitalizations and the like) for any twenty (20) trading days within a thirty
(30) trading-day
period commencing once the warrants became exercisable and ending on the third trading day prior to the date on which we give proper notice of such redemption and provided certain other conditions are met. If and when the public warrants become redeemable by the Company, we may not exercise our redemption right if the issuance of our common stock upon exercise of the public warrants is not exempt from registration or qualification under applicable state blue sky laws or we are unable to effect such registration or qualification. Redemption of the outstanding public warrants could force you (i) to exercise your public warrants and pay the exercise price therefor at a time when it may be disadvantageous for you to do so, (ii) to sell your public warrants at the then-current market price when you might otherwise wish to hold your public warrants or (iii) to accept the nominal redemption price which, at the time the outstanding public warrants are called for redemption, is likely to be substantially less than the market value of your public warrants.In addition, we may redeem the outstanding public warrants for $0.10 per warrant upon a minimum of 30 days’ prior written notice of redemption provided that holders will be able to exercise their public warrants prior to redemption for a number of shares of our common stock determined based on the redemption date and the fair market value of our common stock. The value received upon exercise of the public warrants (i) may be less than the value the holders would have received if they had exercised their public warrants at a later time where the underlying share price is higher and (ii) may not compensate the holders for the value of the public warrants, including because the number of shares of our common stock received is capped at 0.361 shares of common stock per warrant (subject to adjustment) irrespective of the remaining life of the public warrants.
54
The Warrant Agreement designates the courts of the State of New York or the United States District Court for the Southern District of New York as the sole and exclusive forum for certain types of actions and proceedings that may be initiated by holders of the public warrants, which could limit the ability of public warrant holders to obtain a favorable judicial forum for disputes with the Company.
The Warrant Agreement provides that, subject to applicable law, (i) any action, proceeding or claim against the Company arising out of or relating in any way to the Warrant Agreement, including under the Securities Act, will be brought and enforced in the courts of the State of New York or the United States District Court for the Southern District of New York, and (ii) the Company irrevocably submit to such jurisdiction, which jurisdiction shall be the exclusive forum for any such action, proceeding or claim. We will waive any objection to such exclusive jurisdiction and that such courts represent an inconvenient forum.
Notwithstanding the foregoing, these provisions do not apply to suits brought to enforce any liability or duty created by the Exchange Act or any other claim for which the federal district courts of the United States of America are the sole and exclusive forum. Any person or entity purchasing or otherwise acquiring any interest in any of the public warrants shall be deemed to have notice of and to have consented to the forum provisions in the Warrant Agreement. If any action, the subject matter of which is within the scope the forum provisions of the Warrant Agreement is filed in a court other than a court of the State of New York or the United States District Court for the Southern District of New York (a “foreign action”) in the name of any holder of the public warrants, such holder shall be deemed to have consented to: (x) the personal jurisdiction of the state and federal courts located in the State of New York in connection with any action brought in any such court to enforce the forum provisions (an “enforcement action”), and (y) having service of process made upon such warrant holder in any such enforcement action by service upon such public warrant holder’s counsel in the foreign action as agent for such public warrant holder.
Thisprovision may limit a public warrant holder’s ability to bring a claim in a judicial forum that it finds favorable for disputes with the Company, which may discourage such lawsuits. Alternatively, if a court were to find this provision of the Warrant Agreement inapplicable or unenforceable with respect to one or more of the specified types of actions or proceedings, we may incur additional costs associated with resolving such matters in other jurisdictions, which could materially and adversely affect our business, financial condition and results of operations and result in a diversion of the time and resources of our management and Board of Directors.
choice-of-forum
55
USE OF PROCEEDS
All of the securities offered by the Selling Securityholders pursuant to this prospectus will be sold by the Selling Securityholders for their respective accounts. We will not receive any of the proceeds from these sales. Assuming the exercise in full of all of the Warrants for cash, we will receive an aggregate of approximately $332.5 million, but will not receive any proceeds from the sale of the shares of common stock issuable upon such exercise. We expect to use the net proceeds from the exercise of the Warrants, if any, for investment in growth and general corporate purposes. We will have broad discretion over the use of any proceeds from the exercise of the warrants. There is no assurance that the holders of the Warrants will elect to exercise for cash any or all of such Warrants. We believe the likelihood that warrant holders will exercise their Warrants, and therefore the amount of cash proceeds that we would receive, is dependent upon the market price of our common stock. If the market price for our common stock is less than $10.00 per share, we believe warrant holders will be unlikely to exercise their debt provider warrants, and if the market price for our common stock is less than $11.50 per share, we believe warrant holders will be unlikely to exercise their public warrants and private placement warrants. As of May 31, 2022, the closing price of our common stock was $5.19 per share. To the extent that any Warrants are exercised on a “cashless basis,” the amount of cash we would receive from the exercise of the Warrants will decrease.
The Selling Securityholders will pay any underwriting discounts and commissions and expenses incurred by the Selling Securityholders for brokerage, accounting, tax or legal services or any other expenses incurred by the Selling Securityholders in disposing of the securities. We will bear the costs, fees and expenses incurred in effecting the registration of the securities covered by this prospectus, including all registration and filing fees, NYSE listing fees and fees and expenses of our counsel and our independent registered public accounting firm.
56
DETERMINATION OF OFFERING PRICE
The offering price of the shares of common stock underlying the public warrants and the private placement warrants offered hereby is determined by reference to the exercise price of the warrants of $11.50 per share. The offering price of the shares of common stock underlying the debt provider warrants offered hereby is determined by reference to the exercise price of the warrants of $10.00 per share. The public warrants are listed on the NYSE under the symbol “LLAP WS.”
57
MARKET INFORMATION FOR COMMON STOCK AND DIVIDEND POLICY
Market Information
Our common stock and public warrants are currently listed on the NYSE under the symbols “LLAP” and “LLAP WS,” respectively. Prior to the Closing, Tailwind Two’s Class A ordinary shares and public warrants were listed on the NYSE under the symbols “TWNT” and “TWNT WS.” On May 31, 2022, the closing sale price of our common stock was $5.19 per share and the closing price of the public warrants was $0.50 per warrant. As of May 25, 2022, there were 81 holders of record of our common stock and one holder of record of the public warrants. Such numbers do not include beneficial owners holding our securities through nominee names.
Dividend Policy
We have never declared or paid any cash dividends on our capital stock. It is the present intention of the Board to retain all earnings, if any, for use in our business operations and, accordingly, our Board of Directors does not anticipate declaring any dividends in the foreseeable future. The payment of cash dividends in the future will be dependent upon our revenues and earnings, if any, capital requirements and general financial condition. The payment of any cash dividends is within the discretion of our Board of Directors. Further, our ability to declare dividends may be limited by the terms of outstanding indebtedness under the Francisco Partners Facility, the Amended Note Purchase Agreement and any other financing or other agreements entered into by us or our subsidiaries from time to time.
58
UNAUDITED PRO FORMA CONDENSED COMBINED FINANCIAL INFORMATION
Defined terms included below have the same meanings as terms defined and included elsewhere in this prospectus.
Introduction
On October 28, 2021, Legacy Terran Orbital entered into the Merger Agreement with Tailwind Two. On March 25, 2022, Legacy Terran Orbital completed the merger with Tailwind Two, which resulted in Legacy Terran Orbital becoming a wholly-owned subsidiary of Tailwind Two. In connection with the Merger, Tailwind Two was renamed Terran Orbital Corporation and Legacy Terran Orbital was renamed Terran Orbital Operating Corporation. As a result of the Merger, all of Legacy Terran Orbital’s issued and outstanding common stock was converted into shares of Terran Orbital’s common stock using an exchange ratio of 27.585 shares of Terran Orbital common stock per each share of Legacy Terran Orbital’s common stock. In addition, Legacy Terran Orbital’s convertible preferred stock and certain warrants were exercised and converted into shares of Legacy Terran Orbital’s common stock immediately prior to the Merger, and in turn, were converted into shares of Terran Orbital’s common stock as a result of the Merger.
In connection with the Merger, approximately $29 million of cash and marketable securities held in trust, net of redemptions by Tailwind Two’s public shareholders, became available for use by Terran Orbital as well as proceeds received from the contemporaneous sale of common stock in connection with the closing of a PIPE investment with a contractual amount of $51 million (the “”). In addition, Terran Orbital received additional proceeds from the issuance of debt contemporaneously with the Merger. The aggregate cash raised will be used for general corporate purposes, the partial paydown of debt, the payment of transaction costs and the payment of other costs directly or indirectly attributable to the Merger.
PIPE Investment
The Company is providing the following unaudited pro forma condensed combined financial information to aid you in your analysis of the financial aspects of the Merger. The unaudited pro forma condensed combined financial information has been prepared in accordance with Article 11 of Regulation
S-X
and should be read in conjunction with the accompanying notes.The unaudited pro forma condensed combined statement of operations for the year ended December 31, 2021 combines the audited consolidated statement of operations of Legacy Terran Orbital for the year ended December 31, 2021 with the audited consolidated statement of operations of Tailwind Two for the year ended December 31, 2021, giving effect to the Merger as if it had been consummated on January 1, 2021.
The unaudited pro forma condensed combined statement of operations for the three months ended March 31, 2022 combines the unaudited condensed consolidated statement of operations of Terran Orbital for the three months ended March 31, 2022 with the unaudited condensed consolidated statement of operations of Tailwind Two for the period January 1, 2022 through March 25, 2022, giving effect to the Merger as if it had been consummated on January 1, 2021.
The unaudited pro forma condensed combined financial information was derived from, and should be read in conjunction with, the following historical financial statements and the accompanying notes:
| • | The historical audited consolidated financial statements of Legacy Terran Orbital as of and for the year ended December 31, 2021 included in the financial statements attached to this prospectus; |
| • | The historical audited consolidated financial statements of Tailwind Two as of and for the year ended December 31, 2021 included in the financial statements attached to this prospectus; and |
| • | The historical unaudited condensed consolidated financial statements of Terran Orbital as of and for the three months ended March 31, 2022 included in the financial statements attached to this prospectus. |
The foregoing historical financial statements have been prepared in accordance with GAAP. The unaudited pro forma condensed combined financial information has been prepared based on the aforementioned historical financial statements and the assumptions and adjustments as described in the notes to the unaudited pro forma condensed combined financial information. The pro forma adjustments reflect transaction accounting adjustments related to the Merger, which is discussed in further detail below. The unaudited pro forma condensed combined financial statements are presented for illustrative purposes only and do not purport to represent Terran Orbital’s consolidated results of operations that would actually have occurred had the Merger been consummated on the dates assumed or to project Terran Orbital’s consolidated results of operations for any future date or period.
59
The unaudited pro forma condensed combined financial information should also be read together with the section titled “.”
Management’s Discussion and Analysis of Financial Condition and Results of Operations
Accounting for the Merger
While Legacy Terran Orbital became a wholly-owned subsidiary of Terran Orbital, Legacy Terran Orbital was deemed to be the acquirer in the Merger for accounting purposes. Accordingly, the Merger will be accounted for as a reverse recapitalization, in which case the condensed consolidated financial statements of Terran Orbital represent a continuation of Legacy Terran Orbital and the issuance of common stock in exchange for the net assets of Tailwind Two recognized at historical cost and no recognition of goodwill or other intangible assets. The treatment of the Merger as a reverse recapitalization was based upon the
pre-merger
shareholders of Legacy Terran Orbital holding the majority of the voting interests of Terran Orbital, Legacy Terran Orbital’s existing management team serving as the initial management team of Terran Orbital, Legacy Terran Orbital’s appointment of the majority of the initial Board of Directors of Terran Orbital, and Legacy Terran Orbital’s operations comprising the ongoing operations of Terran Orbital.Basis of Pro Forma Presentation
The historical financial information has been adjusted to give pro forma effect to the transaction accounting required for the Merger. The adjustments in the unaudited pro forma condensed combined financial information have been identified and presented to provide relevant information necessary for an accurate understanding of Terran Orbital subsequent to the Merger.
The unaudited pro forma condensed combined financial information is for illustrative purposes only. The financial results may have been different had the companies always been combined. You should not rely on the unaudited pro forma condensed combined financial information as being indicative of the historical results that would have been achieved had the companies always been combined or the future results that the combined entity will experience. Terran Orbital and Tailwind Two have not had any historical relationship prior to the Merger. Accordingly, no pro forma adjustments were required to eliminate activities between the companies.
Accounting Policies
Upon consummation of the Merger, management did not identify any differences in accounting policies that would have a material impact on the unaudited pro forma condensed combined financial information.
60
Unaudited Pro Forma Condensed Combined Statement of Operations
For the Three Months Ended March 31, 2022
(in thousands, except share and per share data)
Terran Orbital Historical | Tailwind Two Historical | Pro Forma Adjustments | Terran Orbital Pro Forma Combined | |||||||||||||||||||||
Revenue | $ | 13,120 | $ | — | $ | — | $ | 13,120 | ||||||||||||||||
Cost of sales | 15,953 | — | (2,053 | ) | (H | ) | 13,900 | |||||||||||||||||
Gross loss | (2,833 | ) | — | 2,053 | (780 | ) | ||||||||||||||||||
Selling, general, and administrative expenses | 30,217 | 12,005 | 2,365 | (A | ) | 17,672 | ||||||||||||||||||
| (11,794 | ) | (F | ) | |||||||||||||||||||||
| (15,121 | ) | (H | ) | |||||||||||||||||||||
Loss from operations | (33,050 | ) | (12,005 | ) | 26,603 | (18,452 | ) | |||||||||||||||||
Interest expense, net | 2,923 | — | 8,496 | (B | ) | 7,943 | ||||||||||||||||||
| (4,194 | ) | (D | ) | |||||||||||||||||||||
| 718 | (E | ) | ||||||||||||||||||||||
Loss on extinguishment of debt | 23,141 | — | (23,141 | ) | (E | ) | — | |||||||||||||||||
Change in fair value of warrant and derivative liabilities | 11,853 | (3,281 | ) | (17,043 | ) | (G | ) | (8,471 | ) | |||||||||||||||
Interest earned on marketable securities held in trust | — | (22 | ) | 22 | (C | ) | — | |||||||||||||||||
Other expense | 403 | — | (370 | ) | (E | ) | 33 | |||||||||||||||||
Loss before income taxes | (71,370 | ) | (8,702 | ) | 62,115 | (17,957 | ) | |||||||||||||||||
Provision for income taxes | 2 | — | — | 2 | ||||||||||||||||||||
Net loss | $ | (71,372 | ) | $ | (8,702 | ) | $ | 62,115 | $ | (17,959 | ) | |||||||||||||
Weighted average shares outstanding - Class A redeemable common stock | 34,500,000 | |||||||||||||||||||||||
Basic and diluted loss per share - Class A redeemable common stock | $ | (0.20 | ) | |||||||||||||||||||||
Weighted average shares outstanding - Class B common stock | 8,625,000 | |||||||||||||||||||||||
Basic and diluted loss per share - Class B common stock | $ | (0.20 | ) | |||||||||||||||||||||
Weighted-average shares outstanding - basic and diluted | 83,643,940 | 137,295,455 | (I | ) | ||||||||||||||||||||
Net loss per share - basic and diluted | $ | (0.85 | ) | $ | (0.13 | ) | (I | ) | ||||||||||||||||
61
Unaudited Pro Forma Condensed Combined Statement of Operations
For the Year Ended December 31, 2021
(in thousands, except share and per share data)
Legacy Terran Orbital Historical | Tailwind Two Historical | Pro Forma Adjustments | Terran Orbital Pro Forma Combined | |||||||||||||||||||||
Revenue | $ | 40,906 | $ | — | $ | — | $ | 40,906 | ||||||||||||||||
Cost of sales | 33,912 | — | — | 33,912 | ||||||||||||||||||||
Gross profit | 6,994 | — | — | 6,994 | ||||||||||||||||||||
Selling, general and administrative expenses | 43,703 | 4,400 | 16,432 | (AA | ) | 122,703 | ||||||||||||||||||
| 13,646 | (BB | ) | ||||||||||||||||||||||
| 44,522 | (CC | ) | ||||||||||||||||||||||
Loss from operations | (36,709 | ) | (4,400 | ) | (74,600 | ) | (115,709 | ) | ||||||||||||||||
Interest expense, net | 7,965 | — | 25,867 | (DD | ) | 33,114 | ||||||||||||||||||
| (718 | ) | (FF | ) | |||||||||||||||||||||
Loss on extinguishment of debt | 96,024 | — | 23,141 | (FF | ) | 119,165 | ||||||||||||||||||
Change in fair value of warrant and derivative liabilities | (1,716 | ) | (2,509 | ) | 17,043 | (GG | ) | 13,259 | ||||||||||||||||
| 441 | (II | ) | ||||||||||||||||||||||
Transaction costs allocable to warrants | — | 649 | — | 649 | ||||||||||||||||||||
Interest earned on investments held in trust account | — | (90 | ) | 90 | (EE | ) | — | |||||||||||||||||
Other (income) expense | (38 | ) | — | 370 | (FF | ) | 12,126 | |||||||||||||||||
| 11,794 | (HH | ) | ||||||||||||||||||||||
Loss before income taxes | (138,944 | ) | (2,450 | ) | (152,628 | ) | (294,022 | ) | ||||||||||||||||
Provision for income taxes | 38 | — | 38 | |||||||||||||||||||||
Net loss | $ | (138,982 | ) | $ | (2,450 | ) | $ | (152,628 | ) | $ | (294,060 | ) | ||||||||||||
Weighted average shares outstanding - Class A redeemable common stock | 28,167,123 | |||||||||||||||||||||||
Basic and diluted loss per share - Class A redeemable common stock | $ | (0.07 | ) | |||||||||||||||||||||
Weighted average shares outstanding - Class B common stock | 8,418,493 | |||||||||||||||||||||||
Basic and diluted loss per share - Class B common stock | $ | (0.07 | ) | |||||||||||||||||||||
Weighted-average shares outstanding - basic and diluted | 2,780,993 | 137,295,455 | (JJ | ) | ||||||||||||||||||||
Net loss per share - basic and diluted | $ | (49.98 | ) | $ | (2.14 | ) | (JJ | ) | ||||||||||||||||
62
NOTES TO UNAUDITED PRO FORMA CONDENSED COMBINED FINANCIAL INFORMATION
1. Basis of Presentation
The effects of the Merger are reflected in the unaudited condensed consolidated balance sheet as of March 31, 2022. Accordingly, an unaudited pro forma condensed combined balance sheet is not presented. The pro forma adjustments for purposes of the unaudited pro forma condensed combined statements of operations for the three months ended March 31, 2022 and for the year ended December 31, 2021 have been prepared as if the Merger had been consummated on January 1, 2021.
The unaudited pro forma condensed combined financial information has been prepared assuming the following methods of accounting in accordance with GAAP.
The Merger is being accounted for as a reverse recapitalization in accordance with GAAP. Accordingly, for accounting purposes, the financial statements of Terran Orbital will represent a continuation of the financial statements of Legacy Terran Orbital with the acquisition being treated as the equivalent of Terran Orbital issuing stock for the net assets of Tailwind Two, accompanied by a recapitalization. The net assets of Tailwind Two have been stated at historical cost, with no goodwill or other intangible assets recorded.
The unaudited pro forma condensed combined financial information does not give effect to any synergies, operating efficiencies, tax savings or cost savings that may be associated with the Merger and related transactions.
The unaudited pro forma condensed combined financial information does not give effect to any income tax benefit associated with the pro forma adjustments as the generation of additional net operating losses are offset by a full valuation allowance recorded on such net operating losses as it is
more-likely-than-not
that the net operating losses will not be utilized.The pro forma adjustments, which are described in the accompanying notes, reflecting the completion of the Merger and related transactions are based on information and assumptions and methodologies that management believes are reasonable under the circumstances. As the unaudited pro forma condensed combined financial information has been prepared in accordance with Article 11 of Regulation S-X, it is likely that the actual adjustments will differ from the pro forma adjustments and it is possible the difference may be material. Management believes that its assumptions and methodologies provide a reasonable basis for presenting all of the significant effects of the Merger and related transactions based on information available to management and that the pro forma adjustments give appropriate effect to those assumptions and are properly applied in the unaudited pro forma condensed combined financial information.
The unaudited pro forma condensed combined financial information is not necessarily indicative of what the actual results of operations and financial position would have been had the Merger and related transactions taken place on the dates indicated, nor are they indicative of the future consolidated results of operations of Terran Orbital. They should be read in conjunction with the historical financial statements and notes thereto of Terran Orbital, Legacy Terran Orbital and Tailwind Two included in this prospectus.
One-time
non-recurring
charges recorded prior to, or concurrent with, the Merger are reflected in the unaudited pro forma condensed combined statement of operations for the year ended December 31, 2021.63
2. Adjustments and Assumptions to the Unaudited Pro Forma Condensed Combined Statement of Operations for the Three Months ended March 31, 2022
The adjustments included in the unaudited pro forma condensed combined statement of operations for the three months ended March 31, 2022 are as follows:
| (A) | Represents the ongoing recognition of share-based compensation expense associated with Terran Orbital restricted stock units (“RSUs”) that included a liquidity event, such as the Merger, as a vesting condition. Prior to the Merger, the RSUs were not probable of vesting and no share-based compensation expense was previously recognized. |
| (B) | Represents the ongoing recognition of interest expense, inclusive of amortization of discount on debt and deferred issuance costs, on the Company’s long-term debt structure as revised in connection with the Merger. |
| (C) | Represents the removal of interest earned on marketable securities held in the trust account. |
| (D) | Represents the removal of recorded interest expense, inclusive of amortization of discount on debt and deferred issuance costs, on the Company’s long-term debt structure prior to the Merger. |
| (E) | Represents the removal of non-recurring entries recorded related to interest expense, loss on extinguishment of debt, and financing fees expensed in connection with the Merger. |
64
| (F) | Represents the removal of non-recurring direct and incremental transaction costs recorded by Tailwind Two prior to the Merger. |
| (G) | Represents the removal of non-recurring entries recorded related to fair value remeasurements of certain liability-classified warrants and derivatives that were settled or reclassified to equity in connection with the Merger. |
| (H) | Represents the removal of the non-recurring cumulative recognition of share-based compensation expense recorded associated with Terran Orbital RSUs that included a liquidity event, such as the Merger, as a vesting condition. |
| (I) | Represents net loss per share computed by dividing net loss by the weighted-average shares outstanding. |
65
3. Adjustments and Assumptions to the Unaudited Pro Forma Condensed Combined Statement of Operations for the year ended December 31, 2021
The adjustments included in the unaudited pro forma condensed combined statement of operations for the year ended December 31, 2021 are as follows:
| (AA) | Represents the non-recurring cumulative recognition of share-based compensation expense associated with Terran Orbital RSUs that included a liquidity event, such as the Merger, as a vesting condition. Prior to the Merger, the RSUs were not probable of vesting and no share-based compensation expense was previously recognized. |
| (BB) | Represents the ongoing recognition of share-based compensation expense associated with Terran Orbital RSUs discussed in (AA). |
| (CC) | Represents the recognition of share-based compensation expense associated with Terran Orbital retention restricted stock units (“ Retention RSUs 30-trading day period. The derived service period for the Retention RSUs was estimated to be less than one year from the date of the Merger based on the median weighted-average triggering event period determined using the Monte Carlo simulation model. As the derived service period is less than one year, the share-based compensation expense associated with the Retention RSUs will be recognized over aone-year period beginning from the consummation of the Merger. Accordingly, the recognition of the share-based compensation expense has been applied on a nonrecurring basis. |
| (DD) | Represents the ongoing recognition of interest expense, inclusive of amortization of discount on debt and deferred issuance costs, on the Company’s long-term debt structure as revised in connection with the Merger. |
| (EE) | Represents the removal of interest earned on marketable securities held in the trust account. |
| (FF) | Represents the recognition of non-recurring adjustments during 2021 related to interest expense, loss on extinguishment of debt, and financing fees expensed in connection with the Merger. |
| (GG) | Represents the recognition of non-recurring adjustments during 2021 related to fair value remeasurements of certain liability-classified warrants and derivatives that were settled or reclassified to equity in connection with the Merger. |
| (HH) | Represents the recognition of non-recurring direct and incremental transaction costs incurred by Tailwind Two prior to the Merger. |
| (II) | Represents the removal of recorded fair value remeasurements on Terran Orbital’s liability-classified warrants and derivatives that were settled, issued, or expired in connection with the Merger. |
| (JJ) | Represents net loss per share computed by dividing net loss by the weighted-average shares outstanding. |
66
MANAGEMENT’S DISCUSSION AND ANALYSIS OF FINANCIAL CONDITION AND RESULTS OF OPERATIONS
The following discussion and analysis provides information which our management believes is relevant to an assessment and understanding of our results of operations and financial condition. The discussion should be read in conjunction with Legacy Terran Orbital’s historical audited annual financial statements as of and for the years ended December 31, 2021 and 2020 and unaudited condensed consolidated financial statements as of and for the three months ended March 31, 2022 and 2021, and the accompanying notes thereto included elsewhere in this prospectus. The discussion and analysis should also be read together with the unaudited pro forma condensed combined financial information in the section titled “Unaudited Pro Forma Condensed Combined Financial Information.” This discussion contains forward-looking statements based upon our current expectations, estimates and projections, and involves numerous risks and uncertainties. Actual results may differ materially from those contained in any forward-looking statements due to, among other considerations, the matters discussed in the sections titled “Risk Factors” and “Cautionary Note Regarding Forward-Looking Statements.”
OVERVIEW
Terran Orbital Corporation, formerly known as Tailwind Two Acquisition Corp. (“”), together with its wholly-owned subsidiaries (collectively, the “,” “,” “,” “,” and “”), is a leading manufacturer of small satellites primarily serving the United States (“”) aerospace and defense industry. Through its subsidiary Tyvak Nano-Satellite Systems, Inc. (“”), the Company providessatellite solutions by combining satellite design, production, launch planning, mission operations, and”). Through its subsidiary PredaSAR Corporation (“”), the Company is developing what it believes will be the world’s largest, most advanced NextGen Earth Observation constellation to provide near persistent, near real-time Earth imagery.
Tailwind Two
Company
we
our
us
Terran Orbital
U.S.
Tyvak
end-to-end
in-orbit
support to meet the needs of its customers. The Company accesses the international market through both Tyvak and its Torino, Italy based subsidiary, Tyvak International S.R.L. (“Tyvak International
PredaSAR
BASIS OF PRESENTATION
All financial information presented in this section includes the accounts of Terran Orbital Corporation and its subsidiaries, and has been prepared in U.S. dollars in accordance with generally accepted accounting principles in the United States of America (“”). All intercompany transactions have been eliminated.
GAAP
The Company’s Chief Executive Officer is its chief operating decision maker (the “”). The Company reports segment information based on how the CODM evaluates performance and makes decisions about how to allocate resources. Accordingly, the Company has two operating and reportable segments: Satellite Solutions and Earth Observation Solutions.
CODM
The reportable segments are defined as follows:
• | Satellite Solutions |
The Satellite Solutions segment is a vertically integrated satellite provider with modern facilities and a global ground station network that deliverssatellite solutions, including spacecraft design, development, launch services and
end-to-end
on-orbit
operations for critical missions across a number of applications in a variety of orbits to governmental agencies and commercial businesses.• | Earth Observation Solutions |
Through the Satellite Solutions segment, the Earth Observation Solutions segment has commenced developing satellites and intends to continue to develop, build, launch and operate a constellation of Earth observation satellites that will feature Synthetic Aperture Radar (“”) and electro-optical capabilities to provide Earth observation data and mission solutions that it believes will be distinguished by breadth of coverage, revisit rates and ability to observe and detect during day and night and through clouds and other interference. In addition, the Earth Observation Solutions segment plans to provide secondary payload solutions and onboard data processing capabilities on its satellite constellation, including sensors, optical links or other mission solutions. The Earth Observation Solutions segment is still in its developmental stage and does not yet generate any material revenue. The scope and timing of the satellite constellation is subject to continuing assessments of customer demand and the Company’s financial and other resources. The Company anticipates completing two satellites of the constellation currently under construction, which the Company anticipates launching in late 2022 or the first half of 2023, while the remainder of the satellites of the constellation will be temporarily delayed based on its prioritization of production capacity to U.S. Government programs coupled with the level of our financial resources as of March 31, 2022.
SAR
67
The CODM uses income (loss) from operations by segment as the segment profitability measure in order to evaluate segment performance. Income (loss) from operations by segment excludes share-based compensation expense and corporate and other costs included within the Company’s consolidated income (loss) from operations.
FACTORS AFFECTING OPERATING RESULTS
The Company’s financial success is based on its ability to deliver high quality products and services on a timely basis and at an economical price for its customers. With the majority of the Company’s contracts with customers reflecting firm fixed pricing structures, its gross profit is dependent on the efficient and effective execution of its contracts. The Company’s ability to maximize gross profit may be impacted by, but not limited to, unanticipated cost overruns, disruptions in its supply chains, and mix of customer contracts based on newer technology demonstrations versus existing technology.
From time to time, the Company may strategically enter into contracts with low or negative margins relative to other contracts or that are at risk of cost overruns. This may occur due to strategic decisions built around positioning itself for future contracts or to enhance the Company’s product and service offerings. However, in some instances, loss contracts may occur from unforeseen cost overruns which are not recoverable from the customer. The Company establishes loss reserves on contracts in which the estimated cost at-completion exceeds the estimated revenue. The loss reserves are recorded in the period in which a loss is determined.
As of December 31, 2019, the Company’s reserve for anticipated losses on contracts totaled $7 million and has decreased to $965 thousand as of March 31, 2022. The Company’s reserve for anticipated losses on contracts resulted from a combination of strategic decisions and unforeseen cost overruns and primarily related to contracts entered into prior to December 31, 2018. The decrease in the reserve for anticipated losses on contracts was related to the completion, partial completion, or modification of such contracts.
The Company is actively executing on its growth initiatives with significant increases in headcount as well as the expansion of manufacturing facilities and office space in order to position itself to be awarded larger contracts with recurring revenue opportunities that will lay the foundation for its long-term success. The Company’s portfolio of contracts includes several technology demonstrations, studies, and prototypes with the potential to convert into contracts to support future constellations. As of March 31, 2022, the Company has identified approximately 140 opportunities representing over $12 billion in potential revenue for its Satellite Solutions segment.
The Company may experience variability in the profitability of its contracts in the future and that such future variability may occur at levels and frequencies different from historical experience. Such variability in profitability may be due to strategic decisions, cost overruns or other circumstances within or outside of the Company’s control. Accordingly, the Company’s historical experience with profitability on our contracts is not indicative or predictive of future experience.
COVID-19
PandemicDuring March 2020, the World Health Organization declared the outbreak of a novel coronavirus as a pandemic (the “”), which has become increasingly widespread across the globe. The
COVID-19
PandemicCOVID-19
Pandemic has negatively impacted the global economy, disrupted global supply chains, and created significant volatility and disruption in the financial and capital markets.During March 2020, the Coronavirus Aid, Relief, and Economic Security Act (the “”) was signed into law. During May 2020, the Company received $2.5 million related to the origination of a loan pursuant to the U.S. Small Business Administration (“”) Paycheck Protection Program under Title I of the CARES Act (the “”). In June 2020, the terms of the PPP Loan were amended with the passing of the Paycheck Protection Program Flexibility Act (“”). For any amounts that were unforgiven, the terms of the loan called for an interest rate of 1% and a maturity date of two years. During October 2020, the Company filed for forgiveness of the PPP Loan as 100% of the proceeds were utilized for qualified payroll and payroll related costs in accordance with the applicable provisions governing the PPP Loan. During June 2021, the SBA paid the lender the full amount of principal and interest on the PPP Loan. The Company recorded a gain on extinguishment of the PPP Loan of approximately $2.6 million in June 2021. There were no contractual principal or interest payments made by the Company prior to the forgiveness of the PPP Loan.
CARES Act
SBA
PPP Loan
PPPFA
The CARES Act also includes several significant business income tax provisions. In connection with the CARES Act, the Company benefited from the five-year carryback rule which allowed the Company to carryback certain of its federal net operating losses (“”) to the 2015 and 2016 tax years.
NOLs
The
COVID-19
Pandemic has contributed to a worldwide shortage of electronic components which has resulted in longer than historically experienced lead times for such electronic components. The reduced availability to receive electronic components used in the Company’s operations has negatively affected its timing and ability to deliver products and services to customers as well as increased its costs in recent periods. The Company considered the emergence and pervasive economic impact of theCOVID-19
Pandemic in its assessment of its financial position, results of operations, cash flows, and certain accounting estimates as of and for the three months ended March 31, 2022 and as of and for the years ended December 31, 2021 and 2020. Due to the evolving and uncertain nature of theCOVID-19
Pandemic, it is possible that the effects of theCOVID-19
Pandemic could materially impact the Company’s estimates and consolidated financial statements in future reporting periods.68
For additional discussion of the impacts and risks to Terran Orbital’s business from the” of this Amendment.
COVID-19
Pandemic, please refer to the section entitled “Risk Factors
RECENT DEVELOPMENTS
The comparability of the Company’s results of operations has been impacted by the following events:
69
Merger with Tailwind Two
Prior to March 25, 2022, Tailwind Two was a publicly listed special purpose acquisition company incorporated as a Cayman Islands exempted company. On March 25, 2022, Tailwind Two acquired Terran Orbital Operating Corporation, formerly known as Terran Orbital Corporation (“”) (the “”). In connection with the Merger, Tailwind Two filed a notice of deregistration with the Cayman Islands Registrar of Companies and filed a certificate of incorporation and a certificate of corporate domestication with the Secretary of State of the State of Delaware, resulting in Tailwind Two becoming a Delaware corporation and changing its name from Tailwind Two to Terran Orbital Corporation. The Merger resulted in Legacy Terran Orbital becoming a wholly-owned subsidiary of Terran Orbital Corporation.
Legacy Terran Orbital
Merger
As a result of the Merger, all of Legacy Terran Orbital’s issued and outstanding common stock was converted into shares of Terran Orbital Corporation’s common stock using an exchange ratio of 27.585 shares of Terran Orbital Corporation’s common stock per each share of Legacy Terran Orbital’s common stock. In addition, Legacy Terran Orbital’s convertible preferred stock and certain warrants were exercised and converted into shares of Legacy Terran Orbital’s common stock immediately prior to the Merger, and in turn, were converted into shares of Terran Orbital Corporation’s common stock as a result of the Merger. Further, in connection with the Merger, Legacy Terran Orbital’s share-based compensation plan and related share-based compensation awards were cancelled and exchanged or converted, as applicable, with a new share-based compensation plan and related share-based compensation awards of Terran Orbital Corporation.
While Legacy Terran Orbital became a wholly-owned subsidiary of Terran Orbital Corporation, Legacy Terran Orbital was deemed to be the acquirer in the Merger for accounting purposes. Accordingly, the Merger was accounted for as a reverse recapitalization, in which case the condensed consolidated financial statements of the Company represent a continuation of Legacy Terran Orbital and the issuance of common stock in exchange for the net assets of Tailwind Two recognized at historical cost and no recognition of goodwill or other intangible assets. Operations prior to the Merger are those of Legacy Terran Orbital and all share and per-share data included in these condensed consolidated financial statements have been retroactively adjusted to give effect to the Merger. In addition, the number of shares subject to, and the exercise price of, the Company’s outstanding options and warrants were adjusted to reflect the Merger. The treatment of the Merger as a reverse recapitalization was based upon the pre-merger shareholders of Legacy Terran Orbital holding the majority of the voting interests of Terran Orbital Corporation, Legacy Terran Orbital’s existing management team serving as the initial management team of Terran Orbital Corporation, Legacy Terran Orbital’s appointment of the majority of the initial board of directors of Terran Orbital Corporation, and Legacy Terran Orbital’s operations comprising the ongoing operations of the Company.
In connection with the Merger, approximately $29 million of cash and marketable securities held in trust, net of redemptions by Tailwind Two’s public shareholders, became available for use by the Company as well as proceeds received from the contemporaneous sale of common stock in connection with the closing of a PIPE investment with a contractual amount of $51 million (the “”). In addition, the Company received additional proceeds from the issuance of debt contemporaneously with the Merger. The aggregate cash raised will be used for general corporate purposes, the partial paydown of debt, the payment of transaction costs and the payment of other costs directly or indirectly attributable to the Merger.
PIPE Investment
Beginning on March 28, 2022, the Company’s common stock and public warrants began trading on the New York Stock Exchange (the “NYSE”) under the symbols “LLAP” and “LLAP WS,” respectively.
Prior to the extraordinary general meeting of Tailwind Two in connection with the Business Combination, holders of 31,565,677 Tailwind Two’s Class A Ordinary Shares exercised their right to redeem those shares for cash at a price of $10.00 per share, for an aggregate of $315.7 million, which represented approximately 91% of the total Tailwind Two Class A Ordinary Shares then outstanding. The Total Resale Shares being offered in this prospectus represents approximately 102% of the current total outstanding shares of our common stock as of May 25, 2022 (and approximately 88% of the total of (a) outstanding shares of common stock, plus (b) underlying shares reserved for issuance related to vested and unvested restricted stock units and options). Additionally, if all the Offered Warrants are exercised for cash, the Selling Securityholders would own an additional 18,855,606 shares of common stock, representing an additional 13.7% of the total outstanding shares of our common stock as of May 25, 2022 (and approximately 10.6% of the total of (a) the total outstanding shares of common stock, plus (b) underlying shares reserved for issuance related to vested and unvested restricted stock units and options, plus (c) such additional shares reserved for issuance related to such Warrants).
The market price for shares of our common stock could decline as a result of the sales of our common stock being offered in this prospectus, and such declines could be significant. Despite such a decline in the public trading price of our common stock and the fact that the closing price of our common stock on May 25, 2022 is below the closing price immediately following the closing of the Business Combination, certain Selling Securityholders may still be incentivized to sell and experience a positive rate of return on the securities they purchased prior to the closing of the Business Combination, but our public securityholders may not experience a similar rate of return on the securities they purchased due to differences in the purchase prices and the current trading price.
Refer to the discussions below under “” for further details regarding our financing transactions which occurred in connection with the Tailwind Two Merger. For more information about the estimated financial impacts of the Merger, see “.”
Liquidity and Capital Resources
Unaudited Pro Forma Condensed Combined Financial Information
Public Company Costs
As a result of the Merger, the Company has incurred and will continue to incur additional legal, accounting, board compensation, and other expenses that it did not previously incur, including costs associated with SEC reporting and corporate governance requirements.
70
These requirements include compliance with the Sarbanes-Oxley Act of 2002 as well as other rules implemented by the SEC and the national securities exchanges. The Company’s financial statements for the periods following the Merger will reflect the impact of these expenses.
RESULTS OF OPERATIONS
Three Months Ended March 31, 2022 Compared to Three Months Ended March 31, 2021
The following table presents the Company’s consolidated results of operations for the three months ended March 31, 2022 and 2021:
Three Months Ended March 31, | ||||||||||||
(in thousands) | 2022 | 2021 | $ Change | |||||||||
Revenue | $ | 13,120 | $ | 10,494 | $ | 2,626 | ||||||
Cost of sales | 15,953 | 9,734 | 6,219 | |||||||||
Gross (loss) profit | (2,833 | ) | 760 | (3,593 | ) | |||||||
Selling, general, and administrative expenses | 30,217 | 6,673 | 23,544 | |||||||||
Loss from operations | (33,050 | ) | (5,913 | ) | (27,137 | ) | ||||||
Interest expense, net | 2,923 | 907 | 2,016 | |||||||||
Loss on extinguishment of debt | 23,141 | 70,667 | (47,526 | ) | ||||||||
Change in fair value of warrant and derivative liabilities | 11,853 | (34 | ) | 11,887 | ||||||||
Other expense | 403 | 15 | 388 | |||||||||
Loss before income taxes | (71,370 | ) | (77,468 | ) | 6,098 | |||||||
Provision for income taxes | 2 | 28 | (26 | ) | ||||||||
Net loss | $ | (71,372 | ) | $ | (77,496 | ) | $ | 6,124 | ||||
Revenue
The following table presents revenue by segment for the three months ended March 31, 2022 and 2021:
Three Months Ended March 31, | ||||||||||||
(in thousands) | 2022 | 2021 | $ Change | |||||||||
Satellite Solutions | $ | 12,974 | $ | 10,494 | $ | 2,480 | ||||||
Earth Observation Solutions | 146 | — | 146 | |||||||||
Revenue | $ | 13,120 | $ | 10,494 | $ | 2,626 | ||||||
The increase in revenue attributable to the Satellite Solutions segment was primarily due to the continued and increased level of progress made in satisfying customer contracts and reflects the ongoing favorable impact from significant contract wins and modifications in recent periods.
During the three months ended March 31, 2022, the Company adjusted the estimate-at-completion (“”) on certain firm fixed price contracts, which had an estimated $3 million negative impact to revenue in the Satellite Solutions segment. While the Company believes its estimates as of March 31, 2022 consider all relevant and known information, such as supply chain and related production challenges, additional adjustments to its EACs could occur and have an impact on its revenue in future reporting periods.
EAC
The Earth Observation Solutions segment was still in its developmental stage and generated limited revenue by providing expert analyses and planned technology demonstrations.
Cost of Sales
The following table presents cost of sales by segment and other components for the three months ended March 31, 2022 and 2021:
Three Months Ended March 31, | ||||||||||||
(in thousands) | 2022 | 2021 | $ Change | |||||||||
Satellite Solutions | $ | 13,803 | $ | 9,720 | $ | 4,083 | ||||||
Earth Observation Solutions | 37 | — | 37 | |||||||||
Share-based compensation expense | 2,113 | 14 | 2,099 | |||||||||
Cost of Sales | $ | 15,953 | $ | 9,734 | $ | 6,219 | ||||||
71
The increase in cost of sales was primarily due to an increase of $4 million in labor, materials, third-party services, overhead and other direct costs incurred in satisfying customer contracts as part of its growth initiatives in the Satellite Solutions segment as well as an increase in share-based compensation expense due to a $2.1 million non-recurring cumulative recognition of share-based compensation expense associated with awards that included a liquidity event, such as the Merger, as a vesting condition. Prior to the Merger, the awards were not probable of vesting and no share-based compensation expense was previously recognized.
During the three months ended March 31, 2022, the Company adjusted the EAC on certain firm fixed price contracts, which had an estimated $0.7 million negative impact to cost of sales in the Satellite Solutions segment. While the Company believes its estimates as of March 31, 2022 consider all relevant and known information, such as supply chain and related production challenges, additional adjustments to its EACs could occur and have an impact on its cost of sales in future reporting periods.
The Earth Observation Solutions segment was still in its developmental stage and generated limited revenue by providing expert analyses and planned technology demonstrations, incurring limited cost of sales.
Selling, General, and Administrative
The following table presents selling, general, and administrative expenses by segment and other components for the three months ended March 31, 2022 and 2021:
Three Months Ended March 31, | ||||||||||||
(in thousands) | 2022 | 2021 | $Change | |||||||||
Satellite Solutions | $ | 5,219 | $ | 1,754 | $ | 3,465 | ||||||
Earth Observation Solutions | 768 | 912 | (144 | ) | ||||||||
Corporate and other | 9,008 | 3,853 | 5,155 | |||||||||
Share-based compensation expense | 15,222 | 154 | 15,068 | |||||||||
Selling, general, and administrative expenses | $ | 30,217 | $ | 6,673 | $ | 23,544 | ||||||
The increase in selling, general, and administrative expenses was primarily due to the following:
| • | an increase in share-based compensation expense due to a $15.1 million non-recurring cumulative recognition of share-based compensation expense associated with awards that included a liquidity event, such as the Merger, as a vesting condition; |
| • | an increase in corporate salaries and wages of $2.5 million as well as an increase in accounting, legal, and other professional fees of $1.2 million as part of the Company’s efforts of becoming a public company; |
| • | an increase in expenses, net of overhead allocations, in the Satellite Solutions segment due to incremental headcount, additional leases for manufacturing facilities and office space, and other selling, general, and administrative expenses as part of the Company’s growth initiatives; |
| • | an increase in corporate facility costs of $566 thousand due to new leases for office locations commencing in 2021; |
| • | an increase of $184 thousand in depreciation and amortization expense in the Earth Observation Solutions segment due to a company-owned satellite that was placed in service in 2021; and |
| • | partially offset by a reduction in various other expenses in the Earth Observation Solutions. |
Interest Expense, net
The increase in interest expense, net was due to an increase in contractual interest of $2 million as a result of higher debt balances and higher interest rates as a result of the Company’s financing transactions during 2021 and 2022, an increase in amortization related to discount on debt of $438 thousand as a result of its financing transactions, partially offset by an increase in capitalized interest of $434 thousand associated with the development of the NextGen Earth Observation constellation.
72
Loss on Extinguishment of Debt
During the three months ended March 31, 2022, loss on extinguishment of debt totaled $23 million, which related to the refinancing and extinguishment of the Company’s debt obligations in connection with the Merger.
During the three months ended March 31, 2021, loss on extinguishment of debt totaled $71 million, which related to the refinancing of convertible note instruments.
Change in Fair Value of Warrant and Derivative Liabilities
The change in fair value of warrant and derivative liabilities relates to the periodic fair value remeasurement of liability-classified warrants and derivatives issued in connection with the Company’s financing transactions during the first and fourth quarter of 2021. The increase during the three months ended March 31, 2022 was primarily due to fair value remeasurements as a result of the Merger.
Other Expense
The increase in other expense was primarily related to an increase of $370 thousand for third-party legal fees expensed in connection with the Company’s financing transactions.
Provision for Income Taxes
Provision for income taxes for the three months ended March 31, 2022 was $2 thousand, resulting in an effective tax rate for the period of 0.0%. The Company had a minimal effective tax rate as a result of the continued generation of net operating losses (“”) offset by a full valuation allowance recorded on such NOLs as the Company determined it is more-likely-than-not that its NOLs will not be utilized.
NOLs
Provision for income taxes for the three months ended March 31, 2021 was $28 thousand, resulting in an effective tax rate for the period of 0.0%. The Company had a minimal effective tax rate as a result of the continued generation of NOLs offset by a full valuation allowance recorded on such NOLs as the Company determined it is more-likely-than-not that our NOLs will not be utilized. The remainder of the provision for income taxes was related to the Company’s foreign subsidiary.
Year Ended December 31, 2021 Compared to Year Ended December 31, 2020
The following table presents the Company’s consolidated results of operations for the years ended December 31, 2021 and 2020:
Years Ended December 31, | ||||||||||||
(in thousands) | 2021 | 2020 | $ Change | |||||||||
Revenue | $ | 40,906 | $ | 24,879 | $ | 16,027 | ||||||
Cost of sales | 33,912 | 16,860 | 17,052 | |||||||||
Gross profit | 6,994 | 8,019 | (1,025 | ) | ||||||||
Selling, general, and administrative expenses | 43,703 | 17,438 | 26,265 | |||||||||
73
Years Ended December 31, | ||||||||||||
(in thousands) | 2021 | 2020 | $ Change | |||||||||
Loss from operations | (36,709 | ) | (9,419 | ) | (27,290 | ) | ||||||
Interest expense, net | 7,965 | 1,216 | 6,749 | |||||||||
Loss on extinguishment of debt | 96,024 | — | 96,024 | |||||||||
Change in fair value of warrant and derivative liabilities | (1,716 | ) | — | (1,716 | ) | |||||||
Other (income) expense | (38 | ) | 4 | (42 | ) | |||||||
Loss before income taxes | (138,944 | ) | (10,639 | ) | (128,305 | ) | ||||||
Provision for (benefit from) income taxes | 38 | (184 | ) | 222 | ||||||||
Net loss | ($ | 138,982 | ) | $ | (10,455 | ) | ($ | 128,527 | ) | |||
Revenue
The following table presents revenue by segment for the��years ended December 31, 2021 and 2020:
Years Ended December 31, | ||||||||||||
(in thousands) | 2021 | 2020 | $ Change | |||||||||
Satellite Solutions | $ | 40,736 | $ | 24,860 | $ | 15,876 | ||||||
Earth Observation Solutions | 170 | 19 | 151 | |||||||||
Revenue | $ | 40,906 | $ | 24,879 | $ | 16,027 | ||||||
The increase in revenue attributable to the Satellite Solutions segment was primarily due to continued progress made in satisfying customer contracts and reflects the favorable impact of a significant contract that commenced in late 2020 as well as a significant increase in scope of an existing contract in late 2021.
The Earth Observation Solutions segment is still in its developmental stage and generates limited revenue by providing expert analyses and planned technology demonstrations.
Cost of sales
The following table presents cost of sales by segment and other components for the years ended December 31, 2021 and 2020:
Years Ended December 31, | ||||||||||||
(in thousands) | 2021 | 2020 | $ Change | |||||||||
Satellite Solutions | $ | 33,712 | $ | 16,657 | $ | 17,055 | ||||||
Earth Observation Solutions | 75 | 8 | 67 | |||||||||
Share-based compensation expense | 125 | 195 | (70 | ) | ||||||||
Cost of sales | $ | 33,912 | $ | 16,860 | $ | 17,052 | ||||||
The increase in cost of sales attributable to the Satellite Solutions segment was primarily due to an increase of $13.4 million in labor, materials, third-party services, overhead and other direct costs incurred in satisfying customer contracts, an increase of $3.5 million related to a lower release of reserves for anticipated losses as a result of continued progress made in satisfying the associated contracts, and an increase in depreciation and amortization of $632 thousand. These increases were partially offset by a reduction of $425 thousand related to scrap and obsolete materials.
74
The Earth Observation Solutions segment is still in its developmental stage and generates limited revenue by providing expert analyses and planned technology demonstrations, incurring limited cost of sales.
Selling, general, and administrative expenses
The following table presents selling, general, and administrative expenses by segment and other components for the years ended December 31, 2021 and 2020:
Years Ended December 31, | ||||||||||||
(in thousands) | 2021 | 2020 | $ Change | |||||||||
Satellite Solutions | $ | 10,350 | $ | 10,331 | $ | 19 | ||||||
Earth Observation Solutions | 4,369 | 2,714 | 1,655 | |||||||||
Corporate and other | 28,431 | 3,394 | 25,037 | |||||||||
Share-based compensation expense | 553 | 999 | (446 | ) | ||||||||
Selling, general, and administrative expenses | $ | 43,703 | $ | 17,438 | $ | 26,265 | ||||||
The increase in selling, general, and administrative expenses was primarily due to the following:
| • | An increase in corporate, accounting, legal and recruiting fees of $14.4 million and an increase in corporate salaries and wages of $7.9 million as part of the Company’s efforts to become a public company, |
| • | An increase in salaries and wages of $1.3 million due to an increase in headcount for the Earth Observation Solutions segment, |
| • | An increase in corporate facility costs of $868 thousand due to new leases for office locations commencing in 2021, |
| • | An increase of $368 thousand in depreciation and amortization expense in the Earth Observation Solutions segment due to a company-owned satellite that was placed in service in 2021, |
| • | A decrease of $446 thousand in share-based compensation expense primarily as a result of certain larger awards becoming fully vested as of December 31, 2020 coupled with the Company not recognizing expense related to awards granted in 2021 as such awards included a performance condition that was not considered probable of vesting, and |
| • | A decrease of $387 thousand due to a lower provision for credit losses in the Satellite Solutions segment. |
Interest expense, net
The increase in interest expense, net was due to an increase in outstanding debt coupled with an increase in interest rate as a result of the Company’s financing transactions during 2021, partially offset by an increase in capitalized interest of $1.1 million associated with the Company’s continued development of its NextGen Earth Observation constellation.
Loss on extinguishment of debt
Loss on extinguishment of debt totaled $96 million and was comprised of a $70.6 million loss related to the refinancing of convertible notes in March 2021, a $28 million loss related to amendments to senior secured notes in November 2021, offset by a $2.6 million gain related to extinguishment of the PPP Loan.
75
Change in fair value of warrant and derivative liabilities
Change in fair value of warrant and derivative liabilities relates to the periodic fair value remeasurement of liability-classified warrants and derivatives granted in connection with the Company’s financing transactions during 2021.
Provision for (benefit from) income taxes
Provision for income taxes for 2021 was $38 thousand, resulting in an effective tax rate for the period of nearly 0%. The Company had a minimal effective tax rate as a result of the continued generation of NOLs offset by a full valuation allowance recorded on such NOLs as the Company determined it is
more-likely-than-not
that they will not be utilized. The remainder of the Company’s provision for income taxes was related to the Company’s foreign subsidiary.Benefit from income taxes for 2020 was $184 thousand, resulting in an effective tax rate for the period of 1.7%. The Company had a minimal effective tax rate as a result of the continued generation of NOLs offset by a full valuation allowance recorded on such NOLs as the Company determined it is
more-likely-than-not
that they will not be utilized. During 2020, the Company had a favorable impact from the CARES Act, which allowed the Company to carry back its NOLs to the 2015 and 2016 tax years.NON-GAAP
MEASURESTo provide investors with additional information in connection with the Company’s results as determined in accordance with GAAP, the Company discloses
non-GAAP
financial measures, such as Adjusted Gross Profit and Adjusted EBITDA, that have not been prepared in accordance with GAAP. Thesenon-GAAP
measures may be different fromnon-GAAP
measures made by other companies. These measures may exclude items that are significant in understanding and assessing the Company’s financial results. Therefore, these measures should not be considered in isolation or as an alternative to net income or other measures of financial performance or liquidity under GAAP.Adjusted Gross Profit
The Company believes that the presentation of Adjusted Gross Profit is appropriate to provide additional information to investors about its gross profit adjusted for certain
non-cash
items. Further, the Company believes Adjusted Gross Profit provides a meaningful measure of operating profitability because the Company uses it for evaluating its business performance, making budgeting decisions, and comparing its performance against that of other peer companies using similar measures.The Company defines Adjusted Gross Profit as gross profit or loss adjusted for (i) share-based compensation expense included in cost of sales and (ii) depreciation and amortization included in cost of sales.
There are material limitations to using Adjusted Gross Profit. Adjusted Gross Profit does not take into account all items which directly affect the Company’s gross profit or loss. These limitations are best addressed by considering the economic effects of the excluded items independently and by considering Adjusted Gross Profit in conjunction with gross profit or loss as calculated in accordance with GAAP.
The following table reconciles Adjusted Gross Profit to gross profit or loss (the most comparable GAAP measure) for the three months ended March 31, 2022 and 2021:
Three Months Ended March 31, | ||||||||||||
(in thousands) | 2022 | 2021 | $ Change | |||||||||
Gross (loss) profit | $ | (2,833 | ) | $ | 760 | (3,593 | ) | |||||
Share-based compensation expense | 2,113 | 14 | 2,099 | |||||||||
Depreciation and amortization | 513 | 453 | 60 | |||||||||
Adjusted gross (loss) profit | $ | (207 | ) | $ | 1,227 | (1,434 | ) | |||||
The decrease in Adjusted Gross Profit was largely due to adjustments to the EAC on certain firm fixed price contracts, which had an estimated $3.7 million negative impact to Adjusted Gross Profit. While the Company believes its estimates as of March 31, 2022 consider all relevant and known information, such as supply chain and related production challenges, additional adjustments to its EACs could occur and have an impact on its Adjusted Gross Profit in future reporting periods.
The following table reconciles Adjusted Gross Profit to gross profit or loss (the most comparable GAAP measure) for the years ended December 31, 2021 and 2020:
Years Ended December 31, | ||||||||||||
(in thousands) | 2021 | 2020 | $ Change | |||||||||
Gross profit | $ | 6,994 | $ | 8,019 | $ | (1,025 | ) | |||||
Share-based compensation expense | 125 | 195 | (70 | ) | ||||||||
Depreciation and amortization | 2,350 | 1,718 | 632 | |||||||||
Adjusted gross profit | $ | 9,469 | $ | 9,932 | $ | (463 | ) | |||||
76
The decrease in Adjusted Gross Profit was largely due to a lower release of reserves for anticipated losses as a result of continued progress made in satisfying the associated contracts, partially offset by lower scrap and obsolete materials. Refer to the discussions above under “” for further details.
Results of Operations
Adjusted EBITDA
The Company believes that the presentation of Adjusted EBITDA is appropriate to provide additional information to investors about its operating profitability adjusted for certain
non-cash
items,non-routine
items that the Company does not expect to continue at the same level in the future, as well as other items that are not core to its operations. Further, the Company believes Adjusted EBITDA provides a meaningful measure of operating profitability because the Company uses it for evaluating its business performance, making budgeting decisions, and comparing its performance against that of other peer companies using similar measures.The Company defines Adjusted EBITDA as net income or loss adjusted for (i) interest, (ii) taxes, (iii) depreciation and amortization, (iv) share-based compensation expense, (v) loss on extinguishment of debt, (vi) change in fair value of warrant and derivative liabilities, and (vii) other
non-recurring
and/ornon-cash
items.There are material limitations to using Adjusted EBITDA. Adjusted EBITDA does not take into account certain significant items, including depreciation and amortization, interest, taxes, and other adjustments which directly affect the Company’s net income or loss. These limitations are best addressed by considering the economic effects of the excluded items independently and by considering Adjusted EBITDA in conjunction with net income or loss as calculated in accordance with GAAP.
The following table reconciles Adjusted EBITDA to net loss (the most comparable GAAP measure) for the three months ended March 31, 2022 and 2021:
Three Months Ended March 31, | ||||||||||||
(in thousands) | 2022 | 2021 | $ Change | |||||||||
Net loss | $ | (71,372 | ) | $ | (77,496 | ) | $ | 6,124 | ||||
Interest expense, net | 2,923 | 907 | 2,016 | |||||||||
Provision for income taxes | 2 | 28 | (26 | ) | ||||||||
Depreciation and amortization | 846 | 671 | 175 | |||||||||
Share-based compensation expense | 17,335 | 168 | 17,167 | |||||||||
Loss on extinguishment of debt | 23,141 | 70,667 | (47,526 | ) | ||||||||
Change in fair value of warrant and derivative liabilities | 11,853 | (34 | ) | 11,887 | ||||||||
Other, net(a) | 555 | 1,452 | (897 | ) | ||||||||
Adjusted EBITDA | $ | (14,717 | ) | $ | (3,637 | ) | $ | (11,080 | ) | |||
| (a) | Represents other expense and other charges and items. Non-recurring legal and accounting fees related to the Company’s transition to a public company are herein. |
The decrease in Adjusted EBITDA was primarily due to a decrease in gross profit and an increase in salaries and wages, legal and accounting fees, and facility expenses as a result of our growth initiatives.
The following table reconciles Adjusted EBITDA to net loss (the most comparable GAAP measure) for the years ended December 31, 2021 and 2020:
Years Ended December 31, | ||||||||||||
(in thousands) | 2021 | 2020 | $ Change | |||||||||
Net loss | $ | (138,982 | ) | $ | (10,455 | ) | $ | (128,527 | ) | |||
Interest expense, net | 7,965 | 1,216 | 6,749 | |||||||||
Provision for (benefit from) income taxes | 38 | (184 | ) | 222 | ||||||||
Depreciation and amortization | 3,053 | 2,934 | 119 | |||||||||
Share-based compensation expense | 678 | 1,194 | (516 | ) | ||||||||
Loss on extinguishment of debt | 96,024 | — | 96,024 | |||||||||
Change in fair value of warrant and derivative liabilities | (1,716 | ) | — | (1,716 | ) | |||||||
Other, net(a) | 6,796 | 4 | 6,792 | |||||||||
Adjusted EBITDA | $ | (26,144 | ) | $ | (5,291 | ) | $ | (20,853 | ) | |||
| (a) | Represents other expense and other charges and items. Non-recurring legal and accounting fees related to the Company’s transition to a public company are herein. |
The decrease in Adjusted EBITDA was primarily due to a decrease in gross profit and an increase in legal and accounting fees and salaries and wages as a result of the Company’s buildout of operational and corporate capacity.
Refer to the discussions above under “Results of Operations” for further details.
77
KEY PERFORMANCE INDICATORS
The Company views growth in backlog as a key measure of its business growth. Backlog represents the estimated dollar value of executed contracts, including both funded (firm orders for which funding is authorized and appropriated) and unfunded portions of such contracts, for which work has not been performed (also known as the remaining performance obligations on a contract). Order backlog excludes contracts in which the Company recognizes revenue in proportion to the amount it has the right to invoice for services performed and does not include unexercised contract options and potential orders under indefinite delivery/indefinite quantity contracts. Although backlog reflects business associated with contracts that are considered to be firm, terminations, amendments or contract cancellations may occur, which could result in a reduction in our total backlog.
The Company’s backlog totaled $221.8 million and $73.9 million as of March 31, 2022 and December 31, 2021, respectively. The increase in backlog was primarily due to a new award to build 42 satellites for the U.S. Space Development Agency’s (“SDA”) Tranche 1 of the Transport Layer. The award is in addition to the 10 satellites the Company is building for the SDA’s Tranche 0 of the Transport Layer. As of March 31, 2022 and December 31, 2022, programs associated with Lockheed Martin represented approximately 86% and 56% of the Company’s backlog, respectively.
LIQUIDITY AND CAPITAL RESOURCES
Liquidity
The Company’s future cash needs are expected to include cash for operating activities, working capital, purchases of property and equipment, strategic investments, research and development expenses, development and expansion of facilities, and development of its NextGen Earth Observation constellation and debt service requirements. Additionally, the Company will receive the proceeds from any exercise of any Warrants that are exercised for cash pursuant to their terms. Assuming the exercise in full of all of the Warrants for cash, the Company will receive an aggregate of approximately $332.5 million, but will not receive any proceeds from the sale of the shares of common stock issuable upon such exercise. To the extent any Warrants are issued on a “cashless basis,” the amount of cash the Company would receive from the exercise of the Warrants will decrease. The Company expects to use any such proceeds received by us from Warrants that are exercised for cash in the future for general corporate and working capital purposes, which would increase our liquidity. There is no assurance that the holders of the Warrants will elect to exercise for cash any or all of such Warrants.
The Company believes the likelihood that warrant holders will exercise their Warrants, and therefore the amount of cash proceeds that it would receive, is dependent upon the market price of its common stock. If the market price for the Company’s common stock is less than $10.00 per share, it believes warrant holders will be unlikely to exercise their debt provider warrants, and if the market price for our common stock is less than $11.50 per share, it believes warrant holders will be unlikely to exercise their public warrants and private placement warrants.
The sale by the Selling Securityholders of all of the securities being offered in this prospectus, which represents a substantial percentage of the Company’s outstanding common stock, could result in a significant decline in the public trading price of its common stock. These sales, or the possibility that these sales may occur may make it more difficult for the Company to sell equity securities in the future at a time and at a price that the Company deems appropriate. Seefor more information.
“Risk Factors—The securities being offered in this prospectus represent a substantial percentage of our outstanding common stock, and the sales of such securities could cause the market price of our common stock to decline significantly” and “Risk Factors—Sales, or the perception of sales, by us or our stockholders in the public market could cause the market price for our common stock to decline”
In addition, under the debt provider warrants issued to affiliates of Francisco Partners pursuant to the Stock and Warrant Purchase Agreement, such warrant holders have the right to require the Company to exchange such warrants (in full but not in part) for $25 million in cash on March 25, 2025, which is the third anniversary of the Closing Date. Other than such warrants no investors have the right to sell back shares or other securities to the Company or have any forward purchase agreements with the Company.
The Company has historically funded its operations primarily through the issuance of debt and the sale of equity securities. As discussed above, the Company believes that based on the current trading prices of its common stock and the substantial percentage of its outstanding common stock that is being offered for resale in this prospectus, it is unlikely that it will receive cash proceeds from the exercise of the Warrants offered in this prospectus in the near future. In order to proceed with the Company’s business plan, the Company expects to need to raise additional funds through the issuance of additional debt, equity or other commercial arrangements, which may not be available to the Company when needed or on terms that the Company deems to be favorable. To the extent the Company raises additional capital through the sale of equity or convertible securities, the ownership interest of its shareholders will be diluted, and the terms of these securities may include liquidation or other preferences that adversely affect the rights of common shareholders. Debt financing and preferred equity financing, if available, may involve agreements that include covenants limiting or restricting the Company’s ability to take specific actions, such as incurring additional debt, making acquisitions or capital expenditures or declaring dividends. If the Company is unable to obtain sufficient financial resources, its business, financial condition and results of operations may be materially and adversely affected. The Company may be required to delay, limit, reduce or terminate parts of its strategic business plan or future commercialization efforts. There can be no assurance the Company will be able to obtain financing on acceptable terms.
Furthermore, the Company’s ability to meet its debt service obligations and other capital requirements depends on its future operating performance, which is subject to future general economic, financial, business, competitive, legislative, regulatory, and other conditions, many of which are beyond the Company’s control. Changes in the Company’s operating plans, material changes in anticipated sales, increased expenses, acquisitions, or other events may cause the Company to seek equity and/or debt financing in future periods.
As of March 31, 2022, the Company had $76.7 million of cash and cash equivalents, which included $1.3 million of cash and cash equivalents held by the Company’s foreign subsidiary. The Company is not presently aware of any restrictions on the repatriation of its foreign cash and cash equivalents; however, earnings of the Company’s foreign subsidiary is essentially considered permanently invested in the foreign subsidiary. If these funds were needed to fund operations or satisfy obligations in the U.S., they could be repatriated and their repatriation into the U.S. may cause us to incur additional foreign withholding taxes. The Company does not currently intend to repatriate these earnings.
The Company’s short-term liquidity requirements include initiatives related to (i) expansion of existing facilities and upgrade of equipment in order to increase operational capacity, (ii) recruitment of additional employees to meet operational needs, (iii) upgrade of information technology, (iv) research and development initiatives and (v) continued buildout of corporate functions and public company compliance requirements, inclusive of accounting and legal fees. The Company’ long-term liquidity requirements include initiatives related to (i) development of its NextGen Earth Observation constellation, inclusive of ground infrastructure, (ii) potential development of the Space Florida Facility, which is the Company’s proposed new campus of approximately 660,000 square foot satellite manufacturing facility and (iii) development of new satellite components and data and analytics software and
78
infrastructure. Additionally, the Company’s liquidity requirements include the repayment of debt and other payment obligations incurred as a result the Merger. The timing and amount of spend on these initiatives may be materially delayed, reduced, and cancelled as a result of our level of our financial resources.
For more information about the estimated financial impacts of the Merger, see “.”
Unaudited Pro Forma Condensed Combined Financial Information
Long-term Debt
As of March 31, 2022, debt was comprised of the following:
(in thousands) Description | Issued | Maturity | Interest Rate | Interest Payable | March 31, 2022 | |||||||||||||||
Francisco Partners Facility | November 2021 | April 2026 | 9.25% | Quarterly | $ | 120,023 | ||||||||||||||
Senior Secured Notes due 2026 (1) | March 2021 | April 2026 | 9.25% and 11.25% | Quarterly | 56,267 | |||||||||||||||
PIPE Investment Obligation | March 2022 | December 2025 | N/A | N/A | 28,125 | |||||||||||||||
Finance leases | N/A | N/A | N/A | N/A | 49 | |||||||||||||||
Unamortized deferred issuance costs | (2,115 | ) | ||||||||||||||||||
Unamortized discount on debt | (99,905 | ) | ||||||||||||||||||
Total debt | 102,444 | |||||||||||||||||||
Current portion of long-term debt | 7,515 | |||||||||||||||||||
Long-term debt | $ | 94,929 | ||||||||||||||||||
| (1) | Includes the Lockheed Martin Rollover Debt and Beach Point Rollover Debt, each as defined below. |
N/A — Not meaningful or applicable
Francisco Partners Facility
On November 24, 2021 (the “”), Legacy Terran Orbital entered into a note purchase agreement (the “”) permitting the issuance and sale of senior secured notes originally in an aggregate principal amount of up to $150 million due on November 24, 2026 with certain managed funds or investment vehicles of Francisco Partners (the “”). The Francisco Partners Facility originally consisted of (i) $30 million of senior secured notes, which were drawn on the FP NPA Closing Date (the “”), (ii) $20 million of senior secured notes drawable at the closing of the Business Combination (the “”), and (iii) up to an additional $100 million of senior secured notes drawable at the closing of the Business Combination (the “”). The
FP NPA Closing Date
FP Note Purchase Agreement
Francisco Partners Facility
Pre-Combination Notes
Delayed Draw Notes
Conditional Notes
Pre-Combination
Notes were issued net of a $5 million discount on debt and resulted in proceeds received of $25 million.On March 9, 2022, we amended the FP Note Purchase Agreement to, among other things, (i) increase the principal amount of senior secured notes that may be issued under the FP Note Purchase Agreement to up to $154 million, (ii) increase the Delayed Draw Notes to $24 million, and (iii) accelerate the funding of the Delayed Draw Notes. The Delayed Draw Notes were issued net of a $4 million original issue discount and resulted in proceeds received of $20 million, before allocations for accounting purposes.
On March 25, 2022, we further amended the FP Note Purchase Agreement to, among other things, (i) decrease the principal amount of senior secured notes that may be issued under the Francisco Partners Facility to up to $119 million, (ii) amend certain existing covenants, as described below, (iii) add an additional covenant, as described below, (iv) revise the maturity date to April 1, 2026, and (v) change the timing of quarterly interest payments to
79
May 15th, August 15th, November 15th and February 15th of each calendar year, with the first such interest payment required to be made on May 15, 2022. As consideration for the amendment on March 25, 2022, Francisco Partners received an additional 1.9 million shares of Terran Orbital Corporation’s common stock upon consummation of the Merger. Upon closing of the Merger, the Company issued $65 million of the Conditional Notes. The Conditional Notes were issued net of a $5 million original issue discount and resulted in proceeds received of $60 million, before allocations for accounting purposes.
The Francisco Partners Facility requires the Company to make certain mandatory prepayments with (i) 100% of net cash proceeds of all”), followed by a call premium of (i) 3.0% on or prior to the first anniversary of the Callable Date, (ii) 2.00% after the first anniversary of the Callable Date but on or prior to the second anniversary of the Callable Date, and (iii) at par thereafter. The Francisco Partners Facility included certain customary make-whole premiums for any voluntary prepayments in the event of delay or termination of the Merger that were not triggered.
non-ordinary
course asset sales or other dispositions of property and any extraordinary receipts, subject to the ability to reinvest such proceeds and certain other exceptions and (ii) 100% of the net cash proceeds of any debt incurrence, other than debt permitted by the FP Note Purchase Agreement. The Company may prepay senior secured notes issued pursuant to the Francisco Partners Facility at any time subject to a customary make-whole premium for any voluntary prepayment made prior to the first anniversary of the FP NPA Closing Date (the “Callable Date
The Francisco Partners Facility contains certain customary affirmative covenants, negative covenants and events of default. In addition, a part of the amendment on March 25, 2022, the liquidity maintenance financial covenant of the Francisco Partners Facility was modified to require that as of the last day of each fiscal quarter, the Company must have an aggregate amount of unrestricted cash and cash equivalents of at least (i) $20 million in the case of the fiscal quarters ending March 31, 2022, June 30, 2022 and September 30, 2022, (ii) $10 million in the case of the fiscal quarter ending December 31, 2022 and (iii) $20 million plus 15% of certain aggregate funded indebtedness of the Note Parties and their Subsidiaries in the case of each fiscal quarter thereafter. In addition, a new covenant was added requiring the Company to at least break even on an EBITDA basis (as defined in the FP Note Purchase Agreement) by December 31, 2023, subject to certain extensions.
The obligations under the Francisco Partners Facility are guaranteed by the Company’s wholly-owned U.S. subsidiaries, Tyvak and PredaSAR (together with the Surviving Corporation, collectively, the “”) and secured by substantially all assets of the Note Parties, subject to certain exceptions.
Note Parties
Senior Secured Notes due 2026
On March 8, 2021, Legacy Terran Orbital entered into a note purchase agreement (the “”) for the issuance and sale of issued $87 million aggregate principal amount of senior secured notes due April 1, 2026 (the “”) which resulted in gross proceeds of $50 million from Lockheed Martin Corporation (“”) and the exchange and extinguishment of $37 million then outstanding convertible notes due 2028 (the “”). The loss on extinguishment of debt totaled $70.6 million and included the recognition of warrants issued at fair value, the fair value adjustment related to the issuance of the Senior Secured Notes due 2026, the write-off of unamortized deferred issuance costs on the extinguished Convertible Notes due 2028, and certain third-party financing expenses.
Existing Note Purchase Agreement
Senior Secured Notes due 2026
Lockheed Martin
Convertible Notes due 2028
80
In connection with the Merger Agreement and incurrence of the FP Note Purchase Agreement, the Existing Note Purchase Agreement was amended in November 2021 to provide consent to the Company to incur obligations related to the”) each agreed to, at their option, (a) exchange up to $25 million (in the case of Lockheed Martin) and $25 million (in the case of Beach Point) of aggregate principal amount of Senior Secured Notes due 2026 for the same principal amount of debt to be issued under, and governed by, a new loan agreement or note purchase agreement, or (b) keep outstanding such amounts of aggregate principal amount of Senior Secured Notes due 2026 under its existing note purchase agreement (in either case, the “”). The Rollover Debt was to be issued pursuant to documentation with substantially similar terms as the terms of the Francisco Partners Facility, except that the Rollover Debt would not have call protection, would be issued without original issue discount, and would be kept outstanding or rolled over at the Closing Date.
Pre-Combination
Notes under the FP Note Purchase Agreement as well as aligning cash interest payments prior to March 8, 2024 with the terms of cash interest payments for the FP Notes. In addition, pursuant to support agreements with Legacy Terran Orbital, affiliates of Lockheed Martin and Beach Point Capital Management LP (“Beach Point
Rollover Debt
The Company issued warrants and contingently issuable warrants and equity to each of Lockheed Martin and an affiliate of Beach Point in connection with the amendment to the Senior Secured Notes due 2026 which resulted in the extinguishment and re-issuance of the Senior Secured Notes due 2026 for each of Lockheed Martin and the Beach Point affiliate for accounting purposes. The loss on extinguishment of debt totaled $28 million and included the recognition of warrants and contingently issuable warrants and equity at fair value, the fair value adjustment related to the re-issuance of the Senior Secured Notes due 2026, the write-off of unamortized discount on debt and deferred issuance costs on the extinguished Senior Secured Notes due 2026, and certain third-party financing expenses. The re-issued Senior Secured Notes were recognized at fair value with a $6.6 million premium less $420 thousand of deferred issuance costs.
On March 25, 2022, the Senior Secured Notes due 2026 were impacted as described below.
In connection with the PIPE Investment, two holders of the Senior Secured Notes due 2026 agreed to, in substance, exchange the outstanding amount of principal and interest for common stock of Terran Orbital Corporation with any residual amounts settled in cash, resulting in a loss on extinguishment of debt of $727 thousand. The consideration transferred as part of the extinguishment included common stock with a fair value of $4.6 million and a cash payment of $703 thousand, of which $293 thousand represents financing cash flows related to the repayment of debt and $410 thousand represents operating cash flows related to the payment of interest in the condensed consolidated statements of cash flows.
On March 25, 2022, the note purchase agreement governing the Senior Secured Notes due 2026 was amended to, among other things, (i) set the amount of senior secured notes that will remain outstanding with Lockheed Martin subsequent to the Merger to $25 million (the “Lockheed Martin Rollover Debt”), (ii) increase and set the amount of senior secured notes that will remain outstanding with Beach Point subsequent to the Merger to $31.3 million (the “Beach Point Rollover Debt”), (iii) set the terms of the Lockheed Martin Rollover Debt and the Beach Point Rollover Debt to have substantially similar terms as the terms in the Francisco Partners Facility, excluding call protection and the Beach Point Rollover Debt bearing interest at 11.25% (9.25% of which is payable in cash and 2.0% of which is payable in kind), and (iv) cause the Beach Point Rollover Debt to be subordinated in right of payment to the Francisco Partners Facility.
The Amended Note Purchase Agreement contains substantially the same affirmative covenants, negative covenants, financial maintenance covenants and events of default as the FP Note Purchase Agreement.
81
In connection with the Merger, the Company partially extinguished Lockheed Martin’s portion of the Senior Secured Notes due 2026, resulting in a gain on extinguishment of debt of $1.8 million, with the remainder representing the Lockheed Martin Rollover Debt. The consideration transferred as part of the partial extinguishment included a cash payment of $30.8 million, of which $25 million represents financing cash flows related to the repayment of debt and $5.8 million represents operating cash flows related to the payment of interest in the condensed consolidated statements of cash flows.
In connection with the PIPE Investment and the amendment on March 25, 2022, Beach Point agreed to, in substance, exchange a portion of the outstanding amount of principal and interest for common stock of Terran Orbital Corporation with the remainder representing the Beach Point Rollover Debt. As consideration for the amendment on March 25, 2022, Beach Point received an additional 2.4 million shares of Terran Orbital Corporation’s common stock upon consummation of the Merger. Accordingly, Beach Point’s portion of the Senior Secured Notes due 2026 was deemed to have been extinguished for the issuance of the Beach Point Rollover Debt and common stock of Terran Orbital Corporation, resulting in a loss on extinguishment of debt of $24.2 million.
PIPE Investment Obligation
An affiliate of a director and shareholder of the Terran Orbital Corporation invested $30 million, before allocations for accounting purposes, as part of the PIPE Investment (the “Insider PIPE Investment”). The subscription agreement for the Insider PIPE Investment included a provision that obligates the Company to pay the affiliate a quarterly fee of $1.875 million for sixteen quarters beginning with the period ending March 31, 2022 (the “PIPE Investment Obligation”). The first four quarterly payments are to be paid in cash and the remaining payments are to be paid, at the Company’s option, in cash or common stock of Terran Orbital Corporation, subject to subordination to and compliance with the Company’s debt facilities.
Warrants and Derivatives
As of March 31, 2022, the Company’s liability-classified warrants were comprised of the following:
(in thousands, except share and per share amounts) | Number of Issuable Shares as of March 31, 2022 | Issuance | Maturity | Exercise Price | March 31, 2022 | |||||||||||||||||||
Public Warrants | 11,499,960 | March 2021 | March 2027 | $ | 11.50 | 5,750 | ||||||||||||||||||
Private Placement Warrants | 7,800,000 | March 2021 | March 2027 | $ | 11.50 | 3,900 | ||||||||||||||||||
FP Combination Warrants | 8,291,704 | March 2022 | March 2027 | $ | 10.00 | 25,966 | ||||||||||||||||||
Warrant liabilities | 27,591,664 | $ | 35,616 | |||||||||||||||||||||
Inducement Warrants
As part of the Merger, all of the warrants issued by Legacy Terran Orbital in connection with the issuance of the Senior Secured Notes due 2026 (the “Inducement Warrants”) were ultimately net settled into approximately 695 thousand shares of Terran Orbital Corporation’s common stock.
Francisco Partners Warrants and Derivatives
As part of the Francisco Partners Facility, Legacy Terran Orbital issued warrants to Francisco Partners in November 2021 to purchase 1.5% of the fully diluted shares of Legacy Terran Orbital’s common stock (the “”). The FP
FP
Pre-Combination
WarrantsPre-Combination
Warrants terminated unexercised upon consummation of the Merger pursuant to their contractual provisions.As additional consideration for the Francisco Partners Facility in November 2021, we committed to the issuance of (i) an equity grant package equal to 1.5% of the fully diluted shares of Terran Orbital Corporation’s common stock outstanding as of immediately following the closing of the Merger, plus an additional one million shares of Terran Orbital Corporation’s common stock (the “”), and (ii) warrants to purchase 5.0% of the Terran Orbital Corporation’s common stock on a fully diluted basis as of immediately following the closing of the Merger at a strike price of $10.00 per share, redeemable at the option of Francisco Partners for $25 million on the third anniversary of the closing of the Merger, and expiring on March 25, 2027 (the “”). The FP Combination Equity and the FP Combination Warrants were contingently issuable upon closing of the Merger. Upon consummation of the Merger, approximately 3.3 million shares of Terran Orbital Corporation’s common stock were issued related to the FP Combination Equity. In addition, approximately 8.3 million warrants were issued related to the FP Combination Warrants.
FP Combination Equity
FP Combination Warrants
Pre-Combination
and Combination Warrants and DerivativesUpon initial funding of the Francisco Partners Facility and in connection with the amendment to the Senior Secured Notes due 2026 note purchase agreement in November 2021, Legacy Terran Orbital issued warrants to each of Lockheed Martin and Beach Point to purchase 0.25% of the fully diluted shares of Legacy Terran Orbital’s common stock for on the same valuation and terms and conditions as the FP”). The
Pre-Combination
Warrants (the “Pre-Combination
WarrantsPre-Combination
Warrants terminated unexercised upon consummation of the Merger pursuant to their contractual provisions.In November 2021, we committed to issue to each of Lockheed Martin and Beach Point (i) an equity grant package equal to 0.25% of the fully diluted shares of Terran Orbital Corporation’s common stock outstanding as of immediately following the closing of the Merger (the “”), and (ii) warrants to purchase 0.83333% of Terran Orbital Corporation’s common stock on a fully diluted basis as of immediately following the closing of the Merger at a strike price of $10.00 per share expiring on March 25, 2027 (the “”). The Combination Equity and the Combination Warrants were contingently issuable upon closing
Combination Equity
Combination Warrants
82
of the Merger. Upon consummation of the Merger, approximately 774 thousand shares of Terran Orbital Corporation’s common stock were issued related to the Combination Equity. In addition, approximately 2.8 million warrants were issued related to the Combination Warrants. Subsequent to the Merger, the Combination Warrants now represent equity-classified financial instruments.
Public Warrants
As part of the Merger, we assumed outstanding warrants giving the holders the right to purchase an aggregate of approximately 11.5 million shares of the Terran Orbital Corporation’s common stock for $11.50 per share (the “”). The public warrants became exercisable on April 24, 2022, 30 days after the completion of the Merger, and will expire five years from the completion of the Merger.
public warrants
We will not be obligated to deliver any shares of common stock pursuant to the exercise of a public warrant and will have no obligation to settle such warrant exercise unless a registration statement with respect to the shares underlying the warrants is then effective and a related prospectus is current, unless a valid exemption from registration is available. No public warrant will be exercisable for cash or on a cashless basis and we will not be obligated to issue shares upon exercise of a public warrant unless the underlying shares have been registered, qualified or deemed to be exempt under the securities laws of the state of residence of the registered holder of the warrants. The registration statement on Form S-1, of which this prospectus forms a part, once declared effective by the SEC, will register the shares of common stock issuable by us upon exercise of the public warrants.
Once the public warrants become exercisable, we may redeem the outstanding warrants when the price per share of the Terran Orbital Corporation’s common stock equals or exceeds $18.00 as follows:
| • | in whole and not in part; |
| • | at a price of $0.01 per warrant; |
| • | upon not less than of 30 days’ prior written notice of redemption to each warrant holder; and |
| • | if, and only if, the closing price of the Terran Orbital Corporation’s shares of common stock equals or exceeds $18.00 per share (as adjusted) for any 20 trading days within a 30-trading day period ending three trading days before we send the notice of redemption to the warrant holders. |
In addition, once the public warrants become exercisable, we may redeem the outstanding warrants when the price per share of Terran Orbital Corporation’s common stock equals or exceeds $10.00 as follows:
| • | in whole and not in part; |
| • | at $0.10 per warrant upon a minimum of 30 days’ prior written notice of redemption; provided that holders will be able to exercise their warrants on a cashless basis prior to redemption and receive that number of shares determined based on the redemption date and the fair market value of Terran Orbital Corporation’s shares of common stock; |
| • | if, and only if, the closing price of the Terran Orbital Corporation’s shares of common stock equals or exceeds $10.00 per share (as adjusted) for any 20 trading days within the 30-trading day period ending three trading days before we send the notice of redemption of the warrant holders; and |
| • | if the closing price of Terran Orbital Corporation’s shares of common stock for any 20 trading days within a 30-trading day period ending on the third trading day prior to the date on which we send the notice of redemption to the warrant holders is less than $18.00 per share (as adjusted), the private placement warrants must also be concurrently called for redemption on the same terms as the outstanding public warrants, as described above. |
If and when the public warrants become redeemable by us, we may exercise our redemption right even if we are unable to register or qualify the underlying securities for sale under all applicable state securities laws.
If we call the public warrants for redemption, as described above, we will have the option to require any holder that wishes to exercise the public warrants to do so on a “cashless basis,” as described in the warrant agreement. The exercise price and number of common shares issuable upon exercise of the public warrants may be adjusted in certain circumstances including in the event of a share dividend, extraordinary dividend or recapitalization, reorganization, merger or consolidation. However, the public warrants will not be adjusted for issuances of common shares at a price below its exercise price. Additionally, in no event will we be required to net cash settle the public warrants.
Private Placement Warrants
As part of the Merger, we assumed outstanding warrants that were previously issued in a private placement and that give the holders thereof the right to purchase an aggregate of 7.8 million shares of Terran Orbital Corporation’s common stock for $11.50 per share (the “private placement warrants”). The private placement warrants are identical to the public warrants, except that the private placement warrants and the common shares issuable upon their exercise were not transferable, assignable or salable until 30 days after the completion of the Merger. Additionally, the private placement warrants will be exercisable on a cashless basis and be non-redeemable, except as described above, so long as they are held by the initial purchasers or their permitted transferees. If the private placement warrants are held by someone other than the initial purchasers or their permitted transferees, the private placement warrants will be redeemable by us and exercisable by such holders on the same basis as the public warrants. The registration statement on Form S-1, of which this prospectus forms a part, once declared effective by the SEC, will register the shares of common stock issuable by us upon exercise of the private placement warrants.
Detachable Warrants
As part of the Merger, all of the warrants issued by Legacy Terran Orbital in connection with the extinguishment of the Convertible Notes due 2028 (the “Detachable Warrants”) were ultimately net settled into approximately 22.3 million shares of Terran Orbital’s common stock.
Dividends
The Company intends to retain future earnings, if any, for future operations, expansion and debt repayment (if any) and there are no current plans to pay any cash dividends for the foreseeable future. In addition, the Company’s ability to pay dividends is limited by covenants of the Company’s existing and outstanding indebtedness, including the Francisco Partners Facility, and may be limited by covenants of any future indebtedness. There are no current restrictions in the covenants of the Company’s existing and outstanding indebtedness on the Company’s wholly-owned subsidiaries from distributing earnings in the form of dividends, loans or advances and through repayment of loans or advances to Terran Orbital Corporation.
Following the Merger, the Company’s existing and outstanding indebtedness allows for the declaration and payment of dividends or prepayment of junior debt obligations in cash in an amount not to exceed $5 million.
Cash Flow Analysis
The following table is a summary of the Company’s cash flow activity for the three months ended March 31, 2022 and 2021:
Three Months Ended March 31, | ||||||||||||
(in thousands) | 2022 | 2021 | $ Change | |||||||||
Net cash used in operating activities | $ | (29,300 | ) | $ | (548 | ) | $ | (28,752 | ) | |||
Net cash used in investing activities | (4,030 | ) | (2,422 | ) | (1,608 | ) | ||||||
Net cash provided by financing activities | 82,687 | 44,348 | 38,339 | |||||||||
Effect of exchange rate fluctuations on cash and cash equivalents | (28 | ) | (66 | ) | 38 | |||||||
Net increase in cash and cash equivalents | $ | 49,329 | $ | 41,312 | $ | 8,017 | ||||||
Cash Flows from Operating Activities
The increase in net cash used in operating activities was primarily due to an increase in selling, general and administrative expense largely related to salaries and wages, legal and accounting fees, and facility expenses as a result of the Company’s growth initiatives as well as cash interest payments of approximately $6.2 million related to the partial extinguishment of the Senior Secured Notes due 2026. The remainder of the activity in net cash used in operating activities related to changes in assets and liabilities due to the volume and timing of other operating cash receipts and payments with respect to when the transactions are reflected in earnings.
Refer to the discussions above under “Results of Operations” for further details.
Cash Flows from Investing Activities
The increase in net cash used in investing activities was primarily due to an increase of $745 thousand related to the payment of capital expenditures incurred in previous reporting periods, an increase in the development of company-owned satellites of $327 thousand, and the buildout of other manufacturing facilities and office space.
Cash Flows from Financing Activities
During the three months ended March 31, 2022, net cash provided by financing activities primarily consisted of $58 million of proceeds received from the Merger and the PIPE Investment, $42 million of proceeds received allocated to warrant and derivative instruments, $36 million of proceeds received allocated to the issuance of debt, and $15 million of proceeds received allocated to the issuance of common stock in relation to our financing transactions. These increases were partially offset by $42 million of payments of issuance costs related to our equity and debt transactions coupled with $27 million related to the repayment of long-term debt.
During the three months ended March 31, 2021, net cash provided by financing activities primarily consisted of $47.5 million of proceeds received allocated to the issuance of debt and $2.5 million of proceeds received allocated to warrant and derivative instruments. These increases were partially offset by $5.7 million of payments of issuance costs related to our debt transactions.
The following table is a summary of the Company’s cash flow activity for the years ended December 31, 2021 and 2020:
Years Ended December 31, | ||||||||||||
(in thousands) | 2021 | 2020 | $ Change | |||||||||
Net cash used in operating activities | $ | (34,887 | ) | $ | (11,474 | ) | $ | (23,413 | ) | |||
Net cash used in investing activities | (16,352 | ) | (7,325 | ) | (9,027 | ) | ||||||
Net cash provided by financing activities | 66,352 | 15,101 | 51,251 | |||||||||
Effect of exchange rate fluctuations on cash and cash equivalents | (124 | ) | 138 | (262 | ) | |||||||
Net increase (decrease) in cash and cash equivalents | $ | 14,989 | $ | (3,560 | ) | $ | 18,549 | |||||
Cash Flows from Operating Activities
The increase in net cash used in operating activities was primarily due to an increase in selling, general and administrative expense largely related to salaries and wages and legal and accounting fees as a result of the Company’s buildout of operational and corporate capacity. The remainder of the activity in net cash used in operating activities related to changes in assets and liabilities due to the volume and timing of other operating cash receipts and payments with respect to when the transactions are reflected in earnings.
Refer to the discussions above under “” for further details.
Results of Operations
83
Cash Flows from Investing Activities
The increase in net cash used in investing activities was primarily due to the development of the Company’s NextGen Earth Observation constellation, which totaled $12.9 million during 2021 compared to $5.7 million during 2020. The remainder of the increase related to the buildout of other corporate and operational facilities.
Cash Flows from Financing Activities
During 2021, net cash provided by financing activities primarily consisted of $50 million of proceeds received related to the issuance of the Senior Secured Notes due 2026 and related warrants in March 2021, and $25 million of proceeds received related to the issuance of the
Pre-Combination
Notes and related warrants and derivatives in November 2021, partially offset by $8.9 million of cash paid related to issuance and transaction costs.During 2020, net cash provided by financing activities primarily consisted of $14.5 million of proceeds received related to contributions from non-controlling interest, and $2.5 million of proceeds received related to the issuance of the PPP Loan, partially offset by the payment of issuance costs of $2 million related to the Convertible Notes due 2028.
Other Material Cash Requirements
In addition to the Company’s debt service requirements and any payment obligations on warrants and derivatives, the Company has certain short-term and long-term cash requirements under operating leases and certain other contractual obligations and commitments.
Operating Leases
Refer to Note 15 “Leases” to the condensed consolidated financial statements for the three months ended March 31, 2022 for further information regarding our operating leases as of March 31, 2022.
PIPE Investment
84
The Company entered into commercial agreements to purchase $20 million of goods and services over three years from two affiliates of a PIPE investor. These commercial agreements became effective upon the closing of the Merger.
Off-Balance
Sheet ArrangementsAs of March 31, 2022, we do not have any material
off-balance
sheet arrangements other than the Combination Warrants, which are described above. Upon closing of the Merger, the Combination Warrants became both indexed to and classified as equity under U.S. GAAP.CRITICAL ACCOUNTING POLICIES AND ESTIMATES
The accompanying consolidated financial statements are prepared in accordance with GAAP, which requires the Company to select accounting policies and make estimates that affect amounts reported in the consolidated financial statements and the accompanying notes. Management’s estimates are based on the relevant information available at the end of each period. Actual results could differ materially from these estimates under different assumptions or market conditions. The following accounting policies are based on, among other things, estimates and judgments made by management that include inherent risks and uncertainties.
Revenue Recognition
The Company adopted Accounting Standards Codification (“”) 606, using the modified retrospective method on January 1, 2020. The adoption of ASC 606 did not result in an adjustment to accumulated deficit.
ASC
Revenue from Contracts with Customers,
Under ASC 606, the Company applies the following five steps in order to recognize revenue from contracts with customers: (i) identify the contract(s) with a customer; (ii) identify the performance obligation(s) in the contract; (iii) determine the transaction price; (iv) allocate the transaction price to the performance obligation(s) in the contract; and (v) recognize revenue when (or as) the entity satisfies a performance obligation. The Company only applies the five-step model to contracts when it is probable that the entity will collect the consideration it is entitled to in exchange for the goods or services it transfers to the customer.
At contract inception, the Company assesses whether the goods or services promised within the contract represent a performance obligation. A performance obligation is a promise in a contract to transfer a distinct good or service to the customer and is the unit of account in ASC 606. For contracts with multiple performance obligations, the Company allocates the contract’s transaction price to each performance obligation on a relative basis using the best estimate of the stand-alone selling price of each performance obligation, which is estimated using the expected-cost-plus-margin approach. Generally, the Company’s contracts with customers are structured such that the customer has the option to purchase additional goods or services. Customer options to purchase additional goods or services do not represent a separate performance obligation as the prices for such options reflect the stand-alone selling prices for the additional goods or services. The majority of the Company’s contracts with customers have a single performance obligation.
The Company recognizes the transaction price allocated to the respective performance obligation as revenue as the performance obligation is satisfied. The majority of the Company’s contracts with customers relate to the creation of specialized assets that do not have alternative use and entitle the Company to an enforceable right to payment for performance completed to date. Accordingly, the Company generally measures progress towards the satisfaction of a performance obligation over time using theinput method.
cost-to-cost
Payments for costs not yet incurred or for costs incurred in anticipation of providing a good or service under a contract with a customer in the future are included in prepaid expenses and other current assets on the consolidated balance sheets.
85
As the majority of the Company’s revenue is recognized over time using theinput method, the recognition of revenue and the estimate ofis complex, subject to many variables and requires significant judgment.
cost-to-cost
cost-at-completion
Estimate-at-completion
EAC
cost-at-completion
Based on the results of the periodic EAC process, any adjustments to revenue, cost of sales, and the related impact to gross profit are recognized on a cumulative
catch-up
basis in the period they become known. These adjustments may result from positive program performance, and may result in an increase in gross profit during the performance of individual performance obligations, if it is determined the Company will be successful in mitigating risks surrounding the technical, schedule and cost aspects of those performance obligations or realizing related opportunities. Likewise, these adjustments may result in a decrease in gross profit if it is determined the Company will not be successful in mitigating these risks or realizing related opportunities. A significant change in one or more of these estimates could affect the profitability of one or more of the Company’s performance obligations.Contract modifications often relate to changes in contract specifications and requirements. Contract modifications are considered to exist when the modification either creates new or changes the existing enforceable rights and obligations. Most of the Company’s contract modifications are for goods or services that are not distinct from the existing contract due to the significant integration service provided in the context of the contract and are accounted for as if they were part of that existing contract. The effect of a contract modification on the transaction price, and the measure of progress for the performance obligation to which it relates, is recognized as an adjustment to revenue either as an increase in or a reduction of revenue on a cumulative
catch-up
basis.Some of the Company’s long-term contracts contain award fees, incentive fees, or other provisions that can either increase or decrease the transaction price. These variable amounts generally are awarded upon achievement of certain performance metrics, program milestones or cost targets and can be based upon customer discretion. Variable consideration is estimated at the most likely amount to which the Company is expected to be entitled. Estimated amounts are included in the transaction price to the extent it is probable that a significant reversal of cumulative revenue recognized will not occur when the uncertainty associated with the variable consideration is resolved. Estimates of variable consideration and determination of whether to include estimated amounts in the transaction price are based largely on an assessment of the Company’s anticipated performance and all information (historical, current, and forecasted) that is reasonably available. The unfunded portion of enforceable contracts are accounted for as variable consideration.
When the estimatedexceeds the estimated revenue to be earned for a performance obligation, the Company records a reserve for the anticipated losses in the period the loss is determined. The reserve for anticipated losses on contracts is presented as a current liability in the consolidated balance sheets and as a component of cost of sales in the consolidated statements of operations and comprehensive loss in accordance with ASC Recognition -
cost-at-completion
605-35,
Revenue
Construction-Type and Production-Type Contracts.
Fair Value Measurements
The measurement of Legacy Terran Orbital’s share-based compensation awards, warrants and derivative liabilities were all based on the estimated fair value of Legacy Terran Orbital’s common stock. In the absence of a public market for Legacy Terran Orbital’s common stock, the valuation of its common stock has been determined using an option pricing model, which considers the guideline publicly-traded company method, guideline transaction method, market calibration method and discounted cash flow method.
86
For purposes of estimating the fair value of Legacy Terran Orbital’s common stock, the option pricing model was used to allocate the total enterprise value of Legacy Terran Orbital to the different classes of equity as of the valuation date. Under the option pricing model, the fair value of common stock was estimated as the net value of a series of call options, representing the present value of the expected future returns to common shareholders. The rights of the common shareholders were equivalent to a call option on any value above the preferred shareholders’ liquidation preferences, adjusted to account for the rights of conversion or participation retained by the preferred shareholders, as applicable. Thus, the common stock could have been valued by estimating the incremental value the common stock shares in each of these call option rights.
The significant assumptions used in the option pricing model included:
| • | Total enterprise value of Legacy Terran Orbital based on the guideline publicly-traded company method, guideline transaction method, market calibration method and discounted cash flow method; |
| • | Liquidation preferences, conversion values, and participation thresholds of different equity classes; |
| • | Probability-weighted time to a liquidity event; |
| • | Expected volatility based upon the historical and implied volatility of common stock for selected peers; |
| • | Expected dividend yield of zero as there was no history or plan of declaring dividends on its common stock; |
| • | Risk-free interest rate based on U.S. treasury bonds with a zero-coupon rate; |
| • | Implied valuation, timing, and probability of the Merger; and |
| • | A discount for the lack of marketability of Legacy Terran Orbital’s common stock. |
For purposes of estimating the total enterprise value of Legacy Terran Orbital, Legacy Terran Orbital considered the guideline publicly-traded company method, guideline transaction method, market calibration method and discounted cash flow method. A summary of each method and related significant assumptions were as follows:
| • | Guideline publicly-traded company method: The guideline publicly-traded company method uses valuation multiples based on the enterprise value in relation to revenue for publicly-traded companies in the same or similar industries to arrive at an indication of value. Based on the implied valuation multiples of the peer companies, a valuation multiple of revenue is selected in order to estimate the enterprise value as of the valuation date. |
| • | Guideline transaction method: The guideline transaction method uses valuation multiples based on observed transactions that have occurred in the marketplace for companies in the same or similar industries to arrive at an indication of value. Based on the observed valuation multiples by comparing the implied enterprise values of the transaction to the respective revenue of the companies being acquired, a valuation multiple of revenue is selected in order to estimate the enterprise value as of the valuation date. |
| • | Market calibration method: The market calibration method analyzes the percent change in the enterprise values of peer companies between the prior valuation date and the current valuation date. Based on the observed market movement in the enterprise values of peer companies, a market movement factor is selected to represent the potential shift in enterprise value between the prior valuation date and the current valuation date. The selected market movement factor is applied to the indicated value as of the prior valuation date. |
| • | Discounted cash flow method: The discounted cash flow method estimates the enterprise value of a company by discounting projected cash flows using market participant assumptions. The derivation of projected cash flows is based on forecasted revenue, operating profit margins, operating expenses, cash flows, and perpetual growth rates. The discount rate is derived from a company’s capital structure and weighted-average cost of capital. Given the forecasted rapid growth in revenue compared to historical performance, the discounted cash flow method was primarily performed to corroborate the reasonableness of the indications of value from the guideline publicly-traded company method, guideline transaction method, and market calibration method. |
87
The results of the guideline publicly-traded company method, guideline transaction method and market calibration method were equally weighted when determining the total enterprise value of Legacy Terran Orbital. Beginning in 2021, only the guideline publicly-traded company method and market calibration method were considered when determining the total enterprise value of Legacy Terran Orbital as a result of the implied valuation and timing and probability of a
de-SPAC
transaction. Finally, the total enterprise value of Legacy Terran Orbital was discounted for the lack of marketability of the Company’s common stock, which ranged from 7% to 34% and varied primarily based on the timing and probability of ade-SPAC
transaction.Legacy Terran Orbital considered various objective and subjective factors to determine the fair value of its common stock as of valuation date, including:
| • | Stage of development and recent operational developments and milestones and related impact on historical earnings; |
| • | Short-term and long-term business initiatives and related impact on projected earnings; |
| • | Company-specific credit and risk considerations; |
| • | Industry information, such as external market conditions affecting the small satellite industry and trends within the small satellite industry; |
| • | Recent observed valuations and operating metrics of an identified peer group; |
| • | Likelihood and timing of achieving a liquidity event, such as an initial public offering, SPAC merger, or strategic sale, or probability of an insolvency event given prevailing market conditions and the nature and history of Legacy Terran Orbital’s business; |
| • | Prices, privileges, powers, preferences and rights of the Legacy Terran Orbitals’s redeemable convertible preferred stock relative to those of its common stock; and |
| • | Macroeconomic conditions and other factors. |
The following represents the range of the estimated fair value of Legacy Terran Orbital’s common stock for the indicated periods:
| • | January 1, 2020 through December 31, 2020: $34.73 per share to $74.37 per share |
| • | January 1, 2021 through December 31, 2021: $74.37 per share to $193.05 per share |
The range of estimated fair values of Legacy Terran Orbital’s common stock includes dates prior to the execution of the Merger Agreement. Beginning in January of 2021 and continuing throughout 2021, Legacy Terran Orbital was actively pursuing becoming a public company through either a
de-SPAC
transaction or an initial public offering. Legacy Terran Orbital received an indication of interest in early 2021 regarding a potentialde-SPAC
transaction prior to the commencement of communications with Tailwind Two. Conversations and negotiations with Tailwind Two regarding the Merger commenced in May of 2021 with execution of the Merger Agreement on October 28, 2021, which resulted in an implied fair value of Legacy Terran Orbital’s common stock of approximately $277.07 per share based on the exchange ratio as of that date. Accordingly, the estimated fair value of Legacy Terran Orbital’s common stock during 2021 considered the implied valuation and timing and probability of ade-SPAC
transaction. Legacy Terran Orbital’s estimate regarding the probability of ade-SPAC
transaction was 15%, 50%, 50%, 60% and 70% as of December 31, 2020, March 31, 2021, June 30, 2021, September 30, 2021 and December 31, 2021, respectively, based on its assessment of the status and likelihood of events noted above. Following the Merger, the fair value of common stock will be based on the closing price of Terran Orbital’s common stock on the relevant valuation date as reported on the New York Stock Exchange.The fair value of the
Pre-Combination
Warrants and FPPre-Combination
Warrants were estimated using the option pricing model as described above.88
The fair value of share-based compensation awards granted in the form of stock options as well as the Detachable Warrants using the Black-Scholes option-pricing model. In addition to the estimated fair value of Legacy Terran Orbital’s common stock, additional assumptions used in the Black- Scholes option-pricing model included:
| • | The exercise price of the instruments; |
| • | Expected term of the instruments; |
| • | Expected volatility based upon the historical and implied volatility of common stock for selected peers; |
| • | Expected dividend yield of zero as there was no history or plan of declaring dividends on its common stock; and |
| • | Risk-free interest rate based on U.S. treasury bonds with a zero-coupon rate. |
The grant date fair value of retention restricted stock units, which included a market vesting condition, was determined using the Monte Carlo simulation model using the following significant inputs and assumptions as of the valuation date: (i) the price per share of Terran Orbital Corporation’s common stock, (ii) the risk-free interest rate, (iii) the dividend yield, (iv) the estimated volatility, and (v) a discount for lack of marketability.
The fair value of the Inducement Warrants was derived using a lattice model with substantially the same significant inputs and assumptions as the Black-Scholes option-pricing described above. Additional assumptions used in the lattice model included (i) the estimated counterparty credit spread based on an estimated credit rating of CCC and below, (ii) the implied valuation, timing, and probability of closing the Merger, and (iii) a discount for the lack of marketability of Legacy Terran Orbital’s common stock. The final fair value of the Inducement Warrants was based on the number of shares of Terran Orbital Corporation common stock issued as part of the Merger and the price per share of Terran Orbital Corporation’s common stock as of the Merger.
The fair values of the Combination Warrants and FP Combination Warrants were derived using the Black-Scholes option-pricing model as described above. Prior to the Merger, additional assumptions utilized included: (i) the price per share of Tailwind Two’s common stock, (ii) the probability of closing the Merger, and (iii) the estimated redemption rate of Tailwind Two’s public shareholders.
The fair values of the Combination Equity and FP Combination Equity were derived using the following significant inputs and assumptions as of the valuation date: (i) the price per share of Tailwind Two’s common stock, (ii) the probability of closing the Merger, and (iii) the estimated redemption rate of Tailwind Two’s public shareholders. The final fair values of the Combination Equity and FP Combination Equity were based on the number of shares of Terran Orbital Corporation common stock issued as part of the Merger and the price per share of Terran Orbital Corporation’s common stock as of the Merger.
The fair value of the public warrants was based on the quoted market price of the public warrants as of each valuation date. As the Private Placement Warrants are similar to the public warrants, the fair value of the Private Placement Warrants was based on the quoted market price of the public warrants as of each valuation date.
In addition, the Company is required to estimate the fair value of its debt instruments for disclosure purposes. The fair value of each debt instrument was estimated using a lattice model with the following significant inputs and assumptions: (i) time to maturity, (ii) coupon rate, (iii) discount rate based on an estimated credit rating of CCC and below, (iv) risk-free interest rate, and (v) contractual features such as prepayment options, call premiums and default provisions. For convertible instruments, additional consideration was made based on the fair value of common stock as described above. The fair value of long-term debt related to the PIPE Investment Obligation was estimated using the discounted cash flow valuation method applied to the sixteen quarterly payments using a discount rate based on a risk-free rate derived from constant maturity yields ranging plus a credit risk derived from an estimated credit rating of CCC and below.
The assumptions underlying these valuations represented management’s best estimate, which involved inherent uncertainties and the application of management’s judgment. If management had used different assumptions or estimates, the fair value of Legacy Terran Orbital’s common stock, grant-date fair value of its share-based compensation awards, warrants and derivatives, and debt instruments could have been materially different.
Inventory
Inventory consists of parts andbasis. Inventory is presented net of an allowance for losses associated with excess and obsolete items, which is estimated based on the Company’s current knowledge with respect to inventory levels, planned production and customer demand.
sub-assemblies
that are ultimately consumed in the manufacturing and final assembly of satellites. When an item in inventory has been identified and incorporated into a specific satellite, the cost of thesub-assembly
is charged to cost of goods sold in the consolidated statements of operations and comprehensive loss. Inventory is measured at the lower of cost or net realizable value. The cost of inventory includes direct material, direct labor and manufacturing overhead and is determined on afirst-in-first-out
89
Long-lived Assets Impairment
The Company reviews long-lived assets for impairment whenever events or changes in business circumstances indicate that the net carrying amount of an asset or asset group may not be fully recoverable. The Company groups assets at the lowest level for which cash flows are separately identified. Recoverability is measured by a comparison of the net carrying amount of the asset group to its expected future undiscounted cash flows. If the expected future undiscounted cash flows of the asset group are less than its net carrying amount, an impairment loss is recognized based on the amount by which the net carrying amount exceeds the fair value less costs to sell. The calculation of the fair value less costs to sell of an asset group is based on assumptions concerning the amount and timing of estimated future cash flows and assumed discount rates, reflecting varying degrees of perceived risk.
Loss Contingencies
From time to time, the Company is subject to claims and lawsuits in the ordinary course of business, such as contractual disputes and employment matters. The Company is also subject to regulatory and governmental examinations, information requests and subpoenas, inquiries, investigations, and threatened legal actions and proceedings. The Company records accruals for losses that are probable and reasonably estimable. These accruals are based on a variety of factors such as judgment, probability of loss, opinions of internal and external legal counsel. Legal costs in connection with claims and lawsuits in the ordinary course of business are expensed as incurred.
Income Taxes
The Company files income tax returns for U.S. federal and various state jurisdictions and in Italy for its foreign subsidiary.
The Company accounts for income taxes using the asset and liability method. Under the asset and liability method, deferred tax assets and liabilities are recognized for the temporary differences between the financial statement carrying amounts of existing assets and liabilities and their respective tax basis. The effect on deferred tax assets and liabilities of a change in tax laws is recognized in the results of operations in the period the new laws are enacted. A valuation allowance is recorded to reduce the carrying amount of deferred tax assets to the estimated realization amount.
The valuation allowance for deferred tax assets relates to the uncertainty of the utilization of U.S. federal, state and foreign deferred tax assets. In evaluating the Company’s ability to recover its deferred tax assets, the Company considers all available positive and negative evidence, which include its past operating results, the existence of cumulative losses in the most recent years, and its forecast of future taxable income. In estimating future taxable income, the Company develops assumptions related to the amount of future
pre-tax
operating income, the reversal of temporary differences, and the implementation of feasible and prudent tax planning strategies. These assumptions require significant judgment about the forecasts of future taxable income and are consistent with the plans and estimates the Company is using to manage its underlying businesses.The Company recognizes positions taken or expected to be taken in a tax return in the consolidated financial statements when it is
more-likely-than-not
(i.e., a likelihood of more than 50%) that the position would be sustained upon examination by tax authorities. A recognized tax position is then measured at the largest amount of benefit with greater than 50% likelihood of being realized upon ultimate settlement. The Company records liabilities for positions that have been taken but do not meet themore-likely-than-not
recognition threshold.ACCOUNTING PRONOUNCEMENTS
Refer to Note 1 “” to the condensed consolidated financial statements for the three months ended March 31, 2022 for further information about recent accounting pronouncements and adoptions.
Organization and Summary of Significant Accounting Policies
QUANTITATIVE AND QUALITATIVE DISCLOSURES ABOUT MARKET RISK
Not applicable to smaller reporting companies.
90
BUSINESS
Industry Context
The space industry is undergoing an exciting generational transformation toward proliferation of small satellites, supported by several macro-themes:
| • | Movement from a small number of very large, expensive satellites with deep capabilities but limited Earth coverage, to large constellations of smaller satellites with more comprehensive and persistent coverage. |
| • | Movement from bespoke and costly satellite manufacturing techniques to high volume, high velocity industrialized production. |
| • | Commodization of launch costs enabling proliferation of smaller satellites and frequent refreshes to technology on orbit. |
| • | New sensor technologies advanced by commercial markets such as transportation making new array of sensor payloads highly capable, robust, and affordable to launch on orbit, with high utilization and throughput. An example of new sensor technology includes SAR, or Synthetic Aperture Radar, which has the ability to see at night as well as day, in all weather conditions, and through obstructions such as foliage or smoke. |
| • | Expansion from predominantly owned-and-operated data-as-a-service |
| • | Large government organizations increasingly comfortable purchasing imagery as a service from more nimble, independent operators, and actively migrating budgets from retiring older space and airborne programs in addition to dedicating new capital sources. The caveat is that only those companies with deep integration to government programs, and highly secure supply chains and technology, will be eligible to participate. |
The majority of the large Earth observation market today remains high-consumption,
non-commercial
customers, such as military, intelligence and civil government entities, with well established and growing budgets. Additional growth is emerging from a newer commercial industry, serving a variety of Earth observation needs. We believe that companies which are well-established and equipped to serve secure and specialized government entities where near-term opportunities exist, in addition to supporting commercial use cases as they continue to scale, are highly advantaged in this market over pure-play commercial satellite players who will be dependent on commercial futures to underwrite their business growth.In this context, we believe there is tremendous opportunity for a company that has proprietary capability to mass manufacture and operate proven small satellites, at industrial scale and cost, to serve the small satellite revolution. This opportunity includes the ability to be the primary supplier of small satellite vehicles and mission operations to larger customers that require their own dedicated programs, as well as the ability to launch proprietary constellations in amodel to serve the middle and long-tail market for Earth observation that has historically been unable to participate due to very high fixed costs.
data-as-a-service
Company Overview
Terran Orbital is a U.S.-based manufacturer, owner and operator of satellites and related space-based solutions that provide Earth observation, data and analytics to defense, intelligence, civil and commercial end users. Through its subsidiary Tyvak Nano-Satellite Systems Inc. (“Terran Orbital Satellite Solutions”), Terran Orbital is a leading provider of next-generation, turnkey satellite solutions focused primarily on the small
91
satellite market. Drawing from over a decade of its satellite solutions and mission support experience, Terran Orbital is developing, through its PredaSAR subsidiary (“Terran Orbital Earth Observation Solutions”), a constellation of NextGen Earth observation (“EO”) satellites using unique Synthetic Aperture Radar (“SAR”) data and electro-optical capabilities to provide EO data and mission solutions that it believes will be distinguished by breadth of coverage, revisit rates and ability to observe and detect during day and night and through clouds and other interference. Terran Orbital is a leader in satellite technology and satellite solutions serving U.S. government defense, intelligence and civil agencies, including the U.S. Department of Defense (the “DoD”), the Space Development Agency (the “SDA”) and the National Aeronautics and Space Administration (“NASA”), as well as aerospace and defense prime contractors, including Lockheed Martin and numerous other governmental and commercial businesses that operate in the high-growth sectors of satellite, space-based solutions.

Terran Orbital Satellite Solutions works with established customers across the federal agencies, including DoD, Intelligence Community and major defense prime contractors. It also supports commercial and academic customers. Through Terran Orbital Satellite Solutions, the Company currently deliverssatellite solutions including spacecraft design, development, launch services and
end-to-end
on-orbit
operations for critical missions across a number of applications in a variety of orbits. Terran Orbital Satellite Solutions has over 65 flight-proven modules and devices which enable the Company to rapidly respond to customer needs. This deep portfolio of knowledge in design engineering teams has led to the track record of mission success, demonstrated by Terran Orbital Satellite Solutions’ over 80 missions executed. Terran Orbital Satellite Solutions continues to support numerous successful marquee agencies, including NASA and SDA.In addition, Terran Orbital Earth Observation Solutions has commenced building satellites and intends to continue to develop and launch the largest commercially operated NextGen Earth Observation constellation. Terran Orbital Earth Observation Solutions plans to provide near persistent global coverage and near real-time, mission-critical Earth observation data. Its first constellation of 96 satellites is currently planned to be completed and
in-orbit
by 2026. Our NextGen Earth Observation constellation is projected to achieve under10-minute
average revisit rates (the rate at which a satellite constellation revisits a certain position over Earth, with higher revisit rates allowing more constant monitoring of the Earth’s surface) once fully deployed. Our NextGen Earth Observation constellation relies on proprietary technology developed and owned by the Company. The satellites will feature SAR capabilities, which permit day and night observance through clouds and other interference. In addition, Terran Orbital Earth Observation Solutions plans to provide secondary payload solutions and onboard data processing capabilities on its satellite constellation, including sensors, optical links or other mission solutions. Terran Orbital Satellite Solutions92
will manufacture Terran Orbital Earth Observation Solutions’ satellite constellation. The scope and timing of the constellation is subject to continuing assessments of customer demand and the Company’s financial and other resources.
As discussed elsewhere in this prospectus, following the lower than expected liquidity from the Business Combination as a result of the approximately 91% redemption rate by holders of Tailwind Two’s Class A Ordinary Shares and amendments to our debt agreements entered into on March 25, 2022, the timing and development of our NextGen Earth Observation constellation is subject to our raising additional capital. See
“Risk Factors — Other Risks Related to our Business and Operations — We are an early stage company with a history of losses and may not achieve or maintain profitability. In addition, we will not be able to pursue, develop and deploy our NextGen Earth Observation constellation as planned and other growth initiatives unless and until we raise additional sufficient capital.”
Terran Orbital Satellite Solutions’ Offering
Demand for small satellites is growing rapidly as both government and commercial customers are increasingly seeking space-based solutions to solve their most critical national security and commercial challenges. Terran Orbital Satellite Solutions is enabling greater access to space by providing U.S.-based,
end-
to-end,
cost-effective small satellite and related space-based systems using agile aerospace design and manufacturing processes.| • | Architecture Definition |
| • | Design & Prototyping . |
| • | Manufacturing, Integration & Test in-house, from the manufacturing of parts to the final assembly. We believe that vertical integration is critical to our focus on meeting the highest quality standards necessary for space flight. |
| • | Launch low-cost satellite separation systems since its first launch in 2003. Terran Orbital Satellite Solutions manufactures all of its satellite dispensersin-house, allowing for full control of engineering and flight unit production. This provides us with proper management over a critical stage of the launch process to ensure that the satellite is directed into the correct orbit. |
| • | Operations end-to-end in-house mission operations center based in Irvine, California and fully integrated ground communications network that includes more than 30 stations in Norway, Australia, Argentina and other parts of the world. We deliver actionable,low-latency information around the clock, with autonomous mission operations utilizing proprietary software both on the spacecraft and throughout our ground infrastructure. Due to our history of mission success, we believe the Terran Orbital Satellite Solutions team has unique experience and institutional knowledge in operating spacecraft throughout all phases of the spacecraft lifecycle. We operate a global network of strategically located ground stations, pairing our own ground stations with partner ground stations where we lease access as needed. We believe that having this control of data downlink provides us with an important advantage in ensuring the timely delivery of key, mission-critical data and insights to our customers. |
93
Terran Orbital Earth Observation Solutions’ Planned NextGen Earth Observation Constellation
Earth observation is at a tipping point — lower costs to build and launch satellites in constellations, combined with innovative new satellite-based EO technologies will make real-time, persistent Earth observation widely available. Terran Orbital Earth Observation Solutions is building and will ultimately operate what we expect to be the world’s largest and most advanced, commercial NextGen Earth Observation constellation. Terran Orbital Earth Observation Solutions’business model is expected to generate a high-growth, high-margin revenue stream for the Company.
data-as-a-service
EO Satellite Technology:
96-satellite
constellation in low Earth orbit. Once completed, the constellation will provide daily coverage of 99.9% of the Earth’s population, with regional average (90% mean average) revisit rates as low as3-7
minutes. The scope and timing of the constellation is subject to continuing assessments of customer demand and the Company’s financial and other resources.| • | SAR true-to-form |
| • | Benefits Over Optical Imagery, or “Earth Observation 1.0.” mid- latitudes, where data is most highly sought-after. SAR is “Earth Observation 2.0,” with radar waves that travel through clouds, smoke, inclement weather and other obstructions to synthetically produce higher resolution images than optical imagery. Additionally, SAR can see as clearly at night as it does during the day, enabling 24/7 coverage. When directed on a target scene, SAR’s radio waves “illuminate” the target, allowing for imagery generation at night. This alone doubles the effectiveness of SAR as compared to optical imagery, which requires a separate source of light. |
| • | The Satellites |
| • | The Antenna state-of-the-art |
94
satellite and on to the customer. This use of power is enabled by Terran Orbital Earth Observation Solutions’ satellite bus which is larger than small satellite competitors. This will deliver significantly more power throughput than commercial off-the-shelf |
| • | The Constellation |
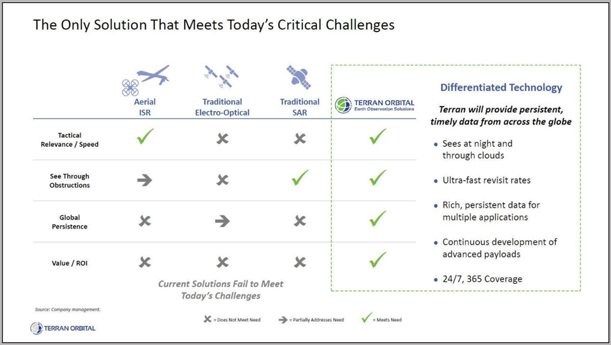 |
Earth Observation Solutions to be Delivered:
data-as-a-service
| • | SAR Data |
95
| • | Image Processing |
| • | Focused Studies |
Earth Observation Market Opportunity:
| • | National Defense & Intelligence |
| • | Civil Agencies; NASA |
| • | Maritime Logistics |
| • | Energy & Utilities |
| • | Emergency Response |
| • | Environment & Climate |
| • | Business Intelligence |
96
Strategy Overview
We seek to continue to be a vertically integrated space solutions provider that delivers superior mission outcomes and real time information for defense, intelligence, civil and commercial customers. To continue to accomplish this, we intend to:
| • | Pursue our $12 billion identified pipeline |
| • | Expand into new state-of-the-art |
| • | Drive further vertical integration |
| • | Launch and expand our NextGen Earth Observation constellation, in addition to other next generation sensor payloads |
| • | Expand use cases for NextGen Earth Observation satellites true-to-form |
97
| • | Selectively explore new strategic initiatives |
Competitive Advantage Overview
We strive to be the leading vertically integrated satellite space solutions provider delivering superior mission outcomes and real time intelligence for defense, intelligence and commercial customers. We believe our ability to compete successfully as a commercial provider of small satellite solutions and SAR data does and will depend on several factors, including our ability to maintain flight heritage ahead of our peers, our lead in advanced technology, vertical integration and control over our products and customer confidence in the reliability of our solutions.
Our competitors consist of small satellite providers with varying degrees of
in-house
capabilities. Terran Orbital Satellite Solutions provides vertically integrated full life cycle small satellite solutions, which allows for total control over our end products and mission solutions. Our competitors include multiple types of Earth observation data constellation providers, from large constellations of very small satellites to smaller constellations of relatively large and higher-cost satellites. Terran Orbital Earth Observation Solutions provides a sizeable small satellite at a competitive cost, through reliance on ourin-house
manufacturing at Terran Orbital Satellite Solutions. We believe constellation size, scale and refresh rates are critical to the success of aSAR-based
mission solution. Our NextGen Earth Observation constellation payloads have additional power requirements over passive optical telescopes and their larger form factor allows for significantly higher power generation and storage. We believe we will have competitive advantages in the arenas in which we operate.| • | Proven track record of successful space missions best-in-class |
| • | U.S. domicile and leadership team |
98
| • | Focus on modular vehicles in-house manufactured parts and subsystems for all of our small satellites. This allows us to provide customers with a competitively priced small satellite solution, while maintaining a large degree of customization. This further means that when we develop a new satellite bus, nearly all, if not all, of the parts are space-proven and have operated in space. We believe this provides a significant competitive advantage over our peers when proving our ability to ensure mission success. We believe our substantial catalog of parts and subsystems, developed over a period of years, provides a significant barrier to entry and competitive advantage. |
| • | Unique, ground-breaking technology and high revisit rates 96-satellite constellation will have both a scale and cost advantage over all other competitors in the market. |
| • | Significant backlog and pent-up customer demand |
| • | Reduced capital requirements and increased mission assurance in-house, enabling us to better manage and control project time, scale and costs. We believe this distinguishes us from competing satellite- based solution providers that we believe are more reliant on third party providers. This control over nearly the entire manufacturing process has the added effect of delivering much higher quality standards and driving mission assurance. |
| • | Partnership with and compatibility across launch providers |
| • | Industry-leading team of engineers |
Global Space Economy Overview
Prior to the 1980s, the space industry in the United States existed in a monopoly controlled by the U.S. government, with all launches conducted under the supervision of a federal agency. Over the past three decades, however, the space industry has transformed from one dominated by government actors into a robust commercial marketplace. Companies across many space-related verticals have found success in a fast- growing market with consistent demand from both government and private customers.
99
Much of the industry is driven by government demand for solutions in areas such as weather- monitoring, communications and intelligence. The U.S. government has displayed a commitment to encouraging a robust and competitive commercial space sector by demonstrating a reliance on private companies to catalyze innovation and advance national space objectives. In addition to government funding and contracting, private capital has recently begun to enter the space market. This growth in private investment in the commercial space industry, combined with a substantial reduction in space launch costs, has led to a wave of new companies reinventing parts of the traditional space industry.
As the space market has grown in size and sophistication, various tangential industries and markets have become directly impacted by advances in the space market, causing an increase in the number of
end-
markets available to space-focused businesses. Today’s space market is largely driven by satellite technologies and applications (including Earth observation), space tourism, extraction of space resources andin-space
manufacturing.Terran Orbital addresses the core space markets of satellite design & production and mission operations as well as Earth observation.
Satellite Design & Production and Mission Operations Market
Though the launch and maintenance of larger satellites have been a staple of the space industry since virtually its inception, market participants have recently shifted focus to small satellites. Before 2018, small satellites were not a priority for government and commercial market participants. Today, however, several hundred small satellites are produced and launched per year and the small satellite industry is growing at a rate that suggests several thousand small satellite launches per year may be a near-term reality. Further, the rise of the small satellite market has created new market segments of nanosatellites and microsatellites, weighing less than 10 kilograms and between 10 and 100 kilograms, respectively. The decrease in the average size of satellites has coincided with a decrease in the average cost of satellites, driving an increase in demand from market participants for whom building satellite constellations or purchasing proprietary satellite- produced data was previously cost-prohibitive. According to Frost & Sullivan, the satellite design and production industry is expected to exceed $190 billion in cumulative revenue for 2021 to 2026.
The satellite mission operations industry has evolved in recent years to accommodate customers with no space expertise whose mission can be accelerated through the use of satellites or other space technology. Mission operations service providers contract with launch providers to secure space launch access for customers. They also purchase and operate ground equipment, including control centers and communications systems that link satellites to ground control to operate the satellite once in orbit. According to Euroconsult, the satellite mission operations industry is expected to exceed $115 billion in cumulative revenue for 2021 to 2026.
Earth Observation Market
A major growth opportunity for the global space economy is Earth observation. Satellite-based Earth observation uses remote sensing techniques to collect information on Earth and we believe has
far-reaching
applications acrossend-markets
such as defense, intelligence, infrastructure, engineering, natural resource management, and disaster management. Primary customers of the Earth observation industry consist of both government entities and commercial market participants. These customers are becoming more reliant on timely Earth observation data to monitor key changes around the world, including monitoring potentially hostile actors and events at key strategic locations. As commercial satellite Earth observation data has become more widely available, demand for the data has grown. The Earth observation market is benefiting from an increase in demand as geospatial intelligence plays an increasingly critical role in decision-making for defense, intelligence and civil government agencies and commercial organizations. Additionally, the rise in the accessibility of big data, artificial intelligence and integration platforms capable of processing diverse data sets have led to increased demand for the large quantities of data created by Earth observation satellites. According to Euroconsult, the Earth observation market is expected to exceed $35 billion in cumulative revenue for 2021 to 2026, though we believe the total addressable market, including both commercial and classified government programs, to be 3x larger for trusted U.S. providers.100
Regulatory
Our business is subject to extensive regulation in the industries we serve.
U.S. Government Contracts
Commercial Aerospace Product Regulation
non-U.S.
licensed spacecraft to be used to serve the United States. The FCC also licenses the operation of satellite earth stations and regulates the technical and other aspects of the operation of these facilities. The Department of Commerce, through NOAA CRSRA office, regulates and licenses the operation of private Earth remote sensing space systems, such as the NextGen Earth Observation constellation.Terran Orbital believes it currently has all of the government authorizations required for satellites it has built and operates for third parties.
Terran Orbital plans to operate the NextGen Earth Observation constellation under filings made by Norway with the ITU and will need to secure a license from Norway authorizing Terran Orbital to operate its satellite system. The orbital location and frequencies for Terran Orbital’s satellites are subject to the ITU’s regulations, including its frequency registration and coordination procedures, and its various provisions on spectrum usage. Those procedures are specified in the ITU Radio Regulations and seek to facilitate shared international use of limited spectrum and orbital resources in a manner that avoids harmful interference.
101
Among other things, the ITU regulations set forth procedures for establishing international priority with respect to the use of such resources, deadlines for bringing satellite networks into use in order to maintain such priority, and coordination rights and obligations with respect to other networks, which vary depending on whether such networks have higher or lower ITU priority. Further licensing by Norway may be required if material changes to the NextGen Earth Observation constellation are made. Terran Orbital has already been issued a NOAA license for initial operations of the NextGen Earth Observation constellation in the United States.
The Company plans to seek FCC and other government authority necessary to support operations of our NextGen Earth Observation constellation. The operation of certain of the Company’s satellites and earth stations is subject to various regulatory and licensing requirements, including technical and operational requirements of the FCC’s rules and regulations.
International Traffic in Arms Regulations (“
ITAR
”) and Export Controls
“dual-use”
applications (i.e., for both military and commercial applications) or that have less sensitive military or space-related applications that are not subject to the ITAR. The regulations exist to advance the national security and foreign policy interests of the United States.The U.S. government agencies responsible for administering the ITAR and the EAR have significant discretion in the interpretation and enforcement of these regulations. The agencies also have significant discretion in approving, denying, or conditioning authorizations to engage in controlled activities. Such decisions are influenced by the U.S. government’s commitments to multilateral export control regimes, particularly the Missile Technology Control Regime concerning the spaceflight business.
Many different types of internal controls and measures are required to ensure compliance with such export control rules. In particular, we are required to maintain registration under the ITAR; determine the proper licensing jurisdiction and classification of products, software, and technology; and obtain licenses or other forms of U.S. government authorizations to engage in activities, including the performance by foreign persons, related to and who support our spaceflight business. Under the ITAR, we must receive permission from DDTC to release controlled technology to foreign person employees and other foreign persons.
The inability to secure and maintain necessary licenses and other authorizations could negatively affect our ability to compete successfully or to operate our spaceflight business as planned. Failure to comply with export control laws and regulations could expose us to civil or criminal penalties, fines, investigations, more onerous compliance requirements, loss of export privileges, debarment from government contracts, or limitations on our ability to enter into contracts with the U.S. government. In addition, any changes in export control regulations or U.S. government licensing policy, such as that necessary to implement U.S. government commitments to multilateral control regimes, may restrict our operations. For further discussion of risks relating to ITAR and export controls, see “Risk Factors — Risks Related to Legal and Regulatory Matters — We are subject to stringent U.S. export and import control laws and regulations. Unfavorable changes in these laws and regulations or U.S. government licensing policies, our failure to secure timely U.S. government authorizations under these laws and regulations, or our failure to comply with these laws and regulations could have a material adverse effect on our business, financial condition and results of operation.”
Environmental Regulation
Other Applicable Regulations
non-U.S.
laws, regulations, and procurement policies and practices, including regulations relating to foreign investment in the United States, exchange controls, anti-corruption, and cash repatriation. Our international sales are also subject to varying currency, political and economic risks. See “Risk Factors — Risks Related to Terran Orbital’s Legal and Regulatory Matters — Our business is subject to various regulatory risks that could adversely affect our operations.”102
Human Capital Resources
As of March 31, 2022, Terran Orbital had over 330 employees, none of whom are subject to any collective bargaining agreement. Terran Orbital generally considers its relations with its employees to be positive.
Terran Orbital’s success largely depends on its hiring and retaining top talent across the entire organization, with primary emphasis on key engineering capabilities. Terran Orbital competes for talent within specialized industries across the U.S., particularly in California and Florida, and in Italy. In order to attract and retain top talent, Terran Orbital focuses on providing an innovative and safe workplace, while offering competitive compensation, health benefits and retirement planning. Most employees are shareholders of the Company and have an equity ownership that is intended to align employee retention and value creation. Terran Orbital provides employees with a structured performance management process and continuous feedback in order to further employee development. Terran Orbital values and prioritizes the health and safety of its team members and customers. Terran Orbital continually works to foster a culture of safety that enables its employees to minimize risk and to understand and follow safety rules, as well as to identify and correct unsafe actions, behaviors or situations. Terran Orbital focuses on compliance with all applicable environmental, health and safety requirements. Terran Orbital also offers its employees and their families comprehensive health and wellness rewards to help them achieve their best overall self. Terran Orbital promotes safe behaviors at work in order to avoid safety incidents, enhance employee wellness and minimize its environmental impact.
Terran Orbital is committed to its code of conduct, which outlines its commitment to its customers, its investors, its communities and to one another. Terran Orbital’s code of conduct provides a framework of what is expected of its employees and ensures it continues to foster a culture of high integrity. We also require certification to our code of conduct upon hiring new employees as well as require all new employees to take ethics and compliance training provided by a third-party vendor and offer additional compliance courses on a regular basis thereafter. Terran Orbital adheres to the governance requirements established by federal and state law, and strives to establish appropriate risk management methods and control procedures to adequately manage monitor, and control the major risks it may face day to day.
As a contractor of the U.S. government, all employees of Terran Orbital in the U.S. are required to be fully vaccinated against
COVID-19,
with the exception of approved medical disability or sincere religious exemptions. Terran Orbital follows The Centers for Disease Control and Prevention guidelines with regards to quarantining, masking and social-distancing. As a lean organization, Terran Orbital experienced challenges during the early stages of theCOVID-19
pandemic as employees who tested positive forCOVID-19
were required to quarantine and could not participate in production activitieson-site.
The increase in vaccination rates, among other developments in theCOVID-19
pandemic, has mitigated operational disruptions.Resources
Intellectual Property
We own a portfolio of U.S. and foreign trademark registrations and application as well as domain name registrations. In addition, we own other intellectual property such as unpatented trade secrets, know- how, proprietary data and software. Additionally, we rely on licenses of certain intellectual property to conduct our business operations, including certain proprietary rights to and from third parties. The U.S. government typically holds licenses to patents developed in the performance of U.S. government contracts and may use or authorize others to use the inventions covered by these patents for certain purposes. While our intellectual property rights in the aggregate are important to our operations, we do not believe that any particular trade secret, trademark, copyright, license or other intellectual property right, standing alone, is of such importance that its loss, expiration or termination would have a material effect on our business as a whole.
103
Raw Materials
Our business is generally engaged in limited manufacturing activities and have minimal exposure to fluctuations in the supply of raw materials. In manufacturing our products, we use our own production capabilities as well as a diverse base of third-party suppliers and subcontractors. Certain aspects of our manufacturing activities require relatively scarce raw materials; occasionally, we have experienced difficulty in our ability to procure raw materials, components,
sub-assemblies
and other supplies required in our manufacturing processes.Research and Development
We have both internally and externally funded research and development projects. Our current and future business is dependent on developing new enhancements and technology that go into our existing and future products and services. Our annual research and development expenses from continuing operations were $1.9 million in 2021. We intend to continue our focus on research and development and product and service enhancements as a key strategy for innovation and growth. Our efforts will continue to be directed into fields that we believe offer the greatest opportunities for long-term growth and profitability.
Facilities
We operate out of offices located in Irvine, California and Boca Raton, Florida. We have manufacturing facilities in Irvine, California (approximately 98,297 square foot facility), Santa Maria, California (approximately 17,520 square foot facility) and Torino, Italy (approximately 4,090 square foot facility) used for satellite manufacturing, assembly, integrating and testing. All of our properties are leased.
We are also in discussions to lease property for, build and finance, in partnership with Space Florida, Florida’s aerospace and spaceport development authority, a new $300 million campus totaling approximately 660,000 square foot satellite manufacturing facility, which is currently planned to be located in Brevard County, Florida, that we estimate will provide us with contract manufacturing capacity for more than 1,000 small satellites annually. We believe this facility will be the largest small satellite manufacturing facility in the world and we are targeting completion within 36 months of the finalization of the terms of the Space Florida Facility. As discussed elsewhere in this prospectus, the timing and development of our Space Florida Facility is subject to our raising additional capital.
We also operate from, but do not own, a global network of approximately 32 ground stations, pairing our own ground stations with partner ground stations where we lease access as needed.
Legal Proceedings
Terran Orbital and its properties are subject from time to time to various claims and legal proceedings that arise in the ordinary course of business. Neither Terran Orbital nor any of its properties are currently subject to any material legal proceeding, nor, to our knowledge, is any material legal proceeding, administrative or judicial proceeding threatened against us or any of our properties.
104
MANAGEMENT
Executive Officers and Directors
The following table lists the names, ages as of May 31, 2022, and positions of the individuals who serve as directors and executive officers of our company:
Name | Age | Position | ||
| Marc H. Bell | 54 | Co-Founder, Chairman and Chief Executive Officer | ||
| Anthony Previte | 57 | Co-Founder, Director, Chief Strategy Officer and Executive Vice President | ||
| Marco Villa | 47 | Chief Revenue Officer and Executive Vice President | ||
| Gary A. Hobart | 54 | Chief Financial Officer, Executive Vice President and Treasurer | ||
| Mathieu Riffel | 37 | Vice President and Controller | ||
| Daniel C. Staton | 69 | Vice Chairman | ||
| James LaChance | 57 | Director | ||
| Tom Manion | 68 | Director | ||
| Richard Y. Newton III | 66 | Director | ||
| Tobi Petrocelli | 38 | Director | ||
| Douglas L. Raaberg | 67 | Director | ||
| Stratton Sclavos | 60 | Director | ||
Executive Officers
Marc H. Bell
co-founder
and, prior to the Business Combination, served as Legacy Terran Orbital’s Chief Executive Officer from March 2021 until March 2022 and the chairman of its board of directors from inception until March 2022 when he became sole director. In his role, Mr. Bell providestop-level
leadership and helps guide the overall organization to meet its strategic goals. Mr. Bell is also an accomplished entrepreneur with a distinguished career. Mr. Bell has served as Director of ARMOUR Residential REIT, Inc. since November 2009. From November 2009 through August 2013, Mr. Bell served as ARMOUR’sCo-Founder,
Co-Chairman
of board of directors and Chief Strategy Officer. ARMOUR today holds over $8 billion worth of mortgage-backed and other securities in its portfolio. From June 2012 to April 2016, Mr. Bell served as Director of Javelin Mortgage Investment Corp. At FriendFinder Networks Inc., Mr. Bell served asCo-Chairman
of the Board from July 2012 to December 2013, as Chief Strategy Officer from July 2012 to October 2012 and as Chief Executive Officer, President and Director from October 2004 to June 2012. FriendFinder was strategically restructured pursuant to a consensual prepackaged plan of reorganization in federal bankruptcy court effective in 2013. Since September 2000, Mr. Bell has been Managing Partner at Marc Bell Capital. In addition, Mr. Bell is a member of the New York University (NYU) Board of Trustees, NYU Langone Health Board of Overseers, NYU Stern Center for Real Estate Finance Research Advisory Board, and the NYU College of Arts and Science Dean’s Advisory Council. He is also Chairman and Founder of the Boca Raton Police Foundation and serves on the board of directors of SOS Children’s Villages Florida. Mr. Bell earned a B.S. degree from Babson College and a M.S. in Real Estate Development and Investment from New York University.We believe that Mr. Bell’s experience and operational insight as Terran Orbital’s Chief Executive Officer, his executive leadership at other private and public companies and his extensive background and experience qualifies him to serve on our Board of Directors.
Anthony Previte
co-founder
and, prior to the Business Combination, Mr. Previte served as Legacy Terran Orbital’s Chief Strategy Officer and Executive Vice President from March 2021 until March 25, 2022, and a member of its board of directors from 2014 until March 2022. From 2014 until March 2021, Mr. Previte was Terran Orbital’s Chief Executive Officer and President. Mr. Previte has been Director at Tyvak Nano-Satellite Systems, Inc. since 2014, and Director at Starsmith LLC, an105
investment holding company focused on acquiring controlling interests in scientific and technological based companies, with an emphasis on long-term investment, since 2003. At FriendFinder Networks Inc., Mr. Previte has served as President and Chief Restructuring Officer since December 2013, and was President from February 2008 to December 2013 and Chief Operating Officer from February 2008 until July 2012. From 2008 through 2013, Mr. Previte held various positions at different subsidiaries of FriendFinder. FriendFinder was strategically restructured pursuant to a consensual prepackaged plan of reorganization in federal bankruptcy court effective in 2013. He has over 30 years of executive leadership in high-technology and space-based services businesses ranging from startups to Fortune 500 companies. Mr. Previte is an active space-based radio astronomy and astrophysics researcher focused on very
low-frequency
radio observation. Mr. Previte’s expertise in aerospace engineering, astronomy, economics and philosophy provides a unique perspective of the paradigm shift in the space landscape. Mr. Previte earned an Aerospace Engineering degree from Polytechnic University, an Astronomy & Astrophysics degree from Swinburne University of Technology and a Business Administration degree from University of Phoenix.We believe that Mr. Previte’s executive leadership at private and public companies and his extensive technical background and experience qualifies him to serve on our Board of Directors.
Dr.
Marco Villa
Gary A. Hobart
106
Mathieu Riffel
Non-Employee
DirectorsDaniel C. Staton
Non-Executive
Co-Chairman
of the board of directors of ARMOUR Residential REIT, Inc., a residential investment firm. Mr. Staton also served as President, Chief Executive Officer and Director of Enterprise Acquisition Corp., a blank check company formed for the purpose of acquiring an operating business, from its inception in 2007 until its merger with ARMOUR in 2009. Mr. Staton is the founder of Staton Capital LLC, a private investment firm, and has served as the firm’s Chairman and Managing Director since February 2003. Mr. Staton has also served as Director of Staton Techiya LLC since July 2017. Mr. Staton has served on the board of directors of Shurgard Self Storage SA since its initial public offering in 2018. From 1999 until 2020, Mr. Staton also served as Director of Public Storage, a self-storage company. Mr. Staton also served asNon-Executive
Chairman of JAVELIN Mortgage Investment Corp., a real estate investment firm, from June 2012 until April 2016. From October 2004 until June 2012, Mr. Staton served as Chairman of the board of directors of FriendFinder Networks Inc., an internet-based social networking and multimedia corporation. Mr. Staton also served as Treasurer of FriendFinder from December 2008 until June 2011, as Consultant of FriendFinder from October 2012 until December 2013 and asCo-Chairman
of the board of directors of FriendFinder from June 2012 until December 2013. Under Mr. Staton’s leadership asCo-Chairman
of the board of directors, FriendFinder was strategically restructured pursuant to a consensual prepackaged plan of reorganization in federal bankruptcy court effective in 2013. Between 1997 and 2007, Mr. Staton was President of The Walnut Group, a private investment firm, where he served as initial investor and Director ofBuild-A-Bear
co-producing
and investing in numerous Broadway musicals as well as with relationships withnot-for-profit
We believe that Mr. Staton’s extensive experience serving on the boards of directors of private and public companies and sourcing private equity and venture capital investments qualifies him to serve on our Board of Directors.
James LaChance
107
billion dollar projects. Mr. LaChance is currently the founder and owner, serving as Chairman and Chief Executive Officer, of The Compound LLC, an adventure marketing business in Las Vegas, Nevada, which he formed in 2011. Mr. LaChance currently serves as the Chairman of Paratus Energy Service LTD (f/k/a Seadrill New Finance Ltd.) since his appointment in January 2022. Previously, Mr. LaChance served as Chairman and lead independent director of Fieldwood Energy from July 2020 until August 2021. Prior to that, Mr. LaChance served as Chairman, lead independent director and interim Chief Strategic Officer of Energy XXI from December 2013 to January 2016, Chairman and interim Chief Executive Officer of Northern Offshore from 2007 to 2014 and Chairman and Interim Chief Executive Officer of Global Aviation from 2010 to 2013. In addition, Mr. LaChance has served on the board of directors of various private and public companies, including Eletson Shipping as
Co-Lead
Chairman from 2017 to 2020, Horizon Lines as director from 2010 until 2014 and Aspire LLC as Executive Chairman from 2015 until 2019. Prior to these appointments, for over 20 years, Mr. LaChance was an investment manager specializing in highly leveraged companies and distressed investment situations across the capital structure, serving as Portfolio Manager and Chief Investment Officer for several multi-billion dollar investment funds. Mr. LaChance earned a B.S. degree in Business from Northeastern University and a M.B.A. degree from New York University Stern School of Business.We believe that Mr. LaChance’s extensive entrepreneurial experience and leadership in managing and growing hedge funds and in operations management in the technology and science industries, as well as his experience serving on private and public boards of directors qualifies him to serve on our Board of Directors.
Colonel Tom Manion
24-year
career prior to his retirement in 2014. From 2010 to 2014, Mr. Manion held various corporate roles at J&J, including supporting the corporate compliance team and the HR transformation team. Prior to that, from 2005 to 2010, Mr. Manion ran the North American Pharmaceutical Group’s Financial shared services center. Prior to that, from 2003 to 2005, Mr. Manion was program lead for a2-year
project to implement a new enterprise-wide financial reporting system. Prior to that, from 2000 to 2003, Mr. Manion served as Vice President, CIO and Management Board Member of the Pharmaceutical Research Institute. Prior to that, from 1998 to 2000, Mr. Manion served as the CIO and Management Board Member of the Janssen Research Foundation. Prior to that, from 1990 to 1998, Mr. Manion held various roles, including manager, director, and executive director at J&J. Prior to that, Mr. Manion served in the US Marine Corps from 1978 until his retirement as Colonel in 2008 (30 years). Mr. Manion served in various roles in the Marine Corps Reserves from 1989 to 2008, retiring as theG-6
for the Fourth Marine Aircraft Wing. Prior to joining the Marine Corps Reserves, Mr. Manion served on active duty in the Marine Corps from 1978 to 1989. Mr. Manion is the father of 1st
Lt. Travis Manion USMC, who made the ultimate sacrifice for our country in April 2007. After the loss of Travis, Mr. Manion and his late wife Janet Manion established the Travis Manion Foundation (“TMF”) to support the U.S. military, the families of the fallen and to help create the next generation of leaders. Mr. Manion has served as the Chairman (from 2007 to 2011), and as Chairman Emeritus (since 2011) of TMF since its founding in 2007. As TMF’s Chairman Emeritus, Mr. Manion works within the community and around the country to inspire people around him to convey a sense of sacrifice and public service in all they do. Mr. Manion is also theco-author
of the book, “Brothers Forever,” the story about the friendship, service and sacrifice between Travis and his Naval Academy roommate Lt. (SEAL) Brendan Looney. Mr. Manion earned a B.S. in Political Science from Widener University and an M.S. in Systems Analysis from the Naval Postgraduate School.We believe that Mr. Manion’s extensive experience and leadership in the U.S. Marine Corps, his experience in management at J&J, and his vision and character as founder of the TMF qualifies him to serve on our Board of Directors.
Lieutenant General Richard Y. Newton III
non-wholly
owned subsidiary of Terran Orbital. From 2018 until 2019, Mr. Newton also served on the board of directors of ELTA North America. Mr. Newton served as Executive Director of The Union League Club of the City of New York from 2014 until 2015 and as Executive Vice President of the Air Force Association from 2012 until 2014. Mr. Newton served 34 years in the U.S. Military, including serving in the position of the United States Air Force Assistance Vice Chief of Staff, until he retired in 2012. He also served as the Deputy Chief of Staff for Manpower and Personnel. Additionally, he oversaw the Global108
Operations directorate for the Joint Chiefs of Staff, responsible for overseeing worldwide cyber security, reconnaissance, space and missile defense, the National Military Command Center and US military special technical operations, among others. Mr. Newton earned a B.S. degree from the United States Air Force Academy, a M.A. degree in Industrial Psychology and Human Relations from Webster University and a M.S. degree in National Security Strategy from The National War College.
We believe that Mr. Newton’s extensive experience and leadership in the U.S. Military, and his experience in national security and in serving on the boards of directors of public and private companies qualifies him to serve on our Board of Directors.
Dr.
Tobi Petrocelli
We believe that Dr. Petrocelli’s extensive experience and leadership in project management, sustainability management and corporate communications qualifies her to serve on our Board of Directors.
Major General Douglas L. Raaberg
Atomic-6
since 2020. From 2019 until 2021, Mr. Raaberg served as a member on the board of directors of PredaSAR Corporation, when PredaSAR Corporation was anon-wholly
owned subsidiary of Terran Orbital. From 2013 until 2017, Mr. Raaberg was Chief Executive, United Arab Emirates of Northrop Grumman Aerospace and Defense, where he led global business development in the UAE. From 2010 until 2013, Mr. Raaberg was Business Development Director of the Aerospace Sector at Northrup Grumman, where he was responsible for $10 billion in U.S. Air Force business development efforts. Mr. Raaberg served 31 years in the United States Air Force, until he retired as a Major General in 2009, where he directed a staff of 1,200 people from nine nations executing combat operations with over 29,000 aviators in the Middle East, Central Asia and Horn of Africa. Mr. Raaberg holds a B.S. degree in Aeronautical Engineering from the United States Air Force Academy, a M.S. degree in Systems Management from the University of Southern California and a M.S. degree in National Security Strategy from the National War College. Mr. Raaberg is a graduate of the Lead Virginia program for experienced leaders, and has participated in several executive leadership programs including, National Association of Corporate Directors’ Battlefield to Boardroom, Thunderbird University’s Global Business Executive Program and Federal Executive Institute’s Aspen Institute Executive Leadership Seminar. Mr. Raaberg also serves as a senior advisor to the Council for a Strong America on Mission: Readiness in Washington, D.C. and as a Falcon Foundation Trustee to the Air Force Academy.We believe that Mr. Raaberg’s extensive experience and leadership in air, space and cyber operations and defense, and his experience in international business management and development as well as service on the boards of directors of private and public companies qualifies him to serve on our Board of Directors.
Stratton Sclavos
start-ups.
From October 2008 until March 2018, Mr. Sclavos was a General Partner at Radar Partners. In July 1995, Mr. Sclavos joined VeriSign Inc. where he served as Chairman and Chief Executive Officer until May 2008. Additionally, Mr. Sclavos currently serves on the board of directors of BitGo Inc. Mr. Sclavos formerly served on the board of directors for over ten years for each of Salesforce.com, Inc., Juniper Networks, Inc. and Intuit Inc. Mr. Sclavos earned a B.S. degree in Electrical and Computer Engineering from University of California, Davis.109
We believe that Mr. Sclavos’ extensive experience and leadership as a principal investor and as an advisor in the technology industry and his experience serving on the boards of directors of public and private companies qualifies him to serve on our Board of Directors.
Corporate Governance
We have structured our corporate governance in a manner we believe closely aligns our interests with those of our stockholders. Notable features of our corporate governance include:
| • | we have independent director representation on our audit, compensation and nominating and corporate governance committees and our independent directors will meet regularly in executive sessions without the presence of our corporate officers or non-independent directors; |
| • | one of our directors qualifies as an “audit committee financial expert” as defined by the SEC; |
| • | we have implemented a range of other corporate governance best practices, including placing limits on the number of directorships held by our directors to prevent “overboarding” and a robust director education program; and |
| • | each of our directors except for Marc Bell, Anthony Previte and Daniel Staton on the Company Board qualify as independent directors under the NYSE rules, and SEC rules and regulations. |
Role of Board in Risk Oversight
The Board of Directors has extensive involvement in the oversight of risk management related to us and our business and accomplishes this oversight through the regular reporting to the Board of Directors by the audit committee. The audit committee represents the Board of Directors by periodically reviewing our accounting, reporting and financial practices, including the integrity of our financial statements, the surveillance of administrative and financial controls and our compliance with legal and regulatory requirements. Through its regular meetings with management, including the finance, legal and internal audit functions, the audit committee reviews and discusses all significant areas of our business and summarizes for the Board of Directors all areas of risk and the appropriate mitigating factors. In addition, our Board of Directors receives periodic detailed operating performance reviews from management.
Composition of Our Board of Directors
Our Board of Directors consists of nine (9) directors, which are divided into the following three (3) classes:
| • | Class I, which consists of Richard Y. Newton III, Tobi Petrocelli and Douglas L. Raaberg; |
| • | Class II, which consists of James LaChance, Daniel C. Staton and Stratton Sclavos; and |
| • | Class III, which consists of Marc H. Bell, Tom Manion and Anthony Previte. |
Board Committees
The standing committees of our Board of Directors consists of an audit committee, a compensation committee and a nominating and corporate governance committee. Our Board of Directors may from time to time establish other committees.
Our Chief Executive Officer, Chief Financial Officer and other executive officers regularly report to the
non-executive
directors and the audit, the compensation and the nominating and corporate governance committees to ensure effective and efficient oversight of our activities and to assist in proper risk management and the ongoing evaluation of management controls.110
Audit Committee
Our audit committee consists of James LaChance, who serves as the chairperson, Douglas L. Raaberg and Stratton Sclavos. Each member of the audit committee meets the financial literacy requirements of the NYSE corporate governance standards and the independence requirements of Rule
10A-3
of the Exchange Act. James LaChance qualifies as an “audit committee financial expert” as such term is defined in Item 407(d)(5) of RegulationS-K.
The purpose of the audit committee is to assist our Board of Directors in overseeing (1) the quality and integrity of our financial statements, (2) our independent auditor’s qualifications, independence, and performance, (3) the performance of our internal audit function, and (4) our compliance with legal and regulatory requirements.
Our Board of Directors has adopted a written charter for the audit committee which is available on our website.
Compensation Committee
Our compensation committee consists of Stratton Sclavos, who serves as the chairperson, Tobi Petrocelli and Douglas L. Raaberg.
The purpose of the compensation committee is to assist our Board of Directors in discharging its responsibilities relating to (1) compensating our Chief Executive Officer and other executive officers, (2) administering our equity-based compensation plans and (3) when we become subject to, or otherwise determine to comply with, the SEC disclosure requirements regarding Compensation Discussion and Analysis, reviewing the disclosures in Compensation Discussion and Analysis and producing an annual compensation committee report for inclusion in our proxy statement and annual report on Form
10-K.
Our Board of Directors has adopted a written charter for the compensation committee which is available on our website.
Nominating and Corporate Governance Committee
Our nominating and corporate governance committee consists of Richard Y. Newton III, who serves as the chairperson, Tom Manion and Tobi Petrocelli. The purpose of our nominating and corporate governance committee is to assist our Board of Directors in discharging its responsibilities relating to (1) identifying individuals qualified to serve as members of our Board of Directors, (2) developing and recommending to our Board of Directors a set of corporate governance guidelines for our Company, and (3) overseeing the evaluation of our Board of Directors and our management.
Our Board of Directors has adopted a written charter for the nominating and corporate governance committee which is available on our website.
Code of Business Conduct
We have adopted a new code of business conduct that applies to all of our directors, officers and employees, including our principal executive officer, principal financial officer and principal accounting officer, which is available on our website. Our code of business conduct is a “code of ethics,” as defined in Item 406(b) of Regulation
S-K.
Please note that our website address is provided as an inactive textual reference only. We will make any legally required disclosures regarding amendments to, or waivers of, provisions of our code of ethics on our website.Compensation Committee Interlocks and Insider Participation
None of the members of the compensation committee is or has been at any time one of our officers or employees. None of our executive officers currently serves, or in the past fiscal year has served, as a member of a board of directors or compensation committee (or other board of directors’ committee performing equivalent functions or, in the absence of any such committee, the entire board of directors) of any entity that has one or more executive officers serving as a member of Terran Orbital’s board of directors or compensation committee.
111
EXECUTIVE AND DIRECTOR COMPENSATION
Unless the context otherwise requires, this section discusses the material components of the executive compensation program of Legacy Terran Orbital prior to the consummation of the Business Combination for our named executive officers who are identified in the 2021 Summary Compensation Table below.
Overview
We have opted to comply with the executive compensation disclosure rules applicable to emerging growth companies, as we are an emerging growth company. The scaled disclosure rules are those applicable to “smaller reporting companies,” as such term is defined in the rules promulgated under the Securities Act, which require compensation disclosure for our principal executive officer and our two most highly compensated executive officers other than the principal executive officer whose total compensation for 2021 exceeded $100,000 and who were serving as executive officers as of December 31, 2021. We refer to these individuals as “named executive officers.” For the year ended December 31, 2021, our named executive officers were:
| • | Marc Bell, Co-Founder, Chairman, Chief Executive Officer and President of Terran Orbital; |
| • | Anthony Previte, Chief Strategy Officer and Executive Vice President of Terran Orbital; and |
| • | Marco Villa, Chief Revenue Officer, Executive Vice President and Head of International Business of Terran Orbital. |
As required under SEC rules, this narrative disclosure and the 2021 Summary Compensation Table below describes the 2021 compensation of our named executive officers and additional disclosure of 2022 compensation-related actions that help to give context to the 2021 disclosure provided. We expect that over time the Company’s executive compensation programs will evolve to reflect our status as a newly publicly- traded company, while still supporting our overall business and compensation objectives.
2021 Compensation of Named Executive Officers
Annual Base Salary
Annual base salaries are intended to provide a level of compensation sufficient to attract and retain an effective management team, when considered in combination with the other components of the executive compensation program. In general, we seek to provide an annual base salary level designed to reflect each executive officer’s scope of responsibility and accountability. During 2021 until February, Mr. Bell was entitled to a consulting fee as further described below and effective March 15, 2021, Mr. Bell’s salary was set at $995,000. During 2021 until February, each of Messrs. Previte’s and Mr. Villa’s annual base salary was $360,000 and $400,000, respectively and effective March 15, 2021, Mr. Previte’s annual base salary was increased to $995,000 and effective March 22, 2021, Mr. Villa’s annual base salary was increased to $450,000. Please see the “Salary” column in the 2021 Summary Compensation Table for the annual base salary received by each of the named executive officers in 2021.
Annual Bonuses
Effective as of March 15, 2021, Mr. Bell was eligible to earn an annual performance-based bonus based on achievement of certain goals, with an annual target bonus opportunity equal to 100% of his annual base salary, which was increased to 200% of his annual base salary effective October 23, 2021. Effective as of March 15, 2021, Mr. Previte became eligible to earn an annual performance-based bonus based on achievement of certain goals, with an annual target bonus opportunity equal to 100% of his annual base salary, and effective March 22, 2021, Mr. Villa became eligible to earn an annual performance-based bonus based on achievement of certain goals, with an annual target bonus opportunity equal to 100% of his annual base salary.
In respect to fiscal year 2021, the performance criteria for each Messrs. Bell, Previte and Villa was based on the following criteria: (i) entering into definitive documentation with respect to a corporate transaction with an implied pre-money enterprise value for the Company of at least $1.0 billion upon consummation, (ii) financial growth, including year-over-year consolidated revenue increase, (iii) operating goals, including significant growth of worldwide employee headcount and facility capacity, and (iv) recruitment and onboarding of key senior management. Based on the achievement of each of the performance criteria, the Board of Directors determined that bonuses for our named executive officers should be paid at 100% of target for each of Messrs. Bell, Previte, and Villa, and in each case prorated for the fiscal year based on each named executive officer’s employment agreement effective date, as further described under “—Executive Employment Agreements” below. The bonus amounts that were determined to be paid to our named executive officers for fiscal year 2021, which are expected to be paid by the end of April 2022, are shown in the “Non-Equity Incentive Plan Compensation” column in the 2021 Summary Compensation Table.
112
Equity Awards
In 2021, Messrs. Bell, Previte and Villa were granted 70,000, 154,633 and 37,316 restricted stock units, respectively, under the terms and conditions of the Amended and Restated Terran Orbital’s 2014 Equity Incentive Plan (“2014 Plan”), a grant notice and a restricted stock unit award agreement, the material terms of which are described below. In addition, effective January 30, 2022, Messrs. Bell, Previte and Villa were granted 9,041, 9,041 and 4,090 retention restricted stock units, respectively, and effective February 8, 2022, Messrs. Bell, Previte and Villa were granted 2,712, 2,721, and 1,227 retention restricted stock units, respectively, in each case, under the terms and conditions of the 2014 Plan, a retention grant notice and a retention restricted stock unit award agreement.
Other Compensation
During 2021, Mr. Bell received a consulting fee equal to $125,000 for consulting services performed in January and February 2021.
2021 Summary Compensation Table
The following table shows information regarding the compensation of the named executive officers for services performed in the year ended December 31, 2021.
Name and Principal Position(1) | Year | Salary ($)(2) | Bonus ($)(3) | Stock Awards ($)(4) | Non-Equity Incentive Plan Compensation ($)(5) | All Other Compensation ($)(6) | Total ($) | |||||||||||||||||||||
Marc Bell, | 2021 | 803,654 | — | 5,685,698 | 1,592,000 | 125,000 | 8,206,352 | |||||||||||||||||||||
Co-Founder, ExecutiveChairman | 2020 | — | — | — | — | 1,116,667 | 1,116,667 | |||||||||||||||||||||
Anthony Previte, Co-Founder, ChiefExecutive Officer and President | | 2021 2020 | | | 872,885 333,665 | | | 200,000 — | | | 12,439,047 — | | | 770,000 — | | | 10,356 12,862 | | | 14,293,134 333,665 | | |||||||
Marco Villa, Chief Revenue Officer, Executive Vice President and Head of International Business of Terran Orbital | | 2021 2020 | | | 439,423 394,939 | | | 140,000 — | | | 3,003,349 — | | | 321,741 — | | | 16,524 8,158 | | | 3,921,037 352,469 | | |||||||
| (1) | Effective March 2021, Mr. Previte was appointed to serve as Terran Orbital’s Co-Founder, Chief Strategy Officer and Executive Vice President, Mr. Bell was appointed to serve as Terran Orbital’sCo-Founder, Chairman, Chief Executive Officer and President, and Mr. Villa was appointed to serve as Terran Orbital’s Chief Revenue Officer, Executive Vice President and Head of International Business. During 2020 and until March 2021, Mr. Previte served as Terran Orbital’sCo-Founder, Chief Executive Officer and President, Mr. Bell served as Terran Orbital’sCo-Founder and Chairman, and Mr. Villa served as Tyvak’s Chief Operations Officer. |
113
| (2) | During 2020, each of Messrs. Previte’s and Mr. Villa’s annual base salary was $360,000 and $400,000, respectively; provided, that, in March 2020, Mr. Villa’s annual base salary was increased from $300,000 to $400,000. Of Mr. Villa’s $394,939 salary, $42,470 was paid through an Italian subsidiary of the Company. |
| (3) | Mr. Previte and Mr. Villa were each paid a one-time signing and relocation bonus equal to $200,000 and $140,000, respectively. |
| (4) | The amounts represented in the “Stock Awards” column reflect the aggregate grant date fair value of restricted stock units awarded during 2021 computed in accordance with the provisions of Financial Accounting Standards Board Accounting Standards Codification Topic 718, using methodologies and assumptions as described in the Fair Value Measurements section located in the Critical Accounting Policies under the heading “Management’s Discussion and Analysis of Financial Condition and Results of Operations.” |
| (5) | The bonus payment amounts for 2021 were approved by the Board of Directors and are expected to be paid in April 2022. |
| (6) | During 2020 and 2021 the Company paid for a supplemental executive health care policy for Mr. Previte and Mr. Villa. During 2020 Mr. Bell was paid an annual consulting fee equal to $416,667 and Mr. Bell’s single member limited liability company, Satellite Solutions Group LLC, received an aggregate consulting fee equal to $700,000 and during 2021 Mr. Bell was paid a consulting fee equal to $125,000. |
Outstanding Equity Awards at 2021 Fiscal
Year-End
The following table presents information regarding outstanding equity awards held by the named executive officers as of December 31, 2021.
Restricted Stock Unit Awards | ||||||||||||||||
Name | Number of Units of Stock that Have Not Vested (#) | Market Value of Units of Stock that Have not Vested ($) | Equity Incentive Plan: Number of Unearned Units that Have Not Vested (#) | Equity Incentive Plan: Market or Payout Value of Unearned Units That Have not Vested ($)(*) | ||||||||||||
Marc Bell | 70,000 | (1) | 13,513,500 | |||||||||||||
Anthony Previte | 84,633 | (2) | 16,338,401 | |||||||||||||
| 70,000 | (3) | 13,513,500 | ||||||||||||||
Marco Villa | 22,316 | (4) | 4,308,104 | |||||||||||||
| 15,000 | (5) | 2,895,750 | ||||||||||||||
| (*) | The market value of the restricted stock units that have not vested was calculated by multiplying the number of units shown in the table by the fair market value per share of our common stock as of December 31, 2021, which was $193.05. The fair market value of our common stock was estimated using the methodologies and assumptions described in the Fair Value Measurements section located in the Critical Accounting Policies and Estimates section under the heading “Management’s Discussion and Analysis of Financial Condition and Results of Operations.” |
Note | Grant Date | Vesting | ||
| (1) | 3/15/2021 | Vest based on satisfaction of (x) a service condition; annually over four years with 25% of the units vesting on each the first, second, third, and fourth anniversary of the vesting start date, subject to full acceleration on a change in control and (y) the occurrence of a liquidity event. | ||
| (2) | 2/24/2021 | Vest based on the satisfaction of (x) a service condition; 34,633 units vest annually over four years with 25% of the units vesting on each the first, second, third, and fourth anniversary of the vesting start date and 40,000 units vest annually over two years with 50% of the units vesting on the first anniversary of the vesting start date and 50% of the units vesting on the second anniversary of the vesting start date, in each case, subject to full acceleration on a change in control and (y) the occurrence of a liquidity event. | ||
114
| (3) | 3/15/2021 | Vest based on the satisfaction of (x) a service condition; annually over four years with 25% of the units vesting on each the first, second, third, and fourth anniversary of the vesting start date, subject to full acceleration on a change in control and (y) the occurrence of a liquidity event. | ||
| (4) | 2/24/2021 | Vest based on the satisfaction of (x) a service condition; annually over four years with 25% of the units vesting on each the first, second, third, and fourth anniversary of the vesting start date, subject to full acceleration on a change in control and (y) the occurrence of a liquidity event. | ||
| (5) | 3/22/2021 | Vest based on the satisfaction of (x) a service condition; annually over four years with 25% of the units vesting on each the first, second, third, and fourth anniversary of the vesting start date, subject to full acceleration on a change in control and (y) the occurrence of a liquidity event. | ||
Additional Narrative Disclosure
Offer Letters and Consulting Agreement
Marc Bell
Effective April 18, 2020, Mr. Bell entered into a consulting agreement with PredaSAR pursuant to which he was engaged to serve as an independent contractor of PredaSAR, effective March 1, 2020, for an indefinite term of service and as the Executive Chairman of PredaSAR’s board of directors. Under the consulting agreement, Mr. Bell was entitled to receive an annual consulting fee equal to $500,000 and was eligible to receive an annual contractor bonus, in the sole discretion of PredaSAR’s board of directors, but given his independent contractor status, was not eligible to receive or participate in any employee benefits. The consulting agreement terminated in February 2021, and he is now subject to the terms and conditions of an employment agreement, as described below.
Effective September 20, 2018, Mr. Bell entered into a confidentiality and trade secret policy agreement with Terran Orbital, which provided for the preservation of trade secrets and confidential information. This agreement was superseded by the mutual
non-disclosure
agreement Mr. Bell entered into with PredaSAR, effective April 18, 2020, which provided for a mutual covenant with respect to the disclosure of confidential information terminating no later than April 18, 2025. The mutualnon-disclosure
agreement was superseded by theat-will
employment, inventions assignment,non-compete,
non-disclosure
and arbitration agreement that is described below.Anthony Previte
Effective December 31, 2014, Mr. Previte entered into an offer letter with Tyvak, which provided that his employment was
at-will
and did not provide him with any severance entitlement in the event of his termination of employment. The offer letter was superseded by the employment agreement with Mr. Previte that is described below.Mr. Previte entered into an
at-will
employment, confidential information, invention assignment and arbitration agreement with Tyvak dated December 31, 2014, which subjected him to a perpetual duty ofnon-disclosure
with respect to confidential information and anon-solicitation
restriction during employment and for one year following his termination for any reason. Theat-will
employment confidential information, invention assignment and arbitration agreement was superseded by theat-will
employment, inventions assignment,non-compete,
non-disclosure
and arbitration agreement that is described below.Marco Villa
Effective June 18, 2013, Mr. Villa entered into an offer letter with Tyvak, which provided that his employment was
at-will
and did not provide him with any severance entitlement in the event of his termination of employment. The offer letter was superseded by the employment agreement with Mr. Villa that is described below.115
Effective July 3, 2014, Mr. Villa entered into an
at-will
employment, confidential information, invention assignment and arbitration agreement with Tyvak, which subjected him to a perpetual duty ofnon-disclosure
with respect to confidential information, anon-competition
restriction during employment until one year following his resignation without “good reason” or termination by Tyvak other than for “cause” and anon-solicitation
restriction during employment and for one year following his termination for any reason. Theat-will
employment confidential information, invention assignment and arbitration agreement was superseded by theat-will
employment, inventions assignment,non-compete,
non-disclosure
and arbitration agreement that is described below.Executive Employment Agreements
Marc Bell
Effective as of March 15, 2021, Mr. Bell entered into an employment agreement with Terran Orbital (the “”), which was amended and superseded in October 2021 as described below. Mr. Bell has served as our Chief Executive Officer and Chairman of the Board since March 15, 2022 and as Executive Chairman of the board of directors of PredSAR Corporation since October 2019. Prior to the Business Combination, Mr. Bell served as Legacy Terran Orbital’s Chief Executive Officer and President.
Bell Employment Agreement
The employment agreement provided for (i) a five-year employment term, which may be earlier terminated pursuant to the terms and conditions of the agreement, (ii) an annual base salary equal to $995,000, (iii) an annual target bonus opportunity equal to 100% of his annual base salary, (iii) eligibility to participate in any benefits plans generally made available to other executives of Terran Orbital and to receive vacation or sick time in accordance with Terran Orbital’s policy, (iv) business expense reimbursement, including for business class or better flights (if business class is unavailable) and for
non-leisure
class hotels for business travel and (v) a grant of restricted stock units under the 2014 Plan, the material terms of which are described below.Upon any termination of his employment, Mr. Bell (or his designated beneficiary or estate, as the case may be) would be entitled to receive any accrued but unpaid annual base salary and expenses required to be reimbursed, and any vacation accrued but unused to the date of termination. In addition, upon Mr. Bell’s termination of employment by Terran Orbital without “cause” (as defined below) or by him for “good reason” (as defined below), in each case, not including a termination on the expiration of the employment term, and subject to his execution of a separation agreement and a release and his continued compliance with respective covenants, Mr. Bell would be entitled to receive the following severance payments and benefits: (i) an amount equal to 24 months of his then current annual base salary (“”), paid in a lump sum within 70 days following his termination; (ii) an amount equal to his target annual bonus for the year in which the termination occurs, paid in a lump sum within 70 days following his termination; (iii) all the outstanding equity awards granted to him by Terran Orbital or any affiliates shall become immediately vested in full as of the date of his termination, provided that this acceleration provision shall not apply to any equity award that has not been outstanding for at least 12 months as of the date of his termination of employment; and (iv) subject to (x) his timely election of continuation coverage under COBRA, and (y) his continued copayment of premiums at the same level and cost to him as if he were an employee of Terran Orbital (excluding, for purposes of calculating cost, an employee’s ability to pay premiums with
Base Salary Severance
pre-tax
dollars), continued payment by Terran Orbital of his health, dental, and vision insurance coverage during the18-month
period following the date of termination to the same extent that Terran Orbital paid for such coverage immediately prior to the date of termination, in a manner intended to avoid any excise tax under Section 4980D of the Code, subject to the eligibility requirements and other terms and conditions of such insurance plans then in place.The employment agreement provided that in the event that any payments and other benefits provided for under the employment agreement or otherwise to Mr. Bell (i) constituted “parachute payments” within the meaning of Section 280G of the Code, and (ii) would be subject to the excise tax imposed by Section 4999 of the Code, then any such post-termination severance benefits would be either: (x) delivered in full, or (y) delivered as to such lesser extent which would result in no portion of such benefits being subject to excise tax under Section 4999 of the Code, whichever of the foregoing amounts, taking into account the applicable federal, state and local income taxes and the excise tax imposed by Section 4999 of the Code, results in the receipt by him on an
after-tax
basis, of the greatest amount of benefits, notwithstanding that all or some portion of such benefits may be taxable under Section 4999 of the Code.116
Pursuant to the employment agreement, Mr. Bell agreed to comply with terms of any confidentiality, nondisclosure or similar agreements between him and Terran Orbital and any affiliates.
Under the Bell Employment Agreement, Terran Orbital could terminate executive’s employment for cause at any time after providing written notice to him, if after providing him with notice of the breach, he failed to cure the breach, if curable, within seven days after receipt of the notice of breach. For purposes of the Bell Employment Agreement, the term “cause” meant: (i) conviction or plea of nolo contendere of any felony; (ii) deliberate and repeated refusal to perform the customary and legal employment duties reasonably related to his position (other than as a result of vacation, sickness, illness or injury); (iii) in the good faith judgment of Terran Orbital, fraud or embezzlement of Terran Orbital’s property or assets; (iv) willful misconduct or gross negligence with respect to Terran Orbital that may, in the good faith judgment of Terran Orbital, result in a breach of trust or have a material adverse effect on Terran Orbital; or (v) a breach or violation of any provision of the employment agreement.
The Bell Employment Agreement provided that Mr. Bell could terminate his employment under the employment agreement for “good reason”, which meant a termination of employment by him within 90 days of the initial existence of one of the conditions described below which occurred without his consent: a material diminution in his annual base salary; (ii) material diminution in his authority, duties, or responsibilities as compared to those on the date of the employment agreement; (iii) a change of more than 75 miles in the geographic location at which he must perform the services under the employment agreement; or (iv) any other action or inaction that constitutes a material breach of employment agreement by Terran Orbital. In order to terminate for good reason, Mr. Bell would have needed to provide notice to Terran Orbital of the existence of the applicable condition described above within 30 days of the initial existence of the condition, and Terran Orbital would then be provided a period of 60 days from receipt of such notice during which it could remedy the condition.
Effective as of October 23, 2021, the Bell Employment Agreement was amended and restated (the “”). The A&R Bell Employment Agreement provides for the same terms and conditions as the Bell Employment Agreement, except as described below.
A&R Bell Employment Agreement
The A&R Bell Employment Agreement (i) removes the concept of a five-year employment term, (ii) provides that Mr. Bell’s annual target bonus opportunity is equal to 200% of his annual base salary and (iii) with respect to Base Salary Severance, provides that such amount shall equal to 36 months of his then current annual base salary, and (iv) modifies the “good reason” definition to also include that executive shall be entitled to terminate his employment for any reason within 90 days following the occurrence of a “change in control” (as defined in the 2014 Plan).
Effective March 15, 2021, Mr. Bell was subject to an”).
at-will
employment, inventions assignment,non-
compete,non-disclosure,
and arbitration agreement, with Terran Orbital which subjects him to anon-
competition restriction during employment and for 12 months following his termination of employment for any reason, anon-solicitation
restriction during employment and for 12 months following his termination of employment for any reason, a perpetual duty ofnon-disclosure
with respect to confidential information, and an assignment of inventions provision (the “Bell Restrictive Covenant Agreement
Mr. Bell continues to be employed by Terran Orbital under the terms of the A&R Bell Employment Agreement and subject to the terms of the Bell Restrictive Covenant Agreement.
Anthony Previte
Effective as of March 15, 2021, Mr. Previte entered into an employment agreement with Terran Orbital. Mr. Previte has served as Chief Strategy Officer and Executive Vice President of Terran Orbital and a member of our Board of Directors since March 25, 2022. Prior to the Business Combination, Mr. Previte served as Chief Strategy Officer and Executive Vice President of Legacy Terran Orbital, the Executive Chairman of Tyvak, and the President and Chief Executive Officer of Terran Orbital’s U.S. subsidiary to be formed upon receipt of funding and which will oversee the Space Florida Facility and he reports to the Chairman and Chief Executive Officer of Terran Orbital. Mr. Previte’s employment agreement provides for the same terms and conditions as the Bell Employment Agreement, except as described below.
117
Under Mr. Previte’s employment agreement, subject to his continued employment and approval by Terran Orbital’s Chairman and Chief Executive Officer, he will earn a bonus equal to $2 million (“Leviathan Bonus”) upon the date Terran Orbital legally occupies one or more buildings built for the Space Florida Facility and Brevard County, Florida. The Leviathan Bonus has not yet been approved or paid. Moreover, under Mr. Previte’s employment agreement, he was paid a
one-time
signing and relocation bonus equal to $200,000 in April 2021.Effective March 15, 2021, Mr. Previte entered into an
at-will
employment, inventions assignment,non-
compete,non-disclosure,
and arbitration agreement, with Terran Orbital. Theat-will
employment, inventions assignment,non-compete,
non-disclosure,
and arbitration agreement provides for the same terms and conditions as the Bell Restrictive Covenant Agreement.Mr. Previte continues to be employed by Terran Orbital under the terms of his employment agreement with Legacy Terran Orbital and continues to be subject to the terms of the
at-will
employment, inventions assignment,non-
compete,non-disclosure,
and arbitration agreement with Terran Orbital.Marco Villa
Effective as of March 22, 2021, Mr. Villa entered into an employment agreement with Terran Orbital. Mr. Villa has served as Chief Revenue Officer and Executive Vice President of Terran Orbital since March 25, 2022 and Chairman of Tyvak International SrL since May 2021. Prior to the Business Combination, Mr. Villa served as the Chief Revenue Officer, Executive Vice President and Head of International Business of Legacy Terran Orbital and he reports to the Chairman and Chief Executive Officer of Terran Orbital. Mr. Villa’s employment agreement provides for the same terms and conditions as the Bell Employment Agreement, except as described below.
Mr. Villa’s employment agreement provides for an annual base salary of $450,000 and under his employment agreement, he was paid a
one-time
signing and relocation bonus equal to $140,000 in May 2021.Effective March 22, 2021, Mr. Villa entered into an
at-will
employment, inventions assignment,non-
compete,non-disclosure,
and arbitration agreement, with Legacy Terran Orbital. Theat-will
employment, inventions assignment,non-compete,
non-disclosure,
and arbitration agreement provides for the same terms and conditions as the Bell Restrictive Covenant Agreement.Mr. Villa continues to be employed by Terran Orbital under the terms of his employment agreement with Legacy Terran Orbital and continues to be subject to the terms of the
at-will
employment, inventions assignment,non-
compete,non-disclosure,
and arbitration agreement with Terran Orbital.2014 Plan, Grant Notice and Restricted Stock Unit Award Agreement
Effective as of March 15, 2021, Mr. Bell was granted 70,000 restricted stock units, effective February 24, 2021 and March 15, 2021 Mr. Previte was granted 84,633 and 70,000 restricted stock units, respectively, and effective February 24, 2021 and March 22, 2021 Mr. Villa was granted 22,316 and 15,000 restricted stock units, respectively, in each case, under the terms and conditions of the 2014 Plan, a grant notice and a restricted stock unit award agreement, the material terms of which are described herein. In connection with and effective as of the Business Combination, the 2014 Plan was terminated and the 2021 Omnibus Incentive Plan, which was adopted by the board of directors of Tailwind Two and approved by the shareholders of Tailwind Two, became effective. As of the consummation of the Business Combination, each outstanding restricted stock unit, option, and restricted stock award under the 2014 Plan was automatically canceled and converted into a corresponding award under the 2021 Omnibus Incentive Plan with respect to Terran Orbital common stock, calculated and determined in accordance with the terms of the Merger Agreement (each, a “”). Each Rollover Equity Award is generally subject to the same terms and conditions (including applicable vesting, expiration and forfeiture provisions) that applied to the corresponding equity award immediately prior to the consummation of the Business Combination under the 2014 Plan. For additional information about the 2021 Omnibus Incentive Plan, please see “—2021 Omnibus Incentive Plan” below.
Rollover Equity Award
118
2014 Plan
. The board of directors of Terran Orbital adopted the 2014 Plan on June 26, 2017, under which awards of incentive stock options, no statutory stock options, stock appreciation rights, restricted stock and restricted stock units could be granted to eligible employees, directors or consultants pursuant to the terms and conditions of the 2014 Plan. The purposes of the Plan was to attract and retain the best available personnel for positions of substantial responsibility, to provide additional incentives to employees, directors and conditions and to promote the success of Terran Orbital’s business. Subject to adjustment, the maximum aggregate number of shares of Terran Orbital’s common stock that was initially reserved for awards under the 2014 Plan was 744,130 (all of which could have been issued upon exercise of incentive stock options). On January 30, 2022, the board of directors of Terran Orbital amended the 2014 Plan to increase the number of shares available for awards to 941,355. Except as otherwise provided by the 2014 Plan, the 2014 Plan was administered by the board of directors of Terran Orbital or a committee appointed by the board of directors of Terran Orbital or the compensation committee of the board of directors of Terran Orbital.Grant Notice and Restricted Stock Unit Award Agreement. Under the grant notice, each of the restricted stock units granted to the named executive officers vests upon the achievement, prior to the seventh anniversary of the date of grant, of both a “service condition” and a “liquidity event condition.”
Each restricted stock unit will vest on the first date on which both of the service condition and liquidity event condition have been satisfied with respect to such restricted stock unit on or before the seventh anniversary of the date of grant, provided that, the executive’s employment or service has not terminated prior such date.
The vesting start date for 84,633 of the restricted stock units awarded to Mr. Previte and 22,316 of the restricted stock units awarded to Mr. Villa was February 24, 2021, the vesting start date for all of Mr. Bell’s restricted stock units was March 15, 2021, and the vesting start date for 70,000 of the restricted stock units awarded to Mr. Previte and 15,000 restricted stock units awarded to Mr. Villa was March 15, 2021.
The restricted stock units satisfy the service condition in the following percentages on each of the following dates: (i) 25% on the first anniversary of the vesting start date; (ii) 25% on the second anniversary of the vesting start date; (iii) 25% on the third anniversary of the vesting start date; and (iv) 25% on the fourth anniversary of the vesting start date; provided, that, 40,000 of the restricted stock units granted to Mr. Previte with a vesting start date of February 24, 2021 satisfy the service condition in the following percentages on each of the following dates: (i) 50% on the first anniversary of the vesting start date and (ii) 50% on the second anniversary of the vesting start date; provided, further, that, all of Mr. Bell’s restricted stock units, all of Mr. Previte’s restricted stock units, and all of Mr. Villa’s restricted stock units will also satisfy the service vesting condition in full upon the occurrence of a change in control (as defined in the 2014 Plan). The restricted stock units satisfy the liquidity event condition upon the first to occur of (i) the declaration that an initial public offering (meaning (a) the closing of the initial underwritten public offering of securities of the class of equity securities then subject to the restricted stock units pursuant to an effective registration statement filed under the Securities Act or (b) the closing of an acquisition of Terran Orbital by a special purpose acquisition company whose shares are publicly traded on a national stock exchange) is effective, and (ii) the time immediately prior to the consummation of a change in control. The liquidity event condition will be satisfied on the consummation of the Business Combination, but the restricted stock units will remain subject to the service condition as described above.
For purposes of the Plan and the A&R Bell Employment Agreement, a “change in control” generally means (i) any one person or persons acting as a group acquires ownership of the stock of Terran Orbital that, together with the stock held by such person or persons, constitutes more than 50% of the total voting power of the stock of Terran Orbital (other than as a result of a private financing approved by Terran Orbital’s board of directors), (ii) a majority of the members of Terran Orbital’s board of directors is replaced during any 12 month period by directors whose appointment or election is not endorsed by a majority of Terran Orbital’s board of directors prior to the appointment or election or (iii) any person or persons acquires, during a 12 month period, assets of Terran Orbital that have a gross fair market value equal to or more than 50% of the total gross fair market value of all the assets of Terran Orbital immediately prior to such acquisition(s).
Under the grant notice and the restricted stock unit award agreement, the restricted stock units will be settled in one share of Terran Orbital’s common stock per vested restricted stock unit within 30 days of the restricted stock unit vesting; provided, that, if the liquidity event condition is satisfied by an effective initial public offering, then the date of settlement of any vested restricted stock prior to the lapsing of any
lock-up
period described restricted stock unit award agreement shall be the first to occur of (x) the date on which suchlock-up
period lapses and (y) a date determined by the board of directors of Terran Orbital, which, in each case, shall be no later than the 15th day of the third month following the end of the applicable year in which the restricted stock unit vests; and provided, further,119
that if the tax withholding obligations of Terran Orbital or its parent, if any, will not be satisfied by the share withholding method and the settlement date would occur on a date on which a sale by the executive of the shares to be issued in settlement of the restricted stock units that vested would violate Terran Orbital’s trading compliance policy, then settlement of the restricted stock units will deferred until the next day on which the sale of such shares would not violate the trading compliance policy, but in any event, shall be on or before the 15th day of the third calendar month following calendar year of the date the restricted stock units would otherwise settle.
Under the restricted stock unit award agreement, (i) if the executive’s employment or service is terminated for cause (as defined in the applicable executive’s employment agreement) at any time prior to the vesting date, then all restricted stock units will be forfeited on the date of such termination and (ii) if the executive’s employment or service terminates for any reason other than for cause, then the executive will forfeit any unvested restricted stock units on the date of such termination; provided, that, pursuant to the named executive officers’ employment agreements, if the executive’s employment is terminated by Terran Orbital without “cause” or by him for “good reason”, in each case, not including a termination on the expiration of the employment term, if applicable, and subject to his execution of a separation agreement and a release and his continued compliance with respective covenants, the outstanding restricted stock units granted to the executive by Terran Orbital shall become immediately vested in full as of the date of his termination, provided that this acceleration provision shall not apply to any equity award that has not been outstanding for at least 12 months as of the date of his termination of employment.
The restricted stock unit agreement provides for restrictions on transferability of the restricted stock units and subjects the executive to a
“lock-up
agreement” and to certain other restrictions on transfer with respect to the shares acquired under the restricted stock units. In general, no such termination or amendment of the restricted stock unit award agreement may have a materially adverse effect on the executive’s rights under the agreement without the written consent of the executive.401(k) Plan
Tyvak maintains a qualified 401(k) savings plan, which allows participants to defer a percentage cash compensation up to the maximum amount allowed under Internal Revenue Service guidelines. During 2021, each of the named executive officers, participated in the 401(k) plan. During 2021, Terran Orbital did not provide any matching or company contributions to the plan and participants were always fully vested in their contributions to the plan. Terran Orbital does not maintain, sponsor or otherwise have any liability with respect to any defined benefit pension plan or nonqualified deferred compensation plan.
Director Compensation
The following table shows information regarding the compensation of each director, who is not a named executive officer, for services during 2021. This table excludes both Mr. Bell and Mr. Previte, who are each a named executive officer and do not receive any compensation from us for their services as directors.
Name | Fees Earned or Paid in Cash ($) | Stock Awards ($)(1)(2) | Total ($) | |||||||||
Daniel Staton | — | 2,865,590 | 2,865,590 | |||||||||
James LaChance | — | 1,069,578 | 1,069,578 | |||||||||
Stratton Sclavos | — | 818,740 | 818,740 | |||||||||
Joseph Berenato | — | 818,740 | 818,740 | |||||||||
Mark Calassa | — | 818,740 | 818,740 | |||||||||
| (1) | The amounts represented in the “Stock Awards” column reflect the aggregate grant date fair value of restricted stock units awarded during 2021 computed in accordance with the provisions of Financial Accounting Standards Board Accounting Standards Codification Topic 718, using methodologies and assumptions as described in the Fair Value Measurements section located in the Critical Accounting Policies and Estimates section under the heading “Management’s Discussion and Analysis of Financial Condition and Results of Operations.” |
120
| (2) | Effective as of March 31, 2021, each of Daniel Staton, James LaChance, Stratton Sclavos, and Joseph Berenato was granted 35,000, 10,000, 10,000 and 10,000 restricted stock units, respectively, and effective August 2, 2021, Mr. LaChance was granted 2,500 restricted stock units, in each case, under the terms and conditions of the 2014 Plan, a grant notice and a restricted stock unit award agreement, the material terms of which are described in “Additional Narrative Disclosure — 2014 Plan, Grant Notice and Restricted Stock Unit Award Agreement” above; provided, however that the restricted stock units effective as of March 31, 2021 satisfy the service condition in the following percentages on each of the following dates: (i) 50% on February 24, 2022 and (ii) 50% on February 24, 2023, and Mr. LaChance’s August 2, 2021 grant of 2,500 restricted stock units satisfies the service condition in the following percentages on each of the following dates (y) 50% on July 1, 2022 and (z) 50% on July 1, 2023. In addition, in connection with Mark Calassa’s service on the board of directors on behalf of Lockheed Martin Corporation, effective as of March 31, 2021, AstroLink International LLC was awarded 10,000 restricted stock units pursuant to the terms and conditions of a grant notice and a restricted stock unit award agreement, the material terms of which are substantially similar to the terms described herein. |
Prior to the Business Combination, Terran Orbital had no formal arrangements under which board members receive compensation for their services on the board of Terran Orbital. In February 2022, Mr. Sclavos was granted 2,500 restricted stock units, under the terms and conditions of the 2014 Plan, a grant notice and a restricted stock unit award agreement.
Following the Business Combination, on March 29, 2022, the Board of Directors of Terran Orbital approved the future payment of the following compensation to the
non-employee
directors of Terran Orbital for their service on the Board of Directors of Terran Orbital: (i) an annual cash retainer of $90,000; (ii) an initial equity retainer of 25,000 restricted stock units with three year vesting from the date of grant; (iii) an annual equity retainer of 17,500 restricted stock units with one year vesting from the date of grant; (iv) an annual cash retainer of $20,000 for the chair of the audit committee, $15,000 for the chair of the compensation committee and $10,000 for the chair of the nominating and corporate governance committee; (v) an annual cash retainer of $10,000 for other members of the audit committee, $7,500 for other members of the compensation committee and $5,000 for other members of the nominating and corporate governance committee; and (vi) an additional annual cash retainer of $25,000 for Mr. Sclavos for serving as the lead independent director. The restricted unit awards described above are expected to be granted under the 2021 Omnibus Incentive Plan on or after the filing and automatic effectiveness of a Registration Statement on FormS-8
that will register shares of common stock reserved for issuance under the 2021 Omnibus Incentive Plan (provided that suchnon-employee
director continues to serve as a director on the grant date).2021 Omnibus Incentive Plan
The 2021 Omnibus Incentive Plan, which was adopted by the board of directors of Tailwind Two and approved by the shareholders of Tailwind Two became effective on March 25, 2022 upon consummation of the Business Combination. The purpose of the 2021 Omnibus Incentive Plan is to assist the Company in attracting, retaining, motivating, and rewarding certain employees, officers, directors, and consultants of the Company and its affiliates and promoting the creation of long-term value for stockholders of the Company by closely aligning the interests of such individuals with those of such stockholders. The 2021 Omnibus Incentive Plan authorizes the award of stock-based and cash-based incentives to “Eligible Persons” to encourage such Eligible Persons to expend maximum effort in the creation of stockholder value. A copy of the 2021 Omnibus Incentive Plan is filed as an exhibit to the registration statement of which this prospectus is a part and this summary is qualified in its entirety by the full text of the 2021 Omnibus Incentive Plan.
Administration
The 2021 Omnibus Incentive Plan is administered by the compensation committee of the Board of Directors of Terran Orbital. The compensation committee has the authority to construe and interpret the 2021 Omnibus Incentive Plan, grant awards and make all other determinations necessary or advisable for the administration of the 2021 Omnibus Incentive Plan.
121
Nonemployee Director Award Limits
The aggregate maximum value of all awards granted under the 2021 Omnibus Incentive Plan (determined as of the date of grant) to any
non-employee
director of Terran Orbital during any one calendar year, taken together with any cash fees paid to suchnon-employee
director for service as anon-employee
director during such calendar year, will not exceed $750,000. The compensation committee may determine to make an exception to this limit, provided, that the director for whom the exception is sought does not participate in such determination.Eligibility
Employees, officers, directors, and consultants of Terran Orbital and its affiliates, will be eligible to receive awards under the 2021 Omnibus Incentive Plan. The compensation committee will determine who will receive awards, and the terms and conditions associated with such award.
Share Reserve and Counting
Terran Orbital has initially reserved 13,729,546 shares of its common stock for issuance under the 2021 Omnibus Incentive Plan, subject to an annual increase on the first day of each calendar year beginning on January 1, 2022 and ending on and including January 1, 2031 equal to the lesser of (x) 3% of the aggregate number of shares of common stock outstanding on the final day of the immediately preceding calendar year and (y) such smaller number of shares as determined by our Board of Directors. In addition, 5,440,438 shares of common stock are reserved under the 2021 Omnibus Incentive Plan for issuance pursuant to “employee retention shares awards” (as defined in the 2021 Omnibus Incentive Plan) pursuant to the terms of the Business Combination Agreement. In addition, the following shares will again be available for grant or issuance under the 2021 Omnibus Incentive Plan:
| • | shares subject to awards granted under the 2021 Omnibus Incentive Plan that are required to be paid in cash pursuant to their terms; |
| • | shares subject to awards granted under the 2021 Omnibus Incentive Plan that terminate, expire, or are cash-settled, canceled, forfeited, exchanged, or surrendered without having been exercised, vested or settled; |
| • | shares tendered by participants or withheld by the Company as full or partial payment to the Company upon exercise of options; |
| • | shares reserved for issuance upon the grant of stock appreciation rights, to the extent the number of reserved shares exceeds the number of shares actually issued upon the exercise of the stock appreciation rights; and |
| • | shares of our common stock withheld by or otherwise remitted to the Company to satisfy withholding obligations upon the exercise, lapse of restrictions or settlement of awards. |
Shares that are granted within five years following the consummation of the Business Combination in connection with the reallocation of any forfeited “employee retention awards” (as defined in the 2021 Omnibus Incentive Plan), shall not reduce the number of shares available for grant under the 2021 Omnibus Incentive Plan.
Awards
The 2021 Omnibus Incentive Plan authorizes the award of stock options, restricted stock, restricted stock units (“”), stock appreciation rights (“”), and other stock-based awards. For stock options that are intended to qualify as incentive stock options (“”) under Section 422 of the Code, the maximum number of shares subject to ISO awards is 13,000,000 shares of common stock. Certain awards under the 2021 Omnibus Incentive Plan may constitute or provide for a deferral of compensation, subject to Section 409A of the Code (“Section 409A”), which may impose additional requirements on the terms and conditions of such awards. All awards under the 2021 Omnibus Incentive Plan will be set forth in award agreements, which will detail the terms and conditions of the awards, including any applicable vesting and payment terms and post-termination exercise limitations. A brief description of each award type follows.
RSUs
SARs
ISOs
122
Stock Options
. Stock options provide for the purchase of shares of our common stock at an exercise price set on the grant date. The 2021 Omnibus Incentive Plan provides for the grant of ISOs only to employees of Terran Orbital and its affiliates. Nonqualified options may be granted to employees, officers, directors and consultants of Terran Orbital and its affiliates. The exercise price of each option to purchase Terran Orbital Common Stock must be at least equal to the fair market value of common stock on the date of grant. The exercise price of ISOs granted to 10% or more shareholders must be at least equal to 110% of that value. Options granted under the 2021 Omnibus Incentive Plan may be exercisable at such times and subject to such terms and conditions as the compensation committee determines. The maximum term of options granted under the 2021 Omnibus Incentive Plan is 10 years (five years in the case of ISOs granted to 10% or more shareholders). No dividend or dividend equivalent rights shall be paid out on options.Restricted Stock.
The compensation committee may grant awards consisting of shares of our common stock, for which restrictions will lapse upon the terms that the compensation committee determines at the time of grant. The compensation committee will determine the requirements for the lapse of the restrictions for the restricted stock awards, which may be based on the service of the participant for a specified time period or the attainment of one or more performance goals. Participants holding restricted stock awards will have the rights of a stockholder and to receive all dividends and other distributions with respect thereto, unless the compensation committee determines otherwise to the extent permitted under applicable law. If a participant has the right to receive dividends paid with respect to a restricted stock award, such dividends shall not be paid to the participant until the underlying award vests. Unless otherwise provided in an award agreement or otherwise, vesting will cease on the date the participant no longer provides services to Terran Orbital and unvested shares will be repurchased by Terran Orbital as soon as practicable following such termination. Any shares granted under a restricted stock award are nontransferable, except in limited circumstances.Restricted Stock Units
. An RSU is a notional unit representing the right to receive one share of our common stock (or the cash value of one share of common stock) on a specified settlement date. The compensation committee may grant awards consisting of RSUs subject to restrictions on sale and transfer. The compensation committee may condition the grant or vesting of RSUs on the achievement of performance conditions and/or the satisfaction of a time-based vesting schedule. Unless otherwise determined by the compensation committee at the time of award, vesting will cease on the date the participant no longer provides services to Terran Orbital and unvested RSUs will be forfeited. Further, unless otherwise set forth in a Participant’s award agreement, a Participant shall be not entitled to dividends or dividend equivalents with respect to RSUs prior to settlement.Stock Appreciation Rights
. SARs provide for a payment, or payments, in cash, Terran Orbital Common Stock or property, as specified in the applicable award, to the holder based upon the difference between the fair market value of Terran Orbital Common Stock on the date of exercise and the stated exercise price of the stock appreciation right. The exercise price must be at least equal to the fair market value of Terran Orbital’s Common Stock on the date the stock appreciation right is granted. Stock appreciation rights may vest based on time or achievement of performance conditions, as determined by the compensation committee in its discretion. No dividends or dividend equivalents shall be paid on SARs.Other Stock-Based Awards
. The compensation committee is authorized, subject to limitations under applicable law, to grant participants other awards under the 2021 Omnibus Incentive Plan that may be denominated or payable in, valued in whole or in part by reference to, or otherwise based upon or related to our common stock. The compensation committee may also grant common stock as a bonus and grant awards in lieu of obligations of the Company or its affiliates to pay cash or deliver property under the 2021 Omnibus Incentive Plan or other plans or compensatory arrangements.Adjustment
In the event of changes in our outstanding common stock or in the capital structure of the Company by reason of stock dividends, extraordinary cash dividends, stock splits, reverse stock splits, recapitalizations, reorganizations, mergers, amalgamations, consolidations, combinations, exchanges, or other relevant changes in capitalization, in connection with any extraordinary dividend declared and paid in respect of shares of our common stock, in the event of any change in applicable laws or circumstances or as otherwise set forth in the 2021 Omnibus Incentive Plan, in each case, that results in or could result in, in either case, as determined by the compensation committee in its sole discretion, any substantial dilution or enlargement of the rights intended to be granted to, or available for, participants in the 2021 Omnibus Incentive Plan, awards shall be equitably and proportionally adjusted or substituted, as determined by the compensation committee, in its sole discretion, as to the number, price, or kind of a share of common stock, other securities or other consideration subject to such awards.
123
Generally, except as otherwise provided by the compensation committee in an award agreement or otherwise, in connection with certain corporate events, including but not limited to a “change in control” (as defined in the 2021 Omnibus Incentive Plan), the compensation committee may provide for any one or more of the following (i) the assumption or substitution of any or all awards in connection therewith, with awards that vest based on performance criteria being deemed earned at the target level (or if no target is specified, the maximum level) and converted into solely service-based vesting awards, (ii) the acceleration of vesting of any or all awards not assumed or substituted in connection with the corporate event (with vesting of performance-based awards deemed earned at the target level (or if no target is specified, the maximum level), unless otherwise specified in the applicable award agreement), (iii) the cancellation of any or all awards not assumed or substituted in connection with such corporate event (whether vested or unvested) together with the payment to participants holding vested awards so canceled of an amount in respect of cancellation based on the
per-share
consideration being paid for the Terran Orbital common stock in connection with such corporate event, (iv) the cancellation or any or all options, SARs, and other awards subject to exercise not assumed or substituted in connection with any such corporate event (whether vested or unvested) after providing the holder thereof with a period of at least 10 days to exercise such awards, and (v) the replacement of any and all awards (subject to certain limitations) with a cash incentive program that preserves the value of the awards so replaced.Plan Amendment and Termination
The Board of Directors or compensation committee may amend the 2021 Omnibus Incentive Plan and awards at any time and from time to time. The Board of Directors or the compensation committee may suspend or terminate the 2021 Omnibus Incentive Plan at any time. Unless sooner terminated, the 2021 Omnibus Incentive Plan shall terminate on the day before the tenth anniversary of the date the stockholders approve the 2021 Omnibus Incentive Plan. No awards may be granted under the 2021 Omnibus Incentive Plan while it is suspended.
124
PRINCIPAL SECURITYHOLDERS
The following table sets forth information known to us regarding the beneficial ownership of our common stock immediately following consummation of the Business Combination by:
| • | each person who is the beneficial owner of more than 5% of the outstanding shares of our common stock; |
| • | each of our named executive officers and directors; and |
| • | all of our executive officers and directors as a group. |
Beneficial ownership is determined according to the rules of the SEC, which generally provide that a person has beneficial ownership of a security if he, she or it possesses sole or shared voting or investment power over that security. Under those rules, beneficial ownership includes securities that the individual or entity has the right to acquire, such as through the exercise of warrants or stock options or the vesting of restricted stock units, within 60 days of May 31, 2022. Shares subject to warrants or options that are currently exercisable or exercisable within 60 days of the Closing Date or subject to restricted stock units that vest within 60 days of April 21, 2022 are considered outstanding and beneficially owned by the person holding such warrants, options or restricted stock units for the purpose of computing the percentage ownership of that person but are not treated as outstanding for the purpose of computing the percentage ownership of any other person. Except as noted by footnote, and subject to community property laws where applicable, based on the information provided to us, we believe that the persons and entities named in the table below have sole voting and investment power with respect to all shares shown as beneficially owned by them.
Beneficial Ownership Table
Name and Address of Beneficial Owners | Number of Shares | % of Ownership | ||||||
Five Percent Holders: | ||||||||
Beach Point Capital Parties (1) | 24,119,581 | 17.360 | % | |||||
Lockheed Martin Parties (2) | 14,725,883 | 10.588 | % | |||||
Tailwind Two Sponsor LLC (3) | 14,044,905 | 9.782 | % | |||||
Francisco Partners Parties (4) | 13,538,381 | 9.283 | % | |||||
Austin Williams | 7,443,113 | 5.411 | % | |||||
Roland Coelho | 7,443,113 | 5.411 | % | |||||
Directors and Executive Officers: | ||||||||
Marc H. Bell (5) | 12,017,339 | 8.706 | % | |||||
Anthony Previte (6) | 11,714,357 | 8.434 | % | |||||
Marco Villa (7) | 6,114,741 | 4.437 | % | |||||
Gary A. Hobart | 241,369 | * | ||||||
Mathieu Riffel | 6,082 | * | ||||||
Daniel C. Staton (8)(9) | 12,772,510 | 9.253 | % | |||||
James LaChance | 255,024 | * | ||||||
Tom Manion | 0 | * | ||||||
Richard Y. Newton, III | 14,564 | * | ||||||
Tobi Petrocelli | 0 | * | ||||||
Douglas L. Raaberg | 14,564 | * | ||||||
Stratton Sclavos | 413,776 | * | ||||||
Directors and executive officers as a group (12 persons) | 43,564,326 | 30.943 | % | |||||
125
| * | Less than 1% |
| (1) | Represents the common stock held by the following: Beach Point SCF XI LP, a Delaware limited partnership (“ SCF XI SCF IV SCF Multi Opportunities Select Securitized TX Fund GP Funds BPCM BPGP |
| (2) | Represents the common stock held by Lockheed Martin Corporation, a Maryland corporation (“ Lockheed Martin Astrolink |
| (3) | Represents the common stock held by Tailwind Two Sponsor LLC, a Delaware limited liability company (“ Tailwind Two Sponsor |
| (4) | Represents the common stock held by FP Credit Partners II, L.P., a Cayman Islands limited partnership (“ FP Credit II FP Phoenix II GP UGP FPM |
126
committee may be deemed to have or share beneficial ownership of the shares held by FP Credit II and FP Phoenix II, but each member of the investment committee disclaims beneficial ownership of such shares. The business address of each of FP Credit II, FP Phoenix II, the GP, the UGP, and FPM is c/o Francisco Partners Management, L.P., One Letterman Drive, Building C —Suite 410, San Francisco, CA 94129.
| (5) | Includes 70,991 common stock held by Terran Orbital Management Investors LLC, an investment vehicle over which Mr. Bell shares voting and dispositive power. |
| (6) | Includes 35,495 common stock held by Terran Orbital Management Investors LLC, an investment vehicle over which Mr. Previte shares voting and dispositive power. |
| (7) | Includes 70,991 common stock held by Terran Orbital Management Investors LLC, an investment vehicle over which Mr. Villa shares voting and dispositive power. |
| (8) | Includes 53,243 common stock held by Terran Orbital Management Investors LLC, an investment vehicle over which Mr. Staton shares voting and dispositive power. |
| (9) | Includes 8,133,126 common stock held by Staton Tyvak Family Limited Partnership and 3,000,000 common shares held by Staton Orbital Family Limited Partnership over which Mr. Staton has sole voting and dispositive power. |
127
SELLING SECURITYHOLDERS
The Selling Securityholders may offer and sell, from time to time, any or all of the shares of common stock or warrants being offered for resale by this prospectus, which consists of:
| • | up to 5,080,409 PIPE Shares; |
| • | up to 8,100,000 Founder Shares; |
| • | up to 94,952,441 shares of common stock issued or issuable to the Legacy Terran Orbital equity holders in connection with or as a result of the consummation of the Business Combination consisting of: |
| • | up to 83,481,806 shares of our common stock; |
| • | up to 82,616 shares of common stock issuable upon the exercise of certain options; and |
| • | up to 11,388,019 shares of common stock issuable upon the settlement of outstanding vested and unvested restricted stock unit awards upon certain conditions; |
| • | up to 8,420,569 shares of common stock issued to certain debt providers pursuant to a stock and warrant purchase agreement; |
| • | up to 7,800,000 shares of our common stock issuable upon the exercise of the private placement warrants; |
| • | up to 11,055,606 shares of our common stock issuable upon the exercise of the debt provider warrants; |
| • | up to 4,746,835 shares of our common stock issuable pursuant to the Subscription Agreement for the Insider PIPE Investor; |
| • | up to 7,800,000 private placement warrants; and |
| • | up to 11,055,606 debt provider warrants |
The term “” includes the securityholders listed in the tables below and their permitted donees, pledgees, transferees, distributes, successors and others who later come to hold any of the selling securityholders’ interest in the shares of common stock or warrants in accordance with the terms of the applicable agreements governing their respective registration rights, other than through public sale.
Selling Securityholders
The following tables provide, as of the date of this prospectus, information regarding the beneficial ownership of our common stock and warrants of each Selling Securityholder, the number of shares of common stock and number of warrants that may be sold by each Selling Securityholder under this prospectus and that each Selling Securityholder will beneficially own after this offering.
Because each Selling Securityholder may dispose of all, none or some portion of their securities, no estimate can be given as to the number of securities that will be beneficially owned by a Selling Securityholder upon termination of this offering. For purposes of the tables below, however, we have assumed that after termination of this offering none of the securities covered by this prospectus will be beneficially owned by the Selling Securityholders and further assumed that the Selling Securityholders will not acquire beneficial ownership of any additional securities during the offering. In addition, the Selling Securityholders may have sold, transferred or otherwise disposed of, or may sell, transfer or otherwise dispose of, at any time and from time to time, our securities in transactions exempt from the registration requirements of the Securities Act after the date on which the information in the tables is presented.
We may amend or supplement this prospectus from time to time in the future to update or change this Selling Securityholders list and the securities that may be resold.
128
Please see the section titled “Plan of Distribution” for further information regarding the Selling Securityholders’ method of distributing these shares.
Shares of Common Stock | ||||||||||||||||
Name | Number Owned Prior to Offering (1) | Number Registered for Sale Hereby | Number Owned After Offering | Percent Owned After Offering | ||||||||||||
Beach Point Capital Parties (2) | 24,119,581 | 24,119,581 | — | — | ||||||||||||
Daniel C. Staton (3) | 18,002,085 | 18,002,085 | — | — | ||||||||||||
Tailwind Two Sponsor LLC (4) | 15,747,000 | 15,747,000 | — | — | ||||||||||||
Anthony Previte (5) | 14,961,883 | 14,961,883 | — | — | ||||||||||||
Lockheed Martin Parties (6) | 14,863,808 | 14,863,808 | — | — | ||||||||||||
Marc H. Bell (7) | 13,789,761 | 13,789,761 | — | — | ||||||||||||
Francisco Partners Parties (8) | 13,538,381 | 13,538,381 | — | — | ||||||||||||
Austin Williams | 7,555,961 | 7,555,961 | — | — | ||||||||||||
Marco Villa (9) | 7,033,436 | 7,033,436 | — | — | ||||||||||||
Fuel Venture Capital Parties | 6,210,857 | 6,210,857 | — | — | ||||||||||||
Gary A. Hobart | 1,103,979 | 1,103,979 | — | — | ||||||||||||
AE Industrial Parties (10) | 1,000,000 | 1,000,000 | — | — | ||||||||||||
Broad Street Principal Investments, L.L.C. (11) | 808,761 | 808,761 | — | — | ||||||||||||
Stratton Sclavos | 620,664 | 620,664 | — | — | ||||||||||||
James LaChance | 427,433 | 427,433 | — | — | ||||||||||||
Mathieu Riffel | 161,012 | 161,012 | — | — | ||||||||||||
Tommy Stadlen (12) | 153,000 | 153,000 | — | — | ||||||||||||
Richard T. Newton, III | 29,129 | 29,129 | — | — | ||||||||||||
Douglas L. Raaberg | 29,129 | 29,129 | — | — | ||||||||||||
Warrants to Purchase Common Stock | ||||||||||||||||
Name | Number Owned Prior to Offering (1) | Number Registered for Sale Hereby | Number Owned After Offering | Percent Owned After Offering | ||||||||||||
Francisco Partners Parties (8) | 8,291,704 | 8,291,704 | — | — | ||||||||||||
Tailwind Two Sponsor LLC (4) | 7,722,000 | 7,722,000 | — | — | ||||||||||||
Beach Point Capital Parties (2) | 1,381,951 | 1,381,951 | — | — | ||||||||||||
Lockheed Martin Parties (6) | 1,381,951 | 1,381,951 | — | — | ||||||||||||
Tommy Stadlen | 78,000 | 78,000 | — | — | ||||||||||||
| (1) | The first table includes shares of our common stock (both shares beneficially owned as determined in accordance with Rule 13d-3 of the Exchange Act and shares which the holder has a contingent right to receive), and shares of common stock issuable upon exercise of the Warrants that may be offered by the Selling Securityholders, and the second table includes the Warrants that may be offered by the Selling Security Holders (collectively, the “ Resale Securities |
129
| (2) | For purposes of the first table, represents the common stock held by the following: Beach Point SCF XI LP, a Delaware limited partnership (“ SCF XI SCF IV SCF Multi Select Securitized TX |
For purposes of the second table, represents debt provider warrants held by the following: SCF XI owns 84,530 warrants; SCF IV owns 68,176 warrants; SCF Multi owns 138,195 warrants; Opportunities owns 706,407 warrants; Select owns 200,383 warrants; Securitized owns 92,130 warrants; and TX owns 92,130 warrants. Beach Point Advisors LLC, a Delaware limited liability company (“”), is the General Partner or Managing Member of each of the above listed entities (the “”) and Scott Klein and Carl Goldsmith are the members of the Fund GP and may be deemed to beneficially own the securities held by the Funds. Notwithstanding the foregoing, the Fund GP, Mr. Klein and Mr. Goldsmith each disclaims beneficial ownership of the securities held by the Funds except to the extent of its or his respective pecuniary interest therein. Beach Point Capital Management LP (“”), the investment manager of above listed entities, has investment discretion and voting power over the securities owned by the Funds. Beach Point GP LLC (“”), the General Partner of BPCM, and BPCM may be deemed to beneficially own the securities held by the Funds. Notwithstanding the foregoing, each of BPCM and BPGP disclaims beneficial ownership of all securities held by the Funds. The business address of each entity is c/o Beach Point Capital Management LP, 1620 26th Street, Suite 6000n, Santa Monica CA 90404.
Fund GP
Funds
BPCM
BPGP
| (3) | Includes (i) 53,243 common stock held by Terran Orbital Management Investors LLC, an investment vehicle over which Mr. Staton shares voting and dispositive power, (ii) 8,133,126 common stock held by Staton Tyvak Family Limited Partnership, (iii) 3,000,000 common shares held by Staton Orbital Family Limited Partnership over which Mr. Staton has sole voting and dispositive power, and (iv) up to 4,746,835 common shares that may be issued at the discretion of Terran Orbital in lieu of cash beginning with the quarterly period ending March 31, 2023 for aggregate quarterly payments of $22.5 million payable under the PIPE Investment Obligation (with the number of such common shares estimated to be issuable calculated based on the $4.74 closing stock price per share on May 25, 2022). |
| (4) | Represents the common stock held by Tailwind Two Sponsor LLC, a Delaware limited liability company (“ Tailwind Two Sponsor |
For purposes of the second table, Tailwind Two Sponsor holds 7,722,000 private placement warrants. The business address of the Tailwind Two Sponsor is 150 Greenwich Street, 29th Floor, New York, NY 10006. Mr. Philip Krim controls Tailwind Two Sponsor LLC and, as such, shares voting and investment discretion with respect to the securities held by Tailwind Two Sponsor LLC and may be deemed to have beneficial ownership of such securities. Mr. Philip Krim disclaims beneficial ownership of such securities except to the extent of his pecuniary interest therein.
(5 ) | Includes 35,495 common stock held by Terran Orbital Management Investors LLC, an investment vehicle over which Mr. Previte shares voting and dispositive power. |
| (6) | Represents the common stock held by Lockheed Martin Corporation, a Maryland corporation (“ Lockheed Martin Astrolink |
For purposes of the second table, represents debt provider warrants held by Lockheed Martin: 1,381,951 warrants. The business address of each is c/o Lockheed Martin, 6801 Rockledge Drive, Bethesda, MD 20817.
| (7) | Includes 70,991 common stock held by Terran Orbital Management Investors LLC, an investment vehicle over which Mr. Bell shares voting and dispositive power. |
| (8) | Represents the common stock held by FP Credit Partners II, L.P., a Cayman Islands limited partnership (“ FP Credit II FP Phoenix II |
130
For purposes of the second table, represents the following debt provider warrants: FP Credit II: 7,907,863 warrants; FP Phoenix II: 383,841 warrants. FP Credit Partners GP II, L.P. is the general partner (the “”) of both FP Credit II and FP Phoenix II. FP Credit Partners GP II Management, LLC is the general partner (the “UGP”) of the GP. Francisco Partners Management, L.P. (“FPM”) serves as the investment manager for each of FP Credit II and FP Phoenix II. As a result, each of FPM, the UGP, and the GP may be deemed to share voting and dispositive power over the shares held, but each disclaims beneficial ownership. Additionally, voting and disposition decisions at FPM with respect to the shares noted above are made by an investment committee. The members of the investment committee may be deemed to have or share beneficial ownership of the shares held by FP Credit II and FP Phoenix II, but each member of the investment committee disclaims beneficial ownership of such shares. The business address of each of FP Credit II, FP Phoenix II, the GP, the UGP, and FPM is c/o Francisco Partners Management, L.P., One Letterman Drive, Building C — Suite 410, San Francisco, CA 94129.
GP
| (9) | Includes 70,991 common stock held by Terran Orbital Management Investors LLC, an investment vehicle over which Mr. Villa shares voting and dispositive power. |
( 10) | Represents the common stock held by AE RED Aggregator, LP, a Delaware limited partnership (“AE RED”), BBAI”) |
Voting and dispositive power with respect to the shares of common stock held of record by AE RED and AE BBAI are exercised by Michael R. Greene and David H. Rowe, the managing members and control persons of AeroEquity GP, LLC, which is the general partner of AE Industrial Partners Fund II GP, LP (“AE. AE Industrial Partners Fund II-B, LP (“AEAE Industrial Partners Fund II, LP (“AEand AE Industrial Partners Fund II-A, LP (“AEand together with AE Fund II-B and AE Fund II LP, the “AEare the controlling equityholders of AE RED and AE BBAI. AE Fund II GP is the general partner of each of the AE Funds. AE BBRED GP, LLC is the general partner of AE RED and AE BBAI. The business address of AE RED, AE BBAI and the AE Funds is 2500 N. Military Trail Suite 470, Boca Raton, FL, 33431.
Fund II GP”)
Fund II-B”),
Fund II LP”)
Fund II-A”
Funds”)
| (11) | Represents the common stock held by Broad Street Principal Investments, L.L.C. (“BSPI”), a Delaware limited liability company. BSPI is managed by Goldman Sachs & Co. LLC (“GS”), which is wholly owned by The Goldman Sachs Group, Inc. (“GS Group”) |
| (12) | Includes the 78,000 shares of common stock issuable upon exercise of the warrants listed in the second table. |
131
CERTAIN RELATIONSHIPS AND RELATED PERSON TRANSACTIONS
In addition to the compensation arrangements with directors and executive officers described under “” and “”, the following is a description of each transaction since January 1, 2019 and each currently proposed transaction in which:
Management
Executive and Director Compensation
| • | we have been or are to be a participant; |
| • | the amount involved exceeds or will exceed $120,000; and |
| • | any of our directors, executive officers or beneficial holders of more than 5% of our capital stock, or any immediate family member of, or person sharing the household with, any of these individuals (other than tenants or employees), had or will have a direct or indirect material interest. |
Certain Relationships and Related Person Transactions - Legacy Terran Orbital
Terran Orbital Holder Support Agreements and Debt Rollover
Concurrently with the execution of the Business Combination Agreement, certain Terran Orbital Holders, including affiliates of Lockheed Martin and Beach Point, entered into the Terran Orbital Holder Support Agreements with Tailwind Two and Legacy Terran Orbital, pursuant to which the Terran Orbital Holders agreed to, among other things, (i) consent to and vote in favor of the Business Combination Agreement and the transactions contemplated thereby and (ii) be bound by certain other covenants and agreements related to the Business Combination. Pursuant to the Terran Orbital Holder Support Agreements and the fifth amendment to the Existing Note Purchase Agreement, affiliates of Lockheed Martin and Beach Point agreed to either (x) roll certain of their Existing Notes into a new loan agreement or note purchase agreement or (y) keep certain of their Existing Notes outstanding under the Existing Note Purchase Agreement, subject to certain amendments, in each case, pursuant to the Debt Rollover. On March 25, 2022, such support agreements were amended to, among other things, (i) set the amount of Rollover Debt of Lockheed Martin as $25 million and (ii) set the amount of Rollover Debt of Beach Point’s affiliate as $31.3 million.
Strategic Cooperation Agreement with Lockheed Martin
On March 8, 2021, Terran Orbital, PredaSAR, Tyvak and Lockheed Martin entered into the Amended and Restated Strategic Cooperation Agreement, which was subsequently amended and restated by the Second Amended and Restated Strategic Cooperation Agreement on October 28, 2021 (the “SCA”). Pursuant to the SCA, the parties agreed, among other things, to extend the term to October 28, 2030, which may be extended for an additional
12-months
if any of the Existing Notes remain outstanding on March 8, 2022. Under the terms of the SCA, the parties agreed to collaborate on the development, production and sale of small satellites for use in U.S. Government spacecraft and spacecraft procurements and to establish a cooperation framework to enable the parties to enter into projects, research and development agreements and other collaborative business arrangements and “teaming activities”. The initial scope, subject matter and responsibilities of each party to the SCA for a project will be set forth on a statement of work executed by the parties prior to commencing any work. Under the SCA, upon delivery of a request for proposal from Lockheed Martin, Terran Orbital is required to provide Lockheed Martin with a binding proposal for the manufacturing of such satellites. If Terran Orbital is awarded the work by Lockheed Martin, then Terran Orbital is required under the SCA to give priority to the Lockheed Martin order over manufacturing any satellites for Terran Orbital’s NextGen Earth Observation constellation or other internal purposes. In addition, Terran Orbital has granted Lockheed Martin with a right of first refusal to place its own order for services if Terran Orbital notifies Lockheed Martin that it has received an offer for services from a third-party that would exceed specified production capacity thresholds.In addition, in the event Terran Orbital needs to engage a third party to pursue an opportunity, including, the development and sale of small satellites for use in US Government or
non-US
Government customer spacecraft or spacecraft-related procurements, or to engage in bids or proposals for certain US Government contracts, Terran Orbital has agreed to offer Lockheed Martin an exclusive opportunity to negotiate a teaming arrangement for a specified period of time on commercially reasonable terms. If the parties cannot agree on terms within the period provided, Terran Orbital can pursue the opportunity with another party without restriction.132
Following an acquisition of Terran Orbital in a proposed sale of Terran Orbital which results in a change of control (which included the Business Combination) until the expiration of the term of the SCA, Lockheed Martin is entitled to appoint one director (reasonably satisfactory to Terran Orbital) to the initial board of directors of the combined company. Prior to the closing of the Business Combination, Lockheed Martin had advised Terran Orbital that it did not expect to exercise this right to appoint a director.
The SCA may be terminated by the” below, under certain conditions the termination of the SCA by Terran Orbital would trigger a mandatory obligation to prepay all of the outstanding Existing Notes pursuant to the terms of the Note Purchase Agreement.
non-breaching
party after the breaching party fails to cure a material breach under the SCA within 90 days after receiving notice of such material breach. As further discussed under “-Notes Refinancing Transaction
In addition, in connection with Mark Calassa’s service on the board of directors on behalf of Lockheed Martin, effective as of March 31, 2021, AstroLink was awarded 10,000 restricted stock units pursuant to the terms and conditions of a grant notice and a restricted stock unit award agreement, the material terms of which are substantially similar to the terms described herein.
Legacy Terran Orbital recognized revenue from Lockheed Martin of $20.6 million, $5.4 million and $7.7 million during 2021, 2020 and 2019, respectively. The Company also recognized revenue from Lockheed Martin of $10.3 million during the three months ended March 31, 2022.
PIPE Financing (Private Placement)
Reference is made to the disclosure under “— —.”
Certain Relationships and Related Person Transactions
— Tailwind Two
PIPE Financing (Private Placement)
Investor Rights Agreement
Reference is made to the disclosure under “— .”
Certain Relationships and Related Person Transactions
— Tailwind Two —Investor Rights Agreement
Notes Refinancing Transaction
On March 8, 2021, Legacy Terran Orbital issued the Existing Notes in an aggregate original principal amount of $86,859,108 and warrants to purchase shares of common stock, $0.0001 par value per share, of Legacy Terran Orbital (“”) to the purchasers under the Existing Note Purchase Agreement. The obligations under the Existing Notes were guaranteed by Tyvak Nano-Satellite Systems, Inc., and PredaSAR Corporation prior to the closing of the Business Combination (the “”). The Existing Notes and the guarantees of the Existing Notes by the Guarantors were secured by substantially all assets of Legacy Terran Orbital and the Guarantors, subject to certain customary exceptions. The maturity date of the Existing Notes was April 1, 2026. The Existing Notes bore interest at a rate of 11% per annum. The Existing Notes were voluntarily prepayable at any time and were subject to mandatory prepayment by Legacy Terran Orbital upon, among other things, (a) the occurrence of a qualified public offering of its stock or a business combination with a special purpose acquisition company and (b) for so long as Lockheed Martin or any of its affiliates held any portion of the Existing Notes, in the event of a termination (other than by Terran Orbital due to an uncured breach by Lockheed Martin) of the SCA or a material breach by Legacy Terran Orbital of the SCA, subject to a 90 days grace period after knowledge of such breach by Legacy Terran Orbital or written notice of such breach to Legacy Terran Orbital from Lockheed Martin.
Legacy Terran Orbital Common Stock
Guarantors
On March 25, 2022, the Existing Note Purchase Agreement was amended (as so amended and as previously amended, the (“”) to, among other things, (i) keep outstanding Existing Notes of Lockheed Martin in the amount of $25 million, (ii) keep the BP Notes outstanding in the amount of $31.3 million, (iii) revise the terms of the Amended Note Purchase Agreement to have substantially similar terms as the terms in the Francisco Partners Facility, other than with respect to call protection and that the BP Notes bear interest at 11.25% (9.25% of which is payable in cash and 2.0% of which is payable in kind), and (iv) cause the BP Notes to be subordinate in right of payment to the FP Notes.
Amended Note Purchase Agreement
133
Upon closing of the Business Combination, other than the Existing Notes subject to the Debt Rollover, all of the outstanding Existing Notes were prepaid in accordance with the terms of the Existing Note Purchase Agreement and the Business Combination Agreement. For additional information regarding the Debt Rollover, see “—Terran Orbital Holder Support Agreements and Debt Rollover.”
Of the $86,859,108 principal amount of Existing Notes, (a) $50,000,000 principal amount of Existing Notes and a warrant to purchase Terran Orbital’s Common Stock, for an exercise price of $0.01 per share of Terran Orbital’s Common Stock (the “”) was issued to Lockheed Martin for an aggregate cash purchase price of $50,000,000, which Inducement Warrant would be convertible into 0.2000% of the shares (on a fully-diluted basis) of Legacy Terran Orbital Common Stock, and (b) $36,859,108 principal amount of the Existing Notes were issued as part of an exchange transaction (the “”) with holders of the convertible promissory notes previously issued by Legacy Terran Orbital pursuant to a Convertible Note Purchase Agreement, dated as of July 23, 2018. As part of the Convertible Notes Exchange, holders of the then outstanding convertible promissory notes received a combination of the Existing Notes, Inducement Warrants and warrants to purchase Legacy Terran Orbital Common Stock in amounts and exercise prices that corresponded to the number of shares of Legacy Terran Orbital’s Common Stock into which the convertible notes would have originally been exchangeable on March 8, 2021 (the “”). Astrolink International, LLC, which is an affiliate of Lockheed Martin, was a holder of the Existing Notes that participated in the Convertible Notes Exchange.
Inducement Warrants
Convertible Notes Exchange
Detachable Warrants
Immediately prior to the closing of the Business Combination, all of the outstanding Inducement Warrants and Detachable Warrants had been exercised on a cash or cashless basis at the election of the holder into shares of Legacy Terran Orbital’s Common Stock in accordance with the related documentation governing such warrants and the Business Combination Agreement. As an inducement to the exercise of the options, holders of Inducement Warrants and Detachable Warrants also received Terran Orbital Common Stock as set forth in the Business Combination Agreement.
Shortly following the closing of the Business Combination, the Company became a guarantor of the Existing Notes and granted a security interest on all of its assets to secure such obligations, subject to certain exceptions.
GeoOptics, Inc.
Terran Orbital owns a”), a privately held company engaged in the acquisition and sale of Earth observation data and a purchaser of products and services from Terran Orbital. As of December 31, 2021, 2020 and 2019, Terran Orbital’s $1.7 million investment in GeoOptics represented an approximately 2.3% ownership interest and was fully impaired. Additionally, one of Terran Orbital’s executive officers serves as a member of the GeoOptics board of directors. Terran Orbital recognized revenue from GeoOptics of $1.6 million, $0.7 million and $0.9 million during 2021, 2020 and 2019, respectively. Terran Orbital also recognized revenue from GeoOptics of $501 thousand during the three months ended March 31, 2022.
non-controlling
equity interest in GeoOptics, Inc. (“GeoOptics
PredaSAR Merger
On February 16, 2021, Terran Orbital and PredaSAR entered into a Letter Agreement with an unaffiliated third party that was then the largest minority holder of PredaSAR’s stock providing its consent for PredaSAR to pursue a merger with Terran Orbital at agreed upon terms.
On February 25, 2021, the board of directors of PredaSAR unanimously approved the terms of a merger agreement pursuant to which Terran Orbital-PredaSAR Merger Sub Corporation, a newly formed subsidiary of Terran Orbital, would merge with and into PredaSAR, with PredaSAR surviving the merger (the “PredaSAR Merger”) as in the best interests of PredaSAR and its stockholders. On February 26, 2021, the PredaSAR Merger was consummated, having received the requisite consent under PredaSAR’s organizational documents and Delaware law of (x) the stockholders of PredaSAR holding at least a majority of the voting power of the outstanding shares of PredaSAR common stock on an
as-converted
basis and (y) the holders of PredaSAR’s preferred stock holding at least a majority of the voting power of the outstanding shares of such preferred stock.In the PredaSAR Merger, the PredaSAR common stock, all of which was held by Terran Orbital, was cancelled and each holder of PredaSAR preferred stock received 15.523 (the “PredaSAR Exchange Ratio”) shares of Terran Orbital Common Stock for each share of PredaSAR Preferred Stock, with cash payable for any fractional shares in accordance with the terms of the merger agreement. Each stock option granted under PredaSAR’s 2020 Equity Incentive Plan for PredaSAR common stock (each, a “PredaSAR Option”), whether vested or unvested, that was outstanding and unexercised as of the effective time of the merger was cancelled and ceased to be outstanding and
134
was not assumed. Immediately following the effective time of the PredaSAR Merger, with respect to each PredaSAR Option, Terran Orbital issued an award of restricted stock units relating to the number of shares of Terran Orbital Common Stock equal to the product of (i) the number of shares of PredaSAR common stock underlying such PredaSAR Option as of immediately prior to the effective time of the PredaSAR Merger and (ii) the PredaSAR Exchange Ratio.
As a result of the PredaSAR Merger, PredaSAR became a wholly-owned subsidiary of Terran Orbital, the former holders of PredaSAR preferred stock received Terran Orbital Common Stock representing approximately 8% of Terran Orbital on a fully-diluted basis as of date of the PredaSAR Merger and the former holders of PredaSAR Options received restricted stock units in Terran Orbital representing approximately 1% of Terran Orbital on a fully-diluted basis as of the date of the PredaSAR Merger.
Immediately prior to the PredaSAR Merger, Marc Bell, the Chief Executive Officer of Terran Orbital and individually and through his affiliated entities, a beneficial owner of 11.2% of Terran Orbital Common Stock on a fully-diluted basis as of February 25, 2021, was serving as the Chairman of the board of directors of PredaSAR and the Executive Chairman of PredaSAR. Through affiliated entities, Mr. Bell beneficially owned approximately 0.06% of the shares of PredaSAR’s Common Stock (on an
as-converted
basis treating all shares of PredaSAR’s Preferred Stock as if they were converted to PredaSAR Common Stock) as of February 25, 2021. In connection with the consideration paid in the PredaSAR Merger, Mr. Bell (through his affiliated entities) received 853 shares of Terran Orbital Common Stock (representing approximately 0.02% of Terran Orbital Common Stock on a fully-diluted basis on the closing date of the PredaSAR Merger).Transactions with Chairman and CEO
Satellite Solutions Group
An entity owned by Marc Bell owns Satellite Solutions Group, LLC (“”). Satellite Solutions Group provided Terran Orbital professional services in connection with the issuance of the Series Seed Preferred Stock for a fee of $700,000 and $300,000 during 2020 and 2019, respectively. The fees were recorded against the gross proceeds received from the issuance of the Series Seed Preferred Stock.
Satellite Solutions Group
Lease for Florida Executive Office
Effective as of April 1, 2021, Terran Orbital, as tenant, entered into a lease agreement for its headquarters/office space with 6800 Broken Sound LLC (which is an entity owned by Marc Bell), as landlord. Under this lease agreement, Terran Orbital leases approximately 11,426 square feet of space in a building located at 6800 Broken Sound Parkway NW, Boca Raton, Florida. The lease term commenced on April 1, 2021 and will expire on March 31, 2026. Terran Orbital has a
one-time
right to extend the lease term for a period of five (5) additional years. Annual base rent payable under the lease is $228,520 ($19,043.33 per month), which rental amount increases by 3% each lease year. The minimum lease payments under the lease is approximately $1.2 million. In addition to rent payments, Terran Orbital is also required under the lease to pay its pro rata share of taxes and operating expenses applicable to the building (subject to adjustment if the building is not fully occupied). The leased premises is permitted to be used for general office use only. Terran Orbital has a right of first offer (subject to anypre-existing
tenant rights) for additional space that becomes available for rental in the building.Certain Relationships and Related Person Transactions — Tailwind Two
Class B Ordinary Shares
On December 3, 2020, the Sponsor paid $25,000 to cover certain offering costs of Tailwind Two in consideration of 8,625,000 Class B ordinary shares. All shares and the associated amounts have been retroactively restated to reflect the share capitalization. The Sponsor has agreed to forfeit up to 1,125,000 Class B ordinary shares to the extent that the over-allotment option was not exercised in full by the underwriters in the initial public offering. The forfeiture would have been adjusted to the extent that the over-allotment option was not exercised in full by the underwriters in the initial public offering so that the Class B ordinary shares would represent 20.0% of Tailwind Two’s issued and outstanding ordinary shares after the initial public offering. On March 9, 2021, the underwriters in the initial public offering exercised their over-allotment option in full; thus, these Class B ordinary shares were no longer subject to forfeiture.
135
The initial shareholders agreed, subject to limited exceptions, not to transfer, assign or sell any of their Class B ordinary shares until the earlier to occur of: (A) one year after the completion of an initial business combination and (B) subsequent to the initial business combination, (x) if the closing price of Tailwind Two’s Class A ordinary shares equals or exceeds $12.00 per share (as adjusted for share splits, share capitalizations, reorganizations, recapitalizations and the like) for any 20 trading days within any
30-trading
day period commencing at least 150 days after the initial Business Combination, or (y) the date on which Tailwind Two completes a liquidation, merger, share exchange, reorganization or other similar transaction that results in all of the Public Shareholders having the right to exchange their ordinary shares for cash, securities or other property.Private Placement Warrants
Simultaneously with the closing of the initial public offering, the Sponsor purchased an aggregate of 7,800,000 private placement warrants at a price of $1.50 per private placement warrant in a private placement, generating gross proceeds of approximately $11.7 million. A portion of these proceeds were added to the proceeds from the IPO.
The private placement warrants are subject to the
lock-up
period described in the Investor Rights Agreement that was executed by the Tailwind Two Sponsor and Tommy Stadlen in connection with the execution of the Business Combination Agreement.Related Party Loans
On November 23, 2020, the Sponsor agreed to loan Tailwind Two an aggregate of up to $300,000 to cover expenses related to Tailwind Two’s IPO pursuant to a promissory note (the “”). This loan was
Note
non-interest
bearing and payable on the earlier of June 30, 2021 or the completion of the IPO. Sponsor paid an aggregate of approximately $89,890 to cover for expenses on Tailwind Two’s behalf under the Note. On March 12, 2021, Tailwind Two repaid the Note in full.Administrative Services Agreement
Effective March 9, 2021, Tailwind Two entered into an agreement to pay monthly expenses of $10,000 for office space, administrative services and support services to Sponsor. The agreement terminates upon the earlier of the completion of a business combination or the liquidation of Tailwind Two. Tailwind Two incurred approximately $100,000 in general and administrative expenses for the period from November 18, 2020 (inception) through December 31, 2021.
PIPE Financing (Private Placement)
Concurrently with the execution of the Business Combination Agreement, Tailwind Two entered into the Subscription Agreements with the PIPE Investors, including affiliates of Lockheed Martin, Beach Point and AE Industrial Partners, as well as an affiliate of Mr. Daniel Staton, a director and shareholder of Terran Orbital (the “”). Pursuant to the Subscription Agreements, the PIPE Investors agreed to subscribe for and purchase, and Tailwind Two agreed to issue and sell to such PIPE Investors, immediately prior to the Closing, an aggregate of 5,080,409 shares of Terran Orbital Common Stock for a purchase price of $10.00 per share, for aggregate gross proceeds of approximately $50.8 million (the “”). The closing of the PIPE Financing was contingent upon, among other things, the substantially concurrent consummation of the Business Combination. The Subscription Agreements provided that Tailwind Two will grant the investors in the PIPE Financing certain customary registration rights. Tailwind Two will, within 45 days after the consummation of the Business Combination, file with the SEC a registration statement registering the resale of such shares of Terran Orbital Common Stock and will use its commercially reasonable efforts to have such registration statement declared effective as soon as practicable after the filing thereof and will not be subject to any form of monetary penalty for its failure to do so.
Insider PIPE Investor
PIPE Financing
136
The Subscription Agreement for the Insider PIPE Investor contains a provision whereby in return for the Insider PIPE Investor’s $30.0 million investment in the PIPE Financing, in addition to the shares to be received by the Insider PIPE Investor in the PIPE Financing, the Insider PIPE Investor or its affiliate will also receive a quarterly fee of $1.875 million for sixteen (16) quarters beginning at the end of the first quarter following the consummation of the Business Combination; the first years’ payments are to be paid in cash and the remaining payments are to be paid, subject to subordination to and compliance with Terran Orbital’s debt facilities, in cash or stock at the discretion of Terran Orbital. The Insider PIPE Investor’s investment in the PIPE Financing, in addition to the investments made by the Other PIPE Investors in the PIPE Financing, was intended to provide immediate liquidity to Terran Orbital upon consummation of the Business Combination as alternative equity financings were not otherwise available. There is no service being provided in connection with the quarterly fees; once all quarterly fees have been paid, the shares to be received by the Insider PIPE Investor in the PIPE Financing will effectively have been issued for no consideration other than the value to Terran Orbital of the immediate liquidity at consummation of the Business Combination. In addition, in connection with entering into the Subscription Agreement with AE Industrial Partners, Legacy Terran Orbital entered into vendor agreements requiring $20 million of purchase commitments from two affiliates of AE Industrial Partners over three years from the Closing Date.
Investor Rights Agreement
Concurrently with the execution of the Business Combination Agreement, Tailwind Two, the Tailwind Two Sponsor, Tommy Stadlen, Legacy Terran Orbital, certain of Legacy Terran Orbital’s stockholders and other parties thereto, including Daniel Staton, Lockheed Martin, Beach Point and Francisco Partners, entered into an investor rights agreement (the “”) pursuant to which, such parties were granted certain customary registration rights with respect to their respective Registrable Securities (as defined in the Investor Rights Agreement), in each case, on the terms and subject to the conditions set forth therein. The Investor Rights Agreement provides that Terran Orbital will grant the investors party thereto certain customary registration rights. Terran Orbital will, within 45 days after the consummation of the Business Combination, file with the SEC a registration statement registering the resale of such shares of Terran Orbital Common Stock and will use its commercially reasonable efforts to have such registration statement declared effective as soon as practicable after the filing thereof and will not be subject to any form of monetary penalty for its failure to do so; provided however that other than Francisco Partners, and subject to certain exceptions, the investors shall be subject to a 180 day
Investor Rights Agreement
lock-up
after the consummation of the Business Combination. Immediately after the Closing of the Business Combination on March 25, 2022, approximately 82.7% of the Company’s 137,295,455 total shares of common stock then outstanding were subject to this 180 daylock-up.
Director and Officer Indemnification
Our charter contains provisions limiting the liability of executive officers and directors and our Bylaws provide that Terran Orbital will indemnify each of its executive officers and directors to the fullest extent permitted under Delaware law. Following the consummation of the Business Combination, we entered into indemnification agreements with each member of our Board of Directors and our executive officers. For more information regarding the terms of these indemnification agreements, see “.”
Description of our Securities—Limitations on Liability and Indemnification of Officers and Directors
Policies and Procedures for Related Party Transactions
Upon the consummation of the Business Combination, we adopted a written related party transaction policy. The policy provides that officers, directors, holders of more than 5% of any class of our voting securities, and any member of the immediate family of and any entity affiliated with any of the foregoing persons, will not be permitted to enter into a related-party transaction with us without the prior consent of our audit committee, or other independent members of our Board of Directors in the event it is inappropriate for the audit committee to review such transaction
137
due to a conflict of interest. Any request for us to enter into a transaction with an executive officer, director, principal stockholder, or any of their immediate family members or affiliates, in which the amount involved exceeds $120,000, must first be presented to our audit committee for review, consideration, and approval. In approving or rejecting the proposed transactions, our audit committee will take into account all of the relevant facts and circumstances available.
All of the transactions described in this section were entered into prior to the adoption of this policy.
138
DESCRIPTION OF SECURITIES
The following summary of the material terms of our securities is not intended to be a complete summary of the rights and preferences of such securities, and is qualified by reference to our certificate of incorporation, as amended (the “Certificate of Incorporation”), our bylaws (the “Bylaws” and, together with the Certificate of Incorporation, the “Governing Documents
”
), the Stock and Warrant Purchase Agreement, the Private Placement Warrants Purchase Agreement and the Warrant Agreement, which are exhibits to the registration statement of which this prospectus is a part. We urge to you read each of the Certificate of Incorporation, the Bylaws, the Stock and Warrant Purchase Agreement and, the Private Placement Warrants Purchase Agreement the Warrant Agreement in their entirety for a complete description of the rights and preferences of our securitiesAuthorized Capitalization
General
The total amount of our authorized share capital consists of 300,000,000 shares of our common stock and 50,000,000 shares of Terran Orbital Preferred Stock. As of May 25, 2022, 137,556,122 shares of our common stock were outstanding.
Common Stock
Voting rights
Dividend rights
Rights upon liquidation
Other rights
139
Preferred Stock
The Terran Orbital Board or any authorized committee thereof has the authority to issue shares of preferred stock at any time and from time to time on terms it may determine, in one or more series and to fix the designations, powers (including voting powers, full or limited, or no voting powers), preferences and relative, participating, optional or other special rights, if any, of the shares of each such series and any qualifications, limitations or restrictions of preferred stock, including dividend rights, conversion rights, voting rights, terms of redemption, liquidation preference, sinking fund terms and the number of shares constituting any series or the designation of any series to the fullest extent permitted by the DGCL. The issuance of Terran Orbital Preferred Stock could have the effect of decreasing the trading price of our common stock, restricting dividends on the capital stock of Terran Orbital, diluting the voting power of our common stock, modifying the liquidation rights of the capital stock of Terran Orbital, or delaying or preventing a change in control of Terran Orbital.
Election of Directors and Vacancies
Subject to the rights of the holders of any series of Preferred Stock to elect additional directors under specified circumstances, the number of directors of the Terran Orbital Board shall be fixed solely and exclusively by resolution duly adopted from time to time by the Terran Orbital Board, but currently consists of nine (9) directors, which are divided into three (3) classes, designated Class I, II and III, respectively, with Class I consisting of three (3) directors, Class II consisting of three (3) directors and Class III consisting of three (3) directors.
Under the Bylaws, at all meetings of stockholders called for the election of directors, a plurality of the votes cast by the stockholders present in person or represented by proxy at the meeting and entitled to vote on the election of directors will be sufficient to elect such directors to the Terran Orbital Board.
Except as required by the DGCL and subject to the rights, if any, of the holders of any series of Terran Orbital Preferred Stock, in the interim between annual meetings of stockholders or special meetings of stockholders called for the election of directors and/or the removal of one or more directors and the filling of any vacancy in that connection, newly created directorships and any vacancies on the Terran Orbital Board, including unfilled vacancies resulting from the removal of directors, may be filled only by the affirmative vote of a majority of the remaining directors then in office, even if less than a quorum, or by the sole remaining director. All directors will hold office until the expiration of their respective terms of office and until their successors will have been elected and qualified or until his or her earlier resignation, death or removal. A director elected or appointed to fill a vacancy resulting from the death, resignation or removal of a director or a newly created directorship will serve for the remainder of the full term of the class of directors in which the new directorship was created or the vacancy occurred and until his or her successor will have been elected and qualified or until his or her earlier resignation, death or removal.
Subject to the rights, if any, of the holders of any series of Terran Orbital Preferred Stock, any director may be removed from office only for cause and only by the affirmative vote of the holders of not less than
two-thirds
of the total voting power of the then-outstanding capital stock (as defined below) of Terran Orbital then entitled to vote generally in the election of directors, voting together as a single class. Any such director proposed to be removed from office is entitled to advance written notice as described in the Certificate of Incorporation.In addition to the powers and authorities hereinbefore or by statute expressly conferred upon them, the directors are empowered to exercise all such powers and do all such acts and things as may be exercised or done by Terran Orbital, subject, nevertheless, to the provisions of the DGCL, the Certificate of Incorporation and to any Bylaws adopted and in effect from time to time.
Notwithstanding the foregoing provisions, any director elected pursuant to the right, if any, of the holders of Terran Orbital Preferred Stock to elect additional directors under specified circumstances will serve for such term or terms and pursuant to such other provisions as specified in the Certificate of Incorporation of Terran Orbital or relevant certificate of designations related to the Terran Orbital Preferred Stock.
140
Quorum
The holders of a majority in voting power of the capital stock issued and outstanding and entitled to vote thereat, present in person or represented by proxy, will constitute a quorum at all meetings of the stockholders for the transaction of business except as otherwise required by law or provided by the Certificate of Incorporation. If, however, such quorum will not be present or represented at any meeting of the stockholders, the holders of a majority of the voting power present in person or represented by proxy, or the presiding officer of the meeting will have power to adjourn the meeting from time to time. At such adjourned meeting at which a quorum will be present or represented, any business may be transacted which might have been transacted at the meeting as originally noticed. If the adjournment is for more than thirty (30) days, or if after the adjournment a new record date is fixed for the adjourned meeting, a notice of the adjourned meeting will be given to each stockholder entitled to vote at such adjourned meeting as of the record date fixed for notice of such adjourned meeting.
Anti-takeover Effects of the Certificate of Incorporation and the Bylaws
The Certificate of Incorporation and the Bylaws contain provisions that may delay, defer or discourage another party from acquiring control of us. We expect that these provisions, which are summarized below, will discourage coercive takeover practices or inadequate takeover bids. These provisions are also designed to encourage persons seeking to acquire control of us to first negotiate with the Board of Directors, which we believe may result in an improvement of the terms of any such acquisition in favor of our stockholders. However, they also give the Board of Directors the power to discourage acquisitions that some stockholders may favor.
Authorized but Unissued Capital Stock
Delaware law does not require stockholder approval for any issuance of authorized shares. However, the listing requirements of the NYSE, which apply if and so long as our common stock (or units or warrants) remains listed on the NYSE, require stockholder approval of certain issuances equal to or exceeding 20% of the then outstanding voting power or then outstanding number of shares of our common stock. Additional shares that may be issued in the future may be used for a variety of corporate purposes, including future public offerings, to raise additional capital or to facilitate acquisitions.
One of the effects of the existence of unissued and unreserved common stock may be to enable the Terran Orbital Board to issue shares to persons friendly to current management, which issuance could render more difficult or discourage an attempt to obtain control of Terran Orbital by means of a merger, tender offer, proxy contest or otherwise and thereby protect the continuity of management and possibly deprive stockholders of opportunities to sell their shares of our common stock at prices higher than prevailing market prices.
Special Meeting, Action by Written Consent and Advance Notice Requirements for Stockholder Proposals
Unless otherwise required by the DGCL or required or permitted by the Certificate of Incorporation, and subject to the rights, if any, of the holders of any series of Terran Orbital Preferred Stock, special meetings of the stockholders of Terran Orbital, for any purpose or purposes, may be called only by a majority of the Terran Orbital Board then in office. Unless otherwise required by law, written notice of a special meeting of stockholders, stating the time, place and purpose or purposes thereof, shall be given to each stockholder entitled to vote at such meeting, not less than ten (10) or more than sixty (60) days before the date fixed for the meeting. Business transacted at any special meeting of stockholders will be limited to the purposes stated in the notice. The Certificate of Incorporation provides that any action required or permitted to be taken by the stockholders of Terran Orbital must be effected at a duly called annual or special meeting and may not be taken or effected by a consent of stockholders in lieu thereof.
The Bylaws also provide that any action required or permitted to be taken at any meeting of the Terran Orbital Board or of any committee thereof may be taken without a meeting, if all members of the Terran Orbital Board or of such committee, as the case may be, consent thereto in writing or by electronic transmission, which consent may be documented, signed and delivered in any manner permitted by Section 116 of the DGCL. After an action is taken, the writing or writings or electronic transmission or transmissions must be filed with the minutes of proceedings of the Terran Orbital Board or committee.
141
In addition, the Bylaws require advance notice procedures for stockholder proposals to be brought before an annual meeting of the stockholders, including the nomination of directors. Stockholders at an annual meeting may only consider the proposals specified in the notice of meeting or brought before the meeting by or at the direction of the Board of Directors, or by a stockholder of record on the record date for the meeting, who is entitled to vote at the meeting and who has delivered a timely written notice in proper form to our secretary, of the stockholder’s intention to bring such business before the meeting.
These provisions could have the effect of delaying until the next stockholder meeting any stockholder actions, even if they are favored by the holders of a majority of our outstanding voting securities.
Amendment to Certificate of Incorporation and Bylaws
The DGCL provides generally that the affirmative vote of a majority of the outstanding stock entitled to vote on amendments to a corporation’s certificate of incorporation or bylaws is required to approve such amendment, unless a corporation’s certificate of incorporation or bylaws, as the case may be, requires a greater percentage.
The Certificate of Incorporation provides that the following provisions therein may be amended, altered, repealed or rescinded only by the affirmative vote of the holders of at least two thirds (2/3) of the total voting power of all the then-outstanding shares of Terran Orbital’s stock entitled to vote thereon, voting as a single class, and the affirmative vote of at least two thirds (2/3) of the then-outstanding shares of each class entitled to vote thereon as a class, voting separately as a class:
| • | the provisions regarding the size of the Terran Orbital Board, the classification of the Terran Orbital Board, and the election of directors; |
| • | the provisions regarding stockholder actions without a meeting; |
| • | the provisions regarding calling special meetings of stockholders; |
| • | the provisions regarding the limited liability of directors of Terran Orbital; and |
| • | the provisions regarding competition and corporate opportunities. |
The Certificate of Incorporation also provides that the provisions regarding removal of directors therein may be amended, altered, repealed or rescinded only by the affirmative vote of the holders of at least two thirds (2/3) of the total in voting power of all the then-outstanding shares of Terran Orbital’s stock entitled to vote thereon, voting as a single class.
The Bylaws may be amended or repealed (A) by the Terran Orbital Board, without the assent or vote of any stockholder, as set forth in the Certificate of Incorporation, (B) without the approval of the Terran Orbital Board, by an affirmative vote of the holders of at least two thirds (2/3) of the total voting power of the then-outstanding shares of Terran Orbital’s stock entitled to vote thereon, voting as a single class, or, (C) if recommended by the Terran Orbital Board, by an affirmative vote of the holders of at least a majority of the total voting power of the then-outstanding shares of Terran Orbital’s stock entitled to vote thereon, in each case, as set forth in the Certificate of Incorporation.
Delaware Anti-Takeover Statute
Section 203 of the DGCL provides that an “interested stockholder” (as defined therein) may not engage in certain “business combinations” with the corporation for a period of three years from the time such person acquired 15% or more of the corporation’s voting stock, unless:
| 1. | Prior to such time the Board of Directors of the corporation approved either the business combination or the transaction which resulted in the stockholder becoming an interested stockholder; |
| 2. | Upon consummation of the transaction which resulted in the stockholder becoming an interested stockholder, the interested stockholder owned at least 85% of the voting stock of the corporation outstanding at the time the transaction commenced, excluding for purposes of determining the voting stock outstanding (but not the outstanding voting stock owned by the interested stockholder) those shares owned (i) by persons who are directors and also officers and (ii) employee stock plans in which employee participants do not have the right to determine confidentially whether shares held subject to the plan will be tendered in a tender or exchange offer; or |
142
| 3. | At or subsequent to such time the business combination is approved by the Board of Directors and authorized at an annual or special meeting of stockholders, and not by written consent, by the affirmative vote of at least 66-2/3% of the outstanding voting stock which is not owned by the interested stockholder. |
Under the Certificate of Incorporation, Terran Orbital opted out of Section 203 of the DGCL and therefore is not subject to Section 203.
Limitations on Liability and Indemnification of Officers and Directors
The Certificate of Incorporation limits the liability of the directors of Terran Orbital for monetary damages for breaches of their fiduciary duties as directors to the fullest extent permitted by law, and the Bylaws provide that we will indemnify them to the fullest extent permitted by such law subject to the limitations set forth in the Bylaws. We have entered and expect to continue to enter into agreements to indemnify our directors, executive officers and other employees as determined by our Board of Directors. Under the terms of such indemnification agreements, we are required to indemnify each of our directors and officers, to the fullest extent permitted by the laws of the state of Delaware and the Certificate of Incorporation, if the basis of the indemnitee’s involvement was by reason of the fact that the indemnitee is or was a director or officer of Terran Orbital or any of its subsidiaries or was serving at Terran Orbital’s request in an official capacity for another entity. Subject to certain limitations set forth in the indemnification agreements, we must indemnify our officers and directors against all reasonable fees, expenses, charges and other costs of any type or nature whatsoever, including any and all expenses and obligations paid or incurred in connection with investigating, defending, being a witness in, participating in (including on appeal), or preparing to defend, be a witness or participate in any completed, actual, pending or threatened action, suit, claim or proceeding, whether civil, criminal, administrative or investigative, or establishing or enforcing a right to indemnification under the indemnification agreement to the fullest extent not prohibited by applicable law or the Company’s Certificate of Incorporation or Bylaws. The indemnification agreements also require us, if so requested in accordance with the terms thereof, to advance within ten (10) days of such request all reasonable fees, expenses, charges and other costs that any of our directors incurred, provided that such director will return any such advance if it is ultimately determined that such director is not entitled to indemnification by us. Any claims for indemnification by our directors and officers may reduce our available funds to satisfy successful third-party claims against us and may reduce the amount of money available to us.
Exclusive Forum of Certain Actions
The Certificate of Incorporation provides that, unless Terran Orbital consents in writing to the selection of an alternative forum, the Court of Chancery (the “”) of the State of Delaware (or, in the event that the Chancery Court does not have jurisdiction, the federal district court for the District of Delaware, or other state courts of the State of Delaware) shall, to the fullest extent permitted by law, be the sole and exclusive forum for (i) any derivative action or proceeding brought or purportedly brought on behalf of Terran Orbital, (ii) any action or proceeding asserting a claim of breach of a fiduciary duty owed by any current or former director, officer, employee, agent or stockholder of Terran Orbital to Terran Orbital or to Terran Orbital’s stockholders, or any claim for aiding and abetting such alleged breach, (iii) any action or proceeding asserting a claim arising pursuant to, or seeking to enforce any right, obligation or remedy under, any provision of the DGCL or the Governing Documents (as either may be amended from time to time), or to interpret, apply, enforce or determine the validity of the Governing Documents (as either may be amended from time to time), (iv) any action or proceeding as to which the DGCL confers jurisdiction on the Court of Chancery of the State of Delaware, (v) any action or proceeding asserting a claim against Terran Orbital or any current or former director, officer, employee, agent or stockholder of Terran Orbital arising pursuant to any provision of the DGCL or the Governing Documents (as either may be amended from time to time), (vi) any action or proceeding asserting a claim against Terran Orbital or any current or former director, officer, employee, agent or stockholder of Terran Orbital governed by the internal affairs doctrine of the State of Delaware, or (vii) any action or proceeding asserting an “internal corporate claim” as defined in Section 115 of the DGCL.
Chancery Court
143
Notwithstanding the forgoing, the exclusive forum provision will not apply to any claim (i) as to which such court determines that there is an indispensable party not subject to the jurisdiction of such court (and the indispensable party does not consent to the personal jurisdiction of such court within ten days following such determination), (ii) which is vested in the exclusive jurisdiction of a court or forum other than such court, or for which such court does not have subject matter jurisdiction, including, for the avoidance of doubt, any claim arising under the Exchange Act, or (iii) arising under the Securities Act , as to which the federal district courts of the United States of America shall, to the fullest extent permitted by law, be the sole and exclusive forum unless Terran Orbital consents in writing to the selection of an alternative forum.
Conflicts of Interest
Delaware law permits corporations to adopt provisions renouncing any interest or expectancy in certain opportunities that are presented to the corporation or its officers, directors or stockholders. The Certificate of Incorporation, to the fullest extent permitted by law, renounces any interest or expectancy that Terran Orbital has in, or right to be offered an opportunity to participate in, specified business opportunities that are from time to time presented to Terran Orbital’s directors or their respective affiliates, other than those directors or affiliates who are Terran Orbital’s employees and other than any opportunity offered to a non-employee director if such opportunity is expressly offered to such person (in writing) solely in his or her capacity as a director of Terran Orbital. The Certificate of Incorporation provides that, to the fullest extent permitted by law, none of the
non-employee
directors or their respective affiliates will have any duty to refrain from (i) engaging in a corporate opportunity in the same or similar business activities or lines of business in which Terran Orbital or any of its affiliates has historically engaged, now engages or proposes to engage or (ii) otherwise competing with Terran Orbital or its affiliates. In addition, to the fullest extent permitted by law, in the event that anynon-employee
director or his or her affiliates acquires knowledge of a potential transaction or other business opportunity which may be a corporate opportunity for itself, herself or himself and for Terran Orbital or its affiliates, such person will have no duty to communicate or offer such transaction or business opportunity to Terran Orbital or any of its affiliates and they may take any such opportunity for themselves or offer it to another person or entity. To the fullest extent permitted by law, no business opportunity will be deemed to be a potential corporate opportunity for Terran Orbital unless Terran Orbital is financially or legally able or contractually permitted to undertake such opportunity, the opportunity, by its nature, would be in the line of Terran Orbital’s business or is of some practical advantage to Terran Orbital, and Terran Orbital has some interest or reasonable expectancy in such opportunity.Terran Orbital Warrants
Our Warrants consist of 7,800,000 private placement warrants, 11,499,960 public warrants and 11,055,606 debt provider warrants (which were issued to Francisco Partners, Beach Point and Lockheed Martin).
Terran Orbital Debt Provider Warrants to Francisco Partners, Lockheed Martin and Beach Point
Each whole debt provider warrant, issued pursuant to a stock and warrant purchase agreement, entitles the registered holder to purchase our common stock at a price of $10.00 per share, subject to adjustment as discussed below, following Closing. Pursuant to the warrant and purchase agreement, a debt provider warrant holder may exercise its debt provider warrants only for a whole number of shares of our common stock.
The debt provider warrants will expire on the earlier of (i) the date that is five years after Closing or (ii) the time at which the warrant has been exercised in respect of all of our common stock or redeemed (if applicable).
Upon any exercise of a debt provider warrant, the exercise price is payable in cash or, at the option of the holder, on a cashless basis under certain circumstances, including by having Terran Orbital withhold a number of shares of our common stock then issuable upon exercise of the debt provider warrant with an aggregate fair market value equal to the aggregate exercise price.
144
If, upon the expiration of the exercise period, the fair market value of one debt provider warrant is greater than the exercise price then in effect, then the debt provider warrant shall automatically be deemed, effective as of immediately prior to such expiration, to be exercised in respect of all our common stock in respect of which it has not previously been exercised in accordance with the “net exercise” procedures, unless the holder elects otherwise in a written notice delivered to Terran Orbital. The “fair market value” as used in this paragraph means, as of any given date, (a) if our common stock is traded on a national securities exchange, inter-dealer quotation system orbulletin board service during the Reference Period (as hereinafter defined) (or such shorter period of consecutive trading days within the Reference Period on which our common stock was so traded as may be mutually agreed between Terran Orbital and the holder), the volume-weighted average of the closing prices per share of our common stock, as reported by Bloomberg, or if not reported by Bloomberg, as reported by Morningstar, during the period of thirty (30) trading days ending on the trading day immediately prior to such date (the “”), (b) if the debt provider warrant is being exercised in connection with a reorganization, reclassification, consolidation, merger, sale, or similar transaction, the fair market
over-the-counter
Reference Period
per-share
value of the consideration received by the holders of the outstanding shares of our common stock or other securities of the Terran Orbital then constituting our common stock in connection therewith and (c) in any other case, the fair market value per share of our common stock as jointly determined by the Terran Orbital Board and the holder, each acting in good faith; provided that if the Terran Orbital Board and the holder are unable to agree on the fair market value per share of our common stock within ten (10) business days after Terran Orbital’s receipt of the exercise notice, such fair market value shall be determined by a nationally recognized investment banking, accounting or valuation firm jointly selected by the Terran Orbital Board and the holder and engaged by the Terran Orbital, which firm’s determination shall be final and conclusive, and the fees and expenses of such firm shall be borne equally by Terran Orbital and the holder.Redemption Procedures.
Repurchase Date
Anti-Dilution Adjustments
If Terran Orbital subdivides or combines our common stock or other securities of Terran Orbital then purchasable upon exercise of the debt provider warrants (“”), then (i) in the case of a subdivision, the exercise price shall be proportionately decreased and the number of Warrant Shares shall be proportionately increased and (ii) in the case of a combination, the exercise price shall be proportionately increased and the number of Warrant Shares shall be proportionately decreased.
Warrant Shares
If Terran Orbital pays any dividend or makes any distribution in respect of our common stock or other securities of Terran Orbital then constituting Warrant Shares, then the exercise price shall be adjusted, from and after the date of determination of the stockholders of Terran Orbital entitled to receive such dividend, to be an amount equal to the product of (A) the exercise price in effect immediately prior to such date of determination multiplied by (B) the quotient of (x) the total number of shares of our common stock or such other securities outstanding immediately prior to such dividend or distribution divided by (y) the total number of shares of our common stock or such other securities outstanding immediately after such dividend or distribution, and the number of Warrant Shares will be proportionately adjusted such that the aggregate exercise price will remain unchanged.
145
If Terran Orbital pays any dividend or makes any distribution (whether in cash, securities or other property) in respect of our common stock, then the Terran Orbital Board shall make provision so that, upon any exercise of the debt provider warrant, the holder shall be entitled to receive, in addition to our common stock issuable upon such exercise, such dividend or distribution to the extent that such dividend or distribution would have been paid or made, as applicable, in respect of our common stock issued upon such exercise had our common stock been outstanding immediately prior to the record date for such dividend or distribution.
In the event of any (i) capital reorganization of Terran Orbital, (ii) reclassification of the stock of Terran Orbital, (iii) consolidation or merger of Terran Orbital, (iv) sale of all or substantially all of Terran Orbital’s assets or (v) other similar transaction, in each case which entitles the holders of our common stock (either directly or upon subsequent liquidation) to receive stock, securities or other property with respect to or in exchange for our common stock, the debt provider warrant shall, immediately after such reorganization, reclassification, consolidation, merger, sale, or similar transaction, remain outstanding and shall thereafter, in lieu of or in addition to (as the case may be) the number of our common stock then exercisable under the debt provider warrant, be exercisable for the kind and number of shares of capital stock or other securities or property of Terran Orbital or of the successor entity resulting from such transaction to which the holder would have been entitled upon such reorganization, reclassification, consolidation, merger, sale, or similar transaction if the holder had exercised the debt provider warrant in full immediately prior to the time of such reorganization, reclassification, consolidation, merger, sale, or similar transaction and acquired the applicable number of our common stock then issuable hereunder as a result of such exercise (without taking into account any limitations or restrictions on the exercisability of the debt provider warrant).
The debt provider warrant holders do not have the rights or privileges of holders of our common stock and any voting rights until they exercise their warrants and receive shares of our common stock. After the issuance of shares of our common stock upon exercise of the debt provider warrants, each holder will be entitled to one (1) vote for each share held of record on all matters to be voted on by stockholders.
No fractional debt provider warrants will be issued upon separation of the units and only whole debt provider warrants will trade.
The Public Warrants
Each whole public warrant entitles the registered holder to purchase one share of our common stock at a price of $11.50 per share, subject to adjustment as discussed below, at any time commencing 30 days after the completion of the Business Combination, except as discussed in the immediately succeeding paragraph. Pursuant to the Warrant Agreement, a public warrant holder may exercise its public warrants only for a whole number of shares of our common stock. The public warrants will expire five years after the completion of the Business Combination, at 5:00 p.m., New York City time, or earlier upon redemption or liquidation.
Terran Orbital will not be obligated to deliver any shares of our common stock pursuant to the exercise of a public warrant and will have no obligation to settle such public warrant exercise unless a registration statement under the Securities Act with respect to the shares underlying the public warrants is then effective and a prospectus relating thereto is current, subject to Terran Orbital satisfying the obligations described below with respect to registration, or a valid exemption from registration is available. No public warrant will be exercisable and Terran Orbital will not be obligated to issue a share of our common stock upon exercise of a public warrant unless the share of our common stock issuable upon such public warrant exercise has been registered, qualified or deemed to be exempt under the securities laws of the state of residence of the registered holder of the public warrants. In the event that the conditions in the two immediately preceding sentences are not satisfied with respect to a public warrant, the holder of such public warrant will not be entitled to exercise such public warrant and such public warrant may have no value and expire worthless. In no event will Terran Orbital be required to net cash settle the public warrants.
146
Terran Orbital has agreed that as soon as practicable, but in no event later than twenty business days after the closing of the Business Combination, Terran Orbital will use its commercially reasonable efforts to file with the SEC a registration statement for the registration, under the Securities Act, of the shares of our common stock issuable upon exercise of the public warrants, and Terran Orbital will use its commercially reasonable efforts to cause the same to become effective within 60 business days after the closing of the Business Combination, and to maintain the effectiveness of such registration statement and a current prospectus relating to those shares of our common stock until the public warrants expire or are redeemed, as specified in the Warrant Agreement; provided that if our common stock is at the time of any exercise of a public warrant not listed on a national securities exchange such that they satisfy the definition of a “covered security” under Section 18(b)(1) of the Securities Act, Terran Orbital may, at its option, require holders of public warrants who exercise their public warrants to do so on a “cashless basis” in accordance with Section 3(a)(9) of the Securities Act and, in the event Terran Orbital so elects, it will not be required to file or maintain in effect a registration statement, but will use its commercially reasonably efforts to register or qualify the shares under applicable blue sky laws to the extent an exemption is not available. If a registration statement covering the shares of our common stock issuable upon exercise of the public warrants is not effective by the 60th day after the closing of the Business Combination, public warrant holders may, until such time as there is an effective registration statement and during any period when Terran Orbital will have failed to maintain an effective registration statement, exercise public warrants on a “cashless basis” in accordance with Section 3(a)(9) of the Securities Act or another exemption, but Terran Orbital will use its commercially reasonably efforts to register or qualify the shares under applicable blue sky laws to the extent an exemption is not available. In such event, each holder would pay the exercise price by surrendering the public warrants for that number of shares of our common stock equal to the lesser of (A) the quotient obtained by dividing (x) the product of the number of shares of our common stock underlying the public warrants, multiplied by the excess of the “fair market value” (defined below) less the exercise price of the public warrants by (y) the fair market value and (B) 0.361. The “fair market value” as used in this paragraph shall mean the volume weighted average price of our common stock for the 10 trading days ending on the trading day prior to the date on which the notice of exercise is received by the public warrant agent.
Redemption of public warrants when the price per share of our common stock equals or exceeds $18.00.
Once the public warrants become exercisable, we may redeem the outstanding public warrants:
| • | in whole and not in part; |
| • | at a price of $0.01 per public warrant; |
| • | upon a minimum of 30 days’ prior written notice of redemption to each public warrant holder; and |
| • | if, and only if, the closing price of our common stock equals or exceeds $18.00 per share for any 20 trading days within a 30-trading day period ending three trading days before we send the notice of redemption to the public warrant holders. |
We will not redeem the public warrants as described above unless a registration statement under the Securities Act covering the issuance of the shares of our common stock issuable upon exercise of the public warrants is then effective and a current prospectus relating to those shares of our common stock is available throughout the
30-day
redemption period. If and when the public warrants become redeemable by us, we may exercise our redemption right even if we are unable to register or qualify the underlying securities for sale under all applicable state securities laws.Redemption of public warrants when the price per share of our common stock equals or exceeds $10.00.
Once the public warrants become exercisable, we may redeem the outstanding public warrants:
| • | in whole and not in part; |
| • | at $0.10 per public warrant upon a minimum of 30 days’ prior written notice of redemption provided that holders will be able to exercise their public warrants on a cashless basis prior to redemption and receive that number of shares determined by reference to the table below, based on the redemption date and the “fair market value” of our common stock (as defined below) except as otherwise described below; |
147
| • | if, and only if, the closing price of our common stock equals or exceeds $10.00 per public share (as adjusted for stock splits, stock dividends, reorganizations, recapitalizations and the like) for any 20 trading days within the 30-trading day period ending three trading days before Terran Orbital sends the notice of redemption to the public warrant holders; and |
| • | if the closing price of our common stock for any 20 trading days within a 30-trading day period ending on the third trading day prior to the date on which Terran Orbital sends the notice of redemption to the public warrant holders is less than $18.00 per share (as adjusted for stock splits, stock dividends, reorganizations, recapitalizations and the like), the private placement warrants must also be concurrently called for redemption on the same terms as the outstanding public warrants, as described above. |
Beginning on the date the notice of redemption is given until the public warrants are redeemed or exercised, holders may elect to exercise their warrants on a cashless basis. The numbers in the table below represent the number of shares of our common stock that a public warrant holder will receive upon such cashless exercise in connection with a redemption by Terran Orbital pursuant to this redemption feature, based on the “fair market value” of our common stock on the corresponding redemption date (assuming holders elect to exercise their warrants and such warrants are not redeemed for $0.10 per warrant), determined for these purposes based on volume weighted average price of our common stock during the 10 trading days immediately following the date on which the notice of redemption is sent to the holders of public warrants, and the number of months that the corresponding redemption date precedes the expiration date of the warrants, each as set forth in the table below. We will provide our public warrant holders with the final fair market value no later than one business day after the
10-trading
day period described above ends.The share prices set forth in the column headings of the table below will be adjusted as of any date on which the number of shares issuable upon exercise of a warrant or the exercise price of a warrant is adjusted as set forth under the heading “- Anti-Dilution Adjustments” below.
148
REDEMPTION DATE (PERIOD TO EXPIRATION OF WARRANTS) | FAIR MARKET VALUE OF CLASS A ORDINARY SHARES | |||||||||||||||||||||||||||||||||||
$10.00 | 11.00 | 12.00 | 13.00 | 14.00 | 15.00 | 16.00 | 17.00 | 18.00 | ||||||||||||||||||||||||||||
60 months | 0.261 | 0.281 | 0.297 | 0.311 | 0.324 | 0.337 | 0.348 | 0.358 | 0.361 | |||||||||||||||||||||||||||
57 months | 0.257 | 0.277 | 0.294 | 0.310 | 0.324 | 0.337 | 0.348 | 0.358 | 0.361 | |||||||||||||||||||||||||||
54 months | 0.252 | 0.272 | 0.291 | 0.307 | 0.322 | 0.335 | 0.347 | 0.357 | 0.361 | |||||||||||||||||||||||||||
51 months | 0.246 | 0.268 | 0.287 | 0.304 | 0.320 | 0.333 | 0.346 | 0.357 | 0.361 | |||||||||||||||||||||||||||
48 months | 0.241 | 0.263 | 0.283 | 0.301 | 0.317 | 0.332 | 0.344 | 0.356 | 0.361 | |||||||||||||||||||||||||||
45 months | 0.235 | 0.258 | 0.279 | 0.298 | 0.315 | 0.330 | 0.343 | 0.356 | 0.361 | |||||||||||||||||||||||||||
42 months | 0.228 | 0.252 | 0.274 | 0.294 | 0.312 | 0.328 | 0.342 | 0.355 | 0.361 | |||||||||||||||||||||||||||
39 months | 0.221 | 0.246 | 0.269 | 0.290 | 0.309 | 0.325 | 0.340 | 0.354 | 0.361 | |||||||||||||||||||||||||||
36 months | 0.213 | 0.239 | 0.263 | 0.285 | 0.305 | 0.323 | 0.339 | 0.353 | 0.361 | |||||||||||||||||||||||||||
33 months | 0.205 | 0.232 | 0.257 | 0.280 | 0.301 | 0.320 | 0.337 | 0.352 | 0.361 | |||||||||||||||||||||||||||
30 months | 0.196 | 0.224 | 0.250 | 0.274 | 0.297 | 0.316 | 0.335 | 0.351 | 0.361 | |||||||||||||||||||||||||||
27 months | 0.185 | 0.214 | 0.242 | 0.268 | 0.291 | 0.313 | 0.332 | 0.350 | 0.361 | |||||||||||||||||||||||||||
24 months | 0.173 | 0.204 | 0.233 | 0.260 | 0.285 | 0.308 | 0.329 | 0.348 | 0.361 | |||||||||||||||||||||||||||
21 months | 0.161 | 0.193 | 0.223 | 0.252 | 0.279 | 0.304 | 0.326 | 0.347 | 0.361 | |||||||||||||||||||||||||||
18 months | 0.146 | 0.179 | 0.211 | 0.242 | 0.271 | 0.298 | 0.322 | 0.345 | 0.361 | |||||||||||||||||||||||||||
15 months | 0.130 | 0.164 | 0.197 | 0.230 | 0.262 | 0.291 | 0.317 | 0.342 | 0.361 | |||||||||||||||||||||||||||
12 months | 0.111 | 0.146 | 0.181 | 0.216 | 0.250 | 0.282 | 0.312 | 0.339 | 0.361 | |||||||||||||||||||||||||||
9 months | 0.090 | 0.125 | 0.162 | 0.199 | 0.237 | 0.272 | 0.305 | 0.336 | 0.361 | |||||||||||||||||||||||||||
6 months | 0.065 | 0.099 | 0.137 | 0.178 | 0.219 | 0.259 | 0.296 | 0.331 | 0.361 | |||||||||||||||||||||||||||
3 months | 0.034 | 0.065 | 0.104 | 0.150 | 0.197 | 0.243 | 0.286 | 0.326 | 0.361 | |||||||||||||||||||||||||||
0 months | — | — | 0.042 | 0.115 | 0.179 | 0.233 | 0.281 | 0.323 | 0.361 | |||||||||||||||||||||||||||
The exact fair market value and redemption date may not be set forth in the table above, in which case, if the fair market value is between two values in the table or the redemption date is between two redemption dates in the table, the number of shares of our common stock to be issued for each public warrant exercised will be determined by a straight-line interpolation between the number of shares set forth for the higher and lower fair market values and the earlier and later redemption dates, as applicable, based on a 365 or
366-day
year, as applicable. In no event will the public warrants be exercisable on a cashless basis in connection with this redemption feature for more than 0.361 shares of our common stock per public warrant (subject to adjustment). Finally, as reflected in the table above, if the public warrants are out of the money and about to expire, they cannot be exercised on a cashless basis in connection with a redemption by us pursuant to this redemption feature, since they will not be exercisable for any shares of our common stock.149
At such time as the public warrants become exercisable for our common stock, Terran Orbital will use its commercially reasonable efforts to register under the Securities Act the security issuable upon the exercise of the public warrants.
Redemption Procedures.
Anti-Dilution Adjustments
split-up
of shares of our common stock or other similar event, then, on the effective date of such capitalization or share dividend,split-up
or similar event, the number of shares of our common stock issuable on exercise of each public warrant will be increased in proportion to such increase in the outstanding shares of our common stock. A rights offering made to all or substantially all holders of our common stock entitling holders to purchase shares of our common stock at a price less than the “historical fair market value” (as defined below) will be deemed a share dividend of a number of shares of our common stock equal to the product of (i) the number of shares of our common stock actually sold in such rights offering (or issuable under any other equity securities sold in such rights offering that are convertible into or exercisable for shares of our common stock) and (ii) one minus the quotient of (x) the price per share of our common stock paid in such rights offering and (y) the historical fair market value. For these purposes, (i) if the rights offering is for securities convertible into or exercisable for shares of our common stock, in determining the price payable for shares of our common stock, there will be taken into account any consideration received for such rights, as well as any additional amount payable upon exercise or conversion and (ii) “historical fair market value” means the volume weighted average price of our common stock as reported during the 10 trading day period ending on the trading day prior to the first date on which our common stock trades on the applicable exchange or in the applicable market, regular way, without the right to receive such rights.In addition, if we, at any time while the public warrants are outstanding and unexpired, pay a dividend or make a distribution in cash, securities or other assets to all or substantially all of the holders of the shares of our common stock on account of such shares of our common stock, other than (a) as described above or (b) any cash dividends or cash distributions which, when combined on a per share basis with all other cash dividends and cash distributions paid on the shares of our common stock during the
365-day
period ending on the date of declaration of such dividend or distribution does not exceed $0.50 (as adjusted to appropriately reflect any other adjustments and excluding cash dividends or cash distributions that resulted in an adjustment to the exercise price or to the number of shares of our common stock issuable on exercise of each public warrant) but only with respect to the amount of the aggregate cash dividends or cash distributions equal to or less than $0.50 per share, then the public warrant exercise price will be decreased, effective immediately after the effective date of such event, by the amount of cash and/or the fair market value of any securities or other assets paid on each share of our common stock in respect of such event.If the number of outstanding shares of our common stock is decreased by a consolidation, combination, reverse share
sub-division
or reclassification of shares of our common stock or other similar event, then, on the effective date of such consolidation, combination, reverse sharesub-division,
reclassification or similar event, the number of shares of our common stock issuable on exercise of each public warrant will be decreased in proportion to such decrease in outstanding shares of our common stock.Whenever the number of shares of our common stock purchasable upon the exercise of the public warrants is adjusted, as described above, the warrant exercise price will be adjusted by multiplying the warrant exercise price immediately prior to such adjustment by a fraction (x) the numerator of which will be the number of shares of our common stock purchasable upon the exercise of the public warrants immediately prior to such adjustment and (y) the denominator of which will be the number of shares of our common stock so purchasable immediately thereafter.
��
150
The public warrants are issued in registered form under a Warrant Agreement between Continental Stock Transfer & Trust Company, as warrant agent, and Tailwind (the “Warrant Agreement”). A copy of the Warrant Agreement is filed as an exhibit to the registration statement of which this prospectus forms a part, including the complete description of the terms and conditions applicable to the public warrants and the private placement warrants.
The Warrant Agreement provides that the terms of the public warrants may be amended without the consent of any holder for the purpose of (i) curing any ambiguity or correct any mistake or defective provision, including to conform the provisions of the Warrant Agreement to the description of the terms of the public warrants and the Warrant Agreement set forth in the prospectus dated March 4, 2021, (ii) amending the provisions relating to cash dividends on shares of common stock as contemplated by and in accordance with the Warrant Agreement or (iii) adding or changing any provisions with respect to matters or questions arising under the Warrant Agreement as the parties to the Warrant Agreement may deem necessary or desirable and that the parties deem to not adversely affect the rights of the registered holders of the public warrants, provided that the approval by the holders of at least 65% of the then-outstanding public warrants is required to make any change that adversely affects the interests of the registered holders of the public warrants (including any amendment to increase the warrant price or shorten the exercise period and any amendments to the terms of only the private placement warrants).
The public warrant holders do not have the rights or privileges of holders of our common stock and any voting rights until they exercise their public warrants and receive shares of our common stock. After the issuance of shares of our common stock upon exercise of the public warrants, each holder will be entitled to one (1) vote for each share held of record on all matters to be voted on by stockholders.
If, upon exercise of the public warrants, a holder would be entitled to receive a fractional interest in a share, we will, upon exercise, round down to the nearest whole number the number of shares of our common stock to be issued to the public warrant holder.
We have agreed that, subject to applicable law, any action, proceeding or claim against us arising out of or relating in any way to the Warrant Agreement will be brought and enforced in the courts of the State of New York or the United States District Court for the Southern District of New York, and we irrevocably submit to such jurisdiction, which jurisdiction will be the exclusive forum for any such action, proceeding or claim. This provision applies to claims under the Securities Act but does not apply to claims under the Exchange Act or any claim for which the federal district courts of the United States of America are the sole and exclusive forum.
Private Placement Warrants
The private placement warrants are issued in registered form under the Warrant Agreement and are identical to the public warrants, subject to the exceptions described below that apply to the private placement warrants as long as they are held by the Sponsor or its permitted transferees. The private placement warrants (including our common stock issuable upon exercise of the private placement warrants) are not transferable, assignable or salable until 30 days after the completion of the Business Combination (except pursuant to limited exceptions) and they will not be redeemable by us (except pursuant to limited exceptions) so long as they are held by the Sponsor or its permitted transferees (except as otherwise set forth herein). The Sponsor, or its permitted transferees, has the option to exercise the private placement warrants on a cashless basis. If the private placement warrants are held by holders other than the Sponsor or its permitted transferees, the private placement warrants will be redeemable by us in all redemption scenarios and exercisable by the holders on the same basis as the public warrants. Any amendment to the terms of the private placement warrants or any provision of the Warrant Agreement with respect to the private placement warrants will require a vote of holders of at least 65% of the number of the then-outstanding private placement warrants.
Except as described above, if holders of the private placement warrants elect to exercise them on a cashless basis, they would pay the exercise price by surrendering his, her or its warrants for that number of shares of our common stock equal to the quotient obtained by dividing (x) the product of the number of shares of our common stock underlying the warrants, multiplied by the excess of the “Sponsor fair market value” (defined below) over the exercise price of the warrants by (y) the Sponsor fair market value. For these purposes, the “Sponsor fair market value” shall mean the average reported closing price of the shares of our common stock for the 10 trading days ending on the third trading day prior to the date on which the notice of warrant exercise is sent to the warrant agent.
151
SECURITIES ACT RESTRICTIONS ON RESALE OF OUR SECURITIES
Except as described below under “—,” pursuant to Rule 144 under the Securities Act (“”), a person who has beneficially owned restricted Terran Orbital Common Stock for at least six months would be entitled to sell their securities provided that (i) such person is not deemed to have been an affiliate of Terran Orbital at the time of, or at any time during the three months preceding, a sale and (ii) Terran Orbital is subject to the Exchange Act periodic reporting requirements for at least three months before the sale and have filed all required reports under Section 13 or 15(d) of the Exchange Act during the twelve months (or such shorter period as Terran Orbital was required to file reports) preceding the sale.
Restrictions on the Use of Rule 144 by Shell Companies or Former Shell Companies
Rule 144
Persons who have beneficially owned restricted Terran Orbital Common Stock shares for at least six months but who are affiliates of Terran Orbital at the time of, or at any time during the three months preceding, a sale, would be subject to additional restrictions, by which such person would be entitled to sell within any three-month period only a number of securities that does not exceed the greater of:
| • | 1% of the total number of shares or other units of the class then outstanding; or |
| • | the average weekly reported trading volume of such securities during the four calendar weeks preceding the filing of a notice on Form 144 with respect to the sale. |
Sales by affiliates of Terran Orbital under Rule 144 are also limited by manner of sale provisions and notice requirements and to the availability of current public information about Terran Orbital.
Restrictions on the Use of Rule 144 by Shell Companies or Former Shell Companies
Rule 144 is not available for the resale of securities initially issued by shell companies (other than business combination related shell companies) or issuers that have been at any time previously a shell company. However, Rule 144 also includes an important exception to this prohibition if the following conditions are met:
| • | the issuer of the securities that was formerly a shell company has ceased to be a shell company; |
| • | the issuer of the securities is subject to the reporting requirements of Section 13 or 15(d) of the Exchange Act; |
| • | the issuer of the securities has filed all Exchange Act reports and material required to be filed, as applicable, during the preceding twelve months (or such shorter period that the issuer was required to file such reports and materials), other than Form 8-K reports; and |
| • | at least one year has elapsed from the time that the issuer filed current Form 10 type information with the SEC reflecting its status as an entity that is not a shell company. |
As a result, our affiliates will be able to sell their shares of common stock and warrants, and any shares of common stock received upon exercise of the warrants, as applicable, pursuant to Rule 144 without registration one year after the filing of our “Super” Form
8-K/A
with Form 10 type information, which was filed on March 31, 2022. Absent registration under the Securities Act, our affiliates will not be permitted to sell their control securities under Rule 144 earlier than one year after the filing of the “Super” Form8-K.
We are no longer a shell company, and as a result, once the conditions set forth in the exceptions listed above are satisfied, Rule 144 will become available for the resale of restricted securities and control securities.
152
PLAN OF DISTRIBUTION
The Selling Securityholders, which as used herein includes donees, pledgees, transferees, distributees or otherselling shares of our common stock or warrants or interests in our common stock or warrants received after the date of this prospectus from the Selling Securityholders as a gift, pledge, partnership distribution or other transfer, may, from time to time, sell, transfer, distribute or otherwise dispose of certain of their shares of common stock or warrants or interests in our common stock or warrants on any stock exchange, market or trading facility on which shares of our common stock or warrants, as applicable, are traded or in private transactions. These dispositions may be at fixed prices, at prevailing market prices at the time of sale, at prices related to the prevailing market price, at varying prices determined at the time of sale, or at negotiated prices.
successors-in-interest
The Selling Securityholders may use any one or more of the following methods when disposing of their shares of common stock or warrants or interests therein:
| • | ordinary brokerage transactions and transactions in which the broker-dealer solicits purchasers; |
| • | one or more underwritten offerings; |
| • | block trades (which may involve crosses) in which the broker-dealer will attempt to sell the shares of common stock or warrants as agent, but may position and resell a portion of the block as principal to facilitate the transaction; |
| • | purchases by a broker-dealer as principal and resale by the broker-dealer for its accounts; |
| • | an exchange distribution and/or secondary distribution in accordance with the rules of the applicable exchange; |
| • | privately negotiated transactions; |
| • | distributions to their employees, partners, members or stockholders; |
| • | short sales (including short sales “against the box”) effected after the date of the registration statement of which this prospectus is a part is declared effective by the SEC; |
| • | through the writing or settlement of standardized or over-the-counter |
| • | in market transactions, including transactions on a national securities exchange or quotations service or over-the-counter |
| • | an offering at other than a fixed price on or through the facilities of any stock exchange on which the securities are listed or to or through a market maker other than on that stock exchange; |
| • | by pledge to secure debts and other obligation; |
| • | directly to purchasers, including our affiliates and stockholders, in a rights offering or otherwise; |
| • | privately negotiated transactions, directly or through agents; |
| • | broker-dealers may agree with the Selling Securityholders to sell a specified number of such shares of common stock or warrants at a stipulated price per share or warrant; |
| • | through the distribution of the securities by any security holders to its partners, members or stockholders; and |
153
| • | through a combination of any of these methods or any other method permitted by applicable law. |
The Selling Securityholders may also transfer the securities by gift. The Selling Securityholders may effect the distribution of our common stock and warrants from time to time in one or more transactions either:
| • | at a fixed price or prices, which may be changed from time to time; |
| • | at market prices prevailing at the time of sale; |
| • | at prices relating to the prevailing market prices; or |
| • | at negotiated prices. |
The Selling Securityholders may, from time to time, pledge or grant a security interest in some shares of our common stock or warrants owned by them and, if a Selling Securityholder defaults in the performance of its secured obligations, the pledgees or secured parties may offer and sell such shares of common stock or warrants, as applicable, from time to time, under this prospectus, or under an amendment or supplement to this prospectus under Rule 424(b)(3) or other applicable provision of the Securities Act amending the list of the Selling Securityholders to include the pledgee, transferee or other successors in interest as the Selling Securityholders under this prospectus.
The Selling Securityholders also may transfer shares of our common stock or warrants in other circumstances, in which case the transferees, pledgees or other successors in interest will be the selling beneficial owners for purposes of this prospectus.
We and the Selling Securityholders may agree to indemnify an underwriter, broker-dealer or agent against certain liabilities related to the sale of our common stock and warrants, including liabilities under the Securities Act. The Selling Securityholders have advised us that they have not entered into any agreements, understandings or arrangements with any underwriters or broker-dealers regarding the sale of their common stock and warrants. Upon our notification by a Selling Securityholder that any material arrangement has been entered into with an underwriter or broker-dealer for the sale of common stock and warrants through a block trade, special offering, exchange distribution, secondary distribution or a purchase by an underwriter or broker-dealer, we will file a supplement to this prospectus, if required, pursuant to Rule 424(b) under the Securities Act, disclosing certain material information, including:
| • | the name of the selling security holder; |
| • | the number of common stock and warrants being offered; |
| • | the terms of the offering; |
| • | the names of the participating underwriters, broker-dealers or agents; |
| • | any discounts, commissions or other compensation paid to underwriters or broker-dealers and any discounts, commissions or concessions allowed or reallowed or paid by any underwriters to dealers; |
| • | the public offering price; |
| • | the estimated net proceeds to us from the sale of the common stock and warrants; |
| • | any delayed delivery arrangements; and |
| • | other material terms of the offering. |
In addition, upon being notified by a Selling Securityholder that a donee, pledgee, transferee or otherintends to sell common stock and warrants, we will, to the extent required, promptly file a supplement to this prospectus to name specifically such person as a Selling Securityholder.
successor-in-interest
154
Agents, broker-dealers and underwriters or their affiliates may engage in transactions with, or perform services for, the Selling Securityholders (or their affiliates) in the ordinary course of business. The Selling Securityholders may also use underwriters or other third parties with whom such selling stockholders have a material relationship.
The Selling Securityholders (or their affiliates) will describe the nature of any such relationship in the applicable prospectus supplement.
There can be no assurances that the Selling Securityholders will sell, nor are the Selling Securityholders required to sell, any or all of the common stock and warrants offered under this prospectus.
In connection with the sale of shares of our common stock or warrants or interests therein, the Selling Securityholder may enter into hedging transactions with broker-dealers or other financial institutions, which may in turn engage in short sales of our common stock or warrants in the course of hedging the positions they assume. The Selling Securityholders may also sell shares of our common stock or warrants short and deliver these securities to close out their short positions, or loan or pledge shares of our common stock or warrants to broker-dealers that in turn may sell these securities. The Selling Securityholders may also enter into option or other transactions with broker-dealers or other financial institutions or the creation of one or more derivative securities that require the delivery to such broker-dealer or other financial institution of shares of our common stock or warrants offered by this prospectus, which shares or warrants such broker-dealer or other financial institution may resell pursuant to this prospectus (as supplemented or amended to reflect such transaction).
The aggregate proceeds to the Selling Securityholders from the sale of shares of our common stock or warrants offered by them will be the purchase price of such shares of our common stock or warrants less discounts or commissions, if any. The Selling Securityholders reserve the right to accept and, together with their agents from time to time, to reject, in whole or in part, any proposed purchase of share of our common stock or warrants to be made directly or through agents. We will not receive any of the proceeds from any offering by the Selling Securityholders.
The Selling Securityholders also may in the future resell a portion of our common stock or warrants in open market transactions in reliance upon Rule 144 under the Securities Act, provided that they meet the criteria and conform to the requirements of that rule, or pursuant to other available exemptions from the registration requirements of the Securities Act.
The Selling Securityholders and any underwriters, broker-dealers or agents that participate in the sale of shares of our common stock or warrants or interests therein may be “underwriters” within the meaning of Section 2(11) of the Securities Act. Any discounts, commissions, concessions or profit they earn on any resale of shares of our common stock or warrants may be underwriting discounts and commissions under the Securities Act. If any Selling Securityholder is an “underwriter” within the meaning of Section 2(11) of the Securities Act, then the Selling Securityholder will be subject to the prospectus delivery requirements of the Securities Act. Underwriters and their controlling persons, dealers and agents may be entitled, under agreements entered into with us and the Selling Securityholders, to indemnification against and contribution toward specific civil liabilities, including liabilities under the Securities Act.
To the extent required, our common stock or warrants to be sold, the respective purchase prices and public offering prices, the names of any agent, dealer or underwriter, and any applicable discounts, commissions, concessions or other compensation with respect to a particular offer will be set forth in an accompanying prospectus supplement or, if appropriate, a post-effective amendment to the registration statement that includes this prospectus. To facilitate the offering of shares of our common stock and warrants offered by the Selling Securityholders, certain persons participating in the offering may engage in transactions that stabilize, maintain or otherwise affect the price of our common stock or warrants. This may include over-allotments or short sales, which involve the sale by persons participating in the offering of more shares of common stock or warrants than were sold to them. In these circumstances, these persons would cover such over-allotments or short positions by making purchases in the open market or by exercising their over-allotment option, if any. In addition, these persons may stabilize or maintain the price of our common stock or warrants by bidding for or purchasing shares of common stock or warrants in the open market or by imposing penalty bids, whereby selling concessions allowed to dealers participating in the offering may be reclaimed if shares of common stock or warrants sold by them are repurchased in connection with stabilization transactions. The effect of these transactions may be to stabilize or maintain the market price of our common stock or warrants at a level above that which might otherwise prevail in the open market. These transactions may be discontinued at any time. These transactions may be effected on any exchange on which the securities are traded, in themarket or otherwise.
over-the-counter
155
Under the Investor Rights Agreement and the PIPE Subscription Agreements, we have agreed to indemnify the applicable Selling Securityholders party thereto against certain liabilities that they may incur in connection with the sale of the securities registered hereunder, including liabilities under the Securities Act, and to contribute to payments that the Selling Securityholders may be required to make with respect thereto. In addition, we and the Selling Securityholders may agree to indemnify any underwriter, broker-dealer or agent against certain liabilities related to the selling of the securities, including liabilities arising under the Securities Act.
Under the Investor Rights Agreement, we have agreed to maintain the effectiveness of the registration statement of which this prospectus forms a part pursuant to such agreement until (i) all such securities have been sold, transferred, disposed of or exchanged in accordance with the registration statement; and (ii) the date as of which no Selling Securityholder that is party to the Investor Rights Agreement holds registrable securities such securities have been otherwise transferred, new certificates or book entry positions for such securities not bearing a legend restricting further transfer have been delivered by us and subsequent public distribution of such securities does not require registration under the Securities Act; (iii) such securities shall have ceased to be outstanding; (iv) such securities have been sold to, or through, a broker, dealer or underwriter in a public distribution or other public securities transaction; or (v) with respect to a Selling Securityholder that is party to the Amended and Restated Registration Rights Agreement, when all such securities held by such Selling Securityholder could be sold without restriction on volume or manner of sale in any three-month period without registration under Rule 144. Under the Subscription Agreements, we have agreed to maintain the effectiveness of the registration statement of which this prospectus forms a part with respect to the PIPE Shares until the earliest of (i) the second anniversary of the Closing; (ii) the date on which the PIPE Investor ceases to hold any PIPE Shares; or (iii) on the first date on which each PIPE Investor is able to sell all of its PIPE Shares under Rule 144 within 90 days without limitation as to the amount of such securities that may be sold and without the requirement for us to be in compliance with the current public information requirement under Rule 144. Under the Warrant Agreement, we have agreed to maintain the effectiveness of this registration statement in respect of the shares of common stock issuable upon the exercise of the public warrants and the private placement warrants until the expiration or redemption of such warrants. We have agreed to pay all expenses in connection with this offering, other than underwriting fees, discounts, selling commissions, stock transfer taxes and certain legal expenses. The Selling Securityholders will pay, on a pro rata basis, any underwriting fees, discounts, selling commissions, stock transfer taxes and certain legal expenses relating to the offering. The Selling Securityholders may use this prospectus in connection with resales of shares of our common stock and warrants. This prospectus and any accompanying prospectus supplement will identify the Selling Securityholders, the terms of our common stock or warrants and any material relationships between us and the Selling Securityholders. The Selling Securityholders may be deemed to be underwriters under the Securities Act in connection with shares of our common stock or warrants they resell and any profits on the sales may be deemed to be underwriting discounts and commissions under the Securities Act. Unless otherwise set forth in a prospectus supplement, the Selling Securityholders will receive all the net proceeds from the resale of shares of our common stock or warrants.
The Selling Securityholders and other persons participating in the sale or distribution of the shares of the common stock will be subject to applicable provisions of the Exchange Act and the related rules and regulations adopted by the SEC, including Regulation M. This regulation may limit the timing of purchases and sales of any of the securities by the Selling Securityholders and any other person. The anti-manipulation rules under the Exchange Act may apply to sales of shares of our common stock in the market and to the activities of the Selling Securityholders and their affiliates. Furthermore, Regulation M may restrict the ability of any person engaged in the distribution of the shares of the common stock to engage in market-making activities with respect to the particular securities being distributed for a period of up to five business days before the distribution. These restrictions may affect the marketability of the shares of our common stock and the ability of any person or entity to engage in market-making activities with respect to the securities.
A Selling Securityholder that is an entity may elect to make an
in-kind
distribution of common stock or warrants to its members, partners or stockholders pursuant to the registration statement of which this prospectus is a part by delivering a prospectus, as amended or supplemented. To the extent that such transferees are not affiliates of ours, such transferees will receive freely tradable shares of common stock or warrants pursuant to the distribution effected through this registration statement.156
LEGAL MATTERS
The validity of the securities offered hereby will be passed upon for us by Akin Gump Strauss Hauer & Feld LLP and Potter Anderson & Corroon LLP. Any underwriters or agents will be advised about other issues relating to the offering by counsel to be named in the applicable prospectus supplement.
EXPERTS
The financial statements of Tailwind Two Acquisition Corp. as of December 31, 2021 and 2020 and for the period from November 18, 2020 (inception) through December 31, 2020 appearing in this proxy prospectus have been audited by WithumSmith+Brown, PC, independent registered public accounting firm, as set forth in their report thereon (which included an emphasis of matter regarding Tailwind Two Acquisition Corp.’s ability to continue as a going concern as of December 31, 2021), appearing elsewhere herein, and are included in reliance upon such report given on the authority of such firm as experts in accounting and auditing.
The consolidated financial statements of Terran Orbital Corporation as of December 31, 2021 and 2020 and for the years then ended have been so included herein in reliance on the report of KPMG LLP, independent registered public accounting firm, appearing elsewhere herein, and upon the authority of said firm as experts in auditing and accounting.
WHERE YOU CAN FIND MORE INFORMATION
We have filed with the SEC a registration statement on Form
S-1
under the Securities Act with respect to the shares of common stock and warrants offered hereby. This prospectus, which constitutes part of the registration statement, does not contain all of the information set forth in the registration statement and the exhibits and schedules thereto. For further information with respect to our company, our common stock and warrants, reference is made to the registration statement and the exhibits and any schedules filed therewith. Statements contained in this prospectus as to the contents of any contract or any other document referred to are not necessarily complete, and in each instance, we refer you to the copy of the contract or other document filed as an exhibit to the registration statement. Each of these statements is qualified in all respects by this reference.You can read our SEC filings, including the registration statement, over the internet at the SEC’s website at www.sec.gov.
We are subject to the information reporting requirements of the Exchange Act and we are required to file reports, proxy statements and other information with the SEC. These reports, proxy statements, and other information are available for inspection and copying at the SEC’s website referred to above. We also maintain a website at www.terranorbital.com, at which you may access these materials free of charge as soon as reasonably practicable after they are electronically filed with, or furnished to, the SEC. Information contained on or accessible through our website is not a part of this prospectus, and the inclusion of our website address in this prospectus is an inactive textual reference only.
157
INDEX TO FINANCIAL STATEMENTS
Page | ||||
Unaudited Condensed Consolidated Financial Statements for Terran Orbital Corporation | ||||
Consolidated Financial Statements | ||||
| F-2 | ||||
| F-3 | ||||
| F-4 | ||||
| F-6 | ||||
| F-7 | ||||
Page | ||||
Audited Consolidated Financial Statements for Tailwind Two Acquisition Corp. (now renamed Terran Orbital Corporation): | ||||
| F-33 | ||||
Consolidated Financial Statements | ||||
| F-34 | ||||
| F-35 | ||||
| F-36 | ||||
| F-37 | ||||
| F-38 | ||||
Page | ||||
Audited Consolidated Financial Statements for Terran Orbital Corporation (now renamed Terran Orbital Operating Corporation): | ||||
| F-55 | ||||
Consolidated Financial Statements | ||||
| F-56 | ||||
| F-57 | ||||
| F-58 | ||||
| F-59 | ||||
| F-60 | ||||
F-1
TERRAN ORBITAL CORPORATION
Condensed Consolidated Balance Sheets (Unaudited)
(In thousands, except share and per share amounts)
March 31, 2022 | December 31, 2021 | |||||||
Assets: | ||||||||
Cash and cash equivalents | $ | 76,654 | $ | 27,325 | ||||
Accounts receivable, net of allowance for credit losses of $883 and $945 as of March 31, 2022 and December 31, 2021, respectively | 18,626 | 3,723 | ||||||
Contract assets, net | 3,609 | 2,757 | ||||||
Inventory | 9,191 | 7,783 | ||||||
Prepaid expenses and other current assets | 6,258 | 57,639 | ||||||
Total current assets | 114,338 | 99,227 | ||||||
Property, plant and equipment, net | 38,334 | 35,530 | ||||||
Other assets | 17,316 | 639 | ||||||
Total assets | $ | 169,988 | $ | 135,396 | ||||
Liabilities, mezzanine equity and shareholders’ deficit: | ||||||||
Current portion of long-term debt | $ | 7,515 | $ | 14 | ||||
Accounts payable | 10,833 | 9,366 | ||||||
Contract liabilities | 24,204 | 17,558 | ||||||
Reserve for anticipated losses on contracts | 965 | 886 | ||||||
Accrued expenses and other current liabilities | 13,082 | 76,136 | ||||||
Total current liabilities | 56,599 | 103,960 | ||||||
Long-term debt | 94,929 | 115,134 | ||||||
Warrant liabilities | 35,616 | 5,631 | ||||||
Other liabilities | 16,995 | 2,028 | ||||||
Total liabilities | 204,139 | 226,753 | ||||||
Commitments and contingencies (Note 12) | 0 | 0 | ||||||
Mezzanine equity: | ||||||||
Redeemable convertible preferred stock - authorized 0 and 20,526,878 shares of $0.0001 par value as of March 31, 2022 and December 31, 2021, respectively; issued and outstanding shares of 0 and 10,947,686 as of March 31, 2022 and December 31, 2021, respectively | — | 8,000 | ||||||
Shareholders’ deficit: | ||||||||
Preferred stock - authorized 50,000,000 and 0 shares of $0.0001 par value as of March 31, 2022 and December 31, 2021, respectively; 0 issued and outstanding | — | — | ||||||
Common stock - authorized 300,000,000 and 151,717,882 shares of $0.0001 par value as of March 31, 2022 and December 31, 2021, respectively; issued and outstanding shares of 137,295,455 and 78,601,283 as of March 31, 2022 and December 31, 2021, respectively | 14 | 8 | ||||||
Additional paid-in capital | 234,384 | 97,737 | ||||||
Accumulated deficit | (268,560 | ) | (197,066 | ) | ||||
Accumulated other comprehensive income (loss) | 11 | (36 | ) | |||||
Total shareholders’ deficit | (34,151 | ) | (99,357 | ) | ||||
Total liabilities, mezzanine equity and shareholders’ deficit | $ | 169,988 | $ | 135,396 | ||||
The accompanying notes are an integral part of these condensed consolidated financial statements.
F-2
TERRAN ORBITAL CORPORATION
Condensed Consolidated Statements of Operations and Comprehensive Loss (Unaudited)
(In thousands, except share and per share amounts)
Three Months Ended March 31, | ||||||||
2022 | 2021 | |||||||
Revenue | $ | 13,120 | $ | 10,494 | ||||
Cost of sales | 15,953 | 9,734 | ||||||
Gross (loss) profit | (2,833 | ) | 760 | |||||
Selling, general, and administrative expenses | 30,217 | 6,673 | ||||||
Loss from operations | (33,050 | ) | (5,913 | ) | ||||
Interest expense, net | 2,923 | 907 | ||||||
Loss on extinguishment of debt | 23,141 | 70,667 | ||||||
Change in fair value of warrant and derivative liabilities | 11,853 | (34 | ) | |||||
Other expense | 403 | 15 | ||||||
Loss before income taxes | (71,370 | ) | (77,468 | ) | ||||
Provision for income taxes | 2 | 28 | ||||||
Net loss | (71,372 | ) | (77,496 | ) | ||||
Other comprehensive income (loss), net of tax: | ||||||||
Foreign currency translation adjustments | 47 | (58 | ) | |||||
Total comprehensive loss | $ | (71,325 | ) | $ | (77,554 | ) | ||
Weighted-average shares outstanding - basic and diluted | 83,643,940 | 71,431,259 | ||||||
Net loss per share - basic and diluted | $ | (0.85 | ) | $ | (1.08 | ) | ||
The accompanying notes are an integral part of these condensed consolidated financial statements.
F-
3
TERRAN ORBITAL CORPORATION
Condensed Consolidated Statements of Shareholders’ Deficit (Unaudited)
(In thousands, except share amounts)
Three Months Ended March 31, 2022 | ||||||||||||||||||||||||||||||||||||
Mezzanine Equity | Shareholders’ Deficit | |||||||||||||||||||||||||||||||||||
Redeemable Convertible Preferred Stock | Common Stock | |||||||||||||||||||||||||||||||||||
Shares | Amounts | Shares | Amounts | Additional Paid-in Capital | Accumulated Deficit | Accumulated Other Comprehensive Income (Loss) | Non- controlling Interest | Total Shareholders’ Deficit | ||||||||||||||||||||||||||||
Balance as of December 31, 2021 | 396,870 | $ | 8,000 | 2,849,414 | $ | — | $ | 97,745 | $ | (197,066 | ) | $ | (36 | ) | $ | — | $ | (99,357 | ) | |||||||||||||||||
Retroactive application of reverse recapitalization | 10,550,816 | — | 75,751,869 | 8 | (8 | ) | — | — | — | — | ||||||||||||||||||||||||||
Balance as of December 31, 2021 - Recast | 10,947,686 | $ | 8,000 | 78,601,283 | $ | 8 | $ | 97,737 | $ | (197,066 | ) | $ | (36 | ) | $ | — | $ | (99,357 | ) | |||||||||||||||||
Adoption of accounting standard, net of tax | — | — | — | — | — | (122 | ) | — | — | (122 | ) | |||||||||||||||||||||||||
Net loss | — | — | — | — | — | (71,372 | ) | — | — | (71,372 | ) | |||||||||||||||||||||||||
Other comprehensive income, net of tax | — | — | — | — | — | — | 47 | — | 47 | |||||||||||||||||||||||||||
Conversion of redeemable convertible preferred stock into common stock | (10,947,686 | ) | (8,000 | ) | 10,947,686 | 1 | 7,999 | — | — | — | 8,000 | |||||||||||||||||||||||||
Net settlement of liability-classified warrants into common stock | — | — | 694,873 | — | 7,616 | — | — | — | 7,616 | |||||||||||||||||||||||||||
Net settlement of equity-classified warrants into common stock | — | — | 22,343,698 | 2 | (2 | ) | — | — | — | — | ||||||||||||||||||||||||||
Issuance of common stock in connection with the Tailwind Two Merger and PIPE Investment, net of issuance costs | — | — | 16,114,695 | 2 | 6,926 | — | — | — | 6,928 | |||||||||||||||||||||||||||
Issuance of common stock in connection with financing transactions, net of issuance costs | — | — | 4,325,000 | 1 | 40,733 | — | — | — | 40,734 | |||||||||||||||||||||||||||
Reclassification of liability-classified warrants and derivatives to equity-classified | — | — | — | — | 11,007 | — | — | — | 11,007 | |||||||||||||||||||||||||||
Issuance of contingently issuable common stock | — | — | 4,095,569 | — | 44,887 | 44,887 | ||||||||||||||||||||||||||||||
Share-based compensation | — | — | — | — | 17,335 | — | — | — | 17,335 | |||||||||||||||||||||||||||
Exercise of stock options | — | — | 172,651 | — | 146 | — | — | — | 146 | |||||||||||||||||||||||||||
Balance as of March 31, 2022 | — | $ | — | 137,295,455 | $ | 14 | $ | 234,384 | $ | (268,560 | ) | $ | 11 | $ | — | $ | (34,151 | ) | ||||||||||||||||||
F-4
TERRAN ORBITAL CORPORATION
Condensed Consolidated Statements of Shareholders’ Deficit (Unaudited)
(In thousands, except share amounts)
Three Months Ended March 31, 2021 | ||||||||||||||||||||||||||||||||||||
Mezzanine Equity | Shareholders’ Deficit | |||||||||||||||||||||||||||||||||||
Redeemable Convertible Preferred Stock | Common Stock | |||||||||||||||||||||||||||||||||||
Shares | Amounts | Shares | Amounts | Additional Paid-in Capital | Accumulated Deficit | Accumulated Other Comprehensive Loss | Non- controlling Interest | Total Shareholders’ Deficit | ||||||||||||||||||||||||||||
Balance as of December 31, 2020 | 396,870 | $ | 8,000 | 2,439,634 | $ | — | $ | 7,454 | $ | (58,084 | ) | $ | (204 | ) | $ | 23,743 | $ | (27,091 | ) | |||||||||||||||||
Retroactive application of reverse recapitalization | 10,550,816 | — | 64,857,839 | 7 | (7 | ) | — | — | — | — | ||||||||||||||||||||||||||
Balance as of December 31, 2020 - Recast | 10,947,686 | $ | 8,000 | 67,297,473 | $ | 7 | $ | 7,447 | $ | (58,084 | ) | $ | (204 | ) | $ | 23,743 | $ | (27,091 | ) | |||||||||||||||||
Net loss | — | — | — | — | — | (77,496 | ) | — | — | (77,496 | ) | |||||||||||||||||||||||||
Other comprehensive income, net of tax | — | — | — | — | — | — | 110 | — | 110 | |||||||||||||||||||||||||||
Issuance of common stock in exchange for non-controlling interest, net of issuance costs | — | — | 10,704,772 | 1 | 23,310 | — | — | (23,743 | ) | (432 | ) | |||||||||||||||||||||||||
Issuance of warrants, net of issuance costs | — | — | — | — | 66,060 | — | — | — | 66,060 | |||||||||||||||||||||||||||
Share-based compensation | — | �� | — | — | 168 | — | — | — | 168 | |||||||||||||||||||||||||||
Exercise of stock options | — | — | 164,352 | — | 19 | — | — | — | 19 | |||||||||||||||||||||||||||
Balance as of March 31, 2021 | 10,947,686 | $ | 8,000 | 78,166,597 | $ | 8 | $ | 97,004 | $ | (135,580 | ) | $ | (94 | ) | $ | — | $ | (38,662 | ) | |||||||||||||||||
The accompanying notes are an integral part of these condensed consolidated financial statements.
F-5
TERRAN ORBITAL CORPORATION
Condensed Consolidated Statements of Cash Flows (Unaudited)
(In thousands)
Three Months Ended March 31, | ||||||||
2022 | 2021 | |||||||
Cash flows from operating activities: | ||||||||
Net loss | $ | (71,372 | ) | $ | (77,496 | ) | ||
Adjustments to reconcile net loss to net cash used in operating activities: | ||||||||
Depreciation and amortization | 846 | 671 | ||||||
Non-cash interest expense | 1,215 | 889 | ||||||
Share-based compensation expense | 17,335 | 168 | ||||||
Provision for losses on receivables and inventory | 169 | 444 | ||||||
Loss on extinguishment of debt | 23,141 | 70,667 | ||||||
Change in fair value of warrant and derivative liabilities | 11,853 | (34 | ) | |||||
Amortization of operating right-of-use | 305 | — | ||||||
Changes in operating assets and liabilities: | ||||||||
Accounts receivable, net | (15,002 | ) | (226 | ) | ||||
Contract assets | (928 | ) | (785 | ) | ||||
Inventory | (1,550 | ) | 998 | |||||
Prepaid expenses and other current assets | (1,384 | ) | 216 | |||||
Accounts payable | 2,134 | 2,202 | ||||||
Contract liabilities | 6,708 | 728 | ||||||
Reserve for anticipated losses on contracts | 79 | (52 | ) | |||||
Accrued expenses and other current liabilities | 4,032 | 1,047 | ||||||
Accrued interest | (4,803 | ) | — | |||||
Other, net | (2,078 | ) | 15 | |||||
Net cash used in operating activities | (29,300 | ) | (548 | ) | ||||
Cash flows from investing activities: | ||||||||
Purchases of property, plant and equipment | (4,030 | ) | (2,422 | ) | ||||
Net cash used in investing activities | (4,030 | ) | (2,422 | ) | ||||
Cash flows from financing activities: | ||||||||
Proceeds from long-term debt | 35,942 | 47,481 | ||||||
Proceeds from warrants and derivatives | 42,247 | 2,519 | ||||||
Proceeds from Tailwind Two Merger and PIPE Investment | 58,424 | — | ||||||
Proceeds from issuance of common stock | 14,791 | — | ||||||
Repayment of long-term debt | (27,171 | ) | (4 | ) | ||||
Payment of issuance costs | (41,681 | ) | (5,667 | ) | ||||
Proceeds from exercise of stock options | 135 | 19 | ||||||
Net cash provided by financing activities | 82,687 | 44,348 | ||||||
Effect of exchange rate fluctuations on cash and cash equivalents | (28 | ) | (66 | ) | ||||
Net increase in cash and cash equivalents | 49,329 | 41,312 | ||||||
Cash and cash equivalents at beginning of period | 27,325 | 12,336 | ||||||
Cash and cash equivalents at end of period | $ | 76,654 | $ | 53,648 | ||||
Non-cash investing and financing activities: | ||||||||
Purchases of property, plant and equipment not yet paid | $ | 211 | $ | 111 | ||||
Non-cash interest capitalized to property, plant and equipment | 555 | 121 | ||||||
Depreciation and amortization capitalized to construction in process | 77 | — | ||||||
Issuance costs not yet paid | 5,983 | 2,361 | ||||||
Non-cash exchange and extinguishment of long-term debt | 40,432 | 36,859 | ||||||
Issuance of common stock in exchange for non-controlling interest | — | 23,743 | ||||||
Conversion of redeemable convertible preferred stock into common stock | 8,000 | — | ||||||
Net settlement of liability-classified warrants into common stock | 7,616 | — | ||||||
Net settlement of equity-classified warrants into common stock | (2 | ) | — | |||||
Non-cash issuance of common stock in connection with PIPE Investment | 10,060 | — | ||||||
Non-cash issuance of common stock in connection with financing transactions | 26,304 | — | ||||||
Reclassification of liability-classified warrants and derivatives to equity-classified | 11,007 | — | ||||||
Issuance of contingently issuable common stock | 44,887 | — | ||||||
The accompanying notes are an integral part of these condensed consolidated financial statements.
F-6
TERRAN ORBITAL CORPORATION
Notes to the Condensed Consolidated Financial Statements (Unaudited)
Note 1 Organization and Summary of Significant Accounting Policies
Organization and Business
Terran Orbital Corporation, formerly known as Tailwind Two Acquisition Corp. (“Tailwind Two”), together with its wholly-owned subsidiaries (the “Company”), is a leading manufacturer of small satellites primarily serving the United States (“U.S.”) aerospace and defense industry. Through its subsidiary Tyvak Nano-Satellite Systems, Inc. (“Tyvak”), the Company providessatellite solutions by combining satellite design, production, launch planning, mission operations, and
end-to-end
in-orbit
support to meet the needs of its customers. The Company accesses the international market through both Tyvak and its Torino, Italy based subsidiary, Tyvak International S.R.L. (“Tyvak International”). Through its subsidiary PredaSAR Corporation (“PredaSAR”), the Company is developing what it believes will be the world’s largest, most advanced NextGen Earth observation constellation to provide near persistent, near real-time Earth imagery.Tailwind Two Merger
Prior to March 25, 2022, Tailwind Two was a publicly listed special purpose acquisition company incorporated as a Cayman Islands exempted company. On March 25, 2022, Tailwind Two acquired Terran Orbital Operating Corporation, formerly known as Terran Orbital Corporation (“Legacy Terran Orbital”) (the “Tailwind Two Merger”). In connection with the Tailwind Two Merger, Tailwind Two filed a notice of deregistration with the Cayman Islands Registrar of Companies and filed a certificate of incorporation and a certificate of corporate domestication with the Secretary of State of the State of Delaware, resulting in Tailwind Two becoming a Delaware corporation and changing its name from Tailwind Two to Terran Orbital Corporation. The Tailwind Two Merger resulted in Legacy Terran Orbital becoming a wholly-owned subsidiary of Terran Orbital Corporation.
As a result of the Tailwind Two Merger, all of Legacy Terran Orbital’s issued and outstanding common stock was converted into shares of Terran Orbital Corporation’s common stock using an exchange ratio of 27.585 shares of Terran Orbital Corporation’s common stock per each share of Legacy Terran Orbital’s common stock. In addition, Legacy Terran Orbital’s convertible preferred stock and certain warrants were exercised and converted into shares of Legacy Terran Orbital’s common stock immediately prior to the Tailwind Two Merger, and in turn, were converted into shares of Terran Orbital Corporation’s common stock as a result of the Tailwind Two Merger. Further, in connection with the Tailwind Two Merger, Legacy Terran Orbital’s share-based compensation plan and related share-based compensation awards were cancelled and exchanged or converted, as applicable, with a new share-based compensation plan and related share-based compensation awards of Terran Orbital Corporation.
While Legacy Terran Orbital became a wholly-owned subsidiary of Terran Orbital Corporation, Legacy Terran Orbital was deemed to be the acquirer in the Tailwind Two Merger for accounting purposes. Accordingly, the Tailwind Two Merger was accounted for as a reverse recapitalization, in which case the condensed consolidated financial statements of the Company represent a continuation of Legacy Terran Orbital and the issuance of common stock in exchange for the net assets of Tailwind Two recognized at historical cost and 0 recognition of goodwill or other intangible assets. Operations prior to the Tailwind Two Merger are those of Legacy Terran Orbital and all share and
per-share
data included in these condensed consolidated financial statements have been retroactively adjusted to give effect to the Tailwind Two Merger. In addition, the number of shares subject to, and the exercise price of, the Company’s outstanding options and warrants were adjusted to reflect the Tailwind Two Merger. The treatment of the Tailwind Two Merger as a reverse recapitalization was based upon thepre-merger
shareholders of Legacy Terran Orbital holding the majority of the voting interests of Terran Orbital Corporation, Legacy Terran Orbital’s existing management team serving as the initial management team of Terran Orbital Corporation, Legacy Terran Orbital’s appointment of the majority of the initial board of directors of Terran Orbital Corporation, and Legacy Terran Orbital’s operations comprising the ongoing operations of the Company.In connection with the Tailwind Two Merger, approximately $29 million of cash and marketable securities held in trust, net of redemptions by Tailwind Two’s public shareholders, became available for use by the Company as well as proceeds received from the contemporaneous sale of common stock in connection with the closing of a PIPE investment with a contractual amount of $51 million (the “PIPE Investment”). In addition, the Company received additional proceeds from the issuance of debt contemporaneously with the Tailwind Two Merger. The aggregate cash raised will be used for general corporate purposes, the partial paydown of debt, the payment of transaction costs and the payment of other costs directly or indirectly attributable to the Tailwind Two Merger.
Beginning on March 28, 2022, the Company’s common stock and public warrants began trading on the New York Stock Exchange (the “NYSE”) under the symbols “LLAP” and “LLAP WS,” respectively.
F-7
TERRAN ORBITAL CORPORATION
Notes to the Condensed Consolidated Financial Statements (Unaudited)
Further information regarding the Tailwind Two Merger is included in the respective notes that follow.
Basis of Presentation and Significant Accounting Policies
The preparation of the condensed consolidated financial statements in accordance with generally accepted accounting principles in the U.S. (“GAAP”) requires the Company to select accounting policies and make estimates that affect amounts reported in the condensed consolidated financial statements and the accompanying notes. The Company’s estimates are based on the relevant information available at the end of each period. Actual results could differ materially from these estimates under different assumptions or market conditions.
The condensed consolidated financial statements included herein are unaudited, but in the opinion of management, they include all adjustments, consisting of normal recurring adjustments, necessary to summarize fairly the Company’s financial position, results of operations, and cash flows for the interim periods presented. The interim results reported in these condensed consolidated financial statements should not be taken as indicative of results that may be expected for future interim periods or the full year. For a more comprehensive understanding of the Company and its interim results, these condensed consolidated financial statements should be read in conjunction with Legacy Terran Orbital’s audited consolidated financial statements as of and for the years ended December 31, 2021 and 2020 included in the registration statement on Form
S-1
filed with the U.S. Securities and Exchange Commission (the “SEC”) on April 22, 2022 (the “FormS-1”).
The Company’s accounting policies used in the preparation of these condensed consolidated financial statements do not differ from those used for the annual consolidated financial statements of Legacy Terran Orbital, unless otherwise noted. The condensed consolidated balance sheet as of December 31, 2021 included herein was derived from the audited consolidated financial statements of Legacy Terran Orbital as of that date but does not include all the footnote disclosures from the annual consolidated financial statements.
The condensed consolidated financial statements include the accounts of Terran Orbital Corporation and its subsidiaries, and have been prepared in U.S. dollars in accordance with GAAP. All intercompany transactions have been eliminated.
COVID-19
PandemicDuring March 2020, the World Health Organization declared the outbreak of a novel coronavirus as a pandemic (the
“COVID-19
Pandemic”), which has become increasingly widespread across the globe. TheCOVID-19
Pandemic has negatively impacted the global economy, disrupted global supply chains, and created significant volatility and disruption in the financial and capital markets.The
COVID-19
Pandemic has contributed to a worldwide shortage of electronic components which has resulted in longer than historically experienced lead times for such electronic components. The reduced availability to receive electronic components used in the Company’s operations has negatively affected its timing and ability to deliver products and services to customers as well as increased its costs in recent periods. The Company considered the emergence and pervasive economic impact of theCOVID-19
Pandemic in its assessment of its financial position, results of operations, cash flows, and certain accounting estimates as of and for the three months ended March 31, 2022. Due to the evolving and uncertain nature of theCOVID-19
Pandemic, it is possible that the effects of theCOVID-19
Pandemic could materially impact the Company’s estimates and condensed consolidated financial statements in future reporting periods.Cash and Cash Equivalents
Cash and cash equivalents consist of cash on hand and highly liquid investments with original maturities of three months or less from the time of purchase.
F-
8
TERRAN ORBITAL CORPORATION
Notes to the Condensed Consolidated Financial Statements (Unaudited)
Prepaid Expenses and Other Current Assets
Prepaid expenses and other current assets consisted of the following as of the dates presented:
(in thousands) | March 31, 2022 | December 31, 2021 | ||||||
Deferred debt commitment costs | $ | — | $ | 46,632 | ||||
Deferred equity issuance costs | — | 6,085 | ||||||
Deferred cost of sales | 1,585 | 2,950 | ||||||
Other current assets | 4,673 | 1,972 | ||||||
Prepaid expenses and other current assets | $ | 6,258 | $ | 57,639 | ||||
Deferred debt commitment costs relate to warrants and other consideration transferred in association with a financing arrangement entered into in anticipation of the Tailwind Two Merger. The deferred debt commitment costs were reclassified to discount on debt and deferred issuance costs in connection with the issuance of the associated debt in March 2022. Refer to Note 5 “Debt” and Note 6 “Warrants and Derivatives” for further discussion.
Deferred equity issuance costs relate to direct and incremental legal, accounting, and other transaction costs incurred in connection with the Tailwind Two Merger. Upon closing of the Tailwind Two Merger, the deferred equity issuance costs were reclassified as a reduction to additional
paid-in
capital. Payments associated with deferred equity issuance costs are reflected in payment of issuance costs in the condensed consolidated statements of cash flows.Accrued Expenses and Other Current Liabilities
Accrued expenses and other current liabilities consisted of the following as of the dates presented:
(in thousands) | March 31, 2022 | December 31, 2021 | ||||||
Current warrant and derivative liabilities (1) | $ | — | $ | 68,518 | ||||
Payroll-related accruals | 8,547 | 5,771 | ||||||
Current operating lease liabilities | 834 | — | ||||||
Accrued interest | 298 | — | ||||||
Other current liabilities | 3,403 | 1,847 | ||||||
Accrued expenses and other current liabilities | $ | 13,082 | $ | 76,136 | ||||
| (1) | Refer to Note 6 “Warrants and Derivatives” for further discussion. |
Research and Development
Research and development includes materials, labor, and overhead allocations attributable to the development of new products and solutions and significant improvements to existing products and solutions. Research and development costs are expensed as incurred and recognized in selling, general, and administrative expenses in the condensed consolidated statements of operations and comprehensive loss. Research and development expense was $1.9 million and $340 thousand during the three months ended March 31, 2022 and 2021, respectively.
Concentration of Credit Risks
Financial instruments that potentially subject the Company to concentrations of credit risk consist primarily of cash and cash equivalents and accounts receivable.
The majority of the Company’s cash and cash equivalents are held at major financial institutions. Certain account balances exceed the Federal Deposit Insurance Corporation insurance limits of $250,000 per account. As a result, there is a concentration of credit risk related to amounts in excess of the insurance limits. The Company regularly monitors the financial stability of these financial institutions and believes that there is no exposure to any significant credit risk in cash and cash equivalents.
F-
9
TERRAN ORBITAL CORPORATION
Notes to the Condensed Consolidated Financial Statements (Unaudited)
Concentrations of credit risk with respect to accounts receivable are limited because the Company performs credit evaluations, sets credit limits, and monitors the payment patterns of its customers.
The table below presents individual customers who accounted for more than 10% of the Company’s revenue for the periods presented:
Three Months Ended March 31, | ||||||||
2022 | 2021 | |||||||
Customer A | 77 | % | 37 | % | ||||
Customer B | 1 | % | 16 | % | ||||
Total | 78 | % | 53 | % | ||||
The table below presents individual customers who accounted for more than 10% of the Company’s accounts receivable, net of allowance for credit losses, as of the dates presented:
March 31, 2022 | December 31, 2021 | |||||||
Customer A | 82 | % | 14 | % | ||||
Customer B | 6 | % | 32 | % | ||||
Customer C | 3 | % | 13 | % | ||||
Customer D | 2 | % | 19 | % | ||||
Customer E | 2 | % | 10 | % | ||||
Total | 95 | % | 88 | % | ||||
Recently Adopted Accounting Pronouncements
Financial Accounting Standards Board (“FASB”) Accounting Standards Update (“ASU”), and related amendments, introduces new guidance which makes substantive changes to the accounting for credit losses. This guidance introduces the current expected credit losses model (“CECL”) which applies to financial assets subject to credit losses and measured at amortized cost, as well as certain
2016-13,
Financial Instruments – Credit Losses (Topic 326): Measurement of Credit Losses on Financial Instrument
off-balance
sheet credit exposures. The CECL model requires an entity to estimate credit losses expected over the life of an exposure, considering information about historical events, current conditions, and reasonable and supportable forecasts and is generally expected to result in earlier recognition of credit losses. The Companyadopted
this guidance on January 1, 2022 using the modified retrospective approach and recognized a cumulative effect adjustment to the opening balance of accumulated deficit with no restatement of comparative periods. The impact of adoption was not material.Lease Accounting
ASU, and related amendments, requires lessees to recognize aasset and lease liability for substantially all leases and to disclose key information about leasing arrangements. The Company
2016-02
,
Leases (Topic 842)
right-of-use
adopted
the guidance on January 1, 2022 using the optional transition method, which allowed the Company to apply the guidance at the adoption date and recognize a cumulative effect adjustment to the opening balance of accumulated deficit in the period of adoption with no restatement of comparative periods. The Company has also elected to apply the package of transitional practical expedients under which the Company did not reassess prior conclusions about lease identification, lease classification, and initial direct costs of existing leases as of the date of adoption. Additionally, the Company has elected the practical expedients to not separatenon-lease
components from lease components. The Company did not elect to apply the practical expedient related to short-term lease recognition exemption.Upon transition to the guidance as of the date of adoption, the Company recognized operating lease liabilities on the condensed consolidated balance sheets with a corresponding amount ofassets, net of amounts reclassified from other assets and liabilities as specified by the guidance. The adoption did not have a material effect on the condensed consolidated statements of operations and comprehensive loss or cash flows. Refer to Note 15 “Leases” for further discussion.
right-of-use
F-
10
TERRAN ORBITAL CORPORATION
Notes to the Condensed Consolidated Financial Statements (Unaudited)
The net impact of the adoption to the condensed consolidated balance sheet was as follows:
(in thousands) | December 31, 2021 | Lease Standard Adoption Adjustment | January 1, 2022 | |||||||||
Assets | ||||||||||||
Other assets | $ | 639 | $ | 6,550 | $ | 7,189 | ||||||
Liabilities | ||||||||||||
Accrued expenses and other current liabilities | 76,136 | 166 | 76,302 | |||||||||
Other liabilities | 2,028 | 6,384 | 8,412 | |||||||||
Note 2 Revenue and Receivables
The Company applies the following five steps in order to recognize revenue from contracts with customers: (i) identify the contract(s) with a customer; (ii) identify the performance obligation(s) in the contract; (iii) determine the transaction price; (iv) allocate the transaction price to the performance obligation(s) in the contract; and (v) recognize revenue when (or as) the entity satisfies a performance obligation. The Company only applies the five-step model to contracts when it is probable that the entity will collect the consideration it is entitled to in exchange for the goods or services it transfers to the customer.
At contract inception, the Company assesses whether the goods or services promised within the contract represent a performance obligation. A performance obligation is a promise in a contract to transfer a distinct good or service to the customer. For contracts with multiple performance obligations, the Company allocates the contract’s transaction price to each performance obligation on a relative basis using the best estimate of the stand-alone selling price of each performance obligation, which is estimated using the expected-cost-plus-margin approach. Generally, the Company’s contracts with customers are structured such that the customer has the option to purchase additional goods or services. Customer options to purchase additional goods or services do not represent a separate performance obligation as the prices for such options reflect the stand-alone selling prices for the additional goods or services. The majority of the Company’s contracts with customers have a single performance obligation.
The Company recognizes the transaction price allocated to the respective performance obligation as revenue as the performance obligation is satisfied. The majority of the Company’s contracts with customers relate to the creation of specialized assets that do not have alternative use and entitle the Company to an enforceable right to payment for performance completed to date. Accordingly, the Company generally measures progress towards the satisfaction of a performance obligation over time using theinput method.
cost-to-cost
Payments for costs not yet incurred or for costs incurred in anticipation of providing a good or service under a contract with a customer in the future are included in prepaid expenses and other current assets on the condensed consolidated balance sheets.
Estimate-at-Completion
As the majority of the Company’s revenue is recognized over time using theinput method, the recognition of revenue and the estimate ofis complex, subject to many variables and requires significant judgment.
cost-to-cost
cost-at-completion
EAC represents the total estimatedand is comprised of direct material, direct labor and manufacturing overhead applicable to a performance obligation. There is a company-wide standard and periodic EAC process in which the Company reviews the progress and execution of outstanding performance obligations. As part of this process, the Company reviews information including, but not limited to, any outstanding key contract matters, progress towards completion and the related program schedule, identified risks and opportunities and the related changes in estimates of revenues and costs. The risks and opportunities include the Company’s judgment about the ability and cost to achieve the schedule (e.g., the number and type of milestone events), technical requirements (e.g., a newly-developed product versus a mature product) and other contract requirements. The Company must make assumptions and estimates regarding labor productivity and availability, the complexity of the work to be performed, the availability of materials, the length of time to complete the performance obligation (e.g., to estimate increases in wages and prices for materials and related support cost allocations), execution by subcontractors, the availability and timing of funding from customers and overhead cost rates, among other variables.
cost-at-completion
F-11
TERRAN ORBITAL CORPORATION
Notes to the Condensed Consolidated Financial Statements (Unaudited)
Based on the results of the periodic EAC process, any adjustments to revenue, cost of sales, and the related impact to gross profit are recognized on a cumulative
catch-up
basis in the period they become known. These adjustments may result from positive program performance, and may result in an increase in gross profit during the performance of individual performance obligations, if it is determined the Company will be successful in mitigating risks surrounding the technical, schedule and cost aspects of those performance obligations or realizing related opportunities. Likewise, these adjustments may result in a decrease in gross profit if it is determined the Company will not be successful in mitigating these risks or realizing related opportunities. A significant change in one or more of these estimates could affect the profitability of one or more of the Company’s performance obligations.Contract modifications often relate to changes in contract specifications and requirements. Contract modifications are considered to exist when the modification either creates new or changes the existing enforceable rights and obligations. Most of the Company’s contract modifications are for goods or services that are not distinct from the existing contract due to the significant integration service provided in the context of the contract and are accounted for as if they were part of that existing contract. The effect of a contract modification on the transaction price, and the measure of progress for the performance obligation to which it relates, is recognized as an adjustment to revenue either as an increase in or a reduction of revenue on a cumulative
catch-up
basis.Some of the Company’s long-term contracts contain award fees, incentive fees, or other provisions that can either increase or decrease the transaction price. These variable amounts generally are awarded upon achievement of certain performance metrics, program milestones or cost targets and can be based upon customer discretion. Variable consideration is estimated at the most likely amount to which the Company is expected to be entitled. Estimated amounts are included in the transaction price to the extent it is probable that a significant reversal of cumulative revenue recognized will not occur when the uncertainty associated with the variable consideration is resolved. Estimates of variable consideration and determination of whether to include estimated amounts in the transaction price are based largely on an assessment of the Company’s anticipated performance and all information (historical, current, and forecasted) that is reasonably available. The unfunded portion of enforceable contracts are accounted for as variable consideration.
Disaggregation of Revenue
Below is a summary of the Company’s accounting by type of revenue:
| • | Mission Support: Mission support services primarily relate to the integrated design, manufacture and final assembly of satellites for government and commercial entities. Revenue associated with mission support services is recognized over time using the cost-to-cost |
| • | Launch Support: Launch support services relates to the design and manufacture of deployment systems in order to launch satellites for government and commercial customers. In addition, the Company will assist in the launch of a satellite into space by coordinating and securing launch opportunities with launch providers on behalf of a customer. Revenue associated with launch support services is recognized over time using the cost-to-cost |
| • | Operations: Operations relates to the monitoring or operation of satellites in orbit on behalf of a customer. Revenue associated with operations is recognized monthly at a fixed contractual rate. Accordingly, the revenue is recognized in proportion to the amount it has the right to invoice for services performed. |
| • | Studies, Design and Other: Studies, design and other services primarily relate to special consulting studies and other design projects for government and commercial entities. Revenue associated with studies, design and other services is primarily recognized over time using the cost-to-cost |
F-12
TERRAN ORBITAL CORPORATION
Notes to the Condensed Consolidated Financial Statements (Unaudited)
The following tables presents the Company’s disaggregated revenue by offering and customer type for the periods presented:
Three Months Ended March 31, | ||||||||
(in thousands) | 2022 | 2021 | ||||||
Mission support | $ | 12,770 | $ | 8,747 | ||||
Launch support | 36 | 692 | ||||||
Operations | 192 | 644 | ||||||
Studies, design and other | 122 | 411 | ||||||
Revenue | $ | 13,120 | $ | 10,494 | ||||
Three Months Ended March 31, | ||||||||
(in thousands) | 2022 | 2021 | ||||||
U.S. Government contracts | ||||||||
Fixed price | $ | 8,492 | $ | 5,478 | ||||
Cost-plus fee | 2,272 | 676 | ||||||
| 10,764 | 6,154 | |||||||
Foreign government contracts | ||||||||
Fixed price | 556 | 543 | ||||||
Commercial contracts | ||||||||
Fixed price, U.S. | 1,650 | 2,192 | ||||||
Fixed price, International | 150 | 1,577 | ||||||
Cost-plus fee | — | 28 | ||||||
| 1,800 | 3,797 | |||||||
Revenue | $ | 13,120 | $ | 10,494 | ||||
For contracts in which the U.S. Government is the ultimate customer, the Company follows U.S. Government procurement and accounting standards in assessing the allowability and the allocability of costs to contracts. Due to the significance of the judgments and estimation processes, it is likely that materially different amounts could be recorded if different assumptions were used or if the underlying circumstances were to change. The Company monitors the consistent application of its critical accounting policies and compliance with contract accounting. Business operations personnel conduct periodic contract status and performance reviews. When adjustments in estimated contract revenues or costs are determined, any material changes from prior estimates are included in earnings in the current period. Also, regular and recurring evaluations of contract cost, scheduling and technical matters are performed by Company personnel who are independent from the business operations personnel performing work under the contract. Costs incurred and allocated to contracts with the U.S. Government are subject to audit by the Defense Contract Audit Agency for compliance with regulatory standards.
Remaining Performance Obligations
Revenue from remaining performance obligations is calculated as the aggregate amount of the transaction price allocated to performance obligations that are unsatisfied (or partially unsatisfied) as of the end of the reporting period on executed contracts, including both funded (firm orders for which funding is authorized and appropriated) and unfunded portions of such contracts. Remaining performance obligations exclude contracts in which the Company recognizes revenue in proportion to the amount it has the right to invoice for services performed and does not include unexercised contract options and potential orders under indefinite delivery/indefinite quantity contracts.
As of March 31, 2022, the Company had approximately $221.8 million of remaining performance obligations. The Company estimates that approximately 98% of the remaining performance obligations as of March 31, 2022 will be completed and recognized as revenue by December 31, 2023, with the rest thereafter.
F-13
TERRAN ORBITAL CORPORATION
Notes to the Condensed Consolidated Financial Statements (Unaudited)
Contract Assets and Contract Liabilities
For each of the Company’s contracts with customers, the timing of revenue recognition, customer billings, and cash collections results in a net contract asset or liability at the end of each reporting period.
Fixed-price contracts are typically billed to the customer either using progress payments, whereby amounts are billed monthly as costs are incurred or work is completed, or performance-based payments, which are based upon the achievement of specific, measurable events or accomplishments defined and valued at contract inception. Cost-type contracts are typically billed to the customer on a monthly or semi-monthly basis.
Contract assets
Contract assets relate to instances in which revenue recognized exceeds amounts billed to customers. Contract assets are reclassified to accounts receivable when the Company has an unconditional right to the consideration and bills the customer. Contract assets are classified as current and
non-current
based on the estimated timing in which the Company will bill the customer. Contract assets are not considered to include a significant financing component as the payment terms are intended to protect the customer in the event the Company does not perform on its obligations under the contract.The Company records an allowance for credit losses against its contract assets for amounts not expected to be recovered. The allowance is recognized at inception and is reassessed each reporting period. The allowance for credit losses on contract assets was not material for the periods presented.
The following is a summary of contract assets, net, recognized in the condensed consolidated balance sheets as of the dates presented:
(in thousands) | March 31, 2022 | January 1, 2022 (1) | ||||||
Contract assets, gross | $ | 3,685 | $ | 2,757 | ||||
Allowance for credit losses | (76 | ) | (82 | ) | ||||
Contract assets, net | $ | 3,609 | $ | 2,675 | ||||
| (1) | Balances reflected are subsequent to the adoption of CECL on January 1, 2022. |
As of March 31, 2022 and December 31, 2021, all contract assets were classified as current assets.
There were 0 material impairments of contract assets during the three months ended March 31, 2022 or 2021.
Contract liabilities
Contract liabilities relate to advance payments and billings in excess of revenue recognized. Contract liabilities are recognized into revenue as the Company satisfies the underlying performance obligations. Contract liabilities are classified as current and
non-current
based on the estimating timing in which the Company will satisfy the underlying performance obligations. Contract liabilities are not considered to include a significant financing component as they are generally utilized to procure materials needed to satisfy a performance obligation or are used to ensure the customer meets contractual requirements.As of March 31, 2022 and December 31, 2021, all contract liabilities were classified as current liabilities.
During the three months ended March 31, 2022 and 2021, the Company recognized revenue of $9.6 million and $7.2 million, respectively, that was previously included in the beginning balance of contract liabilities.
F-14
TERRAN ORBITAL CORPORATION
Notes to the Condensed Consolidated Financial Statements (Unaudited)
Accounts Receivable
Accounts receivable represent unconditional rights to consideration due from customers in the ordinary course of business and are generally due in one year or less. Accounts receivable are recorded at amortized cost less an allowance for credit losses, which is based on the Company’s assessment of the collectability of its accounts receivable. The Company reviews the adequacy of the allowance for credit losses by considering the age of each outstanding invoice and the collection history of each customer. Accounts receivable that are deemed uncollectible are charged against the allowance for credit losses when identified.
Receivables from products and services for which the U.S. Government is the ultimate customer included in accounts receivable was $16.3 million and $2.1 million as of March 31, 2022 and December 31, 2021, respectively.
The following table presents changes in the allowance for credit losses for the periods presented:
Three Months Ended March 31, | ||||||||
(in thousands) | 2022 | 2021 | ||||||
Beginning balance | $ | (945 | ) | $ | (635 | ) | ||
Adoption of CECL | (39 | ) | — | |||||
Provision for credit losses | (26 | ) | (99 | ) | ||||
Write-offs | 127 | 3 | ||||||
Ending balance | $ | (883 | ) | $ | (731 | ) | ||
Reserve for Anticipated Losses on Contracts
When the estimatedexceeds the estimated revenue to be earned for a performance obligation, the Company records a reserve for the anticipated losses in the period the loss is determined. The reserve for anticipated losses on contracts is presented as a current liability in the condensed consolidated balance sheets and as a component of cost of sales in the condensed consolidated statements of operations and comprehensive loss in accordance with ASC.
cost-at-completion
605-35,
Revenue Recognition – Construction-Type and Production-Type Contracts
During the three months ended March 31, 2022, the Company increased the reserve for anticipated losses on contracts by $79 thousand. During the three months ended March 31, 2021, the Company decreased the reserve for anticipated losses on contracts by $52 thousand.
Note 3 Inventory
Inventory consists of parts andbasis. Inventory is presented net of an allowance for losses associated with excess and obsolete items, which is estimated based on the Company’s current knowledge with respect to inventory levels, planned production and customer demand.
sub-assemblies
that are ultimately consumed in the manufacturing and final assembly of satellites. When an item in inventory has been identified and incorporated into a specific satellite, the cost of thesub-assembly
is charged to cost of goods sold in the condensed consolidated statements of operations and comprehensive loss. Inventory is measured at the lower of cost or net realizable value. The cost of inventory includes direct material, direct labor and manufacturing overhead and is determined on afirst-in-first-out
The components of inventory as of the dates presented were as follows:
(in thousands) | March 31, 2022 | December 31, 2021 | ||||||
Raw materials | $ | 5,994 | $ | 4,782 | ||||
Work in process | 3,197 | 3,001 | ||||||
Total inventory | $ | 9,191 | $ | 7,783 | ||||
Note 4 Property, Plant and Equipment, net
Property, plant and equipment, net is stated at historical cost less accumulated depreciation. Cost for company-owned satellite assets includes amounts related to design, construction, launch and commission. Cost for ground stations includes amounts related to construction and testing. Interest is capitalized on certain qualifying assets that take a substantial period of time to develop for their intended use. Depreciation expense is calculated using thedigits or straight-line method over the estimated useful lives of the related assets as follows:
sum-of-the-years’
F-15
TERRAN ORBITAL CORPORATION
Notes to the Condensed Consolidated Financial Statements (Unaudited)
| Machinery and equipment | 5-7 years | |
| Satellites | 3-5 years | |
| Ground station equipment | 5-7 years | |
| Office equipment and furniture | 5-7 years | |
| Computer equipment and software | 3-5 years | |
| Leasehold improvements | Shorter of the estimated useful life or remaining lease term |
The determination of the estimated useful life of satellites involves an analysis that considers design life, random part failure probabilities, expected component degradation and cycle life, predicted fuel consumption and experience with satellite parts, vendors and similar assets.
Depreciation expense was $846 thousand and $671 thousand during the three months ended March 31, 2022 and 2021, respectively. Repairs and maintenance expenditures are expensed when incurred.
The gross carrying amount, accumulated depreciation and net carrying amount of property, plant and equipment, net as of the dates presented were as follows:
(in thousands) | March 31, 2022 | December 31, 2021 | ||||||
Machinery and equipment | $ | 7,595 | $ | 7,607 | ||||
Satellites | 2,209 | 2,209 | ||||||
Ground station equipment | 1,944 | 1,944 | ||||||
Office equipment and furniture | 2,292 | 2,239 | ||||||
Computer equipment and software | 141 | 142 | ||||||
Leasehold improvements | 8,911 | 8,533 | ||||||
Construction in process | 26,959 | 23,647 | ||||||
Property, plant and equipment, gross | 50,051 | 46,321 | ||||||
Accumulated depreciation | (11,717 | ) | (10,791 | ) | ||||
Property, plant and equipment, net | $ | 38,334 | $ | 35,530 | ||||
Construction in process included company-owned satellites, ground station equipment and machinery not yet placed into service.
The Company reviews property, plant and equipment, net for impairment whenever events or changes in business circumstances indicate that the net carrying amount of an asset or asset group may not be fully recoverable. The Company groups assets at the lowest level for which cash flows are separately identified. Recoverability is measured by a comparison of the net carrying amount of the asset group to its expected future undiscounted cash flows. If the expected future undiscounted cash flows of the asset group are less than its net carrying amount, an impairment loss is recognized based on the amount by which the net carrying amount exceeds the fair value less costs to sell. The calculation of the fair value less costs to sell of an asset group is based on assumptions concerning the amount and timing of estimated future cash flows and assumed discount rates, reflecting varying degrees of perceived risk.
There were 0 impairments of property, plant and equipment during the three months ended March 31, 2022 and 2021.
F-16
TERRAN ORBITAL CORPORATION
Notes to the Condensed Consolidated Financial Statements (Unaudited)
Note 5 Debt
Long-term debt as of the presented dates was comprised of the following:
(in thousands)
Description | Issued | Maturity | Interest Rate | Interest Payable | March 31, 2022 | December 31, 2021 | ||||||||||||||||||
Francisco Partners Facility | November 2021 | April 2026 | 9.25% | Quarterly | $ | 120,023 | $ | 30,289 | ||||||||||||||||
Senior Secured Notes due 2026 (1) | March 2021 | April 2026 | | 9.25% and 11.25% | | Quarterly | 56,267 | 94,686 | ||||||||||||||||
PIPE Investment Obligation | March 2022 | | December 2025 | N/A | N/A | 28,125 | — | |||||||||||||||||
Finance leases | N/A | N/A | N/A | N/A | 49 | 53 | ||||||||||||||||||
Unamortized deferred issuance costs | (2,115) | (761) | ||||||||||||||||||||||
Unamortized discount on debt | (99,905) | (9,119) | ||||||||||||||||||||||
Total debt | 102,444 | 115,148 | ||||||||||||||||||||||
Current portion of long-term debt | 7,515 | 14 | ||||||||||||||||||||||
Long-term debt | $ | 94,929 | $ | 115,134 | ||||||||||||||||||||
(1) - Includes the Lockheed Martin Rollover Debt and Beach Point Rollover Debt, each as defined below.
N/A - Not meaningful or applicable
Significant changes in the Company’s debt during the three months ended March 31, 2022 were as follows:
Francisco Partners Facility
On March 9, 2022, the Company amended the note purchase agreement (the “FP Note Purchase Agreement”) governing the issuance and sale of senior secured notes due on November 24, 2026 (the “Francisco Partners Facility”) to, among other things, (i) increase the principal amount of senior secured notes that may be issued under the FP Note Purchase Agreement to up to $154 million, (ii) increase the second tranche of the Francisco Partners Facility (the “Delayed Draw Notes”) to $24 million of senior secured notes, and (iii) accelerate the funding of the Delayed Draw Notes. The Delayed Draw Notes were issued net of a $4 million original issue discount and resulted in proceeds received of $20 million, of which $8.6 million was allocated to proceeds from debt and $11.4 million was allocated to proceeds from warrants and derivatives in the condensed consolidated statements of cash flows. The Company reclassified deferred debt commitment costs of $13.2 million to discount on debt and $137 thousand to deferred issuance costs related to the issuance of the Delayed Draw Notes. The Company incurred an incremental $208 thousand of deferred issuance costs related to the issuance of the Delayed Draw Notes.
On March 25, 2022, the Company further amended the FP Note Purchase Agreement to, among other things, (i) decrease the principal amount of senior secured notes that may be issued under the Francisco Partners Facility to up to $119 million, (ii) amend certain existing covenants, as described below, (iii) add an additional covenant, as described below, (iv) revise the maturity date to April 1, 2026, and (v) change the timing of quarterly interest payments to May 15th, August 15th, November 15th and February 15th of each calendar year, with the first such interest payment required to be made on May 15, 2022. As consideration for the amendment on March 25, 2022, Francisco Partners received an additional 1.9 million shares of Terran Orbital Corporation’s common stock in connection with the Tailwind Two Merger. Upon closing of the Tailwind Two Merger, the Company issued $65 million of senior secured notes as the third tranche of the Francisco Partners Facility (the “Conditional Notes”). The Conditional Notes were issued net of a $5 million original issue discount and resulted in proceeds received of $60 million, of which $14.4 million was allocated to proceeds from debt, $30.8 million was allocated to proceeds from warrants and derivatives, and $14.8 million was allocated to proceeds from the issuance of common stock in the condensed consolidated statements of cash flows. The Company reclassified deferred debt commitment costs of $32.8 million to discount on debt and $509 thousand to deferred issuance costs upon the issuance of the Conditional Notes. The Company incurred an incremental $851 thousand of issuance costs related to the issuance of the Conditional Notes, of which $641 thousand was allocated to debt and $210 thousand was allocated to equity.
F-17
TERRAN ORBITAL CORPORATION
Notes to the Condensed Consolidated Financial Statements (Unaudited)
As part of the amendment on March 25, 2022, the liquidity maintenance financial covenant of the Francisco Partners Facility was modified to require that as of the last day of each fiscal quarter, the Company must have an aggregate amount of unrestricted cash and cash equivalents of at least (i) $20 million in the case of the fiscal quarters ending March 31, 2022, June 30, 2022 and September 30, 2022, (ii) $10 million in the case of the fiscal quarter ending December 31, 2022 and (iii) $20 million plus 15% of certain aggregate funded indebtedness of the Company in the case of each fiscal quarter thereafter. In addition, a new covenant was added requiring the Company to at least break even on an EBITDA basis (as defined in the FP Note Purchase Agreement) by December 31, 2023, subject to certain extensions.
As of March 31, 2022 and December 31, 2021, approximately $1.0 million and $289 thousand of contractual interest was included in the outstanding principal balance of the Francisco Partners Facility, respectively.
Senior Secured Notes due 2026
On March 8, 2021, the Company issued $87 million aggregate principal amount of senior secured notes due April 1, 2026 (the “Senior Secured Notes due 2026”) which resulted in gross proceeds of $50 million from Lockheed Martin Corporation (“Lockheed Martin”) and the exchange and extinguishment of $37 million then outstanding convertible notes. The loss on extinguishment of debt totaled $70.6 million and primarily related to the recognition of warrants issued at fair value. The Company allocated $47.5 million of the proceeds received to the Senior Secured Notes due 2026 and the remainder of the proceeds were allocated to warrants issued upon funding of the Senior Secured Notes due 2026 in the condensed consolidated statements of cash flows. Refer to Note 6 “Warrants and Derivatives” for further discussion regarding warrants.
On March 25, 2022, the Senior Secured Notes due 2026 were impacted as follows:
Exchange of Debt for Equity
In connection with the PIPE Investment, two holders of the Senior Secured Notes due 2026 agreed to, in substance, exchange the outstanding amount of principal and interest for common stock of Terran Orbital Corporation with any residual amounts settled in cash, resulting in a loss on extinguishment of debt of $727 thousand related to $4.6 million carrying amount of Senior Secured Notes due 2026 on March 25, 2022. The consideration transferred as part of the extinguishment included common stock with a fair value of $4.6 million and a cash payment of $703 thousand, of which $293 thousand represents financing cash flows related to the repayment of debt and $410 thousand represents operating cash flows related to the payment of interest in the condensed consolidated statements of cash flows.
Rollover Debt
On March 25, 2022, the note purchase agreement governing the Senior Secured Notes due 2026 was amended to, among other things, (i) set the amount of senior secured notes that will remain outstanding with Lockheed Martin subsequent to the Tailwind Two Merger to $25 million (the “Lockheed Martin Rollover Debt”), (ii) increase and set the amount of senior secured notes that will remain outstanding with Beach Point Capital (“Beach Point”) subsequent to the Tailwind Two Merger to $31.3 million (the “Beach Point Rollover Debt”), (iii) set the terms of the Lockheed Martin Rollover Debt and the Beach Point Rollover Debt to have substantially similar terms as the terms in the Francisco Partners Facility, excluding call protection and the Beach Point Rollover Debt bearing interest at 11.25% (9.25% of which is payable in cash and 2.0% of which is payable in kind), and (iv) cause the Beach Point Rollover Debt to be subordinated in right of payment to the Francisco Partners Facility.
In connection with the Tailwind Two Merger, the Company partially extinguished Lockheed Martin’s portion of the Senior Secured Notes due 2026, resulting in a gain on extinguishment of debt of $1.8 million related to $32.6 million carrying amount, inclusive of an unamortized premium, of Senior Secured Notes due 2026 on March 25, 2022. The consideration transferred as part of the partial extinguishment included a cash payment of $30.8 million, of which $25 million represents financing cash flows related to the repayment of debt and $5.8 million represents operating cash flows related to the payment of interest in the condensed consolidated statements of cash flows. In addition, the Lockheed Martin Rollover Debt represents a modification of Lockheed Martin’s portion of the Senior Secured Notes due 2026. The Company expensed $323 thousand of third-party expenses related to the modification.
In connection with the PIPE Investment and the amendment on March 25, 2022, Beach Point agreed to, in substance, exchange a portion of the outstanding amount of principal and interest for common stock of Terran Orbital Corporation with the remainder representing the Beach Point Rollover Debt. As consideration for the amendment on March 25, 2022, Beach Point received an additional 2.4 million shares of Terran Orbital Corporation’s common stock as part of the Tailwind Two Merger. Accordingly, Beach Point’s portion of the
F-18
TERRAN ORBITAL CORPORATION
Notes to the Condensed Consolidated Financial Statements (Unaudited)
Senior Secured Notes due 2026 was deemed to have been extinguished for the issuance of the Beach Point Rollover Debt and common stock of Terran Orbital Corporation, resulting in a loss on extinguishment of debt of $24.2 million related to $38.6 million carrying amount of Senior Secured Notes due 2026 on March 25, 2022. The consideration transferred as part of the extinguishment included common stock with a fair value of $31.8 million and the Beach Point Rollover Debt with a fair value of $31 million. The Company incurred $328 thousand of third-party expenses related to the Beach Point Rollover Debt, of which $178 thousand was allocated to debt and $151 thousand was allocated to equity.
PIPE Investment Obligation
An affiliate of a director and shareholder of the Company invested $30 million as part of the PIPE Investment (the “Insider PIPE Investment”). The subscription agreement for the Insider PIPE Investment included a provision that obligates the Company to pay the affiliate a quarterly fee of $1.875 million for sixteen quarters beginning with the period ending March 31, 2022 (the “PIPE Investment Obligation”). The first four quarterly payments are to be paid in cash and the remaining payments are to be paid, at the Company’s option, in cash or common stock of the Company, subject to subordination to and compliance with the Company’s debt facilities. The PIPE Investment Obligation represents a liability within scope of ASC 480(“ASC 480”) with subsequent measurement within scope of ASC 835,(“ASC 835”).
, Distinguishing Liabilities from Equity,
Interest
The Insider PIPE Investment resulted in proceeds received of $30 million, of which $13 million was allocated to proceeds from debt and $17 million was allocated to proceeds from PIPE Investment in the condensed consolidated statements of cash flows based on relative fair value. The Company incurred $259 thousand of issuance costs related to the Insider PIPE Investment, of which $112 thousand was allocated to debt and $147 was allocated to equity.
Note 6 Warrants and Derivatives
The Company’s warrants and derivatives consist of freestanding financial instruments issued in connection with the Company’s debt and equity financing transactions. The Company does not have any derivatives designated as hedging instruments.
For each freestanding financial instrument, the Company evaluates whether it represents a liability-classified financial instrument within the scope of ASC 480, or either a liability-classified or equity-classified financial instrument within the scope of ASC 815,(“ASC 815”).
Derivatives and Hedging
Warrants and derivatives classified as liabilities are recognized at fair value in the condensed consolidated balance sheets and are remeasured at fair value as of each reporting period with changes in fair value recorded in the condensed consolidated statements of operations and comprehensive loss. Warrants and derivatives classified as equity are recognized at fair value in additional
paid-in
capital in the condensed consolidated balance sheets and are not subsequently remeasured.Liability-classified Warrants and Derivatives
The fair values of liability-classified warrants recorded in warrant liabilities on the condensed consolidated balance sheets as of the presented dates were as follows:
(in thousands, except share and per share amounts) | Number of Issuable Shares as of March 31, 2022 | Issuance | Maturity | Exercise Price | March 31, 2022 | December 31, 2021 | ||||||||||||||||||
Inducement Warrants | — | March 2021 | March 2041 | $ | 0.01 | $ | — | $ | 5,631 | |||||||||||||||
Public Warrants | 11,499,960 | March 2021 | March 2027 | $ | 11.50 | 5,750 | — | |||||||||||||||||
Private Placement Warrants | 7,800,000 | March 2021 | March 2027 | $ | 11.50 | 3,900 | — | |||||||||||||||||
FP Combination Warrants | 8,291,704 | March 2022 | March 2027 | $ | 10.00 | 25,966 | — | |||||||||||||||||
Warrant liabilities | 27,591,664 | $ | 35,616 | $ | 5,631 | |||||||||||||||||||
F-19
TERRAN ORBITAL CORPORATION
Notes to the Condensed Consolidated Financial Statements (Unaudited)
The fair values of liability-classified warrants and derivatives recorded in accrued expenses and other current liabilities on the consolidated balance sheets as of the presented dates were as follows:
(in thousands) | March 31, 2022 | December 31, 2021 | ||||||
FP Pre-Combination Warrants | $ | — | $ | 2,546 | ||||
Pre-Combination Warrants | — | 849 | ||||||
FP Combination Warrants | — | 27,682 | ||||||
Combination Warrants | — | 7,602 | ||||||
FP Combination Equity | — | 24,110 | ||||||
Combination Equity | — | 5,729 | ||||||
Current warrant and derivative liabilities | $ | — | $ | 68,518 | ||||
The changes in fair value of liability-classified warrants and derivatives during the three months ended March 31, 2022 were as follows:
(in thousands) | Current Warrant and Derivative Liabilities | Warrant Liabilities | Total | |||||||||
Beginning balance | $ | 68,518 | $ | 5,631 | $ | 74,149 | ||||||
Initial recognition from Tailwind Two Merger | — | 13,124 | 13,124 | |||||||||
Change in fair value of warrant and derivative liabilities | 13,342 | (1,489 | ) | 11,853 | ||||||||
Reclassification of current warrant and derivative liabilities to warrant liabilities | (25,966 | ) | 25,966 | — | ||||||||
Reclassification of liability-classified warrants and derivatives to equity-classified | (11,007 | ) | — | (11,007 | ) | |||||||
Net settlement of liability-classified warrants into common stock | — | (7,616 | ) | (7,616 | ) | |||||||
Issuance of contingently issuable shares | (44,887 | ) | — | (44,887 | ) | |||||||
Ending balance | $ | — | $ | 35,616 | $ | 35,616 | ||||||
Inducement Warrants
During the three months ended March 31, 2021, warrants issued by Legacy Terran Orbital in connection with the issuance of the Senior Secured Notes due 2026 (the “Inducement Warrants”) were recognized at a fair value of $4.4 million in the condensed consolidated balance sheets, of which $2.5 million were recognized as discount on debt from the issuance of the Senior Secured Notes due 2026 and $1.9 million were recognized as a component of loss on extinguishment of debt in connection with the extinguishment of convertible notes. The change in fair value of the Inducement Warrants was not material during the three months ended March 31, 2021.
As part of the Tailwind Two Merger, all of the Inducement Warrants were ultimately net settled into approximately 695 thousand shares of Terran Orbital Corporation’s common stock. As a result of the net settlement of the Inducement Warrants, the Company reclassified the fair value of the Inducement Warrants as of the Tailwind Two Merger of $7.6 million to additional
paid-in
capital.Francisco Partners Warrants and Derivatives
As part of the Francisco Partners Facility, the Company issued warrants to Francisco Partners in November 2021 to purchase 1.5% of the fully diluted shares of Legacy Terran Orbital’s common stock (the “FP
Pre-Combination
Warrants”). The FPPre-Combination
Warrants terminated unexercised upon consummation of the Tailwind Two Merger pursuant to their contractual provisions.As additional consideration for the Francisco Partners Facility in November 2021, the Company committed to the issuance of (i) an equity grant package equal to 1.5% of the fully diluted shares of Terran Orbital Corporation’s common stock outstanding as of immediately following the closing of the Tailwind Two Merger, plus an additional 1million shares of Terran Orbital Corporation’s common stock (the “FP Combination Equity”), and (ii) warrants to purchase 5.0% of the Terran Orbital Corporation’s common stock on a fully diluted basis as of immediately following the closing of the Tailwind Two Merger at a strike price of $10.00 per share, redeemable at the option of Francisco Partners for $25 million on the third anniversary of the closing of the Tailwind Two Merger, and expiring on March 25, 2027 (the “FP Combination Warrants”).
F-20
TERRAN ORBITAL CORPORATION
Notes to the Condensed Consolidated Financial Statements (Unaudited)
The FP Combination Equity and the FP Combination Warrants were contingently issuable upon closing of the Tailwind Two Merger. Upon consummation of the Tailwind Two Merger, approximately 3.3 million shares of the Company’s common stock were issued related to the FP Combination Equity, resulting in the reclassification of the fair value of the FP Combination Equity as of the Tailwind Two Merger of $36.4 million to additional
paid-in
capital. In addition, approximately 8.3 million warrants were issued related to the FP Combination Warrants, resulting in the reclassification of the FP Combination Warrants to warrant liabilities on the condensed consolidated balance sheets.Pre-Combination
and Combination Warrants and DerivativesUpon initial funding of the Francisco Partners Facility and in connection with the amendment to the Senior Secured Notes due 2026 note purchase agreement in November 2021, the Company issued warrants to each of Lockheed Martin and Beach Point to purchase 0.25% of the fully diluted shares of Legacy Terran Orbital’s common stock on the same valuation and terms and conditions as the FP
Pre-Combination
Warrants (the“Pre-Combination
Warrants”). ThePre-Combination
Warrants terminated unexercised upon consummation of the Tailwind Two Merger pursuant to their contractual provisions.In November 2021, the Company committed to issue to each of Lockheed Martin and Beach Point (i) an equity grant package equal to 0.25% of the fully diluted shares of Terran Orbital Corporation’s common stock outstanding as of immediately following the closing of the Tailwind Two Merger (the “Combination Equity”), and (ii) warrants to purchase 0.83333% of Terran Orbital Corporation’s common stock on a fully diluted basis as of immediately following the closing of the Tailwind Two Merger at a strike price of $10.00 per share expiring on March 25, 2027 (the “Combination Warrants”).
The Combination Equity and the Combination Warrants were contingently issuable upon closing of the Tailwind Two Merger. Upon consummation of the Tailwind Two Merger, approximately 774 thousand shares of the Company’s common stock were issued related to the Combination Equity, resulting in the reclassification of the fair value of the Combination Equity as of the Tailwind Two Merger of $8.5 million to additional
paid-in
capital. In addition, approximately 2.8 million warrants were issued related to the Combination Warrants, resulting in the reclassification of the fair value of the Combination Warrants as of the Tailwind Two Merger of $11 million to additionalpaid-in
capital as the Combination Warrants now represent equity-classified financial instruments.Public Warrants
As part of the Tailwind Two Merger, the Company assumed outstanding warrants giving the holders the right to purchase an aggregate of 11.5 million shares of the Company’s common stock for $11.50 per share (the “Public Warrants”). The Public Warrants became exercisable on April 24, 2022, 30 days after the completion of the Tailwind Two Merger, and will expire five years from the completion of the Tailwind Two Merger.
The Company will not be obligated to deliver any shares of common stock pursuant to the exercise of a Public Warrant and will have no obligation to settle such warrant exercise unless a registration statement with respect to the shares underlying the warrants is then effective and a related prospectus is current, unless a valid exemption from registration is available. No Public Warrant will be exercisable for cash or on a cashless basis and the Company will not be obligated to issue shares upon exercise of a Public Warrant unless the underlying shares have been registered, qualified or deemed to be exempt under the securities laws of the state of residence of the registered holder of the warrants. On April 22, 2022, the Company filed the Form
S-1
with the SEC for, among other transactions, the registration of the shares of common stock issuable by the Company upon exercise of the Public Warrants. The FormS-1
has not yet been declared effective by the SEC.Once the Public Warrants become exercisable, the Company may redeem the outstanding warrants when the price per share of the Company’s common stock equals or exceeds $18.00 as follows:
| • | in whole and not in part; |
| • | at a price of $0.01 per warrant; |
| • | upon not less than of 30 days’ prior written notice of redemption to each warrant holder; and |
F-21
TERRAN ORBITAL CORPORATION
Notes to the Condensed Consolidated Financial Statements (Unaudited)
| • | if, and only if, the closing price of the Company’s shares of common stock equals or exceeds $18.00 per share (as adjusted) for any 20 trading days within a 30-trading day period ending three trading days before the Company sends the notice of redemption to the warrant holders. |
In addition, once the Public Warrants become exercisable, the Company may redeem the outstanding warrants when the price per share of the Company’s common stock equals or exceeds $10.00 as follows:
| • | in whole and not in part; |
| • | at $0.10 per warrant upon a minimum of 30 days’ prior written notice of redemption; provided that holders will be able to exercise their warrants on a cashless basis prior to redemption and receive that number of shares determined based on the redemption date and the fair market value of the Company’s shares of common stock; |
| • | if, and only if, the closing price of the Company’s shares of common stock equals or exceeds $10.00 per share (as adjusted) for any 20 trading days within the 30-trading day period ending three trading days before the Company send the notice of redemption of the warrant holders; and |
| • | if the closing price of the Company’s shares of common stock for any 20 trading days within a 30-trading day period ending on the third trading day prior to the date on which the Company sends the notice of redemption to the warrant holders is less than $18.00 per share (as adjusted), the Private Placement Warrants must also be concurrently called for redemption on the same terms as the outstanding Public Warrants, as described above. |
If and when the Public Warrants become redeemable by the Company, the Company may exercise its redemption right even if it is unable to register or qualify the underlying securities for sale under all applicable state securities laws.
If the Company calls the Public Warrants for redemption, as described above, the Company will have the option to require any holder that wishes to exercise the Public Warrants to do so on a “cashless basis,” as described in the warrant agreement. The exercise price and number of common shares issuable upon exercise of the Public Warrants may be adjusted in certain circumstances including in the event of a share dividend, extraordinary dividend or recapitalization, reorganization, merger or consolidation. However, the Public Warrants will not be adjusted for issuances of common shares at a price below its exercise price. Additionally, in no event will the Company be required to net cash settle the Public Warrants.
Private Placement Warrants
As part of the Tailwind Two Merger, the Company assumed outstanding warrants that were previously issued in a private placement and that give the holders thereof the right to purchase an aggregate of 7.8 million shares of the Company’s common stock for $11.50 per share (the “Private Placement Warrants”). The Private Placement Warrants are identical to the Public Warrants, except that the Private Placement Warrants and the common shares issuable upon their exercise will not be transferable, assignable or salable until 30 days after the completion of the Tailwind Two Merger. Additionally, the Private Placement Warrants will be exercisable on a cashless basis and be
non-redeemable,
except as described above, so long as they are held by the initial purchasers or their permitted transferees. If the Private Placement Warrants are held by someone other than the initial purchasers or their permitted transferees, the Private Placement Warrants will be redeemable by the Company and exercisable by such holders on the same basis as the Public Warrants. During April 2022, the Company filed a registration statement for the registration of the Private Placement Warrants and the shares of common stock issuable upon exercise of the Private Placement Warrants.Equity-classified Warrants
Detachable Warrants
During the three months ended March 31, 2021, warrants issued by Legacy Terran Orbital in connection with the extinguishment of convertible notes (the “Detachable Warrants”) were recognized at a fair value of $68.4 million in additional
paid-in
capital in the condensed consolidated balance sheets and as a component of loss on extinguishment of debt in the condensed consolidated statements of operations and comprehensive loss. The issuance costs related to the Detachable Warrants totaled $2.3 million and were recognized in additional capital in the consolidated balance sheets and as financing cash flows in the consolidated statements of cash flows.F-22
TERRAN ORBITAL CORPORATION
Notes to the Condensed Consolidated Financial Statements (Unaudited)
As part of the Tailwind Two Merger, all of the Detachable Warrants were ultimately net settled into approximately 22.3 million shares of the Terran
Orbital
Corporation’s common stock.Note 7 Fair Value of Financial Instruments
Fair value is defined as the price that would be received to sell an asset or paid to transfer a liability in an orderly transaction between market participants in the principal market, or if none exists, the most advantageous market, for the specific asset or liability at the measurement date (the exit price). The fair value is based on assumptions that market participants would use when pricing the asset or liability. The fair values are assigned a level within the fair value hierarchy, depending on the source of the inputs into the calculation, as follows:
| • | Level 1: Observable inputs that reflect quoted prices (unadjusted) for identical assets or liabilities in active markets. |
| • | Level 2: Inputs other than quoted prices included in Level 1 that are observable for the asset or liability either directly or indirectly. |
| • | Level 3: Unobservable inputs reflecting management’s own assumptions about the inputs used in pricing the asset or liability. |
The carrying amounts of cash and equivalents, accounts receivable, contract assets, contract liabilities, and accounts payable approximate fair values due to the short-term maturities of these financial instruments.
Warrant and Derivative Liabilities
As a result of the Tailwind Two Merger, the fair value measurements related to warrants and derivatives during the three months ended March 31, 2022 were primarily based on the quoted market price of Terran Orbital Corporation’s common stock and Public Warrants.
The final fair values of the Inducement Warrants, Combination Equity and FP Combination Equity were based on the number of shares of Terran Orbital Corporation common stock issued as part of the Tailwind Two Merger and the price per share of Terran Orbital Corporation’s common stock as of the Tailwind Two Merger and represent Level 1 fair value measurements.
The fair value of the Public Warrants was based on the quoted market price of the Public Warrants as of each valuation date and represents a Level 1 fair value measurement. As the Private Placement Warrants are similar to the Public Warrants, the fair value of the Private Placement Warrants was based on the quoted market price of the Public Warrants as of each valuation date and represents a Level 2 fair value measurement.
The fair values of the Combination Warrants and FP Combination Warrants were derived using the Black-Scholes option pricing model and a lattice model, respectively, with the following significant inputs and assumptions as of the valuation date: (i) the price per share of Terran Orbital Corporation’s common stock, (ii) the exercise price, (iii) the risk-free interest rate, (iv) the dividend yield, (v) the contractual term, and (vi) the estimated volatility. In addition, as a result of the FP Combination Warrants put feature, the valuation also considers counterparty credit spread based on an estimated credit rating of CCC and below. The resulting fair values represent Level 3 fair value measurements.
Long-term Debt
The following table presents the total net carrying amount and estimated fair value of the Company’s long-term debt instruments, excluding finance leases, as of the dates presented:
March 31, 2022 | December 31, 2021 | |||||||||||||||
(in thousands) | Carrying Amount | Fair Value | Carrying Amount | Fair Value | ||||||||||||
Long-term debt | $ | 91,264 | $ | 173,524 | $ | 115,095 | $ | 124,221 | ||||||||
PIPE Investment Obligation | 11,131 | 25,075 | — | — | ||||||||||||
F-23
TERRAN ORBITAL CORPORATION
Notes to the Condensed Consolidated Financial Statements (Unaudited)
As of March 31, 2022, the fair value of the Company’s long-term debt related to the Francisco Partners Facility, Lockheed Martin Rollover Debt, and Beach Point Rollover Debt was estimated using a lattice model with the following significant inputs and assumptions: (i) time to maturity, (ii) coupon rate, (iii) discount rate based on an estimated credit rating of CCC and below, (iv) risk-free interest rate, and (v) contractual features such as prepayment options, call premiums and default provisions. The fair value of long-term debt related to the PIPE Investment Obligation was estimated using the discounted cash flow valuation method applied to the sixteen quarterly payments using a discount rate based on a risk-free rate derived from constant maturity yields ranging plus a credit risk derived from an estimated credit rating of CCC and below. The resulting fair values represent Level 3 fair value measurements.
Note 8 Mezzanine Equity and Shareholders’ Deficit
Significant changes in the Company’s mezzanine equity and shareholders’ deficit during the three months ended March 31, 2022 were as follows:
Common Stock
Subsequent to the Tailwind Two Merger, the Company is authorized to issue up to 300 million shares of common stock with a par value of $0.0001 per share. Each share of common stock entitles the shareholder to one vote.
The Company issued 11 million shares of common stock in exchange for the net assets of Tailwind Two recognized at historical cost in connection with the Tailwind Two Merger and issued 5.1 million shares of common stock in connection with the PIPE Investment. The Tailwind Two Merger and PIPE Investment resulted in allocated cash proceeds of $58.4 million with aggregate allocated third-party issuance costs of $48.4 million and the assumption of the Public Warrants and Private Placement Warrants with an aggregate fair value of $13.1 million.
PredaSAR Merger
During the three months ended March 31, 2021, the Company entered into an agreement with
non-controlling
interest holders of convertible preferred stock in PredaSAR (the “Series Seed Preferred Stock”) to exchange all of the shares of the Series Seed Preferred Stock for shares of the Legacy Terran Orbital’s common stock (the “PredaSAR Merger”). The PredaSAR Merger resulted in the issuance of 10.7 million shares of common stock.The PredaSAR Merger resulted in PredaSAR becoming a wholly-owned subsidiary of Legacy Terran Orbital. Accordingly,
non-controlling
interest was reclassified to additionalpaid-in
capital in the condensed consolidated balance sheets. The issuance costs related to the PredaSAR Merger totaled $432 thousand and were recognized in additionalpaid-in
capital in the condensed consolidated balance sheets and as financing cash flow in the condensed consolidated statements of cash flow.Preferred Stock
Subsequent to the Tailwind Two Merger, the Company is authorized to issue up to 50 million shares of preferred stock with a par value of $0.0001 per share. There were no shares of preferred stock issued and outstanding as of March 31, 2022.
As part of the Tailwind Two Merger, all of the convertible preferred stock of Legacy Terran Orbital (the “Series A Preferred Stock”) was ultimately converted into approximately 10.9 million shares of Terran Orbital Corporation’s common stock. As a result of the conversion of the Series A Preferred Stock, the Company reclassified the amount of Series A Preferred Stock to additional
paid-in
capital.Note 9 Share-Based Compensation
Prior to the Tailwind Two Merger, Legacy Terran Orbital maintained the Amended and Restated Terran Orbital Corporation 2014 Equity Incentive Plan (the “2014 Plan”). During January 2022, the 2014 Plan was amended to authorize the issuance of no more than 941,355 shares of Legacy Terran Orbital’s common stock, which represents 25,967,343 shares of Terran Orbital Corporation’s common stock on a converted basis.
F-24
TERRAN ORBITAL CORPORATION
Notes to the Condensed Consolidated Financial Statements (Unaudited)
In connection with the Tailwind Two Merger, the Company terminated the 2014 Plan and adopted the Terran Orbital Corporation 2021 Omnibus Incentive Plan (the “2021 Plan”). All of the outstanding share-based compensation awards granted under the 2014 Plan were cancelled and substituted for awards under the 2021 Plan in the same form and on substantially the same terms and conditions. The 2021 Plan authorizes the issuance of no more than 13,729,546 shares of Terran Orbital Corporation’s common stock pursuant to awards under the 2021 Plan. The number of authorized shares issuable under the 2021 Plan is subject to an annual increase on the first day of each calendar year during the term of the 2021 Plan, equal to the lesser of (i) 3% of the aggregate number of shares of Terran Orbital Corporation’s common stock outstanding on the final day of the immediately preceding calendar year and (ii) such smaller number of shares of Terran Orbital Corporation’s common stock as determined by the Company’s board of directors. Further, under the 2021 Plan, the number of authorized shares issuable under the 2021 Plan may be adjusted in case of changes to capitalization or other corporate events. As of March 31, 2022, there were approximately 23 million shares of Terran Orbital’s common stock underlying outstanding awards, which were cancelled under the 2014 Plan and substituted for awards under the 2021 Plan. The shares underlying such substituted awards are incremental to, and do not count against, the authorized share pool of the 2021 Plan.
Share-based compensation expense totaled $17.3 million and $168 thousand during the three months ended March 31, 2022 and 2021, respectively. All of the Company’s outstanding restricted stock units (“RSUs”) included a performance condition that requires a liquidity event to occur in order to vest. Accordingly, the Company previously did 0t recognize share-based compensation expense associated with the RSUs as their performance condition was not probable of being met until such an event occurred. Upon closing of the Tailwind Two Merger, the Company recorded a cumulative
catch-up
of approximately $17.2 million in order to begin recognition of share-based compensation expense associated with these RSUs as the performance condition was met, of which $2.1 million was recorded to cost of sales and $15.1 million was recorded to selling, general, and administrative expenses in the condensed consolidated statements of operations and comprehensive loss based on the classification of each employee’s compensation expense.2014 Plan
During the three months ended March 31, 2022 and prior to the Tailwind Two Merger, the Company granted approximately 6.4 million RSUs under the 2014 Plan with a weighted-average grant date fair value of $8.12.
The majority of these RSUs (referred to as “Retention RSUs”) will generally vest on the later to occur of: (i) the first anniversary of the consummation of the Tailwind Two Merger and (ii) the trading price of Company’s common stock equaling or exceeding $11.00 or $13.00, as applicable, for any 20 trading days within any consecutive
30-trading
day period. The Retention RSUs expire five years from the Tailwind Two Merger if unvested. The derived service period for the Retention RSUs was estimated to be less than one year from the date of the Tailwind Two Merger based on the median weighted-average triggering event period determined using the Monte Carlo simulation model. As the derived service period is less than one year, the share-based compensation expense associated with the Retention RSUs will be recognized over aone-year
period beginning from the consummation of the Tailwind Two Merger. In addition, the grant date fair value of the Retention RSUs was determined using the Monte Carlo simulation model using the following significant inputs and assumptions as of the valuation date: (i) the price per share of Terran Orbital Corporation’s common stock, (ii) the risk-free interest rate, (iii) the dividend yield, (iv) the estimated volatility, and (v) a discount for lack of marketability.For the granted RSUs that are not Retention RSUs, the grant date fair value was based on the fair value of Legacy Terran Orbital’s common stock. Prior to the Tailwind Two Merger and in the absence of a public market for the Legacy Terran Orbital’s common stock, the valuation of the Legacy Terran Orbital’s common stock has been determined using an option pricing model, which is used to allocate the total enterprise value of the Company to the different classes of equity as of the valuation date. The significant assumptions used in the option pricing model include: (i) total enterprise value of the Company based on the guideline publicly-traded company method, guideline transaction method, market calibration method and discounted cash flow method; (ii) liquidation preferences, conversion values, and participation thresholds of different equity classes; (iii) probability-weighted time to a liquidity event; (iv) expected volatility based upon the historical and implied volatility of common stock for the Company’s selected peers; (v) expected dividend yield of zero as the Company does not have a history or plan of declaring dividends on its common stock; (vi) risk-free interest rate based on U.S. treasury bonds with a
0-coupon
rate, (vii) implied valuation, timing, and probability of the Tailwind Two Merger; and (viii) a discount for the lack of marketability of the Company’s common stock. As a result of the Tailwind Two Merger, the estimates will no longer be necessary to determine the fair value of the Company’s common stock as there is a public market for the underlying shares.F-25
TERRAN ORBITAL CORPORATION
Notes to the Condensed Consolidated Financial Statements (Unaudited)
PredaSAR Plan
In connection with the PredaSAR Merger, the PredaSAR Corporation 2020 Equity Incentive Plan (the “PredaSAR Plan”) was terminated. The stock options granted under the PredaSAR Plan were modified by cancellation and replacement with RSUs granted under the 2014 Plan. The incremental share-based compensation to be recognized over the service period of the RSUs as a result of the modification totaled approximately $445 thousand and was based on the incremental fair value of the RSUs granted compared to the fair value of the stock options immediately prior to cancellation. The Company did 0t recognize any incremental share-based compensation expense associated with the RSUs during the three months ended March 31, 2021 as the performance condition was not probable of being met until a liquidity event occurs. However, the Company continued to recognize share-based compensation expense related to the original grant date fair value of the cancelled stock options as the stock options were probable of vesting pursuant to their original terms.
Note 10 Net Loss Per Share
Basic net loss per share is computed by dividing net loss by the weighted-average number of shares of common stock outstanding during the period.
Diluted net loss per share gives effect to all securities having a dilutive effect on net loss, weighted-average shares outstanding of common stock or both. The effect from potential dilutive securities includes (i) incremental shares of common stock calculated using the
if-converted
method for the PIPE Investment Obligation and the Series A Preferred Stock and (ii) incremental shares of common stock calculated using the treasury stock method for warrants and share-based compensation awards. None of the potential dilutive securities meet the definition of a participating security.For purposes of the diluted net loss per share computation, all potentially dilutive securities were excluded because their effect would be anti-dilutive or because of unsatisfied contingent issuance conditions. As a result, basic net loss per share was equal to diluted net loss per share for each period presented.
The table below represents the anti-dilutive securities that could potentially be dilutive in the future for the periods presented:
Three Months Ended March 31, | ||||||||
(in shares of common stock) | 2022 | 2021 | ||||||
Series A Preferred Stock | — | 10,947,686 | ||||||
Stock options | 1,938,804 | 2,836,655 | ||||||
Restricted stock units | 16,076,087 | 14,121,542 | ||||||
Detachable Warrants | — | 26,029,630 | ||||||
Inducement Warrants | — | 479,208 | ||||||
FP Combination Warrants | 8,291,704 | — | ||||||
Combination Warrants | 2,763,902 | — | ||||||
Public Warrants | 11,499,960 | — | ||||||
Private Placement Warrants | 7,800,000 | |||||||
PIPE Investment Obligation | 3,270,349 | — | ||||||
The computations of basic and diluted net loss per share for the periods presented were as follows:
Three Months Ended March 31, | ||||||||
(in thousands, except per share and share amounts) | 2022 | 2021 | ||||||
Numerator: | ||||||||
Net loss | $ | (71,372 | ) | $ | (77,496 | ) | ||
Denominator: | ||||||||
Weighted-average shares outstanding - basic and diluted | 83,643,940 | 71,431,259 | ||||||
Net loss per share - basic and diluted | $ | (0.85 | ) | $ | (1.08 | ) | ||
F-26
TERRAN ORBITAL CORPORATION
Notes to the Condensed Consolidated Financial Statements (Unaudited)
Note 11 Income Taxes
Provision for income taxes for the three months ended March 31, 2022 was $2 thousand, resulting in an effective tax rate for the period of 0.0%. The Company had a minimal effective tax rate as a result of the continued generation of net operating losses (“NOLs”) offset by a full valuation allowance recorded on such NOLs as the Company determined it is
more-likely-than-not
that the Company’s NOLs will not be utilized.Provision for income taxes for the three months ended March 31, 2021 was $28 thousand, resulting in an effective tax rate for the period of 0.0%. The Company had a minimal effective tax rate as a result of the continued generation of NOLs offset by a full valuation allowance recorded on such NOLs as the Company determined it is
more-likely-than-not
that the Company’s NOLs will not be utilized. The remainder of the Company’s provision for income taxes was related to the Company’s foreign subsidiary.Note 12 Commitments and Contingencies
Litigation and Other Legal Matters
From time to time, the Company is subject to claims and lawsuits in the ordinary course of business, such as contractual disputes and employment matters. The Company is also subject to regulatory and governmental examinations, information requests and subpoenas, inquiries, investigations, and threatened legal actions and proceedings. The Company records accruals for losses that are probable and reasonably estimable. These accruals are based on a variety of factors such as judgment, probability of loss, and opinions of internal and external legal counsel. Legal costs in connection with claims and lawsuits in the ordinary course of business are expensed as incurred.
Customer Contractual Dispute
In January 2019, the Company entered into a contract (and other related agreements) with a customer to provide mission support and launch support services. During 2021, a contractual dispute arose between the Company and the customer. In April 2022, the Company entered into a confidential settlement agreement with the customer and agreed to a payment to the customer of $833 thousand, which is anticipated to be paid by September 30, 2022. As of March 31, 2022 and December 31, 2021, the Company had accrued $833 thousand and $800 thousand for the settlement, respectively.
Commercial Agreements
During the three months ended March 31, 2022, the Company entered into commercial agreements to purchase $20 million of goods and services over three years from two affiliates of a PIPE investor. These commercial agreements became effective upon the closing of the Tailwind Two Merger.
Note 13 Related Party Transactions
Lockheed Martin
Lockheed Martin, directly and through its wholly-owned subsidiary Astrolink International, LLC (“Astrolink”), is a significant holder of debt and equity instruments in the Company. On June 26, 2017, the Company entered into the strategic cooperation agreement with Lockheed Martin (the “Strategic Cooperation Agreement”) pursuant to which the parties agreed to (i) collaborate on the development, production and sale of satellites for use in U.S. Government spacecraft and spacecraft procurements and (ii) establish a cooperation framework to enable the parties to enter into projects, research and development agreements and other collaborative business arrangements and “teaming activities.” In connection with the issuance of the Senior Secured Notes due 2026, the Company and Lockheed Martin amended and restated the Strategic Cooperation Agreement to, among other things, extend the term to March 8, 2026. In connection with the Merger Agreement, the Strategic Cooperation Agreement was further amended and restated to extend the term to October 28, 2030 and was subsequently extended for an additional twelve months to October 28, 2031 in March 2022 pursuant to existing contractual terms. Refer to Note 5 “Debt” and Note 6 “Warrants and Derivatives” for further discussion regarding debt and equity transactions with Lockheed Martin.
F-27
TERRAN ORBITAL CORPORATION
Notes to the Condensed Consolidated Financial Statements (Unaudited)
The Company recognized revenue from Lockheed Martin of $10.3 million and $3.8 million during the three months ended March 31, 2022 and 2021, respectively. In addition, the Company had accounts receivables due from Lockheed Martin of $15.2 million and $530 thousand as of March 31, 2022 and December 31, 2021, respectively.
As of March 31, 2022 and December 31, 2021, programs associated with Lockheed Martin represented approximately 86% and 56% of the Company’s remaining performance obligations, respectively.
GeoOptics, Inc.
The Company owns a
non-controlling
equity interest in GeoOptics, Inc. (“GeoOptics”), a privately held company engaged in the acquisition and sale of Earth observation data and a purchaser of products and services from the Company. Additionally, one of the Company’s executive officers serves as a member of the GeoOptics board of directors. As of March 31, 2022 and December 31, 2021, the Company’s $1.7 million investment in GeoOptics represented an approximately 2.3% ownership interest and was fully impaired.The Company recognized revenue from GeoOptics of $501 thousand and $320 thousand during the three months ended March 31, 2022 and 2021, respectively. In addition, the Company had accounts receivables due from GeoOptics of $637 thousand and $470 thousand as of March 31, 2022 and December 31, 2021, respectively.
As of March 31, 2022 and December 31, 2021, programs associated with GeoOptics represented approximately 3% and 9% of the Company’s remaining performance obligations, respectively.
Transactions with Chairman and CEO
The Company leases office space in a building beneficially owned by its Chairman and CEO with a lease term of April 1, 2021 to March 31, 2026. The Company has a
one-time
right to extend the lease for a period of five additional years. During the three months ended March 31, 2022, the lease payments under this lease were approximately $57 thousand.During the three months ended March 31, 2021, the Company’s Chairman and CEO was paid $125 thousand for consulting services.
Beach Point
Beach point is a significant holder of debt and equity instruments in the Company. Refer to Note 5 “Debt” and Note 6 “Warrants and Derivatives” for further discussion regarding debt and equity transactions with Beach Point.
PIPE Investment Obligation
The PIPE Investment Obligation represents a related party transaction. Refer to Note 5 “Debt” for further discussion.
Note 14 Segment Information
The Company’s Chief Executive Officer is its chief operating decision maker (the “CODM”). The Company reports segment information based on how the CODM evaluates performance and makes decisions about how to allocate resources. Accordingly, the Company has 2 operating and reportable segments: Satellite Solutions and Earth Observation Solutions.
The reportable segments are defined as follows:
| • | Satellite Solutions |
The Satellite Solutions segment is a vertically integrated satellite provider with modern facilities and a global ground station network that deliverssatellite solutions, including spacecraft design, development, launch services and
end-to-end
on-orbit
operations for critical missions across a number of applications in a variety of orbits to governmental agencies and commercial businesses.F-28
TERRAN ORBITAL CORPORATION
Notes to the Condensed Consolidated Financial Statements (Unaudited)
| • | Earth Observation Solutions |
Through the Satellite Solutions segment, the Earth Observation Solutions segment has commenced developing satellites and intends to continue to develop, build, launch and operate a constellation of Earth observation satellites that will feature Synthetic Aperture Radar (“SAR”) and electro-optical capabilities to provide Earth observation data and mission solutions that it believes will be distinguished by breadth of coverage, revisit rates and ability to observe and detect during day and night and through clouds and other interference. In addition, the Earth Observation Solutions segment plans to provide secondary payload solutions and onboard data processing capabilities on its satellite constellation, including sensors, optical links or other mission solutions.
The Earth Observation Solutions segment is still in its developmental stage and does not yet generate any material revenue. The scope and timing of the satellite constellation is subject to continuing assessments of customer demand and the Company’s financial and other resources. The Company has designed and began building the first two satellites of the constellation and plans to launch the two satellites in late 2022 or the first half of 2023.
The CODM uses income (loss) from operations by segment as the segment profitability measure in order to evaluate segment performance. Income (loss) from operations by segment excludes share-based compensation expense and corporate and other costs included within the Company’s consolidated income (loss) from operations.
The CODM does not review the Company’s assets by segment; therefore, such information is not presented.
The following table presents revenue by segment and a reconciliation to consolidated revenue for the periods presented:
Three Months Ended March 31, | ||||||||
(in thousands) | 2022 | 2021 | ||||||
Satellite Solutions | $ | 12,974 | $ | 10,494 | ||||
Earth Observation Solutions | 146 | — | ||||||
Revenue | $ | 13,120 | $ | 10,494 | ||||
The following table presents loss from operations by segment for the periods presented:
Three Months Ended March 31, | ||||||||
(in thousands) | 2022 | 2021 | ||||||
Satellite Solutions | $ | (6,048 | ) | $ | (980 | ) | ||
Earth Observation Solutions | (660 | ) | (912 | ) | ||||
Loss from operations by segment | $ | (6,708 | ) | $ | (1,892 | ) | ||
During the three months ended March 31, 2022, depreciation and amortization expense included in loss from operations by segment totaled $641 thousand and $184 thousand for Satellite Solutions and Earth Observation Solutions, respectively. During the three months ended March 31, 2021, depreciation and amortization expense included in loss from operations by segment totaled $671 thousand and related entirely to Satellite Solutions.
The following table presents a reconciliation of loss from operations by segment to consolidated loss from operations and net loss for the periods presented:
F-29
TERRAN ORBITAL CORPORATION
Notes to the Condensed Consolidated Financial Statements (Unaudited)
Three Months Ended March 31, | ||||||||
(in thousands) | 2022 | 2021 | ||||||
Loss from operations by segment | $ | (6,708 | ) | $ | (1,892 | ) | ||
Corporate and other | (9,007 | ) | (3,853 | ) | ||||
Share-based compensation expense | (17,335 | ) | (168 | ) | ||||
Loss from operations | (33,050 | ) | (5,913 | ) | ||||
Interest expense, net | 2,923 | 907 | ||||||
Loss on extinguishment of debt | 23,141 | 70,667 | ||||||
Change in fair value of warrant and derivative liabilities | 11,853 | (34 | ) | |||||
Other expense | 403 | 15 | ||||||
Loss before income taxes | (71,370 | ) | (77,468 | ) | ||||
Provision for income taxes | 2 | 28 | ||||||
Net loss | $ | (71,372 | ) | $ | (77,496 | ) | ||
Note 15 Leases
As part of normal operations, the Company leases real estate and equipment from various counterparties with lease terms and maturities extending through 2032. The Company applies the practical expedient to not separate the lease andassets and lease liabilities include leases with lease terms of 12 months or less.
non-lease
components and accounts for the combined component as a lease. Additionally, the Company’sright-of-use
The Company’sassets and lease liabilities primarily represent lease payments that are fixed at the commencement of a lease and variable lease payments that depend on an index or rate. Lease payments are recognized as lease cost on a straight-line basis over the lease term, which is determined as the
right-of-use
non-cancelable
period, including periods in which termination options are reasonably certain of not being exercised and periods in which renewal options are reasonably certain of being exercised. The discount rate for a lease is determined using the Company’s incremental borrowing rate that coincides with the lease term at the commencement of a lease. The incremental borrowing rate is estimated based on the Company’s recent financing transactions.Lease payments that are neither fixed nor dependent on an index or rate and vary because of changes in usage or other factors are included in variable lease costs. Variable lease costs are recorded in the period in which the obligation is incurred and primarily relate to utilities, maintenance, and repair costs.
The Company’s leases do not contain material residual value guarantees or restrictive covenants. The Company is not a lessor in any leases and does not sublease.
The following table presents the amounts reported in the Company’s condensed consolidated balance sheets related to operating and finance leases as of the presented dates:
(in thousands) | Classification | March 31, 2022 | January 1, 2022 | |||||||
Right-of-Use | ||||||||||
Operating | Other assets | $ | 14,119 | $ | 6,550 | |||||
Finance | Property, plant and equipment, net | 44 | 48 | |||||||
�� | ||||||||||
Total right-of-use | $ | 14,163 | $ | 6,598 | ||||||
Lease Liabilities | ||||||||||
Operating | Accrued expenses and other current liabilities | $ | 834 | $ | 166 | |||||
Finance | Current portion of long-term debt | 15 | 14 | |||||||
Operating | Other liabilities | 15,640 | 7,962 | |||||||
Finance | Long-term debt | 34 | 39 | |||||||
Total lease liabilities | $ | 16,523 | $ | 8,181 | ||||||
F-30
TERRAN ORBITAL CORPORATION
Notes to the Condensed Consolidated Financial Statements (Unaudited)
The following is a summary of the Company’s lease cost for the presented period:
Lease Cost ( in thousands ) | Three Months Ended March 31, 2022 | |||
Operating lease cost | $ | 1,263 | ||
Finance lease cost | ||||
Amortization of right-of-use | 4 | |||
Interest on lease liabilities | 2 | |||
Variable lease costs | 140 | |||
Total lease cost | $ | 1,409 | ||
The following is a summary of the cash flows and supplemental information associated with the Company’s leases for the presented period:
Other information ( in thousands ) | Three Months Ended March 31, 2022 | |||
Cash paid for amounts included in the measurement of lease liabilities | ||||
Operating cash flows from operating leases | $ | 486 | ||
Operating cash flows from finance leases | 2 | |||
Financing cash flows from finance leases | 3 | |||
Right-of-use | ||||
Operating leases | 7,384 | |||
Finance leases | — | |||
The following is a summary of the weighted-average lease term and discount rate for operating and finance leases as of the presented date:
Lease Term and Discount Rate | March 31, 2022 | |||
Weighted-average remaining lease term (years) | ||||
Operating leases | 7.7 | |||
Finance leases | 3.4 | |||
Weighted-average discount rate | ||||
Operating leases | 29.69 | % | ||
Finance leases | 14.96 | % | ||
The following is a maturity analysis related to the Company’s operating and finance leases as of March 31, 2022:
Maturity of Lease Liabilities ( in thousands ) | Operating Leases | Finance Leases | ||||||
2022 | $ | 3,053 | $ | 16 | ||||
2023 | 5,666 | 21 | ||||||
2024 | 5,771 | 11 | ||||||
2025 | 5,709 | 8 | ||||||
2026 | 5,705 | 7 | ||||||
Thereafter | 21,522 | — | ||||||
Total lease payments | 47,426 | 63 | ||||||
Less interest | 30,952 | 14 | ||||||
Total lease liabilities | $ | 16,474 | $ | 49 | ||||
F-31
TERRAN ORBITAL CORPORATION
Notes to the Condensed Consolidated Financial Statements (Unaudited)
The table above excludes certain operating leases which have been executed but not yet commenced. The Company has an executed operating lease for office space with a lease term from April 2022 to January 2028 with total future minimum lease payments of approximately $5.4 million. Additionally, there is an executed operating lease for office space with a lease term from April 2022 to June 2027 with total future minimum lease payments of approximately $2 million.
The following is a maturity analysis related to the Company’s operating and finance leases as of December 31, 202which is presented in accordance with ASC 840,:
1,
Leases
(in thousands) | Operating Leases | Finance Leases | ||||||
2022 | $ | 3,484 | $ | 21 | ||||
2023 | 4,865 | 21 | ||||||
2024 | 4,970 | 11 | ||||||
2025 | 4,928 | 8 | ||||||
2026 | 4,896 | 7 | ||||||
Thereafter | 5,167 | — | ||||||
Total lease payments | 28,310 | 68 | ||||||
Less interest on finance leases | — | 15 | ||||||
Total | $ | 28,310 | $ | 53 | ||||
F-32
REPORT OF INDEPENDENT REGISTERED PUBLIC ACCOUNTING FIRM
To the Shareholders and the Board of Directors of
Tailwind Two Acquisition Corp.
Opinion on the Consolidated Financial Statements
We have audited the accompanying consolidated balance sheets of Tailwind Two Acquisition Corp. (the “Company”) as of December 31, 2021 and 2020 and the related consolidated statements of operations, changes in shareholders’ (deficit) equity and cash flows for the year ended December 31, 2021 and for the period from November 18, 2020 (inception) through December 31, 2020 and the related notes (collectively referred to as the “consolidated financial statements”). In our opinion, the consolidated financial statements present fairly, in all material respects, the financial position of the Company as of December 31, 2021 and 2020, and the results of its operations and its cash flows for the year ended December 31, 2021 and for the period from November 18, 2020 (inception) through December 31, 2020, in conformity with accounting principles generally accepted in the United States of America.
Going Concern
The accompanying consolidated financial statements have been prepared assuming that the Company will continue as a going concern. As discussed in Note 1 to the consolidated financial statements, if the Company is unable to raise additional funds to alleviate liquidity needs as well as complete a Business Combination by the close of business on March 9, 2023, then the Company will cease all operations except for the purpose of liquidating. The liquidity condition and date for mandatory liquidation and subsequent dissolution raises substantial doubt about the Company’s ability to continue as a going concern. Management’s plans in regard to these matters are also described in Note 1. The consolidated financial statements do not include any adjustments that might result from the outcome of this uncertainty.
Basis for Opinion
These consolidated financial statements are the responsibility of the Company’s management. Our responsibility is to express an opinion on the Company’s consolidated financial statements based on our audits. We are a public accounting firm registered with the Public Company Accounting Oversight Board (United States) (“PCAOB”) and are required to be independent with respect to the Company in accordance with the U.S. federal securities laws and the applicable rules and regulations of the Securities and Exchange Commission and the PCAOB.
We conducted our audits in accordance with the standards of the PCAOB. Those standards require that we plan and perform the audits to obtain reasonable assurance about whether the consolidated financial statements are free of material misstatement, whether due to error or fraud. The Company is not required to have, nor were we engaged to perform, an audit of its internal control over financial reporting. As part of our audits we are required to obtain an understanding of internal control over financial reporting but not for the purpose of expressing an opinion on the effectiveness of the entity’s internal control over financial reporting. Accordingly, we express no such opinion.
Our audits included performing procedures to assess the risks of material misstatement of the consolidated financial statements, whether due to error or fraud, and performing procedures that respond to those risks. Such procedures included examining, on a test basis, evidence regarding the amounts and disclosures in the consolidated financial statements. Our audits also included evaluating the accounting principles used and significant estimates made by management, as well as evaluating the overall presentation of the consolidated financial statements. We believe that our audits provide a reasonable basis for our opinion.
/s/ WithumSmith+Brown, PC
We have served as the Company’s auditor since 2020.
New York, New York
March 18, 2022
PCAOB ID Number 100
F-33
TAILWIND TWO ACQUISITION CORP.
CONSOLIDATED BALANCE SHEETS
December 31, 2021 | December 31, 2020 | |||||||
ASSETS | ||||||||
Current assets | ||||||||
Cash | $ | 1,552,520 | $ | — | ||||
Prepaid expenses and other current assets | 467,371 | — | ||||||
Total Current Assets | 2,019,891 | — | ||||||
Deferred offering costs | — | 197,790 | ||||||
Investments held in Trust Account | 345,089,823 | — | ||||||
TOTAL ASSETS | $ | 347,109,714 | $ | 197,790 | ||||
LIABILITIES AND SHAREHOLDERS’ (DEFICIT) EQUITY | ||||||||
Current liabilities | ||||||||
Accounts payable and accrued expenses | $ | 2,140,014 | $ | 6,093 | ||||
Accrued offering costs | 12,000 | 120,540 | ||||||
Advances from related party | 5,360 | — | ||||||
Promissory note – related party | — | 52,250 | ||||||
Total Current Liabilities | 2,157,374 | 178,883 | ||||||
Warrant liabilities | 16,405,000 | — | ||||||
Deferred underwriting fee payable | 12,075,000 | — | ||||||
Total Liabilities | 30,637,374 | 178,883 | ||||||
Commitments and contingencies | 0 | 0 | ||||||
Class A ordinary shares subject to possible redemption, $0.0001 par value, 34,500,000 and 0 shares issued and outstanding at $10.00 per share redemption value as of December 31, 2021 and 2020, respectively | 345,000,000 | — | ||||||
Shareholders’ (Deficit) Equity | ||||||||
Preference shares, $0.0001 par value; 1,000,000 shares authorized; NaN issued or outstanding | — | — | ||||||
Class A ordinary shares, $0.0001 par value; 500,000,000 shares authorized; 0 shares issued and outstanding, excluding 34,500,000 and 0 shares subject to possible redemption, as of December 31, 2021 and 2020, respectively | — | — | ||||||
Class B ordinary shares, $0.0001 par value; 50,000,000 shares authorized; 8,625,000 shares issued and outstanding as of December 31, 2021 and 2020 | 863 | 863 | ||||||
Additional paid-in capital | — | 24,137 | ||||||
Accumulated deficit | (28,528,523 | ) | (6,093 | ) | ||||
Total Shareholders’ (Deficit) Equity | (28,527,660 | ) | 18,907 | |||||
TOTAL LIABILITIES AND SHAREHOLDERS’ (DEFICIT) EQUITY | $ | 347,109,714 | $ | 197,790 | ||||
The accompanying notes are an integral part of these consolidated financial statements.
F-34
TAILWIND TWO ACQUISITION CORP.
CONSOLIDATED STATEMENTS OF OPERATIONS
Year Ended December 31, 2021 | For the Period from November 18, 2020 (Inception) through December 31, 2020 | |||||||
General and administrative expenses | $ | 4,400,069 | $ | 6,093 | ||||
Loss from operations | (4,400,069 | ) | (6,093 | ) | ||||
Other income (expense): | ||||||||
Change in fair value of warrant liabilities | 2,509,000 | — | ||||||
Transaction costs allocable to warrants | (649,349 | ) | — | |||||
Interest earned on investments held in Trust Account | 89,823 | — | ||||||
Total other income, net | 1,949,474 | — | ||||||
Net loss | $ | (2,450,595 | ) | $ | (6,093 | ) | ||
Weighted average shares outstanding, Class A ordinary shares | 28,167,123 | — | ||||||
Basic and diluted net loss per share, Class A ordinary shares | $ | (0.07 | ) | $ | — | |||
Weighted average shares outstanding, Class B ordinary shares | 8,418,493 | 7,500,000 | ||||||
Basic and diluted net loss per share, Class B ordinary shares | $ | (0.07 | ) | $ | (0.00 | ) | ||
The accompanying notes are an integral part of these consolidated financial statements.
F-35
TAILWIND TWO ACQUISITION CORP.
CONSOLIDATED STATEMENTS OF CHANGES IN SHAREHOLDERS’ EQUITY (DEFICIT)
Class A | Class B | Additional | Total | |||||||||||||||||||||||||
Ordinary Shares | Ordinary Shares | Paid in | Accumulated | Shareholders’ | ||||||||||||||||||||||||
Shares | Amount | Shares | Amount | Capital | Deficit | Equity (Deficit) | ||||||||||||||||||||||
Balance—November 18, 2020 (inception) | — | $ | — | — | $ | — | $ | — | $ | — | $ | — | ||||||||||||||||
Issuance of Class B ordinary shares to Sponsor | — | — | 8,625,000 | 863 | 24,137 | — | 25,000 | |||||||||||||||||||||
Net loss | — | — | — | — | — | (6,093 | ) | (6,093 | ) | |||||||||||||||||||
Balance—December 31, 2020 | — | $ | — | 8,625,000 | $ | 863 | $ | 24,137 | $ | (6,093 | ) | $ | 18,907 | |||||||||||||||
Proceeds received in excess of fair value of Private Placement Warrants | — | — | — | — | 4,056,000 | — | 4,056,000 | |||||||||||||||||||||
Accretion to Class A ordinary shares subject to possible redemption | — | — | — | — | (4,080,137 | ) | (26,071,835 | ) | (30,151,972 | ) | ||||||||||||||||||
Net loss | — | — | — | — | — | (2,450,595 | ) | (2,450,595 | ) | |||||||||||||||||||
Balance—December 31, 2021 | — | $ | — | 8,625,000 | $ | 863 | $ | — | $ | (28,528,523 | ) | $ | (28,527,660 | ) | ||||||||||||||
The accompanying notes are an integral part of these consolidated financial statements.
F-36
TAILWIND TWO ACQUISITION CORP.
CONSOLIDATED STATEMENTS OF CASH FLOWS
Year Ended December 31, | For the Period from November 18, 2020 (Inception) through December 31, | |||||||
2021 | 2020 | |||||||
Cash Flows from Operating Activities: | ||||||||
Net loss | $ | (2,450,595 | ) | $ | (6,093 | ) | ||
Adjustments to reconcile net loss to net cash used in operating activities: | ||||||||
Interest earned on investments held in Trust Account | (89,823 | ) | — | |||||
Change in fair value of warrant liabilities | (2,509,000 | ) | — | |||||
Transaction cost allocable to warrants | 649,349 | — | ||||||
Changes in operating assets and liabilities: | ||||||||
Prepaid expenses and other current assets | (467,371 | ) | — | |||||
Accounts payable and accrued expenses | 2,133,921 | 6,093 | ||||||
Net cash used in operating activities | (2,733,519 | ) | — | |||||
Cash Flows from Investing Activities: | ||||||||
Investment of cash in Trust Account | (345,000,000 | ) | — | |||||
Net cash used in investing activities | (345,000,000 | ) | — | |||||
Cash Flows from Financing Activities: | ||||||||
Proceeds from sale of Units, net of underwriting discounts paid | 338,100,000 | — | ||||||
Proceeds from sale of Private Placement Warrants | 11,700,000 | — | ||||||
Advances from related party | 5,360 | |||||||
Repayment of promissory note – related party | (89,890 | ) | — | |||||
Payment of offering costs | (429,431 | ) | — | |||||
Net cash provided by financing activities | 349,286,039 | — | ||||||
Net Change in Cash | 1,552,520 | — | ||||||
Cash – Beginning | — | — | ||||||
Cash – Ending | $ | 1,552,520 | $ | — | ||||
Non-cash investing and financing activities: | ||||||||
Offering costs included in accrued offering costs | $ | 12,000 | $ | 120,540 | ||||
Offering costs paid by Sponsor in exchange for issuance of Founder Shares | $ | — | $ | 25,000 | ||||
Offering costs paid through promissory note | $ | 37,640 | $ | 52,250 | ||||
Deferred underwriting fee payable | $ | 12,075,000 | $ | — | ||||
The accompanying notes are an integral part of these consolidated financial statements.
F-37
TAILWIND TWO ACQUISITION CORP.
NOTES TO CONSOLIDATED FINANCIAL STATEMENTS
DECEMBER 31, 2021
NOTE 1. DESCRIPTION OF ORGANIZATION AND BUSINESS OPERATIONS
Tailwind Two Acquisition Corp. (the “Company”) is a blank check company incorporated as a Cayman Islands exempted company on November 18, 2020. The Company was incorporated for the purpose of effecting a merger, share exchange, asset acquisition, share purchase, reorganization or similar business combination with 1or more businesses or entities (a “Business Combination”).
The Company is not limited to a particular industry or sector for purposes of consummating a Business Combination. The Company is an early stage and emerging growth company and, as such, the Company is subject to all of the risks associated with early stage and emerging growth companies.
The Company has one wholly-owned subsidiary, Titan Merger Sub, Inc. (“Merger Sub”) which was incorporated in the State of Delaware on August 2, 2021.
As of December 31, 2021, the Company had not commenced any operations. All activity from inception through December 31, 2021 relates to the Company’s formation, its initial public offering (“Initial Public Offering”), which is described below, and subsequent to the Initial Public Offering, identifying a target company for a Business Combination, in particular, activities in connection with the proposed business combination with Terran Orbital Corporation, a Delaware corporation (“Terran Orbital”) (see Note 6). The Company will not generate any operating revenues until after the completion of a Business Combination, at the earliest. The Company generates
non-operating
income in the form of interest income on the investments held in the Trust Account (as defined below).The registration statement for the Company’s Initial Public Offering was declared effective on March 4, 2021. On March 9, 2021, the Company consummated the Initial Public Offering of 34,500,000 units (the “Units” and, with respect to the Class A ordinary shares included in the Units sold, the “Public Shares”), which includes the full exercise by the underwriters of their over-allotment option in the amount of 4,500,000 Units, at $10.00 per Unit, generating gross proceeds of $345,000,000 which is described in Note 3.
Simultaneously with the closing of the Initial Public Offering, the Company consummated the sale of 7,800,000 warrants (the “Private Placement Warrants”) at a price of $1.50 per Private Placement Warrant in a private placement to Tailwind Two Sponsor LLC (the “Sponsor”), generating gross proceeds of $11,700,000, which is described in Note 4.
Transaction costs amounted to $19,531,321, consisting of $6,900,000 in cash underwriting fees, $12,075,000 of deferred underwriting fees and $556,321 of other offering costs.
Following the closing of the Initial Public Offering on March 9, 2021, an amount of $345,000,000 ($10.00 per Unit) from the net proceeds of the sale of the Units in the Initial Public Offering and the sale of the Private Placement Warrants was placed in a trust account (the “Trust Account”), located in the United States and invested only in U.S. government securities, within the meaning set forth in Section 2(a)(16) of the Investment Company Act of 1940, as amended (the “Investment Company Act”), with a maturity of 185 days or less or in any open-ended investment company that holds itself out as a money market fund selected by the Company meeting the conditions of Rule
2a-7
of the Investment Company Act, as determined by the Company, until the earlier of (i) the completion of a Business Combination and (ii) the distribution of the funds held in the Trust Account to the Company’s shareholders, as described below.The Company’s management has broad discretion with respect to the specific application of the net proceeds of the Initial Public Offering and the sale of the Private Placement Warrants, although substantially all
F-38
TAILWIND TWO ACQUISITION CORP.
NOTES TO CONSOLIDATED FINANCIAL STATEMENTS
DECEMBER 31, 2021
of the net proceeds are intended to be applied generally toward consummating a Business Combination. The stock exchange listing rules require that the Business Combination must be with 1 or more operating businesses or assets with a fair market value equal to at least 80% of the assets held in the Trust Account (excluding the amount of deferred underwriting commissions and taxes payable on the income earned on the Trust Account). The Company will only complete a Business Combination if the post-Business Combination company owns or acquires 50% or more of the issued and outstanding voting securities of the target or otherwise acquires a controlling interest in the target business sufficient for it not to be required to register as an investment company under the Investment Company Act. There is no assurance that the Company will be able to successfully effect a Business Combination.
The Company will provide the holders of the public shares (the “Public Shareholders”) with the opportunity to redeem all or a portion of their public shares upon the completion of the Business Combination, either (i) in connection with a general meeting called to approve the Business Combination or (ii) by means of a tender offer. The decision as to whether the Company will seek shareholder approval of a Business Combination or conduct a tender offer will be made by the Company, solely in its discretion. The Public Shareholders will be entitled to redeem their Public Shares, equal to the aggregate amount then on deposit in the Trust Account, calculated as of two business days prior to the consummation of the Business Combination (initially $10.00 per Public Share), including interest (which interest shall be net of taxes payable), divided by the number of then issued and outstanding public shares, subject to certain limitations as described in the prospectus related to the Initial Public Offering. The
per-share
amount to be distributed to the Public Shareholders who properly redeem their shares will not be reduced by the deferred underwriting commissions the Company will pay to the underwriters (as discussed in Note 6). There will be no redemption rights upon the completion of a Business Combination with respect to the Company’s warrants.The Company will proceed with a Business Combination only if the Company has net tangible assets of at least $5,000,001 and, if the Company seeks shareholder approval, it receives an ordinary resolution under Cayman Islands law approving a Business Combination, which requires the affirmative vote of a majority of the shareholders who attend and vote at a general meeting of the Company. If a shareholder vote is not required and the Company does not decide to hold a shareholder vote for business or other legal reasons, the Company will, pursuant to its Amended and Restated Memorandum and Articles of Association, conduct the redemptions pursuant to the tender offer rules of the Securities and Exchange Commission (“SEC”), and file tender offer documents containing substantially the same information as would be included in a proxy statement with the SEC prior to completing a Business Combination. If the Company seeks shareholder approval in connection with a Business Combination, the Sponsor has agreed to vote its Founder Shares (as defined in Note 5) and any Public Shares purchased during or after the Initial Public Offering in favor of approving a Business Combination. Additionally, each Public Shareholder may elect to redeem their Public Shares, without voting, and if they do vote, irrespective of whether they vote for or against an initial Business Combination.
Notwithstanding the foregoing, if the Company seeks shareholder approval of the Business Combination and the Company does not conduct redemptions pursuant to the tender offer rules, a Public Shareholder, together with any affiliate of such shareholder or any other person with whom such shareholder is acting in concert or as a “group” (as defined under Section 13 of the Securities Exchange Act of 1934, as amended (the “Exchange Act”)), will be restricted from redeeming its shares with respect to more than an aggregate of 15% of the Public Shares without the Company’s prior written consent.
The Sponsor has agreed (a) to waive its redemption rights with respect to any Founder Shares and Public Shares held by it in connection with the completion of a Business Combination and (b) not to propose an amendment to the Amended and Restated Memorandum and Articles of Association (i) to modify the substance
F-39
TAILWIND TWO ACQUISITION CORP.
NOTES TO CONSOLIDATED FINANCIAL STATEMENTS
DECEMBER 31, 2021
or timing of the Company’s obligation to allow redemption in connection with the Company’s initial Business Combination or to redeem 100% of the Public Shares if the Company does not complete a Business Combination within the Combination Period (as defined below) or (ii) with respect to any other provision relating to shareholders’ rights or
pre-initial
business combination activity, unless the Company provides the Public Shareholders with the opportunity to redeem their Public Shares upon approval of any such amendment at aper-share
price, payable in cash, equal to the aggregate amount then on deposit in the Trust Account, including interest earned on the Trust account and not previously released to pay taxes, divided by the number of then issued and outstanding Public Shares.The Company will have until March 9, 2023, to consummate a Business Combination (the “Combination Period”). However, if the Company has not completed a Business Combination within the Combination Period, the Company will (i) cease all operations except for the purpose of winding up, (ii) as promptly as reasonably possible but not more than ten business days thereafter, redeem 100% of the Public Shares, at a
per-share
price, payable in cash, equal to the aggregate amount then on deposit in the Trust Account, including interest earned and not previously released to us to pay our taxes, if any (less up to $100,000 of interest to pay dissolution expenses), divided by the number of then issued and outstanding Public Shares, which redemption will completely extinguish the rights of the Public Shareholders as shareholders (including the right to receive further liquidating distributions, if any), and (iii) as promptly as reasonably possible following such redemption, subject to the approval of the Company’s remaining Public Shareholders and its Board of Directors, liquidate and dissolve, subject in each case to the Company’s obligations under Cayman Islands law to provide for claims of creditors and the requirements of other applicable law.There will be no redemption rights or liquidating distributions with respect to the Company’s warrants, which will expire worthless if the Company fails to complete a Business Combination within the Combination Period.
The Sponsor has agreed to waive its rights to liquidating distributions from the Trust Account with respect to the Founder Shares it will receive if the Company fails to complete a Business Combination within the Combination Period. However, if the Sponsor or any of its respective affiliates acquire Public Shares, such Public Shares will be entitled to liquidating distributions from the Trust Account if the Company fails to complete a Business Combination within the Combination Period. The underwriters have agreed to waive their rights to their deferred underwriting commission (see Note 6) held in the Trust Account in the event the Company does not complete a Business Combination within the Combination Period, and in such event, such amounts will be included with the other funds held in the Trust Account that will be available to fund the redemption of the Public Shares. In the event of such distribution, it is possible that the per share value of the assets remaining available for distribution will be less than the Initial Public Offering price per Unit ($10.00).
In order to protect the amounts held in the Trust Account, the Sponsor has agreed that it will be liable to the Company if and to the extent any claims by a third party (other than the Company’s independent registered public accounting firm) for services rendered or products sold to the Company, or a prospective target business with which the Company has discussed entering into a transaction agreement, reduce the amount of funds in the Trust Account to below the lesser of (1) $10.00 per Public Share and (2) the actual amount per Public Share held in the Trust Account as of the date of the liquidation of the Trust Account, if less than $10.00 per Public Share, due to reductions in the value of trust assets, in each case net of the interest that may be withdrawn to pay taxes. This liability will not apply to any claims by a third party who executed a waiver of any and all rights to seek access to the Trust Account and as to any claims under the Company’s indemnity of the underwriters of the Initial Public Offering against certain liabilities, including liabilities under the Securities Act of 1933, as amended (the “Securities Act”). In the event that an executed waiver is deemed to be unenforceable against a
F-40
TAILWIND TWO ACQUISITION CORP.
NOTES TO CONSOLIDATED FINANCIAL STATEMENTS
DECEMBER 31, 2021
third party, the Sponsor will not be responsible to the extent of any liability for such third-party claims. The Company will seek to reduce the possibility that the Sponsor will have to indemnify the Trust Account due to claims of creditors by endeavoring to have all vendors, service providers (other than the Company’s independent registered public accounting firm), prospective target businesses or other entities with which the Company does business, execute agreements with the Company waiving any right, title, interest or claim of any kind in or to monies held in the Trust Account.
Going Concern and Liquidity
As of December 31, 2021, the Company has $1,552,520 in its operating bank accounts and a working capital deficit of $137,483.
Until the consummation of a Business Combination, the Company will be using the funds not held in the Trust Account for performing due diligence on prospective target businesses, paying for travel expenditures, selecting the target business to acquire, and structuring, negotiating and consummating the Business Combination.
The Company will need to raise additional capital through loans or additional investments from its Sponsor, shareholders, officers, directors, or third parties. The Company’s officers, directors and Sponsor may, but are not obligated to, loan the Company funds, from time to time or at any time, in whatever amount they deem reasonable in their sole discretion, to meet the Company’s working capital needs. Accordingly, the Company may not be able to obtain additional financing. If the Company is unable to raise additional capital, it may be required to take additional measures to conserve liquidity, which could include, but not necessarily be limited to, suspending the pursuit of a Business Combination. The Company cannot provide any assurance that new financing will be available to it on commercially acceptable terms, if at all.
As a result of the above, in connection with the Company’s assessment of going concern considerations in accordance with FASB’s Accounting Standards Update (“ASU”)
2014-15,
“Disclosures of Uncertainties about an Entity’s Ability to Continue as a Going Concern,” management determined that the liquidity condition and date for mandatory liquidation and dissolution raise substantial doubt about the Company’s ability to continue as a going concern through March 9, 2023, the scheduled liquidation date of the Company if it does not complete a Business Combination prior to such date. Management intends to complete a Business Combination prior to mandatory liquidation date. These consolidated financial statements do not include any adjustments relating to the recovery of the recorded assets or the classification of the liabilities that might be necessary should the Company be unable to continue as a going concern.NOTE 2. SUMMARY OF SIGNIFICANT ACCOUNTING POLICIES
Basis of Presentation
The accompanying consolidated financial statements are presented in U.S. dollars and have been prepared in accordance with accounting principles generally accepted in the United States of America (“U.S. GAAP”) and pursuant to the accounting and disclosure rules and regulations of the SEC.
Principles of Consolidation
The accompanying consolidated financial statements include the accounts of the Company and its wholly-owned subsidiary. All significant intercompany balances and transactions have been eliminated in consolidation.
F-41
TAILWIND TWO ACQUISITION CORP.
NOTES TO CONSOLIDATED FINANCIAL STATEMENTS
DECEMBER 31, 2021
Emerging Growth Company
The Company is an “emerging growth company,” as defined in Section 2(a) of the Securities Act, as modified by the Jumpstart Our Business Startups Act of 2012 (the “JOBS Act”), and it may take advantage of certain exemptions from various reporting requirements that are applicable to other public companies that are not emerging growth companies, including, but not limited to, not being required to comply with the independent registered public accounting firm attestation requirements of Section 404 of the Sarbanes-Oxley Act of 2002, reduced disclosure obligations regarding executive compensation in its periodic reports and proxy statements, and exemptions from the requirements of holding a nonbinding advisory vote on executive compensation and shareholder approval of any golden parachute payments not previously approved.
Further, Section 102(b)(1) of the JOBS Act exempts emerging growth companies from being required to comply with new or revised financial accounting standards until private companies (that is, those that have not had a Securities Act registration statement declared effective or do not have a class of securities registered under the Exchange Act) are required to comply with the new or revised financial accounting standards. The JOBS Act provides that a company can elect to opt out of the extended transition period and comply with the requirements that apply to
non-emerging
growth companies but any such election to opt out is irrevocable. The Company has elected not to opt out of such extended transition period which means that when a standard is issued or revised and it has different application dates for public or private companies, the Company, as an emerging growth company, can adopt the new or revised standard at the time private companies adopt the new or revised standard. This may make comparison of the Company’s consolidated financial statements with another public company which is neither an emerging growth company nor an emerging growth company which has opted out of using the extended transition period difficult or impossible because of the potential differences in accounting standards used.Use of Estimates
The preparation of the consolidated financial statements in conformity with GAAP requires management to make estimates and assumptions that affect the reported amounts of assets and liabilities and disclosure of contingent assets and liabilities at the date of the consolidated financial statements and the reported amounts of expenses during the reporting periods.
Making estimates requires management to exercise significant judgment. It is at least reasonably possible that the estimate of the effect of a condition, situation or set of circumstances that existed at the date of the consolidated financial statements, which management considered in formulating its estimate, could change in the near term due to one or more future confirming events. One of the more significant accounting estimates included in these consolidated financial statements is the determination of fair value of the warrant liability. Such estimates may be subject to change as more current information becomes available and accordingly the actual results could differ significantly from those estimates.
Cash and Cash Equivalents
The Company considers all short-term investments with an original maturity of three months or less when purchased to be cash equivalents. The Company did not have any cash equivalents as of December 31, 2021 and 2020.
Investments Held in Trust Account
At December 31, 2021, substantially all of the assets held in the Trust Account were held in U.S. Treasury Securities. All of the Company’s investments held in the Trust Account are classified as
held-to-maturity
F-42
TAILWIND TWO ACQUISITION CORP.
NOTES TO CONSOLIDATED FINANCIAL STATEMENTS
DECEMBER 31, 2021
securities.securities are presented on the consolidated balance sheet at amortized cost at the end of each reporting period.
Held-to-maturity
Offering Costs
Offering costs consisted of legal, accounting and other expenses incurred through the Initial Public Offering that were directly related to the Initial Public Offering. Offering costs were allocated to the separable financial instruments issued in the Initial Public Offering based on a relative fair value basis, compared to total proceeds received. Offering costs associated with warrant liabilities were expensed as incurred in the consolidated statements of operations. Offering costs associated with the Class A ordinary shares were included in Accretion for Class A ordinary shares subject to redemption amount upon the completion of the Initial Public Offering.
Class A Ordinary Shares Subject to Possible Redemption
The Company accounts for its Class A ordinary shares subject to possible redemption in accordance with the guidance in Accounting Standards Codification (“ASC”) Topic 480 “Distinguishing Liabilities from Equity.” Class A ordinary shares subject to mandatory redemption are classified as a liability instrument and are measured at fair value. Conditionally redeemable Class A ordinary shares (including Class A ordinary shares that features redemption rights that are either within the control of the holder or subject to redemption upon the occurrence of uncertain events not solely within the Company’s control) are classified as temporary equity. At all other times, Class A ordinary shares are classified as shareholders’ equity. The Company’s Class A ordinary shares features certain redemption rights that are considered to be outside of the Company’s control and subject to occurrence of uncertain future events. Accordingly, at December 31, 2021, 34,500,000 Class A ordinary shares subject to possible redemption are presented as temporary equity, outside of the shareholders’ (deficit) equity section of the Company’s consolidated balance sheet.
The Company recognizes changes in redemption value immediately as they occur and adjusts the carrying value of redeemable ordinary shares to equal the redemption value at the end of each reporting period. Immediately upon the closing of the Initial Public Offering, the Company recognized the accretion from initial book value to redemption amount value. The change in the carrying value of redeemable Class A ordinary shares resulted in charges against additional
paid-in
capital and accumulated deficit.At December 31, 2021, the Class A ordinary shares reflected in the consolidated balance sheet are reconciled in the following table:
Gross proceeds | $ | 345,000,000 | ||
Less: | ||||
Proceeds allocated to Public Warrants | (11,270,000 | ) | ||
Class A ordinary shares issuance costs | (18,881,972 | ) | ||
Plus: | ||||
Accretion of carrying value to redemption value | 30,151,972 | |||
Class A ordinary shares subject to possible redemption | $ | 345,000,000 | ||
Warrant Liabilities
The Company does not use derivative instruments to hedge exposures to cash flow, market, or foreign currency risks. The Company evaluates all of its financial instruments, including issued stock purchase warrants,
F-43
TAILWIND TWO ACQUISITION CORP.
NOTES TO CONSOLIDATED FINANCIAL STATEMENTS
DECEMBER 31, 2021
to determine if such instruments are derivatives or contain features that qualify as embedded derivatives, pursuant to ASC 480 and FASB ASC Topic 815, “Derivatives and Hedging” (“ASC 815”). The Company accounts for the Warrants in accordance with the guidance contained in ASC
815-40
under which the Warrants do not meet the criteria for equity treatment and must be recorded as liabilities. Accordingly, the Company classifies the Warrants as liabilities at their fair value and adjust the Warrants to fair value at each reporting period. This liability is subject tore-measurement
at each balance sheet date until exercised, and any change in fair value is recognized in the statements of operations. The Private Placement Warrants and the Public Warrants for periods where no observable traded price was available are valued using a binomial lattice model. For periods subsequent to the detachment of the Public Warrants from the Units, the Public Warrant quoted market price will be used as the fair value of the Public Warrants as of each relevant date. The Private Placement Warrants utilize the inputs used for valuing the Public Warrants and, as such, are valued at the Public Warrant value price.Income Taxes
The Company accounts for income taxes under ASC Topic 740, “Income Taxes,” which prescribes a recognition threshold and a measurement attribute for the consolidated financial statement recognition and measurement of tax positions taken or expected to be taken in a tax return. For those benefits to be recognized, a tax position must be more likely than not to be sustained upon examination by taxing authorities. The Company’s management determined that the Cayman Islands is the Company’s major tax jurisdiction. The Company recognizes accrued interest and penalties related to unrecognized tax benefits as income tax expense. As of December 31, 2021 and 2020, there were 0 unrecognized tax benefits and 0amounts accrued for interest and penalties. The Company is currently not aware of any issues under review that could result in significant payments, accruals or material deviation from its position.
The Company is considered to be an exempted Cayman Islands company with no connection to any other taxable jurisdiction and is presently not subject to income taxes or income tax filing requirements in the Cayman Islands or the United States. As such, the Company’s tax provision was zero for the periods presented. The Company’s management does not expect that the total amount of unrecognized tax benefits will materially change over the next twelve months.
Net Income (Loss) Per Ordinary Share
The Company complies with accounting and disclosure requirements of FASB ASC Topic 260, “Earnings Per Share”. The Company has two classes of shares, which are referred to as Class A ordinary shares and Class B ordinary shares. Income and losses are shared pro rata between the two classes of shares. Net income (loss) per ordinary share is computed by dividing net income (loss) by the weighted average number of ordinary shares outstanding for the period. Accretion associated with the redeemable shares of Class A ordinary shares is excluded from earnings per share as the redemption value approximates fair value. The calculation of diluted income (loss) per ordinary share does not consider the effect of the warrants issued in connection with the (i) Initial Public Offering, and (ii) the private placement since the exercise of the warrants is contingent upon the occurrence of future events. The warrants are exercisable to purchase 19,300,000 Class A ordinary shares in the aggregate. As of December 31, 2021 and 2020, the Company did not have any dilutive securities or other contracts that could, potentially, be exercised or converted into ordinary shares and then share in the earnings of the Company. As a result, diluted net income (loss) per ordinary share is the same as basic net income (loss) per ordinary share for the periods presented.
F-44
TAILWIND TWO ACQUISITION CORP.
NOTES TO CONSOLIDATED FINANCIAL STATEMENTS
DECEMBER 31, 2021
The following table reflects the calculation of basic and diluted net income (loss) per ordinary share (in dollars, except share amounts):
Year Ended December 31, 2021 | For the Period from November 18, 2020 (Inception) through December 31, 2020 | |||||||||||||||
Class A | Class B | Class A | Class B | |||||||||||||
Basic and diluted net loss per ordinary share | ||||||||||||||||
Numerator: | ||||||||||||||||
Allocation of net loss | $ | (1,886,704 | ) | $ | (563,891 | ) | $ | — | $ | (6,093 | ) | |||||
Denominator: | ||||||||||||||||
Basic and diluted weighted average shares outstanding | 28,167,123 | 8,418,493 | — | 7,500,000 | ||||||||||||
Basic and diluted net loss per ordinary share | $ | (0.07 | ) | $ | (0.07 | ) | $ | — | $ | (0.00 | ) | |||||
Concentration of Credit Risk
Financial instruments that potentially subject the Company to concentrations of credit risk consist of a cash account in a financial institution, which, at times, may exceed the Federal Depository Insurance Corporation coverage limit of $250,000. The Company has not experienced losses on this account and management believes the Company is not exposed to significant risks on such account.
Fair Value of Financial Instruments
The fair value of the Company’s warrant liabilities does not approximate their carrying amount and as such, the warrant liabilities are recorded at fair value on the Company’s consolidated balance sheets. The fair value of the Company’s assets and other liabilities which qualify as financial instruments under ASC Topic 820, “Fair Value Measurement,” approximate the carrying amounts represented in the accompanying consolidated balance sheets, primarily due to their short-term nature, other than the warrant liabilities (see Note 9).
Recent Accounting Standards
In August 2020, the Financial Accounting Standards Board (“FASB”) issued Accounting Standards Update (“ASU”)
2020-06,
Debt — Debt with Conversion and Other Options (Subtopic470-20)
and Derivatives and Hedging — Contracts in Entity’s Own Equity (Subtopic815-40)
(“ASU2020-06”)
to simplify accounting for certain financial instruments. ASU2020-06
eliminates the current models that require separation of beneficial conversion and cash conversion features from convertible instruments and simplifies the derivative scope exception guidance pertaining to equity classification of contracts in an entity’s own equity. The new standard also introduces additional disclosures for convertible debt and freestanding instruments that are indexed to and settled in an entity’s own equity. ASU2020-06
amends the diluted earnings per share guidance, including the requirement to use theif-converted
method for all convertible instruments. ASU2020-06
is effective January 1, 2022 and should be applied on a full or modified retrospective basis, with early adoption permitted beginning on January 1, 2021. The Company adopted ASU2020-06
effective January 1, 2021. The adoption of ASU2020-06
did not have an impact on the Company’s consolidated financial statements.Management does not believe that any recently issued, but not yet effective, accounting standards, if currently adopted, would have a material effect on the Company’s consolidated financial statements.
F-45
TAILWIND TWO ACQUISITION CORP.
NOTES TO CONSOLIDATED FINANCIAL STATEMENTS
DECEMBER 31, 2021
NOTE 3. INITIAL PUBLIC OFFERING
Pursuant to the Initial Public Offering, the Company sold 34,500,000 Units, which includes a full exercise by the underwriters of their over-allotment option in the amount of 4,500,000 Units, at a purchase price of $10.00 per Unit. Each Unit consists of 1 Class A ordinary share and
1-third
of one redeemable warrant (“Public Warrant”). Each whole Public Warrant entitles the holder to purchase 1 Class A ordinary share at an exercise price of $11.50 per whole share (see Note 8).NOTE 4. PRIVATE PLACEMENT
Simultaneously with the closing of the Initial Public Offering, the Sponsor purchased an aggregate of 7,800,000 Private Placement Warrants at a price of $1.50 per Private Placement Warrant, for an aggregate purchase price of $11,700,000, in a private placement. Each Private Placement Warrant is exercisable to purchase 1 Class A ordinary share at a price of $11.50 per share, subject to adjustment (see Note 8). A portion of the proceeds from the Private Placement Warrants were added to the proceeds from the Initial Public Offering held in the Trust Account. If the Company does not complete a Business Combination within the Combination Period, the proceeds from the sale of the Private Placement Warrants will be used to fund the redemption of the Public Shares (subject to the requirements of applicable law) and the Private Placement Warrants will expire worthless.
NOTE 5. RELATED PARTY TRANSACTIONS
Founder Shares
On December 3, 2020, the Sponsor paid $25,000 to cover certain offering costs of the Company in consideration for 8,625,000 Class B ordinary shares (the “Founder Shares”). The Founder Shares included an aggregate of up to 1,125,000 shares that were subject to forfeiture depending on the extent to which the underwriters’ over-allotment option was exercised, so that the number of Founder Shares would equal, on an
as-converted
basis, approximately 20% of the Company’s issued and outstanding ordinary shares after the Initial Public Offering. As a result of the underwriters’ election to fully exercise their over-allotment option, a total of 1,125,000 Founder Shares are no longer subject to forfeiture.The Sponsor has agreed, subject to limited exceptions, not to transfer, assign or sell any of the Founder Shares until the earliest of: (A) one year after the completion of a Business Combination and (B) subsequent to a Business Combination, (x) if the closing price of the Class A ordinary shares equals or exceeds $12.00 per share (as adjusted for share
sub-divisions,
share dividends, rights issuances, reorganizations, recapitalizations and the like) for any 20 trading days within any30-
trading day period commencing at least 150 days after a Business Combination, or (y) the date on which the Company completes a liquidation, merger, share exchange or other similar transaction that results in all of the Public Shareholders having the right to exchange their Class A ordinary shares for cash, securities or other property.Administrative Services Agreement
The Company agreed, commencing on the March 9, 2021, through the earlier of the Company’s consummation of a Business Combination or its liquidation, to pay an affiliate of the Sponsor a total of $10,000 per month for office space, secretarial and administrative support services. For the year ended December 31, 2021, the Company incurred $100,000 in fees, of which such amount is included in accounts payable and accrued expenses in the accompanying consolidated balance sheet at December 31, 2021. There is 0 accrued administrative cost at December 31,
2020.
F-46
TAILWIND TWO ACQUISITION CORP.
NOTES TO CONSOLIDATED FINANCIAL STATEMENTS
DECEMBER 31, 2021
Promissory Note — Related Party
On November 23, 2020, the Company issued an unsecured promissory note (the “Promissory Note”) to the Sponsor, pursuant to which the Company could borrow up to an aggregate principal amount of $300,000. The Promissory Note was
non-interest
bearing and payable on the earlier of June 30, 2021 or the completion of the Initial Public Offering. The amount outstanding under the Promissory Note of $89,890 was repaid on March 12, 2021. Funds are no longer available under the Promissory Note.Related Party Loans
In order to finance transaction costs in connection with a Business Combination, the Sponsor or an affiliate of the Sponsor, or certain of the Company’s officers and directors may, but are not obligated to, loan the Company funds as may be required (“Working Capital Loans”). If the Company completes a Business Combination, the Company may repay the Working Capital Loans out of the proceeds of the Trust Account released to the Company. Otherwise, the Working Capital Loans may be repaid only out of funds held outside the Trust Account. In the event that a Business Combination does not close, the Company may use a portion of proceeds held outside the Trust Account to repay the Working Capital Loans, but no proceeds held in the Trust Account would be used to repay the Working Capital Loans. Except for the foregoing, the terms of such Working Capital Loans, if any, have not been determined and no written agreements exist with respect to such loans. The Working Capital Loans would either be repaid upon consummation of a Business Combination, without interest, or, at the lender’s discretion, up to $1,500,000 of such Working Capital Loans may be convertible into warrants of the post-Business Combination entity at a price of $1.50 per warrant. The warrants would be identical to the Private Placement Warrants. As of December 31, 2021 and 2020, there were 0 amounts outstanding under the Working Capital Loans.
NOTE 6. COMMITMENTS AND CONTINGENCIES
Risks and Uncertainties
Management continues to evaluate the impact of the
COVID-19
pandemic and has concluded that while it is reasonably possible that the virus could have a negative effect on the Company’s financial position, results of its operations and/or search for a target company, the specific impact is not readily determinable as of the date of these consolidated financial statements. The consolidated financial statements do not include any adjustments that might result from the outcome of this uncertainty.Registration and Shareholder Rights
Pursuant to a registration and shareholder rights agreement entered into on March 9, 2021, the holders of the Founder Shares, Private Placement Warrants and any warrants that may be issued upon conversion of Working Capital Loans (and any Class A ordinary shares issuable upon the exercise of the Private Placement Warrants and warrants that may be issued upon conversion of the Working Capital Loans) will be entitled to registration rights. The holders of these securities are entitled to make up to three demands, excluding short form demands, that the Company register such securities. In addition, the holders have certain “piggy-back” registration rights with respect to registration statements filed subsequent to the completion of a Business Combination. However, the registration and shareholder rights agreement provide that the Company will not permit any registration statement filed under the Securities Act to become effective until termination of the applicable lockup period. The registration rights agreement does not contain liquidating damages or other cash settlement provisions resulting from delays in registering the Company’s securities. The Company will bear the expenses incurred in connection with the filing of any such registration
statements.
F-47
TAILWIND TWO ACQUISITION CORP.
NOTES TO CONSOLIDATED FINANCIAL STATEMENTS
DECEMBER 31, 2021
Underwriting Agreement
The underwriters are entitled to a deferred fee of $0.35 per Unit, or $12,075,000 in the aggregate. The deferred fee will become payable to the underwriters from the amounts held in the Trust Account solely in the event that the Company completes a Business Combination, subject to the terms of the underwriting agreement.
Agreement and Plan of Merger
On October 28, 2021, the Company (here in after referred to as Tailwind Two in this Note 6) entered into an Agreement and Plan of Merger (as it may be amended, supplemented or otherwise modified from time to time, the “Merger Agreement”), by and among Tailwind Two, Titan Merger Sub, Inc., a Delaware corporation (“Merger Sub”), and Terran Orbital Corporation, a Delaware corporation (“Terran Orbital”).
The Business Combination
The Merger Agreement provides for, among other things, the following transactions on the closing date (collectively, the Terran Orbital Business Combination”): (i) Tailwind Two will become a Delaware corporation (the “Domestication”) and, in connection with the Domestication, (A) each outstanding Class A ordinary share of Tailwind Two will become one share of common stock, par value $0.0001 per share, of Tailwind Two (the “New Terran Orbital Common Stock”), (B) each outstanding Class B ordinary share of Tailwind Two will become one share of New Terran Orbital Common Stock, and (C) each outstanding warrant of Tailwind Two will become one warrant to purchase one share of New Terran Orbital Common Stock (D) the certificate of incorporation of Tailwind Two and the bylaws of Tailwind Two will be amended and restated; and (ii) following the Domestication, Merger Sub will merge with and into Terran Orbital, with Terran Orbital as the surviving company in the merger and, after giving effect to such merger, continuing as a wholly-owned subsidiary of Tailwind Two (the “Merger”) and Tailwind Two’s name will be changed to Terran Orbital Corporation.
Merger Consideration
In accordance with the terms and subject to the conditions of the Merger Agreement, issued and outstanding (i) shares of Terran Orbital (including any warrants of Terran Orbital which are exercised immediately prior to the Merger for shares of Terran Orbital in accordance with the terms of the Merger Agreement) will be converted into New Terran Orbital Common Stock, (ii) options to purchase shares of Terran Orbital (whether vested or unvested) will be cancelled in exchange for comparable options to purchase New Terran Orbital Common Stock, pursuant to the new incentive equity plan, and (iii) outstanding and unvested restricted stock and restricted stock units of Terran Orbital (including Employee Retention Share RSUs and Employee Retention Share Restricted Stock) will be cancelled in exchange for comparable restricted stock and restricted stock unit awards to be settled in New Terran Orbital Common Stock pursuant to the new incentive equity plan.
PIPE Financing (Private Placement)
Concurrently with the execution of the Merger Agreement, Tailwind Two entered into subscription agreements (the “Subscription Agreements”) with certain investors (the “PIPE Investors”) and an affiliate of Mr. Daniel Staton, a director and shareholder of Terran Orbital (the “Insider PIPE Investor”, and together with the PIPE Investors, the “Investors”). Pursuant to the Subscription Agreements, the Investors agreed to subscribe for and purchase, and Tailwind Two agreed to issue and sell to such Investors, immediately prior to the closing of the Terran Orbital Business Combination, an aggregate of 5,080,409 shares of New Terran Orbital Common Stock for a purchase price of $10.00 per share, for aggregate gross proceeds of approximately $50.8 million (the “PIPE Financing”). The closing of the PIPE Financing is contingent upon, among other things, the substantially
F-48
TAILWIND TWO ACQUISITION CORP.
NOTES TO CONSOLIDATED FINANCIAL STATEMENTS
DECEMBER 31, 2021
concurrent consummation of the Terran Orbital Business Combination. The Subscription Agreements provide that Tailwind Two will grant the investors in the PIPE Financing certain customary registration rights. Tailwind Two will, within 45 days after the consummation of the Terran Orbital Business Combination, file with the SEC a registration statement registering the resale of such shares of New Terran Orbital Common Stock and will use its commercially reasonable efforts to have such registration statement declared effective as soon as practicable after the filing thereof.
The Merger Agreement contains customary representations, warranties and covenants by the parties thereto and the closing is subject to certain conditions as further described in the Merger Agreement.
For additional information, refer to the Company’s Current Report on Form
8-K/A,
as filed with the SEC on October 29, 2021.NOTE 7. SHAREHOLDERS’ (DEFICIT) EQUITY
Preference Shares
Class
A Ordinary Shares
Class
B Ordinary Shares
Holders of Class A ordinary shares and Class B ordinary shares will vote together as a single class on all other matters submitted to a vote of shareholders, except that, prior to a Business Combination, only holders of the Class B ordinary shares will be entitled to vote on the appointment of directors, and except as required by law. Only holders of the Class B ordinary shares will have the right to vote on the election of directors prior to the Business Combination. The Class B ordinary shares will automatically convert into Class A ordinary shares at the time of a Business Combination or earlier at the option of the holders thereof at a ratio such that the number of Class A ordinary shares issuable upon conversion of all Founder Shares will equal, in the aggregate, on an
as-converted
basis, 20% of the sum of (i) the total number of ordinary shares issued and outstanding upon completion of the Initial Public Offering, plus (ii) the total number of Class A ordinary shares issued or deemed issued or issuable upon conversion or exercise of any equity-linked securities or rights issued or deemed issued, by the Company in connection with or in relation to the consummation of a Business Combination, excluding Class A ordinary shares or equity-linked securities exercisable for or convertible into Class A ordinary shares issued, deemed issued, or to be issued, to any seller in a Business Combination and any Private Placement Warrants issued to the Sponsor, its affiliates or any member of the Company’s management team upon conversion of Working Capital Loans. In no event will the Class B ordinary shares convert into Class A ordinary shares at a rate of less thanone-to-one.
F-49
TAILWIND TWO ACQUISITION CORP.
NOTES TO CONSOLIDATED FINANCIAL STATEMENTS
DECEMBER 31, 2021
NOTE 8. WARRANT LIABILITIES
As of December 31, 2021, there were 11,500,000 Public Warrants outstanding. Public Warrants may only be exercised for a whole number of shares. No fractional shares will be issued upon exercise of the Public Warrants. At December 31, 2020, there were 0 Public Warrants outstanding. The Public Warrants will become exercisable on the later of (a) 30 days after the completion of a Business Combination and (b) one year from the closing of the Initial Public Offering. The Public Warrants will expire five years from the completion of a Business Combination or earlier upon redemption or liquidation.
The Company will not be obligated to deliver any Class A ordinary shares pursuant to the exercise of a warrant and will have no obligation to settle such warrant exercise unless a registration statement under the Securities Act with respect to the Class A ordinary shares underlying the warrants is then effective and a prospectus relating thereto is current, subject to the Company satisfying its obligations with respect to registration, or a valid exemption from registration is available. No Public Warrant will be exercisable for cash or on a cashless basis and the Company will not be obligated to issue a Class A ordinary share upon exercise of a warrant unless the Class A ordinary share issuable upon such warrant exercise has been registered, qualified or deemed to be exempt under the securities laws of the state of residence of the registered holder of the warrants.
The Company has agreed that as soon as practicable, but in no event later than 20 business days, after the closing of a Business Combination, it will use its commercially reasonable efforts to file with the SEC a registration statement for the registration, under the Securities Act, of the Class A ordinary shares issuable upon exercise of the warrants, and the Company will use its commercially reasonable efforts to cause the same to become effective within 60 business days after the closing of a Business Combination, and to maintain the effectiveness of such registration statement and a current prospectus relating to those Class A ordinary shares until the warrants expire or are redeemed, as specified in the warrant agreement; provided that if the Class A ordinary shares are at the time of any exercise of a warrant not listed on a national securities exchange such that they satisfy the definition of a “covered security” under Section 18(b)(1) of the Securities Act, the Company may, at its option, require holders of Public Warrants who exercise their warrants to do so on a “cashless basis” in accordance with Section 3(a)(9) of the Securities Act and, in the event the Company so elects, the Company will not be required to file or maintain in effect a registration statement, but the Company will use its commercially reasonable efforts to register or qualify the shares under applicable blue sky laws to the extent an exemption is not available. If a registration statement covering the Class A ordinary shares issuable upon exercise of the warrants is not effective by the 60th day after the closing of a Business Combination, warrant holders may, until such time as there is an effective registration statement and during any period when the Company will have failed to maintain an effective registration statement, exercise warrants on a “cashless basis” in accordance with Section 3(a)(9) of the Securities Act or another exemption, but the Company will use its commercially reasonable efforts to register or qualify the shares under applicable blue sky laws to the extent an exemption is not available.
Redemption of warrants when the price per Class
A ordinary share equals or exceeds
$18.00.
| • | in whole and not in part; |
| • | at a price of $0.01 per warrant; |
| • | upon not less than of 30 days’ prior written notice of redemption to each warrant holder; and |
F-50
TAILWIND TWO ACQUISITION CORP.
NOTES TO CONSOLIDATED FINANCIAL STATEMENTS
DECEMBER 31, 2021
| • | if, and only if, the closing price of the Class A ordinary shares equals or exceeds $18.00 per share (as adjusted) for any 20 trading days within a 30-trading day period ending three trading days before the Company sends the notice of redemption to the warrant holders. |
If and when the warrants become redeemable by the Company, the Company may exercise its redemption right even if it is unable to register or qualify the underlying securities for sale under all applicable state securities laws.
Redemption of warrants when the price per Class
A ordinary share equals or exceeds
$10.00.
| • | in whole and not in part; |
| • | at $0.10 per warrant upon a minimum of 30 days’ prior written notice of redemption; provided that holders will be able to exercise their warrants on a cashless basis prior to redemption and receive that number of shares determined based on the redemption date and the fair market value of the Class A ordinary shares; |
| • | if, and only if, the closing price of the Class A ordinary shares equal or exceeds $10.00 per Public Share (as adjusted) for any 20 trading days within the 30-trading day period ending three trading days before the Company send the notice of redemption of the warrant holders; and |
| • | if the closing price of the Class A ordinary shares for any 20 trading days within a 30-trading day period ending on the third trading day prior to the date on which the Company sends the notice of redemption to the warrant holders is less than $18.00 per share (as adjusted), the Private Placement Warrants must also be concurrently called for redemption on the same terms as the outstanding Public Warrants, as described above. |
If the Company calls the Public Warrants for redemption, as described above, its management will have the option to require any holder that wishes to exercise the Public Warrants to do so on a “cashless basis,” as described in the warrant agreement. The exercise price and number of ordinary shares issuable upon exercise of the Public Warrants may be adjusted in certain circumstances including in the event of a share dividend, extraordinary dividend or recapitalization, reorganization, merger or consolidation. However, except as described below, the Public Warrants will not be adjusted for issuances of ordinary shares at a price below its exercise price. Additionally, in no event will the Company be required to net cash settle the Public Warrants. If the Company is unable to complete a Business Combination within the Combination Period and the Company liquidates the funds held in the Trust Account, holders of Public Warrants will not receive any of such funds with respect to their Public Warrants, nor will they receive any distribution from the Company’s assets held outside of the Trust Account with respect to such Public Warrants. Accordingly, the Public Warrants may expire worthless.
In addition, if (x) the Company issues additional Class A ordinary shares or equity-linked securities for capital raising purposes in connection with the closing of a Business Combination at an issue price or effective issue price of less than $9.20 per Class A ordinary share (with such issue price or effective issue price to be determined in good faith by the Company’s board of directors and, in the case of any such issuance to the Sponsor or its affiliates, without taking into account any Founder Shares held by the Sponsor or such affiliates, as applicable, prior to such issuance) (the “Newly Issued Price”), (y) the aggregate gross proceeds from such issuances represent more than 60% of the total equity proceeds, and interest thereon, available for the funding of a Business Combination on the date of the consummation of a Business Combination (net of redemptions), and (z) the volume weighted average trading price of its Class A ordinary shares during the 20 trading day period starting on the trading day prior to the day on which the Company consummates its Business Combination (such
F-51
TAILWIND TWO ACQUISITION CORP.
NOTES TO CONSOLIDATED FINANCIAL STATEMENTS
DECEMBER 31, 2021
price, the “Market Value”) is below $9.20 per share, the exercise price of the warrants will be adjusted (to the nearest cent) to be equal to 115% of the higher of the Market Value and the Newly Issued Price, and the $18.00 per share redemption trigger price will be adjusted (to the nearest cent) to be equal to 180% of the higher of the Market Value and the Newly Issued Price, and the $10.00 per share redemption trigger price will be adjusted (to the nearest cent) to be equal to the higher of the Market Value and the Newly Issued Price.
At December 31, 2021, there were 7,800,000 Private Placement Warrants outstanding. At December 31, 2020, there were 0 Private Placement Warrants outstanding. The Private Placement Warrants are identical to the Public Warrants underlying the Units sold in the Initial Public Offering, except that the Private Placement Warrants and the Class A ordinary shares issuable upon the exercise of the Private Placement Warrants will not be transferable, assignable or salable until 30 days after the completion of a Business Combination, subject to certain limited exceptions. Additionally, the Private Placement Warrants will be exercisable on a cashless basis and be
non-redeemable,
except as described above under “Redemption of Warrants when the price per Class A ordinary share equals, so long as they are held by the initial purchasers or their permitted transferees. If the Private Placement Warrants are held by someone other than the initial purchasers or their permitted transferees, the Private Placement Warrants will be redeemable by the Company and exercisable by such holders on the same basis as the Public Warrants.NOTE 9. FAIR VALUE MEASUREMENTS
The fair value of the Company’s financial assets and liabilities reflects management’s estimate of amounts that the Company would have received in connection with the sale of the assets or paid in connection with the transfer of the liabilities in an orderly transaction between market participants at the measurement date. In connection with measuring the fair value of its assets and liabilities, the Company seeks to maximize the use of observable inputs (market data obtained from independent sources) and to minimize the use of unobservable inputs (internal assumptions about how market participants would price assets and liabilities). The following fair value hierarchy is used to classify assets and liabilities based on the observable inputs and unobservable inputs used in order to value the assets and liabilities:
| Level 1: | Quoted prices in active markets for identical assets or liabilities. An active market for an asset or liability is a market in which transactions for the asset or liability occur with sufficient frequency and volume to provide pricing information on an ongoing basis. | |
| Level 2: | Observable inputs other than Level 1 inputs. Examples of Level 2 inputs include quoted prices in active markets for similar assets or liabilities and quoted prices for identical assets or liabilities in markets that are not active. | |
| Level 3: | Unobservable inputs based on our assessment of the assumptions that market participants would use in pricing the asset or liability. | |
The Company classifies its U.S. Treasury and equivalent securities asin accordance with ASC Topic 320 “Investments—Debt and Equity Securities.”securities are those securities which the Company has the ability and intent to hold until maturity.treasury securities are recorded at amortized cost on the accompanying consolidated balance sheets and adjusted for the amortization or accretion of premiums or discounts.
held-to-maturity
Held-to-maturity
Held-to-maturity
At December 31, 2021, assets held in the Trust Account were comprised of $1,188 in cash and $345,088,635 in U.S. Treasury securities. During the year ended December 31, 2021, the Company did not withdraw any interest income from the Trust Account.
F-52
TAILWIND TWO ACQUISITION CORP.
NOTES TO CONSOLIDATED FINANCIAL STATEMENTS
DECEMBER 31, 2021
The following table presents information about the gross holding gain and fair value ofsecurities at December 31, 2021:
held-to-maturity
Held-To-Maturity | Amortized Cost | Gross Holding Gain | Fair Value | |||||||||||
December 31, 2021 | U.S. Treasury Securities (Mature on 01/04/2022) (1) | $ | 345,088,635 | $ | 1,365 | $ | 345,090,000 | |||||||
| (1) | On January 4, 2022, the U.S. Treasury Securities matured and were reinvested on similar instruments. As of the date of these financial statements, the U.S. Treasury Securities held by the company are set to mature on May 19, 2022. |
The following table presents information about the Company’s assets and liabilities that are measured at fair value on a recurring basis at December 31, 2021, and indicates the fair value hierarchy of the valuation inputs the Company utilized to determine such fair value:
Description | Level | December 31, 2021 | ||||||
Liabilities: | ||||||||
Warrant Liability – Public Warrants | 1 | $ | 9,775,000 | |||||
Warrant Liability – Private Placement Warrants | 2 | $ | 6,630,000 | |||||
Initially, the Warrants were valued using a binomial lattice model, which is considered to be a Level 3 fair value measurement. The binomial lattice model’s primary unobservable input utilized in determining the fair value of the Warrants is the expected volatility of the ordinary shares. The expected volatility as of the Initial Public Offering date was derived from observable public warrant pricing on comparable ‘blank-check’ companies without an identified target. For periods subsequent to the detachment of the Public Warrants from the Units, the close price of the Public Warrant price was used as the fair value as of each relevant date. The subsequent measurements of the Public Warrants after the detachment of the Public Warrants from the Units are classified as Level 1 due to the use of an observable market quote in an active market. The subsequent measurements of the Private Placement Warrants after the detachment of the Public Warrants from the Units are classified as Level 2 due to the use of an observable market quote for a similar asset in an active market.
The following table presents the changes in the fair value of warrant liabilities (level 3 measurements):
Private Placement | Public | Warrant Liabilities | ||||||||||
Fair value as of January 1, 2021 | $ | — | $ | — | $ | — | ||||||
Initial measurement on March 9, 2021 | 7,644,000 | 11,270,000 | 18,914,000 | |||||||||
Change in fair value | 156,000 | 230,000 | 386,000 | |||||||||
Transfer to Level 1 | — | (11,500,000 | ) | (11,500,000 | ) | |||||||
Transfer to Level 2 | (7,800,000 | ) | — | (7,800,000 | ) | |||||||
Fair value as of December 31, 2021 | $ | — | $ | — | $ | — | ||||||
Transfers to/from Levels 1, 2 and 3 are recognized at the end of the reporting period in which a change in valuation technique or methodology occurs. The estimated fair value of the Public Warrants transferred from a
F-53
TAILWIND TWO ACQUISITION CORP.
NOTES TO CONSOLIDATED FINANCIAL STATEMENTS
DECEMBER 31, 2021
Level 3 measurement to a Level 1 fair value measurement during the year ended December 31, 2021 was $11,500,000. The estimated fair value of the Private Warrants transferred from a Level 3 measurement to a Level 2 fair value measurement during the year ended December 31, 2021 was $7,800,000.
NOTE 10. SUBSEQUENT EVENTS
The Company evaluated subsequent events and transactions that occurred after the balance sheet date up to March 18, 2022 the date that the consolidated financial statements were issued. Based upon this review, other than as described below, the Company did not identify any subsequent events that would have required adjustment or disclosure in the consolidated financial statements.
In February 2022, the Russian Federation and Belarus commenced a military action with the country of Ukraine. As a result of this action, various nations, including the United States, have instituted economic sanctions against the Russian Federation and Belarus. Further, the impact of this action and related sanctions on the world economy are not determinable as of the date of these financial statements. The specific impact on the Company’s financial condition, results of operations, and cash flows is also not determinable as of the date of these financial statements.
F-54
Report of Independent Registered Public Accounting Firm
To the Shareholders and Board of Directors
Terran Orbital Corporation:
Opinion on the Consolidated Financial Statements
We have audited the accompanying consolidated balance sheets of Terran Orbital Corporation and subsidiaries (the Company) as of December 31, 2021 and 2020, the related consolidated statements of operations and comprehensive loss, shareholders’ deficit, and cash flows for each of the years then ended, and the related notes (collectively, the consolidated financial statements). In our opinion, the consolidated financial statements present fairly, in all material respects, the financial position of the Company as of December 31, 2021 and 2020, and the results of its operations and its cash flows for each of the years then ended, in conformity with U.S. generally accepted accounting principles.
Basis for Opinion
These consolidated financial statements are the responsibility of the Company’s management. Our responsibility is to express an opinion on these consolidated financial statements based on our audits. We are a public accounting firm registered with the Public Company Accounting Oversight Board (United States) (PCAOB) and are required to be independent with respect to the Company in accordance with the U.S. federal securities laws and the applicable rules and regulations of the Securities and Exchange Commission and the PCAOB.
We conducted our audits in accordance with the standards of the PCAOB and in accordance with auditing standards generally accepted in the United States of America. Those standards require that we plan and perform the audit to obtain reasonable assurance about whether the consolidated financial statements are free of material misstatement, whether due to error or fraud. Our audits included performing procedures to assess the risks of material misstatement of the consolidated financial statements, whether due to error or fraud, and performing procedures that respond to those risks. Such procedures included examining, on a test basis, evidence regarding the amounts and disclosures in the consolidated financial statements. Our audits also included evaluating the accounting principles used and significant estimates made by management, as well as evaluating the overall presentation of the consolidated financial statements. We believe that our audits provide a reasonable basis for our opinion.
/s/ KPMG LLP
We have served as the Company’s auditor since 2021.
Irvine, California
March 31, 2022
F-55
TERRAN ORBITAL CORPORATION
Consolidated Balance Sheets
(In thousands, except share and per share amounts)
December 31, | ||||||||
2021 | 2020 | |||||||
Assets: | ||||||||
Cash and cash equivalents | $ | 27,325 | $ | 12,336 | ||||
Accounts receivable, net of allowance for credit losses of $945 and $635 as of December 31, 2021 and 2020, respectively | 3,723 | 2,526 | ||||||
Contract assets | 2,757 | 1,859 | ||||||
Inventory | 7,783 | 2,819 | ||||||
Prepaid expenses and other current assets | 57,639 | 5,216 | ||||||
Total current assets | 99,227 | 24,756 | ||||||
Property, plant and equipment, net | 35,530 | 19,521 | ||||||
Other assets | 639 | — | ||||||
Total assets | $ | 135,396 | $ | 44,277 | ||||
Liabilities, mezzanine equity and shareholders’ deficit: | ||||||||
Current portion of long-term debt | $ | 14 | $ | 1,403 | ||||
Accounts payable | 9,366 | 2,904 | ||||||
Contract liabilities | 17,558 | 18,069 | ||||||
Reserve for anticipated losses on contracts | 886 | 2,220 | ||||||
Accrued expenses and other current liabilities | 76,136 | 2,631 | ||||||
Total current liabilities | 103,960 | 27,227 | ||||||
Long-term debt | 115,134 | 35,629 | ||||||
Warrant liabilities | 5,631 | — | ||||||
Other liabilities | 2,028 | 512 | ||||||
Total liabilities | 226,753 | 63,368 | ||||||
Commitments and contingencies (Note 12) | 0 | 0 | ||||||
Mezzanine equity: | ||||||||
Redeemable convertible preferred stock - authorized 744,130 shares of $0.0001 par value; issued and outstanding shares of 396,870 as of December 31, 2021 and 2020 | 8,000 | 8,000 | ||||||
Shareholders’ deficit: | ||||||||
Common stock - authorized 5,500,000 and 5,000,000 shares of $0.0001 par value; issued and outstanding shares of 2,849,414 and 2,439,634 as of December 31, 2021 and 2020, respectively | — | 0— | ||||||
Additional paid-in capital | 97,745 | 7,454 | ||||||
Accumulated deficit | (197,066 | ) | (58,084 | ) | ||||
Accumulated other comprehensive loss | (36 | ) | (204 | ) | ||||
Non-controlling interest | — | 23,743 | ||||||
Total shareholders’ deficit | (99,357 | ) | (27,091 | ) | ||||
Total liabilities, mezzanine equity and shareholders’ deficit | $ | 135,396 | $ | 44,277 | ||||
The accompanying notes are an integral part of these consolidated financial statements.
F-56
TERRAN ORBITAL CORPORATION
Consolidated Statements of Operations and Comprehensive Loss
(In thousands, except share and per share amounts)
Years Ended December 31, | ||||||||
2021 | 2020 | |||||||
Revenue | $ | 40,906 | $ | 24,879 | ||||
Cost of sales | 33,912 | 16,860 | ||||||
Gross profit | 6,994 | 8,019 | ||||||
Selling, general, and administrative expenses | 43,703 | 17,438 | ||||||
Loss from operations | (36,709 | ) | (9,419 | ) | ||||
Interest expense, net | 7,965 | 1,216 | ||||||
Loss on extinguishment of debt | 96,024 | — | ||||||
Change in fair value of warrant and derivative liabilities | (1,716 | ) | — | |||||
Other (income) expense | (38 | ) | 4 | |||||
Loss before income taxes | (138,944 | ) | (10,639 | ) | ||||
Provision for (benefit from) income taxes | 38 | (184 | ) | |||||
Net loss | (138,982 | ) | (10,455 | ) | ||||
Other comprehensive income (loss), net of tax: | ||||||||
Foreign currency translation adjustments | 168 | (194 | ) | |||||
Total comprehensive loss | $ | (138,814 | ) | $ | (10,649 | ) | ||
Weighted-average shares outstanding - basic and diluted | 2,780,993 | 2,403,755 | ||||||
Net loss per share - basic and diluted | $ | (49.98 | ) | $ | (4.35 | ) | ||
The accompanying notes are an integral part of these consolidated financial statements.
F-57
TERRAN ORBITAL CORPORATION
Consolidated Statements of Shareholders’ Deficit
(In thousands, except share amounts)
Mezzanine Equity Redeemable Convertible Preferred Stock | Shareholders’ Deficit | |||||||||||||||||||||||||||||||||||
Common Stock | Additional Paid-in | Accumulated | Accumulated Other Comprehensive | Non-controlling | Total Shareholders’ | |||||||||||||||||||||||||||||||
Shares | Amounts | Shares | Amounts | Capital | Deficit | Loss | Interest | Deficit | ||||||||||||||||||||||||||||
Balance as of December 31, 2019 | 396,870 | $ | 8,000 | 2,407,946 | $ | — | $ | 6,111 | $ | (47,629 | ) | $ | (10 | ) | $ | 9,268 | $ | (32,260 | ) | |||||||||||||||||
Net loss | — | — | — | — | — | (10,455 | ) | — | — | (10,455 | ) | |||||||||||||||||||||||||
Other comprehensive loss, net of tax | — | — | — | — | — | — | (194 | ) | — | (194 | ) | |||||||||||||||||||||||||
Contributions from non-controlling interest, net of issuance costs | — | — | — | — | — | — | — | 14,475 | 14,475 | |||||||||||||||||||||||||||
Share-based compensation | — | — | (6,250 | ) | — | 1,230 | — | — | — | 1,230 | ||||||||||||||||||||||||||
Exercise of stock options | — | — | 37,938 | — | 113 | — | — | — | 113 | |||||||||||||||||||||||||||
Balance as of December 31, 2020 | 396,870 | $ | 8,000 | 2,439,634 | $ | — | $ | 7,454 | $ | (58,084 | ) | $ | (204 | ) | $ | 23,743 | $ | (27,091 | ) | |||||||||||||||||
Net loss | — | — | — | — | — | (138,982 | ) | — | — | (138,982 | ) | |||||||||||||||||||||||||
Other comprehensive income, net of tax | — | — | — | — | — | — | 168 | — | 168 | |||||||||||||||||||||||||||
Issuance of common stock in exchange for non-controlling interest, net of issuance costs | — | — | 388,064 | — | 23,311 | — | — | (23,743 | ) | (432 | ) | |||||||||||||||||||||||||
Issuance of warrants, net of issuance costs | — | — | — | — | 66,060 | — | — | — | 66,060 | |||||||||||||||||||||||||||
Share-based compensation | — | — | — | — | 678 | — | — | — | 678 | |||||||||||||||||||||||||||
Exercise of stock options | — | — | 21,716 | — | 242 | — | — | — | 242 | |||||||||||||||||||||||||||
Balance as of December 31, 2021 | 396,870 | $ | 8,000 | 2,849,414 | $ | — | $ | 97,745 | $ | (197,066 | ) | $ | (36 | ) | $ | — | $ | (99,357 | ) | |||||||||||||||||
The accompanying notes are an integral part of these consolidated financial statements.
F-58
TERRAN ORBITAL CORPORATION
Consolidated Statements of Cash Flows
(In thousands)
Years Ended December 31, | ||||||||
2021 | 2020 | |||||||
Cash flows from operating activities: | ||||||||
Net loss | $ | (138,982 | ) | $ | (10,455 | ) | ||
Adjustments to reconcile net loss to net cash used in operating activities: | ||||||||
Depreciation and amortization | 3,053 | 2,934 | ||||||
Non-cash interest expense | 7,908 | 1,286 | ||||||
Share-based compensation expense | 678 | 1,194 | ||||||
Provision for losses on receivables and inventory | 877 | 1,690 | ||||||
Loss on extinguishment of debt | 96,024 | — | ||||||
Change in fair value of warrant and derivative liabilities | (1,716 | ) | — | |||||
Other non-cash, net | (567 | ) | (13 | ) | ||||
Changes in operating assets and liabilities: | ||||||||
Accounts receivable, net | (1,687 | ) | (1,980 | ) | ||||
Contract assets | (901 | ) | (195 | ) | ||||
Inventory | (5,393 | ) | (3,188 | ) | ||||
Prepaid expenses and other current assets | 596 | (4,058 | ) | |||||
Accounts payable | 2,161 | (438 | ) | |||||
Contract liabilities | (229 | ) | 6,591 | |||||
Reserve for anticipated losses on contracts | (1,322 | ) | (4,796 | ) | ||||
Accrued expenses and other current liabilities | 4,634 | (123 | ) | |||||
Other, net | (21 | ) | 77 | |||||
Net cash used in operating activities | (34,887 | ) | (11,474 | ) | ||||
Cash flows from investing activities: | ||||||||
Purchases of property, plant and equipment | (16,352 | ) | (7,325 | ) | ||||
Net cash used in investing activities | (16,352 | ) | (7,325 | ) | ||||
Cash flows from financing activities: | ||||||||
Proceeds from long-term debt | 58,241 | 2,537 | ||||||
Proceeds from warrants and derivatives | 16,759 | — | ||||||
Contributions from non-controlling interest, net of issuance costs | — | 14,475 | ||||||
Repayment of long-term debt | (10 | ) | (15 | ) | ||||
Payment of issuance costs | (8,880 | ) | (2,009 | ) | ||||
Proceeds from exercise of stock options | 242 | 113 | ||||||
Net cash provided by financing activities | 66,352 | 15,101 | ||||||
Effect of exchange rate fluctuations on cash and cash equivalents | (124 | ) | 138 | |||||
Net increase (decrease) in cash and cash equivalents | 14,989 | (3,560 | ) | |||||
Cash and cash equivalents at beginning of period | 12,336 | 15,896 | ||||||
Cash and cash equivalents at end of period | $ | 27,325 | $ | 12,336 | ||||
Supplemental disclosure of cash flow information: | ||||||||
Share-based compensation included in inventory | $ | — | $ | 36 | ||||
Non-cash investing and financing activities: | ||||||||
Purchases of property, plant and equipment not yet paid | 845 | 125 | ||||||
Non-cash interest capitalized to property, plant and equipment | 1,265 | 119 | ||||||
Depreciation and amortization capitalized to construction in process | 479 | — | ||||||
Issuance costs not yet paid | 4,141 | — | ||||||
Non-cash exchange and extinguishment of long-term debt | 125,857 | — | ||||||
Issuance of common stock in exchange for non-controlling interest | 23,743 | — | ||||||
The accompanying notes are an integral part of these consolidated financial statements.
F-59
TERRAN ORBITAL CORPORATION
Notes to the Consolidated Financial Statements
Note 1 Organization and Summary of Significant Accounting Policies
Organization and Business
Terran Orbital Corporation and its subsidiaries (the “Company”) is a leading manufacturer of small satellites primarily serving the United States (“U.S.”) aerospace and defense industry. Through its subsidiary Tyvak Nano-Satellite Systems, Inc. (“Tyvak”), the Company provides end-to-end satellite solutions by combining satellite design, production, launch planning, mission operations, and in-orbit support to meet the needs of its customers. The Company accesses the international market through both Tyvak and its Torino, Italy based subsidiary, Tyvak International S.R.L. (“Tyvak International”). Through its subsidiary PredaSAR Corporation (“PredaSAR”), the Company is developing what it believes will be the world’s largest, most advanced NextGen Earth observation constellation to provide persistent, real-time Earth imagery.
Tailwind Two Merger
On October 28, 2021, the Company entered into a merger agreement (together with subsequent amendments, the “Merger Agreement”) with Tailwind Two Acquisition Corp. (“Tailwind Two”), a publicly listed special purpose acquisition company. On March 25, 2022, the Company completed the merger with Tailwind Two (the “Tailwind Two Merger”), which resulted in the Company becoming a wholly-owned subsidiary of Tailwind Two. In connection with the Tailwind Two Merger, Tailwind Two was renamed Terran Orbital Corporation (“New Terran Orbital”) and the Company was renamed Terran Orbital Operating Corporation. As a result of the Tailwind Two Merger, all of the Company’s issued and outstanding common stock was converted into shares of New Terran Orbital’s common stock using an exchange ratio of 27.585 shares of New Terran Orbital common stock per each share of the Company’s common stock. In addition, the Company’s convertible preferred stock and certain warrants were exercised and converted into shares of the Company’s common stock immediately prior to the Tailwind Two Merger, and in turn, were converted into shares of New Terran Orbital’s common stock as a result of the Tailwind Two Merger. Further, in connection with the Tailwind Two Merger, the Company’s share-based compensation plan and related share-based compensation awards were cancelled and exchanged or converted, as applicable, with a new share-based compensation plan and related share-based compensation awards of New Terran Orbital.
While the Company became a wholly-owned subsidiary of New Terran Orbital, the Company is deemed to be the acquirer in the Tailwind Two Merger for accounting purposes. Accordingly, the Tailwind Two Merger will be accounted for as a reverse recapitalization, in which case the net assets of Tailwind Two will be stated at historical cost and 0 goodwill or other intangible assets will be recorded in connection with the Tailwind Two Merger. The treatment of the Tailwind Two Merger as a reverse recapitalization is based upon the
pre-merger
shareholders of the Company holding the majority of the voting interests of New Terran Orbital, the Company’s existing management team serving as the initial management team of New Terran Orbital, the Company’s appointment of the majority of the initial board of directors of New Terran Orbital, and the Company’s operations comprising the ongoing operations of New Terran Orbital.In connection with the Tailwind Two Merger, approximately $29 million of cash and marketable securities held in trust, net of redemptions by Tailwind Two’s public shareholders, became available for use by New Terran Orbital as well as approximately $51 million of cash that was raised by Tailwind Two through a contemporaneous sale of common stock in connection with the closing of a PIPE investment (the “PIPE Investment”). In addition, the Company received additional proceeds from the issuance of debt contemporaneously with the Tailwind Two Merger. The cash available for use by New Terran Orbital will be used for general corporate purposes as well as to pay for transaction costs incurred by both the Company and Tailwind Two, deferred underwriting fees related to Tailwind Two’s initial public offering, portions of the Company’s outstanding debt and other costs directly or indirectly attributable to the Tailwind Two Merger.
F-60
Further information regarding the Tailwind Two Merger is included in the respective notes that follow.
Basis of Presentation and Significant Accounting Policies
The preparation of the consolidated financial statements in accordance with generally accepted accounting principles in the U.S. (“GAAP”) requires the Company to select accounting policies and make estimates that affect amounts reported in the consolidated financial statements and the accompanying notes. The Company’s estimates are based on the relevant information available at the end of each period. Actual results could differ materially from these estimates under different assumptions or market conditions.
The consolidated financial statements include the accounts of Terran Orbital Corporation and its subsidiaries, and have been prepared in U.S. dollars in accordance with GAAP. All intercompany transactions have been eliminated.
Information on accounting policies and methods related to revenue and receivables, inventory, property, plant and equipment, debt, warrants and derivatives, fair value of financial instruments, mezzanine equity and shareholders’ deficit, share-based compensation, net loss per share, income taxes, commitments and contingencies, and segment information is included in the respective notes that follow. Below is a discussion of accounting policies and methods used in the consolidated financial statements that are not presented in other notes.
COVID-19
PandemicDuring March 2020, the World Health Organization declared the outbreak of a novel coronavirus as a pandemic (the
“COVID-19
Pandemic”), which has become increasingly widespread across the globe. TheCOVID-19
Pandemic has negatively impacted the global economy, disrupted global supply chains, and created significant volatility and disruption in the financial and capital markets.The
COVID-19
Pandemic has contributed to a worldwide shortage of electronic components which has resulted in longer than historically experienced lead times for such electronic components. The reduced availability to receive electronic components used in the Company’s operations has negatively affected its timing and ability to deliver products and services to customers as well as increased its costs during 2021 and 2020. The Company considered the emergence and pervasive economic impact of theCOVID-19
Pandemic in its assessment of its financial position, results of operations, cash flows, and certain accounting estimates as of and for the years ended December 31, 2021 and 2020. Due to the evolving and uncertain nature of theCOVID-19
Pandemic, it is possible that the effects of theCOVID-19
Pandemic could materially impact the Company’s estimates and consolidated financial statements in future reporting periods.Foreign Currency Translation and Transaction Gains and Losses
The Company’s reporting currency is the U.S. dollar. The financial statements of the Company’s foreign subsidiary are translated from its functional currency, which is the Euro, into U.S. dollars using the foreign exchange rates applicable to the dates of the financial statements. Assets and liabilities are translated using thespot foreign exchange rate. Revenue, expenses and cash flows are translated at the average foreign exchange rate for each period. Equity accounts are translated at historical foreign exchange rates. The effects of these foreign currency translation adjustments are reported as a component of accumulated other comprehensive income (loss) (“AOCI”) in the consolidated balance sheets.
end-of-period
For any transaction that is denominated in a currency different from the entity’s functional currency, a gain or loss is recognized in other (income) expense in the consolidated statements of operations and comprehensive loss based on the difference between the foreign exchange rate at the transaction date and the foreign exchange rate at the transaction settlement date orrate, if unsettled.
end-of-period
F-61
Cash and Cash Equivalents
Cash and cash equivalents consist of cash on hand and highly liquid investments with original maturities of three months or less from the time of purchase.
Prepaid Expenses and Other Current Assets
Prepaid expenses and other current assets consisted of the following as of the periods presented:
December 31, | ||||||||
(in thousands) | 2021 | 2020 | ||||||
Deferred debt commitment costs | $ | 46,632 | $ | — | ||||
Deferred equity issuance costs | 6,085 | — | ||||||
Deferred cost of sales | 2,950 | 3,573 | ||||||
Other current assets | 1,972 | 1,643 | ||||||
Prepaid expenses and other current assets | $ | 57,639 | $ | 5,216 | ||||
Deferred debt commitment costs relate to warrants and other consideration transferred associated with a financing arrangement entered into in anticipation of the Tailwind Two Merger. The deferred debt commitment costs will be reclassified to discount on debt in connection with the issuance of the associated debt in March 2022. Refer to Note 5 “Debt” and Note 6 “Warrants and Derivatives” for further discussion.
Deferred equity issuance costs relate to direct and incremental legal, accounting, and other transaction costs incurred in connection with the Tailwind Two Merger. Upon closing of the Tailwind Two Merger, the deferred equity issuance costs will be reclassified as a reduction to additional
paid-in
capital. Payments associated with deferred equity issuance costs are reflected in payment of issuance costs in the consolidated statements of cash flows.Accrued Expenses and Other Current Liabilities
Accrued expenses and other current liabilities consisted of the following as of the periods presented:
December 31, | ||||||||
(in thousands) | 2021 | 2020 | ||||||
Current warrant and derivative liabilities (1) | $ | 68,518 | $ | — | ||||
Payroll-related accruals | 5,771 | 1,834 | ||||||
Other current liabilities | 1,847 | 797 | ||||||
Accrued expenses and other current liabilities | $ | 76,136 | $ | 2,631 | ||||
| (1) | Refer to Note 6 “Warrants and Derivatives” for further discussion. |
Research and Development
Research and development includes materials, labor, and overhead allocations attributable to the development of new products and solutions and significant improvements to existing products and solutions. Research and development costs are expensed as incurred and recognized in selling, general, and administrative expenses in the consolidated statements of operations and comprehensive loss. Research and development expense was $1.9 million and $1.3 million during 2021 and 2020, respectively.
Retirement Plans
The Company maintains a qualified defined contribution plan for U.S. employees in the form of a 401(k) plan. Employee participants are permitted to make contributions on a
before-tax
basis. The Company did 0t make any matching contributions during 2021 or 2020.F-62
The Company maintains a defined contribution plan for Tyvak International employees. The Company’s contributions to the plan were not material during 2021 and 2020.
Concentration of Credit Risks
Financial instruments that potentially subject the Company to concentrations of credit risk consist primarily of cash and cash equivalents and accounts receivable.
The majority of the Company’s cash and cash equivalents are held at major financial institutions. Certain account balances exceed the Federal Deposit Insurance Corporation insurance limits of $250,000 per account. As a result, there is a concentration of credit risk related to amounts in excess of the insurance limits. The Company regularly monitors the financial stability of these financial institutions and believes that there is no exposure to any significant credit risk in cash and cash equivalents.
Concentrations of credit risk with respect to accounts receivable are limited because the Company performs credit evaluations, sets credit limits, and monitors the payment patterns of its customers.
The table below presents individual customers who accounted for more than 10% of the Company’s revenue for the periods presented:
Year Ended December 31, | ||||||||
2021 | 2020 | |||||||
Customer A | 50 | % | 22 | % | ||||
Customer B | 6 | % | 13 | % | ||||
Total | 56 | % | 35 | % | ||||
The table below presents individual customers who accounted for more than 10% of the Company’s accounts receivable, net of allowance for credit losses, as of the periods presented:
December 31, | ||||||||
2021 | 2020 | |||||||
Customer A | 32 | % | 9 | % | ||||
Customer B | 19 | % | 37 | % | ||||
Customer C | 14 | % | 15 | % | ||||
Customer D | 13 | % | 3 | % | ||||
Customer E | 10 | % | 9 | % | ||||
Total | 88 | % | 73 | % | ||||
Recently Adopted Accounting Pronouncements
Financial Accounting Standards Board (“FASB”) Accounting Standard Update (“ASU”), provides guidance to ease the potential burden of accounting for convertible instruments, derivatives related to an entity’s own equity, and the related earnings per share considerations. The Company early adopted this guidance on January 1, 2021. The impact of adoption was not material.
2020-06,
Debt with Conversion and Other Options (Subtopic
470-20)
and Derivatives and Hedging—Contracts in Entity’s Own Equity (Subtopic815-40):
Accounting for Convertible Instruments and Contracts in an Entity’s Own EquityASU, aligns the requirements for capitalizing implementation costs incurred in cloud computing arrangements that are classified as a service contracts with the requirements for capitalizing
2018-15,
Customer’s Accounting for Implementation Costs Incurred in a Cloud Computing Arrangement That Is a Service Contract
F-63
implementation costs incurred to develop or obtain
internal-use
software. The Company adopted the guidance as of January 1, 2021 on a prospective basis, which will result in capitalized implementation costs being classified in the same line item as the fees associated with the cloud computing service agreement in the consolidated balance sheets, statements of operations and comprehensive loss, and statements of cash flows. The impact of adoption was not material.Recently Issued Accounting Pronouncements
ASU, and related amendments, introduces new guidance which makes substantive changes to the accounting for credit losses. This guidance introduces the current expected credit losses model (“CECL”) which applies to financial assets subject to credit losses and measured at amortized cost, as well as certain
2016-13,
Financial Instruments – Credit Losses (Topic 326): Measurement of Credit Losses on Financial Instrument
off-balance
sheet credit exposures.The CECL model requires an entity to estimate credit losses expected over the life of an exposure, considering information about historical events, current conditions, and reasonable and supportable forecasts and is generally expected to result in earlier recognition of credit losses. The Company plans to adopt this guidance on January 1, 2022 with the cumulative effect of adoption as an adjustment to accumulated deficit, if any. The impact of adoption is not anticipated to be material.
Lease Accounting
ASU, and related amendments, requires lessees to recognize aasset and lease liability for substantially all leases and to disclose key information about leasing arrangements. The guidance is effective for the Company on January 1, 2022.
2016-02
,
Leases (Topic 842)
right-of-use
The guidance is to be adopted using a modified retrospective approach or an optional transition method. The Company has elected to adopt the guidance using the optional transition method, which allows the Company to apply the guidance at the adoption date and recognize a cumulative effect adjustment to the opening balance of accumulated deficit, if any, in the period of adoption with no restatement of comparative periods. As part of the adoption, the Company has elected to apply the package of transitional practical expedients under which the Company will not reassess prior conclusions about lease identification, lease classification, and initial direct costs of existing leases as of the date of adoption. Additionally, the Company has elected the practical expedients to not separate
non-lease
components from lease components. The Company did not elect to apply the practical expedient related to short-term lease recognition exemption.The Company has performed an impact analysis of the guidance and is in the final phase of implementing the guidance, which includes analyzing the impact of the guidance on existing lease contracts, reviewing the completeness of the existing lease portfolio, comparing accounting policies under current accounting guidance to the new accounting guidance, and implementing a new lease accounting system. Upon transition to the guidance as of the date of adoption, the Company expects to recognize approximately $7 million to $9 million of operating lease liabilities on the consolidated balance sheets, with a corresponding amount ofassets, net of amounts reclassified from other assets and liabilities, as specified by the guidance. Further, the Company does not expect that the adoption of the guidance will have a material effect on the consolidated statements of operations and comprehensive loss and the statements of cash flows.
right-of-use
Note 2 Revenue and Receivables
The Company adopted Accounting Standards Codification (“ASC”) 606,, using the modified retrospective method on January 1, 2020. The adoption of ASC 606 did not result in an adjustment to accumulated deficit.
Revenue from Contracts with Customers
Under ASC 606, the Company applies the following five steps in order to recognize revenue from contracts with customers: (i) identify the contract(s) with a customer; (ii) identify the performance obligation(s) in the contract;
F-64
(iii) determine the transaction price; (iv) allocate the transaction price to the performance obligation(s) in the contract; and (v) recognize revenue when (or as) the entity satisfies a performance obligation. The Company only applies the five-step model to contracts when it is probable that the entity will collect the consideration it is entitled to in exchange for the goods or services it transfers to the customer.
At contract inception, the Company assesses whether the goods or services promised within the contract represent a performance obligation. A performance obligation is a promise in a contract to transfer a distinct good or service to the customer and is the unit of account in ASC 606. For contracts with multiple performance obligations, the Company allocates the contract’s transaction price to each performance obligation on a relative basis using the best estimate of the stand-alone selling price of each performance obligation, which is estimated using the expected-cost-plus-margin approach. Generally, the Company’s contracts with customers are structured such that the customer has the option to purchase additional goods or services. Customer options to purchase additional goods or services do not represent a separate performance obligation as the prices for such options reflect the stand-alone selling prices for the additional goods or services. The majority of the Company’s contracts with customers have a single performance obligation.
The Company recognizes the transaction price allocated to the respective performance obligation as revenue as the performance obligation is satisfied. The majority of the Company’s contracts with customers relate to the creation of specialized assets that do not have alternative use and entitle the Company to an enforceable right to payment for performance completed to date. Accordingly, the Company generally measures progress towards the satisfaction of a performance obligation over time using theinput method.
cost-to-cost
Payments for costs not yet incurred or for costs incurred in anticipation of providing a good or service under a contract with a customer in the future are included in prepaid expenses and other current assets on the consolidated balance sheets.
Estimate-at-Completion
As the majority of the Company’s revenue is recognized over time using theinput method, the recognition of revenue and the estimate ofis complex, subject to many variables and requires significant judgment.
cost-to-cost
cost-at-completion
EAC represents the total estimatedand is comprised of direct material, direct labor and manufacturing overhead applicable to a performance obligation. There is a company-wide standard and periodic EAC process in which the Company reviews the progress and execution of outstanding performance obligations. As part of this process, the Company reviews information including, but not limited to, any outstanding key contract matters, progress towards completion and the related program schedule, identified risks and opportunities and the related changes in estimates of revenues and costs. The risks and opportunities include the Company’s judgment about the ability and cost to achieve the schedule (e.g., the number and type of milestone events), technical requirements (e.g., a newly-developed product versus a mature product) and other contract requirements. The Company must make assumptions and estimates regarding labor productivity and availability, the complexity of the work to be performed, the availability of materials, the length of time to complete the performance obligation (e.g., to estimate increases in wages and prices for materials and related support cost allocations), execution by subcontractors, the availability and timing of funding from customers and overhead cost rates, among other variables.
cost-at-completion
Based on the results of the periodic EAC process, any adjustments to revenue, cost of sales, and the related impact to gross profit are recognized on a cumulative
catch-up
basis in the period they become known. These adjustments may result from positive program performance, and may result in an increase in gross profit during the performance of individual performance obligations, if it is determined the Company will be successful in mitigating risks surrounding the technical, schedule and cost aspects of those performance obligations or realizing related opportunities. Likewise, these adjustments may result in a decrease in gross profit if it isF-65
determined the Company will not be successful in mitigating these risks or realizing related opportunities. A significant change in one or more of these estimates could affect the profitability of one or more of the Company’s performance obligations.
Contract modifications often relate to changes in contract specifications and requirements. Contract modifications are considered to exist when the modification either creates new or changes the existing enforceable rights and obligations. Most of the Company’s contract modifications are for goods or services that are not distinct from the existing contract due to the significant integration service provided in the context of the contract and are accounted for as if they were part of that existing contract. The effect of a contract modification on the transaction price, and the measure of progress for the performance obligation to which it relates, is recognized as an adjustment to revenue either as an increase in or a reduction of revenue on a cumulative
catch-up
basis.Some of the Company’s long-term contracts contain award fees, incentive fees, or other provisions that can either increase or decrease the transaction price. These variable amounts generally are awarded upon achievement of certain performance metrics, program milestones or cost targets and can be based upon customer discretion. Variable consideration is estimated at the most likely amount to which the Company is expected to be entitled. Estimated amounts are included in the transaction price to the extent it is probable that a significant reversal of cumulative revenue recognized will not occur when the uncertainty associated with the variable consideration is resolved. Estimates of variable consideration and determination of whether to include estimated amounts in the transaction price are based largely on an assessment of the Company’s anticipated performance and all information (historical, current, and forecasted) that is reasonably available. The unfunded portion of enforceable contracts are accounted for as variable consideration.
Disaggregation of Revenue
Below is a summary of the Company’s accounting for the types of revenue under ASC 606:
| • | Mission Support: Mission support services primarily relate to the integrated design, manufacture and final assembly of satellites for government and commercial entities. Revenue associated with mission support services is recognized over time using the cost-to-cost |
| • | Launch Support: Launch support services relates to the design and manufacture of deployment systems in order to launch satellites for government and commercial customers. In addition, the Company will assist in the launch of a satellite into space by coordinating and securing launch opportunities with launch providers on behalf of a customer. Revenue associated with launch support services is recognized over time using the cost-to-cost |
| • | Operations: Operations relates to the monitoring or operation of satellites in orbit on behalf of a customer. Revenue associated with operations is recognized monthly at a fixed contractual rate. Accordingly, the revenue is recognized in proportion to the amount it has the right to invoice for services performed. |
| • | Studies, Design and Other: Studies, design and other services primarily relate to special consulting studies and other design projects for government and commercial entities. Revenue associated with studies, design and other services is primarily recognized over time using the cost-to-cost |
F-66
The following tables presents the Company’s disaggregated revenue by offering and customer type for the periods presented:
Years Ended December 31, | ||||||||
(in thousands) | 2021 | 2020 | ||||||
Mission support | $ | 37,109 | $ | 19,362 | ||||
Launch support | 1,144 | 1,304 | ||||||
Operations | 2,039 | 2,558 | ||||||
Studies, design and other | 614 | 1,655 | ||||||
Revenue | $ | 40,906 | $ | 24,879 | ||||
Years Ended December 31, | ||||||||
(in thousands) | 2021 | 2020 | ||||||
U.S. Government contracts | ||||||||
Fixed price | $ | 17,036 | $ | 8,871 | ||||
Cost-plus fee | 4,912 | 3,053 | ||||||
| 21,948 | 11,924 | |||||||
Foreign government contracts | ||||||||
Fixed price | 4,623 | 884 | ||||||
Commercial contracts | ||||||||
Fixed price, U.S. | 9,005 | 5,602 | ||||||
Fixed price, International | 5,210 | 6,414 | ||||||
Cost-plus fee | 120 | 55 | ||||||
| 14,335 | 12,071 | |||||||
Revenue | $ | 40,906 | $ | 24,879 | ||||
For U.S. Government contracts, the Company follows U.S. Government procurement and accounting standards in assessing the allowability and the allocability of costs to contracts. Due to the significance of the judgments and estimation processes, it is likely that materially different amounts could be recorded if different assumptions were used or if the underlying circumstances were to change. The Company monitors the consistent application of its critical accounting policies and compliance with contract accounting. Business operations personnel conduct periodic contract status and performance reviews. When adjustments in estimated contract revenues or costs are determined, any material changes from prior estimates are included in earnings in the current period. Also, regular and recurring evaluations of contract cost, scheduling and technical matters are performed by Company personnel who are independent from the business operations personnel performing work under the contract. Costs incurred and allocated to contracts with the U.S. Government are subject to audit by the Defense Contract Audit Agency for compliance with regulatory standards.
Remaining Performance Obligations
Revenue from remaining performance obligations is calculated as the aggregate amount of the transaction price allocated to performance obligations that are unsatisfied (or partially unsatisfied) as of the end of the reporting period on executed contracts, including both funded (firm orders for which funding is authorized and appropriated) and unfunded portions of such contracts. Remaining performance obligations exclude contracts in which the Company recognizes revenue in proportion to the amount it has the right to invoice for services performed and does not include unexercised contract options and potential orders under indefinite delivery/indefinite quantity contracts.
F-67
As of December 31, 2021, the Company had approximately $73.9 million of remaining performance obligations, of which the Company expects to recognize $67.1 million during 2022, $6.1 million during 2023, $500 thousand during 2024, and $200 thousand thereafter.
Contract Assets and Contract Liabilities
For each of the Company’s contracts with customers, the timing of revenue recognition, customer billings, and cash collections results in a net contract asset or liability at the end of each reporting period.
Fixed-price contracts are typically billed to the customer either using progress payments, whereby amounts are billed monthly as costs are incurred or work is completed, or performance-based payments, which are based upon the achievement of specific, measurable events or accomplishments defined and valued at contract inception. Cost-type contracts are typically billed to the customer on a monthly or semi-monthly basis.
Contract assets
Contract assets relate to instances in which revenue recognized exceeds amounts billed to customers. Contract assets are reclassified to accounts receivable when the Company has an unconditional right to the consideration and bills the customer. Contract assets are classified as current and
non-current
based on the estimated timing in which the Company will bill the customer. Contract assets are not considered to include a significant financing component as the payment terms are intended to protect the customer in the event the Company does not perform on its obligations under the contract.As of December 31, 2021 and 2020, all contract assets were classified as current assets.
There were 0 material impairments of contract assets during 2021 or 2020.
Contract liabilities
Contract liabilities relate to advance payments and billings in excess of revenue recognized. Contract liabilities are recognized into revenue as the Company satisfies the underlying performance obligations. Contract liabilities are classified as current and
non-current
based on the estimating timing in which the Company will satisfy the underlying performance obligations. Contract liabilities are not considered to include a significant financing component as they are generally utilized to procure materials needed to satisfy a performance obligation or are used to ensure the customer meets contractual requirements.As of December 31, 2021 and 2020, all contract liabilities were classified as current liabilities.
During 2021 and 2020, the Company recognized revenue of $17.2 million and $9.3 million, respectively, that was previously included in the beginning balance of contract liabilities.
Accounts Receivable
Accounts receivable represent unconditional rights to consideration due from customers in the ordinary course of business and are generally due in one year or less. Accounts receivable are recorded at amortized cost less an allowance for credit losses, which is based on the Company’s assessment of the collectability of its accounts receivable. The Company reviews the adequacy of the allowance for credit losses by considering the age of each outstanding invoice and the collection history of each customer. Accounts receivable that are deemed uncollectible are charged against the allowance for credit losses when identified.
Receivables from products and services ultimately provided to the U.S. Government included in accounts receivable was $2.1 million and $1.6 million as of December 31, 2021 and 2020, respectively.
F-68
The following table presents changes in the allowance for credit losses for the periods presented:
Years Ended December 31, | ||||||||
(in thousands) | 2021 | 2020 | ||||||
Beginning balance | $ | (635 | ) | $ | (116 | ) | ||
Provision for credit losses | (407 | ) | (794 | ) | ||||
Write-offs | 97 | 275 | ||||||
Ending balance | $ | (945 | ) | $ | (635 | ) | ||
Reserve for Anticipated Losses on Contracts
When the estimatedexceeds the estimated revenue to be earned for a performance obligation, the Company records a reserve for the anticipated losses in the period the loss is determined. The reserve for anticipated losses on contracts is presented as a current liability in the consolidated balance sheets and as a component of cost of sales in the consolidated statements of operations and comprehensive loss in accordance with ASC.
cost-at-completion
605-35,
Revenue Recognition – Construction-Type and Production-Type Contracts
The Company recognized a reduction in cost of sales to offset the previously recognized anticipated losses on contracts of $1.3 million and $4.8 million during 2021 and 2020, respectively.
Note 3 Inventory
Inventory consists of parts andbasis. Inventory is presented net of an allowance for losses associated with excess and obsolete items, which is estimated based on the Company’s current knowledge with respect to inventory levels, planned production and customer demand.
sub-assemblies
that are ultimately consumed in the manufacturing and final assembly of satellites. When an item in inventory has been identified and incorporated into a specific satellite, the cost of thesub-assembly
is charged to cost of goods sold in the consolidated statements of operations and comprehensive loss. Inventory is measured at the lower of cost or net realizable value. The cost of inventory includes direct material, direct labor and manufacturing overhead and is determined on afirst-in-first-out
The components of inventory as of the periods presented were as follows:
December 31, | ||||||||
(in thousands) | 2021 | 2020 | ||||||
Raw materials | $ | 4,782 | $ | 681 | ||||
Work in process | 3,001 | 2,138 | ||||||
Total inventory | $ | 7,783 | $ | 2,819 | ||||
Note 4 Property, Plant and Equipment, net
Property, plant and equipment, net is stated at historical cost less accumulated depreciation. Cost for company-owned satellite assets includes amounts related to design, construction, launch and commission. Cost for ground stations includes amounts related to construction and testing. Interest is capitalized on certain qualifying assets that take a substantial period of time to develop for their intended use. Depreciation expense is calculated using thedigits or straight-line method over the estimated useful lives of the related assets as follows:
sum-of-the-years’
Machinery and equipment | 5-7 years | |
Satellites | 3-5 years | |
Ground station equipment | 5-7 years | |
Office equipment and furniture | 5-7 years | |
Computer equipment and software | 3-5 years | |
Leasehold improvements | Shorter of the estimated useful life or remaining lease term |
F-69
The determination of the estimated useful life of satellites involves an analysis that considers design life, random part failure probabilities, expected component degradation and cycle life, predicted fuel consumption and experience with satellite parts, vendors and similar assets.
Depreciation expense was $3.1 million and $2.9 million during 2021 and 2020, respectively. Repairs and maintenance expenditures are expensed when incurred.
The gross carrying amount, accumulated depreciation and net carrying amount of property, plant and equipment, net as of the periods presented were as follows:
December 31, | ||||||||
(in thousands) | 2021 | 2020 | ||||||
Machinery and equipment | $ | 7,607 | $ | 5,742 | ||||
Satellites | 2,209 | — | ||||||
Ground station equipment | 1,944 | 1,331 | ||||||
Office equipment and furniture | 2,239 | 2,106 | ||||||
Computer equipment and software | 142 | 149 | ||||||
Leasehold improvements | 8,533 | 7,391 | ||||||
Construction in process | 23,647 | 10,039 | ||||||
Property, plant and equipment, gross | 46,321 | 26,758 | ||||||
Accumulated depreciation | (10,791 | ) | (7,237 | ) | ||||
Property, plant and equipment, net | $ | 35,530 | $ | 19,521 | ||||
Construction in process included company-owned satellites, ground station equipment and machinery not yet placed into service.
The Company reviews property, plant and equipment, net for impairment whenever events or changes in business circumstances indicate that the net carrying amount of an asset or asset group may not be fully recoverable. The Company groups assets at the lowest level for which cash flows are separately identified. Recoverability is measured by a comparison of the net carrying amount of the asset group to its expected future undiscounted cash flows. If the expected future undiscounted cash flows of the asset group are less than its net carrying amount, an impairment loss is recognized based on the amount by which the net carrying amount exceeds the fair value less costs to sell. The calculation of the fair value less costs to sell of an asset group is based on assumptions concerning the amount and timing of estimated future cash flows and assumed discount rates, reflecting varying degrees of perceived risk.
There were no impairments of property, plant and equipment during 2021 and 2020.
F-70
Note 5 Debt
Long-term debt as of the presented periods was comprised of the following:
(in thousands) | December 31, | |||||||||||||||||||||||
Description | Issued | Maturity | Interest Rate | Interest Payable | 2021 | 2020 | ||||||||||||||||||
Pre-Combination Notes | November 2021 | November 2026 | 9.25% | Quarterly | 30,289 | — | ||||||||||||||||||
Senior Secured Notes due 2026 | March 2021 | April 2026 | 11.00% | Quarterly | 94,686 | — | ||||||||||||||||||
Convertible Notes due 2028 | July and August 2018 | July 2028 | 3.05% | 6/30 and 12/31 | — | 36,654 | ||||||||||||||||||
PPP Loan | May 2020 | May 2022 | 1.00% | Monthly | — | 2,537 | ||||||||||||||||||
Finance leases | N/A | N/A | N/A | N/A | 53 | 49 | ||||||||||||||||||
Unamortized deferred issuance costs | (761 | ) | (2,208 | ) | ||||||||||||||||||||
Unamortized discount on debt | (9,119 | ) | — | |||||||||||||||||||||
Total debt | 115,148 | 37,032 | ||||||||||||||||||||||
Current portion of long-term debt | 14 | 1,403 | ||||||||||||||||||||||
Long-term debt | $ | 115,134 | $ | 35,629 | ||||||||||||||||||||
N/A - Not meaningful
Francisco Partners Facility
On November 24, 2021 (the “FP NPA Closing Date”), the Company entered into a note purchase agreement (the “FP Note Purchase Agreement”) for the issuance and sale of senior secured notes in an aggregate principal amount of up to $150 million due on November 24, 2026 (the “Francisco Partners Facility”) with certain managed funds or investment vehicles of Francisco Partners. The Francisco Partners Facility originally consisted of (i) $30 million of senior secured notes, which were drawn on the FP NPA Closing Date (the
“Pre-Combination
Notes”), (ii) $20 million of senior secured notes drawable at the closing of the Tailwind Two Merger (the “Delayed Draw Notes”), and (iii) up to an additional $100 million of senior secured notes drawable at the closing of the Tailwind Two Merger (the “Conditional Notes”). Deferred debt commitment costs related to the Francisco Partners Facility totaled $62.4 million and related to an original issue discount of $5 million, third-party legal fees of $864 thousand, warrants and contingently issuable warrants and equity. Deferred debt commitment costs are reclassified to discount on debt and deferred issuance costs, as it relates to third-party legal fees, at the time the underlying debt is issued. Refer to Note 6 “Warrants and Derivatives” for further discussion regarding warrants and contingently issuable warrants and equity recognized in connection with the FP Note Purchase Agreement.The
Pre-Combination
Notes were issued net of a $5 million original issue discount and resulted in proceeds received of $25 million, of which $10.8 million was allocated to proceeds from debt and $14.2 million was allocated to proceeds from warrants and derivatives in the consolidated statements of cash flows. The Company reclassified deferred debt commitment costs of $15.5 million to discount on debt and $218 thousand to deferred issuance costs related to the issuance of thePre-Combination
Notes.On March 9, 2022, the Company amended the FP Note Purchase Agreement to, among other things, (i) increase the principal amount of senior secured notes that may be issued under the Francisco Partners Facility to up to $154 million, (ii) increase the Delayed Draw Notes to $24 million of senior secured notes, and (iii) accelerate the funding of the Delayed Draw Notes. The Delayed Draw Notes were issued net of a $4 million original issue discount and resulted in proceeds received of $20 million.
On March 25, 2022, the Company further amended the FP Note Purchase Agreement to, among other things, (i) decrease the principal amount of senior secured notes that may be issued under the Francisco Partners Facility to up to $119 million, (ii) amend certain existing covenants, as described below, (iii) add an additional covenant, as described below, (iv) revise the maturity date to April 1, 2026, and (v) change the timing of quarterly interest payments, as described below.
F-71
Upon closing of the Tailwind Two Merger, Conditional Notes of $65 million were issued net of a $5 million original issue discount and resulted in proceeds received of $60 million.
Senior secured notes issued pursuant to the Francisco Partners Facility bear interest at a rate of 9.25% per annum, which is due and payable in arrears on the last business day of each calendar quarter, commencing with the calendar quarter ending December 31, 2021. The Francisco Partners Facility included certain escalations in interest rate in the event of delay or termination of the Tailwind Two Merger that were not triggered. In addition, a
one-time
interest payment is due upon the earlier to occur of the1-year
anniversary of the FP NPA Closing Date or the closing date of the Tailwind Two Merger. However, in lieu of payment in cash of all or any portion of the interest amount due on or prior to the earlier to occur of the1-year
anniversary of the FP NPA Closing Date or the closing date of the Tailwind Two Merger, such unpaid interest amount will be added to the principal balance of the senior secured notes on such interest payment date. As of December 31, 2021, approximately $289 thousand of contractual interest was included in the outstanding principal balance of thePre-Combination
Notes.As part of the amendment on March 25, 2022, interest is due and payable in arrears on May 15th, August 15th, November 15th and February 15th of each calendar year, with the first such interest payment required to be made on May 15, 2022.
The Francisco Partners Facility requires the Company to make certain mandatory prepayments with (i) 100% of net cash proceeds of all
non-ordinary
course asset sales or other dispositions of property and any extraordinary receipts, subject to the ability to reinvest such proceeds and certain other exceptions and (ii) 100% of the net cash proceeds of any debt incurrence, other than debt permitted by the FP Note Purchase Agreement. The Company may prepay senior secured notes issued pursuant to the Francisco Partners Facility at any time subject to payment of customary breakage costs and a customary make-whole premium for any voluntary prepayment made prior to the first anniversary of the FP NPA Closing Date (the “Callable Date”), followed by a call premium of (i) 3.0% on or prior to the first anniversary of the Callable Date, (ii) 2.00% after the first anniversary of the Callable Date but on or prior to the second anniversary of the Callable Date, and (iii) at par thereafter. The Francisco Partners Facility included certain customary make-whole premiums for any voluntary prepayments in the event of delay or termination of the Tailwind Two Merger that were not triggered.The Francisco Partners Facility contains certain customary affirmative covenants, negative covenants and events of default. In addition, commencing with the first fiscal quarter ending after the closing of the Tailwind Two Merger, the Francisco Partners Facility will have a liquidity maintenance financial covenant that, subject to certain conditions, requires that as of the last day of each fiscal quarter, the Company and New Terran Orbital have an aggregate amount of unrestricted cash and cash equivalents of at least the greater of (a) $20 million and (b) an amount equal to 15% of the total funded indebtedness of the Company and New Terran Orbital.
As part of the amendment on March 25, 2022, the liquidity maintenance financial covenant was modified to (i) $20 million in the case of the fiscal quarters ending March 31, 2022, June 30, 2022 and September 30, 2022, (ii) $10 million in the case of the fiscal quarter ending December 31, 2022 and (iii) thereafter, $20.0 million plus 15% of the debt incurred after closing of the Tailwind Two Merger. In addition, a new covenant was added requiring New Terran, the Company and its subsidiaries to at least break even on an EBITDA basis (as defined in the FP Note Purchase Agreement) by December 31, 2023, subject to certain extensions.
The obligations under the Francisco Partners Facility are guaranteed by the Company’s wholly-owned U.S. subsidiaries, subject to certain exceptions.
Senior Secured Notes due 2026
On March 8, 2021, the Company issued $87 million aggregate principal amount of senior secured notes due April 1, 2026 (the “Senior Secured Notes due 2026”) which resulted in gross proceeds of $50 million from
F-72
Lockheed Martin Corporation (“Lockheed Martin”) and the exchange and extinguishment of
$37 million then outstanding Convertible Notes due 2028 (as defined below). The Company allocated
$47.5 million of the proceeds received to the Senior Secured Notes due 2026 and the remainder of the proceeds were allocated to warrants issued upon funding of the Senior Secured Notes due 2026 in the consolidated statements of cash flows. The Company allocated
$2.8 million of deferred issuance costs to the Senior Secured Notes due 2026. Refer to Note 6 “Warrants and Derivatives” for further discussion regarding warrants issued in connection with the issuance of the Senior Secured Notes due 2026.
In connection to the Merger Agreement and the FP Note Purchase Agreement, the Senior Secured Notes due 2026 note purchase agreement was amended in November 2021 to provide consent to the Company incurring obligations related to the
Pre-Combination
Notes under the FP Note Purchase Agreement as well as aligning cash interest payments prior to March 8, 2024 with the terms of cash interest payments under the FP Note Purchase Agreement. In addition, Lockheed Martin and Beach Point Capital (“Beach Point”) each agreed to, at their option, (a) exchange up to $25 million (in the case of Lockheed Martin) and $25 million (in the case of Beach Point) of aggregate principal amount of Senior Secured Notes due 2026 for the same principal amount of debt to be issued under, and governed by, a new loan agreement or note purchase agreement, or (b) keep outstanding such amounts of aggregate principal amount of Senior Secured Notes due 2026 under its existing note purchase agreement (in either case, the “Rollover Debt”). The Rollover Debt will have substantially similar terms as the terms of the Francisco Partners Facility, except that the Rollover Debt will not have call protection, will be issued without original issue discount, and will be available at the closing of the Tailwind Two Merger.The Company issued warrants and contingently issuable warrants and equity to each of Lockheed Martin and Beach Point in connection with the amendment to the Senior Secured Notes due 2026 which resulted in the extinguishment and re-issuance of the Senior Secured Notes due 2026 for each of Lockheed Martin and Beach Point for accounting purposes. The loss on extinguishment of debt totaled
$28 million and included the recognition of warrants and contingently issuable warrants and equity at fair value, the fair value adjustment related to the re-issuance of the Senior Secured Notes due 2026, the write-off of unamortized discount on debt and deferred issuance costs on the extinguished Senior Secured Notes due 2026, and certain third-party financing expenses. The re-issued Senior Secured Notes were recognized at fair value with a
$6.6 million premium less
$420 thousand of deferred issuance costs. Refer to Note 6 “Warrants and Derivatives” for further discussion regarding warrants and contingently issuable warrants and equity.
On March 25, 2022, the Senior Secured Notes due 2026 note purchase agreement was amended to, among other things, (i) set the Rollover Debt for Lockheed Martin to $25 million, (ii) increase and set the Rollover Debt for Beach Point to $31.3 million, (iii) set the terms of the Rollover Debt to have substantially similar terms as the terms in the Francisco Partners Facility, excluding call protection and Rollover Debt for Beach Point bearing interest at 11.25% (9.25% of which is payable in cash and 2.0% of which is payable in kind), and (iv) cause the Rollover Debt for Beach Point to be subordinate to the Francisco Partners Facility.
Upon closing of the Tailwind Two Merger, approximately $56.3 million of the Senior Secured Notes due 2026 remained outstanding as Rollover Debt while the remainder was repaid in connection with the Tailwind Two Merger.
Prior to the March 25, 2022 amendment, the Senior Secured Notes due 2026 bore interest at the rate of
11%per annum. The Senior Secured Notes due 2026 included certain escalations in interest rate that were not triggered as a result of the Tailwind Two Merger. Interest was payable on the Senior Secured Notes due 2026 beginning on March 8, 2022 and for each calendar quarter end thereafter until maturity. Prior to
March 8, 2024
,the Company has the option to pay the interest on the Senior Secured Notes due 2026 in-kind in lieu of cash, limited by the alignment of cash interest payments with the terms of cash interest payments under the FP Note Purchase Agreement. As of December 31, 2021, approximately $
7.8
million of contractual interest coupon was accrued and included in the outstanding principal balance of the Senior Secured Notes due 2026.F-73
The Company, at its option, may prepay the Senior Secured Notes due 2026 at any time at 100% of the principal amount, plus accrued and unpaid interest. The Senior Secured Notes due 2026 are subject to mandatory prepayment by the Company upon (i) the occurrence of a qualified public offering of its stock or a business combination with a special purpose acquisition company, except as otherwise agreed to, and (ii) for so long as Lockheed Martin or any of its affiliates holds any portion of the Senior Secured Notes due 2026, in the event of a termination (other than by the Company due to an uncured breach by Lockheed Martin) of a strategic cooperation agreement between the Company and Lockheed Martin (the “Strategic Cooperation Agreement”) or a material breach by the Company of the Strategic Cooperation Agreement, subject to a 90 days grace period after the Company knows of such breach or receives written notice of such breach from Lockheed Martin.
The Senior Secured Notes due 2026 do not have financial maintenance covenants and, unless an event of default has occurred and is continuing, there is no requirement to make any cash interest, amortization or maturity payments on or before March 8, 2024, except for the alignment of cash interest payments with the terms of cash interest payments under the FP Note Purchase Agreement.
Convertible Notes due 2028
In 2018, the Company issued in a private offering an aggregate principal amount of $34 million of 3.05% Convertible Promissory Notes with a maturity date of July 23, 2028 (the “Convertible Notes due 2028”) pursuant to a convertible note purchase agreement, dated as of July 23, 2018, between the Company and three purchaser parties thereto (the “Convertible Note Purchase Agreement”), of which $33 million principal amount was issued on July 23, 2018 and $1 million principal amount was issued on August 2, 2018. The Company issued $31 million aggregate principal amount of Convertible Notes due 2028 for a cash purchase price of 100% and issued $3 million aggregate principal amount of Convertible Notes due 2028 in exchange for a previously issued and outstanding convertible security held by one of the purchasers.
During March 2021, the Convertible Notes due 2028 were extinguished as part of the issuance of the Senior Secured Notes due 2026. The loss on extinguishment of debt totaled $70.6 million and included the recognition of warrants issued at fair value, the fair value adjustment related to the issuance of the Senior Secured Notes due 2026, the
write-off
of unamortized deferred issuance costs on the extinguished Convertible Notes due 2028, and certain third-party financing expenses. Refer to Note 6 “Warrants and Derivatives” for further discussion regarding warrants issued in connection with the extinguishment of the Convertible Notes due 2028.Prior to extinguishment, the Company could, at its option, elect, in lieu of paying interest in cash, to pay interest
in-kind,
which would increase the principal amount of the Convertible Notes due 2028. Contractual interest coupon that was included in the outstanding principal balance of the Convertible Notes due 2028 was $2.8 million and $2.6 million as of the date of extinguishment and December 31, 2020, respectively.Prior to extinguishment, the Convertible Notes due 2028 were convertible into shares of the Company’s common stock at the holder’s election or could be prepaid in cash under certain circumstances at the election of the Company. The original conversion price per share was $38.85 for $31 million of original principal amount of the Convertible Notes due 2028 and $31.08 per share for $3 million of original principal amount of the Convertible Notes due 2028. The conversion price increased semi-annually by 1.05% per annum. The Company was not required to make any principal payments until maturity if the holder did not exercise its right to conversion. As part of the extinguishment of the Convertible Notes due 2028, the conversion feature was detached and issued as separate freestanding warrants. Refer to Note 6 “Warrants and Derivatives” for further discussion.
The Convertible Notes due 2028 were unsecured obligations. The Convertible Note Purchase Agreement contained customary restrictive covenants, including restrictions on incurrence of debt and that the Company adheres to a number of reporting requirements.
F-74
PPP Loan
During May 2020, the Company received $2.5 million related to the origination of a loan pursuant to the U.S. Small Business Administration (“SBA”) Paycheck Protection Program under Title I of the Coronavirus Aid, Relief, and Economic Security Act (the “CARES Act”) (the “PPP Loan”). In June 2020, the terms of the PPP Loan were amended with the passing of the Paycheck Protection Program Flexibility Act (“PPPFA”). For any amounts that were unforgiven, the terms of the loan called for an interest rate of 1% and a maturity date of two years.
During October 2020, the Company filed for forgiveness of the PPP Loan as 100% of the proceeds were utilized for qualified payroll and payroll related costs in accordance with the applicable provisions governing the PPP Loan. During June 2021, the SBA paid the lender the full amount of principal and interest on the PPP Loan. The Company recorded a gain on extinguishment of the PPP Loan of approximately $2.6 million in June 2021.
There were no contractual principal or interest payments made by the Company prior to the forgiveness of the PPP Loan.
Tyvak International Line of Credit
On October 7, 2020, Tyvak International entered into a working capital line of credit with a maximum capacity of €300 thousand (the “Tyvak International Line of Credit”). The Company closed the Tyvak International Line of Credit in November 2021. There were 0 amounts outstanding under the Tyvak International Line of Credit as of December 31, 2020.
Other
As of December 31, 2021, the aggregate principal amount of outstanding debt has a contractual maturity during 2026.
Interest on the Company’s long-term debt was $8.7 million and $1.1 million during 2021 and 2020, respectively, of which $1.3 million and $119 thousand was capitalized to construction in process during 2021 and 2020, respectively. In addition, interest expense included $236 thousand and $294 thousand related to the amortization of deferred issuance costs during 2021 and 2020, respectively, as well as $299 thousand related to the amortization of discount on debt during 2021. There was no amortization of discount on debt during 2020.
Note 6 Warrants and Derivatives
The Company’s warrants and derivatives consist of freestanding financial instruments issued in connection with the Company’s debt and equity financing transactions. The Company does not have any derivatives designated as hedging instruments.
For each freestanding financial instrument, the Company evaluates whether it represents a liability-classified financial instrument within the scope of(“ASC 480”), or either a liability-classified or equity-classified financial instrument within the scope of(“ASC 815”).
ASC 480 Distinguishing Liabilities
ASC 815 Derivatives and Hedging
Warrants and derivatives classified as liabilities are recognized at fair value in the consolidated balance sheets and are remeasured at fair value as of each reporting period with changes in fair value recorded in the consolidated statements of operations and comprehensive loss. Warrants and derivatives classified as equity are recognized at fair value in additional
paid-in
capital in the consolidated balance sheets and are not subsequently remeasured.F-75
Liability-classified Warrants and Derivatives
The fair values of liability-classified warrants and derivatives recorded in warrant liabilities on the consolidated balance sheets as of December 31, 2021 were as follows:
(in thousands, except share amounts) | Number of Issuable Shares | Issuance | Maturity | Fair Value | ||||||||||||
Inducement Warrants | 17,230 | March 2021 | March 2041 | $ | 5,631 | |||||||||||
Warrant liabilities | $ | 5,631 | ||||||||||||||
The fair values of liability-classified warrants and derivatives recorded in accrued expenses and other current liabilities on the consolidated balance sheets as of December 31, 2021 were as follows:
(in thousands) | Fair Value | |||
FP Pre-Combination Warrants | $ | 2,546 | ||
Pre-Combination Warrants | 849 | |||
FP Combination Warrants | 27,682 | |||
Combination Warrants | 7,602 | |||
FP Combination Equity | 24,110 | |||
Combination Equity | 5,729 | |||
Current warrant and derivative liabilities | $ | 68,518 | ||
The changes in fair value of liability-classified warrants and derivatives during 2021 were as follows:
(in thousands) | Current Warrant and Derivative Liabilities | Warrant Liabilities | Total | |||||||||
Beginning balance | $ | — | $ | — | $ | — | ||||||
Initial recognition from discount on debt | 14,240 | 2,519 | 16,759 | |||||||||
Initial recognition from deferred debt commitment costs | 42,247 | — | 42,247 | |||||||||
Initial recognition from loss on extinguishment of debt | 15,002 | 1,857 | 16,859 | |||||||||
Change in fair value of warrant and derivative liabilities | (2,971 | ) | 1,255 | (1,716 | ) | |||||||
Ending balance | $ | 68,518 | $ | 5,631 | $ | 74,149 | ||||||
Inducement Warrants
In connection with the issuance of the Senior Secured Notes due 2026, the Company issued warrants to the note holders to purchase 0.34744% of the Company’s common stock for $0.01 per share or to receive a cash payment of approximately $7 million if the warrants are not exercised prior to maturity or repayment of the Senior Secured Notes due 2026 (the “Inducement Warrants”). The Inducement Warrants were recognized at a fair value of $4.4 million in the consolidated balance sheets, of which $2.5 million were recognized as discount on debt from the issuance of the Senior Secured Notes due 2026 and $1.9 million were recognized as a component of loss on extinguishment of debt in connection with the extinguishment of the Convertible Notes due 2028. The issuance costs related to the Inducement warrants were not material.
In connection with the Merger Agreement, holders of the Inducement Warrants were entitled to receive an additional 0.18708% of the Company’s common stock immediately prior to the Tailwind Two Merger in exchange for waiving their cash redemption rights. As part of the Tailwind Two Merger, all of the Inducement Warrants were net settled into 25,190 thousand shares of the Company’s common stock prior to the exchange into New Terran Orbital common stock.
F-76
Francisco Partners Warrants and Derivatives
As part of the Francisco Partners Facility, the Company issued warrants to Francisco Partners to purchase 1.5% of the fully diluted shares of the Company’s common stock for $0.01 per share, exercisable within 30 days following the termination of the Merger Agreement (the “FP
Pre-Combination
Warrants”). The FPPre-Combination
Warrants were recognized at a fair value of $2.5 million in the consolidated balance sheets, a portion of which were recognized as a discount on debt from the issuance of thePre-Combination
Notes and the remainder as deferred debt commitment costs in prepaid expenses and other current assets on the consolidated balance sheets. The FPPre-Combination
Warrants terminated unexercised upon consummation of the Tailwind Two Merger pursuant to contractual provisions.As additional consideration for the Francisco Partners Facility, the Company committed to the issuance of (i) an equity grant package equal to 1.5% of the fully diluted shares of New Terran Orbital’s common stock outstanding as of immediately following the closing of the Tailwind Two Merger, plus an additional 1.0 million shares of New Terran Orbital common stock (the “FP Combination Equity”), and (ii) warrants to purchase 5.0% of New Terran Orbital’s common stock on a fully diluted basis as of immediately following the closing of the Tailwind Two Merger at a strike price of $10.00 per share, redeemable at the option of Francisco Partners for $25 million on the third anniversary of the closing of the Tailwind Two Merger (the “FP Combination Warrants”). The FP Combination Equity and the FP Combination Warrants were contingently issuable upon closing of the Tailwind Two Merger. The FP Combination Equity and the FP Combination Warrants were recognized at a fair value of $25 million and $29 million, respectively, in accrued expenses and other current liabilities on the consolidated balance sheets, a portion of which were recognized as a discount on debt from the issuance of the
Pre-Combination
Notes and the remainder as deferred debt commitment costs in prepaid expenses and other current assets on the consolidated balance sheets.The issuance costs related to the FP
Pre-Combination
Warrants, FP Combination Equity, and FP Combination Warrants totaled $429 thousand and were expensed as a component of other (income) expense in the consolidated statements of operations and comprehensive loss and included as operating cash flows in the consolidated statements of cash flows.As consideration for the amendment to the FP Note Purchase Agreement on March 25, 2022, Francisco Partners received an additional 1.9 million shares of New Terran Orbital’s common stock, of which 425,000 shares were provided by sponsor shares of Tailwind Two.
In connection with the Tailwind Two Merger, approximately 5.2 million shares of New Terran Orbital common stock were issued related to the FP Combination Equity, inclusive of the incremental million shares from the March 25, 2022 amendment, and 8.3 million warrants were issued related to the FP Combination Warrants.
1.9
Pre-Combination
and Combination Warrants and DerivativesUpon funding of the
Pre-Combination
Notes, and in connection with the amendment to the Senior Secured Notes due 2026 note purchase agreement, the Company issued warrants to each of Lockheed Martin and Beach Point to purchase 0.25% of the fully diluted shares of the Company’s common stock for $0.01 per share on the same valuation and terms and conditions as the FPPre-Combination
Warrants (the“Pre-Combination
Warrants”). ThePre-Combination
Warrants were recognized at a fair value of $827 thousand in the consolidated balance sheets and as a component of loss on extinguishment of debt in the consolidated statements of operations and comprehensive loss. ThePre-Combination
Warrants terminated unexercised upon consummation of the Tailwind Two Merger pursuant to contractual provisions.In connection to the Merger Agreement and the Rollover Debt, the Company committed to each of Lockheed Martin and Beach Point the issuance of (i) an equity grant package equal to 0.25% of the fully diluted shares of New Terran Orbital’s common stock outstanding as of immediately following the closing of the Tailwind Two
F-77
Merger (the “Combination Equity”), and (ii) warrants to purchase 0.83333% of New Terran Orbital’s common stock on a fully diluted basis as of immediately following the closing of the Tailwind Two Merger at a strike price of $10.00 per share with a term of 5 years (the “Combination Warrants”). The Combination Equity and the Combination Warrants were contingently issuable upon closing of the Tailwind Two Merger. The Combination Equity and the Combination Warrants were recognized at fair values of $6.0 million and $8.1 million, respectively, in accrued expenses and other current liabilities on the consolidated balance sheets and as a component of loss on extinguishment of debt in the consolidated statements of operations and comprehensive loss.
The issuance costs related to the
Pre-Combination
Warrants, Combination Warrants, and Combination equity were not material.As consideration for the amendment to the Senior Secured Notes due 2026 note purchase agreement on March 25, 2022, Beach Point received an additional 2.4 million shares of New Terran Orbital’s common stock, of which 100,000 shares were provided by sponsor shares of Tailwind Two.
In connection with the Tailwind Two Merger, approximately 3.2 million shares of New Terran Orbital common stock were issued related to the Combination Equity, inclusive of the incremental 2.4 million shares to Beach Point from the March 25, 2022 amendment, and 2.8 million warrants were issued related to the Combination Warrants.
Equity-classified Warrants
Detachable Warrants
In connection with the extinguishment of the Convertible Notes due 2028, the Company issued detachable warrants to the note holders to purchase 943,612 shares of common stock at an average exercise price of $39.06 and an expiration date of July 23, 2028 (the “Detachable Warrants”). The Detachable Warrants were recognized at a fair value of $68.4 million in additional
paid-in
capital in the consolidated balance sheets and as a component of loss on extinguishment of debt in the consolidated statements of operations and comprehensive loss. The issuance costs related to the Detachable Warrants totaled $2.3 million and were recognized in additionalpaid-in
capital in the consolidated balance sheets and as financing cash flows in the consolidated statements of cash flows.As part of the Tailwind Two Merger, all of the Detachable Warrants were net settled into 809,992 shares of the Company’s common stock prior to the exchange into New Terran Orbital common stock.
The Company estimated the fair value of the Detachable Warrants using the Black-Scholes option-pricing model. The Black-Scholes option-pricing model considers the estimated fair value of the Company’s common stock as well as the expected term of the instrument of 7.4 years, the expected volatility of 103%, the expected dividend yield of 0 and the risk-free interest rate of 1.15%. In the absence of a public market for the Company’s common stock, the valuation of the Company’s common stock has been determined using an option pricing model. Refer to Note 7 “Fair Value of Financial Instruments” for further discussion regarding the valuation of the Company’s common stock using an option pricing model.
Note 7 Fair Value of Financial Instruments
Fair value is defined as the price that would be received to sell an asset or paid to transfer a liability in an orderly transaction between market participants in the principal market, or if none exists, the most advantageous market, for the specific asset or liability at the measurement date (the exit price). The fair value is based on assumptions that market participants would use when pricing the asset or liability. The fair values are assigned a level within the fair value hierarchy, depending on the source of the inputs into the calculation, as follows:
| • | Level 1: Observable inputs that reflect quoted prices (unadjusted) for identical assets or liabilities in active markets. |
F-78
| • | Level 2: Inputs other than quoted prices included in Level 1 that are observable for the asset or liability either directly or indirectly. |
| • | Level 3: Unobservable inputs reflecting management’s own assumptions about the inputs used in pricing the asset or liability. |
The carrying amounts of cash and equivalents, accounts receivable, contract assets, contract liabilities, and accounts payable approximate fair values due to the short-term maturities of these financial instruments. Additionally, the carrying amount of the PPP Loan approximated fair value due to the short-term maturity and nominal interest rate.
Warrant and Derivative Liabilities
The fair values of the Company’s warrant and derivative liabilities are largely based on the fair value of the Company’s common stock. In the absence of a public market for the Company’s common stock, the valuation of the Company’s common stock has been determined using an option pricing model, which is used to allocate the total enterprise value of the Company to the different classes of equity as of the valuation date. The significant assumptions used in the option pricing model include: (i) total enterprise value of the Company based on the guideline publicly-traded company method, guideline transaction method, market calibration method and discounted cash flow method; (ii) liquidation preferences, conversion values, and participation thresholds of different equity classes; (iii) probability-weighted time to a liquidity event; (iv) expected volatility based upon the historical and implied volatility of common stock for the Company’s selected peers; (v) expected dividend yield of zero as the Company does not have a history or plan of declaring dividends on its common stock; (vi) risk-free interest rate based on U.S. treasury bonds with a
zero-coupon
rate, (vii) implied valuation, timing, and probability of the Tailwind Two Merger; and (viii) a discount for the lack of marketability of the Company’s common stock. The resulting fair values represent a Level 3 fair value measurement. If the Company becomes a publicly traded entity, these estimates will no longer be necessary to determine the fair value of the Company’s common stock as there will be a public market for the underlying shares.The fair value of the Inducement Warrants was derived using a lattice model with the following significant inputs and assumptions as of the valuation date: (i) the estimated value of the Company’s common stock using the option pricing model described above, (ii) the exercise price, (iii) the risk-free interest rate, (iv) the dividend yield, (v) the remaining contractual term, (vi) the estimated volatility, (vii) the estimated counterparty credit spread based on an estimated credit rating of CCC and below, (viii) the implied valuation, timing, and probability of closing the Tailwind Two Merger, and (ix) a discount for the lack of marketability of the Company’s common stock. The resulting fair values represent Level 3 fair value measurements.
The fair values of the
Pre-Combination
Warrants and FPPre-Combination
Warrants were derived using the option pricing model as described above. Accordingly, the fair values represent a Level 3 fair value measurements.Contingently Issuable Warrants and Equity
The Company’s contingently issuable warrants and equity represent derivatives issued and outstanding for accounting purposes but are contingently issuable upon closing of the Tailwind Two Merger.
The fair values of the Combination Warrants and FP Combination Warrants were derived using the Black-Scholes option pricing model and a lattice model, respectively, with the following significant inputs and assumptions as of the valuation date: (i) the price per share of Tailwind Two’s common stock, (ii) the exercise price, (iii) the risk-free interest rate, (iv) the dividend yield, (v) the contractual term, (vi) the estimated volatility, (vii) the probability of closing the Tailwind Two Merger, and (viii) the estimated redemption rate of Tailwind Two’s public shareholders. In addition, as a result of the FP Combination Warrants put feature, the valuation also considers counterparty credit spread based on an estimated credit rating of CCC and below. The resulting fair values represent Level 3 fair value measurements.
F-79
The fair values of the Combination Equity and FP Combination Equity were derived using the following significant inputs and assumptions as of the valuation date: (i) the price per share of Tailwind Two’s common stock, (ii) the probability of closing the Tailwind Two Merger, and (iii) the estimated redemption rate of Tailwind Two’s public shareholders. The resulting fair values represent a Level 3 fair value measurement.
The assumptions underlying the above valuations represented the Company’s best estimate, which involved inherent uncertainties and the application of the Company’s judgment. If the Company had used different assumptions or estimates, the fair values above could have been materially different.
Long-term Debt
The following table presents the total net carrying amount and estimated fair value of the Company’s long-term debt instruments, excluding finance leases and the PPP Loan, as of the periods presented:
December 31, 2021 | December 31, 2020 | |||||||||||||||
(in thousands) | Carrying Amount | Fair Value | Carrying Amount | Fair Value | ||||||||||||
Long-term debt | $ | 115,095 | $ | 124,221 | $ | 34,446 | $ | 106,679 | ||||||||
As of December 31, 2021, the fair value of the Company’s long-term debt was related to the
Pre-Combination
Notes and the Senior Secured Notes due 2026. For each instrument, the fair value was determined using a lattice model with the following significant inputs and assumptions: (i) time to maturity, (ii) coupon rate, (iii) discount rate based on an estimated credit rating of CCC and below, (iv) risk-free interest rate, (v) contractual features such as prepayment options, call premiums and default provisions, and (vi) probability of a liquidity event. The resulting fair values represent Level 3 fair value measurements.As of December 31, 2020, the fair value of the Company’s long-term debt was related to the Convertible Notes due 2028. Due to the conversion feature of the Convertible Notes due 2028, the estimated fair value of the Convertible Notes due 2028 was determined using a lattice model with consideration of the value of the Company’s common stock as described above. The fair value of the Convertible Notes due 2028 represents a level 3 fair value measurement.
Note 8 Mezzanine Equity and Shareholders’ Deficit
Common Stock
In October 2021, the Company amended its certificate of incorporation to increase the number of authorized shares of common stock from 5,000,000 to 5,500,000 in connection with the Tailwind Two Merger. The company’s shares of common stock have a par value of $0.0001 per share and entitle shareholders to one vote for each share.
Redeemable Convertible Preferred Stock
As of December 31, 2021 and 2020, the Company was authorized to issue 744,130 shares of convertible preferred stock with a par value of $0.0001 per share (the “Series A Preferred Stock”), of which 396,870 shares were issued and outstanding. The Series A Preferred Stock was issued in July 2017 at an original issue price per share of $20.1578 (the “Original Issue Price”), which resulted in gross proceeds of $8 million. The Company concluded there is an instance within scope of ASC 480,, in which it will be required to redeem the Series A Preferred Stock for cash or other assets that is outside of its control. Accordingly, the Series A Preferred Stock is presented as mezzanine equity outside of shareholders’ deficit in the Company’s consolidated balance sheets.
Distinguishing Liabilities from Equity
As part of the Tailwind Two Merger, all of the Series A Preferred Stock was net settled into 396,870 shares of the Company’s common stock prior to the exchange into New Terran Orbital common
stock.
F-80
Prior to the Tailwind Two Merger and from the date of issuance of any shares of Series A Preferred Stock, dividends at the rate per annum of 8.00% on the Original Issue Price were to be paid on each share of Series A Preferred Stock if and when declared by the Board of Directors. The Series A Preferred Stock had a preference right, but not a participation right, in that the Company could not declare, pay or set aside any dividends on shares of any other class or series of capital stock of the Company (other than dividends on shares of common stock payable in shares of common stock) in any year unless the holders of the Series A Preferred Stock then outstanding first receive, or simultaneously receive for such year, a dividend on each outstanding share of Series A Preferred Stock in an amount at least equal to
8.00
% of the Original Issue Price per share of Series A Preferred Stock. The foregoing dividend was not cumulative. There were 0 dividends declared during 2021 or 2020.Each share of Series A Preferred Stock was convertible, at the option of the holder, at any time, and without the payment of additional consideration by the holder, into such number of fully paid and
non-assessable
shares of common stock as was determined by dividing the Original Issue Price by the conversion price in effect at the time of conversion. The conversion price was subject to adjustment based on customary anti-dilution adjustments. As of December 31, 2021 and 2020, the conversion price was equal to the Original Issue Price.In the event of any voluntary or involuntary liquidation, dissolution or winding up of the Company or a deemed liquidation event, the holders of shares of Series A Preferred Stock then outstanding were be entitled to be paid out of the assets of the Company available for distribution to its shareholders before any payment was to be made to the holders of common stock by reason of their ownership thereof, an amount per share equal to the Original Issue Price together with dividends declared but unpaid thereon (the “Series A Preferred Stock Liquidation Preference”). After the payment of the preferential Series A Preferred Stock Liquidation Preference, the remaining assets of the Company would be distributed to holders of common stock.
Beginning on June 26, 2022, and so long as there were no Convertible Notes due 2028 outstanding, the majority holders of the Series A Preferred Stock had the right to cause the Company to redeem all shares of Series A Preferred Stock out of funds lawfully available therefor by delivering written notice to the Company. Redemption would have occurred over three annual installments commencing not more than 60 days after receipt of such notice at a redemption price that approximates the Series A Preferred Stock Liquidation Preference.
In connection with the issuance of the Senior Secured Notes due 2026, the Company amended and restated its Certificate of Incorporation to, among other things, amend the mandatory redemption and conversion provisions of the Series A Preferred Stock. The mandatory redemption provision was amended to provide that the right of the holders of Series A Preferred Stock to redemption would not be exercisable so long as any of the Senior Secured Notes due 2026 were outstanding. The mandatory conversion provision was amended to provide that in addition to the existing conversion events, a business combination with a special purpose acquisition company or similar entity whose shares are registered and publicly listed on a principal exchange and that (i) generates at least $200 million in cash proceeds to the Company and (ii) with a price per share of at least three times the Original Issue Price would have triggered automatic conversion of the Series A Preferred Stock.
Each holder of outstanding shares of Series A Preferred Stock had voting rights equal to the number of whole shares of common stock into which the shares of Series A Preferred Stock held by such holder are convertible as of the date such vote would take place. For voting on all matters presented to shareholders, the votes of holders of Series A Preferred Stock were counted together with those of holders of common stock as a single class. The prior consent of the holders of Series A Preferred Stock voting as a single class was required with respect to a number of enumerated protective provisions relating to material actions or transactions involving the Company. So long as any shares of Series A Preferred Stock were outstanding, the holders thereof voting as a separate class were entitled to elect two directors of the Company; provided that Astrolink International, LLC (“Astrolink”) had the right to designate one of these two directors so long as it holds any shares of Series A Preferred
Stock.
F-81
Non-controlling
InterestTerran Orbital Corporation owned 65,000 shares of PredaSAR’s common stock, representing 100% of the issued and outstanding shares of common stock of PredaSAR. On November 1, 2019, the board of directors of PredaSAR authorized the issuance of 25,000 shares of preferred stock with a par value of $0.01 per share and designated as the Series Seed Preferred Stock (the “Series Seed Preferred Stock”), which represented a 27.8% equity interest in PredaSAR on an “as converted” basis. The Company concluded there were no circumstances within scope of ASC 480,, in which it would be required to redeem the Series Seed Preferred Stock for cash or other assets that were outside of its control. Accordingly, the Series Seed Preferred Stock was presented as a
Distinguishing Liabilities from Equity
non-controlling
interest within shareholders’ deficit in the Company’s consolidated balance sheets.During 2019, PredaSAR issued 9,810 shares of Series Seed Preferred Stock to outside investors at $1,000 per share (the “Series Seed Original Issue Price”), raising gross proceeds of $9.8 million. During 2020, PredaSAR issued an additional 15,190 shares of Series Seed Preferred Stock to outside investors at the Series Seed Original Issue Price, raising gross proceed of $15.2 million, bringing total proceeds raised from Series Seed Preferred Stock issuances to $25 million. In connection with these issuances, PredaSAR incurred $0.5 million and $0.7 million of issuance costs in 2019 and 2020, respectively. The capital was raised to fund PredaSAR’s satellite constellation development plans and for other general corporate purposes. As of December 31, 2020, 25,000 shares of Series Seed Preferred Stock were issued and outstanding.
On February 26, 2021, the Company entered into an agreement with
non-controlling
interest holders of Series Seed Preferred Stock to exchange all 25,000 shares of Series Seed Preferred Stock for shares of the Company’s common stock (the “PredaSAR Merger”). Each holder of the Series Seed Preferred Stock received 15.523 shares of the Company’s common stock for each share of Series Seed Preferred Stock, resulting in the issuance of 388,064 shares of the Company’s common stock. Fractional shares were settled in cash and were not material.The PredaSAR Merger resulted in PredaSAR becoming a wholly-owned subsidiary of Terran Orbital Corporation. Accordingly,
non-controlling
interest was reclassified to additionalpaid-in
capital in the consolidated balance sheets. The issuance costs related to the PredaSAR Merger totaled $432 thousand and were recognized in additionalpaid-in
capital in the consolidated balance sheet and as financing cash flows in the consolidated statements of cash flows.Prior to the PredaSAR Merger and from the date of issuance of any shares of Series Seed Preferred Stock, dividends at the rate per annum of 8.00% on the Series Seed Original Issue Price were to be paid on each share of Series Seed Preferred Stock if and when declared by the board of directors of PredaSAR. The Series Seed Preferred Stock had a preference right, but not a participation right, in that PredaSAR could not declare, pay or set aside any dividends on shares of any other class or series of capital stock of PredaSAR (other than dividends on shares of its common stock payable in shares of its common stock) in any year unless the holders of the Series Seed Preferred Stock then outstanding first receive, or simultaneously receive for such year, a dividend on each outstanding share of Series Seed Preferred Stock in an amount at least equal to 8.00% of the Series Seed Original Issue Price per share of Series Seed Preferred Stock. The foregoing dividend was not cumulative. There were 0 dividends declared by PredaSAR during 2021 or 2020.
Each share of Series Seed Preferred Stock was convertible, at the option of the holder, at any time, and without the payment of additional consideration by the holder, into such number of fully paid and
non-assessable
shares of common stock of PredaSAR as was determined by dividing the Series Seed Original Issue Price by the conversion price in effect at the time of conversion. The conversion price was subject to adjustment based on customary anti-dilution adjustments. As of December 31, 2020, the conversion price was equal to the Series Seed Original Issue Price.In the event of any voluntary or involuntary liquidation, dissolution or winding up of PredaSAR or deemed liquidation event, the holders of shares of Series Seed Preferred Stock then outstanding were be entitled to be
F-82
paid out of the assets of PredaSAR available for distribution to its shareholders before any payment was made to the holders of its common stock by reason of their ownership thereof, an amount per share equal to the Series Seed Original Issue Price together with dividends declared but unpaid thereon (the “Series Seed Preferred Stock Liquidation Preference”). After the payment of the preferential Series Seed Liquidation Preference, the remaining assets of PredaSAR would be distributed to holders of PredaSAR common stock.
Each holder of outstanding shares of Series Seed Preferred Stock had voting rights equal to the number of whole shares of common stock into which the shares of Series Seed Preferred Stock held by such holder were convertible as of the date such vote would take place. For voting on all matters presented to shareholders, the holders of Series Seed Preferred Stock votes were counted together with the holders of PredaSAR’s common stock as a single class. The prior consent of the holders of Series Seed Preferred Stock voting as a single class was required with respect to a number of enumerated protective provisions relating to material actions or transactions involving PredaSAR. So long as any shares of Series Seed Preferred Stock were outstanding, the holders thereof voting as a separate class were entitled to elect one of the five directors of PredaSAR.
Note 9 Share-Based Compensation
The Company grants share-based compensation awards to employees and directors under the Amended and Restated Terran Orbital Corporation 2014 Equity Incentive Plan (the “2014 Plan”). Prior to the PredaSAR Merger, the Company also granted share-based compensation awards under the PredaSAR Corporation 2020 Equity Incentive Plan (the “PredaSAR Plan”). In connection with the Tailwind Two Merger, the 2014 Plan and related share-based compensation awards were cancelled and exchanged with a new share-based compensation plan and related share-based compensation awards of New Terran Orbital.
Share-based compensation expense for service-based awards is recognized on a straight-line basis over the requisite service period. For awards that include a performance condition, share-based compensation expense is recognized only if it is probable that the performance condition will be met. Share-based compensation expense is included in cost of sales and selling, general, and administrative expenses in the consolidated statements of operations and comprehensive loss. Additionally, certain costs related to share-based compensation awards granted to manufacturing employees are capitalized to inventory. The Company accounts for forfeitures as they occur.
All share-based compensation awards are classified as equity awards and are settled through the issuance of authorized but previously unissued shares of common stock.
Share-based compensation, inclusive of amounts included in inventory, for the periods presented was as follows:
Years ended December 31, | ||||||||
(in thousands) | 2021 | 2020 | ||||||
Stock options | $ | 416 | $ | 580 | ||||
Restricted stock units | 225 | — | ||||||
Restricted stock awards | — | 540 | ||||||
PredaSAR options | 37 | 110 | ||||||
Share-based compensation | $ | 678 | $ | 1,230 | ||||
There was 0 income tax benefit associated with the Company’s share-based compensation during 2021 and 2020 as a result of a full valuation allowance on the Company’s deferred tax assets.
The measurement of the Company’s share-based compensation awards is based on the grant-date fair value of the Company’s common stock. In the absence of a public market for the Company’s common stock, the valuation of the Company’s common stock has been determined using an option pricing model. Refer to Note 7 “Fair Value of Financial Instruments” for further discussion regarding the valuation of the Company’s common stock using an option pricing model.
F-83
2014 Plan
During June 2017, the Company adopted the 2014 Plan as the successor plan to the Tyvak Nano-Satellite Systems, Inc. 2014 Equity Incentive Plan (the “Predecessor Plan”). The 2014 Plan authorizes the issuance of no more than 744,130 shares of Terran Orbital Corporation common stock by the exercise or vesting of granted awards, which are generally stock options, restricted stock awards (“RSAs”) or restricted stock units (“RSUs”). Following the implementation of the 2014 Plan, 0 additional awards were to be granted under the Predecessor Plan. During January 2022, the 2014 Plan was amended to authorize the issuance of no more than 941,355 shares of Terran Orbital Corporation common stock.
Stock Options
Stock options granted under the 2014 Plan are primarily service-based awards that vest over a
two-
or four-year period from the date of grant, have an exercise price based on the estimated fair value of the Company’s common stock on the date of grant, and have a contractual term of up to ten years from the date of grant.There were 0 stock options granted under the 2014 Plan during 2021. The grant-date fair values of stock options granted under the 2014 Plan during 2020 were determined using the Black-Scholes option-pricing model with the following assumptions:
Years ended December 31, | ||||||||
2020 | ||||||||
Range | ||||||||
Low | High | |||||||
Expected term (in years) | 6.25 | 6.25 | ||||||
Expected volatility | 110 | % | 120 | % | ||||
Expected dividend yield | 0 | % | 0 | % | ||||
Risk-free interest rate | 0.46 | % | 0.56 | % | ||||
The expected term was calculated using the simplified method as the Company did not have sufficient historical exercise data to provide a reasonable basis to estimate future exercise patterns. The expected volatility was based upon the historical and implied volatility of common stock for the Company’s selected peers. The dividend yield was determined to be zero as the Company does not have a history or plan of declaring dividends on its common stock. The risk-free interest rate was based on U.S. treasury bonds with a
zero-coupon
rate.The weighted-average grant-date fair value of stock options granted during 2020 was $51.49.
The following table summarizes activity related to stock options during 2021:
Number of Options | Weighted- Average Exercise Price | Aggregate Intrinsic Value (in thousands) | Weighted- Average Remaining Contractual Term (Years) | |||||||||||||
Outstanding as of December 31, 2020 | 115,791 | $ | 24.59 | $ | 5,763 | 6.25 | ||||||||||
Granted | — | — | ||||||||||||||
Exercised | (21,716 | ) | 10.90 | |||||||||||||
Forfeited | (17,119 | ) | 32.16 | |||||||||||||
Outstanding as of December 31, 2021 | 76,956 | $ | 26.76 | $ | 12,797 | 5.39 | ||||||||||
Exercisable as of December 31, 2021 | 58,445 | $ | 23.16 | $ | 9,929 | 4.62 | ||||||||||
The intrinsic value of stock options exercised was $1.9 million and $1.8 million during 2021 and 2020, respectively.
F-84
As of December 31, 2021, unrecognized compensation cost related to stock options was $648 thousand, which is expected to be recognized over a weighted-average period of 2.4 years.
Restricted Stock Units
RSUs granted under the 2014 Plan vest pursuant to a service condition over a
two-
or four-year period and a performance condition that requires a liquidity event to occur withinseven
years. The fair value of RSUs is based on the fair value of the Company’s common stock on the date of grant.The following table summarizes activity related to RSUs during 2021:
Number of RSUs | Weighted- Average Grant-Date Fair Value | |||||||
Unvested as of December 31, 2020 | — | $ | — | |||||
Granted | 568,414 | 83.60 | ||||||
Vested | — | — | ||||||
Forfeited | (31,788 | ) | 89.26 | |||||
Unvested as of December 31, 2021 | 536,626 | $ | 83.27 | |||||
The Company has not recognized any share-based compensation expense associated with the RSUs granted during 2021, except as described below, as the performance condition was not probable of being met until a liquidity event occurs. Upon closing of the Tailwind Two Merger, the Company will record a cumulative
catch-up
in order to begin recognition of share-based compensation expense associated with the RSUs as the performance condition will be met.As of December 31, 2021, unrecognized compensation cost related to RSUs was $43.6 million, which is expected to be recognized over a weighted-average period of 1.1 years.
During the first quarter of 2022, the Company granted approximately 233 thousand RSUs under the 2014 Plan. The majority of these RSUs will generally vest on the latest occur of: (i) the first anniversary of the consummation of the Tailwind Two Merger, (ii) the trading price of New Terran Orbital’s common stock equaling or exceeding $11.00 or $13.00, as applicable, for any 20 trading days within any consecutive
30-trading
day period and (iii) such other performance vesting conditions.Restricted Stock Awards
There were 0 unvested RSAs as of December 31, 2021 as all RSAs had fully vested as of December 31, 2020. There were 0 RSAs granted during 2021 and 2020. The fair value of RSAs that vested during 2020 was $535 thousand.
PredaSAR Plan
During May 2020, the Company adopted the PredaSAR Plan, which authorized the issuance of up to 9,000 shares of PredaSAR Corporation common stock by the exercise or vesting of granted awards, which were all stock options.
Stock options granted under the PredaSAR Plan were primarily service-based awards that vested over a five-year period from the date of grant, had an exercise price of $1,000 per share, and a contractual term of ten years from the date of grant.
F-85
The Company did 0t grant options under the PredaSAR Plan during 2021. The grant-date fair values of stock options granted under the PredaSAR Plan during 2020 were determined using the Black-Scholes option-pricing model with the following assumptions:
Year ended December 31, | ||||||||
2020 | ||||||||
Range | ||||||||
Low | High | |||||||
Expected term (in years) | 6.25 | 6.25 | ||||||
Expected volatility | 110 | % | 110 | % | ||||
Expected dividend yield | 0 | % | 0 | % | ||||
Risk-free interest rate | 0.43 | % | 0.65 | % | ||||
The expected term was calculated using the simplified method as the Company did not have sufficient historical exercise data to provide a reasonable basis to estimate future exercise patterns. The expected volatility was based upon the historical and implied volatility of common stock for the Company’s selected peers. The dividend yield was determined to be zero as the Company does not have a history or plan of declaring dividends on its common stock. The risk-free interest rate was based on U.S. treasury bonds with a
zero-coupon
rate.The weighted-average grant-date fair value of stock options granted during 2020 was $577.00.
In connection with the PredaSAR Merger, the PredaSAR Plan was terminated. The stock options granted under the PredaSAR Plan were modified by cancellation and replacement with RSUs granted under the 2014 Plan. The modification resulted in the issuance of 29,835 RSUs with a weighted-average grant date fair value of $79.99 that vest pursuant to a service condition over a four-year period and a performance condition that requires a liquidity event to occur within seven years. Prior to termination of the PredaSAR Plan, the Company accounted for the cumulative compensation cost of share-based awards granted under the PredaSAR Plan as a component of additional
paid-in
capital. Upon exercise of a stock option, an adjustment tonon-controlling
interest and additionalpaid-in
capital was recorded.The incremental share-based compensation to be recognized over the service period of the RSUs as a result of the modification totaled approximately $445 thousand and was based on the incremental fair value of the RSUs granted compared to the fair value of the stock options immediately prior to cancellation. The Company has 0t recognized any incremental share-based compensation expense associated with the RSUs during 2021 as the performance condition was not considered to be probable of being met until a liquidity event occurs. However, the Company has continued to recognize share-based compensation expense related to the original grant date fair value of the cancelled stock options as the stock options were probable of vesting pursuant to their original terms. Upon closing of the Tailwind Two Merger, the Company will record a cumulative
catch-up
in order to begin recognition of share-based compensation expense associated with the incremental fair value of the modification as the performance condition will be met.The fair value of the stock options immediately prior to cancellation was estimated using the Black-Scholes option pricing model using the following assumptions:
Range | ||||||||
Low | High | |||||||
Expected term (in years) | 5.50 | 6.01 | ||||||
Expected volatility | 105 | % | 105 | % | ||||
Expected dividend yield | 0 | % | 0 | % | ||||
Risk-free interest rate | 0.95 | % | 0.95 | % | ||||
The expected term was calculated using the simplified method as the Company did not have sufficient historical exercise data to provide a reasonable basis to estimate future exercise patterns. The expected volatility was based
F-86
upon the historical and implied volatility of common stock for the Company’s selected peers. The dividend yield was determined to be zero as the Company does not have a history or plan of declaring dividends on its common stock. The risk-free interest rate was based on U.S. treasury bonds with a
zero-coupon
rate.The following table summarizes activity related to stock options granted under the PredaSAR Plan during 2021:
Number of Options | Weighted- Average Exercise Price | Aggregate Intrinsic Value (in thousands) | Weighted- Average Remaining Contractual Term (Years) | |||||||||||||
Outstanding as of December 31, 2020 | 1,967 | $ | 988.64 | $ | — | 9.50 | ||||||||||
Granted | — | — | ||||||||||||||
Exercised | — | — | ||||||||||||||
Forfeited | (45 | ) | 917.25 | |||||||||||||
Cancelled and replaced | (1,922 | ) | 990.31 | |||||||||||||
Outstanding as of December 31, 2021 | — | $ | — | $ | — | — | ||||||||||
Exercisable as of December 31, 2021 | — | $ | — | $ | — | — | ||||||||||
Following the PredaSAR Merger, share-based compensation expense and unrecognized compensation cost, inclusive of the incremental fair value due to modification, is included in information regarding RSUs granted under the 2014 Plan.
Note 10 Net Loss Per Share
Basic net loss per share is computed by dividing net loss by the weighted-average number of shares of common stock outstanding during the period.
Diluted net loss per share gives effect to all securities having a dilutive effect on net loss, weighted-average shares outstanding of common stock or both. The effect from potential dilutive securities includes (i) incremental shares of common stock calculated using the
if-converted
method for the Convertible Notes due 2028 and the Series A Preferred Stock, (ii) incremental shares of common stock calculated using the treasury stock method for warrants and share-based compensation awards granted under the 2014 Plan, (iii) incremental shares and potential shares of common stock that are contingently issuable upon closing of the Tailwind Two Merger, and (iv) adjustments to net loss as a result of changes in thenon-controlling
interest in PredaSAR due to the conversion of the Series Seed Preferred Stock or the exercise of stock options granted under the PredaSAR Plan. None of the potential dilutive securities meet the definition of a participating security.For purposes of the diluted net loss per share computation, all potentially dilutive securities were excluded because their effect would be anti-dilutive or because of unsatisfied contingent issuance conditions. As a result, basic net loss per share was equal to diluted net loss per share for each period presented.
The table below represents the anti-dilutive securities that could potentially be dilutive in the future for the periods presented:
December 31, | ||||||||
(in shares of common stock) | 2021 | 2020 | ||||||
Convertible Notes due 2028 | — | 940,160 | ||||||
Series A Preferred Stock | 396,870 | 396,870 | ||||||
Series Seed Preferred Stock | — | 25,000 | ||||||
Stock options | 76,956 | 115,791 | ||||||
Restricted stock units | 536,626 | — | ||||||
PredaSAR stock options | — | 1,967 | ||||||
Warrants | 1,060,023 | — | ||||||
F-87
The contingently issuable equity and warrants upon closing of the Tailwind Two Merger are excluded from the table above as the number of underlying shares of common stock to be issued is dependent on the capital structure of New Terran Orbital.
The computations of basic and diluted net loss per share for the periods presented were as follows:
Years Ended December 31, | ||||||||
(in thousands, except per share and share amounts) | 2021 | 2020 | ||||||
Numerator: | ||||||||
Net loss | $ | (138,982 | ) | $ | (10,455 | ) | ||
Denominator: | ||||||||
Weighted-average shares outstanding - basic and diluted | 2,780,993 | 2,403,755 | ||||||
Net loss per share - basic and diluted | $ | (49.98 | ) | $ | (4.35 | ) | ||
Note 11 Income Taxes
The Company accounts for income taxes using the asset and liability method. Under the asset and liability method, deferred tax assets and liabilities are recognized for the temporary differences between the financial statement carrying amounts of existing assets and liabilities and their respective tax basis. The effect on deferred tax assets and liabilities of a change in tax laws is recognized in the results of operations in the period the new laws are enacted. A valuation allowance is recorded to reduce the carrying amount of deferred tax assets to the estimated realization amount.
The Company recognizes positions taken or expected to be taken in a tax return in the consolidated financial statements when it is
more-likely-than-not
(i.e., a likelihood of more than 50%) that the position would be sustained upon examination by tax authorities. A recognized tax position is then measured at the largest amount of benefit with greater than 50% likelihood of being realized upon ultimate settlement. The Company records liabilities for positions that have been taken but do not meet themore-likely-than-not
recognition threshold. The Company includes interest and penalties associated with unrecognized tax benefits as income tax expense and as a component of the recorded balance of unrecognized tax benefits, which are reflected in other liabilities or net of related tax loss carryforwards in the consolidated balance sheets. The Company did 0t have any unrecognized tax benefits as of December 31, 2021 and 2020.The CARES Act was signed into law in March 2020 and includes several significant business income tax provisions that, among other things, would eliminate the taxable income limit for certain net operating losses (“NOLs”) and allow businesses to carry back NOLs arising in 2018, 2019 and 2020 to the five prior years, accelerate refunds of previously generated corporate alternative minimum tax credits, generally loosen the business interest limitation under Internal Revenue Code (“IRC”) Section 163(j) from 30 percent to 50 percent among other technical corrections included in the Tax Cuts and Jobs Act of 2017. In connection with the CARES Act, the Company benefited from the five-year carryback rule which allowed the Company to carryback a portion of its NOLs to the 2015 and 2016 tax years. The other provisions of the CARES Act did not have a material impact on the Company.
Significant components of loss before income taxes for the periods presented were as follows:
Years Ended December 31, | ||||||||
(in thousands) | 2021 | 2020 | ||||||
United States | $ | (140,563 | ) | $ | (10,727 | ) | ||
Foreign | 1,619 | 88 | ||||||
Loss before income taxes | $ | (138,944 | ) | $ | (10,639 | ) | ||
F-88
Significant components of provision for (benefit from) income taxes for the periods presented were as follows:
Years Ended December 31, | ||||||||
(in thousands) | 2021 | 2020 | ||||||
Current: | ||||||||
Federal | $ | (5 | ) | $ | (186 | ) | ||
State | 2 | 2 | ||||||
Foreign | 41 | — | ||||||
Current income tax expense (benefit) | 38 | (184 | ) | |||||
Deferred: | ||||||||
Federal | — | — | ||||||
State | — | — | ||||||
Foreign | — | — | ||||||
Deferred income tax benefit | — | — | ||||||
Provision for (benefit from) income taxes | $ | 38 | $ | (184 | ) | |||
The reconciliation between the provision for (benefit from) income taxes and the amount computed at the statutory U.S. federal income tax rate for the periods presented was as follows:
Years Ended December 31, | ||||||||
(in thousands) | 2021 | 2020 | ||||||
Income taxes computed at the U.S. federal statutory rate | $ | (29,178 | ) | $ | (2,234 | ) | ||
State and local income taxes, net of federal benefit | (2,960 | ) | (616 | ) | ||||
Permanent differences | 18,417 | 83 | ||||||
Change in valuation allowance | 14,548 | 3,055 | ||||||
Federal refunds | (5 | ) | (186 | ) | ||||
Other, net | (784 | ) | (286 | ) | ||||
Provision for (benefit from) income taxes | $ | 38 | $ | (184 | ) | |||
F-89
The components of the Company’s net deferred tax assets for the periods presented were as follows:
December 31, | ||||||||
(in thousands) | 2021 | 2020 | ||||||
Deferred tax assets: | ||||||||
Share-based compensation | $ | 670 | $ | 552 | ||||
Property, plant and equipment | 95 | 52 | ||||||
Disallowed interest | 2,194 | 715 | ||||||
Legal accrual | 224 | 230 | ||||||
Reserve for anticipated losses on contracts | 224 | 540 | ||||||
Net operating losses | 25,109 | 13,695 | ||||||
Accrued liabilities | 2,011 | 226 | ||||||
Total deferred tax assets | 30,527 | 16,010 | ||||||
Valuation allowance | (30,046 | ) | (15,498 | ) | ||||
Deferred tax assets, net of valuation allowance | $ | 481 | $ | 512 | ||||
Deferred tax liabilities: | ||||||||
Deferred financing costs | $ | — | $ | (512 | ) | |||
Warrants and derivatives | (481 | ) | — | |||||
Total deferred tax liabilities | (481 | ) | (512 | ) | ||||
Net deferred tax assets | $ | — | $ | — | ||||
The valuation allowance for deferred tax assets relates to the uncertainty of the utilization of U.S. federal, state and foreign deferred tax assets. In evaluating the Company’s ability to recover its deferred tax assets, the Company considers all available positive and negative evidence, which include its past operating results, the existence of cumulative losses in the most recent years, and its forecast of future taxable income. In estimating future taxable income, the Company develops assumptions related to the amount of future
pre-tax
operating income, the reversal of temporary differences, and the implementation of feasible and prudent tax planning strategies. These assumptions require significant judgment about the forecasts of future taxable income and are consistent with the plans and estimates the Company is using to manage its underlying businesses. The Company believes that it ismore-likely-than-not
that it will not generate sufficient future taxable income to realize its deferred tax assets. Accordingly, the Company has recorded a full valuation allowance as of December 31, 2021 and 2020.The change in the valuation allowance for deferred tax assets for the periods presented was as follows:
Years Ended December 31, | ||||||||
(in thousands) | 2021 | 2020 | ||||||
Beginning balance | $ | (15,498 | ) | $ | (12,443 | ) | ||
Change in valuation allowance | (14,548 | ) | (3,055 | ) | ||||
Ending balance | $ | (30,046 | ) | $ | (15,498 | ) | ||
As of December 31, 2021 and 2020, the Company had federal NOL carryforwards of $91 million and $47 million, respectively. Federal NOL carryforwards generated during 2017 totaled $1 million and will expire in 2037. The remainder of the Company’s federal NOL carryforwards were generated beginning in 2018 and can be carried forward indefinitely and used to offset up to 80% of future taxable income for future tax years. As a result of the CARES Act, federal NOL carryforwards generated during 2018, 2019 and 2020 can be carried back five years and offset 100% of taxable income. Accordingly, the Company carried back certain federal NOL carryforwards to the 2015 and 2016 tax years and recognized a benefit of approximately $186 thousand during 2020.
F-90
IRC Section 382 generally limits NOL and tax credit carryforwards following an ownership change, which occurs when one or more five percent shareholder increases its ownership, in aggregate, by more than 50 percentage points over the lowest percentage of stock owned by such shareholder at any time during the “testing period” (generally three years). Accordingly, the Company’s ability to utilize remaining NOL and tax credit carryforwards may be significantly restricted upon a change in ownership.
As of December 31, 2021 and 2020, the Company had state NOL carryforwards of $76 million and $48 million, respectively. The state NOL carryforwards begin to expire in 2038.
As of December 31, 2021 and 2020, the Company’s foreign NOL carryforwards were not material. The foreign NOL carryforwards can be carried forward indefinitely and used to offset up to 80% of future taxable income for future tax years.
The Company files income tax returns for U.S. federal and various state jurisdictions and in Italy for its foreign subsidiary. The income tax returns are subject to audit by the taxing authorities. These audits may culminate in proposed assessments which may ultimately result in a change to the estimated income taxes. The following is a summary of open tax years by jurisdiction:
Jurisdiction | Years Open to Audit | |||
Federal | 2018 - 2020 | |||
State | 2017 - 2020 | |||
Italy | 2016 - 2020 | |||
Note 12 Commitments and Contingencies
Operating Leases
The Company has entered into various
non-cancelable
operating leases for various office, manufacturing, and warehouse facilities.The Company’s future minimum lease payments under
non-cancelable
leases as of December 31, 2021 were as follows:(in thousands) | Operating Leases | Finance Leases | ||||||
2022 | $ | 3,484 | $ | 21 | ||||
2023 | 4,865 | 21 | ||||||
2024 | 4,970 | 11 | ||||||
2025 | 4,928 | 8 | ||||||
2026 | 4,896 | 7 | ||||||
Thereafter | 5,167 | — | ||||||
Subtotal | 28,310 | 68 | ||||||
Less interest on finance leases | — | 15 | ||||||
Total | $ | 28,310 | $ | 53 | ||||
Operating lease expense totaled $1 million and $868 thousand during 2021 and 2020, respectively.
In January 2022, the Company amended an existing operating lease to add additional manufacturing space and to increase the lease term from December 2021 to December 2026, resulting in incremental future minimum lease payments of approximately $1.1 million.
F-91
In February 2022, the Company amended an existing operating lease to increase the lease term from September 2027 to November 2032, resulting in incremental future minimum lease payments of approximately $5.4 million, and to add additional manufacturing space with a lease term of December 2022 to November 2032, resulting in incremental future minimum lease payments of approximately $17.1 million.
In March 2022, the Company signed a new operating lease for office space with a lease term from April 2022 to June 2027, resulting in incremental future minimum lease payments of approximately $2 million.
Litigation and Other Legal Matters
From time to time, the Company is subject to claims and lawsuits in the ordinary course of business, such as contractual disputes and employment matters. The Company is also subject to regulatory and governmental examinations, information requests and subpoenas, inquiries, investigations, and threatened legal actions and proceedings. The Company records accruals for losses that are probable and reasonably estimable. These accruals are based on a variety of factors such as judgment, probability of loss, and opinions of internal and external legal counsel. Legal costs in connection with claims and lawsuits in the ordinary course of business are expensed as incurred.
Customer Contractual Dispute
In January 2019, the Company entered into a contract (and other related agreements) with a customer to provide mission support and launch support services. During 2021, a contractual dispute arose between the Company and the customer. During 2022, the Company entered into a confidential settlement agreement with the customer and agreed to a payment to the customer of approximately $800 thousand. As of December 31, 2021, the Company had accrued $800 thousand for the settlement.
Engagement Agreement Matter
In September 2016, the Company entered into an engagement agreement (the “Engagement”) with an investment banker (the “Advisor”) for investment banking advisory and placement agent services for a financing transaction. A contractual dispute arose between the parties regarding the Advisor’s performance, fees and expenses. Prior to the contractual dispute, the Company terminated the Engagement, and subsequently closed on the Convertible Notes due 2028, without, in its view, the services of the Advisor. In November 2018, the Advisor initiated arbitration with the American Arbitration Association (the “AAA”) in New York. In August 2019, the AAA arbitration panel issued an award that equated to approximately $2.3 million (the “Award”) against the Company for breach of the Engagement. The award represented the placement fee that would have been paid upon closing of the Convertible Notes due 2028 and the Advisor’s legal fees. In October 2019, the Advisor filed a complaint with the California Federal District Court (“District Court”) to confirm the Award. Thereafter, the Company filed a Motion to vacate the Award. In early January 2020, the District Court granted the Advisor’s petition to confirm the Award, which the Company appealed to the U.S. Court of Appeals for the 9th Circuit (the “Ninth Circuit”). On March 9, 2021, the Ninth Circuit affirmed the District Court’s ruling. The Company recorded $2 million of the Award as deferred financing costs as of December 31, 2018. The remainder of the Award was recorded as a legal expense in selling, general and administrative expenses. The Award was paid in full during 2020.
Service Agreement Matter
In April 2017, the Company entered into a services agreement (“Service Agreement”) with an aerospace company that designs and delivers hardware that moves on spacecraft (the “Aerospace Design Company”). The Aerospace Design Company agreed to design and manufacture antennas and feeds for a satellite in connection with a Company project. A contractual dispute arose regarding the Aerospace Design Company’s performance, termination of the Services Agreement, and payment of various invoices. The Services Agreement contained a
F-92
provision for final and binding arbitration. Pursuant to the arbitration provision, in November 2018, the Aerospace Design Company filed a demand for arbitration against the Company, raising claims for breach of contract and seeking monetary damages for
non-payment
of an early termination fee and outstanding invoices. On August 26, 2019, the Aerospace Design Company filed an amended demand, and the case appeared before an arbitrator on January 29 through January 31, 2020, in Los Angeles, California. The parties concurrently filed post-hearing briefs on September 22, 2020 and reply briefs on October 6, 2020. On November 25, 2020, the arbitrator awarded a final award of $0.5 million in favor of the Aerospace Design Company. The final award reflected payments due as a result of the early termination fee and payments due under various unpaid invoices. The Company did not appeal the arbitration award. As of December 31, 2020, the Company had accrued $0.5 million for the settlement. The settlement was paid in full during 2021.Note 13 Related Party Transactions
Lockheed Martin Corporation
Strategic Cooperation Agreement
On June 26, 2017, the Company entered into the Strategic Cooperation Agreement with Lockheed Martin pursuant to which the parties agreed to (i) collaborate on the development, production and sale of satellites for use in U.S. Government spacecraft and spacecraft procurements and (ii) establish a cooperation framework to enable the parties to enter into projects, research and development agreements and other collaborative business arrangements and “teaming activities.” In connection with the issuance of the Senior Secured Notes due 2026, the Company and Lockheed Martin amended and restated the Strategic Cooperation Agreement to, among other things, extend the term to March 8, 2026. In connection with the Merger Agreement, the Strategic Cooperation Agreement was further amended and restated to extend the term to October 28, 2030 and was subsequently extended for an additional twelve months in March 2022 pursuant to existing contractual terms.
Revenue and Receivables
The Company recognized revenue from Lockheed Martin of $20.6 million and $5.4 million during 2021 and 2020, respectively. In addition, the Company had accounts receivables due from Lockheed Martin of $530 thousand and $369 thousand as of December 31, 2021 and 2020, respectively.
As of December 31, 2021, programs associated with Lockheed Martin represented approximately 56% of the Company’s remaining performance obligations.
Debt and Equity Holdings
Lockheed Martin, directly and through its wholly-owned subsidiary Astrolink, is a holder of debt and equity instruments in the Company.
As of December 31, 2021, Lockheed Martin’s principal and accrued interest associated with the Senior Secured Notes due 2026 was $58.1 million. As of December 31, 2020, Lockheed Martin’s principal and accrued interest associated with the Convertible Notes due 2028 was $3.3 million.
As of December 31, 2021 and 2020, Lockheed Martin held 347,261 shares of Series A Preferred Stock, representing a Series A Preferred Stock Liquidation Preference of $7 million.
As of December 31, 2021, Lockheed Martin held (i) 10,571 Inducement Warrants with a fair value of $3.5 million, (ii) 12,398
Pre-Combination
Warrants with a fair value of $424 thousand, and (iii) 103,055 Detachable Warrants. In addition, Lockheed Martin’s portionof
the Combination Warrants and Combination Equity was approximately $3.8 million and $2.9 million,respectively.
F-93
During 2021, the Company issued 10,000 RSUs to Lockheed Martin, through Astrolink, as a Lockheed Martin employee served as a member of the Company’s board of directors.
GeoOptics, Inc.
The Company owns a
non-controlling
equity interest in GeoOptics, Inc. (“GeoOptics”), a privately held company engaged in the acquisition and sale of Earth observation data and a purchaser of products and services from the Company. Additionally, one of the Company’s executive officers serves as a member of the GeoOptics board of directors. As of December 31, 2021 and 2020, the Company��s $1.7 million investment in GeoOptics represented an approximately 2.3% ownership interest and was fully impaired.The Company recognized revenue from GeoOptics of $1.6 million and $0.7 million during 2021 and 2020, respectively. In addition, the Company had accounts receivables due from GeoOptics of $470 thousand and $75 thousand as of December 31, 2021 and 2020, respectively.
As of December 31, 2021, programs associated with GeoOptics represented approximately 9% of the Company’s remaining performance obligations.
Transactions with Chairman and CEO
During 2021, the Company executed a new lease for office space in a building beneficially owned by the Company’s Chairman and CEO. The lease term commenced on April 1, 2021 and will expire on March 31, 2026. The Company has a
one-time
right to extend the lease term for a period of five additional years. The minimum lease payments under the lease is approximately $1.2 million.During 2020, Satellite Solutions Group, LLC, an entity owned by the Company’s Chairman and CEO, provided professional services in connection with the issuance of the Series Seed Preferred Stock for a fee of $700 thousand. The fee was recorded against the gross proceeds received from the issuance of the Series Seed Preferred Stock.
During 2021 and 2020, the Company’s Chairman and CEO was paid $125 thousand and $417 thousand, respectively, for consulting services.
PIPE Investment
The PIPE Investment funded as part of the Tailwind Two Merger primarily comprised of existing debt and equity holders of the Company. An affiliate of Daniel Staton, a director and shareholder of the Company, represented $30 million of the PIPE Investment (the “Staton PIPE Investment”). The subscription agreement for the Staton PIPE Investment contains a provision that obligates New Terran Orbital to pay an affiliate of Daniel Staton a quarterly fee of $1.875 million for sixteen quarters beginning at the end of the quarter in which the Tailwind Two Merger is consummated; the first years’ payments are to be paid in cash and the remaining payments are to be paid, subject to subordination to and compliance with New Terran Orbital’s debt facilities, in cash or common stock at the discretion of New Terran Orbital.
In addition, the Company entered into commercial agreements to purchase $20 million of goods and services over three years from two affiliates of a PIPE investor. These commercial agreements became effective upon the closing of the Tailwind Two Merger.
Note 14 Segment Information
The Company’s Chief Executive Officer is its chief operating decision maker (the “CODM”). The Company reports segment information based on how the CODM evaluates performance and makes decisions about how to allocate resources. Accordingly, the Company has 2 operating and reportable segments: Satellite Solutions and Earth Observation Solutions.
F-94
The reportable segments are defined as follows:
| • | Satellite Solutions |
The Satellite Solutions segment is a vertically integrated satellite provider with modern facilities and a global ground station network that deliverssatellite solutions, including spacecraft design, development, launch services and
end-to-end
on-orbit
operations for critical missions across a number of applications in a variety of orbits to governmental agencies and commercial businesses.| • | Earth Observation Solutions |
Through the Satellite Solutions segment, the Earth Observation Solutions segment has commenced developing satellites and intends to continue to develop, build, launch and operate a constellation of Earth observation satellites that will feature Synthetic Aperture Radar (“SAR”) and electro-optical capabilities to provide Earth observation data and mission solutions that it believes will be distinguished by breadth of coverage, revisit rates and ability to observe and detect during day and night and through clouds and other interference. In addition, the Earth Observation Solutions segment plans to provide secondary payload solutions and onboard data processing capabilities on its satellite constellation, including sensors, optical links or other mission solutions. The Earth observation satellite constellation of 96 satellites is planned to be completed and
in-orbit
by 2026. The scope and timing of the satellite constellation is subject to continuing assessments of customer demand and the Company’s financial and other resources. The Earth Observation Solutions segment is still in its developmental stage and does not yet generate any material revenue.The CODM uses income (loss) from operations by segment as the segment profitability measure in order to evaluate segment performance. Income (loss) from operations by segment excludes share-based compensation expense and corporate and other costs included within the Company’s consolidated income (loss) from operations.
The CODM does not review the Company’s assets by segment; therefore, such information is not presented.
The following table presents revenue by segment and a reconciliation to consolidated revenue for the periods presented:
Years Ended December 31, | ||||||||
(in thousands) | 2021 | 2020 | ||||||
Satellite Solutions | $ | 40,736 | $ | 24,860 | ||||
Earth Observation Solutions | 170 | 19 | ||||||
Revenue | $ | 40,906 | $ | 24,879 | ||||
The following table presents loss from operations by segment for the periods presented:
Years Ended December 31, | ||||||||
(in thousands) | 2021 | 2020 | ||||||
Satellite Solutions | $ | (3,326 | ) | $ | (2,128 | ) | ||
Earth Observation Solutions | (4,274 | ) | (2,703 | ) | ||||
Loss from operations by segment | $ | (7,600 | ) | $ | (4,831 | ) | ||
During 2021, depreciation and amortization expense included in loss from operations by segment totaled $2.7 million and $368 thousand for Satellite Solutions and Earth Observation Solutions, respectively. During 2020, depreciation and amortization expense included in loss from operations by segment totaled $2.9 million and related entirely to Satellite Solutions.
F-95
The following table presents a reconciliation of loss from operations by segment to consolidated loss from operations and net loss for the periods presented:
Years Ended December 31, | ||||||||
(in thousands) | 2021 | 2020 | ||||||
Loss from operations by segment | $ | (7,600 | ) | $ | (4,831 | ) | ||
Corporate and other | (28,431 | ) | (3,394 | ) | ||||
Share-based compensation expense | (678 | ) | (1,194 | ) | ||||
Loss from operations | (36,709 | ) | (9,419 | ) | ||||
Interest expense, net | 7,965 | 1,216 | ||||||
Loss on extinguishment of debt | 96,024 | — | ||||||
Change in fair value of warrant and derivative liabilities | (1,716 | ) | — | |||||
Other (income) expense | (38 | ) | 4 | |||||
Loss before income taxes | (138,944 | ) | (10,639 | ) | ||||
Provision for (benefit from) income taxes | 38 | (184 | ) | |||||
Net loss | $ | (138,982 | ) | $ | (10,455 | ) | ||
The following table presents revenue by geography and a reconciliation to consolidated revenue for the periods presented:
Years Ended December 31, | ||||||||
(in thousands) | 2021 | 2020 | ||||||
United States | $ | 32,960 | $ | 21,215 | ||||
Europe | 7,946 | 3,664 | ||||||
Revenue | $ | 40,906 | $ | 24,879 | ||||
The following table presents property, plant and equipment, net by geography and a reconciliation to consolidated property, plant and equipment, net for the periods presented:
December 31, | ||||||||
(in thousands) | 2021 | 2020 | ||||||
United States | $ | 34,840 | $ | 18,956 | ||||
Europe | 690 | 565 | ||||||
Property, plant and equipment, net | $ | 35,530 | $ | 19,521 | ||||
Note 15 Subsequent Events
The Company evaluated subsequent events through March 31, 2022, the date at which the consolidated financial statements were available to be issued. Relevant subsequent events are disclosed in the preceding notes to the consolidated financial statements.
F-96
Part II
INFORMATION NOT REQUIRED IN PROSPECTUS
Item 13. Other Expenses of Issuance and Distribution.
The following is an estimate of the expenses that Terran Orbital Corporation (the “Registrant”) may incur in connection with the securities being registered hereby (all of which are to be paid by the Registrant).
SEC registration fee | $86,100 | |||
Legal fees and expenses | * | |||
Accounting fees and expenses | * | |||
Financial printing and miscellaneous expenses | * | |||
Total | * | |||
| * | Except for the SEC registration fee, estimated expenses are not presently known. The foregoing sets forth the general categories of expenses (other than underwriting discounts and commissions) that we anticipate we will incur in connection with the offering of securities under this Registration Statement on Form S-1. To the extent required, any applicable prospectus supplement will set forth the estimated aggregate amount of expenses payable in respect of any offering of securities under the registration statement. |
Item 14. Indemnification of Directors and Officers.
Section 145 of the Delaware General Corporation Law authorizes a corporation to indemnify directors and officers under certain circumstances and subject to certain limitations. The terms of Section 145 of the Delaware General Corporation Law are sufficiently broad to permit indemnification under certain circumstances for liabilities, including reimbursement of expenses incurred, arising under the Securities Act of 1933, as amended (the “Securities Act”), subject to certain exceptions.
As permitted by the Delaware General Corporation Law, the Registrant’s certificate of incorporation, as amended (the “Certificate of Incorporation”) contains provisions that eliminate the personal liability of its directors for monetary damages for any breach of fiduciary duties as a director; provided, however, that the Delaware General Corporation Law prohibits the elimination or limitation of liability of a director for the following:
| • | any breach of the director’s duty of loyalty to the Registrant or its stockholders; |
| • | acts or omissions not in good faith or that involve intentional misconduct or a knowing violation of law; |
| • | under Section 174 of the Delaware General Corporation Law (regarding unlawful dividends and stock purchases); or |
| • | any transaction from which the director derived an improper personal benefit. |
As permitted by the Delaware General Corporation Law, the Registrant’s restated bylaws (the “Bylaws”) provide that:
| • | the Registrant is required to indemnify its directors and officers to the fullest extent permitted by the Delaware General Corporation Law, subject to limited exceptions; |
| • | the Registrant is required to advance expenses, as incurred, to its directors and officers in connection with a legal proceeding to the fullest extent permitted by the Delaware General Corporation Law, subject to limited exceptions; and |
| • | the rights conferred in the bylaws are not exclusive. |
II-1
The Registrant has entered into indemnification agreements with its directors and executive officers, which provide for indemnification and advancements by the Registrant of certain expenses and costs under certain circumstances. At present, there is no pending litigation or proceeding involving a director or executive officer of the Registrant for which indemnification is sought. The indemnification provisions in the Registrant’s Bylaws and the indemnification agreements entered into between the Registrant and each of its directors and executive officers may be sufficiently broad to permit indemnification of the Registrant’s directors and executive officers for liabilities arising under the Securities Act.
The Registrant has directors’ and officers’ liability insurance for securities matters.
Item 15. Recent Sales of Unregistered Securities.
Since January 1, 2019, the Registrant has issued and sold the following unregistered securities:
| • | On December 3, 2020, Tailwind Two Sponsor LLC (the “ Tailwind Two Sponsor of the Registrant. Such securities were issued in connection with the Registrant’s organization pursuant to the exemption from registration contained in Section 4(a)(2) of the Securities Act. The Tailwind Two Sponsor is an accredited investor for purposes of Rule 501 of Regulation D. Each of the equity holders in the Tailwind Two Sponsor is an accredited investor under Rule 501 of Regulation D. The sole business of the Tailwind Two Sponsor was to act as the Registrant’s sponsor in connection with the initial public offering of Tailwind Two. |
| • | On March 4, 2021, Tailwind Two consummated a private placement of 7,800,000 private placement warrants, each exercisable to purchase one Class A ordinary share, of Tailwind Two at $11.50 per share (the “ private placement warrants |
| • | On October 28, 2021, concurrently with the execution of the Merger Agreement, Tailwind Two entered into subscription agreements (the “ Subscription Agreements PIPE Investors Insider PIPE Investor Investors PIPE Financing |
| • | On March 25, 2022, the Registrant issued an aggregate of 8,420,569 shares of common stock, par value $0.0001, to certain debt providers concurrently with the closing of the Registrant’s Business Combination in partial consideration for Francisco Partners, Beach Point and Lockheed Martin each agreeing to enter into the transactions in connection with the closing of such transaction. “ Management’s Discussion and Analysis of Financial Condition and Results of Operations—Recent Developments |
II-2
| • | On March 25, 2022, the Registrant issued an aggregate of 11,055,606 warrants to certain debt providers concurrently with the closing of the Registrant’s Business Combination in partial consideration for Francisco Partners, Beach Point and Lockheed Martin each agreeing to enter into the transactions in connection with the closing of such transaction. “ Management’s Discussion and Analysis of Financial Condition and Results of Operations—Recent Developments |
Item 16. Exhibits and Financial Statement Schedules.
(a) Exhibits.
II-3
II-4
II-5
| ** | Filed herewith. |
| † | Schedules and exhibits to this Exhibit omitted pursuant to Item 601(b)(2) of Regulation S-K. The Registrant hereby agrees to furnish supplementally a copy of any omitted schedule or exhibit to the SEC upon request. |
| + | Indicates a management contract or compensatory plan. |
| # | Certain confidential portions (indicated by brackets and asterisks) have been omitted from this exhibit. |
II-6
Item 17. Undertakings.
The undersigned registrant hereby undertakes:
| (1) | to file, during any period in which offers or sales are being made, a post-effective amendment to this registration statement: |
| (i) | to include any prospectus required by Section 10(a)(3) of the Securities Act of 1933, as amended (the “Securities Act”); |
| (ii) | to reflect in the prospectus any facts or events arising after the effective date of the registration statement (or the most recent post-effective amendment thereof) which, individually or in the aggregate, represent a fundamental change in the information set forth in the registration statement. Notwithstanding the foregoing, any increase or decrease in volume of securities offered (if the total dollar value of securities offered would not exceed that which was registered) and any deviation from the low or high end of the estimated maximum offering range may be reflected in the form of prospectus filed with the Commission pursuant to Rule 424(b) if, in the aggregate, the changes in volume and price represent no more than a 20% change in the maximum aggregate offering price set forth in the “Calculation of Registration Fee” table in the effective registration statement; and |
| (iii) | to include any material information with respect to the plan of distribution not previously disclosed in the registration statement or any material change to such information in the registration statement; |
provided, however, that paragraphs (i), (ii) and (iii) do not apply if the registration statement is on Form
S-1
and the information required to be included in a post-effective amendment by those paragraphs is contained in reports filed with or furnished to the Commission by the registrant pursuant to Section 13 or Section 15(d) of the Securities Exchange Act of 1934 that are incorporated by reference in the registration statement, or is contained in a form of prospectus filed pursuant to Rule 424(b) that is part of the registration statement;| (2) | that, for the purpose of determining any liability under the Securities Act, each such post-effective amendment shall be deemed to be a new registration statement relating to the securities offered therein, and the offering of such securities at that time shall be deemed to be the initial bona fide offering thereof; |
| (3) | to remove from registration by means of a post-effective amendment any of the securities being registered which remain unsold at the termination of the offering; |
| (4) | that, for the purpose of determining liability under the Securities Act to any purchaser: each prospectus filed pursuant to Rule 424(b) as part of a registration statement relating to an offering, other than registration statements relying on Rule 430B or other than prospectuses filed in reliance on Rule 430A, shall be deemed to be part of and included in the registration statement as of the date it is first used after effectiveness. Provided, however, that no statement made in a registration statement or prospectus that is part of the registration statement or made in a document incorporated or deemed incorporated by reference into the registration statement or prospectus that is part of the registration statement will, as to a purchaser with a time of contract of sale prior to such first use, supersede or modify any statement that was made in the registration statement or prospectus that was part of the registration statement or made in any such document immediately prior to such date of first use; and |
| (5) | that, for the purpose of determining liability of the registrant under the Securities Act to any purchaser in the initial distribution of the securities, the undersigned registrant undertakes that in a primary offering of securities of the undersigned registrant pursuant to this registration statement, regardless of the underwriting method used to sell the securities to the purchaser, if the securities are offered or sold to such purchaser by means of any of the following communications, the undersigned registrant will be a seller to the purchaser and will be considered to offer or sell such securities to such purchaser: |
| (a) | any preliminary prospectus or prospectus of the undersigned registrant relating to the offering required to be filed pursuant to Rule 424; |
| (b) | any free writing prospectus relating to the offering prepared by or on behalf of the undersigned registrant or used or referred to by the undersigned registrant; |
II-7
| (c) | the portion of any other free writing prospectus relating to the offering containing material information about the undersigned registrant or its securities provided by or on behalf of an undersigned registrant; and |
| (d) | any other communication that is an offer in the offering made by the undersigned registrant to the purchaser. |
Insofar as indemnification for liabilities arising under the Securities Act of 1933 may be permitted to directors, officers, and controlling persons of the registrant pursuant to the foregoing provisions, or otherwise, the registrant has been advised that in the opinion of the Securities and Exchange Commission, such indemnification is against public policy as expressed in the Securities Act of 1933 and is, therefore, unenforceable. In the event that a claim for indemnification against such liabilities (other than the payment by the registrant of expenses incurred or paid by a director, officer, or controlling person of the registrant in the successful defense of any action, suit, or proceeding) is asserted by such director, officer, or controlling person in connection with the securities being registered, the registrant will, unless in the opinion of its counsel the matter has been settled by controlling precedent, submit to a court of appropriate jurisdiction the question whether such indemnification by it is against public policy as expressed in the Securities Act of 1933 and will be governed by the final adjudication of such issue.
II-8
SIGNATURES
Pursuant to the requirements of the Securities Act of 1933, as amended, the Registrant has duly caused this registration statement on Form
S-1
to be signed on its behalf by the undersigned, thereunto duly authorized, in the City of Boca Raton, State of Florida, on the first day of June, 2022.TERRAN ORBITAL CORPORATION | ||
| By: | /s/ Marc H. Bell | |
| Marc H. Bell | ||
| Chief Executive Officer | ||
Pursuant to the requirements of the Securities Act of 1933, as amended, this registration statement on Form
S-1
has been signed by the following persons in the capacities and on the dates indicated.Signature | Title | Date | ||
/s/ Marc H. Bell Marc H. Bell | Chairman and Chief Executive Officer ( Principal Executive Officer | June 1, 2022 | ||
/s/ Gary A. Hobart Gary A. Hobart | Chief Financial Officer, Executive Vice President and Treasurer ( Principal Financial Officer | June 1, 2022 | ||
/s/ Mathieu Riffel Mathieu Riffel | Vice President and Controller ( Principal Accounting Officer | June 1, 2022 | ||
* Anthony Previte | Director | June 1, 2022 | ||
* Daniel C. Staton | Director | June 1, 2022 | ||
* James LaChance | Director | June 1, 2022 | ||
S-1
* Tom Manion | Director | June 1, 2022 | ||
* Richard Y. Newton III | Director | June 1, 2022 | ||
* Tobi Petrocelli | Director | June 1, 2022 | ||
* Douglas L. Raaberg | Director | June 1, 2022 | ||
* Stratton Sclavos | Director | June 1, 2022 | ||
*By: /s/ Marc H. Bell | ||||
| Marc H. Bell | ||||
| Attorney-in-fact |
S-2