CONTENTS
| 5 |
| 5 |
| 6 |
| 8 |
| 8 |
| 8 |
| 8 |
| A. Selected Financial Data | 8
|
| B. Capitalization and Indebtedness | 8
|
| C. Reasons for the Offer and Use of Proceeds | 8
|
| D. Risk Factors | 8
|
| 47 |
| A. History and Development of the Company | 47 |
| B. Business Overview | 47 |
| C. Organizational Structure | 65 |
| D. Property, Plants and Equipment | 66 |
| 66 |
| 66 |
| A. Operating Results | 75 |
| B. Liquidity and Capital Resources | 78 |
| C. Research and Development, Patents and Licenses, Etc. | 80 |
| D. Trend Information | 80 |
| E. Critical Accounting Estimates | 81 |
| 83 |
| A. Directors and Senior Management | 83 |
| B. Compensation | 85 |
| C. Board Practices | 89
|
| D. Employees | 101 |
| E. Share Ownership | 101 |
| 101 |
| A. Major Shareholders | 101 |
| B. Related Party Transactions | 104 |
| C. Interests of Experts and Counsel | 107 |
| 107 |
| A. Consolidated Statements and Other Financial Information | 107 |
| B. Significant Changes | 107 |
| 107 |
| A. Offer and Listing Details | 107 |
| B. Plan of Distribution | 108 |
| C. Markets | 108 |
| D. Selling Shareholders | 108 |
| E. Dilution | 108 |
| F. Expenses of the Issue | 108 |
| |
| A. Share Capital | 108 |
| B. Memorandum and Articles of Association | 108 |
| C. Material Contracts | 108 |
| D. Exchange Controls | 108 |
| E. Taxation | 108 |
| F. Dividends and Paying Agents | 115 |
| G. Statement by Experts | 115 |
| H. Documents on Display | 115 |
| I. Subsidiary Information | 115 |
| 116 |
| 116 |
| 116 |
| 116 |
| 116 |
| 117 |
| 117 |
| 117 |
| 117 |
| 118 |
| 119 |
| 119 |
| 119 |
| 119 |
| 120 |
| 120 |
| 120 |
| 120 |
| 120 |
| 120 |
| 122 |
| F-1 |
ABOUT THIS ANNUAL REPORT
As used in this Annual Report, except where the context otherwise requires or where otherwise indicated, references to “Global-e,” the “Company,” “we,” “us,” “our,” “our company” and similar references refer to Global-E Online Ltd., together with its consolidated subsidiaries as a consolidated entity.
All references in this Annual Report to “Israeli currency” and “NIS” refer to New Israeli Shekels, the terms “dollar,” “USD” or “$” refer to U.S. dollars and the terms “€” or “euro” refer to the currency introduced at the start of the third stage of European economic and monetary union pursuant to the treaty establishing the European Community, as amended.
BASIS OF PRESENTATION
Our financial statements have been prepared in accordance with generally accepted accounting principles in the United States (“GAAP”). We present our consolidated financial statements in U.S. dollars.
Our fiscal year ends on December 31 of each year. Our most recent fiscal year ended on December 31, 2021.
Certain monetary amounts, percentages and other figures included elsewhere in this Annual Report have been subject to rounding adjustments. Accordingly, figures shown as totals in certain tables or charts may not be the arithmetic aggregation of the figures that precede them, and figures expressed as percentages in the text may not total 100% or, as applicable, when aggregated may not be the arithmetic aggregation of the percentages that precede them.
Key Performance Indicators and Non-GAAP Financial Measures Used in this Annual Report
Throughout this Annual Report, we provide a number of key performance indicators and non-GAAP financial measures used by our management and often by others in our industry. These are discussed in more detail in the section entitled “Operating and Financial Review and Prospects— Key Performance Indicators and Other Operating Metrics” which also includes a reconciliation of our non-GAAP financial measures to the most directly comparable U.S. GAAP metric. We define these key performance indicators and non-GAAP financial measures as follows:
| | • | | “Gross Merchandise Value” or “GMV” is defined as the combined amount we collect from the shopper and the merchant for all components of a given transaction, including products, duties and taxes and shipping; |
| | • | | “Adjusted EBITDA” is a non-GAAP financial measure and is defined as operating profit (loss) adjusted for depreciation and amortization, stock-based compensation expenses, offering related expenses and merger and acquisition expenses; |
| | • | | “Net Dollar Retention Rate” for a given period is calculated by dividing the GMV in that period by the GMV in the comparable period in the prior year, in each case, from merchants that processed transactions on our platform in the earlier of the two periods. |
The aforementioned key performance indicators and non-GAAP financial measures are used by management and our board of directors to assess our performance, for financial and operational decision-making, and as a means to evaluate period-to-period comparisons. These measures are frequently used by analysts, investors and other interested parties to evaluate companies in our industry. We believe that these non-GAAP financial measures are appropriate measures of operating performance because they remove the impact of certain items that we believe do not directly reflect our core operations, and permit investors to view performance using the same tools that we use to budget, forecast, make operating and strategic decisions, and evaluate historical performance.
Market and Industry Data
Unless otherwise indicated, information in this Annual Report concerning economic conditions, our industry, our markets and our competitive position is based on a variety of sources, including statistical, market and industry data and forecasts, that we obtained from publicly available information and independent industry publications and reports that we believe to be reliable sources. These publicly available industry publications and reports generally state that they obtain their information from sources that they believe to be reliable, but they do not guarantee the accuracy or completeness of the information. Although we believe that these sources are reliable, we have not independently verified the information contained in such publications. Certain estimates and forecasts involve uncertainties and risks and are subject to change based on various factors, including those discussed under the headings “Cautionary Statement Regarding Forward-Looking Statements” and “Item 3.D. Risk Factors” in this Annual Report.
Our estimates are derived from publicly available information released by third-party sources, as well as data from our internal research, which we believe to be reasonable. None of the independent industry publications used in this Annual Report were prepared on our behalf.
Certain estimates of market opportunity and forecasts of market growth included in this Annual Report may prove to be inaccurate. The market for e-commerce solutions is relatively new and will experience changes over time. E-commerce market estimates and growth forecasts, whether obtained from third-party sources or developed internally, are uncertain and based on assumptions and estimates that may prove to be inaccurate. The estimates and forecasts in this Annual Report relating to the size of our target market, market demand and adoption, capacity to address this demand and pricing may prove to be inaccurate. The addressable market we estimate may not materialize for many years, if ever, and even if the markets in which we compete meet the size estimates in this Annual Report, our business could fail to grow at similar rates, if at all.
Trademarks
We or our licensors have proprietary rights to trademarks used in this Annual Report. Solely for convenience, trademarks and trade names referred to in this Annual Report may appear without the “®” or “™” symbols, but such references are not intended to indicate, in any way, that we will not assert, to the fullest extent possible under applicable law, our rights or the rights of the applicable licensor to these trademarks and trade names. We do not intend our use or display of other companies’ trademarks, trade names or service marks to imply a relationship with, or endorsement or sponsorship of us by, any other companies. Each trademark, trade name or service mark of any other company appearing in this Annual Report is the property of its respective holder.
CAUTIONARY STATEMENT REGARDING FORWARD-LOOKING STATEMENTS
In addition to historical facts, this Annual Report contains forward-looking statements within the meaning of Section 27A of the U.S. Securities Act of 1933, as amended (the “Securities Act”), Section 21E of the U.S. Securities Exchange Act of 1934, as amended (the “Exchange Act”) and the safe harbor provisions of the U.S. Private Securities Litigation Reform Act of 1995. These forward-looking statements are principally contained in the sections entitled Item 3.D “Key Information—Risk Factors,” Item 4. “Information on the Company,” and Item 5. “Operating and Financial Review and Prospects.”
Our estimates and forward-looking statements are mainly based on our management’s current expectations and estimates of future events and trends, which affect or may affect our business, operations, and industry. Although these estimates and forward-looking statements are based upon our management’s current reasonable beliefs and assumptions, they are subject to numerous risks and uncertainties, and are made in light of information currently available to us. Many important factors, in addition to the factors described in this Annual Report, may adversely affect our results as indicated in forward-looking statements. You should read this Annual Report and the documents we have filed as exhibits to the registration statement of which this Annual Report is a part completely, and with the understanding that our actual future results may be materially different and worse from what we expect.
All statements other than statements of historical fact are forward-looking statements. In some cases, these forward-looking statements can be identified by words or phrases such as “may,” “might,” “will,” “could,” “would,” “should,” “expect,” “plan,” “anticipate,” “intend,” “seek,” “believe,” “estimate,” “predict,” “potential,” “continue,” “contemplate,” “possible,” or similar words, as well as their negatives. Statements regarding our future results of operations and financial position, growth strategy and plans and objectives of management for future operations, including, among others, expansion in new and existing markets, development and introductions of new products, capital expenditures and debt service obligations, are forward-looking statements.
These forward-looking statements are subject to a number of known and unknown risks, uncertainties, other factors and assumptions, including the risks described in Item 3.D “Key Information—Risk Factors” and elsewhere in this Annual Report.
In light of the significant uncertainties in these forward-looking statements, you should not regard these statements as a representation or warranty by us or any other person that we will achieve our objectives and plans in any specified time period or at all. Moreover, we operate in an evolving environment. New risks and uncertainties emerge from time to time, and it is not possible for our management to predict all risks and uncertainties, nor can we assess the impact of all factors on our business or the extent to which any factor, or combination of factors, may cause actual results to differ materially from those contained in any estimates or forward-looking statements. We qualify all of our estimates and forward-looking statements by these cautionary statements.
The estimates and forward-looking statements contained in this Annual Report speak only as of the date of this Annual Report. Except as required by applicable law, we undertake no obligation to publicly update or revise any estimates or forward-looking statements contained in this Annual Report, whether as a result of any new information, future events, or otherwise, or to reflect the occurrence of unanticipated events or otherwise.
RISK FACTOR SUMMARY
Our business is subject to numerous risks and uncertainties, including those described in Item 3. “Key Information — D. Risk Factors.” You should carefully consider these risks and uncertainties when investing in our ordinary shares. Principal risks and uncertainties affecting our business include the following:
| | • | | our ability to retain existing, and attract new, merchants; |
| | • | | our expectations regarding our revenue, expenses and operations; |
| | • | | anticipated trends and challenges in our business and the markets in which we operate; |
| | • | | our ability to compete in our industry; |
| | • | | our ability to integrate acquired businesses and technologies; |
| | • | | our ability to anticipate merchant needs or develop or acquire new functionality or enhance our existing platform to meet those needs; |
| | • | | our ability to manage our growth and manage expansion into additional markets; |
| | • | | our ability to establish and protect intellectual property rights; |
| | • | | our ability to hire and retain key personnel; |
| | • | | our ability to adapt to emerging or evolving regulatory developments, technological changes, and cybersecurity needs; |
| | • | | our anticipated cash needs and our estimates regarding our capital requirements and our needs for additional financing; and |
| | • | | other statements described in this Annual Report under “Risk Factors,” “Operating and Financial Review and Prospects,” and “Business.” |
PART I
Item 1. Identity of Directors, Senior Management and Advisers
Not applicable.
Item 2. Offer Statistics and Expected Timetable
Not applicable.
Item 3. Key Information
| A. | Selected Financial Data |
Reserved.
| B. | Capitalization and Indebtedness |
Not applicable.
| C. | Reasons for the Offer and Use of Proceeds |
Not applicable.
You should carefully consider the risks and uncertainties described below and the other information in this Annual Report before making a decision to invest in our ordinary shares. Additional risks and uncertainties not presently known to us, or that we currently deem immaterial, may also impair our business operations. Our business, financial condition, or results of operations could be materially and adversely affected by any of these risks and uncertainties. The trading price and value of our ordinary shares could decline due to any of these risks and uncertainties, and you may lose all or part of your investment. This Annual Report also contains forward-looking statements that involve risks and uncertainties. See “Cautionary Statement Regarding Forward-Looking Statements.” Our actual results could differ materially from those anticipated in these forward-looking statements as a result of certain factors, including the risks and uncertainties faced by us described below and elsewhere in this Annual Report.
Risks Relating to our Business and Industry
We have experienced rapid growth in recent periods and our recent growth rates may not be indicative of our future growth.
We have experienced rapid growth in recent periods. Our revenue was $65.9 million, $136.4 million and $245.3 million for the years ended December 31, 2019, 2020 and 2021, respectively, representing an annual growth of 107.1% and 79.9% for the years ended December 31, 2020 and 2021, respectively. GMV processed through our platform during the years ended December 31, 2019, 2020 and 2021 was $382 million, $774 million and $1,449 million, respectively, representing an annual growth of 103% and 87% for the years ended December 31, 2020 and 2021, respectively. In future periods, we may not be able to sustain revenue or GMV growth consistent with recent history, or at all.
We believe our revenue and GMV growth depends on a number of factors, including, but not limited to, our ability to:
| | • | | increase the overall sales volume facilitated by our platforms; |
| | • | | maintain merchant retention rates; |
| | • | | increase merchants’ e-commerce sales conversion rates; |
| | • | | successfully expand our merchants into new geographies; |
| | • | | attract new merchants to our platforms in existing and new geographies, segments and verticals; |
| | | | |
| | • | | successfully integrating the technologies and platforms of Flow Commerce Inc., or Flow, and other businesses we may acquire in the future, into our existing platform; |
| | • | | provide integration with our merchants’ online e-commerce web-stores; |
| | • | | maintain the security, reliability and integrity of our platform; |
| | • | | maintain compliance with existing and comply with new applicable laws and regulations, including new tax rates and tariffs; |
| | • | | price our platform effectively so that we are able to attract and retain merchants; |
| | • | | successfully compete against our current and future competition and competing solutions; and |
| | • | | maintain service levels and consistent quality of our platform. |
We have also encountered in the past, and expect to encounter in the future, risks and uncertainties frequently experienced by growing companies in rapidly evolving industries. If our assumptions regarding these risks and uncertainties, which we use to plan and operate our business, are incorrect or change, or if we do not address these risks successfully, our growth rates may slow and our business could suffer. Further, our rapid growth may make it difficult to evaluate our future prospects. In addition, a portion of our growth in recent periods may be attributed to trends, including the increasing adoption of e-commerce, facilitated by the emergence of the COVID-19 pandemic. There is no assurance these trends will continue.
If we are unable to retain our existing merchants, or the GMV generated by such merchants on our platform declines or does not increase, our business, operating results and financial condition could be adversely affected.
Our revenues are correlated with the level of GMV that is processed through our platform and we expect our future revenue growth to be partially driven by increases to our existing merchants’ GMV. We aim to sign contracts with merchants for a minimum term of 12 months and with a minimum committed monthly volume, but our merchants (including our largest merchant, which represented approximately 12% and 10% of total GMV and generated 16% and 13% of our total revenues in the year ended December 31, 2020 and 2021 respectively) typically have the right to terminate their agreements for convenience by providing 30 to 180 days prior written notice, and have no obligation to renew their agreements with us after their terms expire. Even if our agreements with the merchants are renewed or not terminated, they may not be renewed on the same or as profitable terms, and may exclude utilization of our shipping services which may reduce our revenues. Although we typically maintain minimum fee arrangements with the merchants, we cannot guarantee that such minimum fees will be commensurate with revenues earned in previous periods. As a result, if existing merchants terminate their agreements with us, renew them on less favorable terms, or otherwise reduce the scope of their activity through our platform, our operating results and financial condition could suffer.
The growth of our business depends on our ability to attract new merchants and increase the GMV of transactions processed on our platform.
Our growth strategies include attracting new merchants to our platform and increasing the GMV processed through our platform. There is no guarantee that we can sustain our historical merchant acquisition rates and if we do, that such new merchants will lead to an increase of the GMV processed through our platform or to an increase in our revenues. Our ability to attract new merchants depends on the success of our platform with existing merchants and the success of our sales and marketing efforts, which may not be successful. Merchants who are not currently engaged in cross-border e-commerce may not be familiar with our solution and those currently engaged in cross-border e-commerce may use other products or services for their cross-border e-commerce needs. In addition, merchants may develop their own solutions to address their cross-border e-commerce needs, purchase competitive product offerings, or engage third-party providers of services and solutions that do not or will not enable the use of our platform and services. It may be difficult to engage and market to merchants who either do not currently have cross-border e-commerce needs, are unfamiliar with our platform and services, or utilize competing solutions and services for their e-commerce needs. This requires us to spend substantial time, effort and resources assisting merchants in evaluating our platform and services, including providing demonstrations, conducting gap analyses and substantiating the value of our platform and services. Furthermore, engaging and marketing to merchants in segments, verticals or new regions where we do not have a presence may also require effort and resources and may not result in the acquisition of new merchants or in increase of GMV. If merchants do not perceive our offerings to be of sufficiently high value and quality, we may not be able to attract new merchants or increase our GMV and our business, operating results and financial condition could be adversely affected.
Additionally, even if we are successful in attracting new merchants, they may not generate GMV or revenue at the same rate or scale as our current or historical merchants. If new merchants that we acquire fail to use our platform to the same extent that our existing merchants do, it would reduce the GMV processed on our platform and therefore our revenue, which could materially adversely affect our operating results and our growth.
We have acquired, and may acquire in the future, other businesses. Acquisitions divert a substantial part of our resources and management attention and if we are unable to effectively integrate acquired business, our operating results may materially suffer.
We recently acquired Flow in January 2022 (the “Flow Merger”), and may in the future acquire complementary solutions, functionalities, technologies or businesses. Seeking and negotiating potential acquisitions to a certain extent diverts our management’s attention from other business concerns and is expensive and time-consuming. Acquisitions expose us and our business to unforeseen liabilities or risks associated with the business or assets acquired or with entering new markets. Through the acquisition of Flow we aim to expand our business into new markets and serve small and emerging brands by utilizing Flow’s technology with our solutions and position our platform as a cross-border solution for any size of merchant. If we are unable to achieve a successful integration of Flow, or effectively integrate other acquired business, we may not be successful in developing and marketing our offerings and our operating results will materially suffer and the potential benefits of the Flow Merger or other potential acquisition may not be realized to the full extent, in a timely fashion or at all. In addition, if the integrated platforms and solutions we offer do not achieve acceptance by the marketplace, our operating results will materially suffer.
If we fail to develop or acquire new functionality (and if acquired, to integrate it) or enhance our existing platforms to meet the needs of our current and future merchants, or if we fail to estimate the impact of developing and introducing new functionality or enhanced solutions in response to rapid market or technological changes, our revenue could decline and our expenditures could increase significantly.
The e-commerce market is characterized by rapid technological changes, frequent new product and service introductions, evolving industry standards and regulations and changing merchant and shopper preferences. To keep pace with technological and regulatory developments, satisfy increasingly sophisticated merchant and shopper needs, achieve market acceptance and maintain the performance and security of our platforms, we must continue to adapt, enhance, integrate and improve our platforms and existing services and we must also continue to introduce new functionality to our platforms. Any new solutions or functionality we develop or acquire (and subsequently, integrate) may not be introduced in a timely manner and may not achieve the broad market acceptance necessary to generate significant revenue. If we are unable to successfully develop or acquire (and subsequently, integrate) new solutions or enhance our existing solutions, our business, operating results and financial condition could be adversely affected.
We expect to incur significant expenses to develop, integrate and implement additional solutions and functionalities and to integrate any acquired solutions or functionalities into our existing platform to maintain our competitive position. These efforts may not result in commercially viable solutions. We may experience difficulties with software development, industry standards, threats to the security and integrity of our technological infrastructure, design, manufacturing or marketing that could delay or prevent our development, introduction or implementation of new solutions and enhancements. If we do not receive significant revenue from these investments, our business, operating results and financial condition could be adversely affected. Merchants may require customized integrations, or features and functions that we do not yet offer or do not intend to offer, or which we have yet fully integrated or implemented, any of which may cause them to choose a competing solution. If we fail to develop solutions that satisfy merchant and shoppers’ preferences in a timely and cost-effective manner, our ability to renew our contracts with existing merchants and our ability to create or increase demand for our platform could be harmed, and our business, operating results and financial condition could be materially adversely affected. We have recently closed the Flow Merger, the integration of Flow may result in difficulties and delays, require additional investment and costs, and even if completed, may not achieve the economic or market results in terms of revenue creation and improved technological solutions that we have expected or anticipated.
We may not be able to successfully compete against current and future competition or other competing solutions, and we may need to change our pricing and model to remain competitive.
We face increasing competition in the market of cross-border e-commerce, and we expect competition and alternative and competing solutions to intensify in the future. Increased competition could lead to a decrease in the GMV processed through our platforms and could reduce our revenue or margins, any of which could negatively affect our business, financial condition and results of operations. A number of competitive factors could cause merchants to cease using or decline to use our platforms and services, or could reduce the transaction volume that they process through our platforms, including, among others:
| | • | | merchants may choose to develop cross-border e-commerce capabilities internally or choose competing solutions; |
| | • | | merchants may merge with or be acquired by companies using a competing solution or an internally-developed solution; |
| | • | | competing solutions may be offered as part of a bundle of e-commerce services; |
| | • | | current and potential competition and competing solutions may adopt more aggressive pricing policies, offer more attractive sales terms, adapt more quickly to new technologies and changes in merchant requirements or devote greater resources to the promotion and sale of their products and solutions than we can; and |
| | • | | current and potential competition may merge or establish cooperative relationships among themselves or with third parties to enhance their products, solutions and expand their markets, forming alliances that rapidly acquire significant market share. |
We cannot assure that we will be able to compete successfully against current and future competition or competing solutions. If we cannot compete successfully against our current and future competition or such competing solutions, our business, operating results and financial condition could be materially and negatively impacted.
In addition, as new or existing competing solutions may be offered in competitive prices, we may be unable to retain existing merchants or attract new merchants. Mid-market and large enterprise merchants may demand substantial price discounts as part of the negotiation of contracts. As a result, we could be required to choose either to reduce our prices or otherwise change our pricing model, or both, which could adversely affect our business, operating results, and financial condition.
We cannot be certain that we will realize the benefits of strategic alliances, joint ventures or partnership arrangements, including with third-party e-commerce platforms. Any failure to manage such strategic alliances, partnerships or joint ventures, or to integrate them with our existing or future business, could have a material adverse effect on us.
We have entered into partnership arrangements, and in the future may consider opportunities to enter into additional arrangements or strategic alliances that may be beneficial for our operations and the growth of our platform. Our ability to grow through these types of partnerships is subject to a number of risks, including unanticipated costs associated with strategic alliances, issues conforming to standards, procedures and contractual requirements, and diversion of management’s attention from our existing business. For example, we have entered into a Services and Partnership Agreement with Shopify Inc. and its affiliates (“Shopify”), dated April 12, 2021 (the “2021 Shopify Agreement”), and concurrently with the acquisition of Flow, we entered into an Amended and Restated Master Services Agreement with Flow and Shopify, dated January 4, 2022 (the “2022 Shopify Agreement,” and together with the 2021 Shopify Agreement, the “Shopify Agreements”), making our platform services and the Flow platform services, respectively, available to certain Shopify merchants through Shopify’s e-commerce platform. Entering into such relationship with Shopify requires us to incur non-recurring and other charges, significantly increasing our near and long-term expenditures. In addition, the 2021 Shopify Agreement requires us to pay Shopify fees equal to a percentage of the GMV for all transactions processed through the respective platforms for applicable Shopify merchants, which may negatively impact our margins. In connection with entering into the Shopify Agreements, we issued securities to Shopify which may dilute our existing shareholders. The potential benefits of our relationship with Shopify are hard to estimate or quantify at this time, and we cannot be certain that our arrangement with Shopify will provide the revenue or net income that justifies such transaction.
Each of the Shopify Agreements is terminable by either party immediately upon notice of certain events, subject to applicable cure periods, or without cause upon prior notice. Any termination of each of the Shopify Agreements could have a material adverse effect on our business, financial condition or results of operations. These risks could apply to any similar arrangement we may enter into, and any potential future collaborations may be similarly terminable by our collaborators.
The success of our business model is reliant on our ability to integrate our platform with third-party e-commerce platforms, our ability to operate according to such third parties’ terms of use and integration requirements, and our ability to maintain any partnership that we have entered into or may enter into with such third parties. Inability or failure to do so would reduce the attractiveness of our solutions for use by current and future merchants.
Merchants sometimes carry out e-commerce activity through third-party e-commerce platforms, such as Salesforce Commerce Cloud, Shopify, BigCommerce, Magento Commerce, SAP/Hybris, WooCommerce, PrestaShop and others. Our ability to attract merchants that utilize such platforms to conduct their e-commerce activity is contingent on our ability to integrate our solutions into the e-commerce platforms they use. Each of the companies that operates these e-commerce platforms dictates the terms of use of its respective platform, including the manner and procedure by which we integrate to its platform. To the extent any such operators offer or promote alternative products or solutions or would limit or prevent merchants from utilizing our platform, our business, financial condition or results of operations could be materially and adversely affected.
Some of these companies also demand that certain certification processes are satisfied prior to implementing an integration into the e-commerce platform they operate. Compliance with such terms may subject us to waiting periods due to certification and onboarding processes and may require us to modify aspects of our platform’s functionality in order to fit applicable technical standards. While we exert substantial efforts to maintain compliance, and although notice of changes and instructions are typically provided in advance, the terms of use and requirements may change unilaterally at the discretion of the e-commerce platform, and none of our efforts as a result would be sufficient. If we fail to maintain certification or compliance, the willingness of merchants to adopt or continue to use our solutions may be by reduced.
In addition, in the event that our solutions do not integrate optimally with third-party e-commerce platforms, leading to errors, defects, disruption or other performance problems, shoppers’ experience will be adversely affected, our reputation may be harmed and our ability to achieve and maintain growth among merchants on the e-commerce platforms would be adversely affected.
We have recently entered into the respective Shopify Agreements. If we are unable to perform under the agreements, fail to maintain our relationship with Shopify, or the Shopify Agreements are otherwise terminated for any reason, our business, financial condition and results of operation could be materially and adversely effected.
If we are not successful in developing or maintaining the functionality of our platforms or if real or perceived errors, failures, vulnerabilities, or bugs in our platforms abound, our business, results of operations, and financial condition could be adversely affected.
Any errors, defects, or disruptions in our platforms, or other performance problems with our platforms could harm our reputation and may damage the businesses of our merchants. Our platform could contain undetected errors, “bugs” or misconfigurations that could adversely affect its performance. Additionally, we regularly update and enhance our platform and introduce new versions of our platform and service. These updates may contain undetected errors when introduced or released, which may cause disruptions in our services and may reduce merchants and shoppers satisfaction. Our continued growth depends in part on our ability to maintain the existing functionality of our platform and services (and implementing the functionality of our acquired platforms), meet our service levels, prevent down time and degradation of services on our platforms for both merchants and shoppers. Failure to do so may result in damage to our reputation which may have an adverse effect on our business and results of operation.
We have experienced in the past and may in the future experience disruptions, data loss, outages, and other performance problems with our infrastructure due to a variety of factors, including infrastructure changes, introductions of new functionality, human or software errors, capacity constraints, denial-of-service attacks, ransomware attacks, or other security-related incidents. In some instances, we may not be able to identify the cause or causes of these performance problems immediately or in short order. We may not be able to maintain the level of service uptime and performance required by merchants, especially during peak usage times as traffic and volumes increase. Since our merchants rely on our platforms to carry out cross-border e-commerce on an ongoing basis, any outage on our platforms would have a direct adverse impact on our merchants business. Our merchants may seek compensation from us for any losses they suffer or cease conducting business with us altogether. Further, a merchant could share information about bad experiences, which could result in damage to our reputation and loss of current and future sales. There can be no assurance that provisions typically included in our contracts with our merchants that attempt to limit our exposure to claims would be enforceable or adequate or would otherwise protect us from liabilities or damages with respect to any particular claim. Even if not successful, a claim brought against us by any of our merchants would likely be time-consuming and costly to defend and could seriously damage our reputation and harm our ability to attract new merchants to our platform.
We have a history of net losses, we anticipate increasing operating expenses in the future, and we may not be able to achieve profitability.
We incurred significant net losses of $7.5 million and $74.9 million for the years ended December 31, 2019 and 2021, respectively. Because the market for our platform and services is rapidly evolving, it is difficult for us to predict our future results of operations or the limits of our market opportunity. As a result of our entry into the Shopify Agreements and the related issuance of warrants to purchase ordinary shares to Shopify, we recognize commercial agreement assets which are recognized upon the vesting of the warrants, and are amortized over time. This results in increased sales and marketing expenses and the reporting of a net loss for the year ended December 31, 2021 and we expect this will continue to result in significant increases to sales and marketing expenses in future periods and the reporting of net losses for such periods. In addition, as a result of the Flow Merger we expect to recognize intangible assets amortization expense over the next few years. We also expect our operating expenses to significantly increase over the next several years as we hire additional personnel, expand into new geographies, expand our partnerships, operations, and infrastructure, continue to enhance our platforms, develop and expand their features, integrations and capabilities, expand and improve our service offering and increase our spending on sales and marketing. We intend to continue to build and enhance our platforms through internal research and development and we may also selectively pursue acquisitions. In addition, as a public company, we will continue to incur additional significant legal, accounting, and other expenses that we did not incur as a private company. If we are unable to maintain revenues high enough to offset the expected increases in our operating expenses, we will not be profitable in future periods.
If we fail to manage our growth effectively, we may be unable to execute our business plan or maintain high levels of service and merchants satisfaction.
We have experienced, and expect to continue to experience, rapid growth, which has placed, and may continue to place, significant demands on our management and our technological, operational and financial resources. For example, our headcount has grown from 289 employees as at December 31, 2020 to 473 employees as at December 31, 2021. We have established international offices, including offices in Israel, the U.S., the UK, France, Japan, Australia and Singapore, and we plan to continue to expand our international operations into other countries in the future. We have also experienced significant growth in both the number of merchants and the number of transactions facilitated by our platform. For example, during the year ended December 31, 2021, approximately 7.0 million transactions were processed through our platform, generating in the aggregate $1,449 million of GMV, representing an increase of 87% relative to the GMV for the year ended December 31, 2020. Additionally, our organizational structure is becoming more complex as we scale our technological, operational, financial and management controls as well as our reporting systems and procedures.
To manage growth in our operations and personnel, we will need to continue to grow and improve our operational, financial, and management controls and our reporting systems and procedures. We will require significant capital expenditures and the allocation of valuable management resources to grow and adapt to our developing needs in these areas without undermining our culture, which has been central to our growth so far. If we fail to manage our anticipated growth and change in a manner that preserves the key aspects of our corporate culture, the quality of our platform and services may suffer, which could negatively affect merchants and shoppers and as a result our reputation.
The increasing focus on environmental sustainability and social initiatives could increase our costs, harm our reputation and adversely impact our financial results.
There has been increasing public focus by investors, customers, environmental activists, the media and governmental and nongovernmental organizations on a variety of environmental, social and other sustainability matters. If we are not effective in addressing environmental, social and other sustainability matters affecting our business, or setting and meeting relevant sustainability goals, our reputation and financial results may suffer. We may experience increased costs in order to execute upon our sustainability goals and measure achievement of those goals, which could have an adverse impact on our business and financial condition.
In addition, this emphasis on environmental, social and other sustainability matters has resulted and may result in the adoption of new laws and regulations, including new reporting requirements. If we fail to comply with new laws, regulations or reporting requirements, our reputation and business could be adversely impacted.
Our operations are subject to seasonal fluctuations. If we fail to accommodate increased volumes during peak seasons and events, our results of operations may be adversely affected.
Our business is seasonal in nature and the fourth quarter is a significant period for our operating results. Our revenue is correlated with the level of GMV that our merchants generate through our platform, and our merchants typically process additional GMV in the fourth quarter, which includes Black Friday, Cyber Monday and the holiday season and other peak events included in the e-commerce calendar, such as Chinese Singles’ Day and Thanksgiving. In the years ended December 31, 2019, 2020 and 2021, fourth quarter GMV represented approximately 38%, 39% and 35%, respectively, of our total GMV. As a result, GMV and accordingly our revenue will generally decline in the first quarter of each year relative to the fourth quarter of the previous year.
Any disruption in our ability to process and ship shopper orders, especially during the fourth quarter, could have a negative effect on our quarterly and annual operating results. Surges in volumes during peak periods may strain our technological infrastructure, logistics channels, shopper and merchant support activities as well as our third-party service providers. Inability of any of these components to process increased volumes may prevent us from efficiently processing and shipping orders, which may reduce our GMV and the attractiveness of our platform.
Any disruption to our operations or the operations of our merchants, our shipping and logistics partners, or other service providers could lead to a material decrease in GMV or revenues relative to our expectations for the fourth quarter which could result in a significant shortfall in revenue and operating cash flows for the full year.
We have a limited operating history, which makes it difficult to forecast our revenue and evaluate our business and future prospects, especially in light of the COVID-19 pandemic and its impact on consumer behavior.
We launched our operations in 2013 and our growth has occurred primarily in recent periods. As a result of our limited operating history, our ability to forecast our future results of operations and plan for and model future growth is limited and subject to a number of uncertainties. We have encountered and expect to continue to encounter risks and uncertainties frequently experienced by growing companies in rapidly evolving industries, such as the risks and uncertainties described herein.
In addition, while our ongoing operations are impacted by the COVID-19 pandemic and its related restrictions, the onset of the COVID-19 pandemic has greatly accelerated existing trends of shoppers moving online and merchants prioritizing digital channels and D2C, due in part to the shutdown of bricks-and-mortar stores, social distancing measures and travel restrictions which have diverted spending previously conducted in physical stores to the online space. Consumers diverting spending to online stores and e-commerce platforms, as well as merchants recognizing the importance of either transitioning to e-commerce or supplementing their existing efforts with an e-commerce offering, has created a substantial growth opportunity for us to service this newfound demand and interest in both e-commerce generally and cross-border e-commerce specifically. Although to date, the COVID-19 pandemic has had a generally positive impact on our growth and business, there is an uncertainty regarding future developments and whether the increased e-commerce adoption resulting from the COVID-19 pandemic will continue as brick-and-mortar stores re-open and restrictions are lifted. It is possible that the growth in GMV and revenues in recent periods may not be indicative of future results.
Accordingly, we may be unable to prepare accurate internal financial forecasts or replace anticipated revenue that we do not receive as a result of these factors. If we do not address these risks successfully, our results of operations could differ materially from our estimates and forecasts or the expectations of investors, causing our business to suffer and our ordinary share price to decline.
Failure to effectively expand our marketing and sales capabilities could harm our ability to increase our merchant base and achieve broader market acceptance of our platform.
Our ability to increase our merchant base and achieve broader market acceptance of our platform will depend on our ability to expand our marketing and sales operations. We plan to continue expanding our sales force and our reliance on strategic partners. We also plan to dedicate significant resources to sales and marketing programs, including search engine and online advertising. Our business and operating results will be harmed if our sales and marketing efforts do not generate a corresponding increase in GMV and revenue. We may not achieve anticipated GMV and revenue growth from expanding our sales force if we are unable to hire, develop, and retain talented sales personnel, if our new sales personnel are unable to achieve desired productivity levels in a reasonable period of time, or if our sales and marketing programs are not effective. Furthermore, if the cost of marketing our platform increases, our business and operating results could be adversely affected.
Lengthy sales cycles with enterprise merchants make it difficult to predict our future revenue and cause variability in our operating results.
Our sales cycle can vary substantially from merchant to merchant, but with enterprise merchants it typically requires 12 to 16 weeks on average. Our ability to accurately forecast revenue is affected by our ability to forecast new merchant acquisition. Lengthy sales cycles make it difficult to predict the quarter in which revenue from a new merchant may first be recognized. If we overestimate new merchant growth, our revenue will not grow as quickly as our estimates, our costs and expenses may continue to exceed our revenue and our ability to become profitable will be harmed. In addition, we plan our operating expenses, including sales and marketing expenses, and our hiring needs in part on our forecasts of new merchant growth and future revenue. If new merchant growth or revenue for a particular period is lower than expected, we may not be able to proportionately reduce our operating expenses for that period, which could harm our operating results for that period. Delays in our sales cycles could cause significant variability in our revenue and operating results for any particular period.
Our long-term success depends on our ability to operate internationally, making us susceptible to risks associated with cross-border sales and operations.
We currently support cross-border transactions of merchants in multiple countries of origin to shoppers in over 200 destination markets and territories and settle transactions in more than 100 currencies. We aim to expand our operations to support more outbound countries, and reach new markets and geographies. Conducting international operations subjects us to risks and burdens which include:
| | • | | the need to localize our solutions, including product customizations and adaptation for local practices and regulatory requirements; |
| | • | | lack of familiarity and burdens of ongoing compliance with local laws, legal standards, regulatory requirements, tariffs, customs formalities and other barriers, including restrictions on advertising practices, regulations governing online services, restrictions on importation or shipping of specified or proscribed items, importation quotas, shopper protection laws, enforcement of intellectual property rights, laws dealing with shopper and data protection, privacy, encryption, denied parties and sanctions, and restrictions on pricing or discounts; |
| | • | | heightened exposure to fraud; |
| | • | | legal uncertainty in foreign countries with less developed legal systems; |
| | • | | unexpected changes in regulatory requirements, taxes, trade laws, tariffs, export quotas, custom duties or customs formalities, embargoes, exchange controls, government controls or other trade restrictions; |
| | • | | differing technology standards; |
| | • | | difficulties in managing and staffing international operations and differing employer/employee relationships; |
| | • | | fluctuations in exchange rates that may increase our foreign exchange exposure; |
| | • | | potentially adverse tax consequences, including the complexities of foreign tax laws (including with respect to value added taxes) and restrictions on the repatriation of earnings; |
| | • | | increased likelihood of potential or actual violations of domestic and international anti-money laundering laws and anticorruption laws, such as the U.S. Foreign Corrupt Practices Act and the U.K. Bribery Act; |
| | • | | uncertain political and economic climates in foreign markets; |
| | • | | managing and staffing operations over a broader geographic area with varying cultural norms and customs; |
| | • | | varying levels of internet, e-commerce and mobile technology adoption and infrastructure; |
| | • | | reduced or varied protection for intellectual property rights in some countries; |
| | • | | new and different sources of competition; |
| | • | | costs and liabilities related to compliance with the numerous and ever-growing landscape of international data privacy and cybersecurity regimes, many of which involve disparate standards and enforcement approaches; and |
| | • | | data privacy laws which may require that merchant and/or shopper data be processed and stored in a designated territory. |
These factors may require significant management attention and financial resources. Any negative impact from our international business efforts could adversely affect our business, results of operations and financial condition.
We rely on third-party services, such as shipping partners and payment providers, in our platforms and services.
We rely on third parties, such as our shipping partners, to deliver products from the merchants to the shoppers. Shortages of transportation vessels, transportation disruptions or other adverse conditions in the transportation industry due to shortages of pilots and truck drivers, strikes, slowdowns, piracy, terrorism, disruptions in rail service, closures of shipping routes, unavailability of ports and port service for other reasons, increases in fuel prices and adverse weather conditions, or other adverse changes related to such third-party services, including as a result of the COVID-19 pandemic or the measures attempting to contain and mitigate the effects thereof, could increase our costs and disrupt our operations and our ability to deliver products from the merchants to our shoppers on the timing they expect or at all. The failure of our shipping partners to provide quality customer service when delivering products to shoppers would adversely affect the merchants and our relationship with the merchants which in turn could negatively impact our business and operating results. Furthermore, we rely on third parties to process payments and we cannot guarantee that such providers will perform adequately. Errors made by, or delays in service from, such third-party providers could adversely affect our ability to process payments and process purchases by shoppers on our platform in a timely manner or at all, which could adversely affect our business, operating results and financial condition.
Our success will depend on our ability to build and maintain relationships with these and other third-party service providers on commercially reasonable terms. If we are unable to build and maintain such relationships on commercially reasonable terms, we may have to suspend or cease operations. Even if we are able to build and maintain such relationships, if these third parties are unable to deliver their services on a timely basis, shoppers could become dissatisfied and decline to make future purchases from the merchants, which would adversely affect our revenue. If the merchants become dissatisfied with the services provided by these third parties, our reputation and our business could suffer.
Operating as merchant of record for sales conducted using our platform imposes certain obligations and subjects us to certain risks applicable to actors that place products in the market such as product liability, shipping compliance, and waste and packaging compliance.
Our business model and activities are predicated upon our operating as the merchant of record (“MoR”) of the products sold through our platforms. As a result of us being identified as a seller rather than the merchants, we could bear responsibility for the products and may be liable for product liability claims brought by our shoppers or other third parties, and we may be subject to various regulatory compliance requirements, such as waste and packaging compliance. Although we have policies in place crafted to ensure compliance and reduce risk of such liabilities, for example by avoiding the sale of products that we determine to be “high risk,” and although our commercial arrangements with the merchants typically require the merchants to cover such liabilities, it is possible that we may be subject to product liability or other compliance regulations or litigation and may incur various related costs which may or may not be fully covered by our contractual arrangements or insurance coverage. Furthermore, any actual or alleged non-compliance on our part in a specific geography may not be treated by local authorities as an isolated event. Heightened scrutiny by local authorities in a specific geography could impede our local activities irrespective of the product vertical or merchant from which the products originated.
As MoR, we could be adversely affected if the packages provided by the merchants do not contain the correct articles ordered by the shopper, or if articles and the packages provided by the merchants are not shipped in compliance with applicable rules or do not contain all requisite documentation for cross-border shipping. Failure to ensure such compliance may result in shipping delays or diminished shopper satisfaction, result in confiscation or destruction of articles and payment of additional costs, fines or assessments from our fulfillment partners and other third parties, which in turn may adversely affect our results of operations.
While merchandise is in our possession, we bear the risk of loss. While the majority of merchants are responsible for transporting the goods to our facilities, certain of our merchant agreements require us to take possession of products for an extended period of time. To the extent that products are damaged, lost or stolen during the period in which we bear the risk of loss, our business may be adversely affected.
Our provision of shipping services is dependent on third-party providers of cross-docking services for which we have limited redundancy. To the extent that we may be unable to secure comparable services in the countries in which we operate, the ongoing operation of our business may be adversely affected.
In the countries in which we operate, we rely on third-party providers of “cross-docking services” to collect, sort and prepare for cross-border shipping the products sold by merchants through our platform. We generally employ a single provider of cross-docking services in each of our outbound markets due to a paucity of providers and minimum volume requirements imposed by such providers. Our ability to ship products in a timely manner is dependent on our ability to secure cross-docking services and in the event that we cannot secure them in specific geographies, or are unable to secure them at competitive prices or with adequate service reliability and availability, our operations may be adversely affected. Moreover, if a cross-docking service provider fails to provide the service, our operations will be adversely affected until such time that we are able to shift to an alternative provider.
Payment transactions through our e-commerce platforms subject us to regulatory requirements, additional fees, and other risks that could be costly and difficult to comply with or that could harm our business.
Our business depends on our ability to process a wide range of payment methods, including credit and debit cards, as well as other alternative payment methods and this ability is facilitated by the payment card and alternative payment networks. We do not directly acquire the payment card networks that enable our acceptance of payment cards and alternative payment methods. As a result, we must rely on banks, acquiring processors and other third-party payment processors to process transactions on our behalf. These third parties perform the card processing, currency exchange, identity verification and fraud analysis services. These third parties may fail or refuse to process transactions adequately, may breach their agreements with us, or may refuse to renegotiate or renew these agreements on terms that are favorable or commercially reasonable. They might also take actions that degrade the functionality of our services, impose additional costs or requirements on us, or give preferential treatment to competitive competing services, including their own services. If we are unsuccessful in establishing, renegotiating or maintaining mutually beneficial relationships with these payment card networks, banks and acquiring processors, our business may be harmed.
We are required by our third-party payment processors to comply with payment card network operating rules, including the Payment Card Industry Data Security Standard (“PCI DSS”), and we have agreed to reimburse our payment processors for any fees or fines that they are assessed by payment card networks as a result of any rule violations by us or our merchants. The payment card schemes have discretion to determine, change and interpret the card rules, and our third-party payment processors are required to assess our compliance with the card scheme rules, and may make assessments or determinations that are unfavorable to our business model. In past assessments of us operating as MoR, we demonstrated our compliance with MoR operating rules and demonstrated that we should not be subject to compliance with other operating rules (e.g. such as those applicable to “payment facilitators”). There is no assurance that the third-party payment processors or their payment card networks will not re-evaluate that conclusion, or make a different determination in the future. If such third-party payment processors or their payment card networks were to determine that we must comply with other operating rules, we may be subject to additional regulations, might incur higher compliance costs, and may be required to modify certain aspects of our platform and service offering in order to maintain compliance, which may have an adverse impact on our business.
If we fail to comply with the payment card network rules, we would be in breach of our contractual obligations to our third-party payment processors, financial institutions, partners and merchants. Such failure to comply may subject us to fines, penalties, damages, higher transaction fees and civil liability, and could eventually prevent us from processing or accepting payment methods or could lead to a loss of a third-party payment processor. Further, there is no guarantee that, even if we are in compliance with such rules or requirements, such compliance will prevent illegal or improper use of our payment systems or the theft, loss, or misuse of data pertaining to credit and debit cards, credit and debit card holders, and credit and debit card transactions.
In addition, we face the risk that one or more payment card networks or other third-party payment processors may, at any time, assess penalties against us or our merchants, or terminate our ability to accept credit card payments or other forms of online payments from shoppers, which would have an adverse effect on our business, financial condition and operating results.
We are subject to governmental export controls that may subject us to liability if we are not in full compliance with applicable economic sanctions and export control laws.
Our activities are subject to certain economic sanctions and export control laws and regulations that prohibit or restrict transactions or dealings with certain countries, regions, governments and persons targeted by U.S., Israel, E.U. or other applicable jurisdictions’ embargoes or sanctions. As a result, we bear the responsibility for ensuring that transactions processed through our platform are conducted in compliance with such laws and regulations. U.S., Israel and E.U. sanctions may change from time to time, and the countries, regions, governments and persons that are sanctioned by each jurisdiction may be different. Ensuring compliance with applicable export control laws and regulations requires ongoing efforts and resources. Identifying commerce with, or sales made to, sanctioned countries or denied parties and obtaining export licenses or other authorizations for a particular product sale may be time-consuming and may result in the delay or loss of sales opportunities even if the export license ultimately may be granted. We generally apply precautions to prevent sales to sanctioned countries and denied parties, such as screening against listed denied parties and blocking sales at the point of checkout; however, we cannot guarantee that the precautions we take will prevent all violations of applicable export control and sanctions laws. We are aware that certain sales of immaterial value and volume made by certain of our non-Israeli merchants through our platform, operated by one or more of our non-Israeli subsidiaries, to a specific country (not sanctioned under U.S. or E.U. laws), as to which country we apply the foregoing precautions, are not in compliance with certain Israeli export laws. Violations of U.S., Israeli or E.U. sanctions or export control laws may result in penalties and significant fines and possible incarceration of responsible employees and managers could be imposed for criminal violations of these laws.
If our carriers and brokers fail to file or obtain appropriate import, export or re-export declarations, licenses or permits, we may also be adversely affected, through reputational harm as well as other negative consequences, including government investigations and penalties. We presently incorporate export control compliance requirements into our strategic partner agreements; however, no assurance can be given that our partners will comply with such requirements.
The recent outbreak of war in Ukraine has prompted the U.S. and other governments to impose new Trade Controls on Russia, among other countries. Additional Trade Controls by the U.S. and other governments enacted due to geopolitics or otherwise, and any counter-sanctions enacted in response, could restrict our ability to operate, generate or collect revenue in certain other countries, which could adversely affect our business.
We are subject to the import regulations and restrictions of each country to which we ship merchandise and non-compliance with such regulations may subject us to liability and may impede our ability to provide services in specific geographies in the future.
Import and export regulations and restrictions vary by country, product and quantity and require costly resources in order to ensure compliance. While we take precautions in order to avoid non-compliance with these restrictions, including focusing on products that carry lower inherent risk of being subject to import/export restrictions and avoiding highly regulated industries, some of the products offered using our platform may be subject to such restrictions. For example, the United States Food and Drug Administration regulates the import of sunglasses as medical devices, and the Australian Department of Agriculture regulates the import of timber, wood articles or bamboo related products. Non-compliance with the local import rules and restrictions applicable to such products may cause our products to be detained, confiscated, or destroyed at the port of entry.
In addition, because we operate as MoR, in the event that we are flagged by a specific country due to non-compliance with import restrictions applicable to a specific product or vertical our ability to continue to import such product in the future may be impeded, regardless of the identity of the merchant from which the product originates. If our service offerings are curtailed to exclude the import of whole verticals to specific countries, or if we are barred from importing products of any vertical to specific countries, our GMV attributable to such destination markets may decrease, our reputation will be harmed, and our platform will become less attractive to our current and future merchants.
Our business relies on the personal importation model and its applicability to the products provided to shoppers. Any modification of the rules, requirements or applicability of this model may adversely affect our business.
The products provided by the merchants to shoppers are shipped to and imported by the shopper for personal rather than commercial use. Each country determines its own rules and criteria for an import to qualify as importation for personal use, and determines which, if any, licenses, certifications, registrations, fees, quantity limitations and obligations apply to such an import. In the event that certain countries modify their personal importation rules, or impose additional compliance requirements or limitations related to this form of import, it could have an adverse effect on the cross-border e-commerce market as a whole, and may reduce the demand for cross-border e-commerce purchases. This in turn would reduce the demand for our platform and services and have an adverse effect on our business and result of operations.
We store personal information of merchants and shoppers. To the extent our security measures are compromised, our platform may be perceived as not being secure. This may result in merchants curtailing or ceasing their use of our platform, our reputation being harmed, our incurring of significant regulatory and monetary liabilities, and adverse effects on our results of operations and growth prospects.
Our operations involve the storage and transmission of data, including personal information and other confidential information of our third-party providers, merchants and shoppers. Third-party applications that we rely on for provision of certain services, such as acquiring processors, may also store personal information, credit card information, and other confidential information. We have experienced and expect to continue to experience actual and attempted cyber-attacks of our IT networks, such as through phishing scams and ransomware. Although none of these actual or attempted cyber-attacks has had a material adverse impact on our operations or financial condition, we cannot guarantee that such incidents will not have such an impact in the future. Cyberattacks and other malicious internet-based activity continue to increase, and cloud-based platform providers of services are expected to continue to be targeted. Threats include traditional computer “hackers,” malicious code (such as viruses and worms), employee theft or misuse and denial-of-service attacks. Sophisticated nation-states and nation-state supported actors now engage in such attacks, including advanced persistent threat intrusions. Although we do not store payment card information, hackers and adverse third parties may mistake us for the merchants, causing them to target us in order to obtain payment card information. Despite significant efforts to create security barriers to such threats, it is virtually impossible for us to entirely mitigate these risks. If our security measures are compromised as a result of third-party action, employee or merchant error, malfeasance, stolen or fraudulently obtained log-in credentials, technical malfunction or otherwise, our reputation could be damaged, our business may be harmed, and we could incur significant liability (including, but not limited to, fines imposed by data privacy authorities). Moreover, many companies that provide cloud-based services have reported a significant increase in cyberattack activity since the beginning of the COVID-19 pandemic.
Because the techniques used to obtain unauthorized access or sabotage systems change frequently and generally are not identified until they are launched against a target, we may be unable to anticipate these techniques or to implement adequate preventative measures. Additionally, because we rely on third-party and public-cloud infrastructure, we are reliant in part on third-party security measures to protect against unauthorized access, cyberattacks, and the mishandling of shopper and merchant data. Even if such a data breach did not arise out of our action or inaction, or if it were to affect our competition rather than us, the resulting concern could negatively affect merchants, shoppers and our business. Concerns regarding data privacy and security may cause some of our merchants to stop using our platform and fail to renew their agreements with us. In addition, failures to meet merchants’ or shoppers’ expectations with respect to security and confidentiality of their data and information could damage our reputation and affect our ability to retain merchants, attract new merchants, and grow our business. Furthermore, failure to comply with legal or contractual requirements around the security of personal information could lead to significant fines and penalties, as well as claims by merchants and shoppers. These proceedings or violations could force us to spend money in defense or settlement of these proceedings, result in the imposition of monetary liability or injunctive relief, divert management’s time and attention, increase our costs of doing business, and materially adversely affect our reputation and the demand for our platform.
A cybersecurity event could have significant costs, including regulatory enforcement actions, litigation, litigation indemnity obligations, remediation costs, network downtime, increases in insurance premiums, and reputational damage.
Interruptions or delays in the services provided by third-party data centers or internet service providers could impair our platform and our business could suffer.
We rely on the internet and, accordingly, depend upon the continuous, reliable, and secure operation of internet servers, related hardware and software, and network infrastructure. Any damage to, failure or delay of our systems would prevent us from operating our business.
We host our platform using third-party data centers and providers of cloud infrastructure services. We currently use one third-party provider for these data and cloud services. Our operations depend on protecting the virtual cloud infrastructure hosted by this cloud services provider by maintaining its configuration, architecture, and interconnection specifications, as well as the information stored in these virtual data centers and transmitted by third-party internet service providers. Furthermore, we have no physical access to or control over the services provided by our cloud services provider. Although we have disaster recovery plans that utilize multiple locations, the data centers that we use are vulnerable to damage or interruption from human error, intentional bad acts, earthquakes, floods, fires, severe storms, war, terrorist attacks, power losses, hardware failures, systems failures, telecommunications failures, and similar events, many of which are beyond our control, any of which could disrupt our service, destroy our data, or prevent us from being able to continuously back up or record changes in our platform. In the event of significant physical damage to one of these data centers, it may take a significant period of time to achieve full resumption of our services, we may incur data loss during the service resumption process and our disaster recovery planning may not account for all eventualities. Further, a prolonged service disruption to our cloud services provider, affecting our platform for any of the foregoing reasons could damage our reputation with current and potential organizations, expose us to liability, cause us to lose merchants and shoppers, or otherwise harm our business. We may also incur significant costs for using alternative equipment or taking other actions in preparation for, or in reaction to, events that damage the systems we use. Damage or interruptions to these data centers could harm our business. Moreover, negative publicity arising from these types of disruptions could damage our reputation and may adversely impact use of our solutions and platform. We may not carry sufficient business interruption insurance to compensate us for losses that may occur as a result of any events that cause interruptions in our service. Further, the contractual commitments that we provide to merchants on our platform as well as our third-party providers with regard to data privacy and security are limited by the commitments that our third-party cloud infrastructure services provider has provided us and these measures may not fully address the risks associated with the third-party processing, storage and transmission of such information. Any violation of data or security laws by our third party providers could adversely impact our business.
Our cloud services provider enables us to order and reserve server capacity in varying amounts and sizes distributed across multiple regions. In addition, our cloud services provider provides us with computing and storage capacity pursuant to terms of service that continue until terminated by either party. If we do not accurately predict our infrastructure capacity requirements, merchants could experience service shortfalls which could interrupt the performance of our platform, which could adversely affect the perception of its reliability and our revenue and harm the sales and business of our merchants. We may also be unable to effectively address capacity constraints, upgrade our systems as needed and continually develop our technology and network architecture to accommodate actual and anticipated changes in technology.
Our platform is utilized by a large number of merchants, and as we continue to expand the number of merchants and shoppers, we may not be able to scale our technology to accommodate the increased capacity requirements, which may result in interruptions or delays in service. Merchants often draw significant numbers of shoppers over short periods of time (typically during events such as new product releases, holiday shopping season and flash sales). In the event that merchants conduct a high volume of sales in a short period of time, we may not be capable of securing the then-necessary capacity for such traffic which may cause a degradation in the quality of our platform and services. Furthermore, if we are incapable of anticipating high traffic levels and reserving server capacity accordingly, our platform and services may be adversely affected. In addition, the failure of our cloud services provider’s data centers or third-party internet service providers to meet our capacity requirements could impede our ability to scale our operations. In some cases, our cloud services provider may terminate the agreement for cause upon 30 days’ notice. Termination of the agreement may harm our ability to access data centers we need to host our platform or to do so on terms as favorable as those we currently have in place. We currently rely exclusively on one cloud services provider for our cloud infrastructure and therefore a transition to an alternative provider may take time, cause us to incur additional costs and reduce the quality and functionality of our platform.
Increases in shipping rates could negatively impact our revenues generated through shipping services.
Shipping rates and surcharges are volatile and subject to market fluctuations. A portion of our revenues is generated through shipping services provided through our shipping and logistics partners. Therefore, a substantial increase in shipping rates may reduce our margins from shipping services. Although some of such cost would be borne by merchants and shoppers, significant increases of costs may diminish demand for cross-border e-commerce, reduce the attractiveness of our service among merchants and adversely affect our results of operations. In particular, DHL, (which holds more than 5% of our outstanding ordinary shares) provided shipping services with respect to 58% of the parcels processed on our platform for the year ended December 31, 2021. The terms of our arrangements with DHL may be less favorable than the terms we could have received if entering into similar arrangements with third parties that are not related parties.
Fluctuations in the exchange rate of foreign currencies could adversely impact our results of operations.
A majority of our purchase and sale transactions are carried out in different currencies and we bear the risk of diminution in value of the shopper’s purchasing currency in the interim periods between the transaction stages (e.g. placement/payment and returns/refund). Despite the natural hedge provided by our bi-directional volume of sales and broad international activity, we may incur additional costs and experience losses resulting from fluctuations in exchange rates.
We currently have revenues denominated in foreign currencies, including Pounds Sterling, Euros, and US Dollars and may in the future have significant sales denominated in the currencies of additional countries. We incur a substantial portion of our operating expenses in New Israeli Shekels, Pounds Sterling and US Dollars, and to a lesser extent, other foreign currencies. We may incur additional costs and experience losses resulting from fluctuations in exchange rates for revenues in foreign currencies or upon translation of New Israeli Shekels expenses incurred in Israel, or Pounds Sterling expenses incurred in the United Kingdom, to US Dollars which may negatively impact our operating results.
If we fail to offer high quality support, our business and reputation could suffer.
Merchants rely on our personnel for support related to our platform and services. High-quality support is important for maintaining, renewing and expanding our agreements with existing merchants and maintaining our reputation among merchants. As we expand our business and pursue engagements with new merchants, the importance of high-quality support will increase, and we expect to incur additional support related costs in order to meet the requirements of our new and future merchants. If we do not help merchants and shoppers quickly to resolve issues and provide effective ongoing support, our ability to retain existing merchants and attract new merchants could suffer and our reputation could be harmed.
If we fail to enhance our reputation and awareness of our platform, our ability to expand the number of merchants using our platform and increase our GMV will be impaired, our reputation may be harmed, and our business, results of operations, and financial condition may suffer.
We believe that developing and maintaining awareness and a favorable reputation is critical to achieving widespread acceptance of our platform and services and is an important element in attracting new merchants to our platform, and retaining existing merchants. Furthermore, we believe that the importance of brand recognition will increase as competition in our market increases. Our ability to increase awareness will depend largely on the effectiveness of our marketing efforts, our ability to ensure that our platform and services remain of high quality, reliable, and useful at competitive prices, our ability to maintain our merchants’ trust, our ability to continue to develop new functionality and solutions, and our ability to successfully differentiate our platform.
Efforts to increase awareness may not yield increased revenue, and even if they do, any increased revenue may not offset the expenses we incur. If we fail to successfully promote our platform, or incur substantial expenses in an unsuccessful attempt to promote our platform, we may fail to attract new merchants or grow or maintain the volume of sales facilitated by our platform to the extent necessary to realize a sufficient return on our marketing efforts, and our business, results of operations, and financial condition could suffer.
Our reputation may be harmed by our merchants’ or third-party service providers’ unethical business practices.
Our emphasis on our values makes our reputation particularly sensitive to allegations of unethical business practices by our merchants or third-party service providers. Our policies promote legal and ethical business practices. However, we do not control our merchants or third-party service providers or their business practices and cannot ensure that they comply with our policies. If our merchants or third-party service providers engage in illegal or unethical business practices or are perceived to do so, we may receive negative publicity and our reputation may be harmed.
Mobile devices are increasingly being used to conduct e-commerce transactions, and if our platform and services do not operate as effectively when the merchants’ sites and checkout pages are accessed through these devices, the merchants’ experience will be negatively impacted, reducing merchant satisfaction with our platform and services.
E-commerce transacted over mobile devices (including tablets and other hand-held devices) continues to grow more rapidly than desktop transactions. We are dependent on the interoperability of our platforms with third-party mobile devices, merchants’ mobile applications and mobile operating systems as well as web browsers. Changes in such devices, systems, applications or web browsers that degrade the functionality of our platform could adversely affect adoption and usage of our platform and services. For example, we provide our merchants with development libraries which allow for easy implementation of our platform as well as bug and error fixes. Our merchants’ ability to timely utilize such libraries in order to fix bugs and errors is contingent on application stores (such as Google Play and Apple App Store) approving our software development kit and libraries. If such approval is not obtained in a timely manner, merchant may be delayed in fixing bugs and errors relating to the use of our platform and may forgo the use of our solutions until an applicable error or bug fix is available. Mobile e-commerce and effective mobile functionality are integral both to our merchants and to our long-term growth strategy. If the functionality of our platforms is inhibited when access to our merchants’ stores is done through mobile devices, our business and operating results could be adversely affected.
We are dependent upon the continued use of the internet for commerce.
Our success depends upon the general public’s continued willingness to use the internet as a means to pay for purchases, communicate, access social media, research and conduct commercial transactions, including through mobile devices. Federal, state, or foreign government bodies or agencies have in the past adopted, and may in the future adopt, laws or regulations affecting the use of the internet as a commercial medium. The adoption of any laws or regulations that could reduce the growth, popularity, or use of the internet, including laws or practices limiting internet neutrality, could decrease the demand for, or the usage of, our platform and services, increase our cost of doing business and harm our results of operations. Changes in these laws or regulations could require us to modify our platform, or certain aspects of it, in order to comply with these changes. In addition, government agencies or private organizations have imposed and may impose additional taxes, fees, or other charges for accessing the internet or commerce conducted via the internet. These laws or charges could limit the growth of internet-related commerce or communications generally, or result in reductions in the demand for internet-based platforms such as ours. In addition, the use of the internet could be harmed due to delays in the development or adoption of new standards and protocols to handle increased demands of internet activity, security, reliability, cost, ease-of-use, accessibility, and quality of service. Further, demand for our platform depends on the quality of shoppers’ access to the internet. Certain features of our platform may require significant bandwidth and fidelity to work effectively. Internet access is frequently provided by companies that have significant market power that could take actions that degrade, disrupt or increase the cost of access to our platform, which would negatively impact our business. The performance of the internet and its acceptance as a commerce tool has been harmed by “viruses,” “worms” and similar malicious programs and the internet has experienced a variety of outages and other delays as a result of damage to portions of its infrastructure. If the use of the internet is adversely affected by these issues, demand for platform and services could decline. Additionally, if merchants or shoppers become unwilling or less willing to use the internet for commerce for any other reason, including lack of access to high-speed communications equipment, congestion of traffic on the internet, internet outages or delays, disruptions or other damage to merchants’ and shoppers computers, increases in the cost of accessing the internet and security and privacy risks or the perception of such risks, our business could be adversely affected.
Finally, our success depends upon merchants continuing to pursue D2C sales as they seek to take advantage of e-commerce trends and gain ownership and knowledge of their international customers. If merchants cease to pursue D2C sales for any reason, including if such merchants prefer to sell their products on e-commerce marketplaces, our business could be adversely affected.
We are subject to stringent and changing laws, regulations, standards, and contractual obligations related to privacy, data protection, and data security. Our actual or perceived failure to comply with such obligations could harm our business.
We receive, collect, store, process, share, transfer, disclose, and use personal information and other data relating to shoppers, employees, contractors and other persons. We are subject to numerous federal, state, local, and international laws, directives, and regulations regarding privacy, data protection, and data security and the collection, storing, sharing, use, processing, transfer, disclosure, and protection of personal information, the scope of which are changing, subject to differing interpretations, and may be inconsistent among jurisdictions or conflict with other legal and regulatory requirements. We are also subject to certain contractual obligations to third parties related to privacy, data protection and data security. We strive to comply with our policies and applicable laws, regulations, contractual obligations, and other legal obligations relating to privacy, data protection, and data security to the extent possible. However, the regulatory framework for privacy, data protection and data security worldwide is, and is likely to remain for the foreseeable future, uncertain and complex, and it is possible that these or other actual or alleged obligations may be interpreted and applied in a manner that we do not anticipate or that is inconsistent from one jurisdiction to another, including across the various jurisdictions in which we operate remotely and may conflict with our other legal obligations or our practices. Further, any significant change to applicable laws, regulations or industry practices regarding the collection, use, processing, storage, sharing, transferring, security or disclosure of data, or their interpretation, or any changes regarding the manner in which the consent of shoppers or other data subjects for the collection, use, processing, storage, sharing, transferring, or disclosure of such data must be obtained, could increase our costs and require us to modify our services and features, possibly in a material manner, which we may be unable to complete, and may limit our ability to collect, use, process, store, share, transfer, or disclose shopper data or develop new services and features.
If we were found in violation of any applicable laws or regulations relating to privacy, data protection, or security, in any jurisdiction, including in jurisdictions where we operate remotely (such as by selling to shoppers residing in such jurisdictions), our business may be materially and adversely affected and we would be liable for any damages and regulatory fines and would likely have to change our business practices and potentially the services and features available through our platform. In addition, these laws and regulations could impose significant costs on us and could constrain our ability to use and process data in manners that may be commercially desirable. In addition, if a breach of data security were to occur or to be alleged to have occurred, if any violation of laws and regulations relating to privacy, data protection or data security were to be alleged, or if we had any actual or alleged defect in our safeguards or practices relating to privacy, data protection, or data security, our platform and services may be perceived as less desirable and our business, prospects, financial condition, and results of operations could be materially and adversely affected.
We also expect that there will continue to be new laws, regulations, and industry standards concerning privacy, data protection, and information security proposed and enacted in various jurisdictions. For example, in the European Economic Area (EEA) we are subject to the General Data Protection Regulation, or GDPR, which came into effect in May 2018 and imposes stringent operational requirements regarding, among others, data use, sharing and processing, data breach notifications, data subject rights, documentation, and cross-border data transfers for EEA entities as well as non-EEA entities that offer goods or services to, or monitor, individuals in the EEA. Failure to comply with the GDPR could result in penalties for noncompliance (including possible fines of up to the greater of €20 million and 4% of our global annual turnover for the preceding financial year for the most serious violations, as well as the right to compensation for financial or non-financial damages claimed by individuals under Article 82 of the GDPR).
In addition to the GDPR, we are subject to the United Kingdom’s privacy regime that imposes obligations and penalties similar to the GDPR including fines up to the greater of £17.5 million or 4% of global turnover. EEA and UK privacy laws are constantly developing, including through case law and regulatory guidance, which increases our compliance costs and regulatory exposure.
We are also subject to evolving EEA and UK privacy laws on cookies, tracking technologies and e-marketing. In the EEA and the UK under national laws derived from the Directive 2002/58 on Privacy and Electronic Communications (the “ePrivacy Directive”), informed and freely given consent is required for the placement of cookies and similar technologies on shoppers’ devices and imposes restrictions on electronic marketing. The GDPR and UK regime also impose conditions on obtaining valid consent for cookies, such as a prohibition on pre-checked consents and a requirement to ensure separate consents are sought for each type of cookie or similar technology. If and when it comes into effect, proposed legislation known as the Regulation of Privacy and Electronic Communications (“ePrivacy Regulation”), would replace the current ePrivacy Directive, and significantly increase fines for non-compliance. Recent European court and regulatory decisions are driving increased attention to cookies and tracking technologies, which could lead to substantial costs, require significant systems changes, limit the effectiveness of our marketing activities, divert the attention of our technology personnel, adversely affect our margins, increase costs and subject us to additional liabilities.
In addition, we are also subject to other data privacy and data protection laws in such jurisdictions that imposes similar requirements to GDPR on the collection and processing of data of local residents, such as Lei Geral de Proteção de Dados, or LGPD, which went into effect in Brazil in August 2020, the Personal Information Protection Law or PIPL which went into effect in November 2021 in China. Similar to the GDPR and CCPA, the PIPL imposes a variety of controls on entities and individuals that decide the purpose, methods and other relevant matters of personal information processing. The PIPL governs personal information processing activities carried out by entities or individuals within China, together with two other key laws on cybersecurity and data protection. As the rules regarding its implementation are still in the process of being drafted, complying with the PIPL may cause us to incur substantial operational costs and may require us to change our business practices.
Additionally, we are also subject to the California Consumer Privacy Act (“CCPA”), which came into effect on January 1, 2020 and, imposes heightened transparency obligations, adds restrictions on the “sale” of personal information (which it defines broadly), and creates new data privacy rights for California residents and carries significant enforcement penalties for non-compliance. The California Attorney General enforces the CCPA and can seek an injunction and civil penalties up to $7,500 per intentional violation and $2,500 per other violation. The CCPA also provides California consumers a private right of action for certain data breaches where they can recover up to $750 per incident, per consumer or actual damages, whichever is greater, and which is expected to increase data breach litigation. The CCPA may require us to modify our data practices and policies and to incur substantial costs and expenses in order to comply. In addition, on November 3, 2020, California voters passed the California Privacy Rights Act (“CPRA”) into law, which will take effect on January 1, 2023 with enforcement beginning on July 1, 2023. The CPRA also creates obligations with respect to certain data relating to consumers as of January 1, 2022. The CPRA will significantly modify the CCPA by introducing additional obligations such as data minimization and storage limitations, granting additional rights to consumers, such as correction of personal information and additional opt-out rights, and create a new state agency that will be vested with authority to implement and enforce the CCPA and the CPRA, potentially resulting in further uncertainty and requiring us to incur additional costs and expenses in an effort to comply. More generally, some observers have noted the CCPA and CPRA could mark the beginning of a trend toward more stringent privacy legislation in the U.S., including similar laws in other U.S. states and a potential federal privacy law, all of which could increase our potential liability and adversely affect our business.
In addition, we are also subject to the Israeli Privacy Protection Law 5741-1981 (the “PPL”), and its regulations, including the Israeli Privacy Protection Regulations (Data Security) 2017 (“Data Security Regulations”), which came into effect in Israel in May 2018 and impose obligations with respect to the manner personal data is processed, maintained, transferred, disclosed, accessed and secured, as well as the guidelines of the Israeli Privacy Protection Authority. In this respect, the Data Security Regulations may require us to adjust our data protection and data security practices, information security measures, certain organizational procedures, applicable positions (such as an information security manager) and other technical and organizational security measures. Failure to comply with the PPL, its regulations and guidelines issued by the Privacy Protection Authority, may expose us to administrative fines, civil claims (including class actions) and in certain cases criminal liability. Current pending legislation may result in a change of the current enforcement measures and sanctions. The Israeli Privacy Protection Authority may initiate administrative inspection proceedings, from time to time, without any suspicion of any particular breach of the PPL, as the Authority has done in the past with respect to dozens of Israeli companies in various business sectors. In addition, to the extent that any administrative supervision procedure is initiated by the Israeli Privacy Protection Authority that reveals certain irregularities with respect to our compliance with the PPL, in addition to our exposure to administrative fines, civil claims (including class actions) and in certain cases criminal liability, we may also need to take certain remedial actions to rectify such irregularities, which may increase our costs.
Additionally, some countries such as Australia, Singapore, Hong Kong, South Korea and Japan are considering or have enacted privacy legislation, and some countries are also considering data localization legislation, which could increase the cost and complexity of delivering our services.
Data privacy legislation restricts the cross-border transfer of personal data and some countries introduced data localization into their laws. Specifically, the GDPR and other European and UK data protection laws generally prohibit the transfer of personal data from the EEA, UK and Switzerland, to the United States and most other countries unless the transfer is to an entity established in a country deemed to provide adequate protection (such as Israel) or the parties to the transfer have implemented specific safeguards to protect the transferred personal data. Where we transfer personal data outside the EEA to a country that is not deemed to be “adequate”, we take steps to comply with applicable laws, such as through implementing the European Commission’s standard contractual clauses ("SCCs"), that have been updated on June 4 2021, and require a complete shift to the new SCCs by December 27, 2022. The European Data Protection Board ("EDPB") released a comment on the supplementary measures that companies may use to ensure an 'EU level' of data protection – such as conducting impact assessment for data transfers, and assess the use of SCCs on a case-by-case basis, taking into account the legal regime applicable in the destination country, and in particular applicable surveillance laws and rights of individuals as well as consider additional technical and organizational measures and/or contractual provisions that may be needed to be put in place. In some jurisdictions like the EU, UK and Israel, the law and guidance on data transfers is rapidly developing and recent developments will require us to review and may require us to amend or supplement the legal mechanisms by which we make and/or receive personal data transfers, which could affect the manner in which we provide our solutions, the geographical location or segregation of our relevant systems and operations, may reduce demand for our solutions from companies subject to these data protection laws and could adversely affect our financial results.
Any failure or perceived failure by us to comply with our posted privacy policies, our privacy-related obligations to merchants or other third parties, or any other legal obligations or regulatory requirements relating to privacy, data protection, or data security, may result in governmental investigations or enforcement actions, litigation, claims, or public statements against us by consumer advocacy groups or others and could result in significant liability, cause our merchants to lose trust in us, and otherwise materially and adversely affect our reputation and business. Furthermore, the costs of compliance with, and other burdens imposed by, the laws, regulations, other obligations, and policies that are applicable to the businesses of our merchants may limit the adoption and use of, and reduce the overall demand for, our platform. Additionally, if third parties we work with violate applicable laws, regulations or contractual obligations, such violations may put our data at risk, could result in governmental investigations or enforcement actions, fines, litigation, claims, or public statements against us by consumer advocacy groups or others and could result in significant liability, cause our merchants to lose trust in us, and otherwise materially and adversely affect our reputation and business. Further, public scrutiny of, or complaints about, technology companies or their data handling or data protection practices, even if unrelated to our business, industry or operations, may lead to increased scrutiny of technology companies, including us, and may cause government agencies to enact additional regulatory requirements, or to modify their enforcement or investigation activities, which may increase our costs and risks.
The belligerent situation in Ukraine could materially adversely affect our business, financial condition and results of operations.
In late February 2022, Russian military forces launched military action against Ukraine, and sustained conflict and disruption in the region is likely. The impact to Ukraine, as well as actions taken by other countries, including new and stricter sanctions by Canada, the United Kingdom, the European Union, the U.S. and other countries and organizations against officials, individuals, regions, and industries, and each potential response to such sanctions, tensions, and military actions, could lead to disruption, instability and volatility in global markets and industries that could have a material adverse effect on our operations. Due to said military action, our services into Ukraine and Russia were suspended until further notice. While our direct business exposure to Ukraine and Russia is immaterial (in a typical year less than 2% of our GMV is generated by Ukraine and Russia combined), there may nevertheless be additional implications of such military conflict on macro economics, consumer sentiment and buying patterns in other markets, including Eastern and Western Europe (in which we have experienced certain reductions in purchases since the commencement of the military conflict), which may have an adverse effect on our results.
In addition, some of our Research and Development team members are located in several cities in Ukraine. The conflict has impaired and may continue to impair their ability to work, thereby adversely affecting our research and development and merchant support capacities.
The COVID-19 pandemic could materially adversely affect our business, financial condition and results of operations.
The COVID-19 pandemic, the measures attempting to contain and mitigate the effects of the COVID-19 pandemic and its variants, including stay-at-home, business closure, social distancing, capsuled labor and other restrictive orders, and the resulting changes in consumer behaviors, have disrupted our normal operations and impacted our employees, suppliers, merchants and shoppers. We expect these disruptions and impacts to continue. In response to the COVID-19 pandemic, we have taken a number of actions that have impacted and continue to impact our business, including transitioning employees across all our offices (including our corporate headquarters) to remote work-from-home arrangements and imposing travel and related restrictions. While we believe these actions were reasonable and necessary as a result of the COVID-19 pandemic, they have been disruptive to our business and could adversely impact our results of operations. In addition, remote work, lockdowns and travel restrictions have added challenges and complexity to the operations of our shipping and logistics partners. As such, continued COVID-19 related restrictions that inhibit the ordinary course operation of our shipping and logistics partners may have an adverse effect on our business.
Given the continued spread of COVID-19 and the resultant personal, economic, and governmental reactions, we may have to take additional actions in the future that could harm our business, financial condition, and results of operations. While we have a distributed workforce and our employees are accustomed to working remotely or working with other remote employees, our workforce has not historically been fully remote. Prior to the COVID-19 pandemic, certain of our employees traveled frequently to establish and maintain relationships with one another and with our merchants, partners, and investors. We continue to monitor the situation and may adjust our current policies as more information and guidance become available. Suspending travel and long-term inability of doing business in-person could negatively impact our marketing efforts, our ability to enter into merchant contracts in a timely manner, our ability to integrate and launch the service for merchants in a timely manner, our international expansion efforts, our ability to recruit and train employees across the organization and our ability to visit and oversee the activity of our third-party service providers and local fulfillment hubs. These changes could negatively impact our operations, sales and marketing in particular, which could have longer-term effects on our sales pipeline, or create operational or other challenges as our workforce remains predominantly remote, any of which could harm our business. In addition, our management team has spent, and will likely continue to spend, significant time, attention, and resources monitoring the COVID-19 pandemic and associated global economic uncertainty and seeking to manage its effects on our business and workforce.
The degree to which COVID-19 will affect our business and results of operations will depend on future developments that are highly uncertain and cannot currently be predicted. These developments include, but are not limited to, the duration, extent, and severity of the COVID-19 pandemic in different geographies, actions taken to contain the COVID-19 pandemic, the impact of the COVID-19 pandemic and related restrictions on economic activity and domestic and international trade, and the extent of the impact of these and other factors on our employees, suppliers, partners, merchants and shoppers. The COVID-19 pandemic and related restrictions could limit merchants’ ability to continue to operate (limiting their abilities to obtain inventory, generate sales, ship and dispatch orders or make timely payments to us). It could disrupt or delay the ability of employees to work because they become sick or are required to care for those who become sick, or for dependents for whom external care is not available. In addition, the COVID-19 pandemic may also result in reduced consumer spending and adverse or uncertain economic conditions globally, which in turn may impact the GMV processed through our platform. See “—General Risks Affecting Our Business and Operations—Unfavorable conditions in our industry, the global economy, or e-commerce in general, could limit our ability to grow our business and negatively affect our results of operations.”
Legal, political, and economic outcomes and remaining uncertainty surrounding the exit of the United Kingdom from the EU may be a source of instability to international markets, create significant currency fluctuations, create logistic and other customs-related complexities, adversely affect our operations in the United Kingdom and pose additional risks to our business, financial condition, and results of operations.
In connection with the United Kingdom’s withdrawal from the EU (“Brexit”), the United Kingdom ceased to be an EU Member State and ratified a trade and cooperation agreement governing its future relationship with the EU. The agreement, which was signed on December 30, 2020 was applied provisionally as of January 1, 2021 and entered into force on May 1, 2021, addresses trade, economic arrangements, law enforcement, judicial cooperation and a governance framework including procedures for dispute resolution, among other things. Because this agreement merely sets forth a framework in many respects and will require complex additional bilateral negotiations between the United Kingdom and the EU, significant political and economic uncertainty remains about how the precise terms of the relationship between the parties will differ from the terms before withdrawal. The ongoing and remaining uncertainty related to Brexit has negatively impacted the United Kingdom’s economy, and will likely continue to have a negative impact until the United Kingdom and EU reach definitive resolutions on any outstanding trade and legal matters, and until any achieved definitive resolutions are fully implemented or practically adopted. These developments, or the perception that any related developments could occur, have had and may continue to have a material adverse effect on global economic conditions and financial markets, and could significantly reduce global market liquidity and restrict the ability of key market participants to operate in certain financial markets.
Although generally we managed to transition and remain up to date with the changes and required adjustments to our operations and compliancy, it remains difficult to predict the full and long term impact of Brexit on our business and e-commerce conducted between the United Kingdom and the EU, and it is likely that the price of goods that are sold cross-border between the United Kingdom and the EU may be subject to additional costs such as customs clearance costs and tariffs which may decrease the attractiveness of such purchases and reduce GMV and revenues relating to these markets. In addition, Brexit may lead to additional complexities and difficulties relating to shipment of products to shoppers, customs formalities and previously inapplicable procedures, resulting in shipping delays and reducing shopper satisfaction.
Additionally, we have faced, and we may face additional and new regulations in numerous fields, including data privacy, shopper rights, trade, aviation, tax, security, and employees, among others, in the United Kingdom which required us and may further require us to amend or adjust our platforms and service. Compliance with such regulations could be costly, negatively impacting our business, results of operations, and financial condition. Furthermore, rapid and additional change to or uncertainty regarding applicable customs clearance costs, tariffs and tax rates may make it difficult to calculate accurate landed costs and which may cause merchants and shopper dissatisfaction from our platform and services.
While Brexit could offer growth opportunities in the form of increased demand for cross-border e-commerce services such as ours by merchants with sales between the United Kingdom and the EU, we may find it difficult to meet such demand due to the aforementioned uncertainties, regulatory and operational difficulties and complexities associated with the transition.
We are subject to anti-corruption, anti-bribery, anti-money laundering and similar laws, and non-compliance with such laws can subject us to criminal penalties or significant fines and harm our business and reputation.
We are subject to anti-corruption and anti-bribery and similar laws, such as the U.S. Foreign Corrupt Practices Act of 1977, as amended, or the FCPA, the U.S. domestic bribery statute contained in 18 U.S.C. § 201, U.S. Travel Act, the USA PATRIOT Act, the U.K. Bribery Act 2010, the Proceeds of Crime Act 2002, Chapter 9 (sub-chapter 5) of the Israeli Penal Law, 57373-1977, the Israeli Prohibition on Money Laundering Law, 5760–2000 and other anti-corruption, anti-bribery and anti-money laundering laws in countries in which we conduct activities. Anti-corruption and anti-bribery laws have been enforced aggressively in recent years and are interpreted broadly and prohibit companies and their employees and agents from promising, authorizing, making, or offering improper payments or other benefits to government officials and others in the private sector. As we increase our international sales and business, our risks under these laws may increase.
In addition, we use, and may continue to use, third parties to sell access to our platform and conduct business on our behalf abroad, in particular carriers and other freight forwarders who perform customs-clearance and related services and functions as our service providers, and in our own name and instructions. We or such current and future third-party intermediaries may have direct or indirect interactions with officials and employees of government agencies or state-owned or affiliated entities, and we can be held liable for the corrupt or other illegal activities of such future third-party intermediaries, and our employees, representatives, contractors, partners, and agents, even if we do not explicitly authorize such activities. We have implemented an anti-corruption compliance program but cannot assure you that all our employees and agents, as well as those companies to which we outsource certain of our business operations, will not take actions in violation of our policies and applicable law, for which we may be ultimately held responsible. Noncompliance with these laws could subject us to investigations, sanctions, settlements, prosecution, other enforcement actions, disgorgement of profits, significant fines, damages, other civil and criminal penalties or injunctions, adverse media coverage, and other consequences. Any investigations, actions or sanctions could harm our business, results of operations, and financial condition.
We act as a service provider and part of the fulfilment chain of the merchants, and while our legal and functional roles are defined, third parties may confuse us with the merchants resulting in claims and liabilities relating to the merchants’ activities.
We operate largely as a “white label” solution which enables the merchants to offer their products through our platform, while maintaining their own brand experience. Due to our nearly transparent integration with such merchants’ shopper experience, claims arising from the actions of the merchants may be unduly addressed to us by virtue of our perceived affiliation with the merchants and our role in the shopper experience. To the extent that we are not successful in demonstrating that we are distinct from such merchants, we may be subject to misdirected claims and associated liabilities. Although we include indemnification provisions in the merchant agreements, such provisions may not be enforced in certain circumstances, certain jurisdictions or may not be sufficient to fully cover potential liabilities arising from such claims.
If we fail to adequately maintain, protect or enforce our intellectual property rights, our competitive position could be impaired and we may lose valuable assets, generate reduced revenue, and incur costly litigation to protect our rights.
Our success is dependent, in part, upon protecting our intellectual property rights, including those in our know-how and proprietary technology. We rely on a combination of copyrights, trade secret and other intellectual property laws and contractual restrictions to establish and protect our intellectual property rights. While it is our policy to protect and defend our rights to our intellectual property, we cannot predict whether steps taken by us will be adequate to prevent infringement, misappropriation or other violation of our intellectual property rights.
Policing unauthorized use of our know-how, technology and intellectual property is difficult and may not be effective. We will not be able to protect our intellectual property if we are unable to enforce our rights or if we do not detect unauthorized use of our intellectual property. Despite our precautions, it may be possible for unauthorized third parties to copy our platform or technology and use information that we regard as proprietary to create products or services that compete with our offerings. Some of the provisions of our service agreements that protect us against unauthorized use, copying, transfer, and disclosure of our platform, may be unenforceable under the laws of certain jurisdictions and foreign countries. Further, the laws of some countries do not protect intellectual property to the same extent as the laws of the United States, and mechanisms for enforcement of intellectual property rights in some foreign countries may be inadequate. To the extent we expand our international activities, our exposure to unauthorized copying and use of our platform and proprietary information may increase. Further, our competition, foreign governments, foreign government-backed actors, criminals, or other third parties may gain unauthorized access to our confidential information and technology. Accordingly, despite our efforts, we may be unable to prevent third parties from infringing upon or misappropriating our intellectual property rights. If we are unable to protect our intellectual property rights or prevent unauthorized use, infringement or misappropriation thereof by third parties, the value of our intellectual property and intellectual property rights may be diminished, and our competition may be able to more effectively mimic our offerings and service. In addition, our know-how is derived in part from insights we obtain from the historical individual and aggregate transactions that take place on our platform. If the availability, security or integrity of such data is lost or compromised due to a technology failure, cyberattack or similar event, our know-how could be lost or diminished, and this could materially adversely affect our ability to serve our merchants. For more information, see “Risk Factors—Risks Relating to our Business and Industry— We store personal information of merchants and shoppers. To the extent our security measures are compromised, our platform may be perceived as not being secure. This may result in merchants curtailing or ceasing their use of our platform, our reputation being harmed, our incurring of significant regulatory and monetary liabilities and adverse effects on our results of operations and growth prospects.”
While software and other of our proprietary works may be protected under copyright law, we have not registered any copyrights in these works, and instead, primarily rely on protecting our software as a trade secret. In order to bring a copyright infringement lawsuit in the United States, the copyright must be registered. Accordingly, the remedies and damages available to us for unauthorized use of our software may be limited.
Although we attempt to protect our intellectual property, technology and confidential information by entering into confidentiality and invention assignment agreements with our employees and consultants and entering into confidentiality agreements with the parties with whom we have strategic relationships and business alliances, these agreements may not effectively grant all necessary rights to any inventions that may have been developed by the employees or consultants party thereto, and may not be effective in controlling access to and distribution of our platform, technology and confidential information or provide an adequate remedy in the event of unauthorized use of our platform or technology or unauthorized access, use or disclosure of our confidential information. Additionally, employees and consultants may choose to violate the terms of their confidentiality agreements.
Further, these agreements do not prevent our competitors from independently developing technologies that are substantially equivalent or superior to ours. We cannot guarantee that others will not independently develop technology with the same or similar functions to any proprietary technology we rely on to conduct our business and differentiate ourselves from our competitors.
We may be required to spend significant resources to monitor and protect our intellectual property rights, and we may or may not be able to detect infringement, misappropriation or other violation of our intellectual property rights by third parties. Litigation may be necessary in the future to enforce our intellectual property rights and to protect our trade secrets. Such litigation could be costly, time consuming, and distracting to management and could result in the impairment or loss of portions of our intellectual property. Furthermore, our efforts to enforce our intellectual property rights may be met with defenses, counterclaims, and countersuits attacking the validity and enforceability of our intellectual property rights. Our inability to protect our proprietary technology against unauthorized copying or use, as well as any costly litigation or diversion of our management’s attention and resources, could delay further sales or the implementation of our platform, impair its functionality, delay introductions of new features, integrations, and capabilities, result in our substituting inferior or more costly technologies into our platform, or injure our reputation. In addition, we may be required to license additional technology from third parties to develop and market new features, integrations, and capabilities, and we cannot assure you that we could license that technology on commercially reasonable terms or at all, and our inability to license this technology could harm our ability to compete. Any one or more of the foregoing could harm our business, results of operations, and financial condition.
We may incur costs to defend against, face liability for or be vulnerable to intellectual property infringement claims brought against us by others.
There is considerable intellectual property development and enforcement activity in our industry. We expect that software developers in our industry will increasingly be subject to infringement claims as the number of competing solutions grows and the functionality of platforms and services in different industries overlap. Our future success depends in part on not infringing upon or misappropriating the intellectual property rights of others. There is a risk that our operations, platforms and services may infringe or otherwise violate, or be alleged to infringe or otherwise violate, the intellectual property rights of third parties. Other companies have claimed in the past, and may claim in the future, that we infringe upon or otherwise violate their intellectual property rights. A claim may also be made relating to technology or intellectual property that we acquire or license from third parties. If we were subject to a claim of infringement, regardless of the merit of the claim or our defenses, the claim could:
| | • | | require costly litigation to resolve and the payment of substantial royalty or license fees, lost profits or other damages; |
| | • | | require and divert significant management time; |
| | • | | cause us to enter into unfavorable royalty or license agreements; |
| | • | | require us to discontinue some or all of the features, integrations, and capabilities available on our platform; |
| | • | | require us to indemnify our merchants or third-party service providers; and/or |
| | • | | require us to expend additional development resources to redesign our platform. |
Any one or more of the above could harm our business, results of operations, and financial condition.
We use open source software, which may pose particular risks to our proprietary software, technologies, products and services in a manner that could negatively affect our business.
We use open source software in our platform and expect to use more open source software in the future. From time to time, there have been claims challenging both the ownership of open source software against companies that incorporate open source software into their products and whether such incorporation is permissible under various open source licenses. There is a risk that these licenses could be construed in a way that could impose unanticipated conditions or restrictions on our ability to commercialize our platform. As a result, we could be subject to lawsuits by parties claiming ownership of what we believe to be open source software, or breach of open source licenses. Litigation could be costly for us to defend, have a negative effect on our business, results of operations, and financial condition, or require us to devote additional research and development resources to change our platform. In addition, if we were to combine our proprietary source code or software with open source software in a certain manner, we could, under certain open source licenses, be required to release the source code of our proprietary software to the public. This would allow our competition to create similar products with less development effort and time. If we inappropriately use open source software, or if the license terms for open source software that we use change, we may be required to re-engineer our platform, or certain aspects of it, incur additional costs, discontinue the availability of certain features, or take other remedial actions.
In addition to risks related to license requirements, usage of open source software can lead to greater risks than use of third-party commercial software, as open source licensors generally do not provide warranties support, indemnification, assurance of title or controls on origin of the software or other contractual protections regarding infringement claims or the quality of the code. In addition, many of the risks associated with usage of open source software, such as the lack of warranties or assurances of title, cannot be eliminated, and could, if not properly addressed, negatively affect our business. We have established processes to help alleviate these risks, but we cannot be sure that all of our use of open source software is in a manner that is consistent with our current policies and procedures, or will not subject us to liability.
In addition, open source libraries incorporated in our platform must be constantly updated in order to avoid security vulnerabilities that may be present in an outdated version of the software. Updating the open source libraries we use in a timely manner requires ongoing development efforts, and any delay relating to this process may expose us to risk of security breach. To the extent that our platform depends upon the successful operation of open source software, any undetected errors or defects in this open source software could prevent the deployment or impair the functionality of our platform, delay new solutions introductions, result in a failure of our platform, and injure our reputation. For example, undetected errors or defects in open source software could render it vulnerable to breaches or security attacks, and, in conjunction, make our systems more vulnerable to data breaches. In addition, the public availability of such software may make it easier for others to compromise our platform.
We depend on our executive officers and other key employees, and the loss of one or more of these employees could harm our business.
Our success depends largely upon the continued services of our executive officers and other key employees. From time to time, there may be changes in our executive management team resulting from the hiring or departure of executives, which could disrupt our business. We do not have employment agreements with our executive officers or other key personnel that require them to continue to work for us for any specified period and, therefore, they could terminate their employment with us at any time subject only to the notice periods prescribed by their respective executive agreements. The loss of one or more of our executive officers, or key employees could harm our business.
Inability to attract and retain other highly skilled employees could harm our business.
To execute our growth plan, we must attract and retain highly qualified personnel. Competition where we maintain offices is intense, especially for engineers experienced in designing and developing software and experienced sales professionals. We have from time to time experienced, and we expect to continue to experience, difficulty in hiring and retaining employees with appropriate qualifications. Many of the companies with which we compete for experienced personnel have greater resources than we have. In addition, certain domestic immigration laws restrict or limit our ability to recruit internationally. Any changes to Israeli, United Kingdom, European or the U.S. immigration policies that restrain the flow of technical and professional talent may inhibit our ability to recruit and retain highly qualified employees.
In addition, job candidates and existing employees often consider the value of the equity awards they receive in connection with their employment. If the perceived value of our equity awards declines, it may harm our ability to recruit and retain highly skilled employees.
Volatility or lack of appreciation in the price of our ordinary shares may also affect our ability to attract and retain our key employees. Many of our senior personnel and other key employees have become, or will soon become, vested in a substantial number of options. Employees may be more likely to leave us if the shares they own or the shares underlying their vested options or restricted share units have significantly appreciated in value relative to the original purchase price of the shares or the exercise price of the options, or conversely, if the exercise price of the options that they hold are significantly above the market price of our ordinary shares.
While we may not be able to enforce non-compete agreements we enter into with our employees, our current and future competition may attempt to enforce similar agreements with individuals we recruit or attempt to recruit.
We generally enter into agreements with our employees which prohibit our employees, if they cease working for us, from competing directly with us or working for our current and future competition for a limited period. However, we may be unable to enforce these agreements under the laws of the jurisdictions in which our employees work, and it may be difficult for us to restrict our current and future competition from benefiting from the expertise our former employees developed while working for us. For example, Israeli labor courts have required employers seeking to enforce non-compete undertakings of a former employee to demonstrate that the competitive activities of the former employee will harm one of a limited number of material interests of the employer that have been recognized by the courts, such as the protection of a company’s trade secrets or other intellectual property.
If we hire employees from our current and future competition or other companies, their former employers may attempt to assert that these employees or we have breached their legal obligations, resulting in a diversion of our time and resources. In a similar manner, should our current and future competition succeed in hiring some of our employees and executives, and should some of these employees or executives breach their legal obligations and divulge commercially sensitive information to our current and future competition, our ability to successfully compete with our current and future competition may be hindered.
Our management team has limited experience managing a public company.
Our management team has limited experience managing a publicly-traded company, interacting with public company investors and complying with the increasingly complex laws pertaining to public companies. Our management team may not successfully or efficiently manage our transition to being a public company that is subject to significant regulatory oversight and reporting obligations under the federal securities laws and the continuous scrutiny of securities analysts and investors. These obligations and constituents will require significant attention from our senior management and could divert their attention away from the day-to-day management of our business, which could harm our business, results of operations, and financial condition.
We may be subject to litigation for a variety of claims, which could harm our reputation and adversely affect our business, results of operations, and financial condition.
In the ordinary course of business, we may be involved in and subject to litigation for a variety of claims or disputes and receive regulatory inquiries. These claims, lawsuits, and proceedings could include labor and employment, wage and hour, commercial, antitrust, alleged securities law violations or other investor claims, and other matters. The number and significance of these potential claims and disputes may increase as our business expands. Further, our general liability insurance may not cover all potential claims made against us or be sufficient to indemnify us for all liability that may be imposed. Any claim against us, regardless of its merit, could be costly, divert management’s attention and operational resources, and harm our reputation. As litigation is inherently unpredictable, we cannot assure you that any potential claims or disputes will not have a material adverse effect on our business, results of operations, and financial condition.
Contractual arrangements between merchants and local distributors may impede the adoption by merchants of a D2C model and diminish the adoption of our platform and services as a result.
A significant segment of our merchants are international brands with a strategic focus on transitioning to a D2C model through the use of e-commerce. Despite making this transition, some brands maintain contractual relationships with distributors of their products such as wholesalers, local webstore operators, marketplaces and franchises in various geographies which our platform makes accessible for D2C sales. Contractual arrangements between brands and their local distributors that provide for exclusivity terms, volume restrictions on alternate distribution channels or most favored client pricing may slow or restrict adoption of our platform and services. Even absent such contractual obligations, local distributors may still petition the brand to cease its operations through our platform if the brand’s D2C sales adversely impact their local distributor sales. Although we believe that our platform and services provide functionality, tools and advantages that match or outweigh the local distributor model and therefore justify their use on a standalone or supplemental basis, resistance on behalf of such distributors and the resulting friction may slow or restrict adoption of our platform and services by such brands in certain locations and diminish our growth in this segment.
Our failure to raise additional capital or generate cash flows necessary to expand our operations and invest in new technologies in the future could reduce our ability to compete successfully and harm our results of operations.
Historically, we have funded our operations and capital expenditures primarily through equity issuances and cash generated from our operations. Although we currently anticipate that our existing cash and cash equivalents, and cash flow from operations will be sufficient to meet our cash needs for the foreseeable future, we may require additional financing, and we may not be able to obtain debt or equity financing on favorable terms, if at all. If we raise equity financing to fund operations or on an opportunistic basis, our shareholders may experience significant dilution of their ownership interests. If we need additional capital and cannot raise it on acceptable terms, or at all, we may not be able to, among other things:
| | • | | develop new features, integrations, capabilities, and enhancements; |
| | • | | continue to expand our product development, sales, and marketing organizations; |
| | • | | respond to competitive pressures or unanticipated working capital requirements; or |
| | • | | pursue acquisition opportunities. |
Our corporate culture has contributed to our success, and if we cannot maintain this culture as we grow, we could lose the innovative approach, creativity, and teamwork fostered by our culture and our business could be harmed.
We believe that an important contributor to our success has been our corporate culture, which we believe creates an environment that drives and perpetuates our strategy to create a better, more productive way to work and focuses on driving success for our customers. As we continue to grow, including geographically, and develop the infrastructure of a public company, we may find it difficult to maintain our corporate culture. If we do not maintain and continue to develop our corporate culture as we grow and evolve, it could harm our ability to foster the innovation, craftsmanship, teamwork, curiosity, and diversity, we believe that we need to support our growth. Any failure to preserve our culture could also harm our ability to retain and recruit personnel, innovate and operate effectively, and execute on our business strategy.
If we fail to maintain an effective system of disclosure controls and internal control over financial reporting, our ability to produce timely and accurate financial statements or comply with applicable regulations could be impaired.
The Sarbanes-Oxley Act requires, among other things, that we maintain effective disclosure controls and procedures and internal control over financial reporting. We are continuing to develop and refine our disclosure controls and other procedures that are designed to ensure that information required to be disclosed by us in the reports that we will file with the SEC is recorded, processed, summarized, and reported within the time periods specified in SEC rules and forms and that information required to be disclosed in reports under the Securities Exchange Act of 1934, as amended, or the Exchange Act, is accumulated and communicated to our principal executive and financial officers. We believe that any disclosure controls and procedures, no matter how well conceived and operated, can provide only reasonable, not absolute, assurance that the objectives of the control system are met. These inherent limitations include the realities that judgments in decision-making can be faulty, and that breakdowns can occur because of simple error or mistake. Additionally, controls can be circumvented by the individual acts of some persons, by collusion of two or more people or by an unauthorized override of the controls. Accordingly, because of the inherent limitations in our control system, misstatements due to error or fraud may occur and not be detected.
We are also continuing to improve our internal control over financial reporting. For example, as we have prepared to become a public company, we have worked to improve the controls around our key accounting processes and our quarterly close process, we have implemented a number of new systems to supplement our core enterprise resource planning, or ERP, system as part of our control environment, and we have hired additional accounting and finance personnel to help us implement these processes and controls. In order to maintain and improve the effectiveness of our disclosure controls and procedures and internal control over financial reporting, we have expended, and anticipate that we will continue to expend, significant resources, including accounting-related costs and significant management oversight. If any of these new or improved controls and systems do not perform as expected, we may experience material weaknesses in our controls. In addition to our results determined in accordance with GAAP, we believe certain non-GAAP measures and key metrics may be useful in evaluating our operating performance. We present certain non-GAAP financial measures and key metrics in this Annual Report and intend to continue to present certain non-GAAP financial measures and key metrics in future filings with the SEC and other public statements. Any failure to accurately report and present our non-GAAP financial measures and key metrics could cause investors to lose confidence in our reported financial and other information, which would likely have a negative effect on the trading price of our ordinary shares.
Our current controls and any new controls that we develop may become inadequate because of changes in conditions in our business. Further, weaknesses in our disclosure controls and internal control over financial reporting may be discovered in the future. Any failure to develop or maintain effective controls or any difficulties encountered in their implementation or improvement could harm our results of operations or cause us to fail to meet our reporting obligations and may result in a restatement of our consolidated financial statements for prior periods. Any failure to implement and maintain effective internal control over financial reporting also could adversely affect the results of management evaluations and annual independent registered public accounting firm attestation reports regarding the effectiveness of our internal control over financial reporting that we will eventually be required to include in our annual reports that will be filed with the SEC. Ineffective disclosure controls and procedures and internal control over financial reporting could also cause investors to lose confidence in our reported financial and other information, which would likely have a negative effect on the trading price of our ordinary shares. In addition, if we are unable to continue to meet these requirements, we may not be able to remain listed on the Nasdaq Global Select Market, or Nasdaq.
We are required to furnish a report by management on, among other things, the effectiveness of our internal control over financial reporting pursuant to Section 404(a) of the Sarbanes-Oxley Act of 2002 (the “Sarbanes-Oxley Act”) in the second annual report following the completion of our initial public offering, or our IPO. This assessment will need to include disclosure of any material weaknesses identified by our management in our internal control over financial reporting. The rules governing the standards that must be met for our management to assess our internal control over financial reporting are complex and require significant documentation, testing and possible remediation. Testing and maintaining internal controls may divert our management’s attention from other matters that are important to our business. Additionally, while we remain an emerging growth company, our independent registered public accounting firm is not required to formally attest to the effectiveness of our internal control over financial reporting pursuant to Section 404(b) of the Sarbanes-Oxley Act. At such time, our independent registered public accounting firm may issue a report that is adverse in the event it is not satisfied with the level at which our internal control over financial reporting is documented, designed or operating. We will remain an “emerging growth company” until the earliest of: (1) December 31, 2026, (2) the last day of the first fiscal year in which our annual gross revenue is $1.07 billion or more; (3) the date on which we have, during the previous rolling three-year period, issued more than $1 billion in non-convertible debt securities; and (4) the date we qualify as a “large accelerated filer.”
We are engaged in a process to document and evaluate our internal control over financial reporting, which is both costly and challenging. In this regard, we will need to continue to dedicate internal resources, potentially engage outside consultants, and adopt a detailed work plan to assess and document the adequacy of internal control over financial reporting, continue steps to improve control processes as appropriate, validate through testing that controls are functioning as documented, and implement a continuous reporting and improvement process for internal control over financial reporting. We currently have limited accounting personnel, and we have begun the process of evaluating the adequacy of our accounting personnel staffing level and other matters related to our internal control over financial reporting. Despite our efforts, there is a risk that we will not be able to conclude, within the prescribed time frame or at all, that our internal control over financial reporting is effective as required by Section 404. If we identify one or more material weaknesses, it could result in an adverse reaction in the financial markets due to a loss of confidence in the reliability of our financial statements. As a result, the market price of our ordinary shares could be negatively affected, and we could become subject to investigations by the SEC or other regulatory authorities, which could require additional financial and management resources.
Any failure to maintain effective disclosure controls and internal control over financial reporting could adversely affect our business, financial condition, and results of operations and could cause a decline in the price of our ordinary shares.
If our estimates or judgments relating to our critical accounting policies prove to be incorrect, our results of operations could be adversely affected.
The preparation of financial statements in conformity with GAAP requires management to make estimates and assumptions that affect the amounts reported in our consolidated financial statements and related notes. We base our estimates on historical experience and on various other assumptions that we believe to be reasonable under the circumstances, as provided in the section titled “Operating and Financial Review and Prospects.” The results of these estimates form the basis for making judgments about the carrying values of assets, liabilities and equity, and the amount of revenue and expenses that are not readily apparent from other sources. Significant assumptions and estimates used in preparing our consolidated financial statements include those related to revenue recognition, share based compensation including the estimation of fair value of ordinary shares, valuation of strategic investments, period of benefit for deferred costs, and uncertain tax positions. Our results of operations may be adversely affected if our assumptions change or if actual circumstances differ from those in our assumptions, which could cause our results of operations to fall below the expectations of securities analysts and investors, resulting in a decline in the trading price of our ordinary shares.
Changes in tax laws or regulations to which we are subject could have an adverse effect on us, our merchants or their shoppers and could increase the costs and reduce the attractiveness of our platform and harm our business.
New income, sales, use or other tax laws, regulations, or ordinances could be enacted and new interpretations of existing tax laws, regulations or ordinances could be adopted at any time. Those changes could adversely affect our domestic and international business operations, and our business, results of operations, and financial condition. These events could require us, our merchants or their shoppers to pay additional tax amounts on a prospective or retroactive basis, as well as require us, our merchants or their shoppers to pay fines and/or penalties and interest for past amounts deemed to be due. If we are required to collect such additional tax amounts from either our merchants or their shoppers and are unsuccessful in collecting such taxes due from our merchants or their shoppers, we could be held liable for such costs, thereby adversely affecting our results of operations and harming our business. If we raise our prices to offset the costs of these changes, merchants may elect not to use our platform and services in the future. Additionally, new, changed, modified, or newly interpreted or applied tax laws could increase our merchants’, our shoppers’ and our compliance, operating, and other costs. Further, these events could decrease the capital we have available to operate our business. Any or all of these events could harm our business, results of operations, and financial condition. For example, on July 1, 2021, new VAT e-commerce rules came into effect, which apply to all sales we make to EU shoppers. Among other requirements, the new VAT rules require us to register and operate a new reporting system (commonly known as “IOSS”). Compliance with these new reporting requirements as well as the newly introduced VAT rules required and will continue to require significant resources and we cannot be certain that we have fully complied with or applied the new requirements, and as a result we may face non-compliance assessments, calculation or remittance gaps and other discrepancies. Further, governments, customs agencies and tax authorities may seek heightened scrutiny and enforcement of the new regulations, which could result in delayed clearance, rejections of our tax submissions, refusal to assess taxes in a timely manner and additional audits.
In addition, we are subject to taxation in several jurisdictions around the world with increasingly complex tax laws, the application of which can be uncertain. The tax authorities in these jurisdictions could review our tax returns and impose additional tax, interest, and penalties, assert that various withholding requirements apply to us or our subsidiaries or that benefits of tax treaties are not available to us or our subsidiaries, any of which could harm us and our results of operations.
Our results of operations may be harmed if we are required to collect sales or other taxes relating to the use of our platform and services in jurisdictions where we have not historically done so.
States and local taxing jurisdictions may impose sales and use taxes, including on services provided electronically or goods sold via the internet. The applicability of sales taxes related to the use of our platform in various jurisdictions is unclear. We collect and remit sales and value-added tax, or VAT or goods and services tax, or GST, in a number of jurisdictions (including in the U.S.). It is possible, however, that we could face sales tax, VAT or GST audits and that our liability for these taxes could exceed our estimates as state tax authorities could still assert that we are obligated to collect additional tax amounts from merchants and remit those taxes to those tax authorities. Further, one or more U.S. state or non-U.S. authorities could seek to impose additional sales, use or other tax collection and record-keeping obligations on us or may determine that such taxes should have, but have not been, paid by us. We could also be subject to audits in U.S. states and non-U.S. jurisdictions for which we have not accrued tax liabilities. A successful assertion that we should be collecting additional sales or other taxes on our services and/or on goods sold in jurisdictions where we have not historically done so and do not accrue for sales taxes could result in substantial tax liabilities for past sales (including substantial interest and penalties), discourage organizations from utilizing our platform and services, or otherwise harm our business, results of operations, and financial condition.
The enactment of legislation implementing changes in taxation of international business activities, the adoption of other corporate tax reform policies, or changes in tax legislation or policies could impact our future financial position and results of operations.
Corporate tax reform, base-erosion efforts and tax transparency continue to be high priorities in many tax jurisdictions where we have business operations. As a result, policies regarding corporate income and other taxes in numerous jurisdictions are under heightened scrutiny and tax reform legislation is being proposed or enacted in a number of jurisdictions.
In 2015, the Organization for Economic Co-operation and Development (the “OECD”) released various reports under its Base Erosion and Profit Shifting (“BEPS”) action plan to reform international tax systems and prevent tax avoidance and aggressive tax planning. These actions aim to standardize and modernize global corporate tax policy, including cross-border taxes, transfer-pricing documentation rules and nexus-based tax incentive practices which in part are focused on challenges arising from the digitalization of the economy. The reports have a very broad scope including, but not limited to, neutralizing the effects of hybrid mismatch arrangements, limiting base erosion involving interest deductions and other financial payments, countering harmful tax practices, preventing the granting of treaty benefits in inappropriate circumstances and imposing mandatory disclosure rules. It is the responsibility of OECD members to consider how the BEPS recommendations should be reflected in their national legislation. Many countries are beginning to implement legislation and other guidance to align their international tax rules with the OECD’s BEPS recommendations, for example, by signing up to the Multilateral Convention to Implement Tax Treaty Related Measures to Prevent BEPS (the “MLI”) which currently has been signed by over 85 jurisdictions, including Israel who ratified the MLI on September 13, 2018. The MLI implements some of the measures that the BEPS initiative proposes to be transposed into existing treaties of participating states. Such measures include the inclusion in tax treaties of one, or both, of a “limitation-on-benefit” (“LOB”) rule and a “principle purposes test” (“PPT”) rule. The application of the LOB rule or the PPT rule could deny the availability of tax treaty benefits (such as a reduced rate of withholding tax) under tax treaties. There are likely to be significant changes in the tax legislation of various OECD jurisdictions during the period of implementation of BEPS. Such legislative initiatives may materially and adversely affect our plans to expand internationally and may negatively impact our financial condition, tax liability, results of operations and could increase our administrative efforts.
General Risks Affecting Our Business and Operations
Unfavorable conditions in our industry, the global economy, e-commerce or particular verticals within e-commerce, could limit our ability to grow our business and negatively affect our results of operations.
Our results of operations may vary based on the impact of changes in our industry or the global economy on us or our merchants. The revenue growth and potential profitability of our business depend on demand for our platform and services, as well as demand for the products offered by our merchants. Therefore, current or future economic uncertainties or downturns could adversely affect our business and results of operations. Negative conditions in the global economy or individual markets, including changes in gross domestic product growth, financial and credit market fluctuations, political turmoil, natural catastrophes, warfare and terrorist attacks, could cause a decrease in business investments, consumer spending, e-commerce generally and negatively affect our business. A percentage of our merchants are luxury fashion brands, and the adverse impact to our business resulting from any of the foregoing factors could be magnified to the extent that it disproportionately affects merchants in verticals from which our merchants derive a significant amount of their GMV.
The COVID-19 pandemic as well as the situation in Ukraine have caused heightened uncertainty in the global economy. If economic conditions further deteriorate, shoppers may not have the financial means to make purchases from our merchants and may delay or reduce discretionary purchases, negatively impacting our merchants and our results of operations.
Such uncertainties may also cause prospective or existing merchants to defer investment in e-commerce. Our smaller merchants may be more susceptible to general economic conditions than larger businesses, which may have greater liquidity and access to capital. Uncertain and adverse economic conditions also may lead to increased refunds and chargebacks. Since the impact of such uncertainties is ongoing, the effect on the global economy may not be fully reflected in our results of operations until future periods. Volatility in the capital markets has been heightened during recent months and such volatility may continue, which may cause declines in the price of our ordinary shares.
To the extent our platform is perceived by merchants as costly, or too difficult to launch or migrate to, it would negatively affect our growth. Our revenue may be disproportionately affected by delays or reductions in general IT spending and reduction in investments in cross-border expansion by merchants. Our competition may respond to market conditions by lowering prices or otherwise bundling their competing solutions with other of their offerings which are widely used by merchants in a way that may make it difficult to attract merchants to our platform and services and may offer more competitive prices (including by way of strategic partnerships, collaborations or otherwise), in order to lure away our merchants. We cannot predict the timing, strength, or duration of any economic slowdown, instability or recovery, generally or within any particular industry. If the economic conditions of the general economy or markets in which we operate worsen from present levels, our business, results of operations and financial condition could be adversely affected.
Actions of activist shareholders may cause us to incur substantial costs, disrupt our operations, divert management’s attention, or have other material adverse effects on us.
From time to time, activist investors may take a position in our shares. These activist investors may disagree with decisions we have made or may believe that alternative strategies or personnel, either at a management level or at a board level, would produce higher returns. Such activists may or may not be aligned with the views of our other shareholders, may be focused on short-term outcomes, or may be focused on building their reputation in the market. These activists may not have a full understanding of our business and markets and the alternative personnel they may propose may also not have the qualifications or experience necessary to lead the company.
Responding to advances or actions by activist investors may be costly and time-consuming, may disrupt our operations, and may divert the attention of our board of directors, management team, and employees from running our business and maximizing performance. Such activist activities could also interfere with our ability to execute our strategic plan, disrupt the functioning of our board of directors, or negatively impact our ability to attract and retain qualified executive leadership or board members, who may be unwilling to serve with activist personnel. Uncertainty as to the impact of activist activities may also affect the market price and volatility of our shares.
Risks Relating to Our Ordinary Shares
Our share price has been and may continue to be volatile.
The market price of our ordinary shares has been and could continue to be highly volatile and may fluctuate substantially as a result of many factors, including:
| | • | | actual or anticipated fluctuations in our results of operations; |
| | • | | variance in our financial performance from the expectations of market analysts; |
| | • | | announcements by us or our direct or indirect competition of significant business developments, changes in service provider relationships, acquisitions or expansion plans; |
| | • | | the impact of the COVID-19 pandemic on our management, employees, partners, merchants, and operating results; |
| | • | | changes or proposed changes in laws or regulations or differing interpretations or enforcement of laws or regulations affecting our business; |
| | • | | changes in our pricing model; |
| | • | | our involvement in litigation or regulatory actions; |
| | • | | our sale of ordinary shares or other securities in the future; |
| | • | | market conditions in our industry; |
| | • | | changes in key personnel; |
| | • | | the trading volume of our ordinary shares; |
| | • | | publication of research reports or news stories about us, our competition or our industry, or positive or negative recommendations or withdrawal of research coverage by securities analysts; |
| | • | | changes in the estimation of the future size and growth rate of our markets; and |
| | • | | general economic and market conditions. |
In addition, the stock markets have experienced extreme price and volume fluctuations. Broad market and industry factors may materially harm the market price of our ordinary shares, regardless of our operating performance. In the past, following periods of volatility in the market price of a company’s securities, securities class action litigation has often been instituted against that company. If we were involved in any similar litigation we could incur substantial costs and our management’s attention and resources could be diverted.
The concentration of our share ownership with insiders may limit your ability to influence corporate matters, including the ability to influence the outcome of director elections and other matters requiring shareholder approval.
Our executive officers, directors, beneficial owners of greater than 5% of our ordinary shares and affiliated entities together beneficially owned approximately 73% of our ordinary shares outstanding as of December 31, 2021. Certain of such holders also have rights to acquire additional ordinary shares upon the exercise of options and warrants in the future. As a result, these shareholders, acting together, will have control over most matters that require approval by our shareholders, including the appointment and dismissal of directors, the terms of compensation of our directors and chief executive officer, certain other related party transactions, capital increases, and amendments to our amended and restated articles of association. Corporate action might be taken even if other shareholders oppose them. This concentration of ownership might also have the effect of delaying or preventing a change of control of us that other shareholders may view as beneficial.
An active trading market for our ordinary shares may not be sustained to provide adequate liquidity.
An active trading market may not be sustained for our ordinary shares. The lack of an active market may impair your ability to sell your shares at the time you wish to sell them or at a price that you consider reasonable. An inactive market may also impair our ability to raise capital by selling ordinary shares and may impair our ability to acquire other companies by using our shares as consideration.
If we do not meet the expectations of equity research analysts, if they do not publish research or reports about our business or if they issue unfavorable commentary or downgrade our ordinary shares, the price of our ordinary shares could decline.
The trading market for our ordinary shares relies in part on the research and reports that equity research analysts publish about us and our business. The analysts’ estimates are based upon their own opinions and are often different from our estimates or expectations. If our results of operations are below the estimates or expectations of public market analysts and investors, the price of our ordinary shares could decline. Moreover, the price of our ordinary shares could decline if one or more securities analysts downgrade our ordinary shares or if those analysts issue other unfavorable commentary or cease publishing reports about us or our business.
We are an emerging growth company, as defined in the Securities Act, and we cannot be certain if the reduced disclosure requirements applicable to emerging growth companies will make our ordinary shares less attractive to investors because we may rely on these reduced disclosure requirements.
We are an emerging growth company, as defined in Section 2(a) of the Securities Act, as modified by the JOBS Act. Under the JOBS Act, emerging growth companies can delay adopting new or revised financial accounting standards until such time as those standards apply to private companies. We have elected to take advantage of this extended transition period under the JOBS Act for adopting new or revised financial accounting standards.
For as long as we continue to be an emerging growth company, we may also take advantage of certain exemptions from various reporting requirements that are applicable to other public companies that are not emerging growth companies, including presenting only limited selected financial data and not being required to comply with the auditor attestation requirements of Section 404 of the Sarbanes-Oxley Act. As a result, our shareholders may not have access to certain information that they may deem important. We could be an emerging growth company until December 31, 2026, although circumstances could cause us to lose that status earlier, including if our total annual gross revenue exceeds $1.07 billion, or if we are deemed to be a “large accelerated filer” under U.S. securities laws, which means either if (i) the market value of our ordinary shares that is held by non-affiliates exceeds $700 million as of the end of the prior fiscal year’s second fiscal quarter of if (2) we issue more than $1.0 billion in non-convertible debt securities during any three-year period. We cannot predict if investors will find our ordinary shares less attractive because we may rely on these exemptions. If some investors find our ordinary shares less attractive as a result, there may be a less active trading market for our ordinary shares and our share price may be more volatile.
We are a foreign private issuer and, as a result, we are not subject to U.S. proxy rules and are subject to Exchange Act reporting obligations that, to some extent, are more lenient and less frequent than those of a U.S. domestic public company.
We report under the Exchange Act as a non-U.S. company with foreign private issuer status. Because we qualify as a foreign private issuer under the Exchange Act, we are exempt from certain provisions of the Exchange Act that are applicable to U.S. domestic public companies, including (1) the sections of the Exchange Act regulating the solicitation of proxies, consents or authorizations in respect of a security registered under the Exchange Act, (2) the sections of the Exchange Act requiring insiders to file public reports of their share ownership and trading activities and liability for insiders who profit from trades made in a short period of time and (3) the rules under the Exchange Act requiring the filing with the SEC of quarterly reports on Form 10-Q containing unaudited financial and other specified information, although we are subject to Israeli laws and regulations with regard to certain of these matters and intend to furnish comparable quarterly information on Form 6-K. In addition, foreign private issuers are not required to file their annual report on Form 20-F until 120 days after the end of each fiscal year, while U.S. domestic issuers that are accelerated filers are required to file their annual report on Form 10-K within 75 days after the end of each fiscal year and U.S. domestic issuers that are large accelerated filers are required to file their annual report on Form 10-K within 60 days after the end of each fiscal year. Foreign private issuers are also exempt from Regulation FD, which is intended to prevent issuers from making selective disclosures of material information. As a result of all of the above, you may not have the same protections afforded to shareholders of a company that is not a foreign private issuer.
We may lose our foreign private issuer status in the future, which could result in significant additional costs and expenses.
As discussed above, we are a foreign private issuer, and therefore, we are not required to comply with all of the periodic disclosure and current reporting requirements of the Exchange Act. The determination of foreign private issuer status is made annually on the last business day of an issuer’s most recently completed second fiscal quarter, and, accordingly, the next determination will be made with respect to us on June 30, 2022. In the future, we would lose our foreign private issuer status if (1) more than 50% of our outstanding voting securities are owned by U.S. residents and (2) a majority of our directors or executive officers are U.S. citizens or residents, or we fail to meet additional requirements necessary to avoid loss of foreign private issuer status. If we lose our foreign private issuer status, we will be required to file with the SEC periodic reports and registration statements on U.S. domestic issuer forms, which are more detailed and extensive than the forms available to a foreign private issuer. We will also have to mandatorily comply with U.S. federal proxy requirements, and our officers, directors and principal shareholders will become subject to the short-swing profit disclosure and recovery provisions of Section 16 of the Exchange Act. In addition, we will lose our ability to rely upon exemptions from certain corporate governance rules of Nasdaq. As a U.S. listed public company that is not a foreign private issuer, we will incur significant additional legal, accounting and other expenses that we will not incur as a foreign private issuer.
As we are a “foreign private issuer” and follow certain home country corporate governance practices, our shareholders may not have the same protections afforded to shareholders of companies that are subject to all corporate governance rules of Nasdaq.
As a foreign private issuer, we have the option to follow certain home country corporate governance practices rather than those of Nasdaq, provided that we disclose the requirements we are not following and describe the home country practices we are following. We rely on this “foreign private issuer exemption” with respect to Nasdaq rules for shareholder meeting quorums. We may in the future elect to follow home country practices with regard to other matters. As a result, our shareholders may not have the same protections afforded to shareholders of companies that are subject to all corporate governance rules of Nasdaq.
The market price of our ordinary shares could be negatively affected by future issuances and sales of our ordinary shares.
As of December 31, 2021, there were 150,456,501 ordinary shares outstanding, as well as warrants to purchase an aggregate of 7,902,480 ordinary shares at an exercise price of $0.01 per share. As of December 31, 2021, we also had 13,324,236 ordinary shares available for future grant under our equity incentive plans and 10,575,172 ordinary shares that were subject to share awards outstanding (of which 7,955,457 were vested and exercisable as of December 31, 2021). Sales by us or our shareholders of a substantial number of ordinary shares in the public market, or the perception that these sales might occur, could cause the market price of our ordinary shares to decline or could impair our ability to raise capital through a future sale of, or pay for acquisitions using, our equity securities. For example, following the effectiveness of the registration statement and re-sale of a substantial number of our ordinary shares held by certain pre-IPO shareholders in mid-September 2021, our ordinary shares experienced a price volatility.
On May 24, 2021, we filed a registration statement on Form S-8 under the Securities Act to register ordinary shares reserved for issuance under our share option plans. The registration statement became effective automatically upon filing, and the ordinary shares covered by such registration statement are eligible for resale in the public markets, subject to vesting restrictions, lock-up agreements and Rule 144 limitations applicable to affiliates.
There can be no assurance that we will not be classified as a passive foreign investment company, which could result in adverse U.S. federal income tax consequences to United States Holders of our ordinary shares.
We would be classified as a passive foreign investment company (“PFIC”) for any taxable year if, after the application of certain look-through rules, either: (i) 75% or more of our gross income for such year is “passive income” (as defined in the relevant provisions of the Internal Revenue Code of 1986, as amended), or (ii) 50% or more of the value of our assets (generally determined on the basis of a quarterly average) during such year is attributable to assets that produce or are held for the production of passive income. For these purposes, cash and other assets readily convertible into cash or that do or could generate passive income are categorized as passive assets, and the value of goodwill and other unbooked intangible assets is generally taken into account. Passive income generally includes, among other things, rents, dividends, interest, royalties, gains from the disposition of passive assets and gains from commodities and securities transactions. For purposes of this test, we will be treated as owning a proportionate share of the assets and earning a proportionate share of the income of any other corporation of which we own, directly or indirectly, at least 25% (by value) of the stock. Based on our market capitalization and the composition of our income, assets and operations, we believe that we were not a PFIC for the year ended December 31, 2021 and do not expect to be a PFIC for United States federal income tax purposes for the current taxable year or in the foreseeable future. However, this is a factual determination that must be made annually after the close of each taxable year. Moreover, the value of our assets for purposes of the PFIC determination may be determined by reference to the trading value of our ordinary shares, which could fluctuate significantly. In addition, it is possible that the Internal Revenue Service may take a contrary position with respect to our determination in any particular year, and therefore, there can be no assurance that we were not a PFIC for the year ended December 31, 2021 or will not be classified as a PFIC in the current taxable year or in the future. Certain adverse U.S. federal income tax consequences could apply to a United States Holder (as defined in Item 10.E. “Taxation—U.S. Federal Income Tax Consideration”) if we are treated as a PFIC for any taxable year during which such United States Holder holds our ordinary shares. United States Holders should consult their tax advisors about the potential application of the PFIC rules to their investment in our ordinary shares. For further discussion, see “Taxation—U.S. Federal Income Tax Consideration—Passive Foreign Investment Company” in Item 10.E. below.
If a United States person is treated as owning at least 10% of our ordinary shares, such holder may be subject to adverse U.S. federal income tax consequences.
If a United States person is treated as owning (directly, indirectly, or constructively) at least 10% of the value or voting power of our ordinary shares, such person may be treated as a “United States shareholder” with respect to each controlled foreign corporation (“CFC”) in our group (if any). Because our group includes a U.S. subsidiary, certain of our non-U.S. subsidiaries will be treated as CFCs (regardless of whether or not we are treated as a CFC). A United States shareholder of a CFC may be required to report annually and include in its U.S. taxable income its pro rata share of “Subpart F income,” “global intangible low-taxed income,” and investments in U.S. property by CFCs, regardless of whether we make any distributions. An individual that is a United States shareholder with respect to a CFC generally would not be allowed certain tax deductions or foreign tax credits that would be allowed to a United States shareholder that is a U.S. corporation. Failure to comply with these reporting obligations may subject a United States shareholder to significant monetary penalties and may prevent the statute of limitations with respect to such shareholder’s U.S. federal income tax return for the year for which reporting was due from starting. We cannot provide any assurances that we will assist investors in determining whether we are or any of our non-U.S. subsidiaries is treated as CFC or whether any investor is treated as a United States shareholder with respect to any such CFC or furnish to any United States shareholders information that may be necessary to comply with the aforementioned reporting and tax paying obligations. The United States Internal Revenue Service has provided limited guidance on situations in which investors may rely on publicly available information to comply with their reporting and tax paying obligations with respect to foreign-controlled CFCs. A United States investor should consult its advisors regarding the potential application of these rules to an investment in our ordinary shares.
Provisions of Israeli law and our amended and restated articles of association may delay, prevent or make undesirable an acquisition of all or a significant portion of our shares or assets.
Provisions of Israeli law and our amended and restated articles of association could have the effect of delaying or preventing a change in control and may make it more difficult for a third-party to acquire us or our shareholders to elect different individuals to our board of directors, even if doing so would be considered to be beneficial by some of our shareholders, and may limit the price that investors may be willing to pay in the future for our ordinary shares. Among other things:
| | • | | the Israeli Companies Law, 5759-1999 (the “Companies Law”) regulates mergers and requires that a tender offer be effected when more than a specified percentage of shares in a company are purchased; |
| | • | | the Companies Law requires special approvals for certain transactions involving directors, officers or significant shareholders and regulates other matters that may be relevant to these types of transactions; |
| | • | | the Companies Law does not provide for shareholder action by written consent for public companies, thereby requiring all shareholder actions to be taken at a general meeting of shareholders; |
| | • | | our amended and restated articles of association divide our directors into three classes, each of which is elected once every three years; |
| | • | | our amended and restated articles of association generally require a vote of the holders of a majority of our outstanding ordinary shares entitled to vote present and voting on the matter at a general meeting of shareholders (referred to as simple majority), and the amendment of a limited number of provisions, such as the provision dividing our directors into three classes, requires a vote of the holders of at least 70% of our voting power; |
| | • | | our amended and restated articles of association restrict us, subject to certain exceptions, from engaging in certain business combination transactions, with any shareholder who holds 20% or more of our voting power. The transactions subject to such restrictions include mergers, consolidations and dispositions of our assets with a market value of 10% or more of our assets or outstanding shares. Subject to certain exceptions, such restrictions will apply for a period of three years following each time a shareholder became the holder of 20% or more of our voting power; |
| | • | | our amended and restated articles of association do not permit a director to be removed except by a vote of the holders of at least 70% of our voting power; and |
| | • | | our amended and restated articles of association provide that director vacancies may be filled by our board of directors. |
Further, Israeli tax considerations may make potential transactions undesirable to us or to some of our shareholders whose country of residence does not have a tax treaty with Israel granting tax relief to such shareholders from Israeli tax. For example, Israeli tax law does not recognize tax-free share exchanges to the same extent as U.S. tax law. With respect to mergers, Israeli tax law allows for tax deferral in certain circumstances but makes the deferral contingent on the fulfillment of numerous conditions, including a holding period of two years from the date of the transaction during which certain sales and dispositions of shares of the participating companies are restricted. Moreover, with respect to certain share swap transactions, the tax deferral is limited in time, and when such time expires, the tax becomes payable even if no disposition of the shares has occurred.
We do not expect to pay any dividends in the foreseeable future.
We have never declared or paid any dividends on our ordinary shares. We do not anticipate paying any dividends in the foreseeable future. We currently intend to retain future earnings, if any, to finance operations and expand our business. Consequently, investors who purchase our ordinary shares may be unable to realize a gain on their investment except by selling sell such shares after price appreciation, which may never occur.
Our board of directors has sole discretion whether to pay dividends. If our board of directors decides to pay dividends, the form, frequency and amount will depend upon our future operations and earnings, capital requirements and surplus, general financial condition, contractual restrictions and other factors that our directors may deem relevant. The Companies Law imposes restrictions on our ability to declare and pay dividends.
Payment of dividends may also be subject to Israeli withholding taxes. See “Taxation” in Item 10.E below for additional information.
We continue to incur increased costs as a result of operating as a public company, and our management is required to devote substantial time to new compliance initiatives and corporate governance practices.
As a public company, and particularly after we are no longer an emerging growth company, we will continue to incur significant legal, accounting and other expenses that we did not incur as a private company. The Sarbanes-Oxley Act, the Dodd-Frank Wall Street Reform and Consumer Protection Act, the listing requirements of Nasdaq and other applicable securities rules and regulations impose various requirements on public companies, including establishment and maintenance of effective disclosure and financial controls and corporate governance practices. Our management and other personnel will continue to devote a substantial amount of time to these compliance initiatives. Moreover, these rules and regulations will continue to increase our legal and financial compliance costs and will make some activities more time-consuming and costly. For example, we expect that these rules and regulations may make it more difficult and more expensive for us to obtain director and officer liability insurance, and could also make it more difficult for us to attract and retain qualified members of our board.
We continue to evaluate these rules and regulations and cannot predict or estimate the amount of additional costs we may continue to incur or the timing of such costs. These rules and regulations are often subject to varying interpretations, in many cases due to their lack of specificity, and, as a result, their application in practice may evolve over time as new guidance is provided by regulatory and governing bodies. This could result in continuing uncertainty regarding compliance matters and higher costs necessitated by ongoing revisions to disclosure and governance practices.
Our amended and restated articles of association provide that unless we consent to an alternate forum, the federal district courts of the United States shall be the exclusive forum of resolution of any claims arising under the Securities Act which may impose additional litigation costs on our shareholders.
Our amended and restated articles of association provide that the federal district courts of the United States shall be the exclusive forum for the resolution of any claims arising under the Securities Act, the Exchange Act or the rules and regulations promulgated pursuant to such statutes. Notwithstanding the foregoing, we note that holders of our securities cannot waive compliance with the federal securities laws and the rules and regulations thereunder. Section 27 of the Exchange Act creates exclusive federal jurisdiction over all suits brought to enforce any duty or liability created by the Exchange Act or the rules and regulations thereunder, and Section 22 of the Securities Act creates concurrent jurisdiction for federal and state courts over all suits brought to enforce any duty or liability created by the Securities Act or the rules and regulations thereunder. As a result, the exclusive jurisdiction provision may not preclude or contract the scope of exclusive federal or concurrent jurisdiction for actions brought under the Securities Act or the Exchange Act, or the respective rules and regulations promulgated thereunder. While the Federal Forum Provision does not restrict the ability of our shareholders to bring claims under the Securities Act, nor does it affect the remedies available thereunder if such claims are successful, we recognize that it may limit shareholders ability to bring a claim in the judicial forum that they find favorable and may increase certain litigation costs which may discourage the filing of claims against the Company, its directors and officers.
If we were deemed to be an investment company under the Investment Company Act of 1940, as amended (the “1940 Act”), applicable restrictions could make it impractical for us to continue our business as contemplated and could have a material adverse effect on our business, financial condition and results of operations.
Under Sections 3(a)(1)(A) and (C) of the 1940 Act, a company generally will be deemed to be an “investment company” for purposes of the 1940 Act if (1) it is, or holds itself out as being, engaged primarily, or proposes to engage primarily, in the business of investing, reinvesting or trading in securities or (2) it engages, or proposes to engage, in the business of investing, reinvesting, owning, holding or trading in securities and it owns or proposes to acquire investment securities having a value exceeding 40% of the value of its total assets (exclusive of U.S. government securities and cash items) on an unconsolidated basis. We do not believe that we are an “investment company,” as such term is defined in either of those sections of the 1940 Act.
Notwithstanding Sections 3(a)(1)(A) and (C) of the 1940 Act, we are a research and development company and comply with the safe harbor requirements of Rule 3a-8 of the 1940 Act. We intend to conduct our operations so that we will not be deemed an investment company. However, if we were to be deemed an investment company, restrictions imposed by the 1940 Act, including limitations on our capital structure and our ability to transact with affiliates, could make it impractical for us to continue our business as contemplated and could have a material adverse effect on our business, financial condition and results of operations.
Risks Relating to Our Incorporation and Location in Israel
Conditions in Israel could materially and adversely affect our business.
Many of our employees, including certain management members operate from our offices that are located in Petah Tikva, Israel. In addition, a number of our officers and directors are residents of Israel. Accordingly, political, economic, and military conditions in Israel and the surrounding region may directly affect our business and operations. In recent years, Israel has been engaged in sporadic armed conflicts with Hamas, an Islamist terrorist group that controls the Gaza Strip, with Hezbollah, an Islamist terrorist group that controls large portions of southern Lebanon, and with Iranian-backed military forces in Syria. In addition, Iran has threatened to attack Israel and may be developing nuclear weapons. Some of these hostilities were accompanied by missiles being fired from the Gaza Strip against civilian targets in various parts of Israel, including areas in which our employees and some of our consultants are located, and negatively affected business conditions in Israel. Any hostilities involving Israel or the interruption or curtailment of trade between Israel and its trading partners could adversely affect our operations and results of operations.
Our commercial insurance does not cover losses that may occur as a result of events associated with war and terrorism. Although the Israeli government currently covers the reinstatement value of direct damages that are caused by terrorist attacks or acts of war, we cannot assure you that this government coverage will be maintained or that it will sufficiently cover our potential damages. Any losses or damages incurred by us could have a material adverse effect on our business. Any armed conflicts or political instability in the region would likely negatively affect business conditions and could harm our results of operations.
Further, in the past, the State of Israel and Israeli companies have been subjected to economic boycotts. Several countries still restrict business with the State of Israel and with Israeli companies. These restrictive laws and policies may have an adverse impact on our operating results, financial condition or the expansion of our business. A campaign of boycotts, divestment and sanctions has been undertaken against Israel, which could also adversely impact our business.
In addition, many Israeli citizens are obligated to perform several days, and in some cases more, of annual military reserve duty each year until they reach the age of 40 (or older, for reservists who are military officers or who have certain occupations) and, in the event of a military conflict, may be called to active duty. In response to increases in terrorist activity, there have been periods of significant call-ups of military reservists. It is possible that there will be military reserve duty call-ups in the future. Our operations could be disrupted by such call-ups, which may include the call-up of members of our management. Such disruption could materially adversely affect our business, prospects, financial condition and results of operations.
Competition for skilled technical and other personnel in Israel is intense, and as a result we may fail to attract, recruit, retain and develop qualified employees, which could materially and adversely impact our business, financial condition and results of operations.
We compete in a market marked by rapidly changing technologies and an evolving competitive landscape. In order for us to successfully compete and grow, we must attract, recruit, retain and develop personnel with requisite qualifications to provide expertise across the entire spectrum of our intellectual capital and business needs.
Our principal research and development as well as significant elements of our general and administrative activities are conducted at our headquarters in Israel, and we face significant competition for suitably skilled employees in Israel. While there has been intense competition for qualified human resources in the Israeli high-tech industry historically, the industry experienced record growth and activity in 2021, both at the earlier stages of venture capital and growth equity financings, and at the exit stage of initial public offerings and mergers and acquisitions. This flurry of growth and activity has caused a sharp increase in job openings in both Israeli high-tech companies and Israeli research and development centers of foreign companies, and intensification of competition between these employers to attract qualified employees in Israel. As a result, the high-tech industry in Israel has experienced significant levels of employee attrition and is currently facing a severe shortage of skilled human capital, including engineering, research and development, sales and customer support personnel. Many of the companies with which we compete for qualified personnel have greater resources than we do, and we may not succeed in recruiting additional experienced or professional personnel, retaining personnel or effectively replacing current personnel who may depart with qualified or effective successors. Failure to retain or attract qualified personnel could have a material adverse effect on our business, financial condition and results of operations.
It may be difficult to enforce a U.S. judgment against us, our officers and directors named in this Annual Report in Israel or the United States, or to assert U.S. securities laws claims in Israel or serve process on our officers and directors.
Not all of our directors or officers are residents of the United States and most of their and our assets are located outside the United States. Service of process upon us or our non-U.S. resident directors and officers and enforcement of judgments obtained in the United States against us or our non-U.S. our directors and executive officers may be difficult to obtain within the United States. We have been informed by our legal counsel in Israel that it may be difficult to assert claims under U.S. securities laws in original actions instituted in Israel or obtain a judgment based on the civil liability provisions of U.S. federal securities laws. Israeli courts may refuse to hear a claim based on a violation of U.S. securities laws against us or our non-U.S. officers and directors because Israel may not be the most appropriate forum to bring such a claim. In addition, even if an Israeli court agrees to hear a claim, it may determine that Israeli law and not U.S. law is applicable to the claim. If U.S. law is found to be applicable, the content of applicable U.S. law must be proved as a fact, which can be a time-consuming and costly process. Certain matters of procedure will also be governed by Israeli law. There is little binding case law in Israel addressing the matters described above. Israeli courts might not enforce judgments rendered outside Israel, which may make it difficult to collect on judgments rendered against us or our non-U.S. officers and directors.
Moreover, an Israeli court will not enforce a non-Israeli judgment if it was given in a state whose laws do not provide for the enforcement of judgments of Israeli courts (subject to exceptional cases), if its enforcement is likely to prejudice the sovereignty or security of the State of Israel, if it was obtained by fraud or in the absence of due process, if it is at variance with another valid judgment that was given in the same matter between the same parties, or if a suit in the same matter between the same parties was pending before a court or tribunal in Israel at the time the foreign action was brought.
Your rights and responsibilities as our shareholder will be governed by Israeli law, which may differ in some respects from the rights and responsibilities of shareholders of U.S. corporations.
We are incorporated under Israeli law. The rights and responsibilities of holders of our ordinary shares are governed by our amended and restated articles of association and the Companies Law. These rights and responsibilities differ in some respects from the rights and responsibilities of shareholders in typical U.S. corporations. In particular, pursuant to the Companies Law each shareholder of an Israeli company has to act in good faith and in a customary manner in exercising his, her or its rights and fulfilling his, her or its obligations toward the Company and other shareholders and to refrain from abusing his, her or its power in the Company, including, among other things, in voting at the general meeting of shareholders, on amendments to a company’s articles of association, increases in a company’s authorized share capital, mergers and certain transactions requiring shareholders’ approval under the Companies Law. In addition, a controlling shareholder of an Israeli company or a shareholder who knows that it possesses the power to determine the outcome of a shareholder vote or who has the power to appoint or prevent the appointment of a director or officer in the Company, or has other powers toward the Company has a duty of fairness toward the Company. However, Israeli law does not define the substance of this duty of fairness. There is little case law available to assist in understanding the implications of these provisions that govern shareholder behavior.
Our amended and restated articles of association provide that unless the Company consents otherwise, the competent courts of Tel Aviv, Israel shall be the sole and exclusive forum for substantially all disputes between the Company and its shareholders under the Companies Law and the Israeli Securities Law, which could limit its shareholders ability to brings claims and proceedings against, as well as obtain favorable judicial forum for disputes with the Company, its directors, officers and other employees.
The competent courts of Tel Aviv, Israel shall be the exclusive forum for (i) any derivative action or proceeding brought on behalf of the Company, (ii) any action asserting a claim of breach of fiduciary duty owed by any director, officer or other employee of the Company to the Company or the Company’s shareholders, or (iii) any action asserting a claim arising pursuant to any provision of the Companies Law or the Israeli Securities Law. This exclusive forum provisions is intended to apply to claims arising under Israeli Law and would not apply to claims brought pursuant to the Securities Act or the Exchange Act or any other claim for which federal courts would have exclusive jurisdiction. Such exclusive forum provision in our amended and restated articles of association will not relieve the Company of its duties to comply with federal securities laws and the rules and regulations thereunder, and shareholders of the Company will not be deemed to have waived the Company’s compliance with these laws, rules and regulations. This exclusive forum provision may limit a shareholders ability to bring a claim in a judicial forum of its choosing for disputes with the Company or its directors or other employees which may discourage lawsuits against the Company, its directors, officers and employees.
Item 4. Information on the Company
| A. | History and Development of the Company |
Global-E Online Ltd. was incorporated on February 21, 2013 under the Companies Law, or the Companies Law, in the State of Israel and commenced operations at that time. Our commercial name is Global-e. Our principal executive offices are located at 25 Basel Street, Petah Tikva 4951038, Israel. We expect to relocate our principal executive offices during 2022 to a new facility under a long-term lease in Petah Tikva. Our website address is www.global-e.com and our telephone number is +972-73-2605078. Information contained on, or that can be accessed through, our website does not constitute a part of this Annual Report and is not incorporated by reference herein. We have included our website address in this Annual Report solely for informational purposes. The SEC maintains an Internet site that contains reports, proxy and information statements, and other information regarding issuers, such as we, that file electronically, with the SEC at www.sec.gov.
We completed the initial public offering of our ordinary shares in the United States in May 2021.
In September 2021, an underwritten secondary follow-on offering of 12,000,000 of our ordinary shares held by certain selling shareholders was consummated and an additional 1,800,000 ordinary shares were sold by such shareholders pursuant to the exercise of an option granted to the underwriters by the selling shareholders. We did not receive any proceeds from the sale of our ordinary shares by the selling shareholders.
On November 24, 2021, we entered into an agreement to acquire Flow through the statutory merger of Flow with Global-e NewCo Inc., our wholly owned indirect subsidiary, with Flow as the surviving corporation and our wholly owned subsidiary. The Flow Merger closed on January 3, 2022 and is expected to strengthen our offering and capabilities, to allow us access to additional addressable market of emerging brands not currently eligible to use our services. The acquisition was for an aggregate purchase price of up to approximately $500 million (in equal portions of cash and our ordinary shares), comprised of a base consideration of approximately $425 million and up to approximately $75 million in potential additional consideration based on certain financial results in 2021. The agreement also contains customary representations, warranties, covenants and indemnification provisions.
For a description of our principal capital expenditures and divestitures, see Item 5. “Operating and Financial Review and Prospects.”
We have built the world’s leading platform to enable and accelerate global, direct-to-consumer (“D2C”) cross-border e-commerce.
Our platform was purpose-built for international shoppers to buy seamlessly online and for merchants to sell from, and to, anywhere in the world – in short, to “go global.” At the same time, to “be local” reflects the localization of the shopper’s experience and our effort to make international transactions as seamless as domestic ones.
We increase the conversion of international traffic into sales by removing much of the complexity associated with international e-commerce. Our platform provides a mission-critical, integrated solution that creates a localized and frictionless shopper experience and is simple to manage, flexible to adjust and smart in its local market insights and best practices. The vast capabilities of our end-to-end platform include interaction with shoppers in their native languages, market-adjusted pricing, payment options tailored to local market preferences, compliance with local consumer regulations and requirements such as customs duties and taxes, shipping services, after-sales support and returns management. These elements are unified under the Global-e platform to enhance the shopper experience and enable merchants to capture the cross-border opportunity.
We operate at the forefront of global e-commerce, which is being transformed by technology, internet adoption and the rise of social networks connecting the world. Shopper buying habits are rapidly shifting online, as shoppers expect to be able to purchase any product online – from anywhere in the world. Trends and consumer tastes are becoming increasingly global, driving the expansion of cross-border e-commerce, but the preference remains for an intuitive online shopping experience that feels local. In parallel, the rapid growth in e-commerce has created an opportunity for merchants to build and strengthen a direct relationship with the shopper. Solutions that enable D2C sales have become a strategic priority for brands and retailers as they seek to take advantage of these e-commerce trends, gaining ownership and knowledge of their international shoppers.
Our comprehensive platform creates differentiated benefits for both shoppers and merchants. Shoppers seek competitive, localized and transparent pricing, a seamless and secure order and delivery process, and a painless returns and refunding process. We address these needs through a fully localized experience that removes many of the barriers shoppers face when purchasing from merchants internationally. We integrate with, and enhance the online stores of merchants and localize the shoppers’ experience based on the country from which they shop. We support local messaging in over 30 languages, purchases in more than 100 currencies by over 150 payment methods and a multitude of shipping options. Shoppers enjoy a fully-guaranteed landed price quote, which includes shipping costs, import duties and tax charges, as well as post-sale services, including multi-lingual customer service and a managed returns service. The enhanced shopper experience we enable typically results in improved sales conversion of our merchants’ international traffic, thereby increasing their cross-border revenues. We have seen merchants experience significant uplift (often exceeding 60%) in international traffic conversion after beginning to use our platform.
For merchants, our platform also removes much of the complexity that is associated with cross-border e-commerce. Sales are reconciled and paid for locally and in the currency of the merchant’s domicile. We handle import duties calculation and collection, foreign sales tax remittance as well as tax recovery for returned goods in line with market regulations. We also displace certain fraud and foreign exchange risks that would otherwise be borne by merchants. We allow merchants to expand and scale their cross-border operations rapidly and efficiently, enabling a quick go-to-market with limited investment. As of December 31, 2021, we had more than 650 merchants on our platform across diversified verticals and ranging from small, emerging brands to globally-recognized retailers.
The scale and sophistication of our platform rely on the data and insights we’ve accumulated since our founding more than eight years ago. We refer to the application of our data as “Smart Insights” – country-, price- point- and vertical-specific lessons learned about shopper behavior. These insights are expanded every time a potential shopper enters a merchant’s online store – which occurs hundreds of millions of times each year – allowing us to gather additional data points along the purchasing journey. We believe that by leveraging our Smart Insights, merchants can provide highly-optimized experiences for shoppers on a per-market, per-vertical and per-price point basis, driving increased sales conversion and revenues. By providing a superior and seamless shopper experience and empowering merchants to capture the global e-commerce opportunity, we believe that we drive more transactions and thereby accumulate more data, which in turn increases the quality and depth of our Smart Insights. This creates strong flywheel effects that further power our business and that of merchants.
The merchants’ success is our success, and we aspire to become their trusted partner for international sales. The better the outcomes for the merchants and the more revenue and growth they achieve, the greater our own revenue and growth. We believe this alignment of interests with the merchants is core to our long-term success. This is evidenced by our Gross Dollar Retention Rate, which has typically been over 98% since 2018, and our Net Dollar Retention Rate, which has typically been over 140% during the same period. In 2021 our Gross Dollar Retention rate continued to track at over 98% and our Net Dollar Retention Rate was 152%. These retention rates demonstrate both the strong retention we enjoy among our existing merchants and the strong growth of GMV from merchants that use our platform.
Since launching our platform in 2013, our business has experienced rapid growth. Our GMV amounted to $382 million, $774 million and $1,449 million in 2019, 2020 and 2021, respectively, representing an increase of 103% and 87% in the years ended December 31, 2020 and 2021, respectively. Our revenues were $65.9 million, $136.4 million and $245.3 million in the years ended December 31, 2019, 2020 and 2021, respectively, representing an increase of 107.1% and 79.9% in the years ended December 31, 2020, and 2021 respectively. Our operating efficiency and growing economies of scale have allowed our gross profit growth rates to outpace those of our revenue growth. Our gross profit increased by 133% and 110% in the years ended December 31, 2020 and 2021. Our gross margin has steadily improved from 28.3% in 2019 to 31.9% in 2020, and to 37.3% in 2021. Our Adjusted EBITDA has grown from $(4.6) million in 2019 to $12.6 million in 2020 and $32.4 million in the year ended December 31, 2021.
We strive to make international sales as simple as domestic ones for our merchants, while also ensuring their shoppers enjoy an intuitive and frictionless shopper journey, making both shoppers and merchants “abroad-agnostic”. We believe that our scalable platform enables our merchants to capture the large and growing cross-border e-commerce market. As of December 31, 2021, we served over 650 merchants across over 15 countries, mainly in the United States, the United Kingdom, France, and other Western European markets; overall, we sell to shoppers in over 200 destination markets worldwide. Forrester expects that by 2023, the cross-border e-commerce market will reach $736 billion. For the year ended December 31, 2020 and 2021, our merchants’ transactions on our platform amounted to a GMV of $774 million and $1,449 million, respectively. We believe that the share of e-commerce merchants that have a meaningful cross-border footprint is limited, thus presenting a significant opportunity for further growth. We believe we have the potential to become an industry-defining player that enables merchants to capture the cross-border e-commerce opportunity.
Global-e is a leader in cross-border e-commerce enablement. We offer a full end-to-end platform built on a highly scalable technology stack. Our comprehensive solution provides merchants with mission-critical tools that enable them to sell and scale globally.
We believe our offering is a result of a potent combination of key components that will help further fuel the growth of cross-border e-commerce by:
Offering an intuitive and frictionless shopper journey
Through a combination of proprietary capabilities and useful third-party integrations, Global-e is able to create a localized and efficient experience for shoppers regardless of the country they are shopping from. Our platform is able to support:
| | • | | Language – localized marketing messaging and checkout in over 30 languages. |
| | • | | Pricing –support for more than 100 currencies as well as a sophisticated pricing engine customizable according to the shopper’s location, local market retail pricing conventions and the merchant’s pricing strategy. |
| | • | | Payments – over 150 payment methods, with new payment methods being continuously added. |
| | • | | Duties and taxes – the ability to accurately pre-calculate import duties and taxes and remit them in over 170 destination markets, simplifying the customs clearance process and allowing for a guaranteed landed price quote for both the shopper and the merchant. We also ensure we are addressing local market import restrictions. |
| | • | | Delivery – an extensive network of more than 20 shipping carriers, offering multiple shipping modes at attractive rates, including specialized shipping options such as Pick-Up & Drop-Off where applicable. We have found that shopper preferences for shipping modes and pricing vary significantly among markets, and are an important driver of conversion rates. |
| | • | | After-sale support and returns – multi-lingual shopper services and multiple returns options, including pre-paid and local returns in relevant markets. |
The combination of these extensive international capabilities embeds a highly-localized shopper journey into the framework of a merchant’s e-commerce store. This creates benefits for shoppers, who enjoy an efficient and familiar experience, while gaining direct access to the merchant’s full and original e-commerce website. Their positive experience allows us to significantly increase the conversion of our merchants’ international traffic and, consequently, their revenue.
Solving the merchants’ needs through our purpose-built end-to-end platform
Our platform includes mission-critical tools, from local pricing and payments capabilities to after-sales support. We also simplify the international order flow – regardless of shopper and merchant origin, currency and payment method used, whether duties and taxes were pre-paid and which shipping option was chosen – making it as simple to complete as a domestic order.
| | • | | Increased sales conversion: we enable the merchants to scale internationally in a rapid, efficient manner through our platform. We ensure that the merchants are able to capitalize on their valuable international shopper traffic and growth potential by eliminating friction to close the gap between international markets’ share of traffic and monetization. This enables the merchants to generate an uplift in sales from the conversion of their international shopper conversion. We have seen merchants experience significant uplift (often exceeding 60%) in international traffic conversion after beginning to use our platform. |
| | • | | Enabling expansion flexibility: Global-e presents merchants with flexibility to expand where and when they want to, as they seek to capture the cross-border opportunity. We transform what otherwise would have required significant time and financial investments in proprietary development and go-to-market efforts into an efficient expansion solution managed by adjusting mere configurations on the Global-e platform per market. |
| | • | | Reducing merchant complexity: Global-e assumes the role of merchant of record (“MoR”) vis-à-vis the shopper. We believe that taking on such responsibility significantly reduces legal complexity for the merchants, as we report and forward relevant import taxes and handle import compliance in the local market where a purchase is made, in line with specific market regulations. Our MoR status allows us to handle tax recovery for returned goods, with no hassle to the merchant. We bear certain fraud and foreign exchange risks that would otherwise be borne by the merchants and offer simple access to dozens of local payment methods, which further reduces potential frictions that could deter both merchants and shoppers from engaging in cross-border transactions. We also adapt our systems and operations on an ongoing basis to address the evolving regulatory landscape and technical backdrop. Vis-à-vis the merchant, we streamline order processing by periodically reconciling all international orders in bulk and in the merchant’s native currency. In short, we aim to provide an experience that is akin to a domestic transaction. |
| | • | | Emphasizing merchant branding: maintaining the direct shopper relationships is of strategic importance to the merchants, and we are deeply committed to preserving that connection. All throughout the process, the merchants preserve the integrity of the brand experience and enhance their brand equity. Our platform uses minimal Global-e branding – and only where required to do so – so shoppers primarily face the merchant’s existing storefront and brand experience. |
Combining our access to data and know-how to generate Smart Insights
We are well-positioned to provide insights to our merchants thanks to both the breadth and depth of the data we generate, on the basis of the significant international traffic on our merchants’ websites and the millions of transactions we facilitate on a yearly basis. For the year ended December 31, 2021, there were approximately 620 million visits across our merchants’ e-commerce sites, and we enabled approximately 7 million transactions across over 15 origin countries and over 200 destination markets. We gather extensive data along the entire value chain and lifecycle of an order – from the initial visit to the e-commerce store through the actual purchase, delivery and returns.
Our proprietary models use this wealth of information to generate curated and actionable Smart Insights for our merchants, advising them on how certain changes to their online value proposition would potentially affect shopper conversion rates. We also provide detailed business analytics on a market-per-market basis, leveraging our know-how, tools and data. Such Smart Insights enable the merchants to optimize their offering to the shoppers by location, alleviating the need for trial and error in order to assess customer preferences on a standalone basis.
Our holistic approach – coupling our localization capabilities and market know-how with our data driven Smart Insights – enables the merchants to unlock their potential for cross-border, D2C sales by means of a localized and optimized offering for each individual market, vertical and price segment.
Environmental, Social and Governance (ESG) Practices
In consultation with KPMG, an independent consulting firm, and with the support of our legal advisors, we have started to assess our ability to impact ESG practices in the value chain in which we are positioned. To that end, we have started to formulate a working plan to detect key areas of our own activities and potential collaboration opportunities with our value chain partners. We view our position in the e-commerce value chain, and our involvement in global distribution of consumer goods, as an opportunity to potentially impact certain ESG matters that are important to us and to our stakeholders. We believe that we are well-positioned to harness our relationship with other players in the value chain, such as carriers and merchants, to promote and scale their own ESG initiatives, especially those related to climate change and sustainability. We intend to follow the Sustainable Accounting Standards Board standards in assessing, developing and implementing our policies and procedures.
We serve a fast-growing and diverse portfolio of merchants around the globe
As of December 31, 2021, we had 657 merchants using our platform, up 48.6% from 442 merchants as of December 31, 2020 and 132.2% from 283 merchants as of December 31, 2019. During the year ended December 31, 2021, merchants using our platform made transactions at a total GMV of $1,449 million, up 87% from $774 million in the year ended December 31, 2020. The merchants we serve are highly diverse across:
| | • | | Multiple origin countries – we serve merchants from the United States, United Kingdom, multiple European markets and other markets globally. |
| | • | | Multiple product verticals – fashion and apparel, luxury, footwear, cosmetics, accessories, children’s fashion, watches and jewelry, sporting equipment, consumer electronics, toys and hobbies, automotive spare parts, and others. |
| | • | | Multiple product price points – ranging from everyday fashion retailers such as Forever 21 and Marks and Spencer, to ultra-high-end brands such as Hugo Boss, Cartier and Versace. |
| | • | | Multiple merchant sizes – from multi-billion dollar global high-street brands to niche small and medium businesses. |
| | • | | Multiple merchant types – from traditional bricks-and-mortar retailers who have been transitioning to the digital D2C realm to emerging digital-native brands. |
We believe that our large and highly diverse portfolio of merchants presents several key advantages:
| | • | | A rich, diverse and fast-growing data asset of international transactions, enabling us to produce Smart Insights. |
| | • | | Vertical-level as well as geographical expertise, yielding a competitive advantage when approaching prospective merchants as part of our sales process. |
| | • | | Strong network and word-of-mouth effects within specific verticals and/or geographies. |
| | • | | High business resilience due to steadily decreasing merchant concentration. |
| | • | | A certain level of built-in “natural currency hedge” as a result of our business activity being conducted in a large number of different base currencies. |
We have a highly efficient sales and go-to-market strategy
We establish partnerships with new merchants through several sales channels:
| | • | | Direct sales – We have a dedicated team of sales executives that use various data sources to screen, qualify, identify and directly approach prospective merchants. |
| | • | | Inbound and word-of-mouth – As our scale and the number of merchants we have in each individual market grows, so does our own brand equity. This leads to more inbound prospects as well as stronger word-of-mouth-based sales, whereby an existing Global-e merchant recommends our solution to other players in the market. |
| | • | | Channel partnerships – We have established mutually-beneficial strategic partnerships with a range of third parties, including leading e-commerce and technology platforms, shipping providers, third-party logistics providers, payment providers, system integrators and others. In the context of such relationships, our partners pass on leads to our sales teams and provide us with access to merchants. In 2021 we entered into the 2021 Shopify Agreement with Shopify to jointly cooperate in offering e-commerce cross-border solutions to Shopify merchants and in January 2022 we extended our partnership with Shopify and entered into the 2022 Shopify Agreement with Flow and Shopify, for the offering of certain natively integrated cross-border solutions for Shopify’s merchants, especially catering to small and emerging brands. |
Sale cycle length depends on several parameters, such as merchant size, vertical, and type of technical integration but takes between three weeks and six months. Once the sales cycle is completed, implementation periods vary, depending on technical complexity, level of granularity of the merchant’s intended international marketing proposition and operational complexity. Implementation projects for large merchants take approximately 12-16 weeks on average while implementation for small businesses take approximately three to six weeks depending on the client internal team engagement.
Our consistent historical performance yields high merchant satisfaction levels, as evident from our strong retention rates. Since 2018, our Net Dollar Retention Rate has typically been over 140%, and our Gross Dollar Retention Rate has typically been over 98%. High merchant retention, coupled with our reliance on multiple and robust sales channels, generates a highly efficient sales and marketing operation. For merchants acquired in the year ended December 31, 2020, our payback period, which measures the amount of time required to recover merchant acquisition costs in a given year from the merchants acquired in that year, based on the gross profit realized from such merchants in the following year, was less than six months.
Our Competitive Advantages
We believe that we have built a leading platform to address merchants’ cross-border e-commerce needs, creating a competitive advantage for our business. We believe our combination of capabilities and expertise uniquely positions us to cater to shoppers globally, driving significant uplifts in international sales conversion rates and revenue growth for our merchants, while also removing much of the complexity and many of the costs inherent to cross-border e-commerce.
Key elements of our competitive advantage include the following:
Purpose-built, end-to-end platform
We understand the challenges and the strategic objectives of our merchants engaging in cross-border e-commerce. We provide merchants with the capabilities required for effective cross-border D2C trade, using a potent combination of our proprietary technology and third-party providers. Our solution is easy to integrate, platform-agnostic, scalable and able to support merchants of all sizes from small, emerging brands to the world’s largest retailers. We aspire to be inclusive and far-reaching in scope. We thus enable our merchants to expand internationally effectively, and to do so much more efficiently than previously possible.
True global cross-border enabler at scale
We believe we are uniquely positioned to capture the cross-border e-commerce opportunity as a stand-out global, cross-border e-commerce enabler.
We believe we are the only player with truly global scale. We have an extensive footprint in North America, the United Kingdom and across the EU, and we are penetrating the Asia Pacific (“APAC”) region. We are diversified by vertical and end-market. Our wide-reaching scale enables us to provide a solution to merchants across the globe. This scale, coupled with strong brand recognition gained since inception, has allowed us to acquire some of the largest merchants in the world as customers.
Differentiated and growing data asset driving flywheel effects
The Global-e platform is based on more than a technical solution and associated capabilities. It is based on data-driven know-how. Data permeates every layer of the Global-e platform. Data drives how we make decisions, how we develop and improve our offering, and how we make the shopper experience efficient and intuitive. We refer to this as “Smart Insights”, which enjoy strong flywheel effects as we continue to grow at pace driven by:
| | • | | “Economies of scale” – Our platform facilitates millions of international transactions each year across hundreds of merchants, spread across multiple geographies, product verticals, price levels, and shopper demographics. We thus accumulate a vast and rich data set and are able to benefit from economies of scale. |
| | • | | “Economies of skill” – Our massive and fast-growing data is a key asset due to the “richness” of its content. Based on this data, and coupled with our operational experience accumulated over years, we are able to generate what we call economies of skill, which enable us to ensure that cross-border sales are optimized for the merchants on a market-by-market basis. |
| | • | | Flywheel Effects. Our rich data serves as the basis for a powerful flywheel effect: the uplift we generate for our merchants drives more sales and the ability for them to expand into new geographies, which in turn creates more data, which is then fed back into our systems in order to generate even better conversion rates and more uplift. This in turn drives increased sales for our merchants and attracts new merchants to our platform. Our data engine gets “smarter” with each new site visit, each merchant and each new shopper. |
Partner network fueling our differentiated go-to-market strategy
Our go-to-market strategy targets merchants that want to establish or expand their cross-border e-commerce business. The effectiveness, prominence and stickiness of our platform have enabled us to acquire many of our merchants organically, supplementing the efforts of our professional salesforce. Many of our new merchants are referrals from existing merchants, which serve as brand ambassadors for Global-e. In addition, our commerce enabler, marketing, payments, shipping and logistics and social media partners, which include global and regional players, act as a meaningful source of referrals and lead generation. Our ability to leverage these relationships is an important source of inbound interest. This is further complemented by our highly efficient sales and marketing efforts. Our salespeople and account managers build intimate relationships with our merchant partners and are crucial in further expanding our merchant network.
Robust business model with sticky customers
Global-e is a cross-border e-commerce enabler covering the entire shopper journey. Our platform is deeply integrated within merchants’ existing technology stack providing the core tools to power their day-to-day cross-border operations. As a result, we retain significant “stickiness” within our customer base. Not only do we retain our merchants – our merchants also grow with our platform, and we grow with them. Merchants process large and growing order volumes through our platform as we become increasingly integral to their daily business operations and as they realize the benefits of using the Global-e platform. An important component of our growth is our existing merchant base, which grows organically each year. Due to our consistently high retention rates, we have strong visibility into the subsequent year’s revenue by looking to our current merchants, in a given period. Attracting new merchants is also critical to the scale of our platform. We have developed a highly efficient marketing model. For the year ended December 31, 2020, our payback period, or the amount of time required to recover merchant acquisition costs in a given year from the merchants acquired in that year, based on the gross profit realized from such merchants in the following year, was less than six months. We continue to build our capabilities to further strengthen our model.
Founder-led management team
We are a founder-led management team with a strong corporate culture. We are privileged to be led by our founders, Amir Schlachet, Nir Debbi, and Shahar Tamari, who set the tone for our people:
| | • | | Customer-Obsessed: We are firm believers in putting our customers first in everything we do. This is a principal tenet of our business. We view the merchants as long-term partners and hold their satisfaction as our guiding principle. Our customer success teams have invaluable tools and data to support the merchants’ ongoing needs, as well as direct access to the senior leadership team, including our founders, to leverage on behalf of our merchant partners. |
| | • | | Initiative and innovation driven: Our goal is to enable merchants to break geographic boundaries and become globally successful businesses. As such, we invest millions in research and development each year, track trends in the e-commerce world across geographies and constantly improve our product offering. Similarly, we encourage our employees to expand the scope of their defined roles, to take initiative, and to elevate Global-e to the next level – every employee can, and does make a difference. |
| | • | | Team-Focused: We are a team. We believe in collaboration, from our founding team that has been working together since our inception to our employees across all our offices worldwide. Our hiring decisions are based on attracting people whose values align with ours: creating real, meaningful and sustainable value for our merchants. |
Grow within our existing portfolio of merchants
The merchants’ success is our success. We help merchants both grow revenues in their existing markets as well as expand into additional ones. As our merchants’ cross-border sales generated through our platform grow, attributed either to improved conversion or by expanding their offering into additional geographies, our revenues grow in tandem. Thus, we increase the “stickiness” of our solutions and become increasingly integral to our merchants’ daily businesses as they realize the benefits of using the Global-e platform. We also have a strong track record of merchants acting as ambassadors for Global-e, referring us to other portfolio brands, as applicable, and more generally, to other potential merchants. We intend to continue deepening our relationships with existing merchants through service and performance of the highest quality, allowing them to continue to serve as our brand ambassadors within and outside their organizations.
Acquire new merchants within existing geographies and verticals
We have a significant opportunity to continue acquiring new merchants over time. Our merchant acquisition is highly efficient, leading to very attractive returns on marketing expense of less than six months. Further, we have proven the ability to rapidly integrate potential merchants with implementation cycles of 12 to 16 weeks on average, and as short as three weeks. We will continue to invest in our marketing and sales teams to enhance awareness of our solutions and to drive lead generation with our strategic partners. We see significant opportunities across multiple existing geographies and brand segments that we believe we are well-positioned to capture.
Expand into additional geographies, verticals and brand segments
We will seek to further expand our geographic footprint and boost our presence across merchant verticals, as well as brand segments. We believe that markets in the vicinity of regions where we already have a strong presence, in particular Europe and North America, and newer markets, such as APAC, are highly relevant for our business. As such, during 2021 we established an office in Tokyo, Japan, our first in the APAC region, and in Q1 of 2022 we recruited our first employee in Melbourne, Australia. In addition, during 2021 we have established strategic collaborations with Australia Post and transcosmos Japan through which we aim to accelerate our penetration into the Australian and Japanese markets.
While historically we have held a strong position in the mass market beauty and fashion segments, we have also achieved significant success with merchants in other segments, in particular, within the luxury segment, that we believe we can continue to capitalize on. As we continue to grow and expand into new geographies, through both new merchant acquisition and our existing portfolio of merchants expanding their offerings into additional geographies, we have the ability to reach new audiences in terms of sizes and verticals. Our growing brand recognition and know-how across our trading markets, enables us to acquire additional merchants more efficiently within current markets as well as new geographies.
The latest vertical we expanded our activity in is global consumer electronics brands. In order to provide the necessary level of support for these global brands, we have built new multi-local capabilities, allowing us to enable localized D2C sales for such brands while also enabling them to utilize their existing local infrastructure, inventory and fulfilment capabilities in multiple destination markets.
Additionally, we will seek to better support small and emerging merchants with a best-in-class solution, tailored to the needs of such merchants, with a lightweight integration effort and advanced self-service capabilities leveraging the robust API-based technology developed by Flow, which we acquired in January 2022. In addition to enhancing our offering for small and emerging merchants, the acquisition will also allow us to offer our solutions to an additional addressable market of small merchants by means of a white-labeled solution, marketed by channel partners, such as e-commerce platforms. We are already at work on implementing the first such white-label channel partnership agreement with Shopify.
Drive continuous innovation on our platform
We will continue to invest in research and development and operate with an agile approach to address our merchants’ and shoppers’ constantly-evolving needs. We will strive to continue developing new capabilities and add-on offerings, as well as opportunistically look to complement our existing platform and offering through M&A opportunities, to maintain Global-e’s position as a leading holistic platform for cross-border e-commerce, enabling efficient selling and purchasing processes for our stakeholders. For example, Global-e introduced to shoppers payment options such as the ability to pay with cash upon delivery of the ordered goods or to collect shipped items at the merchant’s local store, or ability to defer or split payments through third-party buy-now-pay-later solutions. In addition, we have developed the capabilities and infrastructure to support merchants’ multi-local fulfillment offering whereby select markets are serviced from locally-existing inventory, thereby giving the merchant better utilization of its stock and improving the customer offering. Our ability to provide preferred payment and delivery methods in select geographies, contributes to higher conversion rates of shoppers from these geographies.
We also believe that our differentiated data capabilities and constantly-improving data models will allow us to stay at the forefront of e-commerce solutions. We believe our unique, big data-driven Smart Insights enable us to help our merchants deliver more precise, targeted, localized shopper experiences driving conversion and revenues and also manage their operations more efficiently through our superior ability to forecast and predict trends. We believe that data will be a key driver of future optimization and shopper monetization.
Continue to develop and expand our strategic partnerships
We have established mutually beneficial strategic partnerships with a range of key players in the broader e-commerce ecosystem, including global technology groups, e-commerce platforms, shipping providers, third-party logistics providers, payment providers and system integrators. Our channel partners have been an important lead generation engine providing our sales team with a strong pipeline of prospective merchants. We intend to further strengthen our existing relationships, such as our partnership with Shopify which was recently expanded as part of our acquisition of Flow, and build new strategic partnerships with other key players across the value chain and in the different markets in which we operate.
Our end-to-end platform helps merchants remove cross-border e-commerce complexity by empowering merchants with powerful and extensive localization capabilities embedded directly within their websites. Our technology creates a highly-localized shopper experience, which in turn drives increased sales conversion and revenue growth.
The platform is built on a highly scalable tech stack which is powered by a robust layer of application programming interfaces (“APIs”) and data models, powering the shopper journey and allowing us to support a fast-growing and rapidly expanding merchant base.
Through a single, frictionless integration, the merchants’ websites can leverage the power of our platform. The integration technology, either through pre-fabricated e-commerce platform plug-ins, through the implementation of our API’s or through our generic script-based integration, which we refer to as Global-e Module, is based on a simple lightweight integration effort. Such integration effort ranges from a code snippet that is placed into a merchant’s existing online platform enabling us to deploy and integrate with minimal friction, to installation of our plug-ins and/or the implementation of a few of our API’s. After integration, shoppers continue to face the merchant’s existing storefront, and Global-e remains as a “white label” in the background
Shopping experience features
| | • | | Localized browsing – We offer localized browsing features, such as a configurable welcome message or a top-line marketing banner that can be customized by market and presented in the local language. Customization breeds familiarity, reducing bounce rates, increasing conversion and improving shopper confidence through a local shopping experience. |
| | • | | Local market pricing – We offer dynamic price translation to the shopper’s local currency based on market-specific business goals and in accordance with local pricing conventions (e.g. presenting prices in “dollar-ninety-nine” terms, such as $4.99 instead of $5.00, in relevant markets). Global-e offers support for payment in 100 global currencies, and we have found that more than 95% of shoppers choose to pay in their local currency when given the option. The below image shows examples of localized pricing in markets across the globe. |
| | • | | Localized checkout – Embedded within the brand’s e-commerce store, the Global-e checkout system supports over 30 different languages, enabling shoppers to switch the checkout language to their own native tongue for a more customized and local experience. We have found that in some markets, approximately 20% of shoppers choose to switch to their local language at checkout, even if their native language wasn’t supported during browsing. Further, shoppers checkout within the merchant website without being redirected to a third-party site. The below image shows an example of a language menu. |
| | • | | Guaranteed landed cost – We provide shoppers with a “no-surprises” and guaranteed fully-landed cost. We offer multiple options, configurable by market, for handling import duties and taxes. For example, shoppers may select the option to prepay duties and/or taxes at checkout. We have found that on average more than 80% of shoppers from developed markets choose to pre-pay when given such option, despite the fact that it requires payment of a higher price at checkout. Alternatively, our platform has the capability to already embed this cost into the product price within the browsing journey (in full or partially), in order to facilitate an intuitive and frictionless smooth and user-friendly shopper journey. We believe this feature and options are critical in achieving high conversion rates across markets and promoting repeat shoppers.
In addition to achieving shopper confidence, pre-collection of import duties and taxes enables orders to be dispatched to shoppers under a “Delivery Duties Paid” scheme through relevant shipping carriers. This serves to greatly simplify and streamline the process of releasing the goods from customs at the destination market, in turn contributing to a quicker and simpler delivery experience for the shopper.
|
| | • | | Multiple shipping options – Global-e’s platform allows merchants to choose from a menu of shipping options, offering shoppers multiple delivery alternatives, depending on the destination market: mail, express courier, Cash-on-Delivery, store delivery, drop point delivery and more. As part of its market-specific value proposition, merchants can decide which shipping methods to offer and how to price them, based on Global-e’s competitive shipping rates or through their own contracted shipping carriers. |
| | • | | Localized alternative payment methods – Preferred payment methods of shoppers differ from market to market. In some markets, such as the United States and United Kingdom, the use of global cards (Visa, MasterCard, etc.) is the most common payment method used. In others, local card, or universal alternative payment methods, such as PayPal, prevail. There are markets, both in developed and developing countries, where alternative payment methods are used more frequently than cards. For example, iDeal has the largest market share in the Netherlands; while the majority of online payments in China are carried out through AliPay, WeChatPay, and the UnionPay card scheme. In other countries, payment options such as Cash-On-Delivery or Buy-Now-Pay-Later are popular. |
In order to remove payment friction and ensure higher conversion rates, Global-e supports over 150 payment methods globally, granting shoppers in each market the ability to pay with their preferred local option.
| | • | | Real-time anti-fraud screening – Each order is scanned in real-time for potential payment fraud. Global-e utilizes advanced third-party screening services, coupled with proprietary algorithms and processes – all managed by a team of anti-fraud specialists. These capabilities enable Global-e to achieve high payment acceptance rates and low chargeback rates across international markets. The authorization/rejection decision is made in real time without the delays and costs associated with manual or semi-automatic transaction screening. This further contributes to a streamlined and satisfying shopper experience. |
| | • | | International customer services – Global-e operates a branded self-service and multi-lingual online customer service portal, which contains answers to many frequently-asked questions that are typically raised post-sale by international shoppers regarding their orders. In addition, Global-e operates a manned contact center that serves to augment the brand’s own customer services team. Global-e’s contact center can provide either “behind the scenes” support for the merchant’s customer services team, or it can be in touch directly with the brand’s shoppers to handle their queries. |
| | • | | Returns process – Global-e offers a comprehensive and efficient solution for product return management. Through Global-e’s proprietary branded and multi-lingual returns portal, shoppers are presented with multiple return options, according to the various returns services that the merchant enables for a given market. Returns options include self-postage, local return addresses, pre-paid postal labels and courier pick-ups. In addition, merchants set for each option an associated cost. Global-e deducts the return cost from the amount refunded to the shopper once merchants confirm successful receipt of the returned product. |
We support merchants of all sizes, and at various lifecycles, from small, emerging brands to the world’s globally-recognized retailers and high-end brands. Our platform offers a range of differentiated service levels, enabling us to cater to the different – and constantly evolving – needs of the merchants we serve.
Technology, infrastructure and operations
We have designed our platform with enterprise-grade security, reliability, and scalability as top priorities. Core contributors to our strengths in these areas include:
| | • | | Application architecture. We operate a proprietary and modern technology platform, organically developed by our in-house R&D teams over a period of seven years, leveraging leading third-party software where applicable. |
| | • | | Infrastructure. Our platform is deployed via market standard cloud computing infrastructure, allowing us to easily scale our platform globally while maintaining optimal performance. |
| | • | | Disaster Recovery. We maintain a secondary cloud-based data center, holding a full stack of updated applications, which is fully tested at least once a year, with the aim of ensuring the highest reliability for our shoppers. |
| | • | | Security. We employ a multi-layer security approach utilizing both cloud infrastructure security and endpoint protection to enforce the highest degree of security. We adhere with all major security standards, including: PCI/DSS, and GDPR. We perform penetration tests continuously throughout the year by external vendors to identify any vulnerabilities. |
| | • | | Uptime. Our platform maintains excellent service levels. Across all sites, our platform achieved over 99.9% average uptime for the year ended December 31, 2021. |
The market for cross-border e-commerce enablement solutions is competitive, rapidly-evolving, fragmented, and subject to changing regulation, technology, merchant preferences and shopper demands. Our solution and platform compete with other online and offline services, and other solutions. While among them exist several direct competing solutions, many of these solutions and services only handle a specific section of the cross-border e-commerce value chain.
As such, we believe that our existing direct competition fails to offer the same holistic solution based on our combination of global reach, end-to-end advanced feature set, number of merchant partners, accumulated data and insights, quality-of-service and local expertise as embedded in our platform. We are the chosen partner of some globally-recognized retailers and brands as well as some rapidly-growing emerging brands.
We consider the following categories of services and solutions to be our primary and direct competition:
| | • | | In-House D2C. Some merchants have built and managed international stores and prefer to maintain these operations in-house supported by third-party cross-border components. This DIY approach is expensive and complex to maintain, while also lacking the flexibility and know-how of local preferences that a specialized cross-border provider, such as Global-e, can provide. We believe that with the growing importance to merchants of cross-border D2C, coupled with market awareness of the advantages of using reputable and experienced cross border third parties, such as Global-e, the trend of shifting towards a third-party cross-border enabler will accelerate – with Global-e as the distinguished front runner. |
| | • | | Alternative, Cross-Border End-to-End Platforms. There are a limited number of cross-border platforms offering solutions similar in nature and breadth to those offered by Global-e. However, we believe that none of these providers have the combination of track record, variety of merchants, scale, feature set and data, to match Global-e’s overall offering. The level of sophistication embedded in our platform and solutions stemming from executing millions of transactions annually, across merchants in over 200 destination markets, is what makes us a leader in the world of cross-border ecommerce. |
Though to a lesser extent, we believe our platform also indirectly competes with two primary categories of services and providers:
| | • | | Legacy Players and Local Distributors. Merchants expanding abroad may partner with local distributors, granting them licenses to operate in a given market. Licenses typically include an arrangement to sell goods through bricks-and-mortar locations as well as digital rights to the brand, effectively allowing the local licensee to manage the full client-facing relationship with international shoppers. This may cause frustration among shoppers, as local selection may be limited to best-selling products, and interactions with the merchant are routed through a middle-man. As merchants increasingly understand the value of their digital channels and leverage social media to interact directly with shoppers, we believe wide-ranging agreements with local distributors will continue to become less common, especially for digital D2C e-commerce. Nevertheless, some merchants are constrained by long-term, legacy agreements with distributors, preventing the merchant from directly selling to and interacting with shoppers in select (or all) foreign markets, at least for a certain period of time. |
| | • | | Non-D2C Online Channels. Non-D2C online channels, such as marketplaces, represent digital alternatives to the traditional distributor model. Such online channels are varied, ranging from local, multi-local, regional and global platforms. They generate online traffic from shoppers by marketing under the marketplace’s own brand and command a fee, or “take rate” that may represent a meaningful percentage of the merchant’s revenue. To facilitate the transaction between shopper and seller, online channels may provide complimentary services such as payment acquiring, fraud protection, order management, and access to shipping providers. Merchants do not have direct access to shoppers; rather, they must list their products through the intermediary – i.e., the marketplace – to gain exposure. As such, by selling through non-D2C online channels, merchants often expose their brand to direct competition from other brands sold in parallel through such online channels (e.g. a common feature of marketplaces is “people who bought this also bought this” lists which may include different brands). |
Seasonality
See Item 5. “Operating and Financial Review and Prospects.”
Intellectual Property
We consider our intellectual property rights, including those in our know-how and the software code of our proprietary technology, to be, in the aggregate, material to our business. We rely on a combination of contractual commitments and statutory and common law rights to protect our intellectual property rights in our technology and know-how. We seek to control access to our trade secrets and other confidential information related to our proprietary technology by entering into confidentiality agreements with our employees, consultants, merchants, vendors and business partners who have access to our confidential information, and we maintain policies and procedures designed to control access to and distribution of our confidential information.
Our know-how is an important element of our business. The development and management of our platform requires sophisticated coordination among many skilled and specialized employees. Despite our efforts to protect our intellectual property rights in our technology and know-how, unauthorized parties may attempt to copy or obtain and use our technology to develop products and services with the same functionality as our platform. Policing unauthorized access to and use of our technology is difficult. Our competition could also independently develop technologies like ours, and our intellectual property rights may not be broad enough for us to prevent our competition from selling products and services incorporating those technologies. For more information, see “Risk Factors—Risks Relating to our Business and Industry—If we fail to adequately maintain, protect or enforce our intellectual property rights, our competitive position could be impaired and we may lose valuable assets, generate reduced revenue, and incur costly litigation to protect our rights.”
We own and use unregistered common law marks and service marks on or in connection with our proprietary technology and related services. While most of the intellectual property we use is owned by us, we have obtained rights to use intellectual property of third parties through licenses and services agreements. Although we believe these licenses are sufficient for the operation of our business, these licenses typically limit our use of the third parties’ intellectual property to specific uses and for specific time periods.
From time to time, we may become involved in legal proceedings relating to intellectual property arising in the ordinary course of our business, including challenges to the validity of our intellectual property rights and claims of intellectual property infringement. For more information, see “Risk Factors—Risks Relating to our Business and Industry—We may incur costs to defend against, face liability for or be vulnerable to intellectual property infringement claims brought against us by others.” We are not presently and have never been a party to any such legal proceedings that, in the opinion of our management, would individually or taken together have a material adverse effect on our business, financial condition, results of operations or cash flows.
As with any company operating on the internet, we grapple with a growing number of local, national and international laws and regulations. These laws are often complex, sometimes contradict other laws, and are frequently evolving. Laws may be interpreted and enforced in different ways in various locations around the world, posing a significant challenge to our global business. This ambiguity includes laws and regulations possibly affecting our business, such as those related to data privacy and security, pricing, taxation, content regulation, intellectual property ownership and infringement, anti-money laundering, anti-corruption, product liability, consumer protection and export control. Changes to such laws and regulations could cause us or third-party partners on which we rely to incur additional costs and change our or their respective business practices in order to comply.
Data Protection and Privacy
We are subject to laws across several jurisdictions regarding privacy and protection of data, in particular, in Israel, the European Union, the United States and other jurisdictions. Data protection, privacy, cybersecurity, consumer protection, content regulation, and other laws and regulations can be very stringent and vary from jurisdiction to jurisdiction. These laws govern how companies collect, process, and share data, grant rights to data subjects, and require that companies implement specific information security controls to protect certain types of information.
For example, we are subject to Israel’s Privacy Protection Act, 5741-1981 (the “Privacy Protection Act”), and the more recent Privacy Protection Regulations (Data Security) 2017, which imposes obligations on how personal data is processed, maintained, transferred, disclosed, accessed and secured. The regulations may require us to adjust our data protection and data security practices, information security measures, certain organizational procedures, applicable positions (such as an information security manager) and other technical and organizational security measures. In addition, to the extent that any administrative supervision procedure is initiated by the Israeli Privacy Protection Authority that reveals certain irregularities with respect to our compliance with the Privacy Protection Act, in addition to our exposure to administrative fines, civil claims (including class actions) and in certain cases criminal liability, we may also need to take certain remedial actions to rectify such irregularities, which may increase our costs.
For further information on the laws regarding privacy and data protection which we are subject to, see “Risk Factors—Risks Relating to our Business and Industry—We are subject to stringent and changing laws, regulations, standards and contractual obligations related to privacy, data protection, and data security. Our actual or perceived failure to comply with such obligations could harm our business.”
While it is generally the laws of the jurisdiction in which a business is located that apply, there is a risk that data protection regulators of other countries may seek jurisdiction over our activities in locations in which we process data or serve merchants or shoppers but do not have an operating entity. Where the local data protection and privacy laws of a jurisdiction apply, we may be required to register our operations in that jurisdiction or make changes to our business so that shopper data is only collected and processed in accordance with applicable local law. In addition, because our services are accessible worldwide, certain foreign jurisdictions may claim that we are required to comply with their privacy and data protection laws, including in jurisdictions where we have no local entity, employees or infrastructure. In such cases, we may require additional legal review and resources to ensure compliance with any applicable privacy or data protection laws and regulations. In addition, in many jurisdictions there may in the future be new legislation that may affect our business and require additional legal review.
We are subject to laws and regulations related to payments which are complex and vary across different jurisdictions. We are also subject to payment card association operating rules, certification requirements, and rules governing electronic funds transfers, including the PCI DSS, which could change or be reinterpreted to make it more difficult for us to comply. Any failure to comply with these rules or requirements may subject us to higher transaction fees, fines, penalties, damages, and civil liability, and may result in the loss of our ability to accept credit and debit card payments. Depending on how our platform evolves, we may be subject to additional laws in other jurisdictions across the world.
Anti-Corruption and Sanctions
We are subject to laws and regulations of the jurisdictions in which we operate, including the United States, United Kingdom, EU and Israel, that govern or restrict our business and activities in certain countries and with certain persons, including the economic sanctions regulations administered by the U.S. Treasury Department’s Office of Foreign Assets Control, and the export control laws administered by the U.S. Commerce Department’s Bureau of Industry and Security and the U.S. State Department’s Directorate of Defense Trade Controls. See “Risk Factors—Risks Relating to our Business and Industry—We are subject to governmental export controls that may subject us to liability if we are not in full compliance with applicable economic sanctions and export control laws.”
Additionally, we are subject to anti-corruption, anti-bribery, anti-money laundering and similar laws, such as the FCPA, U.S. domestic bribery statute contained in 18 U.S.C. 201, U.S. Travel Act, the USA PATRIOT Act, the U.K. Bribery Act 2010, Chapter 9 (sub-chapter 5) of the Israeli Penal Law, 1977, the Israeli Prohibition on Money Laundering Law–2000 and other applicable laws in the jurisdictions in which we operate. Historically, technology companies have been the target of FCPA and other anti-corruption investigations and penalties. See “Risk Factors—Risks Relating to our Business and Industry—We are subject to anti-corruption, anti-bribery, anti-money laundering and similar laws, and non-compliance with such laws can subject us to criminal penalties or significant fines and harm our business and reputation.”
Further, we are currently subject to a variety of laws and regulations related specifically to payment processing, including those governing cross-border and domestic money transmission, gift cards and other prepaid access instruments, electronic funds transfers, foreign exchange, counter-terrorist financing, banking and import and export restrictions.
Concern about the use of e-commerce platforms for illegal conduct, such as money laundering or to support terrorist activities, may in the future result in legislation or other governmental action that could require changes to our platform or impose additional compliance burdens and costs on us. See “Risk Factors—Risks Related to our Business and Industry—Changes in laws and regulations related to the internet or changes in the internet infrastructure itself may diminish the demand for our platform and services, and could harm our business.”
Depending on how our platform evolves, we may become subject to additional laws in the United States, the United Kingdom, the EU, Israel and elsewhere.
| C. | Organizational Structure |
The following illustrates our corporate structure as of the date of this Annual Report. All ownership is 100%.
| • | Global-e online Pte Ltd (Singapore) |
| • | Globale UK Limited (England) |
| • | Crossborder Global Apparel and Equipment Trading L.L.C (UAE) |
| • | Global-e Middle East FZCO Dubai Branch (UAE, Jebel Ali Free Zone) |
| • | Global-e Middle East FZCO (DAFZA) (UAE, Dubai Airport Free Zone) |
| • | E Commerce Globale Middle East FZCO (UAE, Dubai Commercity Free Zone) |
| • | Global-e Canada e-commerce Ltd. (Canada) |
| • | Global-e CH AG (Switzerland) |
| • | Global-e NL B.V (Netherlands) |
| • | Global-e Japan KK (Japan) |
| • | Global-e France SAS (France) |
| • | Olami E-Commerce Solutions Ireland Limited (Ireland) |
| • | Global-e Australia Pty Ltd. (Australia) |
| • | Global-e Spain S.L (Spain) |
| • | Global-e HK Limited (Hong Kong) |
| • | Global-e (Beijing) Technology Co., Ltd. (China) |
| • | Global-e US Inc. (Delaware, USA). |
| • | Global-e Panama Inc. (Panama, Colon Free Zone) |
| • | Global-e Solutions Ltd. (Israel) |
| • | Global-e South Africa (PTY) Ltd. (South Africa) |
| • | Flow Commerce Inc. (Delaware, USA) |
| • | Flow Commerce Limited (Ireland) |
| • | Flow Commerce Australia Pty Ltd. (Australia) |
| • | Flow Commerce Canada Inc. (Canada) |
| • | Flow Trading Shanghai Company Limited (China) |
| • | Flow Commerce UK LTD (England) |
| D. | Property, Plants and Equipment |
We are headquartered in Petah-Tikva, Israel, where we occupy approximately 17,425 square feet of office space pursuant to a lease that expires on September 30, 2023. On August 1, 2021, we entered into a new lease for office space in Petah-Tikva, Israel, for a total of 73,948 square feet, which office space will replace our existing office in Petah-Tikva and which we expect to move into in the upcoming months. We currently lease additional office space in Israel, the UK and the U.S., and we are party to agreements whereby we have access to and the right to use certain office space in the U.S., France and Japan. We do not own any real property. We intend to procure additional space as we continue to add employees, expand geographically and expand our work spaces. We believe that our facilities are adequate to meet our needs for the immediate future, and that, should it be needed, suitable additional space will be available to accommodate any such expansion of our operations.
Item 4A. Unresolved Staff Comments
None.
Item 5. Operating and Financial Review and Prospects
You should read the following discussion together with “Selected Consolidated Financial Data” and the consolidated financial statements and related notes included elsewhere in this Annual Report. This discussion contains forward-looking statements regarding industry outlook and our expectations regarding our future performance, liquidity and capital resources, as well as other non-historical statements. These forward-looking statements are subject to numerous risks and uncertainties, including, but not limited to, the risks and uncertainties described in “Risk Factors” and “Special Note Regarding Forward-Looking Statements.” Our actual results may differ materially from those contained in or implied by any forward-looking statements.
We have built the world’s leading platform to enable and accelerate global, direct-to-consumer cross-border e-commerce.
Our platform was purpose-built for international shoppers to buy seamlessly online and for merchants to sell from, and to, anywhere in the world – in short, to “go global.” At the same time, to “be local” reflects the localization of the shopper’s experience and our efforts to make international transactions as seamless as domestic ones.
We increase the conversion of international traffic into sales by removing much of the complexity associated with international e-commerce. Our platform provides a mission-critical, integrated solution that creates a localized and frictionless shopper experience and is simple to manage, flexible to adjust and smart in its local market insights and best practices. The vast capabilities of our end-to-end platform include interaction with shoppers in their native languages, market-adjusted pricing, payment options tailored to local market preferences, compliance with local consumer regulations and requirements such as customs duties and taxes, shipping services, after-sales support and returns management. These elements are unified under the Global-e platform to enhance the shopper experience and enable merchants to capture the cross-border opportunity.
We operate at the forefront of global e-commerce, which is being transformed by technology, internet adoption and the rise of social networks connecting the world. Shopper buying habits are shifting online and shoppers expect to be able to purchase any product online – from anywhere in the world. Trends and consumer tastes are becoming increasingly global, driving the expansion of cross-border e-commerce, but the preference remains for an intuitive online shopping experience that feels local. In parallel, the rapid growth in e-commerce has created an opportunity for merchants to build and strengthen a direct consumer relationship with the shopper. Solutions that enable D2C sales have become a strategic priority for brands and retailers as they seek to take advantage of these e-commerce trends, gaining ownership and knowledge of their international shoppers.
Our comprehensive platform creates differentiated benefits for both shoppers and merchants. Shoppers seek competitive, localized and transparent pricing, a seamless and secure order and delivery process, and a painless returns and refunding process. We address these needs through a fully localized experience that removes many of the barriers shoppers face when purchasing from merchants internationally. We integrate with, and enhance the online stores of merchants and localize the shoppers’ experience based on the country from which they shop. We support local messaging in over 30 languages, purchases in more than 100 currencies by over 150 payment methods and a multitude of shipping options. Shoppers enjoy a fully-guaranteed landed price quote, which includes shipping costs, import duties and tax charges, as well as post-sale services, including multi-lingual customer service and a managed returns service. The enhanced shopper experience we enable typically results in improved sales conversion of our merchants’ international traffic, thereby increasing their cross-border revenues. We have seen merchants experience significant uplift (often exceeding 60%) in international traffic conversion after beginning to use our platform.
For merchants, our platform also removes much of the complexity that is associated with cross-border e-commerce. Sales are reconciled and paid for locally and in the merchant’s native currency. We handle import duties calculation and collection, foreign sales tax remittance as well as tax recovery for returned goods in line with market regulations. We also displace certain fraud and foreign exchange risks that would otherwise be borne by merchants. We allow merchants to expand and scale their cross-border operations rapidly and efficiently, enabling a quick go-to-market with limited investment. As of December 31, 2021, we had more than 650 merchants on our platform across diversified verticals and ranging from small emerging brands to globally-recognized retailers.
The scale and sophistication of our platform rely on the data and insights we have accumulated since our founding more than eight years ago. We refer to the application of our data as “Smart Insights” – country-, price-point- and vertical-specific lessons learned about shopper behavior. These insights are expanded every time a potential shopper enters a merchants’ online store – which occurs hundreds of millions of times each year – allowing us to gather additional data points along the purchasing journey. We believe that by leveraging our Smart Insights, merchants can provide highly-optimized experiences for shoppers on a per-market, per-vertical and per-price point basis, driving increased sales conversion and revenues. By providing a superior and seamless shopper experience and empowering merchants to capture the global e-commerce opportunity, we believe that we drive more transactions and thereby accumulate more data, which in turn increases the quality and depth of our Smart Insights. This creates strong flywheel effects that further power our business and that of our merchants.
The merchants’ success is our success, and we aspire to become their trusted partner for international sales. The better the outcomes for merchants and the more revenue and growth they achieve, the greater our own revenue and growth. We believe this alignment of interests with merchants is core to our long-term success. This is evidenced by our Gross Dollar Retention Rate, which has typically been over 98% since 2018, and our Net Dollar Retention Rate, which has typically been over 140% during the same period.
Since our launch in 2013, we have achieved several key business, operational, and financial milestones:
We have an attractive volume-based revenue model, driven by shopper order activity on our merchants’ websites. As a result, our revenues, which are generated from the fees charged for the use of our integrated platform solution and provision of fulfillment services, are correlated with the level of GMV (as defined under “—Key Performance Indicators and Other Operating Metrics”) that flows through our platform. We offer a fully integrated platform solution to merchants, and derive revenues by charging fees that vary depending on the transaction volume processed, outbound countries and destination markets, level of customer service provided and shipping options, among other variables.
Service fees revenue is generated as a percentage of the GMV that flows through our platform. Fulfillment services revenue is generated through our offerings of shipping and handling. We mandatorily bundle components of our integrated platform solution that we believe are essential to achieving improved sales conversion of our merchants’ international traffic. Our fulfillment services are offered on an optional basis, and thus merchants may choose to utilize or cease utilizing our fulfillment services, either in whole or for select markets, at any time and from time to time. Many merchants use our fulfillment services alongside our integrated platform solution due to convenience and competitive pricing achieved due to our economies of scale, while some merchants choose to use our integrated platform solution on a standalone basis. Service fees revenue generated from the use of our integrated platform solution on a standalone basis has increased over time, equaling $1.0 million (or 4.3% of service fees revenue), $2.6 million (or 5.2% of service fees revenue) and $8.4 million (or 8.7% of service fee revenues) for the years ended December 31, 2019, 2020 and 2021, respectively.
Over and above the revenues generated, we view shopper traffic and GMV as critical to our success because they generate valuable data, further fueling our Smart Insights. These data-driven insights are an integral part of the integrated solutions we provide to our merchants and a key driver in the growth of their cross-border revenue. During the year ended December 31, 2021 shoppers that visited e-commerce websites powered by our platform generated 7.0 million orders which translated to $245.3 million of revenue.
An important component of our revenue growth is the retention and expansion of our existing merchant base. Our revenue model is driven by the ability to retain and grow our business with existing merchants and attract new merchants from new geographies, segments and verticals. Revenue from our existing merchant base has grown significantly over time as our merchants’ cross-border revenues have grown, the volume of transactions that our merchants process through our platform has increased and we have expanded to additional geographic corridors. The revenue growth from our existing merchants that continue to process transactions on our platform has historically exceeded any lost revenue from merchants that discontinued their use of our platform. We measure the revenue growth from our existing merchant base using Net Dollar Retention Rate, and we measure the lost revenue from merchants that discontinue their use of our platform using Gross Dollar Retention Rate.
We aim to sign contracts with merchants for a minimum term of 12 months and with a minimum committed monthly volume. The vast majority of our merchants choose to stay on our platform beyond the initial term and trade at larger volumes than the contractually agreed minimum. The chart below demonstrates the GMV for each annual merchant cohort from 2016 to 2021. Each annual merchant cohort is comprised of merchants that completed their first shopper transaction on our platform during the corresponding year (except for the 2016 cohort which includes GMV from merchants that have onboarded our platform from inception through and including 2016). For example, the 2020 merchant cohort includes all merchants that completed their first shopper transaction on our platform between January 1, 2020 and December 31, 2020. Our GMV from these merchants grew 218% for the year ended December 31, 2021 relative to our GMV from these same merchants for the year ended December 31, 2020.
Our existing merchant base is critical to our success, generating approximately 85% and 81% of our GMV in the year ended December 31, 2020 and 2021, respectively. Our Net Dollar Retention Rate for the years ended December 31, 2020 and 2021 was 172% and 152%, respectively. Our high Net Dollar Retention Rate is driven both by strong retention and by the growth of our merchants’ transaction volumes processed on our platform. We believe this highlights the mission-critical nature of our platform for merchants that continue to grow with us over time.
As of December 31, 2021, we had a diversified base of 657 merchants, up 48.6% from 442 merchants and up 132.2% from 283 merchants as of December 31, 2020 and December 31, 2019, respectively. These merchants range from globally-recognized retailers to small, emerging brands located across 15 countries. Our largest merchant represented approximately 15% and 10% of total GMV for the years ended December 31, 2020 and 2021, respectively. Such merchant generated 18% and 13% of our total revenues for the years ended December 31, 2020 and 2021, respectively, while our top ten merchants represented 37% and 31% of our total revenues for the years ended December 31, 2020 and 2021, respectively. We expect the percentage of our revenue represented by our largest merchant to continue decreasing in future years as our existing merchants continue to grow and we onboard additional merchants.
Our significant scale and growth mean we also enjoy increasing geographic diversification in terms of both “outbound” sales, which term refers to sales from the merchant’s country of origin, and “destination market” sales, which term refers to sales made to shoppers in various markets. The United Kingdom has historically been our largest outbound market. However, outbound sales from the United Kingdom as a percentage of total revenue have been decreasing over time as we developed additional outbound markets, namely the United States and the EU. For the year ended December 31, 2021, the United Kingdom represented 47% of our revenues, with North America, the EU, and Israel representing 29%, 23% and 0.4%, respectively. While we expect our outbound sales from the United Kingdom to continue growing in absolute terms, we expect that outbound sales from the United Kingdom as a percentage of total revenue will continue to decrease in future periods. We expect to continue attracting new merchants in geographies outside of the United Kingdom, including countries in which we have existing operations as well as new markets. For example, we are beginning to establish a presence in the Asia-Pacific (“APAC”) region, which we believe represents a significant opportunity. Of the 657 merchants served by our platform as of December 31, 2021, 47.9% were located in the United Kingdom, while 35.6% and 14.9% were located in North America and Europe, respectively, and 1.5% were located in other geographies. With regards to the destination markets from which shoppers make purchases through our platform, the United States, the largest destination market, represented 16% and 13% of our total revenue for the year ended December 31, 2020 and 2021, respectively, Australia represented 11% of our total revenue for the year ended December 31, 2021 and no other destination market represented more than 10% of our total revenue for either period.
In addition to retaining and growing our existing merchant base, we are able to efficiently acquire new merchants. We have developed an effective go-to-market strategy leveraging a dedicated team of sales executives. We also plan to continue leveraging our mutually-beneficial channel partnerships, which broaden our merchant base and generate significant leads for our sales team. For example, we entered into the Shopify Agreements to jointly cooperate in offering e-commerce cross-border solutions to Shopify merchants. As our scale grows, so does our own brand equity, which leads to more inbound prospects as well as stronger word-of-mouth-based sales whereby an existing Global-e merchant recommends our solution to other players in the market. We view our ability to efficiently acquire merchants at scale as a differentiated competitive advantage. We measure the efficiency of our merchant acquisition strategy by tracking payback period, or the amount of time required to recover merchant acquisition costs in a given year from the merchants acquired in that year, based on the gross profit realized from such merchants in the following year. For merchants acquired in the year ended December 31, 2020, our payback period was less than six months.
Key Performance Indicators and Other Operating Metrics
Key Performance Indicators
We review the following indicators to measure our performance, identify trends affecting our business, formulate business plans, and make strategic decisions. Increases or decreases in our key performance indicators may not correspond with increases or decreases in our revenue.
The following table summarizes the key performance indicators that we use to evaluate our business for the years ended December 31, 2019, 2020 and 2021.
| | | Year Ended December 31, | |
| ($ in millions) | | 2019 | | | 2020 | | | 2021 | |
| Gross Merchandise Value | | $ | 382 | | | $ | 774 | | | $ | 1,449 | |
| Net Dollar Retention Rate | | | 134 | % | | | 172 | % | | | 152 | % |
| Revenue | | $ | 65.9 | | | $ | 136.4 | | | $ | 245.3 | |
| Gross Profit | | $ | 18.7 | | | $ | 43.5 | | | $ | 91.4 | |
| Gross Profit as % of Revenue | | | 28.3 | % | | | 31.9 | % | | | 37.3 | % |
| Adjusted EBITDA | | $ | (4.6 | ) | | $ | 12.6 | | | $ | 32.4 | |
| Adjusted EBITDA as % of Revenue | | | (6.9 | )% | | | 9.2 | % | | | 13.2 | % |
Gross Merchandise Value. We derive the substantial part of our revenue from fees we charge for the use of our integrated platform solution and fulfillment services. These fees are generally correlated with the total value of transactions processed through our platform. We assess the growth in transaction volume using a metric we refer to as Gross Merchandise Value (“GMV”) which is defined as the combined amount we collect from the shopper and the merchant for all components of a given transaction, including products, duties and taxes and shipping. GMV does not represent revenue earned by us; however, the GMV processed through our platform is an indicator of the volume of cross-border transactions processed through our platform by our merchants.
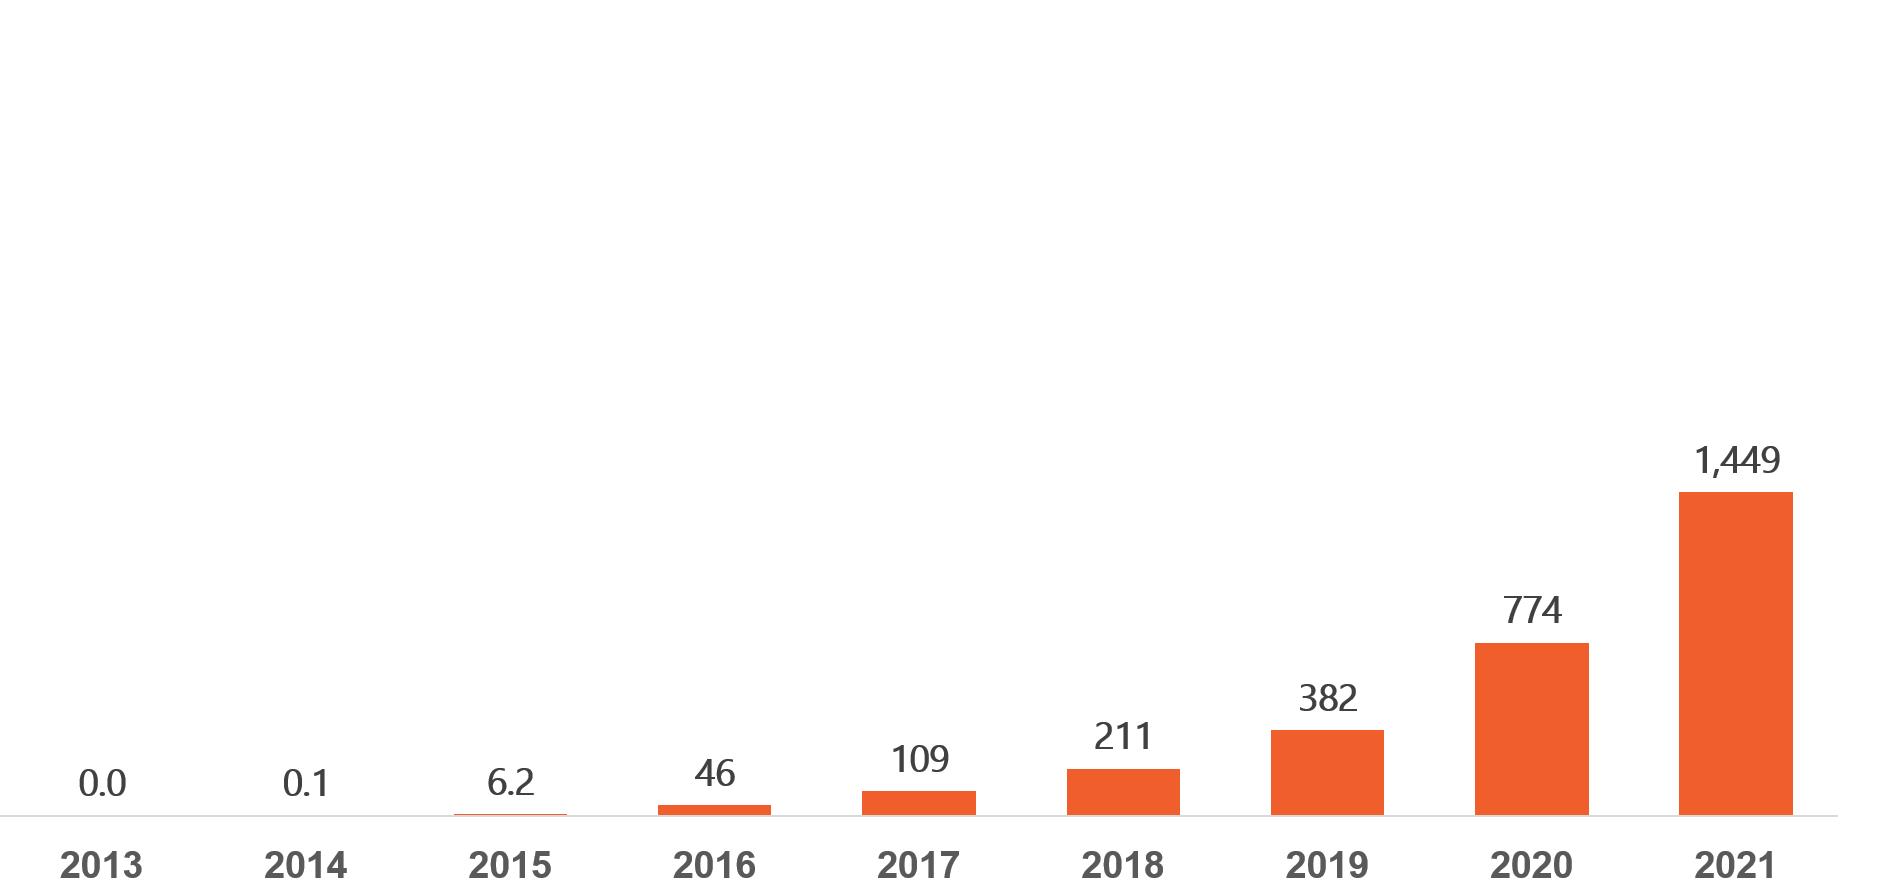
Net Dollar Retention Rate. We assess our performance in retaining and expanding relationships with our existing merchant base using a metric we refer to as Net Dollar Retention Rate, which compares our GMV from the same set of merchants across comparable periods. We calculate Net Dollar Retention Rate for a given period as the GMV in that period divided by the GMV in the comparable period in the prior year, in each case, from merchants that processed transactions on our platform in the earlier of the two periods. Our Net Dollar Retention Rate therefore includes the effect on GMV of any merchant renewals, expansion, contraction and churn but excludes the effect of revenue from merchants that contributed to our GMV in the current period but not in the earlier period. A Net Dollar Retention Rate greater than 100% for a given period implies overall growth in GMV from merchants that were already processing transactions on our platform prior to that period.
Our Net Dollar Retention Rate has typically been over 140% since 2018, and for the years ended December 31, 2019, 2020 and 2021 was 134% 172% and 152%, respectively. Our Net Dollar Retention Rate may fluctuate in future periods due to a number of factors, including the expansion of our revenue base, the level of penetration within our merchant base, enhancements made to our existing platform and our ability to retain our existing merchant base.
Revenue. We generate revenues by charging merchants fees for the use of our end-to-end cross-border solution. Our revenues are correlated with the level of GMV that flows through our platform. We have experienced rapid revenue growth in recent years, growing 107.1% and 79.9% in the years ended December 31, 2020 and 2021, respectively.
Gross Profit and Gross Margin. Our cost of revenue consists primarily of costs associated with payment acquiring fees, shipping and logistic costs, and operational merchant support expenses, such as customer service. Our gross profit represents our revenue less our cost of revenue. In recent years, we have consistently increased our gross profit as a percentage of revenue, or our gross margin, mainly due to economies of scale resulting from growth in GMV and revenue, as well as efficiencies stemming from our optimization. For the years ended December 31, 2019, 2020 and 2021, our gross margin was 28.3%, 31.9% and 37.3%, respectively.
Adjusted EBITDA. Adjusted EBITDA is defined as operating profit (loss) adjusted for depreciation and amortization, stock-based compensation expense, offering related expenses and merger and acquisition expenses. Adjusted EBITDA is a non-GAAP financial metric. Our Adjusted EBITDA grew from $12.6 million for the year ended December 31, 2020 to $32.4 million for the year ended December 31, 2021. This increase was primarily driven by growth in revenues and gross margin, as well as operating leverage.
Gross Dollar Retention Rate. In addition to tracking our key performance indicators above, we also periodically measure our Gross Dollar Retention Rate to further assess our performance in retaining our existing customer base. Gross Dollar Retention Rate measures revenue lost from merchants that discontinue their use of our platform, but does not reflect the benefit of customer expansion, contraction or additions. Gross Dollar Retention Rate may therefore never exceed 100%. We believe our high gross retention rates demonstrate that we serve a vital role for our merchants, as the vast majority of our merchants continue to use our platform.
To calculate the Gross Dollar Retention Rate for a particular quarter, we first calculate the total seasonality adjusted annualized GMV for that quarter. We then calculate the value of GMV from any merchants who discontinued their use of our platform during that quarter, or churned, based on their total GMV from the four quarters preceding such quarter, which we refer to as churned GMV. We then divide (a) the churned GMV by (b) the total seasonality adjusted annualized GMV to calculate the percentage churn for that quarter. Gross Dollar Retention Rate for a particular year is calculated by aggregating the percentage churn of the four quarters within that year and subtracting the result from 100%.
Our Gross Dollar Retention Rate has consistently been over 98% since 2018.
Key Factors Affecting Our Performance
We believe our future performance will continue to depend on many factors, including the following:
| | • | | Continued Growth in Cross-Border E-commerce: We expect to benefit from significant tailwinds including growth in global e-commerce over time, the continued rise in the influence of social media on shopper spending habits worldwide, the increasing relevance of D2C, as well as increased cross-border e-commerce. The rise in complexity of cross-border trade, stemming from constantly-changing regulations and technology, serves as an additional tailwind by driving merchant demand for third-party solutions with the relevant expertise and infrastructure, such as Global-e. |
| | • | | Increasing Existing Merchant Retention and Expansion: We care deeply about the merchants we serve. Our commitment to their success, we believe, increases retention and likelihood of expanding their activity on our platform. Supporting our merchants begins with enhancing both the shopper and the merchant experience; as such, we focus our efforts on developing products and functionality to ease the complexity they face when engaging in cross-border e-commerce. We provide customer support services to their shoppers, take full responsibility for processing duties and taxes, employ dedicated teams to optimize their offering and increase their sales conversion and continue to take steps to boost retention. Our effectiveness in retaining and expanding our existing merchants’ sales is a critical component of our revenue growth and operating results. |
| | • | | New Merchant Acquisition: Our growth depends in part on our ability to attract new merchants and add their GMV to our platform. Over the past seven years, we have experienced substantial expansion in the number of merchants served by our platform, which totaled 657 and 442 as of December 31, 2021 and December 31, 2020, respectively. New merchant acquisition is a key to scaling our platform. We have historically achieved efficient payback periods driven by a combination of direct sales, inbound inquiries, word-of-mouth referrals and channel partnerships. Continuing to add merchants to our platform in an efficient manner is a key component of our ability to grow our revenues. As a result of the recently signed expansion of our partnership with Shopify, we expect that we will be able to accelerate the growth of our merchant base. |
| | • | | Successful Expansion to Additional Geographies: We believe our platform can compete successfully around the world, as it enables merchants, regardless of geography, to expand their market footprint to more shoppers by selling globally. In order to successfully acquire merchants across geographies, Global-e has local sales teams in the United States, the United Kingdom and the EU, and recently also Japan and Australia as part of our efforts to expand our business within the APAC region. We plan to add local sales support in further select international markets over time to support our growth. |
| | • | | Investing to Scale Our Platform and Merchant Base: We have made, and will continue to make, significant investments in our platform to retain and scale our merchant base and enhance their experiences. In the years ended December 31, 2019, 2020 and 2021, excluding stock based compensation, we spent $12.0 million (or 18.2% of revenue), $14.9 million (or 10.9% of revenue) and $25.6 million (or 10.4% of revenue), respectively, on research and development. These amounts represent year over year increases of 24.6% and 71.7% in the years ended December 31, 2020 and 2021, respectively. In the years ended December 31, 2019, 2020 and 2021, excluding the amortization of the Shopify warrants related asset and stock based compensation, we spent $4.6 million (or 6.9% of revenue), $9.4 million (or 6.9% of revenue) and $19.1 million (or 7.8% of revenue), respectively, on sales and marketing. These amounts represent year over year increases of 105.6% and 103.3% in the years ended December 31, 2020 and 2021, respectively. Overall research and development expenses were $12.0 million, $15.4 million and $29.8 million in the years ended December 31, 2019, 2020 and 2021, respectively. Overall sales and marketing expenses were $4.6 million, $9.8 million and $104.7 million in the years ended December 31, 2019, 2020 and 2021, respectively. We plan to continue to invest significantly in go-to-market and innovation to address the needs of merchants. We also plan to increase headcount. The resources we commit to, and the investments we make in, our platform are designed to retain and expand the sales of our merchants, expand into new geographies and acquire new merchants, fuel our “Smart Insights” data set and improve our operating results in the long term. |
| | • | | Revenue Seasonality: Our revenue is correlated with the level of GMV that our merchants generate through our platform. Our merchants typically process additional GMV each year in the fourth quarter, which includes Black Friday, Cyber Monday and the holiday season, driven by an uptick in e-commerce sales. As a result, we historically have generated higher revenues in the fourth quarter than in other quarters. In the years ended December 31, 2019, 2020 and 2021, fourth quarter GMV represented approximately 38%, 39% and 35%, respectively, of our total GMV. We believe that similar seasonality trends will affect our future quarterly performance. |
| | • | | Increased Efficiency from Economies of Scale: as our GMV scales, we can achieve margin expansion due to operating leverage. In addition, our larger size allows us to negotiate better terms with our suppliers allowing us to further optimize our cost base. As the number of merchants on our platform grows, we also generate increasing amounts of data which in turn enable smarter decisions and optimizations that further increase efficiency. |
| | • | | COVID-19: The global pandemic resulting from the spread of COVID-19 increased e-commerce volumes, a trend that we believe has had a positive impact on our business. Lockdown restrictions contributed to an increased shift of shoppers to online retail activity. In addition, store closures and social distancing requirements accelerated the transition of merchants to focusing on D2C e-commerce in general, and cross-border e-commerce in particular. Our platform remained active, with no material outages or service disruptions. We successfully navigated elevated global order volumes as well as the need to rapidly adapt to changing circumstances such as temporary closures due to lockdowns, demonstrating our platform’s resilience, flexibility and effectiveness during the period of global volatility. We expect e-commerce growth rates to normalize in the short-term, as physical stores re-open and social distance requirements ease. However, we continue to witness the accelerated transition of merchants to D2C e-commerce in general and cross-border e-commerce in particular, which we believe is a long-term direction due to the clear advantages of D2C. |
| | • | | Global macro-economics: Inflationary pressures and rising interest rates in key markets, coupled with potential impact of the belligerent situation in Ukraine may influence consumer sentiment and may have a negative effect on consumer spend. |
Components of Our Results of Operations
Revenue. Our revenue is comprised of service fees and fulfillment services fees.
Service fees revenue is generated as a percentage of the GMV that flows through our platform. Fulfillment services revenue is generated through the Company’s offerings of shipping and handling services. Revenue is recognized at the time the related performance obligation is satisfied by transferring the promised product or delivery of service. The amount of revenue recognized reflects the consideration that the Company expects to receive in exchange for these products or services.
Cost of revenue. Cost of revenue primarily consists of payment acquiring fees, fulfillment costs, including shipping and logistic costs, operational merchant support expenses, such as customer service, payroll and allocated overhead. Overhead is allocated to cost of revenue based on applicable headcount. We expect cost of revenue to increase in absolute dollars in future periods due to our expected expansion. The level and timing of all of these items could fluctuate and affect our cost of revenue in the future.
Gross profit and gross margin. Our gross profit and gross margin may fluctuate from period to period. Such fluctuations may be influenced by our revenue, including the seasonality of our revenues, changes in cost of goods sold, our continued investments in our platform, our expected expansion into additional geographies and the growth of our merchant base.
Research and development expenses. Research and development expenses include personnel-related expenses associated with development personnel responsible for the design, development and testing of Company products, other development-related expenses, including cost of development environments and tools, and allocated overhead. Research and development costs are expensed as incurred. We expect these costs to increase as we continue to hire new employees in order to support the growing scale and feature set of our platform. We believe continued investments in research and development are important to attain our strategic objectives and maintain our market leadership position. As such, we expect research and development costs to increase in absolute dollars, but this expense is expected to decrease as a percentage of total revenue.
Sales and marketing expenses. Sales and marketing expenses primarily consist of costs of our marketing and merchant success personnel, sales commissions, marketing activities, merchant acquisition costs and allocated overhead. Overhead is allocated to sales and marketing based on applicable headcount. We intend to continue to invest in our sales and marketing capabilities in the future to continue to increase our brand awareness and to grow our merchant base. We expect these costs to increase as we grow our business. Sales and marketing expense in absolute dollars and as a percentage of total revenue may fluctuate from period-to-period based on total revenue levels and the timing of our investments in our sales and marketing functions as these investments may vary in scope and scale over future periods. As a result of our entry into the Shopify Agreements and the related issuance of warrants to purchase ordinary shares to Shopify, we recognize a commercial agreement asset upon the vesting of the warrants, and we amortize such asset over time.
General and administrative expenses. General and administrative expenses primarily consist of costs of personnel-related expenses, including share-based compensation, associated primarily with our finance, legal, human resources and other operational and administrative functions, external professional services and allocated overhead. We expect that our general and administrative expenses will increase in absolute dollars for the foreseeable future as we increase the size of our general and administrative function to support the growth of our business, as well as to cover the additional cost and expenses associated with becoming a publicly listed company.
Financial expenses, net. Financial expenses, net primarily includes interest income (expense), currency conversion and other bank related fees and income and gains (losses) from foreign exchange fluctuations.
Income taxes. Income taxes consist primarily of income taxes related to the jurisdictions in which we conduct business. Our effective tax rate is affected by tax rates in jurisdictions and the relative amounts of income we earn in those jurisdictions, changes in the valuation of our deferred tax assets and liabilities, applicability of any valuation allowances, and changes in tax laws in jurisdictions in which we operate. Our net operating loss carry forwards for Israeli tax purposes amounted to approximately $103.8 million as of December 31, 2021.
We expect to realize net losses in future periods as a result of the significant increase in sales and marketing expenses in connection with the vesting of the warrants issued to Shopify.
The following tables set forth our results of operations in U.S. dollars and as a percentage of revenue for the periods indicated:
| | | Year Ended
December 31, | |
| | | 2019 | | | 2020 | | | 2021 | |
| (in thousands) | | | | | | | | | |
| Revenue | | $ | 65,852 | | | $ | 136,375 | | | $ | 245,274 | |
| Cost of revenue | | | 47,188 | | | | 92,902 | | | | 153,841 | |
| Gross profit | | | 18,664 | | | | 43,473 | | | | 91,433 | |
| Operating expenses: | | | | | | | | | | | | |
| Research and development | | | 12,034 | | | | 15,400 | | | | 29,761 | |
| Sales and marketing | | | 4,593 | | | | 9,838 | | | | 104,687 | |
| General and administrative | | | 6,988 | | | | 9,822 | | | | 22,643 | |
| Total operating expenses | | | 23,615 | | | | 35,060 | | | | 157,091 | |
| Operating profit (loss) | | | (4,951 | ) | | | 8,413 | | | | (65,658 | ) |
| Financial expenses, net | | | 2,559 | | | | 4,339 | | | | 8,570 | |
| Profit (loss) before income taxes | | | (7,510 | ) | | | 4,074 | | | | (74,228 | ) |
| Income taxes | | | 34 | | | | 160 | | | | 705 | |
| Net profit (loss) | | $ | (7,544 | ) | | $ | 3,914 | | | $ | (74,933 | ) |
| | | Year ended
December 31, | |
| | | 2019 | | | 2020 | | | 2021 | |
| (as a % of revenue) | | | | | | | | | |
| Revenue | | | 100.0 | % | | | 100.0 | % | | | 100 | % |
| Cost of revenue | | | 71.7 | | | | 68.1 | | | | 62.7 | |
| Gross profit | | | 28.3 | | | | 31.9 | | | | 37.3 | |
| Operating expenses: | | | | | | | | | | | | |
| Research and development | | | 18.3 | | | | 11.3 | | | | 12.1 | |
| Sales and marketing | | | 7.0 | | | | 7.2 | | | | 42.7 | |
| General and administrative | | | 10.6 | | | | 7.2 | | | | 9.2 | |
| Total operating expenses | | | 35.9 | | | | 25.7 | | | | 64.0 | |
| Operating profit (loss) | | | (7.5 | ) | | | 6.2 | | | | (26.7 | ) |
| Financial expenses, net | | | 3.9 | | | | 3.2 | | | | 3.5 | |
| Profit (loss) before income taxes | | | (11.4 | ) | | | 3.0 | | | | (30.3 | ) |
| Income taxes | | | 0.0 | | | | 0.1 | | | | 0.3 | |
| Net profit (loss) | | | (11.5 | )% | | | 2.9 | % | | | (30.6 | )% |
| Reconciliation to adjusted EBITDA |
| | | | | Year Ended December 31, | |
| | | | | 2019 | | | 2020 | | | 2021 | |
| | | | | | |
| Operating profit (loss) | | | (4,951 | )
| | | 8,413 | | | | (65,658 | )
|
| | 1 | | Stock-based compensation: | | | | | | | | | | | | |
| | | | Cost of revenue | | | 2 | | | | 10 | | | | 85 | |
| | | | Research and development | | | 79 | | | | 507 | | | | 4,192 | |
| | | | Selling and marketing | | | 22 | | | | 442 | | | | 1,287 | |
| | | | General and administrative | | | 118 | | | | 2,997 | | | | 6,437 | |
| | | | Total stock-based compensation | | | 221.00 | | | | 3,956 | | | | 12,001 | |
| | | | | | | | | | | | | | | | |
| | 2 | | Depreciation and amortization | | | 171 | | | | 235 | | | | 331 | |
| | | | | | | | | | | | | | | | |
| | 3 | | Secondary offering costs | | | - | | | | - | | | | 879 | |
| | | | | | | | | | | | | | | | |
| | 4 | | Commercial agreement asset amortization | | | - | | | | - | | | | 84,298 | |
| | | | | | | | | | | | | | | | |
| | 5 | | Merger and acquisition costs | | | - | | | | - | | | | 573 | |
| | | | | | | | | | | | | | | | |
| Adjusted EBITDA | | | (4,559 | )
| | | 12,604 | | | | 32,424 | |
Year ended December 31, 2021 compared to year ended December 31, 2020
Revenue. Revenue increased by $108.9 million, or 79.9%, to $245.3 million for the year ended December 31, 2021 from $136.4 million for the year ended December 31, 2020, consisting of increases in service fees revenue of $46.7 million, or 93.6%, to $96.7 million from $49.9 million, and fulfillment revenue of $62.2 million, or 71.9%, to $148.6 million from $86.4 million.
The increase in service fees revenue resulted primarily from growth of GMV from $774 million in the year ended December 31, 2020 to $1,449 million in the year ended December 31, 2021. GMV generated from existing merchants increased by $399 million, primarily attributable to growth in cross-border sales and an increase in the use of our platform to support additional inbound markets. In the year ended December 31, 2021, new merchants that onboarded our platform and generated GMV of $277 million. The increase in fulfilment revenue resulted primarily from an increase of transactions processed through our platform from approximately 4.6 million in 2020 to approximately 7.0 million in 2021, and was slightly offset by an increase in the number of merchants using our platform services on a standalone basis.
Cost of Revenue and Gross Profit Margin. Cost of revenue increased by $60.9 million, or 65.6%, to $153.8 million for the year ended December 31, 2021 from $92.9 million for the year ended December 31, 2020, consisting of increases in service fees costs of $11.0 million, or 71.5%, to $26.4 million from $15.4 million, and fulfillment costs of $50.0 million, or 64.4%, to $127.5 million from $77.5 million. The increase in service fees costs was primarily driven by the increased cost of serving the higher value of transactions processed through our platform, partially offset by optimization and cost reduction of service fees related costs. The increase in fulfilment costs was primarily driven by the growth in volume of transactions processed through our platform.
Research and Development Expenses. Research and development expenses increased by $14.4 million, or 93%, to $29.8 million for the year ended December 31, 2021 from $15.4 million for the year ended December 31, 2020. This increase was primarily attributable to an increase of $8.6 million in payroll and subcontractors fees, due to increased headcount of 119 to support the further development of our platform capabilities and $3.7 million in increased share-based compensation expense.
Sales and Marketing Expenses. Sales and marketing expenses increased by $94.8 million, or 964%, to $104.7 million for the year ended December 31, 2021 from $9.8 million for the year ended December 31, 2020. This increase was primarily driven by an amortization expense of $84.3 million related to the Shopify warrants and the expansion of our sales and marketing personnel to support our expansion efforts. Total headcount within sales and marketing increased by 36 from December 31, 2020 to December 31, 2021.
General and Administrative Expenses. General and administrative expenses increased by $12.8 million, or 131%, to $22.6 million for the year ended December 31, 2021 from $9.8 million for the year ended December 31, 2020. This increase was primarily driven by an increase in stock-based compensation expenses of $3.4 million, increase in public company related expenses, including an increase in D&O insurance expense of $2.6 million, increase in consulting services expenses of $3.1 million mainly due to secondary offering related expenses and merger & acquisition related expenses, and expansion of our general and administrative personnel. Total headcount within general and administrative increased by 19 from December 31, 2020 to December 31, 2021.
Financial Expenses, Net. Financial expenses, net increased by $4.2 million, or 98%, to $8.6 million for the year ended December 31, 2021 from $4.3 million for the year ended December 31,2020, primarily driven by revaluation of warrants to purchase convertible preferred shares of the Company.
Income Taxes. Income taxes increased by $545 thousand to $705 thousand for the year ended December 31, 2021 from $160 thousand for the year ended December 31, 2020, primarily driven by an increase in taxes on income.
Year Ended December 31, 2020 Compared to Year Ended December 31, 2019
Revenue. Revenue increased by $70.5 million, or 107.1%, to $136.4 million for the year ended December 31, 2020 from $65.9 million for the year ended December 31, 2019, consisting of increases in service fees revenue of $26.4 million, or 112%, to $49.9 million from $23.5 million, and fulfillment revenue of $44.1 million, or 104%, to $86.4 million from $42.4 million.
The increase in service fees revenue resulted primarily from growth of GMV from $382 million in the year ended December 31, 2019 to $774 million in the year ended December 31, 2020. GMV generated from existing merchants increased by $274 million, primarily attributable to growth in cross-border sales and an increase in the use of our platform to support additional inbound markets. In the year ended December 31, 2020, 204 new merchants were onboarded to our platform and generated GMV of $118 million in such period. The increase in fulfilment revenue resulted primarily from an increase of transactions processed through our platform from approximately 2.4 million in 2019 to approximately 4.6 million in 2020, and was slightly offset by an increase in the number of merchants using our platform services on a standalone basis.
Cost of Revenue and Gross Profit Margin. Cost of revenue increased by $45.7 million, or 96.9%, to $92.9 million for the year ended December 31, 2020 from $47.2 million for the year ended December 31, 2019, consisting of increases in service fees costs of $6.1 million, or 65%, to $15.4 million from $9.3 million, and fulfillment costs of $39.7 million, or 105%, to $77.5 million from $37.8 million. The increase in service fees costs was primarily driven by the increased cost of serving the higher value of transactions processed through our platform, partially offset by optimization and cost reduction of service fees related costs. The increase in fulfilment costs was primarily driven by the growth in volume of transactions processed through our platform.
Research and Development Expenses. Research and development expenses increased by $3.4 million, or 28.0%, to $15.4 million for the year ended December 31, 2020 from $12.0 million for the year ended December 31, 2019. This increase was primarily driven by the expansion of our research and development personnel and platform capacity to further develop our platform capabilities and support the growth of transaction volume. Total headcount within research and development expenses increased by 30 from December 31, 2019 to December 31, 2020.
Sales and Marketing Expenses. Sales and marketing expenses increased by $5.2 million, or 114.2%, to $9.8 million for the year ended December 31, 2020 from $4.6 million for the year ended December 31, 2019. This increase was primarily driven by expansion of our sales and marketing personnel to support our expansion efforts. Total headcount within sales and marketing increased by 23 from December 31, 2019 to December 31, 2020.
General and Administrative Expenses. General and administrative expenses increased by $2.8 million, or 40.6%, to $9.8 million for the year ended December 31, 2020 from $7.0 million for the year ended December 31, 2019. This increase was primarily driven by an increase in stock-based compensation expenses of $2.9 million, most of which were related to secondary transactions, expansion of our general and administrative personnel, as well as increased expense incurred in connection with supplementing our general and administrative function with third-party consultants. The increase in general and administrative expenses was partially offset by a reduction in travel and other expenses due to restrictions related to the COVID-19 pandemic. Total headcount within general and administrative increased by 3 from December 31, 2019 to December 31, 2020.
Financial Expenses, Net. Financial expenses, net increased by $1.8 million, or 70%, to $4.3 million for the year ended December 31, 2020 from $2.6 million for the year ended December 31, 2019, primarily driven by revaluation of warrants to purchase convertible preferred shares of the Company, offset by fluctuations in exchange rates and income generated from deposits and marketable securities.
Income Taxes. Income taxes increased by $126 thousand to $160 thousand for the year ended December 31, 2020 from $34 thousand for the year ended December 31, 2019, primarily driven by an increase in deferred tax liability.
| B. | Liquidity and Capital Resources |
Overview
Since our inception, we have financed our operations primarily through private placements of our equity securities. On May 14, 2021, we completed our initial public offering in which we sold 17,250,000 ordinary shares, which included 2,250,000 ordinary shares sold pursuant to the exercise by the underwriters of an over-allotment option to purchase additional shares, for proceeds of approximately $401.1 million, net of the underwriting discount and before deducting offering expenses. Our cash and cash equivalents, including short-term deposits and marketable securities, were $509 million as of December 31, 2021, prior to the closing of the Flow transaction.
Our primary requirement for liquidity and capital resources is to finance working capital and capital expenditures, and for general corporate purposes. We believe that our sources of liquidity and capital resources will be sufficient to meet our business needs for at least the next 12 months. Our future financing requirements will depend on many factors including our growth rate, levels of revenue, the expansion of sales and marketing activities, market acceptance of our platform, and the timing and extent of spending to support expansion of our platform.
The following table presents the summary consolidated cash flow information for the periods presented.
| | | Year ended
December 31, | |
| (in thousands) | | 2019 | | | 2020 | | | 2021 | |
| | | | | | | | | | |
| Net cash (used in) provided by operating activities | | $ | 7,028 | | | $ | 29,350 | | | $ | 15,748 | |
| Net cash used in investing activities | | | (452 | ) | | | (24,046 | ) | | | (40,489 | ) |
| Net cash provided by financing activities | | | 147 | | | | 59,360 | | | | 398,607 | |
Net cash provided by (used in) operating activities
Net cash provided by operating activities was $7 million for the year ended December 31, 2019, and was primarily comprised of net loss of $7.5 million and prepaid expenses and other assets of $3.9 million, offset by funds payable of $12.5 million, accounts payable of $4.1 million and accrued expenses and other liabilities of $4.2 million.
Net cash provided by operating activities was $29.3 million for the year ended December 31, 2020, and was primarily comprised of net profit of $3.9 million, funds payable of $12.9 million, accounts payable of $10.0 million and accrued expenses and other liabilities of $18.9 million, offset by prepaid expenses and other assets of $12.3 million and funds receivable of $11.8 million.
Net cash provided by operating activities was $15.7 million for the year ended December 31, 2021, and was primarily comprised of net loss of $74.9 million, commercial agreement asset amortization of $84.3 million, funds payable to customers of $23.1 million, accrued expenses and other liabilities of 17.9 million, offset by funds receivable of 29.3 million.
Net cash used in investing activities
Net cash used in investing activities was $0.5 million for the year ended December 31, 2019, and was primarily comprised of investments in property and equipment.
Net cash used in investing activities was $24.0 million for the year ended December 31, 2020, and was primarily comprised of marketable securities and short term investments.
Net cash used in investing activities was $40.5 million for the year ended December 31, 2021, and was primarily comprised of short-term investments of $117.2 million, offset by proceeds from short-term investments of $81.7 million.
Net cash provided by financing activities
Net cash provided by financing activities was $0.1 million for the year ended December 31, 2019, and was primarily comprised of proceeds derived from the exercise of share options.
Net cash provided by financing activities was $59.4 million for the year ended December 31, 2020, and was primarily comprised of proceeds of preferred equity financing.
Net cash provided by financing activities was $398.6 million for the year ended December 31, 2021, primarily comprised of proceeds from issuance of ordinary shares in connection with our initial public offering (“IPO”) of $396.5 million, net of issuance costs.
Off-Balance Sheet Arrangements
We have no material off-balance sheet arrangements.
Recently Issued Accounting Pronouncements
A description of recently issued accounting pronouncements that may potentially impact our financial position, results of operations or cash flows is disclosed in Note 2 to our audited consolidated financial statements included elsewhere in this Annual Report.
| C. | Research and Development, Patents and Licenses, Etc. |
Our research and development activities are primarily located in Israel. Research and development expenses include personnel-related expenses associated with development personnel responsible for the design, development and testing of Company products, other development-related expenses, including cost of development environments and tools, and allocated overhead.
For the years ended December 31, 2021, 2020, and 2019, research and development costs accounted for approximately 12.1%, 11.3%, and 18.3% of our total revenue, respectively. Research and development costs are expensed as incurred. We expect these costs to increase as we continue to hire new employees in order to support the growing scale and feature set of our platform.
We believe continued investments in research and development are important to attain our strategic objectives and maintain our market leadership position. As such, we expect research and development costs to increase in absolute dollars, but this expense is expected to decrease as a percentage of total revenue.
A number of industry trends are reshaping the business environment in which we operate, leading to what we believe is a unique opportunity. Key market dynamics include:
| | • | | Transformation of retail to be online-focused – While e-commerce may face some headwinds from the re-opening of physical stores, the retail market is undergoing a shift towards e-commerce, with growth in online sales overtime, outpacing that of traditional retail. |
| | • | | Rise of cross-border e-commerce – Cross-border e-commerce growth rates are outpacing domestic growth rates, propelled by the rise of social media and global influencers, resulting in globalization of consumer tastes and increased cross-border demand. |
| | • | | Emphasis on D2C sales – e-commerce enables a stronger model of D2C sales for traditional and new merchants, which paves a strategic route for merchants to take ownership of shopper relationships worldwide. |
| | • | | Difficulty in executing on a Do-It-Yourself (“DIY”) strategy – Managing a D2C cross-border network is capital-intensive, requires deep local know-how, and a complex combination of features and capabilities to navigate across markets, further exacerbated by local on-going regulatory changes. |
| | • | | Tailwinds from COVID-19 – The COVID-19 pandemic accelerated existing trends of shoppers moving online and merchants prioritizing digital channels; in general, these trends are expected to continue post-pandemic, although there may be some headwinds as physical stores re-open in key markets. |
| | | | |
| | • | | Supply chain evolution and disruption – Supply chains and in particular cross border supply chains are developing and enabling more efficient trade over time. The COVID-19 pandemic has disrupted supply chains and weighed on e-commerce trade, the impact was significantly less evident in D2C channels, as merchants prioritize D2C over other channels. |
| | | | |
| | • | | Global macro-economics – Inflationary pressures and rising interest rates in key markets, coupled with potential impact of the belligerent situation in Ukraine may influence consumer sentiment and may have a negative effect on consumer spend. |
Other than as disclosed above and elsewhere in this Annual Report, we are not aware of any other trends, uncertainties, demands, commitments or events since December 31, 2021 that are reasonably likely to have a material adverse effect on our revenues, income, profitability, liquidity or capital resources, or that would cause the disclosed financial information to be not necessarily indicative of future operating results or financial conditions.
For additional trend information, see the Risk Factors described in Item 3.D above, the “Overview” and “Operating Results” sections of this Item 5 - “Operating and Financial Review and Prospects” and Item 4 - “Information on the Company” above.
| E. | Critical Accounting Estimates |
We have provided a summary of our significant accounting policies, estimates and judgments in our consolidated financial statements, which are included elsewhere in this Annual Report. The following critical accounting discussion pertains to accounting policies management believes are most critical to the portrayal of our historical financial condition and results of operations and that require significant, difficult, subjective or complex judgments. Other companies in similar businesses may use different estimation policies and methodologies, which may impact the comparability of our financial condition, results of operations and cash flows to those of other companies.
Our consolidated financial statements have been prepared in accordance with GAAP. The preparation of these financial statements requires us to make estimates and assumptions that amounts reported in our consolidated financial statements and accompanying notes. Our estimates are based on our historical experience and on various other factors that we believe are reasonable under the circumstances. The Company is subject to uncertainties such as the impact of future events, economic and political factors, and changes in the Company’s business environment; therefore, actual results could differ from these estimates. Accordingly, the accounting estimates used in the preparation of the Company’s consolidated financial statements will change as new events occur, as more experience is acquired, as additional information is obtained, and as the Company’s operating environment evolves.
The Company’s revenues are comprised of:
| | 1. | Service Fees –The Company provides merchants a cross-border e-commerce platform which enables to sell their products to consumers worldwide. Revenue is generated as a percentage of the value of transactions that flow through the Company’s platform. |
| | 2. | Fulfillment services – The Company offers shipping, handling, and other global delivery services in order to deliver merchants’ goods to consumers. |
We recognize revenues in accordance with ASC No. 606 “Revenue from Contracts with Customers.” As such, we identify a contract with a customer, identify the performance obligations in the contract, determine the transaction price, allocate the transaction price to each performance obligation in the contract and recognize revenues when (or as) we satisfy a performance obligation. See Note 2 to our consolidated financial statements for further information.
We account for share-based compensation in accordance with ASC No. 718, “Compensation - Stock Compensation” (“ASC No. 718”). ASC No. 718 requires companies to estimate the fair value of equity-based payment awards on the date of grant using an option-pricing model. The value of the award is recognized as an expense over the requisite service periods, which is generally the vesting period of the respective award, on a straight-line basis when the only condition to vesting is continued service. If vesting is subject to a performance condition, recognition is based on the implicit service period of the award. Expense for awards with performance conditions is estimated and adjusted on a quarterly basis based upon the assessment of the probability that the performance condition will be met.
We selected the Black-Scholes-Merton option-pricing model as the most appropriate fair value method for our option awards. The fair value of Restricted Share Units (“RSUs”) without market conditions, is based on the closing market value of the underlying shares at the date of grant.
The option-pricing models require a number of assumptions, of which the most significant are the expected share price volatility and the expected option term. We recognize forfeitures of equity-based awards as they occur.
As there was no public market for our ordinary shares prior to the IPO, the fair value of our ordinary shares prior to the IPO was determined by our board of directors after considering contemporaneous third-party valuations and input from management. The valuations of the Company’s ordinary shares were determined in accordance with the guidelines outlined in the American Institute of Certified Public Accountants Practice Aid, Valuation of Privately-Held-Company Equity Securities Issued as Compensation. In the absence of a public trading market, the Company’s board of directors, with input from management, exercised significant judgment and considered various objective and subjective factors to determine the fair value of the Company’s ordinary shares as of the date of each option grant.
These estimates involve uncertainties and the application of judgment. If circumstances are changed and different estimates are used, our expenses could materially differ in the future.
We calculate income tax provisions based on our results in each jurisdiction in which we operate. The calculation is based on estimated tax consequences and on assumptions as to our entitlement to various benefits under the applicable local tax laws.
Significant judgment is required in evaluating our uncertain tax positions. We establish reserves for uncertain tax positions based on the evaluation of whether or not our uncertain tax position is “more likely than not” to be sustained upon examination based on our technical merits. We record estimated interest and penalties pertaining to our uncertain tax positions in the financial statements as income tax expense.
Deferred tax assets are recognized for unused tax losses, unused tax credits, and deductible temporary differences to the extent that it is probable that future taxable profits will be available, against which they can be used. Deferred taxes for each jurisdiction are presented as a net asset or liability, net of any valuation allowances. We estimate the need for any valuation allowance by applying significant judgment and considering all available evidence including past results and future projections. We reassess our estimates periodically and record a partial or full valuation allowance release if needed.
We cannot assure that future final tax outcomes will not be different than our tax provisions and reserves for uncertain tax positions. To the extent that the final tax outcome of these matters is different than the amounts recorded, such differences will impact the provision for income taxes in the period in which such determination is made.
Commercial Agreement Asset
During the year ended December 2021, we recognized an asset in connection with a commercial agreement with Shopify Inc., in which the Company granted warrants in exchange for the benefit of being an exclusive third-party provider of an end-to-end cross-border solution. This asset represents the probable future economic benefit to be realized over a four-year expected benefit period and is valued based on the fair value of the vested warrants on the grant date.
We record amortization expenses related to the commercial agreement asset over a four-year period in the Company’s consolidated statements of operations and comprehensive loss as a component of sales and marketing.
Impact of Foreign Currency Fluctuation
See Item 3.D. “Risk Factors— We are exposed to fluctuations in currency exchange rates, which could negatively affect our financial condition and results of operations.” and Item 11. “Quantitative and Qualitative Disclosures About Market Risk-Foreign Currency Exchange Risk.”
We qualify as an “emerging growth company” pursuant to the provisions of the JOBS Act. Section 107 of the JOBS Act provides that an “emerging growth company” can take advantage of the extended transition period provided in Section 7(a)(2)(B) of the Securities Act for complying with new or revised accounting standards. We have elected to use this extended transition period, which allows us to delay adoption of new or revised accounting pronouncements applicable to public companies until such pronouncements are made applicable to private companies, until the earlier of the date we (i) are no longer an emerging growth company or (ii) affirmatively and irrevocably opt out of the extended transition period provided in the JOBS Act. As a result, our consolidated financial statements may not be comparable to companies that comply with new or revised accounting pronouncements as of public company effective dates.
Item 6. Directors, Senior Management and Employees
| A. | Directors and Senior Management |
The following table sets forth the name and position of each of our executive officers and directors as of March 21, 2022:
| | Age | | | Position |
| Executive Officers | | | | | | |
| Amir Schlachet | | 45 | | | Co-Founder, Chief Executive Officer, Director |
| Shahar Tamari | | 50 | | | Co-Founder, Chief Operations Officer, Director |
| Nir Debbi | | 48 | | | Co-Founder, President, Director |
| Ofer Koren | | 51 | | | Chief Financial Officer |
| Eden Zaharoni | | 45 | | | Chief Technology Officer |
| Ran Fridman | | 48 | | | Chief Revenue Officer |
| | | | | | |
| Non-Executive Directors | | |
| Thomas Studd | | 41 | | | Director |
| Miguel Angel Parra | | 54 | | | Director |
| Tzvia Broida | | 53 | | | Director |
| Anna Bakst | | 61 | | | Director |
| Iris Epple-Righi | | 57 | | | Director |
Executive Officers
Amir Schlachet is our Co-Founder and has served as our Chief Executive Officer since May 1, 2013. Mr. Schlachet has also served as a member of our board of directors since February 20, 2013. Prior to co-founding Global-e, Mr. Schlachet served as SVP and strategic advisor to the chief executive officer of Bank Hapoalim, after serving several years as a management consultant with McKinsey & Company. Mr. Schlachet holds an M.B.A. from INSEAD, an M.Sc. in Electrical Engineering from Tel-Aviv University and a B.Sc. in Mathematics, Physics and Computer Science from the Hebrew University of Jerusalem.
Shahar Tamari is our Co-Founder and has served as our Chief Operations Officer since May 1, 2013. Mr. Tamari has also served as a member of our board of directors since February 21, 2013. Mr. Tamari previously served as the VP and Head of e-payments for 888 Holdings from February 2009 until May 2013. Prior to that, he served as Head of e-Banking Business Development with Bank Hapoalim for seven years, from October 2001 until January 2009. Mr. Tamari received an M.Sc. in Technology Management and Information Systems from Tel Aviv University, and a B.A. in Business Administration, from the College of Management Academic Studies.
Nir Debbi is our Co-Founder and has served as our President since July 1, 2021 and previously served as our Chief Marketing Officer from May 1, 2013 to July 1, 2021. Mr. Debbi has also served as member of our board of directors since February 20, 2013. Prior to co-founding Global-e, Mr. Debbi served as SVP and Head of Strategy and Business Development at Bank Hapoalim, following a term as Head of Retail Strategy. Mr. Debbi holds an M.B.A and a B.Sc. in Economics, both from Tel-Aviv University.
Ofer Koren has served as our Chief Financial Officer since August 1, 2020. Prior to joining us, Mr. Koren served as chief financial officer and deputy chief executive officer at Bank Hapoalim as well as in various strategy and business development roles. Prior to that, Mr. Koren was a partner with Deloitte-Monitor Management Consulting (previously Trigger-Foresight). Mr. Koren holds an M.B.A. from Tel-Aviv University and a B.Sc. in Economics from Haifa University.
Eden Zaharoni has served as our Chief Technology Officer since August 11, 2013 and as our Vice President, Research & Development since August 2013. Mr. Zaharoni served as the Chief Technology Officer of Snoox, a platform that was founded by BBDO group, from March 2012 until August 2013. Prior to that, he served as the Vice President, Research & Development of Cent2Cent from January 2011 to February 2012 and held several management positions at 888 Holdings.
Ran Fridman has served as our Chief Revenue Officer since July 1, 2021. Prior to joining us, Mr. Fridman served as the global VP sales of Allot. Prior to that, he served in multiple global sales positions, including at Nokia, where he held numerous roles within senior global management, sales, and sales support.
Non-Executive Directors
Thomas Studd has served as the representative of Vitruvian Directors I Limited on our board of directors since April 30, 2020. Mr. Studd has been a Partner at Vitruvian Partners LLP since 2016, prior to which he served as Principal from 2013 to 2016 and Vice President from 2009 to 2013. Mr. Studd has served as a director of Carwow Ltd. since 2017, and previously served as the representative of Vitruvian Directors I Limited on the Vestiaire Collective SA from 2016 to 2017, JacTravel Group from 2014 to 2017 and Lausanne Toa Co Ltd. from 2011 to 2016. Mr. Studd holds a MPhys in Physics from the University of Oxford and an M.B.A. from INSEAD.
Miguel Angel Parra has served as a member of our board of directors since January 1, 2020. Mr. Parra currently serves as the Chief Executive Officer of DHL Express Americas since 2014, prior to which he served in numerous management positions, since 1997. Prior to that, from 1986 to 1997, Mr. Parra served as a general manager of TNT Express Worldwide. Mr. Parra holds an associate’s degree in Business from Miami-Dade Community College and is a graduate of the Advanced Management Program of Fuqua School of Business Duke University.
Tzvia Broida has served as a member of our board of directors since May 14, 2021. Since December 2013, Ms. Broida has served on the board of directors and as chairperson of the audit committee of Jacada Ltd. (JCDAF). Since 2021, Ms. Broida has also served as the Chief Financial Officer of NeuroBlade Ltd. Before joining NeuroBlade, Ms. Broida served as the Chief Financial Officer of Sensible Medical Innovations Ltd from 2011 to 2021. Prior to that, Ms. Broida served in various positions at Jacada Ltd, including as Chief Financial Officer from 2005 to 2009, and before that she worked as an accountant at Yehuda Ehrlich & Partners and Vexler, Kodenzick & Partners. Ms. Broida received a B.A. in Accounting & Economics from the Hebrew University of Jerusalem.
Anna Bakst has served as a member of our board of directors since May 14, 2021. From 2018 to 2019, Ms. Bakst served as Brand President and Chief Executive Officer of Kate Spade. Before that, Ms. Bakst served as Group President at Michael Kors from 2003 to 2017. Prior to Michael Kors, Ms. Bakst served in various positions at Donna Karan International from 1990 to 2001. Ms. Bakst received an M.B.A from Stanford University and a B.S. in Industrial Engineering from Purdue University. Ms. Bakst is also a Visiting Associate Professor at Pratt Institute’s Design Management Program.
Iris Epple-Righi has served as a member of our board of directors since May 14, 2021. Ms. Epple-Righi has served on the board of directors and as a member of the working committee of Hugo Boss since 2020. From 2016 to 2019, Ms. Epple-Righi served as Chief Executive Officer of Escada SE. Before that, Ms. Epple-Righi served in various positions in Calvin Klein from 2013 to 2016 and Tommy Hilfiger from 2003 to 2013. Ms. Epple-Righi received an M.B.A from the University of Tübingen.
| Board Diversity Matrix |
| Country of Principal Executive Offices: | Israel |
| Foreign Private Issuer | Yes |
| Disclosure Prohibited under Home Country Law | No |
| Total Number of Directors | 8 |
| | Female | Male | Non- Binary | Did Not
Disclose
Gender |
| Part I: Gender Identity | |
| Directors | 3 | 5 | - | - |
| Part II: Demographic Background | |
| Underrepresented Individual in Home Country Jurisdiction | 1 |
| LGBTQ+ | - |
Compensation of Directors and Executive Officers
Under the Companies Law, the compensation of our directors requires the approval of our compensation committee, the subsequent approval of the board of directors and, unless exempted under regulations promulgated under the Companies Law, the approval of the shareholders at a general meeting. If the compensation of our directors is inconsistent with our stated compensation policy, then those provisions that must be included in the compensation policy according to the Companies Law must have been considered by the compensation committee and board of directors, and shareholder approval will also be required, provided that:
| | • | | at least a majority of the shares held by all shareholders who are not controlling shareholders and do not have a personal interest in such matter, present and voting at such meeting, are voted in favor of the compensation package, excluding abstentions; or |
| | • | | the total number of shares of non-controlling shareholders and shareholders who do not have a personal interest in such matter voting against the compensation package does not exceed two percent (2%) of the aggregate voting rights in the Company. |
Executive Officers other than the Chief Executive Officer
The Companies Law requires the approval of the compensation of a public company’s executive officers (other than the chief executive officer) in the following order: (i) the compensation committee, (ii) the company’s board of directors, and (iii) if such compensation arrangement is inconsistent with the company’s stated compensation policy, the company’s shareholders (by a special majority vote as discussed above with respect to the approval of director compensation). However, if the shareholders of the company decline to approve a compensation arrangement with an executive officer that is inconsistent with the company’s stated compensation policy, the compensation committee and board of directors may override the shareholders’ decision if each of the compensation committee and the board of directors provide detailed reasons for their decision.
An amendment to an existing arrangement with an office holder (who is not a director) requires only the approval of the compensation committee, if the compensation committee determines that the amendment is not material in comparison to the existing arrangement. However, according to regulations promulgated under the Companies Law, an amendment to an existing arrangement with an office holder (who is not a director) who is subordinate to the chief executive officer shall not require the approval of the compensation committee, if (i) the amendment is approved by the chief executive officer, (ii) the company’s compensation policy provides that a non-material amendment to the terms of service of an office holder (other than the chief executive officer) may be approved by the chief executive officer and (iii) the engagement terms are consistent with the company’s compensation policy.
Under the Companies Law, the compensation of a public company’s chief executive officer is required to be approved by: (i) the company’s compensation committee; (ii) the company’s board of directors, and (iii) the company’s shareholders (by a special majority vote as discussed above with respect to the approval of director compensation). However, if the shareholders of the company decline to approve the compensation arrangement with the chief executive officer, the compensation committee and board of directors may override the shareholders’ decision if each of the compensation committee and the board of directors provide a detailed report for their decision. The approval of each of the compensation committee and the board of directors should be in accordance with the company’s stated compensation policy; however, in special circumstances, they may approve compensation terms of a chief executive officer that are inconsistent with such policy provided that they have considered those provisions that must be included in the compensation policy according to the Companies Law and that shareholder approval was obtained (by a special majority vote as discussed above with respect to the approval of director compensation). In addition, the compensation committee may waive the shareholder approval requirement with regards to the approval of the engagement terms of a candidate for the chief executive officer position, if they determine that the compensation arrangement is consistent with the company’s stated compensation policy and that the chief executive officer candidate did not have a prior business relationship with the company or a controlling shareholder of the company and that subjecting the approval of the engagement to a shareholder vote would impede the company’s ability to employ the chief executive officer candidate. In the event that the chief executive officer candidate also serves as a member of the board of directors, his or her compensation terms as chief executive officer will be approved in accordance with the rules applicable to approval of compensation of directors.
Aggregate Compensation of Office Holders
The aggregate compensation, including share-based compensation, paid by us and our subsidiaries to our executive officers and directors for the year ended December 31, 2021 was approximately $8.9 million. This amount includes approximately $0.4 million set aside or accrued to provide pension, severance, retirement or similar benefits or expenses, but does not include business travel, relocation, professional and business association dues and expenses reimbursed to office holders, and other benefits commonly reimbursed or paid by companies in Israel. During the year ended December 31, 2021, our executive officers and directors were granted 191,759 restricted share units under our equity incentive plans. As of December 31, 2021, options to purchase 5,729,028 ordinary shares granted to our executive officers and directors under equity incentive plans, at a weighted average exercise price of $2.89 and having expiration dates generally ten (10) years after the grant date, and 191,759 restricted share units granted under our equity incentive plans, were outstanding.
We pay each of our non-employee directors, other than individuals who served on our board of directors immediately prior to the consummation of our initial public offering, who serves on a board committee an annual retainer of $35,000, with additional annual payment for service on board committees as follows: $10,000 (or $20,000 for the chairperson) per membership of the audit committee, or $7,500 (or $15,000 for the chairperson) per membership of the compensation committee and $4,250 (or $8,500 for the chairperson) per membership of the nominating and governance committee. In addition, upon election, nonemployee directors, other than individuals who served on our board of directors immediately prior to the consummation of our initial public offering, were granted with restricted share unit awards under our incentive plan at a value of $250,000 which vests on an annual basis over a period of three years. In addition, each non-employee director, other than individuals who served on our board of directors immediately prior to the consummation of our initial public offering, were granted annual restricted share unit awards under our incentive plan (provided the director is still in office) at a value of $150,000 which shall vest on the first anniversary of the grant date.
The following is a summary of the salary expenses and social benefit costs of our five most highly compensated executive officers in 2021, or the "Covered Executives." All amounts reported reflect the cost to the Company as recognized in our financial statements for the year ended December 31, 2021. U.S. dollar amounts indicated for compensation of our Covered Executives are in thousands of dollars.
Name and Principal Position(2) | | Base
Salary
($) | | | Benefits and Perquisites
($)(3) | | | Variable compensation
($)(4) | | | Equity-Based Compensation
($)(5) | | | Total
($) | |
| | | (in thousands, US dollars) (1) | |
Amir Schlachet, Co-Founder, Chief Executive Officer, Director | | | 341 | | | | 49 | | | | 129 | | | | 1,402 | | | | 1,921 | |
Shahar Tamari, Co-Founder, Chief Operations Officer, Director | | | 340 | | | | 79 | | | | 129 | | | | 1,402 | | | | 1,950 | |
Nir Debbi, Co-Founder, President, Director | | | 339 | | | | 69 | | | | 129 | | | | 1,402 | | | | 1,939 | |
Ofer Koren, Chief Financial Officer | | | 340 | | | | 88 | | | | 129 | | | | 1,105 | | | | 1,662 | |
Ran Fridman, Chief Revenue Officer | | | 173 | | | | 47 | | | | 79 | | | | 204 | | | | 503 | |
| (1) | All amounts reported in the table are in terms of cost to us, as recorded in our financial statements. |
| | |
| (2) | All Covered Executives listed in the table are our full-time employees. Cash compensation amounts denominated in currencies other than the U.S. dollar were converted into U.S. dollars at the average conversion rate for 2021. | | |
| | | | |
| (3) | Amounts reported in this column include social benefits paid by us on behalf of the Covered Executives, convalescence pay, contributions made by the company to an insurance policy or a pension fund, work disability insurance, severance, educational fund and payments for social security | | |
| | | |
| (4) | Amounts reported in this column refer to incentive and variable compensation payments which were paid or accrued with respect to 2021. In accordance with the Company’s compensation policy, we also paid cash bonuses to our Covered Executives upon compliance with predetermined performance parameters and an over achievement bonus as set by the compensation committee and the board of directors. These amounts were provided for in our 2021 financial statements (but will be paid during 2022). | | |
| | | | |
| (5) | Amounts reported in this column represent the expense recorded in our financial statements for the year ended December 31, 2021 with respect to equity-based compensation grants-- options and restricted share units. The relevant amounts underlying the equity awards granted to our officers during 2021, will continue to be expensed in our financial statements over a four-year period during the years 2021-2024 on account of the 2021 grants in similar annualized amounts. Assumptions and key variables used in the calculation of such amounts are described in Note 7 to our audited consolidated financial statements included in Item 18 of this Annual Report. All equity-based compensation grants to our Covered Executives were made in accordance with the parameters of our Company’s compensation policy and were approved by our compensation committee and board of directors. | | |
Employment and consulting agreements with executive officers and directors
We have entered into written employment agreements with each of our executive officers. These agreements provide for notice periods of varying duration for termination of the agreement by us or by the relevant executive officer, during which time the executive officer will continue to receive salary and benefits. These agreements also contain customary provisions regarding non-competition, non-solicitation confidentiality of information and assignment of inventions. However, the enforceability of the non-competition provisions may be limited under applicable law.
Share Incentive Plans
2013 Share Option Plan.
The 2013 Share Incentive Plan, or the 2013 Plan, was adopted by our board of directors on May 13, 2013 and amended on April 2, 2019. The 2013 Plan provides for the grant of equity-based incentive awards to our employees, directors, office holders, service providers and consultants in order to incentivize them to increase their efforts on behalf of the Company and to promote the success of the Company’s business.
We no longer grant any awards under the 2013 Plan as it was superseded by the 2021 Plan, although previously granted awards remain outstanding. Ordinary shares subject to outstanding options granted under the 2013 Plan that expire or become unexercisable without having been exercised in full will become available again for future grant under the 2021 Plan. Our board of directors, or a duly authorized committee of our board of directors, or the administrator, administers the 2013 Plan.
2021 Employee Share Purchase Plan
The 2021 Employee Share Purchase Plan (the “ESPP”) was adopted by our board of directors on March 1, 2021. The ESPP is comprised of two distinct components: (1) the component intended to qualify for favorable U.S. federal tax treatment under Section 423 of the Code (the “Section 423 Component”) and (2) the component not intended to be tax qualified under Section 423 of the Code to facilitate participation for employees who are not eligible to benefit from favorable U.S. federal tax treatment and, to the extent applicable, to provide flexibility to comply with non U.S. law and other considerations (the “Non Section 423 Component”).
As of December 31, 2021, a total of 2,500,000 of our ordinary shares was available for sale under our ESPP, subject to adjustment as provided for in the ESPP. In addition, on the first day of each fiscal year beginning with our 2022 fiscal year and ending on and including the fiscal year of 2029, such pool of ordinary shares shall be increased by that number of our ordinary shares equal to the lesser of:
| | • | | 0.5% of the outstanding ordinary shares as of the last day of the immediately preceding fiscal year, determined on a fully diluted basis; or |
| | • | | such other amount as our board of directors may determine. |
Our board of directors resolved not to increase the pool of ordinary shares available for sale under the ESPP for the fiscal year 2022.
In no event will more than 2,750,000 ordinary shares be available for issuance under the Section 423 Component.
Unless otherwise determined by our board of directors, the compensation committee of our board of directors, or the administrator, will administer the ESPP and will have the authority to interpret the terms of the ESPP and determine eligibility under the ESPP, and otherwise exercise such powers and to perform such acts as the administrator deems necessary in accordance with the terms of the ESPP and applicable law.
Eligible employees become participants in the ESPP by enrolling to purchase our ordinary shares through contributions, in the form of payroll deductions, or otherwise, to the extent permitted by the administrator. Amounts contributed and accumulated by the participant will be used to purchase shares at the end of each offering period. The administrator may amend, suspend or terminate the ESPP at any time.
2021 Share Incentive Plan
The 2021 Share Incentive Plan, or the 2021 Plan, was adopted by our board of directors on March 1, 2021. The 2021 Plan provides for the grant of equity-based incentive awards to our employees, directors, office holders, service providers and consultants in order to incentivize them to increase their efforts on behalf of the Company and to promote the success of the Company’s business.
The maximum number ordinary shares available for issuance under the 2021 Plan is equal to the sum of (i) 13,500,000 shares, (ii) any shares subject to awards under the 2013 Plan which have expired, or were cancelled, terminated, forfeited or settled in cash in lieu of issuance of shares or became unexercisable without having been exercised, and (iii) an annual increase on the first day of each year beginning in 2022 and on January 1st of each calendar year thereafter during the term of the Plan, equal to five percent (5%) of the outstanding ordinary shares of the Company on the last day of the immediately preceding calendar year. No more than 13,500,000 ordinary shares may be issued upon the exercise of incentive stock options, or ISOs.
Our board of directors, or a duly authorized committee of our board of directors, or the administrator, will administer the 2021 Plan. The administrator may interpret the terms of the 2021 Plan and any award agreements or awards granted thereunder, designate recipients of awards, determine and amend the terms of awards, and take all other actions and make all other determinations necessary for the administration of the 2021 Plan, in accordance with the terms of the 2021 Plan and applicable law.
The 2021 Plan provides for granting awards under various tax regimes, including, without limitation, in compliance with Section 102 of the Israeli Income Tax Ordinance (New Version), 5721-1961 (the “Ordinance”), and Section 3(9) of the Ordinance and for awards granted to our United States employees or service providers, including those who are deemed to be residents of the United States for tax purposes, Section 422 of the Code and Section 409A of the Code.
Section 102 of the Ordinance allows employees, directors and officers who are not controlling shareholders and are considered Israeli residents to receive favorable tax treatment for compensation in the form of shares or options, subject to the terms and conditions set forth in the Ordinance. Our service providers and controlling shareholders may only be granted options under section 3(9) of the Ordinance, which does not provide for similar tax benefits.
The 2021 Plan provides for the grant of stock options (including incentive stock options and nonqualified stock options), ordinary shares, restricted shares, restricted share units, stock appreciation rights and other share-based awards.
As of December 31, 2021, a total of 10,132,154 options to purchase ordinary shares, with a weighted average exercise price of $2.26 per share and 443,018 restricted share units were outstanding under our 2021 Plan and 2013 Plan. As of December 31, 2021, 13,324,236 ordinary shares were available for future grant under the 2021 Plan.
Corporate Governance Practices
As an Israeli company, we are subject to various corporate governance requirements under the Companies Law. However, pursuant to regulations promulgated under the Companies Law, companies with shares traded on certain U.S. stock exchanges, including Nasdaq, may, subject to certain conditions, “opt out” from the Companies Law requirements to appoint external directors and related Companies Law rules concerning the composition of the audit committee and compensation committee of the board of directors (other than the gender diversification rule under the Companies Law, which requires the appointment of a director from the other gender if at the time a director is appointed all members of the board of directors are of the same gender). In accordance with these regulations, we elected to “opt out” from such requirements of the Companies Law. Under these regulations, the exemptions from such Companies Law requirements will continue to be available to us so long as: (i) we do not have a “controlling shareholder” (as such term is defined under the Companies Law), (ii) our shares are traded on certain U.S. stock exchanges, including Nasdaq, and (iii) we comply with the director independence requirements and the audit committee and compensation committee composition requirements under U.S. laws (including applicable rules of Nasdaq) applicable to U.S. domestic issuers.
We are a “foreign private issuer” (as such term is defined in Rule 3b-4 under the Exchange Act). As a foreign private issuer we are permitted to comply with Israeli corporate governance practices instead of the corporate governance rules of Nasdaq, provided that we disclose which requirements we are not following and the equivalent Israeli requirement. As a foreign private issuer, we are exempt under the Exchange Act from, among other things, the rules prescribing the furnishing and content of proxy statements, and our officers, directors and principal shareholders are exempt from the reporting and short-swing profit recovery provisions contained in Section 16 of the Exchange Act. In addition, we are not required under the Exchange Act to file periodic reports and financial statements with the SEC as frequently or as promptly as U.S. companies whose securities are registered under the Exchange Act.
For more information regarding our corporate governance practices and foreign private issuer status, see “Corporate Governance” in Item 16.G below.
Under the Companies Law and our amended and restated articles of association, our business and affairs are managed under the direction of our board of directors. Our board of directors may exercise all powers and may take all actions that are not specifically granted to our shareholders or to executive management. Our Chief Executive Officer (referred to as a “general manager” under the Companies Law) is responsible for our day-to-day management. Our Chief Executive Officer is appointed by, and serves at the discretion of, our board of directors, subject to the employment agreement that we have entered into with him. All other executive officers are appointed by the Chief Executive Officer, subject to applicable corporate approvals, and are subject to the terms of any applicable employment or consulting agreements that we may enter into with them.
Under our amended and restated articles of association, the number of directors on our board of directors is determined by our board of directors and will be no less than three and no more than eleven directors divided into three classes with staggered three-year terms. Each class of directors consists, as nearly as possible, of one-third of the total number of directors constituting the entire board of directors. At each annual general meeting of our shareholders, the election or re-election of directors following the expiration of the term of office of the directors of that class of directors will be for a term of office that expires on the third annual general meeting following such election or re-election, such that from the annual general meeting of 2022 and after, each year the term of office of only one class of directors will expire.
Our directors are divided among the three classes as follows:
| | • | | the Class I directors are Amir Schlachet, Miguel Angel Parra and Iris Epple-Righi, and their terms will expire at our annual general meeting of shareholders to be held in 2022; |
| | • | | the Class II directors, are Nir Debbi and Anna Jain Bakst, and their terms will expire at our annual meeting of shareholders to be held in 2023; and |
| | • | | the Class III directors are Shahar Tamari, Thomas Studd and Tzvia Broida, and their terms will expire at our annual meeting of shareholders to be held in 2024. |
Our directors are appointed by a simple majority vote of holders of our ordinary shares, participating and voting at an annual general meeting of our shareholders, provided that (i) in the event of a contested election, the method of calculation of the votes and the manner in which the resolutions will be presented to our shareholders at the general meeting shall be determined by our board of directors in its discretion, and (ii) in the event that our board of directors does not or is unable to make a determination on such matter, then the directors will be elected by a plurality of the voting power represented at the general meeting in person or by proxy and voting on the election of directors. Each director will hold office until the annual general meeting of our shareholders for the year in which such director’s term expires, unless the tenure of such director expires earlier pursuant to the Companies Law or unless such director is removed from office as described below.
Under our amended and restated articles of association, the approval of the holders of at least 70% of the total voting power of our shareholders is generally required to remove any of our directors from office or amend the provision requiring the approval of at least 70% of the total voting power of our shareholders to remove any of our directors from office, or certain other provisions regarding our staggered board, shareholder proposals, the size of our board and plurality voting in contested elections. In addition, vacancies on our board of directors may be filled by a vote of a simple majority of the directors then in office. A director so appointed will hold office until the next annual general meeting of our shareholders for the election of the class of directors in respect of which the vacancy was created, or in the case of a vacancy due to the number of directors being less than the maximum number of directors stated in our amended and restated articles of association, until the next annual general meeting of our shareholders for the election of the class of directors to which such director was assigned by our board of directors.
Our amended and restated articles of association provide that the Chairperson of the board of directors is appointed by the members of the board of directors from among them. Under the Companies Law, the chief executive officer of a public company, or a relative of the chief executive officer, may not serve as the chairperson of the board of directors of such public company, and the chairperson of the board of directors of a public company, or a relative of the chairperson, may not be vested with authorities of the chief executive officer of such public company, without shareholder approval consisting of a majority vote of the shares present and voting at a shareholders meeting, and in addition, either:
| | • | | at least a majority of the shares of non-controlling shareholders and shareholders that do not have a personal interest in the approval voted at the meeting are voted in favor (disregarding abstentions); or |
| | • | | the total number of shares of non-controlling shareholders and shareholders who do not have a personal interest in such appointment that re voted against such appointment does not exceed two percent (2%) of the aggregate voting rights in the company. |
In addition, a person who is subordinated, directly or indirectly, to the chief executive officer may not serve as the chairperson of the board of directors, the chairperson of the board of directors may not be vested with authorities that are granted to persons who are subordinated to the chief executive officer and the chairperson of the board of directors may not serve in any other position in the company or in a controlled subsidiary, but may serve as a director or chairperson of a controlled subsidiary.
During a special and annual general meeting of our shareholders held on March 21, 2021, our shareholders approved the appointment of Amir Schlachet as Chairperson of our board of directors in addition to his role as our Chief Executive Officer. According to the Companies Law and the regulations promulgated thereunder, such appointment is valid for an initial term of five years following the closing of our initial public offering. Following such initial term, each renewal of the appointment of our Chief Executive Officer as Chairperson of the board of directors will be subject to the shareholder approval described above and will be limited to a three-year term.
Under the Companies Law, companies incorporated under the laws of the State of Israel that are “public companies,” including companies with shares listed on Nasdaq, are required to appoint at least two external directors. Pursuant to regulations promulgated under the Companies Law, companies with shares traded on certain U.S. stock exchanges, including Nasdaq, which do not have a “controlling shareholder,” may, subject to certain conditions, “opt out” from the Companies Law requirements to appoint external directors and related Companies Law rules concerning the composition of the audit committee and compensation committee of the board of directors. In accordance with these regulations, we have elected to “opt out” from the Companies Law requirement to appoint external directors and related Companies Law rules concerning the composition of the audit committee and compensation committee of our board of directors.
Our board has established an audit committee, a compensation committee and a nominating, governance and sustainability committee.
Companies Law Requirements. Under the Companies Law, the board of directors of a public company must appoint an audit committee. The audit committee must be comprised of at least three directors.
Listing Requirements. Under the corporate governance rules of Nasdaq, we are required to maintain an audit committee consisting of at least three independent directors, each of whom is financially literate and one of whom has accounting or related financial management expertise.
Our audit committee consists of Tzvia Broida, Anna Bakst and Iris Epple-Righi. Tzvia Broida serves as the chairperson of the audit committee. All members of our audit committee meet the requirements for financial literacy under the applicable rules and regulations of the SEC and the corporate governance rules of Nasdaq. Our board of directors has determined that Tzvia Broida is an audit committee financial expert as defined by the SEC rules and has the requisite financial experience as defined by the corporate governance rules of Nasdaq.
Our board of directors has determined that each member of our audit committee is “independent” as such term is defined under the Nasdaq corporate governance rules and under and Rule 10A-3(b)(1) under the Exchange Act, which is different from the general test for independence of board and committee members.
Audit Committee Role. Our board of directors has adopted an audit committee charter setting forth the responsibilities of the audit committee, which are consistent with the Companies Law, the SEC rules and the corporate governance rules of Nasdaq and include:
| | • | | retaining and terminating our independent auditors, subject to ratification by the board of directors, and in the case of retention, to ratification by the shareholders; |
| | • | | pre-approving audit and non-audit services to be provided by the independent auditors and related fees and terms; |
| | • | | overseeing the accounting and financial reporting processes of our company and audits of our financial statements, the effectiveness of our internal control over financial reporting and making such reports as may be required of an audit committee under the rules and regulations promulgated under the Exchange Act; |
| | • | | reviewing with management and our independent auditor our annual and quarterly financial statements prior to publication or filing (or submission, as the case may be) to the SEC; |
| | • | | recommending to the board of directors the retention and termination of the internal auditor, and the internal auditor’s engagement fees and terms, in accordance with the Companies Law as well as approving the yearly or periodic work plan proposed by the internal auditor and reviewing and discussing the results of internal auditor activities, including significant findings and management’s responses to significant findings; |
| | • | | reviewing policies and procedures with respect to transactions (other than transactions related to the compensation or terms of services) between the Company and officers and directors, or affiliates of officers or directors, or transactions that are not in the ordinary course of the Company’s business and deciding whether to approve such acts and transactions if so required under the Companies Law; and |
| | • | | establishing procedures for the handling of employees’ complaints as to the management of our business and the protection to be provided to such employees. |
Companies Law Requirements. Under the Companies Law, the board of directors of a public company must appoint a compensation committee, which must be comprised of at least three directors.
Listing Requirements. Under the corporate governance rules of Nasdaq, we are required to maintain a compensation committee consisting of at least two independent directors.
Our compensation committee consists of Anna Bakst Iris Epple-Righi and Thomas Studd Anna Bakst serves as chairperson of the committee. Our board of directors has determined that each member of our compensation committee is independent under the corporate governance rules of Nasdaq, including the additional independence requirements applicable to the members of a compensation committee.
Compensation Committee Role
In accordance with the Companies Law, the roles of the compensation committee are, among others, as follows:
| | • | | making recommendations to the board of directors with respect to the approval of the compensation policy for office holders and, once every three years, regarding any extensions to a compensation policy that was adopted for a period of more than three years; |
| | • | | reviewing the implementation of the compensation policy and periodically making recommendations to the board of directors with respect to any amendments or updates of the compensation policy; |
| | • | | resolving whether or not to approve arrangements with respect to the terms of office and employment of office holders; and |
| | • | | exempting, under certain circumstances, a transaction with our Chief Executive Officer from the approval of our shareholders. |
Our board of directors has adopted a compensation committee charter setting forth the responsibilities of the committee, which are consistent with the corporate governance rules of Nasdaq and include among others:
| | • | | recommending to our board of directors for its approval a compensation policy in accordance with the requirements of the Companies Law as well as other compensation policies, incentive-based compensation plans and equity-based compensation plans, and overseeing the development and implementation of such policies and recommending to our board of directors any amendments or modifications to such policies the committee deems appropriate, including as required under the Companies Law; |
| | • | | reviewing and approving the granting of options and other incentive awards to our Chief Executive Officer and other executive officers, including reviewing and approving corporate goals and objectives relevant to the compensation of our Chief Executive Officer and other executive officers; |
| | • | | approving and exempting certain transactions regarding office holders’ compensation pursuant to the Companies Law; and |
| | • | | administering our equity-based compensation plans, including without limitation, approving the adoption of such plans, amending and interpreting such plans and the awards and agreements issued pursuant thereto, and making awards to eligible persons under the plans and determining the terms of such awards. |
Compensation Policy under the Companies Law
In general, under the Companies Law, a public company must have a compensation policy approved by the board of directors after receiving and considering the recommendations of the compensation committee. In addition, our compensation policy must be approved at least once every three years, first, by our board of directors, upon recommendation of our compensation committee, and second, by a simple majority of the ordinary shares present, in person or by proxy, and voting (excluding abstentions) at a general meeting of shareholders, provided that either:
| | • | | such majority includes at least a majority of the shares held by shareholders who are not controlling shareholders and shareholders who do not have a personal interest in such compensation policy; or |
| | • | | the total number of shares of non-controlling shareholders and shareholders who do not have a personal interest in the compensation policy and who vote against the policy does not exceed two percent (2%) of the aggregate voting rights in the Company. |
Under special circumstances, the board of directors may approve the compensation policy despite the objection of the shareholders on the condition that the compensation committee and then the board of directors decide, on the basis of detailed grounds and after discussing again the compensation policy, that approval of the compensation policy, despite the objection of shareholders, is for the benefit of the company.
If a company that initially offers its securities to the public, like us, adopts a compensation policy in advance of its initial public offering, and describes it in its prospectus for such offering, as we did, then such compensation policy shall be deemed a validly adopted policy in accordance with the Companies Law requirements described above. Furthermore, if the compensation policy is established in accordance with the aforementioned relief, then it will remain in effect for a term of five years from the date such company becomes a public company.
The compensation policy must be based on certain considerations, include certain provisions and reference certain matters as set forth in the Companies Law. The compensation policy must serve as the basis for decisions concerning the financial terms of employment or engagement of office holders, including exculpation, insurance, indemnification or any monetary payment or obligation of payment in respect of employment or engagement. The compensation policy must be determined and later reevaluated according to certain factors, including: the advancement of the company’s objectives, business plan and long-term strategy; the creation of appropriate incentives for office holders, while considering, among other things, the company’s risk management policy; the size and the nature of the company’s operations; and with respect to variable compensation, the contribution of the office holder towards the achievement of the company’s long-term goals and the maximization of its profits, all with a long-term objective and according to the position of the office holder. The compensation policy must furthermore consider the following additional factors:
| | • | | the education, skills, experience, expertise and accomplishments of the relevant office holder; |
| | • | | the office holder’s position and responsibilities; |
| | • | | prior compensation agreements with the office holder; |
| | • | | the ratio between the cost of the terms of employment of an office holder and the cost of the employment of other employees of the company, including employees employed through contractors who provide services to the company, in particular the ratio between such cost to the average and median salary of such employees of the company, as well as the impact of disparities between them on the work relationships in the company; |
| | • | | if the terms of employment include variable components — the possibility of reducing variable components at the discretion of the board of directors and the possibility of setting a limit on the value of non-cash variable equity-based components; and |
| | • | | if the terms of employment include severance compensation — the term of employment or office of the office holder, the terms of the office holder’s compensation during such period, the company’s performance during such period, the office holder’s individual contribution to the achievement of the company goals and the maximization of its profits and the circumstances under which he or she is leaving the company. |
The compensation policy must also include, among other things:
| | • | | with regards to variable components: |
| | o | with the exception of office holders who report to the chief executive officer, a means of determining the variable components on the basis of long-term performance and measurable criteria; provided that the company may determine that an immaterial part of the variable components of the compensation package of an office holder shall be awarded based on non-measurable criteria, or if such amount is not higher than three months’ salary per annum, taking into account such office holder’s contribution to the company; |
| | o | the ratio between variable and fixed components, as well as the limit of the values of variable components at the time of their payment, or in the case of equity-based compensation, at the time of grant; |
| | • | | a condition under which the office holder will return to the company, according to conditions to be set forth in the compensation policy, any amounts paid as part of the office holder’s terms of employment, if such amounts were paid based on information later to be discovered to be wrong, and such information was restated in the company’s financial statements; |
| | • | | the minimum holding or vesting period of variable equity-based components to be set in the terms of office or employment, as applicable, while taking into consideration long-term incentives; and |
| | • | | a limit to retirement grants. |
Our compensation policy is designed to promote retention and motivation of directors and executive officers, incentivize superior individual excellence, align the interests of our directors and executive officers with our long-term performance and provide a risk management tool. To that end, a portion of our executive officer compensation package is targeted to reflect our short and long-term goals, as well as the executive officer’s individual performance. On the other hand, our compensation policy includes measures designed to reduce the executive officer’s incentives to take excessive risks that may harm us in the long-term, such as limits on the value of cash bonuses and equity-based compensation, limitations on the ratio between the variable and the total compensation of an executive officer and minimum vesting periods for equity-based compensation.
Our compensation policy also addresses our executive officers’ individual characteristics (such as their respective position, education, scope of responsibilities and contribution to the attainment of our goals) as the basis for compensation variation among our executive officers and considers the internal ratios between compensation of our executive officers and directors and other employees. Pursuant to our compensation policy, the compensation that may be granted to an executive officer may include: base salary, annual bonuses and other cash bonuses (such as a signing bonus and special bonuses with respect to any special achievements, such as outstanding personal achievement, outstanding personal effort or outstanding company performance), equity-based compensation, benefits and retirement and termination of service arrangements. All cash bonuses are limited to a maximum amount linked to the executive officer’s base salary.
An annual cash bonus may be awarded to executive officers upon the attainment of pre-set periodic objectives and individual targets. The annual cash bonus that may be granted to our executive officers other than our Chief Executive Officer will be based on performance objectives and a discretionary evaluation of the executive officer’s overall performance by our Chief Executive Officer and subject to minimum thresholds. The annual cash bonus that may be granted to executive officers other than our Chief Executive Officer may alternatively be based entirely on a discretionary evaluation. Furthermore, our Chief Executive Officer will be entitled to approve performance objectives for executive officers who report to him.
The measurable performance objectives of our Chief Executive Officer will be determined annually by our compensation committee and board of directors. A non-material portion of the Chief Executive Officer’s annual cash bonus, as provided in our compensation policy, may be based on a discretionary evaluation of the Chief Executive Officer’s overall performance by the compensation committee and the board of directors.
The equity-based compensation under our compensation policy for our executive officers (including members of our board of directors) is designed in a manner consistent with the underlying objectives in determining the base salary and the annual cash bonus, with its main objectives being to enhance the alignment between the executive officers’ interests with our long-term interests and those of our shareholders and to strengthen the retention and the motivation of executive officers in the long term. Our compensation policy provides for executive officer compensation in the form of share options or other equity-based awards, such as restricted shares and restricted share units, in accordance with our equity incentive plan then in place. All equity-based incentives granted to executive officers shall be subject to vesting periods in order to promote long-term retention of the awarded executive officers. The equity-based compensation shall be granted from time to time and be individually determined and awarded according to the performance, educational background, prior business experience, qualifications, role and the personal responsibilities of the executive officer.
In addition, our compensation policy contains compensation recovery provisions which allow us under certain conditions to recover bonuses paid in excess, enable our Chief Executive Officer to approve an immaterial change in the terms of employment of an executive officer who reports directly him (provided that the changes of the terms of employment are in accordance with our compensation policy) and allow us to exculpate, indemnify and insure our executive officers and directors to the maximum extent permitted by Israeli law subject to certain limitations set forth therein.
Our compensation policy also provides for compensation to the members of our board of directors either (i) in accordance with the amounts provided in the Companies Regulations (Rules Regarding the Compensation and Expenses of an External Director) of 2000, as amended by the Companies Regulations (Relief for Public Companies Traded in Stock Exchange Outside of Israel) of 2000, as such regulations may be amended from time to time, or (ii) in accordance with the amounts determined in our compensation policy.
Our compensation policy was approved by our board of directors and shareholders and became effective immediately prior to the closing of our initial public offering and is filed as an exhibit to this Annual Report.
Nominating, Governance and Sustainability Committee
Our nominating, governance and sustainability committee consists of Iris Epple-Righi, Anna Bakst and Thomas Studd. Iris Epple-Righi serves as chairperson of the committee. Our board of directors has adopted a nominating, governance and sustainability committee charter setting forth the responsibilities of the committee, which include:
| | • | | overseeing and assisting our board in reviewing and recommending nominees for election as directors; |
| | • | | assisting our board in its oversight relating to corporate responsibility and environmental, social and governance matters; |
| | • | | overseeing periodic assessments of the performance of the members of our board and its committees; and |
| | • | | establishing and maintaining effective corporate governance policies and practices, including, but not limited to, developing and recommending to our board a set of corporate governance guidelines applicable to our business. |
Our board of directors has adopted a written code of conduct that applies to our directors, officers and employees, including our principal executive officer, principal financial officer, principal accounting officer or controller, or persons performing similar functions. A current copy of the code is posted on the investor section of our website.
Under the Companies Law, the board of directors of a public company must appoint an internal auditor based on the recommendation of the audit committee. The role of the internal auditor is, among other things, to examine whether a company’s actions comply with applicable law and orderly business procedure. Under the Companies Law, the internal auditor cannot be an interested party or an office holder or a relative of an interested party or an office holder, nor may the internal auditor be the company’s independent auditor or its representative. An “interested party” is defined in the Companies Law as (i) a holder of 5% or more of the issued share capital or voting power in a company, (ii) any person or entity who has the right to designate one or more directors or to designate the chief executive officer of the company or (iii) any person who serves as a director or as chief executive officer of the company. As of July 27, 2021, Ms. Sharon Cohen, CPA from Brightman Almagor Zohar & Co., a firm in the Deloitte Global Network, is acting as our internal auditor.
Approval of Related Party Transactions under Israeli Law
Fiduciary Duties of Directors and Executive Officers
The Companies Law codifies the fiduciary duties that office holders owe to a company. An office holder is defined in the Companies Law as a general manager, chief business manager, deputy general manager, vice general manager, any other person assuming the responsibilities of any of these positions regardless of such person’s title, a director and any other manager directly subordinate to the general manager. Each person listed in the table under “Directors and Senior Management” is an office holder under the Companies Law.
An office holder’s fiduciary duties consist of a duty of care and a duty of loyalty. The duty of care requires an office holder to act with the level of care with which a reasonable office holder in the same position would have acted under the same circumstances. The duty of care includes, among other things, a duty to use reasonable means, in light of the circumstances, to obtain:
| | • | | information on the business advisability of a given action brought for his, her or its approval or performed by virtue of his, her or its position; and |
| | • | | all other important information pertaining to such action. |
The duty of loyalty requires that an office holder act in good faith and in the best interests of the company, and includes, among other things, the duty to:
| | • | | refrain from any act involving a conflict of interest between the performance of his, her or its duties in the company and his, her or its other duties or personal affairs; |
| | • | | refrain from any activity that is competitive with the business of the company; |
| | • | | refrain from exploiting any business opportunity of the company for the purpose of gaining a personal advantage for himself, herself or itself or others; and |
| | • | | disclose to the company any information or documents relating to the company’s affairs which the office holder received as a result of his, her or its position as an office holder. |
Under the Companies Law, a company may approve an act specified above which would otherwise constitute a breach of the office holder’s fiduciary duty, provided that the office holder acted in good faith, neither the act nor its approval harms the company and the office holder discloses his, her or its personal interest a sufficient time before the approval of such act. Any such approval is subject to the terms of the Companies Law setting forth, among other things, the appropriate bodies of the company required to provide such approval and the methods of obtaining such approval.
Disclosure of Personal Interests of an Office Holder and Approval of Certain Transactions.
The Companies Law requires that an office holder promptly disclose to the board of directors any personal interest that such office holder may have and all related material information known to such office holder concerning any existing or proposed transaction with the company. A personal interest includes an interest of any person in an act or transaction of a company, including a personal interest of one’s relative or of a corporate body in which such person or a relative of such person is a 5% or greater shareholder, director or general manager or in which such person has the right to appoint at least one director or the general manager, but excluding a personal interest stemming solely from one’s ownership of shares in the company. A personal interest includes the personal interest of a person for whom the office holder holds a voting proxy or the personal interest of the office holder with respect to the officer holder’s vote on behalf of a person for whom he or she holds a proxy even if such shareholder has no personal interest in the matter.
If it is determined that an office holder has a personal interest in a non-extraordinary transaction, meaning any transaction that is in the ordinary course of business, on market terms or that is not likely to have a material impact on the company’s profitability, assets or liabilities, approval by the board of directors is required for the transaction unless the company’s articles of association provide for a different method of approval. Any such transaction that is adverse to the company’s interests may not be approved by the board of directors.
Approval first by the company’s audit committee and subsequently by the board of directors is required for an extraordinary transaction (meaning any transaction that is not in the ordinary course of business, not on market terms or that is likely to have a material impact on the company’s profitability, assets or liabilities) in which an office holder has a personal interest.
A director and any other office holder who has a personal interest in a transaction which is considered at a meeting of the board of directors or the audit committee may generally (unless it is with respect to a transaction which is not an extraordinary transaction) not be present at such a meeting or vote on that matter unless a majority of the directors or members of the audit committee, as applicable, have a personal interest in the matter. If a majority of the members of the audit committee or the board of directors have a personal interest in the matter, then all of the directors may participate in deliberations of the audit committee or board of directors, as applicable, with respect to such transaction and vote on the approval thereof and, in such case, shareholder approval is also required.
Certain disclosure and approval requirements apply under Israeli law to certain transactions with controlling shareholders, certain transactions in which a controlling shareholder has a personal interest and certain arrangements regarding the terms of service or employment of a controlling shareholder. For these purposes, a controlling shareholder is any shareholder that has the ability to direct the company’s actions, including any shareholder holding 25% or more of the voting rights if no other shareholder owns more than 50% of the voting rights in the company. Two or more shareholders with a personal interest in the approval of the same transaction are deemed to be one shareholder.
For a description of the approvals required under Israeli law for compensation arrangements of officers and directors, see “Compensation of Directors and Executive Officers.”
Pursuant to the Companies Law, a shareholder has a duty to act in good faith and in a customary manner toward the company and other shareholders and to refrain from abusing his or her power with respect to the company, including, among other things, in voting at a general meeting and at shareholder class meetings with respect to the following matters:
| | • | | an amendment to the company’s articles of association; |
| | • | | an increase of the company’s authorized share capital; |
| | • | | interested party transactions that require shareholder approval. |
In addition, a shareholder has a general duty to refrain from discriminating against other shareholders.
Certain shareholders also have a duty of fairness toward the company. These shareholders include any controlling shareholder, any shareholder who knows that it has the power to determine the outcome of a shareholder vote and any shareholder who has the power to appoint or to prevent the appointment of an office holder of the company or exercise any other rights available to it under the company’s articles of association with respect to the company. The Companies Law does not define the substance of this duty of fairness, except to state that the remedies generally available upon a breach of contract will also apply in the event of a breach of the duty of fairness.
Exculpation, Insurance and Indemnification of Office Holders
Under the Companies Law, a company may not exculpate an office holder from liability for a breach of the duty of loyalty. An Israeli company may exculpate an office holder in advance from liability, in whole or in part, for damages caused as a result of a breach of duty of care but only if a provision authorizing such exculpation is included in its articles of association. Our amended and restated articles of association include such a provision. An Israeli company may not exculpate a director from liability arising out of a prohibited dividend or distribution to shareholders.
An Israeli company may indemnify an office holder in respect of the following liabilities and expenses incurred for acts performed as an office holder, either in advance of an event or following an event, provided a provision authorizing such indemnification is contained in its articles of association:
| | • | | a financial liability imposed on him or her in favor of another person pursuant to a judgment, including a settlement or arbitrator’s award approved by a court. However, if an undertaking to indemnify an office holder with respect to such liability is provided in advance, then such an undertaking must be limited to events which, in the opinion of the board of directors, can be foreseen based on the company’s activities when the undertaking to indemnify is given, and to an amount or according to criteria determined by the board of directors as reasonable under the circumstances, and such undertaking shall detail the abovementioned events and amount or criteria; |
| | • | | reasonable litigation expenses, including legal fees, incurred by the office holder (1) as a result of an investigation or proceeding instituted against him or her by an authority authorized to conduct such investigation or proceeding, provided that (i) no indictment was filed against such office holder as a result of such investigation or proceeding; and (ii) no financial liability, such as a criminal penalty, was imposed upon him or her as a substitute for the criminal proceeding as a result of such investigation or proceeding or, if such financial liability was imposed, it was imposed with respect to an offense that does not require proof of criminal intent; and (2) in connection with a monetary sanction; |
| | • | | reasonable litigation expenses, including legal fees, incurred by the office holder or imposed by a court in proceedings instituted against him or her by the company, on its behalf or by a third-party or in connection with criminal proceedings in which the office holder was acquitted or as a result of a conviction for an offense that does not require proof of criminal intent; and |
| | • | | expenses, including reasonable litigation expenses and legal fees, incurred by an office holder in relation to an administrative proceeding instituted against such office holder, or certain compensation payments made to an injured party imposed on an office holder by an administrative proceeding, pursuant to certain provisions of the Israeli Securities Law, 1968 (the “Israeli Securities Law”). |
An Israeli company may insure an office holder against the following liabilities incurred for acts performed as an office holder if and to the extent provided in the company’s articles of association:
| | • | | a breach of the duty of loyalty to the company, to the extent that the office holder acted in good faith and had a reasonable basis to believe that the act would not prejudice the company; |
| | • | | a breach of the duty of care to the company or to a third-party, including a breach arising out of the negligent conduct of the office holder; |
| | • | | a financial liability imposed on the office holder in favor of a third-party; |
| | • | | a financial liability imposed on the office holder in favor of a third-party harmed by a breach in an administrative proceeding; and |
| | • | | expenses, including reasonable litigation expenses and legal fees, incurred by the office holder as a result of an administrative proceeding instituted against him or her, pursuant to certain provisions of the Israeli Securities Law. |
An Israeli company may not indemnify or insure an office holder against any of the following:
| | • | | a breach of the duty of loyalty, except to the extent that the office holder acted in good faith and had a reasonable basis to believe that the act would not prejudice the company; |
| | • | | a breach of the duty of care committed intentionally or recklessly, excluding a breach arising out of the negligent conduct of the office holder; |
| | • | | an act or omission committed with intent to derive illegal personal benefit; or |
| | • | | a fine, monetary sanction or forfeit levied against the office holder. |
Under the Companies Law, exculpation, indemnification and insurance of office holders must be approved by the compensation committee and the board of directors (and, with respect to directors and the chief executive officer, by the shareholders). However, under regulations promulgated under the Companies Law, the insurance of office holders does not require shareholder approval and may be approved by only the compensation committee, if the engagement terms are determined in accordance with the company’s compensation policy, which was approved by the shareholders by the same special majority required to approve a compensation policy, provided that the insurance policy is on market terms and the insurance policy is not likely to materially impact the company’s profitability, assets or obligations.
Our amended and restated articles of association allow us to exculpate, indemnify and insure our office holders for any liability imposed on them as a consequence of an act (including any omission) which was performed by virtue of being an office holder. Our office holders are currently covered by a directors and officers’ liability insurance policy.
We have entered into agreements with each of our directors and executive officers exculpating them in advance, to the fullest extent permitted by law, from liability to us for damages caused to us as a result of a breach of duty of care, and undertaking to indemnify them to the fullest extent permitted by law. This indemnification is limited to events determined as foreseeable by the board of directors based on our activities, and to an amount or according to criteria determined by the board of directors as reasonable under the circumstances.
The maximum indemnification amount set forth in such agreements is limited to an amount equal to the higher of $250,000,000, 25% of our total shareholders’ equity as reflected in our most recent consolidated financial statements prior to the date on which the indemnity payment is made, and 10% of our total market cap calculated based on the average closing prices of our ordinary shares over the 30 trading days prior to the actual payment, multiplied by the total number of our issued and outstanding shares as of the date of the payment (other than indemnification for an offering of securities to the public, including by a shareholder in a secondary offering, in which case the maximum indemnification amount is limited to the gross proceeds raised by us and/or any selling shareholder in such public offering). The maximum amount set forth in such agreements is in addition to any amount paid (if paid) under insurance and/or by a third-party pursuant to an indemnification arrangement.
In the opinion of the SEC, indemnification of directors and office holders for liabilities arising under the Securities Act, however, is against public policy and therefore unenforceable.
There is no pending litigation or proceeding against any of our office holders as to which indemnification is being sought, nor are we aware of any pending or threatened litigation that may result in claims for indemnification by any office holder.
As of December 31, 2021, we had 473 employees worldwide, including 260 in research and development. Of these employees, 282 are in Israel and 191 are in our international locations.
In regards to our Israeli employees, Israeli labor laws govern the length of the workday, minimum wages for employees, procedures for hiring and dismissing employees, determination of severance pay, annual leave, sick days, convalescence, advance notice of termination of employment, equal opportunity and anti-discrimination laws and other conditions of employment.
Subject to certain exceptions, Israeli law generally requires severance pay upon the retirement, death or dismissal of an employee, without due cause, and requires us and our employees to make payments to the National Insurance Institute, which is similar to the U.S. Social Security Administration. Pursuant to Section 14 of the Israeli Severance Pay Law, 5723-1963 (“Section 14”), our executive officers and key employees in Israel are entitled to monthly deposits, at a rate of 8.33% of their monthly salary, made in their name with insurance companies. Payments under Section 14 relieve us from any of the aforementioned future severance payment obligations with respect to those employees and, as such, we may only utilize the insurance policies for the purpose of disbursement of severance pay. As a result, we do not recognize an asset nor liability for these employees.
Extension orders issued by the Israeli Ministry of Economy and Industry apply to us and affect matters such as cost of living adjustments to salaries, length of working hours and week, recuperation pay, travel expenses and pension rights.
We have never experienced labor-related work stoppages or strikes and believe that our relations with our employees are satisfactory.
For information regarding the share ownership of directors and officers, see. “Major Shareholders” in Item 7.A below. For information as to our equity incentive plans, see “Share Incentive Plans.” in Item 6.B above.
Item 7. Major Shareholders and Related Party Transactions
The following table sets forth information with respect to the beneficial ownership of our ordinary shares as of March 21, 2022 by:
| | • | | each person or group of affiliated persons known by us to own beneficially more than 5% of our outstanding ordinary shares; |
| | • | | each of our directors and executive officers individually; and |
| | • | | all of our executive officers and directors as a group. |
The beneficial ownership of ordinary shares is determined in accordance with the SEC rules and generally includes any ordinary shares over which a person exercises sole or shared voting or investment power.
For purposes of the table below, we deem ordinary shares subject to options, RSUs or warrants that are exercisable (or settled, as the case may be) within 60 days of March 21, 2022 to be outstanding and to be beneficially owned by the person holding the options or warrants for the purposes of computing the ownership and percentage ownership of that person but we do not treat them as outstanding for the purpose of computing the ownership or percentage ownership of any other person, except with respect to the ownership and percentage ownership of all executive officers and directors as a group. The percentage of shares beneficially owned is based on 155,654,378 ordinary shares outstanding as of March 21, 2022. Unless otherwise noted below, the address of each shareholder listed below is 25 Basel Street, Petah Tikva, 4951038, Israel.
A description of any material relationship that our principal shareholders have had with us or any of our affiliates within the past three years is included under “Related Party Transactions”.
| | | Number of Ordinary Shares | |
| Name of Beneficial Owner | | Amount and Nature of
Beneficial Ownership | | | Percentage of
Outstanding
shares | | | Percentage of
Voting Power | |
| | |
| Principal Shareholders | | | | | | | | | |
Red Dot Capital Partners L.P.(1) | | | 14,737,000 | | | | 9.47 | % | | | 9.47 | % |
Deutsche Post Beteiligungen Holding GmbH(2) | | | 21,423,600 | | | | 13.76 | % | | | 13.76 | % |
Cross Ship S.à r.l.(3) | | | 21,831,075 | | | | 14.03 | % | | | 14.03 | % |
Shopify Inc. and its affiliates (4) | | | 14,451,558 | | | | 9.28 | % | | | 9.28 | % |
FMR LLC and its affiliate (5) | | | 8,705,225 | | | | 5.59 | % | | | 5.59 | % |
Abdiel Qualified Master Fund, LP and its affiliates (6) | | | 8,554,841 | | | | 5.50 | % | | | 5.50 | % |
| Directors, Director Nominees and Executive Officers | | | | | | | | | | | | |
Amir Schlachet (7) | | | 5,766,474 | | | | 3.7 | % | | | 3.7 | % |
Shahar Tamari (8) | | | 5,765,932 | | | | 3.7 | % | | | 3.7 | % |
Nir Debbi (9) | | | 6,005,782 | | | | 3.8 | % | | | 3.8 | % |
Eden Zaharoni (10) | | | 327,378 | | | | 0.2 | % | | | 0.2 | % |
Ofer Koren (11) | | | 341,250 | | | | 0.2 | % | | | 0.2 | % |
| Ran Fridman | | | | | | | | | | | | |
Thomas Studd(12) | | | | | | | | | | | | |
Miguel Angel Parra(13) | | | | | | | | | | | | |
Tzvia Broida (14) | | | 4,010 | | | | * | | | | * | |
Anna J. Bakst (15) | | | 4,010 | | | | * | | | | * | |
Iris Epple-Righi (16) | | | 4,010 | | | | * | | | | * | |
| All executive officers and directors as a group (11 persons) | | | 18,218,846 | | | | 11.6 | % | | | 11.6 | % |
| * | Indicates ownership of less than 1%. |
| | |
| (1) | This information is based on a Schedule 13G filed with the SEC on February 7, 2022. Red Dot Capital Partners, L.P. may be deemed to be the beneficial owner of 14,737,000 ordinary shares. The address for Red Dot Capital Partners, L.P. is 1 Ha’Shikma St. P.O.B 89 Savyon 5691502 Israel. |
| | |
| (2) | Represents 21,423,600 ordinary shares held by Deutsche Post Beteiligungen Holding GmbH which is affiliated with DHL International GmbH. The address for the Deutsche Post Beteiligungen Holding GmbH is Charles-de-Gaulle-Straße 20, 53113 Bonn. Federal Republic of Germany. |
| (3) | This information is based on a Schedule 13G filed with the SEC on February 11, 2022. Cross Ship S.à r.l., Vitruvian III Luxembourg S.à r.l., VIP III Nominees Limited, and Vitruvian Partners LLP may be deemed to be the beneficial owners of 21,831,075 ordinary shares. VIP III LP may be deemed to be the beneficial owner of 21,503,609 ordinary shares, and VIP III CO-INVEST LP may be deemed to be the beneficial owner of 327,466 ordinary shares. Cross Ship S.à r.l. is wholly owned by Vitruvian Investment II Luxembourg S.à r.l. (“Vitruvian Luxembourg”). VIP III Nominees Limited, an England and Wales limited liability company (“VIP Nominees”) and in its capacity as nominee for and on behalf of VIP III LP, an English limited partnership and VIP III Co-Invest LP, a Jersey limited partnership (collectively, the “Funds”), are the sole legal shareholder of Vitruvian Luxembourg. Vitruvian Partners LLP, an England and Wales limited liability partnership (“Vitruvian Partners”) is the manager of the Funds, and sole shareholder of VIP Nomine LLP. The address of the principal business office of VIP Nominees, VIP III LP and Vitruvian Partners is 105 Wigmore Street, London W1U 1QY; the address of the principal business office of VIP III Co-Invest LP is 12 Castle Street, St Helier, Jersey JE2 3RT; and the address of the principal business office of Cross Ship and Vitruvian Luxembourg is 21, rue Philippe II, L-2340 Luxembourg. |
| (4) | This information is based on a Schedule 13G filed with the SEC on January 7, 2022. Shopify Inc. may be deemed to be the beneficial owner of all of the reported shares and Shopify International Limited may be deemed to be beneficially own 12,689,569 ordinary shares consisting of: (i) vested warrants exercisable for 11,701,759 ordinary shares, and (ii) warrants exercisable for an additional 987,810 ordinary shares that have vested within 60 days of January 6, 2022 (On each of February 12, 2022 and March 12, 2022 Shopify International Limited exercised 493,905 warrants to ordinary shares). Shopify Strategic Holdings LLC, a wholly owned subsidiary of Shopify Inc., is deemed to beneficially own 1,761,989 ordinary shares consisting of: (i) 472,925 ordinary shares directly held by it, and (ii) vested warrants exercisable for 1,289,064 ordinary shares. The principal business address of Shopify Inc. is 151 O’Connor Street, Ground Floor, Ottawa, Ontario, Canada K2P 2L8.The principal business address of Shopify International Limited is 2nd Floor Victoria Buildings 1-2 Haddington Road, Dublin 4, D04 XN32, Ireland. |
| | |
| (5) | This information is based on a Schedule 13G filed with the SEC on February 9, 2022. Both FMR LLC and Abigail P. Johnson may be deemed to be the beneficial owners of 8,705,225 ordinary shares. Abigail P. Johnson is a Director, the Chairman and the Chief Executive Officer of FMR LLC. Members of the Johnson family, including Abigail P. Johnson, are the predominant owners, directly or through trusts, of Series B voting common shares of FMR LLC, representing 49% of the voting power of FMR LLC. The Johnson family group and all other Series B shareholders have entered into a shareholders' voting agreement under which all Series B voting common shares will be voted in accordance with the majority vote of Series B voting common shares. Accordingly, through their ownership of voting common shares and the execution of the shareholders' voting agreement, members of the Johnson family may be deemed, under the Investment Company Act of 1940, to form a controlling group with respect to FMR LLC. Neither FMR LLC nor Abigail P. Johnson has the sole power to vote or direct the voting of the shares owned directly by the various investment companies registered under the Investment Company Act ("Fidelity Funds") advised by Fidelity Management & Research Company LLC ("FMR Co. LLC"), a wholly owned subsidiary of FMR LLC, which power resides with the Fidelity Funds' Boards of Trustees. FMR Co. LLC carries out the voting of the shares under written guidelines established by the Fidelity Funds' Boards of Trustees. The address of FMR LLC and Abigail P. Johnson is 245 Summer Street, Boston, Massachusetts 02210. |
| | |
| (6) | This information is based on a Schedule 13G filed with the SEC on February 3, 2022. Abdiel Qualified Master Fund, LP may be deemed to be the beneficial owner of 8,554,841 ordinary shares. Abdiel Capital, LP, may be deemed to be the beneficial owner of 263,116 ordinary shares, Abdiel Capital Management, LLC, Abdiel Capital Advisors, LP and Colin T. Moran may be deemed to be the beneficial owners of all reported shares. Abdiel Capital Management, LLC and Abdiel Capital Advisors, LP serve as the general partner and the investment manager, respectively, of Abdiel Qualified Master Fund, LP and Abdiel Capital, LP. Colin T. Moran serves as managing member of Abdiel Capital Management, LLC and Abdiel Capital Partners, LLC, which serves as the general partner of Abdiel Capital Advisors, LP. Each of the reporting persons disclaims beneficial ownership of the shares reported herein except to the extent of its or his pecuniary interest therein. The address for the reporting persons is 90 Park Avenue, 29th Floor, New York, NY 10016.
|
| (7) | Includes 4,280,472 ordinary shares that Mr. Schlachet holds directly, 17,202 restricted share units that will be settled within 60 days of March 21, 2022, and 1,468,800 ordinary shares underlying options that were fully vested as at December 31, 2021. |
| (8) | Includes 4,279,930 ordinary shares that Mr. Tamari holds directly, 17,202 restricted share units that will be settled within 60 days of March 21, 2022, and 1,468,800 ordinary shares underlying options that were fully vested as at December 31, 2021. |
| (9) | Includes 4,519,780 ordinary shares that Mr. Debbi holds directly, 17,202 restricted share units that will be settled within 60 days of March 21, 2022, and 1,468,800 ordinary shares underlying options that were fully vested as at December 31, 2021. |
| (10) | Includes 327,378 ordinary shares underlying options that will be exercisable within 60 days of March 21, 2022. |
| (11) | Includes 341,250 ordinary shares underlying options that will be exercisable within 60 days of March 21, 2022. |
| (12) | Mr. Studd holds no shares directly. Mr. Studd is a partner at the Vitruvian Group, which manages funds that collectively own ordinary shares. See note 4 above. Mr. Studd disclaims beneficial ownership of the ordinary shares held by Cross Ship S.à r.l., except to the extent of his pecuniary interest, if any, in such ordinary shares by virtue of his interest in the Vitruvian Group and his indirect limited partnership interest in the Vitruvian Group. |
| (13) | Mr. Parra holds no shares directly. Mr. Parra serves as the Chief Executive Officer of DHL Express Americas which is affiliated with Deutsche Post Beteiligungen Holding GmbH. |
| (14) | This information is based on restricted share units that will be exercisable within 60 days of March 21, 2022. |
| (15) | This information is based on restricted share units that will be exercisable within 60 days of March 21, 2022. |
| (16) | This information is based on restricted share units that will be exercisable within 60 days of March 21, 2022. |
Significant Changes in Ownership
To our knowledge, other than as disclosed in the table above, our other filings with the SEC and this Annual Report, there has been no significant change in the percentage ownership held by any major shareholder during the past three years.
No major shareholders listed above had or have voting rights with respect to their ordinary shares that are different from the voting rights of other holders of our ordinary shares. See “Voting Rights” in I Exhibit 2.2 attached to this Annual Report.
Change in Control Arrangements
We are not aware of any arrangement that may at a subsequent date, result in a change of control of the Company.
Based on a review of the information provided to us by our transfer agent, as of March 21, 2022, there were 56 registered holders of our ordinary shares, including Cede & Co., the nominee of The Depository Trust Company, 32 of which are United States registered holders, holding approximately 55% of our outstanding ordinary shares. The number of record holders in the United States is not representative of the number of beneficial holders nor is it representative of where such beneficial holders are resident since many of these ordinary shares were held by brokers or other nominees.
| B. | Related Party Transactions |
Our policy is to enter into transactions with related parties on terms that, on the whole, are no more or less favorable than those available from unaffiliated third parties. Based on our experience in the business sectors in which we operate and the terms of our transactions with unaffiliated third parties, we believe that all of the transactions described below met this policy standard at the time they occurred.
The following is a description of related-party transactions we have entered into since January 1, 2019 with any of the members of the board of directors, executive officers or holders of more than 5% of any class of our voting securities at the time of such transaction.
Agreements with Directors and Officers
Employment Agreements. We have entered into written employment agreements with each of our executive officers. See “Employment and Consulting Agreements with Executive Officers” in Item 6.B above.
Equity Awards. Since our inception, we have granted to our executive officers and certain of our directors restricted share units and options to purchase our ordinary shares. Such award agreements may contain acceleration provisions upon certain transactions. See “Share Incentive Plans” in Item 6.B above.
Exculpation, Indemnification and Insurance. Our amended and restated articles of association permit us to exculpate, indemnify and insure certain of our office holders to the fullest extent permitted by the Companies Law. We have entered into agreements with each of our directors and executive officers, exculpating them in advance from a breach of their duty of care to the fullest extent permitted by law and undertaking to indemnify them to the fullest extent permitted by law, subject to certain exceptions. See “Exculpation, Insurance and Indemnification of Office Holders.”
Equity Financing
Series E Preferred Share Primary Financing and Secondary Sale
On April 20, 2020, we sold an aggregate of 23,706 Series E preferred shares, each having a par value of NIS 0.01 at a price per share of $2,498.65 for an aggregate purchase price of $59,232,997. The following table summarizes purchases of our Series E preferred shares by related persons:
| | Series E
Preferred
Shares | | | Total
Purchase
Price ($) | |
| Cross Ship S.à r.l. | | | 20,011 | | | | 50,000,485.15 | |
| Deutsche Post Beteiligungen Holdings GmbH | | | 3,695 | | | | 9,232,511.75 | |
In conjunction with the foregoing issuance of Series E preferred shares, certain of our shareholders (including Amir Schlachet, Nir Debbi, Shahar Tamari) sold to Cross Ship S.à r.l. an aggregate of 5,547 ordinary shares and 11,179 preferred shares for an aggregate purchase price of approximately $35.3 million.
Underwriting Agreement for September Secondary Follow-On Offering
We entered into an underwriting agreement, dated September 9, 2021, with certain selling shareholders named therein, or the Selling Shareholders, and Goldman Sachs & Co. LLC, Morgan Stanley & Co. LLC, and Jefferies LLC, as representatives of the several underwriters named therein, for the underwritten secondary follow-on offering, by the underwriters, of 12,000,000 of our ordinary shares held by the Selling Shareholders, plus an additional 1,800,000 ordinary shares pursuant to a 30-day option granted to the underwriters by the Selling Shareholders that was exercised in full. We did not receive any proceeds from the sale of our ordinary shares by the Selling Shareholders. We and the Selling Shareholders have agreed to indemnify the underwriters against certain liabilities, including liabilities under the Securities Act.
DHL Service Agreement and Commercial Letter
We are party to a Commercial Letter with DHL International GmbH (“DHL International”), dated March 27, 2017 and amended on December 7, 2020, pursuant to which we use DHL International exclusively for the provision of express shipping services to our merchants, subject to certain exclusions described therein, and DHL International has undertaken certain commitments relating to the prices under which its services are offered to us. In recent months we have negotiated and reached commercial understandings regarding the terms under which such foregoing agreement will be extended until 2025.
In addition, we are party to a services agreement with DHL International (UK) Limited (“DHL UK”), dated May 21, 2019, under which DHL UK provides us with express shipping services relating to the purchase and sale of our merchants’ products. The service agreement continues until terminated by either us or DHL UK in accordance with its terms. The consideration paid by us to DHL UK pursuant to the service agreement is contingent upon the extent of the shipping services provided. We have entered similar arrangements with other DHL affiliated entities in the Netherlands, the United States, France and Spain.
See Note 11 to our audited consolidated financial statements appearing elsewhere in this Annual Report and Note 7 to our unaudited consolidated financial statements appearing elsewhere in this Annual Report.
We are party to the 2021 Shopify Agreement with Shopify, dated April 12, 2021, pursuant to which we are an exclusive third-party provider of an end-to-end cross-border solution that includes localization, merchant of record, duty and tax calculation and remittance, and shipping services for merchants in a single solution with permissions to access and integrate into the Shopify platform checkout. Shopify however will be entitled to offer its own native, whitelabel, or branded partnership merchant of record solution to any merchants without limitation. We will pay Shopify a fee equal to a percentage of the GMV for all transactions processed through our platform for applicable Shopify merchants. Although payment of such fee may initially negatively impact margins, we believe that our expanded partnership will afford us an enhanced market position, enabling us to increase GMV, and positions us to realize efficiencies in winning and onboarding Shopify merchants as a result of our permissions to access and exclusively integrate into the Shopify platform checkout.
The agreement has an initial three-year term ending in April 2024, which automatically renews for additional and successive one-year terms unless either party provides the other party with written notice of election to terminate the agreement at least 180 days prior to the end of any such term. Either party may immediately terminate the agreement without cause by providing at least 180 days’ prior written notice to the other party. In addition, upon the occurrence of certain events, either party may terminate the agreement immediately upon notice to the other party.
See Note 15 to our audited consolidated financial statements appearing elsewhere in this Annual Report.
On April 12, 2021, we entered into a warrant agreement (the “Original Shopify Warrant”) with Shopify pursuant to which we issued warrants to purchase up to an aggregate of 19,604,239 of our ordinary shares at a price of $0.01 per share expiring upon the earlier of April 12, 2031 and immediately prior to consummation of a merger or acquisition. The Original Shopify Warrant was issued in connection with the 2021 Shopify Agreement and 7,750,513 of the shares issuable under the Original Shopify Warrant were vested and became exercisable upon the entry into the 2021 Shopify Agreement on April 12, 2021. The remaining 11,853,726 ordinary shares issuable under the Original Shopify Warrant vest monthly, in equal amounts over a 24-month period, commencing on the second monthly anniversary of the effective date of the 2021 Shopify Agreement, and are subject to accelerated vesting (i) upon termination of the 2021 Shopify Agreement by us for convenience and (ii) immediately prior to a merger and acquisition. On April 19, 2021, Shopify partially exercised the Shopify Warrant for 7,750,513 ordinary shares, at an exercise price of $0.01 per share. On April 21, 2021, we issued Shopify a replacement warrant (the “Shopify First Replacement Warrant”) to purchase up to an aggregate of 11,853,726 ordinary shares at a price of $0.01 per share on substantially similar terms as the Original Shopify Warrant. On June 29, 2021, Shopify partially exercised the Shopify First Replacement Warrant for 987,810 ordinary shares, at an exercise price of $0.01 per share. On July 14, 2021, we issued Shopify a replacement warrant (the “Shopify Second Replacement Warrant”) to purchase up to an aggregate of 10,865,916 ordinary shares at a price of $0.01 per share on substantially similar terms as the Shopify First Replacement Warrant. The Shopify Second Replacement Warrant contains customary provisions for the adjustment of the exercise price and the number of ordinary shares issuable upon exercise in the event of certain share dividends, share splits, reorganizations, recapitalizations, consolidations, mergers, or similar events affecting our ordinary shares and diluting issuances.
The ordinary shares issuable to Shopify upon exercise of the foregoing are entitled to certain registration rights under the Investors’ Rights Agreement as described in greater detail below in the section titled “Registration Rights” in Item 7.B below.
Concurrently with the acquisition of Flow, we agreed to expand our existing partnership with Shopify and entered into the 2022 Shopify Agreement. Pursuant to the 2022 Shopify Agreement, Flow or its affiliate, are the exclusive provider of certain natively integrated cross-border solutions for Shopify’s merchants, including the ability for the merchants to sell their goods to Flow for sale to global customers on a one-to-one basis. The extended partnership between the parties is intended to enhance the offering to select Shopify merchants, among other things, catering for small and emerging brands and expand the capabilities and customer base in the segment.
The 2022 Shopify Agreement has an initial three-year term, which automatically renews for additional and successive one-year terms unless either party provides the other party with written notice of election to terminate the agreement at least 180 days prior to the end of any such term. Either party may immediately terminate the agreement during the 12-month period commencing with the effective date, without cause by providing at least 180 days’ prior written notice to the other party. In addition, upon the occurrence of certain events, either party may terminate the agreement immediately upon notice to the other party.
In connection with the execution of the 2022 Shopify Agreement, we issued to Shopify warrants (the “2022 Shopify Warrants”) to purchase (A) up to an aggregate of 1,289,064 of our ordinary shares for a purchase price of $0.01 per share which vested on the date of the 2022 Shopify Agreement (and were exercised in full on February 2, 2022), and (B) up to an aggregate of 738,081 of our ordinary shares for a purchase price of $0.01 per share which vest upon certain performance milestones.
Registration Rights
Our amended and restated investors’ rights agreement entitles certain of our shareholders to certain registration rights, as set forth below. In accordance with this agreement, and subject to conditions listed below, the following entities which as of the date of this Annual Report beneficially own more than 5% of our ordinary shares are entitled to registration rights: entities affiliated with each of DHL., Cross Ship S.à r.l and Shopify Inc.
Form F-1 Demand Rights. The holders of at least 30% of the registrable securities then outstanding may request that we register all or a portion of their shares. Such request for registration must cover securities the aggregate offering price of which, after payment of the underwriting discount and commissions, would exceed $5,000,000. We will not be required to effect more than two registrations on Form F-1 that have been declared effective. The company has the right to defer such registration under certain circumstances.
Form F-3 Demand Rights. The holders of at least 30% of the registrable securities then outstanding can make a request that we register their shares on Form F-3 if we are qualified to file a registration statement on Form F-3 and if the offering price, after payment of the underwriting discount and commissions, would equal or exceed $5,000,000. The company has the right to defer such registration under certain circumstances.
Piggyback Registration Rights. In the event that we propose to register any of our securities under the Securities Act, either for our own account or for the account of other security holders, then certain holders of our ordinary shares will be entitled, subject to any lock-up restrictions imposed by the underwriters in connection with our initial public offering (whether such restrictions terminate by their terms or are waived by the underwriters), to certain piggyback registration rights with respect to such offering, allowing such holders to include their shares in such registration, subject to certain marketing and other limitations. As a result, whenever we propose to file a registration statement under the Securities Act, other than with respect to (i) a registration relating solely to the sale of securities to participants in a company stock plan, (ii) a registration relating to a corporate reorganization or other transaction listed in Rule 145 under the Securities Act and (iii) a registration on any form that does not include substantially the same information as would be required to be included in a registration statement covering the sale of the registrable securities, the holders of these shares are entitled to notice of the registration and have the right, subject to certain limitations, to include their shares in the registration.
Related Party Transactions Policies and Procedures
Our board of directors has adopted a written related party transaction policy setting forth the policies and procedures for the review and approval or ratification of related person transactions. This policy covers any transaction, arrangement or relationship, or any series of similar transactions, arrangements or relationships, in which we were or are to be a participant, where the related person had or will have a direct or indirect material interest, including, without limitation, purchases of goods or services by or from the related person or entities in which the related person has a material interest, indebtedness, guarantees of indebtedness and employment by us of a related person.
| C. | Interests of Experts and Counsel |
Not applicable.
Item 8. Financial Information
| A. | Consolidated Statements and Other Financial Information |
Consolidated Financial Statements
See Item 18. “Financial Statements.”
Legal and Arbitration Proceedings
From time to time, we may become involved in legal or regulatory proceedings arising in the ordinary course of our business. We are not currently a party to any material litigation or regulatory proceeding and we are not aware of any pending or threatened litigation or regulatory proceeding against us that could have a material adverse effect on our business, operating results, financial condition or cash flows.
We have never declared or paid any dividends on our ordinary shares. We do not anticipate paying any dividends in the foreseeable future. We currently intend to retain future earnings, if any, to finance operations and expand our business. Our board of directors has sole discretion whether to pay dividends. If our board of directors decides to pay dividends, the form, frequency and amount will depend upon our future operations and earnings, capital requirements and surplus, general financial condition, contractual restrictions and other factors that our directors may deem relevant. The Companies Law imposes restrictions on our ability to declare and pay dividends. See “Dividend and Liquidation Rights” in Item 10.B below for additional information.
Payment of dividends may be subject to Israeli withholding taxes. See “Israeli Tax Considerations” in Item 10.E below for additional information.
None.
Item 9. The Offer and Listing
| A. | Offer and Listing Details |
Our ordinary shares commenced trading on the Nasdaq Global Select Market on May 11, 2021, under the symbol “GLBE”. Prior to this, no public market existed for our ordinary shares.
Not applicable.
See “—Offer and Listing Details” above.
Not applicable.
Not applicable.
Not applicable.
Item 10. Additional Information
Not applicable.
| B. | Memorandum and Articles of Association |
A copy of our amended and restated articles of association is filed as Exhibit 1.1 to this Annual Report. Other than as set forth below, the information called for by this Item is set forth in Exhibit 2.2 to this Annual Report.
We have not entered into any material contracts within the two years prior to the date of this annual report, other than contracts entered into in the ordinary course of business, or as otherwise described herein in Item 4.A “History and Development of the Company”, Item 4.B “Business Overview”, Item 5.B “Operating and Financial Review and Prospects—Liquidity and Capital Resources”, Item 6.C “Board Practices” and Item 7.B “Related Party Transactions”.
There are currently no Israeli currency control restrictions on remittances of dividends on our ordinary shares, proceeds from the sale of the ordinary shares or interest or other payments to non-residents of Israel, except for shareholders who are subjects of countries that are, have been, or will be, in a state of war with Israel.
The following description is not intended to constitute a complete analysis of all tax consequences relating to the acquisition, ownership and disposition of our ordinary shares. You should consult your own tax advisor concerning the tax consequences of your particular situation, as well as any tax consequences that may arise under the laws of any state, local, foreign or other taxing jurisdiction.
Israeli Tax Considerations
The following is a brief summary of the material Israeli tax laws applicable to us. This section also contains a discussion of material Israeli tax consequences concerning the ownership and disposition of our ordinary shares purchased by investors. This summary does not discuss all the aspects of Israeli tax law that may be relevant to a particular investor in light of his or her personal investment circumstances or to some types of investors subject to special treatment under Israeli law. Examples of such investors include residents of Israel or traders in securities who are subject to special tax regimes not covered in this discussion. To the extent that the discussion is based on new tax legislation that has not yet been subject to judicial or administrative interpretation, we cannot assure you that the appropriate tax authorities or the courts will accept the views expressed in this discussion. The discussion below is subject to change, including due to amendments under Israeli law or changes to the applicable judicial or administrative interpretations of Israeli law, which change could affect the tax consequences described below. The discussion should not be construed as legal or professional tax advice and does not cover all possible tax considerations.
General Corporate Tax Structure in Israel
Israeli companies are generally subject to corporate tax. The current corporate tax rate is 23%. Capital gains derived by an Israeli company are generally subject to the prevailing corporate tax rate.
Tax Benefits and Grants for Research and Development
Israeli tax law allows, under certain conditions, a tax deduction for expenditures, including capital expenditures, related to scientific research and development for the year in which they are incurred. Expenditures are deemed related to scientific research and development projects, if:
| | • | | the expenditures are approved by the relevant Israeli government ministry, determined by the field of research; |
| | • | | the research and development must be for the promotion of the company; and |
| | • | | the research and development are carried out by or on behalf of the company seeking such tax deduction. |
The amount of such deductible expenses is reduced by the sum of any funds received through government grants for the finance of such scientific research and development projects. Under these research and development deduction rules, no deduction is allowed for any expense invested in an asset depreciable under the general depreciation rules of the Israeli Income Tax Ordinance (New Version), 5721-1961, referred to as the Ordinance. Expenditures that do not qualify for this special deduction are deductible in equal amounts over three years.
From time to time we may apply to the National Authority for Technological Innovation (the “IIA”) for approval to allow a tax deduction for all research and development expenses during the year incurred. There can be no assurance that such request will be granted.
Taxation of Non-Israeli Resident Shareholders
Israeli capital gains tax is imposed on the disposition of capital assets by a non-Israeli resident if those assets (i) are located in Israel, (ii) are shares or a right to shares in an Israeli resident corporation or (iii) represent, directly or indirectly, rights to assets located in Israel, unless a tax treaty between Israel and the seller’s country of residence provides otherwise. The Israeli tax law distinguishes between “Real Capital Gain” and “Inflationary Surplus.” Inflationary Surplus is a portion of the total capital gain which is equivalent to the increase in the relevant asset’s price that is attributable to the increase in the Israeli Consumer Price Index or, in certain circumstances, a foreign currency exchange rate, between the date of purchase and the date of disposition. Inflationary Surplus is currently not subject to tax in Israel. Real Capital Gain is the excess of the total capital gain over the Inflationary Surplus.
Generally, Real Capital Gain accrued by individuals on the sale of our ordinary shares will be taxed at the rate of 25%. However, if the individual shareholder claims deduction of interest and linkage differences expenses in connection with the purchase and holding of such shares or is a “substantial shareholder” at the time of sale or at any time during the preceding 12-month period, such gain will be taxed at the rate of 30%. A “substantial shareholder” is generally a person who alone or together with such person’s relative or another person who collaborates with such person on a permanent basis, holds, directly or indirectly, at least 10% of any of the “Means of Control” of the corporation. “Means of Control” generally include the right to vote, receive profits, nominate a director or an executive officer, receive assets upon liquidation, or order someone who holds any of the aforesaid rights how to act, regardless of the source of such right. Real Capital Gain derived by corporations will be generally subject to a corporate tax rate (23% in 2021).
Generally, a non-Israeli resident (individuals and corporations) who derives capital gains from the sale of shares of an Israeli resident company that were purchased after the company was listed for trading on a stock exchange outside of Israel will be exempt from Israeli capital gains tax so long as the shares were not held through a permanent establishment that the non-Israeli resident maintains in Israel. However, non-Israeli corporations will not be entitled to the foregoing exemption if Israeli residents (i) have a controlling interest of more than 25% in any of the means of control of such non-Israeli corporation or (ii) are the beneficiaries of, or are entitled to, 25% or more of the revenues or profits of such non-Israeli corporation, whether directly or indirectly.
In addition, such exemption is not applicable to a person whose gains from selling or disposing the shares are deemed to be business income.
Additionally, a sale of securities by a non-Israeli resident may be exempt from Israeli capital gains tax under the provisions of an applicable tax treaty. For example, under the tax treaty between the Government of the United States of America and the Government of the State of Israel with respect to Taxes on Income, as amended (the “United States-Israel Tax Treaty”), the sale, exchange or other disposition of shares by a shareholder who is a United States resident (for purposes of the United States-Israel Tax Treaty) holding the shares as a capital asset and is entitled to claim the benefits afforded to such a resident by the United States-Israel Tax Treaty (a “Treaty U.S. Resident”) is generally exempt from Israeli capital gains tax unless: (i) the capital gain arising from such sale, exchange or disposition is attributed to real estate located in Israel; (ii) the capital gain arising from such sale, exchange or disposition is attributed to royalties; (iii) the capital gain arising from the such sale, exchange or disposition is attributed to a permanent establishment in Israel, under certain terms; (iv) such Treaty U.S. Resident holds, directly or indirectly, shares representing 10% or more of the voting rights during any part of the 12-month period preceding the disposition, subject to certain conditions; or (v) such Treaty U.S. Resident is an individual and was present in Israel for 183 days or more during the relevant taxable year. In any such case, the sale, exchange or disposition of such shares would be subject to Israeli tax, to the extent applicable. However, under the United States-Israel Tax Treaty, a Treaty U.S. Resident may be permitted to claim a credit for the Israeli tax against the U.S. federal income tax imposed with respect to the sale, exchange or disposition of the shares, subject to the limitations under U.S. laws applicable to foreign tax credits. The United States-Israel Tax Treaty does not provide such credit against any U.S. state or local taxes.
In some instances where our shareholders may be liable for Israeli capital gains tax on the sale of our ordinary shares, the payment of the consideration for such sale may be subject to withholding of Israeli tax at source and holders of our ordinary shares may be required to demonstrate that they are exempt from tax on their capital gains in order to avoid withholding at source at the time of sale. Specifically, the Israel Tax Authority may require shareholders who are not liable for Israeli capital gains tax on such a sale to sign declarations in forms specified by the Israel Tax Authority, provide documents (including, for example, a certificate of residency) or obtain a specific exemption from the Israel Tax Authority to confirm their status as non-Israeli residents (and, in the absence of such declarations or exemptions, the Israel Tax Authority may require the purchaser of the shares to withhold tax at source).
Taxation on Receipt of Dividends. Non-Israeli residents (whether individuals or corporations) are generally subject to Israeli income tax on the receipt of dividends paid on our ordinary shares at the rate of 25%, which tax will be withheld at source, unless relief is provided in an applicable tax treaty between Israel and the shareholder’s country of residence. However, if the shareholder who is a “substantial shareholder” at the time of receiving the dividend or at any time during the preceding 12-month period, the applicable tax rate will be 30%. Such dividends are generally subject to Israeli withholding tax at a rate of 25% so long as the shares are registered with a nominee company (whether the recipient is a substantial shareholder or not).
However, a reduced tax rate may be provided under an applicable tax treaty. For example, under the United States-Israel Tax Treaty, the maximum rate of tax withheld at source in Israel on dividends paid to a holder of our ordinary shares who is a Treaty U.S. Resident is 25%. However, generally, the maximum rate of withholding tax on dividends that are paid to a United States corporation holding 10% or more of the outstanding voting rights throughout the tax year in which the dividend is distributed as well as during the previous tax year, is 12.5%, provided that not more than 25% of our gross income for such preceding year consists of certain types of dividends and interest. U.S. residents who are subject to Israeli withholding tax on a dividend may be entitled to a credit or deduction for United States federal income tax purposes in the amount of the taxes withheld, subject to detailed rules contained in the Code.
A non-Israeli resident who receives dividends from which tax was withheld is generally exempt from the obligation to file tax returns in Israel with respect to such income, provided that (i) such income was not generated from business conducted in Israel by the taxpayer, (ii) the taxpayer has no other taxable sources of income in Israel with respect to which a tax return is required to be filed, and (iii) the taxpayer is not obligated to pay excess tax (as further explained below).
Surtax. Individuals who are subject to income tax in Israel (whether any such individual is an Israeli resident or non-Israeli resident) are also subject to an additional tax at a rate of 3% on annual taxable income (including, but not limited to, income derived from dividends, interest and capital gains) exceeding NIS 647,640 for 2021, which amount is linked to the annual change in the Israeli consumer price index.
Estate and Gift Tax. Israeli law presently does not impose estate or gift taxes.
Law for the Encouragement of Industry (Taxes), 1969
The Law for the Encouragement of Industry (Taxes), 1969, and the regulations promulgated thereunder, generally referred to as the Industry Encouragement Law, provides several tax benefits for “Industry Companies.” We believe that we currently qualify as an Industrial Company within the meaning of the Industry Encouragement Law.
The Industry Encouragement Law defines an “Industrial Company” as a company resident in Israel, of which 90% or more of its income in a certain tax year, other than income from government loans, is derived from an “Industrial Enterprise” owned by it and located in Israel or in the “Area” in accordance with the definition under section 3A of the Ordinance. An “Industrial Enterprise” is defined as an enterprise whose principal activity in a given tax year is industrial production activity.
The following corporate tax benefits, among others, are available to Industrial Companies:
| | • | | Amortization of the cost of purchased know-how and patents and rights to use a patent and know-how which are used for the development or advancement of the Industrial Enterprise, over an eight-year period, commencing on the year in which such rights were first exercised; |
| | • | | Under limited conditions, an election to file consolidated tax returns with related Israeli Industrial Companies; |
| | • | | Expenses related to a public offering are deductible in equal amounts over a three-year period commencing on the year of the offering. |
Eligibility for benefits under the Industry Encouragement Law is not contingent upon the approval of any governmental authority. The Israeli tax authorities may determine that we do not qualify as an Industrial Company, which could entail our loss of the benefits that relate to this status. There can be no assurance that we will continue to qualify as an Industrial Company or that the benefits described above will be available in the future.
U.S. Federal Income Tax Consideration
The following summary describes certain United States federal income tax considerations generally applicable to United States Holders (as defined below) of our ordinary shares. This summary deals only with our ordinary shares held as capital assets within the meaning of Section 1221 of the Internal Revenue Code of 1986, as amended (“Internal Revenue Code”). This summary also does not address the tax consequences that may be relevant to holders in special tax situations including, without limitation, dealers in securities, traders that elect to use a mark-to-market method of accounting, holders that own our ordinary shares as part of a “straddle,” “hedge,” “conversion transaction,” or other integrated investment, banks or other financial institutions, individual retirement accounts and other tax-deferred accounts, insurance companies, tax-exempt organizations, United States expatriates, holders whose functional currency is not the U.S. dollar, holders subject to the alternative minimum tax, holders that acquired our ordinary shares in a compensatory transaction, holders which are entities or arrangements treated as partnerships for United States federal income tax purposes or holders that actually or constructively through attribution own 10% or more of the total voting power or value of our outstanding ordinary shares.
This summary is based upon the Internal Revenue Code, applicable United States Treasury regulations, administrative pronouncements and judicial decisions, in each case as in effect on the date hereof, all of which are subject to change (possibly with retroactive effect). No ruling will be requested from the Internal Revenue Service (“IRS”) regarding the tax consequences described herein, and there can be no assurance that the IRS will agree with the discussion set out below. This summary does not address any United States federal tax consequences other than United States federal income tax consequences (such as the estate and gift tax or the Medicare tax on net investment income).
As used herein, the term “United States Holder” means a beneficial owner of our ordinary shares that is, for United States federal income tax purposes, (i) an individual who is a citizen or resident of the United States, (ii) a corporation or other entity taxable as a corporation created or organized under the laws of the United States or any state thereof or therein or the District of Columbia, (iii) an estate the income of which is subject to United States federal income taxation regardless of its source, or (iv) a trust (a) that is subject to the supervision of a court within the United States and the control of one or more United States persons as described in Internal Revenue Code Section 7701(a)(30), or (b) that has a valid election in effect under applicable United States Treasury regulations to be treated as a “United States person.”
If an entity or arrangement treated as a partnership for United States federal income tax purposes acquires our ordinary shares, the tax treatment of a partner in the partnership generally will depend upon the status of the partner and the activities of the partnership. Such partner or partnership should consult its tax advisors regarding the United States federal income tax consequences of acquiring, owning, and disposing of our ordinary shares.
THE SUMMARY OF UNITED STATES FEDERAL INCOME TAX CONSEQUENCES SET OUT BELOW IS FOR GENERAL INFORMATION ONLY. ALL PROSPECTIVE INVESTORS SHOULD CONSULT THEIR TAX ADVISORS AS TO THE PARTICULAR TAX CONSEQUENCES TO THEM OF OWNING AND DISPOSING OF OUR ORDINARY SHARES, INCLUDING THE APPLICABILITY AND EFFECT OF STATE, LOCAL AND NON-U.S. TAX LAWS AND POSSIBLE CHANGES IN TAX LAW.
Dividends
Although we do not anticipate paying any dividends in the foreseeable future, as described in “Item 8.A. “Consolidated Statements and Other Financial Information—Dividend Policy” above, if we do make any distributions, subject to the discussion below under “—Passive Foreign Investment Company,” the amount of dividends paid to a United States Holder with respect to our ordinary shares before reduction for any Israeli taxes withheld therefrom generally will be included in the United States Holder’s gross income as ordinary income from foreign sources to the extent paid out of our current or accumulated earnings and profits (as determined for United States federal income tax purposes). Distributions in excess of earnings and profits will be treated as a non-taxable return of capital to the extent of the United States Holder’s tax basis in those ordinary shares and thereafter as capital gain. However, we do not intend to calculate our earnings and profits under United States federal income tax principles. Therefore, United States Holders should expect to treat a distribution as a dividend even if that distribution would otherwise be treated as a non-taxable return of capital or as capital gain under the rules described above.
Foreign withholding tax (if any) paid on dividends on our ordinary shares at the rate applicable to a United States Holder (taking into account any applicable income tax treaty) will, subject to limitations and conditions, be treated as foreign income tax eligible for credit against such holder’s United States federal income tax liability or, at such holder’s election, eligible for deduction in computing such holder’s United States federal taxable income. Dividends paid on our ordinary shares generally will constitute “foreign source income” and “passive category income” for purposes of the foreign tax credit. However, if we are a “United States-owned foreign corporation,” solely for foreign tax credit purposes, a portion of the dividends allocable to our United States source earnings and profits may be re-characterized as United States source. A “United States-owned foreign corporation” is any foreign corporation in which United States persons own, directly or indirectly, 50% or more (by vote or by value) of the stock. In general, United States-owned foreign corporations with less than 10% of earnings and profits attributable to sources within the United States are excepted from these rules. If we are treated as a “United States-owned foreign corporation,” and if 10% or more of our earnings and profits are attributable to sources within the United States, a portion of the dividends paid on the ordinary shares allocable to our United States source earnings and profits will be treated as United States source, and, as such, the ability of a United States Holder to claim a foreign tax credit for any Israeli withholding taxes payable in respect of our dividends may be limited. The rules governing the treatment of foreign taxes imposed on a United States Holder and foreign tax credits are complex, and United States Holders should consult their tax advisors about the impact of these rules in their particular situations.
Dividends received by certain non-corporate United States Holders (including individuals) may be “qualified dividend income,” which is taxed at the lower capital gain rate, provided that (i) either our ordinary shares are readily tradable on an established securities market in the United States or we are eligible for benefits under a comprehensive United States income tax treaty that includes an exchange of information program and which the United States Treasury Department has determined is satisfactory for these purposes, (ii) we are neither a PFIC (as discussed below) nor treated as such with respect to the United States Holder for either the taxable year in which the dividend is paid or the preceding taxable year, and (iii) the United States Holder satisfies certain holding period and other requirements. In this regard, shares generally are considered to be readily tradable on an established securities market in the United States if they are listed on Nasdaq, as our ordinary shares are. United States Holders should consult their tax advisors regarding the availability of the reduced tax rate on dividends paid with respect to our ordinary shares. The dividends will not be eligible for the dividends received deduction available to United States Holders that are corporations in respect of dividends received from other United States corporations.
Disposition of Ordinary Shares
Subject to the discussion below under “—Passive Foreign Investment Company,” a United States Holder generally will recognize capital gain or loss for United States federal income tax purposes on the sale or other taxable disposition of our ordinary shares equal to the difference, if any, between the amount realized and the United States Holder’s tax basis in those ordinary shares. If any Israeli tax is imposed on the sale, exchange or other disposition of our ordinary shares, a United States Holder’s amount realized will include the gross amount of the proceeds of the deposits before deduction of the Israeli tax. In general, capital gains recognized by a non-corporate United States Holder, including an individual, are subject to a lower rate under current law if such United States Holder held the ordinary shares for more than one year. The deductibility of capital losses is subject to limitations. Any such gain or loss generally will be treated as United States source income or loss for purposes of the foreign tax credit. A United States Holder’s tax basis in its ordinary shares generally will equal the cost of such shares. Because gain for the sale or other taxable disposition of our ordinary shares will be treated as United States source income, and a United States Holder may use foreign tax credits against only the portion of United States federal income tax liability that is attributed to foreign source income in the same category, a United States Holder’s ability to utilize a foreign tax credit with respect to the Israeli tax imposed on any such sale or other taxable disposition, if any, may be significantly limited. In addition, if a United States Holder is eligible for the benefit of the income tax convention between the United States and the State of Israel and pay Israeli tax in excess of the amount applicable to the United States Holder under such convention or if the Israeli tax paid is refundable, the United States Holder will not be able to claim any foreign tax credit or deduction with respect to such excess portion of the Israeli tax paid. United States Holders should consult their tax advisors as to whether the Israeli tax on gains may be creditable or deductible in light of their particular circumstances and their ability to apply the provisions of an applicable treaty.
Passive Foreign Investment Company
We would be a PFIC for any taxable year if, after the application of certain look-through rules, either: (i) 75% or more of our gross income for such year is “passive income” (as defined in the relevant provisions of the Internal Revenue Code), or (ii) 50% or more of the value of our assets (generally determined on the basis of a quarterly average) during such year is attributable to assets that produce or are held for the production of passive income. For these purposes, cash and other assets readily convertible into cash or that do or could generate passive income are categorized as passive assets, and the value of goodwill and other unbooked intangible assets is generally taken into account. Passive income generally includes, among other things, rents, dividends, interest, royalties, gains from the disposition of passive assets and gains from commodities and securities transactions. For purposes of this test, we will be treated as owning a proportionate share of the assets and earning a proportionate share of the income of any other corporation of which we own, directly or indirectly, at least 25% (by value) of the stock. Based on our market capitalization and the composition of our income, assets and operations, we believe that we were not a FFIC for the year ended December 31, 2021 and do not expect to be a PFIC for United States federal income tax purposes for the current taxable year or in the foreseeable future. However, this is a factual determination that must be made annually after the close of each taxable year. Moreover, the value of our assets for purposes of the PFIC determination may be determined by reference to the trading value of our ordinary shares, which could fluctuate significantly. In addition, it is possible that the IRS may take a contrary position with respect to our determination in any particular year, and therefore, there can be no assurance that we were not a PFIC for the year ended December 31, 2021 or will not be classified as a PFIC for the current taxable year or in the future. Certain adverse United States federal income tax consequences could apply to a United States Holder if we are treated as a PFIC for any taxable year during which such United States Holder holds our ordinary shares. Under the PFIC rules, if we were considered a PFIC at any time that a United States Holder holds our ordinary shares, we would continue to be treated as a PFIC with respect to such holder’s investment unless (i) we cease to be a PFIC, and (ii) the United States Holder has made a “deemed sale” election under the PFIC rules.
If we are a PFIC for any taxable year that a United States Holder holds our ordinary shares, unless the United States Holder makes certain elections, any gain recognized by the United States Holder on a sale or other disposition of our ordinary shares would be allocated pro-rata over the United States Holder’s holding period for the ordinary shares. The amounts allocated to the taxable year of the sale or other disposition and to any year before we became a PFIC would be taxed as ordinary income. The amount allocated to each other taxable year would be subject to tax at the highest rate in effect for individuals or the highest rate in effect for corporations, as appropriate, for that taxable year, and an interest charge would be imposed. Further, to the extent that any distribution received by a United States Holder on our ordinary shares exceeds 125% of the average of the annual distributions on the ordinary shares received during the preceding three years or the United States Holder’s holding period, whichever is shorter, that distribution would be subject to taxation in the same manner as gain on the sale or other disposition of our ordinary shares if we were a PFIC, described above. If we are treated as a PFIC with respect to a United States Holder for any taxable year, the United States Holder will be deemed to own equity in any of the entities in which we hold equity that also are PFICs. Certain elections may be available that would result in alternative treatments (such as mark-to-market treatment) of the ordinary shares. In addition, a timely election to treat us as a qualified electing fund under the Internal Revenue Code would result in an alternative treatment. However, we do not intend to prepare or provide the information that would enable United States Holders to make a qualified electing fund election. If we are considered a PFIC, a United States Holder also will be subject to annual information reporting requirements. United States Holders should consult their tax advisors about the potential application of the PFIC rules to an investment in the ordinary shares.
Information Reporting and Backup Withholding
Dividend payments and proceeds paid from the sale or other taxable disposition of our ordinary shares may be subject to information reporting to the IRS. In addition, a United States Holder (other than an exempt holder who establishes its exempt status if required) may be subject to backup withholding on dividend payments and proceeds from the sale or other taxable disposition of our ordinary shares paid within the United States or through certain U.S.-related financial intermediaries.
Backup withholding will not apply, however, to a United States Holder who furnishes a correct taxpayer identification number, makes other required certification and otherwise complies with the applicable requirements of the backup withholding rules. Backup withholding is not an additional tax. Rather, any amount withheld under the backup withholding rules will be creditable or refundable against the United States Holder’s United States federal income tax liability, provided the required information is timely furnished to the IRS.
Foreign Financial Asset Reporting
Certain United States Holders are required to report their holdings of certain foreign financial assets, including equity of foreign entities, if the aggregate value of all of these assets exceeds certain threshold amounts. Our ordinary shares are expected to constitute foreign financial assets subject to these requirements unless the ordinary shares are held in an account at certain financial institutions. United States Holders should consult their tax advisors regarding the application of these reporting requirements.
| F. | Dividends and Paying Agents |
Not applicable.
Not applicable.
We are subject to the informational requirements of the Exchange Act. Accordingly, we are required to file reports and other information with the SEC, including annual reports on Form 20-F and reports on Form 6-K. Our filings with the SEC are also available to the public through the SEC’s website at http://www.sec.gov. This site contains reports and other information about issuers, like us, that file electronically with the SEC. The address of that website is www.sec.gov.
We maintain a corporate website at http://www.global-e.com. Information contained on, or that can be accessed through our website does not constitute a part of this Annual Report on Form 20-F. We also make available on our website’s investor relations page at http://investors.global-e.com, free of charge, our Annual Report and the text of our reports on Form 6-K, including any amendments to these reports, as well as certain other SEC filings, as soon as reasonably practicable after they are electronically filed with or furnished to the SEC. The information contained on our website is not incorporated by reference in this Annual Report.
As a foreign private issuer, we are exempt under the Exchange Act from, among other things, the rules prescribing the furnishing and content of proxy statements, and our officers, directors and principal shareholders are exempt from the reporting and short-swing profit recovery provisions contained in Section 16 of the Exchange Act. In addition, we will not be required under the Exchange Act to file periodic reports and financial statements with the SEC as frequently or as promptly as U.S. companies whose securities are registered under the Exchange Act. However, we will file with the SEC, within 120 days after the end of each subsequent fiscal year, or such applicable time as required by the SEC, an annual report on Form 20-F containing financial statements audited by an independent registered public accounting firm. We also intend to furnish certain other material information to the SEC under cover of Form 6-K.
Not applicable.
Item 11. Quantitative and Qualitative Disclosures about Market Risk
We believe that we have no significant exposure to interest rate risk as we have no significant long-term loans. However, our future interest income may fall short of expectations due to changes in market interest rates.
Foreign currency exchange risk
A majority of our purchase and sale transactions are carried out in different currencies, including the U.S. Dollar, Euro and Pounds Sterling, and we bear the risk of diminution in value of the relevant shopper’s purchasing currency in the interim periods between the various transaction stages (e.g. placement/payment and returns/refund). Additionally, we incur a substantial portion of our operating expenses in New Israeli Shekels, Pounds Sterling and U.S. Dollars, and to a lesser extent, other foreign currencies. Our results of operations and cash flows are, therefore, subject to fluctuations due to changes in foreign currency exchange rates. However, we believe we have a certain level of built-in “natural currency hedge” provided by our bi-directional volume of sales and broad international activity.
Despite this natural hedge, we may incur additional costs and experience losses resulting from fluctuations in exchange rates for revenues in foreign currencies or upon translation of New Israeli Shekels expenses incurred in Israel, or Pounds Sterling expenses incurred in the United Kingdom, to U.S. Dollars.
During the year ended December 31, 2021, we did not hedge our foreign currency exchange risk.
We qualify as an “emerging growth company” pursuant to the provisions of the JOBS Act. Section 107 of the JOBS Act provides that an “emerging growth company” can take advantage of the extended transition period provided in Section 7(a)(2)(B) of the Securities Act for complying with new or revised accounting standards. We have elected to use this extended transition period, which allows us to delay adoption of new or revised accounting pronouncements applicable to public companies until such pronouncements are made applicable to private companies, until the earlier of the date we (i) are no longer an emerging growth company or (ii) affirmatively and irrevocably opt out of the extended transition period provided in the JOBS Act. As a result, our consolidated financial statements may not be comparable to companies that comply with new or revised accounting pronouncements as of public company effective dates
Item 12. Description of Securities Other than Equity Securities
Not applicable.
PART II
Item 13. Defaults, Dividend Arrearages and Delinquencies
None.
Item 14. Material Modifications to the Rights of Security Holders and Use of Proceeds
On May 14, 2021, upon closing of the IPO, we amended and restated our articles of association. A copy of our amended and restated articles of association is attached as Exhibit 1.1 to this Annual Report.
Item 15. Controls and Procedures
Disclosure Controls and Procedures
We maintain disclosure controls and procedures (as that term is defined in Rules 13a-15(e) and 15d-15(e) under the Securities Exchange Act of 1934, as amended) that are designed to ensure that information required to be disclosed in the Company’s reports under the Exchange Act is recorded, processed, summarized and reported within the time periods specified in the SEC’s rules and forms and that such information is accumulated and communicated to our management, including our Chief Executive Officer and Chief Financial Officer, as appropriate, to allow timely decisions regarding required disclosures. Any controls and procedures, no matter how well designed and operated, can provide only reasonable assurance of achieving the desired control objectives. Our management, with the participation of our Chief Executive Officer and Chief Financial Officer, has evaluated the effectiveness of the design and operation of our disclosure controls and procedures as of December 31, 2021. Based upon that evaluation, our Chief Executive Officer and Chief Financial Officer concluded that, as of December 31, 2021, our disclosure controls and procedures were effective to accomplish their objectives at the reasonable assurance level.
Management’s Annual Report on Internal Control over Financial Reporting
This annual report does not include a report of management’s assessment regarding internal control over financial reporting (as such term is defined in Rules 13a-15(f) and 15d-15(f) under the Securities Exchange Act) or an attestation report of the company’s registered public accounting firm due to a transition period established by rules of the Securities and Exchange Commission (the “SEC”) for newly public companies. Additionally, our independent registered public accounting firm will not be required to opine on the effectiveness of our internal control over financial reporting until we are no longer an emerging growth company.
Attestation Report of the Independent Registered Public Accounting Firm
This Annual Report does not include an attestation report of our registered public accounting firm due to a transition period established by rules of the SEC for newly public companies. Additionally, our independent registered public accounting firm will not be required to opine on the effectiveness of our internal control over financial reporting until we are no longer an emerging growth company.
Changes in Internal Control over Financial Reporting
There were no changes in our internal control over financial reporting (as such term is defined in Rules 13a-15(f) and 15d-15(f) under the Securities Exchange Act) that occurred during the period covered by this Annual Report that have materially affected, or are reasonably likely to materially affect, our internal control over financial reporting.
Item 16. Reserved
Item 16A. Audit Committee Financial Expert
Our board of directors has determined that Ms. Tzvia Broida is an audit committee financial expert as defined by the SEC rules and has the requisite financial experience as defined by the corporate governance rules of Nasdaq.
Our board of directors has determined that each member of our audit committee is “independent” as such term is defined in Rule 10A-3(b)(1) under the Exchange Act, which is different from the general test for independence of board and committee members.
Item 16B. Code of Ethics
We have adopted a Code of Business Conduct that applies to all our employees, officers and directors. Our Code of Business Conduct addresses, among other things, competition and fair dealing, gifts and entertainment, conflicts of interest, international business laws, financial matters and external reporting, company assets, confidentiality and corporate opportunity requirements and the process for reporting violations of the Code of Business Conduct. Our Code of Business Conduct is intended to meet the definition of “code of ethics” under Item 16B of 20-F under the Exchange Act.
We will disclose on our website any amendment to, or waiver from, a provision of our Code of Business Conduct that applies to our directors or executive officers to the extent required under the rules of the SEC or the Nasdaq. Our Code of Business Conduct is available on our website at https://investors.global-e.com/corporate-governance/documents-charters. The information contained on or through our website, or any other website referred to herein, is not incorporated by reference in this Annual Report.
We granted no waivers under our Code of Business Conduct and Ethics in 2021.
Item 16C. Principal Accounting Fees and Services
The consolidated financial statements of Global-E Online Ltd. at December 31, 2020 and 2021, and for each of the two years in the period ended December 31, 2021, appearing in this Annual Report have been audited by Kost, Forer, Gabbay & Kasierer, a member of Ernst & Young Global, independent registered public accounting firm, as set forth in their report thereon appearing elsewhere herein, and are included in reliance upon such report given on the authority of such firm as experts in accounting and auditing. The current address of Kost, Forer, Gabbay & Kasierer is 144 Menachem Begin Road, Tel Aviv 6492102, Israel.
The table below sets out the total amount of services rendered to us by Kost, Forer, Gabbay & Kasierer, a member of Ernst & Young Global, for services performed in the years ended December 31, 2020 and 2021, and breaks down these amounts by category of service:
| | | 2020 | | | 2021 | |
| | | (in thousands) | |
| Audit Fees | | $ | 303 |
| | $ | 1,300 |
|
| Audit Related Fees | | | - |
| | $ | 510 |
|
| Tax Fees | | $ | 12 |
| | $ | 30 |
|
| All Other Fees | | | - |
| | | - |
|
| Total | | $ | 315 |
| | $ | 1,840 |
|
Audit Fees
Audit fees for the years ended December 31, 2020 and 2021 include fees for the audit of our annual financial statements. This category also includes services that the independent accountant generally provides, such as consents and assistance with and review of documents filed with the SEC.
Audit Related Fees
Audit related fees for the year ended December 31, 2020 and 2021 related to services in connection with our IPO and our underwritten secondary follow-on offering.
Tax Fees
Tax fees for the years ended December 31, 2020 and 2021 related to ongoing tax advisory, tax compliance and tax planning services.
All Other Fees
All other fees in the years ended December 31, 2020 and 2021 related to services in connection with non-audit compliance and review work.
Pre-Approval Policies and Procedures
The advance approval of the Audit Committee or members thereof, to whom approval authority has been delegated, is required for all audit and non-audit services provided by our auditors.
All services provided by our auditors are approved in advance by either the Audit Committee or members thereof, to whom authority has been delegated, in accordance with the Audit Committee’s pre-approval policy.
Item 16D. Exemptions from the Listing Standards for Audit Committees
Not applicable.
Item 16E. Purchases of Equity Securities by the Issuer and Affiliated Purchasers
None.
Item 16F. Change in Registrant’s Certifying Accountant
None.
Item 16G. Corporate Governance
As an Israeli company, we are subject to various corporate governance requirements under the Companies Law. However, pursuant to regulations promulgated under the Companies Law, companies with shares traded on certain U.S. stock exchanges, including Nasdaq, may, subject to certain conditions, “opt out” from the Companies Law requirements to appoint external directors and related Companies Law rules concerning the composition of the audit committee and compensation committee of the board of directors (other than the gender diversification rule under the Companies Law, which requires the appointment of a director from the other gender if at the time a director is appointed all members of the board of directors are of the same gender). In accordance with these regulations, we elected to “opt out” from such requirements of the Companies Law. Under these regulations, the exemptions from such Companies Law requirements will continue to be available to us so long as: (i) we do not have a “controlling shareholder” (as such term is defined under the Companies Law), (ii) our shares are traded on certain U.S. stock exchanges, including Nasdaq, and (iii) we comply with the director independence requirements and the audit committee and compensation committee composition requirements under U.S. laws (including applicable rules of Nasdaq) applicable to U.S. domestic issuers.
We are a “foreign private issuer” (as such term is defined in Rule 3b-4 under the Exchange Act). As a foreign private issuer we are permitted to comply with Israeli corporate governance practices instead of the corporate governance rules of Nasdaq, provided that we disclose which requirements we are not following and the equivalent Israeli requirement.
We rely on this “foreign private issuer exemption” with respect to the quorum requirement for shareholder meetings. Whereas under the corporate governance rules of Nasdaq, a quorum requires the presence, in person or by proxy, of holders of at least 331/3% of the total issued outstanding voting power of our shares at each general meeting of shareholders, pursuant to our amended and restated articles of association, and as permitted under the Companies Law, the quorum required for a general meeting of shareholders consists of at least two shareholders present in person or by proxy in accordance with the Companies Law, who hold or represent at least 331/3% of the total voting power of our shares, except if (i) any such general meeting of shareholders was initiated by and convened pursuant to a resolution adopted by the board of directors and (ii) at the time of such general meeting, we qualify as a “foreign private issuer,” in which case the requisite quorum will consist of two or more shareholders present in person or by proxy who hold or represent at least 25% of the total voting power of our shares (and if the meeting is adjourned for a lack of quorum, the quorum for such adjourned meeting will be, subject to certain exceptions, any number of shareholders). We otherwise comply with and intend to continue to comply with the rules generally applicable to U.S. domestic companies listed on Nasdaq. We may, however, in the future decide to use the “foreign private issuer exemption” and opt out of some or all of the other corporate governance rules. Following our home country governance practices may provide less protection than is accorded to investors under the corporate governance rules of the Nasdaq applicable to domestic issuers.
We intend to take all actions necessary for us to maintain compliance as a foreign private issuer under the applicable corporate governance requirements of the Sarbanes-Oxley Act of 2002, the rules adopted by the SEC and Nasdaq corporate governance rules.
Item 16H. Mine Safety Disclosure
Not applicable.
Item 16I. Disclosure Regarding Foreign Jurisdictions that Prevent Inspections
Not applicable.
PART III
Item 17. Financial Statements
We have provided financial statements pursuant to Item 18.
Item 18. Financial Statements
The audited consolidated financial statements as required under Item 18 are attached hereto starting on page F-1 of this Annual Report.
Item 19. Exhibits.
| | | | | | | Incorporation by Reference | |
| | | | | | | | | | | | | Filed / |
| Exhibit No. | | Description | | Form | | File No. | | Exhibit No. | | Filing Date | | Furnished |
| | | | F-1 | | 333-259371 | | 3.1 | | September 7, 2021 | | |
| | | | F-1 | | 333-259371 | | 4.1 | | September 7, 2021 | | |
|
| | | | | | | | | | | * |
| | | | F-1 | | 333-259371 | | 10.1 | | September 7, 2021 | | |
| | | | F-1 | | 333-259371 | | 10.2 | | September 7, 2021 | | |
| | | | F-1 | | 333-259371 | | 10.3 | | September 7, 2021 | | |
| | | | F-1 | | 333-259371 | | 10.7 | | September 7, 2021 | | |
| | | | F-1 | | 333-259371 | | 10.6 | | September 7, 2021 | | |
| | | | F-1 | | 333-259371 | | 10.4 | | September 7, 2021 | | |
| | | | F-1 | | 333-259371 | | 10.5 | | September 7, 2021 | | |
| | | | F-1 | | 333-259371 | | 10.8 | | September 7, 2021 | | |
| | | | F-1 | | 333-259371 | | 10.9 | | September 7, 2021 | | |
| | | | | | | | | | | * |
| | | | | | | | | | | * |
|
| | | | | | | | | | * |
4.13
| | | | F-1 | | 333-259371 | | 4.2 | September 7, 2021 | | |
|
| | | | | | | | | | * |
|
| | | | | | | | | | * |
|
| | | | | | | | | | * |
|
| | | | | | | | | | ** |
|
| | | | | | | | | | ** |
|
| | | | | | | | | | * |
| 101.INS | Inline XBRL Instance Document. |
| | |
| 101.SCH | Inline XBRL Taxonomy Extension Schema Document. |
| | |
| 101.CAL | Inline XBRL Taxonomy Extension Calculation Linkbase Document. |
| | |
| 101.DEF | Inline XBRL Taxonomy Definition Linkbase Document. |
| | |
| 101.LAB | Inline XBRL Taxonomy Extension Label Linkbase Document. |
| | |
| 101.PRE | Inline XBRL Taxonomy Extension Presentation Linkbase Document |
| | |
| 104 | Inline XBRL for the cover page of this Annual Report on Form 20-F, included in the Exhibit 101 Inline XBRL Document Set. |
| * | Filed herewith. |
| ** | Furnished herewith. |
| † | Portions of this exhibit have been redacted pursuant to Item 4 of the “Instructions As To Exhibits” of Form 20-F because the Company customarily and actually treats the redacted information as private or confidential and the omitted information is not material. The Company hereby agrees to furnish an unredacted copy of the exhibit to the Commission upon request. |
| # | Indicates management contract or compensatory plan or arrangement. |
Certain agreements filed as exhibits to this Annual Report contain representations and warranties that the parties thereto made to each other. These representations and warranties have been made solely for the benefit of the other parties to such agreements and may have been qualified by certain information that has been disclosed to the other parties to such agreements and that may not be reflected in such agreements. In addition, these representations and warranties may be intended as a way of allocating risks among parties if the statements contained therein prove to be incorrect, rather than as actual statements of fact. Accordingly, there can be no reliance on any such representations and warranties as characterizations of the actual state of facts. Moreover, information concerning the subject matter of any such representations and warranties may have changed since the date of such agreements.
SIGNATURES
The registrant hereby certifies that it meets all of the requirements for filing on Form 20-F and that it has duly caused and authorized the undersigned to sign this annual report on its behalf.
| | GLOBAL-E ONLINE LTD.
|
| Date: March 28, 2022 | By: | /s/ Amir Schlachet |
| | Name: | Amir Schlachet |
| | Title: | Chief Executive Officer |