
| Title of each class | Trading Symbol(s) | Name of each exchange on which registered | ||
| Ordinary shares, no par value | GLBE | The Nasdaq Global Select Market |
☒ Large accelerated filer | ☐ Accelerated filer | ☐ Non-accelerated filer | ☐ Emerging growth company |
☒ U.S. GAAP | ☐ International Financial Reporting Standards as issued by the International Accounting Standards Board | ☐ Other |
| 1 | |
| 1 | |
| 3 | |
| 5 | |
| 5 | |
| 5 | |
| 5 | |
A. Selected Financial Data | 5 |
B. Capitalization and Indebtedness | 5 |
C. Reasons for the Offer and Use of Proceeds | 5 |
D. Risk Factors | 5 |
| 53 | |
A. History and Development of the Company | 53 |
B. Business Overview | 54 |
C. Organizational Structure | 80 |
D. Property, Plants and Equipment | 82 |
| 82 | |
| 82 | |
A. Operating Results | 92 |
B. Liquidity and Capital Resources | 96 |
| C. Research and Development, Patents and Licenses, Etc. | 98 |
D. Trend Information | 99 |
E. Critical Accounting Estimates | 100 |
| 102 | |
A. Directors and Senior Management | 102 |
B. Compensation | 105 |
C. Board Practices | 110 |
D. Employees | 123 |
E. Share Ownership | 124 |
F. Disclosure of A Registrant’s Action To Recover Erroneously Awarded Compensation | 124 |
| 124 | |
A. Major Shareholders | 124 |
B. Related Party Transactions | 127 |
C. Interests of Experts and Counsel | 131 |
| 131 | |
A. Consolidated Statements and Other Financial Information | 131 |
B. Significant Changes | 131 |
| 132 | |
A. Offer and Listing Details | 132 |
B. Plan of Distribution | 132 |
C. Markets | 132 |
D. Selling Shareholders | 132 |
E. Dilution | 132 |
F. Expenses of the Issue | 132 |
| 132 | |
A. Share Capital | 132 |
B. Memorandum and Articles of Association | 132 |
C. Material Contracts | 132 |
D. Exchange Controls | 132 |
E. Taxation | 132 |
F. Dividends and Paying Agents | 139 |
G. Statement by Experts | 139 |
H. Documents on Display | 139 |
I. Subsidiary Information | 140 |
J. Annual Report to Security Holders | 140 |
| 140 | |
| 141 | |
| 141 | |
| 141 | |
| 141 | |
| 141 | |
| 142 | |
| 142 | |
| 142 | |
| 143 | |
| 144 | |
| 144 | |
| 144 |
| 144 | |
| 144 | |
| 144 | |
| 146 | |
| 146 | |
| 146 | |
| 146 | |
| 148 | |
| • | “Gross Merchandise Value” or “GMV” is defined as the combined amount we collect from the shopper and the merchant for all components of a given transaction, including products, duties and taxes and shipping; |
| | • | | “Adjusted EBITDA” is a non-GAAP financial measure and is defined as operating profit (loss) adjusted for depreciation and amortization, stock-based compensation expenses, commercial agreements amortization, amortization of acquired intangibles, merger related contingent consideration, acquisition related expenses and secondary offering costs. Adjusted EBITDA margin is calculated as Adjusted EBITDA divided by revenues; |
| • | “Non-GAAP Gross Profit” is a non-GAAP financial measure and is defined as gross profit adjusted for amortization of acquired intangibles. “Non-GAAP gross margin” is calculated as Non-GAAP gross profit divided by revenues; |
| • | “Net Dollar Retention Rate” for a given period is calculated by dividing the GMV in that period by the GMV in the comparable period in the prior year, in each case, from merchants that processed transactions on our platform in the earlier of the two periods; and |
| • | “Gross Dollar Retention Rate” is a key performance indicator and in order to calculate it for a particular quarter, we first calculate the total seasonality adjusted annualized GMV for that quarter. We then calculate the value of GMV from any merchants who discontinued their use of our platform during that quarter, or churned, based on their total GMV from the four quarters preceding such quarter, which we refer to as churned GMV. We then divide (a) the churned GMV by (b) the total seasonality adjusted annualized GMV to calculate the percentage churn for that quarter. Gross Dollar Retention Rate for a particular year is calculated by aggregating the percentage churn of the four quarters within that year and subtracting the result from 100%. |
| • | our rapid growth and growth rates in recent periods may not be indicative of future growth; | ||
| • | our ability to retain existing, and attract new, merchants; | ||
| • | our expectations regarding our revenue, expenses and operations; | ||
| • | anticipated trends and challenges in our business and the markets in which we operate; | ||
| • | our ability to compete in our industry; | ||
| • | our ability to acquire new functionality, and to integrate acquired businesses and technologies; | ||
| • | our reliance on third-parties, including our ability to realize the benefits of any strategic alliances, joint ventures, or partnership arrangements and to integrate our platform with third-party platforms; | ||
| • | our ability to anticipate merchant needs or develop or acquire new functionality or enhance our existing platform to meet those needs; | ||
| • | our history of net losses; | ||
| • | our ability to manage our growth and manage expansion into additional markets; | ||
| • | our ability to establish and protect intellectual property rights; | ||
| • | our ability to hire and retain key personnel; | ||
| • | our ability to adapt to emerging or evolving regulatory developments, technological changes, and cybersecurity needs; | ||
| • | increased attention to ESG matters and our ability to manage such matters; | ||
| • | global events such as war, health pandemics and the recent economic slowdown; | ||
| • | our ability to operate internationally; | ||
| • | risks related to our incorporation and location in Israel; | ||
| • | our anticipated cash needs and our estimates regarding our capital requirements and our needs for additional financing; and | ||
| • | other statements described in this Annual Report under “Risk Factors,” “Operating and Financial Review and Prospects,” and “Business.” |
| A. | [RESERVED]. |
| B. | Capitalization and Indebtedness |
| C. | Reasons for the Offer and Use of Proceeds |
| D. | Risk Factors |
• | increase the overall sales volume facilitated by our platform; |
• | maintain merchant retention rates; |
• | increase merchants’ e-commerce sales conversion rates; |
• | successfully expand our merchants into new geographies; |
• | attract new merchants to our platform in existing and new geographies, segments and verticals; |
• | successfully integrating the technologies, platforms and business propositions, modalities or offerings of Flow Commerce Inc., or Flow and the technologies and cross-border ecommerce solutions of Borderfree, which we acquired from Pitney Bowes Inc., or Pitney Bowes, and other businesses we may acquire in the future, into our existing platform; |
• | successfully realize all the benefits from our third party partnerships and collaborations; |
• | provide integration with our merchants’ online e-commerce web-stores; |
• | maintain the security, reliability and integrity of our platforms; |
• | maintain compliance with existing and comply with new applicable laws and regulations, including new tax rates and tariffs; |
• | price our platform effectively so that we are able to attract and retain merchants; |
• | successfully compete against our current and future competition and competing solutions; and |
• | maintain service levels and consistent quality of our platforms. |
• | merchants may choose to develop cross-border e-commerce capabilities internally or choose competing solutions; |
• | merchants may merge with or be acquired by companies using a competing solution or an internally-developed solution; |
• | competing solutions may be offered as part of a bundle of e-commerce services; |
• | current or potential global or regional competition and competing solutions, both in geographies where we already operate, and in geographies where we do not operate, may adopt more aggressive pricing policies, offer more attractive sales terms, adapt more quickly to new technologies and changes in merchant requirements or devote greater resources to the promotion and sale of their products and solutions than we can; and |
• | current and potential competition may merge or establish cooperative relationships among themselves or with third parties to enhance their products, solutions and expand their markets (or in new markets), forming alliances that rapidly acquire significant market share. |
• | the need to localize our solutions, including product customizations and adaptation for local practices and regulatory requirements; |
• | lack of familiarity and burdens of ongoing compliance with local laws, legal standards, regulatory requirements, tariffs, customs formalities and other barriers, including restrictions on advertising practices, regulations governing online services, restrictions on importation or shipping of specified or proscribed items, importation quotas, shopper protection laws, enforcement of intellectual property rights, laws dealing with shopper and data protection, privacy, encryption, denied parties and sanctions, and restrictions on pricing or discounts; |
• | heightened exposure to fraud; |
| • | legal uncertainty in foreign countries with less developed legal systems; |
• | potentially greater difficulty to execute and enforce contracts, including our terms of service and other agreements despite our efforts to adjust our contracts and service terms to local laws and regulations |
• | increasing scrutiny and disclosure requirements regarding ESG policies, practices, measures and initiatives; |
• | unexpected changes in regulatory requirements, taxes, trade laws, tariffs, export quotas, custom duties or customs formalities, embargoes, exchange controls, government controls or other trade restrictions; |
• | differing technology standards; |
• | difficulties in managing and staffing international operations and differing employer/employee relationships; |
• | fluctuations in exchange rates that may increase our foreign exchange exposure; |
• | potentially adverse tax consequences, including the complexities of foreign tax laws (including with respect to value added taxes) and restrictions on the repatriation of earnings; |
• | increased likelihood of potential or actual violations of domestic and international anti-money laundering laws and anticorruption laws, such as the U.S. Foreign Corrupt Practices Act and the U.K. Bribery Act; |
• | uncertain political, national and economic climates in foreign markets; | ||
• | geo-political or national conflicts and situations, including the ongoing Russia/Ukraine conflict, heightened rates of inflation and recessionary pressures in various countries, that directly (e.g. by virtue of war zones not being serviceable at all) or indirectly affect our operations, consumer sentiment or e-commerce activities in general; | ||
• | rapidly rising inflation across the U.S. and global economy, driving up the costs of goods and services; |
• | managing and staffing operations over a broader geographic area with varying cultural norms and customs; |
• | varying levels of internet, e-commerce and mobile technology adoption and infrastructure; |
• | reduced or varied protection for intellectual property rights in some countries; |
• | new and different sources of competition; |
| • | costs and liabilities related to compliance with the numerous and ever-growing landscape of international data privacy and cybersecurity regimes, many of which involve disparate standards and enforcement approaches; and |
• | data privacy and data protection laws which may require that merchant and/or shopper data be processed and stored in a designated territory. |
• | require costly litigation to resolve and the payment of substantial royalty or license fees, lost profits or other damages; |
• | require and divert significant management time; |
• | cause us to enter into unfavorable royalty or license agreements; |
• | require us to discontinue some or all of the features, integrations, and capabilities available on our platforms; |
• | require us to indemnify our merchants or third-party service providers; and/or |
• | require us to expend additional development resources to redesign our platforms. |
• | develop new features, integrations, capabilities, and enhancements; |
• | continue to expand our product development, sales, and marketing organizations; |
• | respond to competitive pressures or unanticipated working capital requirements; or |
• | pursue acquisition opportunities. |
• | actual or anticipated fluctuations in our results of operations; | ||
• | variance in our financial performance from the expectations of market analysts; | ||
• | announcements by us or our direct or indirect competition of significant business developments, changes in service provider relationships, acquisitions or expansion plans; |
• | the impact of the COVID-19 pandemic on our management, employees, partners, merchants, and operating results, as well as the impact of COVID-19 related restrictions having been lifted and the physical re-opening of stores, on the rate of adoption of e-commerce as well as shoppers buying habits; |
| • | changes or proposed changes in laws or regulations or differing interpretations or enforcement of laws or regulations affecting our business; |
• | changes in our pricing model; |
• | our involvement in litigation or regulatory actions; |
• | our sale of ordinary shares or other securities in the future; |
• | market conditions in our industry; |
• | changes in key personnel; |
• | the trading volume of our ordinary shares; |
• | publication of research reports or news stories about us, our competition or our industry, or positive or negative recommendations or withdrawal of research coverage by securities analysts; |
• | changes in the estimation of the future size and growth rate of our markets; and |
• | general economic and market conditions. |
| • | | the Israeli Companies Law, 5759-1999 (the “Companies Law”) regulates mergers and requires that a tender offer be effected when more than a specified percentage of shares in a company are purchased; |
• | the Companies Law requires special approvals for certain transactions involving directors, officers or significant shareholders and regulates other matters that may be relevant to these types of transactions; |
• | the Companies Law does not provide for shareholder action by written consent for public companies, thereby requiring all shareholder actions to be taken at a general meeting of shareholders; |
• | our amended and restated articles of association divide our directors into three classes, each of which is elected once every three years; |
• | our amended and restated articles of association generally require a vote of the holders of a majority of our outstanding ordinary shares entitled to vote present and voting on the matter at a general meeting of shareholders (referred to as simple majority), and the amendment of a limited number of provisions, such as the provision dividing our directors into three classes, requires a vote of the holders of at least 70% of our voting power; |
• | our amended and restated articles of association restrict us, subject to certain exceptions, from engaging in certain business combination transactions, with any shareholder who holds 20% or more of our voting power. The transactions subject to such restrictions include mergers, consolidations and dispositions of our assets with a market value of 10% or more of our assets or outstanding shares. Subject to certain exceptions, such restrictions will apply for a period of three years following each time a shareholder became the holder of 20% or more of our voting power; |
• | our amended and restated articles of association do not permit a director to be removed except by a vote of the holders of at least 70% of our voting power; and |
• | our amended and restated articles of association provide that director vacancies may be filled by our board of directors. |
| A. | History and Development of the Company |
| B. | Business Overview |
• | Language - localized marketing messaging and checkout in over 30 languages across our platforms. |
• | Pricing -support, across our platforms, for more than 100 currencies as well as a sophisticated pricing engine customizable according to the shopper’s location, local market retail pricing conventions and the merchant’s pricing strategy. |
• | Payments - over 150 payment methods, across our platforms, with new payment methods being continuously added. |
• | Duties and taxes - the ability to accurately pre-calculate import duties and taxes and remit them in over 170 destination markets, simplifying the customs clearance process and allowing for a guaranteed landed price quote for both the shopper and the merchant. We also ensure we are addressing local market import restrictions. |
• | Delivery - an extensive network of more than 20 shipping carriers, offering multiple shipping modes at attractive rates, including specialized shipping options such as Pick-Up & Drop-Off where applicable. We have found that shopper preferences for shipping modes and pricing vary significantly among markets, and are an important driver of conversion rates. |
| • | After-sale support and returns – multi-lingual shopper services and multiple returns options, including pre-paid and local returns in relevant markets. |
• | Increased sales conversion: we enable the merchants to scale internationally in a rapid, efficient manner. We ensure that the merchants are able to capitalize on their valuable international shopper traffic and growth potential by eliminating friction to close the gap between international markets’ share of traffic and monetization. This enables the merchants to generate an uplift in sales from the conversion of their international shopper conversion. We have seen merchants experience significant uplift (often exceeding 60%) in international traffic conversion after beginning to use our platform. |
• | Enabling expansion flexibility: Global-e presents merchants with flexibility to expand where and when they want to, as they seek to capture the cross-border opportunity. We transform what otherwise would have required significant time and financial investments in proprietary development and go-to-market efforts into an efficient expansion solution managed by adjusting mere configurations on the Global-e platform per market. |
• | Reducing merchant complexity: Global-e assumes the role of merchant of record (“MoR”) vis-à-vis the shopper. We believe that taking on such responsibility significantly reduces legal complexity for the merchants, as we report and forward relevant import taxes and handle import compliance in the local market to where a sale is made, in line with specific market regulations. Our MoR status allows us to handle tax recovery for returned goods, with no hassle to the merchant. We bear certain fraud and foreign exchange risks that would otherwise be borne by the merchants and offer simple access to dozens of local payment methods, which further reduces potential frictions that could deter both merchants and shoppers from engaging in cross-border transactions. We also adapt our systems and operations on an ongoing basis to address the evolving regulatory landscape and technical backdrop. Vis-à-vis the merchant, we streamline order processing by periodically reconciling all international orders in bulk and in the merchant’s native currency. In short, we aim to provide an experience that is akin to a domestic transaction. |
• | Emphasizing merchant branding: maintaining the direct shopper relationships is of strategic importance to the merchants, and we are deeply committed to preserving that connection. All throughout the process, the merchants preserve the integrity of the brand experience and enhance their brand equity. We use minimal own branding - and only where required to do so - so shoppers primarily face the merchant’s existing storefront and brand experience. |
• | Multiple origin countries - we serve merchants from multiple locations including the United States, the United Kingdom, various European markets, Japan, Australia, Hong Kong, the United Arab Emirates and other markets globally. |
• | Multiple product verticals - fashion and apparel, luxury, footwear, cosmetics, accessories, children’s fashion, watches and jewelry, sporting equipment, consumer electronics, toys and hobbies, automotive spare parts, and others. |
• | Multiple product price points - ranging from everyday fashion retailers such as Forever 21 and Marks and Spencer, to ultra-high-end brands such as Hugo Boss, Cartier and Versace. |
• | Multiple merchant sizes - from multi-billion dollar global high-street brands to emerging small and medium businesses. |
• | Multiple merchant types - from traditional bricks-and-mortar retailers who have been transitioning to the digital D2C realm to emerging digital-native brands. |
• | A rich, diverse and fast-growing data asset of international transactions, enabling us to produce Smart Insights. |
• | Vertical-level as well as geographical expertise, yielding a competitive advantage when approaching prospective merchants as part of our sales process. |
• | Strong network and word-of-mouth effects within specific verticals and/or geographies. |
• | High business resilience due to steadily decreasing merchant concentration. |
• | A certain level of built-in “natural currency hedge” as a result of our business activity being conducted in a large number of different base currencies. |
• | Direct sales - We have a dedicated team of sales executives that use various data sources to screen, qualify, identify and directly approach prospective merchants. |
• | Inbound and word-of-mouth - As our scale and the number of merchants we have in each individual market grows, so does our own brand equity. This leads to more inbound prospects as well as stronger word-of-mouth-based sales, whereby an existing Global-e merchant recommends our solution to other players in the market. |
• | Channel partnerships - We have established mutually-beneficial strategic partnerships with a range of third parties, including leading e-commerce and technology platforms, shipping providers, third-party logistics providers, payment providers, system integrators and others. In the context of such relationships, our partners pass on leads to our sales teams and provide us with access to merchants. In 2021 we entered into the 2021 Shopify Agreement with Shopify to jointly cooperate in offering e-commerce cross-border solutions to Shopify merchants and in January 2022 we extended our partnership with Shopify and entered into the 2022 Shopify Agreement with Flow and Shopify, for the offering of certain natively integrated cross-border solutions for Shopify’s merchants, especially catering to small and emerging brands. In addition, in 2022 we entered into a strategic partnership and commercial relationship with Pitney Bowes for the offering of access to our cross-border solutions to Pitney Bowes’ clients. |
• | “Economies of scale” - Our platform facilitates millions of international transactions each year across hundreds of merchants, spread across multiple geographies, product verticals, price levels, and shopper demographics. We thus accumulate a vast and rich data set and are able to benefit from economies of scale. |
• | “Economies of skill” - Our massive and fast-growing data is a key asset due to the “richness” of its content. Based on this data, and coupled with our operational experience accumulated over years, we are able to generate what we call economies of skill, which enable us to ensure that cross-border sales are optimized for the merchants on a market-by-market basis. |
• | Flywheel Effect. Our rich data serves as the basis for a powerful flywheel effect: the uplift we generate for our merchants drives more sales and the ability for them to expand into new geographies, which in turn creates more data, which is then fed back into our systems in order to generate even better conversion rates and more uplift. This in turn drives increased sales for our merchants and attracts new merchants to our platform. Our data engine gets “smarter” with each new site visit, each merchant and each new shopper. |
• | Customer-Obsessed: We are firm believers in putting our customers first in everything we do. This is a principal tenet of our business. We view the merchants as long-term partners and hold their satisfaction as our guiding principle. Our customer success teams have invaluable tools and data to support the merchants’ ongoing needs, as well as direct access to the senior leadership team, including our founders, to leverage on behalf of our merchant partners. |
• | Initiative and innovation driven: Our goal is to enable merchants to break geographic boundaries and become globally successful businesses. As such, we invest millions in research and development each year, track trends in the e-commerce world across geographies and constantly improve our product offering. Similarly, we encourage our employees to expand the scope of their defined roles, to take initiative, and to elevate Global-e to the next level - every employee can, and does make a difference. |
• | Team-Focused: We are a team. We believe in collaboration and inclusion, from our founding team that has been working together since our inception to our employees across all our offices worldwide. Our hiring decisions are based on attracting people whose values align with ours: creating real, meaningful and sustainable value for our merchants. |
| Year Ended December 31, | ||||||||||||||||||||||||
| 2020 | 2021 | 2022 | ||||||||||||||||||||||
| Amount | Percentage of Revenue | Amount | Percentage of Revenue | Amount | Percentage of Revenue | |||||||||||||||||||
| (in thousands, except percentages) | ||||||||||||||||||||||||
| Service fees | 49,927 | 37 | % | 96,659 | 39 | % | 181,887 | 44 | % | |||||||||||||||
| Fulfillment services | 86,448 | 63 | % | 148,615 | 61 | % | 227,162 | 56 | % | |||||||||||||||
| Total revenue | $ | 136,375 | 100 | % | $ | 245,274 | 100 | % | $ | 409,049 | 100 | % | ||||||||||||
| Year Ended December 31, | ||||||||||||||||||||||||
| 2020 | 2021 | 2022 | ||||||||||||||||||||||
| Amount | Percentage of Revenue | Amount | Percentage of Revenue | Amount | Percentage of Revenue | |||||||||||||||||||
| (in thousands, except percentages) | ||||||||||||||||||||||||
| United Kingdom | 80,122 | 59 | % | 113,835 | 47 | % | 146,562 | 36 | % | |||||||||||||||
| United States | 34,140 | 25 | % | 71,095 | 29 | % | 173,967 | 43 | % | |||||||||||||||
| European Union | 21,269 | 15 | % | 58,177 | 23 | % | 78,491 | 19 | % | |||||||||||||||
| Israel | 844 | 1 | % | 1,052 | * | 1,357 | * | |||||||||||||||||
| Other | - | - | 1,115 | * | 8,672 | 2 | % | |||||||||||||||||
| Total revenue | $ | 136,375 | 100 | % | $ | 245,274 | 100 | % | $ | 409,049 | 100 | % | ||||||||||||
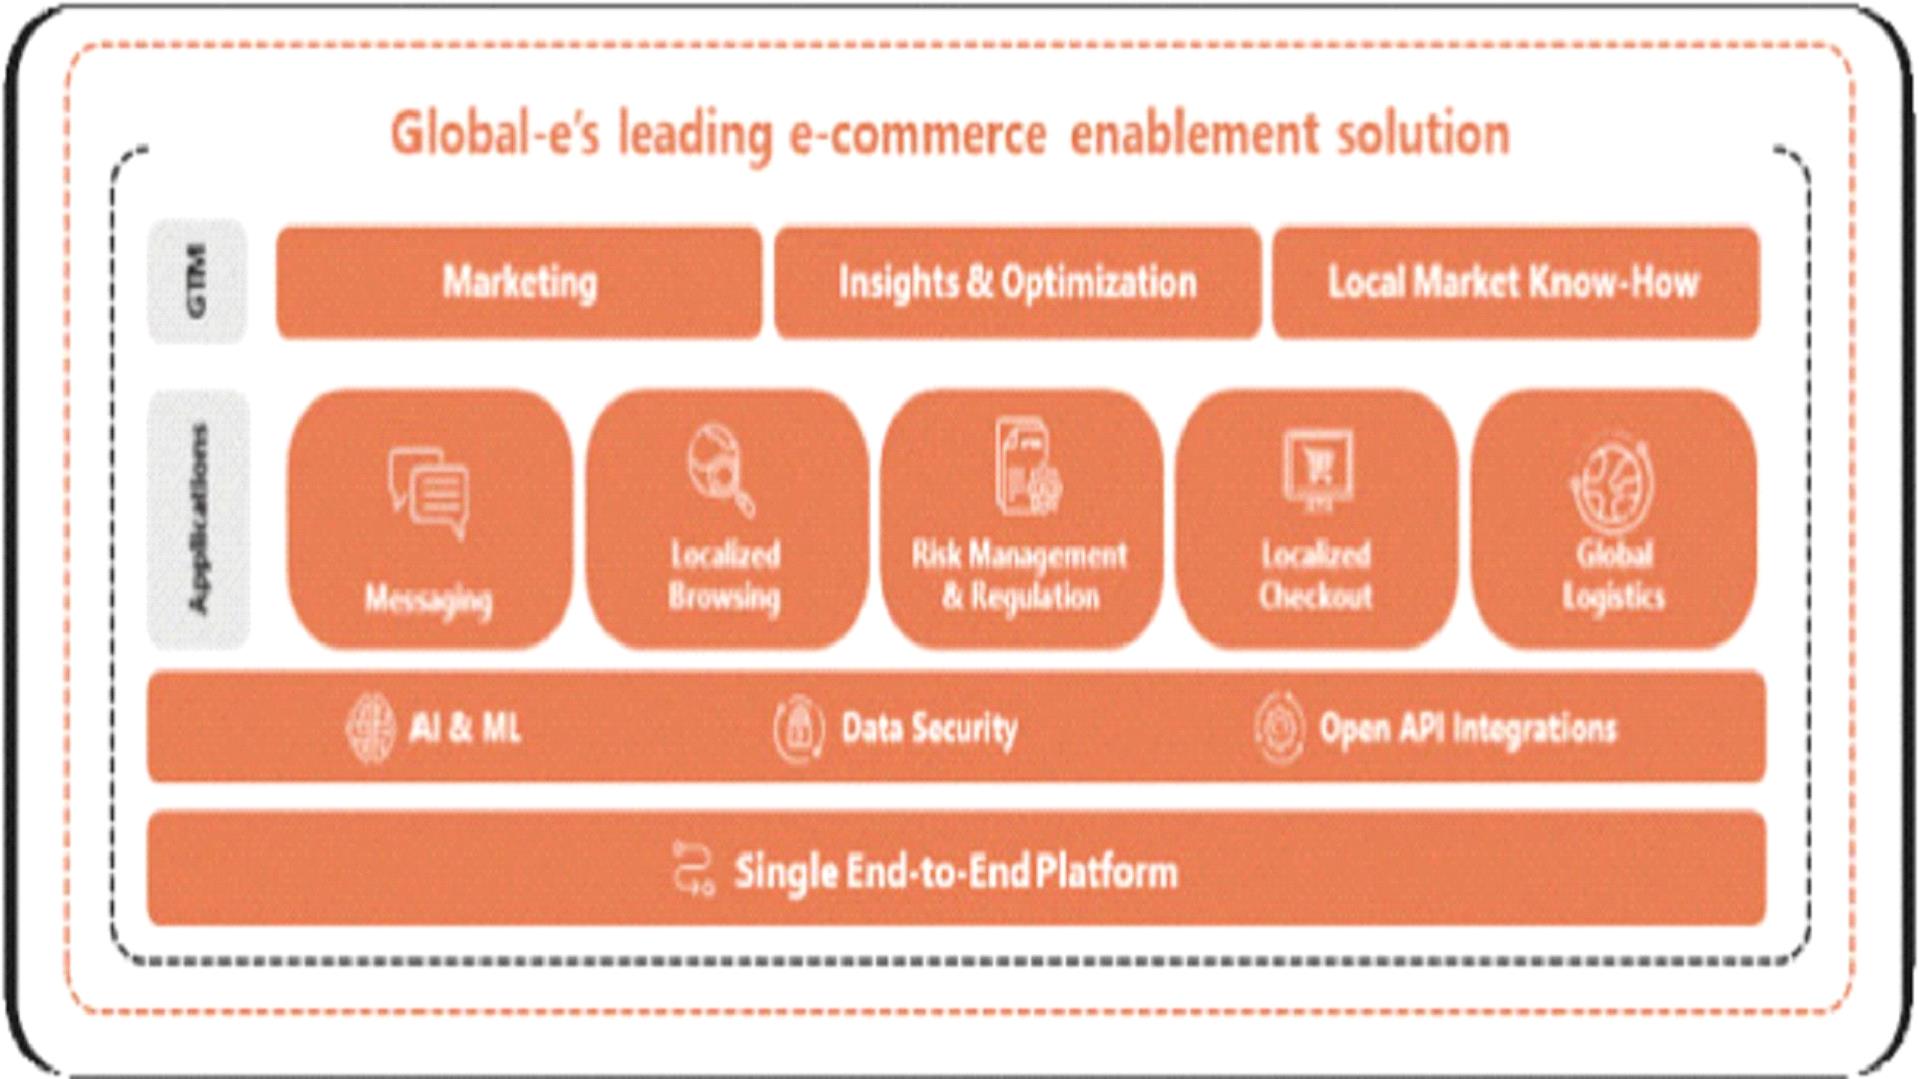
Shopping experience features
• | Localized browsing - We offer localized browsing features, such as a configurable welcome message or a top-line marketing banner that can be customized by market and presented in the local language. Customization breeds familiarity, reducing bounce rates, increasing conversion and improving shopper confidence through a local shopping experience. |

• | Local market pricing - We offer dynamic price translation to the shopper’s local currency based on market-specific business goals and in accordance with local pricing conventions (e.g. presenting prices in “dollar-ninety-nine” terms, such as $4.99 instead of $5.00, in relevant markets). Global-e offers support for payment in 100 global currencies, and we have found that more than 95% of shoppers choose to pay in their local currency when given the option. The below image shows examples of localized pricing in markets across the globe. |

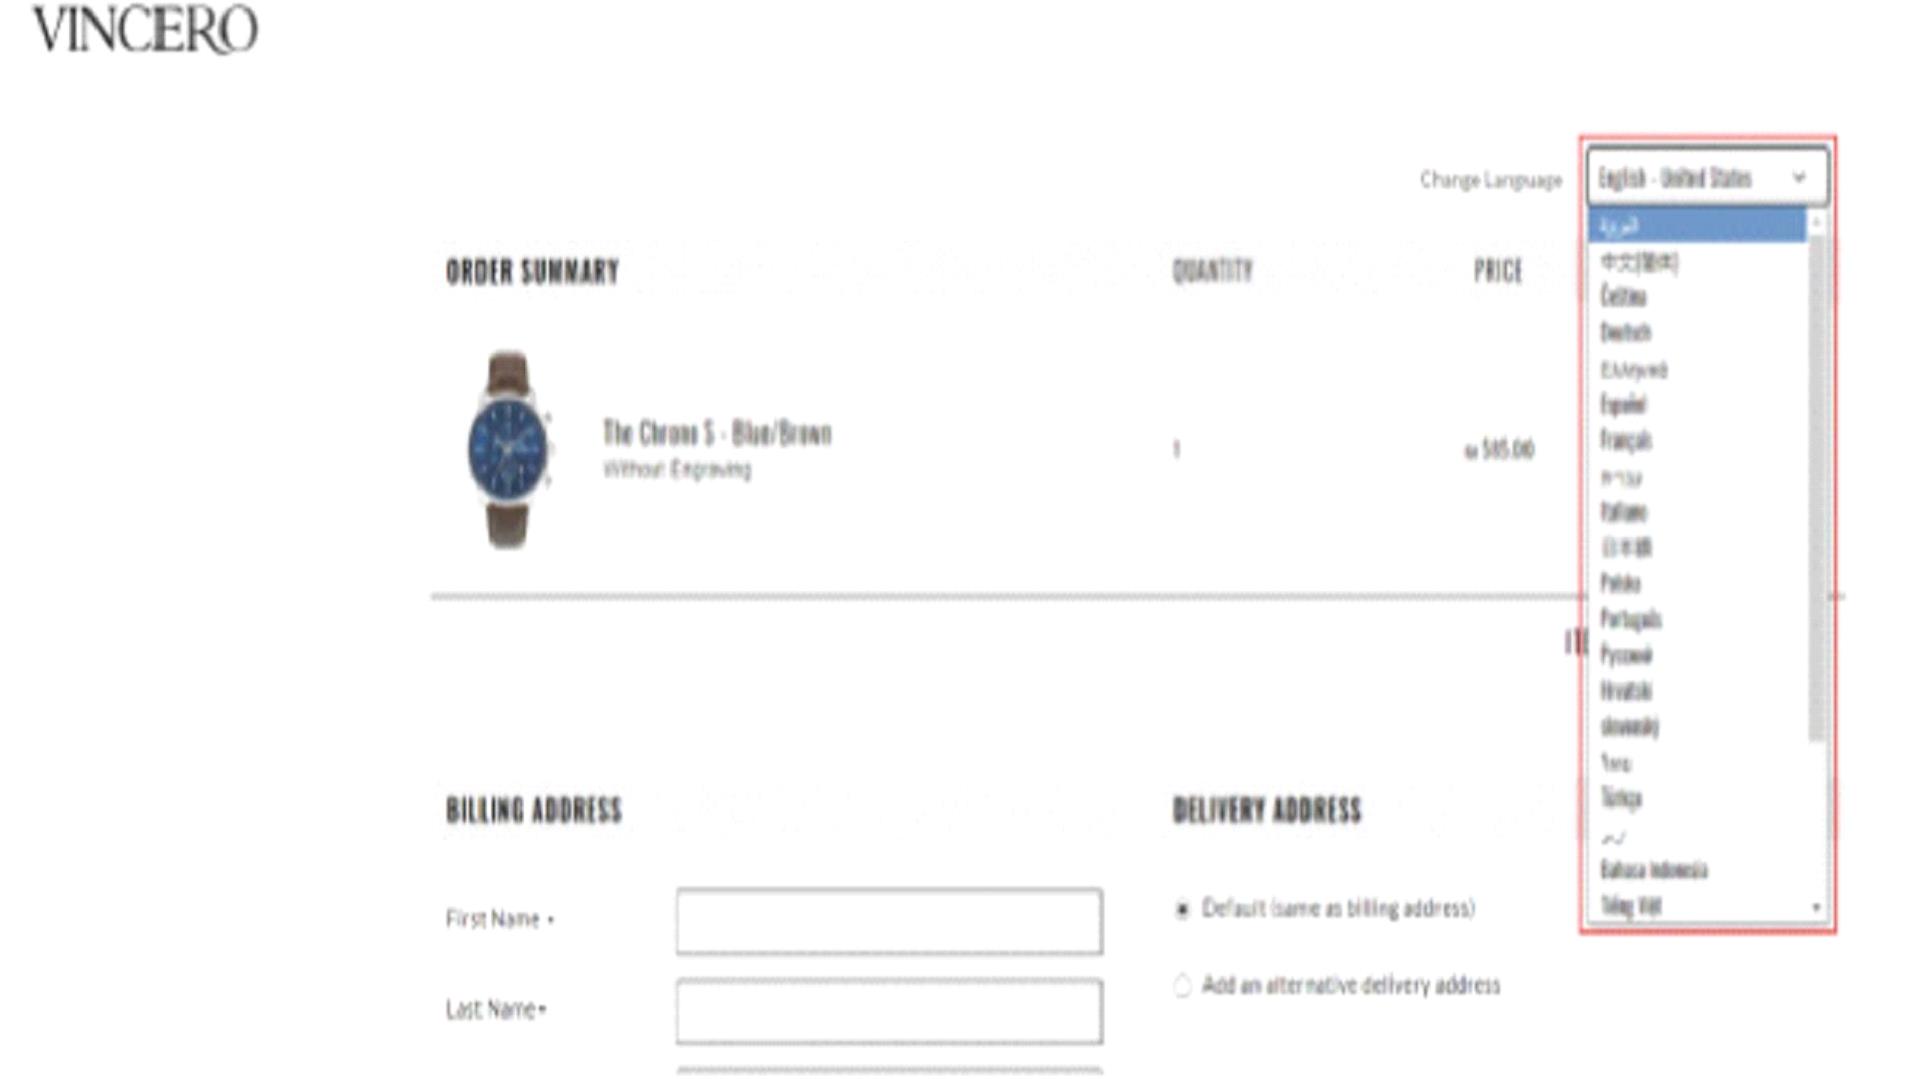
• | Localized checkout - Embedded within the brand’s e-commerce store, the Global-e checkout system supports over 30 different languages, enabling shoppers to switch the checkout language to their own native tongue for a more customized and local experience. We have found that in some markets, approximately 20% of shoppers choose to switch to their local language at checkout, even if their native language wasn’t supported during browsing. Further, shoppers checkout within the merchant website without being redirected to a third-party site. The below image shows an example of a language menu. |
• | Guaranteed landed cost - We provide shoppers with a “no-surprises” and guaranteed fully-landed cost. We offer multiple options, configurable by market, for handling import duties and taxes. For example, shoppers may select the option to prepay duties and/or taxes at checkout. We have found that on average more than 90% of shoppers from developed markets choose to pre-pay when given such option, despite the fact that it requires payment of a higher price at checkout. Alternatively, our platform has the capability to already embed this cost into the product price within the browsing journey (in full or partially), in order to facilitate an intuitive and frictionless smooth and user-friendly shopper journey. We believe this feature and options are critical in achieving high conversion rates across markets and promoting repeat shoppers. In addition to achieving shopper confidence, pre-collection of import duties and taxes enables orders to be dispatched to shoppers under a “Delivery Duties Paid” scheme through relevant shipping carriers. This serves to greatly simplify and streamline the process of releasing the goods from customs at the destination market, in turn contributing to a quicker and simpler delivery experience for the shopper. |

• | Multiple shipping options - our platform allows merchants to choose from a menu of shipping options, offering shoppers multiple delivery alternatives, depending on the destination market: mail, express courier, Cash-on-Delivery, store delivery, drop point delivery and more. As part of its market-specific value proposition, merchants can decide which shipping methods to offer and how to price them, based on Global-e’s competitive shipping rates or through their own contracted shipping carriers. |

• | Localized alternative payment methods - Preferred payment methods of shoppers differ from market to market. In some markets, such as the United States and United Kingdom, the use of global cards (Visa, MasterCard, etc.) is the most common payment method used. In others, local card, or universal alternative payment methods, such as PayPal, prevail. There are markets, both in developed and developing countries, where alternative payment methods are used more frequently than cards. For example, iDeal has the largest market share in the Netherlands; while the majority of online payments in China are carried out through AliPay, WeChatPay, and the UnionPay card scheme. In other countries, payment options such as Cash-On-Delivery or Buy-Now-Pay-Later are popular. |

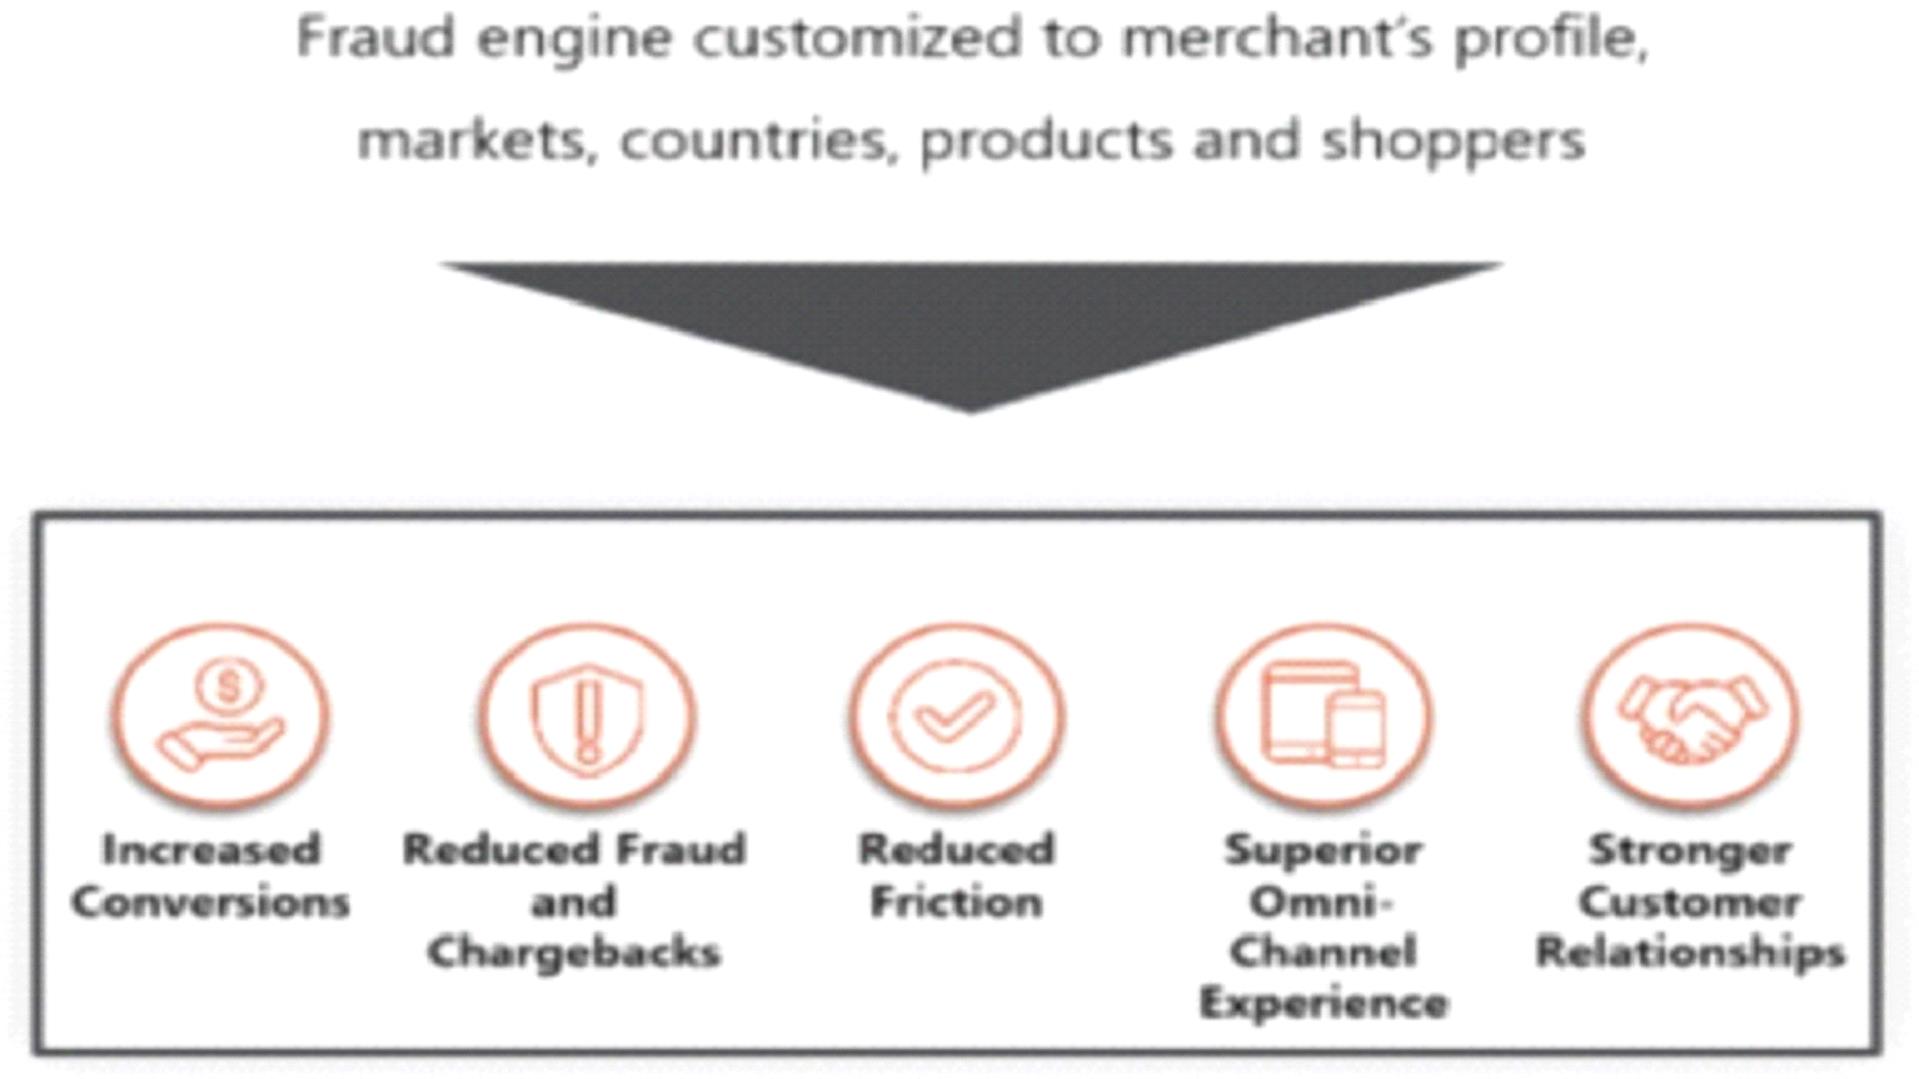
• | Real-time anti-fraud screening - Each order is scanned in real-time for potential payment fraud. Global-e utilizes advanced third-party screening services, coupled with proprietary algorithms and processes - all managed by a team of anti-fraud specialists. These capabilities enable Global-e to achieve high payment acceptance rates and low chargeback rates across international markets. The authorization/rejection decision is made in real time without the delays and costs associated with manual or semi-automatic transaction screening. This further contributes to a streamlined and satisfying shopper experience. |
• | International customer services - Global-e operates a branded self-service and multi-lingual online customer service portal, which contains answers to many frequently-asked questions that are typically raised post-sale by international shoppers regarding their orders. In addition, Global-e operates a manned contact center that serves to augment the brand’s own customer services team. Global-e’s contact center can provide either “behind the scenes” support for the merchant’s customer services team, or it can be in touch directly with the brand’s shoppers to handle their queries. |

• | Returns process - Global-e offers a comprehensive and efficient solution for product return management. Through Global-e’s proprietary branded and multi-lingual returns portal, shoppers are presented with multiple return options, according to the various returns services that the merchant enables for a given market. Returns options include self-postage, local return addresses, pre-paid postal labels and courier pick-ups. In addition, merchants set for each option an associated cost. Global-e deducts the return cost from the amount refunded to the shopper once merchants confirm successful receipt of the returned product. |

• | Application architecture. We operate proprietary and modern technology platforms, organically developed by our in-house R&D teams, leveraging leading third-party software where applicable. |
• | Infrastructure. Our platforms are deployed via market standard cloud computing infrastructure, allowing us to easily scale our platforms globally while maintaining optimal performance. |
• | Disaster Recovery. For our enterprise platform we maintain a secondary cloud-based data center, holding a full stack of updated applications, which is fully tested at least once a year, with the aim of ensuring the highest reliability for our shoppers. |
• | Security. We employ a multi-layer security approach utilizing both cloud infrastructure security and endpoint protection to enforce the highest degree of security. We adhere with all major security standards, including: PCI/DSS, GDPR and ISO 27001. We perform penetration tests continuously throughout the year by external vendors to identify any vulnerabilities. Our shift to a hybrid office/remote work environment could also negatively impact the security of our platforms and systems as well as our ability to prevent attacks or respond to them quickly, and as such we have taken steps designed to ensure remote work can be performed both effectively and securely. |
• | Uptime. Our platform maintains excellent service levels. Across all sites, our platform achieved over 99.9% average uptime for the year ended December 31, 2022. |
• | In-House D2C. Some merchants have built and managed international stores and prefer to maintain these operations in-house supported by proprietary capabilities developed by them, features and capabilities provided by the e-commerce platform they utilize, and/or third-party cross-border components. This DIY approach is expensive and complex to maintain, while also lacking the flexibility and know-how of local preferences that a specialized cross-border provider, such as Global-e, can provide. We believe that with the growing importance to merchants of cross-border D2C, coupled with market awareness of the advantages of using reputable and experienced cross border third parties, such as Global-e, the trend of shifting towards a third-party cross-border enabler will accelerate - with Global-e as the distinguished front runner. |
• | Alternative, Cross-Border End-to-End Platforms. There are a limited number of cross-border platforms offering solutions similar in nature and breadth to those offered by Global-e. However, we believe that none of these providers have the combination of track record, variety of merchants, scale, feature set and data, to match Global-e’s overall offering. The level of sophistication embedded in our platform and solutions stemming from executing millions of transactions annually, across merchants in over 200 destination markets, is what makes us a leader in the world of cross-border ecommerce. |
• | Legacy Players and Local Distributors. Merchants expanding abroad may partner with local distributors, granting them licenses to operate in a given market. Licenses typically include an arrangement to sell goods through bricks-and-mortar locations as well as digital rights to the brand, effectively allowing the local licensee to manage the full client-facing relationship with international shoppers. This may cause frustration among shoppers, as local selection may be limited to best-selling products, and interactions with the merchant are routed through a middle-man. As merchants increasingly understand the value of their digital channels and leverage social media to interact directly with shoppers, we believe wide-ranging agreements with local distributors will continue to become less common, especially for digital D2C e-commerce. Nevertheless, some merchants are constrained by long-term, legacy agreements with distributors, preventing the merchant from directly selling to and interacting with shoppers in select (or all) foreign markets, at least for a certain period of time. |
• | Non-D2C Online Channels. Non-D2C online channels, such as marketplaces, represent digital alternatives to the traditional distributor model. Such online channels are varied, ranging from local, multi-local, regional and global platforms. They generate online traffic from shoppers by marketing under the marketplace’s own brand and command a fee, or “take rate” that may represent a meaningful percentage of the merchant’s revenue. To facilitate the transaction between shopper and seller, online channels may provide complimentary services such as payment acquiring, fraud protection, order management, and access to shipping providers. Merchants do not have direct access to shoppers; rather, they must list their products through the intermediary - i.e., the marketplace - to gain exposure. As such, by selling through non-D2C online channels, merchants often expose their brand to direct competition from other brands sold in parallel through such online channels (e.g. a common feature of marketplaces is “people who bought this also bought this” lists which may include different brands). For geographical and segmental revenue, see Note 2, reporting segments and geographical information included within our consolidated financial statements elsewhere in this Annual Report. |
| C. | Organizational Structure |
| • | Global-e online Pte Ltd (Singapore) |
| • | Globale UK Limited (England) |
| • | Crossborder Global Apparel and Equipment Trading L.L.C (UAE) |
| • | Crossborder Global Apparel and Equipment Trading L.L.C (DMCC Branch) (UAE) |
| • | Global-e Middle East FZCO Dubai Branch (UAE, Jebel Ali Free Zone) |
| | • | Global-e Middle East FZCO (DAFZA) (UAE, Dubai Airport Free Zone) | |
| • | E Commerce Globale Middle East FZCO (UAE, Dubai Commercity Free Zone) | ||
| • | Global-e Canada e-commerce Ltd. (Canada) | ||
| • | Global-e CH AG (Switzerland) | ||
| • | Global-e NL B.V (Netherlands) | ||
| • | Global-e Japan KK (Japan) | ||
| • | Global-e France SAS (France) | ||
| • | Olami E-Commerce Solutions Ireland Limited (Ireland) | ||
| • | Global-e Australia Pty Ltd. (Australia) | ||
| • | Global-e Spain S.L (Spain) |
| • | Global-e HK Limited (Hong Kong) | ||
| • | Global-e (Beijing) Technology Co., Ltd. (China) | ||
| • | Global-e US Inc. (Delaware, USA). | ||
| • | Global-e Panama Inc. (Panama, Colon Free Zone) | ||
| • | Global-e Solutions Ltd. (Israel) |
| • | Global-e South Africa (PTY) Ltd. (South Africa) |
| • | Global-e Solutions Korea Ltd. (Korea) |
| • | Crossborder Solutions For E- Commerce Ltd. (Egypt)* |
| • | Flow Commerce Inc. (Delaware, USA) | ||
| • | Flow Commerce Limited (Ireland) | ||
| • | Flow Commerce Australia Pty Ltd. (Australia) | ||
| • | Flow Commerce Canada Inc. (Canada) | ||
| • | Flow Trading Shanghai Company Limited (China) | ||
| • | Flow Commerce UK LTD (England) | ||
| • | Borderfree Inc. (US) | ||
| • | Pitney Bowes Payco US Inc. (US) | ||
| • | Borderfree Research and Development (Israel) | ||
| • | Pitney Bowes PayCo Holdings Limited (Ireland) | ||
| • | Borderfree UK Limited (England) | ||
| • | Borderfree Payco Australia PTY Ltd. (Australia) | ||
| • | Borderfree PayCo Canada Ltd. (Canada) | ||
| • | Pitney Bowes PayCo Japan KK (Japan) | ||
| • | Pitney Bowes PayCo Singapore Pte. Ltd. (Singapore) | ||
| • | Borderfree PayCo Switzerland GmbH (Switzerland) | ||
| • | Pitney Bowes PayCo UK Limited (England) |
| D. | Property, Plants and Equipment |

Year Ended December 31, | ||||||||||||
| ($ in millions) | 2020 | 2021 | 2022 | |||||||||
| Gross Merchandise Value | $ | 774 | $ | 1,449 | $ | 2,450 | ||||||
| Net Dollar Retention Rate | 172 | % | 152 | % | 130 | % | ||||||
| Revenue | $ | 136.4 | $ | 245.3 | $ | 409.0 | ||||||
| Non-GAAP Gross Profit | $ | 43.5 | $ | 91.4 | $ | 167.9 | ||||||
| Non-GAAP Gross Margin | 31.9 | % | 37.3 | % | 41.1 | % | ||||||
| Adjusted EBITDA | $ | 12.6 | $ | 32.4 | $ | 48.7 | ||||||
| Adjusted EBITDA Margin | 9.2 | % | 13.2 | % | 11.9 | % | ||||||
| Year Ended December 31, | ||||||||||||
| ($ in millions) | 2020 | 2021 | 2022 | |||||||||
| Gross profit | $ | 43.5 | $ | 91.4 | $ | 158.2 | ||||||
| Operating profit (loss) | 8.4 | (65.7 | ) | (189.3 | ) | |||||||
| Net profit (loss) | $ | 3.9 | $ | (74.9 | ) | $ | (195.4 | ) | ||||

• | Continued Growth in Cross-Border E-commerce: We expect to benefit from the continuation of several long-term secular market trends, including growth in global e-commerce over time, the continued rise in the influence of social media on shopper spending habits worldwide, the increasing relevance of D2C, as well as increased cross-border e-commerce. The rise in complexity of cross-border trade, stemming from constantly-changing regulations and technology, serves as an additional tailwind by driving merchant demand for third-party solutions with the relevant expertise and infrastructure, such as Global-e. |
• | Increasing Existing Merchant Retention and Expansion: We care deeply about the merchants we serve. Our commitment to their success, we believe, increases retention and likelihood of expanding their activity on our platform. Supporting our merchants begins with enhancing both the shopper and the merchant experience; as such, we focus our efforts on developing products and functionality to ease the complexity they face when engaging in cross-border e-commerce. We provide customer support services to their shoppers, take full responsibility for processing duties and taxes, employ dedicated teams to optimize their offering and increase their sales conversion and continue to take steps to boost retention. Our effectiveness in retaining and expanding our existing merchants’ sales is a critical component of our revenue growth and operating results. |
• | New Merchant Acquisition: Our growth depends in part on our ability to attract new merchants and add their GMV to our platform. Over the past years, we have experienced substantial expansion in the number of merchants served by our platform, which totaled 1,036 and 657 as of December 31, 2022 and December 31, 2021, respectively. New merchant acquisition is a key to scaling our platform. We have historically achieved efficient payback periods driven by a combination of direct sales, inbound inquiries, word-of-mouth referrals and channel partnerships. Continuing to add merchants to our platform in an efficient manner is a key component of our ability to grow our revenues. As a result of the signed expansion of our partnership with Shopify, we expect that we will be able to accelerate the growth of our merchant base. |
• | Successful Expansion to Additional Geographies: We believe our platform can compete successfully around the world, as it enables merchants, regardless of geography, to expand their market footprint to more shoppers by selling globally. In order to successfully acquire merchants across geographies, Global-e has local sales teams in the United States, the United Kingdom, the EU, Japan and Australia as part of our efforts to expand our business within the APAC region. We plan to add local sales and additional required support in further select international markets over time to support our growth. |
• | Investing to Scale Our Platform and Merchant Base: We have made, and will continue to make, significant investments in our platform to retain and scale our merchant base and enhance their experiences. In the years ended December 31, 2020, 2021 and 2022, excluding stock-based compensation, we spent $14.9 million (or 10.9% of revenue), $25.6 million (or 10.4% of revenue) and $59.2 million (or 14.5% of revenue), respectively, on research and development. These amounts represent year over year increases of 71.7% and 131.7% in the years ended December 31, 2021 and 2022, respectively. The increase of research and development spend as a percentage of revenue is attributed to the acquisitions of Flow and Borderfree and our current efforts around major product developments, including the native integration with Shopify, the new white label offering and the development of traffic generation capabilities. In the years ended December 31, 2020, 2021 and 2022, excluding the amortization of the Shopify warrants related asset and stock-based compensation, we spent $9.4 million (or 6.9% of revenue), $19.1 million (or 7.8% of revenue) and $53.2 million (or 13.0% of revenue), respectively, on sales and marketing. These amounts represent year over year increases of 103.3% and 178.4% in the years ended December 31, 2021 and 2022, respectively. Overall research and development expenses were $15.4 million, $29.8 million and $81.2 million in the years ended December 31, 2020, 2021 and 2022, respectively. Overall sales and marketing expenses were $9.8 million, $104.7 million and $206.1 million in the years ended December 31, 2020, 2021 and 2022, respectively. We plan to continue to invest significantly in go-to-market and innovation to address the needs of merchants. We also plan to increase headcount. The resources we commit to, and the investments we make in, our platform are designed to retain and expand the sales of our merchants, expand into new geographies and acquire new merchants, fuel our “Smart Insights” data set and improve our operating results in the long term. |
• | Revenue Seasonality: Our revenue is highly correlated with the level of GMV that our merchants generate through our platform. Our merchants typically process additional GMV each year in the fourth quarter, which includes Black Friday, Cyber Monday and the holiday season, driven by an uptick in e-commerce sales. As a result, we historically have generated higher revenues in the fourth quarter than in other quarters. In the years ended December 31, 2020, 2021 and 2022, fourth quarter GMV represented approximately 39%, 35% and 34%, respectively, of our total GMV. We believe that similar seasonality trends will affect our future quarterly performance. |
• | Increased Efficiency from Economies of Scale: As our GMV scales, we can achieve margin expansion due to operating leverage. In addition, our larger size allows us to negotiate better terms with our suppliers allowing us to further optimize our cost base. As the number of merchants on our platform grows, we also generate increasing amounts of data which in turn enable smarter decisions and optimizations that further increase efficiency. | ||
• | COVID-19: The global pandemic resulting from the spread of COVID-19 increased e-commerce volumes, a trend that we believe has had a positive impact on our business. Lockdown restrictions contributed to an increased shift of shoppers to online retail activity. In addition, store closures and social distancing requirements accelerated the transition of merchants to focusing on D2C e-commerce in general, and cross-border e-commerce in particular. Our platform remained active, with no material outages or service disruptions. We successfully navigated elevated global order volumes as well as the need to rapidly adapt to changing circumstances such as temporary closures due to lockdowns, demonstrating our platform’s resilience, flexibility and effectiveness during the period of global volatility. The lift of COVID-19 restrictions across various geographies, inducing the re-opening of the physical stores and the ease of social distance requirements, has led to normalization of e-commerce growth rates. However, we continue to witness the accelerated transition of merchants to D2C e-commerce in general and cross-border e-commerce in particular, which we believe is a long-term direction due to the clear advantages of D2C. |
• | Global macro-economic: Inflationary pressures and rising interest rates in key markets may influence consumer sentiment and have a negative effect on consumer spend. Currency exchange rate fluctuations may impact our revenues and expenses and hence, our operating results. Global events, such as the ongoing situation in Ukraine, have created extreme volatility in the global capital markets and is expected to have further global economic consequences, including disruptions to the global supply chain and energy markets, which may adversely affect us or the third parties on whom we rely to conduct our business and may also have a negative effect on consumer spend. |
| A. | Operating Results |
Year Ended December 31, | ||||||||||||
2020 | 2021 | 2022 | ||||||||||
| (in thousands) | ||||||||||||
| Revenue | $ | 136,375 | $ | 245,274 | $ | 409,049 | ||||||
| Cost of revenue | 92,902 | 153,841 | 250,871 | |||||||||
| Gross profit | 43,473 | 91,433 | 158,178 | |||||||||
| Operating expenses: | ||||||||||||
| Research and development | 15,400 | 29,761 | 81,206 | |||||||||
| Sales and marketing | 9,838 | 104,687 | 206,100 | |||||||||
| General and administrative | 9,822 | 22,643 | 60,196 | |||||||||
| Total operating expenses | 35,060 | 157,091 | 347,502 | |||||||||
| Operating profit (loss) | 8,413 | (65,658 | ) | (189,324 | ) | |||||||
| Financial expenses, net | 4,339 | 8,570 | 12,093 | |||||||||
| Profit (loss) before income taxes | 4,074 | (74,228 | ) | (201,417 | ) | |||||||
| Income (benefit) taxes | 160 | 705 | (6,012 | ) | ||||||||
| Net profit (loss) | $ | 3,914 | $ | (74,933 | ) | $ | (195,405 | ) | ||||
Year ended December 31, | ||||||||||||
2020 | 2021 | 2022 | ||||||||||
| (as a % of revenue) | ||||||||||||
| Revenue | 100.0 | % | 100.0 | % | 100 | % | ||||||
| Cost of revenue | 68.1 | 62.7 | 61.3 | |||||||||
| Gross profit | 31.9 | 37.3 | 38.7 | |||||||||
| Operating expenses: | ||||||||||||
| Research and development | 11.3 | 12.1 | 19.9 | |||||||||
| Sales and marketing | 7.2 | 42.7 | 50.4 | |||||||||
| General and administrative | 7.2 | 9.2 | 14.7 | |||||||||
| Total operating expenses | 25.7 | 64.0 | 85.0 | |||||||||
| Operating profit (loss) | 6.2 | (26.7 | ) | (46.3 | ) | |||||||
| Financial expenses, net | 3.2 | 3.5 | 3.0 | |||||||||
| Profit (loss) before income taxes | 3.0 | (30.3 | ) | (49.2 | ) | |||||||
| Income taxes | 0.1 | 0.3 | (1.5 | ) | ||||||||
| Net profit (loss) | 2.9 | % | (30.6 | )% | (47.8 | )% | ||||||
Year Ended December 31, | ||||||||||||
2020 | 2021 | 2022 | ||||||||||
| Gross Profit | 43,473 | 91,433 | 158,178 | |||||||||
| Amortization of acquired intangibles included in cost of revenue | - | - | 9,743 | |||||||||
| Non-GAAP Gross Profit | 43,473 | 91,433 | 167,921 | |||||||||
| Revenues | 136,375 | 245,274 | 409,049 | |||||||||
| Non-GAAP Gross Margin | 31.9 | % | 37.3 | % | 41.1 | % |
| Reconciliation to Adjusted EBITDA |
Year Ended December 31, | ||||||||||||
2020 | 2021 | 2022 | ||||||||||
| Operating profit (loss) | 8,413 | (65,658 | ) | (189,324 | ) | |||||||
| 1 Stock-based compensation: | ||||||||||||
| Cost of revenue | 10 | 85 | 262 | |||||||||
| Research and development | 507 | 4,192 | 21,970 | |||||||||
| Selling and marketing | 442 | 1,287 | 3,877 | |||||||||
| General and administrative | 2,997 | 6,437 | 12,800 | |||||||||
| Total stock-based compensation | 3,956 | 12,001 | 38,909 | |||||||||
| 2 Depreciation and amortization | 235 | 331 | 1,585 | |||||||||
| 3 Secondary offering costs | - | 879 | - | |||||||||
| 4 Commercial agreement asset amortization | - | 84,298 | 149,047 | |||||||||
| 5 Amortization of acquired intangibles | - | - | 27,833 | |||||||||
| 6 Merger related contingent consideration | - | - | 12,161 | |||||||||
| 7 Acquisition related expenses | - | 573 | 8,492 | |||||||||
| Adjusted EBITDA | 12,604 | 32,424 | 48,703 | |||||||||
| Revenues | 136,375 | 245,274 | 409,049 | |||||||||
| Adjusted EBITDA Margin | 9.2 | % | 13.2 | % | 11.9 | % |
| B. | Liquidity and Capital Resources |
Year ended December 31, | ||||||||||||
| (in thousands) | 2020 | 2021 | 2022 | |||||||||
| Net cash provided by operating activities | $ | 29,350 | $ | 15,748 | $ | 81,485 | ||||||
| Net cash used in investing activities | (24,046 | ) | (40,489 | ) | 330,101 | |||||||
| Net cash provided by financing activities | 59,360 | 398,607 | 1,239 | |||||||||
| C. | Research and Development, Patents and Licenses, Etc. |
| D. | Trend Information |
• | Transformation of retail to be online-focused - While e-commerce growth faced some headwinds from the re-opening of physical stores during 2022, the retail market has nevertheless continues to undergo a shift towards e-commerce, with growth in online sales overtime, outpacing that of traditional retail. |
• | Rise of cross-border e-commerce - Cross-border e-commerce growth rates are outpacing domestic growth rates, propelled by the rise of social media and global influencers, resulting in globalization of consumer tastes and increased cross-border demand. |
• | Emphasis on D2C sales - e-commerce enables a stronger model of D2C sales for traditional and new merchants, which paves a strategic route for merchants to take ownership of shopper relationships worldwide. |
• | Difficulty in executing on a Do-It-Yourself (“DIY”) strategy - Managing a D2C cross-border network is capital-intensive, requires deep local know-how, and a complex combination of features and capabilities to navigate across markets, further exacerbated by local on-going regulatory changes. |
• | Tailwinds from COVID-19 - The COVID-19 pandemic accelerated trends of shoppers moving online and merchants prioritizing digital channels; even though during 2022 e-commerce growth has normalized due to some headwinds as physical stores re-opened in key markets, e-commerce adoption rates continue to follow their long-term historical growth trajectory. | ||
• | Supply chain evolution and disruption - Supply chains and in particular cross border supply chains are developing and enabling more efficient trade over time. The COVID-19 pandemic has disrupted supply chains and weighed on e-commerce trade, the impact was significantly less evident in D2C channels, as merchants prioritize D2C over other channels. | ||
• | Global macro-economic - Inflationary pressures and rising interest rates in key markets may influence consumer sentiment and may have a negative effect on consumer spend. Exchange rate fluctuations may incur us additional costs and losses for revenues in foreign currencies Military hostilities such as the ongoing situation in Ukraine, has created extreme volatility in the global capital markets and may cause disruptions to the global supply chain and energy markets, which may adversely affect us or the third parties on whom we rely on and may also have a negative effect on consumer spend. |
| E. | Critical Accounting Estimates |
| 1. | Service Fees -The Company provides merchants a cross-border e-commerce platform which enables the sale of their products to consumers worldwide. Revenue is generated as a percentage of the value of transactions that flow through the Company’s platform. |
| 2. | Fulfillment services - The Company offers shipping, handling, and other global delivery services in order to deliver merchants’ goods to consumers. |
| A. | Directors and Senior Management |
| Name | Age | Position | ||||
| Executive Officers | | |||||
| Amir Schlachet | 46 | Co-Founder, Chief Executive Officer, Director | ||||
| Shahar Tamari | 51 | Co-Founder, Chief Operations Officer, Director | ||||
| Nir Debbi | 49 | Co-Founder, President, Director | ||||
| Ofer Koren | 52 | Chief Financial Officer | ||||
| Eden Zaharoni | 46 | Chief Technology Officer | ||||
| Ran Fridman | 49 | Chief Revenue Officer | ||||
| Non-Executive Directors | ||||||
| Thomas Studd | 42 | Director | ||||
| Miguel Angel Parra | 55 | Director | ||||
| Tzvia Broida | 54 | Director | ||||
| Anna Bakst | 62 | Director | ||||
| Iris Epple-Righi | 58 | Director | ||||
| Board Diversity Matrix (as of the date of this Annual Report) | ||||
| Country of Principal Executive Offices: | Israel | |||
| Foreign Private Issuer | Yes | |||
| Disclosure Prohibited under Home Country Law | No | |||
| Total Number of Directors | 8 | |||
Female | Male | Non- Binary | Did Not Disclose Gender | |
| Part I: Gender Identity | ||||
| Directors | 3 | 5 | - | - |
| Part II: Demographic Background | ||||
| Underrepresented Individual in Home Country Jurisdiction | 2 | |||
| LGBTQ+ | - | |||
| Did Not Disclose Demographic Background | - | |||
| B. | Compensation |
• | at least a majority of the shares held by all shareholders who are not controlling shareholders and do not have a personal interest in such matter, present and voting at such meeting, are voted in favor of the compensation package, excluding abstentions; or |
• | the total number of shares of non-controlling shareholders and shareholders who do not have a personal interest in such matter voting against the compensation package does not exceed two percent (2%) of the aggregate voting rights in the Company. |
Name and Principal Position(2) | Base Salary ($) | Benefits and Perquisites ($)(3) | Variable compensation ($)(4) | Equity-Based Compensation ($)(5) | Total ($) | |||||||||||||||
(in thousands, US dollars) (1) | ||||||||||||||||||||
Amir Schlachet, Co-Founder, Chief Executive Officer, Director | 327 | 70 | 119 | 1,671 | 2,187 | |||||||||||||||
Shahar Tamari, Co-Founder, Chief Operations Officer, Director | 327 | 59 | 119 | 1,671 | 2,176 | |||||||||||||||
Nir Debbi, Co-Founder, President, Director | 327 | 64 | 119 | 1,671 | 2,181 | |||||||||||||||
Ofer Koren, Chief Financial Officer | 327 | 67 | 125 | 1,105 | 1,624 | |||||||||||||||
| Ran Fridman, Chief Revenue Officer | 327 | 83 | 131 | 698 | 1,239 | |||||||||||||||
(1) | All amounts reported in the table are in terms of cost to us, as recorded in our financial statements. | ||
(2) | All Covered Executives listed in the table are our full-time employees. Cash compensation amounts denominated in currencies other than the U.S. dollar were converted into U.S. dollars at the average conversion rate for 2022. | ||
(3) | Amounts reported in this column include social benefits paid by us on behalf of the Covered Executives, convalescence pay, contributions made by the company to an insurance policy or a pension fund, work disability insurance, severance, educational fund and payments for social security. | ||
(4) | Amounts reported in this column refer to incentive and variable compensation payments which were paid or accrued with respect to 2022. In accordance with the Company’s compensation policy, we also paid cash bonuses to our Covered Executives upon compliance with predetermined performance parameters and an over achievement bonus as set by the compensation committee and the board of directors. These amounts were provided for in our 2022 financial statements (but will be paid during 2023). | ||
(5) | Amounts reported in this column represent the expense recorded in our financial statements for the year ended December 31, 2022 with respect to equity-based compensation grants-- options and restricted share units. The relevant amounts underlying the equity awards granted to our officers during 2022, will continue to be expensed in our financial statements over a four-year period during the years 2022-2025 on account of the 2022 grants in similar annualized amounts. Assumptions and key variables used in the calculation of such amounts are described in Note 9 to our audited consolidated financial statements included in Item 18 of this Annual Report. All equity-based compensation grants to our Covered Executives were made in accordance with the parameters of our Company’s compensation policy and were approved by our compensation committee and board of directors. | ||
| C. | Board Practices |
• | the Class I directors are Amir Schlachet, Miguel Angel Parra and Iris Epple-Righi, and their terms will expire at our annual general meeting of shareholders to be held in 2025; |
• | the Class II directors, are Nir Debbi and Anna Jain Bakst, and their terms will expire at our annual meeting of shareholders to be held in 2023; and |
• | the Class III directors are Shahar Tamari, Thomas Studd and Tzvia Broida, and their terms will expire at our annual meeting of shareholders to be held in 2024. |
• | at least a majority of the shares of non-controlling shareholders and shareholders that do not have a personal interest in the approval voted at the meeting are voted in favor (disregarding abstentions); or |
• | the total number of shares of non-controlling shareholders and shareholders who do not have a personal interest in such appointment that re voted against such appointment does not exceed two percent (2%) of the aggregate voting rights in the company. |
| • | | retaining and terminating our independent auditors, subject to ratification by the board of directors, and in the case of retention, to ratification by the shareholders; |
| • | | pre-approving audit and non-audit services to be provided by the independent auditors and related fees and terms; |
• | overseeing the accounting and financial reporting processes of our company and audits of our financial statements, the effectiveness of our internal control over financial reporting and making such reports as may be required of an audit committee under the rules and regulations promulgated under the Exchange Act; |
| • | reviewing with management and our independent auditor our annual and quarterly financial statements prior to publication or filing (or submission, as the case may be) to the SEC; |
• | recommending to the board of directors the retention and termination of the internal auditor, and the internal auditor’s engagement fees and terms, in accordance with the Companies Law as well as approving the yearly or periodic work plan proposed by the internal auditor and reviewing and discussing the results of internal auditor activities, including significant findings and management’s responses to significant findings; |
• | reviewing policies and procedures with respect to transactions (other than transactions related to the compensation or terms of services) between the Company and officers and directors, or affiliates of officers or directors, or transactions that are not in the ordinary course of the Company’s business and deciding whether to approve such acts and transactions if so required under the Companies Law; | ||
| • | Reviewing policies with respect to assessment and risk management, including the management of financial risks, cybersecurity, and information security risks; | ||
| • | Periodically evaluating the committee’s performance; and | ||
| • | | establishing procedures for the handling of employees’ complaints as to the management of our business and the protection to be provided to such employees. |
| • | | making recommendations to the board of directors with respect to the approval of the compensation policy for office holders and, once every three years, regarding any extensions to a compensation policy that was adopted for a period of more than three years; |
| • | | reviewing the implementation of the compensation policy and periodically making recommendations to the board of directors with respect to any amendments or updates of the compensation policy; |
| | • | resolving whether or not to approve arrangements with respect to the terms of office and employment of office holders; and |
| • | exempting, under certain circumstances, a transaction with our Chief Executive Officer from the approval of our shareholders. |
• | recommending to our board of directors for its approval a compensation policy in accordance with the requirements of the Companies Law as well as other compensation policies, incentive-based compensation plans and equity-based compensation plans, and overseeing the development and implementation of such policies and recommending to our board of directors any amendments or modifications to such policies the committee deems appropriate, including as required under the Companies Law; |
• | reviewing and approving the granting of options and other incentive awards to our Chief Executive Officer and other executive officers, including reviewing and approving corporate goals and objectives relevant to the compensation of our Chief Executive Officer and other executive officers; |
| • | | approving and exempting certain transactions regarding office holders’ compensation pursuant to the Companies Law; and |
| | • | administering our equity-based compensation plans, including without limitation, approving the adoption of such plans, amending and interpreting such plans and the awards and agreements issued pursuant thereto, and making awards to eligible persons under the plans and determining the terms of such awards. |
| • | | such majority includes at least a majority of the shares held by shareholders who are not controlling shareholders and shareholders who do not have a personal interest in such compensation policy; or |
| • | | the total number of shares of non-controlling shareholders and shareholders who do not have a personal interest in the compensation policy and who vote against the policy does not exceed two percent (2%) of the aggregate voting rights in the Company. |
| | • | | the education, skills, experience, expertise and accomplishments of the relevant office holder; |
| • | the office holder’s position and responsibilities; |
| • | prior compensation agreements with the office holder; |
• | the ratio between the cost of the terms of employment of an office holder and the cost of the employment of other employees of the company, including employees employed through contractors who provide services to the company, in particular the ratio between such cost to the average and median salary of such employees of the company, as well as the impact of disparities between them on the work relationships in the company; |
| • | if the terms of employment include variable components - the possibility of reducing variable components at the discretion of the board of directors and the possibility of setting a limit on the value of non-cash variable equity-based components; and |
| • | if the terms of employment include severance compensation - the term of employment or office of the office holder, the terms of the office holder’s compensation during such period, the company’s performance during such period, the office holder’s individual contribution to the achievement of the company goals and the maximization of its profits and the circumstances under which he or she is leaving the company. |
| • | with regards to variable components: |
• | with the exception of office holders who report to the chief executive officer, a means of determining the variable components on the basis of long-term performance and measurable criteria; provided that the company may determine that an immaterial part of the variable components of the compensation package of an office holder shall be awarded based on non-measurable criteria, or if such amount is not higher than three months’ salary per annum, taking into account such office holder’s contribution to the company; | ||
| | • | the ratio between variable and fixed components, as well as the limit of the values of variable components at the time of their payment, or in the case of equity-based compensation, at the time of grant; |
• | a condition under which the office holder will return to the company, according to conditions to be set forth in the compensation policy, any amounts paid as part of the office holder’s terms of employment, if such amounts were paid based on information later to be discovered to be wrong, and such information was restated in the company’s financial statements; | ||
| • | the minimum holding or vesting period of variable equity-based components to be set in the terms of office or employment, as applicable, while taking into consideration long-term incentives; and |
| • | a limit to retirement grants. |
| | • | overseeing and assisting our board in reviewing and recommending nominees for election as directors; |
| • | | assisting our board in its oversight relating to corporate responsibility and environmental, social and governance matters; |
| • | | overseeing periodic assessments of the performance of the members of our board and its committees; and |
| • | establishing and maintaining effective corporate governance policies and practices, including, but not limited to, developing and recommending to our board a set of corporate governance guidelines applicable to our business. |
| • | information on the business advisability of a given action brought for his, her or its approval or performed by virtue of his, her or its position; and |
| • | all other important information pertaining to such action. |
| • | refrain from any act involving a conflict of interest between the performance of his, her or its duties in the company and his, her or its other duties or personal affairs; |
| • | | refrain from any activity that is competitive with the business of the company; |
| • | refrain from exploiting any business opportunity of the company for the purpose of gaining a personal advantage for himself, herself or itself or others; and |
| • | disclose to the company any information or documents relating to the company’s affairs which the office holder received as a result of his, her or its position as an office holder. |
• | an amendment to the company’s articles of association; | ||
| • | | an increase of the company’s authorized share capital; |
| • | a merger; or |
| • | | interested party transactions that require shareholder approval. |
• | a financial liability imposed on him or her in favor of another person pursuant to a judgment, including a settlement or arbitrator’s award approved by a court. However, if an undertaking to indemnify an office holder with respect to such liability is provided in advance, then such an undertaking must be limited to events which, in the opinion of the board of directors, can be foreseen based on the company’s activities when the undertaking to indemnify is given, and to an amount or according to criteria determined by the board of directors as reasonable under the circumstances, and such undertaking shall detail the abovementioned events and amount or criteria; |
• | reasonable litigation expenses, including legal fees, incurred by the office holder (1) as a result of an investigation or proceeding instituted against him or her by an authority authorized to conduct such investigation or proceeding, provided that (i) no indictment was filed against such office holder as a result of such investigation or proceeding; and (ii) no financial liability, such as a criminal penalty, was imposed upon him or her as a substitute for the criminal proceeding as a result of such investigation or proceeding or, if such financial liability was imposed, it was imposed with respect to an offense that does not require proof of criminal intent; and (2) in connection with a monetary sanction; |
• | reasonable litigation expenses, including legal fees, incurred by the office holder or imposed by a court in proceedings instituted against him or her by the company, on its behalf or by a third-party or in connection with criminal proceedings in which the office holder was acquitted or as a result of a conviction for an offense that does not require proof of criminal intent; and |
• | expenses, including reasonable litigation expenses and legal fees, incurred by an office holder in relation to an administrative proceeding instituted against such office holder, or certain compensation payments made to an injured party imposed on an office holder by an administrative proceeding, pursuant to certain provisions of the Israeli Securities Law, 1968 (the “Israeli Securities Law”). |
• | a breach of the duty of loyalty to the company, to the extent that the office holder acted in good faith and had a reasonable basis to believe that the act would not prejudice the company; |
• | a breach of the duty of care to the company or to a third-party, including a breach arising out of the negligent conduct of the office holder; |
• | a financial liability imposed on the office holder in favor of a third-party; |
• | a financial liability imposed on the office holder in favor of a third-party harmed by a breach in an administrative proceeding; and |
• | expenses, including reasonable litigation expenses and legal fees, incurred by the office holder as a result of an administrative proceeding instituted against him or her, pursuant to certain provisions of the Israeli Securities Law. |
• | a breach of the duty of loyalty, except to the extent that the office holder acted in good faith and had a reasonable basis to believe that the act would not prejudice the company; |
• | a breach of the duty of care committed intentionally or recklessly, excluding a breach arising out of the negligent conduct of the office holder; |
• | an act or omission committed with intent to derive illegal personal benefit; or |
| • | a fine, monetary sanction or forfeit levied against the office holder. |
| D. | Employees |
| E. | Share Ownership |
| F. | Disclosure of a Registrant’s Action to Recover Erroneously Awarded Compensation |
| A. | Major Shareholders |
| • | each person or group of affiliated persons known by us to own beneficially more than 5% of our outstanding ordinary shares; |
| • | each of our directors and executive officers individually; and |
| • | all of our executive officers and directors as a group. |
| Number of Ordinary Shares | ||||||||||||
| Name of Beneficial Owner | Amount and Nature of Beneficial Ownership | Percentage of Outstanding shares | Percentage of Voting Power | |||||||||
| Principal Shareholders | ||||||||||||
Deutsche Post Beteiligungen Holding GmbH(1) | 21,423,600 | 13.1 | % | 13.1 | % | |||||||
Cross Ship S.à r.l.(2) | 11,349,685 | 6.94 | % | 6.94 | % | |||||||
Shopify Inc. and its affiliate (3) | 22,106,160 | 13.52 | % | 13.52 | % | |||||||
Morgan Stanley and its affiliate (4) | 9,499,576 | 5.81 | % | 5.81 | % | |||||||
Abdiel Qualified Master Fund, LP and its affiliates (5) | 15,246,199 | 9.32 | % | 9.32 | % | |||||||
Dragoneer Investment Group, LLC (6) | 12,802,434 | 7.83 | % | 7.83 | % | |||||||
| Directors, Director Nominees and Executive Officers | ||||||||||||
Amir Schlachet (7) | 5,687,185 | 3.48 | % | 3.48 | % | |||||||
Shahar Tamari (8) | 5,686,643 | 3.48 | % | 3.48 | % | |||||||
Nir Debbi (9) | 5,926,493 | 3.63 | % | 3.63 | % | |||||||
Eden Zaharoni (10) | 402,378 | 0.24 | % | 0.24 | % | |||||||
Ofer Koren (11) | 491,250 | 0.3 | % | 0.3 | % | |||||||
Ran Fridman (12) | 22,394 | 0.01 | % | 0.01 | % | |||||||
Thomas Studd (13) | ||||||||||||
Miguel Angel Parra (14) | ||||||||||||
Tzvia Broida (15) | 5,905 | * | * | |||||||||
Anna J. Bakst (16) | 9,915 | * | * | |||||||||
Iris Epple-Righi (17) | 9,915 | * | * | |||||||||
| All executive officers and directors as a group (11 persons) | 18,242,078 | 11.25 | % | 11.25 | % | |||||||
| * | Indicates ownership of less than 1%. |
(1) | This information is based on a Schedule 13G filed with the SEC on May 24, 2022. Represents 21,423,600 ordinary shares held by Deutsche Post Beteiligungen Holding GmbH, a direct wholly owned subsidiary of Deutsche Post AG and which is affiliated with DHL International GmbH. The address for the Deutsche Post Beteiligungen Holding GmbH is Charles-de-Gaulle-Straße 20, 53113 Bonn. Federal Republic of Germany. |
(2) | This information is based on a Schedule 13G/A filed with the SEC on February 10, 2023. Cross Ship S.à r.l., Vitruvian III Luxembourg S.à r.l., VIP III Nominees Limited, and Vitruvian Partners LLP may be deemed to be the beneficial owners of all the reported ordinary shares. VIP III LP may be deemed to be the beneficial owner of 11,179,440 ordinary shares, and VIP III CO-INVEST LP may be deemed to be the beneficial owner of 170,245 ordinary shares. Cross Ship S.à r.l. is wholly owned by Vitruvian Investment II Luxembourg S.à r.l. (“Vitruvian Luxembourg”). VIP III Nominees Limited, an England and Wales limited liability company (“VIP Nominees”) and in its capacity as nominee for and on behalf of VIP III LP, an English limited partnership and VIP III Co-Invest LP, a Jersey limited partnership (collectively, the “Funds”), are the sole legal shareholder of Vitruvian Luxembourg. Vitruvian Partners LLP, an England and Wales limited liability partnership (“Vitruvian Partners”) is the manager of the Funds, and sole shareholder of VIP Nomine LLP. The address of the principal business office of VIP Nominees, VIP III LP and Vitruvian Partners is 105 Wigmore Street, London W1U 1QY; the address of the principal business office of VIP III Co-Invest LP is 12 Castle Street, St Helier, Jersey JE2 3RT; and the address of the principal business office of Cross Ship and Vitruvian Luxembourg is 21, rue Philippe II, L-2340 Luxembourg. |
(3) | This information is based on a Schedule 13G/A filed with the SEC on February 10, 2023 and information made available to the Company by Shopify. Both Shopify Inc. and Shopify International Limited may be deemed to beneficially own all of the reported ordinary shares consisting of: (i) 20,624,445 ordinary shares directly held by it; (ii) 493,905 Ordinary Shares issued upon the exercise of warrants on March 12, 2023, and (iii) warrants exercisable for an additional 987,810 Ordinary Shares that will vest within 60 days of March 24, 2023. Shopify Inc. has undertaken, on behalf of itself and its affiliates, to not cast any votes with respect to Ordinary Shares which provide Shopify Inc. with voting power in excess of 9.7% of the Company’s issued and outstanding equity. The principal business address of Shopify Inc. is 151 O’Connor Street, Ground Floor, Ottawa, Ontario, Canada K2P 2L8.The principal business address of Shopify International Limited is 2nd Floor Victoria Buildings 1-2 Haddington Road, Dublin 4, D04 XN32, Ireland. |
(4) | This information is based on a Schedule 13G filed with the SEC on February 9, 2023. Morgan Stanley has shared voting power over 9,117,612 ordinary shares and shared dipositive power over 9,499,576 ordinary shares, and Morgan Stanley Investment Management Inc., has shared voting power over 9,117,604 ordinary shares and a shared dipositive power over 9,499,568 ordinary shares. The securities being reported by Morgan Stanley as a parent holding company are owned, or may be deemed to be beneficially owned, by Morgan Stanley Investment Management Inc., a wholly-owned subsidiary of Morgan Stanley. The address of Morgan Stanley is 1585 Broadway New York, NY 10036 and the address of Morgan Stanley Investment Management Inc. is 522 5th Avenue 6th Floor New York, NY 10036. |
(5) | This information is based on a Schedule 13G/A filed with the SEC on January 24, 2023. Abdiel Qualified Master Fund, LP may be deemed to be the beneficial owner of 14,768,631 ordinary shares. Abdiel Capital, LP, may be deemed to be the beneficial owner of 477,568 ordinary shares, Abdiel Capital Management, LLC, Abdiel Capital Advisors, LP and Colin T. Moran may be deemed to be the beneficial owners of all reported shares. Abdiel Capital Management, LLC and Abdiel Capital Advisors, LP serve as the general partner and the investment manager, respectively, of Abdiel Qualified Master Fund, LP and Abdiel Capital, LP. Colin T. Moran serves as managing member of Abdiel Capital Management, LLC and Abdiel Capital Partners, LLC, which serves as the general partner of Abdiel Capital Advisors, LP. Each of the reporting persons disclaims beneficial ownership of the shares reported herein except to the extent of its or his pecuniary interest therein. The address for the reporting persons is 90 Park Avenue, 29th Floor, New York, NY 10016. |
| (6) | This information is based on a Schedule 13G filed with the SEC on February 14, 2023. Dragoneer Investment Group, LLC (the “Dragoneer Adviser”) is a registered investment adviser under the Investment Advisers Act of 1940, as amended. As the managing member of Dragoneer Adviser, Cardinal DIG CC, LLC may also be deemed to share voting and dispositive power with respect to the Ordinary Shares. Marc Stad is the sole member of Cardinal DIG CC, LLC. By virtue of these relationships, each of the reporting persons may be deemed to share beneficial ownership of all of the reported ordinary shares. The address for the reporting persons is One Letterman Dr., Bldg D, Ste M500, San Francisco, CA 94129. |
| (7) | Includes 4,136,472 ordinary shares that Mr. Schlachet holds directly, 63,913 restricted share units that will be settled within 60 days of March 24, 2023, and 1,486,800 ordinary shares underlying options that were fully vested as at March 24, 2023. |
| (8) | Includes 4,135,930 ordinary shares that Mr. Tamari holds directly, 63,913 restricted share units that will be settled within 60 days of March 24, 2023, and 1,486,800 ordinary shares underlying options that were fully vested as at March 24, 2023. |
| (9) | Includes 4,375,780 ordinary shares that Mr. Debbi holds directly, 63,913 restricted share units that will be settled within 60 days of March 24, 2023, and 1,486,800 ordinary shares underlying options that were fully vested as at March 24, 2023. |
| (10) | Includes 402,378 ordinary shares underlying options that will be exercisable within 60 days of March 24, 2023. |
| (11) | Includes 491,250 ordinary shares underlying options that will be exercisable within 60 days of March 24, 2023. |
| (12) | Includes 22,394 ordinary shares underlying options that will be exercisable within 60 days of March 24, 2023. |
| (13) | Mr. Studd holds no shares directly. Mr. Studd is a partner at the Vitruvian Group, which manages funds that collectively own ordinary shares. See note 4 above. Mr. Studd disclaims beneficial ownership of the ordinary shares held by Cross Ship S.à r.l., except to the extent of his pecuniary interest, if any, in such ordinary shares by virtue of his interest in the Vitruvian Group and his indirect limited partnership interest in the Vitruvian Group. |
| (14) | Mr. Parra holds no shares directly. Mr. Parra serves as the Chief Executive Officer of DHL Express Americas which is affiliated with Deutsche Post Beteiligungen Holding GmbH. |
| (15) | Includes 5,905 restricted share units that will become exercisable within 60 days of March 24, 2023. |
| (16) | Includes 9,915 restricted share units that will become exercisable within 60 days of March 24, 2023. |
| (17) | Includes 9,915 restricted share units that will become exercisable within 60 days of March 24, 2023. |
| B. | Related Party Transactions |
| Shareholder | Series E Preferred Shares | Total Purchase Price ($) | ||||||
| Cross Ship S.à r.l. | 20,011 | 50,000,485.15 | ||||||
| Deutsche Post Beteiligungen Holdings GmbH | 3,695 | 9,232,511.75 | ||||||
| C. | Interests of Experts and Counsel |
| A. | Consolidated Statements and Other Financial Information |
| B. | Significant Changes |
| A. | Offer and Listing Details |
| B. | Plan of Distribution |
| C. | Markets |
| D. | Selling Shareholders |
| E. | Dilution |
| F. | Expenses of the Issue |
| A. | Share Capital |
| B. | Memorandum and Articles of Association |
| C. | Material Contracts |
| D. | Exchange Controls |
| E. | Taxation |
| • | the expenditures are approved by the relevant Israeli government ministry, determined by the field of research; |
| • | the research and development must be for the promotion of the company; and |
| • | the research and development are carried out by or on behalf of the company seeking such tax deduction. |
| • | Amortization of the cost of purchased know-how and patents and rights to use a patent or know-how that were purchased in good faith and are used for the development or advancement of the Industrial Enterprise, over an eight-year period, commencing on the year in which such rights were first exercised; |
| • | Under limited conditions, an election to file consolidated tax returns with related Israeli Industrial Companies; and |
| • | Expenses related to a public offering are deductible in equal amounts over a three-year period. |
| F. | Dividends and Paying Agents |
| G. | Statement by Experts |
| H. | Documents on Display |
| I. | Subsidiary Information |
| J. | Annual Report to Security Holders |
2021 | 2022 | ||||||||
(in thousands) | |||||||||
| Audit Fees | $ | 1,300 | $ | 760 | |||||
| Audit Related Fees | $ | 510 | $ | 218 | |||||
| Tax Fees | $ | 30 | $ | 97 | |||||
| All Other Fees | - | - | |||||||
| Total | $ | 1,840 | $ | 1,075 | |||||
F-1 | 333-259371 | 4.2 | September 7, 2021 | |||||||||
| * | ||||||||||||
| * | ||||||||||||
| * | ||||||||||||
| ** | ||||||||||||
| ** | ||||||||||||
| * |
| 101.INS | Inline XBRL Instance Document. | ||||||||||
| 101.SCH | Inline XBRL Taxonomy Extension Schema Document. | ||||||||||
| 101.CAL | Inline XBRL Taxonomy Extension Calculation Linkbase Document. | ||||||||||
| 101.DEF | Inline XBRL Taxonomy Definition Linkbase Document. | ||||||||||
| 101.LAB | Inline XBRL Taxonomy Extension Label Linkbase Document. | ||||||||||
| 101.PRE | Inline XBRL Taxonomy Extension Presentation Linkbase Document | ||||||||||
| 104 | Inline XBRL for the cover page of this Annual Report on Form 20-F, included in the Exhibit 101 Inline XBRL Document Set. |
* | Filed herewith. |
** | Furnished herewith. |
† | Portions of this exhibit have been redacted pursuant to Item 4 of the “Instructions As To Exhibits” of Form 20-F because the Company customarily and actually treats the redacted information as private or confidential and the omitted information is not material. The Company hereby agrees to furnish an unredacted copy of the exhibit to the Commission upon request. |
# | Indicates management contract or compensatory plan or arrangement. |
GLOBAL-E ONLINE LTD. | ||
Date: March 31, 2023 | By: | /s/ Amir Schlachet |
| Name: | Amir Schlachet | |
| Title: | Chief Executive Officer | |
Page | |
Report of Independent Registered Public Accounting Firm (PCAOB ID: 1281) | F-2 |
F-6 | |
F-7 | |
F-8 | |
F-9 | |
F-10 | |
F-11 |

Revenue Recognition | ||
Description of the Matter | As described in Note 2 to the consolidated financial statements, the Company derives its revenue from providing merchants a cross-border e-commerce platform which enables to sell their products to consumers worldwide. Revenue is generated as a percentage of the value of transactions that flow through the Company’s platform and from shipping, handling, and other global delivery services in order to deliver merchants’ goods to consumers. The Company’s revenue recognition process involves several applications responsible for the initiation, processing, recording of transactions, and the calculation of revenue in accordance with the Company’s accounting policy. The processing and recognition of revenue are highly automated and involve capturing and processing significant volumes of data. Auditing the Company's accounting for revenue from contracts with customers was challenging and complex due to the high volume of individually-low-monetary-value transactions and the dependency on the effective design and operation of multiple applications, some of which are custom-made for the Company’s business, and data sources associated with the revenue recognition process. | |
How We Addressed the Matter in Our Audit | We obtained an understanding, evaluated the design, and tested the operating effectiveness of internal controls over the Company’s accounting for revenue from contracts with customers. With the support of our information technology professionals, we identified and tested the relevant systems and tools used for the determination of initiation, processing and recording of revenue, which included processes and controls related to access to the relevant systems and data, changes to the relevant systems and interfaces, and configuration of the relevant systems. For example, with the assistance of IT professionals, we tested the controls over the Company’s cash to billings reconciliation process. Our audit procedures included, among others, substantive audit procedures that included testing the completeness and accuracy of the underlying data within the Company’s billing system, performing data analytics by extracting data from the system to evaluate the completeness and accuracy of recorded revenue, tracing a sample of sales transactions to third-party documentation, and testing a sample of cash to billings reconciliations. We have also evaluated the Company’s disclosures included in Note 2 to the consolidated financial statements. |
Business combinations – accounting for acquisitions | ||
Description of the Matter | As described in Note 6 to the consolidated financial statements, as of December 31, 2022, the Company completed the acquisitions of Flow Commerce Inc and Borderfree Inc for total consideration of $387 million and $102 million, respectively. The Company accounted for these acquisitions as business combinations. The Company’s accounting for the acquisitions included determining the fair value of identified assets acquired, which primarily consisted of developed technology in the amount of $67 million, Customer relationships in the amount of $28 million, and marketing intangible assets in the amount of $31 million (collectively the “Intangible Assets”). Auditing the fair values of the Intangible Assets was complex due to the significant estimations required by management. The complexity was primarily due to the sensitivity of the fair value to certain of the significant underlying assumptions. The significant assumptions used by management to estimate the fair value of the Intangible Assets included, forecasted revenue and revenues growth rates, discount rates, and customer contract renewal rates and customer attrition rates. These significant assumptions were forward-looking and could be affected by future economic and market conditions. | |
How We Addressed the Matter in Our Audit | We obtained an understanding, evaluated the design and tested the operating effectiveness of the Company’s controls over its accounting for business combinations. This included testing controls over the estimation process supporting the recognition and measurement of identified intangible assets, and management’s judgment and evaluation underlying assumptions and estimates with regards to the fair values of intangible assets. To test the estimated fair value of the intangible assets, our audit procedures included, among others, reading the purchase agreements and assessed for the completeness of identified intangible assets, testing prospective financial information, evaluating the significant assumptions used by management and testing the completeness and accuracy of the underlying data. For example, we compared the significant assumptions to current industry, market and economic trends. We tested the completeness and accuracy of the underlying data supporting the significant assumptions and estimates. As part of the assessment, we performed sensitivity analyses over the significant assumptions used in the models. We involved our valuation specialists to assist with our evaluation of the methodology used by the Company and testing of the significant assumptions. For example, our valuation professionals performed independent comparative calculations to estimate the acquired entity discount rate. We have also evaluated the Company’s disclosures regarding the business combinations included in Note 6 to the consolidated financial statements. |
As of December 31, | ||||||||
2021 | 2022 | |||||||
Assets | ||||||||
Current assets: | ||||||||
Cash and cash equivalents | 448,623 | 165,033 | ||||||
Short-term deposits | 41,985 | 46,353 | ||||||
Accounts receivable (net of allowance for credit losses of $724 as of December 31, 2022) | 9,185 | 16,424 | ||||||
Prepaid expenses and other current assets | 46,568 | 51,904 | ||||||
Marketable securities | 18,464 | 16,813 | ||||||
Funds receivable, including cash in banks | 57,635 | 78,125 | ||||||
Total current assets | 622,460 | 374,652 | ||||||
Property and equipment, net | 3,269 | 10,283 | ||||||
Operating lease right-of-use assets | 20,108 | 19,718 | ||||||
Long term deposits | 2,219 | 3,225 | ||||||
Deferred contract acquisition costs, noncurrent | 1,314 | 1,825 | ||||||
Deferred tax assets | - | 171 | ||||||
Other assets, noncurrent | 213 | 3,739 | ||||||
Commercial agreement asset | 196,544 | 282,963 | ||||||
Goodwill and other intangible assets | - | 466,024 | ||||||
Total long-term assets | 223,667 | 787,948 | ||||||
Total assets | 846,127 | 1,162,600 | ||||||
Liabilities, Convertible Preferred Shares and Shareholders’ Equity (Deficit) | ||||||||
Current liabilities: | ||||||||
Accounts payable (including related party payables of $18,158 and $30,809 as of December 31, 2021 and 2022, respectively) | 24,064 | 52,220 | ||||||
Accrued expenses and other current liabilities (including related party payables of $3,357 and $ 5,719 as of December 31, 2021 and 2022, respectively) | 47,358 | 75,990 | ||||||
Funds payable to Customers | 57,635 | 78,125 | ||||||
Short term operating lease liabilities | 2,517 | 3,245 | ||||||
Total current liabilities | 131,574 | 209,580 | ||||||
Long-term liabilities: | ||||||||
Deferred tax liabilities, net | - | 6,558 | ||||||
Long term operating lease liabilities | 18,803 | 16,579 | ||||||
Other long-term liabilities | - | 1,762 | ||||||
Total liabilities | 150,377 | 234,479 | ||||||
Commitments and contingencies (Note 9) | ||||||||
Shareholders’ equity: | ||||||||
Ordinary shares, with no par value, 300,000,000 and 300,000,000 shares authorized as of December 31, 2021 and 2022, respectively; 150,456,501 and 161,316,543, shares issued and outstanding as of December 31, 2021 and 2022, respectively; | - | - | ||||||
Additional paid-in capital | 823,550 | 1,253,093 | ||||||
Accumulated comprehensive income (loss) | (159 | ) | (1,926 | ) | ||||
Accumulated deficit | (127,641 | ) | (323,046 | ) | ||||
Total shareholders’ equity | 695,750 | 928,121 | ||||||
Total liabilities, convertible preferred shares and shareholders’ equity | 846,127 | 1,162,600 | ||||||
Year Ended December 31, | ||||||||||||
2020 | 2021 | 2022 | ||||||||||
Revenue | 136,375 | 245,274 | 409,049 | |||||||||
Cost of revenue (including related party costs of $53,861, $90,315 and $129,629 for the years ended December 31, 2020, 2021 and 2022, respectively) | 92,902 | 153,841 | 250,871 | |||||||||
Gross profit | 43,473 | 91,433 | 158,178 | |||||||||
Operating expenses: | ||||||||||||
Research and development | 15,400 | 29,761 | 81,206 | |||||||||
Sales and marketing | 9,838 | 104,687 | 206,100 | |||||||||
General and administrative | 9,822 | 22,643 | 60,196 | |||||||||
Total operating expenses | 35,060 | 157,091 | 347,502 | |||||||||
Operating profit (loss) | 8,413 | (65,658 | ) | (189,324 | ) | |||||||
Financial expenses, net | 4,339 | 8,570 | 12,093 | |||||||||
Profit (loss) before income taxes | 4,074 | (74,228 | ) | (201,417 | ) | |||||||
Provision for income taxes (benefits) | 160 | 705 | (6,012 | ) | ||||||||
Net profit (loss) | 3,914 | (74,933 | ) | (195,405 | ) | |||||||
Undistributed earnings attributable to participating securities | 3,189 | - | - | |||||||||
Net earnings (loss) attributable to ordinary shareholders | 725 | (74,933 | ) | (195,405 | ) | |||||||
Net earnings (loss) per share attributable to ordinary shareholders, basic | $ | 0.03 | (0.74 | ) | (1.24 | ) | ||||||
Net earnings (loss) per share attributable to ordinary shareholders, diluted | $ | 0.03 | (0.74 | ) | (1.24 | ) | ||||||
Weighted-average shares used in computing net earnings (losses) per share attributable to ordinary shareholders, basic | 21,120,208 | 101,737,026 | 157,691,173 | |||||||||
Weighted-average shares used in computing net earnings (losses)per share attributable to ordinary shareholders, diluted | 28,637,801 | 101,737,026 | 157,691,173 | |||||||||
The accompanying notes are an integral part of these consolidated financial statements. |
Year Ended December 31, | ||||||||||||
2020 | 2021 | 2022 | ||||||||||
Net profit (loss) | $ | 3,914 | (74,933 | ) | (195,405 | ) | ||||||
Other comprehensive income: | ||||||||||||
Unrealized gain (loss) on available-for-sale marketable securities, net | 111 | (270 | ) | (1,767 | ) | |||||||
Other comprehensive income (loss) | 111 | (270 | ) | (1,767 | ) | |||||||
Comprehensive income (loss) | 4,025 | (75,203 | ) | (197,172 | ) | |||||||
Convertible Preferred Shares | Ordinary Shares | Additional Paid-in Capital | Accumulated Other Comprehensive Income | Accumulated Deficit | Total Shareholders’ Equity (Deficit) | |||||||||||||||||||||||||||
Shares | Amount | Shares | Amount | |||||||||||||||||||||||||||||
Balance as of December 31, 2019 | 138,395 | 53,732 | 19,720,800 | - | 3,592 | - | (56,622 | ) | (53,030 | ) | ||||||||||||||||||||||
Issuance of Series E convertible preferred shares, net of issuance costs of $473 | 23,706 | 58,821 | ||||||||||||||||||||||||||||||
Issuance of ordinary shares upon exercise of share options | 2,040,600 | - | 539 | 539 | ||||||||||||||||||||||||||||
Unrealized gain on available-for-sale marketable securities, net | 111 | 111 | ||||||||||||||||||||||||||||||
Share-based compensation expense | 3,956 | 3,956 | ||||||||||||||||||||||||||||||
Net Profit | 3,914 | 3,914 | ||||||||||||||||||||||||||||||
Balance as of December 31, 2020 | 162,101 | 112,553 | 21,761,400 | - | 8,087 | 111 | (52,708 | ) | (44,510 | ) | ||||||||||||||||||||||
Conversion of preferred shares to ordinary shares | (162,101 | ) | (112,553 | ) | 97,260,600 | 112,553 | 112,553 | |||||||||||||||||||||||||
Issuance of warrants to ordinary shares | 280,842 | 280,842 | ||||||||||||||||||||||||||||||
Exercise of options and vested RSUs granted to employees | 2,018,942 | - | 1,584 | 1,584 | ||||||||||||||||||||||||||||
Other comprehensive loss | (270 | ) | (270 | ) | ||||||||||||||||||||||||||||
Share-based compensation expense | 12,001 | 12,001 | ||||||||||||||||||||||||||||||
Issuance of Ordinary shares in IPO, net | 17,250,000 | 396,344 | 396,344 | |||||||||||||||||||||||||||||
Exercise of Warrants to ordinary shares | 12,165,559 | 12,139 | 12,139 | |||||||||||||||||||||||||||||
Net Loss | (74,933 | ) | (74,933 | ) | ||||||||||||||||||||||||||||
Balance as of December 31, 2021 | - | - | 150,456,501 | - | 823,550 | (159 | ) | (127,641 | ) | 695,750 | ||||||||||||||||||||||
Issuance of warrants to ordinary shares | 235,466 | 235,466 | ||||||||||||||||||||||||||||||
Exercise of options and vested RSUs granted to employees | 1,314,057 | - | 1,166 | 1,166 | ||||||||||||||||||||||||||||
Other comprehensive loss | (1,767 | ) | (1,767 | ) | ||||||||||||||||||||||||||||
Share-based compensation expense | 38,909 | 38,909 | ||||||||||||||||||||||||||||||
Exercise of Warrants to ordinary shares | 7,215,924 | 73 | 73 | |||||||||||||||||||||||||||||
Issuance of ordinary shares in connection with the business combination | 2,330,061 | 153,929 | 153,929 | |||||||||||||||||||||||||||||
Net Loss | (195,405 | ) | (195,405 | ) | ||||||||||||||||||||||||||||
Balance as of December 31, 2022 | - | - | 161,316,543 | - | 1,253,093 | (1,926 | ) | (323,046 | ) | 928,121 | ||||||||||||||||||||||
Global-E Online LTD. |
CONSOLIDATED STATEMENTS OF CASH FLOWS |
(in thousands) |
Year Ended December 31, | ||||||||||||
2020 | 2021 | 2022 | ||||||||||
Cash flows from operating activities: | ||||||||||||
Net profit (loss) | $ | 3,914 | $ | (74,933 | ) | $ | (195,405 | ) | ||||
Adjustments to reconcile net profit (loss) to net cash provided by operating activities: | ||||||||||||
Depreciation and amortization | 235 | 331 | 1,585 | |||||||||
Share-based compensation expense | 3,956 | 12,001 | 38,909 | |||||||||
Commercial agreement asset amortization | - | 84,298 | 149,047 | |||||||||
Intangible assets amortization | - | - | 27,833 | |||||||||
Changes in accrued interest and exchange rate on short-term deposits | - | - | (291 | ) | ||||||||
Changes in accrued interest and exchange rate on long-term deposits | - | 24 | (931 | ) | ||||||||
Losses from marketable securities | - | 140 | 73 | |||||||||
Warrants liabilities to preferred shares | 5,523 | 5,872 | - | |||||||||
Changes in operating assets and liabilities: | ||||||||||||
Decrease (increase) in accounts receivable . | (1,652 | ) | (5,591 | ) | 2,662 | |||||||
Increase in prepaid expenses and other assets | (12,273 | ) | (23,239 | ) | (2,685 | ) | ||||||
Decrease (increase) in funds receivable | (11,829 | ) | (29,272 | ) | 17,097 | |||||||
Increase in long-term receivables | (150 | ) | - | (1,279 | ) | |||||||
Increase in funds payable to customers | 12,884 | 23,143 | 17,736 | |||||||||
Decrease (increase) in operating lease ROU assets | (2,761 | ) | 1,382 | 3,253 | ||||||||
Increase in deferred contract acquisition costs | (429 | ) | (814 | ) | (761 | ) | ||||||
Increase in accounts payable | 10,018 | 5,007 | 16,648 | |||||||||
Increase in accrued expenses and other liabilities | 18,874 | 17,926 | 20,531 | |||||||||
Increase (decrease) in deferred tax liabilities | 52 | (90 | ) | (8,178 | ) | |||||||
Increase (decrease) operating lease liabilities | 2,988 | (437 | ) | (4,359 | ) | |||||||
Net cash provided by operating activities | 29,350 | 15,748 | 81,485 | |||||||||
Cash flows from investing activities: | ||||||||||||
Acquisition of a business, net of cash acquired (see note 6) | - | - | (317,483 | ) | ||||||||
Investment in marketable securities | (16,759 | ) | (2,806 | ) | (8,298 | ) | ||||||
Proceeds from marketable securities | - | 748 | 8,110 | |||||||||
Purchases of short-term investments | (6,375 | ) | (117,185 | ) | (78,478 | ) | ||||||
Proceeds from short-term investments | - | 81,657 | 74,400 | |||||||||
Purchases of long-term investments | (456 | ) | (20 | ) | - | |||||||
Purchases of property and equipment | (456 | ) | (2,883 | ) | (8,352 | ) | ||||||
Net cash used in investing activities | (24,046 | ) | (40,489 | ) | (330,101 | ) | ||||||
Cash flows from financing activities: | ||||||||||||
Proceeds from exercise of share options | 539 | 1,584 | 1,166 | |||||||||
Issuance of convertible preferred shares, net of issuance costs | 58,821 | - | - | |||||||||
Proceeds from issuance of Ordinary shares in IPO, net of issuance costs | 396,494 | - | ||||||||||
Proceeds from exercise of warrants to ordinary shares | 529 | 73 | ||||||||||
Net cash provided by financing activities | 59,360 | 398,607 | 1,239 | |||||||||
Net increase (decrease) in cash, cash equivalents, and restricted cash | 64,664 | 373,866 | (247,377 | ) | ||||||||
Cash and cash equivalents and restricted cash-beginning of period | 20,369 | 85,033 | 458,899 | |||||||||
Cash and cash equivalents and restricted cash-end of period | $ | 85,033 | $ | 458,899 | $ | 211,522 | ||||||
Supplemental disclosures of cash flow information: | ||||||||||||
Cash paid for income taxes | $ | 68 | $ | 5 | $ | 249 | ||||||
Supplemental disclosures of noncash investing and financing activities: | ||||||||||||
Purchases of property and equipment during the period included in accounts payable | $ | 13 | $ | 1 | $ | - | ||||||
ROU assets and lease liabilities created during the period | $ | 3,734 | $ | 17,329 | $ | 2,862 | ||||||
Conversion of warrants liability to ordinary shares | $ | $ | 11,610 | $ | - | |||||||
Recognition of Commercial agreement asset | $ | - | $ | 280,842 | $ | 235,467 | ||||||
| 1. | Organization and Description of Business |
| 2. | Summary of Significant Accounting Policies |
December 31, | ||||||||||||
2020 | 2021 | 2022 | ||||||||||
Cash and cash equivalents | $ | 68,637 | $ | 448,623 | $ | 165,033 | ||||||
Cash and cash equivalents included in funds receivable | $ | 16,193 | $ | 10,063 | $ | 46,302 | ||||||
Restricted cash included in other assets | $ | 203 | $ | 213 | $ | 187 | ||||||
Total cash, cash equivalents, and restricted cash | $ | 85,033 | $ | 458,899 | $ | 211,522 | ||||||
Year ended December 31, | ||||||||
2021 | 2022 | |||||||
Unrealized gain on marketable securities | Unrealized gain (loss) on marketable securities | |||||||
Beginning balance | $ | 111 | $ | (159 | ) | |||
Net current period other comprehensive income (loss) | (410 | ) | (1,840 | ) | ||||
reclassification adjustments for losses included in net income | 140 | 73 | ||||||
Total accumulated other comprehensive income (loss) | $ | (159 | ) | $ | (1,926 | ) | ||
Computer and software | 3 years |
Furniture and office equipment | 3 – 7 years |
Leasehold improvements | Shorter of remaining lease term or estimated useful life |
Years | |||
Technology | 2-7 | ||
Partnership Agreement | 6 | ||
Customer Relationships | 1-5 | ||
Trademark | 2 | ||
Marketing Asset | 5 | ||
GTS Duty Calculator | 9 |
| 1. | Service Fees –The Company provides merchants a cross-border e-commerce platform which enables to sell their products to consumers worldwide. Revenue is generated as a percentage of the value of transactions that flow through the Company’s platform. |
| 2. | Fulfillment services – The Company offers shipping, handling, and other global delivery services in order to deliver merchants’ goods to consumers. |
| 1. | Identification of the contract, or contracts, with the customer |
| 2. | Identification of the performance obligations in the contract |
| 3. | Determination of the transaction price |
| 4. | Allocation of the transaction price to the performance obligations in the contract |
| 5. | Recognition of the revenue when, or as, a performance obligation is satisfied |
| a. | Service Fees -the revenues are recognized once the transaction is considered completed, when the payment is processed by the Company, and the merchant goods arrive at the Company’s hub. The Company determined it acts as an agent since it does not have control over the goods provided to the shopper, based on the agreement with the merchant. The Company is not primarily responsible for the acceptability of the goods (for example – the quality of the goods provided to the consumer). Furthermore, the Company has no discretion in determining the prices paid by the consumer for the goods. The Company earns a fee based on a fixed percentage of the total amount of the goods. Therefore, revenues derived from the service fees are presented on a net basis. |
| b. | Fulfillment services - the service is recognized over the shipment time starting upon the dispatch to the carrier until it reaches the consumer. The Company determined it acts as a principal since it is the primary obligor to fulfill its promise to its customers, controls the services (i.e. the Company directs other parties to provide services on its behalf), has discretion in determining the carrier it uses to provide the service and bears the risk of loss if the actual cost of the fulfillment service will exceed the fee. Therefore, revenues derived from the fulfillment services are presented on a gross basis. |
Year Ended December 31, | ||||||||||||||||||||||||
2020 | 2021 | 2022 | ||||||||||||||||||||||
Amount | Percentage of Revenue | Amount | Percentage of Revenue | Amount | Percentage of Revenue | |||||||||||||||||||
(in thousands, except percentages) | ||||||||||||||||||||||||
Service fees | 49,927 | 37 | % | 96,659 | 39 | % | 181,887 | 44 | % | |||||||||||||||
Fulfillment services | 86,448 | 63 | % | 148,615 | 61 | % | 227,162 | 56 | % | |||||||||||||||
Total revenue | $ | 136,375 | 100 | % | $ | 245,274 | 100 | % | $ | 409,049 | 100 | % | ||||||||||||
Year Ended December 31, | ||||||||||||||||||||||||
2020 | 2021 | 2022 | ||||||||||||||||||||||
Amount | Percentage of Revenue | Amount | Percentage of Revenue | Amount | Percentage of Revenue | |||||||||||||||||||
(in thousands, except percentages) | ||||||||||||||||||||||||
United Kingdom | 80,122 | 59 | % | 113,835 | 47 | % | 146,562 | 36 | % | |||||||||||||||
United States | 34,140 | 25 | % | 71,095 | 29 | % | 173,967 | 43 | % | |||||||||||||||
European Union | 21,269 | 15 | % | 58,177 | 23 | % | 78,491 | 19 | % | |||||||||||||||
Israel | 844 | 1 | % | 1,052 | * | ) | 1,357 | * | ) | |||||||||||||||
Other | - | - | 1,115 | * | ) | 8,672 | 2 | % | ||||||||||||||||
Total revenue | $ | 136,375 | 100 | % | $ | 245,274 | 100 | % | $ | 409,049 | 100 | % | ||||||||||||
Year Ended December 31, | ||||||||||||
2020 | 2021 | 2022 | ||||||||||
(in thousands) | ||||||||||||
Beginning balance | $ | 563 | $ | 987 | $ | 1,801 | ||||||
Additions to deferred contract acquisition costs | 618 | 1,188 | 1,378 | |||||||||
Amortization of deferred contract acquisition costs | (194 | ) | (374 | ) | (617 | ) | ||||||
Ending balance | $ | 987 | $ | 1,801 | $ | 2,562 | ||||||
Deferred contract acquisition costs (to be recognized in next 12 months included in other current assets) | $ | 264 | $ | 487 | $ | 737 | ||||||
Deferred contract acquisition costs, noncurrent | 723 | 1,314 | 1,825 | |||||||||
Total deferred contract acquisition costs | $ | 987 | $ | 1,801 | $ | 2,562 | ||||||
December 31, | ||||||||||||
2020 | 2021 | 2022 | ||||||||||
(in thousands) | ||||||||||||
Israel | $ | 1,685 | $ | 18,383 | $ | 22,823 | ||||||
United Kingdom | 3,093 | 2,642 | 3,279 | |||||||||
United States | 74 | 2,326 | 3,828 | |||||||||
Rest of world | 25 | 26 | 71 | |||||||||
Total property and equipment, net | $ | 4,877 | $ | 23,377 | $ | 30,001 | ||||||
Year Ended December 31, | ||||||||||||
2020 | 2021 | 2022 | ||||||||||
(in thousands) | ||||||||||||
Beginning of the year | $ | 215 | $ | 5,738 | $ | - | ||||||
Change in fair value | 5,523 | 5,872 | - | |||||||||
Conversion to shares | - | (11,610 | ) | - | ||||||||
End of year | 5,738 | $ | - | - | ||||||||
| 3. | Prepaid expenses and other current assets |
December 31, | ||||||||
2021 | 2022 | |||||||
(in thousands) | ||||||||
Indirect tax receivables and related prepaid expenses | $ | 39,030 | $ | 43,293 | ||||
Prepaid expenses | 6,271 | 7,847 | ||||||
Other | 1,267 | 764 | ||||||
Prepaid expenses and other current assets | 46,568 | 51,904 | ||||||
| 4. | Property and Equipment, Net |
December 31, | ||||||||
2021 | 2022 | |||||||
(in thousands) | ||||||||
Computer and software | $ | 1,603 | $ | 2,637 | ||||
Furniture and office equipment | 429 | 1,382 | ||||||
Leasehold improvements | 2,271 | 8,883 | ||||||
Property and equipment, gross | 4,303 | 12,902 | ||||||
Less: accumulated depreciation and amortization | (1,034 | ) | (2,619 | ) | ||||
Property and equipment, net | $ | 3,269 | $ | 10,283 | ||||
| 5. | Goodwill and intangible assets, net |
Carrying | ||||
Amount | ||||
Balance as of December 31, 2021 | - | |||
Addition from acquisitions | 367,566 | |||
Balance as of December 31, 2022 | 367,566 | |||
December 31, 2022 | ||||
Cost: | ||||
Technology | $ | 63,677 | ||
Customer relations | 27,856 | |||
Partnership Agreement | 11,366 | |||
Marketing Asset | 19,263 | |||
Trademark | 731 | |||
GTS Duty Calculator | 3,398 | |||
126,291 | ||||
Less - accumulated amortization | 27,833 | |||
Intangible assets, net | $ | 98,458 | ||
Estimated amortization expense for the years ended:
2023 | $ | 20,434 | ||
2024 | 18,812 | |||
2025 | 17,607 | |||
2026 | 17,607 | |||
Thereafter | 23,998 | |||
$ | 98,458 |
Year ended December 31, | ||||
2022 | ||||
Cost of revenues | $ | 9,743 | ||
Selling and marketing | 18,090 | |||
$ | 27,833 | |||
6. BUSINESS COMBINATIONS
| A. | On January 3, 2022, the Company consummated the Flow Acquisition, a private Company. Flow’s technology is a software solution for emerging brands to accelerate and optimize their global expansion and drive cross-border sales in over 200 countries worldwide. The solution allows merchants to use the tools and services they need — whether it is localization, experience optimization, currency exchange, and payments, or Flow’s global infrastructure for shipping and tax and duty compliance. Flow was founded in 2015 and is based in Hoboken, NJ with a globally distributed workforce. | |
| In accordance with the acquisition method of accounting, the total purchase price for the Flow Acquisition was $387,003, subject to working capital adjustments, comprised of $233,074 in cash and $153,929 in shares, based on the fair value in shares of the Company’s ordinary shares at the closing date. | ||
| In addition to the purchase consideration and pursuant to holdback agreements with certain Flow employees, the Company is committed to pay an amount of $24,323 and to issuing 439,200 of the Company’s ordinary shares, to be released over the period of two years after the acquisition date, subject to their continued service and expensed over the applicable service periods. In addition, the Company issued approximately $13,590 in RSUs to Flow employees in accordance with the terms of the Company’s equity incentive plan, which is expected to vest and be expensed over up to four years. | ||
Under the purchase price allocation, the Company allocates the purchase price to tangible and identified intangible assets acquired and liabilities assumed based on the preliminary estimates of their fair values, which were determined using generally accepted valuation techniques based on estimates and assumptions made by management at the time of the acquisition. | ||
| Goodwill represents the purchase price paid in excess of the fair value of net tangible and intangible assets acquired, and is attributable primarily to expected synergies, economies of scale and the assembled workforce of Flow. Goodwill is not deductible for income tax purposes. | ||
The following table summarizes the fair value of assets acquired and liabilities assumed as of the acquisition date: |
Cash and Cash Equivalents | $ | 10,334 | ||
Funds Receivable | 2,755 | |||
Accounts Receivables | 4,880 | |||
Prepaid Expenses and Other Accounts Receivable | 1,153 | |||
Property and Equipment, net | 171 | |||
Long Term Lease Deposits | 75 | |||
Intangible assets | 83,459 | |||
Goodwill | 300,876 | |||
Total assets acquired | 403,703 | |||
Liabilities | ||||
Deferred tax liabilities, net | 5,560 | |||
Accounts Payable | 3,762 | |||
Accrued Expenses and Other Current Liabilities | 4,623 | |||
Funds Payable to Customers | 2,755 | |||
Total liabilities assumed | 16,700 | |||
Total purchase consideration | $ | 387,003 |
The following table summarizes the estimate of the intangible assets and their estimated useful lives as of the acquisition date:
Fair | Useful life | |||||||
Value | (In years) | |||||||
Technology (1) | $ | 58,892 | 7 | |||||
Partnership Agreement (1) | 11,366 | 6 | ||||||
Customer Relationships (1) | 12,470 | 1 | ||||||
Trademark (1) | 731 | 2 | ||||||
Total Intangible assets acquired | $ | 83,459 | ||||||
(1) Technology, Partnership Agreement, Customer relationships and Trademark's fair values were determined using the income approach.
The results of operations of Flow have been included in the consolidated financial statements since the acquisition date of January 3, 2022. Flow's revenue included in the Company’s consolidated statement of operations from January 3, 2022 through December 31, 2022 was $21,151. There is no practical way to determine net income attributable to Flow due to integration.
| B. | On July 1, 2022, the Company consummated the Borderfree Acquisition. Borderfree's technology is a software solution for emerging brands to accelerate and optimize their global expansion and drive cross-border sales in over 200 countries worldwide. The solution allows merchants to use the tools and services they need — whether it is localization, experience optimization, currency exchange, and payments, or Borderfree’s global infrastructure for shipping and tax and duty compliance. |
In accordance with the acquisition method of accounting, the total purchase price for the Borderfree Acquisition was $101,880, subject to working capital adjustments, comprised only of cash.
Under the preliminary purchase price allocation, the Company allocates the purchase price to tangible and identified intangible assets acquired and liabilities assumed based on the preliminary estimates of their fair values, which were determined using generally accepted valuation techniques based on estimates and assumptions made by management at the time of the acquisition. Such estimates are subject to change during the measurement period which is not expected to exceed one year. Any adjustments to the preliminary purchase price allocation identified during the measurement period will be recognized in the period in which the adjustments are determined.
Goodwill represents the purchase price paid in excess of the fair value of net tangible and intangible assets acquired, and is attributable primarily to expected synergies, economies of scale and the assembled workforce of Borderfree. Goodwill is not deductible for income tax purposes.
Acquisition-related transaction costs are not included as components of consideration transferred but are accounted for as expenses in the period in which the costs are incurred. The Company incurred transaction costs $8,492 during the year ended December 31, 2022 which were included in general and administrative expenses in the consolidated statements of income (loss).
The following table summarizes the preliminary fair value of assets acquired and liabilities assumed as of the acquisition date:
Cash and Equivalents | $ | 5732 | ||
Accounts Receivable | 5,021 | |||
Other receivables | 971 | |||
Inventory | 90 | |||
Long term receivables | 2,460 | |||
Deferred tax asset | 389 | |||
Fixed assets, net | 76 | |||
Intangible assets | 42,832 | |||
Goodwill | 66,690 | |||
Total assets acquired | 124,261 | |||
Liabilities | ||||
Deferred tax liabilities, net | 9,394 | |||
Accounts payable | 7,746 | |||
Other accounts payable | 5,241 | |||
Total liabilities assumed | 22,381 | |||
Total purchase consideration | $ | 101,880 |
The following table summarizes the preliminary estimate of the intangible assets and their estimated useful lives as of the acquisition date:
Fair | Useful life | |||||||
| Value | (In years) | |||||||
Marketing Asset (1) | $ | 19,263 | 5 | |||||
Customer Relationships (1) | 15,386 | 5 | ||||||
Technology (1) | 4,785 | 2 | ||||||
GTS Duty Calculator (1) | 3,398 | 9 | ||||||
Total Intangible assets acquired | $ | 42,832 | ||||||
(1)- The fair value of the assets above were determined using the income approach.
The results of operations of Bordrefree have been included in the consolidated financial statements since the acquisition date of July 1, 2022. Borderfree's revenue included in the Company’s consolidated statement of operations from July 1, 2022 through December 31, 2022 was $22,034. There is no practical way to determine net income attributable to Borderfree due to integration.
Year Ended | ||||||||
December 31, | ||||||||
(Unaudited) | ||||||||
2021 | 2022 | |||||||
Revenues | $ | 332,573 | $ | 431,599 | ||||
Net income (loss) | $ | (124,812 | ) | $ | (201,882 | ) | ||
| 7. | Commercial Agreement Assets |
| 8. | Accrued Expenses and Other Current Liabilities |
December 31, | ||||||||
2021 | 2022 | |||||||
(in thousands) | ||||||||
Accrued Expenses | $ | 11,668 | $ | 16,185 | ||||
Accrued indirect taxes and related liabilities | 15,798 | 26,347 | ||||||
Accrued compensation and benefits | 9,797 | 19,918 | ||||||
Advancements from customers | 7,426 | 9,163 | ||||||
Other current liabilities | 2,669 | 4,377 | ||||||
Accrued expenses and other current liabilities | 47,358 | 75,990 | ||||||
| 9. | Convertible Preferred shares, shareholders’ Equity (Deficit) and Equity incentive Plan |
| a. | General: |
| b. | Share options plans: |
Options Outstanding | ||||||||||||||||
Outstanding Share Options | Weighted-Average Exercise Price | Weighted-Average Remaining Contractual Life (Years) | Aggregate Intrinsic Value | |||||||||||||
(in thousands, except share, life and per share data) | ||||||||||||||||
Balance as of December 31, 2021 | 10,132,154 | $ | 2.26 | 7.13 | $ | 619,339.90 | ||||||||||
Granted | - | |||||||||||||||
Exercised | (976,601 | ) | $ | 1.19 | $ | 18,991 | ||||||||||
Forfeited | (101,260 | ) | $ | 2.34 | ||||||||||||
Balance as of December 31, 2022 | 9,054,293 | $ | 2.38 | 6.20 | $ | 165,347 | ||||||||||
Exercisable as of December 31, 2022 | 7,899,747 | $ | 2.30 | 6.01 | $ | 144,877 | ||||||||||
The weighted-average grant date fair value of options granted during the years ended December 31, 2020 was $3.05. During the year ended December 31,2021 and 2022 no options were granted. As of December 31, 2022, unrecognized share-based compensation cost related to unvested share options was $4,739, which is expected to be recognized over a weighted-average period of 1.41 years.
Year Ended December 31, | |||
2020 | |||
Expected term (years) | 6.11 | ||
Expected volatility | 70.0% | ||
Risk-free interest rate | 0.37% - 1.45% | ||
Expected dividend yield | 0.0 |
| • | Fair Value of Ordinary Shares. Prior to IPO, the fair value was determined by our board of directors, with input from management and valuation reports prepared by third-party valuation specialists. Post IPO, the fair value of each ordinary share was based on the closing price of our publicly traded Ordinary Shares as reported on the date of the grant. |
| • | Risk-Free Interest Rate. The risk-free rate for the expected term of the options is based on the Black-Scholes option-pricing model on the yields of U.S. Treasury securities with maturities appropriate for the expected term of employee share option awards. |
| • | Expected Term. The expected term represents the period that options are expected to be outstanding. For option grants that are considered to be “plain vanilla,” the Company determines the expected term using the simplified method. The simplified method deems the term to be the average of the time-to-vesting and the contractual life of the options. |
| • | Expected Volatility. Since the Company has no trading history of its Ordinary Shares, the expected volatility is derived from the average historical share volatilities of several unrelated public companies within the Company’s industry that the Company considers to be comparable to its own business over a period equivalent to the option’s expected term. |
| • | Expected Dividend Yield. The Company has never declared or paid any cash dividends and does not presently plan to pay cash dividends in the foreseeable future. As a result, an expected dividend yield of zero percent was used. |
Amount of RSU’s | Weighted average grant date fair value | |||||||
Unvested as of December 31, 2021 | 443,018 | $ | 63.49 | |||||
Granted | 1,449,829 | 36.33 | ||||||
Vested | (337,456 | ) | 64.91 | |||||
Forfeited | (206,709 | ) | 50.80 | |||||
Unvested as of December 31, 2022 | 1,348,682 | $ | 36.18 | |||||
Year Ended December 31, | ||||||||||||
2020 | 2021 | 2022 | ||||||||||
(in thousands) | ||||||||||||
Cost of revenue | $ | 10 | $ | 85 | $ | 262 | ||||||
Research and development | 507 | 4,192 | 21,970 | |||||||||
Sales and marketing | 442 | 1,287 | 3,877 | |||||||||
General and administrative | 2,997 | 6,437 | 12,800 | |||||||||
Total share-based compensation expense | $ | 3,956 | $ | 12,001 | $ | 38,909 | ||||||
The Company has the following Ordinary Shares reserved for future issuance:
December 31, | ||||||||
2021 | 2022 | |||||||
Conversion of convertible preferred shares | - | - | ||||||
Outstanding share options | 10,132,154 | 9,054,293 | ||||||
Unvested RSU’s | 443,018 | 1,348,682 | ||||||
Remaining shares available for future issuance under the 2021 Plan | 2,749,064 | 19,705,622 | ||||||
Total shares of ordinary shares reserved | 13,324,236 | 30,108,597 | ||||||
| 10. | Leases |
Year ended December 31, | ||||||||||||
2020 | 2021 | 2022 | ||||||||||
Components of lease expenses | ||||||||||||
Operating lease cost | $ | 1,023 | $ | 1,406 | $ | 3,318 | ||||||
Short-term lease | $ | 66 | $ | 51 | $ | 462 | ||||||
Total lease expenses | $ | 1,089 | $ | 1,457 | $ | 3,780 | ||||||
Year ended December 31, | ||||||||||||
2020 | 2021 | 2022 | ||||||||||
Supplemental cash flow information | ||||||||||||
Cash paid for amounts included in the measurement of lease liabilities | $ | 1,017 | $ | 1,015 | $ | 2,212 | ||||||
Supplemental non-cash information related to lease liabilities from obtaining ROU assets | $ | 3,734 | $ | 17,329 | $ | 2,862 | ||||||
December 31, 2022 | ||||
(in thousands) | ||||
Year Ending December 31, | ||||
2023 | $ | 3,260 | ||
2024 | 3,024 | |||
2025 | 2,674 | |||
2026 | 2,653 | |||
2027 | 2,185 | |||
Thereafter | 7,830 | |||
Total operating lease payments | $ | 21,626 | ||
Less: imputed interest | 1,802 | |||
Total | $ | 19,824 | ||
| 11. | Income Taxes |
| a. | Israeli taxation: |
| 1. | Industry Encouragement (Taxes) Law, 1969 |
| 2. | Ordinary taxable income in Israel is subject to a corporate tax rate of 23%. |
| 3. | The Company has not received any final tax assessments since inception. |
| 4. | The Company has net operating losses from prior tax periods which may be subjected to examination in future periods. As of December 31, 2022, the Company’s tax years until December 31, 2015 are subject to statutes of limitation in Israel. |
| 5. | Measurement of taxable income in U.S. dollars: |
| b. | Income taxes of non-Israeli subsidiaries: |
Non-Israeli subsidiaries are taxed according to the tax laws in their respective countries of residence.
| c. | The components of the net profit (loss) before the provision for income taxes were as follows: |
Year Ended December 31, | ||||||||||||
2020 | 2021 | 2022 | ||||||||||
(in thousands) | ||||||||||||
Israel | 1,293 | (83,028 | ) | (170,138 | ) | |||||||
Foreign | 2,781 | 8,800 | (31,279 | ) | ||||||||
Total | 4,074 | (74,228 | ) | (201,417 | ) | |||||||
| d. | The provision for income taxes was as follows: |
Year Ended December 31, | ||||||||||||
2020 | 2021 | 2022 | ||||||||||
(in thousands) | ||||||||||||
Current: | ||||||||||||
Israel | $ | 16 | $ | - | $ | - | ||||||
Foreign | 92 | $ | 795 | $ | 1,512 | |||||||
Total current income tax expense | 108 | $ | 795 | $ | 1,512 | |||||||
Deferred: | ||||||||||||
Israel | - | - | - | |||||||||
Foreign | 52 | (90 | ) | (7,524 | ) | |||||||
Total deferred income tax (benefit) expense | 52 | (90 | ) | (7,524 | ) | |||||||
Total provision for income taxes | $ | 160 | $ | 705 | $ | (6,012 | ) | |||||
| e. | Reconciliation of the theoretical tax expenses: |
A reconciliation of the Company’s theoretical income tax expense to actual income tax expense is as follows:
Year Ended December 31, | ||||||||||||
2020 | 2021 | 2022 | ||||||||||
(in thousands) | ||||||||||||
Theoretical income tax expense (benefit) | $ | 937 | $ | (17,072 | ) | $ | (46,326 | ) | ||||
Change in valuation allowance | (2,235 | ) | 26,822 | 43,134 | ||||||||
Return to provision true ups | - | (2,490 | ) | 395 | ||||||||
Foreign tax rate differentials | (150 | ) | (76 | ) | 311 | |||||||
Shared Based Compensations non-deductible (taxable) | 910 | (8,148 | ) | (929 | ) | |||||||
Non-deductible expenses | 1,290 | 1,517 | 820 | |||||||||
Tax rate change impact | - | - | (1,883 | ) | ||||||||
Foreign exchange impact | (357 | ) | 273 | 874 | ||||||||
State Taxes | - | 63 | (316 | ) | ||||||||
Valuation allowance on acquisition balances | - | - | (3,482 | ) | ||||||||
Other | (235 | ) | (184 | ) | 1,390 | |||||||
Total | $ | 160 | $ | 705 | $ | (6,012 | ) | |||||
| f. | Deferred tax assets and liabilities: |
December 31, | ||||||||
2021 | 2022 | |||||||
(in thousands) | ||||||||
Deferred tax assets: | ||||||||
Net operating loss carryforwards *) | 30,129 | 75,766 | ||||||
Research and development expenses | 4,327 | 9,186 | ||||||
Leasing liabilities | 4,823 | 4,588 | ||||||
Accruals and reserves | 351 | 848 | ||||||
Share-based compensation | 1,371 | 7,758 | ||||||
Deferred IPO costs | - | 346 | ||||||
R&D tax credits | - | 351 | ||||||
Bad debt | - | 157 | ||||||
Unrealized Losses from marketable securities | - | 482 | ||||||
Gross deferred tax assets | 41,001 | 99,482 | ||||||
Valuation allowance | (36,077 | ) | (79,211 | ) | ||||
Total deferred tax assets | 4,924 | 20,271 | ||||||
Deferred tax liabilities: | ||||||||
Deferred contract acquisition costs | 376 | 391 | ||||||
Leasing assets | 4,548 | 4,570 | ||||||
Property and equipment | - | 42 | ||||||
Intangibles | 21,577 | |||||||
Other | 78 | |||||||
Gross deferred tax liabilities | 4,924 | 26,658 | ||||||
Deferred taxes assets (liabilities),net | - | (6,387 | ) | |||||
| g. | Uncertain tax position |
December 31, | ||||||||
2021 | 2022 | |||||||
(in thousands) | ||||||||
Beginning balance | - | 19,389 | ||||||
Increases related to tax positions taken during the current year *) | 19,389 | 34,281 | ||||||
Ending balance | 19,389 | 53,670 | ||||||
Year Ended December 31, | ||||||||||||
2020 | 2021 | 2022 | ||||||||||
(in thousands, except share and per share data) | ||||||||||||
Basic net profit (loss) per share | ||||||||||||
Numerator: | ||||||||||||
Allocation of net profit (loss) | 3,914 | (74,933 | ) | (195,405 | ) | |||||||
Net income allocated to preferred shareholders | 3,189 | - | - | |||||||||
Allocation of net profit (loss) attributable to Ordinary shareholders | 725 | (74,933 | ) | (195,405 | ) | |||||||
Denominator: | ||||||||||||
Weighted-average shares used in computing net profit (loss) per share attributable to Ordinary shareholders | 21,120,208 | 101,737,026 | 157,691,173 | |||||||||
Basic net profit (loss) per share attributable to Ordinary shareholders | 0.03 | (0.74 | ) | (1.24 | ) | |||||||
Diluted net profit (loss) per share | ||||||||||||
Numerator: | ||||||||||||
Allocation of net profit (loss) attributable for diluted computation | 725 | (74,933 | ) | (195,405 | ) | |||||||
Denominator: | ||||||||||||
Shares used in computing net earnings per share of ordinary share, basic | 21,120,208 | 101,737,026 | 157,691,173 | |||||||||
Weighted average effect of dilutive securities - effect of stock-based awards | 7,517,593 | - | - | |||||||||
Weighted-average shares used in computing net profit (loss) per share attributable to Ordinary shareholders | 28,637,801 | 101,737,026 | 157,691,173 | |||||||||
Diluted net profit (loss) per share attributable to ordinary shareholders | 0.03 | (0.74 | ) | (1.24 | ) | |||||||
Year Ended December 31, | ||||||||||||
2020 | 2021 | 2022 | ||||||||||
Convertible preferred shares | 92,946,600 | |||||||||||
Unvested RSU’s | - | 443,018 | 1,348,682 | |||||||||
Outstanding warrants to Ordinary Shares | - | 7,902,480 | 2,713,701 | |||||||||
Warrants to convertible shares | 312,600 | - | - | |||||||||
Outstanding share options | - | 10,132,154 | 9,054,293 | |||||||||
Total | 93,259,200 | 18,477,652 | 13,116,676 | |||||||||
December 31, 2022 | ||||||||||||||||
Fair value measurements using input type | ||||||||||||||||
Level 1 | Level 2 | Level 3 | Total | |||||||||||||
Assets: | ||||||||||||||||
Mutual Funds | $ | 1,258 | $ | - | $ | - | $ | 1,258 | ||||||||
Government debentures | - | 789 | - | 789 | ||||||||||||
Corporate debentures | - | 14,766 | - | 14,766 | ||||||||||||
Total financials assets | $ | 1,258 | $ | 15,555 | $ | - | $ | 16,813 | ||||||||
December 31, 2021 | ||||||||||||||||
Fair value measurements using input type | ||||||||||||||||
Level 1 | Level 2 | Level 3 | Total | |||||||||||||
Assets: | ||||||||||||||||
Mutual Funds | $ | 1,274 | $ | - | $ | - | $ | 1,274 | ||||||||
Government debentures | - | 1,908 | - | 1,908 | ||||||||||||
Corporate debentures | - | 15,282 | - | 15,282 | ||||||||||||
Total financials assets | $ | 1,274 | $ | 17,190 | $ | - | $ | 18,464 | ||||||||
| December 31, 2022 | ||||||||||||||||
Amortized Cost | Gross Unrealized Gains | Gross Unrealized Losses | Fair Value | |||||||||||||
Mutual funds | $ | 1,274 | 3 | (19 | ) | $ | 1,258 | |||||||||
Government debentures | $ | 1,157 | - | (368 | ) | $ | 789 | |||||||||
Corporate debentures | $ | 16,307 | $ | 13 | $ | (1,554 | ) | $ | 14,766 | |||||||
18,738 | $ | 16 | $ | (1,941 | ) | $ | 16,813 | |||||||||
| December 31, 2021 | ||||||||||||||||||||
Amortized Cost | Gross Unrealized Gains | Gross Unrealized Losses | Gross Realized Losses | Fair Value | ||||||||||||||||
Mutual funds | $ | 1,252 | 22 | - | $ | - | $ | 1,274 | ||||||||||||
Government debentures | $ | 1,894 | 23 | - | $ | (9 | ) | $ | 1,908 | |||||||||||
Corporate debentures | $ | 15,617 | $ | 24 | $ | (228 | ) | $ | (131 | ) | $ | 15,282 | ||||||||
18,763 | $ | 69 | $ | (228 | ) | $ | (140 | ) | $ | 18,464 | ||||||||||
December 31, 2022 | ||||
(in thousands) | ||||
Within one year | 200 | |||
After one year through five years | 3,323 | |||
After 5 years through 10 years | 2,978 | |||
After 10 years | 980 | |||
7,481 | ||||
December 31, 2022 | December 31, 2021 | |||||||||||||||
Fair Value | Unrealized Loss | Fair Value | Unrealized Loss | |||||||||||||
Mutual Funds | 1,258 | (19 | ) | - | - | |||||||||||
Government debentures | 789 | (368 | ) | 11,409 | (215 | ) | ||||||||||
Corporate debentures | 3,308 | (315 | ) | - | - | |||||||||||
Total | 5,355 | (702 | ) | 11,409 | (215 | ) | ||||||||||
December 31, 2022 | December 31, 2021 | |||||||||||||||
Fair Value | Unrealized Loss | Fair Value | Unrealized Loss | |||||||||||||
Mutual Funds | - | - | - | - | ||||||||||||
Government debentures | - | - | - | - | ||||||||||||
Corporate debentures | 10,447 | (1,239 | ) | 423 | (13 | ) | ||||||||||
Total | 10,447 | (1,239 | ) | 423 | (13 | ) | ||||||||||