| | |
United States Securities and Exchange Commission Washington, DC 20549 | | Form 10-K |
| ( X ) | | Annual Report Pursuant to Section 13 or 15(d) of the Securities Exchange Act of 1934 for the Fiscal Year Ended December 31, 2008 |
or
| ( ) | | Transition Report Pursuant to Section 13 or 15(d) of the Securities Exchange Act of 1934 for the Transition Period from to |
Commission file number 001-05519
| | |
| CDI Corp. | | (Exact name of Registrant as specified in its charter) |
| | |
Pennsylvania (State of incorporation) 1717 Arch Street, 35th Floor, Philadelphia, PA 19103-2768 (Address of principal executive offices) 23-2394430 (I.R.S. Employer Identification Number) (215) 569-2200 (Registrant’s telephone number, including area code) | | Securities registered pursuant to Section 12(b) of the Act: Common stock, $.10 par value (Title of each class) New York Stock Exchange (Name of exchange on which registered) |
Indicate by a check mark if the registrant is a well-known seasoned issuer, as defined in Rule 405 of the Securities Act. YES[ ] NO [ X ]
Indicate by a check mark if the registrant is not required to file reports pursuant to Section 13 or Section 15(d) of the Act. YES[ ] NO [ X ]
Indicate by check mark whether the registrant (1) has filed all reports required to be filed by Section 13 or 15(d) of the Securities Exchange Act of 1934 during the preceding 12 months (or for such shorter period that the registrant was required to file such reports), and (2) has been subject to such filing requirements for the past 90 days. YES [ X ] NO[ ]
Indicate by check mark if disclosure of delinquent filers pursuant to Item 405 of Regulation S-K is not contained herein, and will not be contained, to the best of registrant’s knowledge, in definitive proxy or information statements incorporated by reference in Part III of this Form 10-K or any amendment to this Form 10-K. þ
Indicate by check mark whether the registrant is a large accelerated filer, an accelerated filer, a non-accelerated filer, or a smaller reporting company. See the definitions of “large accelerated filer,” “accelerated filer” and “smaller reporting company” in Rule 12b-2 of the Exchange Act.
| | |
| Large accelerated filer [ ] | | Accelerated filer [ X ] |
| Non-accelerated filer [ ] | | Smaller reporting company [ ] |
| (Do not check if a smaller reporting company) | | |
Indicate by check mark whether the registrant is a shell company (as defined in Rule 12b-2 of the Exchange Act.) YES [ ] NO [ X ]
The aggregate market value of the registrant’s voting and non-voting common equity held by non-affiliates computed by reference to the price at which the common equity was last sold on June 30, 2008, the last business day of the registrant’s most recently completed second fiscal quarter, as reported on the New York Stock Exchange, was $353,186,878:
The number of shares outstanding of each of the registrant’s classes of common stock as of February 27, 2009 was as follows:
| | |
Common stock, $.10 par value Class B common stock, $.10 par value | | 18,906,576 Shares None |
Documents Incorporated By Reference
Portions of the registrant’s definitive proxy statement to be filed with the Securities and Exchange Commission in connection with the registrant’s 2009 annual meeting of shareholders are incorporated by reference into Part III of this report on Form 10-K.
Part I
Caution Concerning Forward-Looking Statements
This report (including Management’s Discussion and Analysis of Financial Condition and Results of Operations) contains forward-looking statements within the meaning of the Private Securities Litigation Reform Act of 1995. All statements that address expectations or projections about the future, including statements about the Company’s strategies for growth and future financial results (such as revenues, pre-tax profit and tax rates), are forward-looking statements. Some of the forward-looking statements can be identified by words like “anticipates,” “believes,” “expects,” “may,” “will,” “could,” “should”, intends,” “plans,” “estimates,” and similar expressions. These statements are not guarantees of future performance and involve a number of risks, uncertainties and assumptions that are difficult to predict. Because these forward-looking statements are based on estimates and assumptions that are subject to significant business, economic and competitive uncertainties, many of which are beyond the Company’s control or are subject to change, actual outcomes and results may differ materially from what is expressed or forecasted in these forward-looking statements. Important factors that could cause actual results to differ materially from the forward-looking statements include, but are not limited to: continued deterioration in general economic conditions and levels of capital spending by customers in the industries that the Company serves; further weakness in the financial and capital markets which may result in the postponement or cancellation of the CDI’s customers’ capital projects or the inability of CDI’s customers to pay the Company’s fees; competitive market pressures; the Company’s ability to maintain and grow its revenue base; the availability and cost of qualified labor; adverse consequences arising out of the U.K. Office of Fair Trading investigation; the Company’s level of success in attracting, training and retaining qualified management personnel and other staff employees; changes in customers’ attitudes towards outsourcing; credit risks associated with the Company’s customers; changes in tax laws and other government regulations; the possibility of incurring liability for the Company’s activities, including the activities of the Company’s temporary employees; the Company’s performance on customer contracts; and government policies or judicial decisions adverse to the Company’s businesses. More detailed information about some of these risks and uncertainties may be found in the Company’s filings with the SEC, particularly in the “Risk Factors” section in Part I, Item 1A. of this Annual Report on Form 10-K. Readers are cautioned not to place undue reliance on these forward-looking statements, which speak only as of the date hereof. The Company assumes no obligation to update such statements, whether as a result of new information, future events or otherwise, except as required by law.
Unless the context otherwise requires, all references herein to “CDI,” the “Registrant,” the “Company,” “we,” “us,” or “our” are to CDI Corp. and its consolidated subsidiaries.
General
CDI Corp. (the “Company” or “CDI”) (NYSE:CDI) was incorporated in Pennsylvania on July 30, 1985. It is the successor registrant to CDI Corporation, which was incorporated in Pennsylvania on September 16, 1950. The Company, which provides engineering and information technology outsourcing solutions and professional staffing, derives the majority of its revenues by providing services to Fortune 1000 companies and equivalent non-US-based companies, primarily in the US, UK, Canada, Mexico and Australia. Its services can be described in the following broad categories:
| | Ÿ | | Project outsourcing services - Project outsourcing services include engineering and information technology projects, usually performed at a CDI facility, which provide a deliverable work product or service to the customer. |
| | | In the CDI Engineering Solutions segment, these outsourcing projects can range in duration from several months to multiple years and generally include analysis of a customer’s engineering needs and development of solutions in one or more areas of a facility’s design and start-up supply chain. This supply chain includes such functions as feasibility studies, program and projectmanagement, technology and process design, front end engineering design, detailed design, construction management, equipment procurement and facility start-up services. Additional services can include life cycle plant maintenance. |
| | | In the CDI Information Technology Solutions segment, outsourcing projects can range from several months to multiple years and include problem analysis and execution of business application services, testing and quality assurance, program management and process outsourcing. |
| | | The CDI AndersElite and Management Recruiters International segments do not provide project outsourcing services. |
| | Ÿ | | Staffing services - Staffing services include assigning the Company’s skilled engineering, information technology, project management, architecture, construction and other professionals to work at a customer’s location under the supervision of customer personnel on a contractual basis for assignments that could range from several months to over one year. The Company also provides managed staffing services where the Company assumes overall management of a customer’s contract staffing functions. All of the Company’s four business segments provide customers with staffing services. |
2
| | Ÿ | | Professional services - Professional services include search, recruitment and permanent placement of technical, professional and managerial personnel; sales of new franchises; and services provided to franchisees to help them generate permanent placements. All of the Company’s four business segments provide customers with professional services. |
Reporting Segments
Through December 31, 2006, the Company operated through four reporting segments: Business Solutions (“BS”), CDI AndersElite (“Anders”), Todays Staffing (“Todays”), and Management Recruiters International (“MRI”). As of January 1, 2007, the Company began separately reporting CDI Engineering Solutions (“ES”) and CDI Information Technology Solutions (“ITS”), which together previously comprised the BS segment. This change reflected the Company’s new operating structure and was intended to provide investors with additional information on the Company’s engineering versus its information technology revenue and operating profit. Please see Note 21—Reporting Segments, in the notes to the consolidated financial statements, for further information about reporting segments.
As discussed in Note 9—Discontinued Operations, in the notes to the consolidated financial statements, the Company sold its Todays business segment in the third quarter of 2007. This was a significant step in the Company’s efforts over the past few years to refocus CDI’s business on engineering and IT project outsourcing and professional staffing services. Since September 30, 2007, the Company has four reporting segments: ES, MRI, Anders and ITS.
CDI Engineering Solutions (“ES”)
ES is a full service engineering, procurement, construction management, technical outsourcing and technical staffing firm providing project outsourcing, staffing and professional services through a global network of offices and alliance partners. In most engineering project engagements, the Company seeks to utilize technical resources at the most cost-effective CDI offices or alliance facilities. Work is generally performed at CDI engineering centers in the US and Canada, as well as at an alliance facility in Mexico. Approximately 22% of ES’s total revenue was generated outside the US in 2008.
Services
Through December 31, 2007, the ES segment operated through four verticals: CDI-Process and Industrial, CDI-Life Sciences, CDI-Government Services and CDI-Aerospace. In the second quarter of 2008, management decided to re-align the management and operations of the CDI-Life Sciences vertical into the CDI-Process and Industrial vertical. As a result, ES now offers its services through the following three key verticals:
| | Ÿ | | CDI-Process and Industrial (“P&I”) - Provides a full range of engineering, design, project management, professional staffing and outsourcing solutions to firms in oil, gas, refining, alternative energy, power generation and energy transmission, nuclear, chemicals and heavy manufacturing industries. In addition, P&I offers facility design, project management, engineering, professional staffing and facility start-up services to customers in the pharmaceutical, bio-pharmaceutical and regulated medical services industries. |
| | Ÿ | | CDI-Government Services (“Government Services”) - Provides engineering, design and logistics services to the defense industry, particularly in marine design, systems development and military aviation support. |
| | Ÿ | | CDI-Aerospace (“Aerospace”) - Provides a full range of engineering, design, project management, professional staffing and outsourcing solutions to both the commercial and military aerospace markets. |
ES’s project outsourcing services are high value-added engineering services that typically involve managing a discrete portion or portions of a customer’s capital project, including, but not limited to, feasibility studies, basic engineering or detailed plant design and construction management, validation and commissioning of a facility and life cycle support. To the extent such activities entail design and planning work, they are typically performed at CDI’s offices. However, construction management, commissioning and life cycle support activities are generally performed on-site at customers’ facilities. ES performs these engagements under contracts that are generally more than a year in duration.
ES’s staffing service is tailored to the needs of the customer. The most basic service provides skilled professionals to work at a single customer location on a temporary basis. In providing these services, the segment recruits and hires employees and provides personnel to customers for assignments that, on average, last close to one year. ES personnel perform the vast majority of these services at the customers’ facilities. Customers use ES’s employees to provide additional capabilities in times of expansion and change and to work on projects requiring specialized skills. At the end of the project, ES assigns the employees to another project for the customer, assigns the employees to perform services for another customer or terminates the employment of the employees.
This segment’s highest-value staffing service is customized managed staffing solutions, under which ES oversees the customer’s entire contract staffing needs as well as certain human resource functions required to manage the customer’s contract workforce. In these instances, ES frequently establishes on-site offices at one or more of the customer’s facilities, provides staffing and links that office into the segment’s business systems. If desired by the customer, managed staffing services utilize web-based technology to help accelerate and streamline the procurement, management and supervision of contract
3
employees. ES is responsible for administrative matters, benefits and employment taxes for these temporary employees.
ES also provides permanent placement services to meet the needs of its customers. Customers provide a position specification to ES, and candidates are identified through traditional advertising, the Company’s website, networking, public job boards or targeted recruiting. ES has developed professional recruitment outsourcing (“PRO”) services to manage a customer’s entire permanent recruitment process. PRO services provide domestic and multi-national customers with a single source of professional and technical permanent placements across an entire organization. ES also offers assessment services to study a customer’s permanent placement hiring processes and provides recommendations to improve critical hiring metrics. Those metrics include time to hire, cost to hire and quality of hired candidates.
Pricing
ES generally prices its project outsourcing services using either a mark-up or a multiplier of its employees’ hourly rates of pay or bill rates. Contracts generally do not obligate the customer to pay for any fixed number of hours. To a lesser extent, ES prices these services on a fixed-price basis. For the majority of its temporary and managed staffing contracts, ES determines the pricing based on either mark-ups of its employees’ hourly rates of pay or bill rates. Contracts generally do not obligate the customer to pay for any fixed number of hours. Generally, the customer has the right to terminate the project outsourcing or staffing contract on short notice. ES maintains the right to terminate its employees at will.
Permanent placement revenues are contingent upon filling an assigned position. If the customer hires the candidate, ES receives a fee based upon an agreed-upon rate, which generally amounts to a percentage of the candidate’s first-year compensation.
Customers typically invite several companies to bid for contracts, which the Company believes are awarded primarily on the basis of prior performance, reputation, value-added services, technological capability and price. Customers frequently grant multi-vendor contracts.
All pricing is subject to negotiation and agreement with the customer.
Customers / Markets
ES’s customers are primarily large, multinational corporations, spanning several industries. P&I customers are in the oil, gas, refining, alternative energy, power generation and energy transmission, nuclear, chemicals, heavy manufacturing, pharmaceutical, bio-pharmaceutical and regulated medical service industries. Government Services customers are in the defense industry. Aerospace customers are in the commercial and military aviation industries. Business under government contracts, which may be terminated by the government forconvenience at any time, represented approximately 18% of ES’s total segment revenues in 2008, mostly in the Government Services vertical.
ES’s management conducts business development activities to identify opportunities in specific vertical markets and geographical areas. Business development professionals identify the potential markets for services and develop these markets through personal contact with existing and prospective customers, as well as other business and trade contacts. The segment’s operating management seeks to stay abreast of emerging demand for services and expands or redirects their efforts to take advantage of potential business in either established or new marketing areas.
Management Recruiters International (“MRI”)
MRI is a global franchisor that does business as MRINetwork® and provides the use of its trademarks, business systems and training and support services to its franchisees to enable them to engage in the search and recruitment of managerial, professional, executive, administrative and technical personnel for employment by their customers. MRI brand names include Management Recruiters®, Sales Consultants®, CompuSearch® and OfficeMates 5®. MRI’s trademarks provide value by distinguishing its services from those of its competitors, being connected to its successful service offering and providing MRI with the legal ability to prevent unauthorized use of its brands. The trademarks have indefinite lives. MRI also provides training and back-office services to enable franchisees to provide temporary contract staffing services to their customers.
As of December 31, 2008, MRI had approximately 790 franchised offices in the US and two master franchises, one covering the Japanese market and one covering the rest of the international markets. In April 2006, MRI sold an international master franchise to MRI Worldwide Network, Limited (“Worldwide”), whereby MRI assigned the rights to all of its existing international franchise agreements as well as the right to enter into any new franchise agreements outside the US, with the exception of existing or future franchises in Japan. The Company entered into a master franchise agreement for the Japanese market in 2004. On January 22, 2009, the Company terminated its master franchise agreement with MRI Worldwide Network, Limited and had assigned to it the benefit of the franchise agreements of MRI Worldwide Network, Limited’s sub-franchisees. Subsequently, the Company has been operating the business. MRI believes that the international marketplace provides opportunity for franchise expansion and the potential for franchise sales and royalty revenue flows. There are approximately 150 franchised offices in 39 countries throughout the world. MRI reported less than 1% of its total revenue from sources outside the US in 2008.
4
Services
MRI provides training and administrative support primarily from offices in Philadelphia, Pennsylvania and Cleveland, Ohio for domestic franchise operations and in the UK and Japan for the international franchise operations. The broad geographic scope of operations and underlying support and related systems enables franchisees to provide their customers with global permanent placement services through a worldwide inter-office referral network.
Under a typical MRI franchise agreement, the franchisee is entitled to the use of MRI’s intellectual property, such as trademarks and trade names, as well as ongoing field service and public relations support, training and vendor purchasing programs. Franchisees also have access to MRI’s extensive performance development curriculum, which is designed specifically for the recruitment industry, and an inter-office referral network that provides franchisees with a searchable database of assignments and candidates to facilitate office cooperation in search and recruiting activities. MRI does not control the business operations of its franchisees.
In conjunction with MRI, franchisees can also offer professional and administrative temporary staffing services to their customers. Franchisees are responsible for selling these services to their customers and for recruiting the temporary personnel. MRI performs payroll services, billing and collection functions for the franchisees. The franchisee receives a portion of the gross profit generated from the temporary staffing service accounts.
Pricing
Ongoing royalties and initial franchise fees are key components of MRI’s revenues. MRI receives ongoing royalty fees based on a contractual percentage of the franchisee’s permanent placement service fees and any other revenue collected. New franchise agreements generally have a term of 10 years. Individual franchises and international master franchises may be acquired by qualified candidates both in the US and internationally. In 2008, new franchisees located in the US paid an initial fee of approximately $100,000 and MRI was entitled to receive a portion of the initial fee paid by new subfranchisees located outside the US. Beginning in 2009, MRI implemented a new pricing structure with an initial fee of approximately $40,000, a total service fee, payable monthly for the first twelve months of operation, totaling $24,000 and a revised royalty rate schedule.
For the majority of its professional and administrative temporary staffing services, pricing is based on mark-ups of the hourly rates payable to the temporary personnel. Arrangements generally do not obligate the customer to pay for any fixed number of hours. Generally, the customer has the right to terminate the arrangement on short notice.
Customers / Markets
MRI’s primary objective is to provide valuable trademarks and business systems, as well as superior service, training, supportand ancillary services to its franchisees, to enable them to be successful in their businesses. Its secondary objective is to sell new franchises and renew existing franchises. New franchisees have been brought into the MRI network primarily on a referral basis. The ability of MRI’s franchisees to compete successfully with other contingent recruitment firms is important to this segment’s changes in revenue. MRI’s business is not dependent on any single franchisee.
CDI AndersElite (“Anders”)
Anders provides contract and permanent placement candidates to customers in the infrastructure environment seeking staff in building, construction and related professional services through a network of Company offices. The Company maintains offices in the UK and Australia, and many candidates that Anders places in the UK are recruited from Australia and New Zealand. Customer disciplines include architecture, building services, rail, commercial and industrial construction, consulting engineering, facilities management, interior design, surveying and town planning projects in both private and government-funded capital infrastructure investments. In 2008, Anders generated approximately 3% of its total revenue from its Australian operations.
Services
Anders provides temporary workers at customer jobsites to work on projects. Anders contracts for the temporary workers’ services either with the individual workers directly or with a limited company that employs the worker. In the case of individual workers, Anders is responsible for related tax deductions and national insurance contributions, whereas in the case of limited company workers, the limited company employer is responsible for such deductions and contributions. The customer has supervisory control and responsibility for the performance of the temporary workers. The period of assignment depends on the customer’s need for the individual worker’s skills and can range up to many months. The average duration ranges from 12 to 14 weeks. At the end of the project, Anders seeks to find the workers new assignments, or terminates the relationship with the workers.
Additionally, Anders recruits candidates to meet the permanent placement requirements of its customers. Typically customers provide a candidate specification to Anders and Anders in turn recruits the candidate, primarily through the Company’s website, external candidate databases or referrals.
Pricing
Anders determines its pricing for the supply of temporary workers based on mark-ups of the hourly rates payable to the temporary workers. Pricing is subject to negotiation and agreement with the customer. Arrangements with the customer generally do not obligate the customer to pay for any fixed number of hours. Permanent placement revenues are con-
5
tingent upon filling an assigned position. If the customer hires the candidate, Anders receives a fee equal to a percentage of the candidate’s first-year compensation.
Customers / Markets
Anders provides services to national and regional UK-based customers that operate within the public and private sectors. These customers span the industrial, commercial, government and defense, housing and rail industries. The service industries in which Anders competes are highly competitive and are subject to strong pricing pressures from customers and competition.
The segment’s operating results are affected by the seasonality of its customers’ businesses. This seasonality is due to weather and daylight limitations, as well as governmental budget constraints. Demand for Anders’ staffing services is generally lower in the first and fourth quarters of the calendar year and increases during the second and third quarters. Anders provides services to the government sector. Business under government contracts, which may be terminated by the government for convenience at any time, represented approximately 23% of Anders total segment revenues in 2008.
CDI Information Technology Solutions (“ITS”)
ITS provides a variety of information technology (“IT”) related services to its customers, which are primarily Fortune 1000 customers with high volume information technology requirements and/or the need to augment their own staff on a flexible basis. Services include staffing augmentation, permanent placement, outsourcing (both on-site and off-site) and consulting.
Services
ITS provides three types of services to key functions.
| | Ÿ | | IT staffing - To provide IT specialists to assist in the completion of special projects or to address peak seasonal, project or business cycle demands through the addition of contract IT professionals or through a managed staffing solution. |
| | Ÿ | | IT outsourcing - To improve process management of complex or labor-intensive IT functions such as testing and quality assurance, Help Desk operations and other business application services. |
| | Ÿ | | IT consulting - To provide subject matter expertise in selected IT domains, improve IT process efficiency, reduce implementation time and obtain knowledgeable assessments from the Company’s subject matter experts. |
IT outsourcing and IT consulting provide quality assurance management and testing, application development and maintenance, program, portfolio and project management services, service desk application and infrastructure support, IT riskmanagement services and IT security services. In providing IT outsourcing services, this segment usually provides its own employees to the customer’s technical department and manages and monitors the results of the department. In most instances, the managed department is located on-site at the customer’s premises, but in some cases the customer may prefer an off-site location. In this case, the segment may maintain a stand-alone operation. ITS performs these engagements under contracts that span from several months to more than a year in duration.
IT staffing provides skilled professionals to work on a temporary basis on customer projects at their facilities. The customer’s need for the individual employee’s skills dictates the period of assignment. The average duration of an assignment is approximately six to nine months. At the end of the assignment, ITS assigns the employees to perform services for another customer or terminates the employment of the employees.
Additionally, IT permanent placement recruits candidates to meet the permanent placement requirements of its customers. Typically customers provide a candidate specification to ITS. The candidate is then found primarily through the Company’s website, a candidate database or a referral program.
Pricing
For the majority of its IT staffing augmentation contracts, ITS determines the pricing based on bill rates or mark-ups of its employees’ hourly rates of pay. Contracts generally do not obligate the customer to pay for any fixed number of hours. Generally, the customer has the right to terminate the contract on short notice. ITS maintains the right to terminate its employees at will.
Permanent placement revenues are contingent upon filling an assigned position. If the customer hires the candidate, ITS receives a fee based upon an agreed-upon rate, which generally amounts to a percentage of the candidate’s first-year compensation.
ITS generally prices its project outsourcing services using a mark-up or a multiplier of its employees’ hourly rates of pay or bill rates. Contracts generally do not obligate the customer to pay for any fixed number of hours. ITS also prices these services, to a lesser extent, on a fixed-price basis.
Customers typically invite several companies to bid for contracts, which the Company believes are awarded primarily on the basis of prior performance, value-added services, technological capability and price. Many times customers grant multi-vendor contracts.
Customers / Markets
ITS customers are primarily Fortune 1000 companies. Major customers are predominantly in the technology, auto and financial services industries. ITS also has smaller projects with customers in a variety of other industries.
6
ITS seeks to provide incremental services to existing customers. ITS also grows its business in its major markets by developing business and trade contacts with prospective customers. The market demand for ITS’s services is heavily dependent upon the pace of technology change and the changes in business requirements and practices of its customers. The IT services industry is highly competitive and is subject to strong pricing pressures from customers and competition.
The segment’s operating results are affected by the seasonality of its customers’ businesses. This seasonality is due to customers’ vacation and holiday schedules. Demand for ITS’s staffing and project outsourcing services is typically subject to seasonal slowdown at the end of the fourth quarter and beginning of the first quarter of each year, as well as a modest downturn during heavy vacation periods in the third quarter of each year. Revenue from one customer, International Business Machines Corporation, accounted for 48% of total segment revenue in 2008.
Other Information
Competition
The Company competes in global, national, regional and local markets with numerous engineering and information technology outsourcing companies and with temporary staffing and permanent placement firms. All segments of the Company’s operations face competition in attracting both customers and high-quality specialized employment candidates. The temporary and permanent placement businesses are very competitive and highly fragmented, with limited barriers to entry into the market. In many areas, the local companies are the strongest competitors. Price competition among companies in CDI’s staffing services industry and pricing pressures from customers are significant. The trend of customers who consolidate their purchases of engineering and IT outsourcing and staffing services with a single provider or with a small number of providers continues. This trend to consolidate purchases may make it more difficult for the Company to obtain or retain customers. The Company believes it derives a competitive advantage from its lengthy experience with and long-standing commitment to the industries it serves, long-term relationships with its customers, technical capabilities, national presence, and various marketing activities.
In 2008, CDI’s largest competitors by segment included:
| | Ÿ | | ES - Aerotek, Inc., Belcan Corporation, Day & Zimmerman, Inc., Gibbs and Cox, Inc., Jacobs Engineering Group Inc. and The Shaw Group Inc. |
| | Ÿ | | MRI - Heidrick & Struggles International, Inc., Korn/Ferry International, Robert Half International Inc., and SRA International, Inc. |
| | Ÿ | | ITS - Aerotek, Inc., CIBER, Inc., Computer Task Group, Inc., MPS Group, Inc. and Volt Information Sciences, Inc. |
Financial Information about Segments
Please see Note 21—Reporting Segments, in the notes to the consolidated financial statements, for further information about reporting segments.
Safeguards—Business, Disaster and Contingency Planning
CDI has a number of safeguards to protect the Company from various system-related risks. Given the significant amount of data generated in the Company’s key processes, including customer related projects, recruiting, payroll, and customer invoicing, CDI has implemented fault tolerant processing capability within the Company’s primary data center. This mitigates the risks related to hardware failure. Additionally, CDI has contracted with a third-party provider to restore its primary data center operations in the event of a disruption. Finally, the Company maintains site disaster plans for a majority of its operating offices as well as maintaining data back-up requirements throughout the Company.
Employees
As of December 31, 2008, CDI had approximately 1,200 staff employees. In addition, CDI had approximately 9,200 employees and workers engaged as billable personnel. The number of billable employees and workers varies in relation to the number of projects and assignments in progress at any particular time.
Access to Company Information
CDI makes available, free of charge, through its website or by responding to requests addressed to the Company’s Vice President of Corporate Communications, its Annual Report on Form 10-K, Quarterly Reports on Form 10-Q, Current Reports on Form 8-K, and all amendments to those reports filed by the Company with the Securities and Exchange Commission (“SEC”) pursuant to Sections 13(a) and 15(d) of the Securities Exchange Act of 1934, as amended. These reports are available as soon as reasonably practicable after such material is electronically filed with or furnished to the SEC. CDI’s website address ishttp://www.cdicorp.com. CDI posts its Audit Committee, Compensation Committee, Finance Committee, Executive Committee and Governance and Nominating Committee charters, Corporate Governance Principles and Code of Conduct on the Company’s website. The information contained on the Company’s website, or on other websites linked to the Company’s website, is not part of this document. The public may also read and copy any materials the Company has filed with the SEC at the SEC’s Public Reference Room located at 100 F Street N.E., Washington, D.C., 20549. In order to obtain information about the operation of the Public Reference Room, a person may call the SEC at 1-800-732-0330. The SEC also maintains a website on the Internet that contains reports, proxy and information statements, and other information regarding issuers that file electronically with the SEC. The SEC’s website is http://www.sec.gov.
7
CDI’s business involves a number of risks, many of which are beyond its control. The risks and uncertainties described below could individually or collectively have a material adverse effect on the Company’s business, assets, profitability or prospects. While these are not the only risks and uncertainties the Company faces, management believes that the more significant risks and uncertainties are as follows:
CDI’s business is heavily dependent on capital spending by customers in the industries it serves, and cuts in capital spending and economic downturns may result in the loss of revenues and profitability.
The demand for the Company’s services is highly dependent upon the level of capital spending by the Company’s customers, especially in the ES segment. The pace of customer capital spending programs, new product launches and similar activities have a direct impact on the need for project outsourcing and both temporary and permanent employees. There have been and may continue to be delays and cancellations of projects due to potential credit constraints and weak economic conditions experienced by CDI’s customers, which has and could continue to adversely affect the Company’s revenue stream. Further weakening of the economic condition of the US or any of the foreign countries in which the Company does business, or in any specific industry served, could have a further negative effect on the Company’s business, financial condition, cash flows or results of operations.
Unfavorable economic conditions could negatively affect CDI’s business.
As widely reported, financial markets in the US, Europe and Asia have been experiencing extreme disruption in recent months, including severely tightened credit availability, increases in unemployment and general declines in the US economy and economies around the world. Given the current economic conditions, many companies may choose to decrease their spending on staffing, both permanent and temporary, which in turn could have a material and adverse effect on the Company’s financial and operating performance.
The Anders and MRI segments earn revenue when qualified candidates accept open positions held by potential employers, generally corporate entities. These corporate entities may cut back on hiring in efforts to cut costs. In addition, as a result of the economic downturn, candidates may be less likely to take the risk of seeking new employment, creating a lack of qualified candidates. Both of these could have a material and adverse effect on the Company’s financial and operating performance.
In addition, the MRI segment derives royalty revenue from franchisees. If persons hoping to start MRI franchises are unable to obtain credit, they could be prevented from doing so, whichcould impede CDI’s growth in that sector. If current franchisees are unable to obtain credit, it could cause downsizing in their organizations, in turn negatively affecting the Company’s royalty revenue, potentially having a material and adverse effect on the Company’s financial and operating performance.
The Company’s continued success is dependent on its ability to hire and retain qualified employees, both management and billable personnel. The loss of key personnel could have a material adverse effect on the Company’s business.
CDI depends upon its ability to attract qualified personnel who possess the skills and experience required by its customers and to successfully bid for new customer projects. CDI must continually evaluate its base of available qualified personnel to keep pace with changing customer needs and emerging technologies. Competition for individuals with proven professional or technical skills always exists, and the demand for such individuals (particularly in certain engineering disciplines and geographic areas) is expected to remain strong in the foreseeable future. There is always uncertainty as to whether qualified personnel will continue to be available to CDI in sufficient numbers and on terms of employment acceptable to CDI.
The Company’s operations also depend on the continued efforts of its executives and senior management. The loss of key members of CDI’s management team may cause a significant disruption to the Company’s business. CDI also depends on the performance and productivity of its local managers and sales and recruiting personnel. The Company’s ability to attract and retain new business is significantly affected by local relationships and the quality of service rendered. The loss of key managers and field personnel may also jeopardize existing customer relationships, which could cause revenues to decline.
The Company may experience adverse consequences arising out of an ongoing investigation by the UK Office of Fair Trading.
In June 2006, the United Kingdom’s Office of Fair Trading (“OFT”) opened an investigation into alleged anti-competitive behavior by Anders and a number of its competitors in the UK construction recruitment industry. The allegations being investigated include, among others, the competitors agreeing to minimum fees in their contracts with UK intermediary recruitment companies and declining to work with one particular UK intermediary recruitment company. The Company has fully cooperated with the OFT in the investigation under the OFT’s corporate leniency program. On October 21, 2008, the OFT issued a Statement of Objections in which the OFT proposes to make a finding that Anders violated the UK Competition Act of 1998. In response to the Statement of Objections, on January 16, 2009 the Company submitted written representations to the OFT and on February 18, 2009 the Company made an oral presentation to the OFT. Although the Statement of Objections does not propose a specific fine, based on the contents of the Statement of Objections, the Company continues to believe that a fine will be imposed and that the amount of such
8
fine could be material. The Company believes it is reasonably possible that the OFT will levy a fine in the near term. The Company does not believe the Statement of Objections provides sufficient new information for the Company to determine, with any reliability, the amount of the fine or an estimated range of the fine, nor does the document make it clear when the Company might be able to reach a reliable estimate. However, a significant fine could have a material adverse effect on the Company’s financial position and results of operations. The Company has not made any provision for any fine or other liabilities relating to this matter in the Company’s consolidated financial statements as of December 31, 2008.
It is also possible that third-party civil lawsuits may be filed against Anders in connection with this matter. Anders has incurred legal fees and could incur significant incremental legal fees in connection with the OFT investigation and in defending any third-party lawsuits. Furthermore, this matter and the related publicity could materially and adversely affect the reputation of Anders and the Company. Senior management at Anders and the Company has devoted and will likely need to continue to devote a significant amount of time with regard to this matter, which could distract them from day-to-day business operations.
CDI is engaged in highly competitive businesses. Pricing pressures and increasing consolidation of purchasing by its customers could reduce the Company’s market share and profits.
The engineering, IT and professional staffing businesses are highly competitive and fragmented, with limited barriers to entry for staffing services. CDI competes in global, national, regional and local markets with numerous engineering and IT outsourcing companies and with temporary staffing and permanent placement firms. Price competition among companies in CDI’s industry and pricing pressures from customers are significant. The number of customers which consolidate their purchases of engineering and IT outsourcing and staffing services with a single provider or with a small number of providers has continued to rise. This trend to consolidate purchases may make it more difficult for the Company to obtain or retain customers in the future. The Company could also face the risk that certain customers may decide to provide similar services internally. Additionally, pricing pressures have intensified as customers have continued to competitively bid new contracts and seek price reductions on existing contracts. This trend is expected to continue for the foreseeable future, which could limit CDI’s ability to maintain or increase its market share or profitability.
The Company’s revenues are subject to uncertainties. CDI’s results of operations depend on, among other factors, new contract awards, and the selection process and timing for performing these contracts are subject to contingencies beyond the Company’s control. In addition, the Company’s customer contracts and arrangements may be adjusted, cancelled or suspended by its customers, in some cases on short notice.
A significant portion of revenues is directly or indirectly derived from awards of long-term contracts. It is difficult to predict whether and when the Company will receive such awards due to the lengthy and complex bidding and selection process, which is affected by a number of factors, such as market conditions, financing arrangements and governmental approvals. Because a meaningful portion of revenues is generated from these contracts, the Company’s results of operations and cash flows can fluctuate from quarter to quarter depending on the timing of contract awards.
Furthermore, substantially all of the Company’s contracts are subject to cancellation or termination at the discretion of the customer. In addition, project contracts are generally subject to changes in the scope of services to be provided. CDI, particularly in the Government Services vertical of its ES segment, is a party to prime contracts and subcontracts involving the federal government. Contracts with the US and other governments and their respective agencies are subject to particular uncertainties, restrictions and regulations. The US Government is under no obligation to maintain funding at any specific level, and funds for a program can be eliminated. Accordingly, the Company does not have a guaranteed backlog of business.
The failure of customers to pay amounts owed to CDI could cause the Company to experience significant losses.
Accounts receivable represent the largest asset on CDI’s balance sheet. While the Company takes steps to evaluate and manage the credit risks relating to its customers, economic downturns or events like those that are currently being experienced, could affect particular customers’ or industries’ ability to pay, which could reduce CDI’s ability to collect all amounts due from customers. In particular, the chemical and auto industries have been severely impacted by the global economic downturn in 2008 and the Company’s December 31, 2008 accounts receivable balance related to customers in these industries totaled approximately $13 million. If conditions continue to decline in these two industries, customers may have difficulty in paying their balances. In addition, in the staffing business, there are sometimes intermediaries between CDI and the customer, and therefore financial problems involving the intermediary company could pose credit risks to CDI.
CDI faces competition from global outsourcing companies, which may result in a loss of market share and reduced profitability.
There is increasing pressure from customers on their suppliers to outsource certain areas of their businesses to low-cost offshore
9
locations. Many engineering and IT outsourcing and staffing companies already have or are seeking an offshore solution to support their technology and business process functions, and as a result, a significant amount of domestic technology and engineering project work may utilize offshore capabilities as alternatives to domestic resources. CDI has established lower cost outsourcing centers and has partnered with offshore companies to provide additional lower cost options to its customers. Conducting business through offshore arrangements entails additional compliance and regulatory issues and may result in additional costs. CDI’s partnering arrangements are subject to the Company’s ability to maintain good working relationships with its foreign partners and on its partners’ ability to fulfill their obligations under CDI’s agreements with them. Changes in the supply and demand for offshore personnel with the training to perform the IT and engineering services sought by CDI’s customers, as well as other factors affecting offshore labor costs, could raise CDI’s costs which would put pressure on its margins. Also, other offshore solution providers could develop direct relationships with CDI’s customers resulting in a significant loss of the Company’s market share and revenue.
Foreign currency fluctuations, weak foreign economies and unfavorable political developments in connection with CDI’s international operations could seriously harm its financial condition.
CDI’s international operations are important to its business and the Company expects that it will continue to account for an increasing portion of its total revenues. At a minimum, its reported financial condition and results of operations are exposed to the effects (both positive and negative) that fluctuating exchange rates have on the process of translating the financial statements of international operations, which are denominated in currencies other than the US dollar, into the US dollar. CDI’s exposure to foreign currency fluctuations relates primarily to operations denominated in British pounds sterling, Canadian dollars and Australian dollars. Exchange rate fluctuations impact the US dollar value of reported earnings derived from these foreign operations as well as the Company’s investment in the net assets related to these operations. The Company has and may continue to engage in hedging activities with respect to certain of its foreign operations.
The Company’s international operations are subject to a variety of other risks, including, but not limited to, the following:
| | Ÿ | | Recessions in foreign economies and the impact on costs of doing business in those countries; |
| | Ÿ | | Difficulties in staffing and managing foreign operations; |
| | Ÿ | | Changes in regulatory requirements; |
| | Ÿ | | The adoption of new, and the expansion of existing, trade restrictions and the failure to comply with US export control laws; |
| | Ÿ | | The lack of well-developed legal systems and less established or traditional business practices in some countries, which could make it difficult for CDI to enforce its contractual rights; |
| | Ÿ | | Exposure to liability under the Foreign Corrupt Practices Act; |
| | Ÿ | | Social, political and economic instability, including risks of loss due to civil strife, acts of war, insurrection and terrorism; |
| | Ÿ | | Limitations on the movement of cash and the ability to repatriate foreign earnings; and |
| | Ÿ | | Logistical and communications challenges. |
CDI’s projects may encounter difficulties that result in additional costs, reductions in revenues, claims, disputes and the payment of damages.
CDI’s projects often involve complex design and engineering, significant procurement of equipment and supplies and broad construction management. The Company may encounter difficulties in the design or engineering, equipment and supply delivery, schedule changes and other factors, some of which are beyond its control, that impact its ability to complete the project in accordance with the original delivery schedule. In addition, the Company often relies on third-party equipment manufacturers as well as other third-party subcontractors to assist with the completion of its contracts. Any delay by these equipment manufacturers or subcontractors to complete their respective portions of a project, or any failure by subcontractors to satisfactorily complete their respective portions of a project, as well as other factors beyond the Company’s control, may result in delays in the overall progress of such project, cause CDI to incur additional costs or both. These delays and additional costs may be substantial, and the Company may be required to compensate the customer for these delays. While CDI may recover these additional costs from the responsible vendor, subcontractor or other third-party, the Company may not be able to recover all of these costs in all circumstances.
In addition, some contracts may require CDI’s customers to provide it with design or engineering information or with equipment or materials to be used on the project. In some cases, the customer may provide CDI with deficient design or engineering information or equipment or may provide the information or equipment to it later than required by the project schedule. The customer may also determine, after commencement of the project, to change various elements of the project. CDI is subject to the risk that it might be unable to obtain, through negotiation, arbitration, litigation or otherwise, adequate amounts to compensate it for the additional work or expenses incurred due to customer requested change orders or failure by the customer to timely provide required items. A failure to obtain adequate compensation for these matters could require CDI to record an adjustment to amounts of revenues
10
and gross profit that were recognized in prior periods. Any such adjustments could have a material adverse effect on the Company’s results of operations and financial condition.
The Company bears the risk of cost overruns in fixed-price contracts.
CDI sometimes enters into fixed-price contracts with customers, primarily for engineering project services. Revenue recognized under fixed-price contracts accounts for less than 5% of consolidated revenue in each of the past three years. Under these fixed-price contracts, prices are established based on cost and scheduling estimates, which in turn are based in part on assumptions about the prices and availability of skilled personnel, equipment, and materials. If the Company’s price estimates for a particular project prove to be inaccurate, then cost overruns may occur, and CDI could experience reduced profits or a loss for that project and the Company’s reputation could be harmed. Cost overruns may also be caused by changes in the scope of the project after the contract has been entered into or by a failure of the parties to adequately define and agree upon the entire scope of the project at inception. In those cases, there may be disputes between the parties over who should pay for the cost overruns. The Company will attempt to negotiate change orders to recover the additional costs, but there can be no assurance that the Company will be successful in its negotiations with its customers. In general, fixed-price contracts can offer greater profit potential but also entail more inherent risk—both in terms of possible financial losses and the potential for significant disputes with customers—than contracts containing pricing on a time-and-materials basis.
The Company’s project outsourcing services expose it to potential professional liability, product liability, warranty and other claims.
In connection with certain of its project outsourcing services, the Company engineers and performs services in various types of facilities, including major industrial facilities, where accidents or system failures can be disastrous. Any catastrophic occurrences in excess of insurance limits relating to locations or products which are engineered by the Company or locations where its services are performed could result in significant professional liability, product liability, warranty and other claims against the Company.
Furthermore, the project outsourcing services CDI provides expose it to additional risks including equipment failures, personal injuries, property damage and unforeseen engineering, architectural and environmental problems, each of which could significantly impact the Company’s performance and materially impact its financial statements.
Changes in government regulations could result in loss of business and/or increased costs.
CDI’s business is subject to regulation or licensing in many states and in certain foreign countries. There can be no assurance the Company will be able to continue to obtain all necessary licenses or approvals or that the cost of compliance will not prove to be material in the future. Any inability to comply with government regulation or licensing requirements, or increase in the cost of compliance, could materially and adversely impact the Company. New government regulations could disrupt or reduce existing business done by the Company, though it can also provide new business opportunities. Changes in government regulations could result in the imposition of new or additional benefits, licensing or tax requirements, thereby increasing CDI’s costs of doing business. There can be no assurance that CDI would be able to increase the fees charged to its customers in a timely manner or in a sufficient amount to cover increased costs as a result of any of the foregoing. Staffing services entail employing individuals on a temporary basis and placing such individuals in customers’ workplaces. Therefore, increased government regulation of the workplace or of the employer-employee relationship could materially and adversely impact the Company.
The outcome of pending and future claims and litigation could have a material adverse effect on the Company’s business.
From time to time, various types of legal claims arise in connection with the ordinary course of CDI’s business. Employees of the Company may make a variety of claims including workplace injury claims and employment-related claims such as discrimination, harassment, and wage and hour claims. Since the Company’s staffing business involves employing individuals on a temporary basis and placing them in customer workplaces where CDI has limited ability to control the workplace environment, these types of claims may arise more frequently in those business operations. The Company’s customers may make claims based on the Company’s alleged failure to perform in accordance with contract requirements. Since the Company’s project business often involves responsibility to produce specified deliverables, these types of claims may arise more frequently in those business operations. Customers in the staffing business may allege claims based on the conduct of staffing employees assigned to the customer’s worksite. Customers and subcontractors may make claims alleging the Company’s failure to abide by certain contract provisions. In addition, the Company is subject to possible government claims or fines for violations of various laws. See Note 15—Legal Proceedings and Claims, in the notes to the consolidated financial statements, for more information.
CDI has significant payroll-related costs, such as workers’ compensation, unemployment taxes and health benefits, which are subject to increases caused by government regulation and other factors, and such increases could reduce its profits.
In conducting its business, CDI pays a number of payroll and related costs and expenses, including unemployment taxes, workers’ compensation and medical insurance for its personnel. Unemployment insurance premiums paid by employers typically
11
increase during periods of increased levels of unemployment. Workers’ compensation costs may increase in the future if states raise benefit levels and liberalize allowable claims. The Company self-insures a portion of the exposure for losses related to workers’ compensation. The Company has established reserves for workers’ compensation claims based on historical loss statistics and periodic independent actuarial valuations. While management believes that its assumptions and estimates are appropriate, significant differences in actual experience or significant changes in assumptions may materially and adversely affect the Company’s future financial results. CDI’s future earnings could also be materially and adversely affected if it is not able to increase the fees charged to customers to absorb the increased costs related to unemployment insurance, workers’ compensation and medical benefits. In addition, its future earnings could also be materially and adversely affected by future cost increases.
Estimates of the Company’s income tax liabilities are subject to various uncertainties and actual results could vary significantly from these estimates.
When financial statements are prepared, CDI estimates its income tax liabilities with respect to the various jurisdictions in which the Company does business. Significant judgment is required in determining the provision for income tax liabilities in the financial statements and in forecasting CDI’s effective income tax rate in a given period. The provision for income taxes and tax liability in the future could be materially and adversely affected by numerous factors, including changes in tax laws, regulations or accounting principles, changes in the valuation of deferred tax assets and liabilities and audits by taxing authorities.
Future acquisitions may not be successful.
The Company may selectively pursue acquisitions as an element of its growth strategy, but it can not provide assurances that it will be able to locate suitable acquisitions or that it will be able to consummate any such transactions on terms and conditions acceptable to the Company, or that such transactions will be successful. Acquisitions involve a number of risks, including the diversion of management’s attention from its existing operations, the failure to retain key personnel or customers of an acquired business, the failure to realize anticipated benefits, such as cost savings and revenue enhancements, the potentially substantial transaction costs associated with acquisitions, the assumption of unknown liabilities of the acquired business, and the inability to successfully integrate the business. There can be no assurance that any future acquired businesses will generate anticipated revenues or earnings.
Disasters could interfere with CDI’s ability to operate its business. Certain of the Company’s customers operate in areas that may be impacted by severe weather conditions.
Various types of natural or man-made disasters could interfere with the Company’s continued ability to operate its businessnormally. For example, the Company’s ability to protect its data centers and information systems against damage from fire, power loss, telecommunications failure and other disasters is critical. In order to provide many of its services, CDI must be able to store, retrieve, process and manage large databases and periodically expand and upgrade its capabilities. Any damage to the Company’s data centers or any failure of the Company’s telecommunication links that interrupts its operations or results in an inadvertent loss of data could adversely affect CDI’s ability to meet its customers’ needs and their confidence in utilizing CDI for future services. While the Company has developed various backup plans and disaster recovery plans, there can be no assurance that the Company would be able to continue to operate its business smoothly in the face of certain natural or man-made disasters. Such business interruptions could materially and adversely affect CDI’s financial results and future prospects.
The Company services the oil, gas and chemical industries, each of which has a significant concentration of activities in the Gulf Coast of the US. This area has been impacted by several hurricanes in the past, and could be further impacted by severe weather in the future, negatively impacting CDI’s customers and its ability to serve them.
The Company relies on information systems in its operations. Failure to protect these systems against security breaches could materially and adversely affect CDI’s business and results of operations. Additionally, if these systems fail or become unavailable for any significant period of time, the Company’s business could be harmed.
The efficient operation of CDI’s business is dependent on computer hardware and software systems. Information systems are vulnerable to security breaches by computer hackers and cyber terrorists. The Company relies on industry accepted security measures and technology to securely maintain confidential and proprietary information maintained on its information systems. However, these measures and technology may not always be adequate to properly prevent security breaches. In addition, the unavailability of the information systems or the failure of these systems to perform as anticipated for any reason could disrupt CDI’s business and could result in decreased performance and increased overhead costs, causing the Company’s business and results of operations to suffer. Any significant interruption or failure of CDI’s information systems or any significant breach of security could adversely affect its business and results of operations.
CDI relies on outside suppliers to perform certain administrative services.
CDI outsources certain data processing, payroll and other administrative functions to companies that specialize in performing those services. The failure of such outside service providers to adequately perform such services could have a material adverse effect on CDI’s business and operations.
12
If CDI fails to maintain an effective system of internal controls over financial reporting, it may not be able to accurately report its financial results or prevent fraud. As a result, investors could lose confidence in the Company’s financial reporting, which would harm its business and the trading price of its stock.
Effective internal controls are necessary for CDI to provide reliable financial reports and prevent fraud. If the Company cannot provide reliable financial reports or prevent fraud, its operating results could be harmed. CDI devotes significant attention to establishing and maintaining effective internal controls. Any failure to implement required new or improved controls or difficulties encountered in their implementation could affect CDI’s operating results or cause it to fail to meet reporting obligations in future periods. Ineffective internal controls could also cause investors to lose confidence in the Company’s reported financial information, which could have a negative effect on the market price of CDI stock.
The Company may not be able to obtain the insurance coverages necessary to manage its risks.
The Company relies on insurance to help manage its risks and to limit the Company’s exposure to significant claims. The future availability and cost of such insurance is subject to market forces and CDI’s claims experience. There can be no assurance that the Company can always obtain and maintain appropriate insurance coverage, including errors and omissions insurance, in order to effectively manage the risks of its business.
A significant portion of the Company’s common stock is owned by related parties, and they could vote their shares in a way that is adverse to the interests of other shareholders.
Certain of CDI’s directors and trusts, for which some of the Company’s directors serve as trustee, own a substantial portion of the Company’s outstanding common stock. By virtue of this stock ownership, such shareholders have the power to significantly influence CDI’s affairs and are able to influence the outcome of matters required to be submitted to shareholders for approval, including the election of directors and the amendment of the Company’s Articles of Incorporation or Bylaws. Such shareholders could exercise influence over the Company in a manner adverse to the interests of CDI’s other shareholders.
The Company performs certain projects through joint ventures. Participation in joint ventures exposes the Company to additional risks and uncertainties.
As is common in the industry, CDI executes certain projects jointly with other contractors through joint ventures. These arrangements expose the Company to a number of risks, including the risk that CDI’s partners may not be able to fulfill their performance obligations under the joint venture agreements and related customer contracts. There is also a risk that CDI’s partners may be incapable of providing the required financialsupport to the partnerships. Disputes can arise not only between the Company and its joint venture partners, but also between the joint ventures and the customers.
Improper disclosure of employee and customer data could result in liabilities and harm the Company’s reputation.
The Company’s business involves the use, storage and transmission of information about its billable employees, permanent placement candidates and its customers. The Company has established policies and procedures to help protect the security and privacy of this information. The Company also, from time to time, exports sensitive customer data and technical information to recipients outside the US. The Company has a policy in place that requires an analysis prior to the export of any products, software, data, technology or other information from the Company’s systems to determine if any restrictions apply to the export.
It is possible that the Company’s security controls over personal and customer data and other practices that the Company follows may not prevent the improper access to or disclosure of personally identifiable and customer information. Such disclosure could harm the Company’s reputation and subject the Company to liability under its contracts and laws that protect personal and customer data, resulting in increased costs or loss of revenue.
The inability to meet the restrictive covenants included in the Company’s credit facility agreement could cause the Company to be unable to access facility funds, or default on the facility.
The Company has a credit facility, which requires that the Company comply with specified covenants, including certain minimum and maximum ratios that must be met or not be surpassed as well as a minimum level of shareholder’s equity. If the Company were to fail to meet any of these covenants, it would be unable to borrow under the credit facility. Failure to meet these covenants could also cause harm to the Company’s reputation and stock price.
| | |
| Item 1B. | | Unresolved Staff Comments |
Not applicable.
The Company presently maintains its principal executive offices at 1717 Arch Street, Philadelphia, Pennsylvania, in approximately 29,000 square feet of leased office space under leases expiring in 2012 and 2013. The Company also maintains offices at 1801 Market Street, Philadelphia, Pennsylvania, in approximately 50,000 square feet of leased office space under a lease expiring in 2016.
13
The Company maintains significant engineering centers in Houston, Texas (9800 Centre Parkway and 9555 W. Sam Houston Parkway) in approximately 100,000 square feet of leased space under various leases expiring through 2015, and in Baton Rouge, Louisiana at 4041 Essen Lane in approximately 49,000 square feet of leased space under a lease expiring in 2012. In addition, the Company operates a shared service center and engineering center at 3200 Kanawha Turnpike, South Charleston, West Virginia in approximately 54,000 square feet of leased space under a lease expiring in 2011. The Company also maintains additional offices at 200 Public Square, Cleveland, Ohio in approximately 52,000 square feet of leased office space under a lease expiring in 2011 and at 55 Merchant Square in Cincinnati, Ohio in approximately 53,000 square feet of leased office space under a lease expiring in 2011.
Additionally each reporting segment also has numerous other active facilities and locations under operating lease agreements. Most of the leased space is devoted to sales, marketing, engineering design, and administrative and back-office functions. These facilities are leased for terms ranging from five to ten years. The Company believes that its facilities are adequate to meet its current and near term needs.
A few of the Company’s offices accommodate more than one operating segment. In such cases, square-foot usage is allocated among the segments primarily based on utilization.
| | |
| Item 3. | | Legal Proceedings |
The Company has litigation and other claims pending which have arisen in the ordinary course of business.
In June 2006, the United Kingdom’s Office of Fair Trading (“OFT”) opened an investigation into alleged anti-competitive behavior by CDI AndersElite (“Anders”) and a number of its competitors in the UK construction recruitment industry. The Company has fully cooperated with the OFT in the investigation under the OFT’s corporate leniency program. On October 21, 2008, the OFT issued a Statement of Objections in which the OFT proposes to make a finding that Anders violated the UK Competition Act of 1998. In response to the Statement of Objections, on January 16, 2009 the Company submitted written representations to the OFT and on February 18, 2009 the Company made an oral presentation to the OFT. Although the Statement of Objections does not propose a specific fine, based on the contents of the Statement of Objections, the Company continues to believe that a fine will be imposed and that the amount of such fine could be material. The Company believes it is reasonably possible that the OFT will levy a fine in the near term. The Company does not believe the Statement of Objections provides sufficient new information for the Company to determine, with any reliability, the amount of the fine or an estimated range of the fine, nor does the document make it clear when the Company might be able to reach a reliable estimate. The Company has not made any provisions for any fine or other liabilities relating to this matter in its consolidated financial statements as of December 31, 2008.
| | |
| Item 4. | | Submission of Matters to a Vote of Security Holders |
There were no matters submitted to a vote of security holders during the fourth quarter of the year covered by this report.
14
Part II
| | |
| Item 5. | | Market for Registrant’s Common Equity, Related Stockholder Matters and Issuer Purchases of Equity Securities |
Market Information
Shares of CDI’s common stock are traded on the New York Stock Exchange under the trading symbol “CDI”. The high and low sales price per share of the Company’s common stock for each quarter during the last two years are shown in the table below (all as reported by the Wall Street Journal), together with dividend information for each period.
| | | | | | | | | |
| | | High | | Low | | Dividends |
2008 | | | | | | | | | |
First quarter | | $ | 26.56 | | $ | 18.78 | | $ | 0.13 |
Second quarter | | | 28.96 | | | 24.60 | | | 0.13 |
Third quarter | | | 28.53 | | | 15.11 | | | 0.13 |
Fourth quarter | | | 22.51 | | | 7.88 | | | 0.13 |
| | | |
2007 | | | | | | | | | |
First quarter | | $ | 30.98 | | $ | 23.80 | | $ | 0.11 |
Second quarter | | | 33.87 | | | 28.35 | | | 0.11 |
Third quarter | | | 33.37 | | | 23.34 | | | 0.11 |
Fourth quarter | | | 30.09 | | | 23.53 | | | 0.13 |
Dividends
The declaration and payment of future dividends will be at the discretion of the Company’s Board of Directors and will depend upon many factors, including the Company’s earnings, financial condition and capital requirements.
Shareholders
As of February 27, 2009, there were 434 shareholders of record of the Company’s common stock. A single record shareholder account may however represent multiple beneficial owners, including holders of shares in street name accounts. Including those multiple beneficial owners, the total number of shareholders of the Company’s common stock on February 27, 2009 was approximately 5,000. See Note 10 – Stock-Based Compensation in the notes to the consolidated financial statements, for information relating to securities authorized for issuance under the Company’s equity compensation plans.
15
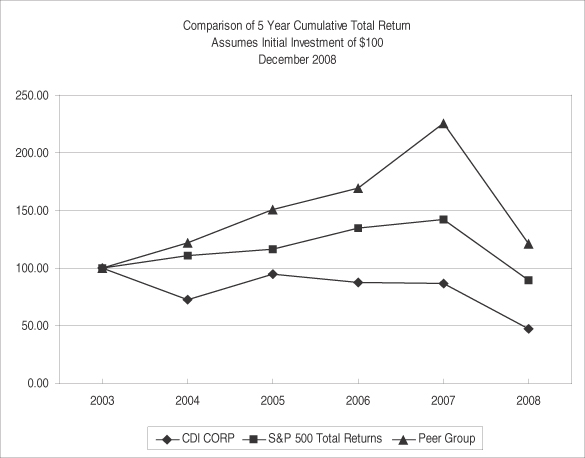
Comparative Stock Performance
The following graph sets forth the cumulative total shareholder return (assuming an investment of $100 on December 31, 2003 and the reinvestment of any dividends) for the last five fiscal years on (a) CDI stock, (b) the Standard & Poor’s (S&P) 500 Index and (c) CDI’s peer group index.
CDI’s peer group consists of the following nine companies: CIBER, Inc., Computer Task Group Inc., Heidrick & Struggles International Inc., Jacobs Engineering Group, Inc., Korn/Ferry International, MPS Group Inc., Robert Half International Inc., The Shaw Group Inc. and Volt Information Sciences Inc.
| | | | | | | | | | | | | | | | | | |
| | | Years ended December 31, |
| | | 2003 | | 2004 | | 2005 | | 2006 | | 2007 | | 2008 |
CDI Corp. | | $ | 100.00 | | $ | 72.65 | | $ | 94.81 | | $ | 87.63 | | $ | 86.73 | | $ | 47.55 |
S&P 500 Index—Total Return | | | 100.00 | | | 110.87 | | | 116.30 | | | 134.66 | | | 142.07 | | | 89.51 |
Peer Group | | | 100.00 | | | 121.92 | | | 150.62 | | | 169.11 | | | 225.27 | | | 121.10 |
16
Issuer Purchases of Equity Securities
A total of 1,489,469 shares of CDI Corp. common stock were repurchased by the Company at an average price of $20.13 during the year ended December 31, 2008. As of December 31, 2008, there remained an outstanding authorization to repurchase approximately $20.0 million of outstanding stock as represented in the table below:
| | | | | | | | | | |
CDI Corp. Purchases of Equity Securities
|
| Period | | Total Number
of Shares
Purchased (1)(3) | | Average
Price Paid
per Share | | Total Number
of Shares
Purchased as
Part of Publicly
Announced
Program (2) | | Approximate
Dollar Value of
Shares that May
Yet Be
Purchased
Under the
Program (2) |
January 1 through January 31, 2008 | | - | | $ | - | | - | | $ | - |
February 1 through February 29, 2008 | | - | | | - | | - | | | 50,000,000 |
March 1 through March 31, 2008 | | 72,400 | | | 24.61 | | 72,400 | | | 48,218,140 |
Total for January 1—March 31, 2008 | | 72,400 | | $ | 24.61 | | 72,400 | | $ | 48,218,140 |
April 1 through April 30, 2008 | | - | | $ | - | | - | | $ | 48,218,140 |
May 1 through May 31, 2008 | | - | | | - | | - | | | 48,218,140 |
June 1 through June 30, 2008 | | - | | | - | | - | | | 48,218,140 |
Total for April 1—June 30, 2008 | | - | | $ | - | | - | | $ | 48,218,140 |
July 1 through July 31, 2008 | | - | | $ | - | | - | | $ | 48,218,140 |
August 1 through August 31, 2008 | | 774,440 | | | 24.24 | | 774,440 | | | 29,445,049 |
September 1 through September 30, 2008 | | 106,232 | | | 24.65 | | 106,232 | | | 26,826,896 |
Total for July 1—September 30, 2008 | | 880,672 | | $ | 24.29 | | 880,672 | | $ | 26,826,896 |
October 1 through October 31, 2008 | | 536,397 | | $ | 12.69 | | 536,397 | | $ | 20,018,197 |
November 1 through November 30, 2008 | | - | | | - | | - | | | 20,018,197 |
December 1 through December 31, 2008 | | - | | | - | | - | | | 20,018,197 |
Total for October 1—December 31, 2008 | | 536,397 | | $ | 12.69 | | 536,397 | | $ | 20,018,197 |
| | | | |
Total January 1—December 31, 2008 | | 1,489,469 | | $ | 20.13 | | 1,489,469 | | $ | 20,018,197 |
| (1) | All share repurchases were effected in open-market transactions, except for 71,797 shares, which were purchased in a private transaction at the market price on the date of purchase. |
| (2) | The Company’s Board of Directors authorized on February 26, 2008 the repurchase of up to $50 million of the Company’s outstanding common stock (the “Repurchase Program”). Repurchases will be made from time to time beginning March 4, 2008 depending upon the Company’s share price and other relevant factors. Repurchases may be made in the open market or through privately negotiated transactions. The Company is not required to repurchase any specific number of shares, and the Company may terminate the repurchase program at any time. |
| (3) | No shares were repurchased by the Company other than through the Repurchase Program. |
17
| | |
| Item 6. | | Selected Financial Data |
The following is selected financial data derived from the Company’s audited consolidated financial statements for each of the last five years. The data should be read in conjunction with the Company’s consolidated financial statements (and related notes) appearing elsewhere in this report and with Item 7, Management’s Discussion and Analysis of Financial Condition and Results of Operations. The data presented below is in thousands, except for per share data.
| | | | | | | | | | | | | | | | |
| | | 2008 | | 2007 | | 2006 | | 2005 | | | 2004 |
Earnings Data: | | | | | | | | | | | | | | | | |
Revenue | | $ | 1,118,597 | | $ | 1,187,299 | | $ | 1,113,417 | | $ | 984,437 | | | $ | 922,945 |
Earnings from continuing operations before cumulative effect of accounting changes, net of tax (1)(2) | | $ | 19,415 | | $ | 31,828 | | $ | 20,752 | | $ | 12,352 | | | $ | 6,119 |
Discontinued operations, net of tax (1) | | | - | | | 2,374 | | | 2,511 | | | 1,605 | | | | 1,409 |
Cumulative effect of accounting changes, net of tax (3) | | | - | | | - | | | - | | | (152 | ) | | | - |
Net earnings | | $ | 19,415 | | $ | 34,202 | | $ | 23,263 | | $ | 13,805 | | | $ | 7,528 |
Basic earnings per share: | | | | | | | | | | | | | | | | |
Earnings from continuing operations (1) | | $ | 0.98 | | $ | 1.57 | | $ | 1.04 | | $ | 0.63 | | | $ | 0.31 |
Discontinued operations (1) | | | - | | | 0.12 | | | 0.13 | | | 0.08 | | | | 0.07 |
Cumulative effect of accounting changes | | | - | | | - | | | - | | | (0.01 | ) | | | - |
Net earnings | | $ | 0.98 | | $ | 1.69 | | $ | 1.17 | | $ | 0.70 | | | $ | 0.38 |
Diluted earnings per share: | | | | | | | | | | | | | | | | |
Earnings from continuing operations (1) | | $ | 0.97 | | $ | 1.56 | | $ | 1.03 | | $ | 0.62 | | | $ | 0.30 |
Discontinued operations (1) | | | - | | | 0.12 | | | 0.13 | | | 0.08 | | | | 0.07 |
Cumulative effect of accounting changes | | | - | | | - | | | - | | | (0.01 | ) | | | - |
Net earnings | | $ | 0.97 | | $ | 1.68 | | $ | 1.16 | | $ | 0.69 | | | $ | 0.37 |
Cash dividends declared per common share (4) | | $ | 0.52 | | $ | 0.46 | | $ | 0.44 | | $ | 0.44 | | | $ | 2.40 |
| | | | | |
Balance Sheet Data: | | | | | | | | | | | | | | | | |
Total assets of continuing operations (1) | | $ | 383,199 | | $ | 450,058 | | $ | 366,825 | | $ | 332,192 | | | $ | 316,366 |
Shareholders’ equity | | | 291,385 | | | 334,978 | | | 299,332 | | | 271,478 | | | | 267,190 |
| (1) | In September 2007, the Company sold its Todays Staffing, Inc. (“Todays”) subsidiary to Spherion Corporation. The sale price was $40.1 million in cash and the Company retained responsibility for certain liabilities and certain current and deferred income taxes directly related to the business. The Company recorded a gain of $2.1 million ($1.3 million after-tax) in connection with the sale. See Note 9—Discontinued Operations, in the notes to the consolidated financial statements, for further information on the sale of Todays and Discontinued Operations. |
| (2) | On January 1, 2006, the Company adopted SFAS 123 (R),Share-Based Payment, which requires all share-based payments to employees to be recognized as an expense based on the estimated fair value of the award on the date of grant. The Company recognized $1.3 million, $1.4 million and $1.4 million of expense related to stock options and stock appreciation rights in 2008, 2007 and 2006, respectively. See Note 10—Stock-Based Compensation, in the notes to the consolidated financial statements, for further information on stock-based compensation. |
| (3) | Effective December 31, 2005, the Company adopted FIN 47,Accounting for Conditional Asset Retirement Obligations,which required the Company to recognize a liability for its obligation to return certain of its operating leased facilities to their original condition upon termination of the lease. The Company increased its leasehold improvements asset by $0.3 million, recognized an asset retirement obligation of $0.5 million and a charge of $0.2 million. |
| (4) | In 2004, the Company declared special dividends of $2.00 per common share. |
18
| | |
| Item 7. | | Management’s Discussion and Analysis of Financial Condition and Results of Operations |
Executive Overview
The global economic slowdown that began early in 2008 and dramatically accelerated through the second half of 2008, significantly affected CDI’s revenue and earnings performance in 2008.
During the first half of 2008, the Company experienced a gradual weakening in permanent placement hiring at its Management Recruiters International (“MRI”) and CDI AndersElite (“Anders”) segments as customer uncertainty led to delayed hiring decisions. Additionally, late in the third quarter and throughout the fourth quarter, the Company experienced market disruptions driven by the global credit market crisis and a steep decline in commodity chemical and oil prices. These late-year factors caused cancellations and project delays in some previously awarded engineering contracts, particularly in chemicals, specialty chemicals, alternative energy and refining. These factors also caused sharp declines in permanent placement hiring in MRI and Anders.
As a result of these late-year hiring and capital investment cutbacks, the Company’s revenue decreased by 5.8% for the full year 2008 compared to the prior year and the Company’s net earnings from continuing operations declined by 39.0% compared to the prior year. The decline in net earnings from continuing operations was driven by the decline in revenue and worsened by an unfavorable revenue mix shift in the Company’s service categories. The economic slowdown most impacted revenues from the Company’s highest margin category, professional services, which decreased by 27.6% compared to the prior year. The Company’s high margin project outsourcing revenue category decreased by 9.5% compared to the prior year, while its lowest margin revenue category, staffing services, decreased by 2.2% compared to the prior year.
This revenue mix shift adversely affected the Company’s ability to make progress on one of its core strategic goals during the year—to continue to shift services delivered up the value continuum to higher margin services. The Company remains committed to this strategic goal and expects to resume the shift as the current economic cycle improves.
During the fourth quarter, the Company observed sharp deterioration in the general business environment, increasing instability of the credit markets and the resulting adverse effect on the industries that the Company serves. Additionally, the Company’s stock price declined significantly during the fourth quarter of 2008, causing its market capitalization to decline below its book value at December 31, 2008. These adverse changes were determined to be a triggering event, which indicated that a potential goodwill impairment may have occurred and the Company needed to update its impairment analysis. Therefore, the Company conducted another impairment test and determined that there was no impairment of goodwill as of December 31, 2008.
Despite these macroeconomic factors, CDI did achieve certain strategic milestones during the year:
| | Ÿ | | Acquired TK Engineering - broadening the Company’s capabilities in delivering jet turbine engineering services for clients in aerospace and wind power industries; |
| | Ÿ | | Formed a joint venture in Kuwait - providing access to engineering project work in Middle Eastern industrial and commercial infrastructure projects; |
| | Ÿ | | Secured a contract expansion of the Company’s largest IT Solutions (“ITS”) client; and |
| | Ÿ | | Secured a five-year contract, which has a maximum value of $139 million over the five year period, with The Naval Surface Warfare Center - supporting growth in the Government Services vertical of the Company’s Engineering Solutions (“ES”) segment. |
The Company remains focused on its long-term strategic plan to continue to shift services up the value continuum, to continue global expansion, to expand engineering project business in a recovering capital spending cycle and to increase higher margin permanent placement business. However, the Company remains cognizant of the short to mid-term challenges presented by the global economic slowdown and is committed to prudent cost and net asset management through this financial cycle. Throughout 2008 and in particular during the fourth quarter, the Company took steps to right-size the organization in the face of the continuing economic downturn. These steps have created a leaner operating structure better aligned with current business levels, which should position the Company to continue to focus on its long-term strategic plan.
Between the issuance of the Company’s press release announcing the 2008 results of operations and the filing of this Annual Report on Form 10-K, the Company determined that income tax expense was $0.4 million more and net earnings from continuing operations was $0.4 million less than reported in the press release. The $0.4 million represents the net effect of certain income tax adjustments, which includes $1.2 million of expense pertaining to prior years and the recognition of $0.7 million of a US tax benefit in relation to an international tax matter. The financial statements, footnotes and any relevant financial ratios in this report on Form 10-K have been updated accordingly. Basic and diluted earnings per share for the quarter and year ended December 31, 2008 decreased by $0.02 per share as a result of these adjustments. See Footnote 13 – Income Taxes in the notes to the consolidated financial statements.
Investigation by the UK Office of Fair Trading
In June 2006, the United Kingdom’s Office of Fair Trading (“OFT”) opened an investigation into alleged anti-competitive behavior by Anders and a number of its competitors in the UK construction recruitment industry. The Company has fully cooperated with the OFT in the investigation under the OFT’s corporate leniency program. On October 21, 2008, the OFT issued a Statement of Objections in which the OFT proposes to
19
make a finding that Anders violated the UK Competition Act of 1998. In response to the Statement of Objections, on January 16, 2009 the Company submitted written representations to the OFT and on February 18, 2009 the Company made an oral presentation to the OFT. Although the Statement of Objections does not propose a specific fine, based on the contents of the Statement of Objections, the Company continues to believe that a fine will be imposed and that the amount of such fine could be material. The Company believes it is reasonably possible that the OFT will levy a fine in the near term. The Company does not believe the Statement of Objections provides sufficient new information for the Company to determine, with any reliability, the amount of the fine or an estimated range of the fine, nor does the document make it clear when the Company might be able to reach a reliable estimate. The Company has not made any provisions for any fine or other liabilities relating to this matter in its consolidated financial statements as of December 31, 2008.
Consolidated Discussion
Business Strategy
CDI’s strategic objective is to be a leading global provider of engineering and information technology outsourcing solutions and professional staffing. These services enable CDI’s customers to focus on their core competencies and drive profitable growth and return on capital investment.
The Company seeks to achieve its strategic objectives by focusing on three core goals. These goals are:
| | Ÿ | | Continue to shift service delivery up the value continuum, which requires the Company to focus business development efforts among existing and new customers on higher value, higher margin and higher skill services. |
| | Ÿ | | Build international reach and global services delivery capabilities, particularly in engineering outsourcing, engineering project management and professional services. |
| | Ÿ | | Leverage the long-term capital spending cycle by building skill sets and business scale in targeted ES verticals and Anders. |
Key Performance Indicators
The Company manages and assesses its performance through various means, with the primary financial and operational measures including revenue, contract renewals, new contract wins, gross profit dollars and gross profit margin, operating profit, return on net assets and variable contribution margin.
Revenue is impacted by, among other things, levels of capital spending by customers, particularly in the ES and Anders business segments. Other external factors, such as the general business environment and employment levels, impact the Company’s staffing business. Economic growth or decline typically impacts the demand for labor. In periods of increasing unemployment and slowing GDP growth, CDI customers tend to first cut-back on their contract workforce. As economic weakness continues, CDI customers then tend to decrease permanent headcount. In a recovering economy, CDI customers tend first to increase their contract employee headcount and to delay hiring permanent employees until later in the recovery cycle, when they are more certain that the recovery will continue. Operationally, CDI’s ability to capitalize on opportunities created by the economy, its performance on new and existing accounts, new contract and account wins and its ability to mitigate competitive pricing pressures affect the Company’s revenue.
Gross profit dollars and gross profit margin reflect CDI’s ability to realize pricing consistent with value provided, to address changes in market demand and to control and pass through direct costs. Gross profit margin will shift as a result of the mix of business. The Company is focused on improving margins over time through efforts to grow new higher margin business and to cycle out of lower margin business. Professional services revenue, consisting of permanent placement and franchise related services, has an impact on gross profit margin. Since there are no direct costs associated with professional services revenue, increases or decreases in such revenue can have a disproportionate impact on gross profit margin.
Operating profit is gross profit less operating and administrative expenses. Operating profit margin reflects the Company’s ability to adjust overhead costs to changing business volumes.
Return on net assets (“RONA”) reflects CDI’s ability to generate earnings while optimizing assets deployed in the business. RONA means the pre-tax earnings for the current year, divided by the average net assets at the beginning and end of that year. Net assets include total assets minus total liabilities excluding cash and income tax accounts. A key metric to drive RONA is Accounts Receivable Days Sales Outstanding (“DSO”). Reduction in DSO will contribute to improvement in RONA.
Variable contribution margin (“VCM”) is a measure of the amount of profit that flows to the operating profit line for each dollar of revenue growth. VCM is calculated as the year-over-year change in operating profit divided by the year-over-year change in revenue.
The Company has established the following long-term performance goals:
| | Ÿ | | Produce pre-tax RONA of 20% and redeploy assets unable to meet this target; |
| | Ÿ | | Generate operating profit margin of 5% through gross margin expansion, financial discipline and lean headquarters operations; and |
| | Ÿ | | Generate VCM in the 12% to 14% range on incremental revenue. |
20
During 2008, the Company achieved a RONA of 14.0%, as compared to 23.4% during 2007, primarily reflecting reduced profit levels. Operating profit margin declined from 3.9% during 2007 to 2.3% during 2008 due to lower business volumesand the inability to reduce infrastructure costs as rapidly as the decline in revenue. The VCM calculation is not meaningful in this instance because both revenue and operating profit declined.
Consolidated Results of Operations
2008 versus 2007
Results of Operations
The following table presents revenue by service type along with several key metrics (in percentages) for 2008 and 2007:
| | | | | | | | | | | | | | | | | | | | | |
| Consolidated | | 2008 | | | 2007 | | | Increase (Decrease) | |
| (in thousands) | | $ | | | % of Total
Revenue | | | $ | | | % of Total
Revenue | | | $ | | | % | |
Revenue (1) | | | | | | | | | | | | | | | | | | | | | |
Staffing services | | $ | 771,955 | | | 69.0 | % | | $ | 789,460 | | | 66.5 | % | | $ | (17,505 | ) | | (2.2 | )% |
Project outsourcing services | | | 293,058 | | | 26.2 | | | | 323,823 | | | 27.3 | | | | (30,765 | ) | | (9.5 | ) |
Professional services | | | 53,584 | | | 4.8 | | | | 74,016 | | | 6.2 | | | | (20,432 | ) | | (27.6 | ) |
| | | $ | 1,118,597 | | | 100.0 | % | | $ | 1,187,299 | | | 100.0 | % | | $ | (68,702 | ) | | (5.8 | )% |
Gross profit | | $ | 255,447 | | | 22.8 | % | | $ | 286,940 | | | 24.2 | % | | $ | (31,493 | ) | | (11.0 | )% |
Operating and administrative expenses | | | 230,089 | | | 20.6 | | | | 240,104 | | | 20.2 | | | | (10,015 | ) | | (4.2 | ) |
Operating profit | | | 25,358 | | | 2.3 | | | | 46,836 | | | 3.9 | | | | (21,478 | ) | | (45.9 | ) |
Net earnings from continuing operations | | $ | 19,415 | | | 1.7 | % | | $ | 31,828 | | | 2.7 | % | | $ | (12,413 | ) | | (39.0 | )% |
| | | | | | |
Cash and cash equivalents | | $ | 61,761 | | | | | | $ | 127,059 | | | | | | $ | (65,298 | ) | | (51.4 | )% |
Cash flow provided by operations | | $ | 14,791 | | | | | | $ | 56,819 | | | | | | $ | (42,028 | ) | | NM | |
| | | | | | |
Effective income tax rate | | | 32.4 | % | | | | | | 35.2 | % | | | | | | | | | | |
After-tax return on shareholders’ equity (2) | | | 6.2 | % | | | | | | 10.0 | % | | | | | | | | | | |
Pre-tax return on net assets (3) | | | 14.0 | % | | | | | | 23.4 | % | | | | | | | | | | |
Variable contribution margin (4) | | | NM | | | | | | | 18.6 | % | | | | | | | | | | |
| (1) | Revenue for 2007 has been reclassified to conform to the current year’s presentation. |
| (2) | The year’s earnings divided by the average shareholders’ equity. |
| (3) | Pre-tax earnings for the year, divided by the average net assets at the beginning and end of the year. Net assets include total assets minus total liabilities excluding cash and income tax accounts. |
| (4) | Year-over-year change in operating profit divided by year-over-year change in revenues. The calculation for the 2008 year is not meaningful (NM) because both revenue and operating profit declined. |
Revenue by service type includes the following:
| | Ÿ | | Staffing services—Staffing services include assigning the Company’s skilled engineering, information technology, project management, architecture, construction and other professionals to work at a customer’s location under the supervision of customer personnel on a contractual basis for assignments that could range from several months to over one year. The Company also provides managed staffing services where the Company assumes overall management of a customer’s contract staffing functions. All of the Company’s four business segments provide customers with staffing services. |
| | Ÿ | | Project outsourcing services—Project outsourcing services include engineering and information technology projects, usually performed at a CDI facility, which provide a deliverable work product or service to the customer. These services are performed in the Company’s ES and ITS segments. |
| | Ÿ | | Professional services—Professional services include search, recruitment and permanent placement of technical, professional and managerial personnel; sales of new franchises; and services provided to franchisees to help them generate permanent placements. All of the Company’s four business segments provide customers with professional services. |
Revenue for 2008 declined 5.8% versus the prior year period. Anders and MRI experienced declines in professional services revenue due to a drop in permanent placement hiring as a result of declining employment markets in North America and the UK. Anders also experienced declines in staffing services revenue, primarily due to declines in the commercial, property development and residential housing construction markets in the UK. Additionally, the effects of changes in foreign exchange rates between the British pound sterling and the US dollar negatively impacted Anders’ revenue. ES experienced decreases in revenues primarily due to delayed and reduced projects in the Aerospace and P&I
21
verticals, as a result of decreases in capital spending by petrochemical, chemical and industrial customers and the Gulf Coast hurricanes. ITS experienced revenue declines due to reduced demand for contract staffing, primarily in the automotive sector.
While all revenue service types declined in 2008, staffing services revenue declined at a much lower rate than project outsourcing services and professional services revenue. While the Company’s strategy is to increase revenue from the higher-margin services, the downturn in capital spending and the global economy more significantly impacted the higher-margin project outsourcing services and professional services than the lower-margin staffing services. The Company was able to increase certain business relationships in Canada and the Government Services vertical.
Gross profit and gross profit margin decreased at a faster pace than the decline in revenue, primarily due to the reduction of higher margin permanent placement activity at Anders and MRI, the reduction of higher-margin project outsourcing in ES and increases in ES’s lower-margin staffing business.
Consolidated operating and administrative expenses decreased due to lower variable compensation costs and cost control measures.
Operating profit declined 45.9% compared to 2007 and operating profit margin decreased from 3.9% during 2007 to 2.3% during 2008 due to lower business volumes and infrastructure costs declining at a slower pace than revenue.
Included in net earnings from continuing operations is other income and expense of $3.8 million. This increased by $1.5 million in 2008 due primarily to $1.1 million of realized gains from zero cost collar option contracts entered into to hedge portions of the earnings of the Company’s foreign operations. The Company realized an immaterial loss from foreign exchange options in 2007.
Cash and cash equivalents of $61.8 million at December 31, 2008 was $65.3 million lower than the prior year balance. The decrease in cash was primarily driven by the purchase of TK Engineering for $17.6 million, and the repurchase of $30.0 million of the Company’s common stock. Cash flow provided by operations of $14.8 million was driven by earnings, partially offset by higher working capital requirements.
The Company’s effective income tax rate was 32.4% for the year ended December 31, 2008 compared to 35.2% for the year ended December 31, 2007. The tax rate in 2008 was favorably impacted by Canadian research credits and investments in tax-exempt instruments partially offset by the impact of state income taxes and certain adjustments to correct current taxes receivable. The tax rate in 2007 was negatively impacted by an increase in state taxes partially offset by the favorable impact of Canadian research credits, investments in tax-exempt instruments and a higher proportion of foreign earnings taxed at lower rates. Prior to the third quarter of 2008, the Companydid not record the benefit of the Canadian research credits until its claims were approved by the Canadian government due to the uncertain nature of the claims and related inability to estimate the amount of the credit. Because the Canadian government has accepted the claims for several years, the Company believes it can reliably estimate the credit and now accounts for these credits using the accrual method of accounting. The Company, however, expects that the Canadian research credit will be lower in future years because of a decrease in qualifying business activities.
Segment Discussion
CDI Engineering Solutions (“ES”)
Business Strategy
ES’s business strategy is to pursue the development of long-term alliances with its customers as a cost-effective, single-source provider of engineering services and professional staffing. By working as a core supplier and partner with its customers, ES is able to develop an understanding of its customers’ overall business needs as well as the unique technical needs of their projects. This approach creates the opportunity for ES to provide a greater and more integrated range of services to its customers to facilitate efficient project management, procurement, overall program integration and execution. This strategy requires ES to develop capabilities to provide services to its customers who have global requirements. Success of the ES business strategy is dependent upon maintaining and renewing its existing customers or contracts, continued capital spending by its major engineering customers, the ability to win new contract awards and accounts and the availability of labor at a reasonable cost. In addition, ES is strategically engaging in global arrangements to lower its labor costs for customers, to access a broader talent pool and to provide worldwide servicing capabilities for its global customers. ES has developed professional recruitment outsourcing (“PRO”) services to manage a customer’s entire recruitment process. PRO services provide domestic and multi-national customers with a single source of professional and technical permanent placements across an entire organization. ES continues to develop its strategy to acquire broader skill sets and greater leverage for servicing the alternative energy markets, as it continues to pursue further business opportunities in those markets.
Key Performance Indicators
ES manages and assesses its performance through various means, with the primary financial and operational measures including revenue, contract renewals, new contract wins, account growth, gross profit dollars and gross profit margin, operating profit and return on net assets.
Revenue reflects performance on both new and existing contracts and accounts. Changes in revenue will not generally result in proportionate changes in costs, particularly operating and administrative expenses, thus potentially impacting operating profit margins.
22
New contracts, account wins and contract renewals are the primary drivers of future revenue and provide an assessment of ES’s ability to compete. New contract wins fluctuate from quarter to quarter, depending on the timing of customer needs and external factors.
Gross profit dollars and gross profit margin reflect ES’s ability to realize pricing consistent with value provided, to incorporate changes in market demand and to control and pass through direct costs. ES’s focus on maintaining and improving overall margins can lead to improved profitability. Gross margins can also shift as a result of the mix of business, with project outsourcing services and professional services generally providing higher margins than staffing services. ES utilizes financial modeling and operational reviews in the contracting process to produce acceptable margins and returns.
Return on net assets (“RONA”) reflects ES’s ability to generate earnings while optimizing assets deployed in the business. A key metric to drive RONA is Accounts Receivable Days Sales Outstanding (“DSO”). Reduction in DSO will contribute to improvement in RONA.
Results of Operations
The following table presents changes in revenue by category, cost of services, gross profit, operating and administrative expenses and operating profit for ES for 2008 and 2007:
| | | | | | | | | | | | | | | | | | | |
| ES | | 2008 | | | 2007 (1) | | | Increase
(Decrease) | |
| (in thousands) | | $ | | % of Total
Revenue | | | $ | | % of Total
Revenue | | | $ | | | % | |
Revenue | | | | | | | | | | | | | | | | | | | |
Staffing services | | $ | 326,618 | | 54.1 | % | | $ | 307,433 | | 50.0 | % | | $ | 19,185 | | | 6.2 | % |
Project outsourcing services | | | 266,437 | | 44.2 | | | | 297,383 | | 48.4 | | | | (30,946 | ) | | (10.4 | ) |
Professional services | | | 10,168 | | 1.7 | | | | 9,706 | | 1.6 | | | | 462 | | | 4.8 | |
| | | | 603,223 | | 100.0 | | | | 614,522 | | 100.0 | | | | (11,299 | ) | | (1.8 | ) |
Cost of services | | | 477,481 | | 79.2 | | | | 485,035 | | 78.9 | | | | (7,554 | ) | | (1.6 | ) |
Gross profit | | | 125,742 | | 20.8 | | | | 129,487 | | 21.1 | | | | (3,745 | ) | | (2.9 | ) |
Operating and administrative expenses | | | 98,673 | | 16.3 | | | | 93,979 | | 15.3 | | | | 4,694 | | | 5.0 | |
Operating profit | | $ | 27,069 | | 4.5 | % | | $ | 35,508 | | 5.8 | % | | $ | (8,439 | ) | | (23.8 | )% |
| (1) | Revenues and expenses for 2007 have been reclassified to conform to the current year’s presentation. See Note 21—Reporting Segments in the notes to the consolidated financial statements. |
ES’s revenue decreased slightly in 2008, primarily due to:
| | Ÿ | | Reductions in capital spending by petrochemical, chemical and industrial customers in the CDI - Process and Industrial (“P&I”) vertical, driven by the global credit market crisis and a steep decline in commodity chemical and oil prices; |
| | Ÿ | | Decreases in project outsourcing due to the Gulf Coast hurricanes; |
| | Ÿ | | Continued project delays by a large customer in the CDI - Aerospace (“Aerospace”) vertical; and |
| | Ÿ | | Reduced business levels with alternative energy customers. |
These decreases were partially offset by increased capital spending by major customers in the CDI—Government Services (“Government Services”) vertical, increases in contract staffing services revenue, primarily from customers operating in the western Canadian oil market and increased project outsourcing revenue from the July 2008 acquisition of TK Engineering.
Gross profit dollars decreased 2.9%, primarily due to the decrease in higher margin project outsourcing services.
Gross profit margins decreased primarily due to the increase in lower margin staffing services, and the decrease in higher margin project outsourcing services, partially offset by a slight increase in permanent placement PRO services revenue in the P&I vertical and the higher margin revenue provided by the TK Engineering acquisition.
ES’s operating and administrative expenses increased in 2008 primarily due to:
| | Ÿ | | Facility cost increases within the P&I vertical in Texas, Louisiana and Michigan, as well as the addition of new facilities related to the TK Engineering acquisition; |
| | Ÿ | | The absence of a one-time favorable reversal of a legal accrual of $1.6 million in 2007; and |
| | Ÿ | | The establishment of a $2.5 million bad debt reserve for a customer who filed for bankruptcy in early 2009, cost containment expenses of $0.6 million, unsuccessful acquisition costs of $0.5 million and a goodwill adjustment of $0.5 million. |
These were partially offset by decreases in salaries, bonuses and commissions as part of the business unit’s lower headcount, field office consolidation and other cost containment measures.
The following table presents changes in revenue from each of ES’s verticals for 2008 and 2007:
| | | | | | | | | | | | | | | | | | | |
| ES | | | 2008 | | | | 2007 | | |
| Increase
(Decrease) |
|
| (in thousands) | | $ | | % of Total
Revenue | | | $ | | % of Total
Revenue | | | $ | | | % | |
Revenue (1) | | | | | | | | | | | | | | | | | | | |
CDI-P & I | | $ | 453,544 | | 75.2 | % | | $ | 474,982 | | 77.3 | % | | $ | (21,438 | ) | | (4.5 | )% |
CDI-Government Services | | | 82,909 | | 13.7 | | | | 70,035 | | 11.4 | | | | 12,874 | | | 18.4 | |
CDI-Aerospace | | | 66,770 | | 11.1 | | | | 69,505 | | 11.3 | | | | (2,735 | ) | | (3.9 | ) |
| | | $ | 603,223 | | 100.0 | % | | $ | 614,522 | | 100.0 | % | | $ | (11,299 | ) | | (1.8 | )% |
| (1) | Revenues for 2007 have been reclassified to conform to the current year’s presentation. |
23
The P&I vertical provides a full range of engineering, project management, design, professional staffing and outsourcing solutions to firms in oil, gas, refining, alternative energy, power generation and energy transmission, nuclear, chemical and heavy manufacturing industries. Typically, these customers are large, multi-national companies that use multiple service providers. Contracts are awarded based on the ability to meet the specific requirements of each individual project. Effective in the second quarter of 2008, the Life Sciences vertical was incorporated into the P&I vertical. The Life Sciences projects within the P&I vertical include facility design, project management, engineering, professional staffing and facility start-up services to customers in the pharmaceutical, bio-pharmaceutical and regulated medical services industries. Revenue in the P&I vertical decreased in 2008 due to decreases in capital spending by petrochemical, chemical and industrial customers and the effects of the Gulf Coast hurricanes, partially offset by increases in projects for customers in the Western Canadian oil market and slight increases in permanent placement revenue from PRO services.
The Government Services vertical focuses on providing engineering, design and logistics services to the defense industry, particularly in marine design, systems development and military aviation support. Revenue increases within the Government Services vertical in 2008 were driven primarily by renewed US federal government funding of several US Navy shipbuilding and ship design projects.
The Aerospace vertical provides a full range of engineering, design, project management, professional engineering staffing and outsourcing solutions to both the commercial and military aerospace markets. Revenue within the Aerospace vertical decreased in 2008 as compared to 2007, primarily as a result of ongoing project delays by a customer and reduced demand for services stemming from long-term contracts toward the end of the year as a result of reduced demand in the commercial airline industry and delays in defense aviation programs, partially offset by revenue from TK Engineering, which was acquired in the third quarter of 2008.
Management Recruiters International (“MRI”)
Business Strategy
The MRI network is one of the largest search and recruitment organizations in the world. The key to MRI’s success is delivering value to its franchisees by providing the use of its trademarks, business systems and training and support services to its franchisees to enable them to engage in the search and recruitment of managerial, professional, executive, administrative and technical personnel for employment by their customers. MRI’s strategic objectives include expansion of the number of current franchisees’ search consultants, expansion of the international franchise network and growth in underdeveloped US markets. MRI believes that the international marketplace provides opportunity for franchise expansion and the potential for franchise sales and royalty revenues.
Factors affecting MRI’s revenue include the state of the US and global economies, employment rates and the amount of contract staffing business done by franchisees. Economic growth or decline typically impacts the demand for labor. In periods of increasing unemployment and slowing GDP growth, MRI customers tend to first cut-back on their contract workforce. As economic weakness continues, MRI customers then tend to decrease permanent headcount. In a recovering economy, MRI customers tend first to increase their contract employee headcount and to delay hiring permanent employees until later in the recovery cycle, when they are more certain that the recovery will continue. Permanent placement and royalty fees are driven by employer demand for mid-to-upper level managerial, professional and sales candidates, as well as the number of new franchise offices and franchise contract renewals.
MRI continues to focus its efforts on growing existing franchisees by devoting additional resources to field service teams. These teams focus on maximizing customer contact and developing customer-level business plans to establish clear metrics and optimize network member performance. The ability of an individual franchisee to compete and operate successfully may be affected by the service quality of its office, the number of permanent placement offices operating in a particular industry segment, company reputation and other general and local economic factors.
MRI continues to provide and broaden its training and operations support to enable its franchisees to develop contract staffing services capabilities in their offices. These capabilities potentially provide a franchise owner with a complementary revenue stream and may improve the potential market value of the franchise office. MRI is also exploring ways to leverage its size and footprint with vendor alliance relationships that will benefit the franchise owners and their customers.
In 2008, new franchisees located in the US paid an initial fee of approximately $100,000 and MRI was entitled to receive a portion of the initial fee paid by new subfranchisees located outside the US. Beginning in 2009, MRI implemented a new pricing structure with an initial fee of approximately $40,000, a total service fee, payable monthly for the first twelve months of operation, totaling $24,000 and a revised royalty rate schedule.
Key Performance Indicators
MRI manages and assesses its performance through various means, with the primary operational and financial measures including weekly job orders, placements and billings, cash collections, royalties, number of franchise offices, franchise sales and renewals, billable hours, revenue, gross profit dollars and gross profit margin and return on net assets.
The number of franchise offices measures MRI’s overall market penetration, franchise sales measure MRI’s ability to expand its market reach and renewals indicate MRI’s ability to maintain, and the franchisees’ satisfaction with, its network.
24
MRI gauges the strength of its franchise sales program by monitoring the number of referrals, sales presentations and sales, closing percentage and the success of the franchisees.
Billable hours and revenue in contract staffing services are significantly influenced by MRI’s performance in successfully expanding these service offerings within the franchise network.
Gross profit dollars and gross profit margin reflect MRI’s ability to improve its franchisees’ permanent placement capabilities, thus increasing royalty payments to MRI. Additionally, gross profit margin reflects MRI’s ability to identify and sell franchise territories to new franchise owners, thus producing franchise sales revenue. In both cases, revenues flow directly through to gross profit dollars and gross profit margin. Revenue from the contract staffing business has associated direct costs included in gross profit dollars and gross profit margin and therefore growth in this business will reduce overall gross profit margin. However, MRI believes the contract staffing offering will create a stronger, more vibrant and profitable franchise business. Within contract staffing, gross profit dollars and gross profit margin can be increased as franchise owners build their staffing and recruiting capabilities to generate higher bill rates for the placement of high level professionals.
Return on net assets (“RONA”) reflects MRI’s ability to generate earnings while optimizing assets deployed in the business. A key metric to drive RONA is Accounts Receivable Days Sales Outstanding (“DSO”). Reduction in DSO will contribute to improvement in RONA.
Results of Operations
The following table presents changes in revenue, cost of services, gross profit, operating and administrative expenses and operating profit for MRI for 2008 and 2007:
| | | | | | | | | | | | | | | | | | | |
| MRI | | | 2008 | | | | 2007 | | |
| Increase
(Decrease) |
|
| (in thousands) | | $ | | % of Total
Revenue | | | $ | | % of Total
Revenue | | | $ | | | % | |
Revenue (1) | | | | | | | | | | | | | | | | | | | |
Staffing services | | $ | 49,444 | | 66.2 | % | | $ | 46,420 | | 59.6 | % | | $ | 3,024 | | | 6.5 | % |
Professional services | | | 25,259 | | 33.8 | | | | 31,530 | | 40.4 | | | | (6,271 | ) | | (19.9 | ) |
| | | | 74,703 | | 100.0 | | | | 77,950 | | 100.0 | | | | (3,247 | ) | | (4.2 | ) |
Cost of services | | | 33,919 | | 45.4 | | | | 32,186 | | 41.3 | | | | 1,733 | | | 5.4 | |
Gross profit | | | 40,784 | | 54.6 | | | | 45,764 | | 58.7 | | | | (4,980 | ) | | (10.9 | ) |
Operating and administrative expenses | | | 30,861 | | 41.3 | | | | 29,989 | | 38.5 | | | | 872 | | | 2.9 | |
Operating profit | | $ | 9,923 | | 13.3 | % | | $ | 15,775 | | 20.2 | % | | $ | (5,852 | ) | | (37.1 | )% |
| (1) | Revenues for 2007 have been reclassified to conform to the current year’s presentation. |
MRI’s revenue decreased in 2008 primarily due to a decline in professional services revenue, reflecting a decline in permanent placements and royalties. The declines, which became morepronounced later in the year, reflect the worldwide economic downturn toward the end of 2008, notably in the finance, construction and retail industries. The decline in professional services revenue was partially offset by growth in staffing services revenue, reflecting growth in the early part of the year, partly offset by weakness in the latter part of the year.
Gross profit dollars decreased primarily due to the decline in higher margin professional services revenue mentioned above. Overall gross profit margin decreased as lower margin contract staffing services revenue increased, while higher margin professional services revenue decreased.
The increase in operating and administrative expenses was primarily due to increased commissions and personnel costs associated with the revenue growth in staffing services, cost containment charges of $0.8 million and a charge of $0.8 million for reserves related to amounts due from MRI Worldwide Network, Limited, a former international master licensee. This was partially offset by cost reduction initiatives implemented toward the end of the year, as well as reduced computer and administrative expenses related to lower franchise sales.
Operating profit declined due to the decrease in gross profit dollars and increase in operating and administrative expense.
CDI AndersElite (“Anders”)
Business Strategy
Anders is focused on providing recruitment services within the UK and Australian construction and infrastructure environment. Anders seeks to deliver these services through the management of an efficient branch office operation that provides customers with qualified contract and permanent professionals. Efficient branch office operations are, in management’s belief, characterized by skilled managers leading production teams of consultants and recruitment assistants to meet customers’ contract and permanent staffing needs. Management believes Anders’ utilization of web-based recruiting is critical to providing it with a large pool of highly qualified candidates and enhances the Company’s ability to filter candidates to meet specific customer needs. Additionally, over time, Anders is looking to capitalize on and develop its international capabilities in order to provide services to its customers who have global requirements and international needs.
The UK infrastructure sector provides opportunities with the rebuilding of the country’s rail system, other government-related projects and private industry-related projects. Anders is pursuing these opportunities by redeploying producers to areas that are expected to grow in spite of the current economic slowdown, specifically the 2012 London Olympics and government spending-backed transportation and infrastructure projects. Additionally, Anders is expanding its capabilities to provide staffing services to national accounts.
25
Anders opened a new office in Australia during the first quarter of 2008, continuing its effort to capitalize on demand in that region. The Australian offices provide a pool of candidates to the UK labor market, in addition to generating business from Australia-based customers.
Key Performance Indicators
Anders relies on various operational and financial metrics to manage its business. Key metrics include direct margin by recruiter and branch office, staff payroll costs as a percentage of gross profit, gross profit pounds and gross profit margin and return on net assets.
Monitoring direct margin by recruiter and branch office enables Anders to focus on increasing productivity, thereby increasing profit margins. Anders also monitors its staff payroll costs as a percentage of gross profit pounds to evaluate recruiter and branch effectiveness. This allows Anders to identify the most efficient branches and to apply the methods used in those branches to improve the performance of its other branches. Monitoring recruiter and branch performance also allows Anders to promote delivery of high levels of service to customers.
Gross profit pounds and gross profit margin reflect Anders’ ability to realize pricing consistent with value provided, to incorporate changes in market demand and to control and pass through direct costs. Gross margin may not increase at the same percentage rate as revenue. Permanent placement revenue has a significant impact on gross margin. Since there are no direct costs associated with permanent placement revenue, increases or decreases in permanent placement revenue can have a disproportionate impact on gross profit margin.
Return on net assets (“RONA”) reflects Anders’ ability to generate earnings while optimizing assets deployed in the business. A key metric to drive RONA is Accounts Receivable Days Sales Outstanding (“DSO”). Reduction in DSO will contribute to improvement in RONA.
Results of Operations
The following table presents changes in revenue, cost of services, gross profit, operating and administrative expenses and operating profit for Anders for 2008 and 2007 in US dollars:
| | | | | | | | | | | | | | | | | | | |
| Anders | | 2008 | | | 2007 | | | Increase
(Decrease) | |
(US dollars in
thousands) | | $ | | % of Total
Revenue | | | $ | | % of Total
Revenue | | | $ | | | % | |
Revenue | | | | | | | | | | | | | | | | | | | |
Staffing services | | $ | 196,132 | | 91.9 | % | | $ | 222,175 | | 87.5 | % | | $ | (26,043 | ) | | (11.7 | )% |
Professional services | | | 17,403 | | 8.1 | | | | 31,747 | | 12.5 | | | | (14,344 | ) | | (45.2 | ) |
| | | | 213,535 | | 100.0 | | | | 253,922 | | 100.0 | | | | (40,387 | ) | | (15.9 | ) |
Cost of services | | | 166,499 | | 78.0 | | | | 186,843 | | 73.6 | | | | (20,344 | ) | | (10.9 | ) |
Gross profit | | | 47,036 | | 22.0 | | | | 67,079 | | 26.4 | | | | (20,043 | ) | | (29.9 | ) |
Operating and administrative expenses | | | 43,119 | | 20.2 | | | | 54,701 | | 21.5 | | | | (11,582 | ) | | (21.2 | ) |
Operating profit | | $ | 3,917 | | 1.8 | % | | $ | 12,378 | | 4.9 | % | | $ | (8,461 | ) | | (68.4 | )% |
To more effectively discuss the comparative results of operations for 2008 and 2007, the following table presents Anders’ results on a local currency basis (i.e., British Pounds—£):
| | | | | | | | | | | | | | | | | |
| Anders | | 2008 | | | 2007 | | | Increase
(Decrease) | |
(British
pounds in
thousands) | | £ | | % of Total
Revenue | | | £ | | % of Total
Revenue | | | £ | | % | |
Revenue | | | | | | | | | | | | | | | | | |
Staffing services | | £ | 105,709 | | 91.9 | % | | £ | 111,188 | | 87.5 | % | | £ (5,479) | | (4.9 | )% |
Professional services | | | 9,379 | | 8.1 | | | | 15,888 | | 12.5 | | | (6,509) | | (41.0 | ) |
| | | | 115,088 | | 100.0 | | | | 127,076 | | 100.0 | | | (11,988) | | (9.4 | ) |
Cost of services | | | 89,737 | | 78.0 | | | | 93,506 | | 73.6 | | | (3,769) | | (4.0 | ) |
Gross profit | | | 25,351 | | 22.0 | | | | 33,570 | | 26.4 | | | (8,219) | | (24.5 | ) |
Operating and administrative expenses | | | 23,241 | | 20.2 | | | | 27,377 | | 21.5 | | | (4,136) | | (15.1 | ) |
Operating profit | | £ | 2,110 | | 1.8 | % | | £ | 6,193 | | 4.9 | % | | £ (4,083) | | (65.9 | )% |
Anders’ professional services revenue decreased in 2008 primarily due to the significant drop in permanent placement hiring as a result of weaker demand in the property development and residential housing construction markets in the UK. The rate of decline in permanent placement revenue increased significantly in the fourth quarter, coinciding with the rapid decline in the construction market in the latter part of the year. The decrease in staffing services revenue occurred primarily in the third and fourth quarters, coinciding with increased declines in the retail and housing construction markets in the UK and declines in construction of new office buildings.
Gross profit pounds and gross profit margin decreased primarily due to a significant decline in higher margin professional services revenue and, to a lesser extent, staffing services volume and lower gross margin.
26
Anders’ operating and administrative expenses decreased primarily due to lower variable compensation, salaries and facilities costs as a result of lower headcount, office consolidation and other cost containment measures.
Operating profit declined due to the significant decrease in gross profit pounds, partially offset by the decrease in operating and administrative expenses.
CDI Information Technology Solutions (“ITS”)
Business Strategy
ITS provides a variety of information technology related services to its customers. These services include staffing, consulting and outsourcing. These service offerings require recruiting and retaining IT talent for contract and permanent IT positions, industry expertise and the ability to determine appropriate solutions for business service needs. ITS’s customers are primarily Fortune 1000 companies with high volume IT requirements and/or the need to augment their own staff on a flexible basis.
The success of ITS’s staffing services is dependent upon maintaining and increasing penetration of its existing customer base, its ability to win new contract awards and the availability and cost of its skilled labor pool. The market demand for ITS’s services is also heavily dependent upon the pace of technology change and the changes in business requirements and practices of its customers. The IT services industry is highly competitive and is subject to strong pricing pressures from customers and competition.
While staffing continues to be a core offering, ITS is focusing its efforts on providing higher value IT outsourcing and consulting services through the development of expertise in five technology areas: quality assurance, application development and maintenance, program management, service desk management and IT security and risk management. This effort to shift the emphasis towards higher value IT services is consistent with CDI’s core business strategy. ITS seeks to provide a full range of integrated IT services to its customers. ITS also seeks to differentiate itself from the competition and optimize the customer’s infrastructure, all while targeting a reduction in overall IT costs and improved service levels.
Key Performance Indicators
ITS manages and assesses its performance through various means, with the primary financial and operational measures including revenue, revenue per sales person, gross profit dollars and gross profit margin, gross margin per hour, recruiter cost per hire, operating profit margin and return on net assets.
Revenue changes reflect performance on both new and existing contracts and accounts. The ITS model is such that increases inrevenue may not result in proportionate changes in operating and administrative costs, thus improving profitability.
Gross profit dollars and gross profit margin reflect ITS’s ability to realize pricing consistent with value provided, to incorporate changes in market demand and to control and pass through direct costs. It is also an indication of ITS’s ability to shift the mix of business to higher margin service offerings.
Return on net assets (“RONA”) reflects ITS’s ability to generate earnings while optimizing assets deployed in the business. A key metric to drive RONA is Accounts Receivable Days Sales Outstanding (“DSO”). Reduction in DSO will contribute to improvement in RONA.
Results of Operations
The following table presents changes in revenue by category, cost of services, gross profit, operating and administrative expenses, and operating profit for ITS for 2008 and 2007:
| | | | | | | | | | | | | | | | | | | |
| ITS | | 2008 | | | 2007 (1) | | | Increase
(Decrease) | |
| (in thousands) | | $ | | % of Total
Revenue | | | $ | | % of Total
Revenue | | | $ | | | % | |
Revenue | | | | | | | | | | | | | | | | | | | |
Staffing services | | $ | 199,761 | | 88.0 | % | | $ | 213,433 | | 88.6 | % | | $ | (13,672 | ) | | (6.4 | )% |
Project outsourcing services | | | 26,621 | | 11.7 | | | | 26,440 | | 11.0 | | | | 181 | | | 0.7 | |
Professional services | | | 754 | | 0.3 | | | | 1,032 | | 0.4 | | | | (278 | ) | | (26.9 | ) |
| | | | 227,136 | | 100.0 | | | | 240,905 | | 100.0 | | | | (13,769 | ) | | (5.7 | ) |
Cost of services | | | 185,251 | | 81.6 | | | | 196,295 | | 81.5 | | | | (11,044 | ) | | (5.6 | ) |
Gross profit | | | 41,885 | | 18.4 | | | | 44,610 | | 18.5 | | | | (2,725 | ) | | (6.1 | ) |
Operating and administrative expenses | | | 39,565 | | 17.4 | | | | 41,497 | | 17.2 | | | | (1,932 | ) | | (4.7 | ) |
Operating profit | | $ | 2,320 | | 1.0 | % | | $ | 3,113 | | 1.3 | % | | $ | (793 | ) | | (25.5 | )% |
| (1) | Revenues and expenses for 2007 have been reclassified to conform to the current year’s presentation. See Note 21—Reporting Segments in the notes to the consolidated financial statements. |
ITS’s revenue decreased in 2008 primarily due to the decrease in staffing services revenue as a result of reduced demand in the automotive sector.
ITS’s gross profit dollars decreased primarily due to a reduction in staffing services revenue and costs related to a major account expansion. Gross profit margin remained relatively flat, as the Company was able to successfully meet customer pricing pressures through lowering direct costs.
ITS’s operating and administrative expenses decreased primarily due to cost control initiatives implemented during 2008, partially offset by increased compensation costs associated with an investment in sales personnel toward the end of the year.
27
Operating profit declined more significantly than gross profit dollars due to the inability to reduce infrastructure costs as rapidly as the decline in gross profit dollars.
Corporate
Corporate expenses totaled $18.3 million for 2008 as compared to $19.9 million for 2007. The decrease of $1.6 million was primarily due to lower variable compensation costs and cost containment measures.
Consolidated Results of Operations
2007 versus 2006
Results of Operations
The following table presents revenue by service type along with several key metrics (in percentages) for 2007 and 2006:
| | | | | | | | | | | | | | | | | | | | |
| Consolidated | | 2007 | | | 2006 | | | Increase (Decrease) | |
| (in thousands) | | $ | | | % of Total
Revenue | | | $ | | | % of Total
Revenue | | | $ | | % | |
Revenue (1) | | | | | | | | | | | | | | | | | | | | |
Staffing services | | $ | 789,460 | | | 66.5 | % | | $ | 753,069 | | | 67.7 | % | | $ | 36,391 | | 4.8 | % |
Project outsourcing services | | | 323,823 | | | 27.3 | | | | 299,872 | | | 26.9 | | | | 23,951 | | 8.0 | |
Professional services (1) | | | 74,016 | | | 6.2 | | | | 60,476 | | | 5.4 | | | | 13,540 | | 22.4 | |
| | | $ | 1,187,299 | | | 100.0 | % | | $ | 1,113,417 | | | 100.0 | % | | $ | 73,882 | | 6.6 | % |
Gross profit | | $ | 286,940 | | | 24.2 | % | | $ | 258,059 | | | 23.2 | % | | $ | 28,881 | | 11.2 | % |
Operating and administrative expenses | | | 240,104 | | | 20.2 | | | | 225,000 | | | 20.2 | | | | 15,104 | | 6.7 | |
Operating profit | | | 46,836 | | | 3.9 | | | | 33,059 | | | 3.0 | | | | 13,777 | | 41.7 | |
Net earnings from continuing operations | | $ | 31,828 | | | 2.7 | % | | $ | 20,752 | | | 1.9 | % | | $ | 11,076 | | 53.4 | % |
Cash and cash equivalents | | $ | 127,059 | | | | | | $ | 33,551 | | | | | | $ | 93,508 | | 278.7 | |
Cash flow provided by operations | | $ | 56,819 | | | | | | $ | 38,818 | | | | | | $ | 18,001 | | 46.4 | % |
Effective income tax rate | | | 35.2 | % | | | | | | 36.1 | % | | | | | | | | | |
After-tax return on shareholders’ equity (2) | | | 10.0 | % | | | | | | 7.3 | % | | | | | | | | | |
Pre-tax return on net assets (3) | | | 23.4 | % | | | | | | 14.9 | % | | | | | | | | | |
Variable contribution margin (4) | | | 18.6 | % | | | | | | 10.7 | % | | | | | | | | | |
| (1) | Revenue for 2006 and 2007 has been reclassified to conform to the current year’s presentation. |
| (2) | The year’s earnings divided by the average shareholders’ equity. |
| (3) | Pre-tax earnings for the year, divided by the average net assets at the beginning and end of the year. Net assets include total assets minus total liabilities excluding cash and income tax accounts. |
| (4) | Year-over-year change in operating profit from continuing operations divided by year-over-year change in revenue from continuing operations. |
Revenue by service type includes the following:
| | Ÿ | | Staffing services - Staffing services include assigning the Company’s skilled engineering, information technology, project management, architecture, construction and other professionals to work at a customer’s location under the supervision of customer personnel on a contractual basis for assignments that could range from several months to over one year. The Company also provides managed staffing services where the Company assumes overall management of a customer’s contract staffing functions. All of the Company’s four business segments provide customers with staffing services. |
| | Ÿ | | Project outsourcing services - Project outsourcing services include engineering and information technology projects, usually performed at a CDI facility, which provide a deliverable work product or service to the customer. These services are performed in the Company’s ES and ITS segments. |
| | Ÿ | | Professional services - Professional services include search, recruitment and permanent placement of technical, professional and managerial personnel; sales of new franchises; and services provided to franchisees to help them generate permanent placements. All of the Company’s four business segments provide customers with professional services. |
Revenue increased primarily due to strong capital spending which drove increased demand for engineering project outsourcing services in the oil and gas, alternative energy and defense industries, as well as in the construction industries in the UK and Australia.
Gross profit margins increased as a result of growth in higher margin project outsourcing services in ES and permanent placement services revenue in ES and Anders.
Consolidated operating and administrative expenses increased primarily due to higher staff salaries and incentive-based and
28
stock-based compensation, largely driven by the improved financial performance discussed above. Partially offsetting these expense increases was the reversal of a legal accrual of $1.6 million in the first quarter of 2007.
Operating profit grew 41.7% and operating profit margin increased from 3.0% to 3.9%, demonstrating progress towards the Company’s goal of a 5% operating profit margin. VCM of 18.6%, or 13.9% when adjusted for certain previously disclosed pre-tax adjustments to earnings, was at the upper end of the Company’s target range of 12-14%. The increase in VCM was primarily due to the shift in mix to higher value, higher margin, longer cycle business, which led to margins growing faster than expenses.
The Company’s effective income tax rate was 35.2% and 36.1% for the years ended December 31, 2007 and 2006, respectively. The rate in 2007 was favorably impacted by investments in tax-exempt instruments and a higher proportion of foreign earnings taxed at lower rates, while the rate in 2006 was unfavorably impacted by an increase in the valuation allowance recorded against certain deferred tax assets.
Cash and cash equivalents increased from $33.6 million in 2006 to $127.1 million in 2007. During 2007, the Company generated $56.8 million in cash from operating activities from continuing operations as compared to $38.8 million in 2006. The 2007 increase in operating cash flow versus 2006 was primarily due to higher earnings of $10.9 million and improvements in accounts receivable collections. During 2007, the Company generated $34.4 million in cash from investing activities from continuing operations as compared to $12.9 million cash used in investing activities from continuing operations in 2006. The 2007 increase in cash provided by investing activities from continuing operations versus 2006 was primarily due to $39.8 million from the sale of Todays, partially offset by capital spending of $7.8 million.
Segment Discussion
Effective January 1, 2007, the Company began separately reporting the ES and ITS segments. These operations were previously reported within the Business Solutions segment.
CDI Engineering Solutions (“ES”)
Results of Operations
The following table presents changes in revenue by category, cost of services, gross profit, operating and administrative expenses and operating profit for ES for 2007 and 2006:
| | | | | | | | | | | | | | | | | | |
| ES | | 2007 (1) | | | 2006 (1) | | | Increase
(Decrease) | |
| (in thousands) | | $ | | % of Total
Revenue | | | $ | | % of Total
Revenue | | | $ | | % | |
Revenue | | | | | | | | | | | | | | | | | | |
Staffing services | | $ | 307,433 | | 50.0 | % | | $ | 285,453 | | 51.4 | % | | $ | 21,980 | | 7.7 | % |
Project outsourcing services | | | 297,383 | | 48.4 | | | | 266,346 | | 48.0 | | | | 31,037 | | 11.7 | |
Professional services | | | 9,706 | | 1.6 | | | | 3,292 | | 0.6 | | | | 6,414 | | 194.8 | |
| | | | 614,522 | | 100.0 | | | | 555,091 | | 100.0 | | | | 59,431 | | 10.7 | |
Cost of services | | | 485,035 | | 78.9 | | | | 447,689 | | 80.7 | | | | 37,346 | | 8.3 | |
Gross profit | | | 129,487 | | 21.1 | | | | 107,402 | | 19.3 | | | | 22,085 | | 20.6 | |
Operating and administrative expenses | | | 93,979 | | 15.3 | | | | 84,928 | | 15.3 | | | | 9,051 | | 10.7 | |
Operating profit | | $ | 35,508 | | 5.8 | % | | $ | 22,474 | | 4.0 | % | | $ | 13,034 | | 58.0 | % |
| (1) | Revenues and expenses for 2007 and 2006 have been reclassified to conform to the current year’s presentation. See Note 21—Reporting Segments in the notes to the consolidated financial statements. |
ES’s revenue increased in 2007, largely due to:
| | Ÿ | | Increased capital spending by major customers, especially within project outsourcing; |
| | Ÿ | | Average bill rate increases, reflecting the Company’s ability to pass on higher labor costs to its customers; and |
| | Ÿ | | Increased permanent placement revenue primarily from PRO services in the P&I vertical. |
Gross profit dollars increased due to volume increases in the P&I and Government Services verticals, offset by a decrease in Aerospace volume.
Gross profit margins increased primarily due to:
| | Ÿ | | An improved mix of higher margin, longer cycle project outsourcing in the P&I and Government Services verticals and an increase in higher margin permanent placement (“PRO” services) revenue in the P&I vertical; and |
| | Ÿ | | Decline in lower margin technical staffing revenue within the Aerospace vertical. |
ES’s operating and administrative expenses increased in 2007 primarily due to:
| | Ÿ | | Higher staff salaries and incentive-based compensation associated with the increase in sales volume and profit, primarily in the P&I vertical; |
29
| | Ÿ | | Start-up costs of $0.6 million in early 2007 associated with an account win; and |
| | Ÿ | | Increased computer and facilities costs within the P&I vertical associated with the increase in revenue. |
These increases were partially offset by the reversal of a legal accrual of $1.6 million in the first quarter of 2007.
The following table presents changes in revenue from each of ES’s verticals for 2007 and 2006:
| | | | | | | | | | | | | | | | | | | |
| ES | | 2007 | | | 2006 | | | Increase
(Decrease) | |
| (in thousands) | | $ | | % of Total
Revenue | | | $ | | % of Total
Revenue | | | $ | | | % | |
Revenue (1) | | | | | | | | | | | | | | | | | | | |
CDI-P & I | | $ | 474,982 | | 77.3 | % | | $ | 412,451 | | 74.3 | % | | $ | 62,531 | | | 15.2 | % |
CDI-Government Services | | | 70,035 | | 11.4 | | | | 57,988 | | 10.4 | | | | 12,047 | | | 20.8 | |
CDI-Aerospace | | | 69,505 | | 11.3 | | | | 84,652 | | 15.3 | | | | (15,147 | ) | | (17.9 | ) |
| | | $ | 614,522 | | 100.0 | % | | $ | 555,091 | | 100.0 | % | | $ | 59,431 | | | 10.7 | % |
| (1) | Revenues for 2007 and 2006 have been reclassified to conform to the current year’s presentation. |
The P&I vertical provides a full range of engineering, project management, design, professional staffing and outsourcing solutions to firms in oil, gas, refining, alternative energy, power generation and energy transmission, nuclear, chemicals and heavy manufacturing industries. Typically, these customers are large, multi-national companies that use multiple service providers. Contracts are awarded based on the ability to meet the specific requirements of each individual project. Effective in the second quarter of 2008, the Life Sciences vertical was incorporated into the P&I vertical. The Life Sciences projects within the P&I vertical include facility design, project management, engineering, professional staffing and facility start-up services to customers in the pharmaceutical, bio-pharmaceutical and regulated medical services industries. The increase in revenue within this vertical was largely attributable to strong capital spending by customers within the process sector, and to a lesser extent, within the industrial sector, resulting in both new account wins and a ramp-up of existing accounts. Two significant account wins, late in the third quarter of 2007 in the alternative energy industry contributed to revenue growth in the fourth quarter. Increases in permanent placement revenue were realized primarily as a result of PRO services and to a lesser extent increased volumes in Canada.
The Government Services vertical focuses on providing engineering, design and logistics services to the defense industry, particularly in marine design, systems development and military aviation support. Revenue increases within this vertical in 2007 were driven primarily by renewed US federal government funding of a major US Navy shipbuilding and ship design contract, as well as increased revenue from a major national staffing contract.
The Aerospace vertical provides a full range of engineering, design, project management, professional engineering staffing and outsourcing solutions to both the commercial and military aerospace markets. Revenue within the Aerospace vertical decreased in 2007, primarily as a result of exiting certain lower margin domestic technical staffing businesses and project delays by an international customer.
Management Recruiters International (“MRI”)
Results of Operations
The following table presents changes in revenue, cost of services, gross profit, operating and administrative expenses and operating profit for MRI for 2007 and 2006:
| | | | | | | | | | | | | | | | | | | |
| MRI | | 2007 | | | 2006 | | | Increase
(Decrease) | |
| (in thousands) | | $ | | % of Total
Revenue | | | $ | | % of Total
Revenue | | | $ | | | % | |
Revenue (1) | | | | | | | | | | | | | | | | | | | |
Staffing services | | $ | 46,420 | | 59.6 | % | | $ | 35,308 | | 52.3 | % | | $ | 11,112 | | | 31.5 | % |
Professional services | | | 31,530 | | 40.4 | | | | 32,166 | | 47.7 | | | | (636 | ) | | (2.0 | ) |
| | | | 77,950 | | 100.0 | | | | 67,474 | | 100.0 | | | | 10,476 | | | 15.5 | |
Cost of services | | | 32,186 | | 41.3 | | | | 25,033 | | 37.1 | | | | 7,153 | | | 28.6 | |
Gross profit | | | 45,764 | | 58.7 | | | | 42,441 | | 62.9 | | | | 3,323 | | | 7.8 | |
Operating and administrative expenses | | | 29,989 | | 38.5 | | | | 27,831 | | 41.2 | | | | 2,158 | | | 7.8 | |
Operating profit | | $ | 15,775 | | 20.2 | % | | $ | 14,610 | | 21.7 | % | | $ | 1,165 | | | 8.0 | % |
| (1) | Revenues for 2007 and 2006 have been reclassified to conform to the current year’s presentation. |
MRI’s revenue increased in 2007 as a result of higher contract staffing services revenue, reflecting placements of higher level professionals at higher average bill rates. Professional services revenue decreased slightly reflecting the impact of the 2006 sale of the master franchise license, which lowered royalty revenue partially offset by increased sales of domestic franchises of $0.4 million.
Gross profit dollars increased due to the sales growth mentioned above. Overall gross profit margin decreased as lower margin contract staffing services revenue grew significantly while higher margin professional services revenue decreased slightly.
The increase in operating and administrative expenses was largely due to:
| | Ÿ | | Sales commissions associated with the revenue growth in staffing services; and |
| | Ÿ | | Variable expenses related to incremental franchise sales. |
This increase was partially offset by the absence of impairment charges of $0.6 million recorded in 2006, related to declines in the fair value of an asset held for sale, severance charges of $0.4 million recorded in the third quarter of 2006, and lower
30
office and facility expenses associated with the sale of the international master franchise in April 2006.
CDI AndersElite (“Anders”)
Results of Operations
The following table presents changes in revenue, cost of services, gross profit, operating and administrative expenses and operating profit for Anders for 2007 and 2006 in US dollars:
| | | | | | | | | | | | | | | | | | |
| Anders | | 2007 | | | 2006 | | | Increase
(Decrease) | |
(US dollars in
thousands) | | $ | | % of Total
Revenue | | | $ | | % of Total
Revenue | | | $ | | % | |
Revenue | | | | | | | | | | | | | | | | | | |
Staffing services | | $ | 222,175 | | 87.5 | % | | $ | 193,053 | | 88.9 | % | | $ | 29,122 | | 15.1 | % |
Professional services | | | 31,747 | | 12.5 | | | | 24,135 | | 11.1 | | | | 7,612 | | 31.5 | |
| | | | 253,922 | | 100.0 | | | | 217,188 | | 100.0 | | | | 36,734 | | 16.9 | |
Cost of services | | | 186,843 | | 73.6 | | | | 161,511 | | 74.4 | | | | 25,332 | | 15.7 | |
Gross profit | | | 67,079 | | 26.4 | | | | 55,677 | | 25.6 | | | | 11,402 | | 20.5 | |
Operating and administrative expenses | | | 54,701 | | 21.5 | | | | 48,005 | | 22.1 | | | | 6,696 | | 13.9 | |
Operating profit | | $ | 12,378 | | 4.9 | % | | $ | 7,672 | | 3.5 | % | | $ | 4,706 | | 61.3 | % |
To more effectively discuss the comparative results of operations for 2007 and 2006, the following table presents Anders’ results on a local currency basis (i.e., British Pounds—£):
| | | | | | | | | | | | | | | | | | |
| Anders | | 2007 | | | 2006 | | | Increase
(Decrease) | |
(British pounds in
thousands) | | £ | | % of Total
Revenue | | | £ | | % of Total
Revenue | | | £ | | % | |
Revenue | | | | | | | | | | | | | | | | | | |
Staffing services | | £ | 111,188 | | 87.5 | % | | £ | 105,237 | | 88.9 | % | | £ | 5,951 | | 5.7 | % |
Professional services | | | 15,888 | | 12.5 | | | | 13,156 | | 11.1 | | | | 2,732 | | 20.8 | |
| | | | 127,076 | | 100.0 | | | | 118,393 | | 100.0 | | | | 8,683 | | 7.3 | |
Cost of services | | | 93,506 | | 73.6 | | | | 88,041 | | 74.4 | | | | 5,465 | | 6.2 | |
Gross profit | | | 33,570 | | 26.4 | | | | 30,352 | | 25.6 | | | | 3,218 | | 10.6 | |
Operating and administrative expenses | | | 27,377 | | 21.5 | | | | 26,178 | | 22.1 | | | | 1,199 | | 4.6 | |
Operating profit | | £ | 6,193 | | 4.9 | % | | £ | 4,174 | | 3.5 | % | | £ | 2,019 | | 48.4 | % |
The increase in revenue was primarily due to:
| | Ÿ | | Strong capital spending on infrastructure, which continued to drive demand for both staffing and permanent placement services; and |
| | Ÿ | | Increased productivity among recruiting and sales personnel due to increased support to key producers. |
Gross profit dollars increased due to the sales growth and improved productivity mentioned above.
Gross profit margins increased primarily due to:
| | Ÿ | | More rapid growth in higher margin permanent placement revenue than lower margin staffing services in the UK and growth in permanent placement revenue in Australia; and |
| | Ÿ | | Average permanent placement fee increase of approximately 11%. |
Anders’ operating and administrative expenses increase was largely due to higher staff salaries and incremental incentive-based compensation of £2.0 million associated with the increase in sales volume, partially offset by lower advertising and marketing expenses of £0.3 million.
CDI Information Technology Solutions (“ITS”)
Results of Operations
The following table presents changes in revenue by category, cost of services, gross profit, operating and administrative expenses, and operating profit for ITS for 2007 and 2006:
| | | | | | | | | | | | | | | | | | | |
| ITS | | 2007 (1) | | | 2006 (1) | | | Increase
(Decrease) | |
| (in thousands) | | $ | | % of Total
Revenue | | | $ | | % of Total
Revenue | | | $ | | | % | |
Revenue | | | | | | | | | | | | | | | | | | | |
Staffing services | | $ | 213,433 | | 88.6 | % | | $ | 239,255 | | 87.4 | % | | $ | (25,822 | ) | | (10.8 | )% |
Project outsourcing | | | 26,440 | | 11.0 | | | | 33,526 | | 12.3 | | | | (7,086 | ) | | (21.1 | ) |
Professional services | | | 1,032 | | 0.4 | | | | 883 | | 0.3 | | | | 149 | | | 16.9 | |
| | | | 240,905 | | 100.0 | | | | 273,664 | | 100.0 | | | | (32,759 | ) | | (12.0 | ) |
Cost of services | | | 196,295 | | 81.5 | | | | 221,125 | | 80.8 | | | | (24,830 | ) | | (11.2 | ) |
Gross profit | | | 44,610 | | 18.5 | | | | 52,539 | | 19.2 | | | | (7,929 | ) | | (15.1 | ) |
Operating and administrative expenses | | | 41,497 | | 17.2 | | | | 46,095 | | 16.8 | | | | (4,598 | ) | | (10.0 | ) |
Operating profit | | $ | 3,113 | | 1.3 | % | | $ | 6,444 | | 2.4 | % | | $ | (3,331 | ) | | (51.7 | )% |
| (1) | Revenues and expenses for 2007 and 2006 have been reclassified to conform to the current year’s presentation. See Note 21—Reporting Segments in the notes to the consolidated financial statements. |
ITS’s revenue decreased from the prior year primarily due to staffing cutbacks by the major IT alliance account, the termination of an outsourcing contract, as well as continued competitive pricing pressures within the staffing services marketplace.
ITS’s gross profit dollars decreased due to a reduction in staffing services and outsourcing. Gross profit margin declined due to the reduction in outsourcing revenue and pricing pressures experienced within staffing services.
31
ITS’s operating and administrative expenses decreased primarily due to headcount reduction and other cost control initiatives implemented throughout 2006 and 2007.
Corporate
Corporate expenses increased $1.8 million for a total of $19.9 million for 2007, as compared to $18.1 million for 2006. These increases were primarily due to variable compensation costs as well as higher stock-based compensation expenses, partially offset by reductions in consulting fees, audit fees and compliance costs related to the Sarbanes-Oxley Act of 2002.
Inflation
During the years ended December 31, 2008, 2007 and 2006, general inflation has been low and the net effect of inflation on the Company’s operations has not been material.
Liquidity and Capital Resources
CDI finances its business primarily through cash provided by operations. At December 31, 2008, the Company’s principal sources of liquidity consisted of $61.8 million of cash and cash equivalents and a $45.0 million committed, unsecured credit facility. CDI generates the majority of its revenues and resultant cash flows from several activities, as outlined below:
| | Ÿ | | Project management, technical engineering, and information technology outsourcing services; |
| | Ÿ | | Temporary staffing services; |
| | Ÿ | | Permanent placement services; and |
| | Ÿ | | Initial franchise fees and ongoing franchise royalties. |
Payrolls for the majority of billable employees are typically paid weekly and revenues for temporary staffing are recognized coincident with the payroll cycle as services are provided. This schedule applies to the majority of CDI’s technical engineering business as well. Customers are invoiced weekly, bi-weekly, or monthly for staffing services. Projects under fixed-price contracts are invoiced when specific milestones are met or based on a periodic billing schedule. Customers are typically invoiced for project management, engineering and outsourcing services contracts on a weekly or monthly basis. MRI generates revenues and cash flows from the collection of royalties as its franchisees collect cash from their customers for permanent placement services and from franchise sales.
The Company’s cash needs increased as a result of business expansion during the early part of 2006. The Company utilized its uncommitted, unsecured line of credit with a bank to meet these cash requirements. During 2006, the Company’s outstanding borrowings ranged from $0.1 million to $16.0 million. Later in 2006, the Company generated sufficient cash flow from operations to fund its operations and pay down its line of credit. At December 31, 2006, there were no outstanding borrowings under this $35.0 million facility which expired on February 28, 2007.
On February 28, 2007, the Company established a committed, unsecured credit agreement which provides for a revolving credit facility of up to $45.0 million. On February 27, 2008, and again on November 10, 2008, the Company renewed its credit agreement with JP Morgan Chase Bank, N.A. The credit agreement provides the Company with a committed, unsecured $45.0 million revolving credit facility and extends the term of the credit facility to November 9, 2009. At December 31, 2008 and 2007, there were no outstanding borrowings under this $45.0 million facility. Additionally, the Company has a $10.2 million uncommitted, demand unsecured line of credit with Brown Brothers Harriman & Co., under which the bank issues, at its sole discretion, standby letters of credit to the Company. At December 31, 2008, the Company had $6.8 million of outstanding letters of credit issued against this line of credit. See Note 7—Short-Term Borrowings, in the notes to the consolidated financial statements, for further information.
On February 26, 2008, CDI’s Board of Directors approved the repurchase of up to $50 million of the Company’s outstanding common stock. Repurchases have been and may be made from time to time depending upon the Company’s share price and other relevant factors. Repurchases have been and may be made in the open market or through privately negotiated transactions. The Company is not required to repurchase any specific number of shares, and the Company may terminate the repurchase program at any time. The Company repurchased 1,489,469 shares for $30.0 million in cash during 2008. As of December 31, 2008, approximately $20.0 million remains authorized for repurchase of shares.
The following table summarizes the major cash flow categories from the Company’s consolidated statements of cash flows from continuing operations:
| | | | | | | | | | | | |
| (in thousands) | | 2008 | | | 2007 | | | 2006 | |
Operating Activities | | $ | 14,791 | | | $ | 56,819 | | | $ | 38,818 | |
Investing Activities | | | (33,163 | ) | | | 34,401 | | | | (12,888 | ) |
Financing Activities | | | (39,257 | ) | | | (5,540 | ) | | | (8,826 | ) |
Operating Activities
During 2008, the Company generated $14.8 million in net cash from operating activities as compared to $56.8 million in 2007 and $38.8 million in 2006. Cash provided by operating activities was driven mostly by earnings and partially offset by working capital requirements. Operating cash flow for 2008 was below that for the prior year by $42.0 million, primarily due to lower earnings and higher working capital requirements of $37.4 million, reflecting decreases in accrued expenses and accounts payable, as well as a smaller decrease in accounts receivable year over year. Exchange rate fluctuations materially and negatively impacted net cash provided by operating activities and the Company’s cash balance in 2008 as compared to 2007 primarily related to the Company’s operations denominated in British pounds sterling and Canadian dollars.
32
The 2007 increase in operating cash flow versus 2006 was primarily due to higher earnings of $11.1 million and improvements in accounts receivable collections.
Investing Activities
The Company’s investing activities during 2008 consisted primarily of the purchase of the TK Engineering business, purchases of property and equipment and investments in a new joint venture and trademarks. On July 28, 2008, the Company purchased the TK Engineering business for $17.6 million in cash. During 2008, capital expenditures totaled $10.1 million, as compared to $7.8 million in 2007. The increase in capital spending was primarily due to capital expenditures for software acquisitions in ES’s Aerospace vertical, for recruitment and financial systems related technology projects, additional leasehold improvements and furniture. Additionally, the Company invested $4.1 million in a joint venture called CDI Gulf International (“CGI”) and $1.7 million in trademarks in its MRI segment.
The Company’s investing activities during 2007 consisted primarily of net proceeds of $39.8 million from the sale of the Todays business segment and proceeds of $2.3 million from the sale of an MRI asset, partially offset by capital expenditures of $7.8 million. The 2007 capital expenditures were primarily for computer hardware and software to support the growth in engineering services in the P&I vertical and continued development of new recruiting software to support the ES and ITS segments.
The Company’s investing activities during 2006 consisted primarily of capital expenditures of $12.9 million reflecting investments in equipment at certain engineering centers and leasehold improvements and the implementation of a new franchise reporting system for MRI.
Financing Activities
Net cash used in financing activities of $39.3 million increased by $33.7 million during 2008, as compared to 2007. The Company repurchased 1,489,469 shares of its common stock for $30.0 million in cash during 2008. The Company paid shareholders dividends totaling $10.3 million and $9.3 million during 2008 and 2007, respectively. The declaration and payment of future dividends will be at the discretion of the Company’s Board of Directors and will depend upon many factors including the Company’s earnings, financial condition and capital requirements. In addition, the Company received $0.1 million of proceeds from exercises of employee stock options during 2008 as compared to $5.7 million received in 2007.
Net cash used by financing activities was $5.5 million during 2007, as compared to $8.8 million in 2006. The Company paid shareholders dividends totaling $9.3 million and $8.8 million during 2007 and 2006, respectively. The Company received $5.7 million in proceeds from stock options exercised during 2007 as compared to $2.6 million received during the same period in 2006. The level of cash overdrafts decreased by $1.5 million as compared to the same period in 2006, principally dueto timing of payments. In addition, in 2007, the Company paid $1.4 million to satisfy the outstanding mortgage on an MRI asset held for sale.
Summary
The Company’s business model is expected to generate positive cash flow over the business cycle. However, changes in level of business activity, and to a lesser extent, seasonality, do impact working capital needs and cash flow. In addition, the weakening global economy has and could continue to cause delays in customer payments which could lead to a slower collections process, causing a temporary decline in operating cash flow. Management believes that the Company’s current funds, funds generated from operations and funds available under its short-term credit facility will be sufficient to support currently anticipated working capital, capital expenditures, shareholder dividends, stock repurchases and potential strategic acquisitions. Should the Company require additional funds in the future, management believes that it will be able to obtain these funds at competitive rates.
Contractual Obligations and Commitments
The following table summarizes the Company’s outstanding contractual obligations and commitments as of December 31, 2008 (in thousands):
| | | | | | | | | | | | | | | |
| | | Total | | Less than 1 Year | | 1-3
Years | | 4-5
Years | | More
than 5
Years |
Operating lease commitments (1) | | $ | 47,199 | | $ | 11,645 | | $ | 18,949 | | $ | 11,099 | | $ | 5,506 |
Letters of credit (2) | | | 6,837 | | | 6,837 | | | - | | | - | | | - |
Purchase obligations (3) | | | 10,626 | | | 5,235 | | | 5,059 | | | 332 | | | - |
Total | | $ | 64,662 | | $ | 23,717 | | $ | 24,008 | | $ | 11,431 | | $ | 5,506 |
| (1) | Represents future minimum rental commitments under non-cancelable leases. The Company expects to fund these commitments with existing cash and cash flows from operations. |
| (2) | Represents primarily letters of credit issued through major domestic banks as required by certain insurance carriers in connection with the Company’s workers’ compensation plan. |
| (3) | Purchase obligations consist primarily of normal and customary technology maintenance and on-line job posting and search services contracts. The Company expects to fund these commitments with existing cash and cash flows from operations (Note 17—Lease Commitments and Other Contractual Obligations, in the notes to the consolidated financial statements). |
Critical Accounting Policies and Estimates
The consolidated financial statements contained in this report were prepared in accordance with accounting principles generally accepted in the United States of America, which require management to make estimates and assumptions that affect the reported amounts of assets, liabilities, revenues, and expenses, and the disclosure of contingencies. Certain accounting policies, methods and estimates are particularly sensitive because of their significance to the consolidated financial statements and because of the possibility that future events affecting them may differ from current judgments. While there
33
are a number of accounting policies, methods and estimates that affect the consolidated financial statements as described in Note 1—Significant Accounting Policies, in the notes to the consolidated financial statements, areas that are particularly significant are discussed below.
Allowance for Doubtful Accounts
The Company makes ongoing estimates related to the collectability of its accounts receivable and maintains an allowance for estimated losses resulting from the inability of its customers to make required payments. Estimates used in determining accounts receivable allowances are based on specific customer account reviews, historical experience of credit losses and application of percentages to certain aged receivable categories. The Company also applies judgment, including assessments about changes in economic conditions, concentration of receivables among customers and industries, recent write-off trends, rates of bankruptcy, and credit quality of specific customers. Unanticipated changes in the financial condition of customers, the resolution of various disputes, or significant changes in the economy could impact the reserves required. At December 31, 2008 and 2007, the allowance for doubtful accounts was $6.6 million and $3.0 million, respectively.
Income Taxes
The Company makes judgments and interpretations based on enacted tax laws, published tax guidance, as well as estimates of future earnings. These judgments and interpretations affect the provision for income taxes, deferred tax assets and liabilities and the valuation allowance. As of December 31, 2008, the Company had total net deferred tax assets of $12.9 million. This includes $4.0 million (net of valuation allowance) which relates primarily to state net operating loss carryforwards and capital loss carryforwards. The deferred tax assets were evaluated under the guidelines of Statement of Financial Accounting Standards (“SFAS”) No. 109,Accounting for Income Taxes(“SFAS No. 109”), and a determination on the basis of objective factors was made that it is more likely than not that the net assets will be realized through future years’ taxable income. In the event that actual results differ from these estimates and assessments, additional valuation allowances may be required. Effective January 1, 2007, the Company adopted the provisions of FASB Interpretation No. 48,Accounting for Uncertainty in Income Taxes (“FIN 48”), an interpretation of SFAS No. 109. (See Note 13—Income Taxes, in the notes to the consolidated financial statements).
Goodwill and Other Intangible Assets
Goodwill arising from acquisitions is not amortized but is instead tested for impairment at the reporting unit level at least annually in accordance with the provisions of SFAS No. 142,Goodwill and Other Intangible Assets (“SFAS No. 142”). SFAS No. 142 requires an annual impairment test for goodwill and intangible assets with indefinite lives.
Under the provisions of SFAS No. 142, the first step of the impairment test requires that the Company determine the fair value of each reporting unit and compare the fair value to the reporting unit’s carrying amount. The Company uses a dual approach to determine the fair value of its reporting units. The Company first uses the income approach, which is based on the present value of discounted cash flows and terminal value projected for each reporting unit. The income approach requires significant judgments, including the projected results of operations, the weighted average cost of capital (“WACC”) used to discount the cash flows and terminal value assumptions. The WACC is determined based on the Company’s capital structure, cost of capital, inherent business risk profile and long-term growth expectations, as reflected in the terminal value. The Company uses peer group market multiples to validate the reasonableness of the fair values as determined using the income approach.
Additionally, the Company corroborates the reasonableness of the total fair value of the reporting units by reconciling the aggregate fair values of the reporting units to the Company’s total market capitalization adjusted to include an estimated control premium. The estimated control premium is based on reviewing observable transactions involving the purchase of controlling interests in comparable companies. In developing the market capitalization, the Company may, depending on the volatility of the market value of its stock price, use either the stock price on the valuation date or the average stock price over a range of dates around the valuation date.
The second step under the provisions of SFAS No. 142 is contingent upon the results of the first step. To the extent a reporting unit’s carrying amount exceeds its fair value, an indication exists that the reporting unit’s goodwill or intangible assets may be impaired and the Company must perform a second more detailed impairment assessment. The second impairment assessment involves allocating the reporting unit’s fair value to all of its recognized and unrecognized assets and liabilities in order to determine the implied fair value of the reporting unit’s goodwill and intangible assets as of the assessment date. The implied fair value of the reporting unit’s goodwill and other intangible assets is then compared to the carrying amount of goodwill and other intangible assets to quantify an impairment charge as of the assessment date.
Changes in future market conditions, the Company’s business strategy, or other factors could impact upon the future values of the Company’s reporting units, which could result in future impairment charges. At December 31, 2008, total goodwill amounted to $49.5 million. As described in Note 6—Goodwill and Other Intangible Assets, in the notes to the consolidated financial statements, the Company performed an interim impairment analysis as of December 31, 2008 and determined that there was no impairment. Should the deterioration in the general business environment, instability of the credit markets and decline in the Company’s stock price continue, it is possible
34
that the Company could have goodwill impairment in future periods.
Other intangible assets arising from acquisitions that are determined to have a definite useful life are amortized straight-line over the useful life of the asset. Other intangible assets determined to have an indefinite useful life are tested for impairment as part of the Company’s annual SFAS No. 142 impairment assessment. When significant intangible assets are acquired, an independent third party valuation firm is engaged to assist in determining the fair value of the assets as of the acquisition date. At December 31, 2008, other intangible assets amounted to $10.0 million, net of accumulated amortization.
Workers’ Compensation
The Company has a combination of insurance contracts and self-insurance under which the Company generally bears the first $250,000 of risk per single accident for workers’ compensation claims. The Company establishes accruals for workers’ compensation utilizing an outside actuarial firm to estimate the undiscounted future cash payments that will be made to satisfy the claims, including an allowance for incurred-but-not-reported claims. This process includes establishing loss development factors based on the historical claims experience of the Company and the industry, and applying those factors to current claims information to derive an estimate of the Company’s ultimate claims liability. In preparing the estimates, the Company also considers the nature and severity of the claims, analyses provided by third party claims administrators, as well as current legal, economic and regulatory factors. Changes in these estimates and assumptions could materially affect the determination of the established accrual. Management evaluates the accrual, and the underlying assumptions, periodically throughout the year and makes adjustments as needed based on such evaluation. The accrual for workers’ compensation was $3.3 million and $4.6 million at December 31, 2008 and 2007, respectively.
Contingencies
The Company is primarily in the business of employing people to provide technical and engineering services to businesses on a temporary or outsourced basis. As a result, CDI is party to litigation and other claims in the ordinary course of its business. The outcome of litigation and other claims brought against the Company is subject to significant uncertainty. SFAS No. 5,Accounting for Contingencies (“SFAS No. 5”), requires that an estimated loss from a loss contingency, such as a legal proceeding or claim, should be accrued by a charge to income if it is probable that an asset has been impaired or a liability has been incurred, and the amount of the loss can be reasonably estimated. Disclosure of a contingency is required if there is at least a reasonable possibility that a loss has been incurred. In determining whether a loss should be accrued, the Company evaluates, among other factors, the degree of probability of an unfavorable outcome and the ability to make a reasonableestimate of the amount of the loss. Changes in these factors could materially impact the Company’s financial position or consolidated results of operations.
Recent Accounting Pronouncements
Effective January 1, 2008, the Company adopted the provisions of Statement of Financial Accounting Standards (“SFAS”) No. 157,Fair Value Measurements (“SFAS No. 157”) for financial assets and liabilities, as well as for any other assets and liabilities that are carried at fair value on a recurring basis. SFAS No. 157 defines fair value, establishes a framework for measuring fair value in generally accepted accounting principles and expands disclosures about fair value measurements. The adoption of SFAS No. 157 for financial assets and liabilities, as well as for any other assets and liabilities that are carried at fair value on a recurring basis, did not have an impact on the Company’s operating results or consolidated balance sheet (see Note 4—Fair Value Disclosures, in the notes to the consolidated financial statements, for additional information on fair value measurements).
In February 2008, the Financial Accounting Standards Board (“FASB”) issued FASB Staff Position (“FSP”) No. 157-2 (“FSP No. 157-2”) which, if elected, delayed the effective date of SFAS No. 157 for one year (until January 1, 2009 for the Company) for non-financial assets and non-financial liabilities, except for items that are recognized or disclosed at fair value in the financial statements on a recurring basis (at least annually). The Company elected the deferral under FSP No. 157-2 and is currently evaluating the impact of adopting the provisions of SFAS No. 157 for non-financial assets and non-financial liabilities, specifically the valuations related to its annual goodwill and other intangible assets impairment test. (See Note 4—Fair Value Disclosures, in the notes to the consolidated financial statements, for additional information on fair value measurements.)
Effective January 1, 2008, the Company adopted the provisions of SFAS No. 159,The Fair Value Option for Financial Assets and Financial Liabilities; Including an Amendment of FASB Statement No. 115(“SFAS No. 159”). On January 1, 2008, the Company did not have any eligible financial assets and liabilities against which to apply the fair value option re-measurement criteria; therefore, the Company did not record any cumulative-effect adjustment to the opening balance of retained earnings.
In December 2007, the FASB issued SFAS No. 141(R),Business Combinations(“SFAS No. 141(R)”), and SFAS No. 160,Noncontrolling Interests in Consolidated Financial Statements, an amendment of ARB No. 51(“SFAS No. 160”).SFAS No. 141(R) will change how business acquisitions are accounted for and will impact financial statements both on the acquisition date and in subsequent periods. SFAS No. 160 will change the accounting and reporting for minority interests, which will be recharacterized as noncontrolling interests and classified as a component of equity. Early adoption is prohibited for both standards. The provisions of SFAS No. 141(R) and SFAS No. 160,
35
effective for the Company’s fiscal year beginning January 1, 2009, are to be applied prospectively. The adoption of the provisions of SFAS No. 160 is not expected to have a material impact on the Company’s financial statements.
In March 2008, the FASB issued SFAS No. 161,Disclosures about Derivative Instruments and Hedging Activities, an amendment of SFAS No. 133(“SFAS No. 161”). SFAS No. 161 will change the disclosure requirements for derivative instruments and hedging activities. The Company is currently evaluating the disclosure requirements of adopting the provisions of SFAS No. 161, which will be effective for the Company beginning January 1, 2009. The Company is currently evaluating the impact of SFAS No. 161 on its financial statements.
In April 2008, the FASB issued FSP No. 142-3,Determination of the Useful Life of Intangible Assets(“FSP No. 142-3”). FSP No. 142-3 amends the factors that an entity should consider in developing renewal or extension assumptions used in determining the useful life of recognized intangible assets under SFAS No. 142. This new guidance applies prospectively to intangible assets that are acquired individually or with a group of other assets in a business combination or asset acquisition. FSP No. 142-3 will be effective for the Company beginning January 1, 2009.
| | |
| Item 7A. | | Quantitative and Qualitative Disclosures About Market Risk |
The Company is exposed to risks associated with foreign currency fluctuations and changes in interest rates. The Company’s exposure to foreign currency fluctuations relates primarily to its operations denominated in British pounds sterling, Euros, Canadian dollars and Australian dollars. The Company generally has positive cash flows in British pounds sterling, Canadian dollars and Australian dollars, and net cash outflows in Euros. Exchange rate fluctuations impact the US dollar value ofreported earnings derived from these foreign operations as well as the Company’s investment in the net assets related to these operations. The Company engages in hedging activities with respect to certain of its foreign operations.
During the first quarter of 2008, the Company entered into zero cost collar option contracts (“options”) to hedge portions of its British pounds sterling, Euro, Canadian dollar and Australian dollar currency forecasted results. These options have a range of foreign exchange rates, which provide a hedge against foreign amounts that are translated at rates outside the range. These options do not have a premium. The options were for various amounts in local currency and expired respectively at the end of the first, second, third and fourth quarters in 2008. Under SFAS No. 133,Accounting for Derivative Instruments and Hedging Activities, these instruments are accounted for at fair value. Because the Company could not designate these options as hedges for accounting purposes, foreign exchange revaluation gains or losses are reflected in earnings immediately, while the impact of translating the foreign based income into US dollars is recognized throughout the year. For the year ended December 31, 2008, the Company recorded a net gain of $1.1 million related to these options, all of which was realized. The net gains were recorded in interest income and other expense in the consolidated statements of earnings. (See Note 4—Fair Value Disclosures, in the notes to the consolidated financial statements for additional information.)
At December 31, 2008 there were no outstanding foreign exchange options or other hedging instruments.
During 2008 and 2007, the Company did not have any borrowings under its unsecured credit facility. The Company’s cash balances are primarily invested in money market investments at variable rates and fixed term deposits. Due to the Company’s cash balance, interest rate fluctuations will affect the Company’s return on its investments.
36
| | |
| Item 8. | | Financial Statements and
Supplementary Data |
CDI CORP. AND SUBSIDIARIES
Consolidated Statements of Earnings
| | | | | | | | | | | |
| | | Years ended December 31, | |
| (in thousands, except per share data) | | 2008 | | | 2007 | | 2006 | |
Revenue | | $ | 1,118,597 | | | $ | 1,187,299 | | $ | 1,113,417 | |
Cost of service | | | 863,150 | | | | 900,359 | | | 855,358 | |
Gross profit | | | 255,447 | | | | 286,940 | | | 258,059 | |
Operating and administrative expenses | | | 230,089 | | | | 240,104 | | | 225,000 | |
Operating profit | | | 25,358 | | | | 46,836 | | | 33,059 | |
Other income and expense, net | | | 3,770 | | | | 2,303 | | | (572 | ) |
Equity in losses from affiliated companies | | | (406 | ) | | | - | | | - | |
Earnings before income taxes from continuing operations | | | 28,722 | | | | 49,139 | | | 32,487 | |
Income tax expense | | | 9,307 | | | | 17,311 | | | 11,735 | |
Earnings from continuing operations | | | 19,415 | | | | 31,828 | | | 20,752 | |
Earnings from discontinued operations, net of tax (Note 9) | | | - | | | | 2,374 | | | 2,511 | |
Net earnings | | $ | 19,415 | | | $ | 34,202 | | $ | 23,263 | |
| | | |
Basic earnings per share: | | | | | | | | | | | |
Earnings from continuing operations | | $ | 0.98 | | | $ | 1.57 | | $ | 1.04 | |
Discontinued operations, net of tax | | | - | | | | 0.12 | | | 0.13 | |
Net earnings | | $ | 0.98 | | | $ | 1.69 | | $ | 1.17 | |
| | | |
Diluted earnings per share: | | | | | | | | | | | |
Earnings from continuing operations | | $ | 0.97 | | | $ | 1.56 | | $ | 1.03 | |
Discontinued operations, net of tax | | | - | | | | 0.12 | �� | | 0.13 | |
Net earnings | | $ | 0.97 | | | $ | 1.68 | | $ | 1.16 | |
See accompanying notes to consolidated financial statements.
37
CDI CORP. AND SUBSIDIARIES
Consolidated Balance Sheets
| | | | | | | | |
| | | December 31, | |
| (in thousands, except share data) | | 2008 | | | 2007 | |
Assets | | | | | | | | |
Current assets: | | | | | | | | |
Cash and cash equivalents | | $ | 61,761 | | | $ | 127,059 | |
Accounts receivable, less allowance for doubtful accounts of $6,614 - December 31, 2008; $2,996 - December 31, 2007 | | | 193,338 | | | | 210,629 | |
Prepaid expenses and other current assets | | | 7,499 | | | | 5,607 | |
Income taxes receivable | | | 4,267 | | | | 1,322 | |
Deferred income taxes | | | 6,428 | | | | 4,137 | |
Total current assets | | | 273,293 | | | | 348,754 | |
Property and equipment, net | | | 33,974 | | | | 34,152 | |
Deferred income taxes | | | 6,445 | | | | 8,484 | |
Goodwill and other intangible assets | | | 59,523 | | | | 51,588 | |
Other non-current assets | | | 9,964 | | | | 7,080 | |
Total assets | | $ | 383,199 | | | $ | 450,058 | |
Liabilities and Shareholders’ Equity | | | | | | | | |
Current liabilities: | | | | | | | | |
Cash overdraft | | $ | 1,965 | | | $ | 973 | |
Accounts payable | | | 27,950 | | | | 33,819 | |
Withheld payroll taxes | | | 1,291 | | | | 4,401 | |
Accrued compensation and related expenses | | | 32,425 | | | | 47,015 | |
Other accrued expenses and other current liabilities | | | 16,362 | | | | 16,533 | |
Total current liabilities | | | 79,993 | | | | 102,741 | |
Deferred compensation and other non-current liabilities | | | 11,821 | | | | 12,339 | |
Total liabilities | | | 91,814 | | | | 115,080 | |
Commitments and Contingencies (Notes 15 and 17) | | | | | | | | |
| | |
Shareholders’ equity: | | | | | | | | |
Preferred stock, $.10 par value - authorized 1,000,000 shares; none issued | | | - | | | | - | |
Common stock, $.10 par value - authorized 100,000,000 shares; issued 21,361,408 shares - December 31, 2008; 21,300,352 shares - December 31, 2007 | | | 2,136 | | | | 2,130 | |
Class B common stock, $.10 par value - authorized 3,174,891 shares; none issued | | | - | | | | - | |
Additional paid-in-capital | | | 54,377 | | | | 50,898 | |
Retained earnings | | | 298,981 | | | | 289,908 | |
Accumulated other comprehensive income (loss) | | | (11,743 | ) | | | 14,426 | |
Less common stock in treasury, at cost - 2,456,175 shares - December 31, 2008; 966,706 shares - December 31, 2007 | | | (52,366 | ) | | | (22,384 | ) |
Total shareholders’ equity | | | 291,385 | | | | 334,978 | |
Total liabilities and shareholders’ equity | | $ | 383,199 | | | $ | 450,058 | |
See accompanying notes to consolidated financial statements.
38
CDI CORP. AND SUBSIDIARIES
Consolidated Statements of Shareholders’ Equity
| | | | | | | | | | | | |
| | | Years ended December 31, | |
| (in thousands) | | 2008 | | | 2007 | | | 2006 | |
Common stock | | | | | | | | | | | | |
Beginning of period | | $ | 2,130 | | | $ | 2,098 | | | $ | 2,079 | |
Exercise of stock options | | | - | | | | 28 | | | | 13 | |
Stock purchase plan | | | 1 | | | | 2 | | | | 5 | |
Time-vested deferred stock, stock appreciation rights and restricted stock | | | 5 | | | | 2 | | | | 1 | |
End of period | | $ | 2,136 | | | $ | 2,130 | | | $ | 2,098 | |
Additional paid-in-capital | | | | | | | | | | | | |
Beginning of period | | $ | 50,898 | | | $ | 41,443 | | | $ | 35,459 | |
Reclassification from unamortized value of restricted stock | | | - | | | | - | | | | (32 | ) |
Exercise of stock options | | | 51 | | | | 5,654 | | | | 2,589 | |
Stock-based compensation | | | 3,555 | | | | 2,759 | | | | 3,070 | |
Tax benefit (expense) from stock plans | | | (127 | ) | | | 1,042 | | | | 357 | |
End of period | | $ | 54,377 | | | $ | 50,898 | | | $ | 41,443 | |
Retained earnings | | | | | | | | | | | | |
Beginning of period | | $ | 289,908 | | | $ | 265,015 | | | $ | 250,534 | |
Net earnings | | | 19,415 | | | | 34,202 | | | | 23,263 | |
Dividends paid to shareholders | | | (10,342 | ) | | | (9,309 | ) | | | (8,782 | ) |
End of period | | $ | 298,981 | | | $ | 289,908 | | | $ | 265,015 | |
Accumulated other comprehensive income | | | | | | | | | | | | |
Beginning of period | | $ | 14,426 | | | $ | 13,160 | | | $ | 5,822 | |
Reclassification adjustment for foreign currency translation gain included in net income (relates to discontinued operations) | | | - | | | | (2,506 | ) | | | - | |
Translation adjustment | | | (26,169 | ) | | | 3,772 | | | | 7,338 | |
End of period | | $ | (11,743 | ) | | $ | 14,426 | | | $ | 13,160 | |
Treasury stock | | | | | | | | | | | | |
Beginning of period | | $ | (22,384 | ) | | $ | (22,384 | ) | | $ | (22,384 | ) |
Shares repurchased | | | (29,982 | ) | | | - | | | | - | |
End of period | | $ | (52,366 | ) | | $ | (22,384 | ) | | $ | (22,384 | ) |
Comprehensive income (loss) | | | | | | | | | | | | |
Net earnings | | $ | 19,415 | | | $ | 34,202 | | | $ | 23,263 | |
Reclassification adjustment for foreign currency translation gain included in net income (relates to discontinued operations) | | | - | | | | (2,506 | ) | | | - | |
Translation adjustment | | | (26,169 | ) | | | 3,772 | | | | 7,338 | |
Total | | $ | (6,754 | ) | | $ | 35,468 | | | $ | 30,601 | |
See accompanying notes to consolidated financial statements.
39
CDI CORP. AND SUBSIDIARIES
Consolidated Statements of Cash Flows
| | | | | | | | | | | | |
| | | Years ended December 31, | |
| (in thousands) | | 2008 | | | 2007 | | | 2006 | |
Operating activities from continuing operations: | | | | | | | | | | | | |
Net earnings | | $ | 19,415 | | | $ | 34,202 | | | $ | 23,263 | |
Less: earnings from discontinued operations, net of tax | | | - | | | | (2,374 | ) | | | (2,511 | ) |
Earnings from continuing operations | | | 19,415 | | | | 31,828 | | | | 20,752 | |
Adjustments to reconcile net earnings to cash provided by operating activities: | | | | | | | | | | | | |
Depreciation and amortization | | | 11,903 | | | | 10,913 | | | | 9,918 | |
Equity in losses of affiliated companies | | | 406 | | | | - | | | | - | |
Deferred income taxes | | | (252 | ) | | | (4,375 | ) | | | 3,618 | |
Stock-based compensation | | | 3,836 | | | | 3,243 | | | | 2,071 | |
Impairment of asset held for sale | | | - | | | | - | | | | 705 | |
Loss on sale of assets | | | - | | | | - | | | | 315 | |
Changes in operating assets and liabilities, net of effects from acquisitions: | | | | | | | | | | | | |
Accounts receivable, net | | | 7,009 | | | | 17,588 | | | | (7,566 | ) |
Prepaid expenses | | | (1,646 | ) | | | (748 | ) | | | (1,313 | ) |
Accounts payable | | | (4,995 | ) | | | (721 | ) | | | 4,311 | |
Accrued expenses and other current liabilities | | | (18,517 | ) | | | 3,180 | | | | 5,776 | |
Income taxes | | | (3,096 | ) | | | (4,165 | ) | | | 1,477 | |
Other assets, non-current liabilities and other | | | 728 | | | | 76 | | | | (1,246 | ) |
Net cash provided by operating activities | | | 14,791 | | | | 56,819 | | | | 38,818 | |
Investing activities from continuing operations: | | | | | | | | | | | | |
Additions to property and equipment | | | (10,136 | ) | | | (7,841 | ) | | | (12,895 | ) |
Acquisitions, net of cash acquired | | | (17,608 | ) | | | - | | | | - | |
Proceeds of residential property sold | | | - | | | | 2,337 | | | | - | |
Investment in joint venture | | | (4,138 | ) | | | - | | | | - | |
Investment in trademarks | | | (1,726 | ) | | | - | | | | - | |
Net proceeds from sale of business | | | - | | | | 39,776 | | | | - | |
Proceeds from sale of assets | | | - | | | | - | | | | 117 | |
Other | | | 445 | | | | 129 | | | | (110 | ) |
Net cash provided by (used in) investing activities | | | (33,163 | ) | | | 34,401 | | | | (12,888 | ) |
Financing activities from continuing operations: | | | | | | | | | | | | |
Dividends paid to shareholders | | | (10,342 | ) | | | (9,309 | ) | | | (8,782 | ) |
Shares repurchased under the stock repurchase program | | | (29,982 | ) | | | - | | | | - | |
Payments of obligation on property sold | | | - | | | | (1,422 | ) | | | - | |
Cash overdraft | | | 992 | | | | (1,534 | ) | | | (3,003 | ) |
Proceeds from exercises of employee stock options | | | 51 | | | | 5,683 | | | | 2,602 | |
Tax benefit from equity compensation plans | | | 24 | | | | 1,042 | | | | 357 | |
Net cash used in financing activities | | | (39,257 | ) | | | (5,540 | ) | | | (8,826 | ) |
Discontinued operations: | | | | | | | | | | | | |
Cash provided by operating activities | | | - | | | | 6,717 | | | | 2,727 | |
Cash used in investing activities | | | - | | | | (307 | ) | | | (548 | ) |
Cash provided by financing activities | | | - | | | | 92 | | | | - | |
Net cash provided by discontinued operations | | | - | | | | 6,502 | | | | 2,179 | |
Effect of exchange rate changes on cash | | | (7,669 | ) | | | 1,326 | | | | 861 | |
Net increase (decrease) in cash and cash equivalents | | | (65,298 | ) | | | 93,508 | | | | 20,144 | |
Cash and cash equivalents at beginning of period | | | 127,059 | | | | 33,551 | | | | 13,407 | |
Cash and cash equivalents at end of period | | $ | 61,761 | | | $ | 127,059 | | | $ | 33,551 | |
| | | |
Supplemental disclosure of cash flow information: | | | | | | | | | | | | |
Cash paid for interest | | $ | - | | | $ | - | | | $ | 81 | |
Cash paid for income taxes, net | | | 13,312 | | | | 24,366 | | | | 8,085 | |
See accompanying notes to consolidated financial statements.
40
Notes to Consolidated Financial Statements
(In thousands, except share and per share amounts, unless otherwise indicated)
Note 1 - Significant Accounting Policies
Nature of Operations - - CDI Corp. (the “Company” or “CDI”) was incorporated in Pennsylvania on July 30, 1985. It is the successor registrant to CDI Corporation, which was incorporated in Pennsylvania on September 16, 1950. The Company, which provides engineering and information technology outsourcing solutions and professional staffing, derives the majority of its revenues by providing services to Fortune 1000 companies and equivalent non-US-based companies, primarily in the US, UK, Canada, Mexico and Australia.
Basis of Presentation - The consolidated financial statements of the Company and the accompanying notes are prepared in accordance with accounting principles generally accepted in the United States of America and the rules of the Securities and Exchange Commission.
Principles of Consolidation - The consolidated financial statements include the accounts of the Company and its wholly-owned subsidiaries after elimination of intercompany balances and transactions. For comparative purposes, certain amounts have been reclassified to conform to the 2008 presentation.
Use of Estimates - The preparation of financial statements in accordance with accounting principles generally accepted in the United States of America requires management to make estimates and assumptions that affect the reported amounts of assets and liabilities and disclosure of contingent assets and liabilities at the date of the financial statements and the reported amounts of revenues and expenses during the reporting period. Actual results could differ from those estimates.
Revenue Recognition - Revenues in the consolidated statements of earnings are presented net of any revenue-based taxes, such as sales, use, excise and value added taxes. The Company derives its revenues from several sources. All of the Company’s segments perform staffing services. The Company’s CDI Engineering Solutions (“ES”) segment also performs project outsourcing services, which includes some fixed-price contracts and permanent placement services. The Company’s Management Recruiters International (“MRI”) segment derives a large portion of its revenue from ongoing franchise royalties and initial franchise fees. The Company’s CDI AndersElite (“Anders”) segment also derives revenue from permanent placement services. The Company’s CDI Information Technology Solutions (“ITS”) segment also performs project outsourcing services, which includes some fixed-price contracts and permanent placement services.
Staffing Services - The Company recognizes revenues from staffing services on a gross basis, as services are performed and associated costs have been incurred when employees of the Company are utilized. In these circumstances, the Company assumes the risk of acceptability of its employees to its customers. An element of the Company’s staffing business is the use of unaffiliated companies (“supplier associates”) and their employees to fulfill a customer’sstaffing requirements. Under these arrangements, these firms serve as subcontractors. Customers typically require a single consolidated billing which reflects services performed by the Company’s employees as well as staffing supplied by supplier associates.
When utilizing supplier associates, the Company records the difference between its gross billings and the amount paid to the supplier associate as revenue, in accordance with Emerging Issues Task Force (“EITF”) 99-19, Reporting Revenue Gross as a Principal versus Net as an Agent (“EITF 99-19”), which is generally referred to as an administrative fee. Administrative and clerical costs related to time accumulation, invoicing and other activities are recorded and included in operating and administrative expenses as incurred.
Project Outsourcing Services - The Company recognizes revenue from project outsourcing services based on mark-ups of its employees’ rates of pay. To a lesser extent, the Company derives revenue from fixed-price contracts.
Fixed-price engineering contracts typically include development of conceptual and detailed designs in support of a customer’s construction of tangible property. In accordance with the American Institute of Certified Public Accountants’ Statement of Position (“SOP”) 81-1,Accounting for Performance of Construction-Type and Certain Production-Type Contracts (“SOP 81-1”), revenue is recorded using the percentage-of-completion method, relying on direct hours as the primary input measure. In addition, these contracts are evaluated periodically to ensure that any potential losses have been identified and recorded in the financial statements.
Outsourcing service contracts generally include the performance of certain computer or network operations or help-desk support on behalf of customers. Service contracts typically contain an invoicing schedule covering the contractual period. Accordingly, the Company recognizes revenue on a pro-rata basis using elapsed time as the measure of performance under these contracts. The Company charges the related costs to earnings as they are incurred. As with fixed-price engineering contracts, the Company periodically evaluates the need to provide for any losses on such contracts.
Permanent Placement - Services include the search and recruitment of candidates to become employed by the Company’s customers. Generally, the Company performs permanent placement services on a non-exclusive, contingency basis and recognizes revenue only after successfully placing a recommended candidate.
Ongoing Franchise Royalties - MRI’s rights to franchise royalties are governed by the provisions of its franchise contracts. Under the franchise contracts, the franchisees
41
Notes to Consolidated Financial Statements
(In thousands, except share and per share amounts, unless otherwise indicated)
remit to the Company a contractual percentage of fees collected from their customers. The Company records franchise royalty revenue as fees are collected by the franchisee and they become a receivable from the franchisee, in accordance with Statement of Financial Accounting Standards (“SFAS”) No. 45—Accounting for Franchise Fee Revenue (“SFAS No. 45”).
Initial Franchise Fees - The Company recognizes fees related to sales of new MRI franchises and master franchise agreements when the Company has substantially fulfilled its requirements under the respective franchise agreement.
Off-Balance Sheet Risk - The Company maintains letters of credit primarily issued through major domestic banks as required by certain insurance carriers in connection with its workers’ compensation plan. As of December 31, 2008 and 2007, the Company had outstanding letters of credit of $6.8 million and $11.8 million, respectively, expiring at various dates through July 2009.
From time to time the Company engages in hedging activities with respect to its foreign operations. As of December 31, 2008, the Company had no outstanding hedging instruments in place.
Foreign Currency Translation - Foreign subsidiaries of the Company use local currency as the functional currency. Net assets are translated at year-end rates while revenues and expenses are translated at average exchange rates. Adjustments resulting from these translations are reflected in accumulated other comprehensive income in shareholders’ equity. Gains and losses arising from foreign currency transactions are reflected in the consolidated statements of earnings.
Concentrations of Credit Risk - The Company’s principal asset is accounts receivable. Substantially all of the Company’s customers are provided trade credit. The primary users of the Company’s services are large organizations, many of which are Fortune 1000 companies. The Company performs ongoing credit evaluations of its customers and maintains allowances for potential credit losses. An allowance is provided against accounts receivable that are not expected to be collected. This reserve is based upon historical experience, as well as estimates based on management’s judgments in specific matters.
During 2008 and 2006, one customer accounted for approximately 10% of consolidated revenues. In 2007, no single customer accounted for 10% or more of consolidated revenues. The Company’s top ten customers accounted for approximately 32%, 30%, and 31% of consolidated revenue for the years ended December 31, 2008, 2007, and 2006, respectively.
One customer accounted for approximately 22% and 14% of total accounts receivable at December 31, 2008 and 2007, respectively. The chemical and auto industries have been severely impacted by the global economic downturn in 2008 and the Company’s December 31, 2008 accounts receivablebalance related to customers in these industries totaled approximately $13 million. If conditions continue to decline in these two industries, customers may have difficulty in paying their balances.
The Company’s cash balances are held in money market mutual funds and in accounts held by major banks and financial institutions, primarily in the US, Canada and the UK.
Income Taxes - The Company accounts for income taxes using the asset and liability method, as prescribed by SFAS No. 109,Accounting for Income Taxes (“SFAS No. 109”). Under this method, income taxes are provided for amounts currently payable and for amounts deferred as tax assets and liabilities based on differences between the financial statement carrying amounts and tax basis of its assets and liabilities. In establishing its deferred income tax assets and liabilities, the Company makes judgments and interpretations based on the enacted tax laws and published tax guidance that are applicable to its operations. The Company records deferred tax assets and liabilities and evaluates the need for valuation allowances to reduce the deferred tax assets to realizable amounts. The likelihood of a material change in the Company’s expected realization of these assets is dependent on future taxable income, its ability to use tax credit carryforwards and carrybacks, final tax settlements, and the effectiveness of its tax planning strategies in the various tax jurisdictions in which it operates. Effective January 1, 2007, the Company adopted the provisions of Financial Accounting Standards Board (“FASB”) Interpretation No. 48,Accounting for Uncertainty in Income Taxes (“FIN 48”), an interpretation of SFAS No. 109. See Note 13—Income Taxes.
Cash and Cash Equivalents - Cash equivalents include cash in operating accounts, term deposits and investments in money market funds in highly liquid securities that mature within 90 days from the date of acquisition.
Fair Value of Financial Instruments - The net carrying amounts of cash and cash equivalents, accounts receivable, cash overdraft and accounts payable approximate their fair value due to the short-term nature of these instruments.
Property and Equipment - Property and equipment are recorded at cost. Depreciation expense for financial reporting purposes is computed using the straight-line method over the following useful lives:
| | |
Computer equipment | | 4-7 years |
Equipment and furniture | | 4-10 years |
Software | | 4-7 years |
Leasehold improvements | | Shorter of lease term or useful life |
The Company capitalizes direct costs incurred in the development of internal-use software in accordance with the American Institute of Certified Public Accountants Statement of Position (“SOP”) No. 98-1,Accounting for the Costs of Computer Software Developed or Obtained for Internal Use (“SOP No. 98-1”).
42
Notes to Consolidated Financial Statements
(In thousands, except share and per share amounts, unless otherwise indicated)
Goodwill and Other Intangible Assets - Goodwill represents the excess of the cost of businesses acquired over the fair market value of identifiable net assets at the dates of acquisition. Other intangible assets are identifiable assets that lack physical substance, which are acquired as part of a business combination or other transaction. The Company follows the provisions of SFAS No. 142,Goodwill and Other Intangible Assets(“SFAS No. 142”). SFAS No. 142 requires an annual impairment test for goodwill and other intangible assets with indefinite lives. The Company performs its annual impairment test during the third fiscal quarter or whenever events occur or circumstances change, such as an adverse change in business climate or a decline in the industries that the Company serves, that would more likely than not reduce the fair value of a reporting unit below its carrying amount.
Under the provisions of SFAS No. 142, the first step of the impairment test requires that the Company determine the fair value of each reporting unit and compare the fair value to the reporting unit’s carrying amount. The Company uses a dual approach to determine the fair value of its reporting units. The Company first uses the income approach, which is based on the present value of discounted cash flows and terminal value projected for each reporting unit. The income approach requires significant judgments, including the projected results of operations, the weighted average cost of capital (“WACC”) used to discount the cash flows and terminal value assumptions. The WACC is determined based on the Company’s capital structure, cost of capital, inherent business risk profile and long-term growth expectations, as reflected in the terminal value. The Company uses peer group market multiples to validate the reasonableness of the fair values as determined using the income approach.
Additionally, the Company corroborates the reasonableness of the total fair value of the reporting units by reconciling the aggregate fair values of the reporting units to the Company’s total market capitalization adjusted to include an estimated control premium. The estimated control premium is based on reviewing observable transactions involving the purchase of controlling interests in comparable companies. In developing the market capitalization, the Company may, depending on the volatility of the market value of its stock price, use either the stock price on the valuation date or the average stock price over a range of dates around the valuation date.
The second step under the provisions of SFAS No. 142 is contingent upon the results of the first step. To the extent a reporting unit’s carrying amount exceeds its fair value, an indication exists that the reporting unit’s goodwill or intangible assets may be impaired and the Company must perform a second more detailed impairment assessment. The second impairment assessment involves allocating the reporting unit’s fair value to all of its recognized and unrecognized assets and liabilities in order to determine the implied fair value of the reporting unit’s goodwill and intangible assets as of the assessment date. Theimplied fair value of the reporting unit’s goodwill and other intangible assets is then compared to the carrying amount of goodwill and other intangible assets to quantify an impairment charge as of the assessment date.
Long-Lived Assets -The Company evaluates long-lived assets and intangible assets with definite lives for impairment whenever events or changes in circumstances indicate that the carrying amount of an asset may not be recoverable. When it is probable that undiscounted future cash flows will not be sufficient to recover an asset’s carrying amount, the asset is written down to its fair value. Assets to be disposed of by sale are reported at the lower of the carrying amount or fair value less cost to sell. Certain intangible assets are amortized on a straight-line basis over the useful life of the asset, in accordance with SFAS No. 142.
Joint Ventures -The Company has investments in two joint ventures. The fair value of each joint venture was initially determined by the investment amount and is adjusted for equity in the earnings or losses of the joint venture. The operating results for the joint ventures are being accounted for in accordance with Accounting Principles Board Opinion No. 18,The Equity Method of Accounting for Investments in Common Stock (“APB No. 18”).
Leases - The Company leases office space under operating leases expiring at various times through 2016. For material lease agreements that provide for escalating rent payments or free-rent occupancy periods, the Company recognizes rent expense on a straight-line basis over the non-cancelable lease term. The lease term commences on the date when all conditions precedent to the Company’s obligation to pay rent are satisfied. Deferred rent is included in “Other accrued expenses and other current liabilities” in the consolidated balance sheets.
Cash Overdraft - The Company manages the level of cash in banks to minimize its non-interest bearing cash balances. Cash balances as reflected by banks are higher than the Company’s book balances because of checks that are outstanding throughout the banking system. Cash is generally not provided to bank accounts until checks are presented for payment. This process can result in negative cash balances in the Company’s records. These negative balances are reflected in current liabilities as “Cash overdraft” when the right of offset is not available.
Capitalization of Start-up Costs - The Company engages in contracts for long-term projects. In connection with these contracts, the Company incurs costs related to the acquisition of these contracts. The Company may capitalize certain of these costs related to the acquisition of contracts in accordance with FASB Technical Bulletin (“FTB”) No. 90-1,Accounting for Separately Priced Extended Warranty and Product Maintenance Contracts (“FTB No. 90-1”). Only direct, incremental and recoverable external costs that would not have been incurred but for the acquisition of the contract may be capitalized. At
43
Notes to Consolidated Financial Statements
(In thousands, except share and per share amounts, unless otherwise indicated)
December 31, 2008, no capitalized start-up costs were recognized on the balance sheet.
Stock-Based Compensation - On January 1, 2006, the Company adopted SFAS No. 123(R),Share-Based Payment(“SFAS No. 123(R)”), which requires all share-based payments to employees to be recognized as an expense based on the estimated fair value of the award on the date of grant. The compensation expense, less expected forfeitures, is being recognized over the service period on a straight-line basis. The Company uses the Black-Scholes option pricing model to calculate the fair value of the awards. The Black-Scholes model requires estimates for risk-free interest rate, expected term, expected stock price volatility and expected dividend yield. Changes in these estimates could impact expense recognition for future awards.
Workers’ Compensation - The Company has a combination of insurance contracts and self-insurance under which the Company generally bears the first $250,000 of risk per single accident for workers’ compensation claims. The Company establishes accruals for workers’ compensation utilizing an outside actuarial service to estimate the undiscounted future cash payments that will be made to satisfy the claims, including an allowance for incurred-but-not-reported claims. This process includes establishing loss development factors based on the historical claims experience of the Company and the industry, and applying those factors to current claims information to derive an estimate of the Company’s ultimate claims liability. In preparing the estimates, the Company also considers the nature and severity of the claims, analyses provided by third party claims administrators, as well as current legal, economic and regulatory factors. Changes in these estimates and assumptions could materially affect the determination of the established accrual. Management evaluates the accrual, and the underlying assumptions, periodically throughout the year and makes adjustments as needed based on such evaluation. The accrual for workers’ compensation was $3.3 million at December 31, 2008 and $4.6 million at December 31, 2007.
Recent Accounting Pronouncements
Effective January 1, 2008, the Company adopted the provisions of SFAS No. 157,Fair Value Measurements (“SFAS No. 157”) for financial assets and liabilities, as well as for any other assets and liabilities that are carried at fair value on a recurring basis. SFAS No. 157 defines fair value, establishes a framework for measuring fair value in generally accepted accounting principles and expands disclosures about fair value measurements. The adoption of SFAS No. 157 for financial assets and liabilities, as well as for any other assets and liabilities that are carried at fair value on a recurring basis, did not have an impact on the Company’s operating results or consolidated balance sheet (see Note 4—Fair Value Disclosures for additional information on fair value measurements).
In February 2008, the FASB issued FASB Staff Position (“FSP”) No. 157-2 (“FSP No. 157-2”) which, if elected, delayed the effective date of SFAS No. 157 for one year (until January 1, 2009 for the Company) for non-financial assets and non-financial liabilities, except for items that are recognized or disclosed at fair value in the financial statements on a recurring basis (at least annually). The Company elected the deferral under FSP No. 157-2 and is currently evaluating the impact of adopting the provisions of SFAS No. 157 for non-financial assets and non-financial liabilities, specifically the valuations related to its annual goodwill and other intangible assets impairment test. (See Note 4—Fair Value Disclosures for additional information on fair value measurements.)
Effective January 1, 2008, the Company adopted the provisions of SFAS No. 159,The Fair Value Option for Financial Assets and Financial Liabilities; Including an Amendment of FASB Statement No. 115 (“SFAS No. 159”). On January 1, 2008, the Company did not have any eligible financial assets and liabilities against which to apply the fair value option re-measurement criteria; therefore, the Company did not record any cumulative-effect adjustment to the opening balance of retained earnings.
In December 2007, the FASB issued SFAS No. 141(R),Business Combinations (“SFAS No. 141(R)”), and SFAS No. 160,Noncontrolling Interests in Consolidated Financial Statements, an amendment of ARB No. 51(“SFAS No. 160”).SFAS No. 141(R) will change how business acquisitions are accounted for and will impact financial statements both on the acquisition date and in subsequent periods. SFAS No. 160 will change the accounting and reporting for minority interests, which will be recharacterized as noncontrolling interests and classified as a component of equity. Early adoption is prohibited for both standards. The provisions of SFAS No. 141(R) and SFAS No. 160, effective for the Company’s fiscal year beginning January 1, 2009, are to be applied prospectively. The adoption of the provisions of SFAS No. 160 is not expected to have a material impact on the Company’s financial statements.
In March 2008, the FASB issued SFAS No. 161,Disclosures about Derivative Instruments and Hedging Activities, an amendment of SFAS No. 133 (“SFAS No. 161”). SFAS No. 161 will change the disclosure requirements for derivative instruments and hedging activities. The Company is currently evaluating the disclosure requirements of adopting the provisions of SFAS No. 161, which will be effective for the Company beginning January 1, 2009.
In April 2008, the FASB issued FSP No. 142-3,Determination of the Useful Life of Intangible Assets(“FSP No. 142-3”). FSP No. 142-3 amends the factors that an entity should consider in developing renewal or extension assumptions used in determining the useful life of recognized intangible assets under SFAS No. 142. This new guidance applies prospectively to intangible assets that are acquired individually or with a group of other assets in a business combination or asset acquisition. FSP
44
Notes to Consolidated Financial Statements
(In thousands, except share and per share amounts, unless otherwise indicated)
No. 142-3 will be effective for the Company beginning January 1, 2009.
Note 2 - Property Sale
On August 26, 2005, the Company entered into a relocation agreement with an MRI executive. During the third quarter of 2006, the association between the executive and the Company ceased. Under the terms of the relocation agreement, the former executive transferred beneficial ownership of his principal residence to the Company in exchange for $2.0 million. At the time of the transfer, the property had a fair value, net of costs to sell, of $3.2 million with an outstanding mortgage of $1.4 million. In accordance with SFAS No. 144,Accounting for the Impairment or Disposal of Long-Lived Assets (“SFAS No. 144”), the asset held for sale was carried at fair value less costs to sell. The property was sold on June 11, 2007, and the Company received net cash proceeds of $0.9 million from the sale resulting in an immaterial gain.
Note 3 - Property and Equipment
Property and equipment, net at December 31, 2008 and 2007, was comprised of the following:
| | | | | | | | |
| | | 2008 | | | 2007 | |
Computer equipment | | $ | 41,037 | | | $ | 47,441 | |
Equipment and furniture | | | 18,413 | | | | 18,788 | |
Software | | | 26,390 | | | | 26,435 | |
Leasehold improvements | | | 10,729 | | | | 15,563 | |
| | | | 96,569 | | | | 108,227 | |
Accumulated depreciation | | | (62,595 | ) | | | (74,075 | ) |
| | | $ | 33,974 | | | $ | 34,152 | |
During the years ended December 31, 2008 and 2007, the Company capitalized approximately $3.1 million and $2.7 million, respectively, of internal-use software acquisition and development costs. During 2008 and 2007, the Company recorded adjustments to retire $20.9 million and $22.6 million, respectively, of property and equipment and retiring $20.4 million and $22.5 million, respectively, of accumulated depreciation, recognizing a loss of $0.5 million and $0.1 million, respectively.
Note 4 - Fair Value Disclosures
The Company is exposed to risks associated with foreign currency fluctuations. The Company’s exposure to foreign currency fluctuations relates primarily to its operations denominated in British pounds sterling, Euros, Canadian dollars and Australian dollars. The Company generally has positive cash flow in British pounds sterling, Canadian dollars and Australian dollars and net cash outflows in Euros. Exchange rate fluctuations impact the US dollar value of reported earnings derived from these foreign operations as well as the Company’s investment in the net assets related to these operations. The Company has and may continue to engage in hedging activities with respect to certain of its foreign operations.
During the first quarter of 2008, the Company entered into zero cost collar option contracts (“options”) to hedge portions of its British pounds sterling, Euros, Canadian dollar and Australian dollar currency forecasted amounts. These options have a range of foreign exchange rates, which provide a hedge against foreign results that are translated at rates outside the range. These options did not have a premium. The options were for various amounts in local currency and expired respectively at the end of the first, second, third and fourth quarters in 2008. Under SFAS No. 133,Accounting for Derivative Instruments and Hedging Activities(“SFAS No. 133”), these instruments are accounted for at fair value. Because the Company could not designate these options as hedges for accounting purposes, foreign exchange revaluation gains or losses are reflected in earnings currently, while the impact of translating the foreign based income into US dollars is recognized throughout the year. For 2008, the Company recorded a net gain of $1.1 million related to these options, all of which was realized. All options matured prior to December 31, 2008. The net gains were recorded in interest income and other expense in the consolidated statements of earnings. The gains were recorded as each individual option matured, or, in the case of certain Euros options, when the options were closed out at the election of the Company. If the option was a put, the gain or loss was calculated as the difference between the average spot rate for the period and the ceiling of the option (for a loss) or the floor of the option (for a gain), multiplied by the total local currency hedged. If the option was a call, the gain or loss was calculated as the difference between the average monthly spot rate for the period and the ceiling of the option (for a gain) or the floor of the option (for a loss), multiplied by the total local currency hedged.
The Company maintains a non-qualified Deferred Compensation Plan for highly compensated employees. The assets of the plan are held in the name of CDI at a third party financial institution. Separate accounts are maintained for each participant to reflect the amounts deferred by the participant and all earnings and losses on those deferred amounts. The plan assets are recorded in other non-current assets and the related liability amounts are recorded in deferred compensation and other non-current liabilities in the consolidated balance sheets. The assets of the plan are held in publicly traded mutual funds. The fair value of the plan assets is calculated using the market price of the mutual funds as of the end of the period.
Effective January 1, 2008, the Company adopted the provisions of SFAS No. 157 for financial assets and liabilities, as well as for any other assets and liabilities that are carried at fair value on a recurring basis. SFAS No. 157 defines fair value, establishes a framework for measuring fair value in accordance with generally accepted accounting principles and expands disclosures about fair value measurements. The SFAS No. 157 fair value hierarchy consists of three levels: Level 1 fair values are valuations based on quoted market prices in active markets for identical assets or liabilities that the entity has the ability to
45
Notes to Consolidated Financial Statements
(In thousands, except share and per share amounts, unless otherwise indicated)
access; Level 2 fair values are those valuations based on quoted prices for similar assets or liabilities, quoted prices in markets that are not active, or other inputs that are observable or can be corroborated by observable data for substantially the full term of the assets or liabilities; and Level 3 fair values are valuationsbased on inputs that are supported by little or no market activity and that are significant to the fair value of the assets or liabilities. The adoption of SFAS No. 157 did not have an impact on the Company’s fair value determinations included in the financial statements.
The following table outlines by major category, the financial assets measured at fair value on a recurring basis as of December 31, 2008:
| | | | | | | | | | | | |
Description | | Fair Value
Measurements
at December 31,
2007 | | Fair Value Measurements At December 31, 2008 Using |
| | | Quoted Prices in
Active Markets for Identical Assets (Level 1) | | Significant Other
Observable Inputs (Level 2) | | Significant
Unobservable
Inputs (Level 3) |
Assets | | | | | | | | | | | | |
Mutual funds included in deferred compensation plan (1) | | $ | 5,861 | | $ | 5,415 | | $ | - | | $ | - |
Total assets | | $ | 5,861 | | $ | 5,415 | | $ | - | | $ | - |
| (1) | Included in deferred compensation and other non-current liabilities in the consolidated balance sheet is a corresponding liability of the same amount reflecting balances owed to plan participants. |
Note 5 - Acquisition
On July 28, 2008,the Company acquired certain assets of TK Engineering Associates, Inc. (“TK Engineering”), an engineering services firm with offices primarily in Cincinnati specializing in design, analysis, consulting and project services in the aviation and energy sectors. The purchase price of $17.6 million, including transaction costs, was funded from the Company’s existing cash. As part of the purchase price allocation, the Company recorded intangible assets of $8.1 million for a customer relationship, which will be amortized on a straight-line basis over the useful life of the asset, which is 15 years, and $6.1 million for goodwill, which will not be amortized, but will be subject to annual impairment testing. The purpose of the acquisition is to enhance the Company’s service offerings in the CDI Engineering Solutions Aerospace vertical. The TK Engineering business was included in the CDI Engineering Solutions (“ES”) segment of the Company from the date of acquisition.
The transaction was accounted for as purchase business combination under SFAS No. 141,Business Combinations(“SFAS No. 141”). The results of operations of this business are included in the Company’s consolidated statement of income from the date of acquisition. The preliminary purchase price allocation for the acquisition is as follows:
| | | | |
Current Assets | | $ | 3,085 | |
Fixed Assets | | | 3,084 | |
Customer Relationship | | | 8,100 | |
Goodwill (1) | | | 6,144 | |
Current Liabilities | | | (2,805 | ) |
| | | $ | 17,608 | |
| (1) | $6,144 of goodwill is deductible for tax purposes. |
Note 6 - Goodwill and Other Intangible Assets
In accordance with SFAS No. 142, the Company performs its annual goodwill and other intangible assets impairment testing by reporting unit in the third quarter, or whenever events occur or circumstances change, such as an adverse change in business climate or a decline in the industries that the Company serves, that would more likely than not reduce the fair value of a reporting unit below its carrying amount. The Company conducted its annual goodwill impairment test as of July 1, 2008 and identified no impairments.
During the fourth quarter, the Company observed sharp deterioration in the general business environment, increasing instability of the credit markets and the resulting adverse effect on the industries that the Company serves. Additionally, the Company’s stock price declined significantly during the fourth quarter of 2008, causing its market capitalization to decline below its book value at December 31, 2008. These adverse changes were determined to be a triggering event, which indicated that a potential impairment may have occurred and the Company needed to update its impairment analysis.
As of December 31, 2008, the Company performed impairment testing under the provisions of SFAS No. 142. The first step of the impairment test required that the Company determine the fair value of each reporting unit and compare the fair value to the reporting unit’s carrying amount. The Company used a dual approach to determine the fair value of its reporting units. The Company first used the income approach, which was based on the present value of discounted cash flows and terminal value projected for each reporting unit. The income approach required significant judgments, including the projected results of operations, the weighted average cost of capital (“WACC”) used to discount the cash flows and terminal value assumptions.
46
Notes to Consolidated Financial Statements
(In thousands, except share and per share amounts, unless otherwise indicated)
The WACC was determined based on the Company’s capital structure, cost of capital, inherent business risk profile and long-term growth expectations, as reflected in the terminal value. The Company used peer group market multiples to validate the reasonableness of the fair values as determined using the income approach.
The Company then corroborated the reasonableness of the total fair value of the reporting units by reconciling the aggregate fair values of the reporting units to the Company’s total market capitalization adjusted to include an estimated control premium. The estimated control premium was based on reviewing observable transactions involving the purchase of controlling interests in comparable companies. The Company calculated the market capitalization using the average closing stock price for the 15 days prior to the test date of December 31, 2008. The results of the market capitalization approach further supported the Company’s income approach.
As a result of the impairment test, the Company determined that there was no goodwill impairment as of December 31, 2008. However, in connection with the analysis, the Company recorded a $0.5 million adjustment to reduce certain discrete asset balances in the ES segment. The Company will continue to closely monitor the recoverability of its goodwill assets.
In February 2008 the Company’s Management Recruiters International, Inc. (“MRI”) subsidiary entered into an agreement with a European based search and recruitment firm under which MRI made a $1.7 million payment to the firm to secure unrestricted future use of certain trademarks. MRI’s payment of $1.7 million was capitalized in other intangible assets (see the table below). This trademark is considered to have an indefinite useful life and accordingly will not be amortized, but will be subject to annual impairment testing. During the impairment test as of December 31, 2008, the Company identified no impairments related to trademarks.
In July 2008, the Company acquired certain assets of TK Engineering (see Note 5—Acquisition). As part of the purchase price allocation, the Company recorded intangible assets of $8.1 million for a customer relationship, which will be amortized on a straight-line basis over the useful life of the asset, which is 15 years, and $6.1 million for goodwill, which will not be amortized, but will be subject to annual impairment testing.
The following tables summarize the changes in the Company’s carrying value of goodwill and other intangible assets by reportable segment during 2008 and 2007:
| | | | | | | | | | | | | | | | | |
| 2008 | | Balance at
December 31, 2007 | | Additions | | Amor-
tization | | | Translation
and Other
Adjustments | | | Balance at
December
31, 2008 |
Goodwill | | | | | | | | | | | | | | | | | |
ES (1), (2) | | $ | 16,588 | | $ | 6,144 | | $ | - | | | $ | (553 | ) | | $ | 22,179 |
Anders | | | 24,319 | | | - | | | - | | | | (6,446 | ) | | | 17,873 |
MRI | | | 10,242 | | | - | | | - | | | | (811 | ) | | | 9,431 |
Total goodwill | | | 51,149 | | | 6,144 | | | - | | | | (7,810 | ) | | | 49,483 |
Other intangible assets Trademarks - MRI | | | 439 | | | 1,726 | | | - | | | | - | | | | 2,165 |
Customer Relationship
—ES (1) | | | - | | | 8,100 | | | (225 | ) | | | - | | | | 7,875 |
Total goodwill and other intangible assets | | $ | 51,588 | | $ | 15,970 | | $ | (225 | ) | | $ | (7,810 | ) | | $ | 59,523 |
| (1) | The additions of $8,100 for customer relationship and $6,144 of goodwill were recorded as intangible assets as part of the purchase price allocation of the TK Engineering acquisition. |
| (2) | Includes an adjustment of $498 to reduce certain discrete asset balances in the ES segment. |
| | | | | | | | | | | | | | | |
| 2007 | | Balance at
December
31, 2006 | | Additions | | Amor-
tization | | Translation and Other
Adjustments | | Balance
at
December
31, 2007 |
Goodwill | | | | | | | | | | | | | | | |
ES | | $ | 16,588 | | $ | - | | $ | - | | $ | - | | $ | 16,588 |
AndersElite | | | 23,906 | | | - | | | - | | | 413 | | | 24,319 |
MRI | | | 10,191 | | | - | | | - | | | 51 | | | 10,242 |
Total goodwill | | | 50,685 | | | - | | | - | | | 464 | | | 51,149 |
Other intangible assets
Trademarks —MRI | | | 382 | | | 57 | | | - | | | - | | | 439 |
Total goodwill and other intangible assets | | $ | 51,067 | | $ | 57 | | $ | - | | $ | 464 | | $ | 51,588 |
Amortization expense was $225 for 2008. Annual amortization expense is expected to be $540 per year for each of the next five years.
Note 7 - Short-Term Borrowings
On November 10, 2008, the Company entered into an amended and restated credit agreement with JP Morgan Chase Bank, N.A. The credit agreement further extends CDI’s existing committed, unsecured $45 million revolving line of credit facility until November 9, 2009. The Company sought the early renewal to ensure on-going liquidity in light of the recent turmoil in credit markets.
Interest on borrowings under the facility are based on either a Eurodollar rate or an “Alternate Base Rate” (which is the greater of (i) the Bank’s prime rate, (ii) the Federal Funds rate plus 0.5% and (iii) the one-month LIBO rate), as chosen by the Company each time it wishes to borrow funds. The interest rate in the case of Eurodollar-based borrowings is the LIBO rate plus a number of basis points (ranging from 1.15% to 1.75%) depending on the Company’s leverage ratio (which is defined as
47
Notes to Consolidated Financial Statements
(In thousands, except share and per share amounts, unless otherwise indicated)
the ratio of consolidated indebtedness to consolidated EBITDA). The interest rate in the case of Alternate Base Rate borrowings is the Alternate Base Rate (plus 0.25% if the Company’s leverage ratio equals or exceeds 2.0). Any Eurodollar-based borrowing must be in a minimum principal amount of $2,000 and any Alternate Base Rate loan must be in a minimum principal amount of $100.
The restrictive covenants contained in the agreement limit the Company with respect to, among other things, subsidiary indebtedness, creating liens on its assets, mergers or consolidations, disposition of assets other than in the ordinary course of business, acquisitions and investments. Additionally, the Company is required by the agreement to maintain a minimum Adjusted EBITDA (as defined in the agreement) to interest expense ratio of 1.5 to 1, not to exceed a maximum Debt to Consolidated EBITDA ratio of 2.5 to 1 and maintain a minimum shareholders’ equity balance.
On February 27, 2008, the Company renewed its credit agreement with JP Morgan Chase Bank, N.A. The credit agreement provides the Company with a committed, unsecured $45 million revolving credit facility and extended the term of the credit facility to February 27, 2009. The renewal also expanded the permitted investments which the Company may make and raised the dollar limit on the size of acquisitions which the Company may make without obtaining the lender’s approval.
During 2008, the Company did not have any outstanding borrowings under the revolving credit facility and was in compliance with all covenants under the credit agreement. Additionally, the Company has a $10.2 million uncommitted, demand unsecured line of credit with Brown Brothers Harriman & Co., under which the bank issues, at its sole discretion, standby letters of credit to the Company. At December 31, 2008, the Company had $6.8 million of outstanding letters of credit issued against this line of credit.
Note 8 - Real Estate Exit Costs
During 2004, the Company determined there was excess real estate capacity in its Life Sciences vertical within the ES segment and the MRI segment. The Company ceased using these properties and, in accordance with SFAS No. 146,Accounting for Costs of Exit or Disposal Activities (“SFAS No. 146”), the Company recorded pre-tax charges of $2.9 million, of which $0.6 million related to abandoned leasehold improvements and $2.3 million related to operating lease terminations. In 2005, management recorded an additional expense of $0.6 million for operating lease terminations, of which $0.2 million was charged to the CDI Engineering Solutions segment and $0.4 million was charged to the MRI segment. These additional charges were caused by a longer than expected timeframe to sublease the previously vacated properties. In December 2006, a joint venture, in which the Company’s ES segment is a member, entered into a master services agreement with a customer. To support this business expansion, the ES segment entered into a subleasearrangement to occupy the space vacated by the MRI segment in 2004. On a consolidated basis, the MRI segment’s portion of the liability no longer qualifies for accrual under SFAS No. 146 and the Company has reversed the remaining liability balance of $0.8 million. By the end of 2006, the activity associated with these real estate exit costs was substantially completed and any remaining balance activity in 2007 and 2008 was immaterial.
These amounts are included in operating and administrative expenses in the accompanying consolidated statements of earnings and consolidated balance sheet.
The table presented below shows the activity by reportable segments for 2006. The activity in 2007 and 2008 was immaterial.
| | | | | | | | | | | | |
| | | Engineering
Solutions | | | MRI | | | Totals | |
Balance as of December 31, 2005 | | $ | 63 | | | $ | 1,290 | | | $ | 1,353 | |
Additional charges for (reversal of) real estate exit costs | | | 139 | | | | (819 | ) | | | (680 | ) |
Payments | | | (114 | ) | | | (471 | ) | | | (585 | ) |
Balance as of December 31, 2006 | | $ | 88 | | | $ | - | | | $ | 88 | |
Note 9 - Discontinued Operations
On September 28, 2007, the Company sold all of the issued and outstanding common stock of its Todays Staffing, Inc. (“Todays”) subsidiary. The sale price was $40.1 million in cash and the Company retained responsibility for certain liabilities and certain current and deferred income taxes directly related to the business. The Company recorded a gain of $2.1 million ($1.3 million after-tax), which included a $2.5 million reclassification adjustment for foreign currency translation gain included in net income, in connection with the sale. The sale price was subject to a working capital adjustment of $0.7 million, which was agreed to and paid by the Company during the first quarter of 2008. Included in “Accrued compensation and related expenses” and “Other accrued expenses and other liabilities” of continuing operations at December 31, 2008 are $0.3 million of other transaction-related liabilities.
In accordance with SFAS No. 144,Accounting for the Impairment or Disposal of Long-Lived Assets(“SFAS No. 144”), the financial results of the Todays business segment have been presented as discontinued operations in the consolidated financial statements for all periods presented.
48
Notes to Consolidated Financial Statements
(In thousands, except share and per share amounts, unless otherwise indicated)
The results of discontinued operations are summarized as follows:
| | | | | | | | | |
| | | 2008 | | 2007 | | 2006 |
Net Revenue | | $ | - | | $ | 117,168 | | $ | 151,869 |
Earnings before income taxes from discontinued operations | | | - | | | 1,642 | | | 3,968 |
Income tax expense | | | - | | | 613 | | | 1,457 |
Earnings from discontinued operations, net of taxes | | | - | | | 1,029 | | | 2,511 |
Gain from disposal of discontinued operations, net of taxes of $741 | | | - | | | 1,345 | | | - |
Total earnings from discontinued operations, net of taxes | | $ | - | | $ | 2,374 | | $ | 2,511 |
Note 10 - Stock-Based Compensation
On January 1, 2006, the Company adopted SFAS No. 123(R), which requires all share-based payments to employees to be recognized as an expense based on the estimated fair value of the award on the date of grant. The Company elected the modified prospective transition method which does not require restatement of prior periods. The Company used the Black-Scholes option pricing model to estimate the fair value of all share-based awards. Compensation cost includes the estimated fair value of all share-based awards which were not fully vested as of January 1, 2006 and the estimated fair value of all share-based awards granted subsequent to January 1, 2006. Compensation expense, less expected forfeitures, is being recognized over the service period on a straight-line basis. Under SFAS No. 123(R), the estimated forfeiture method is required such that expected future forfeitures of non-vested awards are reflected as a reduction of stock-based compensation expense. Estimated forfeitures may need to be revised in subsequent periods if actual forfeitures differ from estimates. However, SFAS No. 123(R) does not allow a subsequent reduction of compensation expense if a vested share-based payment is later forfeited, as would occur when an out-of-the money stock option is surrendered by a resigning employee. Forfeitures were estimated at the time of grant and were based upon historical experience.
The Company has two stock-based compensation plans, the CDI Corp. 2004 Omnibus Stock Plan (the “Omnibus Plan”) and the Amended and Restated CDI Corp. Stock Purchase Plan for Management Employees and Non-Employee Directors (the “Stock Purchase Plan”). The Omnibus Plan replaced the Amended and Restated CDI Corp. 1998 Non-Qualified Stock Option Plan and the earlier Non-Qualified Stock Option and Stock Appreciation Rights Plan. The Omnibus Plan allows eligible employees to receive awards of stock options, stock appreciation rights, restricted stock, time-vested deferred stock and performance-based deferred stock. Under the Stock Purchase Plan, certain employees and non-employee directors may purchase units which, upon vesting, convert into shares of the Company’s common stock with a portion of bonuses for employees or retainer fees for non-employeedirectors. As of December 31, 2008, the Company has reserved 2,372,979 shares of common stock for issuance of stock based awards under the Company’s Omnibus Plan and 134,036 shares of common stock for issuance under the Company’s Stock Purchase Plan.
On December 21, 2007, the Company and its Chief Executive Officer (“CEO”) entered into a new employment agreement that amended and extended a previous employment agreement which was signed on August 11, 2005 and was scheduled to expire on September 30, 2008. The new agreement was effective as of January 1, 2008 and extended the term of the CEO’s employment to March 31, 2011. In addition to base salary and cash bonuses, in each of 2009, 2010 and 2011, the CEO will receive shares of Time-Vested Deferred Stock with a dollar value of $281,250 which will vest over the years 2009, 2010 and 2011. The CEO will also be eligible to receive grants of Performance-Contingent Deferred Stock in 2009, 2010 and 2011. The dollar value of these grants will be based primarily on whether various performance criteria are satisfied and if he remains employed by the Company. These shares will also vest over the years 2009, 2010 and 2011.
Stock-based compensation expense is included in operating and administrative expenses in the consolidated statement of earnings and amounted to $3,836 ($2,413, net of tax), $3,243 ($2,101, net of tax) and $2,071 ($1,323, net of tax) for the years ended December 31, 2008, 2007 and 2006, respectively. The table below summarizes the components of stock-based compensation expense for all of the Company’s stock-based plans for the years ended December 31, 2008, 2007, and 2006:
| | | | | | | | | |
| | | 2008 | | 2007 | | 2006 |
Stock options | | $ | 542 | | $ | 919 | | $ | 1,122 |
Stock appreciation rights | | | 718 | | | 486 | | | 259 |
Time-vested deferred stock | | | 1,466 | | | 712 | | | 327 |
Restricted stock | | | 358 | | | 264 | | | 123 |
Performance contingent deferred stock | | | 540 | | | 618 | | | - |
Stock purchase plan | | | 212 | | | 244 | | | 240 |
| | | $ | 3,836 | | $ | 3,243 | | $ | 2,071 |
Stock Options
The table below summarizes the fair value of options granted during the years ended December 31, 2007 and 2006 and the assumptions utilized to estimate the fair value. No options were granted during the year ended December 31, 2008.
| | | | | | | | |
| Options | | 2007 | | | 2006 | |
Risk-free interest rate | | | 4.589 | % | | | 4.625 | % |
Expected life of options | | | 1.7 years | | | | 5.0 years | |
Expected stock price volatility | | | 54 | % | | | 37 | % |
Expected dividend yield | | | 1.51 | % | | | 1.53 | % |
Weighted-average fair value at grant date | | $ | 8.39 | | | $ | 9.87 | |
Options are granted at a price equal to or greater than the quoted market price per share of the Company’s common stock on the date of grant. Employee stock options generally vest
49
Notes to Consolidated Financial Statements
(In thousands, except share and per share amounts, unless otherwise indicated)
ratably over a five year period and expire seven years from the date of grant. In estimating the expected term of the options, the Company utilized the “simplified method” allowable under SEC Staff Accounting Bulletin No. 107,Share-Based Payment(“SAB No. 107”) for 2007 and 2006. The expected stock price volatility is based on the historical volatility of the Company’s common stock over the previous five years for 2006 and 1.7 years for 2007.
The following table summarizes the Company’s stock option activity and related information for the years ended December 31, 2008, 2007 and 2006:
| | | | | | | | | | | |
| | | Options | | | Weighted
Average
Exercise
Price | | Weighted
Average
Remaining
Contractual
Life | | Aggregate
Intrinsic
Value |
Outstanding at January 1, 2006 | | 913,434 | | | $ | 22.75 | | | | | |
Granted | | 17,000 | | | | 28.78 | | | | | |
Exercised | | (122,460 | ) | | | 21.26 | | | | | |
Cancelled | | (45,030 | ) | | | 27.10 | | | | | |
Outstanding at December 31, 2006 | | 762,944 | | | $ | 22.87 | | | | | |
Granted | | 25,000 | | | | 29.23 | | | | | |
Exercised | | (290,070 | ) | | | 19.59 | | | | | |
Cancelled | | (21,635 | ) | | | 24.58 | | | | | |
Outstanding at December 31, 2007 | | 476,239 | | | $ | 24.75 | | | | | |
Granted | | - | | | | - | | | | | |
Exercised | | (2,200 | ) | | | 23.24 | | | | | |
Cancelled | | (53,547 | ) | | | 35.58 | | | | | |
Outstanding at December 31, 2008 | | 420,492 | | | $ | 23.38 | | 1.7 | | $ | - |
Exercisable at December 31, 2008 | | 393,223 | | | $ | 23.01 | | 1.7 | | $ | - |
Aggregate intrinsic value represents the difference between the exercise prices and the closing stock price on December 31, 2008. The total intrinsic value of stock options exercised during the year ended December 31, 2008 was not material based on the difference between the exercise price and the closing stock price on the date of exercise.
As of December 31, 2008, total unrecognized compensation cost related to unvested stock options was $71 and will be recognized over the remaining weighted-average service period of 0.3 years.
Stock Appreciation Rights (“SARs”)
The following table summarizes the fair value of SARs granted for the years ended December 31, 2008, 2007 and 2006, respectively, and the assumptions utilized to estimate the fair value:
| | | | | | | | | | | | |
| SARs | | 2008 | | | 2007 | | | 2006 | |
Risk-free interest rate | | | 2.48 - 3.25 | % | | | 4.26 - 5.07 | % | | | 4.56 - 5.08 | % |
Expected life of SARs | | | 5.0 years | | | | 5.0 years | | | | 5.0 years | |
Expected stock price volatility | | | 38 - 43 | % | | | 36 | % | | | 37 | % |
Expected dividend yield | | | 1.82 - 3.98 | % | | | 1.36 -1.66 | % | | | 1.53 - 2.15 | % |
Weighted-average fair value at grant date | | $ | 3.70 - 9.20 | | | $ | 8.79 - 11.41 | | | $ | 6.73 - 9.71 | |
SARs generally vest ratably over a five year period and expire seven years from the date of grant. Upon exercise, the amount of appreciation in stock price, minus withholding taxes, is payable in shares of common stock. In estimating the expected term of the SARs, the Company has utilized the “simplified method” allowable under SAB No. 107. The expected stock price volatility is based on the historical volatility of the Company’s common stock over the previous five years.
50
Notes to Consolidated Financial Statements
(In thousands, except share and per share amounts, unless otherwise indicated)
The following table summarizes the Company’s SARs activity and related information for the years ended December 31, 2008, 2007 and 2006:
| | | | | | | | | | | |
| | | SARs | | | Weighted
Average
Exercise
Price | | Weighted
Average
Contractual
Life | | Aggregate
Intrinsic
Value |
Outstanding at January 1, 2006 | | 138,568 | | | $ | 21.41 | | | | | |
Granted | | 188,475 | | | | 25.76 | | | | | |
Exercised | | (5,976 | ) | | | 21.31 | | | | | |
Cancelled | | (53,657 | ) | | | 23.67 | | | | | |
Outstanding at December 31, 2006 | | 267,410 | | | $ | 24.02 | | | | | |
Granted | | 190,579 | | | | 26.94 | | | | | |
Exercised | | (18,680 | ) | | | 22.98 | | | | | |
Cancelled | | (48,388 | ) | | | 24.82 | | | | | |
Outstanding at December 31, 2007 | | 390,921 | | | $ | 25.40 | | | | | |
Granted | | 179,464 | | | | 24.57 | | | | | |
Exercised | | (10,723 | ) | | | 23.85 | | | | | |
Cancelled | | (116,565 | ) | | | 25.30 | | | | | |
Outstanding at December 31, 2008 | | 443,097 | | | $ | 25.13 | | 5.1 | | $ | - |
Exercisable at December 31, 2008 | | 100,048 | | | $ | 24.73 | | 4.2 | | $ | - |
Aggregate intrinsic value represents the difference between the exercise prices and the closing stock price on December 31, 2008. The total intrinsic value of SARs exercised during the year ended December 31, 2008 was not material, based on the difference between the exercise price and the closing stock price on the date of exercise.
As of December 31, 2008, total unrecognized compensation cost related to non-vested SARs was $2.1 million and will be recognized over the remaining weighted-average service period of 2.8 years.
Restricted Stock
During 2008, the Company issued 20,000 shares of restricted common stock, of which 10,000 vested at December 31, 2008 and the remaining 10,000 will vest on December 31, 2009. Shares that do not vest are forfeited. During 2007, the Company issued 9,500 shares of restricted common stock, all of which vested during 2007 and 2008. At December 31, 2008, there were 10,000 unvested shares outstanding.
Compensation cost on restricted stock is based on the fair value of the Company’s common stock on the date of grant and ischarged to earnings on a straight line basis over the vesting period. Upon vesting, the holder receives unrestricted common stock and is credited with additional shares of CDI common stock having a fair market value equal to the sum of the dividends that would have been paid on the restricted stock during the vesting period. To the extent that restricted shares are forfeited, the forfeited shares will be included in treasury stock.
Time-Vested Deferred Stock (“TVDS”)
TVDS entitles each recipient to receive a number of shares of CDI common stock upon vesting. The shares of TVDS vest 20% on each of the next five anniversaries of the date of grant. TVDS will generally be forfeited prior to vesting if the holder’s employment with the Company ends. Upon vesting, a holder of TVDS receives the original awarded shares plus additional shares of CDI common stock having a fair market value equal to the sum of the dividends that would have been paid on the original awarded shares during the vesting period had they been issued and outstanding during that period. Compensation cost on TVDS is based on the fair value of the Company’s common stock on the date of grant and is charged to earnings on a straight-line basis over the vesting period.
51
Notes to Consolidated Financial Statements
(In thousands, except share and per share amounts, unless otherwise indicated)
The following table summarizes the Company’s TVDS activity and related information for the years ended December 31, 2008, 2007 and 2006:
| | | | | | | | |
| | | Time Vested
Deferred
Stock | | | Weighted
Average
Grant
Date Fair
Value | | Weighted
Average
Contractual
Life |
Outstanding at January 1, 2006 | | 39,501 | | | $ | 22.07 | | |
Granted | | 56,596 | | | | 25.90 | | |
Vested | | (8,465 | ) | | | 21.98 | | |
Cancelled | | (13,935 | ) | | | 23.25 | | |
Outstanding at December 31, 2006 | | 73,697 | | | $ | 24.80 | | 4.2 |
Dividend Shares Outstanding at December 31, 2006 | | 1,191 | | | $ | 24.90 | | - |
Total Outstanding at December 31, 2006 | | 74,888 | | | $ | 24.80 | | 4.2 |
Granted | | 44,993 | | | $ | 28.69 | | |
Vested | | (14,942 | ) | | | 24.71 | | |
Cancelled | | (6,726 | ) | | | 24.39 | | |
Outstanding at December 31, 2007 | | 97,022 | | | $ | 26.65 | | 3.4 |
Dividend Shares Outstanding at December 31, 2007 | | 2,440 | | | $ | 25.89 | | - |
Total Outstanding at December 31, 2007 | | 99,462 | | | $ | 26.63 | | 3.4 |
Granted | | 50,951 | | | $ | 26.11 | | |
Vested | | (20,178 | ) | | | 25.30 | | |
Cancelled | | (12,156 | ) | | | 25.03 | | |
Outstanding at December 31, 2008 | | 115,639 | | | $ | 26.82 | | 2.7 |
Dividend Shares Outstanding at December 31, 2008 | | 3,735 | | | $ | 26.16 | | - |
Total Outstanding at December 31, 2008 | | 119,374 | | | $ | 26.80 | | 2.7 |
Performance-Contingent Deferred Stock (“PCDS”)
PCDS awards are earned based on achievement of predetermined goals under the Omnibus Plan and generally vest over a two year period. The fair value of the awards is determined on the date of grant. If the Company determines the achievement of the performance conditions is probable, there will be charges to earnings on a straight-line basis over the vesting period. No awards were earned during 2008 or 2006. During 2007, the performance conditions were met, which resulted in 49,362 awards earned of which 24,681 vested in March 2008, 5,673 were cancelled and 19,008 will vest in March 2009.
Stock Purchase Plan (“SPP”)
Under the terms of the SPP, designated employees and non-employee directors have the opportunity to purchase shares of the Company’s common stock on a pre-tax basis. Employee participants use a portion of their annual bonus awards to purchase SPP units. Certain senior management personnel are required to participate by using 25% of their annual bonus awards to purchase SPP units and can elect participation for up to an additional 25%. Other employee participants can elect to use up to 25% of their annual bonus amount. Non-employee directors may participate by using some or all of their retainer fees to purchase SPP units. The Company makes a matching contribution of one SPP unit for every three SPP units purchased by a participant on a voluntary basis. Vesting of SPP units occurs over a period of three to ten years as chosen by the participant. There are 104,283 SPP units (including Company matching SPP units) accumulated as of December 31, 2008. The SPP units were determined using a weighted average market price of $24.16 per share.
Note 11 - Capital Stock
Changes in common shares issued and treasury shares for the years ended December 31, 2008, 2007, and 2006 are as follows:
| | | | | | | |
| | | 2008 | | 2007 | | | 2006 |
Shares issued | | | | | | | |
Beginning of year | | 21,300,352 | | 20,975,230 | | | 20,789,972 |
Exercise of stock options | | 2,200 | | 290,070 | | | 122,460 |
Exercise of stock appreciation rights | | 753 | | 3,023 | | | 795 |
Performance-Contingent Deferred stock | | 15,736 | | - | | | - |
Time-Vested Deferred stock | | 13,665 | | 10,194 | | | 5,586 |
Restricted stock | | 20,000 | | 9,500 | | | 5,000 |
Stock purchase plans | | 8,702 | | 12,335 | | | 51,417 |
End of year | | 21,361,408 | | 21,300,352 | | | 20,975,230 |
Treasury shares | | | | | | | |
Beginning of year | | 966,706 | | 966,934 | | | 966,934 |
Repurchase of stock | | 1,489,469 | | - | | | - |
Restricted stock forfeiture | | - | | (228 | ) | | - |
End of year | | 2,456,175 | | 966,706 | | | 966,934 |
Note 12 - Basic and Diluted Earnings Per Share (“EPS”) Data
The following table reconciles the denominator used to compute basic EPS to the denominator used to compute diluted EPS for the fiscal years ended December 31 2008, 2007 and 2006:
| | | | | | | | | |
| | | 2008 | | | 2007 | | | 2006 | |
Basic | | | | | | | | | |
Average shares outstanding | | 19,895,148 | | | 20,221,492 | | | 19,948,689 | |
Restricted shares issued not vested | | (20,662 | ) | | (12,734 | ) | | (4,667 | ) |
| | | 19,874,486 | | | 20,208,758 | | | 19,944,022 | |
Diluted | | | | | | | | | |
Shares used for basic calculation | | 19,874,486 | | | 20,208,758 | | | 19,944,022 | |
Dilutive effect of shares / units granted under Omnibus Stock Plan | | 44,805 | | | 113,684 | | | 98,743 | |
Dilutive effect of units issuable under Stock Purchase Plan | | 89,959 | | | 54,092 | | | 46,854 | |
| | | 20,009,250 | | | 20,376,534 | | | 20,089,619 | |
52
Notes to Consolidated Financial Statements
(In thousands, except share and per share amounts, unless otherwise indicated)
Outstanding employee shares and units granted under the Omnibus Stock Plan of 887 thousand, 624 thousand and 533 thousand shares were excluded from the computation of EPS for the years ended December 31, 2008, 2007 and 2006, respectively, because their effect would have been anti-dilutive.
Note 13 - Income Taxes
Earnings from continuing operations before income taxes for the years ended December 31, 2008, 2007, and 2006 were as follows:
| | | | | | | | | |
| | | 2008 | | 2007 | | 2006 |
United States | | $ | 26,233 | | $ | 36,423 | | $ | 23,462 |
Foreign | | | 2,489 | | | 12,716 | | | 9,025 |
| | | $ | 28,722 | | $ | 49,139 | | $ | 32,487 |
Income tax expense (benefit) from continuing operations for the years ended December 31, 2008, 2007 and 2006 was comprised of the following:
| | | | | | | | | | | | | | | |
| | | Total | | | Federal | | | State | | Foreign | |
2008 | | | | | | | | | | | | | | | |
Current | | $ | 9,559 | | | $ | 8,413 | | | $ | 1,718 | | $ | (572 | ) |
Deferred | | | (252 | ) | | | (280 | ) | | | 114 | | | (86 | ) |
| | | $ | 9,307 | | | $ | 8,133 | | | $ | 1,832 | | $ | (658 | ) |
2007 | | | | | | | | | | | | | | | |
Current | | $ | 21,686 | | | $ | 16,876 | | | $ | 1,276 | | $ | 3,534 | |
Deferred | | | (4,375 | ) | | | (4,818 | ) | | | 399 | | | 44 | |
| | | $ | 17,311 | | | $ | 12,058 | | | $ | 1,675 | | $ | 3,578 | |
2006 | | | | | | | | | | | | | | | |
Current | | $ | 10,035 | | | $ | 7,542 | | | $ | 261 | | $ | 2,232 | |
Deferred | | | 1,700 | | | | 995 | | | | 196 | | | 509 | |
| | | $ | 11,735 | | | $ | 8,537 | | | $ | 457 | | $ | 2,741 | |
The following table reconciles income tax expense based on the US statutory rate to the Company’s income tax expense related to continuing operations for the years ended December 31, 2008, 2007 and 2006:
| | | | | | | | | | | | |
| | | 2008 | | | 2007 | | | 2006 | |
Income tax expense based on the US statutory rate | | $ | 10,053 | | | $ | 17,199 | | | $ | 11,370 | |
State income taxes, net of federal tax benefit | | | 1,386 | | | | 2,611 | | | | 385 | |
Permanent items | | | 338 | | | | 165 | | | | 222 | |
Tax exempt interest | | | (542 | ) | | | (427 | ) | | | - | |
Canadian Scientific Research and Experimental Development (“SRED”) incentive program | | | (3,028 | ) | | | (855 | ) | | | (678 | ) |
Effect of foreign operations | | | 585 | | | | (207 | ) | | | 28 | |
Recognition of a US benefit in relation to an international tax matter | | | (653 | ) | | | - | | | | - | |
Adjustments to current taxes receivable, pertaining to prior years | | | 1,185 | | | | - | | | | - | |
Change in valuation allowance—Federal capital loss carryforwards | | | (189 | ) | | | 380 | | | | - | |
Change in valuation allowance—State loss carryforwards | | | (195 | ) | | | (1,523 | ) | | | 267 | |
Other | | | 367 | | | | (32 | ) | | | 141 | |
| | | $ | 9,307 | | | $ | 17,311 | | | $ | 11,735 | |
Canadian SRED Tax Incentive
Prior to the third quarter of 2008, the Company recorded benefits from the Canadian SRED tax incentive program in the period its claims were approved by the Canadian government. The Company recorded benefits in this manner because of the uncertain nature of the claims process and related inability to reliably estimate the benefit from the Canadian SRED program. During the third quarter of 2008, the Company received approval from the Canadian government related to its claims for the 2005 and 2006 years. Based on these approvals, management concluded that it could reliably estimate the credits available before obtaining approval from the Canadian government. Consequently, the Company began accruing an estimate for the credit attributable to 2007 and 2008 in addition to the benefits recorded with respect to 2005 and 2006. The estimate related to prior years is separately disclosed in the rate reconciliation above. The amount related to 2008 of approximately $0.1 million is included as part of the effect of foreign operations.
The tax effects of temporary differences that give rise to the Company’s deferred tax accounts as of December 31, 2008 and 2007 were as follows:
| | | | | | | | |
| | | 2008 | | | 2007 | |
Deferred tax assets: | | | | | | | | |
Expenses not currently deductible (principally compensation-related and bad debt reserves) | | $ | 12,305 | | | $ | 10,084 | |
Intangible asset amortization | | | 806 | | | | 2,942 | |
Loss carryforwards | | | 4,893 | | | | 5,380 | |
Total gross deferred tax assets | | | 18,004 | | | | 18,406 | |
Less: valuation allowance | | | (885 | ) | | | (1,269 | ) |
Net total deferred tax assets | | | 17,119 | | | | 17,137 | |
Deferred tax liabilities: | | | | | | | | |
Deferral of revenues | | | (1,292 | ) | | | (1,939 | ) |
Fixed asset depreciation | | | (2,241 | ) | | | (1,872 | ) |
Other | | | (713 | ) | | | (705 | ) |
Total deferred tax liabilities | | | (4,246 | ) | | | (4,516 | ) |
Net deferred tax assets | | $ | 12,873 | | | $ | 12,621 | |
The valuation allowance primarily relates to the reduction of state loss carryforwards to a level which, more likely than not, will be realized and the reduction of a capital loss carryforward created by the disposition of property previously held for sale. The total valuation allowance for the years ended December 31, 2008 and 2007 decreased by $384 and $1,143, respectively, due to net changes in the valuation allowance attributable to state loss carryforwards and capital loss carryforwards.
At December 31, 2008, for state income tax purposes, there are operating loss carryforwards aggregating approximately $86.0 million expiring in varying amounts from 2009 through 2028. Realization is dependent upon generating sufficient state taxable income in the appropriate jurisdiction prior to expiration of the loss carryforwards. Although realization is not assured, management believes it is more likely than not that the deferred tax asset, net of the valuation allowance, will be realized. The
53
Notes to Consolidated Financial Statements
(In thousands, except share and per share amounts, unless otherwise indicated)
amount of the deferred tax asset considered realizable could be reduced if estimates of future state taxable income during the carryforward period are reduced.
Effective January 1, 2007, the Company adopted the provisions of FIN 48, an interpretation of SFAS No. 109. Implementation of FIN 48 did not result in a cumulative effect adjustment to retained earnings. At December 31, 2008, the Company had approximately $1,322 of total gross unrecognized tax benefits. The net unrecognized tax benefit of $669, if recognized, would impact the effective tax rate. The Company does not expect the amount of gross unrecognized tax benefits to significantly change in the next 12 months. A reconciliation of the beginning and ending amount of gross unrecognized tax benefits for the years ending December 2008 and 2007 is as follows:
| | | | |
Gross unrecognized tax benefits upon adoption at January 1, 2007 | | $ | 1,492 | |
Additions for tax provisions of prior years | | | 175 | |
Reductions for settlements and payments | | | (108 | ) |
Gross unrecognized tax benefits at December 31, 2007 | | $ | 1,559 | |
Additions based on tax positions related to the current year | | | 333 | |
Additions for tax provisions of prior years | | | 37 | |
Reductions for settlements and payments | | | (589 | ) |
Reductions due to statute expiration | | | (18 | ) |
Gross unrecognized tax benefits at December 31, 2008 | | $ | 1,322 | |
The Company accounts for interest and penalties related to income tax matters in income tax expense. Approximately $379 of interest and penalties are accrued at December 31, 2008, $148 of which was recorded during 2008. The Company files a consolidated US Federal income tax return and files state and foreign income tax returns in various jurisdictions as required. The US Federal tax return is open for examination back to 2005. State and foreign income tax returns remain open for examination back to 2003 in major jurisdictions in which the Company operates.
The Company has not recorded deferred income taxes on the undistributed earnings of its foreign subsidiaries because it is management’s intention to reinvest such earnings for the foreseeable future. At December 31, 2008, the undistributed earnings of the foreign subsidiaries amounted to approximately $54 million. Upon distribution of these earnings in the form of dividends or otherwise, the Company may be subject to US income taxes and foreign withholding taxes, offset by foreign tax credits.
Note 14 - Derivative Instruments
During the first quarter of 2008, the Company entered into zero cost collar option contracts (“options”) to hedge portions of its British pounds sterling, Euros, Canadian dollar and Australian dollar currency forecasted amounts. These options had a range of foreign exchange rates, which provided a hedge against foreign results that are translated at rates outside the range. These options did not have a premium. The options were for various amounts in local currency and expired respectively at the end ofthe first, second, third and fourth quarters in 2008. Under SFAS No. 133,Accounting for Derivative Instruments and Hedging Activities(“SFAS No. 133”), these instruments are accounted for at fair value. Because the Company could not designate these options as hedges for accounting purposes, foreign exchange revaluation gains or losses are reflected in earnings currently, while the impact of translating the foreign based income into US dollars is recognized throughout the year. For the year ended December 31, 2008, the Company recorded a net gain of $1.1 million related to these options, all of which was realized. The net gains were recorded in interest income and other expense in the consolidated statements of earnings. At December 31, 2008 there were no outstanding foreign exchange options.
During the first quarter of 2007, the Company purchased foreign exchange options to hedge portions of its British pounds sterling, Euros and Canadian dollar currency forecasted amounts. The options were for various amounts in local currency and expired respectively at the end of the second, third and fourth quarters in 2007. Under SFAS No. 133, these instruments were accounted for at fair value. Because the Company could not designate these options as hedges for accounting purposes, foreign exchange revaluation gains or losses were reflected in earnings immediately while the impact of translating the foreign based income into US dollars is recognized throughout the year. For the year ended December 31, 2007, the Company recognized an immaterial loss. At December 31, 2007 there were no outstanding foreign exchange options.
During the first quarter of 2006, the Company entered into foreign exchange forward contracts to hedge portions of its British pounds sterling and Canadian dollar forecasted amounts. Throughout the year, a British pound sterling and Canadian dollar forward contract matured on the last day of each fiscal quarter. Under SFAS No. 133, these instruments were accounted for at fair value. Because the Company could not designate these options as hedges for accounting purposes, foreign exchange revaluation gains or losses were reflected in earnings immediately while the impact of translating the foreign based income into US dollars is recognized throughout the year. For the year ended December 31, 2006, the Company recognized a loss of $0.9 million relating to the forward exchange contracts which matured in 2006. At December 31, 2006 there were no outstanding contracts.
Note 15 - Legal Proceedings and Claims
The Company has litigation and other claims pending which have arisen in the ordinary course of business.
In June 2006, the United Kingdom’s Office of Fair Trading (“OFT”) opened an investigation into alleged anti-competitive behavior by Anders and a number of its competitors in the UK construction recruitment industry. The Company has fully
54
Notes to Consolidated Financial Statements
(In thousands, except share and per share amounts, unless otherwise indicated)
cooperated with the OFT in the investigation under the OFT’s corporate leniency program. On October 21, 2008, the OFT issued a Statement of Objections in which the OFT proposes to make a finding that Anders violated the UK Competition Act of 1998. In response to the Statement of Objections, on January 16, 2009 the Company submitted written representations to the OFT and on February 18, 2009 the Company made an oral presentation to the OFT. Although the Statement of Objections does not propose a specific fine, based on the contents of the Statement of Objections, the Company continues to believe that a fine will be imposed and that the amount of such fine could be material. The Company believes it is reasonably possible that the OFT will levy a fine in the near term. The Company does not believe the Statement of Objections provides sufficient new information for the Company to determine, with any reliability, the amount of the fine or an estimated range of the fine, nor does the document make it clear when the Company might be able to reach a reliable estimate. The Company has not made any provisions for any fine or other liabilities relating to this matter in its consolidated financial statements as of December 31, 2008.
In March 2007, the Company received notification of its successful appeal of a 2004 state court judgment against the Company. Thereafter, the other party petitioned the state supreme court to accept the appeal of this decision and that petition was denied. In March 2007, the Company reversed the $1.6 million legal accrual previously recorded for this matter to operating and administrative expenses.
Note 16 - Retirement Plans
Trusteed contributory and non-contributory defined contribution retirement plans have been established for the benefit of eligible employees. Costs of the plans are charged to earnings and are based on either a formula using a percentage of compensation or an amount determined by the Board of Directors. Charges to earnings for these retirement plans for the years ended December 31, 2008, 2007 and 2006 were $2,368, $2,588 and $1,818, respectively.
Note 17 - Lease Commitments and Other Contractual Obligations
Office facilities used for sales, recruitment, engineering, design, drafting and administrative functions are occupied under numerous leases that expire through 2016. In addition, there are leases for computers and office equipment. Due primarily to prior year exit costs, CDI had entered into several non-cancelable sublease arrangements which expired in 2006.
Rental expenses and sublease proceeds for the years ended December 31, 2008, 2007 and 2006 are as follows:
| | | | | | | | | |
| | | 2008 | | 2007 | | 2006 |
Rental expense | | $ | 14,187 | | $ | 13,593 | | $ | 13,931 |
Sublease proceeds | | | 190 | | | 43 | | | 72 |
For periods after December 31, 2008, approximate minimum annual rental payments under non-cancelable leases are presented in the table below.
| | | | | | | | | | | | | | | | | | |
| | | 2009 | | 2010 | | 2011 | | 2012 | | 2013 | | Thereafter |
Future minimum lease payments on non-cancelable leases | | $ | 11,645 | | $ | 10,278 | | $ | 8,671 | | $ | 6,891 | | $ | 4,208 | | $ | 5,506 |
The Company maintains global master agreements with two large on-line job posting and search services for the benefit of its operating segments and MRI franchise network. The agreements are for one and three years, and provide volume pricing benefits in return for guaranteed minimum payments. At December 31, 2008, the aggregate minimum payments for the years ended 2009 and 2010 are $1,118 and $3,308, respectively. The Company has historically exceeded the contract minimums; however, given the current economic conditions, there is uncertainty regarding its ability to meet or exceed these minimums in 2009.
Note 18 - Related Party Transactions
The Company obtains legal services from a law firm whose chairman is a member of the Company’s Board of Directors. Total disbursements to the law firm relating to these items aggregated approximately $0.9 million, $0.8 million and $0.8 million in 2008, 2007 and 2006, respectively.
The former President of the Company’s subsidiary, MRI, owned, and may still own, a 25% indirect interest in MRI Worldwide Network, Limited, MRI’s former principal international master franchisee. At December 31, 2008, amounts due from MRI Worldwide Network Limited amounted to $0.7 million, which are past due as a result of operating and managerial issues at the Company’s former UK based international master licensee. The Company recorded a provision of $0.7 million relating to this matter in the Company’s consolidated financial statements during 2008.
In October 2008, the Company purchased 71,797 shares of the Company’s common stock from a son of the Company’s Chairman for $0.9 million, which was at the closing market price on the date of the transaction.
Note 19 - Sale of International Master Franchise
Effective April 1, 2006, the Company entered into an international master franchise agreement, which transferred to a third party all existing international franchise agreements as well as the right to enter into new franchise agreements abroad, with
55
Notes to Consolidated Financial Statements
(In thousands, except share and per share amounts, unless otherwise indicated)
the exception of existing or future franchises in Japan. The Company received an initial franchise fee of $0.3 million upon execution of the agreement and receives a portion of the franchise fees for all new franchises sold by the master franchisee. The agreement also provided for the Company to receive royalty payments. In addition, the Company transferred an office lease and certain employees and sold fixed assets for $0.1 million, which amount approximated the aggregate net book value of those fixed assets.
On January 22, 2009, the Company terminated its master franchise agreement with MRI Worldwide Network, Limited and had assigned to it the benefit of the franchise agreements of MRI Worldwide Network, Limited’s sub-franchisees. Subsequently, the Company has been operating the business.
Note 20 - Joint Ventures
CDI Gulf International (“CGI”)
In June 2008, the Company and another engineering firm formed a joint venture called CGI, in which the Company owns a 49% interest. As part of the initial agreement, the Company invested $4.1 million in CGI. The Company accounted for the payment as an initial investment in a non-consolidated subsidiary. The total value of the investment at December 31, 2008 is $3.6 million, which is included in “Other assets” in the consolidated balance sheet.
During 2008, the Company incurred a $0.4 loss in the joint venture. Net foreign exchange translation differences decreased the value of the investment asset by $0.1 million.
CTQ Engineering LLC (“CTQ”)
In December 2006, the Company and two other engineering firms formed a joint venture called CTQ, in which the Company owned a 33% interest. The joint venture had no substantive operations during 2006.
In December of 2006, CTQ entered into an engineering master services agreement with a customer. In connection with this contract, the Company made a $1.3 million payment to the joint venture as its portion of the amount subsequently paid to the customer. The Company accounted for the payment as a deferred charge as it anticipates significant future business from the customer. The asset is being amortized on a straight-line basis over the five year life of the contract as a reduction of revenues. $0.2 million was amortized during 2007. At December 31, 2007, $0.3 million of the remaining deferred charge was included in “Prepaid expenses and other assets” and an additional $0.8 million was included in “Other assets” in the consolidated balance sheet.
In July 2008, the Company purchased TK Engineering, one of the partners in the joint venture. As a result of the transaction, the Company increased its interest in CTQ to 50%. The deferred charges asset discussed above continues to be amortized on a straight-line basis over the life of the contract as a reduction of revenues. $0.3 million was amortized in 2008. At December 31, 2008, $0.3 million of the remaining asset is included in “Prepaid expenses and other assets” and $0.5 million is included in “Other assets” in the consolidated balance sheet.
Note 21 - Reporting Segments
Through December 31, 2006, the Company operated through four reporting segments: Business Solutions (“BS”), CDI AndersElite (“Anders”), Todays Staffing (“Todays”), and Management Recruiters International (“MRI”). As of January 1, 2007, the Company began separately reporting CDI Engineering Solutions (“ES”) and CDI IT Solutions (“ITS”), which previously comprised the BS segment. This change reflects the Company’s new operating structure and was intended to provide investors with additional information on the Company’s engineering versus its information technology revenue and operating profit.
As discussed in Note 9 - Discontinued Operations, the Company sold its Todays business segment on September 28, 2007. Since September 30, 2007, the Company has operated through four reporting segments: ES, MRI, Anders and ITS.
ES reports on three verticals, reflecting the decision in the second quarter of 2008 to re-align the management and operations of the CDI-Life Sciences vertical into the CDI-Process & Industrial vertical. As such, ES operates principally through the following three key verticals:
| | Ÿ | | CDI-Process and Industrial (“P&I”)– P&I provides a full range of engineering, design, project management, professional staffing and outsourcing solutions to firms in oil, gas, refining, alternative energy, power generation and energy transmission, nuclear, chemicals and heavy manufacturing industries. In addition, P&I offers facility design, validation, project management, engineering, professional staffing and facility start-up services to customers in the pharmaceutical, bio-pharmaceutical and regulated medical services industries. |
| | Ÿ | | CDI-Government Services (“Government Services”)– Government Services focuses on providing engineering, design and logistics services to the defense industry, particularly in marine design, systems development and military aviation support. |
| | Ÿ | | CDI-Aerospace (“Aerospace”)– Aerospace provides a full range of engineering, design, project management, professional staffing and outsourcing solutions to both the commercial and military aerospace markets. |
MRI is a franchisor that does business as MRINetwork® and provides the use of its trademarks, business systems and training and support services to its franchisees to enable them to engage in the search and recruitment of executive, technical, professional and managerial personnel for employment by their
56
Notes to Consolidated Financial Statements
(In thousands, except share and per share amounts, unless otherwise indicated)
customers. The MRI franchisees provide permanent placement services primarily under the brand names of Management Recruiters®, Sales Consultants®, CompuSearch® and OfficeMates 5®. MRI also provides training implementation services and back-office services to enable franchisees to pursue contract staffing service opportunities.
Anders provides contract and permanent placement candidates to customers in the infrastructure environment seeking staff in building, construction and related professional services through a network of Company offices. The Company maintains offices in the UK and Australia, and many candidates that Anders places in the UK are recruited from Australia and New Zealand.
ITS provides a variety of information technology (“IT”) related services to its customers, which are primarily Fortune 1000 customers with high volume information technology requirements and/or the need to augment their own staff on a flexible basis. Services include staffing augmentation, outsourcing (both on-site and off-site), consulting and permanent placement. During 2008 and 2006, one ITS customer accounted for approximately 10% of the Company’s consolidated revenues. In 2007, no single customer accounted for 10% or more of consolidated revenues.
In accordance with SFAS No. 131,Disclosures about Segments of an Enterprise and Related Information (“SFAS No. 131”), for purposes of business segment performance measurement, the Company charges certain expenses directly attributable to the segments and allocates certain expenses and support costs. Support costs consist principally of employee benefit administration, accounting support, IT services and shared service center costs. Identifiable assets of the business segments exclude corporate assets, which principally consist of cash and certain prepaid expenses, non-trade accounts receivable, deferred tax assets attributable to the former BS segment, property and equipment, and other assets.
The Company has revised the reporting segments’ prior year revenue and operating profit for the ES and ITS split only for comparative purposes. Operating segment data is presented in the following table:
| | | | | | | | | | | | |
| | | 2008 | | | 2007 | | | 2006 | |
Revenue: | | | | | | | | | | | | |
ES | | $ | 603,223 | | | $ | 614,522 | | | $ | 555,091 | |
MRI | | | 74,703 | | | | 77,950 | | | | 67,474 | |
Anders | | | 213,535 | | | | 253,922 | | | | 217,188 | |
ITS | | | 227,136 | | | | 240,905 | | | | 273,664 | |
Total revenue | | $ | 1,118,597 | | | $ | 1,187,299 | | | $ | 1,113,417 | |
| | | |
Operating profit (loss): | | | | | | | | | | | | |
ES | | $ | 27,069 | | | $ | 35,508 | | | $ | 22,474 | |
MRI | | | 9,923 | | | | 15,775 | | | | 14,610 | |
Anders | | | 3,917 | | | | 12,378 | | | | 7,672 | |
ITS | | | 2,320 | | | | 3,113 | | | | 6,444 | |
Corporate | | | (18,277 | ) | | | (19,938 | ) | | | (18,141 | ) |
| | | $ | 24,952 | | | $ | 46,836 | | | $ | 33,059 | |
Less equity in losses from affiliated companies | | | 406 | | | | - | | | | - | |
Total operating profit | | $ | 25,358 | | | $ | 46,836 | | | $ | 33,059 | |
Equity in losses from affiliated companies | | $ | (406 | ) | | $ | - | | | $ | - | |
Interest income and other (expenses), net | | | 3,770 | | | | 2,303 | | | | (572 | ) |
Earnings before income taxes from continuing operations | | $ | 28,722 | | | $ | 49,139 | | | $ | 32,487 | |
The following table reconciles the amount of revenue and operating profit reported for the prior year periods to the revised amounts as shown above:
| | | | | | | | | | |
| | | 2007 |
| | Amounts
previously
reported | | Reclassifications | | | As
Revised |
Revenue: | | | | | | | | | | |
ES | | $ | 617,385 | | $ | (2,863 | ) | | $ | 614,522 |
ITS | | | 238,042 | | | 2,863 | | | | 240,905 |
| | | $ | 855,427 | | $ | - | | | $ | 855,427 |
| |
| | | 2006 |
| | Amounts
previously
reported | | Reclassifications | | | As
Revised |
Revenue: | | | | | | | | | | |
ES | | $ | 557,966 | | $ | (2,875 | ) | | $ | 555,091 |
ITS | | | 270,789 | | | 2,875 | | | | 273,664 |
| | | $ | 828,755 | | $ | - | | | $ | 828,755 |
57
Notes to Consolidated Financial Statements
(In thousands, except share and per share amounts, unless otherwise indicated)
| | | | | | | | | | |
| |
| | | 2007 |
| | Amounts
previously
reported | | Reclassifications | | | As
Revised |
Operating profit (loss): | | | | | | | | | | |
ES | | $ | 36,069 | | $ | (561 | ) | | $ | 35,508 |
ITS | | | 2,552 | | | 561 | | | | 3,113 |
| | | $ | 38,621 | | $ | - | | | $ | 38,621 |
| | | | | | | | | | |
| |
| | | 2006 |
| | Amounts
previously
reported | | Reclassifications | | | As
Revised |
Operating profit (loss): | | | | | | | | | | |
ES | | $ | 23,221 | | $ | (747 | ) | | $ | 22,474 |
ITS | | | 5,697 | | | 747 | | | | 6,444 |
| | | $ | 28,918 | | $ | - | | | $ | 28,918 |
Inter-segment activity is not significant. Therefore, revenues reported for each operating segment are substantially all from external customers.
| | | | | | | | | |
| | | 2008 | | 2007 | | 2006 |
Depreciation and amortization: | | | | | | | | | |
ES | | $ | 5,661 | | $ | 4,884 | | $ | 4,038 |
MRI | | | 508 | | | 421 | | | 443 |
Anders | | | 1,122 | | | 1,548 | | | 1,369 |
ITS | | | 1,164 | | | 1,252 | | | 1,237 |
Corporate | | | 3,448 | | | 2,808 | | | 2,831 |
| | | $ | 11,903 | | $ | 10,913 | | $ | 9,918 |
Segment asset data is presented in the table below. Segment assets at December 31, 2006 have been reclassified to conform to the 2007 and 2008 presentation.
| | | | | | | | | |
| | | 2008 | | 2007 | | 2006 |
Assets: | | | | | | | | | |
ES (1) | | $ | 150,232 | | $ | 136,011 | | $ | 139,036 |
MRI | | | 27,820 | | | 34,809 | | | 31,689 |
Anders | | | 44,918 | | | 71,795 | | | 70,819 |
ITS | | | 60,099 | | | 50,586 | | | 67,313 |
Corporate | | | 100,130 | | | 156,857 | | | 57,968 |
| | | $ | 383,199 | | $ | 450,058 | | $ | 366,825 |
| (1) | ES assets include $3,705 investment in joint ventures accounted for using the equity method. |
| | | | | | | | | |
| | | 2008 | | 2007 | | 2006 |
Purchases of property and equipment: | | | | | | | | | |
ES (1) | | $ | 7,828 | | $ | 3,325 | | $ | 5,468 |
MRI | | | 107 | | | 296 | | | 928 |
Anders | | | 609 | | | 1,644 | | | 1,914 |
ITS | | | 531 | | | 519 | | | 854 |
Corporate | | | 4,145 | | | 2,057 | | | 3,731 |
| | | $ | 13,220 | | $ | 7,841 | | $ | 12,895 |
| (1) | ES purchases of property and equipment include $3,084 of property and equipment purchased in the acquisition of TK Engineering. |
The Company is domiciled in the US and its segments (other than Anders) operate primarily in the US and Canada. Revenue attributable to foreign countries is determined based on the domiciled country of the customer. Revenues and fixed assets by geographic area for the years ended December 31, 2008, 2007 and 2006 are as follows:
| | | | | | | | | |
| | | 2008 | | 2007 | | 2006 |
Revenue: | | | | | | | | | |
US | | $ | 773,855 | | $ | 812,159 | | $ | 788,134 |
UK | | | 206,788 | | | 247,542 | | | 214,722 |
Canada | | | 105,164 | | | 94,768 | | | 83,066 |
Other | | | 32,790 | | | 32,830 | | | 27,495 |
| | | $ | 1,118,597 | | $ | 1,187,299 | | $ | 1,113,417 |
| | | |
| | | 2008 | | 2007 | | 2006 |
Property and equipment | | | | | | | | | |
US | | $ | 30,183 | | $ | 28,373 | | $ | 31,234 |
UK | | | 2,888 | | | 4,578 | | | 4,561 |
Canada | | | 740 | | | 957 | | | 1,265 |
Other | | | 163 | | | 244 | | | 180 |
| | | $ | 33,974 | | $ | 34,152 | | $ | 37,240 |
58
Report of Independent Registered Public Accounting Firm
The Board of Directors and Shareholders CDI Corp.:
We have audited the accompanying consolidated balance sheets of CDI Corp. and subsidiaries as of December 31, 2008 and 2007, and the related consolidated statements of earnings, shareholders’ equity, and cash flows for each of the years in the three-year period ended December 31, 2008. In connection with our audits of the consolidated financial statements, we also have audited the related financial statement schedule. These consolidated financial statements and the financial statement schedule are the responsibility of the Company’s management. Our responsibility is to express an opinion on these consolidated financial statements and related financial statement schedule based on our audits.
We conducted our audits in accordance with the standards of the Public Company Accounting Oversight Board (United States). Those standards require that we plan and perform the audit to obtain reasonable assurance about whether the financial statements are free of material misstatement. An audit includes examining, on a test basis, evidence supporting the amounts and disclosures in the financial statements. An audit also includes assessing the accounting principles used and significant estimates made by management, as well as evaluating the overall financial statement presentation. We believe that our audits provide a reasonable basis for our opinion.
In our opinion, the consolidated financial statements referred to above present fairly, in all material respects, the financial position of CDI Corp. and subsidiaries as of December 31, 2008 and 2007, and the results of their operations and their cash flows for each of the years in the three-year period ended December 31, 2008, in conformity with U.S. generally accepted accounting principles. Also in our opinion, the related financial statement schedule, when considered in relation to the basic consolidated financial statements taken as a whole, presents fairly, in all material respects, the information set forth therein.
As discussed in notes 1 and 13 to the consolidated financial statements, CDI Corp. adopted the provisions of Financial Accounting Standards Board Interpretation No. 48,Accounting for Uncertainty in Income Taxes, as of January 1, 2007.
We also have audited, in accordance with the standards of the Public Company Accounting Oversight Board (United States), CDI Corp.’s internal control over financial reporting as of December 31, 2008, based on criteria established in Internal Control—Integrated Framework issued by the Committee of Sponsoring Organizations of the Treadway Commission (COSO), and our report dated March 11, 2009 expressed an unqualified opinion on the effectiveness of the Company’s internal control over financial reporting.
| | |
| | | /s/ KPMG LLP
|
Philadelphia, Pennsylvania March 11, 2009 | | |
59
Quarterly Results (Unaudited)
The following is a summary of quarterly financial information for fiscal 2008 and 2007 (in thousands, except per share data):
| | | | | | | | | | | | | | | | | |
| | | Year Ended December 31, 2008 | |
| | | First
Quarter | | Second
Quarter | | Third
Quarter | | Fourth
Quarter | | | Total | |
Revenues | | $ | 293,880 | | $ | 289,211 | | $ | 281,865 | | $ | 253,641 | | | $ | 1,118,597 | |
Gross profit | | | 71,255 | | | 67,582 | | | 62,586 | | | 54,024 | | | | 255,447 | |
Operating and administrative expenses | | | 60,292 | | | 56,826 | | | 55,766 | | | 57,205 | | | | 230,089 | |
Operating profit (loss) | | | 10,963 | | | 10,756 | | | 6,820 | | | (3,181 | ) | | | 25,358 | |
Loss from joint ventures | | | - | | | - | | | - | | | (406 | ) | | | (406 | ) |
Net earnings (loss) | | | 7,924 | | | 6,979 | | | 8,126 | | | (3,614 | )(1) | | | 19,415 | (1) |
Diluted earnings (loss) per share: | | | | | | | | | | | | | | | | | |
Net earnings (loss) | | | 0.39 | | | 0.34 | | | 0.41 | | | (0.19 | )(1) | | | 0.97 | (1) |
| (1) | Between the issuance of the Company’s press release announcing the 2008 results of operations and the filing of this Annual Report on Form 10-K, the Company determined that income tax expense was $0.4 million more and net earnings from continuing operations was $0.4 million less than reported in the press release. The $0.4 million represents the net effect of certain income tax adjustments, which includes $1.2 million of expense pertaining to prior years and the recognition of $0.7 million of a US tax benefit in relation to an international tax matter. Basic and diluted earnings per share for the quarter and year ended December 31, 2008 decreased by $0.02 per share as a result of these adjustments. See Footnote 13 – Income Taxes in the notes to the consolidated financial statements. |
| | | | | | | | | | | | | | | | |
| | | Year Ended December 31, 2007 |
| | | First
Quarter | | Second
Quarter | | Third
Quarter | | Fourth
Quarter | | | Total |
Revenues | | $ | 293,914 | | $ | 295,717 | | $ | 298,708 | | $ | 298,960 | | | $ | 1,187,299 |
Gross profit | | | 68,042 | | | 71,798 | | | 72,393 | | | 74,707 | | | | 286,940 |
Operating and administrative expenses | | | 55,643 | | | 60,623 | | | 60,825 | | | 63,013 | | | | 240,104 |
Operating profit | | | 12,399 | | | 11,175 | | | 11,568 | | | 11,694 | | | | 46,836 |
Earnings from continuing operations | | | 8,047 | | | 7,643 | | | 7,967 | | | 8,171 | | | | 31,828 |
Earnings (loss) from discontinued operations | | | 421 | | | 686 | | | 1,622 | | | (355 | ) | | | 2,374 |
Net earnings | | | 8,468 | | | 8,329 | | | 9,589 | | | 7,816 | | | | 34,202 |
Diluted earnings per share: | | | | | | | | | | | | | | | | |
Earnings from continuing operations | | | 0.40 | | | 0.37 | | | 0.39 | | | 0.40 | | | | 1.56 |
Earnings (loss) from discontinued operations | | | 0.02 | | | 0.04 | | | 0.08 | | | (0.02 | ) | | | 0.12 |
Net earnings | | | 0.42 | | | 0.41 | | | 0.47 | | | 0.38 | | | | 1.68 |
| | |
| Item 9. | | Changes in and Disagreements with Accountants on Accounting and Financial Disclosure |
Not applicable.
| | |
| | |
| Item 9A. | | Controls and Procedures |
| (a) | Evaluation of Disclosure Controls and Procedures |
The management of the Company, under the supervision and with the participation of the Company’s Chief Executive Officer and Chief Financial Officer, has evaluated the effectiveness of the Company’s disclosure controls and procedures (as such term is defined in Rules 13a-15(e) and 15d-15(e) under the Securities Exchange Act of 1934, as amended (the “Exchange Act”)) as of December 31, 2008. Based on this evaluation, the Chief Executive Officer and Chief Financial Officer have concluded that the Company’s disclosure controls and procedures were effective as of that date.
| (b) | Management’s Report on Internal Control over Financial Reporting |
Under Section 404 of the Sarbanes-Oxley Act of 2002, management is required to assess the effectiveness of the Company’s internal control over financial reporting as of the end of each fiscal year and report, based on that assessment, whether the Company’s internal control over financial reporting is effective.
The Company’s management is responsible for establishing and maintaining adequate internal control over financial reporting. The Company’s internal control over financial reporting is a process designed to provide reasonable assurance of the reliability of its financial reporting and of the preparation of its financial statements for external reporting purposes, in accordance with US generally accepted accounting principles.
The Company’s internal control over financial reporting includes policies and procedures that (1) pertain to the maintenance of records that, in reasonable detail, accurately and
60
fairly reflect transactions and disposition of assets; (2) provide reasonable assurance that transactions are recorded as necessary to permit preparation of financial statements in accordance with US generally accepted accounting principles, and that receipts and expenditures are being made only in accordance with the authorization of its management and directors; and (3) provide reasonable assurance regarding the prevention or timely detection of unauthorized acquisition, use, or disposition of the Company’s assets that could have a material effect on its financial statements.
Because of its inherent limitations, internal control over financial reporting may not prevent or detect misstatements. Also, projections of any evaluation of the effectiveness to future periods are subject to the risk that controls may become inadequate because of changes in conditions, or that the degree of compliance with the policies and procedures included in such controls may deteriorate.
The Company’s management has assessed the effectiveness of the Company’s internal control over financial reporting as of December 31, 2008. In making this assessment, the Company used the criteria established by the Committee of Sponsoring Organizations of the Treadway Commission (COSO) in “Internal Control—Integrated Framework.” These criteria are in the areas of control environment, risk assessment, control activities, information and communication, and monitoring. The Company’s assessment included extensive documenting, evaluating and testing the design and operating effectiveness of its internal controls over financial reporting.
Based on the Company’s processes and assessment, as described above, management has concluded that, as of December 31, 2008, the Company’s internal control over financial reporting was effective.
The Company’s independent registered public accounting firm, KPMG LLP, have audited and issued their report on effectiveness of the Company’s internal control over financial reporting, which report is included herein.
| (c) | Changes in Internal Control |
There were no changes in the Company’s internal control over financial reporting during the Company’s fourth quarter ended December 31, 2008, that have materially affected, or are reasonably likely to materially affect, the Company’s internal control over financial reporting.
| (d) | Report of Independent Registered Public Accounting Firm |
The Board of Directors and Shareholders
CDI Corp.:
We have audited CDI Corp.’s internal control over financial reporting as of December 31, 2008, based on criteria established in Internal Control - Integrated Framework issued by the Committee of Sponsoring Organizations of the Treadway Commission (COSO). CDI Corp.’s management is responsible for maintaining effective internal control over financial reporting and for its assessment of the effectiveness of internal control over financial reporting, included in the accompanying Management’s Report on Internal Control over Financial Reporting. Our responsibility is to express an opinion on the Company’s internal control over financial reporting based on our audit.
We conducted our audit in accordance with the standards of the Public Company Accounting Oversight Board (United States). Those standards require that we plan and perform the audit to obtain reasonable assurance about whether effective internal control over financial reporting was maintained in all material respects. Our audit included obtaining an understanding of internal control over financial reporting, assessing the risk that a material weakness exists, and testing and evaluating the design and operating effectiveness of internal control based on the assessed risk. Our audit also included performing such other procedures as we considered necessary in the circumstances. We believe that our audit provides a reasonable basis for our opinion.
A company’s internal control over financial reporting is a process designed to provide reasonable assurance regarding the reliability of financial reporting and the preparation of financial statements for external purposes in accordance with generally accepted accounting principles. A company’s internal control over financial reporting includes those policies and procedures that (1) pertain to the maintenance of records that, in reasonable detail, accurately and fairly reflect the transactions and dispositions of the assets of the company; (2) provide reasonable assurance that transactions are recorded as necessary to permit preparation of financial statements in accordance with generally accepted accounting principles, and that receipts and expenditures of the company are being made only in accordance with authorizations of management and directors of the company; and (3) provide reasonable assurance regarding prevention or timely detection of unauthorized acquisition, use, or disposition of the company’s assets that could have a material effect on the financial statements.
Because of its inherent limitations, internal control over financial reporting may not prevent or detect misstatements. Also, projections of any evaluation of effectiveness to future periods are subject to the risk that controls may become inadequate because of changes in conditions, or that the degree of compliance with the policies or procedures may deteriorate.
In our opinion, CDI Corp. maintained, in all material respects, effective internal control over financial reporting as
61
of December 31, 2008, based on criteria established in Internal Control - Integrated Framework issued by COSO.
We also have audited, in accordance with the standards of the Public Company Accounting Oversight Board (United States), the consolidated balance sheets of CDI Corp. as of December 31, 2008 and 2007, and the related consolidated statements of earnings, shareholders’ equity, and cash flows for each of the years in the three-year period ended December 31, 2008, and our report dated March 11, 2009 expressed an unqualified opinion on those consolidated financial statements.
/s/ KPMG LLP
Philadelphia, Pennsylvania
March 11, 2009
| | |
| Item 9B. | | Other Information |
None.
62
Part III
| | |
| Item 10. | | Directors, Executive Officers and Corporate Governance |
Information related to directors, executive officers and corporate governance is omitted herein as the required information will be included in a definitive proxy statement to be filed with the Securities and Exchange Commission pursuant to Regulation 14A no later than 120 days after the close of the fiscal year.
The Company has adopted a Code of Conduct that applies to all of the Company’s employees, including its principal executive officer, principal financial officer, principal accounting officer or controller, or persons performing similar functions. This Code of Conduct is available on the Company’s website atwww.cdicorp.com, or may be obtained free of charge by making a written request addressed to the Company’s Vice President of Corporate Communications. The Company will disclose on its website amendments to, and, if any are granted, waivers of, its Code of Conduct for its principal executive officer, principal financial officer, or principal accounting officer or controller.
| | |
| Item 11. | | Executive Compensation |
Information related to executive compensation is omitted herein as the required information will be included in a definitive proxy statement to be filed with the Securities and Exchange Commission pursuant to Regulation 14A no later than 120 days after the close of the fiscal year.
| | |
| Item 12. | | Security Ownership of Certain Beneficial Owners and Management and Related Stockholder Matters |
Information related to executive compensation and equity compensation plans is omitted herein as the required information will be included in a definitive proxy statement to be filed with the Securities and Exchange Commission pursuant to Regulation 14A no later than 120 days after the close of the fiscal year.
| | |
| Item 13. | | Certain Relationships and Related Transactions, and Director Independence |
Information related to certain relationships and related transactions and director independence is omitted herein as the required information will be included in a definitive proxy statement to be filed with the Securities and Exchange Commission pursuant to Regulation 14A no later than 120 days after the close of the fiscal year.
| | |
| Item 14. | | Principal Accountant Fees and Services |
Information related to principal accountant fees and services is omitted herein as the required information will be included in a definitive proxy statement to be filed with the Securities and Exchange Commission pursuant to Regulation 14A no later than 120 days after the close of the fiscal year.
63
Part IV
| | |
| Item 15. | | Exhibits and Financial Statement Schedules |
| (a) | Documents filed as part of this report: |
Financial statements:
The consolidated balance sheets of the Registrant as of December 31, 2008 and 2007, the related consolidated statements of earnings, shareholders’ equity, and cash flows for each of the years ended December 31, 2008, 2007 and 2006, the footnotes thereto, and the reports of KPMG LLP, independent auditors, are filed herewith.
Financial statement schedule:
Schedule II—Valuation and Qualifying Accounts for the years ended December 31, 2008, 2007 and 2006.
| | | | | | | | | | | | | |
Exhibit
No. | | | Exhibit Description | | Incorporated by Reference |
| | | Form | | SEC File No. | | Exhibit | | Filing
Date | | Filed
Herewith |
| 3.1 | | | Articles of incorporation of the Registrant, as amended effective December 12, 2007 | | 10-K | | 001-05519 | | 3.1 | | 03/07/08 | | |
| | | | | | |
| 3.2 | | | Bylaws of the Registrant, as amended effective December 11, 2007. | | 10-K | | 001-05519 | | 3.2 | | 03/07/08 | | |
| | | | | | |
| 10.1 | | | Credit Agreement dated February 28, 2007 among the Registrant and JPMorgan Chase Bank, N.A. | | 10-Q | | 001-05519 | | 10.32 | | 05/07/07 | | |
| | | | | | |
| 10.2 | | | First Amendment to Credit Agreement signed on February 27, 2008 by JP Morgan Chase Bank, N.A. and the Registrant (along with certain of its subsidiaries) | | 10-Q | | 001-05519 | | 10.1 | | 05/09/08 | | |
| | | | | | |
| 10.3 | | | Amended and Restated Credit Agreement dated as of November 10, 2008 among JP Morgan Chase Bank, N.A., the Registrant and certain of its subsidiaries | | | | | | | | | | X |
| | | | | | |
| 10.4 | | | Purchase Agreement, dated September 19, 2007, by and among CDI Corporation, Spherion Atlantic Enterprises, LLC, Spherion Corporation, and, for the limited purposes set forth therein, Todays Staffing, Inc. | | 8-K | | 001-05519 | | 2.1 | | 09/24/07 | | |
| | | | | | |
| 10.5 | | | Technical Services Statement of Work between CDI Corporation and International Business Machines Corporation effective as of June 28, 2008 relating to the “Core” businesses | | 10-Q | | 001-05519 | | 10.2 | | 08/08/08 | | |
| | | | | | |
| 10.6 | | | Predominant Supplier Attachment to the Technical Services Statement of Work between CDI Corporation and International Business Machines Corporation effective as of July 1, 2008 for the Integrated Technology Delivery business | | 10-Q | | 001-05519 | | 10.3 | | 08/08/08 | | |
| | | | | | |
| 10.7 | * | | CDI Corp. 2004 Omnibus Stock Plan, as adopted in 2004 | | Def. Proxy Stmt. (14A) | | 001-05519 | | Appendix A | | 04/21/04 | | |
64
| | | | | | | | | | | | |
Exhibit
No. | | Exhibit Description | | Incorporated by Reference |
| | | Form | | SEC File No. | | Exhibit | | Filing
Date | | Filed
Herewith |
| 10.8* | | First Amendment to CDI Corp. 2004 Omnibus Stock Plan, effective as of December 31, 2008 | | | | | | | | | | X |
| | | | | | |
| 10.9* | | CDI Corp. Stock Purchase Plan for Management Employees and Non-Employee Directors, as amended and restated effective in 2004 | | Def. Proxy Stmt. | | 001-05519 | | Appendix C | | 04/21/04 | | |
| | | | | | |
| 10.10* | | Amendment to the CDI Corp. Stock Purchase Plan for Management Employees and Non-Employee Directors, effective as of December 31, 2008 | | | | | | | | | | X |
| | | | | | |
| 10.11* | | CDI Corporation Deferred Compensation Plan | | 10-K | | 001-05519 | | 10.e | | 03/31/05 | | |
| | | | | | |
| 10.12* | | Executive Severance Program applicable to executive officers of the Registrant | | | | | | | | | | X |
| | | | | | |
| 10.13* | | Executive Stock Purchase Opportunity Program approved by the Board of Directors of the Registrant on March 9, 2006 | | 8-K | | 001-05519 | | 10.1 | | 03/15/06 | | |
| | | | | | |
| 10.14* | | Employment Agreement dated October 1, 2001, between Registrant and Roger H. Ballou | | | | | | | | | | X |
| | | | | | |
| 10.15* | | Employment Agreement dated August 11, 2005, between Registrant and Roger H. Ballou | | 10-Q | | 001-05519 | | 10.a | | 11/08/05 | | |
| | | | | | |
| 10.16* | | Employment Agreement, dated as of January 1, 2008 and entered into on December 21, 2007, between Registrant and Roger H. Ballou | | 8-K | | 001-05519 | | 10.1 | | 12/28/07 | | |
| | | | | | |
| 10.17* | | Amendment to Employment Agreement between Roger H. Ballou and the Registrant, effective as of April 1, 2008 | | 10-Q | | 001-05519 | | 10.2 | | 05/09/08 | | |
| | | | | | |
| 10.18* | | Offer letter dated August 26, 2005 and Employment Agreement dated September 6, 2005 between CDI Corporation and Mark Kerschner | | 10-Q | | 001-05519 | | 10.b | | 11/08/05 | | |
| | | | | | |
| 10.19* | | Form of Stock Appreciation Rights Agreement | | 8-K | | 001-05519 | | 10.1 | | 06/06/05 | | |
| | | | | | |
| 10.20* | | Form of Time-Vested Deferred Stock Agreement | | 8-K | | 001-05519 | | 10.2 | | 06/06/05 | | |
| | | | | | |
| 10.21* | | Form of Performance-Contingent Deferred Stock Agreement | | 8-K | | 001-05519 | | 10.3 | | 06/06/05 | | |
| | | | | | |
| 10.22* | | Form of Stock Appreciation Rights Agreement | | 8-K | | 001-05519 | | 10.1 | | 06/30/06 | | |
| | | | | | |
| 10.23* | | Form of Time-Vested Stock Agreement | | 8-K | | 001-05519 | | 10.2 | | 06/30/06 | | |
| | | | | | |
| 10.24* | | Form of Performance-Contingent Deferred Stock Agreement | | 8-K | | 001-05519 | | 10.3 | | 06/30/06 | | |
65
| | | | | | | | | | | | |
Exhibit
No. | | Exhibit Description | | Incorporated by Reference |
| | | Form | | SEC File No. | | Exhibit | | Filing
Date | | Filed
Herewith |
| 10.25* | | Summary of Terms of Stock Appreciation Rights and Deferred Stock awarded to Joseph R. Seiders and Cecilia J. Venglarik on February 15, 2005 | | 10-Q | | 001-05519 | | 10.b | | 05/10/05 | | |
| | | | | | |
| 10.26* | | Changes to the Directors’ Compensation Arrangements, approved by the Board of Directors on June 11, 2007 and effective on July 18, 2007 | | 10-Q | | 001-05519 | | 10 | | 08/03/07 | | |
| | | | | | |
| 10.27* | | Form of Director’s Time-Vested Deferred Stock Award | | 10-Q | | 001-05519 | | 10.a | | 11/07/07 | | |
| | | | | | |
| 10.28* | | Supplemental Pension Agreement dated April 11, 1978 between CDI Corporation and Walter R. Garrison | | | | | | | | | | X |
| | | | | | |
| 10.29* | | 2008 Executive Incentive Program applicable to the executive officers of the Registrant | | 10-Q | | 001-05519 | | 10.3 | | 05/09/08 | | |
| | | | | | |
| 10.30* | | Form of Performance-Contingent Deferred Stock Agreement for executive officers | | 10-Q | | 001-05519 | | 10.1 | | 08/08/08 | | |
| | | | | | |
| 21 | | List of Subsidiaries of the Registrant | | | | | | | | | | X |
| | | | | | |
| 23 | | Consent of Independent Registered Public Accounting Firm | | | | | | | | | | X |
| | | | | | |
| 31.1 | | Certification of Chief Executive Officer Pursuant to Section 302 of the Sarbanes-Oxley Act of 2002 | | | | | | | | | | X |
| | | | | | |
| 31.2 | | Certification of Chief Financial Officer Pursuant to Section 302 of the Sarbanes-Oxley Act of 2002 | | | | | | | | | | X |
| | | | | | |
| 32 | | Certification of Chief Executive Officer and Chief Financial Officer Pursuant to 18 U.S.C. Section 1350, as Adopted Pursuant to Section 906 of the Sarbanes-Oxley Act of 2002 | | | | | | | | | | X |
| * | Constitutes a management contract or compensatory plan or arrangement. |
66
Schedule II
CDI CORP. AND SUBSIDIARIES
Valuation and Qualifying Accounts
(Allowance for Uncollectible Receivables)
| | | | | | | | | | | | | |
| | | Balance at
beginning of
year | | Additions
charged to
earnings | | Uncollectible
receivables
written off,
net of recoveries | | | Balance at
end of year |
December 31, 2008 | | $ | 2,996 | | $ | 4,135 | | $ | (517 | ) | | $ | 6,614 |
December 31, 2007 | | $ | 3,293 | | $ | 709 | | $ | (1,006 | ) | | $ | 2,996 |
December 31, 2006 | | $ | 3,210 | | $ | 1,696 | | $ | (1,613 | ) | | $ | 3,293 |
67
Signatures
Pursuant to the requirements of Section 13 or 15(d) of the Securities Exchange Act of 1934, the Registrant has duly caused this report to be signed on its behalf by the undersigned, thereunto duly authorized.
| | |
CDI Corp. |
By: /s/ | | Roger H. Ballou |
| | | Roger H. Ballou |
| | | President and Chief Executive Officer |
| | | Date: March 11, 2009 |
Pursuant to the requirements of the Securities Exchange Act of 1934, this report has been signed below by the following persons on behalf of the Registrant and in the capacities and on the dates indicated.
| | | | | | | | | | |
By: /s/ | | Roger H. Ballou | | By: /s/ | | Michael J. Emmi | | By: /s/ | | Ronald J. Kozich |
| | | Roger H. Ballou | | | | Michael J. Emmi | | | | Ronald J. Kozich |
| | | President, Chief | | | | Director | | | | Director |
| | | Executive Officer and Director | | | | Date: March 11, 2009 | | | | Date: March 11, 2009 |
| | | (Principal Executive Officer) | | | | | | | | |
| | | Date: March 11, 2009 | | By: /s/ | | Walter R. Garrison | | By: /s/ | | Constantine N. Papadakis |
| | | | | | | Walter R. Garrison | | | | Constantine N. Papadakis |
By: /s/ | | Mark A. Kerschner | | | | Director | | | | Director |
| | | Mark A. Kerschner | | | | Date: March 11, 2009 | | | | Date: March 11, 2009 |
| | | Executive Vice President | | | | | | | | |
| | | And Chief Financial Officer | | By: /s/ | | Lawrence C. Karlson | | By: /s/ | | Barton J. Winokur |
| | | (Principal Financial and | | | | Lawrence C. Karlson | | | | Barton J. Winokur |
| | | Accounting Officer) | | | | Director | | | | Director |
| | | Date: March 11, 2009 | | | | Date: March 11, 2009 | | | | Date: March 11, 2009 |
| | | | | |
| | | | | By: /s/ | | Albert E. Smith | | | | |
| | | | | | | Albert E. Smith | | | | |
| | | | | | | Director | | | | |
| | | | | | | Date: March 11, 2009 | | | | |
68