UNITED STATES SECURITIES AND EXCHANGE COMMISSION
Washington, DC 20549
Form 10-K
| [ X ] | | Annual Report Pursuant to Section 13 or 15(d) of the Securities Exchange Act of 1934 |
for the Fiscal Year Ended December 31, 2011
December 31, 2011
or
| [ ] | | Transition Report Pursuant to Section 13 or 15(d) of the Securities Exchange Act of 1934 |
for the Transition Period from to
Commission file number:001-05519
CDI Corp.
(Exact name of registrant as specified in its charter)
| | |
Pennsylvania (State of incorporation) 1717 Arch Street, 35th Floor, Philadelphia, PA 19103-2768 (Address of principal executive offices) 23-2394430 (I.R.S. Employer Identification Number) (215) 569-2200 (Registrant’s telephone number, including area code) | | Securities registered pursuant to Section 12(b) of the Act: Common stock, $0.10 par value (Title of each class) New York Stock Exchange (Name of exchange on which registered) Securities registered pursuant to Section 12(g) of the Act: None |
Indicate by a check mark if the registrant is a well-known seasoned issuer, as defined in Rule 405 of the Securities Act. [ ] YES [X] NO
Indicate by a check mark if the registrant is not required to file reports pursuant to Section 13 or Section 15(d) of the Act. [ ] YES [X] NO
Indicate by check mark whether the registrant (1) has filed all reports required to be filed by Section 13 or 15(d) of the Securities Exchange Act of 1934 during the preceding 12 months (or for such shorter period that the registrant was required to file such reports), and (2) has been subject to such filing requirements for the past 90 days. [X] YES [ ] NO
Indicate by check mark whether the registrant has submitted electronically and posted on its corporate web site, if any, every Interactive Data File required to be submitted and posted pursuant to Rule 405 of Regulation S-T (section 232.405 of this chapter) during the preceding 12 months (or for shorter period that the registrant was required to submit and post such files). [X] YES [ ] NO
Indicate by check mark if disclosure of delinquent filers pursuant to Item 405 of Regulation S-K (section 229.405 of this chapter) is not contained herein, and will not be contained, to the best of registrant’s knowledge, in definitive proxy or information statements incorporated by reference in Part III of this Form 10-K or any amendment to this Form 10-K. [X]
Indicate by check mark whether the registrant is a large accelerated filer, an accelerated filer, a non-accelerated filer, or a smaller reporting company. See the definitions of “large accelerated filer,” “accelerated filer” and “smaller reporting company” in Rule 12b-2 of the Exchange Act.
| | | | | | |
Large accelerated filer [ ] | | | | Accelerated filer [X] |
Non-accelerated filer [ ] (Do not check if a smaller reporting company) | | Smaller reporting company [ ] |
| | | | | | | |
Indicate by check mark whether the registrant is a shell company (as defined in Rule 12b-2 of the Exchange Act.) [ ] YES [X] NO
The aggregate market value of the registrant’s voting and non-voting common equity held by non-affiliates computed by reference to the price at which the common equity was last sold on June 30, 2011, the last business day of the registrant’s most recently completed second fiscal quarter, as reported on the New York Stock Exchange, was $176,527,708.
The number of shares outstanding of each of the registrant’s classes of common stock as of February 24, 2012 was as follows:
| | | | | | |
| | | Common stock, $0.10 par value | | 19,181,657 Shares | | |
| | | Class B common stock, $0.10 par value | | None | | |
Documents Incorporated By Reference
Portions of the registrant’s definitive proxy statement for its 2012 annual meeting of shareholders (to be filed with the Securities and Exchange Commission within 120 days after the registrant’s fiscal year end of December 31, 2011) are incorporated by reference into Part III of this Form 10-K.
Caution Concerning Forward-Looking Statements
This report (including Management’s Discussion and Analysis of Financial Condition and Results of Operations) contains forward-looking statements within the meaning of the Private Securities Litigation Reform Act of 1995. All statements that address expectations or projections about the future, including, but not limited to, statements about our strategies for growth and future financial results (such as revenue, operating profit, cash flow, and tax rate), are forward-looking statements. Some of the forward-looking statements can be identified by words like “anticipates,” “believes,” “expects,” “may,” “will,” “could,” “should,” “intends,” “plans,” “estimates” and similar references to future periods. These statements are not guarantees of future performance and involve a number of risks, uncertainties and assumptions that are difficult to predict. Because these forward-looking statements are based on estimates and assumptions that are subject to significant business, economic and competitive uncertainties, many of which are beyond our control or are subject to change, actual outcomes and results may differ materially from what is expressed or forecasted in these forward-looking statements. Important factors that could cause actual results to differ materially from these forward-looking statements include, but are not limited to: weakness in general economic conditions and levels of capital spending by clients in the industries we serve; weakness or volatility in the financial and capital markets, which may result in the postponement or cancellation of our clients’ capital projects or the inability of our clients to pay our fees; the inability to successfully implement our new strategic plan; the termination of a major client contract or project; our ability to maintain or expand our existing bank credit facility on satisfactory terms; credit risks associated with our clients; competitive market pressures; the availability and cost of qualified labor; our level of success in attracting, training, and retaining qualified management personnel and other staff employees; changes in tax laws and other government regulations; the possibility of incurring liability for our business activities, including, but not limited to, the activities of our temporary employees; our performance on client contracts; negative outcome of pending and future claims and litigation; and government policies, legislation or judicial decisions adverse to our businesses. More detailed information about some of these and other risks and uncertainties may be found in our filings with the SEC, particularly in the “Risk Factors” section in Part I, Item 1A of this Form 10-K Report. Readers are cautioned not to place undue reliance on these forward-looking statements, which speak only as of the date hereof. We assume no obligation to update such statements, whether as a result of new information, future events or otherwise, except as required by law.
Unless the context otherwise requires, all references herein to “CDI,” the “Registrant,” the “Company,” “we,” “us” or “our” are to CDI Corp. and its consolidated subsidiaries.
General
CDI Corp. (NYSE:CDI) is an integrated engineering and technology services organization providing differentiated, client-focused solutions in select global industries.
On December 8, 2011, the Company announced business model and organizational changes aligned with a new strategic plan to make CDI an engineering and technology solutions company with global capabilities in select markets. The objectives of these changes are to grow the Company’s solutions business, optimize the Company’s professional staffing operations and prioritize the geographic markets and industries to which the Company will deliver engineering and technology solutions. See “Business Strategy” in this Item 1 for a further description of the Company’s new strategic plan.
Services
Effective January 2012, CDI’s restructured business model provides a range of integrated engineering and technology solutions and professional staffing services through an organizational platform focused on services offered to clients, geographic markets that reflect its clients’ growth plans and select industries that are aligned with the Company’s core capabilities. Effective January 2012, the Company’s reportable segments are as follows:
| | Ÿ | | Global Engineering and Technology Solutions (“GETS”)—The Company provides engineering and information technology solutions for its clients that involve the production of deliverable work products or services performed at a CDI facility or at a client’s facility under the supervision of CDI personnel. These solutions typically include analysis of a client’s engineering or information technology needs and the development of a solution that generally range in duration from several months to multiple years. Depending on the industry, engineering services can include such functions as feasibility studies, technology assessment, conceptual design, cost estimating, preliminary design, execution planning, procurement optimization detailed design, testing and validation of regulatory compliance, technology integration and operating and maintenance support. Information technology services can include assessments, execution of business application services, web development, quality assurance and testing and program management. GETS provides these solutions for the Company’s geographic regions through a delivery model consisting of: centers of excellence, with concentrated skill sets required for larger, more complex projects; regional centers to service local needs of clients; client-centered offices to deliver site-specific services; and off-shore and near-shore centers to leverage low-cost design resources. |
2
| | Ÿ | | Professional Services Staffing (“PSS”)—The Company provides skilled technical and professional personnel to its clients for discrete periods of time to augment the client’s workforce in times of project, seasonal, peak period or business cycle needs. These engagements can range from several months to multiple years in duration. The Company also provides permanent placement services. The Company provides professional staffing services to targeted industries that include managed services and managed staffing programs, functional staffing outsourcing and business advisory services. The Company delivers these services through its PSS delivery organization which provides centralized global staffing delivery focused on select engineering and technology skill sets and competencies. |
| | Ÿ | | Management Recruiters International, Inc. (“MRI”)—MRI is a global franchisor that does business as MRINetwork® and provides the use of its trademarks, business systems and training and support services to its franchisees who engage in the search and recruitment of executive, technical, professional and managerial personnel for employment by their clients. The MRI franchisees provide permanent placement services primarily under the brand names Management Recruiters®, Sales Consultants®, CompuSearch® and OfficeMates 5®. MRI also provides training and support, implementation services and back-office services to enable franchisees to pursue contract staffing opportunities. |
CDI’s restructured business is focused on offering services through three geographic regions: the Americas; Europe, the Middle East and Africa (“EMEA”); and Asia Pacific (“APAC”). These geographic regions have separate organizations that include client-facing management and teams deployed in a strategic client engagement model to provide focused client development, to sell offerings across the Company’s service lines and to manage successful long-term client relationships. The majority of the Company’s operations are currently in the Americas.
2011 Reporting Segments and Services
The financial information presented in this Form 10-K Report does not give effect to the change in the composition of the Company’s operating segments as a result of the restructuring effective January 2012. During 2011, the Company managed its business under the following four reporting segments:
CDI Engineering Solutions (“ES”)—ES provided engineering, architecture, procurement, construction management and technical staffing services. Approximately 19% of ES’s total revenue in 2011 was from clients domiciled outside the U.S.
CDI Information Technology Solutions (“ITS”)—ITS provided IT-related services to its clients, which were primarily large and mid-sized clients with significant IT requirements and/or the need to supplement their own staff on a flexible basis. Services included staffing augmentation, permanent placement, outsourcing (both on-site, under the client’s supervision, and off-site) and consulting.
MRI—See the description of the MRI business under Services above.
CDI AndersElite (“Anders”)—Anders provided contract and permanent placement candidates to national, regional and local UK and Australia-based clients that operated within the public and private sectors in the industrial, commercial, government and defense, housing, rail, IT, mining, and oil & gas industries. The Company maintained offices in the UK and Australia. In addition, Anders provided staffing, managed services and recruitment outsourcing services to the aerospace, mining, oil & gas, power and energy, and IT industries.
During 2011, the Company categorized the services it provided into project outsourcing, staffing and professional services. Project outsourcing services primarily related to managing clients’ outsourcing of projects or functions. Staffing services primarily related to providing temporary workforce augmentation. Professional services primarily related to providing permanent placement staffing except for MRI, which was primarily related to royalties and franchise fees.
Business Strategy
On December 8, 2011 the Company announced a new business model and organizational changes aligned with a new strategic growth plan effective January 2012. The new strategic plan will focus on high-potential growth opportunities in a discrete number of priority industries, selectively expand the Company’s geographic footprint to meet the global needs of the Company’s core clients, provide a clear vision and improved organizational structure to become recognized as a market-leading global engineering and technology solutions provider.
Key elements of the organizational changes and strategic growth plan are as follows:
| | Ÿ | | Create an organization that includes a client engagement model in three geographic regions—the Americas, EMEA and APAC. These geographic regions are designed to build deeper and more strategic client relationships in targeted industries across the portfolio of CDI services. |
| | Ÿ | | Reorganize CDI’s project solutions business previously within the ES and ITS segments into the GETS reporting segment. GETS’ primary focus is to more effectively deliver value-added engineering and IT solutions services to the Company’s clients. |
| | Ÿ | | Reorganize CDI’s staffing services previously within the ES, ITS and the Anders segments into the PSS reporting segment. PSS will provide global talent sourcing and delivery. |
3
| | Ÿ | | Maintain the Company’s MRI business as a separate reporting segment. |
| | Ÿ | | Centralize support functions and processes into a global model to optimize execution and more effectively manage costs. |
| | Ÿ | | Prioritize investments in the following strategic industry verticals: Oil, Gas and Chemicals; Aerospace and Industrial Equipment; and Hi-Tech. |
Financial Information about Segments and Geographic Areas
Results for 2011 and prior periods in this Form 10-K Report are reported on the basis under which the Company managed its business in 2011 and do not reflect the new reporting segments effective January 2012. See “Management’s Discussion and Analysis of Financial Condition and Results of Operations” in Part II, Item 7 and Note 14—Reporting Segments, in the notes to the consolidated financial statements included in Part II, Item 8 of this Form 10-K Report for financial information by reporting segment and about geographic areas in which the Company operates.
Other Information
The Company was incorporated in Pennsylvania on July 30, 1985. It is the successor registrant to CDI Corporation, which was incorporated in Pennsylvania on September 16, 1950.
Clients/Markets
The Company’s clients consist primarily of: multi-national, national and regional companies; and US Federal, state, local and foreign governments. The Company seeks to expand its service offerings of engineering and technology solutions as well as professional staffing within the Oil & Gas, Chemicals, Aerospace, Industrial Products and Hi-Tech industries. The Company also does significant business in other industries, including the U.S. defense, financial services, rail and mining industries. Revenue from one client, International Business Machines Corporation (“IBM”), accounted for 21% of total CDI consolidated revenue in 2011.
MRI provides trademarks and business systems, as well as service, training, support and ancillary services to its franchisees, to enable them to be successful in their businesses. MRI seeks to sell new franchises and renew existing franchises. New franchisees have historically been brought into the MRI network primarily on a referral basis. MRI’s business is not dependent on any single franchisee.
Seasonality
The Company’s operating results are impacted by the seasonality of its clients’ or franchisees’ businesses. This seasonality is generally due to the clients vacation and holiday schedules which tend to impact the fourth quarter and beginning of the first quarter of each year as well as result in a modest downturn during heavy vacation periods in the third quarter of each year. In addition, this seasonality is impacted by weather, and daylight limitations. MRI franchisee clients’ hiring rates tend to be lower in the fourth quarter, leading to lower royalty revenues in the first quarter of the following year. Demand for MRI’s staffing services is typically subject to seasonal slowdown at the end of the fourth quarter and beginning of the first quarter of each year.
Pricing
The Company generally determines its pricing based on mark-ups of its employees’ hourly rates of pay and bill rates for GETS and PSS services. Permanent placement revenues are generally contingent upon filling an assigned position. If the client hires the candidate, the Company receives a fee based on an agreed-upon rate, which generally is a percentage of the candidate’s first-year compensation. Clients typically invite several companies to bid for contracts, which the Company believes are awarded primarily on the basis of prior performance, reputation, value-added services, technological capability and price. Clients frequently award multi-vendor contracts.
MRI’s revenue consists of ongoing royalties, initial franchise fees and support service fees. MRI receives ongoing royalty fees based on a percentage of the franchisee’s permanent placement fees and any other revenue collected. New franchise agreements generally have a term of 10 to 15 years. Individual franchises may be acquired by qualified candidates both in the U.S. and internationally. The domestic pricing structure includes an initial fee, a support fee payable over the first 24 months of operation, and a royalty rate schedule.
Competition
The Company competes in global, national, and regional markets with numerous engineering and information technology outsourcing companies and with temporary staffing and permanent placement firms. All segments of the Company’s operations face competition in attracting both clients and high-quality specialized employment candidates.
The engineering and information technology outsourcing business is highly fragmented. Certain of the Company’s competitors have greater financial resources and offer a broader range of services and others are smaller and tend to be more specialized. The extent of the competition varies according to the particular markets and geographic area. The degree and type of competition is also influenced by the type and scope of a particular project.
The temporary and permanent placement businesses are very competitive and highly fragmented, with limited barriers to entry into the market. In many areas, the local companies are the strongest competitors. Price competition among companies and pricing pressures from clients are significant in the staffing services industry in which we compete.
4
The trend of clients who consolidate their purchases of engineering, information technology and staffing services with a single provider or with a small number of providers continues. This trend to consolidate purchases may make it more difficult for the Company to obtain or retain clients when competing with larger competitors. The Company believes it derives a competitive advantage from its lengthy experience with and long-standing commitment to the industries it serves, long-term relationships with its clients, technical capabilities, and national and international presence.
In 2011, CDI’s primary competitors by business segment included:
| | Ÿ | | ES—AECOM Technology Corporation; Aerotek, Inc.; Belcan Corporation; Day & Zimmermann, Inc.; Gibbs and Cox, Inc.; Jacobs Engineering Group Inc.; and Shaw Group Inc. |
| | Ÿ | | ITS—Aerotek, Inc.; CIBER, Inc.; Computer Task Group, Inc.; MPS Group, Inc. (a subsidiary of Adecco S.A.); and Volt Information Sciences, Inc. |
| | Ÿ | | MRI—Heidrick & Struggles International, Inc.; Korn/Ferry International; and Robert Half International Inc. |
| | Ÿ | | Anders—Hays plc; Hill McGlynn (a subsidiary of Randstad Holding nv); Matchtech Group plc; and Morson plc. |
Safeguards—Business, Disaster and Contingency Planning
CDI has a number of safeguards that seek to protect the Company from various system-related risks. Given the significant amount of data generated in the Company’s key processes, including client-related projects, recruiting, payroll, and client invoicing, CDI has implemented fault tolerant processing capability within the Company’s primary data center. This mitigates the risks related to hardware failure. Additionally, CDI has contracted with a third-party provider to restore its primary data center operations in the event of a disruption. Finally, the Company maintains site disaster plans for a majority of its operating offices as well as maintaining data back-up requirements throughout the Company.
Employees
As of December 31, 2011, CDI had approximately 1,000 staff employees. In addition, CDI had approximately 9,400 employees and other workers engaged as billable personnel. The number of billable employees and other workers varies in relation to the number of projects and assignments in progress at any particular time.
Access to Company Information
CDI maintains a website atwww.cdicorp.com and makes available free of charge on that website (under the “Investor Relations” tab) the Company’s annual reports on Form 10-K, quarterly reports on Form 10-Q,current reports on Form 8-K and amendments to those reports filed or furnished pursuant to Section 13(a) or 15(d) of the Securities Exchange Act of 1934, as amended, as soon as reasonably practicable after CDI electronically files these materials with, or furnishes them to, the Securities and Exchange Commission. Also available on CDI’s website are the Company’s Corporate Governance Principles, Code of Conduct and the charters for the Audit Committee, Compensation Committee, Finance Committee, Executive Committee and Governance and Nominating Committee. The information contained on CDI’s website, or on other websites linked to CDI’s website, is not part of, or incorporated in, this report.
CDI’s business involves a number of risks, many of which are beyond our control. The risks and uncertainties described below could individually or collectively have a material adverse effect on our business, assets, profitability or prospects. While these are not the only risks and uncertainties we face, management believes that the more significant risks and uncertainties are as follows:
CDI’s business is heavily dependent on capital spending by clients in the industries we serve, and cuts in capital spending and economic downturns may result in the loss of revenue and profitability.
The demand for CDI’s services is highly dependent upon the level of capital spending by our clients, especially in our engineering project outsourcing business and in certain portions of our staffing business. The pace of client capital spending programs, new product launches and similar activities have a direct impact on our clients’ needs for project outsourcing and both temporary and permanent employees. There have been and, despite recent signs of a turnaround, may continue to be delays and cancellations of projects due to credit constraints and weak economic conditions experienced by some of our clients. These delays and cancellations can adversely affect CDI’s revenue and profitability
Unfavorable economic conditions could negatively affect CDI’s business.
Financial markets in the U.S., Europe and Asia experienced extreme disruption in recent years, causing severely tightened credit availability, increases in unemployment and general declines in the U.S. economy and economies around the world. While conditions are improving in many countries, the economic recovery appears to be somewhat slower and weaker than following previous economic downturns. Many companies are limiting, and may continue to limit, their spending on the services which CDI provides, which in turn could have a material adverse effect on our financial and operating performance.
Our staffing businesses earn revenue when qualified candidates accept open positions with potential employers. These
5
employers may postpone or cut back on hiring in efforts to cut costs, particularly during economic downturns. In addition, during periods of high unemployment, candidates may be less likely to take the risk of seeking new employment, creating a lack of qualified candidates. Both of these could have a material adverse effect on our financial and operating performance.
In addition, our MRI segment derives royalty revenue from franchisees. If persons hoping to start MRI franchises are unable to obtain credit, they could be prevented from purchasing franchises, which could impede our growth in that sector. If current franchisees are unable to obtain credit, it could cause downsizing in their organizations, in turn negatively affecting MRI’s royalty revenue, potentially having a material adverse effect on CDI’s financial and operating performance.
While CDI manages its cost structure in response to reduced demand for our services, these efforts may not be successful in having us remain profitable or, if profitable, maintain our current profit margins.
Our revenues are subject to uncertainties and cyclicality. Our results of operations depend on, among other factors, new contract awards and contract renewals, and the selection process and timing for performing these contracts are subject to contingencies beyond our control. In addition, our client contracts and arrangements may be adjusted, cancelled or suspended by our clients, in most cases on short notice. Fluctuations in commodity prices could also have a material adverse impact on our operating results.
A significant portion of our revenues is directly or indirectly derived from awards of long-term contracts. It is difficult to predict whether and when we will receive such awards due to the typically lengthy and complex bidding and selection process, which is affected by a number of factors, such as market conditions, clients’ financing arrangements and governmental approvals. Because a meaningful portion of our revenues is generated from these contracts, CDI’s results of operations and cash flows can fluctuate from quarter to quarter depending on the timing of contract awards and contract renewals.
Many of the industries CDI serves (such as the oil & gas industry) historically have been, and will likely continue to be, cyclical in nature and vulnerable to general downturns in the domestic and international economies, such as what was experienced in recent years. Consequently, CDI’s results of operations have fluctuated and may continue to fluctuate depending on the demand for services from these cyclical industries. For example, fluctuations in commodity prices (such as chemicals or oil & gas) can have a significant impact on our engineering outsourcing and staffing businesses, since those prices have a direct effect on our clients’ decisions to invest in capital projects. Rising commodity prices can negatively impact the financial returns on those projects, which may result in projects being delayed or cancelled, which in turn could have a material adverse impact on our operating results.
Furthermore, substantially all of CDI’s contracts are subject to cancellation or termination at the discretion of the client, typically on short notice. Many of our contracts, particularly in the staffing business, contain no minimum purchase obligations on the part of the client. Project contracts are generally subject to changes in the scope of services to be provided. Accordingly, we do not have a guaranteed backlog of business.
If we are not able to successfully execute on our new growth strategy, our business and results of operations would be adversely affected.
On December 8, 2011, CDI announced a new strategic plan designed to enhance the company’s long-term growth. The strategic plan, which was described earlier in this Form 10-K Report, also included a restructuring of CDI’s operations and a reduction in staff. Implementation of this plan presents various managerial, administrative, operational and other challenges. Implementing our new strategic growth plan will require, among other things, expending capital, developing and adopting new technologies, recruiting, developing, motivating and retaining talented employees, and changing our corporate culture. If we are unable to successfully execute any or all of the initiatives contained in our plan, our revenues, operating results and profitability may be adversely affected. Even if we successfully implement our new strategic plan, we cannot guarantee that our revenues, operating results and profitability will improve.
The loss of one or more major clients could have a material adverse effect on our financial results.
The loss of one or more major clients or projects, or a significant decrease in the volume of business that we receive from such major clients or projects could have a material adverse effect on CDI’s financial condition and results of operations. Revenue from one client, IBM, accounted for 21% of total CDI consolidated revenue in 2011. Our current contract with IBM was extended at the end of 2011, with a new three-year term, but which is subject to termination by IBM with or without cause at any time.
CDI derives a substantial portion of its revenue and profits from government agencies. If adequate government funding is delayed or is not available, then our revenue and profits could decline.
CDI is a party to many prime contracts and subcontracts involving U.S. federal, state and local governments and their agencies and authorities, as well as foreign governments and their agencies. Such contracts are subject to various uncertainties, restrictions and regulations. All levels of government are facing budget pressures, and government contracts are exposed to risks associated with appropriations. Contracts with the U.S. federal government, for example, are subject to the uncertainties of Congressional funding. Legislatures may appropriate funds for a given project on a year-by-year basis, even
6
though the project may take more than one year to perform. In addition, public-supported financing, such as state and local municipal bonds, may be only partially raised to support existing infrastructure projects. As a result, a project we are currently working on may only be partially funded and thus additional public funding may be required in order to complete our contract. Governments are typically under no obligation to maintain funding at any specific level, and funds for government programs may even be eliminated. As a result, CDI’s government clients may terminate our contracts for convenience or decide not to renew the contracts with little or no prior notice. Government contracts may also contain terms (such as broad indemnification obligations) that expose CDI to higher levels of risk and potential liability than non-government contracts.
We are subject to many different laws and regulations. The failure to comply with those laws and regulations could result in significant fines and penalties being imposed on CDI, harm to our reputation, loss of business and other adverse consequences. Changes in laws and regulations could also result in loss of business and increased costs.
Many U.S., state, local and foreign laws and regulations govern and impact the business, operations and employees of CDI. These laws and regulations are often complex. CDI’s policies mandate compliance with all applicable laws and regulations, and we maintain a compliance program and provide employees with training, guidelines and information about laws and regulations. CDI has controls and procedures in place that are designed to detect and prevent legal violations and errors and misconduct by employees. However, these policies, programs, controls and procedures cannot provide assurance that employees or agents of CDI will not violate any laws or regulations. Government regulatory agencies can investigate CDI’s compliance with laws and regulations and, if they believe there have been violations, can seek to impose significant fines and penalties (both civil and criminal) on us. Recent laws, such as the Dodd-Frank Act, increase the rewards for whistleblowing and could result in more claims of violations and in more government investigations. Compliance with laws and regulations, and responding to government investigations, even when no violations have occurred, can entail significant costs and expenses. If violations are alleged or found, CDI’s reputation could be materially damaged for a considerable period of time, which in turn could directly or indirectly result in a loss of business for CDI. Clients and potential clients could decide to discontinue doing business with us, to decrease the amount of business they do with us or to not award new business to us. In some cases, we could be suspended or debarred from government contract work. Our senior management may be required to devote a significant amount of time to repairing the relationship with any client that decides to discontinue or decrease its business with CDI, thereby decreasing the amount of time senior management is able to devote to other facets of our business; additionally, potential clients may not award business to CDI.
Government contracts are subject to specific procurement regulations, profit and cost controls, and a variety of other legal requirements. For example, for contracts with the U.S. federal government, we must comply with the Federal Acquisition Regulation, the Truth in Negotiations Act, the Cost Accounting Standards, the Service Contract Act and Department of Defense security regulations. We are also subject to government audits, investigations and proceedings and so-called “qui tam” actions brought by individuals or the government under the U.S. False Claims Act or under similar state and local laws. Government agencies routinely review and audit government contractors to determine whether allowable costs are in accordance with applicable regulations.
If we violate a law or regulation, fail to comply with a contractual or other requirement or do not satisfy an audit, a variety of penalties can be imposed including monetary damages and criminal and civil penalties. In addition, our government contracts could be terminated, CDI could be suspended or debarred from government contract work, or payment of our costs could be disallowed. Any of these actions could harm CDI’s reputation and could have a material adverse impact on our business, financial condition and results of operations.
CDI’s business is also subject to licensing in many states and in certain foreign countries. There can be no assurance we will continue to obtain all necessary government licenses or that the cost of compliance with the licensing rules will not prove to be material in the future. Any failure to comply with licensing requirements, or increase in the cost of compliance, could materially and adversely impact us.
New laws or regulations also could disrupt or reduce existing business done by CDI. Changes in laws or regulations could result in the imposition of new or additional employee benefits, licensing or tax requirements, thereby increasing our costs of doing business. There can be no assurance that we will be able to increase the fees charged to our clients in a timely manner or in a sufficient amount to cover increased costs as a result of any of the foregoing. CDI’s staffing services entail employing a large number of individuals on a temporary basis and placing such individuals in clients’ workplaces. Therefore, increased government regulation of the workplace or of the employer-employee relationship could materially and adversely impact CDI.
CDI’s existing credit facility includes restrictive and financial covenants. CDI’s ability to access additional credit also could be limited.
CDI has entered into a credit agreement with JPMorgan Chase Bank, N.A. under which we have access to a $50.0 million revolving line of credit facility (the “Credit Facility”) that terminates on November 30, 2012. CDI had no borrowings under the Credit Facility as of December 31, 2011. Our obligations under the Credit Facility are secured by substantially all of the assets of CDI Corp. and its major U.S. subsidiaries. The terms of the Credit Facility include, among other provisions,
7
specific limitations on creating liens on its assets, subsidiary indebtedness, acquisitions and investments, mergers and consolidations, dividends, stock repurchases, disposition of assets other than in the ordinary course of business, and changing its line of business. Additionally, the Credit Facility requires CDI to maintain certain financial covenants, including a maximum consolidated leverage ratio, a minimum consolidated fixed charge coverage ratio, and a minimum level of consolidated liquidity. The failure to comply with any of these debt covenants would cause a default under the Credit Facility. A default, if not waived or cured, could cause CDI’s debt under the Credit Facility to become immediately due and payable. In such a situation, we may not be able to repay the debt or borrow sufficient funds to refinance the debt, and even if new financing is available, it may not be on terms acceptable to us. Additionally, if we need to obtain a waiver under the Credit Facility or if we seek other financing, if available, our cost of borrowing could significantly increase and we could face more restrictive covenants. This could materially and adversely affect CDI’s results of operations and financial condition.
Although CDI is currently in compliance with the financial covenants of the Credit Facility, a deterioration of economic conditions could negatively impact our business, resulting in a failure to comply with these covenants in the future, which could in turn limit our ability to borrow funds under the Credit Facility. In such circumstances, we may not be able to secure alternative financing or may only be able to do so at significantly higher costs.
Although CDI generally finances much of its operations using cash provided by operations, at times we depend on the availability of credit to support our working capital needs, grow our business and to help fund business acquisitions. The state of the global credit markets could make it more difficult for us to access funds, refinance our existing indebtedness, enter into agreements for new indebtedness, or obtain funding through the issuance of our debt securities. There is no guarantee that CDI will be able to renew the Credit Facility on terms as favorable as those in the existing facility, and if we are unable to do so, CDI’s costs of borrowing and our business may be materially adversely affected.
We rely on information systems in our operations. Failure to protect these systems against security breaches could materially and adversely affect our business and results of operations. Additionally, if these systems fail or become unavailable for any significant period of time, our business could be harmed.
The efficient operation of CDI’s business is dependent on computer hardware and software systems. Information systems are inherently vulnerable to security breaches by computer hackers and cyber terrorists. Cybersecurity attacks are evolving and include malicious software, attempts to gain unauthorized access to data, and other electronic security breaches that could lead to disruptions in systems, unauthorized release of confidential or otherwise protected information and corruption of data. We rely on industry-accepted security measures and technology to securely maintain confidential and proprietary information maintained on our information systems. However, these measures and technology may not always be adequate to properly prevent security breaches. In addition, the unavailability of the information systems or the failure of these systems to perform as anticipated for any reason could disrupt our business and could result in decreased performance and increased overhead costs, causing our business and results of operations to suffer. Any significant interruption or failure of our information systems or any significant breach of security could materially and adversely affect our business and results of operations. We maintain insurance to cover certain of these cybersecurity risks, but that insurance is subject to limits and self-insured retentions.
The failure of clients to pay amounts owed to CDI could cause us to experience significant losses.
We typically bill our clients for our services in arrears and so are subject to the risk that our clients will delay or fail to pay our invoices. Accounts receivable represent the largest asset on CDI’s balance sheet. While we take steps to evaluate and manage the credit risks relating to our clients, economic downturns such as the one experienced in recent years can adversely affect various industries and, within those industries, particular clients’ ability to pay, which could reduce our ability to collect all amounts due from clients. There may also be delays in payments from clients, which would increase the working capital which CDI needs to maintain and could impact our liquidity. In addition, in the staffing business, there are sometimes intermediaries between us and the client, and therefore financial problems involving the intermediary company could pose credit risks to CDI.
CDI is engaged in highly competitive businesses. Pricing pressures and increasing consolidation of purchasing by our clients could reduce our market share and profits.
The engineering and IT project outsourcing business and the professional staffing business are highly competitive and fragmented, and particularly in the case of staffing services, have limited barriers to entry. CDI competes in global, national, regional and local markets with numerous engineering and IT outsourcing companies and with temporary staffing and permanent placement firms, some of which have greater financial and other resources than we have. Price competition among companies in our industry and pricing pressures from clients are significant. The number of clients that consolidate their purchases of engineering and IT outsourcing and staffing services with a single provider or with a small number of providers has continued to rise. This long-term trend to consolidate purchases may make it more difficult for CDI to obtain or retain clients in the future.
8
We could also face the risk that certain clients may decide to provide internally services similar to those we offer. Additionally, pricing pressures have intensified as clients have continued to competitively bid new contracts and seek price reductions on existing contracts. This trend is expected to continue for the foreseeable future, which could limit our ability to maintain or increase our market share or profitability.
CDI’s continued success is dependent on our ability to hire and retain qualified employees, both management and billable personnel. The loss of key personnel could have a material adverse effect on our business. In addition, our business may be harmed if CDI or its employees are unable to obtain the security clearances or other qualifications needed to perform services for our clients.
CDI depends upon its ability to attract qualified personnel who possess the skills and experience required by its clients and to successfully bid for new client projects. CDI must continually evaluate its base of available qualified personnel to keep pace with changing client needs and emerging technologies. Competition for individuals with proven professional or technical skills always exists, and the demand for such individuals (particularly in certain engineering disciplines and geographic areas) is expected to remain strong in the foreseeable future. There can be no assurance that qualified personnel will continue to be available to CDI in sufficient numbers and on terms of employment acceptable to CDI.
Our operations also depend on the continued efforts of our executives and senior management. The loss of key members of CDI’s management team may cause a significant disruption to our business. CDI also depends on the performance and productivity of its local managers and sales and recruiting personnel. The loss of key managers and field personnel may also jeopardize existing client relationships, which could cause revenues to decline.
A number of government programs require contractors to have security clearances. Depending on the level of required clearance, security clearances can be difficult and time-consuming to obtain. If CDI or its employees are unable to obtain or retain necessary security clearances, we may not be able to win certain new business, and our existing clients could terminate their contracts with us or decide not to renew them. To the extent we cannot obtain or maintain the required security clearances for our employees working on a particular contract, we may not derive the anticipated revenue or profit from such contract.
CDI faces competition from lower-cost, offshore outsourcing companies, which may result in a loss of market share and reduced profitability.
There is increasing pressure from clients on their suppliers to outsource certain areas of their businesses to lower-cost offshore locations. Many engineering and IT outsourcing and staffing companies already have or are seeking offshore solutions to support their technology and business process functions, and as a result, a significant amount of domestic technology and engineering project work may utilize offshore capabilities as alternatives to domestic resources. CDI has established lower-cost outsourcing centers and has partnered with offshore companies to provide additional lower cost options to its clients. In connection with our new growth strategy, we expect to expand our service delivery capabilities outside the U.S. Conducting business through offshore arrangements entails additional compliance and regulatory issues and may result in additional costs to CDI. CDI’s partnering arrangements are subject to our ability to maintain good working relationships with our foreign partners and on our partners’ ability to fulfill their obligations under our agreements with them. Changes in the supply and demand for offshore personnel with the training to perform the engineering and IT services sought by CDI’s clients, as well as other factors affecting offshore labor costs, could raise CDI’s costs, which would put pressure on its margins. Also, other offshore solution providers could develop direct relationships with CDI’s clients resulting in a significant loss of CDI’s market share and revenue.
Foreign currency fluctuations, weak foreign economies and unfavorable political developments in connection with CDI’s international operations could harm our financial condition.
CDI’s international operations are important to our business, and we expect that they will account for an increasing portion of our total revenues as we implement our new growth strategy. CDI’s reported financial condition and results of operations are exposed to the effects (both positive and negative) of fluctuating exchange rates. CDI’s exposure to foreign currency fluctuations currently relates primarily to operations denominated in British pounds sterling and Canadian dollars. Exchange rate fluctuations impact the U.S. dollar value of reported earnings derived from these foreign operations as well as our investment in the net assets related to these operations. CDI has at times in the past engaged, and may in the future engage, in hedging activities with respect to certain of its foreign operations.
Our international operations are subject to a variety of other risks, including, but not limited to, the following:
| | Ÿ | | Recessions in foreign economies and the impact on costs of doing business in those countries; |
| | Ÿ | | Difficulties in staffing and managing foreign operations; |
| | Ÿ | | Changes in foreign government policies and regulatory requirements; |
| | Ÿ | | The adoption of new, and the expansion of existing, trade restrictions and the failure to comply with U.S. export control laws; |
| | Ÿ | | The lack of well-developed legal systems and less established or traditional business practices in some countries, which could make it difficult for CDI to enforce its contractual rights; |
9
| | Ÿ | | Social, political and economic instability, including risks of loss due to civil strife, acts of war, insurrection and terrorism; |
| | Ÿ | | Limitations on the movement of cash; and |
| | Ÿ | | Logistical and communications challenges. |
If our growth strategy is successful, we will earn an increasing portion of our income, and accumulate a greater portion of our cash flow, in foreign jurisdictions. Any repatriation of funds currently held in foreign jurisdictions may result in higher effective tax rates and incremental cash tax payments. In addition, changes in legislation with respect to the tax treatment of foreign earnings may have a material impact on our U.S. tax expense and cash flows.
CDI operates in many different jurisdictions and could be materially and adversely affected by violations of the U.S. Foreign Corrupt Practices Act, the UK Bribery Act and similar worldwide anti-corruption laws.
The U.S. Foreign Corrupt Practices Act, the UK Bribery Act and similar worldwide anti-corruption laws generally prohibit companies and their intermediaries from making improper payments to government officials and others for the purpose of obtaining or retaining business. CDI’s internal policies mandate compliance with these anti-corruption laws. We operate in parts of the world that have experienced governmental corruption to some degree, and in certain circumstances, strict compliance with anti-corruption laws may conflict with local customs and practices. Despite our training and compliance programs, there can be no assurance that our internal control policies and procedures will protect us from reckless or criminal acts committed by those of our employees or agents who violate our policies. Our continued expansion outside the U.S. (including in developing countries) in connection with our growth strategy could increase the risk of such violations in the future. Violations of these laws, or allegations of such violations, could disrupt our business and result in a material adverse effect on our results of operations or financial condition.
CDI’s project outsourcing services expose the company to potential professional liability, product liability, warranty and other claims. Our project outsourcing business may encounter difficulties that result in additional costs, reductions in revenues, claims, disputes and the payment of damages.
In connection with certain of our project outsourcing services, the Company engineers and performs services in various types of facilities, including major industrial facilities, where accidents or system failures can be disastrous. CDI also provides engineering and related services in connection with major products such as aircraft engines and naval ships. Any catastrophic occurrences in excess of insurance limits relating to locations or products which are engineered by CDI or locations where our services are performed could result in significant professional liability, product liability, warranty and other claims against us. Furthermore, the project outsourcing services CDI provides expose us to additional risks including equipment failures, personal injuries, property damage and unforeseen engineering, architectural and environmental problems, each of which could significantly impact our performance and materially impact our financial statements.
CDI’s project outsourcing services often involve complex design and engineering, significant procurement of equipment and supplies, and broad construction management. We may encounter difficulties in the design or engineering, equipment and supply delivery, schedule changes and other factors, some of which are beyond our control, that impact our ability to complete the project in accordance with the original delivery schedule. In addition, we often rely on third-party equipment manufacturers as well as other third-party subcontractors to assist with the completion of our contracts. Any delay by these equipment manufacturers or subcontractors to complete their respective portions of a project, or any failure by subcontractors to satisfactorily complete their respective portions of a project, as well as other factors beyond our control, may result in delays in the overall progress of such project, cause us to incur additional costs or both. These delays and additional costs may be substantial, and we may be required to compensate the client for these delays. While we may recover these additional costs from the responsible vendor, subcontractor or other third party, we may not be able to recover all of these costs in all circumstances.
In addition, some contracts may require our clients to provide us with design or engineering information or with equipment or materials to be used on the project. In some cases, the client may provide us with deficient design or engineering information or equipment, or may provide the information or equipment to us later than required by the project schedule. The client may also determine, after commencement of the project, to change various elements of the project. We are subject to the risk that we might be unable to obtain, through negotiation, arbitration, litigation or otherwise, adequate amounts to compensate us for the additional work or expenses incurred due to client requested change orders or failure by the client to timely provide required items. A failure to obtain adequate compensation for these matters could require CDI to record an adjustment to amounts of revenues and gross profit that were recognized in prior periods. Any such adjustments could have a material adverse effect on our results of operations and financial condition.
The outcome of pending and future claims and litigation could have a material adverse effect on our business.
From time to time, various types of legal claims arise in connection with the ordinary course of our business. Employees of CDI may make a variety of claims including workplace injury claims and employment-related claims such as discrimination,
10
harassment, and wage and hour claims. Since CDI’s staffing business involves employing a large number of individuals on a temporary basis and placing them in client workplaces where we have limited ability to control the workplace environment, these types of claims may arise more frequently in those business operations. CDI’s clients may make claims based on our alleged failure to perform in accordance with contract requirements. Since our project business often involves responsibility to produce specified deliverables, these types of claims may arise more frequently in those business operations. Clients in the staffing business may allege claims based on the conduct of staffing employees assigned to the client’s worksite. Clients and subcontractors may make claims alleging CDI’s failure to abide by certain contract provisions. In addition, CDI is subject to possible government claims or fines for violations of various laws. See Note 10—Commitment and Contingencies, in the notes to the consolidated financial statements included in Part II, Item 8 of this Form 10-K Report, for more information regarding legal proceedings and claims.
CDI has significant payroll-related costs, such as workers’ compensation, unemployment taxes and health benefits, which are subject to increases caused by government regulation and other factors, and such increases could reduce our profits.
In conducting its business, CDI pays a number of payroll-related costs and expenses, including unemployment taxes, workers’ compensation and medical coverage for its personnel. Unemployment insurance premiums paid by employers typically increase during periods of increased levels of unemployment and have increased substantially in the past couple years. Workers’ compensation costs may increase in the future if states raise benefit levels and liberalize allowable claims. CDI maintains insurance relating to its exposure for losses associated with workers’ compensation and medical coverage for its personnel, but this insurance coverage is subject to deductibles. We have established reserves for workers’ compensation and medical coverage claims based on historical loss statistics and periodic independent actuarial valuations. While we believe that our assumptions and estimates are appropriate, significant differences in actual experience or significant changes in assumptions may materially and adversely affect our future financial results. Our future earnings could also be materially and adversely affected if we are not able to increase the fees charged to clients to absorb the increased costs related to unemployment insurance, workers’ compensation and medical benefits. In addition, our future earnings could also be materially and adversely affected by future cost increases.
Disasters could interfere with CDI’s ability to operate its business. Certain of our clients operate in areas that may be impacted by severe weather conditions.
Various types of natural or man-made disasters could interfere with CDI’s continued ability to operate its business normally. For example, our ability to protect our data centers and information systems against damage from fire, power loss, telecommunications failure and other disasters is critical. In order to provide many of our services, we must be able to store, retrieve, process and manage large databases and periodically expand and upgrade our capabilities. Any damage to our data centers or any failure of our telecommunication links that interrupts our operations or results in an inadvertent loss of data could materially and adversely affect our ability to meet our clients’ needs and their confidence in utilizing CDI for future services. While we have developed various backup plans and disaster recovery plans, there can be no assurance that we would be able to continue to operate our business smoothly in the face of certain natural or man-made disasters. Such business interruptions could materially and adversely affect our financial results and future prospects.
CDI services the oil & gas and chemical industries, each of which has a significant concentration of activities in the Gulf Coast of the U.S. CDI also has two major engineering centers in this area. The U.S. Gulf Coast has been impacted by several hurricanes in the past, and could be further impacted by severe weather in the future. Some scientists believe that increased hurricane activity is associated with climate change. Hurricanes in the U.S. Gulf Coast could negatively impact CDI’s clients and our ability to serve them.
Regulation regarding climate change may negatively impact our clients and our projects.
Increasing concerns about climate change may result in additional regulation affecting our clients and our projects, particularly those who are involved in the exploration, production or refining of fossil fuels. Those new regulations could increase the cost of projects for our clients and, in some cases, prevent a project from moving forward, thereby potentially reducing the need for our services, which could in turn have a material adverse impact on our results of operation.
Past and future acquisitions may not be successful.
CDI has pursued and continues to pursue acquisitions as an element of its growth strategy, but we cannot provide assurances that we will be able to locate suitable acquisitions or that we will be able to consummate any such transactions on terms and conditions acceptable to us, or that such transactions will be successful. Adverse changes in the credit markets may make it more difficult and costly to finance acquisitions. Acquisitions involve a number of risks, including the diversion of management’s attention from its existing operations, the failure to retain key personnel or clients of an acquired business, the failure to realize anticipated benefits, such as cost savings and revenue enhancements, the potentially substantial transaction costs associated with acquisitions, the assumption of unknown liabilities of the acquired business, and the inability to successfully integrate the business within CDI. Potential impairment could result if we overpay for an acquisition. There can be no
11
assurance that any past or future acquired businesses will generate anticipated revenues or earnings.
We perform certain projects through joint ventures. Participation in joint ventures exposes CDI to additional risks and uncertainties.
As is common in the project engineering industry, CDI executes certain projects jointly with other contractors through joint ventures or other teaming arrangements. These arrangements expose CDI to a number of risks, including the risk that our partners may not be able to fulfill their performance obligations under the joint venture agreements and related client contracts. There is also a risk that our joint venture partners may be incapable of providing the required financial support to the joint ventures. Another risk is that improper, illegal or unethical actions by our joint venture partners would have a negative impact on the reputation of the joint venture and CDI. Disputes can arise not only between CDI and its joint venture partners, but also between the joint ventures and the clients.
Improper disclosure of employee and client data could result in liabilities and harm CDI’s reputation.
CDI’s business involves the use, storage and transmission of information about its employees, candidates, clients and franchisees. The protection of such information, as well as CDI data, is critical to us. The regulatory environment surrounding information security and privacy is increasingly demanding, with the frequent imposition of new and constantly changing requirements. We have established policies and procedures to help protect the security and privacy of this information. We also, from time to time, export sensitive client data and technical information to recipients outside the U.S. CDI has a policy in place that requires an analysis prior to the export of any products, software, data, technology or other information from our systems to determine if any restrictions apply to the export. It is possible that CDI’s security controls over personal and client data and other practices that we follow may not prevent the improper access to or disclosure of personally identifiable and client information. Such disclosure could harm CDI’s reputation, cause us to lose clients or candidates, and subject us to liability under our contracts and laws that protect personal and client data, resulting in increased costs or loss of revenue.
CDI relies on outside suppliers to perform certain administrative services, and we may suffer damage to our business if those suppliers fail to adequately perform those services.
CDI outsources certain payroll, employee benefits administration and other back-office functions to companies that specialize in performing those services. The failure of such outside service providers to adequately perform such services could have a material adverse effect on our business and operations. Such third parties may have risks relating to cybersecurity and possible breaches of data privacy laws which are similar to those risks described above for CDI. We seek to reduce those risks by requiring audits of the relevant third parties’ information technology processes or by performing other due diligence inquiries regarding such processes, but there can be no assurance that such parties will not experience cybersecurity or data privacy breaches which could adversely affect our employees, clients and business.
We bear the risk of cost overruns in fixed-price contracts.
CDI sometimes enters into fixed-price contracts with clients, primarily for engineering project services. Revenue recognized under fixed-price contracts accounts for less than 5% of 2011 consolidated revenue. Under these fixed-price contracts, prices are established based on cost and scheduling estimates, which in turn are based in part on assumptions about the prices and availability of skilled personnel, equipment and materials. If our price estimates for a particular project prove to be inaccurate, if there are errors or ambiguities as to contract specifications, or if there are unanticipated technical problems, then cost overruns may occur, and we could experience reduced profits or a loss for that project. Cost overruns may also be caused by changes in the scope of the project after the contract has been entered into or by a failure of the parties to adequately define and agree upon the entire scope of the project at inception. In those cases, there may be disputes between the parties over who should pay for the cost overruns. We will attempt to negotiate change orders to recover the additional costs, but there can be no assurance that we will be successful in our negotiations with our clients. In general, fixed-price contracts can offer greater profit potential but also entail more inherent risk—both in terms of possible financial losses and the potential for significant disputes with clients—than contracts containing pricing on a time-and-materials basis.
A charge for impairment of goodwill or other intangible assets could have a material adverse effect on our reported results of operations.
We are required to test the goodwill and other indefinite-lived intangible assets carried on our consolidated balance sheets for possible impairment on an annual basis based upon a fair value approach. As of December 31, 2011, CDI had $80.0 million of goodwill and other intangible assets, representing 20% of our total assets of $390.7 million.
12
CDI has chosen to perform its annual goodwill and other indefinite-lived intangible assets impairment testing by reporting unit as of July 1 of each fiscal year. We are also required to test for impairment between annual tests if events occur or circumstances change that would indicate that it is more likely than not that the fair value of a reporting unit was below its carrying value. Examples of events or circumstances include, but are not limited to: adverse changes in legal factors, business climate or regulatory environment; unanticipated competition; loss of key personnel; and a more-likely-than-not expectation that a reporting unit or a significant portion of a reporting unit will be sold or otherwise disposed of. Other factors that could impact an impairment include, but are not limited to, significant underperformance relative to projected future operating results, significant changes in the manner of use of acquired assets or the strategy for our overall business, significant negative industry or economic trends, a significant decline in our stock price for a sustained period and decreases in our market capitalization below the recorded amount of our net assets for a sustained period. If the fair value of CDI’s reporting units were to be less than their book value, we could be required to record a non-cash impairment charge. The amount of any impairment could be significant and could have a material adverse effect on our financial results for the period in which the charge is taken.
Estimates of our income tax liabilities are subject to various uncertainties and actual results could vary significantly from these estimates.
When we prepare our financial statements, we estimate our income tax liabilities with respect to the various jurisdictions in which we do business. Significant judgment is required in determining the provision for income tax liabilities in our financial statements and in forecasting our effective income tax rate in a given period. The provision for income taxes and tax liability in the future could be materially and adversely affected by numerous factors, including changes in tax laws, regulations or accounting principles, changes in the valuation of deferred tax assets and liabilities and audits by taxing authorities.
If CDI fails to maintain an effective system of internal controls over financial reporting, it may not be able to accurately report its financial results or prevent fraud. As a result, investors could lose confidence in our financial reporting, which could harm our business and the trading price of our stock.
Effective internal controls are necessary for CDI to provide reliable financial reports and prevent fraud. If we cannot provide reliable financial reports or prevent fraud, our operating results could be harmed. We devote significant attention to establishing and maintaining effective internal controls. Any failure to implement required new or improved controls or difficulties encountered in their implementation could affect our operating results or cause us to fail to meet reporting obligations in future periods. Ineffective internal controls could also cause investors to lose confidence in our reported financial information, which could have a negative effect on the market price of CDI stock.
CDI may not be able to obtain the insurance coverages necessary to manage its risks.
CDI relies on insurance to help manage its risks and to limit our exposure to significant claims. The future availability and cost of such insurance is subject to market forces and our claims experience. There can be no assurance that CDI can always obtain and maintain appropriate insurance coverage, including errors and omissions insurance, in order to effectively manage the risks of its business.
In addition, CDI has elected to retain a portion of losses that may occur through the use of various deductibles, limits and retentions under these programs. As a result, we may be subject to future liability for which CDI is only partially insured, or completely uninsured. Our insurers are subject to business risk. One or more of our insurers may be unable to fulfill their insurance obligations due to insolvency or otherwise. To the extent we are not insured against a loss or any of our insurers fails to provide coverage, CDI’s financial condition and results of operations could be materially and adversely affected.
A significant portion of CDI’s common stock is owned by related parties, and they could vote their shares in a way that is adverse to the interests of other shareholders.
Certain of CDI’s directors and trusts, for which some of our directors serve as trustee, own a substantial portion of CDI’s outstanding common stock. By virtue of this stock ownership, such shareholders have the power to significantly influence our affairs and are able to influence the outcome of matters required to be submitted to shareholders for approval, including the election of directors and the amendment of our Articles of Incorporation or Bylaws. Such shareholders could exercise influence over CDI in a manner adverse to the interests of our other shareholders.
| | |
| Item 1B. | | Unresolved Staff Comments |
None.
13
The Company maintains major facilities in the following locations, all of which are leased:
| | | | |
| Segment | | Address | | Description |
Corporate/MRI | | Philadelphia, Pennsylvania | | Executive offices/MRI offices |
Corporate/ES | | Philadelphia, Pennsylvania | | Corporate offices/Engineering center |
ES | | Ebensburg, Pennsylvania | | Engineering center |
ES | | Baton Rouge, Louisiana | | Engineering center |
ES | | Cincinnati, Ohio | | Engineering center |
ES | | Houston, Texas | | Engineering center |
Corporate/ITS | | Cross Lanes, West Virginia | | Shared services center/ITS service
desk operations |
Additionally, each reporting segment has numerous other active facilities and locations under operating lease agreements. Most of the leased space is devoted to sales, marketing, engineering design, and administrative and back-office functions. Most of these facilities are leased for terms ranging from three to ten years. The Company believes that its facilities are adequate to meet its current and near-term needs.
A few of the Company’s offices accommodate more than one operating segment. In such cases, square-foot usage is allocated among the segments, primarily based on utilization.
| | |
| Item 3. | | Legal Proceedings |
The Company is subject to various legal proceedings and claims that have arisen in the ordinary course of business. Although management cannot predict the timing or outcome of these matters with certainty, management does not believe that the final resolution of these matters, individually or in the aggregate, would have a material adverse effect on the Company’s consolidated financial condition, results of operations or cash flows.
| | |
| Item 4. | | Mine Safety Disclosures |
Not Applicable.
14
| | |
| Item 5. | | Market for Registrant’s Common Equity, Related Stockholder Matters and Issuer Purchases of Equity Securities |
Market Information
Shares of CDI’s common stock are traded on the New York Stock Exchange under the trading symbol “CDI”. The high and low sales price per share of the Company’s common stock for each quarter during the last two years are shown in the table below, together with dividend information for each period.
| | | | | | | | | | | | |
| | | High | | | Low | | | Dividends | |
2011 | | | | | | | | | | | | |
First quarter | | $ | 20.34 | | | $ | 13.71 | | | $ | 0.13 | |
Second quarter | | | 15.40 | | | | 12.70 | | | | 0.13 | |
Third quarter | | | 13.71 | | | | 9.84 | | | | 0.13 | |
Fourth quarter | | | 14.24 | | | | 10.05 | | | | 0.13 | |
| | | |
2010 | | | | | | | | | | | | |
First quarter | | $ | 16.07 | | | $ | 12.25 | | | $ | 0.13 | |
Second quarter | | | 18.65 | | | | 14.04 | | | | 0.13 | |
Third quarter | | | 18.26 | | | | 10.86 | | | | 0.13 | |
Fourth quarter | | | 19.90 | | | | 12.09 | | | | 0.13 | |
Dividends
Dividends have been paid quarterly during the past two years. The declaration and payment of future dividends will be at the discretion of the Company’s Board of Directors and will depend upon many factors, including the Company’s earnings, financial condition and capital requirements. The Company maintains a Credit Agreement with JPMorgan Chase Bank, N.A. that requires a minimum liquidity balance (unrestricted cash and cash equivalents plus the unused amount available for borrowing under the credit facility) of greater than $25.0 million to be maintained by CDI Corp. before the Company can pay a dividend.
Shareholders
As of February 24, 2012, there were 367 shareholders of record of the Company’s common stock. A single record shareholder account may however represent multiple beneficial owners, including holders of shares in street name accounts. Including those multiple beneficial owners, the Company estimates that the total number of shareholders of the Company’s common stock on February 24, 2012 was approximately 4,200. See Part III, Item 12 and Note 7—Stock-Based Compensation, in the notes to the consolidated financial statements included in Item 8 of this Form 10-K Report, for information relating to securities authorized for issuance under the Company’s equity compensation plans.
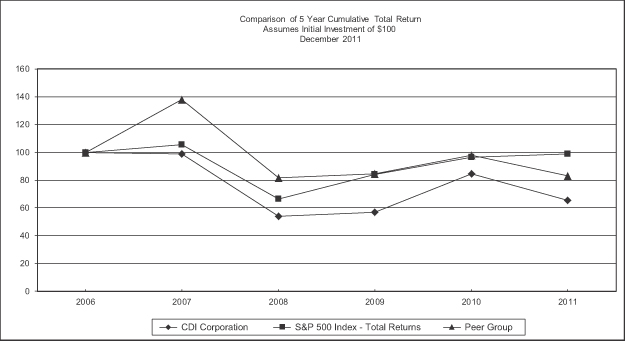
Comparative Stock Performance
The following graph sets forth the cumulative total shareholder return (assuming an investment of $100 on December 31, 2006 and the reinvestment of any dividends) for the last five fiscal years on: CDI stock, the Standard & Poor’s (“S&P”) 500 Index, and peer group.
CDI’s peer group (“Peer Group”) consists of the following companies: AECOM Technology Corp., CIBER, Inc., Computer Task Group Inc., Heidrick & Struggles International Inc., Jacobs Engineering Group, Inc., Korn/Ferry International, Robert Half International Inc., Shaw Group Inc. and Volt Information Sciences Inc.
15
| | | | | | | | | | | | | | | | | | | | | | | | |
| | | Years ended December 31, | |
| | | 2006 | | | 2007 | | | 2008 | | | 2009 | | | 2010 | | | 2011 | |
CDI Corp. | | $ | 100.00 | | | $ | 98.97 | | | $ | 54.26 | | | $ | 56.75 | | | $ | 84.48 | | | $ | 65.27 | |
S&P 500 Index—Total Return | | | 100.00 | | | | 105.50 | | | | 66.47 | | | | 84.05 | | | | 96.71 | | | | 98.75 | |
Peer Group | | | 100.00 | | | | 138.09 | | | | 81.48 | | | | 84.47 | | | | 98.08 | | | | 83.26 | |
Recent Sales of Unregistered Securities and Use of Proceeds from Registered Securities
None.
Purchases of Equity Securities by the Issuer
The Company did not repurchase any of the Company’s common stock during the quarter ended December 31, 2011.
16
| | |
| Item 6. | | Selected Financial Data |
The following is selected financial data derived from the Company’s audited consolidated financial statements for each of the last five years. The data should be read in conjunction with the Company’s consolidated financial statements and accompanying notes thereto included in Item 8 of this Form 10-K Report and with Management’s Discussion and Analysis of Financial Condition and Results of Operations thereto included in Item 7 of this Form 10-K Report. The data presented below is in thousands, except for per share data.
| | | | | | | | | | | | | | | | | | | | |
| | | For the years ended December 31, | |
| | | 2011 | | | 2010 | | | 2009 | | | 2008 | | | 2007 | |
Earnings Data: | | | | | | | | | | | | | | | | | | | | |
Revenue | | $ | 1,059,803 | | | $ | 926,289 | | | $ | 884,950 | | | $ | 1,118,597 | | | $ | 1,187,299 | |
Income (loss) from continuing operations (1) | | $ | 15,000 | | | $ | (10,814 | ) | | $ | (19,919 | ) | | $ | 19,415 | | | $ | 31,828 | |
Discontinued operations, net of tax (1) | | | - | | | | - | | | | - | | | | - | | | | 2,374 | |
Less: Income (loss) attributable to the noncontrolling interest | | | 167 | | | | 44 | | | | (17 | ) | | | - | | | | - | |
Net income (loss) attributable to CDI | | $ | 14,833 | | | $ | (10,858 | ) | | $ | (19,902 | ) | | $ | 19,415 | | | $ | 34,202 | |
Basic earnings (loss) attributable to CDI per share: | | | | | | | | | | | | | | | | | | | | |
Earnings (loss) from continuing operations (1) | | $ | 0.77 | | | $ | (0.57 | ) | | $ | (1.05 | ) | | $ | 0.98 | | | $ | 1.57 | |
Discontinued operations (1) | | | - | | | | - | | | | - | | | | - | | | | 0.12 | |
Net earnings (loss) attributable to CDI | | $ | 0.77 | | | $ | (0.57 | ) | | $ | (1.05 | ) | | $ | 0.98 | | | $ | 1.69 | |
Diluted earnings (loss) attributable to CDI per share: | | | | | | | | | | | | | | | | | | | | |
Earnings (loss) from continuing operations (1) | | $ | 0.77 | | | $ | (0.57 | ) | | $ | (1.05 | ) | | $ | 0.97 | | | $ | 1.56 | |
Discontinued operations (1) | | | - | | | | - | | | | - | | | | - | | | | 0.12 | |
Net earnings (loss) attributable to CDI | | $ | 0.77 | | | $ | (0.57 | ) | | $ | (1.05 | ) | | $ | 0.97 | | | $ | 1.68 | |
Cash dividends declared per common share | | $ | 0.52 | | | $ | 0.52 | | | $ | 0.52 | | | $ | 0.52 | | | $ | 0.46 | |
| | | | | |
Balance Sheet Data: | | | | | | | | | | | | | | | | | | | | |
Total assets of continuing operations (1) | | $ | 390,696 | | | $ | 398,511 | | | $ | 375,034 | | | $ | 383,199 | | | $ | 450,058 | |
Long-term obligations of continuing operations (1) | | $ | 13,704 | | | $ | 15,496 | | | $ | 12,945 | | | $ | 11,821 | | | $ | 12,339 | |
Total equity | | | 267,031 | | | | 258,927 | | | | 274,896 | | | | 291,385 | | | | 334,978 | |
| | | | | |
Weighted average shares for earnings (loss) attributable to CDI per share: | | | | | | | | | | | | | | | | | | | | |
Basic Shares | | | 19,144 | | | | 19,015 | | | | 18,932 | | | | 19,874 | | | | 20,209 | |
Diluted Shares | | | 19,356 | | | | 19,015 | | | | 18,932 | | | | 20,009 | | | | 20,377 | |
| (1) | In September 2007, the Company sold its Todays Staffing, Inc. subsidiary to Spherion Corporation. The sale price was $40.1 million in cash and the Company retained responsibility for certain liabilities and certain current and deferred income taxes directly related to the business. The Company recorded a gain of $2.1 million ($1.3 million after-tax) in connection with the sale. |
17
| | |
| Item 7. | | Management’s Discussion and Analysis of Financial Condition and Results of Operations |
The following Management’s Discussion and Analysis of Financial Condition and Results of Operations should be read in conjunction with the consolidated financial statements and the accompanying notes thereto included in Item 8 of this Form 10-K Report.
Executive Overview
CDI is an integrated engineering and technology services organization providing differentiated, client-focused solutions in select global industries.
In December 2011, the Company announced business model and organizational changes aligned with a new strategic plan to make CDI an engineering and technology solutions company with global capabilities in select markets. The objectives of these changes are to grow the Company’s solutions business, optimize the Company’s professional staffing operations and prioritize the geographic markets and industries to which the Company will deliver engineering and technology solutions.
Effective January 2012, the Company’s restructured business model provides a range of integrated engineering and technology solutions and professional staffing services through an organizational platform focused on services offered to clients, geographic markets that reflect its clients’ growth plans and select industries that are aligned with the Company’s core capabilities. Effective January 2012, the Company’s reportable segments are: Global Engineering and Technology Solutions (“GETS”), Professional Services Staffing (“PSS”), and Management Recruiters International, Inc. (“MRI”). The restructured business is focused on offering services through three geographic regions: the Americas; Europe, the Middle East and Africa (“EMEA”); and Asia Pacific (“APAC”).
The financial information presented in this Management’s Discussion and Analysis of Financial Condition and Results of Operations does not give effect to the change in the composition of the Company’s operating segments as a result of the restructuring described above. During 2011, the Company had four reporting segments: CDI Engineering Solutions (“ES”), CDI Information Technology Solutions (“ITS”), MRI and CDI AndersElite (“Anders”).
Revenue in 2011 increased $133.5 million or 14.4% as compared to 2010 as revenue rose in three of the Company’s four operating segments. Revenue increased in the Company’s ES segment by $98.8 million, primarily due to growth within the Process & Industrial (“P&I”) vertical as well as a result of the inclusion of a full year of revenue in 2011 from the acquisitions of substantially all of the assets and certain liabilities of L. Robert Kimball & Associates, Inc. and two affiliated companies (collectively, “L.R. Kimball”) (Infrastructure vertical) and DSPCon, Inc. (“DSPCon”) (Aerospace vertical) in June and December of 2010, respectively. Additionally, revenue from the Company’s ITS segment increased by $30.3 million primarily due to account growth within a large national account.
During 2011, the Company’s operating cash flows increased $32.3 million primarily as a result the Company’s efforts to manage its working capital in addition to its revenue growth. The significant improvement in operating cash flows allowed the Company to pay off the full balance on its credit facility that it drew during 2010.
During December 2011, the Company initiated a restructuring plan (“Restructuring Plan”) designed to reduce costs and improve efficiencies as part of the strategic plan. The Company recorded an $8.1 million charge during the fourth quarter as a result of this plan. The actions to align the organization and business model provide the Company with a more efficient operating platform to support future revenue and profit growth.
18
Consolidated Results of Operations
2011 versus 2010
Results of Operations
The following table presents revenue by service type, selected financial data along with certain key metrics (in percentages) for 2011 and 2010:
Consolidated
| | | | | | | | | | | | | | | | | | | | | | | | |
| | | 2011 | | | 2010 | | | Increase (Decrease) | |
| (in thousands) | | $ | | | % of Total
Revenue | | | $ | | | % of Total
Revenue | | | $ | | | % | |
Revenue | | | | | | | | | | | | | | | | | | | | | | | | |
Staffing services | | $ | 749,268 | | | | 70.7 | % | | $ | 659,967 | | | | 71.3 | % | | $ | 89,301 | | | | 13.5 | % |
Project outsourcing services | | | 284,936 | | | | 26.9 | | | | 243,781 | | | | 26.3 | | | | 41,155 | | | | 16.9 | |
Professional services | | | 25,599 | | | | 2.4 | | | | 22,541 | | | | 2.4 | | | | 3,058 | | | | 13.6 | |
Total revenue | | $ | 1,059,803 | | | | 100.0 | | | $ | 926,289 | | | | 100.0 | | | $ | 133,514 | | | | 14.4 | |
Gross profit | | $ | 225,301 | | | | 21.3 | | | $ | 193,963 | | | | 20.9 | | | $ | 31,338 | | | | 16.2 | |
Goodwill impairment | | $ | - | | | | - | | | $ | 8,312 | | | | 0.9 | | | $ | (8,312 | ) | | | (100.0 | ) |
Restructuring and other related costs | | $ | 8,100 | | | | 0.8 | | | $ | - | | | | - | | | $ | 8,100 | | | | 100.0 | |
Operating and administrative expenses | | $ | 196,826 | | | | 18.6 | | | $ | 185,958 | | | | 20.0 | | | $ | 10,868 | | | | 5.8 | |
Operating profit (loss) | | $ | 20,375 | | | | 1.9 | | | $ | (307 | ) | | | - | | | $ | 20,682 | | | | NM | |
Net income (loss) attributable to CDI | | $ | 14,833 | | | | 1.4 | | | $ | (10,858 | ) | | | (1.2 | ) | | $ | 25,691 | | | | NM | |
Cash and cash equivalents | | $ | 26,644 | | | | | | | $ | 28,746 | | | | | | | $ | (2,102 | ) | | | (7.3 | ) |
Cash flow provided by (used in) operations | | $ | 28,002 | | | | | | | $ | (4,339 | ) | | | | | | $ | 32,341 | | | | NM | |
Effective income tax rate | | | 25.5 | % | | | | | | | (243.7 | )% | | | | | | | | | | | | |
After-tax return on shareholders’ equity (1) | | | 5.6 | % | | | | | | | (4.1 | )% | | | | | | | | | | | | |
Pre-tax return on net assets(2) | | | 8.7 | % | | | | | | | (1.5 | )% | | | | | | | | | | | | |
| (1) | Net income (loss) attributable to CDI divided by the average of the beginning and ending balances of CDI shareholders’ equity. |
| (2) | Income (loss) before income taxes for the year, divided by the average net assets at the beginning and end of the year. Net assets include total assets minus total liabilities excluding cash and cash equivalents and income tax accounts. |
NM—Not meaningful.
Revenue for 2011 increased 14.4% as compared to 2010. ES experienced increases in staffing services in the oil & gas and chemical sector and in industrial accounts. ES project engineering revenue increased primarily as a result of the inclusion of a full year of revenue in the current period from the acquisitions of the L.R. Kimball and DSPCon businesses in June and December 2010, respectively. ITS experienced increased staffing services revenue, primarily due to account expansions with a large account. MRI also experienced growth in staffing revenue, due to franchisees continuing to grow their staffing services. These increases in revenue were partially offset by decreases in Anders’ staffing services revenue, primarily due to deterioration in Anders’ transportation business in 2011 as compared to 2010.
Gross profit for 2011 increased as compared to 2010 primarily due to the increases in revenue. Gross profit margin increased from 20.9% in 2010 to 21.3% in 2011, primarily due to inclusion of a full year of profits in the current period from the acquisitions of the L.R. Kimball (Infrastructure vertical) and DSPCon (Aerospace vertical) businesses in June and December of 2010, respectively, and the shift in mix to higher-margin outsourcing projects in the ES segment, partially offset by $4.1 million of HIRE Act payroll tax credits in 2010.
Consolidated operating and administrative expenses for 2011 increased as compared to 2010, primarily due to the inclusion of a full year of costs in the current period from the acquisitions of the L.R. Kimball and DSPCon businesses in June and December of 2010, respectively, and increased consulting costs in the corporate reporting unit as the Company made investments to support its new organizational structure. These increases were partially offset by the OFT fine reduction of $9.7 million in the second quarter of 2011 (see Note 10–Commitments and Contingencies, in the notes to the consolidated financial statements included in Item 8 of this Form 10-K Report) and the impact of cost reduction measures taken throughout 2011.
Operating profit increased by $20.7 million to $20.4 million in 2011 compared to a loss of $0.3 million in 2010. The increase in operating profit was primarily due to increases in business volume, the OFT fine reduction in the second quarter of 2011, the $8.3 million goodwill impairment charge in 2010 and the impact of cost reduction measures in 2011. This increase was partially
19
offset by the $8.1 million restructuring expense incurred in 2011, $4.1 million of HIRE Act payroll tax credits received in 2010 and the $1.8 million benefit realized in 2010 as a result of a legal settlement.
Operating profit margin increased from 0.0% in 2010 to 1.9% in 2011, primarily due to the factors that affected operating profit described above.
The effective tax rates for 2011 and 2010 were 25.5% and (243.7)%, respectively. The effective income tax rate for 2011 was favorably impacted by a reduction in the reserve for the OFT matter, which is not subject to tax (see Note 9–Income Taxes and Note 10–Commitments and Contingencies, in the notes to the consolidated financial statements included in Item 8 of this Form 10-K Report). The 2011 period was also favorably impacted by Federal income tax credits under the HIRE Act of $0.9 million. However, these credits were offset by a $0.8 million reduction to deferred tax assets for stock-based compensation grants that vested or expired. In addition, the 2011 rate was unfavorably impacted by losses in the UK and Australia for which no tax benefit has been recognized.
The negative income tax rate for the 2010 period reflects an income tax expense on a pre-tax loss. The income tax rate for the 2010 period was unfavorably impacted primarily by: certain foreign tax attributes, including a $2.8 million charge for a full valuation allowance against deferred tax assets in the UK operations of Anders; the $2.9 million tax effect of an $8.3 million impairment charge related to a non-deductible goodwill write-down in the Anders segment; losses in foreign jurisdictions on which no tax benefit has been recognized or on which the tax benefit was recognized at tax rates lower than the U.S. rate; and additional tax expense related to a non-realizable tax asset. These unfavorable items were partially offset by the favorable impact of the 2010 reduction in the reserve for the 2009 claim under the US False Claims Act brought by the Civil Division of the Department of Justice (“DOJ”) and an individual relator (the “DOJ matter”), which was largely not taxable.
In December 2011, the Company announced a strategic growth initiative. As part of this initiative, the Company approved the Restructuring Plan that is designed to reduce costs and improve efficiencies. The Restructuring Plan eliminated approximately 200 positions, consolidated facilities and reduced related operating costs. Restructuring Plan actions started in December 2011 and are expected to be completed in 2012.
In the fourth quarter of 2011, the Company recorded an aggregate pre-tax charge of $8.1 million to “Restructuring and other related costs” in the consolidated statement of operations, comprised of $5.7 million of employee severance and related costs, $0.8 million of real estate exit and related costs and $1.5 million of asset write-offs.
Corporate
Corporate expenses consist of operating and administrative expenses that are not allocated to the reporting units under segment reporting. Corporate expenses increased to $24.4 million for 2011 from $15.9 million for 2010 due to increased consulting, personnel-related, consolidation of support functions and restructuring costs as the Company made investments to support its new business strategy.
20
Segment Discussion
CDI Engineering Solutions (“ES”)
Results of Operations
The following table presents changes in revenue by category, cost of services, gross profit, operating and administrative expenses and operating profit for ES for 2011 and 2010:
ES
| | | | | | | | | | | | | | | | | | | | | | | | |
| | | 2011 | | | 2010 | | | Increase | |
| (in thousands) | | $ | | | % of
Total
Revenue | | | $ | | | % of
Total
Revenue | | | $ | | | % | |
Revenue | | | | | | | | | | | | | | | | | | | | | | | | |
Staffing services | | $ | 325,269 | | | | 55.9 | % | | $ | 270,012 | | | | 55.9 | % | | $ | 55,257 | | | | 20.5 | % |
Project outsourcing services | | | 254,831 | | | | 43.7 | | | | 212,084 | | | | 43.8 | | | | 42,747 | | | | 20.2 | |
Professional services | | | 2,456 | | | | 0.4 | | | | 1,635 | | | | 0.3 | | | | 821 | | | | 50.2 | |
Total revenue | | | 582,556 | | | | 100.0 | | | | 483,731 | | | | 100.0 | | | | 98,825 | | | | 20.4 | |
Cost of services | | | 460,151 | | | | 79.0 | | | | 387,811 | | | | 80.2 | | | | 72,340 | | | | 18.7 | |
Gross profit | | | 122,405 | | | | 21.0 | | | | 95,920 | | | | 19.8 | | | | 26,485 | | | | 27.6 | |
Operating and administrative expenses (1) | | | 107,598 | | | | 18.5 | | | | 87,210 | | | | 18.0 | | | | 20,388 | | | | 23.4 | |
Operating profit | | $ | 14,807 | | | | 2.5 | | | $ | 8,710 | | | | 1.8 | | | $ | 6,097 | | | | 70.0 | |
| (1) | The year ended December 31, 2011 includes a $5.8 million restructuring charge. |
ES’ revenue increased for 2011 as compared to 2010 primarily due to:
| | Ÿ | | strong growth in staffing services provided to clients in the oil & gas and chemical sector, as well as industrial accounts; and |
| | Ÿ | | growth in project outsourcing services as a result of the inclusion of a full year of revenue in the current period from the acquisitions of the L.R. Kimball (Infrastructure vertical) and DSPCon (Aerospace vertical) businesses in June and December 2010, respectively, as well as organic growth in the Company’s P&I vertical. |
ES’ gross profit increased in total dollars during 2011 as compared to 2010 primarily due to the increase in revenue, which was driven primarily by the inclusion of a full year of results in the current period from the acquisitions of L.R. Kimball (Infrastructure vertical) and DSPCon (Aerospace vertical) businesses in June and December of 2010, respectively, and to a lesser extent, by an increase in staffing services. Gross profit margin increased primarily due to the shift in mix to higher-margin projects in the Infrastructure, Aerospace and P&I verticals, partially offset by $1.5 million of HIRE Act payroll tax credits received in 2010.
ES’ operating and administrative expenses increased during 2011 as compared to 2010 primarily due to the inclusion of a full year of costs in the current period from the acquisitions of the L.R. Kimball (Infrastructure vertical) and DSPCon (Aerospace vertical) businesses in June and December 2010, respectively, and a $5.8 million restructuring charge in the fourth quarter of 2011. Additionally, ES recorded a $1.8 million benefit in 2010 as a result of the settlement of the DOJ matter. The Company reserved $4.3 million in 2009 for the DOJ matter, but settled the claim for $2.4 million, resulting in the $1.8 million reduction of the reserve in 2010. In addition, the Company implemented certain cost reduction measures throughout 2011.
ES’ operating profit increased for 2011 as compared to 2010 primarily due to the increase in revenue, which was driven by an increase in higher-margin project business in the P&I, Infrastructure and Aerospace verticals partially offset by the restructuring charge, 2010 HIRE Act payroll tax credits and 2010 reversal of the legal settlement reserve described above.
ES operated through the following four verticals:
| | Ÿ | | CDI-Process and Industrial (“P&I”)—P&I provided engineering, design, project management, professional staffing and outsourcing solutions to firms in oil & gas, refining, alternative energy, power generation and energy transmission, chemicals and heavy manufacturing industries. |
| | Ÿ | | CDI-Government Services (“Government Services”)— Government Services provided engineering, design, logistics and professional staffing services to the U.S. defense industry, particularly in marine design, systems development and military aviation support. |
| | Ÿ | | CDI-Aerospace (“Aerospace”)—Aerospace provided engineering, design, project management and outsourcing solutions to both the commercial and military aerospace markets. |
21
| | Ÿ | | CDI-Infrastructure (“Infrastructure”) – Infrastructure provided architecture, civil and environmental engineering, communication technology and consulting services to governmental, educational and private industry clients, through a network of offices primarily in the mid-Atlantic region. |
The following table presents changes in revenue for each of ES’s verticals for 2011 and 2010:
ES
| | | | | | | | | | | | | | | | | | | | | | | | |
| | | 2011 | | | 2010 | | | Increase | |
| (in thousands) | | 2011 | | | % of
Total
Revenue | | | $ | | | % of
Total
Revenue | | | $ | | | % | |
Revenue | | | | | | | | | | | | | | | | | | | | | | | | |
CDI-P & I | | | 396,908 | | | | 68.1 | % | | $ | 328,633 | | | | 68.0 | % | | $ | 68,275 | | | | 20.8 | % |
CDI-Government Services | | | 78,249 | | | | 13.4 | | | | 78,018 | | | | 16.1 | | | | 231 | | | | 0.3 | |
CDI-Aerospace | | | 57,586 | | | | 9.9 | | | | 48,577 | | | | 10.0 | | | | 9,009 | | | | 18.5 | |
CDI-Infrastructure | | | 49,813 | | | | 8.6 | | | | 28,503 | | | | 5.9 | | | | 21,310 | | | | 74.8 | |
Total revenue | | $ | 582,556 | | | | 100.0 | | | $ | 483,731 | | | | 100.0 | | | $ | 98,825 | | | | 20.4 | |
Revenue in the P&I vertical increased during 2011 as compared to 2010 primarily due to increases in staffing services in the oil & gas and chemical sector and industrial accounts as well as project outsourced engineering services in our U.S. Gulf Coast operations, particularly in the chemical sector.
Revenue in the Government Services vertical was relatively flat during 2011 as compared to 2010 due to increases in project outsourcing services accounts as a result of U.S. government funding releases later in the year, largely offset by a reduction and delays in Federal funding for staffing projects in the defense sector.
Revenue in the Aerospace vertical increased in 2011 as compared to 2010 primarily due to the inclusion of a full year of revenue in the current period as a result of the acquisition of the DSPCon business in December 2010.
The Infrastructure vertical was added to the ES business segment in the second quarter of 2010 with the June 2010 purchase the L.R. Kimball business. Revenue in the Infrastructure vertical increased in 2011 as compared to 2010 primarily due to the inclusion of a full year of revenue in the current period.
CDI Information Technology Solutions (“ITS”)
Results of Operations
The following table presents changes in revenue by category, cost of services, gross profit, operating and administrative expenses, and operating profit for ITS for 2011 and 2010:
ITS
| | | | | | | | | | | | | | | | | | | | | | | | |
| | | 2011 | | | 2010 | | | Increase (Decrease) | |
| (in thousands) | | $ | | | % of
Total
Revenue | | | $ | | | % of
Total
Revenue | | | $ | | | % | |
Revenue | | | | | | | | | | | | | | | | | | | | | | | | |
Staffing services | | $ | 314,766 | | | | 90.9 | % | | $ | 283,440 | | | | 89.8 | % | | $ | 31,326 | | | | 11.1 | % |
Project outsourcing services | | | 30,105 | | | | 8.7 | | | | 31,697 | | | | 10.0 | | | | (1,592 | ) | | | (5.0 | ) |
Professional services | | | 1,291 | | | | 0.4 | | | | 712 | | | | 0.2 | | | | 579 | | | | 81.3 | |
Total revenue | | | 346,162 | | | | 100.0 | | | | 315,849 | | | | 100.0 | | | | 30,313 | | | | 9.6 | |
Cost of services | | | 290,041 | | | | 83.8 | | | | 262,435 | | | | 83.1 | | | | 27,606 | | | | 10.5 | |
Gross profit | | | 56,121 | | | | 16.2 | | | | 53,414 | | | | 16.9 | | | | 2,707 | | | | 5.1 | |
Operating and administrative expenses | | | 42,499 | | | | 12.3 | | | | 41,348 | | | | 13.1 | | | | 1,151 | | | | 2.8 | |
Operating profit | | $ | 13,622 | | | | 3.9 | | | $ | 12,066 | | | | 3.8 | | | $ | 1,556 | | | | 12.9 | |
22
ITS’s revenue increased for 2011 as compared to 2010 primarily due to increases in staffing services, which was largely driven by expansion with a large staffing services account, partially offset by a decline in another large staffing services account as certain temporary projects on the account were completed. This increase in revenue was also partially offset by decreases in project outsourcing services, primarily due to the completion of a large project.
ITS’s gross profit increased in total dollars in 2011 as compared to 2010, primarily due to increases in revenue. ITS’s gross profit margin was lower in 2011 due to growth in lower-margin staffing accounts and $2.2 million of HIRE Act payroll tax credits received in 2010.
ITS’s operating and administrative expenses increased for 2011 as compared to 2010 primarily due to a restructuring expense of $1.3 million and costs associated with increased business volumes, partially offset by certain cost reduction measures taken throughout 2011, lower commission expenses associated with the decrease in project outsourcing services, as well as the reversal of a reserve of $0.4 million due to a favorable state sales tax ruling in the third quarter of 2011.
ITS’s operating profit increased for 2011 as compared to 2010 primarily due to increased business volumes and a reversal of a reserve due to a favorable state sales tax ruling of $0.4 million in the third quarter of 2011, partially offset by $2.2 million of HIRE Act payroll tax credits received in 2010 and the restructuring expense incurred of $1.3 million.
Management Recruiters International (“MRI”)
Results of Operations
The following table presents changes in revenue, cost of services, gross profit, operating and administrative expenses and operating profit for MRI for 2011 and 2010:
MRI
| | | | | | | | | | | | | | | | | | | | | | | | |
| | | 2011 | | | 2010 | | | Increase
(Decrease) | |
| (in thousands) | | $ | | | % of
Total
Revenue | | | $ | | | % of
Total
Revenue | | | $ | | | % | |
Revenue | | | | | | | | | | | | | | | | | | | | | | | | |
Staffing services | | $ | 51,612 | | | | 75.2 | % | | $ | 44,386 | | | | 72.4 | % | | $ | 7,226 | | | | 16.3 | % |
Professional services | | | 16,983 | | | | 24.8 | | | | 16,930 | | | | 27.6 | | | | 53 | | | | 0.3 | |
Total revenue | | | 68,595 | | | | 100.0 | | | | 61,316 | | | | 100.0 | | | | 7,279 | | | | 11.9 | |
Cost of services | | | 35,672 | | | | 52.0 | | | | 28,941 | | | | 47.2 | | | | 6,731 | | | | 23.3 | |
Gross profit | | | 32,923 | | | | 48.0 | | | | 32,375 | | | | 52.8 | | | | 548 | | | | 1.7 | |
Operating and administrative expenses | | | 24,372 | | | | 35.5 | | | | 26,287 | | | | 42.9 | | | | (1,915 | ) | | | (7.3 | ) |
Operating profit | | $ | 8,551 | | | | 12.5 | | | $ | 6,088 | | | | 9.9 | | | $ | 2,463 | | | | 40.5 | |
MRI’s revenue increased for 2011 as compared to 2010 primarily due to the growth of franchisees’ staffing services business, reflecting ongoing demand for skilled contingent professionals. Professional services revenue was relatively flat as an increase in royalties was predominantly offset by lower franchise fees.
MRI’s gross profit increased in total dollars in 2011 as compared to 2010 primarily due to the increase in staffing services revenues. MRI’s gross profit margin decreased for 2011 as compared to 2010 primarily due to the shift in mix to lower-margin staffing services.
MRI’s operating and administrative expenses decreased for 2011 as compared to 2010 primarily due to cost reduction efforts.
MRI’s operating profit increased for 2011 as compared to 2010 driven primarily by increases in revenues due to growth in staffing services and cost reduction efforts.
23
CDI AndersElite (“Anders”)
Results of Operations
The following table presents changes in revenue, cost of services, gross profit, operating and administrative expenses and operating profit (loss) for Anders for 2011 and 2010:
Anders
| | | | | | | | | | | | | | | | | | | | | | | | |
| | | | 2011 | | | | 2010 | | |
| Increase
(Decrease) |
|
(in thousands) | | | $ | | |
| % of
Total
Revenue |
| | | $ | | |
| % of
Total
Revenue |
| | | $ | | | | % | |
Revenue | | | | | | | | | | | | | | | | | | | | | | | | |
Staffing services | | $ | 57,621 | | | | 92.2 | % | | $ | 62,129 | | | | 95.0 | % | | $ | (4,508 | ) | | | (7.3 | )% |
Professional services | | | 4,869 | | | | 7.8 | | | | 3,264 | | | | 5.0 | | | | 1,605 | | | | 49.2 | |
Total revenue | | | 62,490 | | | | 100.0 | | | | 65,393 | | | | 100.0 | | | | (2,903 | ) | | | (4.4 | ) |
Cost of services | | | 48,638 | | | | 77.8 | | | | 53,139 | | | | 81.3 | | | | (4,501 | ) | | | (8.5 | ) |
Gross profit | | | 13,852 | | | | 22.2 | | | | 12,254 | | | | 18.7 | | | | 1,598 | | | | 13.0 | |
Operating and administrative expenses (1),(2) | | | 6,103 | | | | 9.8 | | | | 25,870 | | | | 39.5 | | | | (19,767 | ) | | | (76.4 | ) |
Operating profit (loss) | | $ | 7,749 | | | | 12.4 | | | $ | (13,616 | ) | | | (20.8 | ) | | $ | 21,365 | | | | NM | |
| (1) | The year ended December 31, 2011 includes a $9.7 million benefit due to the reduction of the reserve for the OFT fine. |
| (2) | The year ended December 31, 2010 includes an $8.3 million goodwill impairment charge. |
Anders’ staffing services revenue decreased for 2011 as compared to 2010 primarily due to the deterioration in Anders’ transportation business, particularly in the first six months, partially offset by revenue growth in Anders’ Australian staffing business. Anders’ professional services revenue increased primarily due to growth in demand for permanent placement.
Anders’ gross profit increased in total dollars in 2011 compared to 2010 as a result of the increase in professional services revenue. Anders’ gross profit margin increased in 2011 as compared to 2010 primarily due to a shift in mix to higher-margin professional services, as well as an increase in staffing margin due to a shift in mix away from certain lower-margin transportation projects.
Anders’ operating and administrative expenses decreased for 2011 as compared to 2010, primarily due to the $9.7 million reduction of a reserve in the second quarter of 2011 for a fine imposed by the OFT in the third quarter of 2009 (See Note 10—Commitments and Contingencies, in the notes to the consolidated financial statements included in Item 8 of this Form 10-K Report). Anders’ operating and administrative expenses also decreased comparatively due to the $8.3 million goodwill impairment charge recorded in 2010 and to a lesser extent, the impact of cost reduction measures in 2011.
Anders’ operating profit for 2011 as compared to 2010 improved primarily due to the reduction of the reserve for the OFT fine, the $8.3 million goodwill impairment charge recorded in 2010 and to a lesser extent, the shift in mix to higher-margin services and the impact of cost reduction measures.
24
Consolidated Results of Operations
2010 versus 2009
Results of Operations
The following table presents revenue by service type, selected financial data, along with certain key metrics (in percentages) for 2010 and 2009:
Consolidated
| | | | | | | | | | | | | | | | | | | | | | | | |
| | | 2010 | | | 2009 | | | Increase (Decrease) | |
| (in thousands) | | $ | | | % of Total
Revenue | | | $ | | | % of Total
Revenue | | | $ | | | % | |
Revenue | | | | | | | | | | | | | | | | | | | | | | | | |
Staffing services | | $ | 659,967 | | | | 71.3 | % | | $ | 623,664 | | | | 70.5 | % | | $ | 36,303 | | | | 5.8 | % |
Project outsourcing services | | | 243,781 | | | | 26.3 | | | | 240,538 | | | | 27.2 | | | | 3,243 | | | | 1.3 | |
Professional services | | | 22,541 | | | | 2.4 | | | | 20,748 | | | | 2.3 | | | | 1,793 | | | | 8.6 | |
Total revenue | | $ | 926,289 | | | | 100.0 | | | $ | 884,950 | | | | 100.0 | | | $ | 41,339 | | | | 4.7 | |
Gross profit | | $ | 193,963 | | | | 20.9 | | | $ | 176,564 | | | | 20.0 | | | $ | 17,399 | | | | 9.9 | |
Goodwill impairment | | $ | 8,312 | | | | 0.9 | | | $ | - | | | | - | | | $ | 8,312 | | | | 100.0 | |
Operating and administrative expenses | | $ | 185,958 | | | | 20.0 | | | $ | 194,699 | | | | 22.0 | | | $ | (8,741 | ) | | | (4.5 | ) |
Operating loss | | $ | (307 | ) | | | - | | | $ | (18,135 | ) | | | (2.0 | ) | | $ | 17,828 | | | | (98.3 | ) |
Net loss attributable to CDI | | $ | (10,858 | ) | | | (1.2 | ) | | $ | (19,902 | ) | | | (2.2 | ) | | $ | 9,044 | | | | (45.4 | ) |
Cash and cash equivalents | | $ | 28,746 | | | | | | | $ | 73,528 | | | | | | | $ | (44,782 | ) | | | (60.9 | ) |
Cash flow (used in) provided by operations | | $ | (4,339 | ) | | | | | | $ | 22,818 | | | | | | | $ | (27,157 | ) | | | (119.0 | ) |
Effective income tax rate | | | (243.7 | )% | | | | | | | (2.6 | )% | | | | | | | | | | | | |
After-tax return on shareholders’ equity (1) | | | (4.1 | )% | | | | | | | (7.0 | )% | | | | | | | | | | | | |
Pre-tax return on net assets (2) | | | (1.5 | )% | | | | | | | (9.7 | )% | | | | | | | | | | | | |
| (1) | Net income (loss) attributable to CDI divided by the average of the beginning and ending balances of CDI shareholders’ equity. |
| (2) | Earnings (loss) before income taxes for the year, divided by the average net assets at the beginning and end of the year. Net assets include total assets minus total liabilities excluding cash and cash equivalents and income tax accounts. |
Revenue for 2010 increased 4.7% as compared to 2009. ITS experienced increased staffing and project outsourcing services revenue, primarily due to growth with existing clients, reflecting the Company’s continued investment and improved productivity in sales and recruiting personnel. MRI experienced growth in professional services revenue, primarily due to increased royalties, and in staffing revenue, as franchisees continued to grow their staffing services. ES staffing services revenue increased in 2010 due to increases in and expansions of projects as certain chemical, oil, and other companies proceeded with maintenance projects.
These increases were partially offset by declines in Anders revenue related to continued declines in staffing services, primarily due to continued weakness in the UK construction industry and deterioration in Anders’ transportation business. ES experienced declines in outsourcing revenue, as an uneven economic recovery and continued uncertainty in the energy sector resulted in reduced demand and delayed or cancelled projects. The decline in ES outsourcing revenue was partly offset as a result of revenue from the new Infrastructure vertical.
Gross profit for 2010 increased as compared to 2009 primarily due to increases in revenue. Gross profit margin increased primarily due to higher-margin outsourcing projects in the new Infrastructure vertical, lower charges for payroll-related taxes due to the HIRE Act, which expired December 31, 2010, and increased higher-margin professional services revenue, partially offset by lower-margin staffing becoming a larger portion of total revenue.
During 2010, the Company recorded an $8.3 million impairment charge related to a goodwill write-down in its Anders segment.
Consolidated operating and administrative expenses for 2010 decreased as compared to 2009 primarily due to the absence of a $12.3 million charge associated with the fine imposed by the OFT and the $4.3 million charge associated with the DOJ investigation, both of which were included in the 2009 results. The decrease in operating and administrative expenses was also due to cost reduction initiatives taken by the Company throughout 2009 and 2010 and the reserve reduction of $1.8 million related to the settlement of the DOJ matter in 2010. This benefit was partially offset by increased operating expenses associated with the new Infrastructure vertical and increased variable costs for ITS and MRI related to expansions in business volumes.
25
Operating profit increased to a loss of $0.3 million in 2010 from an $18.1 million loss in 2009, and operating profit margin increased to an operating profit margin of 0.0% during 2010 from an operating loss margin of (2.0)% during 2009, primarily due to lower operating and administrative costs, as well as increased revenues in the second through fourth quarters of 2010 as compared to 2009. These were partially offset by the increased operating expenses associated with the new Infrastructure vertical. 2009 operating and administrative costs included the OFT and DOJ charges.
The Company’s effective income tax rate was (243.7)% for the year ended December 31, 2010 compared to (2.6)% for the year ended December 31, 2009. The income tax rate for 2010 was unfavorably impacted primarily by certain foreign tax attributes, including a $2.8 million charge for a full valuation allowance against deferred tax assets in the UK operations of Anders, the $8.3 million impairment charge related to a goodwill write-down in the Anders segment, which was not tax deductible, losses in foreign jurisdictions on which no tax benefit has been recognized or on which the tax benefit was recognized at tax rates lower than the U.S. rate, and additional tax expense related to a non-realizable tax asset. These were partially offset by the favorable impact of the second quarter 2010 reduction in the reserve for the DOJ matter, which is largely not taxable.
The negative income tax rate in 2009, which reflects an income tax expense on a pre-tax loss, was primarily driven by the $12.3 million charge associated with the fine imposed by the OFT, which is not deductible for income tax purposes. The 2009 income tax rate was also impacted by the $4.3 million charge associated with the DOJ investigation, a portion of which is not deductible for income tax purposes. To a lesser extent, the income tax rate in 2009 was also unfavorably impacted by an increase related to uncertain tax positions and operating losses occurring predominantly in foreign jurisdictions on which tax benefits could not be recognized or that were recognized at tax rates lower than in the U.S. and the effect of stock-based compensation plans.
Corporate
Corporate expenses are operating and administrative expenses that are not required to be allocated to the reporting units under segment reporting requirements. Corporate expenses totaled $15.9 million for both 2010 and 2009.
Inflation
During the years ended December 31, 2011, 2010 and 2009, general inflation has been low and the net effect of inflation on the Company’s operations has not been material.
Segment Discussion
CDI Engineering Solutions (“ES”)
Results of Operations
The following table presents changes in revenue by category, cost of services, gross profit, operating and administrative expenses and operating profit for ES for 2010 and 2009:
ES
| | | | | | | | | | | | | | | | | | | | | | | | |
| | | 2010 | | | 2009 | | | Increase
(Decrease) | |
| (in thousands) | | $ | | | % of
Total
Revenue | | | $ | | | % of
Total
Revenue | | | $ | | | % | |
Revenue | | | | | | | | | | | | | | | | | | | | | | | | |
Staffing services | | $ | 270,012 | | | | 55.9 | % | | $ | 266,097 | | | | 55.0 | % | | $ | 3,915 | | | | 1.5 | % |
Project outsourcing services | | | 212,084 | | | | 43.8 | | | | 213,717 | | | | 44.2 | | | | (1,633 | ) | | | (0.8 | ) |
Professional services | | | 1,635 | | | | 0.3 | | | | 3,941 | | | | 0.8 | | | | (2,306 | ) | | | (58.5 | ) |
Total revenue | | | 483,731 | | | | 100.0 | | | | 483,755 | | | | 100.0 | | | | (24 | ) | | | 0.0 | |
Cost of services | | | 387,811 | | | | 80.2 | | | | 392,985 | | | | 81.2 | | | | (5,174 | ) | | | (1.3 | ) |
Gross profit | | | 95,920 | | | | 19.8 | | | | 90,770 | | | | 18.8 | | | | 5,150 | | | | 5.7 | |
Operating and administrative expenses | | | 87,210 | | | | 18.0 | | | | 85,410 | | | | 17.7 | | | | 1,800 | | | | 2.1 | |
Operating profit | | $ | 8,710 | | | | 1.8 | | | $ | 5,360 | | | | 1.1 | | | $ | 3,350 | | | | 62.5 | |
ES’s revenue for 2010 was essentially flat as compared to 2009. The 2010 revenue included $28.5 million of revenue from the operations of the new Infrastructure vertical. Excluding the revenue from the new Infrastructure vertical, ES’s revenue declined in 2010 as compared to 2009, although revenue in the second half of 2010 increased as compared to the first half of 2010, particularly in the P&I vertical, as the economy gradually improved.
26
Factors adversely affecting revenue for 2010 as compared to 2009 were:
| | Ÿ | | Declines in outsourcing as the uneven economic recovery and continued uncertainty in the energy sector that resulted in reduced demand and delayed or cancelled outsourcing projects; |
| | Ÿ | | A project delay caused by a budget funding gap in a major defense project outsourcing services account in the Government Services vertical, as well as client delays in other outsourcing projects; |
| | Ÿ | | Decreases in revenue in the Aerospace vertical, reflecting the relatively weak demand from the commercial aviation industry; |
| | Ÿ | | The completion of certain staffing projects in Canada, somewhat mitigated by new account wins later in the year; and |
| | Ÿ | | Continuing declines in professional services related to the completion of a client contract in 2009 and weak permanent placement demand. |
Factors positively affecting revenue were:
| | Ÿ | | Increases in and expansions of staffing projects as certain chemical, oil and other companies proceeded with maintenance projects; |
| | Ÿ | | Increases in outsourcing revenue related to the Infrastructure vertical; and |
| | Ÿ | | Increases in work performed on several U.S. Navy shipbuilding, ship design and refurbishment projects. |
ES’s gross profit dollars increased during 2010 as compared to 2009 primarily due to increased gross profit dollars from the new Infrastructure vertical. Gross profit margin increased primarily due to higher-margin projects in the Infrastructure vertical and lower charges for payroll-related taxes due to the HIRE Act, which expired December 31, 2010, partially offset by the change in revenue mix, with lower-margin staffing becoming a larger portion of total revenue, as well as the decline in higher-margin revenue from professional services.
ES’s operating and administrative expenses increased slightly during 2010 as compared to 2009 primarily due to increased operating expenses associated with the Infrastructure vertical and a $1.0 million charge for writing off the Company’s investment in its CDI Gulf International joint venture. These increases were partially offset by decreased headcount and other cost reduction initiatives taken by the Company during 2009 and 2010 and the reserve reduction of $1.8 million related to the settlement of the DOJ matter in 2010. 2009 also included the $4.3 million charge associated with the DOJ investigation.
ES’s operating profit increased during 2010 as compared to 2009 primarily due to the increase in gross profit dollars.
The following table presents changes in revenue from each of ES’s verticals for 2010 and 2009:
ES
| | | | | | | | | | | | | | | | | | | | | | | | |
| | | 2010 | | | 2009 | | | Increase (Decrease) | |
| (in thousands) | | $ | | | % of
Total
Revenue | | | $ | | | % of
Total
Revenue | | | $ | | | % | |
Revenue | | | | | | | | | | | | | | | | | | | | | | | | |
CDI-P & I | | $ | 328,633 | | | | 68.0 | % | | $ | 340,405 | | | | 70.4 | % | | $ | (11,772 | ) | | | (3.5 | )% |
CDI-Government Services | | | 78,018 | | | | 16.1 | | | | 88,488 | | | | 18.3 | | | | (10,470 | ) | | | (11.8 | ) |
CDI-Aerospace | | | 48,577 | | | | 10.0 | | | | 54,862 | | | | 11.3 | | | | (6,285 | ) | | | (11.5 | ) |
CDI-Infrastructure | | | 28,503 | | | | 5.9 | | | | - | | | | - | | | | 28,503 | | | | 100.0 | |
Total revenue | | $ | 483,731 | | | | 100.0 | | | $ | 483,755 | | | | 100.0 | | | $ | (24 | ) | | | 0.0 | |
Revenue in the P & I vertical decreased in 2010 as compared to 2009 due to the completion of certain staffing projects in Canada and decreases in outsourcing caused by the uneven economic recovery and continued uncertainty in the energy sector, which resulted in reduced demand and delayed or cancelled projects. These were partially offset by increases in certain staffing projects as companies proceeded with maintenance activities.
Revenue decreased within the Government Services vertical in 2010 as compared to 2009 primarily due to a project delay caused by a budget funding gap in a major defense project outsourcing services account, as well as client delays in other outsourcing projects, partially offset by increases in work on several U.S. Navy shipbuilding, ship design and refurbishment projects.
Revenue within the Aerospace vertical decreased in 2010 as compared to 2009 primarily due to the relatively weak demand from the commercial aviation industry. In December 2010, the Company completed the acquisition of DSPCon, the results of which are not material to the Aerospace vertical.
27
The Infrastructure vertical was established in the second quarter of 2010 with the June 28, 2010 purchase of substantially all of the assets and certain liabilities of L.R. Kimball. The results of L.R. Kimball are included in the Infrastructure vertical from the date of acquisition through December 31, 2010.
CDI Information Technology Solutions (“ITS”)
Results of Operations
The following table presents changes in revenue by category, cost of services, gross profit, operating and administrative expenses, and operating profit for ITS for 2010 and 2009:
ITS
| | | | | | | | | | | | | | | | | | | | | | | | |
| | | 2010 | | | 2009 | | | Increase | |
| (in thousands) | | $ | | | % of
Total
Revenue | | | $ | | | % of
Total
Revenue | | | $ | | | % | |
Revenue | | �� | | | | | | | | | | | | | | | | | | | | | | |
Staffing services | | $ | 283,440 | | | | 89.8 | % | | $ | 216,777 | | | | 88.9 | % | | $ | 66,663 | | | | 30.8 | % |
Project outsourcing services | | | 31,697 | | | | 10.0 | | | | 26,821 | | | | 11.0 | | | | 4,876 | | | | 18.2 | |
Professional services | | | 712 | | | | 0.2 | | | | 330 | | | | 0.1 | | | | 382 | | | | 115.8 | |
Total revenue | | | 315,849 | | | | 100.0 | | | | 243,928 | | | | 100.0 | | | | 71,921 | | | | 29.5 | |
Cost of services | | | 262,435 | | | | 83.1 | | | | 201,145 | | | | 82.5 | | | | 61,290 | | | | 30.5 | |
Gross profit | | | 53,414 | | | | 16.9 | | | | 42,783 | | | | 17.5 | | | | 10,631 | | | | 24.8 | |
Operating and administrative expenses | | | 41,348 | | | | 13.1 | | | | 36,270 | | | | 14.8 | | | | 5,078 | | | | 14.0 | |
Operating profit | | $ | 12,066 | | | | 3.8 | | | $ | 6,513 | | | | 2.7 | | | $ | 5,553 | | | | 85.3 | |
ITS’s revenue for 2010 increased as compared to 2009 primarily due to increases in staffing services from account expansions with existing clients, reflecting the Company’s continued investment in and improved productivity of sales and recruiting personnel. ITS revenue also increased due to increases in project outsourcing services revenue related to several account expansions and professional services revenue, reflecting both higher permanent placement opportunities and a more efficient sales and recruiting force.
ITS’s gross profit dollars increased during 2010 as compared to 2009, primarily due to increases in revenue. ITS’s gross profit margin was lower primarily due to increased business volumes with a lower-margin staffing client and pricing discounts associated with higher business volumes. This was partially offset by lower charges for payroll-related taxes due to the HIRE Act, which expired December 31, 2010, and to a lesser extent, to an increase in higher-margin professional services revenue.
ITS’s operating and administrative expense increased during 2010 as compared to 2009 primarily due to increased sales, recruiting and commission costs related to expansions in business volumes.
ITS’s operating profit increased during 2010 as compared to 2009 primarily due to increased business volumes, lower charges for payroll-related taxes associated with the HIRE Act and operating and administrative expense increasing at a lower rate than revenues.
28
Management Recruiters International (“MRI”)
Results of Operations
The following table presents changes in revenue, cost of services, gross profit, operating and administrative expenses and operating profit for MRI for 2010 and 2009:
MRI
| | | | | | | | | | | | | | | | | | | | | | | | |
| | | 2010 | | | 2009 | | | Increase (Decrease) | |
| (in thousands) | | $ | | | % of
Total
Revenue | | | $ | | | % of
Total
Revenue | | | $ | | | % | |
Revenue | | | | | | | | | | | | | | | | | | | | | | | | |
Staffing services | | $ | 44,386 | | | | 72.4 | % | | $ | 40,031 | | | | 74.2 | % | | $ | 4,355 | | | | 10.9 | % |
Professional services | | | 16,930 | | | | 27.6 | | | | 13,944 | | | | 25.8 | | | | 2,986 | | | | 21.4 | |
Total revenue | | | 61,316 | | | | 100.0 | | | | 53,975 | | | | 100.0 | | | | 7,341 | | | | 13.6 | |
Cost of services | | | 28,941 | | | | 47.2 | | | | 27,389 | | | | 50.7 | | | | 1,552 | | | | 5.7 | |
Gross profit | | | 32,375 | | | | 52.8 | | | | 26,586 | | | | 49.3 | | | | 5,789 | | | | 21.8 | |
Operating and administrative expenses | | | 26,287 | | | | 42.9 | | | | 24,280 | | | | 45.0 | | | | 2,007 | | | | 8.3 | |
Operating profit | | $ | 6,088 | | | | 9.9 | | | $ | 2,306 | | | | 4.3 | | | $ | 3,782 | | | | 164.0 | |
MRI’s staffing revenue for 2010 increased as compared to 2009 primarily due to new business wins as franchisees continued to grow their staffing services businesses, reflecting ongoing demand for skilled contingent professionals. The increase in professional services revenue was due to increased royalties, reflecting ongoing strength and demand for skilled permanent placement professionals.
MRI’s gross profit dollars increased during 2010 as compared to 2009 primarily due to increases in revenue. Gross profit margin increased primarily due to growth in certain higher-margin staffing accounts and changes in business mix, with higher-margin professional services revenue composing a larger percent of total revenue.
MRI’s operating and administrative expenses increased during 2010 as compared to 2009 primarily due to increases in variable costs related to higher volume staffing services. This was partially offset by decreased headcount and other savings realized from cost reduction initiatives taken by the Company during 2009 and 2010.
MRI’s operating profit increased primarily due to the increase in gross profit dollars, combined with smaller increases in operating expenses. Additionally, MRI’s operating profit gain also reflects the profitability of its international operations.
CDI AndersElite (“Anders”)
Results of Operations
The following table presents changes in revenue, cost of services, gross profit, operating and administrative expenses and operating (loss) profit for Anders for 2010 and 2009:
Anders
| | | | | | | | | | | | | | | | | | | | | | | | |
| | | 2010 | | | 2009 | | | Increase (Decrease) | |
| (in thousands) | | $ | | | % of
Total
Revenue | | | $ | | | % of
Total
Revenue | | | $ | | | % | |
Revenue | | | | | | | | | | | | | | | | | | | | | | | | |
Staffing services | | $ | 62,129 | | | | 95.0 | % | | $ | 100,759 | | | | 97.5 | % | | $ | (38,630 | ) | | | (38.3 | )% |
Professional services | | | 3,264 | | | | 5.0 | | | | 2,533 | | | | 2.5 | | | | 731 | | | | 28.9 | |
Total revenue | | | 65,393 | | | | 100.0 | | | | 103,292 | | | | 100.0 | | | | (37,899 | ) | | | (36.7 | ) |
Cost of services | | | 53,139 | | | | 81.3 | | | | 86,867 | | | | 84.1 | | | | (33,728 | ) | | | (38.8 | ) |
Gross profit | | | 12,254 | | | | 18.7 | | | | 16,425 | | | | 15.9 | | | | (4,171 | ) | | | (25.4 | ) |
Operating and administrative expenses(1),(2) | | | 25,870 | | | | 39.5 | | | | 34,219 | | | | 33.1 | | | | (8,349 | ) | | | (24.4 | ) |
Operating (loss) profit | | $ | (13,616 | ) | | | (20.8 | ) | | $ | (17,794 | ) | | | (17.2 | ) | | $ | 4,178 | | | | (23.5 | ) |
| (1) | The year ended December 31, 2010 includes an $8.3 million impairment charge related to a goodwill write-down. |
| (2) | The year ended December 31, 2009 includes a $12.3 million charge associated with the fine imposed by the OFT. |
29
Anders’ staffing services revenue for 2010 decreased significantly as compared to 2009 primarily due to depressed market conditions in the UK construction industry and deterioration in the Company’s transportation business. The increase in professional services revenue was primarily due to growth in permanent placement services for the Australian natural resources market.
Anders’ gross profit decreased during 2010 as compared to 2009 primarily due to the decline in staffing services revenue. Gross profit margin increased during 2010 as compared to 2009 due to a change in mix as higher-margin professional services revenue was a larger portion of total revenue than in the prior year and because lower-margin rail contracts were a smaller portion of total revenue than in the prior year.
Anders’ operating and administrative expenses decreased during 2010 as compared to 2009, primarily due to the absence of a $12.3 million charge associated with the fine imposed by the OFT in 2009. Additionally, operating and administrative expenses decreased due to declines in salaries and variable compensation related to decreased headcount, as well as lower real estate costs associated with office downsizing. These decreases were partially offset by the $8.3 million impairment charge related to a goodwill write-down.
Anders’ operating loss decreased during 2010 as compared to 2009 due to the decrease in operating and administrative expenses exceeding the smaller reduction in gross profit. Operating and administrative expenses in 2010 included the $8.3 million impairment charge related to a goodwill write-down and 2009 included a $12.3 million charge associated with the fine imposed by the OFT in 2009.
Liquidity and Capital Resources
The Company’s principal sources of liquidity are cash flows from operations, borrowings under our credit facilities and access to credit markets. The Company’s principal uses of cash are operating expenses, capital expenditures, working capital requirements, dividends, and debt service. Management expects that the Company’s current cash balances, cash generated from operations and unused borrowing capacity will be sufficient to support the Company’s planned operating and capital requirements for the foreseeable future and at least the next twelve months.
In the fourth quarter of 2011, the Company amended its credit agreement to increase its borrowing capacity to $50.0 million from $35.0 million and extend the term to November 30, 2012 (see Note 6–Short-term Debt, in the notes to the consolidated financial statements included in Item 8 of this Form 10-K Report). The amended credit agreement contains customary affirmative covenants. In addition, the amended credit agreement contains certain negative covenants, including requirements to maintain a minimum liquidity balance (unrestricted cash and cash equivalents plus the amount of the unused credit line) of $20.0 million at the end of each fiscal quarter and $25.0 million before CDI Corp. can pay a dividend. The Company was in compliance with all covenants under the amended credit agreement as of December 31, 2011.
At December 31, 2011, the Company had cash and cash equivalents of $26.6 million. At December 31, 2011, there were no outstanding borrowings, $4.3 million of letters of credit outstanding and $45.7 million available to borrow under the amended credit agreement.
The Company’s primary source of cash is cash generated from operations. The Company provides services to clients, which it typically bills on a weekly, bi-weekly or monthly basis. The Company has general payment terms with clients that can range from advance payments to more than 60 days. Expansions and contractions of the Company’s business operations as well as varying efforts to collect amounts due can result in a significant impact on accounts receivable and available cash. Expansions of the Company’s business operations generally result in an initial decrease of cash due to increased payroll costs and an initial increase in outstanding accounts receivable associated with higher business volumes. Contractions of the Company’s business operations generally result in an initial increase of cash due to the continued collections of outstanding accounts receivable and decreased payroll costs associated with lower business volumes. The Company’s accounts receivable balances were $222.9 million and $223.0 million at December 31, 2011 and 2010, respectively.
Payroll is the Company’s largest expense, with the majority of billable employees paid weekly or bi-weekly. As a result of the timing differences between the revenue collection cycle and the payroll cycle, the Company typically needs to fund its operations.
Capital expenditures are primarily for the replacement of aging fixed assets and upgrades of systems for efficiencies and for expenditures associated with business expansion and growth.
The Company expects to generate positive cash flow over the business cycle. However, changes in the level of business activity, and to a lesser extent, seasonality, do impact working capital needs and cash flow. In addition, the uncertain global economy could cause delays in customer payments which could lead to slower collections that may cause a temporary decline in operating cash flow.
As of December 31, 2011, approximately 66% of the Company’s cash and cash equivalents were held by certain non-U.S. subsidiaries, principally a Canadian entity, as well as being denominated in foreign currencies, principally Canadian dollars. The repatriation of cash and cash equivalent balances from non-U.S. subsidiaries could have adverse tax consequences; however, such cash and cash equivalent balances are generally available, without legal restrictions, to fund ordinary business operations at the local level. Deferred income taxes have not
30
been provided on the unremitted earnings of such non-U.S. subsidiaries because it is management’s intention to reinvest such earnings in non-U.S. subsidiaries for the foreseeable future.
In December 2011, the Company announced a long-term strategic growth initiative (see Note 5–Restructuring and Other Related Costs, in the notes to the consolidated financial statements included in Item 8 of this Form 10-K Report). As part of this initiative, the Company approved the Restructuring Plan which was designed to reduce costs and improve efficiencies.
Implementation of the Restructuring Plan actions started in December 2011 and is expected to be completed in 2012 with certain cash payments expected through the first half of 2013.
The following table summarizes the net cash flows, by category, from the Company’s consolidated statements of cash flows:
| | | | | | | | | | | | |
| (in thousands) | | 2011 | | | 2010 | | | 2009 | |
Operating Activities | | $ | 28,002 | | | $ | (4,339 | ) | | $ | 22,818 | |
Investing Activities | | | (5,860 | ) | | | (44,800 | ) | | | (5,870 | ) |
Financing Activities | | | (24,014 | ) | | | 3,772 | | | | (8,956 | ) |
Operating Activities
During 2011, net cash provided by operating activities was $28.0 million, an increase of $32.3 million to as compared to 2010. Operating cash flow increased primarily due to an increase in net income of $25.8 million and lower working capital requirements, partially offset by a net change in non-cash items of $20.3 million. The lower working capital requirements resulted from the change in the Company’s accounts receivable balances during 2011 as compared to 2010. The change in non-cash items primarily relate to the $9.7 million gain for the non-cash reduction of legal reserves in 2011 and the $8.3 million goodwill impairment charge in 2010.
During 2010, net cash used in operating activities was $4.3 million. The negative cash flow reflects a net loss of $10.8 million and higher working capital requirements, primarily due to increased growth in select large national accounts whose contract provisions include longer payment terms. Operating cash flow in 2010 was lower than in 2009 by $27.2 million, primarily due to higher working capital requirements in 2010, reflecting increases in accounts receivable and a smaller increase in accrued expenses and other current liabilities, partially offset by increases in accounts payable and a $9.1 million lower net loss.
During 2009, net cash provided by operating activities was $22.8 million, despite a net loss of $19.9 million. The positive cash flow reflects lower working capital requirements, primarily due to decreases in accounts receivable, reflecting lower business volumes, partially offset by growth in select large national accounts whose contract provisions include longer payment terms. The positive cash flow also includes increases in accrued expenses and other current liabilities, primarily reflecting the impact of the establishment of reserves for the OFT fine of $12.3 million and the DOJ matter of $4.3 million, which had not been paid as of December 31, 2009.
Investing Activities
During 2011, net cash used in investing activities was $5.9 million, a decrease of $38.9 million as compared to 2010. This decrease primarily relates to the $38.8 million of net cash used for acquisitions in 2010. On June 28, 2010, the Company purchased the L.R. Kimball business for $34.1 million in cash and on December 20, 2010, the Company acquired the DSPCon business for $4.7 million in cash. Investing activities in 2011 consisted primarily of purchases of fixed assets.
During 2010, net cash used in investing activities was $44.8 million, an increase of $38.9 million as compared to 2009, primarily due to the $34.1 million and $4.7 million purchases of the L.R. Kimball and DSPCon businesses, respectively, as noted above. Other investing activities consisted primarily of purchases of fixed assets. During 2010, capital expenditures totaled $5.9 million, as compared to $6.0 million in 2009. The slight decrease in capital spending was primarily due to the absence of computer software and hardware investments for an ITS project outsourcing client contract in 2009, partially offset by increased internal software projects in the corporate and MRI reporting units. Capital spending in 2010 also related to computer hardware and software purchases in the Aerospace vertical of ES and the Company’s shared services center. In 2010, the Company also reacquired for $0.4 million certain franchise rights in its MRI reporting segment.
Financing Activities
During 2011, net cash used in financing activities was $24.0 million, an increase of $27.8 million as compared to 2010. The increase in cash used in financing activities was primarily the result of the 2011 repayment of $13.9 million under the Company’s credit agreement that was drawn in 2010. The repayment was a result of the Company’s improved cash flows from operations.
During 2010, net cash provided by financing activities was $3.8 million, an increase of $12.7 million as compared to 2009. The increase in cash provided by financing activities was primarily due to borrowings of $13.9 million under the Company’s former credit agreement. The Company paid shareholders dividends totaling $9.9 million in both 2010 and 2009. The declaration and payment of future dividends will be at the discretion of the Company’s Board of Directors and will depend upon many factors including the Company’s earnings, financial condition and capital requirements.
31
Contractual Obligations and Commitments
The following table summarizes the Company’s outstanding contractual obligations and commitments as of December 31, 2011 (in thousands):
| | | | | | | | | | | | | | | | | | | | |
| | | Total | | | Less than 1
Year | | | 1-3 Years | | | 4-5
Years | | | More
than 5
Years | |
Operating lease commitments(1) | | $ | 32,562 | | | $ | 10,580 | | | $ | 14,126 | | | $ | 6,270 | | | $ | 1,586 | |
Letters of credit(2) | | | 4,251 | | | | 4,251 | | | | - | | | | - | | | | - | |
Purchase obligations(3) | | | 6,015 | | | | 2,564 | | | | 2,721 | | | | 730 | | | | - | |
Other(4) | | | 6,203 | | | | 5,593 | | | | 610 | | | | | | | | | |
Total | | $ | 49,031 | | | $ | 22,988 | | | $ | 17,457 | | | $ | 7,000 | | | $ | 1,586 | |
| (1) | Represents future minimum rental commitments under non-cancelable leases. The Company expects to fund these commitments with existing cash, cash flows from operations and its borrowing capacity under its credit agreement. (See Note 10—Commitments and Contingencies, in the notes to the consolidated financial statements included in Item 8 of this Form 10-K Report.) |
| (2) | Represents primarily letters of credit issued through a domestic bank as required by certain insurance carriers, primarily in connection with the Company’s workers’ compensation plan. |
| (3) | Purchase obligations consist primarily of normal and customary technology maintenance and on-line job posting and search services contracts. The Company expects to fund these commitments with existing cash, cash flows from operations and its borrowing capacity. (See Note 10—Commitments and Contingencies, in the notes to the consolidated financial statements included in Item 8 of this Form 10-K Report). |
| (4) | Represents amounts expected to be paid pursuant to the Restructuring Plan (See Note 5—Restructuring and Other Related Costs, in the notes to the consolidated financial statements included in Item 8 of this Form 10-K Report). |
Off-Balance Sheet Arrangements
The Company does not have any significant off-balance sheet arrangements other than those disclosed in Note 10–Commitments and Contingencies, in the notes to the consolidated financial statements included in Item 8 of this Form 10-K Report that are reasonably likely to have a material effect on the Company’s consolidated financial condition, results of operations or cash flows.
Critical Accounting Policies and Estimates
The consolidated financial statements contained in this Form 10-K Report were prepared in accordance with accounting principles generally accepted in the United States of America, which require management to make estimates and assumptions that affect the reported amounts of assets, liabilities, revenues, and expenses, and the disclosure of contingencies. Certain accounting policies, methods and estimates are particularly sensitive because of their significance to the consolidated financial statements and because of the possibility that future events affecting them may differ from current judgments. While there are a number of accounting policies, methods and estimates that affect the consolidated financial statements as described in Note 1—Significant Accounting Policies, in the notes to the consolidated financial statements included in Item 8 of this Form 10-K Report, areas that are particularly significant are discussed below.
Revenue Recognition
Revenues in the consolidated statements of operations are presented net of any revenue-based taxes, such as sales, use, excise and value added taxes. The Company derives its revenue from several sources. All of the Company’s segments perform staffing services. The Company’s CDI Engineering Solutions (“ES”) and CDI Information Technology Solutions (“ITS”) segments also perform project outsourcing services, which include some fixed-price contracts and permanent placement services. The Company’s CDI AndersElite (“Anders”) segment also derives revenue from permanent placement services. The Company’s Management Recruiters International (“MRI”) segment derives a portion of its revenue from ongoing franchise royalties and, to a lesser extent, franchise fees.
Staffing Services – The Company recognizes revenue from staffing services based on the gross amount billed. The Company typically bills its clients once services are performed and associated costs have been incurred. In these circumstances, the Company assumes the risk of acceptability of its employees to its clients. The Company will also at times use unaffiliated companies (“supplier associates”) and their employees to fulfill a client’s staffing requirements either in whole or in part. Under these arrangements, these firms serve as subcontractors. Clients typically require a single consolidated bill that reflects services performed by both the Company’s employees and the employees of any applicable supplier associates.
When utilizing supplier associates, the Company records the difference between its gross billings and the amount paid to the supplier associate as revenue, which is generally referred to as an administrative fee. Administrative and clerical costs related to time accumulation, invoicing and other activities are recorded and included in operating and administrative expenses as incurred.
32
Project Outsourcing Services – The Company recognizes revenue from project outsourcing services as the services are performed. Revenue for these services is generally based on mark-ups of its employees’ rates of pay utilizing an hourly multiplier or on a cost plus fixed fee basis.
The Company derives less than 5% of its revenue from fixed-price contracts. Fixed-price engineering contracts typically include development of conceptual and detailed designs in support of a client’s construction of tangible property. Revenue is recorded using the percentage-of-completion method, relying on direct labor cost as the primary input measure. In addition, these contracts are evaluated periodically to identify and record potential losses.
ITS outsourcing service contracts generally include the performance of certain computer or network operations or help-desk support on behalf of clients. Service contracts typically contain an invoicing schedule covering the contractual period. Accordingly, the Company recognizes revenue on a pro-rata basis using elapsed time as the measure of performance under these contracts. The Company charges the related costs to earnings as they are incurred. As with fixed-price engineering contracts, the Company periodically evaluates the need to provide for any losses on such contracts.
Permanent Placement – Services include the search for and recruitment of candidates for employment with the Company’s clients. Generally, the Company performs permanent placement services on a non-exclusive, contingency basis. Revenue is recognized only after successfully placing a recommended candidate.
Ongoing Franchise Royalties – MRI’s rights to franchise royalties are governed by the provisions of its franchise contracts. Under the franchise contracts, the franchisees remit to the Company a contractual percentage of fees collected from their clients. The Company records franchise royalty revenue as fees are collected by the franchisee and as they become a receivable from the franchisee.
Franchise Fees – The Company recognizes fees related to sales of new MRI franchises and master franchise agreements when the Company has substantially fulfilled its requirements under the respective franchise agreement. Additionally, the Company recognizes a support service fee, which is paid and recognized monthly for the first 24 months of operation.
Income Taxes
The Company makes judgments and interpretations based on enacted tax laws, published tax guidance, as well as estimates of future earnings. These judgments and interpretations affect the provision for income taxes, deferred tax assets and liabilities and the valuation allowance. As of December 31, 2011, the Company had total net deferred tax assets of $15.2 million. This includes $5.6 million (net of valuation allowance) which relates primarily to state net operating loss carry forwards and foreign tax credit carry forwards. A determination on the basis of objective factors was made that it is more likely than not that the net deferred tax assets will be realized through future years’ income. In the event that actual results differ from these estimates and assessments, the valuation allowances may be adjusted. In 2011, the Company added $0.6 million to the valuation allowance that was set up against the Company’s net foreign deferred tax assets. In 2010, the Company added $3.4 million to the valuation allowance for foreign deferred tax assets.
Allowance for Doubtful Accounts
The Company’s principal asset is its accounts receivable. Substantially all of the Company’s clients are provided trade credit. The Company’s clients are primarily large and mid-sized organizations. The Company performs ongoing credit evaluations of its clients and maintains allowances for potential credit losses. The Company considers a number of factors in determining the allowance for doubtful accounts, including an assessment of client-specific information, the Company’s historical experience, the age of the receivable and current market and economic conditions. Unanticipated changes in the financial condition of clients, the resolution of various disputes, or significant changes in the economy could impact the reserves required. At December 31, 2011 and 2010, the allowance for doubtful accounts was $3.7 million and $5.3 million, respectively.
Goodwill and Other Intangible Assets
The Company performs its annual goodwill and other indefinite-lived intangible assets impairment testing by reporting unit as of July 1 of each fiscal year, or whenever events occur or circumstances indicate that it is more likely than not that the fair value of a reporting unit is below its carrying value.
The first step of the impairment test requires that the Company determine the fair value of each reporting unit and then compare that fair value to the reporting unit’s carrying amount. The Company uses the income approach to determine the fair value of its reporting units. The income approach is based on the present value of estimated discounted cash flows and terminal value projected for each reporting unit. The income approach requires significant judgments, including the projected results of operations, the weighted-average cost of capital (“WACC”) used to discount the cash flows and terminal value assumptions. The projected results of operations are based on the Company’s best estimates of future economic and market conditions, including growth rates, estimated earnings and cash expenditures. The WACC is determined based on the Company’s capital structure, cost of capital, inherent business risk profile and long-term growth expectations, as reflected in the
33
terminal value. The Company uses a market approach based on peer group market multiples to validate the reasonableness of the fair values determined under the income approach.
The Company then validates the reasonableness of the total fair value of the reporting units under the income approach by reconciling the aggregate fair values of the reporting units to the Company’s total market capitalization, adjusted to include an estimated control premium. The estimated control premium is derived from observable transactions involving the purchase of controlling interests in comparable companies. The market capitalization of the Company is based on the average stock price over a range of dates prior to the assessment date.
The second step of the impairment test is performed if the first step indicates that impairment exists. The second step of the impairment assessment involves allocating the reporting unit’s fair value to all of its recognized and unrecognized assets and liabilities in order to determine the implied fair value of the reporting unit’s goodwill and intangible assets as of the assessment date. The implied fair value of the reporting unit’s goodwill and other intangible assets is then compared to the carrying amount of goodwill and other intangible assets to quantify an impairment charge as of the assessment date.
On July 1, 2011, the Company performed its annual impairment test. Based on the results of the impairment test, the Company determined that there was no impairment of goodwill or other indefinite-lived intangible assets. The Company’s reporting units had fair values in excess of their carrying value. (See Note 4–Goodwill and Other Intangible Assets, in the notes to the consolidated financial statements included in Item 8 of this Form 10-K Report for further information.) There were no triggering events subsequent to July 1, 2011 that required additional testing for any reporting units.
Changes in future market conditions, the Company’s business strategy, or other factors could impact the future values of the Company’s reporting units, which could result in future impairment charges. The future occurrence of a potential triggering event, such as a decrease in expected earnings, adverse market conditions, a decline in current market multiples, further decline in the Company’s stock price, a significant adverse change in legal factors or business climate, an adverse action or assessment by a regulator, unanticipated competition, strategic decisions made in response to economic or competitive conditions, or a more-likely-than-not expectation that a reporting unit or a significant portion of a reporting unit will be sold or disposed of, could require additional interim impairment testing prior to the next annual impairment test. In the event of significant adverse changes such as those described above, the Company may need to recognize a non-cash impairment of goodwill, which could have a material adverse effect on the Company’s Consolidated Statements of Operations. At December 31, 2011, total goodwill amounted to $61.5 million.
Other intangible assets arising from acquisitions that are determined to have a definite useful life are generally amortized on a straight-line basis over the estimated useful life of the asset. Other intangible assets determined to have an indefinite useful life are tested for impairment as part of the Company’s annual impairment assessment. When significant intangible assets are acquired, an independent third-party valuation firm is engaged to assist in determining the fair value of the assets as of the acquisition date. At December 31, 2011, other intangible assets amounted to $18.0 million, net of accumulated amortization.
Contingencies
The Company is subject to various legal proceedings and claims that have arisen in the ordinary course of business. The Company records a liability when it is both probable that a liability has been incurred and the amount of the loss can be reasonably estimated. Disclosure of a contingency is required if there is at least a reasonable possibility that a loss has been incurred. In determining whether a loss should be accrued, the Company evaluates, among other factors, the degree of probability of an unfavorable outcome and the ability to make a reasonable estimate of the amount of the loss. Changes in these factors could materially impact the Company’s consolidated financial condition, results of operations or cash flows.
Recent Accounting Pronouncements
Effective January 1, 2012, the Company is required to adopt the provisions of Accounting Standards Update (“ASU”) No. 2011-08,Testing Goodwill for Impairment (Topic 350) (“ASU 2011-08”), which permits an entity to first assess qualitative factors to determine whether it is more likely than not that the fair value of a reporting unit is less than its carrying amount as a basis for determining whether it is necessary to perform the two-step goodwill impairment test described in Topic 350. The adoption of ASU 2011-08 will not have an impact on the Company’s consolidated financial position, results of operations or cash flows, as the guidance does not change the impairment calculation.
Effective January 1, 2012, the Company is required to adopt the provisions of ASU No. 2011-05,Comprehensive Income (Topic 220):Presentation of Comprehensive Income (“ASU 2011-05”), which requires that all non-owner changes in shareholders’ equity be presented either in a single continuous statement of comprehensive income or in two separate but consecutive statements. In the two-statement approach, the first statement would present total net income and its components followed consecutively by a second statement that would present total other comprehensive income, the components of other comprehensive income, and the total of comprehensive income. The effective date of certain provisions of this standard pertaining to the reclassification of items out of accumulated other comprehensive income has been deferred and is pending the
34
issuance of further guidance on that matter. The adoption of ASU 2011-05 will not have an impact on the Company’s consolidated financial position, results of operations or cash flows, as the guidance only changes the presentation of financial information.
| | |
| Item 7A. | | Quantitative and Qualitative Disclosures About Market Risk |
The Company is exposed to risks associated with foreign currency fluctuations and changes in interest rates.
Foreign Currency Risk
The Company’s exposure to foreign currency fluctuations relates primarily to its operations denominated in British pounds sterling and Canadian dollars. Exchange rate fluctuations impact the U.S. dollar value of reported earnings derived from these foreign operations as well as the Company’s investment in the net assets related to these operations.
Interest Rate Risk
The interest rate risk associated with the Company’s borrowing activities as of December 31, 2011 is not material in relation to its consolidated financial position, results of operations or cash flows. While it may do so in the future, the Company has not used derivative financial instruments to alter the interest rate characteristics of its debt instruments. At December 31, 2011, the Company did not have any borrowings under its committed, secured $50.0 million revolving line of credit facility. The Company’s cash balances are primarily invested in money market funds at variable rates and fixed term deposits. Due to the Company’s cash balance, interest rate fluctuations will affect the Company’s return on its investments.
35
| | |
| Item 8. | | Financial Statements and Supplementary Data |
Report of Independent Registered Public Accounting Firm
The Board of Directors and Shareholders
CDI Corp.:
We have audited the accompanying consolidated balance sheets of CDI Corp. and subsidiaries as of December 31, 2011 and 2010, and the related consolidated statements of operations, equity and comprehensive income (loss), and cash flows for each of the years in the three-year period ended December 31, 2011. These consolidated financial statements are the responsibility of the Company’s management. Our responsibility is to express an opinion on these consolidated financial statements based on our audits.
We conducted our audits in accordance with the standards of the Public Company Accounting Oversight Board (United States). Those standards require that we plan and perform the audit to obtain reasonable assurance about whether the financial statements are free of material misstatement. An audit includes examining, on a test basis, evidence supporting the amounts and disclosures in the financial statements. An audit also includes assessing the accounting principles used and significant estimates made by management, as well as evaluating the overall financial statement presentation. We believe that our audits provide a reasonable basis for our opinion.
In our opinion, the consolidated financial statements referred to above present fairly, in all material respects, the financial position of CDI Corp. and subsidiaries as of December 31, 2011 and 2010, and the results of their operations and their cash flows for each of the years in the three-year period ended December 31, 2011, in conformity with U.S. generally accepted accounting principles.
We also have audited, in accordance with the standards of the Public Company Accounting Oversight Board (United States), CDI Corp.’s internal control over financial reporting as of December 31, 2011, based on criteria established in Internal Control—Integrated Framework issued by the Committee of Sponsoring Organizations of the Treadway Commission (COSO), and our report dated March 6, 2012 expressed an unqualified opinion on the effectiveness of the Company’s internal control over financial reporting.
| | |
| /s/ KPMG LLP | | |
| |
Philadelphia, Pennsylvania March 6, 2012 | | |
36
CDI CORP. AND SUBSIDIARIES
Consolidated Statements of Operations
| | | | | | | | | | | | |
| | | Years ended December 31, | |
| (in thousands, except per share amounts) | | 2011 | | | 2010 | | | 2009 | |
Revenue | | $ | 1,059,803 | | | $ | 926,289 | | | $ | 884,950 | |
Cost of services | | | 834,502 | | | | 732,326 | | | | 708,386 | |
Gross profit | | | 225,301 | | | | 193,963 | | | | 176,564 | |
Operating and administrative expenses | | | 196,826 | | | | 185,958 | | | | 194,699 | |
Restructuring and other related costs | | | 8,100 | | | | - | | | | - | |
Goodwill impairment | | | - | | | | 8,312 | | | | - | |
Operating profit (loss) | | | 20,375 | | | | (307 | ) | | | (18,135 | ) |
Other income (expense), net | | | (245 | ) | | | (540 | ) | | | 81 | |
Equity in losses of affiliated companies | | | - | | | | (2,299 | ) | | | (1,357 | ) |
Income (loss) before income taxes | | | 20,130 | | | | (3,146 | ) | | | (19,411 | ) |
Income tax expense | | | 5,130 | | | | 7,668 | | | | 508 | |
Net income (loss) | | | 15,000 | | | | (10,814 | ) | | | (19,919 | ) |
Less: Income (loss) attributable to noncontrolling interest | | | 167 | | | | 44 | | | | (17 | ) |
Net income (loss) attributable to CDI | | $ | 14,833 | | | $ | (10,858 | ) | | $ | (19,902 | ) |
| | | |
Earnings (loss) per common share: | | | | | | | | | | | | |
Basic | | $ | 0.77 | | | $ | (0.57 | ) | | $ | (1.05 | ) |
Diluted | | $ | 0.77 | | | $ | (0.57 | ) | | $ | (1.05 | ) |
See accompanying notes to consolidated financial statements.
37
CDI CORP. AND SUBSIDIARIES
Consolidated Balance Sheets
| | | | | | | | |
| | | December 31, | |
| (in thousands, except per share amounts) | | 2011 | | | 2010 | |
Assets | | | | | | | | |
Current assets: | | | | | | | | |
Cash and cash equivalents | | $ | 26,644 | | | $ | 28,746 | |
Accounts receivable, net of allowances of $3,698 and $5,339 | | | 222,889 | | | | 222,999 | |
Prepaid expenses and other current assets | | | 10,322 | | | | 8,773 | |
Prepaid income taxes | | | 2,182 | | | | 2,407 | |
Deferred income taxes | | | 9,693 | | | | 7,086 | |
Total current assets | | | 271,730 | | | | 270,011 | |
Property and equipment, net of accumulated depreciation of $75,914 and $74,423 | | | 25,295 | | | | 31,019 | |
Deferred income taxes | | | 5,522 | | | | 8,531 | |
Goodwill | | | 61,527 | | | | 61,054 | |
Other intangible assets, net | | | 18,023 | | | | 19,020 | |
Other non-current assets | | | 8,599 | | | | 8,876 | |
Total assets | | $ | 390,696 | | | $ | 398,511 | |
Liabilities and Equity | | | | | | | | |
Current liabilities: | | | | | | | | |
Cash overdraft | | $ | 3,363 | | | $ | 2,970 | |
Short-term debt | | | - | | | | 13,900 | |
Accounts payable | | | 36,170 | | | | 32,910 | |
Accrued compensation and related expenses | | | 41,943 | | | | 37,493 | |
Other accrued expenses and other current liabilities | | | 19,236 | | | | 28,110 | |
Accrued client rebates | | | 6,042 | | | | 6,923 | |
Income taxes payable | | | 3,207 | | | | 1,782 | |
Total current liabilities | | | 109,961 | | | | 124,088 | |
Deferred compensation | | | 9,324 | | | | 10,239 | |
Other non-current liabilities | | | 4,380 | | | | 5,257 | |
Total liabilities | | | 123,665 | | | | 139,584 | |
Commitments and contingencies | | | | | | | | |
Equity: | | | | | | | | |
Preferred stock, $0.10 par value - authorized 1,000 shares; none issued | | | - | | | | - | |
Common stock, $0.10 par value - authorized 100,000 shares; issued 21,642 and 21,531 shares | | | 2,164 | | | | 2,153 | |
Class B common stock, $0.10 par value - authorized 3,175 shares; none issued | | | - | | | | - | |
Additional paid-in-capital | | | 63,860 | | | | 60,338 | |
Retained earnings | | | 253,344 | | | | 248,467 | |
Accumulated other comprehensive income (loss) | | | (306 | ) | | | 111 | |
Common stock in treasury, at cost - 2,463 shares | | | (52,487 | ) | | | (52,487 | ) |
Total CDI shareholders’ equity | | | 266,575 | | | | 258,582 | |
Noncontrolling interest | | | 456 | | | | 345 | |
Total equity | | | 267,031 | | | | 258,927 | |
Total liabilities and equity | | $ | 390,696 | | | $ | 398,511 | |
See accompanying notes to consolidated financial statements.
38
CDI CORP. AND SUBSIDIARIES
Consolidated Statements of Equity and Comprehensive Income (Loss)
| | | | | | | | | | | | | | | | | | | | | | | | | | | | | | | | | | | | |
| (in thousands, except per share | | Common Stock | | | Treasury | | | Additional
Paid-In- | | | Retained | | | Accumulated
Other
Comprehensive | | | Total
CDI
Shareholders’ | | | Non-
Controlling | | | Total | |
| amounts) | | Shares | | | Amount | | | Stock | | | Capital | | | Earnings | | | Income (Loss) | | | Equity | | | Interest | | | Equity | |
Balance at December 31, 2008 | | | 21,361 | | | $ | 2,136 | | | $ | (52,366 | ) | | $ | 54,377 | | | $ | 298,981 | | | $ | (11,743 | ) | | $ | 291,385 | | | $ | - | | | $ | 291,385 | |
Net loss | | | | | | | | | | | | | | | | | | | (19,902 | ) | | | - | | | | (19,902 | ) | | | (17 | ) | | | (19,919 | ) |
Other comprehensive income (loss): | | | | | | | | | | | | | | | | | | | | | | | | | | | | | | | | | | | | |
Translation adjustments | | | - | | | | - | | | | - | | | | - | | | | - | | | | 9,919 | | | | 9,919 | | | | 6 | | | | 9,925 | |
Total comprehensive income (loss) | | | | | | | | | | | | | | | | | | | | | | | | | | | (9,983 | ) | | | (11 | ) | | | (9,994 | ) |
Stock-based compensation | | | - | | | | - | | | | - | | | | 3,050 | | | | - | | | | - | | | | 3,050 | | | | - | | | | 3,050 | |
Reclassification of equity awards from liabilities, net | | | - | | | | - | | | | - | | | | 720 | | | | - | | | | - | | | | 720 | | | | - | | | | 720 | |
Vesting of equity awards | | | 89 | | | | 9 | | | | - | | | | (9 | ) | | | - | | | | - | | | | - | | | | - | | | | - | |
Common shares withheld for taxes | | | (21 | ) | | | (2 | ) | | | - | | | | (164 | ) | | | - | | | | - | | | | (166 | ) | | | - | | | | (166 | ) |
Cash dividends declared ($0.52 per common share) | | | - | | | | - | | | | - | | | | - | | | | (9,854 | ) | | | - | | | | (9,854 | ) | | | - | | | | (9,854 | ) |
Tax shortfall from stock plans | | | - | | | | - | | | | - | | | | (397 | ) | | | - | | | | - | | | | (397 | ) | | | - | | | | (397 | ) |
Other | | | - | | | | - | | | | - | | | | - | | | | - | | | | - | | | | - | | | | 152 | | | | 152 | |
Balance at December 31, 2009 | | | 21,429 | | | | 2,143 | | | | (52,366 | ) | | | 57,577 | | | | 269,225 | | | | (1,824 | ) | | | 274,755 | | | | 141 | | | | 274,896 | |
Net loss | | | | | | | | | | | | | | | | | | | (10,858 | ) | | | - | | | | (10,858 | ) | | | 44 | | | | (10,814 | ) |
Other comprehensive income (loss): | | | | | | | | | | | | | | | | | | | | | | | | | | | | | | | | | | | | |
Translation adjustments | | | - | | | | - | | | | - | | | | - | | | | - | | | | 1,935 | | | | 1,935 | | | | 20 | | | | 1,955 | |
Total comprehensive income (loss) | | | | | | | | | | | | | | | | | | | | | | | | | | | (8,923 | ) | | | 64 | | | | (8,859 | ) |
Stock-based compensation | | | - | | | | - | | | | - | | | | 2,979 | | | | - | | | | - | | | | 2,979 | | | | - | | | | 2,979 | |
Reclassification of equity awards from liabilities, net | | | - | | | | - | | | | - | | | | 165 | | | | - | | | | - | | | | 165 | | | | - | | | | 165 | |
Proceeds from exercise of stock options | | | 13 | | | | 1 | | | | - | | | | 65 | | | | - | | | | - | | | | 66 | | | | - | | | | 66 | |
Vesting of equity awards | | | 124 | | | | 12 | | | | - | | | | (12 | ) | | | - | | | | - | | | | 0 | | | | - | | | | 0 | |
Common shares withheld for taxes | | | (35 | ) | | | (3 | ) | | | - | | | | (557 | ) | | | - | | | | - | | | | (560 | ) | | | - | | | | (560 | ) |
Shares acquired in connection with stock option exercises | | | - | | | | - | | | | (121 | ) | | | 121 | | | | - | | | | - | | | | - | | | | - | | | | - | |
Cash dividends declared ($0.52 per common share) | | | - | | | | - | | | | - | | | | - | | | | (9,900 | ) | | | - | | | | (9,900 | ) | | | - | | | | (9,900 | ) |
Other | | | - | | | | - | | | | - | | | | - | | | | - | | | | - | | | | - | | | | 140 | | | | 140 | |
Balance at December 31, 2010 | | | 21,531 | | | | 2,153 | | | | (52,487 | ) | | | 60,338 | | | | 248,467 | | | | 111 | | | | 258,582 | | | | 345 | | | | 258,927 | |
Net income | | | | | | | | | | | | | | | | | | | 14,833 | | | | - | | | | 14,833 | | | | 167 | | | | 15,000 | |
Other comprehensive income (loss): | | | | | | | | | | | | | | | | | | | | | | | | | | | | | | | | | | | | |
Translation adjustments | | | - | | | | - | | | | - | | | | - | | | | - | | | | (417 | ) | | | (417 | ) | | | (56 | ) | | | (473 | ) |
Total comprehensive income | | | | | | | | | | | | | | | | | | | | | | | | | | | 14,416 | | | | 111 | | | | 14,527 | |
Stock-based compensation | | | - | | | | - | | | | - | | | | 3,358 | | | | - | | | | - | | | | 3,358 | | | | - | | | | 3,358 | |
Reclassification of equity awards from liabilities, net | | | - | | | | - | | | | - | | | | 726 | | | | - | | | | - | | | | 726 | | | | - | | | | 726 | |
Vesting of equity awards | | | 149 | | | | 15 | | | | - | | | | (15 | ) | | | - | | | | - | | | | - | | | | - | | | | - | |
Common shares withheld for taxes | | | (38 | ) | | | (4 | ) | | | - | | | | (547 | ) | | | - | | | | - | | | | (551 | ) | | | - | | | | (551 | ) |
Cash dividends declared ($0.52 per common share) | | | - | | | | - | | | | - | | | | - | | | | (9,956 | ) | | | - | | | | (9,956 | ) | | | - | | | | (9,956 | ) |
Balance at December 31, 2011 | | | 21,642 | | | $ | 2,164 | | | $ | (52,487 | ) | | $ | 63,860 | | | $ | 253,344 | | | $ | (306 | ) | | $ | 266,575 | | | $ | 456 | | | $ | 267,031 | |
See accompanying notes to consolidated financial statements.
39
CDI CORP. AND SUBSIDIARIES
Consolidated Statements of Cash Flows
| | | | | | | | | | | | |
| | | Years ended December 31, | |
| (in thousands) | | 2011 | | | 2010 | | | 2009 | |
Operating activities: | | | | | | | | | | | | |
Net income (loss) | | $ | 15,000 | | | $ | (10,814 | ) | | $ | (19,919 | ) |
Adjustments to reconcile net income (loss) to cash provided by (used in) operating activities: | | | | | | | | | | | | |
Depreciation | | | 9,640 | | | | 9,971 | | | | 10,667 | |
Amortization | | | 1,368 | | | | 686 | | | | 540 | |
Goodwill impairment | | | - | | | | 8,312 | | | | - | |
Deferred income tax expense (benefit) | | | 433 | | | | 2,343 | | | | (2,757 | ) |
Equity in losses of affiliated companies | | | - | | | | 2,299 | | | | 1,357 | |
Stock-based compensation | | | 3,358 | | | | 2,979 | | | | 3,050 | |
Non-cash reduction of legal reserves | | | (9,698 | ) | | | - | | | | - | |
Loss on disposal of assets | | | 1,170 | | | | - | | | | - | |
Changes in operating assets and liabilities, net of effects from acquisitions: | | | | | | | | | | | | |
Accounts receivable, net | | | (103 | ) | | | (27,347 | ) | | | 19,550 | |
Prepaid expenses and other current assets | | | (1,560 | ) | | | (582 | ) | | | 1,251 | |
Accounts payable | | | 3,019 | | | | 4,242 | | | | (2,954 | ) |
Accrued expenses and other current liabilities | | | 4,543 | | | | 2,698 | | | | 8,718 | |
Income taxes receivable/payable | | | 1,638 | | | | 2,042 | | | | 1,736 | |
Other non-current assets | | | 261 | | | | (933 | ) | | | (393 | ) |
Deferred compensation | | | (189 | ) | | | 153 | | | | 1,108 | |
Other non-current liabilities | | | (878 | ) | | | (388 | ) | | | 864 | |
Net cash provided by (used in) operating activities | | | 28,002 | | | | (4,339 | ) | | | 22,818 | |
Investing activities: | | | | | | | | | | | | |
Additions to property and equipment | | | (5,658 | ) | | | (5,890 | ) | | | (5,986 | ) |
Reacquired franchise rights | | | (372 | ) | | | (386 | ) | | | - | |
Acquisitions, net of cash acquired | | | - | | | | (38,842 | ) | | | - | |
Other | | | 170 | | | | 318 | | | | 116 | |
Net cash used in investing activities | | | (5,860 | ) | | | (44,800 | ) | | | (5,870 | ) |
Financing activities: | | | | | | | | | | | | |
Dividends paid to shareholders | | | (9,956 | ) | | | (9,900 | ) | | | (9,854 | ) |
Short-term debt, net | | | (13,900 | ) | | | 13,900 | | | | - | |
Cash overdraft | | | 393 | | | | 127 | | | | 878 | |
Proceeds from exercises of employee stock options | | | - | | | | 65 | | | | - | |
Tax benefit from equity compensation plans | | | - | | | | - | | | | 20 | |
Common shares withheld for taxes | | | (551 | ) | | | (560 | ) | | | - | |
Contribution to joint venture by non-controlling interest | | | - | | | | 140 | | | | - | |
Net cash (used in) provided by financing activities | | | (24,014 | ) | | | 3,772 | | | | (8,956 | ) |
Effect of exchange rate changes on cash | | | (230 | ) | | | 585 | | | | 3,775 | |
Net (decrease) increase in cash and cash equivalents | | | (2,102 | ) | | | (44,782 | ) | | | 11,767 | |
Cash and cash equivalents at beginning of period | | | 28,746 | | | | 73,528 | | | | 61,761 | |
Cash and cash equivalents at end of period | | $ | 26,644 | | | $ | 28,746 | | | $ | 73,528 | |
| | | |
Supplemental disclosure of cash flow information: | | | | | | | | | | | | |
Cash paid for interest | | $ | 333 | | | $ | 8 | | | $ | - | |
Cash paid (received) for income taxes, net | | $ | 3,213 | | | $ | 4,024 | | | $ | (382 | ) |
See accompanying notes to consolidated financial statements.
40
|
| CDI Corp. and Subsidiaries |
| Notes to Consolidated Financial Statements |
| |
| (In thousands, except per share amounts, unless otherwise indicated) |
Note 1—Significant Accounting Policies
Organization - CDI Corp. and Subsidiaries (the “Company” or “CDI”) provides project outsourcing services for its clients’ engineering, information technology and project management needs, staffing services to augment its clients’ workforces and a range of professional services to meet its clients’ permanent placement needs. The Company derives most of its revenue by providing these services to large and mid-sized companies located primarily in the United States (“U.S.”), United Kingdom (“UK”) and Canada.
On December 8, 2011, the Company announced business model and organizational changes aligned with a strategic plan to make CDI an engineering and technology solutions company with global capabilities in select markets. See Note 5—Restructuring and Other Related Costs, for further information.
Basis of Presentation - The consolidated financial statements of the Company and the accompanying notes are prepared in accordance with U.S. generally accepted accounting principles (“GAAP”).
Principles of Consolidation - The consolidated financial statements include the accounts of CDI Corp. and its wholly-owned subsidiaries after elimination of intercompany balances and transactions. For comparative purposes, certain amounts have been reclassified to conform to the 2011 presentation.
Use of Estimates - The preparation of financial statements in accordance with GAAP requires management to make estimates and assumptions about future events. Those estimates and the related underlying assumptions affect the amounts of assets and liabilities reported, disclosures about contingent assets and liabilities at the date of the financial statements and reported amounts of revenues and expenses during the reporting period. Significant estimates include the valuation of accounts receivable, goodwill, intangible assets, legal contingencies and assumptions used in the calculation of income taxes. Management evaluates its estimates and assumptions on an ongoing basis using historical experience and other factors, including the current economic environment. Actual results may differ from those estimates.
Revenue Recognition - Revenues in the consolidated statements of operations are presented net of any revenue-based taxes, such as sales, use, excise and value added taxes. The Company derives its revenue from several sources. All of the Company’s segments perform staffing services. The Company’s CDI Engineering Solutions (“ES”) and CDI Information Technology Solutions (“ITS”) segments also perform project outsourcing services, which include some fixed-price contracts and permanent placement services. The Company’s CDI AndersElite (“Anders”) segment also derives revenue from permanent placement services. The Company’s Management Recruiters International (“MRI”) segment derives a portion of its revenue from ongoing franchise royalties and, to a lesser extent, franchise fees.
Staffing Services - The Company recognizes revenue from staffing services based on the gross amount billed. The Company typically bills its clients once services are performed and associated costs have been incurred. In these circumstances, the Company assumes the risk of acceptability of its employees to its clients. The Company will also at times use unaffiliated companies (“supplier associates”) and their employees to fulfill a client’s staffing requirements either in whole or in part. Under these arrangements, these firms serve as subcontractors. Clients typically require a single consolidated bill that reflects services performed by both the Company’s employees and the employees of any applicable supplier associates.
When utilizing supplier associates, the Company records the difference between its gross billings and the amount paid to the supplier associate as revenue, which is generally referred to as an administrative fee. Administrative and clerical costs related to time accumulation, invoicing and other activities are recorded and included in operating and administrative expenses as incurred.
Project Outsourcing Services - The Company recognizes revenue from project outsourcing services as the services are performed. Revenue for these services is generally based on mark-ups of its employees’ rates of pay utilizing an hourly multiplier or on a cost plus fixed fee basis.
The Company derives less than 5% of its revenue from fixed-price contracts. Fixed-price engineering contracts typically include development of conceptual and detailed designs in support of a client’s construction of tangible property. Revenue is recorded using the percentage-of-completion method, relying on direct labor cost as the primary input measure. In addition, these contracts are evaluated periodically to identify and record potential losses.
ITS outsourcing service contracts generally include the performance of certain computer or network operations or help-desk support on behalf of clients. Service contracts typically contain an invoicing schedule covering the contractual period. Accordingly, the Company recognizes revenue on a pro-rata basis using elapsed time as the measure of performance under these contracts. The Company charges the related costs to earnings as they are incurred. As with fixed-price engineering contracts, the Company periodically evaluates the need to provide for any losses on such contracts.
Permanent Placement - Services include the search for and recruitment of candidates for employment with the
41
|
| CDI Corp. and Subsidiaries |
| Notes to Consolidated Financial Statements |
| |
| (In thousands, except per share amounts, unless otherwise indicated) |
Company’s clients. Generally, the Company performs permanent placement services on a non-exclusive, contingency basis. Revenue is recognized only after successfully placing a recommended candidate.
Ongoing Franchise Royalties - MRI’s rights to franchise royalties are governed by the provisions of its franchise contracts. Under the franchise contracts, the franchisees remit to the Company a contractual percentage of fees collected from their clients. The Company records franchise royalty revenue as fees are collected by the franchisee and they become a receivable from the franchisee.
Franchise Fees - The Company recognizes fees related to sales of new MRI franchises and master franchise agreements when the Company has substantially fulfilled its requirements under the respective franchise agreement. Additionally, the Company recognizes a support service fee, which is paid and recognized monthly for the first 24 months of operation.
Off-Balance Sheet Risk - The Company is exposed to risks associated with fluctuations in foreign currency exchange rates because the transactions of its foreign operations are primarily denominated in British pounds sterling and Canadian dollars. Exchange rate fluctuations impact the U.S. dollar value of reported earnings derived from these foreign operations as well as the Company’s investment in the net assets related to these foreign operations.
Foreign Currency Translation - Foreign subsidiaries of the Company use local currency as the functional currency. Net assets are translated at year-end rates while revenues and expenses are translated at average exchange rates. Adjustments resulting from these translations are reflected in “Accumulated other comprehensive income (loss)” in shareholders’ equity. Gains and losses arising from foreign currency transactions are reflected in “Other income (expense), net” in the consolidated statements of operations.
Concentrations of Credit Risk - The Company’s principal asset is its accounts receivable. Substantially all of the Company’s clients are provided trade credit. The Company’s clients are primarily large and mid-sized organizations. The Company performs ongoing credit evaluations of its clients and maintains allowances for potential credit losses. The Company considers a number of factors in determining the allowance for doubtful accounts, including an assessment of client-specific information, the Company’s historical experience, the age of the receivable and current market and economic conditions.
The following table summarizes the changes in the allowance for doubtful accounts receivable:
| | | | | | | | | | | | | | | | |
| | | Balance at
beginning of
year | | | Additions
charged to
earnings | | | Uncollectible
receivables
written off,
net of
recoveries | | | Balance at
end of year | |
December 31, 2011 | | $ | 5,339 | | | $ | 428 | | | $ | (2,069 | ) | | $ | 3,698 | |
December 31, 2010 | | | 6,887 | | | | 2,274 | | | | (3,822 | ) | | | 5,339 | |
December 31, 2009 | | | 6,614 | | | | 1,992 | | | | (1,719 | ) | | | 6,887 | |
One client accounted for approximately 26% and 33% of total accounts receivable at December 31, 2011 and 2010, respectively.
The Company’s cash and cash equivalents are held in money market mutual funds and in accounts at major banks and financial institutions located primarily in the U.S., Canada and the UK.
Income Taxes - The Company accounts for income taxes using the asset and liability method. Under this method, income taxes are provided for amounts currently payable and for amounts deferred as tax assets and liabilities based on differences between the financial statement carrying amounts and tax basis of its assets and liabilities. In establishing its deferred income tax assets and liabilities, the Company makes judgments and interpretations based on the enacted tax laws and published tax guidance that are applicable to its operations. The Company records deferred tax assets and liabilities and evaluates the need for valuation allowances to reduce the deferred tax assets to realizable amounts. The likelihood of a material change in the Company’s expected realization of these assets is dependent on future taxable income, its ability to use tax credit carry forwards and carry backs, final tax settlements and the effectiveness of its tax planning strategies in the various tax jurisdictions in which it operates. The Company recognizes the effect of income tax positions only if those positions are more likely than not to be sustained. Recognized income tax positions are measured at the largest amount that is greater than 50% likely to be realized. Changes in recognition or measurement are reflected in the period in which the change in judgment occurs. See Note 9—Income Taxes.
Cash and Cash Equivalents - Cash equivalents include cash in operating accounts, term deposits and investments in money market funds holding highly liquid securities that mature within 90 days from the date of investment.
Fair Value of Financial Instruments - The net carrying amounts of cash and cash equivalents, accounts receivable, cash overdraft, accounts payable and short-term debt approximate their fair value due to the short-term nature of these instruments as well as the variable interest rate for short-term debt.
42
|
| CDI Corp. and Subsidiaries |
| Notes to Consolidated Financial Statements |
| |
| (In thousands, except per share amounts, unless otherwise indicated) |
For financial assets and liabilities measured at fair value on a recurring basis, fair value is the price the Company would receive to sell an asset or pay to transfer a liability in an orderly transaction with a market participant at the measurement date. A three-level fair value hierarchy prioritizes the inputs used to measure fair value as follows: Level 1—quoted prices in active markets for identical instruments; Level 2—quoted prices in active markets for similar instruments, quoted prices for identical instruments in markets that are not active, or other inputs that are observable or can be corroborated by observable data for substantially the full term of the instrument; and Level 3—significant inputs to the valuation model are unobservable.
Property and Equipment - Property and equipment are recorded at cost. Depreciation expense for financial reporting purposes is computed using the straight-line method over the following useful lives:
| | |
Computer equipment | | 4-7 years |
Equipment and furniture | | 4-10 years |
Software | | 4-7 years |
Leasehold improvements | | Shorter of lease term or useful life |
The Company capitalizes direct costs incurred in the development of internal-use software in the application development stage of software development.
Goodwill and Other Intangible Assets - Goodwill represents the excess of the purchase price over the estimated fair market value of identifiable net assets at the dates of acquisition in a business combination. Other intangible assets are identifiable assets that lack physical substance, which are acquired as part of a business combination or other transaction. Intangible assets with definite lives are amortized over their useful lives. Goodwill and other intangible assets with indefinite lives are not amortized and are tested for impairment at the reporting unit level at least annually. The Company performs its annual goodwill and other indefinite-lived intangible assets impairment testing by reporting unit as of July 1 of each fiscal year, or whenever events occur or circumstances indicate that it is more likely than not that the fair value of a reporting unit is below its carrying value.
The first step of the impairment test requires that the Company determine the fair value of each reporting unit and then compare that fair value to the reporting unit’s carrying amount. The Company uses the income approach to determine the fair value of its reporting units. The income approach is based on the present value of estimated discounted cash flows and terminal value projected for each reporting unit. The income approach requires significant judgments, including the projected results of operations, the weighted-average cost of capital (“WACC”) used to discount the cash flows and terminal value assumptions. The projected results of operations are based on the Company’s best estimates of future economic and market conditions, including growth rates, estimated earnings and cash expenditures. The WACC is determined based on the Company’s capital structure, cost of capital, inherent business risk profile and long-term growth expectations, as reflected in the terminal value. The Company uses a market approach based on peer group market multiples to validate the reasonableness of the fair values determined under the income approach.
The Company then validates the reasonableness of the total fair value of the reporting units under the income approach by reconciling the aggregate fair values of the reporting units to the Company’s total market capitalization, adjusted to include an estimated control premium. The estimated control premium is derived from observable transactions involving the purchase of controlling interests in comparable companies. The market capitalization of the Company is based on the average stock price over a range of dates prior to the assessment date.
The second step of the impairment test is performed if the first step indicates that impairment exists. The second step of the impairment assessment involves allocating the reporting unit’s fair value to all of its recognized and unrecognized assets and liabilities in order to determine the implied fair value of the reporting unit’s goodwill and intangible assets as of the assessment date. The implied fair value of the reporting unit’s goodwill and other intangible assets is then compared to the carrying amount of goodwill and other intangible assets to quantify an impairment charge as of the assessment date.
Long-Lived Assets - The Company evaluates long-lived assets and intangible assets with definite lives for impairment whenever events or changes in circumstances indicate that the carrying amount of an asset may not be recoverable. When it is probable that undiscounted future cash flows will not be sufficient to recover an asset’s carrying amount, the asset is written down to its fair value. Assets to be disposed of by sale are reported at the lower of the carrying amount or fair value less cost to sell.
Joint Ventures - The Company uses the equity-method of accounting for investments for which it has the ability to exercise significant influence, but not control, over the investee. Significant influence is generally deemed to exist if the Company has an ownership interest in the voting stock of the investee of between 20% to 50%. The Company recognizes its proportionate share of the investee’s results as “Equity in losses of affiliated companies” in the consolidated statements of operations.
The Company consolidates investments for which it has the ability to control or for which it has an ownership interest in the voting stock of the investee in excess of 50%. The portion of the results not attributable to the Company’s controlling interest in the investee’s results is presented as “Income (loss) attributable to noncontrolling interest” in the consolidated statements of operations.
43
|
| CDI Corp. and Subsidiaries |
| Notes to Consolidated Financial Statements |
| |
| (In thousands, except per share amounts, unless otherwise indicated) |
Leases - The Company leases office facilities and equipment under operating leases. For material lease agreements that provide for escalating rent payments or free-rent occupancy periods, the Company recognizes rent expense on a straight-line basis over the non-cancelable lease term. The lease term commences on the date when all conditions precedent to the Company’s obligation to pay rent are satisfied. Deferred rent is included in “Other accrued expenses and other current liabilities” in the consolidated balance sheets.
Cash Overdraft - The Company manages the level of its cash balances held in bank accounts to minimize its non-interest bearing cash balances. The cash balances in these bank accounts are higher than the Company’s book balances because of checks that are outstanding throughout the banking system. Cash is generally not transferred to operating bank accounts until checks are presented for payment. This process can result in negative cash balances in the Company’s records for certain accounts. These negative balances are reflected in current liabilities as “Cash overdraft” in the consolidated balance sheets when the right of offset is not available.
Stock-Based Compensation - The Company accounts for stock-based compensation based on the fair value of the award at the date of grant for equity-classified awards or as re-measured each reporting date for liability-classified awards until such awards no longer remain outstanding. The Company uses primarily the Black-Scholes option pricing model to calculate the fair value of awards and recognizes compensation expense, less estimated forfeitures, ratably over the requisite service period.
Recent Accounting Pronouncements
Effective January 1, 2012, the Company is required to adopt the provisions of Accounting Standards Update (“ASU”) No. 2011-08,Testing Goodwill for Impairment (Topic 350) (“ASU 2011-08”), which permits an entity to first assess qualitative factors to determine whether it is more likely than not that the fair value of a reporting unit is less than its carrying amount as a basis for determining whether it is necessary to perform the two-step goodwill impairment test described in Topic 350. The adoption of ASU 2011-08 will not have an impact on the Company’s consolidated financial position, results of operations or cash flows, as the guidance does not change the impairment calculation.
Effective January 1, 2012, the Company is required to adopt the provisions of ASU No. 2011-05,Comprehensive Income (Topic 220):Presentation of Comprehensive Income (“ASU 2011-05”), which requires that all non-owner changes in shareholders’ equity be presented either in a single continuous statement of comprehensive income or in two separate but consecutive statements. In the two-statement approach, the first statement would present total net income and its components followed consecutively by a second statement that would present total other comprehensive income, the components of other comprehensive income, and the total of comprehensive income. The effective date of certain provisions of this standard pertaining to the reclassification of items out of accumulated other comprehensive income has been deferred and is pending the issuance of further guidance on that matter. The adoption of ASU 2011-05 will not have an impact on the Company’s consolidated financial position, results of operations or cash flows, as the guidance only changes the presentation of financial information.
Note 2 - Property and Equipment
Property and equipment, net at December 31, 2011 and 2010, was comprised of the following:
| | | | | | | | |
| | | 2011 | | | 2010 | |
Computer equipment | | $ | 43,526 | | | $ | 43,420 | |
Equipment and furniture | | | 20,117 | | | | 22,744 | |
Software | | | 29,304 | | | | 29,286 | |
Leasehold improvements | | | 8,262 | | | | 9,992 | |
Total property and equipment | | | 101,209 | | | | 105,442 | |
Accumulated depreciation | | | (75,914 | ) | | | (74,423 | ) |
Property and equipment, net | | $ | 25,295 | | | $ | 31,019 | |
During the years ended December 31, 2011 and 2010, the Company capitalized $1.1 million and $2.3 million, respectively, of internal-use software acquisition and development costs. During 2011 and 2010, the Company recorded adjustments to retire $9.1 million and $2.9 million, respectively, of property and equipment and removed the associated $7.9 million and $2.6 million, respectively, of accumulated depreciation, recognizing a loss of $1.2 million and $0.3 million, respectively.
Note 3 - Fair Value Disclosures
The Company maintains a non-qualified Deferred Compensation Plan for highly compensated employees. The assets of the plan are held in the name of CDI at a third-party financial institution. Separate accounts are maintained for each participant to reflect the amounts deferred by the participant and all earnings and losses on those deferred amounts. The assets of the plan are held in publicly traded mutual funds. The fair value of the plan assets is calculated using the market price of the mutual funds as of the end of the period.
44
|
| CDI Corp. and Subsidiaries |
| Notes to Consolidated Financial Statements |
| |
| (In thousands, except per share amounts, unless otherwise indicated) |
The following tables summarize, by major category, the financial assets measured at fair value on a recurring basis as of December 31, 2011 and 2010:
| | | | | | | | | | | | | | | | |
| | | | | | Fair Value Measurements At December 31, 2011 Using | |
| Description | | Fair Value
Measurements at
December 31, 2011 | | | Quoted Prices in
Active Markets
for Identical
Assets
(Level 1) | | | Significant Other
Observable Inputs
(Level 2) | | | Significant
Unobservable
Inputs
(Level 3) | |
Debt securities: | | | | | | | | | | | | | | | | |
Corporate debt securities | | $ | 1,371 | | | $ | 1,371 | | | $ | - | | | $ | - | |
Government debt securities | | | 596 | | | | 596 | | | | - | | | | - | |
Equity securities: | | | | | | | | | | | | | | | | |
Mututal funds | | | 4,226 | | | | 4,226 | | | | - | | | | - | |
Money Market funds | | | 1,764 | | | | 1,764 | | | | - | | | | - | |
Total assets(1) | | $ | 7,957 | | | $ | 7,957 | | | $ | - | | | $ | - | |
| (1) | At December 31, 2011, $849 and $7,108 are included in “Prepaid expenses and other current assets” (liability offset in “Other accrued expenses and other current liabilities”) and “Other non-current assets” (liability offset in “Deferred compensation”), respectively, in the consolidated balance sheet reflecting the non-qualified Deferred Compensation Plan assets. |
| | | | | | | | | | | | | | | | |
| | | | | | Fair Value Measurements At December 31, 2010 Using | |
| Description | | Fair Value
Measurements at
December 31, 2010 | | | Quoted Prices in
Active Markets
for Identical
Assets
(Level 1) | | | Significant Other
Observable Inputs
(Level 2) | | | Significant
Unobservable
Inputs
(Level 3) | |
Debt securities: | | | | | | | | | | | | | | | | |
Corporate debt securities | | $ | 1,774 | | | $ | 1,774 | | | $ | - | | | $ | - | |
Equity securities: | | | | | | | | | | | | | | | | |
Mututal funds | | | 4,027 | | | | 4,027 | | | | - | | | | - | |
Money Market funds | | | 1,851 | | | | 1,851 | | | | - | | | | - | |
Total assets(1) | | $ | 7,652 | | | $ | 7,652 | | | $ | - | | | $ | - | |
| (1) | At December 31, 2010, $191 and $7,461 are included in “Prepaid expenses and other current assets” (liability offset in “Other accrued expenses and other current liabilities”) and “Other non-current assets” (liability offset in “Deferred compensation”), respectively, in the consolidated balance sheet reflecting the non-qualified Deferred Compensation Plan assets. |
Note 4 - Goodwill and Other Intangible Assets
On December 20, 2010, the Company acquired substantially all of the assets and certain liabilities of DSPCon, Inc. (“DSPCon”) for a purchase price of $6.9 million. During 2011, the Company retrospectively adjusted the purchase price allocation by recognizing $2.2 million of intangible assets including $1.7 for client relationships, $0.5 million for developed technology and $0.1 million for a trademark resulting in adjusted goodwill of $3.4 million. At December 31, 2011, the fair value of contingent purchase consideration was $2.2 million based on significant unobservable inputs (Level 3 – fair value hierarchy). The key assumption used to determine the fair value of contingent purchase consideration was management’s estimate of DSPCon’s future earnings before interest and taxes (“EBIT”).
On June 28, 2010, the Company acquired substantially all of the assets and certain liabilities of L. Robert Kimball & Associates, Inc. and two affiliated companies (collectively, “L.R. Kimball”) for $34.1 million in cash. Approximately $23.1 million of the purchase price was allocated to intangibles, including $2.2 million for client relationships, $0.2 million for non-compete agreements, $5.1 million for a trademark and $15.6 million for goodwill.
45
|
| CDI Corp. and Subsidiaries |
| Notes to Consolidated Financial Statements |
| |
| (In thousands, except per share amounts, unless otherwise indicated) |
The following tables summarize the changes in the Company’s carrying value of goodwill by reportable segment during 2011 and 2010:
| | | | | | | | | | | | | | | | | | | | | | | | |
| | | December 31, 2010 | | | | | | | | | December 31, 2011 | |
| | | Gross
Balance | | | Accumulated
Impairment
Losses | | | Additions | | | Translation
and Other
Adjustments | | | Gross
Balance | | | Accumulated
Impairment
Losses | |
ES | | $ | 56,003 | | | $ | (15,171 | ) | | $ | 290 | | | $ | 58 | | | $ | 56,351 | | | $ | (15,171 | ) |
Anders | | | 18,982 | | | | (8,312 | ) | | | - | | | | (85 | ) | | | 18,897 | | | | (8,312 | ) |
MRI | | | 15,782 | | | | (6,230 | ) | | | - | | | | 210 | | | | 15,992 | | | | (6,230 | ) |
Total goodwill | | $ | 90,767 | | | $ | (29,713 | ) | | $ | 290 | | | $ | 183 | | | $ | 91,240 | | | $ | (29,713 | ) |
| | | | | | | | | | | | | | | | | | | | | | | | |
| | | December 31, 2009 | | | | | | | | | December 31, 2010 | |
| | | Gross
Balance | | | Accumulated
Impairment
Losses | | | Additions | | | Impairment,
Translation
and Other
Adjustments | | | Gross
Balance | | | Accumulated
Impairment
Losses | |
ES | | $ | 37,331 | | | $ | (15,171 | ) | | $ | 18,672 | | | $ | - | | | $ | 56,003 | | | $ | (15,171 | ) |
Anders (1) | | | 19,472 | | | | - | | | | - | | | | (8,802 | ) | | | 18,982 | | | | (8,312 | ) |
MRI | | | 15,862 | | | | (6,230 | ) | | | - | | | | (80 | ) | | | 15,782 | | | | (6,230 | ) |
Total goodwill | | $ | 72,665 | | | $ | (21,401 | ) | | $ | 18,672 | | | $ | (8,882 | ) | | $ | 90,767 | | | $ | (29,713 | ) |
| (1) | During the fourth quarter of 2010, the Company’s Anders segment recognized an impairment charge of $8.3 million due in part to deterioration of the UK construction industry. |
Effective July 1, 2011, the Company performed its annual impairment test and determined that there was no impairment of goodwill. The Company’s reporting units, with the exception of Infrastructure (L.R. Kimball), which was recorded at fair value on the acquisition date of June 28, 2010, had fair values substantially in excess of their carrying value. The Infrastructure reporting unit had a fair value in excess of its carrying value of approximately 10% and goodwill of $15.6 million. There were no triggering events subsequent to July 1, 2011 that required additional testing for any reporting units.
The following tables summarize the changes in the Company’s carrying value of other intangible assets by reportable segment during 2011 and 2010:
| | | | | | | | | | | | | | | | | | | | | | | | |
| | | December 31, 2010 | | | | | | | | | December 31, 2011 | |
| | | Gross
Balance | | | Accumulated
Amortization | | | Additions | | | Amortization | | | Gross
Balance | | | Accumulated
Amortization | |
Trademarks: | | | | | | | | | | | | | | | | | | | | | | | | |
ES | | $ | 100 | | | $ | - | | | $ | - | | | $ | (33 | ) | | $ | 100 | | | $ | (33 | ) |
ES—indefinite life assets | | | 5,100 | | | | - | | | | - | | | | - | | | | 5,100 | | | | - | |
MRI—indefinite life assets | | | 2,165 | | | | - | | | | - | | | | - | | | | 2,165 | | | | - | |
Total trademarks | | | 7,365 | | | | - | | | | - | | | | (33 | ) | | | 7,365 | | | | (33 | ) |
Client relationship—ES | | | 11,960 | | | | (1,389 | ) | | | - | | | | (1,148 | ) | | | 11,960 | | | | (2,537 | ) |
Developed Technology—ES | | | 460 | | | | - | | | | - | | | | (92 | ) | | | 460 | | | | (92 | ) |
Non-compete agreements—ES | | | 150 | | | | (15 | ) | | | - | | | | (31 | ) | | | 150 | | | | (46 | ) |
Reacquired franchise rights—MRI | | | 536 | | | | (47 | ) | | | 371 | | | | (64 | ) | | | 907 | | | | (111 | ) |
Total other intangible assets | | $ | 20,471 | | | $ | (1,451 | ) | | $ | 371 | | | $ | (1,368 | ) | | $ | 20,842 | | | $ | (2,819 | ) |
| | | | | | | | | | | | | | | | | | | | | | | | |
| | | December 31, 2009 | | | | | | | | | December 31, 2010 | |
| | | Gross
Balance | | | Accumulated
Amortization | | | Additions | | | Amortization | | | Gross
Balance1 | | | Accumulated
Amortization | |
Trademarks: | | | | | | | | | | | | | | | | | | | | | | | | |
ES | | $ | - | | | $ | - | | | $ | 100 | | | $ | - | | | $ | 100 | | | $ | - | |
ES—indefinite life assets | | | - | | | | - | | | | 5,100 | | | | - | | | | 5,100 | | | | - | |
MRI—indefinite life assets | | | 2,165 | | | | - | | | | - | | | | - | | | | 2,165 | | | | - | |
Total trademarks | | | 2,165 | | | | - | | | | 5,200 | | | | - | | | | 7,365 | | | | - | |
Client relationship—ES | | | 8,100 | | | | (765 | ) | | | 3,860 | | | | (624 | ) | | | 11,960 | | | | (1,389 | ) |
Developed technology—ES | | | - | | | | - | | | | 460 | | | | - | | | | 460 | | | | - | |
Non-compete agreements—ES | | | - | | | | - | | | | 150 | | | | (15 | ) | | | 150 | | | | (15 | ) |
Reacquired franchise rights—MRI | | | 150 | | | | - | | | | 386 | | | | (47 | ) | | | 536 | | | | (47 | ) |
Total other intangible assets | | $ | 10,415 | | | $ | (765 | ) | | $ | 10,056 | | | $ | (686 | ) | | $ | 20,471 | | | $ | (1,451 | ) |
Amortization expense was $1.4 million for 2011, $0.7 million for 2010 and $0.5 million for 2009. Annual amortization expense is expected to range from approximately $1.0—$1.2 million per year for each of the next five years.
46
|
| CDI Corp. and Subsidiaries |
| Notes to Consolidated Financial Statements |
| |
| (In thousands, except per share amounts, unless otherwise indicated) |
Note 5 – Restructuring and Other Related Costs
In December 2011, the Company announced a strategic growth initiative. As part of this initiative, the Company approved a restructuring plan (“the Restructuring Plan”) designed to reduce costs and improve efficiencies. The Restructuring Plan will eliminate approximately 200 positions, consolidate facilities and reduce related operating costs. Implementation of the Restructuring Plan started in December 2011 and is expected to be completed in 2012 with certain cash payments expected through the first half of 2013.
In the fourth quarter of 2011, the Company recorded an aggregate pre-tax charge of $8.1 million to “Restructuring and other related costs” in the consolidated statement of operations, comprised of $5.7 million of employee severance and related costs, $0.8 million of real estate exit and related costs and $1.5 million of asset write-offs.
The following table summarizes the Restructuring Plan provision, activity and ending balances in “Other accrued expenses and other current liabilities” in the consolidated balance sheets during the year ended December 31, 2011 by cost type:
| | | | | | | | | | | | | | | | |
| | | Restructuring
and other
related costs | | | Non-cash | | | Cash
payments | | | December 31,
2011 Accrued
restructuring
liability | |
Employee severance and related costs | | $ | 5,739 | | | $ | - | | | $ | (367 | ) | | $ | 5,372 | |
Real estate exit and related costs | | | 831 | | | | - | | | | - | | | | 831 | |
Asset write-offs | | | 1,530 | | | | (1,530 | ) | | | - | | | | - | |
| | | $ | 8,100 | | | $ | (1,530 | ) | | $ | (367 | ) | | $ | 6,203 | |
The following table summarizes the amount of restructuring and other related costs recognized during the year ended December 31, 2011, by business segment:
| | | | |
| | | 2011 | |
ES | | $ | 5,813 | |
ITS | | | 1,283 | |
MRI | | | 476 | |
Anders | | | 196 | |
Corporate | | | 332 | |
Restructuring and other related costs | | $ | 8,100 | |
Note 6 – Short-Term Debt
On each of October 28, 2011 and November 30, 2011, CDI Corp. and its wholly-owned subsidiary, CDI Corporation (collectively, the “Borrowers”), entered into amendments to its Credit Agreement with JPMorgan Chase Bank, N.A. (the “Bank”) dated October 29, 2010 (as amended, the “Credit Agreement”), which amendments increased the revolving credit facility to $50.0 million and extended the term of the Credit Agreement to November 30, 2012. These amendments also raised the minimum liquidity balance (unrestricted cash and cash equivalents plus the unused amount available for borrowing under the credit facility) required to be maintained by CDI Corp. at the end of each fiscal quarter and before CDI Corp. can pay a dividend, to $20.0 million and $25.0 million, respectively.
The Credit Agreement is guaranteed by Management Recruiters International, Inc. and MRI Contract Staffing, Inc. (collectively, the “Guarantors”), and is secured by nearly all of the assets of the Borrowers and the Guarantors (collectively, the “Loan Parties”). The Loan Parties also pledged the stock of certain subsidiary companies, as additional security.
Interest under the facility is based on either a Eurodollar rate or an “Alternate Base Rate,” at the Company’s option each time it borrows funds. The Eurodollar rate equals LIBOR plus a spread (ranging from 2.25% to 2.75%) depending on the Company’s leverage ratio (consolidated indebtedness to consolidated EBITDA). The Alternate Base Rate equals the greater of: (i) the Bank’s prime rate, (ii) the Federal Funds rate plus 0.5% and (iii) the one-month LIBOR plus 1%. Fees associated with the Credit Agreement include a commitment fee of $30 thousand and a facility fee at the rate of 0.25% to 0.375% on the daily amount of the Bank’s commitment.
The Credit Agreement contains customary affirmative covenants. In addition, the Credit Agreement contains negative covenants including requirements to not exceed a maximum leverage ratio of 2.5 to 1.0, to maintain a minimum fixed charge coverage ratio of 1.2 to 1.0, and to maintain a minimum liquidity balance (unrestricted cash and cash equivalents plus the amount of the unused credit line) of $20.0 million. The Company was in compliance with all covenants under the Credit Agreement as of December 31, 2011.
At December 31, 2011, there were no outstanding borrowings and $45.7 million available to borrow under the Credit Agreement.
At December 31, 2010, the Company had outstanding borrowings of $13.9 million under the Credit Agreement, with a weighted average interest rate of 3.25%, which were borrowed under the Alternate Base Rate option. At December 31, 2010, the Company had a $10.2 million uncommitted, demand unsecured line of credit with Brown Brothers Harriman & Co., under which the bank issued, at its sole discretion, standby letters of credit. At December 31, 2010, the Company had $4.3 million of outstanding letters of credit issued against this line of credit. This line of credit expired as of March 31, 2011, and the outstanding standby letters of credit were replaced with letters of credit issued under the Credit Agreement. At December 31, 2011, there was $4.3 million of letters of credit outstanding under the Credit Agreement.
47
|
| CDI Corp. and Subsidiaries |
| Notes to Consolidated Financial Statements |
| |
| (In thousands, except per share amounts, unless otherwise indicated) |
Note 7 - Stock-Based Compensation
The Company has two stock-based compensation plans, the CDI Corp. 2004 Omnibus Stock Plan, as amended (the “Omnibus Plan”), and the CDI Corp. Stock Purchase Plan for Management Employees and Non-Employee Directors, as amended (the “Stock Purchase Plan”). Under the Omnibus Plan, eligible employees can be granted awards of stock options, stock appreciation rights, restricted stock, time-vested deferred stock and performance-contingent deferred stock. Under the Stock Purchase Plan, certain employees and non-employee directors may purchase units with a portion of bonuses for employees or retainer fees for non-employee directors, which, upon vesting, convert into shares of the Company’s common stock. As of December 31, 2011, the Company has 2,176 thousand shares of the Company’s common stock reserved for future issuance under the Company’s Omnibus Plan and 240 thousand shares of common stock reserved for future issuance under the Stock Purchase Plan.
Stock-based compensation expense is included in “Operating and administrative expenses” in the consolidated statements of operations and amounted to $3.4 million ($2.1 million, net of tax), $3.0 million ($1.8 million, net of tax) and $3.1 million ($1.9 million, net of tax) for the years ended December 31, 2011, 2010 and 2009, respectively. The table below summarizes the components of stock-based compensation expense for all of the Company’s stock-based plans for the years ended December 31, 2011, 2010 and 2009:
| | | | | | | | | | | | |
| | | 2011 | | | 2010 | | | 2009 | |
Time-vested deferred stock | | $ | 1,625 | | | $ | 1,751 | | | $ | 1,765 | |
Stock appreciation rights | | | 850 | | | | 988 | | | | 790 | |
Performance-contingent deferred stock | | | 721 | | | | - | | | | - | |
Stock purchase plan | | | 162 | | | | 240 | | | | 268 | |
Stock options | | | - | | | | - | | | | 69 | |
Restricted stock | | | - | | | | - | | | | 158 | |
Total stock-based compensation | | $ | 3,358 | | | $ | 2,979 | | | $ | 3,050 | |
Time-Vested Deferred Stock (“TVDS”)
TVDS awards entitle each recipient to receive a number of shares of the Company’s common stock upon vesting. The shares of TVDS generally vest 20% on each of the next five anniversaries of the date of grant, except for those granted to the non-employee directors and certain former and current members of senior management, whose vesting periods vary from one to five years. TVDS will generally be forfeited prior to vesting if the holder’s employment with the Company ends, or for a certain award, if the Company’s stock price on the date of vesting is below the price on the date of grant. Upon vesting, a holder of TVDS receives the original awarded shares plus additional shares of CDI common stock having a fair market value equal to the sum of the dividends that would have been paid on the original awarded shares during the vesting period had they been issued and outstanding during that period. Compensation cost on TVDS is based on the fair value of the Company’s common stock on the date of grant and is charged to earnings on a straight-line basis over the vesting period.
The following table summarizes the Company’s TVDS activity and related information for the years ended December 31, 2011, 2010 and 2009:
| | | | | | | | | | | | |
| | | Time
Vested
Deferred
Stock | | | Weighted-
Average
Grant
Date Fair
Value | | | Weighted-
Average
Remaining
Contractual
Life (In
Years) | |
Outstanding non-vested at December 31, 2008 | | | 116 | | | $ | 26.82 | | | | | |
Granted | | | 111 | | | | 10.54 | | | | | |
Vested | | | (44 | ) | | | 20.38 | | | | | |
Cancelled | | | (1 | ) | | | 13.58 | | | | | |
Outstanding non-vested at December 31, 2009 | | | 182 | | | | 18.50 | | | | | |
Granted | | | 116 | | | | 15.44 | | | | | |
Vested | | | (78 | ) | | | 19.36 | | | | | |
Cancelled | | | (2 | ) | | | 18.63 | | | | | |
Outstanding non-vested at December 31, 2010 | | | 218 | | | | 16.57 | | | | | |
Granted | | | 305 | | | | 14.74 | | | | | |
Vested | | | (70 | ) | | | 20.59 | | | | | |
Cancelled | | | (37 | ) | | | 15.16 | | | | | |
Outstanding non-vested at December 31, 2011 | | | 416 | | | $ | 14.68 | | | | 3.0 | |
As noted above, upon vesting, the Company awards additional shares to TVDS holders equivalent to the dollar amount of dividends that would have been earned on the TVDS awards had the shares been issued and outstanding. The following table shows the calculation of the number of shares equivalent to the dividend dollars outstanding at December 31, 2011, 2010 and 2009:
| | | | | | | | | | | | |
| | | December 31, | |
| | | 2011 | | | 2010 | | | 2009 | |
Total Dividends Outstanding | | $ | 241 | | | $ | 174 | | | $ | 142 | |
Closing market price per share | | $ | 13.81 | | | $ | 18.59 | | | $ | 12.95 | |
Equivalent shares at closing market price | | | 17 | | | | 9 | | | | 11 | |
As of December 31, 2011, total unrecognized compensation cost related to non-vested TVDS awards was $3.3 million and will be recognized over the remaining weighted-average service period of 3.0 years.
Stock Appreciation Rights (“SARs”)
SARs represent the right to receive, upon exercise, shares of the Company’s common stock, net of withholding taxes, equal to
48
|
| CDI Corp. and Subsidiaries |
| Notes to Consolidated Financial Statements |
| |
| (In thousands, except per share amounts, unless otherwise indicated) |
the difference between the market price of the common stock and the exercise price as determined by the terms of the individual awards. SARs generally vest between three to five years and expire in seven years or less from the date of grant. In estimating the expected term of SARs granted in 2011 and 2010, the Company utilized actual historical experience. In estimating the expected life of SARs granted in 2009, the Company utilized the “simplified method.” The expected stock price volatility is based on the historical volatility of the Company’s common stock over the previous five years.
The following table summarizes the range of assumptions used to estimate the fair values of SARs granted for the years ended December 31, 2011, 2010 and 2009:
| | | | | | | | | | | | |
| | | 2011 | | | 2010 | | | 2009 | |
Risk-free interest rate | | | 0.87 - 2.37 | % | | | 1.44 - 2.33 | % | | | 1.64 - 2.95 | % |
Expected life of SARs | | | 4.5 years | | | | 4.9 years | | | | 5.0 years | |
Expected stock price volatility | | | 54 - 60 | % | | | 52 - 53 | % | | | 54 - 57 | % |
Expected dividend yield | | | 2.71 - 4.97 | % | | | 3.23 - 3.92 | % | | | 4.20 - 5.54 | % |
Weighted-average fair value at grant date | | $ | 3.22 - 8.13 | | | $ | 4.39 - 5.75 | | | $ | 2.82 - 4.51 | |
The following table summarizes the Company’s SARs activity and related information for the years ended December 31, 2011, 2010 and 2009:
| | | | | | | | | | | | | | | | |
| | | SARs | | | Weighted-Average
Exercise
Price | | | Weighted-Average
Remaining
Contractual
Life
(In Years) | | | Aggregate
Intrinsic
Value | |
Outstanding at December 31, 2008 | | | 443 | | | $ | 25.13 | | | | | | | | | |
Granted | | | 182 | | | | 9.49 | | | | | | | | | |
Cancelled | | | (27 | ) | | | 17.09 | | | | | | | | | |
Expired | | | (12 | ) | | | 24.85 | | | | | | | | | |
Outstanding at December 31, 2009 | | | 586 | | | | 20.66 | | | | | | | | | |
Granted | | | 159 | | | | 14.80 | | | | | | | | | |
Exercised | | | (7 | ) | | | 9.61 | | | | | | | | | |
Cancelled | | | (38 | ) | | | 19.43 | | | | | | | | | |
Expired | | | (5 | ) | | | 25.49 | | | | | | | | | |
Outstanding at December 31, 2010 | | | 695 | | | | 19.47 | | | | | | | | | |
Granted | | | 429 | | | | 13.15 | | | | | | | | | |
Exercised | | | (22 | ) | | | 10.06 | | | | | | | | | |
Cancelled | | | (136 | ) | | | 15.70 | | | | | | | | | |
Expired | | | (109 | ) | | | 24.49 | | | | | | | | | |
Outstanding at December 31, 2011 | | | 857 | | | | 16.51 | | | | 4.5 | | | $ | 1,200 | |
Exercisable at December 31, 2011 | | | 276 | | | | 21.86 | | | | 2.3 | | | $ | 174 | |
Expected to vest at December 31, 2011 | | | 423 | | | $ | 14.44 | | | | 5.4 | | | $ | 681 | |
Aggregate intrinsic value represents the difference between the exercise prices and the closing stock price on December 31, 2011. The total intrinsic value of SARs exercised during the year ended December 31, 2011 and 2010 was $74 thousand and $60 thousand, respectively. There were no SARs exercised during the year ended December 31, 2009.
As of December 31, 2011, total unrecognized compensation cost related to non-vested SARs was $1.9 million and will be recognized over the remaining weighted-average service period of 3.1 years.
Performance-Contingent Deferred Stock (“PCDS”)
PCDS awards are earned based on achievement of pre determined goals under the Omnibus Plan and generally vest over a two-year period. The fair value of the awards is determined on the date of grant. If the Company determines the achievement of the performance conditions is probable, there will be charges to earnings on a straight-line basis over the vesting period. The Company granted 107 thousand PCDS during 2011, which includes an estimated number of PCDS based on the Company’s December 31, 2011 stock price of $13.81 for a fixed-dollar PCDS grant. The actual number of shares of the Company’s common stock that would be issued for the fixed-dollar PCDS upon vesting will be based on the Company’s stock price on the date of vesting. No awards were earned during 2010 or 2009 and all awards issued prior to 2011 have expired. As of December 31, 2011, total unrecognized compensation cost related to non-vested PCDS was $0.8 million
49
|
| CDI Corp. and Subsidiaries |
| Notes to Consolidated Financial Statements |
| |
| (In thousands, except per share amounts, unless otherwise indicated) |
and subject to revisions in the estimates of achievement of the performance conditions, will be recognized over the remaining weighted-average service period of 1 year.
Stock Purchase Plan (“SPP”)
Under the terms of the SPP, designated employees and non-employee directors have the opportunity to purchase shares of the Company’s common stock on a pre-tax basis. Employee participants use a portion of their annual bonus awards to purchase SPP units. Certain senior management personnel are required to participate (unless they have satisfied their stock ownership requirements) by using 25% of their annual bonus awards to purchase SPP units and can elect to participate with up to an additional 25% of their annual bonus to purchase SPP units. Other employee participants can elect to use up to 25% of their annual bonus amount. Non-employee directors may participate by using some or all of their retainer fees to purchase SPP units. The Company makes a matching contribution of one SPP unit for every three SPP units purchased by a participant on a voluntary basis. Vesting of SPP units occurs over a period of three to ten years as chosen by the participant. As of December 31, 2011, there were 75 thousand SPP units accumulated based upon participating employee and Company matching contributions and using a weighted-average market price of $12.25. In addition, SPP units that vest will receive additional shares of the Company’s common stock in lieu of dividends declared from the date of grant to the date of vesting.
Stock Options
Options are granted at a price equal to the quoted market price per share of the Company’s common stock on the date of grant. Employee stock options generally vest ratably over a five year period and expire seven years from the date of grant.
The following table summarizes the Company’s stock option activity and related information for the years ended December 31, 2011, 2010 and 2009:
| | | | | | | | | | | | | | | | |
| | | Options | | | Weighted-Average
Exercise
Price | | | Weighted-Average
Remaining
Contractual
Life
(In Years) | | | Aggregate
Intrinsic
Value | |
Outstanding at December 31, 2008 | | | 420 | | | $ | 23.38 | | �� | | | | | | | |
Expired | | | (79 | ) | | | 22.87 | | | | | | | | | |
Outstanding at December 31, 2009 | | | 341 | | | | 23.50 | | | | | | | | | |
Exercised | | | (28 | ) | | | 15.26 | | | | | | | | | |
Cancelled | | | (13 | ) | | | 27.38 | | | | | | | | | |
Expired | | | (145 | ) | | | 24.69 | | | | | | | | | |
Outstanding at December 31, 2010 | | | 155 | | | | 23.57 | | | | | | | | | |
Cancelled | | | (50 | ) | | | 16.05 | | | | | | | | | |
Expired | | | (105 | ) | | | 27.15 | | | | | | | | | |
Outstanding at December 31, 2011 | | | - | | | | - | | | | - | | | $ | - | |
Exercisable at December 31, 2011 | | | - | | | $ | - | | | | - | | | $ | - | |
The total intrinsic value of stock options exercised during the year ended December 31, 2010 was $75 thousand.
Restricted Stock
During 2008, the Company issued 20 thousand shares of restricted common stock, which vested in equal tranches at December 31, 2008 and 2009.
Note 8 - Basic and Diluted Earnings Per Share (“EPS”) Data
The following table reconciles the denominator used to compute basic EPS to the denominator used to compute diluted EPS for the fiscal years ended December 31 2011, 2010 and 2009:
| | | | | | | | | | | | |
| | | 2011 | | | 2010 | | | 2009 | |
Numerator: | | | | | | | | | | | | |
Net income (loss) attributable to CDI | | $ | 14,833 | | | $ | (10,858 | ) | | $ | (19,902 | ) |
Denominator: | | | | | | | | | | | | |
Basic weighted-average shares | | | 19,144 | | | | 19,015 | | | | 18,932 | |
Dilutive effect of stock-based awards | | | 212 | | | | - | | | | - | |
Diluted weighted-average shares | | | 19,356 | | | | 19,015 | | | | 18,932 | |
Earnings (loss) per common share: | | | | | | | | | | | | |
Basic | | $ | 0.77 | | | $ | (0.57 | ) | | $ | (1.05 | ) |
Diluted | | $ | 0.77 | | | $ | (0.57 | ) | | $ | (1.05 | ) |
50
|
| CDI Corp. and Subsidiaries |
| Notes to Consolidated Financial Statements |
| |
| (In thousands, except per share amounts, unless otherwise indicated) |
Outstanding employee shares and units granted under the Omnibus Plan of 729 thousand, 1,259 thousand and 1,279 thousand shares were excluded from the computation of EPS for the years ended December 31, 2011, 2010 and 2009, respectively, because their effect would have been anti-dilutive.
Note 9 - Income Taxes
Income (loss) before income taxes for the years ended December 31, 2011, 2010 and 2009 were as follows:
| | | | | | | | | | | | |
| | | 2011 | | | 2010 | | | 2009 | |
United States | | $ | 11,186 | | | $ | 13,194 | | | $ | 1,688 | |
Foreign | | | 8,944 | | | $ | (16,340 | ) | | | (21,099 | ) |
Income (loss) before income taxes | | $ | 20,130 | | | $ | (3,146 | ) | | $ | (19,411 | ) |
Income tax expense for the years ended December 31, 2011, 2010 and 2009 was comprised of the following:
| | | | | | | | | | | | |
| | | 2011 | | | 2010 | | | 2009 | |
Current | | | | | | | | | | | | |
Federal | | $ | 2,595 | | | $ | 4,638 | | | $ | 2,304 | |
State | | | 1,604 | | | | 1,007 | | | | 349 | |
Foreign | | | 442 | | | | (179 | ) | | | 762 | |
| | | | 4,641 | | | | 5,466 | | | | 3,415 | |
Deferred | | | | | | | | | | | | |
Federal | | $ | 1,086 | | | $ | 706 | | | $ | 65 | |
State | | | (552 | ) | | | 206 | | | | (1,341 | ) |
Foreign | | | (45 | ) | | | 1,290 | | | | (1,631 | ) |
| | | | 489 | | | | 2,202 | | | | (2,907 | ) |
Income tax expense | | $ | 5,130 | | | $ | 7,668 | | | $ | 508 | |
The following table reconciles income tax expense and rate based on the U.S. statutory rate to the Company’s income tax expense for the years ended December 31, 2011, 2010 and 2009:
| | | | | | | | | | | | | | | | | | | | | | | | |
| | | 2011 | | | 2010 | | | 2009 | |
| | | $ | | | % | | | $ | | | % | | | $ | | | % | |
Income tax expense based on the US statutory rate | | $ | 7,046 | | | | 35.0 | % | | $ | (1,101 | ) | | | 35.0 | % | | $ | (6,794 | ) | | | 35.0 | % |
Effect of impairment charge related to a goodwill write-down | | | - | | | | - | | | | 2,909 | | | | (92.5 | ) | | | - | | | | - | |
Effect of charge related to DOJ matter | | | - | | | | - | | | | (863 | ) | | | 27.4 | | | | 1,307 | | | | (6.7 | ) |
Effect of charge related to OFT fine | | | (3,381 | ) | | | (16.8 | ) | | | - | | | | - | | | | 4,314 | | | | (22.2 | ) |
State income taxes, net of federal tax benefit | | | 684 | | | | 3.4 | | | | 563 | | | | (17.9 | ) | | | (751 | ) | | | 3.9 | |
Permanent items | | | 164 | | | | 0.8 | | | | 283 | | | | (9.0 | ) | | | 157 | | | | (0.8 | ) |
Effect of foreign operations | | | 923 | | | | 4.6 | | | | 1,373 | | | | (43.6 | ) | | | 829 | | | | (4.3 | ) |
Net change in uncertain tax positions | | | (139 | ) | | | (0.7 | ) | | | 119 | | | | (3.8 | ) | | | 828 | | | | (4.3 | ) |
Adjustment to deferred taxes, pertaining to prior years | | | - | | | | - | | | | 558 | | | | (17.8 | ) | | | - | | | | - | |
Change in valuation allowance—Federal foreign tax credits | | | - | | | | - | | | | 130 | | | | (4.1 | ) | | | 115 | | | | (0.6 | ) |
Change in valuation allowance—Foreign loss carryforwards | | | - | | | | - | | | | 3,293 | | | | (104.7 | ) | | | 412 | | | | (2.1 | ) |
HIRE Act income tax credit | | | (947 | ) | | | (4.7 | ) | | | - | | | | - | | | | - | | | | - | |
Stock-based compensation | | | 689 | | | | 3.4 | | | | 408 | | | | (13.0 | ) | | | 57 | | | | (0.3 | ) |
Other | | | 91 | | | | 0.5 | | | | (4 | ) | | | 0.3 | | | | 34 | | | | (0.2 | ) |
| | | $ | 5,130 | | | | 25.5 | % | | $ | 7,668 | | | | (243.7 | )% | | $ | 508 | | | | (2.6 | )% |
The tax effects of temporary differences that give rise to the Company’s deferred tax accounts as of December 31, 2011 and 2010 were as follows:
| | | | | | | | |
| | | 2011 | | | 2010 | |
Deferred tax assets: | | | | | | | | |
Accrued compensation | | $ | 11,126 | | | $ | 10,260 | |
Reserves and accruals | | | 4,635 | | | | 2,897 | |
Bad debts | | | 1,145 | | | | 2,392 | |
Loss and credit carryforwards | | | 10,912 | | | | 10,121 | |
Total gross deferred tax assets | | | 27,818 | | | | 25,670 | |
Less: valuation allowances | | | (5,354 | ) | | | (4,720 | ) |
Net total deferred tax assets | | | 22,464 | | | | 20,950 | |
Deferred tax liabilities: | | | | | | | | |
Property and equipment depreciation | | | (4,098 | ) | | | (3,526 | ) |
Intangible asset amortization | | | (2,135 | ) | | | (987 | ) |
Other | | | (1,016 | ) | | | (820 | ) |
Total deferred tax liabilities | | | (7,249 | ) | | | (5,333 | ) |
Net deferred tax assets | | $ | 15,215 | | | $ | 15,617 | |
At December 31, 2011, the Company had state net operating loss carry forwards aggregating $95.8 million; these losses expire at various dates from 2013 through 2031.
51
|
| CDI Corp. and Subsidiaries |
| Notes to Consolidated Financial Statements |
| |
| (In thousands, except per share amounts, unless otherwise indicated) |
At December 31, 2011, the Company had foreign tax credits of $0.9 million, which expire at various dates from 2012 through 2020.
At December 31, 2011, the Company had foreign net operating losses of $15.9 million, the majority of which can be carried forward indefinitely.
In 2011, the Company added $0.6 million to the valuation allowance that was set up against the Company’s net foreign deferred tax assets of which $0.4 million related to the valuation allowance set up against the Company’s net foreign deferred tax assets to fully reserve previously recorded tax benefits generated in the UK. In 2010, the Company added $3.4 million to the valuation allowance for foreign deferred tax assets of which, $2.8 million related to the tax benefits generated in the UK. This valuation allowance is primarily due to cumulative losses in the UK operations of the Anders segment over the past four years. A valuation allowance has been established for the state net operating loss carry forwards and foreign tax credit carry forwards to reduce the assets to a level which, more likely than not, will be realized. Realization is dependent upon generating sufficient state taxable income, foreign taxable income and foreign source income, respectively, in the appropriate jurisdictions prior to the expiration of the carry forwards. In addition, the Company has considered available tax planning strategies as part of the establishment of the valuation allowances. The deferred tax asset considered realizable could be reduced if estimates of these amounts during the carry forward period are reduced.
At December 31, 2011, the Company had $1.1 million of total gross unrecognized tax benefits. The net unrecognized tax benefit of $1.1 million, if recognized, would impact the effective tax rate. The Company does not expect the amount of gross unrecognized tax benefits to significantly change in the next 12 months. A reconciliation of the beginning and ending amount of gross unrecognized tax benefits for the years ending December 31, 2011, 2010 and 2009 is as follows:
| | | | | | | | | | | | |
| | | 2011 | | | 2010 | | | 2009 | |
Beginning balance of gross unrecognized tax benefits | | $ | 1,351 | | | $ | 2,189 | | | $ | 1,322 | |
Reductions in gross unrecognized tax benefits | | | - | | | | (912 | ) | | | - | |
Additions based on tax positions related to the current year | | | 95 | | | | - | | | | 370 | |
Reductions for tax provisions of prior years | | | (11 | ) | | | 342 | | | | 651 | |
Reductions for settlements and payments | | | (118 | ) | | | (70 | ) | | | (154 | ) |
Reductions due to statute expiration | | | (247 | ) | | | (198 | ) | | | - | |
Ending balance of gross unrecognized tax benefits | | $ | 1,070 | | | $ | 1,351 | | | $ | 2,189 | |
The Company accounts for interest and penalties related to income tax matters in income tax expense. Interest and penalties of $0.8 million are accrued at December 31, 2011, $0.1 million of which was recorded during 2011. The Company files a consolidated U.S. federal income tax return and files state and foreign income tax returns in various jurisdictions as required. The U.S. federal tax return is open for examination back to 2008. State and foreign income tax returns remain open for examination back to 2007 in major jurisdictions in which the Company operates.
The Company has not recorded incremental deferred income taxes on the undistributed earnings of its foreign subsidiaries because it is management’s intention to reinvest such earnings for the foreseeable future. At December 31, 2011, the undistributed earnings of the foreign subsidiaries amounted to approximately $41.3 million. Upon distribution of these earnings in the form of dividends or otherwise, the Company would be subject to U.S. income taxes and foreign withholding taxes, reduced by certain foreign tax credits.
Note 10 - Commitments and Contingencies
Lease Commitments
The Company leases office facilities and equipment under operating leases. The office facilities are generally used for sales, recruitment, engineering, design, drafting and administrative functions and are under leases that generally expire through 2019.
Rental expense and sublease proceeds for the years ended December 31, 2011, 2010 and 2009 are as follows:
| | | | | | | | | | | | |
| | | 2011 | | | 2010 | | | 2009 | |
Rental expense | | $ | 12,959 | | | $ | 14,310 | | | $ | 14,286 | |
Sublease proceeds | | | 657 | | | | 415 | | | | 401 | |
For periods after December 31, 2011, approximate minimum annual rental payments under non-cancelable leases are as follows:
| | | | | | | | | | | | | | | | | | | | | | | | |
| | | 2012 | | | 2013 | | | 2014 | | | 2015 | | | 2016 | | | Thereafter | |
Gross future mininum lease payments on non-cancelable leases | | $ | 11,053 | | | $ | 8,105 | | | $ | 6,081 | | | $ | 4,366 | | | $ | 1,904 | | | $ | 1,586 | |
Future receipts from subleases | | | (703 | ) | | | (381 | ) | | | (183 | ) | | | (137 | ) | | | - | | | | - | |
Future mininum lease payments on non-cancelable leases, net | | $ | 10,350 | | | $ | 7,724 | | | $ | 5,898 | | | $ | 4,229 | | | $ | 1,904 | | | $ | 1,586 | |
Other Contractual Obligations
The Company maintains a global master agreement with a large on-line job posting and search service. At December 31, 2011, the aggregate minimum payments remaining for the years ended December 31, 2012 and 2013 were $0.1 and $1.5 million, respectively.
52
|
| CDI Corp. and Subsidiaries |
| Notes to Consolidated Financial Statements |
| |
| (In thousands, except per share amounts, unless otherwise indicated) |
Insurance
The Company self-funds certain losses related to worker’s compensation and employee health benefit claims. The Company maintains stop-loss insurance for workers’ compensation and health care benefit claims that generally limits the Company’s exposure to $250 thousand and $200 thousand per incident, respectively. The Company records expense for its estimated claims exposure based on incurred claims, historical experience and third-party insurance professionals or actuaries. The amounts accrued gives consideration to the estimated undiscounted cash payments expected to be paid to satisfy existing claims and an allowance for incurred-but-not-reported claims. The accrual for workers’ compensation estimated claims exposure was $2.3 million and $2.5 million at December 31, 2011 and 2010, respectively. The Company established its self-funded health benefits program during 2011 and had accrued $3.1 million at December 31, 2011 for its estimated claims exposure.
Legal Proceedings and Claims
The Company is subject to various legal proceedings and claims that have arisen in the ordinary course of business. The Company records a liability when it is both probable that a liability has been incurred and the amount of the loss can be reasonably estimated. Although management cannot predict the timing or outcome of these matters with certainty, management does not believe that the final resolution of these matters, individually or in the aggregate, would have a material adverse effect on the Company’s consolidated financial condition, results of operations or cash flows.
In April 2011, the Company received a favorable ruling from the Competition Appeal Tribunal (“CAT”) on the Company’s appeal of a fine imposed by the United Kingdom’s Office of Fair Trading (“OFT”). The ruling by the CAT reduced the fine from $12.3 million to $2.5 million. The Company originally reserved $12.3 million for the fine in 2009 but as a result of the appeal, reversed $9.7 million of that reserve in the second quarter of 2011 through “Operating and administrative expenses” in the consolidated statements of operations.
In November 2010, the Company paid $2.4 million to settle of a 2009 claim under the U.S False Claims Act brought by the Civil Division of the Department of Justice (“DOJ”) and an individual relator. The Company originally reserved $4.3 million in 2009 and reversed $1.8 million concurrent with this settlement through “Operating and administrative expenses” in the consolidated statements of operations.
Note 11 - Retirement Plans
Trusteed contributory and non-contributory defined contribution retirement plans have been established for the benefit of eligible employees. Costs of the plans are charged to “Operating and administrative expenses” in the consolidated statements of operations and are based on either a formula using a percentage of compensation or an amount determined by the Board of Directors. The non-contributory defined contribution retirement plan was rolled into the contributory plan as of December 31, 2011. Charges to income for these retirement plans for the years ended December 31, 2011, 2010 and 2009 were $1.1 million, $0.8 million and $0.7 million, respectively.
Note 12 - Related Party Transactions
A member of the Company’s Board of Directors is a senior partner of a law firm that provides legal services to the Company. Total disbursements to the law firm relating to these legal services aggregated $0.5 million, $0.4 million and $0.8 million in 2011, 2010 and 2009, respectively.
Note 13 - Joint Ventures
CDI-Pycopsa
In 2008, the Company formed CDI—Pycopsa Ingeniería y Construcción, S. de R.L. de C.V. (“CDI-Pycopsa”), a joint venture with a Mexico-based construction and industrial maintenance company. In June 2009, CDI-Pycopsa began operations. The Company consolidates CDI-Pycopsa based on the Company’s controlling interest. As of December 31, 2011, the Company had a 67% ownership interest in CDI-Pycopsa and had invested an aggregate of approximately $0.6 million. CDI-Pycopsa had pre-tax income of $0.7 million and $0.4 million for the years ended December 31, 2011 and 2010, respectively, and had a pre-tax loss of $0.1 million for the seven months ended December 31, 2009.
CDI Gulf International (“CGI”)
In June 2008, the Company formed CDI Gulf International (“CGI”) with an engineering firm. The Company accounted for this investment in CGI under the equity method of accounting based on its 49% ownership interest. The Company invested $4.1 million in CGI in 2008. This investment was reduced to zero through the Company’s proportionate share of losses during 2010, 2009, 2008 of $1.3 million, $1.4 million and $0.4 million, respectively, and a $1.0 million write-off in December 2010. The Company sold its interest in CGI for a de minimis amount during 2011.
CTQ Engineering LLC (“CTQ”)
In December 2006, the Company formed CTQ Engineering LLC (“CTQ”) with two engineering firms. Since July 2008, the Company has maintained a 50% ownership interest in CTQ. The Company accounts for its ownership interest in CTQ under the equity method of accounting based on its significant but non-controlling interest. The Company maintains a de minimis investment balance in CTQ.
53
|
| CDI Corp. and Subsidiaries |
| Notes to Consolidated Financial Statements |
| |
| (In thousands, except per share amounts, unless otherwise indicated) |
Note 14 - Reporting Segments
On December 8, 2011, the Company announced business model and organizational changes aligned with a new strategic plan to make CDI an engineering and technology solutions company with global capabilities in select markets. The restructuring activities, as further described in Note 5—Restructuring and Other Related Costs, did not impact the composition of the Company’s operating segments as of December 31, 2011.
During 2011 and 2010 the Company operated through four reporting segments: ES, ITS, MRI and Anders.
ES operated through the following four verticals:
| | Ÿ | | CDI-Process and Industrial (“P&I”)—P&I provided a full range of engineering, design, project management, professional staffing and outsourcing solutions to firms in oil & gas, refining, alternative energy, power generation and energy transmission, chemicals and heavy manufacturing industries. |
| | Ÿ | | CDI-Government Services (“Government Services”)—Government Services provided engineering, design and logistics services to the U.S. defense industry, particularly in marine design, systems development and military aviation support. |
| | Ÿ | | CDI-Aerospace (“Aerospace”)—Aerospace provided engineering, design, project management, professional staffing and outsourcing solutions to both the commercial and military aerospace markets. |
| | Ÿ | | CDI-Infrastructure (“Infrastructure”)—Infrastructure provided architecture, civil and environmental engineering, communication technology and consulting services to governmental, educational and private industry clients, through a network of offices primarily in the mid-Atlantic region. |
ITS provided a variety of IT-related services to its clients, which were primarily large and mid-sized clients with significant IT requirements and/or the need to supplement their own staff on a flexible basis. Services included staffing augmentation, permanent placement, outsourcing (both on-site, under the client’s supervision, and off-site) and consulting. During 2011, 2010 and 2009, IBM accounted for approximately 21%, 20% and 16%, respectively, of the Company’s consolidated revenue. In December 2011, the Company and IBM executed a new Master Statement of Work effective as of December 31, 2011 with a term of three years. IBM may terminate the contract with or without cause at any time and has the option to extend the contract by an additional three years, in one-year increments.
MRI is a global franchisor that does business as MRINetwork® and provides the use of its trademarks, business systems and training and support services to its franchisees who engage in the search and recruitment of executive, technical, professional and managerial personnel for employment by their clients. The MRI franchisees provide permanent placement services primarily under the brand names Management Recruiters®, Sales Consultants®, CompuSearch® and OfficeMates 5®. MRI also provides training and support, implementation services and back-office services to enable franchisees to pursue contract staffing opportunities.
Anders provided contract and permanent placement candidates to clients in the infrastructure environment seeking staff in building, construction and related professional services through a network of Company offices. The Company maintains offices in the UK and Australia.
For purposes of business segment performance measurement, the Company charges certain expenses directly attributable to the segments and allocates certain other expenses and support costs. Support costs consist principally of employee benefit administration, accounting support, IT services and shared service center costs. Operating and administrative expenses that are not directly attributable to the segments are classified as corporate. Identifiable assets of the business segments exclude corporate assets, which principally consist of cash and cash equivalents and certain prepaid expenses, non-trade accounts receivable, deferred tax assets attributable to the ITS and ES segments, property and equipment and other assets.
Reporting segment data is presented in the table below:
| | | | | | | | | | | | |
| | | 2011 | | | 2010 | | | 2009 | |
Revenue: | | | | | | | | | | | | |
ES | | $ | 582,556 | | | $ | 483,731 | | | $ | 483,755 | |
ITS | | | 346,162 | | | | 315,849 | | | | 243,928 | |
MRI | | | 68,595 | | | | 61,316 | | | | 53,975 | |
Anders | | | 62,490 | | | | 65,393 | | | | 103,292 | |
Total revenue | | $ | 1,059,803 | | | $ | 926,289 | | | $ | 884,950 | |
Operating profit (loss): | | | | | | | | | | | | |
ES | | $ | 14,807 | | | $ | 8,710 | | | $ | 5,360 | |
ITS | | | 13,622 | | | | 12,066 | | | | 6,513 | |
MRI | | | 8,551 | | | | 6,088 | | | | 2,306 | |
Anders | | | 7,749 | | | | (13,616 | ) | | | (17,794 | ) |
Corporate | | | (24,354 | ) | | | (15,854 | ) | | | (15,877 | ) |
| | | | 20,375 | | | | (2,606 | ) | | | (19,492 | ) |
Less equity in losses of affiliated companies | | | - | | | | 2,299 | | | | 1,357 | |
Total operating profit (loss) | | | 20,375 | | | | (307 | ) | | | (18,135 | ) |
Equity in losses from affiliated companies | | | - | | | | (2,299 | ) | | | (1,357 | ) |
Other (expense) income, net | | | (245 | ) | | | (540 | ) | | | 81 | |
Income (loss) before income taxes | | $ | 20,130 | | | $ | (3,146 | ) | | $ | (19,411 | ) |
54
|
| CDI Corp. and Subsidiaries |
| Notes to Consolidated Financial Statements |
| |
| (In thousands, except per share amounts, unless otherwise indicated) |
Inter-segment activity is not significant. Therefore, revenues reported for each reporting segment are substantially all from external clients. Total depreciation and amortization by reporting segment is presented in the table below:
| | | 0,000,000 | | | | 0,000,000 | | | | 0,000,000 | |
| | | 2011 | | | 2010 | | | 2009 | |
Depreciation and amortization: | | | | | | | | | | | | |
ES | | $ | 6,028 | | | $ | 5,351 | | | $ | 5,489 | |
ITS | | | 721 | | | | 737 | | | | 658 | |
MRI | | | 400 | | | | 443 | | | | 431 | |
Anders | | | 673 | | | | 744 | | | | 956 | |
Corporate | | | 3,186 | | | | 3,382 | | | | 3,673 | |
Total depreciation and amortization | | $ | 11,008 | | | $ | 10,657 | | | $ | 11,207 | |
Reporting segment asset data is presented in the table below:
| | | | | | | | | | | | |
| | | 2011 | | | 2010 | | | 2009 | |
Assets: | | | | | | | | | | | | |
ES(1),(2) | | $ | 189,595 | | | $ | 177,009 | | | $ | 127,213 | |
ITS | | | 79,229 | | | | 98,364 | | | | 71,230 | |
MRI | | | 29,344 | | | | 26,698 | | | | 26,495 | |
Anders | | | 25,634 | | | | 24,581 | | | | 39,306 | |
Corporate | | | 66,894 | | | | 71,859 | | | | 110,790 | |
Total assets | | $ | 390,696 | | | $ | 398,511 | | | $ | 375,034 | |
| | (1) | ES assets in 2010 include $36.3 million and $9.2 million of assets related to the acquisitions of L.R. Kimball and DSPCon, respectively. |
| | (2) | ES assets in 2009 include $2.1 million of investments in joint ventures accounted for using the equity method. |
Capital expenditure data by reporting segment is presented in the table below:
| | | 00,000,000 | | | | 00,000,000 | | | | 00,000,000 | |
| | | 2011 | | | 2010 | | | 2009 | |
Purchases of property and equipment: | | | | | | | | | | | | |
ES(1) | | $ | 3,122 | | | $ | 8,361 | | | $ | 2,012 | |
ITS | | | 184 | | | | 515 | | | | 1,371 | |
MRI | | | 649 | | | | 312 | | | | 38 | |
Anders | | | 185 | | | | 135 | | | | 277 | |
Corporate | | | 1,518 | | | | 2,526 | | | | 2,288 | |
Total purchases of property and equipment | | $ | 5,658 | | | $ | 11,849 | | | $ | 5,986 | |
| | (1) | ES purchases of property and equipment in 2010 include $5,676 and $283 of property and equipment purchased in the acquisitions of L.R. Kimball and DSPCon, respectively. |
The Company is domiciled in the U.S. and its reporting segments (other than Anders) operate primarily in the U.S. and Canada. Revenue attributable to foreign countries is determined based on the client’s country of domicile. Revenues and fixed assets by geographic area for the years ended December 31, 2011, 2010 and 2009 are presented in the tables below:
| | | | | | | | | | | | |
| | | 2011 | | | 2010 | | | 2009 | |
Revenue: | | | | | | | | | | | | |
US | | $ | 889,671 | | | $ | 785,227 | | | $ | 693,758 | |
UK | | | 55,900 | | | | 62,467 | | | | 101,640 | |
Canada | | | 99,541 | | | | 68,753 | | | | 80,097 | |
Other | | | 14,691 | | | | 9,842 | | | | 9,455 | |
Total revenue | | $ | 1,059,803 | | | $ | 926,289 | | | $ | 884,950 | |
| | | |
| | | 2011 | | | 2010 | | | 2009 | |
Property and equipment, net: | | | | | | | | | | | | |
US | | $ | 23,335 | | | $ | 28,437 | | | $ | 26,051 | |
UK | | | 1,404 | | | | 1,946 | | | | 2,609 | |
Canada | | | 402 | | | | 402 | | | | 509 | |
Other | | | 154 | | | | 234 | | | | 389 | |
Total property and equipment, net | | $ | 25,295 | | | $ | 31,019 | | | $ | 29,558 | |
55
|
| CDI Corp. and Subsidiaries |
| Notes to Consolidated Financial Statements |
| |
| (In thousands, except per share amounts, unless otherwise indicated) |
Note 15 - Selected Quarterly Financial Information (Unaudited)
The following is a summary of quarterly financial information for fiscal 2011 and 2010:
| | | 000000000 | | | | 000000000 | | | | 000000000 | | | | 000000000 | | | | 000000000 | |
| | | Year Ended December 31, 2011 | |
| | | First
Quarter | | | Second
Quarter | | | Third
Quarter | | | Fourth
Quarter | | | Total | |
Revenue | | $ | 256,636 | | | $ | 262,739 | | | $ | 272,474 | | | $ | 267,954 | | | $ | 1,059,803 | |
Gross profit | | | 54,330 | | | | 56,960 | | | | 57,742 | | | | 56,269 | | | | 225,301 | |
Operating and administrative expenses(1) | | | 51,577 | | | | 43,256 | | | | 53,321 | | | | 48,672 | | | | 196,826 | |
Restructuring and other related costs | | | - | | | | - | | | | - | | | | 8,100 | | | | 8,100 | |
Operating profit (loss) | | | 2,753 | | | | 13,704 | | | | 4,421 | | | | (503 | ) | | | 20,375 | |
Income (loss) before income taxes | | | 2,710 | | | | 13,588 | | | | 4,358 | | | | (526 | ) | | | 20,130 | |
Net income (loss) | | | 740 | | | | 12,016 | | | | 2,862 | | | | (618 | ) | | | 15,000 | |
Net income (loss) attributable to CDI | | | 694 | | | | 11,982 | | | | 2,814 | | | | (657 | ) | | | 14,833 | |
Earnings (loss) per common share: | | | | | | | | | | | | | | | | | | | | |
Basic | | $ | 0.04 | | | $ | 0.62 | | | $ | 0.15 | | | $ | (0.03 | ) | | $ | 0.77 | |
Diluted | | $ | 0.04 | | | $ | 0.62 | | | $ | 0.15 | | | $ | (0.03 | ) | | $ | 0.77 | |
| | (1) | Second quarter Operating and administrative expenses includes a $9.7 million benefit related to the final settlement of the OFT matter. |
| | | | | | | | | | | | | | | | | | | | |
| | | Year Ended December 31, 2010 | |
| | | First
Quarter | | | Second
Quarter | | | Third
Quarter | | | Fourth
Quarter | | | Total | |
Revenue | | $ | 209,940 | | | $ | 218,982 | | | $ | 249,355 | | | $ | 248,012 | | | $ | 926,289 | |
Gross profit | | | 41,507 | | | | 44,703 | | | | 55,338 | | | | 52,415 | | | | 193,963 | |
Goodwill impairment(1) | | | - | | | | - | | | | - | | | | 8,312 | | | | 8,312 | |
Operating and administrative expenses(2) | | | 40,892 | | | | 41,135 | | | | 50,400 | | | | 53,531 | | | | 185,958 | |
Operating profit (loss) | | | 615 | | | | 3,568 | | | | 4,938 | | | | (9,428 | ) | | | (307 | ) |
Equity in losses from affiliated companies(3) | | | (351 | ) | | | (417 | ) | | | (312 | ) | | | (1,219 | ) | | | (2,299 | ) |
Income (loss) before income taxes | | | 316 | | | | 3,021 | | | | 4,184 | | | | (10,667 | ) | | | (3,146 | ) |
Net income (loss)(4) | | | (184 | ) | | | 2,598 | | | | 1,711 | | | | (14,939 | ) | | | (10,814 | ) |
Net income (loss) attributable to CDI | | | (191 | ) | | | 2,590 | | | | 1,679 | | | | (14,936 | ) | | | (10,858 | ) |
Earnings (loss) per common share: | | | | | | | | | | | | | | | | | | | | |
Basic | | $ | (0.01 | ) | | $ | 0.14 | | | $ | 0.09 | | | $ | (0.78 | ) | | $ | (0.57 | ) |
Diluted | | $ | (0.01 | ) | | $ | 0.13 | | | $ | 0.09 | | | $ | (0.78 | ) | | $ | (0.57 | ) |
| | (1) | Fourth quarter goodwill impairment is an $8.3 million charge related to a goodwill write-down in the Company’s Anders segment. |
| | (2) | Second quarter operating and administrative expenses includes a $1.8 million benefit related to the final settlement of the DOJ matter. |
| | (3) | Fourth quarter equity in losses of affiliated companies includes a $1.0 million charge related to an impairment reserve associated with the Company’s investment in one of its joint ventures, CDI Gulf International. |
| | (4) | Fourth quarter net earnings (loss) includes a $2.8 million valuation allowance against the Company’s net deferred tax assets to fully reserve previously recorded tax benefits generated in the UK. |
56
| | |
| Item 9. | | Changes in and Disagreements with Accountants on Accounting and Financial Disclosure |
None.
| | |
| Item 9A. | | Controls and Procedures |
| (a) | Evaluation of Disclosure Controls and Procedures |
The management of the Company, under the supervision and with the participation of the Company’s Chief Executive Officer and Chief Financial Officer, has evaluated the effectiveness of the Company’s disclosure controls and procedures (as such term is defined in Rules 13a-15(e) and 15d-15(e) under the Securities Exchange Act of 1934, as amended (the “Exchange Act”)) as of December 31, 2011. Based on this evaluation, the Chief Executive Officer and Chief Financial Officer have concluded that the Company’s disclosure controls and procedures were effective as of that date to provide reasonable assurance that information required to be disclosed by the Company in reports that the information reported in this Form 10-K Report is (i) recorded, processed, summarized and reported within the time periods specified in the Securities and Exchange Commission rules and forms and (ii) accumulated and communicated to the Company’s management, including its principal executive officer and principal financial officer, as appropriate to allow timely decisions regarding required disclosure.
| (b) | Management’s Report on Internal Control over Financial Reporting |
Under Section 404 of the Sarbanes-Oxley Act of 2002, management is required to assess the effectiveness of the Company’s internal control over financial reporting as of the end of each fiscal year and report, based on that assessment, whether the Company’s internal control over financial reporting is effective.
The Company’s management is responsible for establishing and maintaining adequate internal control over financial reporting. The Company’s internal control over financial reporting is a process designed to provide reasonable assurance of the reliability of its financial reporting and of the preparation of its financial statements for external reporting purposes, in accordance with U.S. generally accepted accounting principles.
The Company’s internal control over financial reporting includes policies and procedures that (1) pertain to the maintenance of records that, in reasonable detail, accurately and fairly reflect transactions and disposition of assets; (2) provide reasonable assurance that transactions are recorded as necessary to permit preparation of financial statements in accordance with U.S. generally accepted accounting principles, and that receipts and expenditures are being made only in accordance with the authorization of its management and directors; and (3) provide reasonable assurance regarding the prevention or timely detection of unauthorized acquisition, use, or disposition of the Company’s assets that could have a material effect on its financial statements.
Because of its inherent limitations, internal control over financial reporting may not prevent or detect misstatements. Also, projections of any evaluation of the effectiveness to future periods are subject to the risk that controls may become inadequate because of changes in conditions, or that the degree of compliance with the policies and procedures included in such controls may deteriorate.
The Company’s management has assessed the effectiveness of the Company’s internal control over financial reporting as of December 31, 2011. In making this assessment, the Company used the criteria established by the Committee of Sponsoring Organizations of the Treadway Commission (COSO) in “Internal Control—Integrated Framework.” These criteria are in the areas of control environment, risk assessment, control activities, information and communication, and monitoring. The Company’s assessment included extensive documenting, evaluating and testing the design and operating effectiveness of its internal control over financial reporting.
Based on the Company’s processes and assessment, as described above, management has concluded that, as of December 31, 2011, the Company’s internal control over financial reporting was effective.
The Company’s independent registered public accounting firm, KPMG LLP, has audited and issued its report on effectiveness of the Company’s internal control over financial reporting as of December 31, 2011, which is included herein.
| (c) | Changes in Internal Control |
There were no changes in the Company’s internal control over financial reporting during the Company’s fourth quarter ended December 31, 2011, that have materially affected, or are reasonably likely to materially affect, the Company’s internal control over financial reporting.
57
| (d) | Report of Independent Registered Public Accounting Firm |
Report of Independent Registered Public Accounting Firm
The Board of Directors and Shareholders
CDI Corp.:
We have audited CDI Corp.’s internal control over financial reporting as of December 31, 2011, based on criteria established in Internal Control—Integrated Framework issued by the Committee of Sponsoring Organizations of the Treadway Commission (COSO). CDI Corp.’s management is responsible for maintaining effective internal control over financial reporting and for its assessment of the effectiveness of internal control over financial reporting, included in the accompanying Management’s Report on Internal Control over Financial Reporting. Our responsibility is to express an opinion on the Company’s internal control over financial reporting based on our audit.
We conducted our audit in accordance with the standards of the Public Company Accounting Oversight Board (United States). Those standards require that we plan and perform the audit to obtain reasonable assurance about whether effective internal control over financial reporting was maintained in all material respects. Our audit included obtaining an understanding of internal control over financial reporting, assessing the risk that a material weakness exists, and testing and evaluating the design and operating effectiveness of internal control based on the assessed risk. Our audit also included performing such other procedures as we considered necessary in the circumstances. We believe that our audit provides a reasonable basis for our opinion.
A company’s internal control over financial reporting is a process designed to provide reasonable assurance regarding the reliability of financial reporting and the preparation of financial statements for external purposes in accordance with generally accepted accounting principles. A company’s internal control over financial reporting includes those policies and procedures that (1) pertain to the maintenance of records that, in reasonable detail, accurately and fairly reflect the transactions and dispositions of the assets of the company; (2) provide reasonable assurance that transactions are recorded as necessary to permit preparation of financial statements in accordance with generally accepted accounting principles, and that receipts and expenditures of the company are being made only in accordance with authorizations of management and directors of the company; and (3) provide reasonable assurance regarding prevention or timely detection of unauthorized acquisition, use, or disposition of the company’s assets that could have a material effect on the financial statements.
Because of its inherent limitations, internal control over financial reporting may not prevent or detect misstatements. Also, projections of any evaluation of effectiveness to future periods are subject to the risk that controls may become inadequate because of changes in conditions, or that the degree of compliance with the policies or procedures may deteriorate.
In our opinion, CDI Corp. maintained, in all material respects, effective internal control over financial reporting as of December 31, 2011, based on criteria established in Internal Control—Integrated Framework issued by the Committee of Sponsoring Organizations of the Treadway Commission.
We also have audited, in accordance with the standards of the Public Company Accounting Oversight Board (United States), the consolidated balance sheets of CDI Corp. as of December 31, 2011 and 2010, and the related consolidated statements of operations, equity and comprehensive income (loss), and cash flows for each of the years in the three-year period ended December 31, 2011, and our report dated March 6, 2012 expressed an unqualified opinion on those consolidated financial statements.
/s/ KPMG LLP
Philadelphia, Pennsylvania
March 6, 2012
| | |
| Item 9B. | | Other Information |
None.
58
| | |
| Item 10. | | Directors, Executive Officers and Corporate Governance |
Information related to directors, executive officers and corporate governance is omitted herein as the required information will be included in a definitive proxy statement to be filed with the Securities and Exchange Commission pursuant to Regulation 14A no later than 120 days after the close of the Company’s fiscal year.
The Company has adopted a Code of Conduct that applies to all of the Company’s employees, including its principal executive officer, principal financial officer, principal accounting officer or controller, or persons performing similar functions. This Code of Conduct is available on the Company’s website atwww.cdicorp.com, or may be obtained free of charge by making a written request addressed to the Company’s Vice President of Investor Relations. The Company will disclose on its website amendments to, and, if any are granted, waivers of, its Code of Conduct for its principal executive officer, principal financial officer, or principal accounting officer or controller.
| | |
| Item 11. | | Executive Compensation |
Information related to executive compensation is omitted herein as the required information will be included in a definitive proxy statement to be filed with the Securities and Exchange Commission pursuant to Regulation 14A no later than 120 days after the close of the Company’s fiscal year.
| | |
| Item 12. | | Security Ownership of Certain Beneficial Owners and Management and Related Stockholder Matters |
Information related to security ownership of certain beneficial owners and management is omitted herein as the required information will be included in a definitive proxy statement to be filed with the Securities and Exchange Commission pursuant to Regulation 14A no later than 120 days after the close of the Company’s fiscal year.
Equity Compensation Plan Information
The following table provides information as of December 31, 2011 regarding shares of the Company’s common stock that may be issued under the CDI Corp. 2004 Omnibus Stock Plan, as amended (“the Omnibus Plan”). It also includes information related to the CDI Corp. Stock Purchase Plan for Management Employees and Non-Employee Directors, as amended (“the Stock Purchase Plan”). Both of these equity compensation plans have been approved by the Company’s shareholders. See Note 7—Stock-Based Compensation, in the notes to the consolidated financial statements included in Item 8 of the Form 10-K Report, for further information related to these equity compensation plans.
| | | | | | | | | | | | |
| | | Number of securities
to be issued upon
exercise of
outstanding options,
warrants and rights | | | Weighted average
exercise price of
outstanding options,
warrants and rights | | | Number of securities
remaining available
for future issuance
under equity
compensation plans
(excluding securities
reflected in column A) | |
| (in thousands, except per share amounts) | | A | | | B | | | C | |
Equity compensation plans approved by security holders (a) | | | 681 | | | $ | 10.81(b | ) | | | 1,735 | |
Equity compensation plans not approved by security holders | | | - | | | | - | | | | - | |
Total | | | 681 | | | $ | 10.81 | | | | 1,735 | |
| (a) | The number of securities in column A includes 75 thousand units awarded to participants in the Stock Purchase Plan. Upon vesting, participants in the plans are entitled to receive an equal number of shares of CDI common stock. |
At December 31, 2011, 86 thousand shares would have been issuable to participants upon exercise of Stock Appreciation Rights (“SARs”) under the Omnibus Plan. Holders of SARs can, upon vesting, receive shares of CDI common stock having a value equal to any appreciation in the market price of the stock on the date of exercise over the market price on the date of grant. Based on the market price of CDI common stock on December 31, 2011 of $13.81, the market price exceeded the exercise price for 398 thousand of the 857 thousand SARs granted under the Omnibus Plan. The weighted-average appreciation of these SARs was $3.00.
At December 31, 2011, 416 thousand shares of Time-Vested Deferred Stock (“TVDS”) were outstanding and held by various employees and directors. For most employees, the shares of TVDS vest 20% per year on the first five anniversaries of the date of grant, and TVDS will generally be forfeited prior to vesting if the holder’s employment with the Company ends prior to the applicable vesting date. For directors, the shares of TVDS vest on the third anniversary of the date of grant.
At December 31, 2011, 104 thousand shares of Performance-Contingent Deferred Stock (“PCDS”) were outstanding under the Omnibus Plan, 50% of which will vest
59
in 2012 and 50% of which will vest in 2013 if the applicable performance goals are met. This number includes an estimated number of PCDS based on the Company’s December 31, 2011 stock price of $13.81 for a fixed-dollar PCDS grant. The actual number of shares of the Company’s common stock that would be issued for the fixed-dollar PCDS upon vesting will be based on the Company’s stock price on the date of vesting.
| (b) | The weighted-average exercise price relates to outstanding SARs. Not included in the calculation of the weighted-average exercise price were shares of CDI common stock issuable under the Stock Purchase Plan, shares of TVDS and shares of PCDS. |
| | |
| Item 13. | | Certain Relationships and Related Transactions, and Director Independence |
Information related to certain relationships and related transactions and director independence is omitted herein as the required information will be included in a definitive proxy statement to be filed with the Securities and Exchange Commission pursuant to Regulation 14A no later than 120 days after the close of the Company’s fiscal year.
| | |
| Item 14. | | Principal Accounting Fees and Services |
Information related to principal accounting fees and services is omitted herein as the required information will be included in a definitive proxy statement to be filed with the Securities and Exchange Commission pursuant to Regulation 14A no later than 120 days after the close of the Company’s fiscal year.
60
| (a) | Documents filed as part of this report: |
Financial statements:
The consolidated balance sheets of the Registrant as of December 31, 2011 and 2010, the related consolidated statements of operations, equity and comprehensive income (loss), and cash flows for each of the years ended December 31, 2011, 2010 and 2009, the footnotes thereto, and the reports of KPMG LLP, independent registered public accounting firm, are filed herewith.
| | | | | | | | | | | | |
| | | | | Incorporated by Reference | | |
Exhibit
No. | | Exhibit Description | | Form | | SEC File No. | | Exhibit | | Filing
Date | | Filed
Herewith |
| 3.1 | | Articles of Incorporation of the Registrant, as amended effective December 12, 2007 | | 10-K | | 001-05519 | | 3.1 | | 03/07/08 | | |
| 3.2 | | Bylaws of the Registrant, as amended effective December 11, 2007 | | 10-K | | 001-05519 | | 3.2 | | 03/07/08 | | |
| 10.1 | | Credit Agreement dated October 29, 2010 among JPMorgan Chase Bank, N.A. and the Registrant (along with certain of its subsidiaries) | | 8-K | | 001-05519 | | 10.1 | | 11/04/10 | | |
| 10.2 | | First Amendment to Credit Agreement dated October 28, 2011 among JPMorgan Chase Bank, N.A. and the Registrant (along with certain of its subsidiaries) | | | | | | | | | | X |
| 10.3 | | Second Amendment to Credit Agreement dated November 30, 2011 among JPMorgan Chase Bank, N.A. and the Registrant (along with certain of its subsidiaries) | | | | | | | | | | X |
| 10.4 | | Technical Services Agreement dated as of July 1, 2005 between CDI Corporation and International Business Machines Corporation | | 10-Q | | 001-05519 | | 10.c. | | 11/08/05 | | |
| 10.5 | | Technical Services Statement of Work between CDI Corporation and International Business Machines Corporation effective as of June 28, 2008 relating to the “Core” businesses | | 10-Q | | 001-05519 | | 10.2 | | 08/08/08 | | |
| 10.6 | | Predominant Supplier Attachment to the Technical Services Statement of Work between CDI Corporation and International Business Machines Corporation effective as of July 1, 2008 for the Integrated Technology Delivery business | | 10-Q | | 001-05519 | | 10.3 | | 08/08/08 | | |
| 10.7 | | Amendment to Technical Services Statement of Work between CDI Corporation and International Business Machines Corporation dated June 3, 2011 | | 8-K | | 001-05519 | | 10.1 | | 06/20/11 | | |
| 10.8 | | Amendment to Technical Services Statement of Work between CDI Corporation and International Business Machines Corporation dated September 19, 2011 | | 10-Q | | 001-05519 | | 10.1 | | 11/04/11 | | |
| 10.9 | | Master Statement of Work between CDI Corporation and International Business Machines Corporation effective as of December 31, 2011 | | 8-K | | 001-05519 | | 10.1 | | 12/22/11 | | |
| 10.10* | | CDI Corp. 2004 Omnibus Stock Plan, as adopted in 2004 | | Def. Proxy Stmt. (14A) | | 001-05519 | | Appendix B | | 04/21/04 | | |
| 10.11* | | First Amendment to CDI Corp. 2004 Omnibus Stock Plan, effective as of December 31, 2008 | | 10-K | | 001-05519 | | 10.8 | | 03/11/09 | | |
| 10.12* | | CDI Corp. Stock Purchase Plan for Management Employees and Non-Employee Directors, as amended and restated effective in 2004 | | Def. Proxy Stmt. (14A) | | 001-05519 | | Appendix C | | 04/21/04 | | |
| 10.13* | | Amendment to the CDI Corp. Stock Purchase Plan for Management Employees and Non-Employee Directors, effective as of December 31, 2008 | | 10-K | | 001-05519 | | 10.3 | | 03/11/09 | | |
61
| | | | | | | | | | | | |
| | | | | Incorporated by Reference | | |
Exhibit
No. | | Exhibit Description | | Form | | SEC File No. | | Exhibit | | Filing
Date | | Filed
Herewith |
| 10.14* | | CDI Corp. Stock Purchase Plan for Management Employees and Non-Employee Directors, as amended and restated effective May 17, 2011 | | 10-Q | | 001-05519 | | 10.3 | | 08/05/11 | | |
| 10.15* | | CDI Corporation Deferred Compensation Plan | | 10-K | | 001-05519 | | 10.e | | 03/31/05 | | |
| 10.16* | | Executive Severance Program applicable to executive officers of the Registrant | | 10-K | | 001-05519 | | 10.12 | | 03/11/09 | | |
| 10.17* | | Executive Stock Purchase Opportunity Program approved by the Board of Directors of the Registrant on March 9, 2006 | | 8-K | | 001-05519 | | 10.1 | | 03/15/06 | | |
| 10.18* | | Employment Agreement, dated as of January 1, 2008 and entered into on December 21, 2007, between Registrant and Roger H. Ballou | | 8-K | | 001-05519 | | 10.1 | | 12/28/07 | | |
| 10.19* | | Amendment to Employment Agreement between Roger H. Ballou and the Registrant, effective as of April 1, 2008 | | 10-Q | | 001-05519 | | 10.2 | | 05/09/08 | | |
| 10.20* | | Offer letter dated August 26, 2005 and Employment Agreement dated September 6, 2005 between CDI Corporation and Mark A. Kerschner | | 10-Q | | 001-05519 | | 10.b | | 11/08/05 | | |
| 10.21* | | Non-Competition Agreement and Release and Waiver of Claims dated October 28, 2011 between Mark A. Kerschner and the Registrant | | | | | | | | | | X |
| 10.22* | | Form of Stock Appreciation Rights Agreement | | 8-K | | 001-05519 | | 10.1 | | 06/06/05 | | |
| 10.23* | | Form of Stock Appreciation Rights Agreement | | 8-K | | 001-05519 | | 10.1 | | 06/30/06 | | |
| 10.24* | | Form of Time-Vested Stock Agreement | | 8-K | | 001-05519 | | 10.2 | | 06/30/06 | | |
| 10.25* | | Summary of Terms of Stock Appreciation Rights and Deferred Stock awarded to Joseph R. Seiders and Cecilia J. Venglarik on February 15, 2005 | | 10-Q | | 001-05519 | | 10.b | | 05/10/05 | | |
| 10.26* | | Changes to the Directors’ Compensation Arrangements, approved by the Board of Directors on June 11, 2007 and effective on July 18, 2007 | | 10-Q | | 001-05519 | | 10 | | 08/03/07 | | |
| 10.27* | | Form of Director’s Time-Vested Deferred Stock Award | | 10-Q | | 001-05519 | | 10.a | | 11/07/07 | | |
| 10.28* | | Supplemental Pension Agreement dated April 11, 1978 between CDI Corporation and Walter R. Garrison | | 10-K | | 001-05519 | | 10.3 | | 03/11/09 | | |
| 10.29* | | Form of 2009 Performance-Contingent Deferred Stock Agreement for executive officers of the Registrant | | 10-Q | | 001-05519 | | 10.2 | | 05/08/09 | | |
| 10.30* | | Amendment to Employment Agreement between CDI Corp. and Roger H. Ballou signed on May 13, 2009 | | 10-Q | | 001-05519 | | 10.1 | | 08/06/09 | | |
| 10.31* | | Employment Agreement between CDI Corporation and Brian D. Short effective March 16, 2009, and offer letter dated February 11, 2009 from CDI Corporation to Brian D. Short | | 10-Q | | 001-05519 | | 10.2 | | 08/06/09 | | |
| 10.32* | | Policy on Cash Bonus Awards and Equity Awards “Clawback” | | 10-K | | 001-05519 | | 10.37 | | 03/02/10 | | |
| 10.33* | | Third Amendment to Employment Agreement between Roger H. Ballou and the Registrant, effective as of February 25, 2010 | | 10-Q | | 001-05519 | | 10.1 | | 05/06/10 | | |
| 10.34* | | Form of Stock Appreciation Rights Agreement for 2010 grants | | 10-Q | | 001-05519 | | 10.1 | | 11/05/10 | | |
| 10.35* | | Form of Time-Vested Deferred Stock Agreement for 2010 awards | | 10-Q | | 001-05519 | | 10.2 | | 11/05/10 | | |
| 10.36* | | Form of Performance-Contingent Deferred Stock Agreement for 2010 awards | | 10-Q | | 001-05519 | | 10.3 | | 11/05/10 | | |
| 10.37* | | 2010 Executive Incentive Program Overview (distributed to executives in August 2010) | | 10-Q | | 001-05519 | | 10.4 | | 11/05/10 | | |
| 10.38* | | Employment Agreement dated January 10, 2011 between the Registrant and Paulett Eberhart | | 8-K | | 001-05519 | | 10.1 | | 01/14/11 | | |
62
| | | | | | | | | | | | |
| | | | | Incorporated by Reference | | |
Exhibit
No. | | Exhibit Description | | Form | | SEC File No. | | Exhibit | | Filing
Date | | Filed
Herewith |
| 10.39* | | 2011 CEO Cash Bonus Plan | | Def. Proxy Stmt. (14A) | | 001-05519 | | Appendix A | | 04/19/11 | | |
| 10.40* | | Agreement dated January 10, 2011 between the Registrant and Roger H. Ballou | | 8-K | | 001-05519 | | 10.2 | | 01/14/11 | | |
| 10.41* | | Non-Competition Agreement and Release and Waiver of Claims dated July 1, 2011 between Joseph R. Seiders and the Registrant | | 10-Q | | 001-05519 | | 10.2 | | 11/04/11 | | |
| 10.42* | | Employment and Consulting Agreement dated as of February 15, 2009 between CDI Corporation and Robert J. Giorgio, and Amendment to Employment Agreement between CDI Corporation and Robert J. Giorgio effective as of December 16, 2010 | | 10-Q | | 001-05519 | | 10.1 | | 08/05/11 | | |
| 10.43* | | Offer letter dated May 18, 2011 and Employment Agreement dated May 31, 2011 between CDI Corporation and Philip L. Clark | | 10-Q | | 001-05519 | | 10.2 | | 08/05/11 | | |
| 10.44* | | Offer Letter dated August 15, 2011 from CDI Corporation to Robert M. Larney | | 8-K | | 001-05519 | | 10.1 | | 08/31/11 | | |
| 10.45* | | Employment Agreement effective August 30, 2011 between CDI Corporation and Robert M. Larney | | 8-K | | 001-05519 | | 10.2 | | 08/31/11 | | |
| 21 | | List of Subsidiaries of the Registrant | | | | | | | | | | X |
| 23 | | Consent of Independent Registered Public Accounting Firm | | | | | | | | | | X |
| 31.1 | | Certification of Chief Executive Officer Pursuant to Section 302 of the Sarbanes-Oxley Act of 2002 | | | | | | | | | | X |
| 31.2 | | Certification of Chief Financial Officer Pursuant to Section 302 of the Sarbanes-Oxley Act of 2002 | | | | | | | | | | X |
| 32 | | Certification of Chief Executive Officer and Chief Financial Officer Pursuant to 18 U.S.C. Section 1350, as Adopted Pursuant to Section 906 of the Sarbanes-Oxley Act of 2002 | | | | | | | | | | X |
| * | Constitutes a management contract or compensatory plan or arrangement. |
63
Pursuant to the requirements of Section 13 or 15(d) of the Securities Exchange Act of 1934, the Registrant has duly caused this report to be signed on its behalf by the undersigned, thereunto duly authorized.
| | |
| CDI Corp. |
| |
| By: /s/ | | Paulett Eberhart |
| | | Paulett Eberhart |
| | | President and Chief Executive Officer |
| | | Date: March 6, 2012 |
Pursuant to the requirements of the Securities Exchange Act of 1934, this report has been signed below by the following persons on behalf of the Registrant and in the capacities and on the dates indicated.
| | | | | | | | | | |
| By: /s/ | | Paulett Eberhart | | By: /s/ | | Michael J. Emmi | | By: /s/ | | Ronald J. Kozich |
| | | Paulett Eberhart | | | | Michael J. Emmi | | | | Ronald J. Kozich |
| | | President, Chief | | | | Director | | | | Director |
| | | Executive Officer and Director | | | | Date: March 6, 2012 | | | | Date: March 6, 2012 |
| | | (Principal Executive Officer) | | | | | | | | |
| | | Date: March 6, 2012 | | By: /s/ | | Walter R. Garrison | | By: /s/ | | Barton J. Winokur |
| | | | | | | Walter R. Garrison | | | | Barton J. Winokur |
| By: /s/ | | Robert M. Larney | | | | Director | | | | Director |
| | | Robert M. Larney | | | | Date: March 6, 2012 | | | | Date: March 6, 2012 |
| | | Executive Vice President | | | | | | | | |
| | | and Chief Financial Officer | | By: /s/ | | Lawrence C. Karlson | | By: /s/ | | Albert E. Smith |
| | | (Principal Financial and Accounting Officer) | | | | Lawrence C. Karlson Director | | | | Albert E. Smith Director |
| | | Date: March 6, 2012 | | | | Date: March 6, 2012 | | | | Date: March 6, 2012 |
| | | | | | | | | | | |
| | | | | |
| By: /s/ | | Anna M. Seal | | | | | | | | |
| | | Anna M. Seal | | | | | | | | |
| | | Director | | | | | | | | |
| | | Date: March 6, 2012 | | | | | | | | |
64