
Third Quarter 2022 Financial Results Call November 17, 2022 CONFIDENTIAL & PRIVATE

2 Safe Harbor Statement This presentation and the accompanying oral presentation includes forward-looking statements within the meaning of Section 27A of the Securities Act of 1933, as amended, Section 21E of the Securities Exchange Act of 1934, as amended, and the safe harbor provisions of the U.S. Private Securities Litigation Reform Act of 1995, that relate to our current expectations and views of future events. All statements other than statements of historical facts contained in this presentation, including statements regarding when jurisdictions in North America or elsewhere may launch online iGaming or sports betting and/or when affiliate marketing will be permitted in those states, how many M&A transactions we can execute in any given year, if any, the success of our new domains, repurchase of ordinary shares, our 2022 outlook, and future results of operations and financial position, whether we can sustain our organic growth and make accretive acquisitions, industry dynamics, business strategy and plans and our objectives for future operations, are forward-looking statements. These statements represent our opinions, expectations, beliefs, intentions, estimates or strategies regarding the future, which may not be realized. In some cases, you can identify forward-looking statements by terms such as “believe,” “may,” “estimate,” “continue,” “anticipate,” “intend,” “should,” “plan,” “expect,” “predict,” “potential,” “could,” “will,” “would,” “ongoing,” “future” or the negative of these terms or other similar expressions that are intended to identify forward-looking statements, although not all forward-looking statements contain these identifying words. Forward- looking statements are based largely on our current expectations and projections about future events and financial trends that we believe may affect our financial condition, results of operations, business strategy, short-term and long-term business operations and objectives and financial needs. These forward-looking statements involve known and unknown risks, uncertainties, contingencies, changes in circumstances that are difficult to predict and other important factors that may cause our actual results, performance or achievements to be materially and/or significantly different from any future results, performance or achievements expressed or implied by the forward-looking statement. Such risks uncertainties, contingencies, and changes in circumstances are discussed under “Item 3. Key Information - Risk Factors” in our annual report filed on Form 20-F for the year ended December 31, 2021 with the US Securities and Exchange Commission (the “SEC”) on March 25, 2022, and our other filings with the SEC as such factors may be updated from time to time. Moreover, we operate in a very competitive and rapidly changing environment. New risks emerge from time to time. It is not possible for our management to predict all risks, nor can we assess the impact of all factors on our business or the extent to which any factor, or combination of factors, may cause actual results to differ materially from those contained in any forward-looking statements we may make. In light of these risks, uncertainties and assumptions, the forward-looking events and circumstances discussed in this presentation may not occur and actual results could differ materially and adversely from those anticipated or implied in the forward-looking statements. We caution you therefore against relying on these forward-looking statements, and we qualify all of our forward-looking statements by these cautionary statements. The forward-looking statements included in this presentation are made only as of the date hereof. Although we believe that the expectations reflected in the forward-looking statements are reasonable, we cannot guarantee that the future results, levels of activity, performance or events and circumstances reflected in the forward-looking statements will be achieved or occur. Moreover, neither we nor our advisors nor any other person assumes responsibility for the accuracy and completeness of the forward-looking statements. Neither we nor our advisors undertake any obligation to revise, supplement or update any forward-looking statements for any reason after the date of this presentation to conform these statements to actual results or to changes in our expectations, even if new information becomes available in the future, except as may be required by law. You should read this presentation with the understanding that our actual future results, levels of activity, performance and events and circumstances may be materially different from what we expect. Unless otherwise indicated, information contained in this presentation concerning our industry, competitive position and the markets in which we operate is based on information from independent industry and research organizations, other third-party sources and management estimates. Management estimates are derived from publicly available information released by independent industry analysts and other third-party sources, as well as data from our internal research, and are based on assumptions made by us upon reviewing such data, and our experience in, and knowledge of, such industry and markets, which we believe to be reasonable. In addition, projections, assumptions and estimates of the future performance of the industry in which we operate and our future performance are necessarily subject to uncertainty and risk due to a variety of factors, including those described above. These and other factors could cause results to differ materially from those expressed in the estimates made by independent parties and by us. Industry publications, research, surveys and studies generally state that the information they contain has been obtained from sources believed to be reliable, but that the accuracy and completeness of such information is not guaranteed. Forecasts and other forward-looking information obtained from these sources are subject to the same qualifications and uncertainties as the other forward-looking statements in this presentation. The trademarks included herein are the property of the owners thereof and are used for reference purposes only. Non-IFRS Financial Measures - Management uses several financial measures, both IFRS and non-IFRS financial measures, in analyzing and assessing the overall performance of the business and for making operational decisions. Adjusted Operating Expense is a non-IFRS measure defined as operating expense excluding the fair value gain or loss related to contingent consideration. Adjusted Operating Profit is a non-IFRS financial measure defined as operating profit excluding the fair value gain or loss related to the contingent consideration. Adjusted Net Income is a non-IFRS financial measure defined as net income attributable to equity holders excluding the fair value gain or loss related to contingent consideration and unwinding of deferred consideration. Adjusted net income per diluted share is a non-IFRS financial measure defined as adjusted net income attributable to equity holders divided by the diluted weighted average number of common shares outstanding. EBITDA is a non-IFRS financial measure defined as earnings excluding interest, income tax charge, depreciation, and amortization. Adjusted EBITDA is a non-IFRS financial measure defined as EBITDA adjusted to exclude the effect of non-recurring items, significant non-cash items, share-based payment expense and other items that our board of directors believes do not reflect the underlying performance of the business. Adjusted EBITDA Margin is a non-IFRS measure defined as Adjusted EBITDA as a percentage of revenue. We believe EBITDA, Adjusted EBITDA and Adjusted EBITDA Margin are useful to our management team as a measure of comparative operating performance from period to period as those measures remove the effect of items not directly resulting from our core operations including effects that are generated by differences in capital structure, depreciation, tax effects and non-recurring events. While we use EBITDA, Adjusted EBITDA and Adjusted EBITDA Margin as tools to enhance our understanding of certain aspects of our financial performance, we do not believe that EBITDA, Adjusted EBITDA and Adjusted EBITDA Margin are substitutes for, or superior to, the information provided by IFRS results. As such, the presentation of EBITDA, Adjusted EBITDA and Adjusted EBITDA Margin is not intended to be considered in isolation or as a substitute for any measure prepared in accordance with IFRS. The primary limitations associated with the use of EBITDA, Adjusted EBITDA and Adjusted EBITDA Margin as compared to IFRS results are that EBITDA, Adjusted EBITDA and Adjusted EBITDA Margin as we define them may not be comparable to similarly titled measures used by other companies in our industry and that EBITDA, Adjusted EBITDA and Adjusted EBITDA Margin may exclude financial information that some investors may consider important in evaluating our performance. In regard to forward looking non-IFRS guidance, we are not able to reconcile the forward looking non-IFRS Adjusted EBITDA measure to the closest corresponding IFRS measure without unreasonable efforts because we are unable to predict the ultimate outcome of certain significant items including, but not limited to, fair value movements, share-based payments for future awards, acquisition-related expenses and certain financing and tax items. Free Cash Flow is a non-IFRS financial measure defined as cash flow from operating activities less capital expenditures, or CAPEX. We believe Free Cash Flow is useful to our management as a measure of financial performance as it measures our ability to generate additional cash from our operations. While we use Free Cash Flow as a tool to enhance our understanding of certain aspects of our financial performance, we do not believe that Free Cash Flow is a substitute for, or superior to, the information provided by IFRS metrics. As such, the presentation of Free Cash Flow is not intended to be considered in isolation or as a substitute for any measure prepared in accordance with IFRS. The primary limitation associated with the use of Free Cash Flow as compared to IFRS metrics is that Free Cash Flow does not represent residual cash flows available for discretionary expenditures due to the fact that the measure does not deduct the payments required for debt service and other obligations or payments made for business acquisitions. Free Cash Flow as we define it also may not be comparable to similarly titled measures used by other companies in the online gambling affiliate industry. For such non-IFRS information in this presentation, see the tables at the end of this presentation under “Appendix: Financial Tables” for reconciliations to the comparable IFRS numbers.

Q3 Quarter Highlights Q3 Financial Results YTD Financial Results 2022 Outlook Appendix AGENDA 3CONFIDENTIAL & PRIVATE 4 - 7 8 9 10 11 - 19

Third Quarter Highlights 4 • Total revenue grew 94% to $19.6 million • Adjusted EBITDA(1) of $6.4 million • Adjusted EBITDA Margin(1) of 33% • Free Cash Flow (1) of $4.9 million • New Depositing Customers increased 152% to more than 68,000 compared to 27,000 in Q3 2021 (1) Represents a non-IFRS financial measure. See ”Safe Harbor Statement - Non-IFRS Financial Measures” and the tables at the end of this presentation under “Appendix: Financial Tables” for reconciliations to the comparable IFRS numbers.
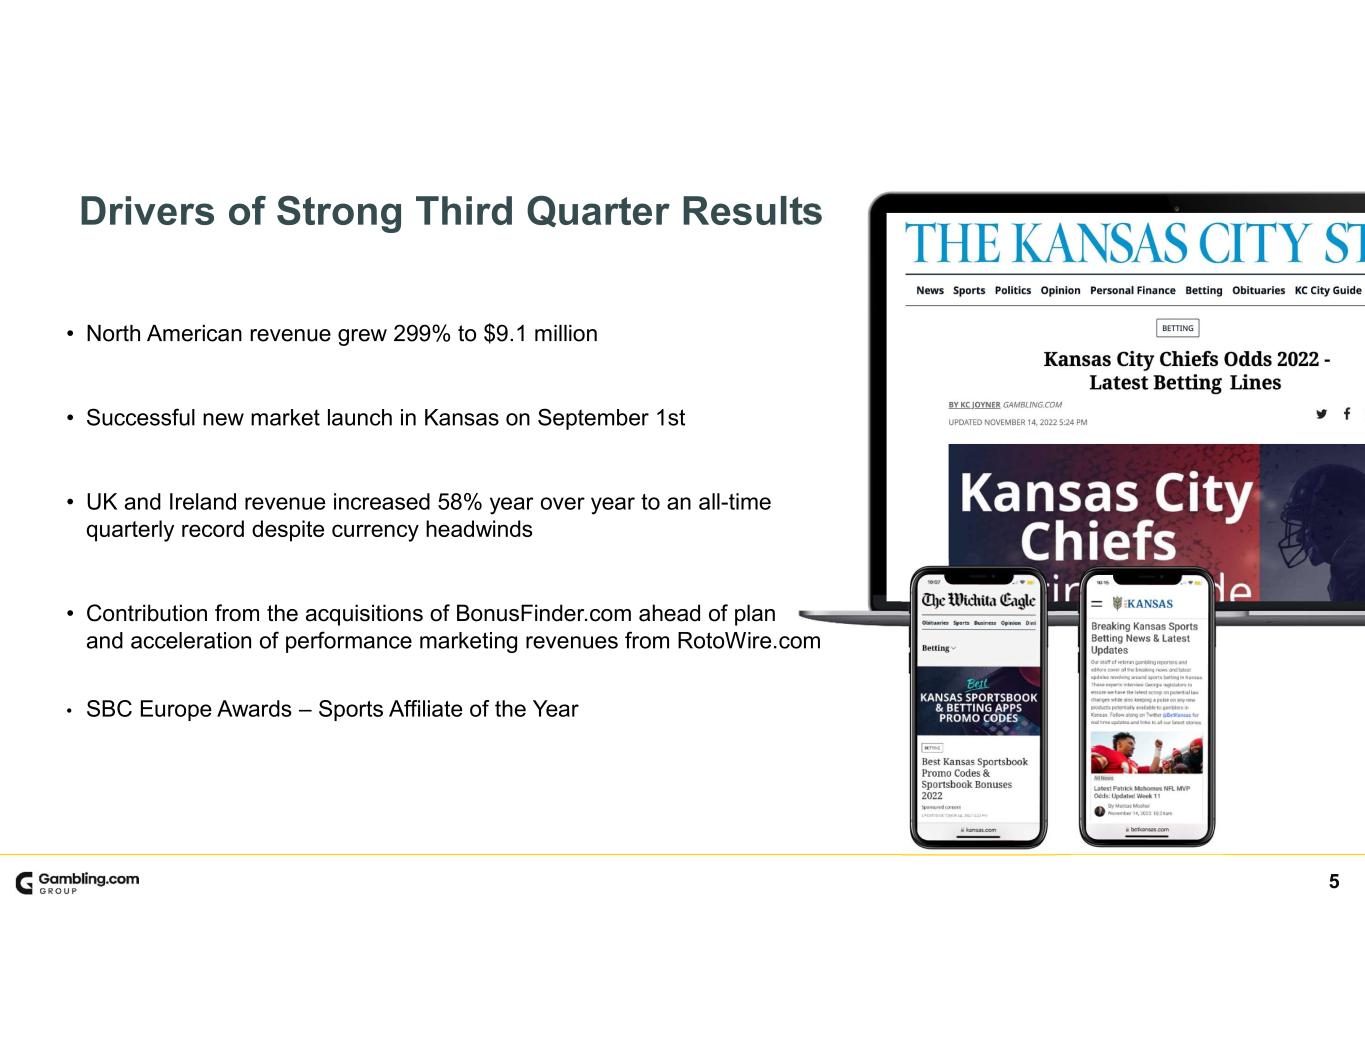
5 Drivers of Strong Third Quarter Results • North American revenue grew 299% to $9.1 million • Successful new market launch in Kansas on September 1st • UK and Ireland revenue increased 58% year over year to an all-time quarterly record despite currency headwinds • Contribution from the acquisitions of BonusFinder.com ahead of plan and acceleration of performance marketing revenues from RotoWire.com • SBC Europe Awards – Sports Affiliate of the Year

6 O T S U.S. State Specific International Brands Strategic U.S. Media Assets and Partnerships National U.S. Sites Diversified Portfolio of Premium Digital Media Assets
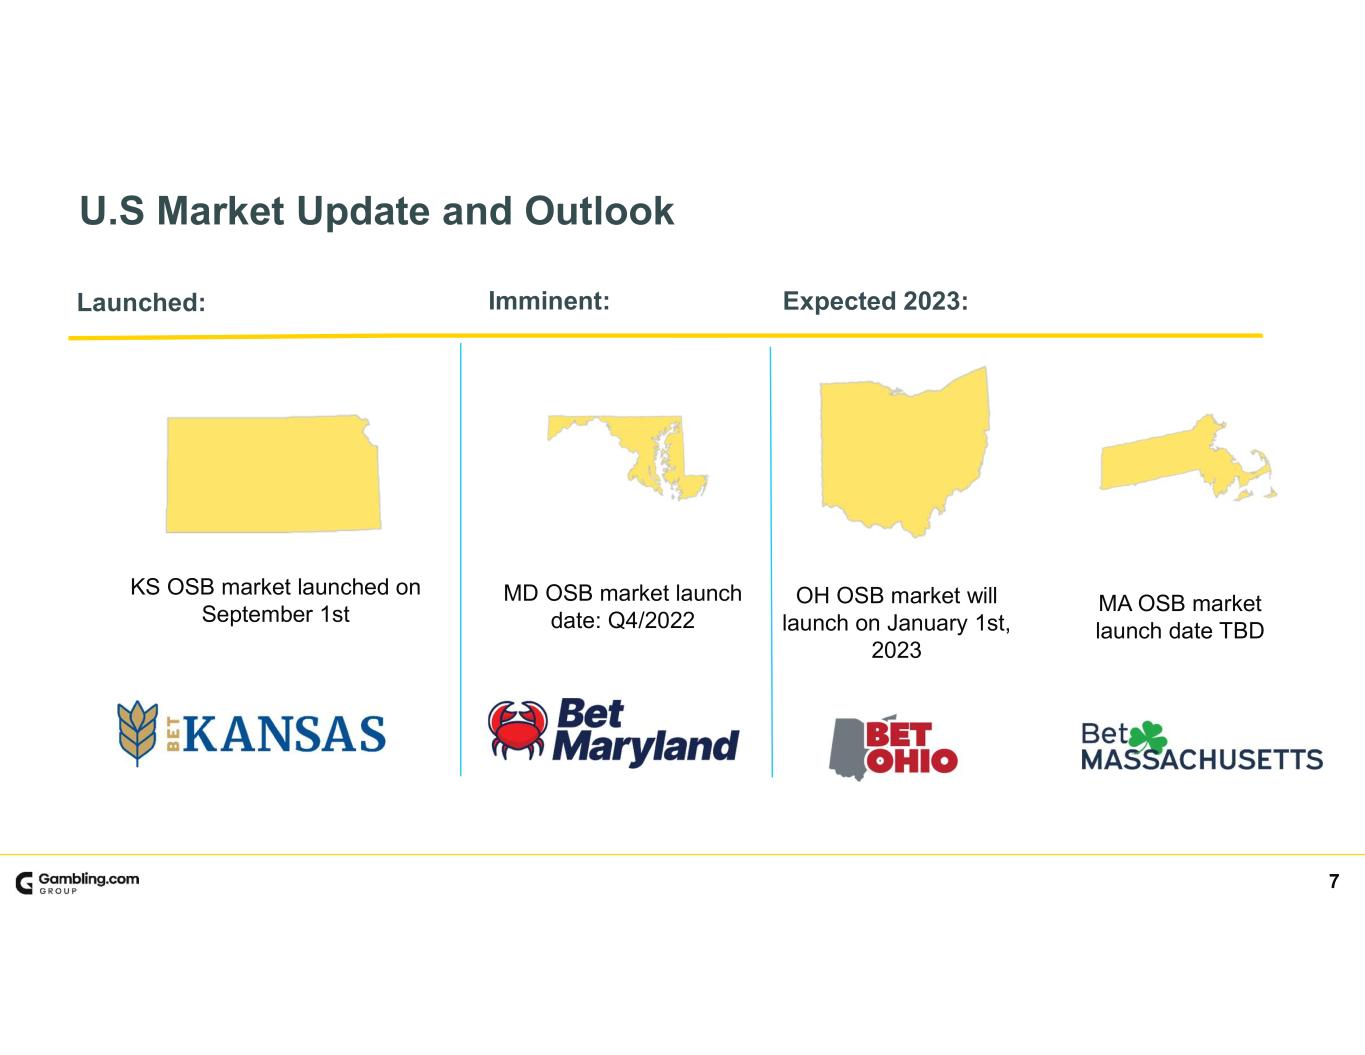
7 Expected 2023: U.S Market Update and Outlook OH OSB market will launch on January 1st, 2023 MD OSB market launch date: Q4/2022 KS OSB market launched on September 1st Launched: MA OSB market launch date TBD Imminent:

8 Q3 2022 Financial Results(1) (1) This table contains non-IFRS financial measures. See ”Safe Harbor Statement - Non-IFRS Financial Measures” and the tables at the end of this presentation under “Appendix: Financial Tables” for reconciliations to the comparable IFRS numbers. NM = not meaningful Q3 2022 Q3 2021 Change Revenue (millions) $19.6 $10.1 94% Cost of Sales $0.6 $— n/m Operating Expense (millions) $18.9 $7.7 145% Operating Profit (Loss) (millions) $0.16 $2.4 (94)% Net Income (millions) $2.3 $4.7 -52% Net Income per Diluted Share $0.06 $0.13 -52% Adjusted Operating Expense (millions) $15.2 $7.7 97% Adjusted Operating Profit $3.8 $2.4 60% Adjusted Net Income (millions) $6.0 $4.7 29% Adjusted Net Income per Diluted Share $0.16 $0.13 27% Adjusted EBITDA (millions) $6.4 $4.9 32% Adjusted EBITDA Margin (% of Revenue) 33% 48% (15)% Cash from Operations (millions) $5.6 $1.4 307% Capital Expenditures (millions) $0.7 $0.6 -16% Free Cash Flow (millions) $4.9 $0.8 549% New Depositing Customers (thousands) 68 27 152%
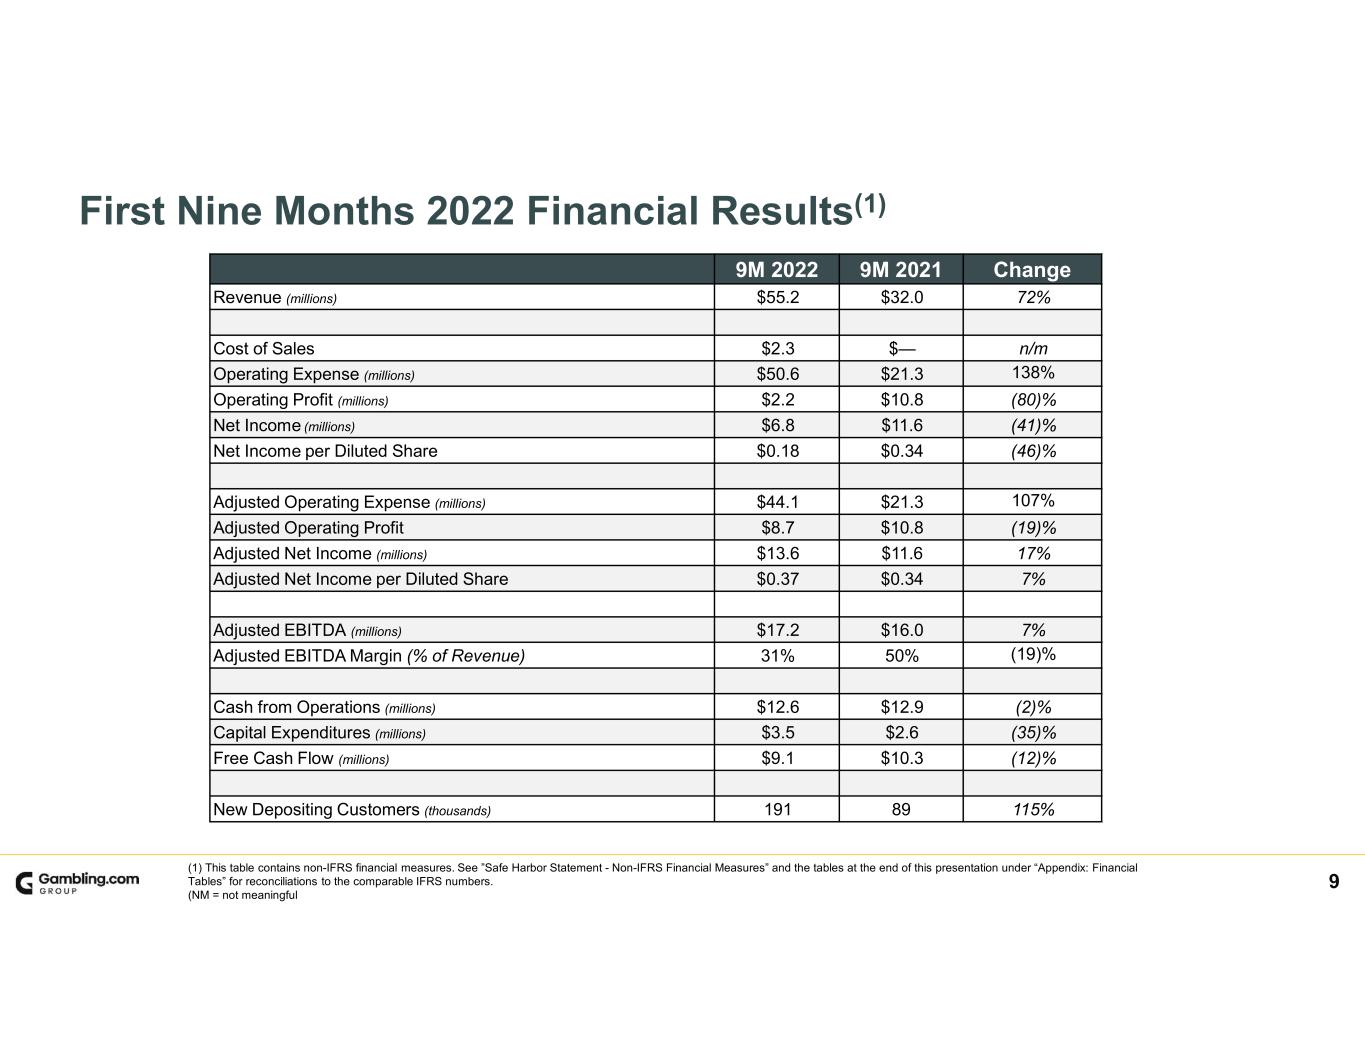
9 First Nine Months 2022 Financial Results(1) (1) This table contains non-IFRS financial measures. See ”Safe Harbor Statement - Non-IFRS Financial Measures” and the tables at the end of this presentation under “Appendix: Financial Tables” for reconciliations to the comparable IFRS numbers. (NM = not meaningful 9M 2022 9M 2021 Change Revenue (millions) $55.2 $32.0 72% Cost of Sales $2.3 $— n/m Operating Expense (millions) $50.6 $21.3 138% Operating Profit (millions) $2.2 $10.8 (80)% Net Income (millions) $6.8 $11.6 (41)% Net Income per Diluted Share $0.18 $0.34 (46)% Adjusted Operating Expense (millions) $44.1 $21.3 107% Adjusted Operating Profit $8.7 $10.8 (19)% Adjusted Net Income (millions) $13.6 $11.6 17% Adjusted Net Income per Diluted Share $0.37 $0.34 7% Adjusted EBITDA (millions) $17.2 $16.0 7% Adjusted EBITDA Margin (% of Revenue) 31% 50% (19)% Cash from Operations (millions) $12.6 $12.9 (2)% Capital Expenditures (millions) $3.5 $2.6 (35)% Free Cash Flow (millions) $9.1 $10.3 (12)% New Depositing Customers (thousands) 191 89 115%
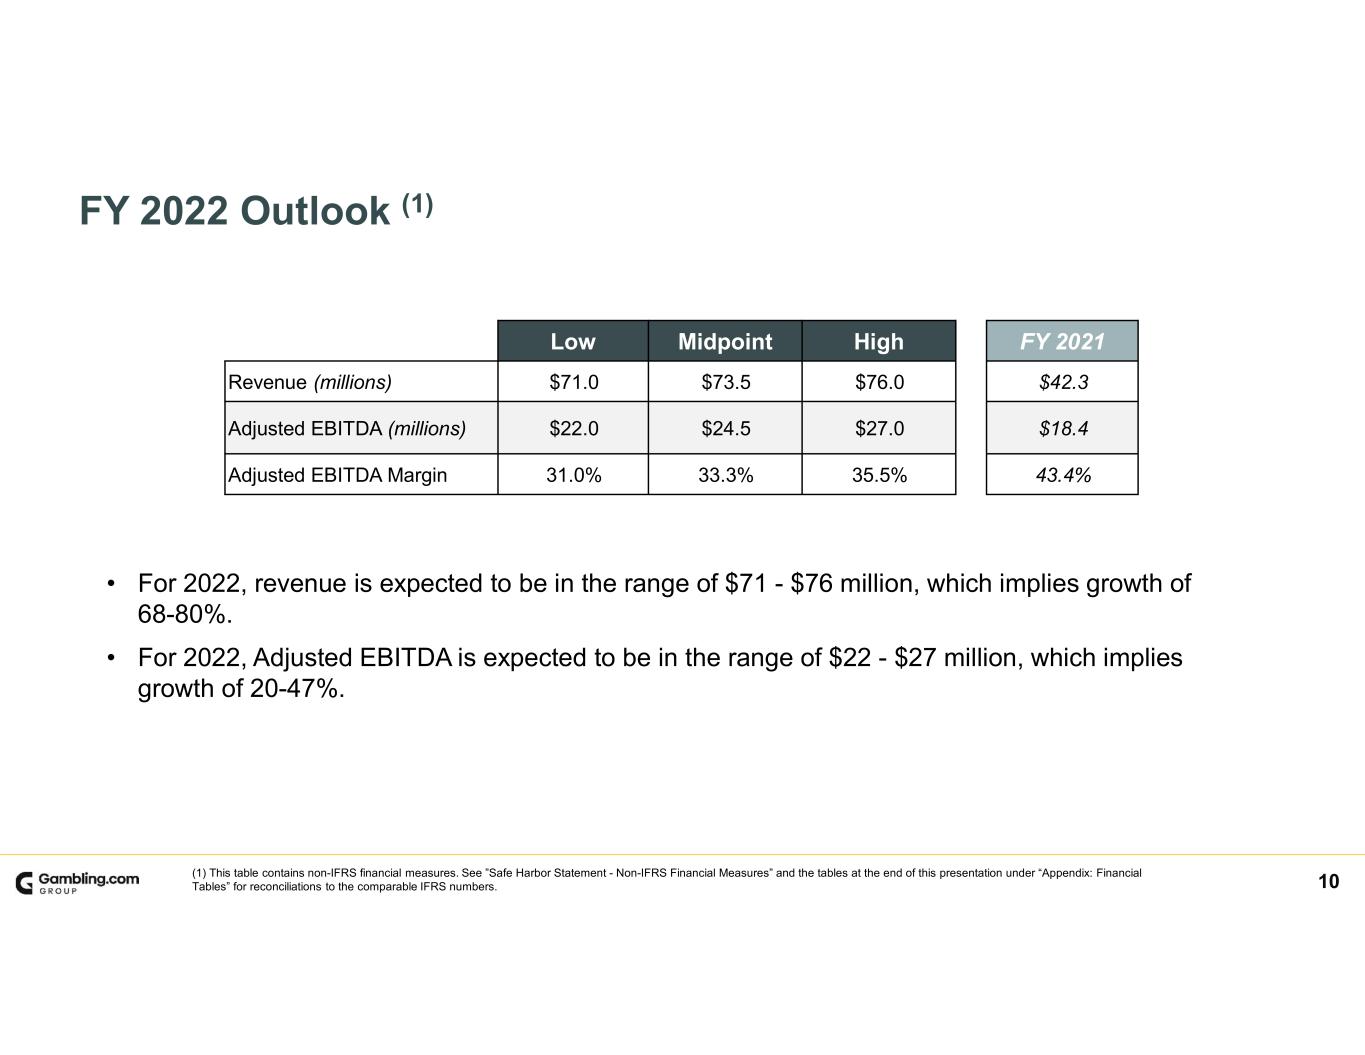
10 FY 2022 Outlook (1) • For 2022, revenue is expected to be in the range of $71 - $76 million, which implies growth of 68-80%. • For 2022, Adjusted EBITDA is expected to be in the range of $22 - $27 million, which implies growth of 20-47%. Low Midpoint High FY 2021 Revenue (millions) $71.0 $73.5 $76.0 $42.3 Adjusted EBITDA (millions) $22.0 $24.5 $27.0 $18.4 Adjusted EBITDA Margin 31.0% 33.3% 35.5% 43.4% (1) This table contains non-IFRS financial measures. See ”Safe Harbor Statement - Non-IFRS Financial Measures” and the tables at the end of this presentation under “Appendix: Financial Tables” for reconciliations to the comparable IFRS numbers.

11CONFIDENTIAL & PRIVATE Appendix: Financial Tables
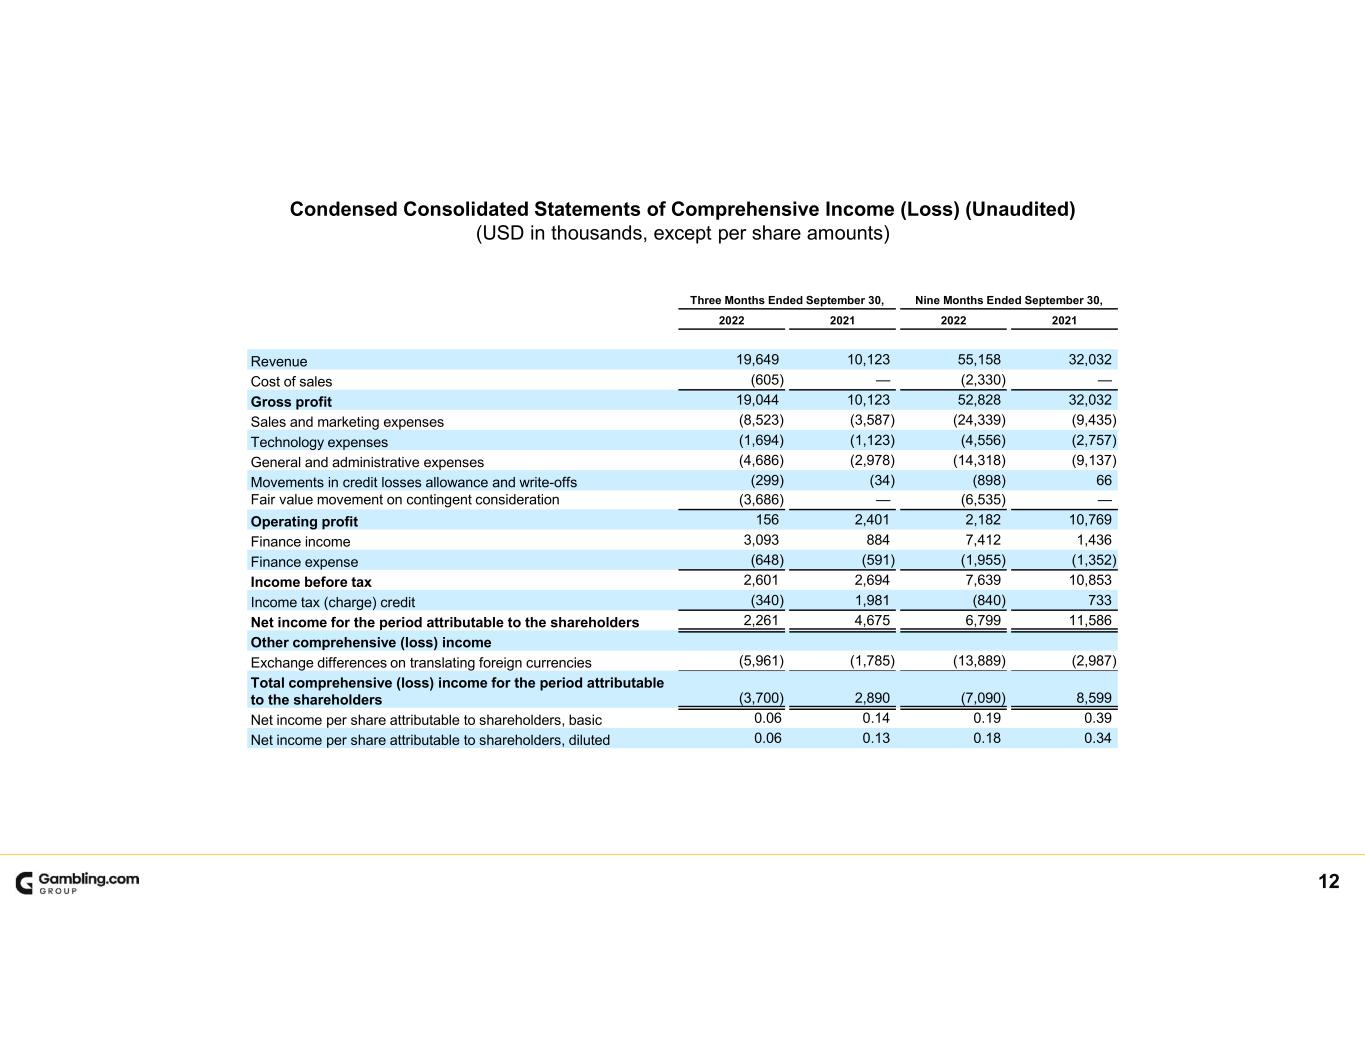
12 Condensed Consolidated Statements of Comprehensive Income (Loss) (Unaudited) (USD in thousands, except per share amounts) Three Months Ended September 30, Nine Months Ended September 30, 2022 2021 2022 2021 Revenue 19,649 10,123 55,158 32,032 Cost of sales (605) — (2,330) — Gross profit 19,044 10,123 52,828 32,032 Sales and marketing expenses (8,523) (3,587) (24,339) (9,435) Technology expenses (1,694) (1,123) (4,556) (2,757) General and administrative expenses (4,686) (2,978) (14,318) (9,137) Movements in credit losses allowance and write-offs (299) (34) (898) 66 Fair value movement on contingent consideration (3,686) — (6,535) — Operating profit 156 2,401 2,182 10,769 Finance income 3,093 884 7,412 1,436 Finance expense (648) (591) (1,955) (1,352) Income before tax 2,601 2,694 7,639 10,853 Income tax (charge) credit (340) 1,981 (840) 733 Net income for the period attributable to the shareholders 2,261 4,675 6,799 11,586 Other comprehensive (loss) income Exchange differences on translating foreign currencies (5,961) (1,785) (13,889) (2,987) Total comprehensive (loss) income for the period attributable to the shareholders (3,700) 2,890 (7,090) 8,599 Net income per share attributable to shareholders, basic 0.06 0.14 0.19 0.39 Net income per share attributable to shareholders, diluted 0.06 0.13 0.18 0.34
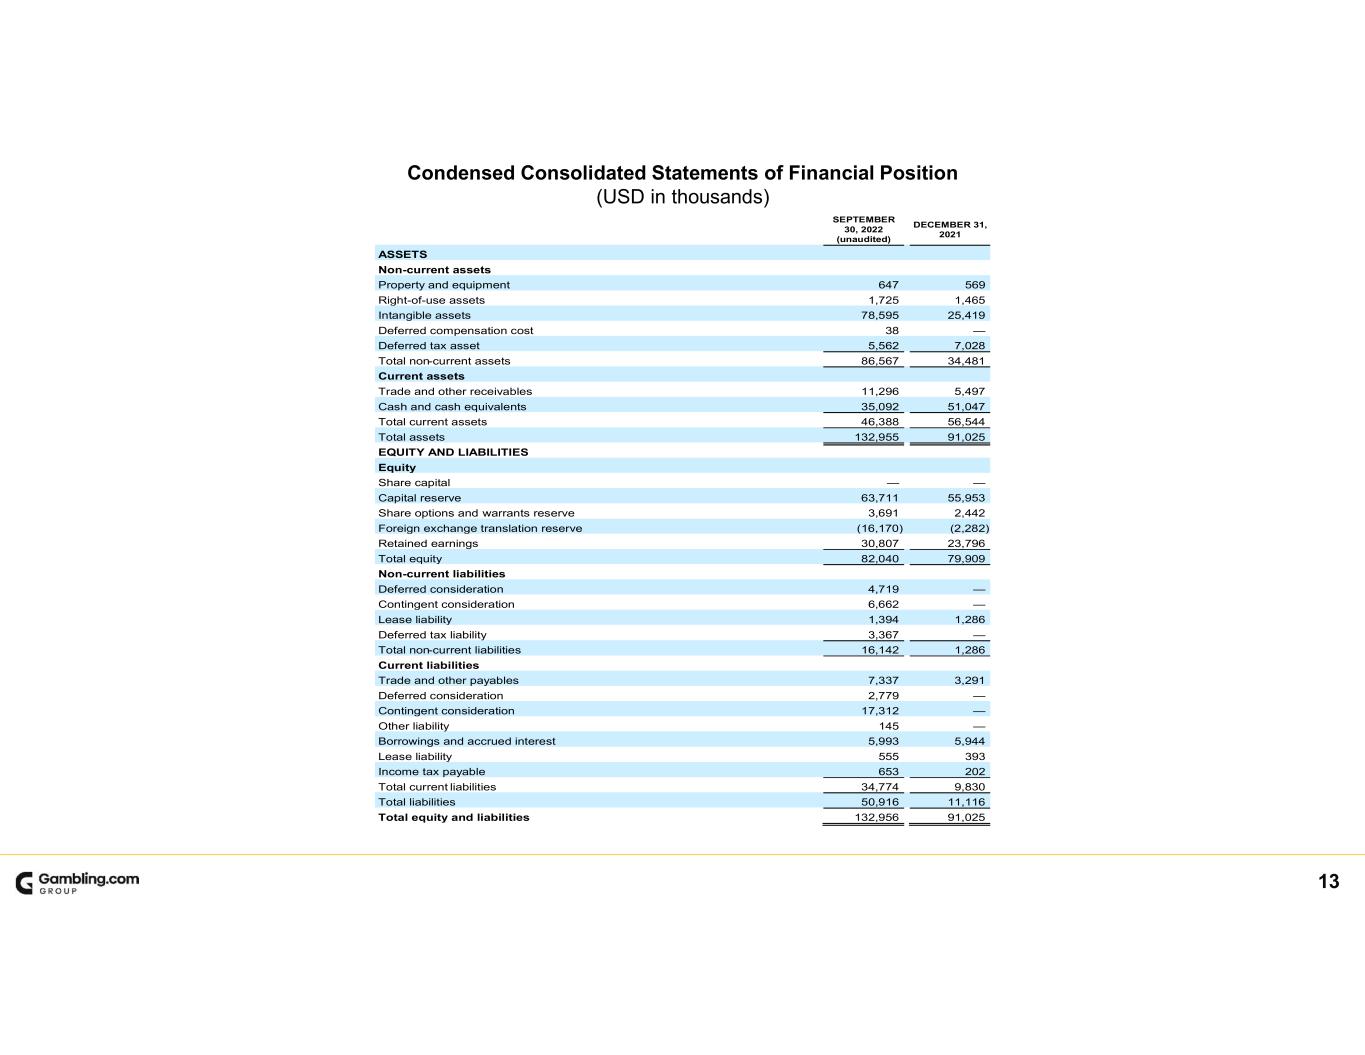
13 Condensed Consolidated Statements of Financial Position (USD in thousands) SEPTEMBER 30, 2022 (unaudited) DECEMBER 31, 2021 ASSETS Non-current assets Property and equipment 647 569 Right-of-use assets 1,725 1,465 Intangible assets 78,595 25,419 Deferred compensation cost 38 — Deferred tax asset 5,562 7,028 Total non-current assets 86,567 34,481 Current assets Trade and other receivables 11,296 5,497 Cash and cash equivalents 35,092 51,047 Total current assets 46,388 56,544 Total assets 132,955 91,025 EQUITY AND LIABILITIES Equity Share capital — — Capital reserve 63,711 55,953 Share options and warrants reserve 3,691 2,442 Foreign exchange translation reserve (16,170) (2,282) Retained earnings 30,807 23,796 Total equity 82,040 79,909 Non-current liabilities Deferred consideration 4,719 — Contingent consideration 6,662 — Lease liability 1,394 1,286 Deferred tax liability 3,367 — Total non-current liabilities 16,142 1,286 Current liabilities Trade and other payables 7,337 3,291 Deferred consideration 2,779 — Contingent consideration 17,312 — Other liability 145 — Borrowings and accrued interest 5,993 5,944 Lease liability 555 393 Income tax payable 653 202 Total current liabilities 34,774 9,830 Total liabilities 50,916 11,116 Total equity and liabilities 132,956 91,025
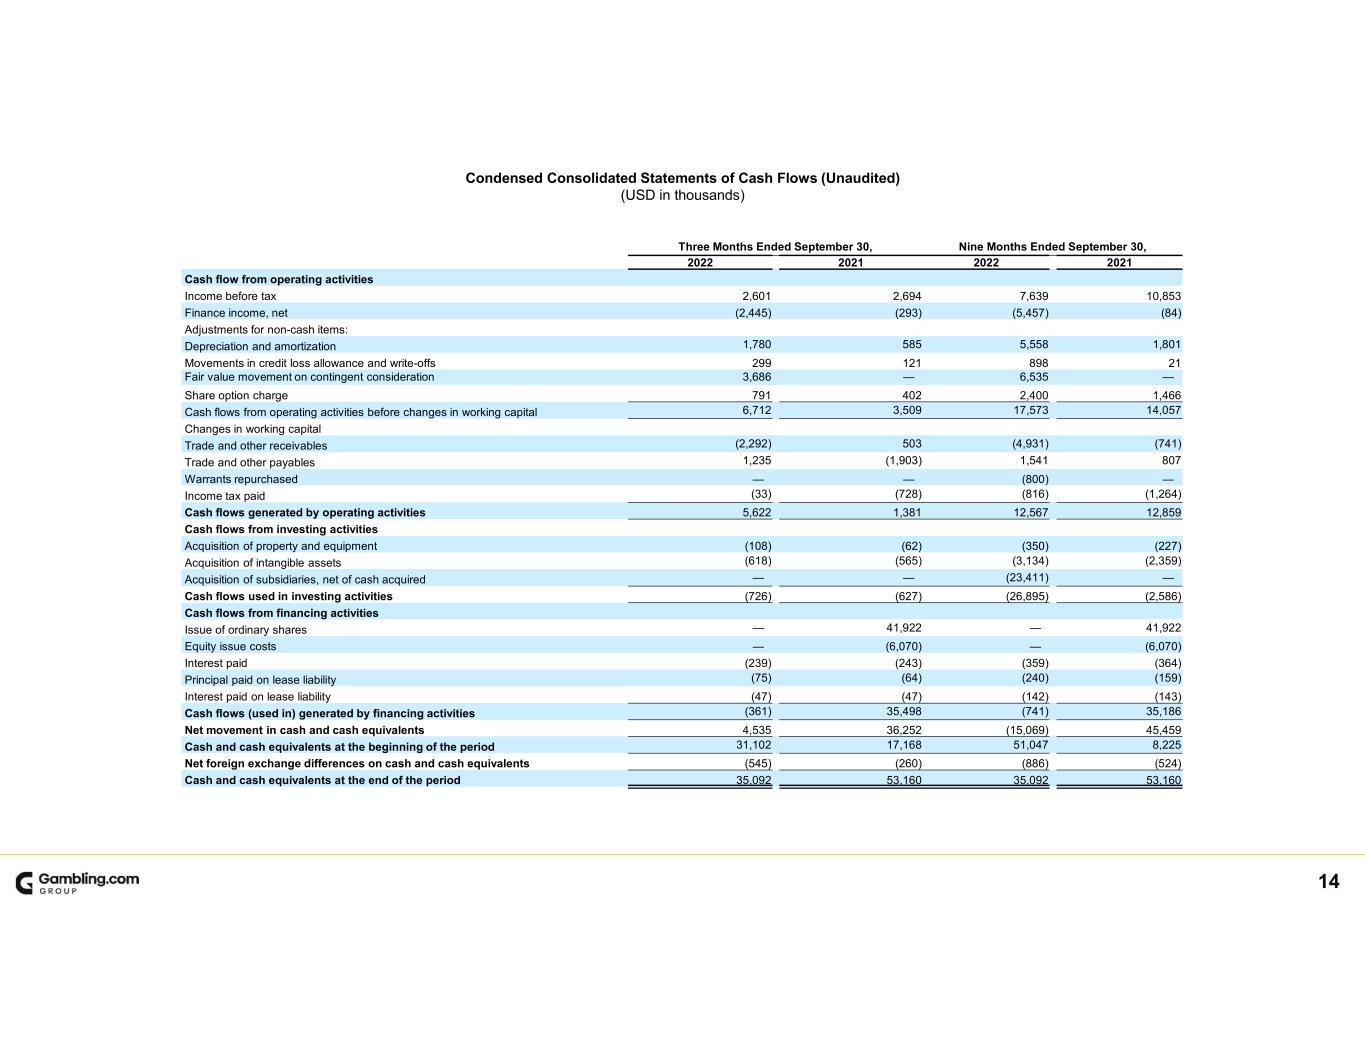
14 Condensed Consolidated Statements of Cash Flows (Unaudited) (USD in thousands) Three Months Ended September 30, Nine Months Ended September 30, 2022 2021 2022 2021 Cash flow from operating activities Income before tax 2,601 2,694 7,639 10,853 Finance income, net (2,445) (293) (5,457) (84) Adjustments for non-cash items: Depreciation and amortization 1,780 585 5,558 1,801 Movements in credit loss allowance and write-offs 299 121 898 21 Fair value movement on contingent consideration 3,686 — 6,535 — Share option charge 791 402 2,400 1,466 Cash flows from operating activities before changes in working capital 6,712 3,509 17,573 14,057 Changes in working capital Trade and other receivables (2,292) 503 (4,931) (741) Trade and other payables 1,235 (1,903) 1,541 807 Warrants repurchased — — (800) — Income tax paid (33) (728) (816) (1,264) Cash flows generated by operating activities 5,622 1,381 12,567 12,859 Cash flows from investing activities Acquisition of property and equipment (108) (62) (350) (227) Acquisition of intangible assets (618) (565) (3,134) (2,359) Acquisition of subsidiaries, net of cash acquired — — (23,411) — Cash flows used in investing activities (726) (627) (26,895) (2,586) Cash flows from financing activities Issue of ordinary shares — 41,922 — 41,922 Equity issue costs — (6,070) — (6,070) Interest paid (239) (243) (359) (364) Principal paid on lease liability (75) (64) (240) (159) Interest paid on lease liability (47) (47) (142) (143) Cash flows (used in) generated by financing activities (361) 35,498 (741) 35,186 Net movement in cash and cash equivalents 4,535 36,252 (15,069) 45,459 Cash and cash equivalents at the beginning of the period 31,102 17,168 51,047 8,225 Net foreign exchange differences on cash and cash equivalents (545) (260) (886) (524) Cash and cash equivalents at the end of the period 35,092 53,160 35,092 53,160

15 Earnings Per Share Three Months Ended September 30, Nine Months Ended September 30, 2022 2021 2022 2021 (in thousands USD, except for share and per share data, unaudited) (in thousands USD, except for share and per share data, unaudited) Net income for the period attributable to the shareholders 2,261 4,675 6,799 11,586 Weighted-average number of ordinary shares, basic 36,467,299 32,364,114 35,613,073 29,830,319 Net income per share attributable to shareholders, basic 0.06 0.14 0.19 0.39 Net income for the period attributable to the shareholders 2,261 4,675 6,799 11,586 Weighted-average number of ordinary shares, diluted 36,795,589 36,184,575 36,830,801 33,640,305 Net income per share attributable to shareholders, diluted 0.06 0.13 0.18 0.34
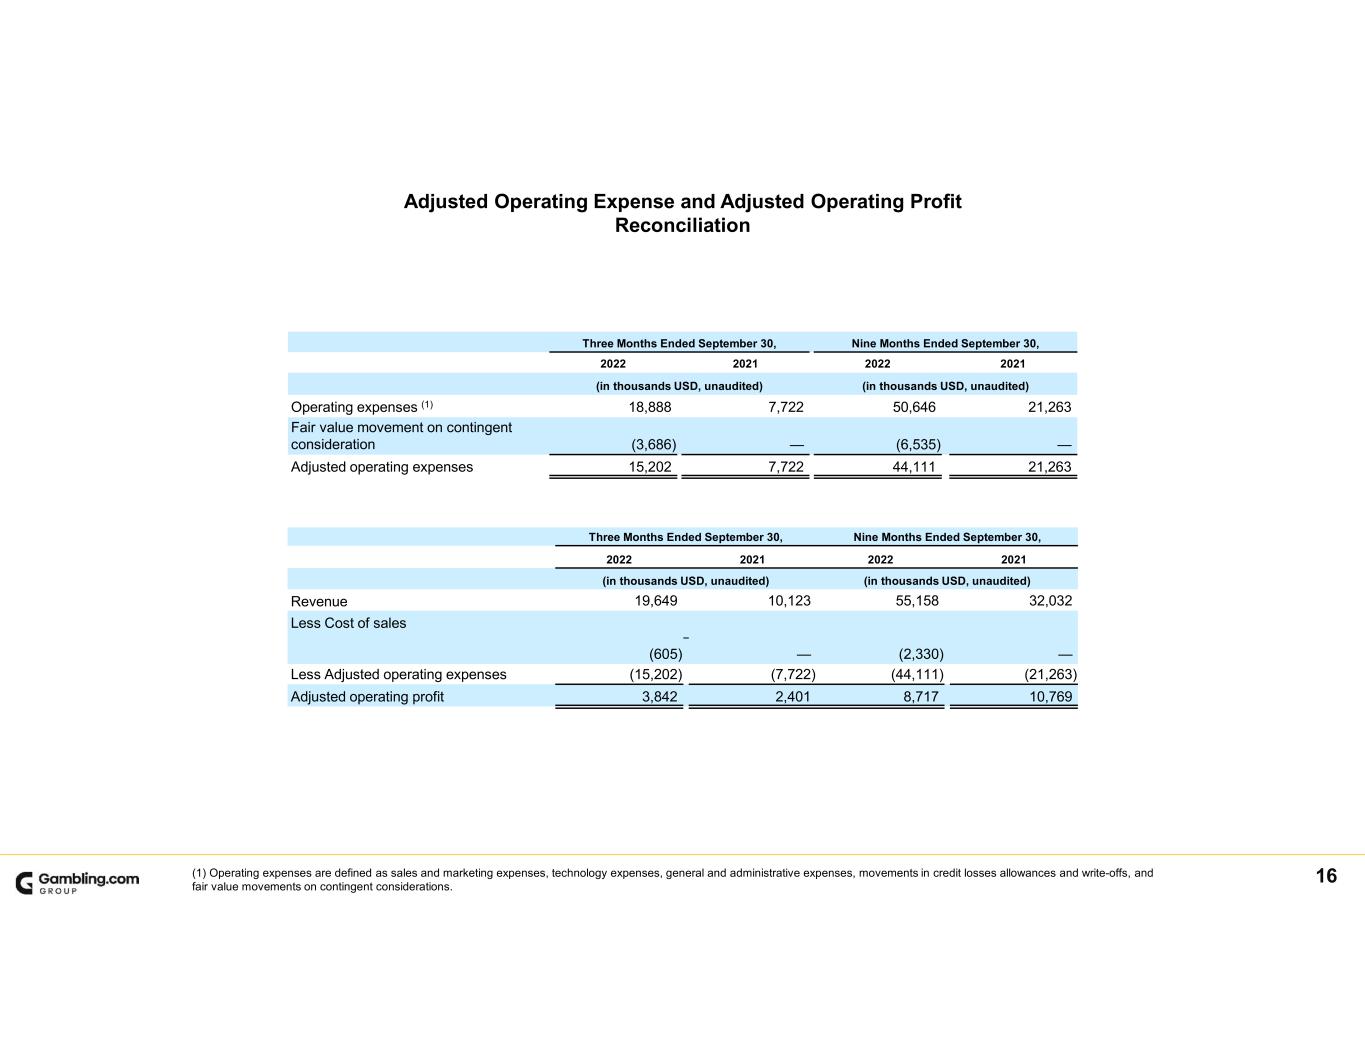
16 Adjusted Operating Expense and Adjusted Operating Profit Reconciliation Three Months Ended September 30, Nine Months Ended September 30, 2022 2021 2022 2021 (in thousands USD, unaudited) (in thousands USD, unaudited) Revenue 19,649 10,123 55,158 32,032 Less Cost of sales (605) — — (2,330) — Less Adjusted operating expenses (15,202) (7,722) (44,111) (21,263) Adjusted operating profit 3,842 2,401 8,717 10,769 Three Months Ended September 30, Nine Months Ended September 30, 2022 2021 2022 2021 (in thousands USD, unaudited) (in thousands USD, unaudited) Operating expenses (1) 18,888 7,722 50,646 21,263 Fair value movement on contingent consideration (3,686) — (6,535) — Adjusted operating expenses 15,202 7,722 44,111 21,263 (1) Operating expenses are defined as sales and marketing expenses, technology expenses, general and administrative expenses, movements in credit losses allowances and write-offs, and fair value movements on contingent considerations.

17 Adjusted Net Income and Adjusted Net Income Per Share Reconciliation Three Months Ended September 30, Nine Months Ended September 30, 2022 2021 2022 2021 (in thousands USD, except for share and per share data, unaudited) (in thousands USD, except for share and per share data, unaudited) Net income for the period attributable to the shareholders 2,261 4,675 6,799 11,586 Fair value movement on contingent consideration (1) 3,686 — 6,535 — Unwinding of deferred consideration (1) 88 — 248 — Adjusted net income for the period attributable to shareholders 6,035 4,675 13,582 11,586 Weighted-average number of ordinary shares, basic 36,467,299 32,364,114 35,613,073 29,830,319 Net income per share attributable to shareholders, basic 0.06 0.14 0.19 0.39 Effect of adjustments for fair value movements on contingent consideration, basic 0.10 0.00 0.18 0.00 Effect of adjustments for unwinding on deferred consideration, basic 0.01 0.00 0.01 0.00 Adjusted net income per share attributable to shareholders, basic 0.17 0.14 0.38 0.39 Weighted-average number of ordinary shares, diluted 36,795,589 36,184,575 36,830,801 33,640,305 Net income per share attributable to ordinary shareholders, diluted 0.06 0.13 0.18 0.34 Adjusted net income per share attributable to shareholders, diluted 0.16 0.13 0.37 0.34 (1)There is no tax impact from fair value movement on contingent consideration and unwinding of deferred consideration.
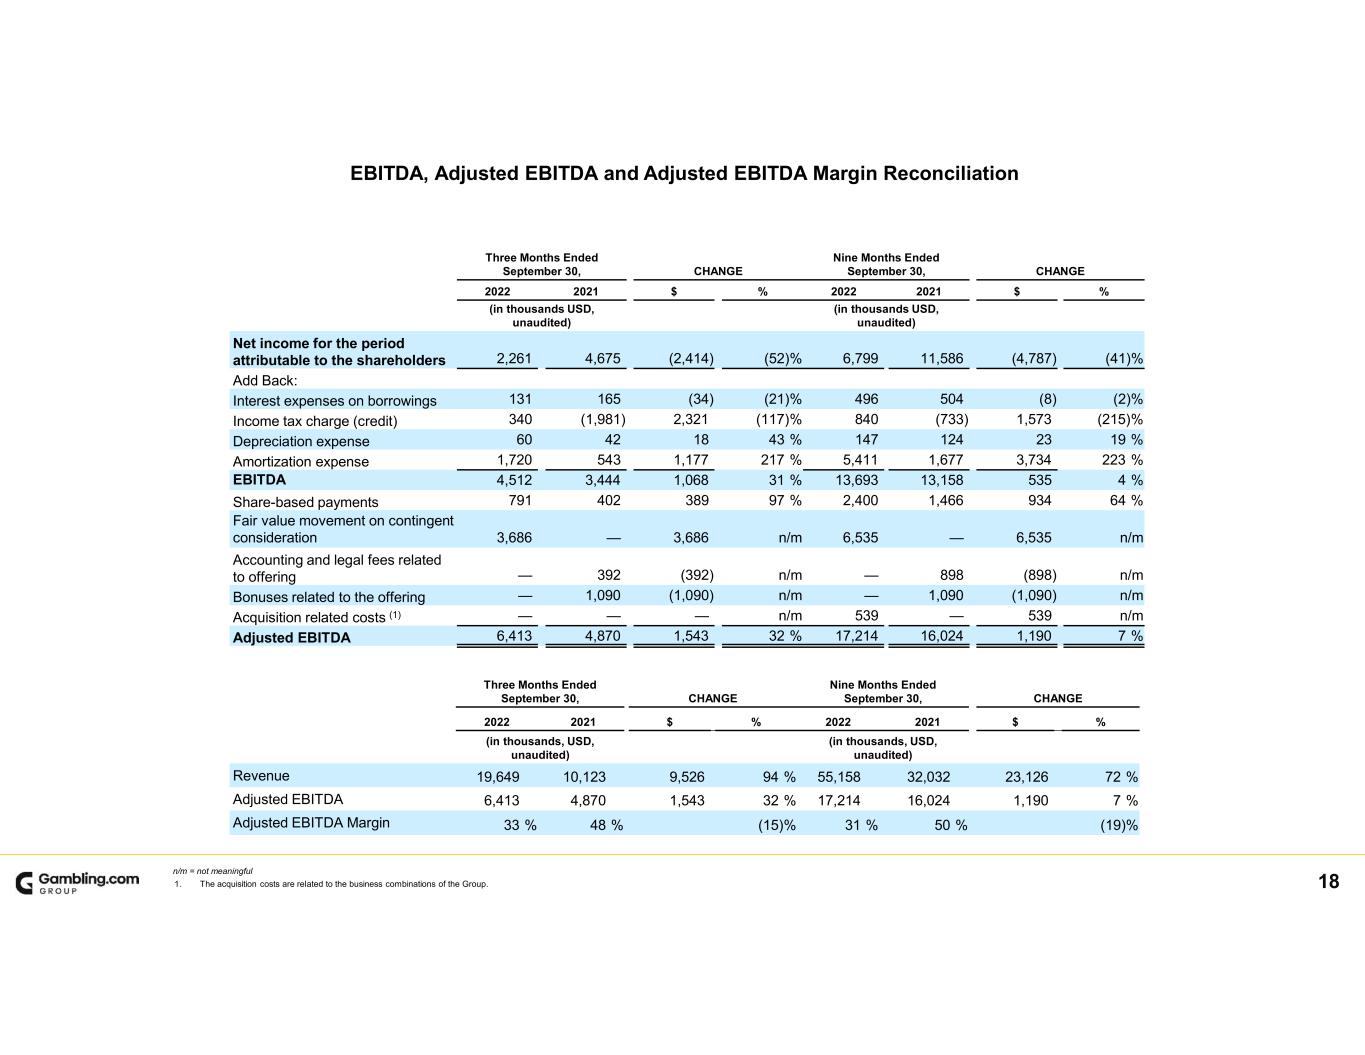
18 EBITDA, Adjusted EBITDA and Adjusted EBITDA Margin Reconciliation n/m = not meaningful 1. The acquisition costs are related to the business combinations of the Group. Three Months Ended September 30, CHANGE Nine Months Ended September 30, CHANGE 2022 2021 $ % 2022 2021 $ % (in thousands USD, unaudited) (in thousands USD, unaudited) Net income for the period attributable to the shareholders 2,261 4,675 (2,414) (52)% 6,799 11,586 (4,787) (41)% Add Back: Interest expenses on borrowings 131 165 (34) (21)% 496 504 (8) (2)% Income tax charge (credit) 340 (1,981) 2,321 (117)% 840 (733) 1,573 (215)% Depreciation expense 60 42 18 43 % 147 124 23 19 % Amortization expense 1,720 543 1,177 217 % 5,411 1,677 3,734 223 % EBITDA 4,512 3,444 1,068 31 % 13,693 13,158 535 4 % Share-based payments 791 402 389 97 % 2,400 1,466 934 64 % Fair value movement on contingent consideration 3,686 — 3,686 n/m 6,535 — 6,535 n/m Accounting and legal fees related to offering — 392 (392) n/m — 898 (898) n/m Bonuses related to the offering — 1,090 (1,090) n/m — 1,090 (1,090) n/m Acquisition related costs (1) — — — n/m 539 — 539 n/m Adjusted EBITDA 6,413 4,870 1,543 32 % 17,214 16,024 1,190 7 % Three Months Ended September 30, CHANGE Nine Months Ended September 30, CHANGE 2022 2021 $ % 2022 2021 $ % (in thousands, USD, unaudited) (in thousands, USD, unaudited) Revenue 19,649 10,123 9,526 94 % 55,158 32,032 23,126 72 % Adjusted EBITDA 6,413 4,870 1,543 32 % 17,214 16,024 1,190 7 % Adjusted EBITDA Margin 33 % 48 % (15)% 31 % 50 % (19)%

19 Free Cash Flow Reconciliation (1) Capital expenditures are defined as the acquisition of property and equipment and the acquisition of intangible assets. Three Months Ended September 30, CHANGE Nine Months Ended September 30, CHANGE 2022 2021 $ % 2022 2021 $ % (in thousands USD, unaudited) (in thousands USD, unaudited) Cash flows generated by operating activities 5,622 1,381 4,241 307 % 12,567 12,859 (292) (2)% Capital Expenditures (1) (726) (627) (99) (16)% (3,484) (2,586) (898) (35)% Free Cash Flow 4,896 754 4,142 549 % 9,084 10,273 (1,189) (12)%


