| FREE WRITING PROSPECTUS | ||
| FILED PURSUANT TO RULE 433 | ||
| REGISTRATION FILE NO.: 333-226486-18 | ||
 |  |  |
Free Writing Prospectus
Structural and Collateral Term Sheet
$905,186,404
(Approximate Initial Pool Balance)
$768,559,000
(Approximate Aggregate Certificate Balance of Offered Certificates)
BANK 2021-BNK31
as Issuing Entity
Wells Fargo Commercial Mortgage Securities, Inc.
as Depositor
Wells Fargo Bank, National Association
Morgan Stanley Mortgage Capital Holdings LLC
Bank of America, National Association
National Cooperative Bank, N.A.
as Sponsors and Mortgage Loan Sellers
Commercial Mortgage Pass-Through Certificates
Series 2021-BNK31
January 24, 2021
| WELLS FARGO SECURITIES | BofA SECURITIES | MORGAN STANLEY
|
Co-Lead Manager and Joint Bookrunner
| Co-Lead Manager and Joint Bookrunner
| Co-Lead Manager and Joint Bookrunner
|
Academy Securities, Inc. Co-Manager
| Drexel Hamilton Co-Manager
|
STATEMENT REGARDING THIS FREE WRITING PROSPECTUS
The depositor has filed a registration statement (including a prospectus) with the Securities and Exchange Commission (‘‘SEC’’) (SEC File No. 333-226486) for the offering to which this communication relates. Before you invest, you should read the prospectus in the registration statement and other documents the depositor has filed with the SEC for more complete information about the depositor, the issuing entity and this offering. You may get these documents for free by visiting EDGAR on the SEC Web site at www.sec.gov. Alternatively, the depositor, any underwriter, or any dealer participating in the offering will arrange to send you the prospectus after filing if you request it by calling toll free 1-800-745-2063 (8 a.m. – 5 p.m. EST) or by emailing wfs.cmbs@wellsfargo.com.
Nothing in this document constitutes an offer of securities for sale in any jurisdiction where the offer or sale is not permitted. The information contained herein is preliminary as of the date hereof, supersedes any such information previously delivered to you and will be superseded by any such information subsequently delivered and ultimately by the final prospectus relating to the securities. These materials are subject to change, completion, supplement or amendment from time to time.
This free writing prospectus has been prepared by the underwriters for information purposes only and does not constitute, in whole or in part, a prospectus for the purposes of Regulation (EU) 2017/1129 (as amended) and/or Part VI of the Financial Services and Markets Act 2000, as amended, or other offering document.
STATEMENT REGARDING ASSUMPTIONS AS TO SECURITIES, PRICING ESTIMATES AND OTHER INFORMATION
The attached information contains certain tables and other statistical analyses (the “Computational Materials”) which have been prepared in reliance upon information furnished by the Mortgage Loan Sellers. Numerous assumptions were used in preparing the Computational Materials, which may or may not be reflected herein. As such, no assurance can be given as to the Computational Materials’ accuracy, appropriateness or completeness in any particular context; or as to whether the Computational Materials and/or the assumptions upon which they are based reflect present market conditions or future market performance. The Computational Materials should not be construed as either projections or predictions or as legal, tax, financial or accounting advice. You should consult your own counsel, accountant and other advisors as to the legal, tax, business, financial and related aspects of a purchase of these securities. Any weighted average lives, yields and principal payment periods shown in the Computational Materials are based on prepayment and/or loss assumptions, and changes in such prepayment and/or loss assumptions may dramatically affect such weighted average lives, yields and principal payment periods. In addition, it is possible that prepayments or losses on the underlying assets will occur at rates higher or lower than the rates shown in the attached Computational Materials. The specific characteristics of the securities may differ from those shown in the Computational Materials due to differences between the final underlying assets and the preliminary underlying assets used in preparing the Computational Materials. The principal amount and designation of any security described in the Computational Materials are subject to change prior to issuance. None of Wells Fargo Securities, LLC, BofA Securities, Inc., Morgan Stanley & Co. LLC, Academy Securities, Inc., Drexel Hamilton, LLC or any of their respective affiliates, make any representation or warranty as to the actual rate or timing of payments or losses on any of the underlying assets or the payments or yield on the securities. The information in this presentation is based upon management forecasts and reflects prevailing conditions and management’s views as of this date, all of which are subject to change. In preparing this presentation, we have relied upon and assumed, without independent verification, the accuracy and completeness of all information available from public sources or which was provided to us by or on behalf of the Mortgage Loan Sellers or which was otherwise reviewed by us.
This free writing prospectus contains certain forward-looking statements. If and when included in this free writing prospectus, the words “expects”, “intends”, “anticipates”, “estimates” and analogous expressions and all statements that are not historical facts, including statements about our beliefs or expectations, are intended to identify forward-looking statements. Any forward-looking statements are made subject to risks and uncertainties which could cause actual results to differ materially from those stated. Those risks and uncertainties include, among other things, declines in general economic and business conditions, increased competition, changes in demographics, changes in political and social conditions, regulatory initiatives and changes in customer preferences, many of which are beyond our control and the control of any other person or entity related to this offering. The forward-looking statements made in this free writing prospectus are made as of the date stated on the cover. We have no obligation to update or revise any forward-looking statement.
Wells Fargo Securities is the trade name for the capital markets and investment banking services of Wells Fargo & Company and its subsidiaries, including but not limited to Wells Fargo Securities, LLC, a member of NYSE, FINRA, NFA and SIPC, Wells Fargo Prime Services, LLC, a member of FINRA, NFA and SIPC, and Wells Fargo Bank, N.A. Wells Fargo Securities, LLC and Wells Fargo Prime Services, LLC are distinct entities from affiliated banks and thrifts.
IMPORTANT NOTICE REGARDING THE OFFERED CERTIFICATES
The information herein is preliminary and may be supplemented or amended prior to the time of sale. In addition, the Offered Certificates referred to in these materials and the asset pool backing them are subject to modification or revision (including the possibility that one or more classes of certificates may be split, combined or eliminated at any time prior to issuance or availability of a final prospectus) and are offered on a “when, as and if issued” basis.
The underwriters described in these materials may from time to time perform investment banking services for, or solicit investment banking business from, any company named in these materials. The underwriters and/or their affiliates or respective employees may from time to time have a long or short position in any security or contract discussed in these materials.
The information contained herein supersedes any previous such information delivered to any prospective investor and will be superseded by information delivered to such prospective investor prior to the time of sale.
IMPORTANT NOTICE RELATING TO AUTOMATICALLY-GENERATED EMAIL DISCLAIMERS
Any legends, disclaimers or other notices that may appear at the bottom of any email communication to which this free writing prospectus is attached relating to (1) these materials not constituting an offer (or a solicitation of an offer), (2) any representation that these materials are accurate or complete and may not be updated or (3) these materials possibly being confidential, are not applicable to these materials and should be disregarded. Such legends, disclaimers or other notices have been automatically generated as a result of these materials having been sent via Bloomberg or another system.
THE INFORMATION IN THIS STRUCTURAL AND COLLATERAL TERM SHEET IS NOT COMPLETE AND MAY BE AMENDED PRIOR TO THE TIME OF SALE. THIS TERM SHEET IS NOT AN OFFER TO SELL THESE SECURITIES AND IT IS NOT A SOLICITATION OF AN OFFER TO BUY THESE SECURITIES IN ANY JURISDICTION WHERE THE OFFER OR SALE IS NOT PERMITTED.
2
| BANK 2021-BNK31 | Certificate Structure |
I. Certificate Structure
| Class | Expected Ratings (Fitch/KBRA/S&P)(1) | Approximate Initial Certificate Balance or Notional Amount(2) | Approx. Initial Credit Support(3) | Pass-Through Rate Description | Weighted Average Life (Years)(4) | Expected Principal Window(4) | Certificate Principal to Value Ratio(5) | Certificate Principal U/W NOI Debt Yield(6) | ||
| Offered Certificates | ||||||||||
| A-1 | AAAsf/AAA(sf)/AAA(sf) | $24,155,000 | 30.000% | (7) | 2.78 | 03/21 - 02/26 | 36.5% | 17.3% | ||
| A-SB | AAAsf/AAA(sf)/AAA(sf) | $27,859,000 | 30.000% | (7) | 7.09 | 02/26 - 03/30 | 36.5% | 17.3% | ||
| A-3(8) | AAAsf/AAA(sf)/AAA(sf) | (8)(9) | 30.000% | (7) | (9) | (9) | 36.5% | 17.3% | ||
| A-4(8) | AAAsf/AAA(sf)/AAA(sf) | (8)(9) | 30.000% | (7) | (9) | (9) | 36.5% | 17.3% | ||
| X-A | AAAsf/AAA(sf)/AAA(sf) | $601,948,000(10) | N/A | Variable(11) | N/A | N/A | N/A | N/A | ||
| X-B | A-sf/AAA(sf)/NR | $166,611,000(12) | N/A | Variable(13) | N/A | N/A | N/A | N/A | ||
| A-S(8) | AAAsf/AAA(sf)/AAA(sf) | $94,592,000(8) | 19.000% | (7) | 9.93 | 01/31 - 01/31 | 42.2% | 15.0% | ||
| B(8) | AA-sf/AA-(sf)/AA-(sf) | $37,622,000(8) | 14.625% | (7) | 9.93 | 01/31 - 01/31 | 44.5% | 14.2% | ||
| C(8) | A-sf/A-(sf)/NR | $34,397,000(8) | 10.625% | (7) | 9.93 | 01/31 - 01/31 | 46.6% | 13.6% | ||
| Non-Offered Certificates | ||||||||||
| X-D | BBB-sf/BBB-(sf)/NR | $37,622,000(14) | N/A | Variable(15) | N/A | N/A | N/A | N/A | ||
| X-F | BB-sf/BB-(sf)/NR | $17,199,000(16) | N/A | Variable(17) | N/A | N/A | N/A | N/A | ||
| X-G | B-sf/B-(sf)/NR | $8,599,000(16) | N/A | Variable(17) | N/A | N/A | N/A | N/A | ||
| X-H | NR/NR/NR | $27,948,084(16) | N/A | Variable(17) | N/A | N/A | N/A | N/A | ||
| D | BBBsf/BBB(sf)/NR | $21,499,000 | 8.125% | (7) | 9.93 | 01/31 - 01/31 | 47.9% | 13.2% | ||
| E | BBB-sf/BBB-(sf)/NR | $16,123,000 | 6.250% | (7) | 9.96 | 01/31 - 02/31 | 48.9% | 12.9% | ||
| F | BB-sf/BB-(sf)/NR | $17,199,000 | 4.250% | (7) | 10.01 | 02/31 - 02/31 | 49.9% | 12.7% | ||
| G | B-sf/B-(sf)/NR | $8,599,000 | 3.250% | (7) | 10.01 | 02/31 - 02/31 | 50.5% | 12.5% | ||
| H | NR/NR/NR | $27,948,084 | 0.000% | (7) | 10.01 | 02/31 - 02/31 | 52.1% | 12.1% | ||
| Non-Offered Eligible Vertical Interest | ||||||||||
| RR Interest | NR/NR/NR | $45,259,320.22 | N/A | WAC(18) | 9.53 | 03/21 - 02/31 | N/A | N/A | ||
| Notes: | |
| (1) | The expected ratings presented are those of Fitch Ratings, Inc. (“Fitch”), Kroll Bond Rating Agency, LLC. (“KBRA”) and S&P Global Ratings (“S&P”), which the depositor hired to rate the Offered Certificates. One or more other nationally recognized statistical rating organizations that were not hired by the depositor may use information they receive pursuant to Rule 17g-5 under the Securities Exchange Act of 1934, as amended (the “Exchange Act”) or otherwise, to rate or provide market reports and/or published commentary related to the Offered Certificates. We cannot assure you as to what ratings a non-hired nationally recognized statistical rating organization would assign or that its reports will not express differing, possibly negative, views of the mortgage loans and/or the Offered Certificates. The ratings of each Class of Offered Certificates address the likelihood of the timely distribution of interest and, except in the case of the Class X-A and X-B Certificates, the ultimate distribution of principal due on those Classes on or before the Rated Final Distribution Date. See “Risk Factors—Other Risks Relating to the Certificates—Nationally Recognized Statistical Rating Organizations May Assign Different Ratings to the Certificates; Ratings of the Certificates Reflect Only the Views of the Applicable Rating Agencies as of the Dates Such Ratings Were Issued; Ratings May Affect ERISA Eligibility; Ratings May Be Downgraded” and “Ratings” in the Preliminary Prospectus, expected to be dated January 24, 2021 (the “Preliminary Prospectus”). Fitch, KBRA and S&P have informed us that the “sf” designation in their ratings represents an identifier for structured finance product ratings. |
| (2) | The Certificate Balances and Notional Amounts set forth in the table are approximate. The actual initial Certificate Balances and Notional Amounts may be larger or smaller depending on the initial pool balance of the mortgage loans definitively included in the pool of mortgage loans, which aggregate cut-off date balance may be as much as 5% larger or smaller than the amount presented in the Preliminary Prospectus. In addition, the Notional Amounts of the Class X-A, Class X-B, Class X-D, Class X-F, Class X-G and Class X-H Certificates (collectively referred to herein as “Class X Certificates”) may vary depending upon the final pricing of the Classes of Principal Balance Certificates (as defined below) or trust components whose Certificate Balances comprise such Notional Amounts and, if as a result of such pricing the pass-through rate of any Class of the Class X Certificates would be equal to zero at all times, such Class of Certificates will not be issued on the closing date of this securitization. |
| (3) | The approximate initial credit support with respect to the Class A-1, A-SB, A-3 and A-4 Certificates represents the approximate credit enhancement for the Class A-1, A-SB, A-3 and A-4 Certificates in the aggregate, taking into account the Certificate Balances of the Class A-3 and Class A-4 trust components. The approximate initial credit support percentage set forth for the Class A-S certificates represents the approximate credit support for the underlying Class A-S trust component. The approximate initial credit support percentage set forth for the Class B certificates represents the approximate credit support for the underlying Class B trust component. The approximate initial credit support percentage set forth for the Class C certificates represents the approximate credit support for the underlying Class C trust component. The RR Interest only provides credit support to the limited extent that losses incurred on the underlying mortgage loans are allocated to it, on the one hand, and to the Offered Certificates and the Non-Offered Certificates, on the other hand, pro rata, in accordance with their respective Percentage Allocation Entitlements. |
| (4) | Weighted Average Lives and Expected Principal Windows are calculated based on an assumed prepayment rate of 0% CPR and the “Structuring Assumptions” described under “Yield and Maturity Considerations—Weighted Average Life” in the Preliminary Prospectus. |
| (5) | The Certificate Principal to Value Ratio for each Class of Certificates (other than the Class A-1, A-SB, A-3 and A-4 Certificates) is calculated as the product of (a) the weighted average Cut-off Date LTV Ratio for the mortgage loans and (b) a fraction, the numerator of which is the total initial Certificate Balance of such Class of Certificates and all Classes of Principal Balance Certificates (or, with respect to the Class A-3, A-4, A-S, B or C Certificates, the trust component with the same alphanumeric designation) senior to such Class of Certificates and the denominator of which is the total initial Certificate Balance of all of the Principal Balance Certificates (or, with respect to the Class A-3, A-4, A-S, B or C Certificates, the trust component with the same alphanumeric designation)(other than the RR Interest). The Certificate Principal to Value Ratio for each of the Class A-1, A-SB, A-3 and A-4 Certificates is calculated in the aggregate for those Classes as if they were a single Class and is calculated as the product of (a) the weighted average Cut-off Date LTV Ratio for the mortgage loans and (b) a fraction, the numerator of which is the total initial aggregate Certificate Balances of such Classes of Certificates (or, with respect to the Class A-3 or A-4 Certificates, the trust component with the same alphanumeric designation) and the denominator of which is the total initial Certificate Balance of all of the Principal Balance Certificates (or, with respect to the Class A-3, A-4, A-S, B or C Certificates, the trust component with the same alphanumeric designation)(other than the RR Interest). In any event, however, excess mortgaged property value associated with a mortgage loan will not be available to offset losses on any other mortgage loan. |
THE INFORMATION IN THIS STRUCTURAL AND COLLATERAL TERM SHEET IS NOT COMPLETE AND MAY BE AMENDED PRIOR TO THE TIME OF SALE. THIS TERM SHEET IS NOT AN OFFER TO SELL THESE SECURITIES AND IT IS NOT A SOLICITATION OF AN OFFER TO BUY THESE SECURITIES IN ANY JURISDICTION WHERE THE OFFER OR SALE IS NOT PERMITTED.
3
| BANK 2021-BNK31 | Certificate Structure |
| (6) | The Certificate Principal U/W NOI Debt Yield for each Class of Certificates (other than the Class A-1, A-SB, A-3 and A-4 Certificates) is calculated as the product of (a) the weighted average U/W NOI Debt Yield for the mortgage loans and (b) a fraction, the numerator of which is the total initial Certificate Balance of all of the Classes of Principal Balance Certificates (or, with respect to the Class A-3, A-4, A-S, B or C Certificates, the trust component with the same alphanumeric designation) (other than the RR Interest) and the denominator of which is the total initial Certificate Balance for such Class of Certificates and all Classes of Principal Balance Certificates (or, with respect to the Class A-3, A-4, A-S, B or C Certificates, the trust component with the same alphanumeric designation) senior to such Class of Certificates. The Certificate Principal U/W NOI Debt Yield for each of the Class A-1, A-SB, A-3 and A-4 Certificates is calculated in the aggregate for those Classes as if they were a single Class and is calculated as the product of (a) the weighted average U/W NOI Debt Yield for the mortgage loans and (b) a fraction, the numerator of which is the total initial Certificate Balance of all of the Classes of Principal Balance Certificates (or, with respect to the Class A-3, A-4, A-S, B or C Certificates, the trust component with the same alphanumeric designation)(other than the RR Interest) and the denominator of which is the total aggregate initial Certificate Balances for the Class A-1, A-SB, A-3 and A-4 Certificates (or, with respect to the Class A-3 or A-4 Certificates, the trust component with the same alphanumeric designation). In any event, however, cash flow from each mortgaged property supports only the related mortgage loan and will not be available to support any other mortgage loan. |
| (7) | The pass-through rates for the Class A-1, A-SB, A-3, A-4, A-S, B, C, D, E, F, G and H Certificates will, in each case, be one of the following: (i) a fixed rate per annum, (ii) a variable rate per annum equal to the weighted average of the net mortgage interest rates on the mortgage loans for the related distribution date, (iii) a variable rate per annum equal to the lesser of (a) a fixed rate and (b) the weighted average of the net mortgage interest rates on the mortgage loans for the related distribution date or (iv) a variable rate per annum equal to the weighted average of the net mortgage interest rates on the mortgage loans for the related distribution date minus a specified percentage. For purposes of the calculation of the weighted average of the net mortgage interest rates on the mortgage loans for each distribution date, the mortgage interest rates will be adjusted as necessary to a 30/360 basis. |
| (8) | The Class A-3-1, A-3-2, A-3-X1, A-3-X2, A-4-1, A-4-2, A-4-X1, A-4-X2, A-S-1, A-S-2, A-S-X1, A-S-X2, B-1, B-2, B-X1, B-X2, C-1, C-2, C-X1 and C-X2 Certificates are also offered certificates. Such Classes of Certificates, together with the Class A-3, A-4, A-S, B and C Certificates, constitute the “Exchangeable Certificates”. The Class A-1, A-SB, D, E, F, G and H Certificates, together with the Exchangeable Certificates with a Certificate Balance, are referred to as the “Principal Balance Certificates.” Each Class of Exchangeable Certificates will have the Certificate Balance or Notional Amount and pass-through rate described below under “Exchangeable Certificates.” |
| (9) | The exact initial Certificate Balances or Notional Amounts of the Class A-3, A-3-X1, A-3-X2, A-4, A-4-X1 and A-4-X2 trust components (and consequently, the exact aggregate Initial Certificate Balances or Notional Amounts of the Exchangeable Certificates with an “A-3” or “A-4” designation) are unknown and will be determined based on the final pricing of those Classes of Certificates. However, the initial Certificate Balances, weighted average lives and principal windows of the Class A-3 and A-4 trust components are expected to be within the applicable ranges reflected in the following chart. The aggregate initial Certificate Balance of the Class A-3 and A-4 trust components is expected to be approximately $549,934,000, subject to a variance of plus or minus 5%. The Class A-3-X1 and A-3-X2 trust components will have initial Notional Amounts equal to the initial Certificate Balance of the Class A-3 trust component. The Class A-4-X1 and A-4-X2 trust components will have initial Notional Amounts equal to the initial Certificate Balance of the Class A-4 trust component. In the event that the Class A-4 trust component is issued with an initial certificate balance of $549,934,000, the Class A-3 trust component will not be issued. |
Trust Components | Expected Range of Approximate Initial | Expected Range of Weighted Average Life (Years) | Expected Range of Principal Window |
| Class A-3 | $0 - $270,000,000 | N/A – 9.60 | N/A / 03/30 – 12/30 |
| Class A-4 | $279,934,000 - $549,934,000 | 9.75 – 9.89 | 03/30 – 01/31 / 12/30 – 01/31 |
| (10) | The Class X-A Certificates are notional amount certificates. The Notional Amount of the Class X-A Certificates will be equal to the aggregate Certificate Balance of the Class A-1 and A-SB Certificates and the Class A-3 and A-4 trust components outstanding from time to time. The Class X-A Certificates will not be entitled to distributions of principal. |
| (11) | The pass-through rate for the Class X-A Certificates for any distribution date will be a per annum rate equal to the excess, if any, of (a) the weighted average of the net mortgage interest rates on the mortgage loans for the related distribution date, over (b) the weighted average of the pass-through rates on the Class A-1 and A-SB Certificates and the Class A-3, A-3-X1, A-3-X2, A-4, A-4-X1 and A-4-X2 trust components for the related distribution date, weighted on the basis of their respective Certificate Balances or Notional Amounts outstanding immediately prior to that distribution date (but excluding trust components with a Notional Amount in the denominator of such weighted average calculation). For purposes of the calculation of the weighted average of the net mortgage interest rates on the mortgage loans for each distribution date, the mortgage interest rates will be adjusted as necessary to a 30/360 basis. |
| (12) | The Class X-B Certificates are notional amount certificates. The Notional Amount of the Class X-B Certificates will be equal to the aggregate Certificate Balance of the Class A-S, B and C trust components outstanding from time to time. The Class X-B Certificates will not be entitled to distributions of principal. |
| (13) | The pass-through rate for the Class X-B Certificates for any distribution date will be a per annum rate equal to the excess, if any, of (a) the weighted average of the net mortgage interest rates on the mortgage loans for the related distribution date, over (b) the weighted average of the pass-through rates on the Class A-S, A-S-X1, A-S-X2, B, B-X1, B-X2, C, C-X1 and C-X2 trust components for the related distribution date, weighted on the basis of their respective Certificate Balances or Notional Amounts outstanding immediately prior to that distribution date (but excluding trust components with a Notional Amount in the denominator of such weighted average calculation). For purposes of the calculation of the weighted average of the net mortgage interest rates on the mortgage loans for each distribution date, the mortgage interest rates will be adjusted as necessary to a 30/360 basis. |
| (14) | The Class X-D Certificates are notional amount certificates. The Notional Amount of the Class X-D Certificates will be equal to the aggregate Certificate Balance of the Class D and E Certificates outstanding from time to time. The Class X-D Certificates will not be entitled to distributions of principal. |
| (15) | The pass-through rate for the Class X-D Certificates for any distribution date will be a per annum rate equal to the excess, if any, of (a) the weighted average of the net mortgage interest rates on the mortgage loans for the related distribution date, over (b) the weighted average of the pass-through rates on the Class D and E Certificates for the related distribution date, weighted on the basis of their respective Certificate Balances outstanding immediately prior to that distribution date. For purposes of the calculation of the weighted average of the net mortgage interest rates on the mortgage loans for each distribution date, the mortgage interest rates will be adjusted as necessary to a 30/360 basis. |
| (16) | The Class X-F, X-G and X-H Certificates are notional amount certificates. The Notional Amount of the Class X-F, X-G and X-H Certificates will be equal to the Certificate Balance of the Class F, G and H Certificates, respectively, outstanding from time to time. None of the Class X-F, X-G and X-H Certificates will be entitled to distributions of principal. |
| (17) | The pass-through rate for the Class X-F, X-G and X-H for any distribution date will, in each case, be a per annum rate equal to the excess, if any, of (a) the weighted average of the net mortgage interest rates on the mortgage loans for the related distribution date, over (b) the pass-through rates on the Class F, G and H Certificates, respectively, for the related distribution date. For purposes of the calculation of the weighted average of the net mortgage interest rates on the mortgage loans for each distribution date, the mortgage interest rates will be adjusted as necessary to a 30/360 basis. |
| (18) | The effective interest rate for the RR Interest will be a variable rate per annum (described in the table as “WAC”) equal to the weighted average of the net mortgage interest rates on the mortgage loans for the related distribution date. For purposes of calculation of the weighted average of the net mortgage interest rates on the mortgage loans for each distribution date, the mortgage interest rates will be adjusted as necessary to a 30/360 basis. |
THE INFORMATION IN THIS STRUCTURAL AND COLLATERAL TERM SHEET IS NOT COMPLETE AND MAY BE AMENDED PRIOR TO THE TIME OF SALE. THIS TERM SHEET IS NOT AN OFFER TO SELL THESE SECURITIES AND IT IS NOT A SOLICITATION OF AN OFFER TO BUY THESE SECURITIES IN ANY JURISDICTION WHERE THE OFFER OR SALE IS NOT PERMITTED.
4
| BANK 2021-BNK31 | Transaction Highlights |
II. Transaction Highlights
Mortgage Loan Sellers:
Mortgage Loan Seller | Number of | Number of | Aggregate Cut-off Date Balance | Approx. % of Initial Pool | ||||||||
| Wells Fargo Bank, National Association | 16 | 36 | $311,413,202 | 34.4 | % | |||||||
| Morgan Stanley Mortgage Capital Holdings LLC | 17 | 38 | 274,568,000 | 30.3 | ||||||||
| Bank of America, National Association | 11 | 35 | 259,652,948 | 28.7 | ||||||||
| National Cooperative Bank, N.A. | 17 | 17 | 59,552,254 | 6.6 | ||||||||
Total | 61 | 126 | $905,186,404 | 100.0 | % | |||||||
Loan Pool:
| Initial Pool Balance: | $905,186,404 |
| Number of Mortgage Loans: | 61 |
| Average Cut-off Date Balance per Mortgage Loan: | $14,839,121 |
| Number of Mortgaged Properties: | 126 |
| Average Cut-off Date Balance per Mortgaged Property(1): | $7,184,019 |
| Weighted Average Mortgage Interest Rate: | 3.2111% |
| Ten Largest Mortgage Loans as % of Initial Pool Balance: | 55.4% |
| Weighted Average Original Term to Maturity or ARD (months): | 120 |
| Weighted Average Remaining Term to Maturity or ARD (months): | 118 |
| Weighted Average Original Amortization Term (months)(2)(3): | 333 |
| Weighted Average Remaining Amortization Term (months)(2)(3): | 332 |
| Weighted Average Seasoning (months): | 2 |
| (1) | Information regarding mortgage loans secured by multiple properties is based on an allocation according to relative appraised values or the allocated loan amounts or property-specific release prices set forth in the related loan documents or such other allocation as the related mortgage loan seller deemed appropriate. |
| (2) | Excludes any mortgage loan that does not amortize. |
| (3) | With respect to Mortgage Loan No. 8, McDonald’s Global HQ, the Original Amortization Term and Remaining Amortization Term of 270 months and 267 months, respectively, is for the McDonald’s Global HQ Whole Loan. The McDonald’s Global HQ Senior Loan fully amortizes in 186 periods. See amortization schedule for the McDonald’s Global HQ Mortgage Loan set forth in Annex A-4 in the Preliminary Prospectus. |
Credit Statistics:
| Weighted Average U/W Net Cash Flow DSCR(1): | 3.25x |
| Weighted Average U/W Net Operating Income Debt Yield(1): | 12.1% |
| Weighted Average Cut-off Date Loan-to-Value Ratio(1): | 52.1% |
| Weighted Average Balloon or ARD Loan-to-Value Ratio(1): | 49.1% |
| % of Mortgage Loans with Additional Subordinate Debt(2): | 21.5% |
| % of Mortgage Loans with Single Tenants(3): | 14.1% |
| (1) | With respect to any mortgage loan that is part of a whole loan, loan-to-value ratio, debt service coverage ratio and debt yield calculations include the related pari passu companion loan(s) but exclude any related subordinate companion loan(s) (unless otherwise stated). For mortgaged properties securing residential cooperative mortgage loans, the debt service coverage ratio and debt yield for each such mortgaged property are calculated using U/W Net Operating Income or U/W Net Cash Flow, as applicable, for the related residential cooperative property which is the projected net operating income or net cash flow, as applicable, reflected in the most recent appraisal obtained by or otherwise in the possession of the related mortgage loan seller as of the cut-off date, and the loan-to-value ratio is calculated based upon the appraised value of the residential cooperative property determined as if such residential cooperative property is operated as a residential cooperative, inclusive of the amount of the underlying debt encumbering such residential cooperative property. The debt service coverage ratio, debt yield and loan-to-value ratio information do not take into account any subordinate debt (whether or not secured by the related mortgaged property), that currently exists or is allowed under the terms of any mortgage loan. See “Description of the Mortgage Pool—Mortgage Pool Characteristics” in the Preliminary Prospectus and Annex A-1 to the Preliminary Prospectus. |
| (2) | Fifteen (15) of the mortgage loans, each of which is secured by a residential cooperative property sold to the depositor by National Cooperative Bank, N.A., currently have in place either (i) subordinate secured lines of credit to the related mortgage borrowers that permit future advances (such loans, collectively, the “Subordinate Coop LOCs”) or (ii) a subordinate wraparound mortgage to the related mortgage borrower that is currently held by the cooperative sponsor (such loan, the “Subordinate Wrap Mortgage”). The percentage figure expressed as “% of Mortgage Loans with Additional Subordinate Debt” is determined as a percentage of the initial pool balance and does not take into account any future subordinate debt (whether or not secured by the mortgaged property), if any, that may be permitted under the terms of any mortgage loan or the pooling and servicing agreement. See “Description of the Mortgage Pool—Additional Indebtedness—Other Unsecured Indebtedness” and “Description of the Mortgage Pool —Additional—Indebtedness—Other Secured Indebtedness—Additional Debt Financing for Mortgage Loans Secured by Residential Cooperatives Sold to the Depositor by National Cooperative Bank, N.A.” in the Preliminary Prospectus. |
| (3) | Excludes mortgage loans that are secured by multiple single tenant properties. |
THE INFORMATION IN THIS STRUCTURAL AND COLLATERAL TERM SHEET IS NOT COMPLETE AND MAY BE AMENDED PRIOR TO THE TIME OF SALE. THIS TERM SHEET IS NOT AN OFFER TO SELL THESE SECURITIES AND IT IS NOT A SOLICITATION OF AN OFFER TO BUY THESE SECURITIES IN ANY JURISDICTION WHERE THE OFFER OR SALE IS NOT PERMITTED.
5
| BANK 2021-BNK31 | Transaction Highlights |
Loan Structural Features:
Amortization: Based on the Initial Pool Balance, 25.6% of the mortgage pool (23 mortgage loans) has scheduled amortization, as follows:
13.5% (12 mortgage loans) requires amortization during the entire loan term; and
12.1% (11 mortgage loans) provides for an interest-only period followed by an amortization period
Interest-Only: Based on the Initial Pool Balance, 74.4% of the mortgage pool (38 mortgage loans) provides for interest-only payments during the entire loan term through maturity or ARD. The weighted average Cut-off Date Loan-to-Value Ratio and weighted average U/W Net Cash Flow DSCR for those mortgage loans are 52.4% and 3.58x, respectively.
Hard Lockboxes: Based on the Initial Pool Balance, 58.7% of the mortgage pool (14 mortgage loans) has hard lockboxes in place.
Reserves: The mortgage loans require amounts to be escrowed monthly as follows (excluding any mortgage loans with springing provisions):
| Real Estate Taxes: | 53.9% of the pool |
| Insurance: | 17.8% of the pool |
| Capital Replacements: | 62.8% of the pool |
| TI/LC: | 40.4% of the pool(1) |
| (1) The percentage of Initial Pool Balance for mortgage loans with TI/LC reserves is based on the aggregate principal balance allocable to loans that include office, mixed use, retail and industrial properties. | |
Call Protection/Defeasance: Based on the Initial Pool Balance, the mortgage pool has the following call protection and defeasance features:
65.0% of the mortgage pool (36 mortgage loans) features a lockout period, then defeasance only until an open period;
9.9% of the mortgage pool (1 mortgage loan) features no lockout period, but requires yield maintenance, then yield maintenance or defeasance until an open period;
8.8% of the mortgage pool (1 mortgage loan) features no lockout period, but requires the greater of a prepayment premium (1.0%) or yield maintenance, then the greater of a prepayment premium (1.0%) or yield maintenance or defeasance until an open period;
6.8% of the mortgage pool (4 mortgage loans) features a lockout period, then the greater of a prepayment premium or yield maintenance until an open period;
6.6% of the mortgage pool (17 mortgage loans) features no lockout period, but requires the greater of a prepayment premium or yield maintenance, then a prepayment premium until an open period;
2.4% of the mortgage pool (1 mortgage loan) features no lockout period, but requires the greater of a prepayment premium (0.5%) or yield maintenance, then the greater of a prepayment premium (0.5%) or yield maintenance or defeasance until an open period; and
0.4% of the mortgage pool (1 mortgage loan) features no lockout period, but requires the greater of a prepayment premium or yield maintenance until an open period;
Prepayment restrictions for each mortgage loan reflect the entire life of the mortgage loan. Please refer to Annex A-1 to the Preliminary Prospectus and the footnotes related thereto for further information regarding individual loan call protection.
THE INFORMATION IN THIS STRUCTURAL AND COLLATERAL TERM SHEET IS NOT COMPLETE AND MAY BE AMENDED PRIOR TO THE TIME OF SALE. THIS TERM SHEET IS NOT AN OFFER TO SELL THESE SECURITIES AND IT IS NOT A SOLICITATION OF AN OFFER TO BUY THESE SECURITIES IN ANY JURISDICTION WHERE THE OFFER OR SALE IS NOT PERMITTED.
6
| BANK 2021-BNK31 | Transaction Highlights |
III. COVID-19 Considerations
The following table contains information regarding the status of the Mortgage Loans and Mortgaged Properties provided by the respective borrowers as of the date set forth in the “Information As Of Date” column. The information from the borrowers has not been independently verified by the Mortgage Loan Sellers, the Underwriters or any other party, and there can be no assurances that the status of the Mortgage Loans and of the related Mortgaged Properties has not changed since the date in the “Information As Of Date” column. The cumulative effects of the COVID-19 emergency on the global economy may cause tenants to be unable to pay their rent and borrowers to be unable to pay debt service under the Mortgage Loans. As a result, we cannot assure you that the information in the following table is indicative of future performance or that tenants or borrowers will not seek rent or debt service relief (including forbearance arrangements) or other lease or loan modifications in the future. Such actions may lead to shortfalls and losses on the certificates.
Loan Number | Mortgage Loan Seller | Information As Of Date | Origination Date | Mortgage Loan Name | Mortgaged Property Type | November Debt Service Payment Received (Y/N) | December Debt Service Payment Received (Y/N) | January Debt Service Payment Received (Y/N) | Forbearance or Other Debt Service Relief Requested (Y/N) | Other Loan Modification Requested (Y/N) | Lease Modification or Rent Relief Requested (Y/N) | Total SF or Unit Count Making Full December Rent Payment (%)(1) | UW December Base Rent Paid (%) | Total SF or Unit Count Making Full January Rent Payment (%)(1) | UW January Base Rent Paid (%) |
| 1 | WFB | 1/15/2021 | 11/13/2020 | McClellan Park | Industrial | NAP(2) | NAP(2) | Y | N | N | Y(3) | 98.0% | 99.0% | 95.0% | 93.0% |
| 2 | MSMCH | 1/24/2021 | 11/20/2020 | 605 Third Avenue | Office | NAP(2) | NAP(2) | Y | N | N | Y(4) | 96.4% | 97.0% | 93.5% | 94.1% |
| 3 | BANA | 1/14/2021 | 2/28/2020 | Miami Design District | Retail | Y | Y | Y | Y(5) | Y(5) | Y(6) | 91.3% | 95.6% | 98.9% | 99.0% |
| 4 | BANA | 1/19/2021 | 12/22/2020 | ExchangeRight Net Leased Portfolio #42 | Various | NAP(7) | NAP(7) | NAP(7) | N | N | N | 100.0% | 100.0% | 100.0% | 100.0% |
| 5 | MSMCH | 1/20/2021 | 11/12/2020 | 250 West 57th Street | Office | NAP(2) | NAP(2) | Y | N | N | Y(8) | 93.8% | 94.5% | 90.7% | 92.3% |
| 6 | WFB | 1/7/2021 | 12/24/2020 | ExchangeRight REIT 2 | Various | NAP(7) | NAP(7) | NAP(7) | N | N | N | 100.0% | 100.0% | 100.0% | 100.0% |
| 7 | BANA | 12/23/2020 | 12/23/2020 | U-Haul AREC Portfolio 43 | Self Storage | NAP(7) | NAP(7) | NAP(7) | N | N | N | (9) | (9) | (9) | (9) |
| 8 | BANA | 1/14/2021 | 10/29/2020 | McDonald’s Global HQ | Office | NAP(10) | Y | Y | N | N | Y(11) | 100.0% | 100.0% | 100.0% | 100.0% |
| 9 | WFB | 1/15/2021 | 12/15/2020 | Inland SE Self Storage Portfolio | Self Storage | NAP(7) | NAP(7) | NAP(7) | N | N | N | NAV(12) | 95.0% | NAV(12) | 90.9% |
| 10 | WFB | 1/6/2021 | 12/23/2020 | 350 Holger Way | Office | NAP(7) | NAP(7) | NAP(7) | N | N | N | 100.0% | 100.0% | 100.0% | 100.0% |
| 11 | MSMCH | 1/4/2021 | 11/24/2020 | ExchangeRight Net Leased Portfolio #41 | Various | NAP(2) | NAP(2) | Y | N | N | N | 100.0% | 100.0% | 100.0% | 100.0% |
| 12 | WFB | 1/11/2021 | 10/30/2020 | Coleman Highline | Office | NAP(10) | Y | Y | N | N | N | 100.0% | 100.0% | 100.0% | 100.0% |
| 13 | MSMCH | 1/14/2021 | 10/27/2020 | Fresh Pond Cambridge | Retail | NAP(10) | Y | Y | N | N | Y(13) | 99.5% | 99.5% | 97.2% | 97.4% |
| 14 | NCB | 1/13/2021 | 12/29/2020 | Holliswood Owners Corp. | Multifamily | NAP(7) | NAP(7) | NAP(7) | N | N | N | 91.6%(14) | NAP(15) | 88.5%(14) | NAP(15) |
| 15 | MSMCH | 1/4/2021 | 11/13/2020 | Harvard West (Roseburg DHS Office) | Office | NAP(2) | NAP(2) | Y | N | N | N | 100.0% | 100.0% | (16) | (16) |
| 16 | MSMCH | 1/11/2021 | 12/23/2020 | 23000 Millcreek Boulevard | Office | NAP(7) | NAP(7) | NAP(7) | N | N | N | 100.0% | 100.0% | 100.0% | 100.0% |
| 17 | BANA | 12/31/2020 | 12/22/2020 | Laguna Hills Self Storage | Self Storage | NAP(7) | NAP(7) | NAP(7) | N | N | N | 99.5% | 97.0% | (16) | (16) |
| 18 | BANA | 1/14/2020 | 1/15/2021 | Newport Court | Industrial | NAP(7) | NAP(7) | NAP(7) | N | N | N | 100.0% | 100.0% | 100.0% | 100.0% |
| 19 | WFB | 1/14/2021 | 12/22/2020 | EZ Storage Southfield Portfolio | Self Storage | NAP(7) | NAP(7) | NAP(7) | N | N | N | 90.1% | 94.9% | (16) | (16) |
| 20 | MSMCH | 1/19/2021 | 1/14/2021 | Naiman Industrial Portfolio | Industrial | NAP(7) | NAP(7) | NAP(7) | N | N | N | 100.0% | 100.0% | 100.0% | 100.0% |
| 21 | WFB | 1/18/2021 | 9/30/2020 | Mission Ridge - CA | Retail | Y | Y | Y | N | N | Y(17) | 98.8%(18) | 98.4%(18) | 92.3%(18) | 94.3%(18) |
| 22 | WFB | 1/15/2021 | 12/23/2020 | All Aboard - 4 Property Portfolio | Various | NAP(7) | NAP(7) | NAP(7) | N | N | N | 95.4%(19) | 94.1%(19) | 95.4%(19) | 94.2%(19) |
| 23 | WFB | 1/20/2021 | 1/20/2021 | C.C. Filson World Headquarters | Mixed Use | NAP(7) | NAP(7) | NAP(7) | N | N | N | 100.0% | 100.0% | 100.0% | 100.0% |
| 24 | WFB | 1/13/2021 | 12/17/2020 | 100 & 200 Westlake - CA | Office | NAP(7) | NAP(7) | NAP(7) | N | N | N | 88.0%(20) | 90.0% | 88.0%(20) | 89.0% |
| 25 | BANA | 12/16/2020 | 12/16/2020 | Guardian Storage Bridgeville | Self Storage | NAP(7) | NAP(7) | NAP(7) | N | N | N | 98.4% | 98.5% | (16) | (16) |
| 26 | WFB | 1/14/2021 | 12/18/2020 | East Manchester Village | Retail | NAP(7) | NAP(7) | NAP(7) | N | N | Y(21) | 80.9%(22) | 89.0%(22) | 80.9%(22) | 89.5%(22) |
| 27 | MSMCH | 1/22/2021 | 12/23/2020 | 3900 Kinross | Office | NAP(7) | NAP(7) | NAP(7) | N | N | N | 100.0% | 100.0% | 100.0% | 100.0% |
| 28 | BANA | 12/16/2020 | 12/16/2020 | Guardian Storage Fox Chapel | Self Storage | NAP(7) | NAP(7) | NAP(7) | N | N | N | 100.0% | 100.0% | (16) | (16) |
| 29 | MSMCH | 1/6/2021 | 12/23/2020 | Apple Cupertino | Office | NAP(7) | NAP(7) | NAP(7) | N | N | N | 100.0% | 100.0% | 100.0% | 100.0% |
| 30 | BANA | 1/19/2021 | 1/15/2021 | Amazon - Hazleton, PA | Industrial | NAP(7) | NAP(7) | NAP(7) | N | N | N | 100.0% | 100.0% | 100.0% | 100.0% |
| 31 | MSMCH | 1/7/2021 | 12/2/2020 | Walgreens Anchorage AK | Retail | NAP(7) | NAP(7) | NAP(7) | N | N | N | 100.0% | 100.0% | 100.0% | 100.0% |
| 32 | MSMCH | 1/7/2021 | 12/21/2020 | Sunset Hills | Office | NAP(7) | NAP(7) | NAP(7) | N | N | Y(23) | 100.0% | 100.0% | 100.0% | 100.0% |
| 33 | NCB | 12/31/2020 | 1/12/2021 | 440 East 62nd St. Owners Corp. | Multifamily | NAP(7) | NAP(7) | NAP(7) | N | N | N | 94.0%(14) | NAP(15) | NAP(14) | NAP(15) |
| 34 | MSMCH | 1/21/2021 | 12/23/2020 | Quinnipiac Gardens | Multifamily | NAP(7) | NAP(7) | NAP(7) | N | N | Y(24) | 96.0% | 96.0% | (16) | (16) |
| 35 | WFB | 1/13/2021 | 12/31/2020 | Walgreens - Fresno | Retail | NAP(7) | NAP(7) | NAP(7) | N | N | N | NAP(25) | NAP(25) | 100.0% | 100.0% |
| 36 | WFB | 1/14/2021 | 12/21/2020 | Walgreens - Glenview | Retail | NAP(7) | NAP(7) | NAP(7) | N | N | N | 100.0% | 100.0% | 100.0% | 100.0% |
| 37 | MSMCH | 1/8/2021 | 12/15/2020 | A1 Access Self Storage | Self Storage | NAP(7) | NAP(7) | NAP(7) | N | N | N | 94.1% | 92.7% | (16) | (16) |
| 38 | MSMCH | 1/15/2021 | 12/30/2020 | 1049 5th Avenue | Office | NAP(7) | NAP(7) | NAP(7) | N | N | N | 100.0% | 100.0% | 100.0% | 100.0% |
| 39 | WFB | 1/18/2021 | 12/1/2020 | Hemet Self Storage | Self Storage | NAP(2) | NAP(2) | Y | N | N | N | (26) | (26) | (26) | (26) |
| 40 | MSMCH | 1/15/2021 | 12/10/2020 | Katy Station Business Park and West Belt | Various | NAP(7) | NAP(7) | NAP(7) | N | N | Y(27) | 100.0% | 100.0% | 100.0% | 100.0% |
| 41 | BANA | 1/8/2021 | 12/10/2020 | 45-26 44th Street | Multifamily | NAP(7) | NAP(7) | NAP(7) | N | N | N | 100.0% | 100.0% | (16) | (16) |
| 42 | NCB | 1/11/2021 | 1/13/2021 | 25 West 13th Corp. | Multifamily | NAP(7) | NAP(7) | NAP(7) | N | N | N | 98.9%(14) | NAP(15) | 95.0%(14) | NAP(15) |
| 43 | NCB | 1/13/2021 | 12/29/2020 | Jackson 34 Realty Corp. | Multifamily | NAP(7) | NAP(7) | NAP(7) | N | N | N | 97.9%(14) | NAP(15) | 100.0%(14) | NAP(15) |
| 44 | WFB | 1/6/2021 | 12/11/2020 | 980 Fifth Avenue | Office | NAP(2) | NAP(2) | Y | N | N | N | 100.0% | 100.0% | 100.0% | 100.0% |
| 45 | MSMCH | 12/11/2020 | 12/11/2020 | Rent A Space Dunbar | Self Storage | NAP(7) | NAP(7) | NAP(7) | N | N | N | (9) | (9) | (9) | (9) |
| 46 | NCB | 1/13/2021 | 12/23/2020 | 365 Bronx River Road Owners, Inc. | Multifamily | NAP(7) | NAP(7) | NAP(7) | N | N | N | 95.4%(14) | NAP(15) | 95.4%(14) | NAP(15) |
| 47 | BANA | 1/11/2021 | 12/22/2020 | Ottawa Kansas MHC Portfolio | MHC | NAP(7) | NAP(7) | NAP(7) | N | N | N | 94.0%(28) | 94.0%(28) | 100.0%(28) | 100.0%(28) |
| 48 | MSMCH | 1/7/2021 | 1/4/2021 | Hawthorn Self Storage | Self Storage | NAP(7) | NAP(7) | NAP(7) | N | N | N | 99.0% | 99.0% | (16) | (16) |
| 49 | NCB | 1/13/2021 | 12/4/2020 | 3111 Tenant’s Corp. a/k/a 3111 Tenants Corp. | Multifamily | NAP(7) | NAP(7) | NAP(7) | N | N | N | 94.1%(14) | NAP(15) | 94.1%(14) | NAP(15) |
| 50 | NCB | 1/13/2021 | 12/29/2020 | Michelle Tenants Corp. | Multifamily | NAP(7) | NAP(7) | NAP(7) | N | N | N | 95.8%(14) | NAP(15) | 94.4%(14) | NAP(15) |
| 51 | NCB | 1/13/2021 | 12/30/2020 | Plaza East Owners Corp. | Multifamily | NAP(7) | NAP(7) | NAP(7) | N | N | N | 94.1%(14) | NAP(15) | 94.1%(14) | NAP(15) |
| 52 | NCB | 1/13/2021 | 1/8/2021 | Rugby Road Owners Corp. | Multifamily | NAP(7) | NAP(7) | NAP(7) | N | N | N | 95.9%(14) | NAP(15) | 91.8%(14) | NAP(15) |
| 53 | NCB | 12/31/2020 | 12/30/2020 | 575 Riverhouse Corp. | Multifamily | NAP(7) | NAP(7) | NAP(7) | N | N | N | 95.3%(14) | NAP(15) | NAP(14) | NAP(15) |
| 54 | NCB | 1/13/2021 | 12/30/2020 | 424 East 57th Street Tenants Corp. | Multifamily | NAP(7) | NAP(7) | NAP(7) | N | N | N | 100.0%(14) | NAP(15) | 100.0%(14) | NAP(15) |
| 55 | WFB | 1/20/2021 | 12/10/2020 | Walgreens – Laurel | Other | NAP(2) | NAP(2) | Y | N | N | N | 100.0% | 100.0% | 100.0% | 100.0% |
| 56 | NCB | 1/14/2021 | 12/29/2020 | 599 Wea Owners Corp. | Multifamily | NAP(7) | NAP(7) | NAP(7) | N | N | N | 100.0%(14) | NAP(15) | 96.3%(14) | NAP(15) |
| 57 | NCB | 12/31/2020 | 1/13/2021 | 30-40 Fleetwood Avenue Apartment Corp. | Multifamily | NAP(7) | NAP(7) | NAP(7) | N | N | N | 95.4%(14) | NAP(15) | NAP(14) | NAP(15) |
| 58 | NCB | 1/13/2021 | 12/23/2020 | 57 Thompson Corp. | Multifamily | NAP(7) | NAP(7) | NAP(7) | N | N | N | 87.5%(14) | NAP(15) | 96.9%(14) | NAP(15) |
| 59 | NCB | 1/13/2021 | 12/29/2020 | 2 W. 90th St. Housing Corp. | Multifamily | NAP(7) | NAP(7) | NAP(7) | N | N | N | 100.0%(14) | NAP(15) | 100.0%(14) | NAP(15) |
| 60 | NCB | 1/13/2021 | 12/29/2020 | Grand Liberte Cooperative, Inc. | Multifamily | NAP(7) | NAP(7) | NAP(7) | N | N | N | 90.0%(14) | NAP(15) | 70.0%(14) | NAP(15) |
| 61 | NCB | 1/13/2021 | 12/15/2020 | 362 West Broadway Cooperative Corp. | Multifamily | NAP(7) | NAP(7) | NAP(7) | N | N | N | 87.5%(14) | NAP(15) | 87.5%(14) | NAP(15) |
THE INFORMATION IN THIS STRUCTURAL AND COLLATERAL TERM SHEET IS NOT COMPLETE AND MAY BE AMENDED PRIOR TO THE TIME OF SALE. THIS TERM SHEET IS NOT AN OFFER TO SELL THESE SECURITIES AND IT IS NOT A SOLICITATION OF AN OFFER TO BUY THESE SECURITIES IN ANY JURISDICTION WHERE THE OFFER OR SALE IS NOT PERMITTED.
7
| BANK 2021-BNK31 | Transaction Highlights |
| (1) | Except as otherwise stated, Total SF or Unit Count Making Full December Rent Payment (%) and Total SF or Unit Count Making Full January Rent Payment (%) are presented as percentages of the total net rentable area. With respect to the McClellan Park mortgage loan and with respect to the mortgage loans secured by residential cooperative properties, Total SF or Unit Count Making Full Rent Payment and UW Base Rent Paid percentages are based on occupied rather than total SF. |
| (2) | The related mortgage loan has its first due date in January 2021. |
| (3) | With respect to the McClellan Park mortgaged property, six tenants, representing 5.7% of the NRA have requested rent relief. |
| (4) | With respect to the 605 Third Avenue mortgage loan, the borrower has reported that six tenants (16.8% of NRA and 15.6% of underwritten base rent) at the 605 Third Avenue Property have been granted deferrals of rent by the 605 Third Avenue Borrower. Five of the six tenants (16.1% of NRA and 14.5% of underwritten base rent) were granted between 3 and 5 months of deferred rent with repayment over fixed periods commencing on various dates in 2020 and 2021. One of the five tenants (0.7% of NRA and 1.1% of underwritten base rent) was granted deferred rent from January through June 2021, of which 50% was forgiven and the remaining deferred amount is required to be repaid across 24 monthly installments beginning January 1, 2022. |
| (5) | With respect to the Miami Design District mortgaged property, as of April 29, 2020, the borrower entered into a loan modification to defer debt service payments for May, June and July 2020, which are payable on the earlier of the maturity date or when the loan is paid in full. On December 1, 2020, the borrower deposited $10,474,740 as a debt service reserve which, provided that no event of default is continuing, will be applied to supplement any debt service payments beginning as early as January 1, 2021. |
| (6) | With respect to the Miami Design District mortgaged property, five tenants (3.5% of NRA and 4.5% of underwritten base rent) fully or partially abated their rent for December 2020. Three tenants (1.0% of NRA and 1.2% of underwritten base rent) fully or partially abated their rent for January 2021. Two tenants (4.2% of NRA and 3.1% of underwritten base rent) partially deferred their rent for December 2020. |
| (7) | The related mortgage loan has its first due date in February or March 2021. |
| (8) | With respect to the 250 West 57th Street mortgaged property, ten tenants (16.2% of NRA and 16.8% of underwritten base rent) requested rent relief and five of such tenants (9.4% of NRA and 10.6% of underwritten base rent) were granted rent relief. Three of such five tenants (6.1% of NRA and 6.6% of underwritten base rent) were granted between 1 and 3 months of deferred rent with repayment over fixed periods. One of such five tenants (3.2% of NRA and 3.9% of underwritten base rent) is in discussions with the borrower regarding a rent deferral plan. One of such five tenants (0.1% of NRA and 0.1% of underwritten base rent) is paying 25% of their monthly gross sales from April to December 2020 and is required to resume paying fixed rent in January 2021. |
| (9) | Given the timing of collection and reporting, an accurate estimate of the percentage of tenants paying rent in December and January is not available. |
| (10) | The related mortgage loan had its first due date in December 2020. |
| (11) | With respect to the McDonald’s Global HQ mortgaged property, the second largest tenant, Politan Row (1.8% of NRA and 2.1% of underwritten base rent), closed from April to July, in compliance with local COVID-19 regulations. The tenant re-opened for outdoor dining in August, and recently announced that it was closing temporarily for the winter, with plans to re-open in the spring of 2021. The tenant is under a rent abatement period till June 2021, such free rent was fully reserved at origination. |
| (12) | With respect to the Inland SE Self Storage Portfolio mortgaged properties, information based on the NRA or unit count was not available. |
| (13) | With respect to the Fresh Pond Cambridge mortgage loan, the borrower has reported that three tenants were granted some form of rent relief. TJ Maxx/Homegoods (15.6% of NRA and 21.6% of underwritten rent) was granted deferred rent from June to August 2020 with repayment expected in six equal installments starting in January 2021. The tenant made its first repayment of deferred rent as agreed. Mattress Firm (2.0% of NRA and 3.0% of underwritten rent) was granted deferred rent from March to May 2020, of which 50% was forgiven and the remaining deferred amount is required to be repaid across six equal installments starting in January 2021. The tenant made its first repayment of deferred rent as agreed. All Dental (1.1% of NRA and 1.9% of underwritten rent) was granted rent relief from April to May 2020 and repayment was received in October 2020. |
| (14) | For residential cooperative properties, the percentages reported were determined based on available cooperative maintenance receivables reports provided from the borrowers (although the borrowers were not required, pursuant to the loan documents, to furnish those reports). Generally, this information is not tracked for residential cooperative properties and the borrowers are not required, pursuant to the loan documents, to report this data on a monthly basis. |
| (15) | This information is not presented for residential cooperative properties. The base rent represented in the cash flow for residential cooperative properties is the hypothetical income derived from the appraisal. Residential cooperative properties are structured to allow for an increase in unit owner maintenance charges or the assessment of additional charges to cover operating deficits, including deficits resulting from unpaid or delinquent rents or maintenance charges. |
| (16) | Given the timing of collection and reporting, an accurate estimate of the percentage of tenants paying rent in January is not available. |
| (17) | With respect to the Mission Ridge – CA mortgaged property, nine tenants accounting for 30.7% of underwritten base rent and 26.3% of the NRA (including one tenant, representing 1.6% of NRA, that was underwritten as vacant) received rent abatements ranging from one to three months, all of which ended by July 2020. The abated rents were forgiven. |
| (18) | With respect to the Mission Ridge – CA mortgaged property, one tenant (2.6% of NRA and 2.5% of underwritten base rent), made a partial rent payment. Excluding that tenant, the total SF of the mortgaged property making full December and January rent payments is 96.3% and 89.7%, respectively. One tenant underwritten as vacant (1.6% of the NRA) made full December and January rent payments. Including this tenant in total rent collections for December and January based on underwritten base rent is 105.3% and 94.5% of underwritten base rent, respectively. |
| (19) | Represents payment information related to the self storage properties in the All Aboard – 4 Property Portfolio (Big Tree Depot property, Daytona Depot Property, and Hand & Younge Property). The office property (Clark Office Building) reported that 100% of NRA and 100% of base rent made their full December and January rent payments. |
| (20) | With respect to the 100 & 200 Westlake – CA mortgaged property, 9.6% of the NRA is vacant. One tenant (2.4% of NRA and 2.7% of underwritten base rent), has not paid rent in December or January but is in discussions with the borrower to create a payment plan. |
| (21) | With respect to the East Manchester Village, five tenants (6.8% of the NRA and 12.9% of underwritten base rent), were granted rent deferrals for two or three months between April and June 2020. One tenant (15.5% of NRA and 11.0% of underwritten base rent) was not granted its requested rent relief and has been operating under a settlement agreement since October 2020. |
| (22) | With respect to the East Manchester Village, one tenant (15.5% of NRA and 11.0% of underwritten base rent), has not paid its rent in December or January. |
| (23) | With respect to the Sunset Hills mortgaged property, Progress Residential (7.5% of NRA and 7.4% of underwritten base rent) was granted rent relief from April through June 2020, which is now being repaid at an additional $1,989 per month through July 2021 and After-School All Stars (3.9% of NRA and 3.6% of underwritten base rent) was granted rent relief for the month of April 2020, which rent was deferred to the end of their lease term with the lease extended one month. |
| (24) | With respect to the Quinnipiac Gardens mortgaged property, according to the borrower sponsor, five out of the 71 units were granted rent relief. |
| (25) | With respect to the Walgreens Fresno mortgaged property, the lease commenced on December 30, 2020; therefore, no December rent was paid. |
| (26) | With respect to the Hemet Self Storage mortgaged property, due to the recent acquisition and transition to a new property manager, accurate accounts receivable information is not available. |
| (27) | With respect to the Katy Station Business Park and West Belt mortgaged property, S&D Threads (4.2% of NRA and 3.8% of underwritten rent) was granted 100% rent forgiveness for April and May 2020 and was granted rent relief from June to August 2020, of which 40% was forgiven and the remaining deferred amount was repaid. The tenant is back to making regular rent payment and is not in arrears. 9Rounds Fitness (2.3% of NRA and 3.8% of underwritten rent) was granted rent relief for May and June 2020 due to mandatory closure during the COVID-19 pandemic. The tenant has started repayment and owes a remaining amount of $1,000. Otherwise, the tenant is current on rent. |
| (28) | Collections for Ottawa Kansas MHC Portfolio mortgaged property are not formally reported. The numbers shown are estimates by the borrower sponsor. |
See “Risk Factors—Risks Related to Market Conditions and Other External Factors—The Coronavirus Pandemic Has Adversely Affected the Global Economy and Will Likely Adversely Affect the Performance of the Mortgage Loans”.
THE INFORMATION IN THIS STRUCTURAL AND COLLATERAL TERM SHEET IS NOT COMPLETE AND MAY BE AMENDED PRIOR TO THE TIME OF SALE. THIS TERM SHEET IS NOT AN OFFER TO SELL THESE SECURITIES AND IT IS NOT A SOLICITATION OF AN OFFER TO BUY THESE SECURITIES IN ANY JURISDICTION WHERE THE OFFER OR SALE IS NOT PERMITTED.
8
| BANK 2021-BNK31 | Issue Characteristics |
| IV. | Issue Characteristics |
| Securities Offered: | $768,559,000 approximate monthly pay, multi-class, commercial mortgage REMIC pass-through certificates consisting of twenty-nine classes (Classes A-1, A-SB, A-3, A-3-1, A-3-2, A-3-X1, A-3-X2, A-4, A-4-1, A-4-2, A-4-X1, A-4-X2, A-S, A-S-1, A-S-2, A-S-X1, A-S-X2, B, B-1, B-2, B-X1, B-X2, C, C-1, C-2, C-X1, C-X2, X-A and X-B), which are offered pursuant to a registration statement filed with the SEC (such Classes of certificates, the “Offered Certificates”). |
| Mortgage Loan Sellers: | Wells Fargo Bank, National Association (“WFB”), Morgan Stanley Mortgage Capital Holdings LLC (“MSMCH”), Bank of America, National Association (“BANA”) and National Cooperative Bank, N.A. (“NCB”). |
| Joint Bookrunners and Co-Lead Managers: | Wells Fargo Securities, LLC, BofA Securities, Inc. and Morgan Stanley & Co. LLC |
| Co-Manager: | Academy Securities, Inc. and Drexel Hamilton, LLC |
| Rating Agencies: | Fitch Ratings, Inc., Kroll Bond Rating Agency, LLC and S&P Global Ratings |
| Master Servicers: | Wells Fargo Bank, National Association and National Cooperative Bank, N.A. |
| Special Servicers: | KeyBank National Association and National Cooperative Bank, N.A. |
| Certificate Administrator: | Wells Fargo Bank, National Association |
| Trustee: | Wilmington Trust, National Association |
| Operating Advisor: | Park Bridge Lender Services LLC |
| Asset Representations Reviewer: | Park Bridge Lender Services LLC |
| U.S. Credit Risk Retention: | For a discussion of the manner in which the U.S. credit risk retention requirements are being addressed by Wells Fargo Bank, National Association, as the retaining sponsor, see “Credit Risk Retention” in the Preliminary Prospectus. |
| EU Securitization Regulation and UK Securitization Regulation: | None of the sponsors, the depositor or the underwriters or their respective affiliates, or any other person, intends to retain a material net economic interest in the securitization constituted by the issue of the certificates, or to take any other action in respect of such securitization, in a manner prescribed or contemplated by the EU Securitization Regulation or the UK Securitization Regulation. In particular, no such person undertakes to take any action which may be required by any potential investor or certificateholder for the purposes of its compliance with any requirement of the EU Securitization Regulation or the UK Securitization Regulation. In addition, the arrangements described under “Credit Risk Retention” in the Preliminary Prospectus have not been structured with the objective of ensuring compliance by any person with any requirement of the EU Securitization Regulation or the UK Securitization Regulation. Consequently, the Offered Certificates may not be a suitable investment for investors that are subject to any requirement of the EU Securitization Regulation or the UK Securitization Regulation. See “Risk Factors—Other Risks Relating to the Certificates—EU Securitization Regulation and UK Securitization Regulation” in the Preliminary Prospectus. |
| Initial Risk Retention Consultation Party: | Wells Fargo Bank, National Association |
| Initial Majority Controlling Class Certificateholder: | LD II Holdco XIV, LLC or its affiliate |
| Cut-off Date: | The Cut-off Date with respect to each mortgage loan is the due date for the monthly debt service payment that is due in February 2021 (or, in the case of any mortgage loan that has its first due date after February 2021, the date that would have been its due date in February 2021 under the terms of that mortgage loan if a monthly debt service payment were scheduled to be due in that month). |
| Expected Closing Date: | On or about February 11, 2021. |
| Determination Dates: | The 11th day of each month (or if that day is not a business day, the next succeeding business day), commencing in March 2021. |
| Distribution Dates: | The fourth business day following the Determination Date in each month, commencing in March 2021. |
THE INFORMATION IN THIS STRUCTURAL AND COLLATERAL TERM SHEET IS NOT COMPLETE AND MAY BE AMENDED PRIOR TO THE TIME OF SALE. THIS TERM SHEET IS NOT AN OFFER TO SELL THESE SECURITIES AND IT IS NOT A SOLICITATION OF AN OFFER TO BUY THESE SECURITIES IN ANY JURISDICTION WHERE THE OFFER OR SALE IS NOT PERMITTED.
9
| BANK 2021-BNK31 | Issue Characteristics |
| Rated Final Distribution Date: | The Distribution Date in February 2054. |
| Interest Accrual Period: | With respect to any Distribution Date, the calendar month immediately preceding the month in which such Distribution Date occurs. |
| Day Count: | The Offered Certificates will accrue interest on a 30/360 basis. |
| Minimum Denominations: | $10,000 for each Class of Offered Certificates (other than the Class X-A and X-B Certificates) and $1,000,000 for the Class X-A and X-B Certificates. Investments may also be made in any whole dollar denomination in excess of the applicable minimum denomination. |
| Clean-up Call: | 1.0% |
| Delivery: | DTC, Euroclear and Clearstream Banking |
| ERISA/SMMEA Status: | Each Class of Offered Certificates is expected to be eligible for exemptive relief under ERISA. No Class of Offered Certificates will be SMMEA eligible. |
| Risk Factors: | THE CERTIFICATES INVOLVE CERTAIN RISKS AND MAY NOT BE SUITABLE FOR ALL INVESTORS. SEE THE “SUMMARY OF RISK FACTORS” AND “RISK FACTORS” SECTIONS OF THE PRELIMINARY PROSPECTUS. |
| Bond Analytics Information: | The Certificate Administrator will be authorized to make distribution date statements, CREFC® reports and certain supplemental reports (other than confidential information) available to certain financial modeling and data provision services, including Bloomberg, L.P., Trepp, LLC, Intex Solutions, Inc., Markit Group Limited, Interactive Data Corp., BlackRock Financial Management, Inc., CMBS.com, Inc., Moody’s Analytics, Inc., KBRA Analytics, LLC, MBS Data, LLC, RealInsight and Thomson Reuters Corporation. |
| Tax Treatment | For U.S. federal income tax purposes, the issuing entity will consist of one or more REMICs arranged in a tiered structure and a trust (the “grantor trust”). The upper-most REMIC will issue REMIC regular interests some of which will be held by the grantor trust (such grantor trust-held REMIC regular interests, the “trust components”). The Offered Certificates (other than the Exchangeable Certificates) will represent REMIC regular interests (other than the trust components). The Exchangeable Certificates will represent beneficial ownership of one or more of the trust components held by the grantor trust. |
THE INFORMATION IN THIS STRUCTURAL AND COLLATERAL TERM SHEET IS NOT COMPLETE AND MAY BE AMENDED PRIOR TO THE TIME OF SALE. THIS TERM SHEET IS NOT AN OFFER TO SELL THESE SECURITIES AND IT IS NOT A SOLICITATION OF AN OFFER TO BUY THESE SECURITIES IN ANY JURISDICTION WHERE THE OFFER OR SALE IS NOT PERMITTED.
10
| BANK 2021-BNK31 | Characteristics of the Mortgage Pool |
| V. | Characteristics of the Mortgage Pool(1) |
| A. | Ten Largest Mortgage Loans |
| Mortgage Loan Seller | Mortgage Loan Name | City | State | Number of Mortgage Loans / Mortgaged Properties | Mortgage Loan Cut-off Date Balance ($) | % of Initial Pool Balance (%) | Property Type | Number of SF | Cut-off Date Balance Per SF ($) | Cut-off Date LTV Ratio (%) | Balloon or ARD LTV Ratio (%) | U/W NCF DSCR (x) | U/W NOI Debt Yield (%) |
| WFB | McClellan Park | McClellan | CA | 1 / 1 | $90,000,000 | 9.9% | Industrial | 6,925,484 | $52 | 60.2% | 60.2% | 2.90x | 10.5% |
| MSMCH | 605 Third Avenue | New York | NY | 1 / 1 | 80,000,000 | 8.8 | Office | 1,027,736 | 225 | 33.7 | 33.7 | 6.61 | 13.9 |
| BANA | Miami Design District | Miami | FL | 1 / 1 | 80,000,000 | 8.8 | Retail | 497,094 | 805 | 46.7 | 46.7 | 2.14 | 9.3 |
| BANA | ExchangeRight Net Leased Portfolio #42 | Various | Various | 1 / 14 | 40,495,000 | 4.5 | Various | 222,970 | 182 | 59.7 | 59.7 | 2.70 | 9.4 |
| MSMCH | 250 West 57th Street | New York | NY | 1 / 1 | 38,000,000 | 4.2 | Office | 543,743 | 331 | 54.5 | 54.5 | 3.49 | 11.1 |
| WFB | ExchangeRight REIT 2 | Various | Various | 1 / 13 | 37,564,000 | 4.1 | Various | 289,623 | 130 | 63.0 | 63.0 | 2.61 | 9.3 |
| BANA | U-Haul AREC Portfolio 43 | Various | Various | 1 / 11 | 36,917,578 | 4.1 | Self Storage | 410,161 | 90 | 48.2 | 33.1 | 1.90 | 10.8 |
| BANA | McDonald’s Global HQ | Chicago | IL | 1 / 1 | 34,555,371 | 3.8 | Office | 575,018 | 292 | 41.0 | 16.9 | 1.45 | 11.9 |
| WFB | Inland SE Self Storage Portfolio | Various | Various | 1 / 5 | 32,600,000 | 3.6 | Self Storage | 407,213 | 80 | 58.7 | 52.2 | 1.85 | 9.5 |
| WFB | 350 Holger Way | San Jose | CA | 1 / 1 | 30,900,000 | 3.4 | Office | 96,502 | 320 | 61.2 | 61.2 | 3.11 | 11.0 |
| Top Three Total/Weighted Average | 3 / 3 | $250,000,000 | 27.6% | 47.4% | 47.4% | 3.84x | 11.2% | ||||||
| Top Five Total/Weighted Average | 5 / 18 | $328,495,000 | 36.3% | 49.7% | 49.7% | 3.66x | 11.0% | ||||||
| Top Ten Total/Weighted Average | 10 / 49 | $501,031,948 | 55.4% | 51.3% | 48.1% | 3.15x | 10.8% | ||||||
| Non-Top Ten Total/Weighted Average | 51 / 77 | $404,154,456 | 44.6% | 53.2% | 50.3% | 3.37x | 13.8% | ||||||
| (1) | With respect to any mortgage loan that is part of a whole loan, Cut-off Date Balance Per SF loan-to-value ratio, debt service coverage ratio and debt yield calculations include the related pari passu companion loan(s) but exclude any related subordinate companion loan(s) (unless otherwise stated). With respect to each mortgage loan, debt service coverage ratio, debt yield and loan-to-value ratio information do not take into account subordinate debt (whether or not secured by the related mortgaged property), if any, that currently exists or is allowed under the terms of such mortgage loan. |
THE INFORMATION IN THIS STRUCTURAL AND COLLATERAL TERM SHEET IS NOT COMPLETE AND MAY BE AMENDED PRIOR TO THE TIME OF SALE. THIS TERM SHEET IS NOT AN OFFER TO SELL THESE SECURITIES AND IT IS NOT A SOLICITATION OF AN OFFER TO BUY THESE SECURITIES IN ANY JURISDICTION WHERE THE OFFER OR SALE IS NOT PERMITTED.
11
| BANK 2021-BNK31 | Characteristics of the Mortgage Pool |
| B. | Summary of the Whole Loans |
| No. | Property Name | Mortgage Loan Seller in BANK 2021-BNK31 | Trust Cut-off Date Balance | Aggregate Pari-Passu Companion Loan Cut-off Date Balance(1) | Controlling Pooling / Trust & Servicing Agreement | Master Servicer | Special Servicer | Related Pari Passu Companion Loan(s) Securitizations | Related Pari Passu Companion Loan(s) Original Balance | |
| 1 | McClellan Park | WFB | $90,000,000 | $268,000,000 | BANK 2020-BNK30 | Wells Fargo Bank, National Association | Greystone Servicing Company LLC | BANK 2020-BNK30 | $75,000,000 | |
| WFCM 2020-C58 | $69,000,000 | |||||||||
| BMARK 2020-B21 | $75,000,000 | |||||||||
| BMARK 2020-B22 | $32,400,000 | |||||||||
| Future Securitization(s) | $16,600,000 | |||||||||
| 2 | 605 Third Avenue | MSMCH | $80,000,000 | $151,000,000 | BANK 2020-BNK30 | Wells Fargo Bank, National Association | Greystone Servicing Company LLC | BANK 2020-BNK30 | $80,000,000 | |
| Future Securitization(s) | $71,000,000 | |||||||||
| 3 | Miami Design District | BANA | $80,000,000 | $320,000,000 | BANK 2020-BNK30(2) | Wells Fargo Bank, National Association(2) | Greystone Servicing Company LLC(2) | BANK 2020-BNK30 | $75,000,000 | |
| Future Securitization(s) | $245,000,000 | |||||||||
| 5 | 250 West 57th Street | MSMCH | $38,000,000 | $142,000,000 | BANK 2020-BNK29 | Wells Fargo Bank, National Association | Rialto Capital Advisors, LLC | BANK 2020-BNK29 | $87,000,000 | |
| BANK 2020-BNK30 | $55,000,000 | |||||||||
| 8 | McDonald’s Global HQ | BANA | $34,555,371 | $133,285,001 | BANK 2020-BNK30 | Wells Fargo Bank, National Association | Greystone Servicing Company LLC | BANK 2020-BNK29 | $50,000,000 | |
| BANK 2020-BNK30 | $70,000,000 | |||||||||
| Future Securitization(s) | $15,000,000 | |||||||||
| 11 | ExchangeRight Net Leased Portfolio #41 | MSMCH | $26,338,000 | $40,000,000 | BANK 2020-BNK30 | Wells Fargo Bank, National Association | Greystone Servicing Company LLC | BANK 2020-BNK30 | $40,000,000 | |
| 12 | Coleman Highline | WFB | $22,000,000 | $145,700,000 | BANK 2020-BNK29 | Wells Fargo Bank, National Association | Rialto Capital Advisors, LLC | BANK 2020-BNK29 | $85,000,000 | |
| BANK 2020-BNK30 | $60,700,000 | |||||||||
| 13 | Fresh Pond Cambridge | MSMCH | $20,000,000 | $30,000,000 | BANK 2020-BNK30 | Wells Fargo Bank, National Association | Greystone Servicing Company LLC | BANK 2020-BNK30 | $30,000,000 | |
| (1) | The Aggregate Pari Passu Companion Loan Cut-off Date Balance excludes the related Subordinate Companion Loans. |
| (2) | The related whole loan is expected to initially be serviced under the BANK 2020-BNK30 securitization pooling and servicing agreement until the securitization of the related “lead” pari passu note, after which the related whole loan will be serviced under the pooling and servicing agreement governing such securitization of the related “lead” pari passu note. The master servicer and special servicer for such securitization will be identified in a notice, report or statement to holders of the BANK 2021-BNK31 certificates after the closing of such securitization. Pursuant to the related co-lender agreement, the holder of Note B is the controlling noteholder unless a “control appraisal period” has occurred and is continuing under the co-lender agreement, in which case Note A-1 will become the controlling noteholder. |
THE INFORMATION IN THIS STRUCTURAL AND COLLATERAL TERM SHEET IS NOT COMPLETE AND MAY BE AMENDED PRIOR TO THE TIME OF SALE. THIS TERM SHEET IS NOT AN OFFER TO SELL THESE SECURITIES AND IT IS NOT A SOLICITATION OF AN OFFER TO BUY THESE SECURITIES IN ANY JURISDICTION WHERE THE OFFER OR SALE IS NOT PERMITTED.
12
| BANK 2021-BNK31 | Characteristics of the Mortgage Pool |
| C. | Mortgage Loans with Additional Secured and Mezzanine Financing(1) |
| Loan No. | Mortgage Loan Seller | Mortgage Loan Name | Mortgage Loan Cut-off Date Balance ($) | % of Cut-off Date Balance (%) | Sub Debt Cut-off Date Balance ($) | Mezzanine Debt Cut-off Date Balance ($) | Total Debt Interest Rate (%)(2) | Mortgage Loan U/W NCF DSCR (x)(3) | Total Debt U/W NCF DSCR (x) | Mortgage Loan Cut-off Date U/W NOI Debt Yield (%)(3) | Total Debt Cut-off Date U/W NOI Debt Yield (%) | Mortgage Loan Cut-off Date LTV Ratio (%)(3) | Total Debt Cut-off Date LTV Ratio (%) |
| 2 | MSMCH | 605 Third Avenue | $80,000,000 | 8.8% | $78,000,000 | $91,000,000 | 2.8680% | 6.61x | 2.58x | 13.9% | 8.0% | 33.7% | 58.4% |
| 3 | BANA | Miami Design District | 80,000,000 | 8.8 | 100,000,000 | NAP | 4.1325 | 2.14 | 1.72 | 9.3 | 7.4 | 46.7 | 58.4 |
| 8 | BANA | McDonald’s Global HQ | 34,555,371 | 3.8 | 110,000,000 | NAP | 2.9350 | 1.45 | 1.17 | 11.9 | 7.2 | 41.0 | 67.9 |
| Total/Weighted Average | $194,555,371 | 21.5% | $288,000,000 | $91,000,000 | 3.3999% | 3.86x | 1.98x | 11.7% | 7.6% | 40.3% | 60.1% | ||
| (1) | In addition, fifteen (15) of the mortgage loans, each of which is secured by a residential cooperative property sold to the depositor by National Cooperative Bank, N.A, currently have in place either (i) Subordinate Coop LOCs or (ii) a Subordinate Wrap Mortgage. See “Description of the Mortgage Pool—Additional Indebtedness—Other Unsecured Indebtedness” and “Description of the Mortgage Pool—Additional Indebtedness—Other Secured Indebtedness—Additional Debt Financing for Mortgage Loans Secured by Residential Cooperatives Sold to the Depositor by National Cooperative Bank, N.A.” in the Preliminary Prospectus. |
| (2) | Total Debt Interest Rate for any specified mortgage loan reflects the weighted average of the interest rates on the respective components of the total debt. |
| (3) | With respect to any mortgage loan that is part of a whole loan, the loan-to-value ratio, debt service coverage ratio and debt yield calculations include the related pari passu companion loan(s) but exclude any related subordinate companion loan(s) (unless otherwise stated). |
THE INFORMATION IN THIS STRUCTURAL AND COLLATERAL TERM SHEET IS NOT COMPLETE AND MAY BE AMENDED PRIOR TO THE TIME OF SALE. THIS TERM SHEET IS NOT AN OFFER TO SELL THESE SECURITIES AND IT IS NOT A SOLICITATION OF AN OFFER TO BUY THESE SECURITIES IN ANY JURISDICTION WHERE THE OFFER OR SALE IS NOT PERMITTED.
13
| BANK 2021-BNK31 | Characteristics of the Mortgage Pool |
| D. | Previous Securitization History(1) |
| Loan No. | Mortgage Loan Seller | Mortgage Loan or Mortgaged Property Name | City | State | Property Type | Mortgage Loan or Mortgaged Property Cut-off Date Balance ($) | % of Initial Pool Balance (%) | Previous Securitization |
| 13 | MSMCH | Fresh Pond Cambridge | Cambridge | MA | Retail | $20,000,000 | 2.2% | JPMDB 2016-C4 |
| 14 | NCB | Holliswood Owners Corp. | Hollis | NY | Multifamily | 19,967,346 | 2.2 | BANK 2017-BNK5 |
| 19 | WFB | EZ Storage Southfield Portfolio | Southfield | MI | Self Storage | 15,000,000 | 1.7 | COMM 2013-CRE7 |
| 21 | WFB | Mission Ridge - CA | Manteca | CA | Retail | 14,400,000 | 1.6 | WFCM 2015-C26 |
| 22 | WFB | All Aboard - 4 Property Portfolio | Various | FL | Various | 13,679,202 | 1.5 | UBSBB 2013-C5 |
| 25 | BANA | Guardian Storage Bridgeville | Bridgeville | PA | Self Storage | 11,505,000 | 1.3 | JPMCC 2012-CBX |
| 28 | BANA | Guardian Storage Fox Chapel | Pittsburgh | PA | Self Storage | 9,230,000 | 1.0 | JPMCC 2012-CBX |
| 29 | MSMCH | Apple Cupertino | Cupertino | CA | Office | 9,000,000 | 1.0 | MSBAM 2015-C24 |
| 39 | WFB | Hemet Self Storage | Hemet | CA | Self Storage | 4,400,000 | 0.5 | CSAIL 2015-C3 |
| 50 | NCB | Michelle Tenants Corp. | Bayside | NY | Multifamily | 2,496,101 | 0.3 | WFRBS 2014-C22 |
| Total | $119,677,649 | 13.2% |
| (1) | The table above represents the most recent securitization with respect to the mortgaged property securing the related mortgage loan, based on information provided by the related borrower or obtained through searches of a third-party database. While loans secured by the above mortgaged properties may have been securitized multiple times in prior transactions, mortgage loans in this securitization are only listed in the above chart if the mortgage loan paid off a loan in another securitization. The information has not otherwise been confirmed by the mortgage loan sellers. |
THE INFORMATION IN THIS STRUCTURAL AND COLLATERAL TERM SHEET IS NOT COMPLETE AND MAY BE AMENDED PRIOR TO THE TIME OF SALE. THIS TERM SHEET IS NOT AN OFFER TO SELL THESE SECURITIES AND IT IS NOT A SOLICITATION OF AN OFFER TO BUY THESE SECURITIES IN ANY JURISDICTION WHERE THE OFFER OR SALE IS NOT PERMITTED.
14
| BANK 2021-BNK31 | Characteristics of the Mortgage Pool |
| E. | Property Type Distribution(1) |
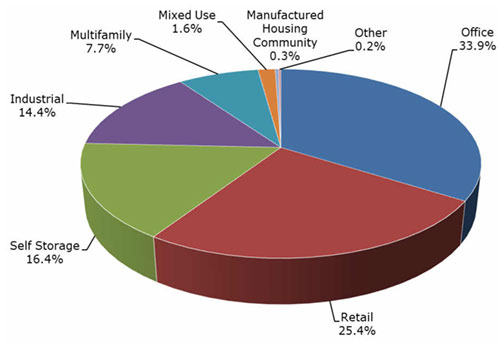
| Property Type | Number of Mortgaged Properties | Aggregate Cut-off Date Balance ($) | % of Cut-off Date Balance (%) | Weighted Average Cut-off Date LTV Ratio (%) | Weighted Average Balloon or ARD LTV Ratio (%) | Weighted Average U/W NCF DSCR (x) | Weighted Average U/W NOI Debt Yield (%) | Weighted Average U/W NCF Debt Yield (%) | Weighted Average Mortgage Rate (%) | |||||||||||||||||
| Office | 20 | $306,991,814 | 33.9 | % | 50.8 | % | 47.6 | % | 3.83 | x | 11.7 | % | 11.0 | % | 2.8292 | % | ||||||||||
| CBD | 3 | 152,555,371 | 16.9 | 40.5 | 35.1 | 4.66 | 12.7 | 12.0 | 2.3855 | |||||||||||||||||
| Suburban | 10 | 131,866,964 | 14.6 | 61.4 | 60.3 | 3.08 | 10.9 | 10.1 | 3.2242 | |||||||||||||||||
| Medical | 7 | 22,569,480 | 2.5 | 57.8 | 57.8 | 2.54 | 9.3 | 8.9 | 3.5203 | |||||||||||||||||
| Retail | 46 | 229,877,520 | 25.4 | 55.3 | 54.3 | 2.43 | 9.6 | 9.3 | 3.6508 | |||||||||||||||||
| Single Tenant | 42 | 105,477,520 | 11.7 | 61.1 | 61.1 | 2.61 | 9.2 | 9.0 | 3.4098 | |||||||||||||||||
| Luxury Retail | 1 | 80,000,000 | 8.8 | 46.7 | 46.7 | 2.14 | 9.3 | 9.0 | 4.1325 | |||||||||||||||||
| Anchored | 3 | 44,400,000 | 4.9 | 57.1 | 51.8 | 2.54 | 11.1 | 10.4 | 3.3553 | |||||||||||||||||
| Self Storage | 28 | 148,619,816 | 16.4 | 58.3 | 50.4 | 2.17 | 9.9 | 9.7 | 3.1132 | |||||||||||||||||
| Self Storage | 28 | 148,619,816 | 16.4 | 58.3 | 50.4 | 2.17 | 9.9 | 9.7 | 3.1132 | |||||||||||||||||
| Industrial | 8 | 130,644,000 | 14.4 | 56.2 | 55.7 | 2.86 | 10.7 | 9.8 | 3.3694 | |||||||||||||||||
| Warehouse | 2 | 92,649,000 | 10.2 | 60.3 | 60.3 | 2.89 | 10.5 | 9.7 | 3.3233 | |||||||||||||||||
| Manufacturing | 1 | 15,000,000 | 1.7 | 25.9 | 25.9 | 3.65 | 11.8 | 11.0 | 2.9700 | |||||||||||||||||
| Flex | 4 | 14,245,000 | 1.6 | 63.6 | 63.6 | 2.59 | 11.8 | 10.0 | 3.7882 | |||||||||||||||||
| Warehouse Distribution | 1 | 8,750,000 | 1.0 | 53.0 | 45.7 | 1.59 | 9.4 | 9.0 | 3.8600 | |||||||||||||||||
| Multifamily | 19 | 69,402,254 | 7.7 | 24.3 | 20.3 | 6.65 | 30.6 | 30.0 | 3.2142 | |||||||||||||||||
| Cooperative | 17 | 59,552,254 | 6.6 | 18.3 | 14.6 | 7.37 | 34.1 | 33.4 | 3.1738 | |||||||||||||||||
| Garden | 1 | 6,000,000 | 0.7 | 72.3 | 62.2 | 1.53 | 8.9 | 8.6 | 3.8100 | |||||||||||||||||
| Mid Rise | 1 | 3,850,000 | 0.4 | 42.3 | 42.3 | 3.38 | 10.3 | 10.0 | 2.9100 | |||||||||||||||||
| Mixed Use | 2 | 14,801,000 | 1.6 | 60.0 | 60.0 | 2.58 | 10.2 | 9.5 | 3.6322 | |||||||||||||||||
| Office/Industrial/Retail | 1 | 13,100,000 | 1.4 | 59.5 | 59.5 | 2.59 | 10.2 | 9.5 | 3.6260 | |||||||||||||||||
| Industrial/Retail | 1 | 1,701,000 | 0.2 | 64.0 | 64.0 | 2.52 | 10.1 | 9.4 | 3.6800 | |||||||||||||||||
| Manufactured Housing Community | 2 | 2,850,000 | 0.3 | 67.2 | 55.1 | 1.68 | 9.8 | 9.6 | 4.0400 | |||||||||||||||||
| Manufactured Housing Community | 2 | 2,850,000 | 0.3 | 67.2 | 55.1 | 1.68 | 9.8 | 9.6 | 4.0400 | |||||||||||||||||
| Other | 1 | 2,000,000 | 0.2 | 60.6 | 60.6 | 2.09 | 8.1 | 8.1 | 3.8170 | |||||||||||||||||
| Leased Fee | 1 | 2,000,000 | 0.2 | 60.6 | 60.6 | 2.09 | 8.1 | 8.1 | 3.8170 | |||||||||||||||||
| Total | 126 | $905,186,404 | 100.0 | % | 52.1 | % | 49.1 | % | 3.25 | x | 12.1 | % | 11.6 | % | 3.2111 | % | ||||||||||
| (1) | Because this table presents information relating to the mortgaged properties and not the mortgage loans, the information for mortgage loans secured by more than one mortgaged property is based on allocated loan amounts (allocating the principal balance of the mortgage loan to each of those properties according to the relative appraised values of the mortgaged properties or the allocated loan amounts or property-specific release prices set forth in the related mortgage loan documents or such other allocation as the related mortgage loan seller deemed appropriate). For mortgaged properties securing residential cooperative mortgage loans, the debt service coverage ratio and debt yield for each such mortgaged property is calculated using U/W Net Operating Income or U/W Net Cash Flow, as applicable, for the related residential cooperative property which is the projected net operating income or net cash flow, as applicable, reflected in the most recent appraisal obtained by or otherwise in the possession of the related mortgage loan seller as of the cut-off date and the loan-to-value ratio, is calculated based upon the appraised value of the residential cooperative property determined as if such residential cooperative property is operated as a residential cooperative, inclusive of the amount of the underlying debt encumbering such residential cooperative property. With respect to any mortgage loan that is part of a whole loan, the loan-to-value ratio, debt service coverage ratio and debt yield calculations include the related pari passu companion loan(s) but exclude any related subordinate companion loan(s) (unless otherwise stated). With respect to each mortgage loan, debt service coverage ratio, debt yield and loan-to-value ratio information do not take into account any subordinate debt (whether or not secured by the related mortgaged property) that currently exists or is allowed under the terms of such mortgage loan. See Annex A-1 to the Preliminary Prospectus. |
THE INFORMATION IN THIS STRUCTURAL AND COLLATERAL TERM SHEET IS NOT COMPLETE AND MAY BE AMENDED PRIOR TO THE TIME OF SALE. THIS TERM SHEET IS NOT AN OFFER TO SELL THESE SECURITIES AND IT IS NOT A SOLICITATION OF AN OFFER TO BUY THESE SECURITIES IN ANY JURISDICTION WHERE THE OFFER OR SALE IS NOT PERMITTED.
15
| BANK 2021-BNK31 | Characteristics of the Mortgage Pool |
| F. | Geographic Distribution(1)(2) |
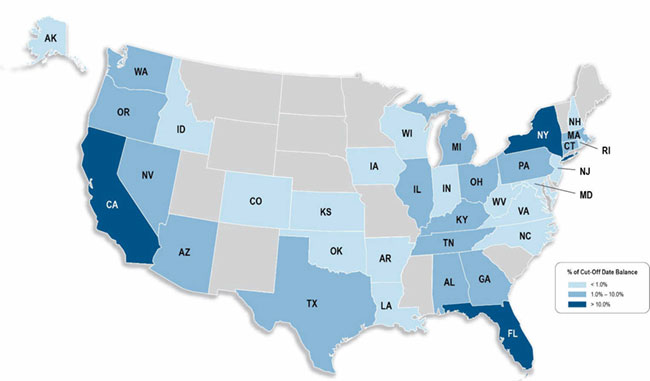
| Location | Number of Mortgaged Properties | Aggregate Cut-off Date Balance ($) | % of Cut-off Date Balance (%) | Weighted Average Cut-off Date LTV Ratio (%) | Weighted Average Balloon or ARD LTV Ratio (%) | Weighted Average U/W NCF DSCR (x) | Weighted Average U/W NOI Debt Yield (%) | Weighted Average U/W NCF Debt Yield (%) | Weighted Average Mortgage Rate (%) | ||||||||||||||||||
| California | 11 | $222,970,000 | 24.6 | % | 58.2 | % | 57.6 | % | 2.93 | x | 10.4 | % | 9.8 | % | 3.2483 | % | |||||||||||
| Northern California | 7 | 175,500,000 | 19.4 | 60.2 | 59.4 | 2.84 | 10.2 | 9.6 | 3.2873 | ||||||||||||||||||
| Southern California | 4 | 47,470,000 | 5.2 | 50.8 | 50.8 | 3.29 | 10.8 | 10.3 | 3.1042 | ||||||||||||||||||
| New York | 24 | 189,610,025 | 20.9 | 33.8 | 32.6 | 5.97 | 19.4 | 18.6 | 2.6049 | ||||||||||||||||||
| Florida | 5 | 93,679,202 | 10.3 | 50.3 | 48.0 | 2.09 | 9.4 | 9.1 | 4.0203 | ||||||||||||||||||
| Illinois | 6 | 48,288,024 | 5.3 | 46.3 | 29.1 | 1.82 | 11.2 | 11.2 | 3.0664 | ||||||||||||||||||
| Other(3) | 80 | 350,639,153 | 38.7 | 59.5 | 55.7 | 2.48 | 10.2 | 9.7 | 3.3189 | ||||||||||||||||||
| Total/Weighted Average | 126 | $905,186,404 | 100.0 | % | 52.1 | % | 49.1 | % | 3.25 | x | 12.1 | % | 11.6 | % | 3.2111 | % | |||||||||||
| (1) | The mortgaged properties are located in 35 states. |
| (2) | Because this table presents information relating to the mortgaged properties and not the mortgage loans, the information for mortgage loans secured by more than one mortgaged property is based on allocated amounts (allocating the principal balance of the mortgage loan to each of those properties according to the relative appraised values of the mortgaged properties or the allocated loan amounts or property-specific release prices set forth in the related mortgage loan documents or such other allocation as the related mortgage loan seller deemed appropriate). For mortgaged properties securing residential cooperative mortgage loans, the debt service coverage ratio and debt yield for each such mortgaged property is calculated using U/W Net Operating Income or U/W Net Cash Flow, as applicable, for the related residential cooperative property, which is the projected net operating income or net cash flow, as applicable, reflected in the most recent appraisal obtained by or otherwise in the possession of the related mortgage loan seller as of the cut-off date, and the loan-to-value ratio, is calculated based upon the appraised value of the residential cooperative property determined as if such residential cooperative property is operated as a residential cooperative, inclusive of the amount of the underlying debt encumbering such residential cooperative property. With respect to any mortgage loan that is part of a whole loan, the loan-to-value ratio, debt service coverage ratio and debt yield calculations include the related pari passu companion loan(s) but exclude any related subordinate companion loan(s) (unless otherwise stated). With respect to each mortgage loan, debt service coverage ratio, debt yield and loan-to-value ratio information do not take into account any subordinate debt (whether or not secured by the related mortgaged property) that currently exists or is allowed under the terms of such mortgage loan. See Annex A-1 to the Preliminary Prospectus. |
| (3) | Includes 31 other states. |
THE INFORMATION IN THIS STRUCTURAL AND COLLATERAL TERM SHEET IS NOT COMPLETE AND MAY BE AMENDED PRIOR TO THE TIME OF SALE. THIS TERM SHEET IS NOT AN OFFER TO SELL THESE SECURITIES AND IT IS NOT A SOLICITATION OF AN OFFER TO BUY THESE SECURITIES IN ANY JURISDICTION WHERE THE OFFER OR SALE IS NOT PERMITTED.
16
| BANK 2021-BNK31 | Characteristics of the Mortgage Pool |
| G. | Characteristics of the Mortgage Pool(1) |
| LOAN PURPOSE | |||||||||
| Loan Purpose | Number of Mortgage Loans | Aggregate Cut-off Date Balance ($) | Percent by Aggregate Cut-off Date Pool Balance (%) | ||||||
| Refinance | 38 | $516,363,956 | 57.0 | % | |||||
| Acquisition | 18 | 260,340,871 | 28.8 | ||||||
| Recapitalization | 4 | 90,917,578 | 10.0 | ||||||
| Acquisition/Refinance | 1 | 37,564,000 | 4.1 | ||||||
| Total: | 61 | $905,186,404 | 100.0 | % | |||||
| MORTGAGE RATE | |||||||||
| Range of Mortgage Rates (%) | Number of Mortgage Loans | Aggregate Cut-off Date Balance ($) | Percent by Aggregate Cut-off Date Pool Balance (%) | ||||||
| 1.9375 - 3.5000 | 46 | $719,233,904 | 79.5 | % | |||||
| 3.5001 - 3.7500 | 5 | 50,645,000 | 5.6 | ||||||
| 3.7501 - 4.0000 | 5 | 34,557,500 | 3.8 | ||||||
| 4.0001 - 4.2500 | 4 | 96,250,000 | 10.6 | ||||||
| 4.2501 - 4.3200 | 1 | 4,500,000 | 0.5 | ||||||
| Total: | 61 | $905,186,404 | 100.0 | % | |||||
| Weighted Average: | 3.2111% | ||||||||
| UNDERWRITTEN NOI DEBT YIELD | |||||||||
| Range of U/W NOI Debt Yields (%) | Number of Mortgage Loans | Aggregate Cut-off Date Balance ($) | Percent by Aggregate Cut-off Date Pool Balance (%) | ||||||
| 8.1 - 9.0 | 7 | $66,795,500 | 7.4 | % | |||||
| 9.1 - 10.0 | 13 | 294,573,202 | 32.5 | ||||||
| 10.1 - 11.0 | 12 | 228,260,078 | 25.2 | ||||||
| 11.1 - 12.0 | 6 | 122,105,371 | 13.5 | ||||||
| 12.1 - 13.0 | 3 | 35,900,000 | 4.0 | ||||||
| 13.1 - 14.0 | 3 | 98,000,000 | 10.8 | ||||||
| 14.1 - 15.0 | 1 | 19,967,346 | 2.2 | ||||||
| 15.1 - 20.0 | 1 | 1,300,000 | 0.1 | ||||||
| 20.1 - 121.6 | 15 | 38,284,908 | 4.2 | ||||||
| Total: | 61 | $905,186,404 | 100.0 | % | |||||
| Weighted Average: | 12.1% | ||||||||
| UNDERWRITTEN NCF DEBT YIELD | |||||||||
| Range of U/W NCF Debt Yields (%) | Number of Mortgage Loans | Aggregate Cut-off Date Balance ($) | Percent by Aggregate Cut-off Date Pool Balance (%) | ||||||
| 8.1 - 9.0 | 10 | $169,945,500 | 18.8 | % | |||||
| 9.1 - 10.0 | 20 | 385,368,202 | 42.6 | ||||||
| 10.1 - 11.0 | 9 | 153,365,078 | 16.9 | ||||||
| 11.1 - 12.0 | 2 | 44,555,371 | 4.9 | ||||||
| 12.1 - 13.0 | 3 | 92,400,000 | 10.2 | ||||||
| 13.1 - 15.0 | 1 | 19,967,346 | 2.2 | ||||||
| 15.1 - 20.0 | 1 | 1,300,000 | 0.1 | ||||||
| 20.1 - 121.0 | 15 | 38,284,908 | 4.2 | ||||||
| Total: | 61 | $905,186,404 | 100.0 | % | |||||
| Weighted Average: | 11.6% | ||||||||
| (1) | For mortgaged properties securing residential cooperative mortgage loans, the debt service coverage ratio and debt yield for each such mortgaged property is calculated using U/W Net Operating Income or U/W Net Cash Flow, as applicable, for the related residential cooperative property, which is the projected net operating income or net cash flow, as applicable, reflected in the most recent appraisal obtained by or otherwise in the possession of the related mortgage loan seller as of the cut-off date, and the loan-to-value ratio is calculated based upon the appraised value of the residential cooperative property determined as if such residential cooperative property is operated as a residential cooperative, inclusive of the amount of the underlying debt encumbering such residential cooperative. With respect to any mortgage loan that is part of a whole loan, the loan-to-value ratio, debt service coverage ratio and debt yield calculations include the related pari passu companion loan(s) but exclude any related subordinate companion loan(s) (unless otherwise stated). With respect to each mortgage loan, debt service coverage ratio, debt yield and loan-to-value ratio information do not take into account any subordinate debt (whether or not secured by the related mortgaged property), that currently exists or is allowed under the terms of such mortgage loan. See Annex A-1 to the Preliminary Prospectus. Prepayment provisions for each mortgage loan reflects the entire life of the loan (from origination to maturity). |
THE INFORMATION IN THIS STRUCTURAL AND COLLATERAL TERM SHEET IS NOT COMPLETE AND MAY BE AMENDED PRIOR TO THE TIME OF SALE. THIS TERM SHEET IS NOT AN OFFER TO SELL THESE SECURITIES AND IT IS NOT A SOLICITATION OF AN OFFER TO BUY THESE SECURITIES IN ANY JURISDICTION WHERE THE OFFER OR SALE IS NOT PERMITTED.
17
| BANK 2021-BNK31 | Characteristics of the Mortgage Pool |
| CUT-OFF DATE LOAN-TO-VALUE RATIO | |||||||||
| Range of Cut-off Date LTV Ratios (%) | Number of Mortgage Loans | Aggregate Cut-off Date Balance | Percent by Aggregate Cut-off Date Pool Balance (%) | ||||||
| 3.0 - 25.0 | 16 | $39,584,908 | 4.4 | % | |||||
| 25.1 - 30.0 | 1 | 15,000,000 | 1.7 | ||||||
| 30.1 - 35.0 | 1 | 80,000,000 | 8.8 | ||||||
| 35.1 - 40.0 | 1 | 19,967,346 | 2.2 | ||||||
| 40.1 - 45.0 | 4 | 62,905,371 | 6.9 | ||||||
| 45.1 - 50.0 | 2 | 116,917,578 | 12.9 | ||||||
| 50.1 - 55.0 | 5 | 68,150,000 | 7.5 | ||||||
| 55.1 - 60.0 | 8 | 139,630,000 | 15.4 | ||||||
| 60.1 - 65.0 | 14 | 280,244,500 | 31.0 | ||||||
| 65.1 - 70.0 | 6 | 53,207,500 | 5.9 | ||||||
| 70.1 - 72.3 | 3 | 29,579,202 | 3.3 | ||||||
| Total: | 61 | $905,186,404 | 100.0 | % | |||||
| Weighted Average: | 52.1% | ||||||||
| BALLOON OR ARD LOAN-TO-VALUE RATIO | |||||||||
| Range of Balloon or ARD LTV Ratios (%) | Number of Mortgage Loans | Aggregate Cut-off Date Balance | Percent by Aggregate Cut-off Date Pool Balance (%) | ||||||
| 0.0 - 25.0 | 17 | $74,140,279 | 8.2 | % | |||||
| 25.1 - 30.0 | 2 | 34,967,346 | 3.9 | ||||||
| 30.1 - 40.0 | 2 | 116,917,578 | 12.9 | ||||||
| 40.1 - 45.0 | 3 | 28,350,000 | 3.1 | ||||||
| 45.1 - 50.0 | 2 | 88,750,000 | 9.8 | ||||||
| 50.1 - 55.0 | 6 | 107,000,000 | 11.8 | ||||||
| 55.1 - 60.0 | 13 | 155,916,702 | 17.2 | ||||||
| 60.1 - 65.0 | 15 | 281,144,500 | 31.1 | ||||||
| 65.1 - 65.9 | 1 | 18,000,000 | 2.0 | ||||||
| Total: | 61 | $905,186,404 | 100.0 | % | |||||
| Weighted Average: | 49.1% | ||||||||
| AMORTIZATION TYPE | |||||||||
| Amortization Type | Number of Mortgage Loans | Aggregate Cut-off Date Balance | Percent by Aggregate Cut-off Date Pool Balance (%) | ||||||
| Interest-only, Balloon | 37 | $651,124,500 | 71.9 | % | |||||
| Interest-only, Amortizing Balloon | 11 | 109,457,500 | 12.1 | ||||||
| Amortizing Balloon | 10 | 81,936,827 | 9.1 | ||||||
| Amortizing ARD | 1 | 36,917,578 | 4.1 | ||||||
| Interest-only, ARD | 1 | 22,000,000 | 2.4 | ||||||
| Fully Amortizing | 1 | 3,750,000 | 0.4 | ||||||
| Total: | 61 | $905,186,404 | 100.0 | % | |||||
| ORIGINAL TERM OF INTEREST-ONLY PERIOD FOR PARTIAL IO LOANS | |||||||||
IO Terms (months) | Number of Mortgage Loans | Aggregate Cut-off Date Balance | Percent by Aggregate Cut-off Date Pool Balance (%) | ||||||
| 12 | 1 | $2,850,000 | 0.3 | % | |||||
| 18 | 1 | 9,900,000 | 1.1 | ||||||
| 24 | 2 | 6,650,000 | 0.7 | ||||||
| 36 | 6 | 57,457,500 | 6.3 | ||||||
| 60 | 1 | 32,600,000 | 3.6 | ||||||
| Total: | 11 | $109,457,500 | 12.1 | % | |||||
| Weighted Average: | 40 months | ||||||||
| SEASONING | |||||||||
| Seasoning (months) | Number of Mortgage Loans | Aggregate Cut-off Date Balance | Percent by Aggregate Cut-off Date Pool Balance (%) | ||||||
| 0 | 9 | $68,827,500 | 7.6 | % | |||||
| 1 | 39 | 403,165,534 | 44.5 | ||||||
| 2 | 8 | 262,238,000 | 29.0 | ||||||
| 3 | 3 | 76,555,371 | 8.5 | ||||||
| 4 | 1 | 14,400,000 | 1.6 | ||||||
| 11 | 1 | 80,000,000 | 8.8 | ||||||
| Total: | 61 | $905,186,404 | 100.0 | % | |||||
| Weighted Average: | 2 months | ||||||||
| (1) | The original amortization term shown for any mortgage loan that is interest-only for part of its term does not include the number of months in its interest-only period and reflects only the number of months as of the commencement of amortization remaining from the end of such interest-only period. |
| (2) | The remaining amortization term shown for any mortgage loan that is interest-only for part of its term does not include the number of months in its interest-only period and reflects only the number of months as of the commencement of amortization remaining from the end of such interest-only period. |
| (3) | Excludes the non-amortizing mortgage loans. |
THE INFORMATION IN THIS STRUCTURAL AND COLLATERAL TERM SHEET IS NOT COMPLETE AND MAY BE AMENDED PRIOR TO THE TIME OF SALE. THIS TERM SHEET IS NOT AN OFFER TO SELL THESE SECURITIES AND IT IS NOT A SOLICITATION OF AN OFFER TO BUY THESE SECURITIES IN ANY JURISDICTION WHERE THE OFFER OR SALE IS NOT PERMITTED.
18
| BANK 2021-BNK31 | Certain Terms and Conditions |
| VI. | Certain Terms and Conditions |
| Allocation Between the RR Interest and the Non-Retained Certificates: | Amounts available for distributions to the holders of the Certificates (including the RR Interest) will be allocated between amounts available for distribution to the holders of the RR Interest, on the one hand, and to all other Certificates, referred to herein as the “Non-Retained Certificates”, on the other hand. The portion of such amount allocable to (a) the RR Interest will at all times be the product of such amount multiplied by 5% and (b) the Non-Retained Certificates will at all times be the product of such amount multiplied by 95% (each, the respective “Percentage Allocation Entitlement”). |
| Interest Entitlements: | The interest entitlement of each Class of Non-Retained Certificates (other than the Class V and R Certificates) or trust component on each Distribution Date generally will be the interest accrued during the related Interest Accrual Period on the related Certificate Balance or Notional Amount at the related pass-through rate, net of any prepayment interest shortfalls allocated to that Class or trust component for such Distribution Date as described below. If prepayment interest shortfalls arise from voluntary prepayments (without the applicable Master Servicer consent) on particular non-specially serviced loans during any collection period, the applicable Master Servicer is required to make a compensating interest payment to offset those shortfalls, generally up to an amount equal to the portion of its master servicing fees that accrue at 0.25 basis points per annum. The remaining amount of prepayment interest shortfalls will be allocated between the RR Interest, on one hand, and the Non-Retained Certificates (other than the Class V and R Certificates) on the other hand, in accordance with their respective Percentage Allocation Entitlements. The prepayment interest shortfalls allocated to the Non-Retained Certificates (other than the Class V and R Certificates) will be allocated among such Classes of Certificates (other than the Exchangeable Certificates) and trust components that are entitled to interest, on a pro rata basis, based on their respective amounts of accrued interest for the related Distribution Date, to reduce the interest entitlement on each such Class of Certificates. For any distribution date, prepayment interest shortfalls allocated to a trust component will be allocated among the related Classes of Exchangeable Certificates, pro rata, in accordance with their Class Percentage Interests. If a Class or trust component receives less than the entirety of its interest entitlement on any Distribution Date, then the shortfall (excluding any shortfall due to prepayment interest shortfalls), together with interest thereon, will be added to its interest entitlement for the next succeeding Distribution Date. |
| Aggregate Principal Distribution Amount: | The Aggregate Principal Distribution Amount for each Distribution Date generally will be the aggregate amount of principal received or advanced in respect of the mortgage loans, net of any non-recoverable advances and interest thereon and workout-delayed reimbursement amounts that are reimbursed to the applicable Master Servicer, the Special Servicer or the Trustee during the related collection period. Non-recoverable advances and interest thereon are reimbursable from principal collections and advances before reimbursement from other amounts. Workout-delayed reimbursement amounts are reimbursable from principal collections. The Non-Retained Certificates will be entitled to the portion of the Aggregate Principal Distribution Amount equal to their Percentage Allocation Entitlement, which is referred to herein as the “Principal Distribution Amount”. |
| Subordination, Allocation of Losses and Certain Expenses: | The chart below describes the manner in which the payment rights of certain Classes of Non-Retained Certificates will be senior or subordinate, as the case may be, to the payment rights of other Classes of Non-Retained Certificates. The chart also shows the allocation between the RR Interest and the Non-Retained Certificates and the corresponding entitlement to receive principal and/or interest of certain Classes of Non-Retained Certificates (other than excess interest that accrues on each mortgage loan that has an anticipated repayment date) on any distribution date in descending order. It also shows the manner in which losses are allocated between the RR Interest and the Non-Retained Certificates and the manner in which the Non-Retained Certificate allocations are further allocated to certain Classes of those Certificates in ascending order (beginning with the Non-Offered Certificates, other than the Class V and R Certificates and the RR Interest) to reduce the balance of each such Class to zero; provided that no principal payments or mortgage loan losses will be allocated to the Class X-A, X-B, X-D, X-F, X-G, X-H, V or R Certificates, although principal payments and losses may reduce the Notional Amounts of the Class X-A, X-B, X-D, X-F, X-G and X-H Certificates and, therefore, the amount of interest they accrue. |
THE INFORMATION IN THIS STRUCTURAL AND COLLATERAL TERM SHEET IS NOT COMPLETE AND MAY BE AMENDED PRIOR TO THE TIME OF SALE. THIS TERM SHEET IS NOT AN OFFER TO SELL THESE SECURITIES AND IT IS NOT A SOLICITATION OF AN OFFER TO BUY THESE SECURITIES IN ANY JURISDICTION WHERE THE OFFER OR SALE IS NOT PERMITTED.
19
| BANK 2021-BNK31 | Certain Terms and Conditions |
(1) The maximum certificate balances of the Class A-3, A-4, A-S, B and C certificates (subject to the constraint on the aggregate initial certificate balance of the Class A-3 and A-4 trust components discussed in footnote (9) to the table under “Certificate Structure”) will be issued on the closing date, and the certificate balance or notional amount of each other class of Exchangeable Certificates will be equal to zero on the closing date. The relative priorities of the Exchangeable Certificates are described more fully under “Exchangeable Certificates.”
(2) The Class X-A, X-B, X-D, X-F, X-G and X-H Certificates are interest-only certificates.
(3) The Class X-D, X-F, X-G and X-H Certificates and the RR Interest are Non-Offered Certificates.
(4) Other than the Class X-D, X-F, X-G, X-H, V and R Certificates and the RR Interest. | |
| Distributions: | On each Distribution Date, funds available for distribution from the mortgage loans, net of specified trust fees, expenses and reimbursements that are allocable to the Non-Retained Certificates will generally be distributed in the following amounts and order of priority (in each case to the extent of remaining available funds): |
| 1. Class A-1, A-SB, A-3, A-4, X-A, X-B, X-D, X-F, X-G and X-H Certificates: To interest on the Class A-1, A-SB, X-A, X-B, X-D, X-F, X-G and X-H Certificates and the Class A-3, A-3-X1, A-3-X2, A-4, A-4-X1 and A-4-X2 trust components, pro rata, according to their respective interest entitlements. | |
2. Class A-1 and A-SB Certificates and the Class A-3 and A-4 trust components: To principal on the Class A-1 and A-SB Certificates and the Class A-3 and A-4 trust components in the following amounts and order of priority: (i) first, to principal on the Class A-SB Certificates, in an amount up to the Principal Distribution Amount for such Distribution Date until their Certificate Balance is reduced to the Class A-SB Planned Principal Balance for such Distribution Date; (ii) second, to principal on the Class A-1 Certificates until their Certificate Balance is reduced to zero, up to the remainder of the Principal Distribution Amount for such Distribution Date; (iii) third, to principal on the Class A-3 trust component, until its Certificate Balance is reduced to zero, up to the remainder of the Principal Distribution Amount for such Distribution Date; (iv) fourth, to principal on the Class A-4 trust component, until its Certificate Balance is reduced to zero, up to the remainder of the Principal Distribution Amount for such Distribution Date; and (v) fifth, to principal on the Class A-SB Certificates until their Certificate Balance is reduced to zero, up to the remainder of the Principal Distribution Amount for such Distribution Date. However, if the Certificate Balance of each and every Class of Principal Balance Certificates, other than the Class A-1 and A-SB Certificates and the Class A-3 and A-4 trust components and the RR Interest, has been reduced to zero as a result of the allocation of Mortgage Loan losses and expenses and any of the Class A-1 and A-SB Certificates and the Class A-3 and A-4 trust components remains outstanding, then the |

THE INFORMATION IN THIS STRUCTURAL AND COLLATERAL TERM SHEET IS NOT COMPLETE AND MAY BE AMENDED PRIOR TO THE TIME OF SALE. THIS TERM SHEET IS NOT AN OFFER TO SELL THESE SECURITIES AND IT IS NOT A SOLICITATION OF AN OFFER TO BUY THESE SECURITIES IN ANY JURISDICTION WHERE THE OFFER OR SALE IS NOT PERMITTED.
20
| BANK 2021-BNK31 | Certain Terms and Conditions |
Principal Distribution Amount will be distributed to the Class A-1 and A-SB Certificates and the Class A-3 and A-4 trust components, pro rata, based on their respective outstanding Certificate Balances, until their Certificate Balances have been reduced to zero. | |
| 3. Class A-1 and A-SB Certificates and the Class A-3 and A-4 trust components: To reimburse the holders of the Class A-1 and A-SB Certificates and the Class A-3 and A-4 trust components, pro rata, on the basis of previously allocated unreimbursed losses, for any previously unreimbursed losses (plus interest thereon) on the mortgage loans that were previously allocated in reduction of the Certificate Balances of such Classes or trust components. | |
4. Class A-S, A-S-X1 and A-S-X2 trust components: To make distributions on the Class A-S, A-S-X1 and A-S-X2 trust components as follows: (a) first, to interest on the Class A-S, A-S-X1 and A-S-X2 trust components, pro rata, according to their respective interest entitlements; (b) next, to the extent of the portion of the Principal Distribution Amount remaining after distributions in respect of principal to each Class with a higher distribution priority (in this case, the Class A-1 and A-SB Certificates and the Class A-3 and A-4 trust components), to principal on the Class A-S trust component until its Certificate Balance is reduced to zero; and (c) next, to reimburse the holders of the Class A-S trust component for any previously unreimbursed losses (plus interest thereon) on the mortgage loans that were previously allocated to that trust component in reduction of their Certificate Balance.
5. Class B, B-X1 and B-X2 trust components: To make distributions on the Class B, B-X1 and B-X2 trust components as follows: (a) first, to interest on the Class B, B-X1 and B-X2 trust components, pro rata, according to their respective interest entitlements; (b) next, to the extent of the portion of the Principal Distribution Amount remaining after distributions in respect of principal to each Class with a higher distribution priority (in this case, the Class A-1 and A-SB Certificates and the Class A-3, A-4 and A-S trust components), to principal on the Class B trust component until its Certificate Balance is reduced to zero; and (c) next, to reimburse the holders of the Class B trust component for any previously unreimbursed losses (plus interest thereon) on the mortgage loans that were previously allocated to that trust component in reduction of their Certificate Balance.
6. Class C, C-X1 and C-X2 trust components: To make distributions on the Class C, C-X1 and C-X2 trust components as follows: (a) first, to interest on the Class C, C-X1 and C-X2 trust components, pro rata, according to their respective interest entitlements; (b) next, to the extent of the portion of the Principal Distribution Amount remaining after distributions in respect of principal to each Class with a higher distribution priority (in this case, the Class A-1 and A-SB Certificates and the Class A-3, A-4, A-S and B trust components), to principal on the Class C trust component until its Certificate Balance is reduced to zero; and (c) next, to reimburse the holders of the Class C trust component for any previously unreimbursed losses (plus interest thereon) on the mortgage loans that were previously allocated to that trust component in reduction of their Certificate Balance.
7. Class D Certificates: To make distributions on the Class D Certificates as follows: (a) first, to interest on the Class D Certificates in the amount of the interest entitlement for that Class; (b) next, to the extent of the portion of the Principal Distribution Amount remaining after distributions in respect of principal to each Class with a higher distribution priority (in this case, the Class A-1 and A-SB Certificates and the Class A-3, A-4, A-S, B and C trust components), to principal on the Class D Certificates until their Certificate Balance is reduced to zero; and (c) next, to reimburse the holders of the Class D Certificates for any previously unreimbursed losses (plus interest thereon) on the mortgage loans that were previously allocated to that Class in reduction of their Certificate Balance.
8. After the Class A-1, A-SB and D Certificates and the Class A-3, A-4, A-S, B and C trust components are paid all amounts to which they are entitled, the remaining funds available for distribution will be used to pay interest, principal and loss reimbursement amounts on the Class E, F, G and H Certificates sequentially in that order in a manner analogous to the Class D Certificates.
Principal and interest payable on the Class A-3, A-3-X1, A-3-X2, A-4, A-4-X1, A-4-X2, A-S, A-S-X1, A-S-X2, B, B-X1, B-X2, C, C-X1 and C-X2 trust components will be distributed pro rata to the corresponding classes of Exchangeable Certificates representing interests therein in |
THE INFORMATION IN THIS STRUCTURAL AND COLLATERAL TERM SHEET IS NOT COMPLETE AND MAY BE AMENDED PRIOR TO THE TIME OF SALE. THIS TERM SHEET IS NOT AN OFFER TO SELL THESE SECURITIES AND IT IS NOT A SOLICITATION OF AN OFFER TO BUY THESE SECURITIES IN ANY JURISDICTION WHERE THE OFFER OR SALE IS NOT PERMITTED.
21
| BANK 2021-BNK31 | Certain Terms and Conditions |
| accordance with their Class Percentage Interests therein as described below under “Exchangeable Certificates.” | |
| Exchangeable Certificates: | Each class of Exchangeable Certificates may be exchanged for the corresponding classes of Exchangeable Certificates set forth next to such class in the table below, and vice versa. Following any exchange of one or more classes of Exchangeable Certificates (the applicable “Surrendered Classes”) for one or more classes of other Exchangeable Certificates (the applicable “Received Classes”), the Class Percentage Interests (as defined below) of the outstanding certificate balances or Notional Amounts of the Corresponding Trust Components that are represented by the Surrendered Classes (and consequently their related certificate balances or notional amounts) will be decreased, and those of the Received Classes (and consequently their related certificate balances or notional amounts) will be increased. The dollar denomination of each of the Received Classes of certificates must be equal to the dollar denomination of each of the Surrendered Classes of certificates. No fee will be required with respect to any exchange of Exchangeable Certificates. |
Surrendered Classes (or Received Classes) of Certificates | Received Classes (or Surrendered Classes) of Certificates | |
| Class A-3 | Class A-3-1, Class A-3-X1 | |
| Class A-3 | Class A-3-2, Class A-3-X2 | |
| Class A-4 | Class A-4-1, Class A-4-X1 | |
| Class A-4 | Class A-4-2, Class A-4-X2 | |
| Class A-S | Class A-S-1, Class A-S-X1 | |
| Class A-S | Class A-S-2, Class A-S-X2 | |
| Class B | Class B-1, Class B-X1 | |
| Class B | Class B-2, Class B-X2 | |
| Class C | Class C-1, Class C-X1 | |
| Class C | Class C-2, Class C-X2 |
| On the closing date, the issuing entity will issue the following “trust components,” each with the initial certificate balance (or, if such trust component has an “X” suffix, notional amount) and pass-through rate set forth next to it in the table below. Each trust component with an “X” suffix will not be entitled to distributions of principal. |
Trust Component | Initial Certificate Balance or Notional Amount | Pass-Through Rate | |
| Class A-3 | See footnote (9) to the table under “Certificate Structure” | Class A-3 Certificate Pass-Through Rate minus 1.00% | |
| Class A-3-X1 | Equal to Class A-3 Trust Component Certificate Balance | 0.50% | |
| Class A-3-X2 | Equal to Class A-3 Trust Component Certificate Balance | 0.50% | |
| Class A-4 | See footnote (9) to the table under “Certificate Structure” | Class A-4 Certificate Pass-Through Rate minus 1.00% | |
| Class A-4-X1 | Equal to Class A-4 Trust Component Certificate Balance | 0.50% | |
| Class A-4-X2 | Equal to Class A-4 Trust Component Certificate Balance | 0.50% |
THE INFORMATION IN THIS STRUCTURAL AND COLLATERAL TERM SHEET IS NOT COMPLETE AND MAY BE AMENDED PRIOR TO THE TIME OF SALE. THIS TERM SHEET IS NOT AN OFFER TO SELL THESE SECURITIES AND IT IS NOT A SOLICITATION OF AN OFFER TO BUY THESE SECURITIES IN ANY JURISDICTION WHERE THE OFFER OR SALE IS NOT PERMITTED.
22
| BANK 2021-BNK31 | Certain Terms and Conditions |
| Trust Component | Initial Certificate Balance or Notional Amount | Pass-Through Rate | |
| Class A-S | $94,592,000 | Class A-S Certificate Pass-Through Rate minus 1.00% | |
| Class A-S-X1 | Equal to Class A-S Trust Component Certificate Balance | 0.50% | |
| Class A-S-X2 | Equal to Class A-S Trust Component Certificate Balance | 0.50% | |
| Class B | $37,622,000 | Class B Certificate Pass-Through Rate minus 1.00% | |
| Class B-X1 | Equal to Class B Trust Component Certificate Balance | 0.50% | |
| Class B-X2 | Equal to Class B Trust Component Certificate Balance | 0.50% | |
| Class C | $34,397,000 | Class C Certificate Pass-Through Rate minus 1.00% | |
| Class C-X1 | Equal to Class C Trust Component Certificate Balance | 0.50% | |
| Class C-X2 | Equal to Class C Trust Component Certificate Balance | 0.50% |
| Each class of Exchangeable Certificates represents an undivided beneficial ownership interest in the trust components set forth next to it in the table below (the “Corresponding Trust Components”). Each class of Exchangeable Certificates has a pass-through rate equal to the sum of the pass-through rates of the Corresponding Trust Components and represents a percentage interest (the related “Class Percentage Interest”) in each Corresponding Trust Component, including principal and interest payable thereon, equal to (x) the certificate balance (or, if such class has an “X” suffix, notional amount) of such class of certificates, divided by (y) the certificate balance of the Class A-3 trust component (if such class of Exchangeable Certificates has an “A-3” designation), the Class A-4 trust component (if such class of Exchangeable Certificates has an “A-4” designation), the Class A-S trust component (if such class of Exchangeable Certificates has an “A-S” designation), the Class B trust component (if such class of Exchangeable Certificates has a “B” designation) or the Class C trust component (if such class of Exchangeable Certificates has a “C” designation). |
Group of Exchangeable Certificates | Class of Exchangeable Certificates | Corresponding Trust Components |
| “Class A-3 Exchangeable Certificates” | Class A-3 | Class A-3, A-3-X1, A-3-X2 |
| Class A-3-1 | Class A-3, A-3-X2 | |
| Class A-3-2 | Class A-3 | |
| Class A-3-X1 | Class A-3-X1 | |
| Class A-3-X2 | Class A-3-X1, A-3-X2 |
THE INFORMATION IN THIS STRUCTURAL AND COLLATERAL TERM SHEET IS NOT COMPLETE AND MAY BE AMENDED PRIOR TO THE TIME OF SALE. THIS TERM SHEET IS NOT AN OFFER TO SELL THESE SECURITIES AND IT IS NOT A SOLICITATION OF AN OFFER TO BUY THESE SECURITIES IN ANY JURISDICTION WHERE THE OFFER OR SALE IS NOT PERMITTED.
23
| BANK 2021-BNK31 | Certain Terms and Conditions |
| Group of Exchangeable Certificates | Class of Exchangeable Certificates | Corresponding Trust Components |
| “Class A-4 Exchangeable Certificates” | Class A-4 | Class A-4, A-4-X1, A-4-X2 |
| Class A-4-1 | Class A-4, A-4-X2 | |
| Class A-4-2 | Class A-4 | |
| Class A-4-X1 | Class A-4-X1 | |
| Class A-4-X2 | Class A-4-X1, A-4-X2 | |
| “Class A-S Exchangeable Certificates” | Class A-S | Class A-S, A-S-X1, A-S-X2 |
| Class A-S-1 | Class A-S, A-S-X2 | |
| Class A-S-2 | Class A-S | |
| Class A-S-X1 | Class A-S-X1 | |
| Class A-S-X2 | Class A-S-X1, A-S-X2 | |
| “Class B Exchangeable Certificates” | Class B | Class B, B-X1, B-X2 |
| Class B-1 | Class B, B-X2 | |
| Class B-2 | Class B | |
| Class B-X1 | Class B-X1 | |
| Class B-X2 | Class B-X1, B-X2 | |
| “Class C Exchangeable Certificates” | Class C | Class C, C-X1, C-X2 |
| Class C-1 | Class C, C-X2 | |
| Class C-2 | Class C | |
| Class C-X1 | Class C-X1 | |
| Class C-X2 | Class C-X1, C-X2 |
The maximum Certificate Balance or Notional Amount of each class of Class A-3 Exchangeable Certificates that could be issued in an exchange is equal to the Certificate Balance of the Class A-3 trust component, the maximum Certificate Balance or Notional Amount of each class of Class A-4 Exchangeable Certificates that could be issued in an exchange is equal to the Certificate Balance of the Class A-4 trust component, the maximum Certificate Balance or Notional Amount of each class of Class A-S Exchangeable Certificates that could be issued in an exchange is equal to the Certificate Balance of the Class A-S trust component, the maximum Certificate Balance or Notional Amount of each class of Class B Exchangeable Certificates that could be issued in an exchange is equal to the Certificate Balance of the Class B trust component and the maximum Certificate Balance or Notional Amount of each class of Class C Exchangeable Certificates that could be issued in an exchange is equal to the Certificate Balance of the Class C trust component. The maximum Certificate Balances of Class A-3, A-4, A-S, B and C certificates (subject to the constraint on the aggregate initial Certificate Balance of the Class A-3 and A-4 trust components discussed in footnote (9) to table under “Certificate Structure”) will be issued on the closing date, and the Certificate Balance or Notional Amount of each other class of Exchangeable Certificates will be equal to zero on the Closing Date.
Each class of Class A-3 Exchangeable Certificates, Class A-4 Exchangeable Certificates, Class A-S Exchangeable Certificates, Class B Exchangeable Certificates and Class C Exchangeable Certificates will have a Certificate Balance or Notional Amount equal to its Class Percentage Interest multiplied by the Certificate Balance of the Class A-3 trust component, Class A-4 trust component, Class A-S trust component, Class B trust component or Class C trust component, respectively. Each class of Class A-3 Exchangeable Certificates, Class A-4 Exchangeable Certificates, Class A-S Exchangeable Certificates, Class B Exchangeable Certificates and Class C Exchangeable Certificates with a Certificate Balance will have the same approximate initial credit support percentage, Expected Weighted Average Life, Expected Principal Window, Certificate Principal U/W NOI Debt Yield and Certificate Principal to Value Ratio as the Class A-3 Certificates, Class A-4 Certificates, Class A-S Certificates, Class B Certificates or Class C Certificates, respectively, shown above. |
THE INFORMATION IN THIS STRUCTURAL AND COLLATERAL TERM SHEET IS NOT COMPLETE AND MAY BE AMENDED PRIOR TO THE TIME OF SALE. THIS TERM SHEET IS NOT AN OFFER TO SELL THESE SECURITIES AND IT IS NOT A SOLICITATION OF AN OFFER TO BUY THESE SECURITIES IN ANY JURISDICTION WHERE THE OFFER OR SALE IS NOT PERMITTED.
24
| BANK 2021-BNK31 | Certain Terms and Conditions |
| Allocation of Yield Maintenance Charges and Prepayment Premiums: | If any yield maintenance charge or prepayment premium is collected during any particular collection period with respect to any mortgage loan, then on the Distribution Date corresponding to that collection period, the certificate administrator will pay that yield maintenance charge or prepayment premium (net of liquidation fees payable therefrom) in the following manner:
(x)
(1) to each class of the Class A-1, A-SB, A-3, A-3-1, A-3-2, A-4, A-4-1, A-4-2, A-S, AS-1, A-S-2, B, B-1, B-2, C, C-1, C-2, D and E Certificates, the product of (a) the Non-Retained Certificates’ Percentage Allocation Entitlement of the yield maintenance charge or prepayment premium, (b) the related Base Interest Fraction (as defined in the Preliminary Prospectus) for such class and the applicable principal prepayment, and (c) a fraction, the numerator of which is equal to the amount of principal distributed to such class for that Distribution Date, and the denominator of which is the total amount of principal distributed to the Class A-1, A-SB, D, E, F, G and H Certificates and the Class A-3 Exchangeable Certificates, the Class A-4 Exchangeable Certificates, the Class A-S Exchangeable Certificates, the Class B Exchangeable Certificates and the Class C Exchangeable Certificates for that Distribution Date,
(2) to the Class A-3-X1 Certificates, the product of (a) the Non-Retained Percentage of such Yield Maintenance Charge or Prepayment Premium, (b) a fraction, the numerator of which is equal to the amount of principal distributed to the Class A-3-1 Certificates for that Distribution Date, and the denominator of which is the total amount of principal distributed to the Class A-1, A-SB, D, E, F, G and H and the Class A-3 Exchangeable Certificates, the Class A-4 Exchangeable Certificates, the Class A-S Exchangeable Certificates, the Class B Exchangeable Certificates and the Class C Exchangeable Certificates for that Distribution Date and (c) the difference between (i) the Base Interest Fraction for the Class A-3 Certificates and the applicable principal prepayment and (ii) the Base Interest Fraction for the Class A-3-1 Certificates and the applicable principal prepayment,
(3) to the Class A-3-X2 Certificates, the product of (a) the Non-Retained Percentage of such Yield Maintenance Charge or Prepayment Premium, (b) a fraction, the numerator of which is equal to the amount of principal distributed to the Class A-3-2 Certificates for that Distribution Date, and the denominator of which is the total amount of principal distributed to the Class A-1, A-SB, D, E, F, G and H Certificates and the Class A-3 Exchangeable Certificates, the Class A-4 Exchangeable Certificates, the Class A-S Exchangeable Certificates, the Class B Exchangeable Certificates and the Class C Exchangeable Certificates for that Distribution Date and (c) the difference between (i) the Base Interest Fraction for the Class A-3 Certificates and the applicable principal prepayment and (ii) the Base Interest Fraction for the Class A-3-2 Certificates and the applicable principal prepayment,
(4) to the Class A-4-X1 Certificates, the product of (a) the Non-Retained Percentage of such Yield Maintenance Charge or Prepayment Premium, (b) a fraction, the numerator of which is equal to the amount of principal distributed to the Class A-4-1 Certificates for that Distribution Date, and the denominator of which is the total amount of principal distributed to the Class A-1, A-SB, D, E, F, G and H Certificates and the Class A-3 Exchangeable Certificates, the Class A-4 Exchangeable Certificates, the Class A-S Exchangeable Certificates, the Class B Exchangeable Certificates and the Class C Exchangeable Certificates for that Distribution Date and (c) the difference between (i) the Base Interest Fraction for the Class A-4 Certificates and the applicable principal prepayment and (ii) the Base Interest Fraction for the Class A-4-1 Certificates and the applicable principal prepayment,
(5) to the Class A-4-X2 Certificates, the product of (a) the Non-Retained Percentage of such Yield Maintenance Charge or Prepayment Premium, (b) a fraction, the numerator of which is equal to the amount of principal distributed to the Class A-4-2 Certificates for that Distribution Date, and the denominator of which is the total amount of principal distributed to the Class A-1, A-SB, D, E, F, G and H Certificates and the Class A-3 Exchangeable Certificates, the Class A-4 Exchangeable Certificates, the Class A-S Exchangeable Certificates, the Class B Exchangeable Certificates and the Class C Exchangeable Certificates for that Distribution Date and (c) the difference between (i) the Base Interest Fraction for the Class A-4 Certificates and the applicable principal prepayment and (ii) the Base Interest Fraction for the Class A-4-2 Certificates and the applicable principal prepayment, |
THE INFORMATION IN THIS STRUCTURAL AND COLLATERAL TERM SHEET IS NOT COMPLETE AND MAY BE AMENDED PRIOR TO THE TIME OF SALE. THIS TERM SHEET IS NOT AN OFFER TO SELL THESE SECURITIES AND IT IS NOT A SOLICITATION OF AN OFFER TO BUY THESE SECURITIES IN ANY JURISDICTION WHERE THE OFFER OR SALE IS NOT PERMITTED.
25
| BANK 2021-BNK31 | Certain Terms and Conditions |
(6) to the Class A-S-X1 Certificates, the product of (a) the Non-Retained Percentage of such Yield Maintenance Charge or Prepayment Premium, (b) a fraction, the numerator of which is equal to the amount of principal distributed to the Class A-S-1 Certificates for that Distribution Date, and the denominator of which is the total amount of principal distributed to the Class A-1, A-SB, D, E, F, G and H Certificates and the Class A-3 Exchangeable Certificates, the Class A-4 Exchangeable Certificates, the Class A-S Exchangeable Certificates, the Class B Exchangeable Certificates and the Class C Exchangeable Certificates for that Distribution Date and (c) the difference between (i) the Base Interest Fraction for the Class A-S Certificates and the applicable principal prepayment and (ii) the Base Interest Fraction for the Class A-S-1 Certificates and the applicable principal prepayment,
(7) to the Class A-S-X2 Certificates, the product of (a) the Non-Retained Percentage of such Yield Maintenance Charge or Prepayment Premium, (b) a fraction, the numerator of which is equal to the amount of principal distributed to the Class A-S-2 Certificates for that Distribution Date, and the denominator of which is the total amount of principal distributed to the Class A-1, A-SB, D, E, F, G and H Certificates and the Class A-3 Exchangeable Certificates, the Class A-4 Exchangeable Certificates, the Class A-S Exchangeable Certificates, the Class B Exchangeable Certificates and the Class C Exchangeable Certificates for that Distribution Date and (c) the difference between (i) the Base Interest Fraction for the Class A-S Certificates and the applicable principal prepayment and (ii) the Base Interest Fraction for the Class A-S-2 Certificates and the applicable principal prepayment,
(8) to the Class B-X1 Certificates, the product of (a) the Non-Retained Percentage of such Yield Maintenance Charge or Prepayment Premium, (b) a fraction, the numerator of which is equal to the amount of principal distributed to the Class B-1 Certificates for that Distribution Date, and the denominator of which is the total amount of principal distributed to the Class A-1, A-SB, D, E, F, G and H Certificates and the Class A-3 Exchangeable Certificates, the Class A-4 Exchangeable Certificates, the Class A-S Exchangeable Certificates, the Class B Exchangeable Certificates and the Class C Exchangeable Certificates for that Distribution Date and (c) the difference between (i) the Base Interest Fraction for the Class B Certificates and the applicable principal prepayment and (ii) the Base Interest Fraction for the Class B-1 Certificates and the applicable principal prepayment,
(9) to the Class B-X2 Certificates, the product of (a) the Non-Retained Percentage of such Yield Maintenance Charge or Prepayment Premium, (b) a fraction, the numerator of which is equal to the amount of principal distributed to the Class B-2 Certificates for that Distribution Date, and the denominator of which is the total amount of principal distributed to the Class A-1, A-SB, D, E, F, G and H Certificates and the Class A-3 Exchangeable Certificates, the Class A-4 Exchangeable Certificates, the Class A-S Exchangeable Certificates, the Class B Exchangeable Certificates and the Class C Exchangeable Certificates for that Distribution Date and (c) the difference between (i) the Base Interest Fraction for the Class B Certificates and the applicable principal prepayment and (ii) the Base Interest Fraction for the Class B-2 Certificates and the applicable principal prepayment,
(10) to the Class C-X1 Certificates, the product of (a) the Non-Retained Percentage of such Yield Maintenance Charge or Prepayment Premium, (b) a fraction, the numerator of which is equal to the amount of principal distributed to the Class C-1 Certificates for that Distribution Date, and the denominator of which is the total amount of principal distributed to the Class A-1, A-SB, D, E, F, G and H Certificates and the Class A-3 Exchangeable Certificates, the Class A-4 Exchangeable Certificates, the Class A-S Exchangeable Certificates, the Class B Exchangeable Certificates and the Class C Exchangeable Certificates for that Distribution Date and (c) the difference between (i) the Base Interest Fraction for the Class C Certificates and the applicable principal prepayment and (ii) the Base Interest Fraction for the Class C-1 Certificates and the applicable principal prepayment,
(11) to the Class C-X2 Certificates, the product of (a) the Non-Retained Percentage of such Yield Maintenance Charge or Prepayment Premium, (b) a fraction, the numerator of which is equal to the amount of principal distributed to the Class C-2 Certificates for that Distribution Date, and the denominator of which is the total amount of principal distributed to the Class A-1, A-SB, D, E, F, G and H Certificates and the Class A-3 Exchangeable Certificates, the Class A-4 Exchangeable Certificates, the Class A-S Exchangeable Certificates, the Class B Exchangeable |
THE INFORMATION IN THIS STRUCTURAL AND COLLATERAL TERM SHEET IS NOT COMPLETE AND MAY BE AMENDED PRIOR TO THE TIME OF SALE. THIS TERM SHEET IS NOT AN OFFER TO SELL THESE SECURITIES AND IT IS NOT A SOLICITATION OF AN OFFER TO BUY THESE SECURITIES IN ANY JURISDICTION WHERE THE OFFER OR SALE IS NOT PERMITTED.
26
| BANK 2021-BNK31 | Certain Terms and Conditions |
Certificates and the Class C Exchangeable Certificates for that Distribution Date and (c) the difference between (i) the Base Interest Fraction for the Class C Certificates and the applicable principal prepayment and (ii) the Base Interest Fraction for the Class C-2 Certificates and the applicable principal prepayment,
(12) to the Class X-A Certificates, the excess, if any, of (a) the product of (i) the Non-Retained Certificates’ Percentage Allocation Entitlement of such yield maintenance charge or prepayment premium and (ii) a fraction, the numerator of which is equal to the total amount of principal distributed to the Class A-1 and A-SB Certificates and the Class A-3 Exchangeable Certificates and the Class A-4 Exchangeable Certificates for that Distribution Date, and the denominator of which is the total amount of principal distributed to the Class A-1, A-SB, D, E, F, G and H Certificates and the Class A-3 Exchangeable Certificates, the Class A-4 Exchangeable Certificates, the Class A-S Exchangeable Certificates, the Class B Exchangeable Certificates and the Class C Exchangeable Certificates for that Distribution Date, over (b) the total amount of such yield maintenance charge or prepayment premium distributed to the Class A-1 and Class A-SB Certificates and the Class A-3 Exchangeable Certificates and the Class A-4 Exchangeable Certificates as described above, and
(13) to the Class X-B Certificates, any remaining portion of the Non-Retained Percentage of such yield maintenance charge or prepayment premium not distributed as described above, and
(y) to the RR Interest, its Percentage Allocation Entitlement of the yield maintenance charge or prepayment premium.
No prepayment premiums or yield maintenance charges will be distributed to the holders of the Class X-D, X-F, X-G, X-H, F, G, H, V or R Certificates. For a description of when prepayment premiums and yield maintenance charges are generally required on the mortgage loans, see Annex A-1 to the Preliminary Prospectus. See also “Risk Factors—Risks Relating to the Mortgage Loans—Risks Relating to Enforceability of Yield Maintenance Charges, Prepayment Premiums or Defeasance Provisions” and “Risk Factors—Other Risks Relating to the Certificates—Your Yield May Be Affected by Defaults, Prepayments and Other Factors” in the Preliminary Prospectus. Prepayment premiums and yield maintenance charges will be distributed on each Distribution Date only to the extent they are actually received on the mortgage loans as of the related Determination Date. | |
| Realized Losses: | The Certificate Balances of the Class A-1, A-SB, D, E, F, G and H Certificates and the Class A-3, A-4, A-S, B and C trust components will be reduced without distribution on any Distribution Date as a write-off to the extent of the Non-Retained Certificates’ Percentage Allocation Entitlement of any losses realized on the mortgage loans allocated to such Class on such Distribution Date. Such losses will be applied in the following order, in each case until the related Certificate Balance is reduced to zero: first, to the Class H Certificates; second, to the Class G Certificates; third, to the Class F Certificates; fourth, to the Class E Certificates; fifth, to the Class D Certificates; sixth, to the Class C trust component; seventh, to the Class B trust component; eighth, to the Class A-S trust component; and, finally, pro rata, to the Class A-1 and A-SB Certificates and the Class A-3 and A-4 trust components based on their outstanding Certificate Balances.
Any portion of such amount applied to the Class A-3, A-4, A-S, B or C trust component will reduce the Certificate Balance or Notional Amount of each Class of Certificates in the related group of Exchangeable Certificates by an amount equal to the product of (x) its Certificate Balance or Notional Amount, divided by the Certificate Balance of such trust component prior to the applicable reduction, and (y) the amount applied to such trust component.
The Notional Amount of the Class X-A Certificates will be reduced by the amount of all losses that are allocated to the Class A-1 and A-SB Certificates and the Class A-3 and A-4 trust components as write-offs in reduction of their Certificate Balances. The Notional Amount of the Class X-B Certificates will be reduced by the amount of all losses that are allocated to the Class A-S, B or C trust components as write-offs in reduction of their Certificate Balances. The Notional Amount of the Class X-D Certificates will be reduced by the amount of all losses that are allocated to the Class D or E Certificates as write-offs in reduction of their Certificate Balances. The Notional Amount of the Class X-F Certificates will be reduced by the amount of all losses that are allocated to the Class F Certificates as write-offs in reduction of their Certificate Balance. The Notional Amount of the Class X-G Certificates will be reduced by the amount of all losses that are allocated to the Class G Certificates as write-offs in reduction of their Certificate Balance. The Notional |
THE INFORMATION IN THIS STRUCTURAL AND COLLATERAL TERM SHEET IS NOT COMPLETE AND MAY BE AMENDED PRIOR TO THE TIME OF SALE. THIS TERM SHEET IS NOT AN OFFER TO SELL THESE SECURITIES AND IT IS NOT A SOLICITATION OF AN OFFER TO BUY THESE SECURITIES IN ANY JURISDICTION WHERE THE OFFER OR SALE IS NOT PERMITTED.
27
| BANK 2021-BNK31 | Certain Terms and Conditions |
Amount of the Class X-H Certificates will be reduced by the amount of all losses that are allocated to the Class H Certificates as write-offs in reduction of their Certificate Balance. | |
| P&I Advances: | Each Master Servicer or, if such Master Servicer fails to do so, the Trustee, will be obligated to advance delinquent debt service payments with respect to the mortgage loans it services (other than balloon payments, excess interest and default interest) and assumed debt service payments on mortgage loans with delinquent balloon payments (excluding any related companion loan), except to the extent any such advance is deemed non-recoverable from collections on the related mortgage loan. In addition, if an Appraisal Reduction Amount exists for a given mortgage loan, the interest portion of any P&I advance for such mortgage loan will be reduced, which will have the effect of reducing the amount of interest available for distribution to the Certificates, which with respect to the Non-Retained Certificates (other than the Class V and R Certificates) will be applied in reverse alphabetical order of their Class designations (except that interest payments on the Class A-1, A-SB, A-3, A-3-X1, A-3-X2, A-4, A-4-X1, A-4-X2, X-A, X-B, X-D, X-F, X-G and X-H Certificates would be affected on a pari passu basis). |
| Servicing Advances: | Each Master Servicer or, if such Master Servicer fails to do so, the Trustee, will be obligated to make servicing advances, including the payment of delinquent property taxes, insurance premiums and ground rent, except to the extent that those advances are deemed non-recoverable from collections on the related mortgage loan. The related Master Servicer or the Trustee, as applicable, will have the primary obligation to make any required servicing advances with respect to any serviced whole loan. With respect to any non-serviced whole loan, the master servicer or trustee, as applicable, under the related lead securitization servicing agreement will have the primary obligation to make any required servicing advances with respect to such non-serviced whole loan. |
Appraisal Reduction Amounts and Collateral Deficiency Amounts:
| An “Appraisal Reduction Amount” generally will be created in the amount, if any, by which the principal balance of a required appraisal loan (which is a mortgage loan (other than a non-serviced mortgage loan) with respect to which certain defaults, modifications or insolvency events have occurred as further described in the Preliminary Prospectus) plus other amounts overdue or advanced in connection with such mortgage loan exceeds 90% of the appraised value of the related mortgaged property plus certain escrows and reserves (including letters of credit) held with respect to the mortgage loan. With respect to any serviced whole loan, any Appraisal Reduction Amount will be allocated first to the related subordinate companion loan, if any, and then, pro rata, to the related mortgage loan and the related pari passu companion loan(s). With respect to any non-serviced mortgage loan, appraisal reduction amounts are expected to be calculated in a similar manner under the related non-serviced pooling and servicing agreement.
A mortgage loan will cease to be a required appraisal loan when the same has ceased to be a specially serviced loan (if applicable), has been brought current for at least three consecutive months and no other circumstances exist that would cause such mortgage loan to be a required appraisal loan.
A “Collateral Deficiency Amount” will exist with respect to any mortgage loan that is modified into an AB loan structure and remains a corrected mortgage loan and will generally equal the excess of (i) the stated principal balance of such AB modified loan (taking into account the related junior note(s) and any pari passu notes included therein), over (ii) the sum of (in the case of a whole loan, solely to the extent allocable to the subject mortgage loan) (x) the most recent appraised value of the related mortgaged property plus (y) solely to the extent not reflected or taken into account in such appraised value (or in the calculation of any related Appraisal Reduction Amount) and to the extent on deposit with, or otherwise under the control of, the lender as of the date of such determination, any capital or additional collateral contributed by the related borrower at the time the mortgage loan (and as part of the modification thereto) became an AB modified loan plus (z) any other escrows or reserves (in addition to any amounts set forth in the immediately preceding clause (y) and solely to the extent not reflected or taken into account in the calculation of any related Appraisal Reduction Amount) held by the lender with respect to the mortgage loan as of the date of such determination.
A “Cumulative Appraisal Reduction Amount” with respect to any mortgage loan will be the sum of any Appraisal Reduction Amount and any Collateral Deficiency Amount.
Appraisal Reduction Amounts will affect the amount of debt service advances in respect of the related mortgage loan. Additionally, Cumulative Appraisal Reduction Amounts will be taken into account in the determination of the identity of the Class whose majority constitutes the “majority controlling class certificateholder” and is entitled to appoint the directing certificateholder.
Neither (i) a Payment Accommodation with respect to any mortgage loan or serviced whole loan nor (ii) any default or delinquency that would have existed but for such Payment Accommodation will constitute an appraisal reduction event, for so long as the related borrower is complying with |
THE INFORMATION IN THIS STRUCTURAL AND COLLATERAL TERM SHEET IS NOT COMPLETE AND MAY BE AMENDED PRIOR TO THE TIME OF SALE. THIS TERM SHEET IS NOT AN OFFER TO SELL THESE SECURITIES AND IT IS NOT A SOLICITATION OF AN OFFER TO BUY THESE SECURITIES IN ANY JURISDICTION WHERE THE OFFER OR SALE IS NOT PERMITTED.
28
| BANK 2021-BNK31 | Certain Terms and Conditions |
the terms of such Payment Accommodation. Additionally, a Government-Sponsored Relief Modification will not constitute an appraisal reduction event.
A “Payment Accommodation” for any mortgage loan or serviced whole loan means the entering into of any temporary forbearance agreement as a result of the COVID-19 emergency relating to payment obligations or operating covenants under the related mortgage loan documents or the use of funds on deposit in any reserve account or escrow account for any purpose other than the explicit purpose described in the related mortgage loan documents, that in each case (i) defers no greater than 3 monthly debt service payments (but no greater than 9 monthly debt service payments in the aggregate with any other Payment Accommodations) and (ii) requires full repayment of deferred payments, reserves and escrows by the date that is 24 months following the date of the first Payment Accommodation for such mortgage loan or serviced whole loan. For the avoidance of doubt, a Payment Accommodation may only be entered into by the applicable special servicer on behalf of the issuing entity.
A “Government-Sponsored Relief Modification” for any mortgage loan or serviced whole loan means any modification, waiver or amendment of the related mortgage loan or serviced whole loan that is necessary to facilitate a borrower’s ability to take advantage of any government-sponsored COVID-specific relief or stimulus program applicable to the mortgage loan or serviced whole loan, related mortgaged property or related borrower; provided that (A) any such action would not constitute a “significant modification” of such mortgage loan or companion loan pursuant to Treasury Regulations Section 1.860G-2(b), and would not otherwise cause either Trust REMIC to fail to qualify as a REMIC for federal income tax purposes (as evidenced by an opinion of counsel (at the issuing entity’s expense to the extent not reimbursed or paid by the related borrower), to the extent requesting such opinion is consistent with the servicing standard), (B) agreeing to such action would be consistent with the servicing standard, and (C) agreeing to such action would not violate the terms, provisions or limitations of the Pooling and Servicing Agreement or any intercreditor agreement. For the avoidance of doubt, a Government-Sponsored Relief Modification may only be entered into by the applicable special servicer on behalf of the issuing entity. | |
Clean-Up Call and Exchange Termination:
| On each Distribution Date occurring after the aggregate unpaid principal balance of the pool of mortgage loans is less than 1.0% of the principal balance of the mortgage loans as of the cut-off date (solely for the purposes of this calculation, if such right is being exercised after the distribution date in February 2031 and the U-Haul AREC Portfolio 43 mortgage loan or Coleman Highline mortgage loan is still an asset of the issuing entity, then such mortgage loan will be excluded from the then-aggregate principal balance of the mortgage loans and from the initial pool balance), certain specified persons will have the option to purchase all of the remaining mortgage loans (and the trust’s interest in all property acquired through exercise of remedies in respect of any mortgage loan) at the price specified in the Preliminary Prospectus. Exercise of the option will terminate the trust and retire the then-outstanding Certificates.
If the aggregate Certificate Balances of each of the Class A-1, A-SB, D and E Certificates and the Class A-3, A-4, A-S, B and C trust components have been reduced to zero, the trust may also be terminated in connection with an exchange of all the then-outstanding Certificates (other than the Class V and R Certificates and the RR Interest) for the mortgage loans and REO properties then remaining in the issuing entity, subject to payment of a price specified in the Preliminary Prospectus, but all of the holders of those outstanding Classes of Certificates (other than the Class V and R Certificates and the RR Interest) would have to voluntarily participate in the exchange. |
| Liquidation Loan Waterfall: | Following the liquidation of any mortgage loan or mortgaged property, the net liquidation proceeds generally will be applied (after reimbursement of advances and certain trust fund expenses), first, as a recovery of accrued interest, other than delinquent interest that was not advanced as a result of Appraisal Reduction Amounts, second, as a recovery of principal until all principal has been recovered, and then as a recovery of delinquent interest that was not advanced as a result of Appraisal Reduction Amounts. Please see “Description of the Certificates—Distributions—Application Priority of Mortgage Loan Collections or Whole Loan Collections” in the Preliminary Prospectus. |
| Control Eligible Certificates: | The Class F, G and H Certificates. |
| Directing Certificateholder/ Controlling Class: | A directing certificateholder may be appointed by the “majority controlling class certificateholder”, which will be the holder(s) of a majority of the Controlling Class.
The “Controlling Class” will be, as of any time of determination, the most subordinate Class of Control Eligible Certificates then-outstanding that has an aggregate Certificate Balance (as notionally reduced by any Cumulative Appraisal Reduction Amounts allocable to such Class) at least equal to 25% of the initial Certificate Balance of that Class; provided, however, that if at |
THE INFORMATION IN THIS STRUCTURAL AND COLLATERAL TERM SHEET IS NOT COMPLETE AND MAY BE AMENDED PRIOR TO THE TIME OF SALE. THIS TERM SHEET IS NOT AN OFFER TO SELL THESE SECURITIES AND IT IS NOT A SOLICITATION OF AN OFFER TO BUY THESE SECURITIES IN ANY JURISDICTION WHERE THE OFFER OR SALE IS NOT PERMITTED.
29
| BANK 2021-BNK31 | Certain Terms and Conditions |
any time the Certificate Balances of the Certificates other than the Control Eligible Certificates and the RR Interest have been reduced to zero as a result of principal payments on the Mortgage Loans, then the Controlling Class will be the most subordinate Class of Control Eligible Certificates that has a Certificate Balance greater than zero without regard to any Cumulative Appraisal Reduction Amounts. The Controlling Class as of the Closing Date will be the Class H Certificates. | |
| Control and Consultation/ Replacement of Special Servicer by Directing Certificateholder: | The rights of various parties to replace the Special Servicer and approve or consult with respect to major actions of the Special Servicer will vary according to defined periods.
A “Control Termination Event” will occur when the Class F Certificates have a Certificate Balance (taking into account the application of any Cumulative Appraisal Reduction Amounts to notionally reduce the Certificate Balance of such Class) of less than 25% of the initial Certificate Balance of that Class; provided, that a Control Termination Event will not be deemed continuing in the event that the Certificate Balances of the Certificates other than the Control Eligible Certificates and the RR Interest have been reduced to zero as a result of principal payments on the Mortgage Loans.
A “Consultation Termination Event” will occur when there is no Class of Control Eligible Certificates that has a then-outstanding Certificate Balance at least equal to 25% of the initial Certificate Balance of that Class, in each case, without regard to the application of any Cumulative Appraisal Reduction Amounts; provided, however, that a Consultation Termination Event will not be deemed continuing in the event that the Certificate Balances of the Certificates other than the Control Eligible Certificates and the RR Interest have been reduced to zero as a result of principal payments on the Mortgage Loans.
If no Control Termination Event has occurred and is continuing, except with respect to the Excluded Loans (as defined below) with respect to the directing certificateholder (i) the directing certificateholder will be entitled to grant or withhold approval of asset status reports prepared, and material servicing actions proposed, by the Special Servicer, and (ii) the directing certificateholder will be entitled to terminate and replace the Special Servicer with or without cause, and appoint itself or another person as the successor special servicer. It will be a condition to such appointment that Fitch, KBRA and S&P (and any rating agency rating any securities backed by any pari passu companion loan(s) serviced under this transaction) confirm that the appointment would not result in a qualification, downgrade or withdrawal of any of their then-current ratings of Certificates (and any certificates backed by any pari passu companion loan(s) serviced under this transaction).
If a Control Termination Event has occurred and is continuing but no Consultation Termination Event has occurred and is continuing, the Special Servicer will be required to consult with the directing certificateholder (other than with respect to Excluded Loans as to such party) and the Operating Advisor in connection with asset status reports and material special servicing actions.
If a Consultation Termination Event has occurred and is continuing, the Special Servicer must seek to consult with the Operating Advisor in connection with asset status reports and material special servicing actions, and, in general, no directing certificateholder will be recognized or have any right to terminate the Special Servicer or approve, direct or consult with respect to servicing matters.
With respect to each serviced whole loan, the rights of the directing certificateholder described above will be subject to the consultation rights of the holders of the related pari passu companion loans. Those consultation rights will generally extend to asset status reports and material special servicing actions involving the related whole loan, will be as set forth in the related intercreditor agreement, and will be in addition to the rights of the directing certificateholder in this transaction described above.
With respect to the non-serviced whole loan, the applicable servicing agreement for the related controlling pari passu companion loan(s) generally grants (or will grant) the directing certificateholder under the related securitization control rights that may include the right to approve or disapprove various material servicing actions involving the related whole loan. The directing certificateholder for this securitization (so long as no Consultation Termination Event has occurred and is occurring) generally will nonetheless have the right to be consulted on a non-binding basis with respect to such actions. For purposes of the servicing of any such whole loan contemplated by this paragraph, the occurrence and continuance of a Control Termination Event or Consultation Termination Event under this securitization will not limit the control or other rights of the directing certificateholder (or equivalent) under the securitization of the related controlling pari passu companion loan(s).
The control rights and consent and consultation rights described in the preceding paragraphs are subject to various limitations, conditions and exceptions as described in the Preliminary Prospectus. |
THE INFORMATION IN THIS STRUCTURAL AND COLLATERAL TERM SHEET IS NOT COMPLETE AND MAY BE AMENDED PRIOR TO THE TIME OF SALE. THIS TERM SHEET IS NOT AN OFFER TO SELL THESE SECURITIES AND IT IS NOT A SOLICITATION OF AN OFFER TO BUY THESE SECURITIES IN ANY JURISDICTION WHERE THE OFFER OR SALE IS NOT PERMITTED.
30
| BANK 2021-BNK31 | Certain Terms and Conditions |
Notwithstanding any contrary description set forth above, in the event that, with respect to any mortgage loan, the majority controlling class certificateholder or the directing certificateholder is a Borrower Party, the majority controlling class certificateholder and the directing certificateholder will have no right to receive asset status reports or such other information as may be specified in the BANK 2021-BNK31 pooling and servicing agreement, to grant or withhold approval of, or consult with respect to, asset status reports prepared, and material servicing actions proposed, by the Special Servicer, with respect to such mortgage loan, and such mortgage loan will be referred to as an “Excluded Loan” as to such party.
In addition, notwithstanding any contrary description set forth above, in the event that, with respect to any mortgage loan, a controlling class certificateholder is a Borrower Party, such controlling class certificateholder will have no right to receive asset status reports or such other information as may be specified in the BANK 2021-BNK31 pooling and servicing agreement with respect to such mortgage loan.
“Borrower Party” means a borrower, a mortgagor or a manager of a mortgaged property, an Accelerated Mezzanine Loan Lender, or any Borrower Party Affiliate. “Accelerated Mezzanine Loan Lender” means a mezzanine lender under a mezzanine loan that has been accelerated or as to which foreclosure or enforcement proceedings have been commenced against the equity collateral pledged to secure such mezzanine loan. “Borrower Party Affiliate” means, with respect to a borrower, a mortgagor, a manager of a Mortgaged Property or an Accelerated Mezzanine Loan Lender, (x) any other person controlling or controlled by or under common control with such borrower, mortgagor, manager or Accelerated Mezzanine Loan Lender, as applicable, or (y) any other person owning, directly or indirectly, 25% or more of the beneficial interests in such borrower, mortgagor, manager or Accelerated Mezzanine Loan Lender. With respect to a mortgage loan secured by a residential cooperative property, a person will not be considered a “Borrower Party” solely by reason of such person holding one or more cooperative unit loans that are secured by direct equity interests in the related borrower or owning one or more residential cooperative units comprising the related mortgaged property as a result of any foreclosure, transfer in lieu of foreclosure or other exercise of remedies with respect to any such unit loan(s). | |
| Risk Retention Consultation Party: | A risk retention consultation party may be appointed by the holder or holders of more than 50% of the RR Interest, by Certificate Balance. The majority RR Interest holder will have a continuing right to appoint, remove or replace the risk retention consultation party in its sole discretion. This right may be exercised at any time and from time to time.
Except with respect to an Excluded Loan as to such party, the risk retention consultation party will be entitled to consult with each Special Servicer, upon request of the risk retention consultation party, with respect to certain material servicing actions proposed by such Special Servicer. |
| Replacement of Special Servicer by General Vote of Certificateholders: | If a Control Termination Event has occurred and is continuing, either Special Servicer may be removed and replaced without cause upon the affirmative direction of certificate owners holding not less than 66-2/3% of a certificateholder quorum, following a proposal from certificate owners holding not less than 25% of the appraisal-reduced voting rights of all Principal Balance Certificates other than the RR Interest. The certificateholders who initiate a vote on a termination and replacement of a Special Servicer without cause must cause Fitch, KBRA and S&P to confirm the then-current ratings of the Certificates (or decline to review the matter) and cause the payment of the fees and expenses incurred in the replacement. If no Control Termination Event has occurred and is continuing, either Special Servicer may be replaced by the directing certificateholder, subject to Fitch, KBRA and S&P (and any rating agency rating any securities backed by any pari passu companion loan(s) serviced under this transaction) confirming the then-current ratings of the Certificates (and any certificates backed by any pari passu companion loans serviced under this transaction) or declining to review the matter. |
| Excluded Special Servicer: | In the event that, with respect to any mortgage loan, a Special Servicer is a Borrower Party, such Special Servicer will be required to resign as special servicer of such mortgage loan (referred to as an “excluded special servicer loan”). If no Control Termination Event has occurred and is continuing, the directing certificateholder will be entitled to appoint (and may replace with or without cause) a separate special servicer that is not a Borrower Party (referred to as an “excluded special servicer”) with respect to such excluded special servicer loan unless such excluded special servicer loan is also an excluded loan. Otherwise, upon resignation of the applicable Special Servicer with respect to an excluded special servicer loan, such resigning Special Servicer will be required to use reasonable efforts to appoint the excluded special servicer. |
| Appraisal Remedy: | If the Class of Certificates comprising the Controlling Class loses its status as Controlling Class because of the application of an Appraisal Reduction Amount or Collateral Deficiency Amount, the holders of a majority of the voting rights of such Class may require the applicable Special Servicer to order a second appraisal for any mortgage loan in respect of which an Appraisal Reduction Amount or Collateral Deficiency Amount has been applied. Such Special Servicer must |
THE INFORMATION IN THIS STRUCTURAL AND COLLATERAL TERM SHEET IS NOT COMPLETE AND MAY BE AMENDED PRIOR TO THE TIME OF SALE. THIS TERM SHEET IS NOT AN OFFER TO SELL THESE SECURITIES AND IT IS NOT A SOLICITATION OF AN OFFER TO BUY THESE SECURITIES IN ANY JURISDICTION WHERE THE OFFER OR SALE IS NOT PERMITTED.
31
| BANK 2021-BNK31 | Certain Terms and Conditions |
| thereafter determine whether, based on its assessment of such second appraisal, any recalculation of the Appraisal Reduction Amount or Collateral Deficiency Amount is warranted, and if so warranted, the Special Servicer will recalculate such Appraisal Reduction Amount or Collateral Deficiency Amount. Such Class will not be able to exercise any direction, control, consent and/or similar rights of the Controlling Class unless and until reinstated as the Controlling Class through such determination; and pending such determination, the rights of the Controlling Class will be exercised by the Control Eligible Certificates, if any, that would be the Controlling Class taking into account the subject appraisal reduction amount. | |
| Sale of Defaulted Assets: | There will be no “fair value” purchase option. Instead, the BANK 2021-BNK31 pooling and servicing agreement will authorize the Special Servicer to sell defaulted mortgage loans serviced by such Special Servicer to the highest bidder in a manner generally similar to sales of REO properties.
The sale of a defaulted loan (other than a non-serviced whole loan) for less than par plus accrued interest and certain other fees and expenses owed on the loan will be subject to consent or consultation rights of the directing certificateholder and/or Operating Advisor, as described in the Preliminary Prospectus. Generally speaking, the holder of a pari passu companion loan will have consent and/or consultation rights, as described in the Preliminary Prospectus. If the subject whole loan includes one or more subordinate companion loans, those subordinate companion loans may be included in such sale as well.
With respect to any serviced whole loan, if such whole loan becomes a defaulted loan under the BANK 2021-BNK31 pooling and servicing agreement, the Special Servicer will generally be required to sell both the mortgage loan and the related pari passu companion loan(s) as a single whole loan. If the subject whole loan includes one or more subordinate companion loans, those subordinate companion loans may be included in such sale as well.
With respect to the non-serviced whole loan, the applicable servicing agreement governing the servicing of such whole loan generally will provide that, if the related pari passu companion loan(s) serviced under such agreement become a defaulted loan under such servicing agreement, then the related special servicer may offer to sell to any person (or may offer to purchase) for cash such whole loan during such time as such applicable pari passu companion loan(s) constitutes a defaulted loan under such servicing agreement. Generally speaking, in connection with any such sale, the related special servicer is required to sell both the mortgage loan and the related pari passu companion loan(s) as a whole loan. The directing certificateholder for this securitization generally will have consent and/or consultation rights as the holder of an interest in the related mortgage loan, as described in the Preliminary Prospectus. If the subject whole loan includes one or more subordinate companion loans, those subordinate companion loans may be included in such sale as well.
The procedures for the sale of any whole loan that becomes a defaulted whole loan, and any associated consultation rights, are subject to various limitations, conditions and exceptions as described in the Preliminary Prospectus. |
| “As-Is” Appraisals: | Appraisals must be conducted on an “as-is” basis, and must be no more than 12 months old, for purposes of determining Appraisal Reduction Amounts and market value in connection with REO sales. Required appraisals may consist of updates of prior appraisals. Internal valuations by the applicable Special Servicer are permitted if the principal balance of a mortgage loan is less than $2,000,000. |
| Operating Advisor: | The Operating Advisor will perform certain review duties if a Control Termination Event has occurred and is continuing, which will generally include a limited annual review of, and the delivery of a report regarding, certain actions of each Special Servicer with respect to the resolution and/or liquidation of specially serviced loans to the Certificate Administrator. The review and report generally will be based on any asset status reports and additional information delivered to the Operating Advisor by each Special Servicer. In addition, if a Control Termination Event has occurred and is continuing, each Special Servicer must seek to consult with the Operating Advisor (in addition to the directing certificateholder if no Consultation Termination Event has occurred and is continuing) in connection with material special servicing actions with respect to specially serviced loans serviced by such Special Servicer. Furthermore, under certain circumstances, but only if a Consultation Termination Event has occurred and is continuing, the Operating Advisor may recommend the replacement of a Special Servicer, in which case the Certificate Administrator will deliver notice of such recommendation to the certificateholders, and certificateholders with specified percentages of the voting rights may direct the replacement of such Special Servicer at their expense.
If a Consultation Termination Event has occurred and is continuing, the Operating Advisor may be removed and replaced without cause upon the affirmative direction of certificate owners holding at least 75% of the appraisal-reduced voting rights of all Certificates (other than the RR |
THE INFORMATION IN THIS STRUCTURAL AND COLLATERAL TERM SHEET IS NOT COMPLETE AND MAY BE AMENDED PRIOR TO THE TIME OF SALE. THIS TERM SHEET IS NOT AN OFFER TO SELL THESE SECURITIES AND IT IS NOT A SOLICITATION OF AN OFFER TO BUY THESE SECURITIES IN ANY JURISDICTION WHERE THE OFFER OR SALE IS NOT PERMITTED.
32
| BANK 2021-BNK31 | Certain Terms and Conditions |
Interest), following a proposal from certificate owners holding not less than 25% of the appraisal-reduced voting rights of all Certificates (other than the RR Interest). The certificateholders who initiate a vote on a termination and replacement of the Operating Advisor without cause must cause Fitch, KBRA and S&P to confirm the then-current ratings of the Certificates (or decline to review the matter) and cause the payment of the fees and expenses incurred in the replacement. The Operating Advisor generally may be discharged from its duties if and when the Class A-1, A-SB, D and E Certificates and the Class A-3, A-4, A-S, B and C trust components are retired. | |
| Asset Representations Reviewer: | The Asset Representations Reviewer will be required to review certain delinquent mortgage loans after a specified delinquency threshold has been exceeded (an “Asset Review Trigger”) and the required percentage of certificateholders vote to direct a review of such delinquent loans. An Asset Review Trigger will occur when either (1) mortgage loans with an aggregate outstanding principal balance of 25.0% or more of the aggregate outstanding principal balance of all of the mortgage loans (including any REO loans (or a portion of any REO loan in the case of a whole loan)) held by the issuing entity as of the end of the applicable collection period are delinquent loans or (2)(A) prior to and including the second anniversary of the Closing Date, at least 10 mortgage loans are delinquent loans as of the end of the applicable collection period and the outstanding principal balance of such delinquent loans in the aggregate constitutes at least 15.0% of the aggregate outstanding principal balance of all of the mortgage loans (including any REO loans (or a portion of any REO loan in the case of a whole loan)) held by the issuing entity as of the end of the applicable collection period, or (B) after the second anniversary of the Closing Date, at least 15 mortgage loans are delinquent loans as of the end of the applicable collection period and the outstanding principal balance of such delinquent loans in the aggregate constitutes at least 20.0% of the aggregate outstanding principal balance of all of the mortgage loans (including any REO loans (or a portion of any REO loan in the case of a whole loan)) held by the issuing entity as of the end of the applicable collection period. See “Pooling and Servicing Agreement—The Asset Representations Reviewer—Asset Review” in the Preliminary Prospectus.
The Asset Representations Reviewer may be terminated and replaced without cause. Upon (i) the written direction of certificateholders evidencing not less than 25% of the voting rights (without regard to the application of any Cumulative Appraisal Reduction Amounts) requesting a vote to terminate and replace the Asset Representations Reviewer with a proposed successor Asset Representations Reviewer that is an eligible asset representations reviewer, and (ii) payment by such holders to the certificate administrator of the reasonable fees and expenses to be incurred by the certificate administrator in connection with administering such vote, the certificate administrator will promptly provide notice to all certificateholders and the Asset Representations Reviewer of such request by posting such notice on its internet website, and by mailing such notice to all certificateholders and the Asset Representations Reviewer. Upon the written direction of certificateholders evidencing at least 75% of a certificateholder quorum (without regard to the application of any Cumulative Appraisal Reduction Amounts), the Trustee will terminate all of the rights and obligations of the Asset Representations Reviewer under the BANK 2021-BNK31 pooling and servicing agreement by written notice to the Asset Representations Reviewer, and the proposed successor Asset Representations Reviewer will be appointed. See “Pooling and Servicing Agreement—The Asset Representations Reviewer” in the Preliminary Prospectus. |
| Dispute Resolution Provisions: | The mortgage loan sellers will be subject to the dispute resolution provisions set forth in the BANK 2021-BNK31 pooling and servicing agreement to the extent those provisions are triggered with respect to any mortgage loan sold to the depositor by a mortgage loan seller and such mortgage loan seller will be obligated under the related mortgage loan purchase agreement to comply with all applicable provisions and to take part in any mediation or arbitration proceedings that may result.
Generally, in the event that a Repurchase Request (as defined in the Preliminary Prospectus) is not “Resolved” (as defined below) within 180 days after the related mortgage loan seller receives such Repurchase Request, then the enforcing servicer will be required to send a notice to the “Initial Requesting Certificateholder” (if any) and the Certificate Administrator indicating the enforcing servicer’s intended course of action with respect to the Repurchase Request. If (a) the enforcing servicer’s intended course of action with respect to the Repurchase Request does not involve pursuing further action to exercise rights against the related mortgage loan seller with respect to the Repurchase Request and the Initial Requesting Certificateholder, if any, or any other certificateholder or certificate owner wishes to exercise its right to refer the matter to mediation (including non-binding arbitration) or arbitration, or (b) the enforcing servicer’s intended course of action is to pursue further action to exercise rights against the related mortgage loan seller with respect to the Repurchase Request but the Initial Requesting Certificateholder, if any, or any other certificateholder or certificate owner does not agree with the dispute resolution method selected by the enforcing servicer, then the Initial Requesting Certificateholder, if any, or such other certificateholder or certificate owner may deliver a written |
THE INFORMATION IN THIS STRUCTURAL AND COLLATERAL TERM SHEET IS NOT COMPLETE AND MAY BE AMENDED PRIOR TO THE TIME OF SALE. THIS TERM SHEET IS NOT AN OFFER TO SELL THESE SECURITIES AND IT IS NOT A SOLICITATION OF AN OFFER TO BUY THESE SECURITIES IN ANY JURISDICTION WHERE THE OFFER OR SALE IS NOT PERMITTED.
33
| BANK 2021-BNK31 | Certain Terms and Conditions |
notice to the applicable Special Servicer indicating its intent to exercise its right to refer the matter to either mediation or arbitration.
“Resolved” means, with respect to a Repurchase Request, (i) that the related Material Defect has been cured, (ii) the related mortgage loan has been repurchased in accordance with the related mortgage loan purchase agreement, (iii) a mortgage loan has been substituted for the related mortgage loan in accordance with the related mortgage loan purchase agreement, (iv) the applicable mortgage loan seller has made a Loss of Value Payment (as defined in the Preliminary Prospectus), (v) a contractually binding agreement is entered into between the enforcing servicer, on behalf of the issuing entity, and the related mortgage loan seller that settles the related mortgage loan seller’s obligations under the related mortgage loan purchase agreement, or (vi) the related mortgage loan is no longer property of the issuing entity as a result of a sale or other disposition in accordance with the BANK 2021-BNK31 pooling and servicing agreement. See “Pooling and Servicing Agreement—Dispute Resolution Provisions” in the Preliminary Prospectus. | |
| Investor Communications: | The certificate administrator is required to include on any Form 10–D any request received from a certificateholder to communicate with other certificateholders related to certificateholders exercising their rights under the terms of the BANK 2021-BNK31 pooling and servicing agreement. Any certificateholder wishing to communicate with other certificateholders regarding the exercise of its rights under the terms of the BANK 2021-BNK31 pooling and servicing agreement will be able to deliver a written request signed by an authorized representative of the requesting investor to the certificate administrator. |
| Certain Fee Offsets: | If a workout fee is earned by a Special Servicer following a loan default with respect to any mortgage loan that it services, then certain limitations will apply based on modification fees paid by the borrower. The modification fee generally must not exceed 1% of the principal balance of the loan as modified in any 12-month period. In addition, if the loan re-defaults, any subsequent workout fee on that loan must be reduced by a portion of the modification fees paid by the borrower in the previous 12 months. Likewise, liquidation fees collected in connection with a liquidation or partial liquidation of a mortgage loan must be reduced by a portion of the modification fees paid by the borrower in the previous 12 months. |
| Deal Website: | The Certificate Administrator will be required to maintain a deal website, which will include, among other items: (a) summaries of asset status reports prepared by each Special Servicer, (b) inspection reports, (c) appraisals, (d) various “special notices” described in the Preliminary Prospectus, (e) the “Investor Q&A Forum”, (f) a voluntary “Investor Registry” and (g) the “Risk Retention Special Notices” tab. Investors may access the deal website following execution of a certification and confidentiality agreement. |
| Initial Majority Controlling Class Certificateholder: | It is expected that LD II Holdco XIV, LLC or its affiliate will be the initial majority controlling class certificateholder. |
| Whole Loans: | Each of the mortgaged properties identified above under “V. Characteristics of the Mortgage Pool—B. Summary of the Whole Loans” secures both a mortgage loan to be included in the trust fund and one or more other mortgage loans that will not be included in the trust fund, each of which will be pari passu or subordinate in right of payment with the mortgage loan included in the trust fund. We refer to each such group of mortgage loans as a “whole loan”. Such “—Summary of the Whole Loans” section includes further information regarding the various notes in each whole loan, the holders of such notes, the lead servicing agreement for each such whole loan, and the applicable master servicer and applicable special servicer under such lead servicing agreement. |
THE INFORMATION IN THIS STRUCTURAL AND COLLATERAL TERM SHEET IS NOT COMPLETE AND MAY BE AMENDED PRIOR TO THE TIME OF SALE. THIS TERM SHEET IS NOT AN OFFER TO SELL THESE SECURITIES AND IT IS NOT A SOLICITATION OF AN OFFER TO BUY THESE SECURITIES IN ANY JURISDICTION WHERE THE OFFER OR SALE IS NOT PERMITTED.
34
(THIS PAGE INTENTIONALLY LEFT BLANK)
THE INFORMATION IN THIS STRUCTURAL AND COLLATERAL TERM SHEET IS NOT COMPLETE AND MAY BE AMENDED PRIOR TO THE TIME OF SALE. THIS TERM SHEET IS NOT AN OFFER TO SELL THESE SECURITIES AND IT IS NOT A SOLICITATION OF AN OFFER TO BUY THESE SECURITIES IN ANY JURISDICTION WHERE THE OFFER OR SALE IS NOT PERMITTED.
35
| Industrial – Warehouse | Loan #1 | Cut-off Date Balance: | $90,000,000 | |
Various McClellan, CA 95652
| McClellan Park | Cut-off Date LTV: U/W NCF DSCR: U/W NOI Debt Yield: | 60.2% 2.90x 10.5% |
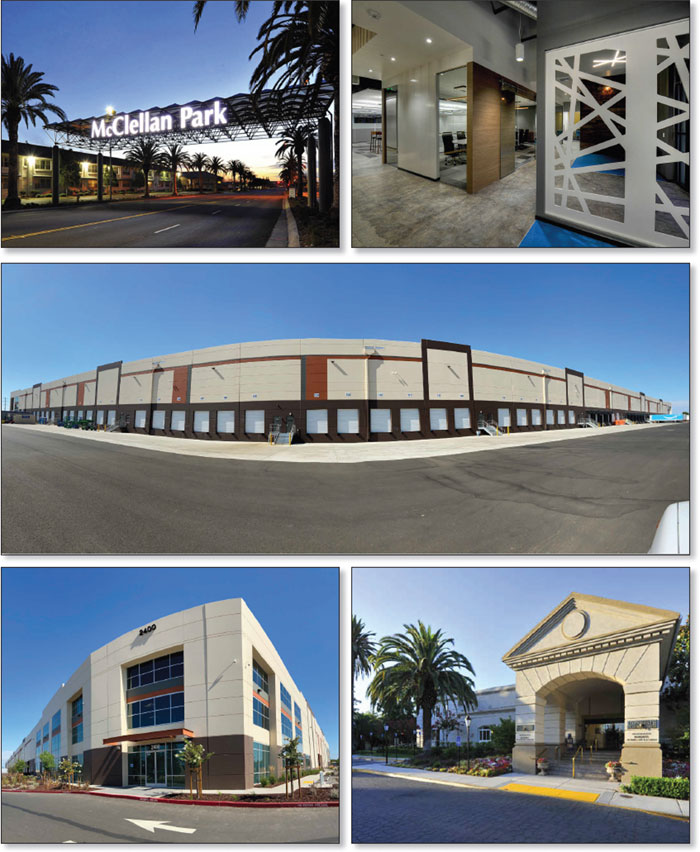
THE INFORMATION IN THIS STRUCTURAL AND COLLATERAL TERM SHEET IS NOT COMPLETE AND MAY BE AMENDED PRIOR TO THE TIME OF SALE. THIS TERM SHEET IS NOT AN OFFER TO SELL THESE SECURITIES AND IT IS NOT A SOLICITATION OF AN OFFER TO BUY THESE SECURITIES IN ANY JURISDICTION WHERE THE OFFER OR SALE IS NOT PERMITTED.
36
| Industrial – Warehouse | Loan #1 | Cut-off Date Balance: | $90,000,000 | |
Various McClellan, CA 95652
| McClellan Park | Cut-off Date LTV: U/W NCF DSCR: U/W NOI Debt Yield: | 60.2% 2.90x 10.5% |

THE INFORMATION IN THIS STRUCTURAL AND COLLATERAL TERM SHEET IS NOT COMPLETE AND MAY BE AMENDED PRIOR TO THE TIME OF SALE. THIS TERM SHEET IS NOT AN OFFER TO SELL THESE SECURITIES AND IT IS NOT A SOLICITATION OF AN OFFER TO BUY THESE SECURITIES IN ANY JURISDICTION WHERE THE OFFER OR SALE IS NOT PERMITTED.
37
| No. 1 – McClellan Park | |||||||
| Mortgage Loan Information | Mortgaged Property Information(5) | ||||||
| Mortgage Loan Seller: | Wells Fargo Bank, National Association | Single Asset/Portfolio: | Single Asset | ||||
| Credit Assessment (Fitch/KBRA/S&P): | NR/NR/NR | Property Type – Subtype: | Industrial - Warehouse | ||||
| Original Principal Balance(1): | $90,000,000 | Location: | McClellan, CA | ||||
| Cut-off Date Balance(1): | $90,000,000 | Size: | 6,925,484 SF | ||||
| % of Initial Pool Balance: | 9.9% | Cut-off Date Balance Per SF(1): | $51.69 | ||||
| Loan Purpose: | Refinance | Maturity Date Balance Per SF(1): | $51.69 | ||||
| Borrower Sponsor: | McClellan Business Park, LLC | Year Built/Renovated: | 1938/2019 | ||||
| Guarantor: | McClellan Business Park, LLC | Title Vesting: | Fee | ||||
| Mortgage Rate: | 3.3090% | Property Manager: | Self-managed | ||||
| Note Date: | November 13, 2020 | Current Occupancy (As of): | 86.8% (9/15/2020) | ||||
| Seasoning: | 2 months | YE 2019 Occupancy(4): | 88.4% | ||||
| Maturity Date: | December 11, 2030 | YE 2018 Occupancy(4): | 83.4% | ||||
| IO Period: | 120 months | YE 2017 Occupancy(4): | 80.3% | ||||
| Loan Term (Original): | 120 months | YE 2016 Occupancy(4): | NAV | ||||
| Amortization Term (Original): | NAP | As-Is Appraised Value: | $595,000,000 | ||||
| Loan Amortization Type: | Interest-only, Balloon | As-Is Appraised Value Per SF: | $85.91 | ||||
| Call Protection(2): | YM(26),YM or D(87),O(7) | As-Is Appraisal Valuation Date: | September 15, 2020 | ||||
| Lockbox Type: | Hard/Springing Cash Management | ||||||
| Additional Debt(1): | Yes | Underwriting and Financial Information(5) | |||||
| Additional Debt Type (Balance)(1): | Pari Passu ($268,000,000) | TTM NOI (9/30/2020): | $29,593,816 | ||||
| YE 2019 NOI(6): | $27,579,910 | ||||||
| YE 2018 NOI(6): | $24,924,493 | ||||||
| YE 2017 NOI(6): | $21,645,209 | ||||||
| Escrows and Reserves(3) | U/W Revenues: | $52,666,380 | |||||
| Initial | Monthly | Cap | U/W Expenses: | $15,037,967 | |||
| Taxes | $0 | Springing | NAP | U/W NOI(6): | $37,628,413 | ||
| Insurance | $0 | Springing | NAP | U/W NCF: | $34,858,219 | ||
| Replacement Reserve | $0 | Springing | $2,077,645 | U/W DSCR based on NOI/NCF(1): | 3.13x / 2.90x | ||
| TI/LC Reserve | $0 | Springing | $6,925,484 | U/W Debt Yield based on NOI/NCF(1): | 10.5% / 9.7% | ||
| Tenant Specific TI/LC | $5,482,591 | $0 | NAP | U/W Debt Yield at Maturity based on NOI/NCF(1): | 10.5% / 9.7% | ||
| Rent Concession | $18,717 | $0 | NAP | Cut-off Date LTV Ratio(1): | 60.2% | ||
| Development Agency Reserve | $689,614 | $0 | NAP | LTV Ratio at Maturity(1): | 60.2% | ||
| Sources and Uses | ||||||||
| Sources | Uses | |||||||
| Original whole loan amount(1) | $358,000,000 | 100.0% | Loan payoff | $334,182,430 | 93.3% | |||
| Upfront reserves | 6,190,922 | 1.7 | ||||||
| Closing costs | 5,652,858 | 1.6 | ||||||
| Return of equity | 11,973,790 | 3.3 | ||||||
| Total Sources | $358,000,000 | 100.0% | Total Uses | $358,000,000 | 100.0% | |||
| (1) | The McClellan Park Mortgage Loan (as defined below) is part of the McClellan Park Whole Loan (as defined below) with an original aggregate principal balance of $358,000,000. The Cut-off Date Balance Per SF, Maturity Date Balance Per SF, U/W Debt Yield based on NOI/NCF, U/W Debt Yield at Maturity based on NOI/NCF, U/W DSCR based on NOI/NCF, Cut-off Date LTV Ratio and LTV Ratio at Maturity numbers presented above are based on the McClellan Park Whole Loan. |
| (2) | At any time after the earlier of (i) January 11, 2024 and (ii) two years from the closing date of the securitization that includes the last pari passu note of the McClellan Park Whole Loan to be securitized, the McClellan Park Borrower (as defined below) has the right to defease the McClellan Park Whole Loan in whole, but not in part. Additionally, the McClellan Park Borrower may prepay the McClellan Park Whole Loan at any time during the term with a 30-day prior notice and, if such prepayment occurs on or before May 11, 2030, payment of the yield maintenance premium. |
| (3) | See “Escrows” section below. |
| (4) | See “Historical Occupancy” section below. |
| (5) | While the McClellan Park Whole Loan was originated after the emergence of the novel coronavirus pandemic and the economic disruption resulting from measures to combat the pandemic, the pandemic is an evolving situation and could impact the McClellan Park Whole Loan more severely than assumed in the underwriting of the McClellan Park Whole Loan and could adversely affect the NOI, NCF and occupancy information, as well as the appraised value and the DSCR, LTV and Debt Yield metrics presented above. See “Risk Factors—Risks Related to Market Conditions and Other External Factors—Coronavirus Pandemic Has Adversely Affected the Global Economy and Will Likely Adversely Affect the Performance of the Mortgage Loans” in the Preliminary Prospectus. |
| (6) | See “Operating History and Underwritten Cash Flow” section below for information regarding year-over-year increases in NOI and increase to U/W NOI from YE 2019 NOI. |
THE INFORMATION IN THIS STRUCTURAL AND COLLATERAL TERM SHEET IS NOT COMPLETE AND MAY BE AMENDED PRIOR TO THE TIME OF SALE. THIS TERM SHEET IS NOT AN OFFER TO SELL THESE SECURITIES AND IT IS NOT A SOLICITATION OF AN OFFER TO BUY THESE SECURITIES IN ANY JURISDICTION WHERE THE OFFER OR SALE IS NOT PERMITTED.
38
| Industrial – Warehouse | Loan #1 | Cut-off Date Balance: | $90,000,000 | |
Various McClellan, CA 95652
| McClellan Park | Cut-off Date LTV: U/W NCF DSCR: U/W NOI Debt Yield: | 60.2% 2.90x 10.5% |
The Mortgage Loan. The mortgage loan (the “McClellan Park Mortgage Loan”) is part of a whole loan (the “McClellan Park Whole Loan”) that is evidenced by eight pari passu promissory notes in the aggregate original principal amount of $358,000,000. The McClellan Park Whole Loan is secured by a first priority fee mortgage encumbering McClellan Park, a 6,925,484 square foot primarily industrial and office portfolio located in McClellan, California (the “McClellan Park Property”). The McClellan Park Whole Loan was co-originated on November 13, 2020 by Wells Fargo Bank, National Association and Goldman Sachs Bank USA.
The McClellan Park Mortgage Loan is evidenced by the non-controlling promissory Notes A-3 and A-4 in the original principal amount of $90,000,000. As noted in the Note Summary chart below, The McClellan Park Whole Loan is also evidenced by the controlling A-1 promissory Note and the non-controlling promissory Notes A-2, A-5, A-6, A-7 and A-8 (the “McClellan Park Non-Serviced Pari Passu Companion Loans”). Note A-2 was included in the WFCM 2020-C58 securitization, Note A-6 was included in the BMARK 2020-B21 securitization and Notes A-7 and A-8 were included in the BMARK 2020-B22 securitization. The McClellan Park Whole Loan will be serviced under the pooling and servicing agreement for the BANK 2020-BNK30 securitization trust. See “Description of the Mortgage Pool—The Whole Loans—The Non-Serviced Pari Passu Whole Loans” and “Pooling and Servicing Agreement” in the Preliminary Prospectus.
Note Summary
| Notes | Original Balance | Cut-off Date Balance | Note Holder | Controlling Piece |
| McClellan Park Whole Loan | ||||
| A-1 | $75,000,000 | $75,000,000 | BANK 2020-BNK30 | Yes |
| A-2 | $69,000,000 | $69,000,000 | WFCM 2020–C58 | No |
| A-3 | $54,000,000 | $54,000,000 | BANK 2020-BNK31 | No |
| A-4 | $36,000,000 | $36,000,000 | BANK 2020-BNK31 | No |
| A-5 | $16,600,000 | $16,600,000 | Wells Fargo Bank, National Association | No |
| A-6 | $75,000,000 | $75,000,000 | BMARK 2020–B21 | No |
| A-7 | $16,400,000 | $16,400,000 | BMARK 2020-B22 | No |
| A-8 | $16,000,000 | $16,000,000 | BMARK 2020-B22 | No |
| Total | $358,000,000 | $358,000,000 | ||
The Borrower and Borrower Sponsor. The borrower is McClellan Realty, LLC (the “McClellan Park Borrower”), a Delaware limited liability company and single purpose entity with two independent directors. In connection with the origination of the loan, counsel to the McClellan Park Borrower delivered a non-consolidation opinion.
The borrower sponsor and carveout guarantor is McClellan Business Park, LLC (the “Guarantor”). McClellan Business Park, LLC is a privately held company that was selected to acquire and redevelop McClellan Air Force Base in 1999. Today the project consists of 3,000 acres with approximately 8.5 million square feet of rentable space and 500 acres of developable land. The company is comprised of three entities, MBP Ventures, LLC, LDK Capital, LLC and Industrial Realty Group. MBP Ventures, LLC has acquired and developed real estate totaling over 20 million square feet and more than five thousand acres of land. LDK Capital, LLC has developed numerous master planned communities and business parks. Industrial Realty Group specializes in industrial properties and has holdings in excess of 100 million square feet.
The Property. The McClellan Park Property is a portion of McClellan Park, a large office and industrial park encompassing 3,000-acres and approximately 8.5 million square feet of leasable space, located west of Watt Avenue in an unincorporated area of Sacramento County, California. The McClellan Park Property represents the majority of McClellan Park with 6,925,484 square feet and comprises 139 buildings spanning approximately 785.1 acres. The McClellan Park Property surrounds the 10,600-foot McClellan Airfield runway, which, according to the appraisal, is one of the west coast’s most active airstrips for private aircraft. The McClellan Park Property benefits from approximately seven miles of on-site rail with multiple rails spurs, trans load yard, and rail served warehouses, which are serviced by both Burlington Northern Railroad and Union Pacific Railroad. Onsite amenities include a 112-room hotel, dining options, a gym, a credit union and a park.
Until July 2001, the McClellan Park Property served as McClellan Air Force Base, one of five major depots in the United States that provided repair and maintenance services to military aircraft. The McClellan Park Borrower was selected to acquire the base and implement an extensive redevelopment program. Since the acquisition in 2001, the borrower sponsor has invested more than $580 million in critical infrastructure, building improvements, and land development, which has driven the lease-up or sale of more than seven million square feet of office and industrial space.
As of September 15, 2020, the McClellan Park Property was 86.8% leased by approximately 176 tenants with no tenant accounting for more than 6.0% of the net rentable area or 7.0% of underwritten base rent. The McClellan Park Property has averaged 84.7% occupancy over the past five years. Since 2018 there has been over 3.4 million square feet of leasing activity. Approximately 21.7% of the net rentable area and 37.5% of underwritten base rent is attributable to investment grade tenants.
THE INFORMATION IN THIS STRUCTURAL AND COLLATERAL TERM SHEET IS NOT COMPLETE AND MAY BE AMENDED PRIOR TO THE TIME OF SALE. THIS TERM SHEET IS NOT AN OFFER TO SELL THESE SECURITIES AND IT IS NOT A SOLICITATION OF AN OFFER TO BUY THESE SECURITIES IN ANY JURISDICTION WHERE THE OFFER OR SALE IS NOT PERMITTED.
39
| Industrial – Warehouse | Loan #1 | Cut-off Date Balance: | $90,000,000 | |
Various McClellan, CA 95652
| McClellan Park | Cut-off Date LTV: U/W NCF DSCR: U/W NOI Debt Yield: | 60.2% 2.90x 10.5% |
The following table represents the different use types for the McClellan Park Property:
| Use Type | NRSF | % of NRSF | In Place Cut-Off Date Occupancy |
| Warehouse | 2,532,812 | 36.6% | 96.6% |
| Manufacturing | 1,660,684 | 24.0% | 91.6% |
| Research | 604,753 | 8.7% | 70.2% |
| Airfield | 843,221 | 12.2% | 78.6% |
| Total Industrial | 5,641,470 | 81.5% | 89.6% |
| Office | 1,020,349 | 14.7% | 72.5% |
| Residential | 157,254 | 2.3% | 71.8% |
| Commercial | 103,291 | 1.5% | 93.8% |
| Yard | 3,120 | 0.0% | 100.0% |
| Collateral Total | 6,925,484 | 100.0% | 86.8% |
Industrial (81.5% of net rentable area; 60.8% of underwritten gross rent) The industrial component of the McClellan Park Property includes over 5.6 million square feet, representing 81.5% of net rentable area and 60.8% of underwritten gross rent (including rent attributed to grossed up vacant space), and encompasses warehouse, manufacturing, research, and airfield/hanger buildings. The cluster of manufacturing, warehouse, research, residential, and office space provides the opportunity for industrial tenants to lease complementary use products all within one park.
Office (14.7% of net rentable area; 31.8% of underwritten gross rent) The office component of the McClellan Park Property includes buildings designated as office and recreational (37 primary buildings totaling 1,020,349 square feet). These buildings range in size from 800 to 331,670 square feet, with most buildings below 15,000 square feet in size. The median size within this set of buildings is 7,606 square feet. Originally constructed from 1938 to 1992, many of the buildings have been renovated to various levels. Existing office tenants include a variety of larger and small public and private operations such as the USDA Forest Services, Gateway Charters, and Faneuil, Inc.
Residential (2.3% of net rentable area; 5.0% of underwritten gross rent) The residential component at the McClellan Park Property includes seven primary buildings which include renovated and non-renovated dorm buildings. These buildings are consistent in size, ranging from 19,038 to 25,380 square feet with a median of 24,000 square feet. The subject residential space is currently 71.8% occupied by two tenants, the USDA Forest Service and AmeriCorps.
Commercial (1.5% of net rentable area; 2.5% of underwritten gross rent) Currently 93.8% leased, the retail portion of the McClellan Park Property consists of 11 buildings totaling 103,291 square feet of improved retail space. The retail operations provide tenants amenities such as a credit union, a gas station, restaurants, and a gym.
COVID-19 Update. As of January 15, 2021, most tenants at the McClellan Park Property are open and operating. Approximately 98% of the tenants by square footage and 99% of the tenants by underwritten base rent made their full December rent payments. Approximately 95% of the tenants by square footage and 93% of the tenants by underwritten base rent made their full January rent payments. Four tenants, representing approximately 4.2% of underwritten base rent, received rent deferrals ranging from 3-5 months. Three of the four tenants concurrently extended their leases. Two tenants representing 0.2% of underwritten base rent have pending rent relief requests. As January 15, 2021, the McClellan Park Whole Loan is current and is not subject to any modification or forbearance request.
Major Tenants.
Largest Tenant: Amazon (417,637 square feet, 6.0% of net rentable area; 6.5% of underwritten base rent; June 30, 2030 lease expiration) Amazon fully occupies a warehouse building at the McClellan Park Property that was constructed in 2019. According to a third party news source, Amazon’s building at the McClellan Park Property features 36-foot clear height ceilings, a 135-foot truck courtyard, as well as 40 trailer parking stalls. Amazon created an open warehouse of approximately 158,000 square feet, a drive-thru warehouse of approximately 240,000 square feet and office and support area of approximately 18,200 square feet. Additional work included creating chilled and frozen warehouse space along with will call and flex pickup areas. Amazon has leased over 1 million square feet of distribution space in Sacramento in recent years. Amazon has two 5-year renewal options, each with 270 days’ notice, at the fair market rental rate.
2nd Largest Tenant: Hydra Distribution (388,784 square feet, 5.6% of net rentable area; 3.0% of underwritten base rent; April 16, 2025 lease expiration) Hydra Distribution provides contract warehouse, transportation, crossdocking and shipping services within its central California distribution network (based at the McClellan Park Property). Hydra Distribution features access to over 2.4 million square feet of rail-served facilities and over seven miles of rail track. Hydra Distribution’s facility at the McClellan Park Property
THE INFORMATION IN THIS STRUCTURAL AND COLLATERAL TERM SHEET IS NOT COMPLETE AND MAY BE AMENDED PRIOR TO THE TIME OF SALE. THIS TERM SHEET IS NOT AN OFFER TO SELL THESE SECURITIES AND IT IS NOT A SOLICITATION OF AN OFFER TO BUY THESE SECURITIES IN ANY JURISDICTION WHERE THE OFFER OR SALE IS NOT PERMITTED.
40
| Industrial – Warehouse | Loan #1 | Cut-off Date Balance: | $90,000,000 | |
Various McClellan, CA 95652
| McClellan Park | Cut-off Date LTV: U/W NCF DSCR: U/W NOI Debt Yield: | 60.2% 2.90x 10.5% |
features 24-foot clear height ceilings and raised floor tilt-ups. Hydra Distribution has one 5-year renewal option to extend, each with six months’ notice, at the 95% of fair market rental rate.
3rd Largest Tenant: Dome Printing (320,000 square feet, 4.6% of net rentable area; 2.6% of underwritten base rent; November 17, 2033 lease expiration) Dome Printing was founded in 1914 as an engraving company serving local printers and newspapers. In 1969, Dome Printing transformed into an offset printing facility, becoming one of the largest privately held commercial printing companies in northern California. Dome Printing offers direct printing on canvas, plastics, paperboard, synthetics and metalized substrates for both its retail and packaging clients. Dome Printing has two 5-year renewal options, each with nine months’ notice, at the fair market rental rate.
The following table presents certain information relating to the tenancy at the McClellan Park Property:
Major Tenants
| Tenant Name | Credit Rating (Fitch/ Moody’s/ | Tenant NRSF | % of NRSF | Annual U/W Base Rent PSF(2) | Annual U/W Base Rent(2) | % of Total Annual U/W Base Rent | Lease Expiration Date | Extension Options | Termination Option (Y/N) |
| Major Tenants | |||||||||
| Amazon | A+/A2/AA- | 417,637 | 6.0% | $6.15 | $2,568,468 | 6.5% | 6/30/2030 | 2, 5- year | N |
| Hydra Distribution | NR/NR/NR | 388,784 | 5.6% | $3.05 | $1,184,293 | 3.0% | 4/16/2025 | 1, 5-year | N |
| Dome Printing | NR/NR/NR | 320,000 | 4.6% | $3.23 | $1,033,815 | 2.6% | 11/17/2033 | 2, 5-year | N |
| McClellan Jet Services | NR/NR/NR | 280,839 | 4.1% | $3.67 | $1,031,119 | 2.6% | 9/12/2022 | None | Y(3) |
| Northrop Grumman Systems | BBB/Baa1/BBB | 267,618 | 3.9% | $10.47 | $2,801,193 | 7.0% | Multiple(4) | Various(5) | Y(6) |
| Total Major Tenants | 1,674,878 | 24.2% | $5.15 | $8,618,888 | 21.7% | ||||
| Non-Major Tenants(7) | 4,333,579 | 62.6% | $7.19 | $31,137,427 | 78.3% | ||||
| Occupied Collateral Total | 6,008,457 | 86.8% | $6.62 | $39,756,315 | 100.0% | ||||
| Vacant Space | 917,027 | 13.2% | |||||||
| Collateral Total | 6,925,484 | 100.0% | |||||||
| (1) | Certain ratings are those of the parent company, whether or not the parent company guarantees the lease. |
| (2) | The Annual U/W Base Rent PSF and Annual U/W Base Rent shown above include rent steps through October 2021 totaling $1,210,817. The lender’s underwriting gives separate credit for straight-line rent averaging for investment grade tenants totaling $585,214 (see “Operating History and Underwritten Net Cash Flow” below). The Annual U/W Base Rent PSF and Annual U/W Base Rent shown in the table above do not include credit given for such investment grade tenants. |
| (3) | McClellan Jet Services has the right to terminate 1,373 square feet of its space after November 30, 2023 with 30 days’ notice. |
| (4) | Northrup Grumman Systems lease for its 161,589 square foot space and its 92,922 square foot space expire on December 31, 2021 (collectively, the “NG Space A”), its 4,857 square foot space expires on July 31, 2022 (“NG Space B”) and its 8,250 square foot space expires on November 30, 2022 (“NG Space C”). |
| (5) | NG Space A lease has two 5-year options to renew with nine months’ notice, NG Space B lease has two, 1-year options to renew with six months’ notice and NG Space C has no renewal options. |
| (6) | Northrup Grumman may terminate NG Space B on December 1st of each year of its term with 180 days’ notice and payment of the unamortized portion of the funded tenant improvement allowance, plus unamortized leasing commissions and three months of the base rent payable for the month immediately preceding the termination date. |
| (7) | Includes two tenants, Siemens Industry, Inc. (65,785 SF) and Veterans Affairs (10,000 SF), that have leases starting in January 2021 and February 2021, respectively. |
THE INFORMATION IN THIS STRUCTURAL AND COLLATERAL TERM SHEET IS NOT COMPLETE AND MAY BE AMENDED PRIOR TO THE TIME OF SALE. THIS TERM SHEET IS NOT AN OFFER TO SELL THESE SECURITIES AND IT IS NOT A SOLICITATION OF AN OFFER TO BUY THESE SECURITIES IN ANY JURISDICTION WHERE THE OFFER OR SALE IS NOT PERMITTED.
41
| Industrial – Warehouse | Loan #1 | Cut-off Date Balance: | $90,000,000 | |
Various McClellan, CA 95652
| McClellan Park | Cut-off Date LTV: U/W NCF DSCR: U/W NOI Debt Yield: | 60.2% 2.90x 10.5% |
The following table presents certain information relating to the lease rollover schedule at the McClellan Park Property:
Lease Expiration Schedule(1)(2)
| Year Ending December 31, | No. of Leases Expiring | Expiring NRSF | % of Total NRSF | Cumulative Expiring NRSF | Cumulative % of Total NRSF | Annual U/W Base Rent | % of Total Annual U/W Base Rent | Annual U/W Base Rent PSF(3) |
| MTM | 15 | 75,533 | 1.1% | 75,533 | 1.1% | $484,397 | 1.2% | $6.41 |
| 2020 | 17 | 150,128 | 2.2% | 225,661 | 3.3% | $1,399,982 | 3.5% | $9.33 |
| 2021 | 94 | 896,269 | 12.9% | 1,121,930 | 16.2% | $7,521,327 | 18.9% | $8.39 |
| 2022 | 63 | 1,044,895 | 15.1% | 2,166,825 | 31.3% | $8,252,111 | 20.8% | $7.90 |
| 2023 | 35 | 783,580 | 11.3% | 2,950,405 | 42.6% | $3,945,606 | 9.9% | $5.04 |
| 2024 | 21 | 463,243 | 6.7% | 3,413,648 | 49.3% | $2,279,219 | 5.7% | $4.92 |
| 2025 | 26 | 791,251 | 11.4% | 4,204,899 | 60.7% | $4,257,919 | 10.7% | $5.38 |
| 2026 | 5 | 152,898 | 2.2% | 4,357,797 | 62.9% | $1,010,198 | 2.5% | $6.61 |
| 2027 | 21 | 601,568 | 8.7% | 4,959,365 | 71.6% | $3,048,594 | 7.7% | $5.07 |
| 2028 | 21 | 233,106 | 3.4% | 5,192,471 | 75.0% | $2,702,656 | 6.8% | $11.59 |
| 2029 | 3 | 64,800 | 0.9% | 5,257,271 | 75.9% | $1,184,601 | 3.0% | $18.28 |
| 2030 | 5 | 420,757 | 6.1% | 5,678,028 | 82.0% | $2,568,468 | 6.5% | $6.10 |
| Thereafter | 13 | 330,429 | 4.8% | 6,008,457 | 86.8% | $1,101,237 | 2.8% | $3.33 |
| Vacant | 0 | 917,027 | 13.2% | 6,925,484 | 100.0% | $0 | 0.0% | $0.00 |
| Total/Wtd. Avg. | 339 | 6,925,484 | 100.0% | $39,756,315 | 100.0% | $6.62 |
| (1) | Information obtained from the underwritten rent roll. |
| (2) | Certain tenants may have lease termination options that are exercisable prior to the originally stated expiration date of the subject lease and that are not considered in the Lease Expiration Schedule. |
| (3) | Total/Wtd. Avg. Annual U/W Base Rent excludes vacant space. |
The following table presents historical occupancy percentages at the McClellan Park Property:
Historical Occupancy
12/31/2016 | 12/31/2017(1) | 12/31/2018(1) | 12/31/2019(1) | 9/15/2020(2)(3) |
| NAV(4) | 80.3% | 83.4% | 88.4% | 86.8% |
| (1) | Information obtained from the borrower sponsor. |
| (2) | Information obtained from the underwritten rent roll. |
| (3) | Includes two tenants, Siemens Industry, Inc. (65,785 SF) and Veterans Affairs (10,000 SF), that have leases starting in January 2021 and February 2021, respectively. |
| (4) | Information on 2016 Occupancy was not provided by the McClellan Park Borrower. |
THE INFORMATION IN THIS STRUCTURAL AND COLLATERAL TERM SHEET IS NOT COMPLETE AND MAY BE AMENDED PRIOR TO THE TIME OF SALE. THIS TERM SHEET IS NOT AN OFFER TO SELL THESE SECURITIES AND IT IS NOT A SOLICITATION OF AN OFFER TO BUY THESE SECURITIES IN ANY JURISDICTION WHERE THE OFFER OR SALE IS NOT PERMITTED.
42
| Industrial – Warehouse | Loan #1 | Cut-off Date Balance: | $90,000,000 | |
Various McClellan, CA 95652
| McClellan Park | Cut-off Date LTV: U/W NCF DSCR: U/W NOI Debt Yield: | 60.2% 2.90x 10.5% |
Operating History and Underwritten Net Cash Flow. The following table presents certain information relating to the historical operating performance and underwritten net cash flow at the McClellan Park Property:
Cash Flow Analysis
2017 | 2018 | 2019 | TTM 9/30/2020 | U/W | %(1) | U/W $ per SF | |
| Base Rent | $30,020,185 | $34,154,288 | $36,215,976 | $38,587,412 | $38,545,498 | 61.5% | $5.57 |
| Rent Steps | 0 | 0 | 0 | 0 | 1,210,817(2) | 1.9 | 0.17 |
| Rent Average Benefit | 0 | 0 | 0 | 0 | 585,214 | 0.9 | 0.08 |
| TI Amortization(3) | 0 | 0 | 0 | 0 | 535,080 | 0.9 | 0.08 |
| Yard Rent(3)(4) | 0 | 0 | 0 | 0 | 4,145,429 | 6.6 | 0.60 |
| Grossed Up Vacant Space | 0 | 0 | 0 | 0 | 10,013,909(5) | 16.0 | 1.45 |
| Gross Potential Rent | $30,020,185 | $34,154,288 | $36,215,976 | $38,587,412 | $55,035,947 | 87.8% | $7.95 |
| Other Income(6) | 252,056 | 47,853 | 300,496 | 793,948 | 793,948 | 1.3 | 0.11 |
| Expense Reimbursements | 4,748,711 | 5,452,877 | 6,256,187 | 6,754,163 | 6,850,394 | 10.9 | 0.99 |
| Net Rental Income | $35,020,952 | $39,655,018 | $42,772,659 | $46,135,523 | $62,680,289 | 100.0% | $9.05 |
| (Vacancy & Credit Loss) | 0 | 0 | 0 | 0 | (10,013,909) | (18.2) | (1.45) |
| Effective Gross Income | $35,020,952 | $39,655,018 | $42,772,659 | $46,135,523 | $52,666,380 | 84.0% | $7.60 |
| Real Estate Taxes | 3,963,293 | 4,255,008 | 4,257,566 | 4,625,532 | 4,454,422 | 8.5 | 0.64 |
| Insurance | 642,426 | 674,916 | 712,904 | 844,519 | 844,519 | 1.6 | 0.12 |
| Management Fee | 1,824,797 | 2,055,920 | 2,208,082 | 2,332,630 | 1,000,000 | 1.9 | 0.14 |
| Other Operating Expenses | 6,945,227 | 7,744,681 | 8,014,197 | 8,739,026 | 8,739,026 | 16.6 | 1.26 |
| Total Operating Expenses | $13,375,743 | $14,730,525 | $15,192,749 | $16,541,707 | $15,037,967 | 28.6% | $2.17 |
| Net Operating Income(7) | $21,645,209 | $24,924,493 | $27,579,910 | $29,593,816 | $37,628,413 | 71.4% | $5.43 |
| Replacement Reserves | 0 | 0 | 0 | 0 | 1,038,823 | 2.0 | 0.15 |
| TI/LC | 0 | 0 | 0 | 0 | 1,731,371 | 3.3 | 0.25 |
| Net Cash Flow | $21,645,209 | $24,924,493 | $27,579,910 | $29,593,816 | $34,858,219 | 66.2% | $5.03 |
| NOI DSCR(8) | 1.80x | 2.08x | 2.30x | 2.46x | 3.13x | ||
| NCF DSCR(8) | 1.80x | 2.08x | 2.30x | 2.46x | 2.90x | ||
| NOI Debt Yield(8) | 6.0% | 7.0% | 7.7% | 8.3% | 10.5% | ||
| NCF Debt Yield(8) | 6.0% | 7.0% | 7.7% | 8.3% | 9.7% |
| (1) | Represents (i) percent of Net Rental Income for all revenue fields, (ii) percent of Gross Potential Rent for Vacancy & Credit Loss and (iii) percent of Effective Gross Income for all other fields. |
| (2) | Represents rent steps through October 2021. |
| (3) | Yard Rent and TI Amortization has historically been captured under base rent. |
| (4) | Yard Rent represents land that is leased to tenants for additional parking needs. It is typically co-terminus with the contractual obligations in the lease. |
| (5) | Grossed Up Vacant Space is grossed up at appraisal concluded market rents. |
| (6) | Other Income represents late fees, termination fees, excess rail usage and ancillary income. |
| (7) | The increase from YE 2017 to YE 2018 NOI was primarily due to an increase in occupancy from 80.3% to 83.4% and annual increases in existing tenant rental rates. The increase in YE 2018 NOI to YE 2019 NOI was primarily due to an increase in occupancy from 83.4% to 88.4% and annual increases in existing tenant rental rates. The increase in U/W NOI from the TTM 9/30/2020 is partially driven by $1,210,817 in rent steps and $585,214 in straight line rent average for investment grade tenants. The other main driver is Amazon’s lease for 417,637 SF, under which it began paying rent in July of 2020. Its lease represents approximately $2.6 million of U/W base rent and an additional $1.2 million of Yard Rent. Additionally, the U/W base rent includes approximately $526,152 of U/W rent from two tenants, Siemens Industry, Inc. (65,785 SF) and Veterans Affairs (10,000 SF) which have leases starting in January 2021 and February 2021, respectively. Lastly, the management fee is capped at $1.0 million. |
| (8) | The NOI DSCR, NCF DSCR, NOI Debt Yield and NCF Debt Yield are based on the McClellan Park Whole Loan. |
Appraisal. The appraiser concluded to an “as-is market value” of $595,000,000 as of September 15, 2020 and a “hypothetical land value – bulk property” appraised value of $70,000,000 as of September 15, 2020.
Environmental Matters. According to the Phase I environmental reports dated between November 2, 2020 and November 6, 2020, the McClellan Business Park Property is a part of the former McClellan Air Force Base, which is on the National Priorities List (NPL) as a Superfund site due to impacts related to the long-term military operation of the McClellan Business Park Property. According to the related environmental reports, environmental impacts include, among other things, groundwater contamination from volatile organic compounds, 1,4-dioxane, metals, and perchlorate. The environmental reports identified such impacts, including the potential for vapor encroachment, as a site-wide recognized environmental condition. In addition, the Phase I ESAs identified two lot-specific recognized environmental conditions related to (i) perfluorooctane sulfonate concentrations exceeding U.S. Environmental Protection Agency screening criteria for drinking water at one parcel and (ii) impacts from the prior operations of a wastewater treatment plant, sludge drying beds, an underground oil-water separator, a 10,000-gallon oil storage tank and a pesticide/herbicide storage area on another parcel. The McClellan Business Park Property is subject to multiple local, state and federal restrictions and institutional controls, including, among other things, groundwater use restrictions, use restrictions, digging restrictions, interference restrictions and access restrictions. According to the environmental reports, the United States Air Force is the responsible party of record and retains
THE INFORMATION IN THIS STRUCTURAL AND COLLATERAL TERM SHEET IS NOT COMPLETE AND MAY BE AMENDED PRIOR TO THE TIME OF SALE. THIS TERM SHEET IS NOT AN OFFER TO SELL THESE SECURITIES AND IT IS NOT A SOLICITATION OF AN OFFER TO BUY THESE SECURITIES IN ANY JURISDICTION WHERE THE OFFER OR SALE IS NOT PERMITTED.
43
| Industrial – Warehouse | Loan #1 | Cut-off Date Balance: | $90,000,000 | |
Various McClellan, CA 95652
| McClellan Park | Cut-off Date LTV: U/W NCF DSCR: U/W NOI Debt Yield: | 60.2% 2.90x 10.5% |
responsibility for subsequent discoveries of previously unknown environmental conditions. See “Description of the Mortgage Pool—Environmental Considerations” in the Preliminary Prospectus.
Market Overview and Competition. The McClellan Park Property is located 3.6 miles north of the interstate 80 on/off ramp, which provides access westbound towards the San Francisco Bay area and eastbound towards the Nevada border. The McClellan Park Property surrounds the McClellan Airfield and is immediately adjacent to the Sacramento McClellan Airport. The Sacramento International Airport is positioned 14.2 miles west of the McClellan Park Property and the deep-water Port of Sacramento is situated 16.1 miles southwest of the McClellan Park Property. It is approximately 7.4 miles from downtown Sacramento.
According to California Department of Finance, of the ten largest cities in California, Sacramento grew by the largest percentage (1.5%) in 2018. In terms of pure population growth, the city of Sacramento added more new residents than San Diego, San Francisco, Los Angeles, or San Jose in the same year. According to the appraisal, a large portion of Sacramento’s employment has historically been dominated by the State government and other public-sector employers. State and local government accounts for 26% of the region’s labor pool (approximately 225,000 employees).
According to a third party market research provider, the estimated 2020 population within a three- and five-mile radius of the McClellan Park Property was approximately 344,204 and 1,070,132, respectively; and the estimated 2020 average household income within the same radii was approximately $74,927 and $84,655, respectively.
According to a third party market research report, the McClellan Park Property is situated within the McClellan industrial submarket of the Sacramento - CA industrial market. As of the November 10, 2020, the industrial submarket reported a total inventory of approximately 17.4 million square feet with a 5.2% vacancy rate and average asking rent of $9.23 per square foot, triple net. The submarket vacancy rate has decreased from 20.3% in 2010 and has averaged 8.1% since 2015.
The following table presents certain information relating to the appraisal’s market rent conclusions for the McClellan Park Property:
Market Rent Summary(1)
| Warehouse | Warehouse – Amazon | Manufacturing | Office | Airfield | Research | |
| Market Rent (PSF) | $0.40 | $0.50 | $0.45 | $1.10 | $0.52 | $0.90 |
| Lease Term (Years) | 4 | 4 | 4 | 4 | 4 | 4 |
| Lease Type (Reimbursements) | NNN | NNN | NNN | Full Service / Base Year | NNN | NNN |
| Rent Increase Projection | 3.00% per annum | 3.00% per annum | 3.00% per annum | 3.00% per annum | 3.00% per annum | 3.00% per annum |
| Tenant Improvements (New Tenants) (PSF) | $3.00 | $3.00 | $5.00 | $25.00 | $10.00 | $20.00 |
| Tenant Improvements (Renewals) (PSF) | $1.00 | $1.00 | $1.00 | $5.00 | $1.00 | $5.00 |
| (1) | Information obtained from the appraisal. |
The table below presents certain information relating to comparable sales pertaining to the McClellan Park Property identified by the appraiser:
Comparable Sales(1)
| Property Name | Location | Year Built/Renovated | Rentable Area (SF) | Sale Date | Sale Price | Sale Price (PSF) |
| Depot Park | Sacramento, CA | 1940/2000 | 2,144,568 | Jun. 2018 | $126,590,000 | $59 |
| Delta Industrial Portfolio | Multiple | 1997/NAP | 8,766,532 | Aug. 2017 | $590,000,000 | $67 |
| NW Mutual NV Ind. Portfolio | Reno/Sparks, NV | 1995/NAP | 1,765,258 | May 2019 | $157,800,000 | $89 |
| Texas Logistics Portfolio | Multiple | 1995/NAP | 2,682,696 | Jul. 2019 | $248,000,000 | $92 |
| (1) | Information obtained from the appraisal. |
Escrows.
Real Estate Taxes – During a Cash Trap Event Period (as defined below), the McClellan Park Whole Loan documents require ongoing monthly real estate tax reserves in an amount equal to one-twelfth of the real estate taxes that the lender estimates will be payable during the next 12 months.
Insurance – During a Cash Trap Event Period, the McClellan Park Whole Loan documents require ongoing monthly insurance reserves in an amount equal to one-twelfth of the insurance premiums that the lender estimates will be payable for the renewal of the coverage afforded by the policies upon the expiration thereof.
THE INFORMATION IN THIS STRUCTURAL AND COLLATERAL TERM SHEET IS NOT COMPLETE AND MAY BE AMENDED PRIOR TO THE TIME OF SALE. THIS TERM SHEET IS NOT AN OFFER TO SELL THESE SECURITIES AND IT IS NOT A SOLICITATION OF AN OFFER TO BUY THESE SECURITIES IN ANY JURISDICTION WHERE THE OFFER OR SALE IS NOT PERMITTED.
44
| Industrial – Warehouse | Loan #1 | Cut-off Date Balance: | $90,000,000 | |
Various McClellan, CA 95652
| McClellan Park | Cut-off Date LTV: U/W NCF DSCR: U/W NOI Debt Yield: | 60.2% 2.90x 10.5% |
However, the McClellan Park Borrower’s obligation to make insurance reserve payments will be waived so long as, (i) no event of default is continuing, (ii) the insurance policies maintained by the McClellan Park Borrower are part of a blanket or umbrella policy approved by the lender in its reasonable discretion and (iii) the McClellan Park Borrower provides the lender with paid receipts for the payment of the insurance premiums by no later than ten business days prior to the expiration dates of said policies.
Replacement Reserve – During a Cash Trap Event Period, the McClellan Park Whole Loan documents require ongoing monthly replacement reserves of $86,569 ($0.15 per square foot annually), subject to a cap of $2,077,645 ($0.30 per square foot).
TI/LC Reserve – During a Cash Trap Event Period, the McClellan Park Whole Loan documents require ongoing monthly TI/LC reserves of $288,562 ($0.50 per square foot annually), subject to a cap of $6,925,484 ($1.00 per square foot).
Development Agency Loan Reserve – The McClellan Park Whole Loan documents require an upfront reserve of $689,614 representing approximately 108% of the estimated maximum possible amount owing under a development agency loan secured by a subordinate deed of trust lien encumbering a portion of the McClellan Park Property. See “Subordinate and Mezzanine Indebtedness” section below.
Rent Concession Reserve - The McClellan Park Whole Loan documents require an upfront reserve of $18,717 related to outstanding future rent credits, abatements or gap rent pursuant to existing leases.
Tenant Specific TI/LC Reserve – The McClellan Park Whole Loan documents require an upfront reserve of $5,482,591 related to outstanding tenant improvements and leasing commissions payable by the McClellan Park Borrower under existing leases with Siemens Industry, Inc. ($2,943,558), Amazon ($1,407,294) and Americorp ($1,131,739).
Lockbox and Cash Management. The McClellan Park Whole Loan requires a lender-controlled lockbox account, which is already in-place, and that the McClellan Park Borrower or property manager direct all tenants to pay rent directly into such lockbox account. The McClellan Park Whole Loan documents also require that all rents received by the McClellan Park Borrower or the property manager be deposited into the lockbox account within two business days of receipt. Provided no Cash Trap Event Period is in effect, all amounts on deposit in the account will be transferred daily to an account specified by the McClellan Park Borrower. During a Cash Trap Event Period, all funds in the lockbox account and excess cash flow remaining after satisfaction of the waterfall items outlined in the McClellan Park Whole Loan documents, are required to be swept to an excess cash flow subaccount to be held as additional collateral for the McClellan Park Whole Loan.
A “Cash Trap Event Period” will commence upon the earlier of the following:
| (i) | the occurrence of an event of default; or |
| (ii) | the net cash flow debt yield falling below 7.0% at the end of any calendar quarter. |
A Cash Trap Event Period will end upon the occurrence of the following:
| ● | with regard to clause (i), the cure of such event of default; or |
| ● | with regard to clause (ii), the net cash flow debt yield being equal to or greater than 7.0% at the end of any calendar quarter. |
Property Management. The McClellan Park Property is managed by LDKV Management, Inc., a California corporation and a borrower sponsor affiliate.
Partial Release.
Provided no event of default is continuing, the McClellan Park Borrower is permitted to issue a partial reconveyance, satisfaction or release of one or more income producing parcels from the lien of McClellan Park Whole Loan (collectively, an “Income Producing Parcel Release”), subject, but not limited, to the following conditions:
| ● | the Income Producing Parcel Release is conveyed to a person other than the McClellan Park Borrower; |
| ● | the lender having received a Release Price (as defined below), in addition to any yield maintenance and interest shortfall then due (if any); |
| ● | immediately following the Income Producing Parcel Release, the net cash flow debt yield is no less than 10.0%; |
| ● | immediately following the Income Producing Parcel Release, at least 100 parcels are subject to the lien of the McClellan Park Whole Loan and no single parcel being more than 10.0% of the remaining aggregate adjusted net cash flow; |
| ● | immediately following the release, at least 60.0% of the rentable square footage remaining at the McClellan Park Property will be used for industrial purposes; |
| ● | the lender having received reasonably satisfactory evidence that, following the release, the McClellan Park Property complies with all applicable zoning laws, land use, parking requirements, major leases, and permitted encumbrances as defined in the McClellan Park Whole Loan documents; and |
| ● | the lender’s reasonable satisfaction that the release will satisfy REMIC requirements. |
Provided no event of default is continuing, the McClellan Park Borrower is permitted to issue a partial reconveyance, satisfaction or release of one or more vacant non-income providing parcels from the lien of McClellan Park Whole Loan (collectively, an “Non-Income Producing Parcel Release”) and, upon completion of the condominium conversion (as described below), the McClellan Park Borrower is permitted to release the Twin Rivers NIP Parcel (as defined below) as a Non-Income Producing Parcel Release, subject, but not limited, to the following conditions:
THE INFORMATION IN THIS STRUCTURAL AND COLLATERAL TERM SHEET IS NOT COMPLETE AND MAY BE AMENDED PRIOR TO THE TIME OF SALE. THIS TERM SHEET IS NOT AN OFFER TO SELL THESE SECURITIES AND IT IS NOT A SOLICITATION OF AN OFFER TO BUY THESE SECURITIES IN ANY JURISDICTION WHERE THE OFFER OR SALE IS NOT PERMITTED.
45
| Industrial – Warehouse | Loan #1 | Cut-off Date Balance: | $90,000,000 | |
Various McClellan, CA 95652
| McClellan Park | Cut-off Date LTV: U/W NCF DSCR: U/W NOI Debt Yield: | 60.2% 2.90x 10.5% |
| ● | the Non-Income Producing Parcel Release is conveyed to a person other than the McClellan Park Borrower; |
| ● | the lender having received evidence that no portion of the Non-Income Producing Parcel Release is required to remain part of the McClellan Park Property pursuant to the terms of any leases, legal agreements or for use as parking, access, ingress/egress and/or storage at the McClellan Park Property; and |
| ● | the lender having received evidence that the Non-Income Producing Parcel Release is occurring solely (i) to accommodate parcel/tax lot adjustments for potential development by an affiliate of the McClellan Park Borrower or guarantor or (ii) for the sale of such Non-Income Producing Parcel Release parcel to a third party that is not an affiliate of the McClellan Park Borrower or guarantor; |
“Release Price” means (a) with respect to the Twin Rivers Release Parcel (as defined below) an amount equal to 100% of its allocated loan amount ($10,447,854), however, as provided below, following such condominium conversion of the Twin Rivers NIP Parcel to a commercial condominium to effectuate the conveyance of the Twin Rivers condominium unit to Twin Rivers Unified School District, the Twin Rivers NIP Parcel may be released as a free release; and (b) with respect to each other release parcel (i) for the first 10% of the original principal balance of the McClellan Park Whole Loan being prepaid, 110% of the allocated loan amount of the subject release parcel(s) and (ii) for the remaining McClellan Park Whole Loan collateral, 115% of the allocated loan amount of the subject release parcel(s). A partial release of the Twin Rivers Release Parcel at the Release Price set forth in clause (a) above will count towards the 10% threshold set forth in clause (b)(i) above if such threshold has not yet been reached.
“Twin Rivers Parcel” is comprised of (i) a single tenant building leased to Twin Rivers Unified School District and identified as APN 215-0320-127 (the “Twin Rivers NIP Parcel”), and (ii) a multi-tenant building identified as APN 215-0320–126 (the “Twin Rivers Release Parcel”).
Condominium Conversion Option. Following the date which is the earlier of (x) November 13, 2021 and (y) 60 days following the last securitization of the component notes evidencing the McClellan Park Whole Loan and provided no event of default has occurred and is continuing, the McClellan Park Borrower is permitted to convert the Twin Rivers Parcel to a commercial condominium form of ownership, subject, but not limited, to the following conditions:
| ● | the condominium regime is required to create two or more condominium units, one of which will consist solely of the Twin Rivers NIP Parcel and each condominium unit will have its own separate tax parcel; and |
| ● | the McClellan Park Borrower will deliver to the lender (i) an irrevocable proxy from the McClellan Park Borrower granting the lender the right to vote, on the McClellan Park Borrower’s behalf in any vote taken by the condominium association after the acceleration of the McClellan Park Whole Loan and (ii) a conditional resignation (effective upon the lender’s demand upon the acceleration of the McClellan Park Whole Loan) of any board members that are appointed or controlled by the McClellan Park Borrower. |
Real Estate Substitution. Not permitted.
Subordinate and Mezzanine Indebtedness. In 2011, the Sacramento County Successor Agency, the successor agency to the Former Redevelopment Agency of the County of Sacramento (the “Development Agency”) made a $1,000,000 loan (the “Development Agency Loan”) to the predecessor-in-interest to the McClellan Park Borrower in connection with the renovation of portions of three buildings at the McClellan Park Property. The loan, which is due and payable in 2023, is secured by a deed of trust lien on such portion of the McClellan Park Property and is forgivable once the renovated space reaches 80% occupancy. At origination of the McClellan Park Whole Loan, the Development Agency entered into a subordination agreement which subordinated such deed of trust lien to the McClellan Park Whole Loan documents. The McClellan Park Borrower maintains that the occupancy required for forgiveness of the Development Agency Loan has been achieved and is currently negotiating loan forgiveness with the Development Agency. The amount reserved with lender for the Development Agency Loan (see “Escrows” above) has been certified by the Development Agency as sufficient to obtain the satisfaction and release of the deed of trust lien securing the Development Agency Loan. Provided no event of default is continuing, upon receipt of a payoff statement and wiring instructions from the Development Agency, the lender will disburse funds from such reserve to pay off the Development Agency Loan and, upon receipt of evidence that the lien has been released, disburse any remaining funds in the reserve to the McClellan Park Borrower (or, if a Cash Trap Event Period then exists, to the cash management account with the lender).
Ground Lease. None.
Terrorism Insurance. The McClellan Park Whole Loan documents require that the “all risk” insurance policy required to be maintained by the McClellan Park Borrower provides coverage for terrorism in an amount equal to the full replacement cost of the McClellan Park Property, as well as business interruption insurance covering no less than the 24-month period following the occurrence of a casualty event, together with a 12-month extended period of indemnity (provided that if TRIPRA or a similar statute is not in effect, the McClellan Park Borrower will not be obligated to pay terrorism insurance premiums in excess of two times the annual premium for the casualty and business interruption coverage).
Earthquake Insurance. A seismic risk assessment dated September 30, 2020 indicated a probable maximum loss of 9%. Earthquake insurance is not required.
THE INFORMATION IN THIS STRUCTURAL AND COLLATERAL TERM SHEET IS NOT COMPLETE AND MAY BE AMENDED PRIOR TO THE TIME OF SALE. THIS TERM SHEET IS NOT AN OFFER TO SELL THESE SECURITIES AND IT IS NOT A SOLICITATION OF AN OFFER TO BUY THESE SECURITIES IN ANY JURISDICTION WHERE THE OFFER OR SALE IS NOT PERMITTED.
46
(THIS PAGE INTENTIONALLY LEFT BLANK)
THE INFORMATION IN THIS STRUCTURAL AND COLLATERAL TERM SHEET IS NOT COMPLETE AND MAY BE AMENDED PRIOR TO THE TIME OF SALE. THIS TERM SHEET IS NOT AN OFFER TO SELL THESE SECURITIES AND IT IS NOT A SOLICITATION OF AN OFFER TO BUY THESE SECURITIES IN ANY JURISDICTION WHERE THE OFFER OR SALE IS NOT PERMITTED.
47
| Office – CBD | Loan #2 | Cut-off Date Balance: | $80,000,000 | |
| 605 Third Avenue | 605 Third Avenue | Cut-off Date LTV: | 33.7% | |
| New York, NY 10158 | UW NCF DSCR: | 6.61x | ||
| UW NOI Debt Yield: | 13.9% |

THE INFORMATION IN THIS STRUCTURAL AND COLLATERAL TERM SHEET IS NOT COMPLETE AND MAY BE AMENDED PRIOR TO THE TIME OF SALE. THIS TERM SHEET IS NOT AN OFFER TO SELL THESE SECURITIES AND IT IS NOT A SOLICITATION OF AN OFFER TO BUY THESE SECURITIES IN ANY JURISDICTION WHERE THE OFFER OR SALE IS NOT PERMITTED.
48
| Office – CBD | Loan #2 | Cut-off Date Balance: | $80,000,000 | |
| 605 Third Avenue | 605 Third Avenue | Cut-off Date LTV: | 33.7% | |
| New York, NY 10158 | UW NCF DSCR: | 6.61x | ||
| UW NOI Debt Yield: | 13.9% |
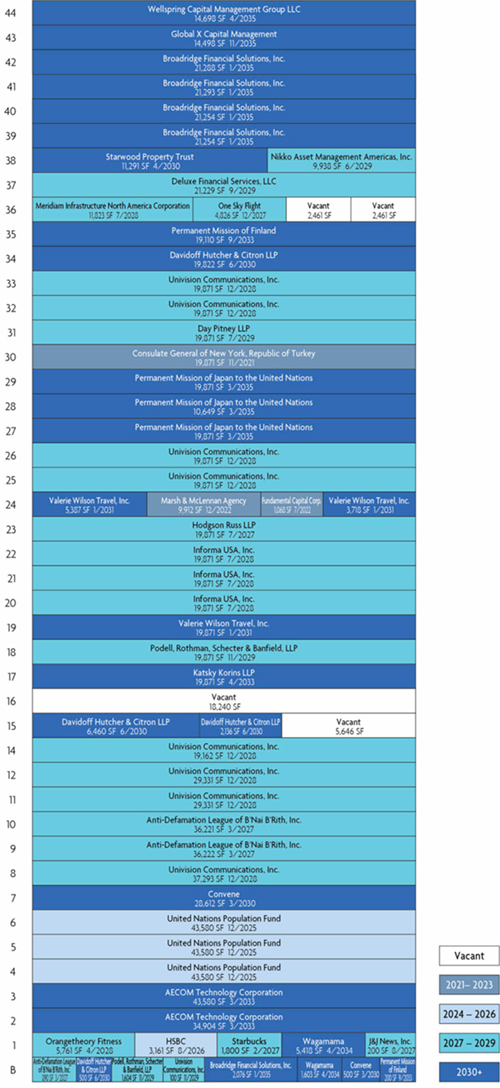
THE INFORMATION IN THIS STRUCTURAL AND COLLATERAL TERM SHEET IS NOT COMPLETE AND MAY BE AMENDED PRIOR TO THE TIME OF SALE. THIS TERM SHEET IS NOT AN OFFER TO SELL THESE SECURITIES AND IT IS NOT A SOLICITATION OF AN OFFER TO BUY THESE SECURITIES IN ANY JURISDICTION WHERE THE OFFER OR SALE IS NOT PERMITTED.
49
| Office – CBD | Loan #2 | Cut-off Date Balance: | $80,000,000 | |
| 605 Third Avenue | 605 Third Avenue | Cut-off Date LTV: | 33.7% | |
| New York, NY 10158 | UW NCF DSCR: | 6.61x | ||
| UW NOI Debt Yield: | 13.9% |
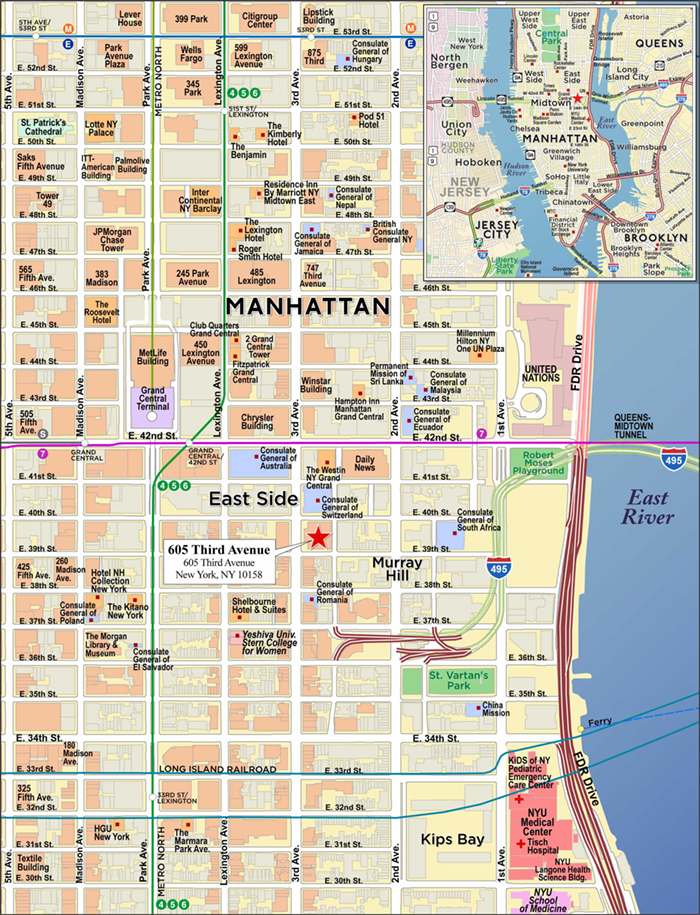
THE INFORMATION IN THIS STRUCTURAL AND COLLATERAL TERM SHEET IS NOT COMPLETE AND MAY BE AMENDED PRIOR TO THE TIME OF SALE. THIS TERM SHEET IS NOT AN OFFER TO SELL THESE SECURITIES AND IT IS NOT A SOLICITATION OF AN OFFER TO BUY THESE SECURITIES IN ANY JURISDICTION WHERE THE OFFER OR SALE IS NOT PERMITTED.
50
| No. 2 – 605 Third Avenue | |||||||
| Mortgage Loan Information | Mortgaged Property Information(7) | ||||||
| Mortgage Loan Seller: | Morgan Stanley Mortgage Capital Holdings LLC | Single Asset/Portfolio: | Single Asset | ||||
Credit Assessment (Fitch/KBRA/S&P): | BBB-sf/A-(sf)/NR | Property Type – Subtype: | Office – CBD | ||||
| Original Principal Balance(1): | $80,000,000 | Location: | New York, NY | ||||
| Cut-off Date Balance(1): | $80,000,000 | Size: | 1,027,736 SF | ||||
| % of Initial Pool Balance: | 8.8% | Cut-off Date Balance Per SF(1): | $224.77 | ||||
| Loan Purpose: | Refinance | Maturity Date Balance Per SF(1): | $224.77 | ||||
| Borrower Sponsors: | RP 605 Acquisition; FB 605 Equity | Year Built/Renovated: | 1965/2018 | ||||
| LLC, FB 605 Corp.; Hadwin LLC | Title Vesting: | Fee | |||||
| Guarantor(2): | NAP | Property Manager: | Self-managed | ||||
| Mortgage Rate(3): | 1.93752% | Current Occupancy (As of): | 97.2% (10/1/2020) | ||||
| Note Date: | November 20, 2020 | YE 2019 Occupancy: | 96.7% | ||||
| Seasoning: | 2 months | YE 2018 Occupancy: | 76.6% | ||||
| Maturity Date: | December 5, 2030 | YE 2017 Occupancy: | 71.9% | ||||
| IO Period: | 120 months | YE 2016 Occupancy: | NAV | ||||
| Loan Term (Original): | 120 months | Appraised Value: | $685,000,000 | ||||
| Amortization Term (Original): | NAP | Appraised Value Per SF: | $666.51 | ||||
| Loan Amortization Type: | Interest-only, Balloon | Appraisal Valuation Date: | November 1, 2020 | ||||
| Call Protection(4): | GTR 1% or YM(26),GTR 1% or YM or D(87),O(7) | Underwriting and Financial Information(7) | |||||
| Lockbox Type: | Hard/Springing Cash Management | TTM NOI (9/30/2020)(8): | $23,869,945 | ||||
| Additional Debt(1): | Yes | YE 2019 NOI(8): | $8,013,280 | ||||
| Additional Debt Type (Balance)(1)(5): | Pari Passu ($151,000,000); | YE 2018 NOI: | $10,798,472 | ||||
| Subordinate ($78,000,000); | YE 2017 NOI: | $13,196,382 | |||||
| Mezzanine ($91,000,000); | U/W Revenues: | $68,159,995 | |||||
| Future Mezzanine | U/W Expenses: | $36,029,430 | |||||
| Escrows and Reserves(6) | U/W NOI(8): | $32,130,565 | |||||
| Initial | Monthly | Cap | U/W NCF: | $29,974,788 | |||
| RE Taxes | $0 | Springing | NAP | U/W DSCR based on NOI/NCF(1): | 7.08x / 6.61x | ||
| Insurance | $0 | Springing | NAP | U/W Debt Yield based on NOI/NCF(1): | 13.9% / 13.0% | ||
| Replacement Reserve | $0 | Springing | $411,096 | U/W Debt Yield at Maturity based on NOI/NCF(1): | 13.9% / 13.0% | ||
| TI/LC Reserve | $1,092,905 | Springing | $4,000,000 | Cut-off Date LTV Ratio(1): | 33.7% | ||
| Free Rent Reserve | $934,456 | Springing | NAP | LTV Ratio at Maturity(1): | 33.7% | ||
| Sources and Uses | ||||||||||
| Sources | Uses | |||||||||
| Senior Loan Amount(1) | $231,000,000 | 57.8 | % | Loan Payoff | $189,965,577 | 47.5 | % | |||
| Subordinate Loan Amount | 78,000,000 | 19.5 | Return of Equity | 201,920,067 | 50.5 | |||||
| Mezzanine Loan | 91,000,000 | 22.8 | Closing Costs | 6,086,995 | 1.5 | |||||
| Reserves | 2,027,361 | 0.5 | ||||||||
| Total Sources | $400,000,000 | 100.0 | % | Total Uses | $400,000,000 | 100.0 | % | |||
| (1) | The 605 Third Avenue Mortgage Loan (as defined below) is part of the 605 Third Avenue Whole Loan (as defined below), which is comprised of five pari passu senior promissory notes with an aggregate original principal balance of $231,000,000 (collectively, the “605 Third Avenue Senior Loans”) and three promissory notes that are subordinate to the 605 Third Avenue Senior Loans with an aggregate original principal balance of $78,000,000 (collectively, the “605 Third Avenue Subordinate Companion Loans”, and together with the 605 Third Avenue Senior Loans, the “605 Third Avenue Whole Loan”). The Cut-off Date Balance Per SF, Maturity Date Balance Per SF, U/W DSCR based on NOI/NCF, U/W Debt Yield based on NOI/NCF, U/W Debt Yield at Maturity based on NOI/NCF, Cut-off Date LTV Ratio and LTV Ratio at Maturity numbers presented above are based on the aggregate Cut-off Date principal balance of the 605 Third Avenue Senior Loans, without regard to the 605 Third Avenue Subordinate Companion Loans or the 605 Third Avenue Mezzanine Loan (as defined below). The Cut-off Date Balance PSF, Maturity Date Balance PSF, UW NOI Debt Yield, UW NOI Debt Yield at Maturity, UW DSCR based on NOI/NCF, Cut-off Date LTV Ratio and Maturity Date LTV Ratio numbers based on the entire 605 Third Avenue Whole Loan are $301, $301, 10.4%, 10.4%, 4.61x, 4.30x, 45.1% and 45.1%, respectively. The Cut-off Date Balance PSF, Maturity Date Balance PSF, UW NOI Debt Yield, UW NOI Debt Yield at Maturity, UW DSCR based on NOI/NCF, Cut-off Date LTV Ratio and Maturity Date LTV Ratio numbers based on the combined balance of the 605 Third Avenue Whole Loan and the 605 Third Avenue Mezzanine Loan are $389, $389, 8.0%, 8.0%, 2.76x, 2.58x, 58.4% and 58.4%, respectively. |
| (2) | There is no non-recourse carveout guarantor or separate environmental indemnitor with respect to the 605 Third Avenue Whole Loan. |
| (3) | Reflects the 605 Third Avenue Senior Loans only. The 605 Third Avenue Subordinate Companion Loans bear interest at the rate of 3.0780% per annum. |
| (4) | Defeasance of the 605 Third Avenue Whole Loan is permitted at any time after the earlier of (i) November 20, 2023, or (ii) two years from the closing date of the securitization that includes the last note evidencing a portion of the 605 Third Avenue Whole Loan to be securitized. The assumed defeasance lockout period of 26 payments is based on the closing date of this transaction in February 2021. In addition, prepayment of the 605 Third Avenue Whole Loan is permitted at any time, subject to, prior to the open prepayment date, payment of a prepayment fee equal to the greater of 1.00% of the amount prepaid and a yield maintenance premium. |
| (5) | See “Subordinate and Mezzanine Indebtedness” section below. |
| (6) | See “Escrows” below for further discussion of reserve requirements. |
| (7) | The novel coronavirus pandemic is an evolving situation and could impact the 605 Third Avenue Whole Loan more severely than assumed in the underwriting of the 605 Third Avenue Whole Loan and could adversely affect the NOI, NCF and occupancy information, as well as the appraised value and the DSCR, LTV and Debt Yield metrics presented above and herein. See “Risk Factors—Risks Related to Market Conditions and Other External Factors—The Coronavirus Pandemic Has Adversely Affected the Global Economy and Will Likely Adversely Affect the Performance of the Mortgage Loans” in the Preliminary Prospectus. |
| (8) | See “Operating History and Underwritten Net Cash Flow” for information regarding the increases in NOI from 2nd Most Recent NOI to Most Recent NOI and from Most Recent NOI to UW NOI. |
THE INFORMATION IN THIS STRUCTURAL AND COLLATERAL TERM SHEET IS NOT COMPLETE AND MAY BE AMENDED PRIOR TO THE TIME OF SALE. THIS TERM SHEET IS NOT AN OFFER TO SELL THESE SECURITIES AND IT IS NOT A SOLICITATION OF AN OFFER TO BUY THESE SECURITIES IN ANY JURISDICTION WHERE THE OFFER OR SALE IS NOT PERMITTED.
51
| Office – CBD | Loan #2 | Cut-off Date Balance: | $80,000,000 | |
| 605 Third Avenue | 605 Third Avenue | Cut-off Date LTV: | 33.7% | |
| New York, NY 10158 | UW NCF DSCR: | 6.61x | ||
| UW NOI Debt Yield: | 13.9% |
The Mortgage Loan. The mortgage loan (the “605 Third Avenue Mortgage Loan”) is part of the 605 Third Avenue Whole Loan in the original principal balance of $309,000,000. The 605 Third Avenue Whole Loan is secured by a first priority fee mortgage encumbering an office property located in New York, New York (the “605 Third Avenue Property”). The 605 Third Avenue Whole Loan was originated by Morgan Stanley Bank, N.A., as to the 605 Third Avenue Senior Loans, and by Morgan Stanley Mortgage Capital Holdings LLC, as to the 605 Third Avenue Subordinate Companion Loans. The 605 Third Avenue Whole Loan is comprised of the 605 Third Avenue Senior Loans, consisting of five pari passu senior promissory notes in the aggregate original principal balance of $231,000,000, and the 605 Third Avenue Subordinate Companion Loans, consisting of three subordinate promissory notes in the aggregate original principal balance of $78,000,000. The non-controlling senior Notes A-2 and A-5, with an aggregate original principal balance of $80,000,000, represent the 605 Third Avenue Mortgage Loan and will be included in the BANK 2021-BNK31 securitization trust. The remaining senior promissory notes, with an aggregate original principal balance of $151,000,000, have been or are expected to be contributed to one or more future securitization transactions. The 605 Third Avenue Whole Loan will be serviced pursuant to the pooling and servicing agreement for the BANK 2020-BNK30 securitization trust. See “Description of the Mortgage Pool—The Whole Loans—The Non-Serviced AB Whole Loans—The 605 Third Avenue Whole Loan” and “Pooling and Servicing Agreement” in the Preliminary Prospectus.
Note Summary
| Notes | Original Principal Balance | Cut-off Date Balance | Note Holder | Controlling Interest | ||||
| A-1 | $80,000,000 | $80,000,000 | BANK 2020-BNK30 | No(1) | ||||
| A-2 | $60,000,000 | $60,000,000 | BANK 2021-BNK31 | No | ||||
| A-3 | $40,000,000 | $40,000,000 | MSBNA | No | ||||
| A-4 | $31,000,000 | $31,000,000 | MSBNA | No | ||||
| A-5 | $20,000,000 | $20,000,000 | BANK 2021-BNK31 | No | ||||
| B-1 | $40,600,000 | $40,600,000 | Third party holder | Yes(1) | ||||
| B-2 | $20,000,000 | $20,000,000 | Third party holder | No(1) | ||||
| B-3 | $17,400,000 | $17,400,000 | Third party holder | No(1) | ||||
| Total | $309,000,000 | $309,000,000 |
| (1) | Pursuant to the related co-lender agreement, the holder of Note B-1 is the controlling noteholder unless a “control appraisal period” has occurred and is continuing under the co-lender agreement, in which case Note A-1 will become the controlling noteholder. See “Description of the Mortgage Pool—The Whole Loans—The Non-Serviced AB Whole Loans—The 605 Third Avenue Whole Loan” in the Preliminary Prospectus. |
The Borrower and the Borrower Sponsors. The borrower is 605 Third Avenue Fee LLC (the “605 Third Avenue Borrower”), a Delaware limited liability company structured with two independent directors. There is no non-recourse carveout guarantor or separate environmental indemnitor with respect to the 605 Third Avenue Whole Loan. The 605 Third Avenue Borrower is owned by a joint venture between affiliates of Fisher Brothers (approximately 50.5%) and the Commingled Pension Trust Fund (Special Situation Property) (the “Fund”) of JP Morgan Chase Bank, N.A. (approximately 49.0%). The borrower sponsors are RP 605 Acquisition LLC (which is indirectly owned by the Fund), and FB 605 Equity LLC, FB 605 Corp. and Hadwin LLC (all of which are indirectly owned by members of the Fisher family and/or their family trusts). Fisher Brothers has been a builder, owner and operator of commercial real estate in New York City for over 100 years. The company has developed, owned and managed more than 10 million square feet of Class-A commercial space, with 1.5 million square feet of space under development. Fisher Brothers developed the 605 Third Avenue Property in 1963 and has operated the 605 Third Avenue Property ever since. The related Whole Loan documents generally permit transfers of interests in the 605 Third Avenue Borrower among the owners of the joint venture and certain of their affiliates, including affiliates of Fisher Brothers and certain affiliates of JP Morgan Chase Bank, N.A. and related funds.
The Property. The 605 Third Avenue Property is a Class A, 44-story office property totaling 1,027,736 square feet, including 16,340 square feet of retail space, located in New York City. The 605 Third Avenue Property was built in 1965 and most recently renovated in 2018. Since 2014, the borrower sponsor spent approximately $104.3 million in capital expenditures at the 605 Third Avenue Property. Capital expenditures included modifications to the building lobby, elevator modernization, the creation of a bike room, the creation of a marketing and messenger center, fire alarm upgrades, and tenant improvement allowances, as well as base building upgrades.
The 605 Third Avenue Property was 97.2% leased as of October 1, 2020 to 25 office tenants and five retail tenants. The tenant mix includes financial technology, financial and diplomatic mission tenants, including the three largest tenants: Univision Communications, Inc. (“Univision”), United Nations Population Fund (“UNPF”) and Broadridge Financial Solutions, Inc. (“Broadridge”). The office component of the 605 Third Avenue Property is 97.1% leased to a mixture of tenants, anchored by seven tenants that exceed 50,000 square feet. Aside from the three largest tenants at the 605 Third Avenue Property, no other tenant accounts for more than 6.7% of underwritten rent or 7.6% of total square feet. The 605 Third Avenue Property contains a retail component that comprises 1.6% of the total net rentable area and accounts for approximately 3.6% of underwritten rent. The retail component is currently 100.0% leased to Orangetheory Fitness (5,761 square feet), Wagamama (5,418 square feet), HSBC (3,161 square feet), Starbucks (1,800 square feet) and J&J News, Inc. (200 square feet).
Approximately 230,000 square feet have been leased in the building since January 2019. Tenants that have signed leases over the past two years include Broadridge (85,089 square feet), Permanent Mission of Japan to the United Nations (50,391 square feet), Deluxe Financial Services, LLC (21,229 square feet), Katsky Korins LLP (19,871 square feet) and Wellspring Capital Management Group LLC (14,698 square feet).
THE INFORMATION IN THIS STRUCTURAL AND COLLATERAL TERM SHEET IS NOT COMPLETE AND MAY BE AMENDED PRIOR TO THE TIME OF SALE. THIS TERM SHEET IS NOT AN OFFER TO SELL THESE SECURITIES AND IT IS NOT A SOLICITATION OF AN OFFER TO BUY THESE SECURITIES IN ANY JURISDICTION WHERE THE OFFER OR SALE IS NOT PERMITTED.
52
| Office – CBD | Loan #2 | Cut-off Date Balance: | $80,000,000 | |
| 605 Third Avenue | 605 Third Avenue | Cut-off Date LTV: | 33.7% | |
| New York, NY 10158 | UW NCF DSCR: | 6.61x | ||
| UW NOI Debt Yield: | 13.9% |
Major Tenants.
Univision (194,701 square feet, 18.9% of net rentable area, 18.0% of underwritten rent). Univision is the leading Spanish language media company in the United States. The company provides news, sports and entertainment content across broadcast and cable television, audio and digital platforms. Univision has been a tenant at the 605 Third Avenue Property since 2013 and has a lease expiration of December 31, 2028. Univision has two, 5-year renewal options or one, 10-year renewal option, upon notice of at least 18 months prior to the expiration of the current term. Univision may only exercise its renewal option with respect to at least 37,000 rentable square feet. The fixed annual rent for each extension term is required to be an amount equal to 95% of the market value rent. Univision is currently subleasing space to the following subtenants through Univision’s lease expiration: Wolf, Greenfield & Sacks (19,871 square feet) at $52.00 PSF, Shoptalk Commerce (19,871 square feet) at $41.00 PSF, Levy Konigsberg (19,871 square feet) at $45.00 PSF, and DCS Advisory (29,331 square feet) at $45.00 PSF. Univision has a free rent period from January through June 2024 (for which the 605 Third Avenue Borrower is required to make deposits into a free rent reserve as described below under “Escrows—Free Rent Reserve” during the period from January 2022 through December 2023) and also has free rent during April, July and October 2028 (for which the 605 Third Avenue Borrower is required to make deposits into a free rent reserve as described below under “Escrows—Free Rent Reserve” during the period from April 1, 2027 through March 31, 2028).
UNPF (130,740 square feet, 12.7% of net rentable area, 8.9% of underwritten rent). UNPF is the United Nations sexual and reproductive health agency. Headquartered in New York City, UNPF works in more than 150 countries and territories that are home to the majority of the world’s people. UNPF has been a tenant at the 605 Third Avenue Property since 2018 and has a lease expiration of December 31, 2025. If the United Nations leaves its headquarters in New York City, UNPF has the option to terminate its lease upon written notice and subject to termination costs equal to the sum of unamortized tenant improvements, leasing commissions and legal fees. The termination date will occur one year after UNPF provides written notice of intent to vacate. UNPF has one, 10-year renewal option available.
Broadridge (87,165 square feet, 8.5% of net rentable area, 10.6% of underwritten rent). Broadridge is a provider of investor communications and technology-driven solutions to banks, broker-dealers, mutual funds and corporate issuers. The company’s segments include investor communication solutions and global technology and operations. Broadridge has been a tenant at the 605 Third Avenue Property since February 2020, has a lease expiration of January 31, 2035 and has one, 10-year renewal option available.
THE INFORMATION IN THIS STRUCTURAL AND COLLATERAL TERM SHEET IS NOT COMPLETE AND MAY BE AMENDED PRIOR TO THE TIME OF SALE. THIS TERM SHEET IS NOT AN OFFER TO SELL THESE SECURITIES AND IT IS NOT A SOLICITATION OF AN OFFER TO BUY THESE SECURITIES IN ANY JURISDICTION WHERE THE OFFER OR SALE IS NOT PERMITTED.
53
| Office – CBD | Loan #2 | Cut-off Date Balance: | $80,000,000 | |
| 605 Third Avenue | 605 Third Avenue | Cut-off Date LTV: | 33.7% | |
| New York, NY 10158 | UW NCF DSCR: | 6.61x | ||
| UW NOI Debt Yield: | 13.9% |
The following table presents certain information relating to the major tenants at the 605 Third Avenue Property:
Major Tenants(1)
| Tenant Name | Credit Rating |
| Tenant NRSF | % of NRSF | Annual U/W Base Rent PSF(3) | Annual U/W Base Rent | % of Total Annual U/W Base Rent | Lease Expiration Date | Extension Options | Term. Option (Y/N) | |||||||||
| Major Tenants | |||||||||||||||||||
| Univision(4) | NR/NR/NR | 194,701 | 18.9% | $56.79 | $11,056,864 | 18.0% | 12/31/2028 | (5) | N | ||||||||||
| UNPF(6) | NR/NR/NR | 130,740 | 12.7% | $41.85 | $5,471,469 | 8.9% | 12/31/2025 | 1 x 10-year | Y | ||||||||||
| Broadridge | BBB+/Baa1/BBB+ | 87,165 | 8.5% | $74.30 | $6,476,486 | 10.6% | 1/31/2035 | 1 x 10-year | N | ||||||||||
| AECOM Technology Corporation(7) | NR/NR/NR | 78,484 | 7.6% | $52.00 | $4,081,168 | 6.7% | 3/31/2033 | 1 x 10-year | Y | ||||||||||
| Anti-Defamation League of B’nai B’rith, Inc. | NR/NR/NR | 73,333 | 7.1% | $48.71 | $3,571,735 | 5.8% | 3/31/2027 | 1 x 10-year | N | ||||||||||
| Total Major Tenants | 564,423 | 54.9% | $54.32 | $30,657,721 | 50.0% | ||||||||||||||
| Non-Major Tenants(3) | 434,505 | 42.3% | $70.45 | $30,610,678 | 50.0% | ||||||||||||||
| Occupied Collateral Total | 998,928 | 97.2% | $61.33 | $61,268,399 | 100.0% | ||||||||||||||
| Vacant Space | 28,808 | 2.8% | |||||||||||||||||
| Collateral Total | 1,027,736 | 100.0% | |||||||||||||||||
| (1) | Information is based on the underwritten rent roll as of October 1, 2020. |
| (2) | Certain ratings are those of the parent company whether or not the parent company guarantees the lease. |
| (3) | Total/Wtd. Avg. Annual UW Rent PSF excludes vacant space. |
| (4) | Univision is currently subleasing space to the following subtenants through Univision’s lease expiration: Wolf, Greenfield & Sacks (19,871 square feet) at $52.00 PSF, Shoptalk Commerce (19,871 square feet) at $41.00 PSF, Levy Konigsberg (19,871 square feet) at $45.00 PSF, and DCS Advisory (29,331 square feet) at $45.00 PSF. The 605 Third Avenue Whole Loan was underwritten based on the rent under the prime lease. Univision has a free rent period from January through June 2024 (for which the 605 Third Avenue Borrower is required to make deposits into a free rent reserve as described below under “Escrows—Free Rent Reserve” during the period from January 2022 through December 2023) and also has free rent during April, July and October 2028 (for which the 605 Third Avenue Borrower is required to make deposits into a free rent reserve as described below under “Escrows—Free Rent Reserve” during the period from April 1, 2027 through March 31, 2028). |
| (5) | Univision has two, 5-year renewal options or one, 10-year renewal option, upon notice of at least 18 months prior to the expiration of the current term. Univision may only exercise its renewal option with respect to at least 37,000 rentable square feet. The fixed annual rent for each extension term is required to be an amount equal to 95% of the market value rent. |
| (6) | If the United Nations leaves its headquarters in New York City, UNPF has the option to terminate its lease upon written notice and subject to termination costs equal to the sum of unamortized tenant improvements, leasing commissions and legal fees. The termination date will occur one year after UNPF provides written notice of intent to vacate. |
| (7) | AECOM Technology Corporation has the option to terminate its lease effective September 30, 2028 upon written notice given by September 30, 2026 accompanied by a termination payment. AECOM Technology Corporation has free rent through June 2021 and a partial rent abatement in July 2021, which have been reserved for. |
The following table presents certain information relating to the lease rollover schedule at the 605 Third Avenue Property:
Lease Expiration Schedule(1)
| Year Ending December 31, | No. of Leases Expiring(2) | Expiring NRSF | % of Total NRSF | Cumulative Expiring NRSF | Cumulative % of Total NRSF | Annual U/W Base Rent | % of Total Annual U/W Base Rent | Annual U/W Base Rent PSF | |||||||||
| MTM | 0 | 0 | 0.0% | 0 | 0.0% | $0 | 0.0% | $0.00 | |||||||||
| 2021 | 1 | 19,871 | 1.9% | 19,871 | 1.9% | $1,828,132 | 3.0% | $92.00 | |||||||||
| 2022 | 2 | 10,980 | 1.1% | 30,851 | 3.0% | $584,844 | 1.0% | $53.26 | |||||||||
| 2023 | 0 | 0 | 0.0% | 30,851 | 3.0% | $0 | 0.0% | $0.00 | |||||||||
| 2024 | 0 | 0 | 0.0% | 30,851 | 3.0% | $0 | 0.0% | $0.00 | |||||||||
| 2025 | 1 | 130,740 | 12.7% | 161,591 | 15.7% | $5,471,469 | 8.9% | $41.85 | |||||||||
| 2026 | 1 | 3,161 | 0.3% | 164,752 | 16.0% | $857,990 | 1.4% | $271.43 | |||||||||
| 2027 | 5 | 100,030 | 9.7% | 264,782 | 25.8% | $5,565,077 | 9.1% | $55.63 | |||||||||
| 2028 | 4 | 271,898 | 26.5% | 536,680 | 52.2% | $16,093,898 | 26.3% | $59.19 | |||||||||
| 2029 | 4 | 72,513 | 7.1% | 609,193 | 59.3% | $5,106,086 | 8.3% | $70.42 | |||||||||
| 2030 | 3 | 69,321 | 6.7% | 678,514 | 66.0% | $3,999,948 | 6.5% | $57.70 | |||||||||
| 2031 | 1 | 28,976 | 2.8% | 707,490 | 68.8% | $1,825,488 | 3.0% | $63.00 | |||||||||
| Thereafter | 8 | 291,438 | 28.4% | 998,928 | 97.2% | $19,935,467 | 32.5% | $68.40 | |||||||||
| Vacant | 0 | 28,808 | 2.8% | 1,027,736 | 100.0% | $0 | 0.0% | $0.00 | |||||||||
| Total/Wtd. Avg.(3) | 30 | 1,027,736 | 100.0% | $61,268,399 | 100.0% | $61.33 |
| (1) | Information is based on the underwritten rent roll as of October 1, 2020. |
| (2) | Certain tenants may have lease termination options that are exercisable prior to the stated expiration date of the subject lease or leases that are not considered in the lease rollover schedule. |
| (3) | Total Annual U/W Base Rent PSF excludes vacant space. |
THE INFORMATION IN THIS STRUCTURAL AND COLLATERAL TERM SHEET IS NOT COMPLETE AND MAY BE AMENDED PRIOR TO THE TIME OF SALE. THIS TERM SHEET IS NOT AN OFFER TO SELL THESE SECURITIES AND IT IS NOT A SOLICITATION OF AN OFFER TO BUY THESE SECURITIES IN ANY JURISDICTION WHERE THE OFFER OR SALE IS NOT PERMITTED.
54
| Office – CBD | Loan #2 | Cut-off Date Balance: | $80,000,000 | |
| 605 Third Avenue | 605 Third Avenue | Cut-off Date LTV: | 33.7% | |
| New York, NY 10158 | UW NCF DSCR: | 6.61x | ||
| UW NOI Debt Yield: | 13.9% |
The following table presents historical occupancy percentages at the 605 Third Avenue Property:
Historical Occupancy
| 2017(1) | 2018(1) | 2019(1) | 10/1/2020(2) | |||
| 71.9% | 76.6% | 96.7% | 97.2% |
| (1) | Information obtained from the borrower sponsor. |
| (2) | Information based on the underwritten rent roll. |
Operating History and Underwritten Net Cash Flow. The following table presents certain information relating to the historical operating performance and underwritten net cash flow at the 605 Third Avenue Property:
Cash Flow Analysis(1)
| 2017(2) | 2018(2) | 2019(3) | TTM 9/30/2020(3)(4) | U/W(4) | %(5) | U/W $ per SF | ||||||||||
| Base Rent | $40,934,326 | $39,522,660 | $37,440,783 | $52,128,598 | $61,142,196 | 89.7 | % | $59.49 | ||||||||
| Rent Steps | 0 | 0 | 0 | 0 | 126,203 | 0.2 | 0.12 | |||||||||
| Gross Potential Rent(6) | $40,934,326 | $39,522,660 | $37,440,783 | $52,128,598 | $61,268,399 | 89.9 | % | $59.61 | ||||||||
| Recoveries | 7,715,168 | 4,583,083 | 4,400,331 | 4,802,886 | 5,609,565 | 8.2 | 5.46 | |||||||||
| Other Income | 1,135,055 | 1,327,105 | 2,111,375 | 1,850,293 | 1,282,031 | 1.9 | 1.25 | |||||||||
| Net Rental Income | $49,784,549 | $45,432,848 | $43,952,489 | $58,781,777 | $68,159,995 | 100.0 | % | $66.32 | ||||||||
| Vacancy | 0 | 0 | 0 | 0 | 0 | 0.0 | 0.00 | |||||||||
| Effective Gross Income | $49,784,549 | $45,432,848 | $43,952,489 | $58,781,777 | $68,159,995 | 100.0 | % | $66.32 | ||||||||
| Real Estate Taxes | 13,712,598 | 14,086,765 | 14,463,311 | 13,863,649 | 14,330,316 | 21.0 | 13.94 | |||||||||
| Insurance | 600,483 | 665,212 | 655,019 | 557,557 | 714,021 | 1.0 | 0.69 | |||||||||
| Management Fee | 357,093 | 364,022 | 370,201 | 376,266 | 1,000,000 | 1.5 | 0.97 | |||||||||
| Other Operating Expenses | 21,917,994 | 19,518,377 | 20,450,679 | 20,114,360 | 19,985,093 | 29.3 | 19.45 | |||||||||
| Total Operating Expenses | $36,588,167 | $34,634,376 | $35,939,209 | $34,911,832 | $36,029,430 | 52.9 | % | $35.06 | ||||||||
| Net Operating Income(3) | $13,196,382 | $10,798,472 | $8,013,280 | $23,869,945 | $32,130,565 | 47.1 | % | $31.26 | ||||||||
| Replacement Reserves | 0 | 0 | 0 | 0 | 205,547 | 0.3 | 0.20 | |||||||||
| TI/LC | 0 | 0 | 0 | 0 | 1,950,230 | 2.9 | 1.90 | |||||||||
| Net Cash Flow | $13,196,382 | $10,798,472 | $8,013,280 | $23,869,945 | $29,974,788 | 44.0 | % | $29.17 | ||||||||
| NOI DSCR(7) | 2.91x | 2.38x | 1.77x | 5.26x | 7.08x | |||||||||||
| NCF DSCR(7) | 2.91x | 2.38x | 1.77x | 5.26x | 6.61x | |||||||||||
| NOI Debt Yield(7) | 5.7% | 4.7% | 3.5% | 10.3% | 13.9% | |||||||||||
| NCF Debt Yield(7) | 5.7% | 4.7% | 3.5% | 10.3% | 13.0% | |||||||||||
| (1) | For the avoidance of doubt, no COVID specific adjustments have been made to the lender underwriting. |
| (2) | The decrease in Gross Potential Rent and Net Operating Income between 2017 and 2018 was mainly due to Neuberger Berman vacating the 605 Third Avenue Property. |
| (3) | The increase in Gross Potential Rent and Net Operating Income between 2019 and 9/30/2020 TTM was mainly due to (i) new leases signed between the end of 2019 and the beginning of 2020 totaling approximately $9,227,237 of rent, (ii) an increase in overall base rent for a number of tenants from 2019, (iii) a reduction in the repairs and maintenance expense of approximately $832,000 and (iv) expiration of free rent periods. |
| (4) | The increase in Gross Potential Rent and Net Operating Income between 9/30/2020 TTM and UW is mainly due to recent new leases signed in 2020 including Broadridge ($6,476,486 of UW rent), Katsky Korins LLP ($1,351,228 of UW rent), Global X Capital Management ($1,101,848 of UW rent) and One Sky Flight ($357,124 of UW rent). |
| (5) | Represents (i) percent of Net Rental Income for all revenue fields, (ii) percent of Gross Potential Rent for Vacancy and Concessions & Credit Loss and (iii) percent of Effective Gross Income for all other fields. |
| (6) | UW Gross Potential Rent is as of October 1, 2020 and includes rent steps of $126,203 through October 31, 2021. |
| (7) | The debt service coverage ratios and debt yields are based on the 605 Third Avenue Senior Loans, and exclude the 605 Third Avenue Subordinate Companion Loans and 605 Third Avenue Mezzanine Loan. |
Appraisal. The appraiser concluded to an “as-is” value as of November 1, 2020 of $685,000,000.
Environmental Matters. According to the Phase I environmental site assessment dated October 27, 2020, there was no evidence of any recognized environmental conditions at the 605 Third Avenue Property.
COVID-19 Update. As of January 5, 2021 the 605 Third Avenue Whole Loan is current as of the January debt service payment and is not subject to any forbearance, modification or debt service relief request. As of January 24, 2021, the 605 Third Avenue Borrower has reported that the 605 Third Avenue Property is open and operating, with 93.5% of tenants by occupied NRA and 94.1% of tenants by underwritten base rent having paid their full January 2021 rent payments. Six tenants (16.8% of NRA and 15.6% of underwritten base rent) at the 605 Third Avenue Property have been granted deferrals of rent by the 605 Third Avenue Borrower. Five of the six tenants (16.1% of NRA and 14.5% of underwritten base rent) were granted between 3 and 5 months of deferred rent with repayment over fixed periods commencing on various dates in 2020 and 2021. One of the five tenants (0.7% of NRA and 1.1% of underwritten
THE INFORMATION IN THIS STRUCTURAL AND COLLATERAL TERM SHEET IS NOT COMPLETE AND MAY BE AMENDED PRIOR TO THE TIME OF SALE. THIS TERM SHEET IS NOT AN OFFER TO SELL THESE SECURITIES AND IT IS NOT A SOLICITATION OF AN OFFER TO BUY THESE SECURITIES IN ANY JURISDICTION WHERE THE OFFER OR SALE IS NOT PERMITTED.
55
| Office – CBD | Loan #2 | Cut-off Date Balance: | $80,000,000 | |
| 605 Third Avenue | 605 Third Avenue | Cut-off Date LTV: | 33.7% | |
| New York, NY 10158 | UW NCF DSCR: | 6.61x | ||
| UW NOI Debt Yield: | 13.9% |
base rent) was granted deferred rent from January through June 2021, of which 50% was forgiven and the remaining deferred amount is required to be repaid across 24 monthly installments beginning January 1, 2022.
Market Overview and Competition. The 605 Third Avenue Property is located in New York, New York along the entire eastern blockfront of Third Avenue between East 39th and East 40th Streets within the Grand Central office submarket of Midtown Manhattan. The 605 Third Avenue Property is located near major commercial landmarks and public attractions such as St. Patrick’s Cathedral, The New York Public Library, The MetLife Building, The Helmsley Building, The Bank of America Tower and the Chrysler Building. Primary access to the 605 Third Avenue Property is provided by Grand Central Terminal, which services Metro-North and many subway lines. The 605 Third Avenue Property is located four blocks southeast of the 42nd Street – Bryant Park subway station, which services the 7, B, D, F and M lines. According to the appraisal, as of the third quarter of 2020, the vacancy rate in the Grand Central office submarket was approximately 7.1%, with average asking rents of $89.46 PSF and inventory of approximately 47.6 million square feet. According to the appraisal, as of the third quarter of 2020, the vacancy rate in the Midtown office market was approximately 6.0%, with average asking rents of $85.76 PSF and inventory of approximately 288.0 million square feet.
The following table presents certain information relating to the appraisal’s market rent conclusion for the 605 Third Avenue Property:
Market Rent Summary
| Market Rent (PSF) | Lease Term (Years) | Lease Type (Reimbursements) | Rent Increase Projection | |||||
| Office (Floors 2-10) | $60.00 | 10 | Modified Gross | $7.00 PSF Every 5-Years | ||||
| Office (Floors 11-14) | $65.00 | 10 | Modified Gross | $7.00 PSF Every 5-Years | ||||
| Office (Floors 15-24) | $68.00 | 10 | Modified Gross | $7.00 PSF Every 5-Years | ||||
| Office (Floors 25-34) | $72.00 | 10 | Modified Gross | $7.00 PSF Every 5-Years | ||||
| Office (Floors 35-44) | $75.00 | 10 | Modified Gross | $7.00 PSF Every 5-Years | ||||
| Retail Ground Third Avenue | $175.00 | 10 | Modified Gross | 2.50% Annual Increase | ||||
| Ground Corner | $250.00 | 10 | Modified Gross | 2.50% Annual Increase | ||||
| Retail Ground Side Street | $125.00 | 10 | Modified Gross | 2.50% Annual Increase | ||||
| Retail Multi-Level | $65.00 | 10 | Modified Gross | 2.50% Annual Increase | ||||
| Storage | $25.00 | 10 | Modified Gross | 2.50% Annual Increase | ||||
| Retail Newstand | $55.00 | 10 | Modified Gross | 2.50% Annual Increase |
Source: Appraisal.
The following table presents comparable office leases with respect to the 605 Third Avenue Property:
Comparable Office Lease Summary
| Property/Location | Year Built | SF | Tenant Name | Size (SF) | Lease Date | Rent PSF | Lease Type | ||||||||
605 Third Avenue (subject) New York, NY | 1965 | 1,027,736 | Univision | 194,701 | Various | $56.79 | Modified Gross | ||||||||
600 Third Avenue New York, NY | 1970 | 575,600 | Energy Impact Partners Pomerantz | 13,129 4,668 | Oct. 2020 July 2020 | $85.00 $64.00 | Modified Gross Modified Gross | ||||||||
19 West 44th Street New York, NY | 1916 / 2014 | 303,943 | Corporation Service Company | 12,273 | May 2020 | $64.00 | Modified Gross | ||||||||
99 Park Avenue New York, NY | 1954 | 640,122 | Bosley Medical | 14,469 | April 2020 | $67.00 | Modified Gross | ||||||||
366 Madison Avenue New York, NY | 1920 | 93,000 | FordHarrison | 6,851 | Jan. 2020 | $65.00 | Modified Gross | ||||||||
711 Third Avenue New York, NY | 1955 / 2010 | 592,772 | Strategic Financial Planning Center on Addiction and Substance Abuse Goldberg Segalla LLP | 82,557 30,035 10,422 | Dec. 2019 Nov. 2019 Oct. 2019 | $62.00 $62.00 $67.13 | Modified Gross Modified Gross Modified Gross | ||||||||
420 Lexington Avenue New York, NY | 1927 / 1999 | 1,513,673 | Greenberg Traurig LLP | 46,744 | Dec. 2019 | $65.00 | Modified Gross | ||||||||
733 Third Avenue New York, NY | 1961 / 2018 | 445,000 | EisnerAmper
| 124,364
| Dec. 2019 | $59.50 | Modified Gross | ||||||||
708 Third Avenue New York, NY | 1931 / 2019 | 420,000 | ZEFR Crux Informatics | 17,896 13,220 | Nov. 2019 Sept. 2019 | $80.00 $83.00 | Modified Gross Modified Gross | ||||||||
675 Third Avenue New York, NY | 1927 / 1994 | 342,000 | T&R Productions | 8,569 | Nov. 2019 | $70.00 | Modified Gross | ||||||||
575 Fifth Avenue New York, NY | 1984 | 513,740 | Forter, Inc. | 21,690 | Sept. 2019 | $81.00 | Modified Gross |
Source: Appraisal.
THE INFORMATION IN THIS STRUCTURAL AND COLLATERAL TERM SHEET IS NOT COMPLETE AND MAY BE AMENDED PRIOR TO THE TIME OF SALE. THIS TERM SHEET IS NOT AN OFFER TO SELL THESE SECURITIES AND IT IS NOT A SOLICITATION OF AN OFFER TO BUY THESE SECURITIES IN ANY JURISDICTION WHERE THE OFFER OR SALE IS NOT PERMITTED.
56
| Office – CBD | Loan #2 | Cut-off Date Balance: | $80,000,000 | |
| 605 Third Avenue | 605 Third Avenue | Cut-off Date LTV: | 33.7% | |
| New York, NY 10158 | UW NCF DSCR: | 6.61x | ||
| UW NOI Debt Yield: | 13.9% |
Escrows.
Real Estate Taxes – During a Trigger Period (as defined below), the 605 Third Avenue Whole Loan documents provide for ongoing monthly deposits into a reserve for real estate taxes in an amount equal to 1/12 of the real estate taxes that the lender estimates will be payable during the next twelve months for the 605 Third Avenue Property.
Insurance – During a Trigger Period, the 605 Third Avenue Whole Loan documents provide for ongoing monthly deposits into a reserve for insurance premiums in an amount equal to 1/12 of the insurance premiums that the lender estimates will be payable for the renewal of coverage upon the expiration of the insurance policies; provided that such monthly deposits are not required so long as a blanket insurance policy acceptable to the lender is in effect with respect to the policies required under the 605 Third Avenue Whole Loan documents.
Replacement Reserve – During a Trigger Period, the 605 Third Avenue Whole Loan documents provide for ongoing monthly deposits of approximately $17,129 into a reserve for approved capital expenditures; provided that such monthly deposits are not required so long as the balance in such reserve equals or exceeds $411,096.
TI/LC Reserve – The 605 Third Avenue Whole Loan documents provide for an upfront reserve of approximately $1,092,905 for outstanding tenant improvements or rent credits payable to the tenant Podell, Schwartz, Schecter & Bankfield, LLP. In addition, during a Trigger Period, the 605 Third Avenue Whole Loan documents provide for ongoing monthly deposits of approximately $107,056 into a reserve for future tenant improvements and leasing commissions; provided that such monthly deposits are not required so long as the balance in such reserve equals or exceeds $4,000,000 (excluding from such balance any remaining portion of the upfront reserve and any proceeds of a 605 Third Avenue Permitted Future Mezzanine Loan (as defined below) deposited into such reserve).
Free Rent Reserve – The 605 Third Avenue Whole Loan documents provide for an upfront reserve of approximately $934,456 for outstanding free rent credits for various tenants, including Aecom Technology Corporation, and so long as the Univision lease remains in effect, (i) on each monthly payment date during the First Univision Sweep Period (as defined below), ongoing monthly deposits of approximately $250,441 into a reserve for outstanding free rent credits available to Univision during the First Univision Free Rent Period (as defined below), and (ii) on each monthly payment date during the Second Univision Sweep Period (as defined below), ongoing monthly deposits of approximately $250,441 into a reserve for outstanding free rent credits available to Univision during the Second Univision Free Rent Period (as defined below).
“First Univision Sweep Period” means the period commencing on January 1, 2022 and ending on December 31, 2023.
“First Univision Free Rent Period” means the period of free rent credit provided to Univision pursuant to the terms of the Univision lease during the period commencing on January 1, 2024 and ending June 30, 2024.
“Second Univision Sweep Period” means the period commencing on April 1, 2027 and ending on March 31, 2028.
“Second Univision Free Rent Period” means the period of free rent credit provided to Univision pursuant to the terms of the Univision lease during the calendar months of April, 2028, July, 2028, and October, 2028.
Lockbox and Cash Management. The 605 Third Avenue Whole Loan is structured with a hard lockbox and springing cash management. The 605 Third Avenue Borrower is required to establish and maintain a lockbox account for the benefit of an administrative agent for the lender (the “Agent”), to direct all tenants of the 605 Third Avenue Property to deposit all rents directly into the lockbox account, and to deposit any funds received by the 605 Third Avenue Borrower or property manager into the lockbox account within two business days of receipt. In addition, the 605 Third Avenue Borrower is required to establish and maintain a cash management account controlled by the Agent on behalf of the lender. So long as no Trigger Period or Univision Sweep Period (as defined below) is continuing, all funds in the lockbox account are required to be swept to the 605 Third Avenue Borrower’s operating account. During the continuance of a Trigger Period, provided no event of default under the 605 Third Avenue Whole Loan documents is continuing, all funds in the cash management account are required to be applied on each monthly payment date: (i) to make the monthly deposits into the real estate tax and insurance reserves as described above under “Escrows,” (ii) to pay debt service on the 605 Third Avenue Whole Loan, (iii) to make the monthly deposit into the replacement reserve and the rollover funds reserve as described above under “Escrows,” (iv) if the Trigger Period exists during a Univision Sweep Period, to make the required deposits into the free rent reserve as described above under “Escrows,” (v) to pay operating expenses set forth in the annual budget (which is deemed approved by the lender so long as it meets certain specified parameters) and lender-approved extraordinary expenses, (vi) if the 605 Third Avenue Mezzanine Loan is outstanding, to pay debt service and other amounts then due and payable under the 605 Third Avenue Mezzanine Loan, (vii) if a 605 Third Avenue Permitted Future Mezzanine Loan is outstanding, to pay debt service and other amounts then due and payable under the 605 Third Avenue Permitted Future Mezzanine Loan, and (viii) to deposit any remainder into an excess cash flow reserve to be held as additional security for the 605 Third Avenue Whole Loan during the continuance of such Trigger Period (provided that, at the 605 Third Avenue Borrower’s request, provided no event of default is continuing, funds in such reserve will be applied to pay the amounts described in clauses (i) through (vii) and certain other property expenses). During the continuance of a Univision Sweep Period, provided no event of default or Trigger Period is continuing, all amounts deposited into the cash management account in respect of free rent during the preceding month will be disbursed (i) to the free rent account to make payments on account of free rent and (ii) any remainder, to the 605 Third Avenue Borrower.
THE INFORMATION IN THIS STRUCTURAL AND COLLATERAL TERM SHEET IS NOT COMPLETE AND MAY BE AMENDED PRIOR TO THE TIME OF SALE. THIS TERM SHEET IS NOT AN OFFER TO SELL THESE SECURITIES AND IT IS NOT A SOLICITATION OF AN OFFER TO BUY THESE SECURITIES IN ANY JURISDICTION WHERE THE OFFER OR SALE IS NOT PERMITTED.
57
| Office – CBD | Loan #2 | Cut-off Date Balance: | $80,000,000 | |
| 605 Third Avenue | 605 Third Avenue | Cut-off Date LTV: | 33.7% | |
| New York, NY 10158 | UW NCF DSCR: | 6.61x | ||
| UW NOI Debt Yield: | 13.9% |
“Trigger Period” means a period:
| (i) | commencing upon an event of default under the 605 Third Avenue Whole Loan documents or an event of default under the 605 Third Avenue Mezzanine Loan documents, and ending upon the lender’s or mezzanine lender’s, as applicable, acceptance of a cure of such event of default; or |
| (ii) | commencing upon the debt yield on the 605 Third Avenue Whole Loan falling below 8.10% as of the last day of any calendar quarter, and ending on the date such debt yield equals or exceeds 8.10% as of the last day of two consecutive calendar quarters; or |
| (iii) | commencing upon the aggregate debt yield on the 605 Third Avenue Whole Loan, the 605 Third Avenue Mezzanine Loan and any 605 Third Avenue Permitted Future Mezzanine Loan falling below 6.25% as of the last day of any calendar quarter, and ending on the date such aggregate debt yield equals or exceeds 6.25% as of the last day of two consecutive calendar quarters. |
“Univision Sweep Period” means the First Univision Sweep Period or Second Univision Sweep Period, as the case may be.
Property Management. The 605 Third Avenue Property is managed by Fisher Brothers Management Co. LLC, an affiliate of the 605 Third Avenue Borrower.
Partial Release. Not permitted.
Real Estate Substitution. Not permitted.
Subordinate and Mezzanine Indebtedness. Concurrently with the funding of the 605 Third Avenue Whole Loan, Morgan Stanley Mortgage Capital Holdings LLC funded a mezzanine loan in the amount of $91,000,000 (the “605 Third Avenue Mezzanine Loan”) to the holder of 100% of the direct equity interests in the 605 Third Avenue Borrower (such holder, the “605 Third Avenue Mezzanine Borrower”), secured by a pledge of such equity interests. The 605 Third Avenue Mezzanine Loan is co-terminous with the 605 Third Avenue Whole Loan, accrues interest at the rate of 5.05000% per annum and requires payments of interest only until its maturity date. The 605 Third Avenue Mezzanine Loan has been sold to a third party holder.
The 605 Third Avenue total debt as of the origination date is summarized in the following table:
605 Third Avenue Total Debt Summary
| Note | Original Balance | Interest Rate | Cumulative UW NCF DSCR | Cumulative UW NOI Debt Yield | Cumulative Cut-off Date LTV | ||||||
| Senior Loans | $231,000,000 | 1.93752% | 6.61x | 13.9% | 33.7% | ||||||
| Subordinate Companion Loans | $78,000,000 | 3.0780% | 4.30x | 10.4% | 45.1% | ||||||
| Mezzanine Loan | $91,000,000 | 5.0500% | 2.58x | 8.0% | 58.4% | ||||||
| Total Debt | $400,000,000 | 2.8680% | 2.58x | 8.0% | 58.4% |
In addition, the holders of the direct or indirect equity interests in the 605 Third Avenue Mezzanine Borrower are permitted to incur future mezzanine debt secured by a pledge of 100% of such equity interests in the 605 Third Avenue Mezzanine Borrower (a “605 Third Avenue Permitted Future Mezzanine Loan”), provided that, among other conditions: (i) no event of default is continuing; (ii) the aggregate loan-to-value ratio of the 605 Third Avenue Whole Loan, the 605 Third Avenue Mezzanine Loan and the 605 Third Avenue Permitted Future Mezzanine Loan (collectively, the “605 Third Avenue Total Debt”) is less than or equal to 58.4%, (iii) the aggregate debt service coverage ratio of the 605 Third Avenue Total Debt is at least 2.00x, (iv) the aggregate debt yield of the 605 Third Avenue Total Debt is at least 7.8%, and the debt yield of the 605 Third Avenue Whole Loan is at least 10.0%; (v) the term of the 605 Third Avenue Permitted Future Mezzanine Loan is at least co-terminous with the term of the 605 Third Avenue Whole Loan; (vi) an intercreditor agreement is executed that is reasonably acceptable to the lender and acceptable to the rating agencies rating securities backed by the 605 Third Avenue Whole Loan; and (vii) a rating agency confirmation is delivered by each rating agency rating securities backed by the 605 Third Avenue Whole Loan.
In the event that the 605 Third Avenue Permitted Future Mezzanine Loan is originated from and after July 1, 2027, the net loan proceeds must be deposited into the rollover funds reserve in an amount equal to $75 PSF of space which, as of the origination date of the 605 Third Avenue Permitted Future Mezzanine Loan, is vacant or is excluded from the calculation of underwritten net cash flow under the 605 Third Avenue Whole Loan Documents (other than due to free rent periods). A 605 Third Avenue Permitted Future Mezzanine Loan may be prepaid or defeased without simultaneous prepayment or defeasance of the 605 Third Avenue Whole Loan, and may be refinanced by another mezzanine loan that meets the conditions to a 605 Third Avenue Permitted Future Mezzanine Loan.
Letter of Credit. None.
Right of First Offer / Right of First Refusal. None.
Ground Lease. None.
THE INFORMATION IN THIS STRUCTURAL AND COLLATERAL TERM SHEET IS NOT COMPLETE AND MAY BE AMENDED PRIOR TO THE TIME OF SALE. THIS TERM SHEET IS NOT AN OFFER TO SELL THESE SECURITIES AND IT IS NOT A SOLICITATION OF AN OFFER TO BUY THESE SECURITIES IN ANY JURISDICTION WHERE THE OFFER OR SALE IS NOT PERMITTED.
58
| Office – CBD | Loan #2 | Cut-off Date Balance: | $80,000,000 | |
| 605 Third Avenue | 605 Third Avenue | Cut-off Date LTV: | 33.7% | |
| New York, NY 10158 | UW NCF DSCR: | 6.61x | ||
| UW NOI Debt Yield: | 13.9% |
Terrorism Insurance. The 605 Third Avenue Borrower is required to obtain and maintain an “all risk” property insurance policy that covers perils of terrorism and acts of terrorism in an amount equal to the “full replacement cost” of the 605 Third Avenue Property together with 18 months of business income insurance, provided that such coverage is commercially available. For so long as the Terrorism Risk Insurance Program Reauthorization Act of 2015 or any replacement, reauthorization or extension thereof (“TRIPRA”) is in effect, the lender is required to accept terrorism insurance which covers against “certified” acts as defined by TRIPRA but only in the event that TRIPRA continues to cover both domestic and foreign acts of terrorism. If TRIPRA is not in effect, then, provided that terrorism insurance is commercially available, the 605 Third Avenue Borrower will be required to carry terrorism insurance, but in such event it will not be required to spend on terrorism insurance more than two times the amount of the insurance premiums that are payable at such time in respect of the property and business income insurance required under the loan documents (without giving effect to the cost of terrorism and earthquake components of such insurance). See “Risk Factors—Risks Relating to the Mortgage Loans—Terrorism Insurance May Not Be Available for All Mortgaged Properties” in the Preliminary Prospectus.
THE INFORMATION IN THIS STRUCTURAL AND COLLATERAL TERM SHEET IS NOT COMPLETE AND MAY BE AMENDED PRIOR TO THE TIME OF SALE. THIS TERM SHEET IS NOT AN OFFER TO SELL THESE SECURITIES AND IT IS NOT A SOLICITATION OF AN OFFER TO BUY THESE SECURITIES IN ANY JURISDICTION WHERE THE OFFER OR SALE IS NOT PERMITTED.
59
| Retail - Luxury Retail | Loan #3 | Cut-off Date Balance: | $80,000,000 | |
| 151 NE 40th Street | Miami Design District | Cut-off Date LTV: | 46.7% | |
| Miami, FL 33137 | U/W NCF DSCR: | 2.14x | ||
| U/W NOI Debt Yield: | 9.3% |

THE INFORMATION IN THIS STRUCTURAL AND COLLATERAL TERM SHEET IS NOT COMPLETE AND MAY BE AMENDED PRIOR TO THE TIME OF SALE. THIS TERM SHEET IS NOT AN OFFER TO SELL THESE SECURITIES AND IT IS NOT A SOLICITATION OF AN OFFER TO BUY THESE SECURITIES IN ANY JURISDICTION WHERE THE OFFER OR SALE IS NOT PERMITTED.
60
| Retail - Luxury Retail | Loan #3 | Cut-off Date Balance: | $80,000,000 | |
| 151 NE 40th Street | Miami Design District | Cut-off Date LTV: | 46.7% | |
| Miami, FL 33137 | U/W NCF DSCR: | 2.14x | ||
| U/W NOI Debt Yield: | 9.3% |
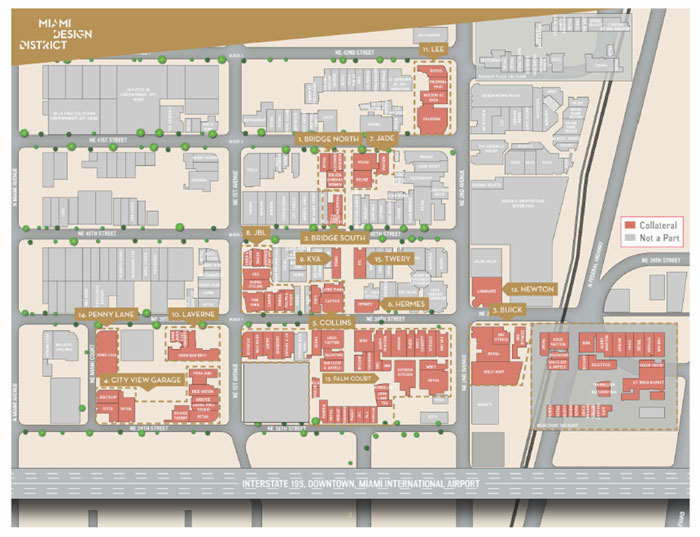
THE INFORMATION IN THIS STRUCTURAL AND COLLATERAL TERM SHEET IS NOT COMPLETE AND MAY BE AMENDED PRIOR TO THE TIME OF SALE. THIS TERM SHEET IS NOT AN OFFER TO SELL THESE SECURITIES AND IT IS NOT A SOLICITATION OF AN OFFER TO BUY THESE SECURITIES IN ANY JURISDICTION WHERE THE OFFER OR SALE IS NOT PERMITTED.
61
| Retail - Luxury Retail | Loan #3 | Cut-off Date Balance: | $80,000,000 | |
| 151 NE 40th Street | Miami Design District | Cut-off Date LTV: | 46.7% | |
| Miami, FL 33137 | U/W NCF DSCR: | 2.14x | ||
| U/W NOI Debt Yield: | 9.3% |
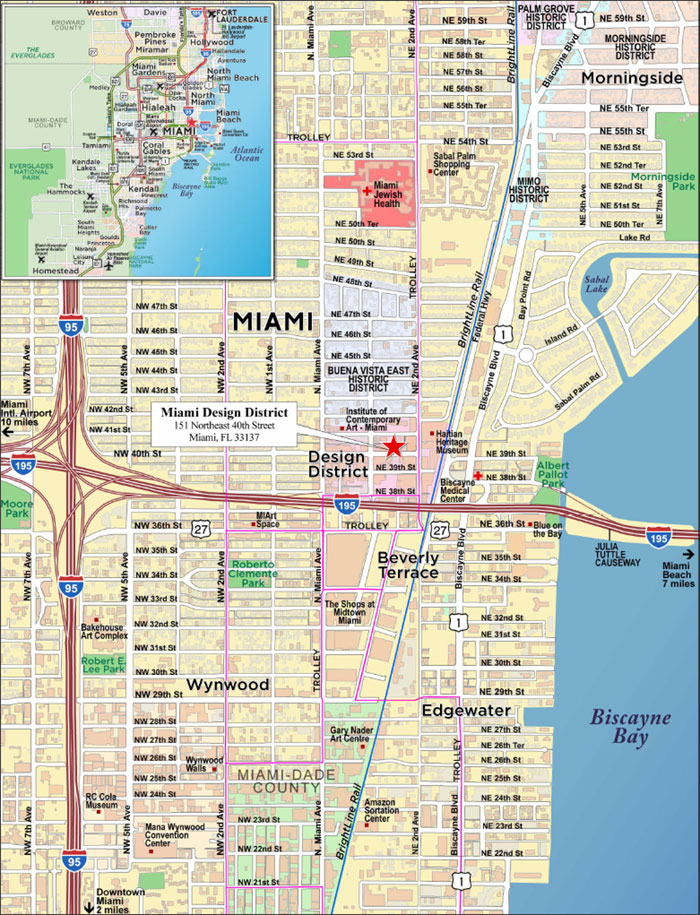
THE INFORMATION IN THIS STRUCTURAL AND COLLATERAL TERM SHEET IS NOT COMPLETE AND MAY BE AMENDED PRIOR TO THE TIME OF SALE. THIS TERM SHEET IS NOT AN OFFER TO SELL THESE SECURITIES AND IT IS NOT A SOLICITATION OF AN OFFER TO BUY THESE SECURITIES IN ANY JURISDICTION WHERE THE OFFER OR SALE IS NOT PERMITTED.
62
| No. 3 – Miami Design District | ||||||||
| Mortgage Loan Information | Mortgaged Property Information | |||||||
| Mortgage Loan Seller: | Bank of America, National Association | Single Asset/Portfolio: | Single Asset | |||||
Credit Assessment (Fitch/KBRA/S&P): | NR/NR/NR | Property Type – Subtype: | Retail - Luxury Retail | |||||
| Original Principal Balance(1): | $80,000,000 | Location: | Miami, FL | |||||
| Cut-off Date Balance(1): | $80,000,000 | Size: | 497,094 SF | |||||
| % of Initial Pool Balance: | 8.8% | Cut-off Date Balance Per SF(1): | $804.68 | |||||
| Loan Purpose: | Refinance | Maturity Date Balance Per SF(1)(5): | $804.68 | |||||
| Borrower Sponsor: | Miami Design District Associates, LLC | Year Built/Renovated: | 2014/NAP | |||||
| Guarantor: | Miami Design District Associates, LLC | Title Vesting: | Fee | |||||
| Mortgage Rate: | 4.1325% | Property Manager: | Design District Management, Inc. | |||||
| Note Date: | February 28, 2020 | Current Occupancy (As of): | 88.5% (9/1/2020) | |||||
| Seasoning: | 11 months | YE 2019 Occupancy(6): | 92.4% | |||||
| Maturity Date: | March 1, 2030 | YE 2018 Occupancy(6): | 93.1% | |||||
| IO Period: | 120 months | YE 2017 Occupancy(6): | 87.0% | |||||
| Loan Term (Original): | 120 months | YE 2016 Occupancy(6): | 78.1% | |||||
| Amortization Term (Original): | NAP | As-Is Appraised Value(6)(7): | $856,000,000 | |||||
| Loan Amortization Type: | Interest-only, Balloon | As-Is Appraised Value Per SF(7): | $1,722.01 | |||||
| Call Protection(2): | L(35), D(78), O(7) | As-Is Appraisal Valuation Date: | March 1, 2020 | |||||
| Lockbox Type: | Hard/Springing Cash Management | Underwriting and Financial Information(6) | ||||||
| Additional Debt(1)(3): | Yes | YE 2019 NOI: | $33,817,392 | |||||
| Additional Debt Type (Balance) (1)(3): | Pari Passu ($320,000,000), Subordinate ($100,000,000) | YE 2018 NOI: | $32,133,624 | |||||
| YE 2017 NOI: | $25,614,162 | |||||||
| YE 2016 NOI(8): | NAV | |||||||
| U/W Revenues: | $53,041,550 | |||||||
| Escrows and Reserves(4) | U/W Expenses: | $16,007,449 | ||||||
| Initial | Monthly | Cap | U/W NOI: | $37,034,101 | ||||
| Taxes | $2,100,000 | $525,000 | NAP | U/W NCF: | $35,940,495 | |||
| Insurance | $0 | Springing | NAP | U/W DSCR based on NOI/NCF(1): | 2.21x / 2.14x | |||
| Replacement Reserve | $0 | $8,285 | NAP | U/W Debt Yield based on NOI/NCF(1): | 9.3% / 9.0% | |||
| TI/LC Reserve | $4,907,050 | $82,849 | NAP | U/W Debt Yield at Maturity based on NOI/NCF(1)(5): | 9.3% / 9.0% | |||
| Free/Gap Rent Reserve | $1,724,567 | $0 | NAP | Cut-off Date LTV Ratio(1)(7): | 46.7% | |||
| Debt Service Reserve | $10,474,740 | $0 | NAP | LTV Ratio at Maturity(1)(5)(7): | 46.7% | |||
| Sources and Uses | ||||||||
| Sources | Uses | |||||||
| Original whole loan amount | $500,000,000 | 100.0% | Loan Payoff(9) | $476,005,977 | 95.2% | |||
| Return of Equity | 11,474,730 | 2.3 | ||||||
| Reserves | 8,731,617 | 1.7 | ||||||
| Closing Costs | 3,787,676 | 0.8 | ||||||
| Total Sources | $500,000,000 | 100.0% | Total Uses | $500,000,000 | 100.0% | |||
| (1) | The Cut-off Date Balance Per SF, Maturity Date Balance Per SF, U/W DSCR based on NOI/NCF, U/W Debt Yield based on NOI/NCF, U/W Debt Yield at Maturity based on NOI/NCF, Cut-off Date LTV Ratio and LTV Ratio at Maturity numbers presented above are based on the Miami Design District Whole Loan (as defined below). |
| (2) | Defeasance of the Miami Design District Whole Loan is permitted at any time after the earlier to occur of (a) the end of the two-year period commencing on the closing date of the securitization of the last portion of the Miami Design District Whole Loan to be securitized and (b) March 1, 2025. The assumed prepayment lockout period of 35 payments is based on the closing date of this transaction in February 2021. |
| (3) | See “Subordinate and Mezzanine Indebtedness” section. |
| (4) | See “Escrows” section. |
| (5) | Pursuant to an amendment to the Miami Design District Whole Loan dated April 29, 2020, debt service payments owed for May, June and July 2020 were deferred and are payable on the Maturity Date or earlier repayment in full of the Miami Design District Whole Loan. |
| (6) | All NOI, NCF and occupancy information, as well as the appraised value were determined prior to the emergence of the novel coronavirus and the economic disruption resulting from measures to combat the coronavirus. All DSCR, LTV and Debt Yield metrics were calculated, and the Miami Design District Whole Loan was underwritten, based on such prior information. See “Risk Factors—Risks Related to Market Conditions and Other External Factors—The Coronavirus Pandemic Has Adversely Affected the Global Economy and Will Likely Adversely Affect the Performance of the Mortgage Loans” in the Preliminary Prospectus. |
| (7) | The appraisal also provided an “Upon Stabilization” value of $883,000,000 as of March 1, 2021, which value assumes physical and economic stabilization and results in an Appraised Value Per SF, Cut-off Date LTV Ratio and LTV Ratio at Maturity of $1,776, 45.3% and 45.3%, respectively, based on the principal balance of the Miami Design District Senior Loan (as defined below). The appraisal also provided a “land” value of $600,000,000 for the land portion (assumed unimproved) of the Miami Design District Property (as defined below), which value would result in a Cut-off Date LTV Ratio and LTV Ratio at Maturity of 66.7% and 66.7%, respectively, based on the principal balance of the Miami Design District Senior Loan. |
| (8) | Further historical NOI is not available, as the redevelopment of the Miami Design District Property (as defined below) occurred between 2014 and 2019. |
| (9) | Loan Payoff includes existing debt secured by components of the larger Miami Design District that are not collateral for the Miami Design District Whole Loan. |
THE INFORMATION IN THIS STRUCTURAL AND COLLATERAL TERM SHEET IS NOT COMPLETE AND MAY BE AMENDED PRIOR TO THE TIME OF SALE. THIS TERM SHEET IS NOT AN OFFER TO SELL THESE SECURITIES AND IT IS NOT A SOLICITATION OF AN OFFER TO BUY THESE SECURITIES IN ANY JURISDICTION WHERE THE OFFER OR SALE IS NOT PERMITTED.
63
| Retail - Luxury Retail | Loan #3 | Cut-off Date Balance: | $80,000,000 | |
| 151 NE 40th Street | Miami Design District | Cut-off Date LTV: | 46.7% | |
| Miami, FL 33137 | U/W NCF DSCR: | 2.14x | ||
| U/W NOI Debt Yield: | 9.3% |
The Mortgage Loan. The mortgage loan (the “Miami Design District Mortgage Loan”) is part of a whole loan (the “Miami Design District Whole Loan”) that is evidenced by fifteen pari passu senior promissory notes, with an aggregate original principal balance of $400,000,000 (together, the “Miami Design District Senior Loan”) and one note in the original principal amount of $100,000,000 (the “Miami Design District Subordinate Companion Loan”) that is subordinate to the Miami Design District Senior Loan. The Miami Design District Whole Loan is secured by a first priority fee mortgage encumbering a 497,094 square foot luxury retail development located in Miami, Florida (the “Miami Design District Property”). The Miami Design District Mortgage Loan is evidenced by the non-controlling Note A-2 and Note A-7 with an aggregate original principal balance of $80,000,000. The remaining promissory notes comprising the Miami Design District Whole Loan are summarized in the below table. The Miami Design District Whole Loan is being serviced pursuant to the pooling and servicing agreement for the BANK 2020-BNK30 securitization trust until the securitization of Note A-1. See “Description of the Mortgage Pool—The Whole Loans—The Non-Serviced AB Whole Loans—The Miami Design District Whole Loan” and “Pooling and Servicing Agreement—Servicing of the Non-Serviced Mortgage Loans” in the Preliminary Prospectus.
Note Summary
| Notes | Original Balance | Cut-off Date Balance | Note Holder | Controlling Piece |
| A-1, A-4, A-5, A-8, A-9, A-10, A-11, A-12, A-13, A-14, A-15 | $245,000,000 | $245,000,000 | Bank of America, National Association | No |
| A-3, A-6 | $75,000,000 | $75,000,000 | BANK 2020-BNK30 | No |
| A-2, A-7 | $80,000,000 | $80,000,000 | BANK 2021-BNK31 | No |
| B | $100,000,000 | $100,000,000 | Third Party Investor | Yes(1) |
| Total | $500,000,000 | $500,000,000 |
| (1) | Pursuant to the related co-lender agreement, the holder of Note B is the controlling noteholder unless a “control appraisal period” has occurred and is continuing under the co-lender agreement, in which case Note A-1 will become the controlling noteholder. |
The Borrower and Borrower Sponsor. The borrower is Oak Plaza Associates (Del.) LLC (the “Miami Design District Borrower”), a Delaware limited liability company structured to be bankruptcy-remote with at least two independent directors. Legal counsel to the borrower delivered a non-consolidation opinion in connection with the origination of the Miami Design District Whole Loan.
The borrower sponsor and non-recourse carveout guarantor is Miami Design District Associates, LLC, a partnership between Dacra (38.75%), L Catterton Real Estate (38.75%), and Brookfield Property Partners (22.265%). Dacra is a real estate development company founded in 1987 that has developed over 2.0 million square feet of commercial, residential and mixed-use communities. Dacra has played an active role in revitalization efforts and redevelopment in Miami and Miami Beach. In addition to the Miami Design District, Dacra has developed real estate projects in South Beach’s Art Deco District and on Lincoln Road. Since the 1990’s, Dacra had been aggregating the land for the Miami Design District, with the vision of transforming the area into a retail, art and dining destination. In 2010, Dacra partnered with L Catterton Real Estate, a Catterton, LVMH and Groupe Arnault-sponsored global real estate development and investment fund specializing in creating luxury shopping destinations. The partnership brought LVMH brands, including Louis Vuitton, Dior, Fendi, Bulgari, Celine, Berluti, Hermes and Cartier to the Miami Design District, which paved the way for other global luxury brands and upscale contemporary brands to follow. Dacra and L Catterton Real Estate completed the first phase of the Miami Design District in 2012. In 2014, a joint venture between General Growth Properties (now Brookfield Property Partners (NASDAQ: BPY)) and Ashkenazy Acquisition Corp. acquired an interest in the Miami Design District. Brookfield Property Partners is a diversified global real estate company that owns, operates and develops one of the largest portfolios of office, retail, multifamily, industrial, hospitality, triple net lease, self-storage, student housing and manufactured housing assets.
The borrower sponsor owns approximately 20 acres (developed and available for future development) in the Miami Design District, of which the Miami Design District Property represents 7.4 acres. The Miami Design District Borrower covenanted that its affiliates will not, without the consent of the lender, (i) develop such parcels held for future development in a manner that would materially interfere with the continued use and operation of the Miami Design District Property, or (ii) engage in any leasing that would result in a material adverse effect to the Miami Design District Property.
The Property. The Miami Design District Property is a 497,094 square foot portion of a Class A luxury retail development known as the Miami Design District in Miami, Florida. The Miami Design District is a LEED Neighborhood Development located at the northwest quadrant of Interstate 195 and N Federal Highway that was designed as a creative neighborhood for shopping, dining and contemporary public art exhibitions. The Miami Design District encompasses approximately 30 acres in a walkable urban environment, and is home to more than 120 flagship stores, including luxury brand retailers and jewelers Balenciaga, Hermes, Fendi, Dior, Cartier and Louis Vuitton. The Miami Design District also includes design showrooms, art galleries and cultural institutions, including The Institute of Contemporary Art Miami (ICA), de la Cruz Collection Contemporary Art Space, Locust Projects Alternative Art Space and the Haitian Heritage Museum. The buildings within the Miami Design District are arranged along a typical urban street block grid system, with on-street metered parking and a north/south running pedestrian-only corridor through the center, known as Paseo Ponti.
The Miami Design District Property consists of 15 buildings that were redeveloped between 2014 and 2019 from former warehouse, showroom and industrial space. The Miami Design District Property includes a total of 497,094 square feet of rentable space plus 559 total parking spaces located in two garages. Many of the buildings are built-to-suit for luxury retailers, both with respect to the interior buildouts and exterior facades. As of September 1, 2020, the Miami Design District Property was 88.5% occupied by 86 tenants. The largest tenants by base rent include Hermes, Harry Winston, Holly Hunt, Fendi Casa/Luxury Living and Tom Ford, with no other tenant representing more than 3.1% of underwritten base rent. Overall property sales for tenants who report at the Miami Design District Property increased 29.5% from 2018 to 2019 to $1,002 PSF ($231.5 million total sales).
THE INFORMATION IN THIS STRUCTURAL AND COLLATERAL TERM SHEET IS NOT COMPLETE AND MAY BE AMENDED PRIOR TO THE TIME OF SALE. THIS TERM SHEET IS NOT AN OFFER TO SELL THESE SECURITIES AND IT IS NOT A SOLICITATION OF AN OFFER TO BUY THESE SECURITIES IN ANY JURISDICTION WHERE THE OFFER OR SALE IS NOT PERMITTED.
64
| Retail - Luxury Retail | Loan #3 | Cut-off Date Balance: | $80,000,000 | |
| 151 NE 40th Street | Miami Design District | Cut-off Date LTV: | 46.7% | |
| Miami, FL 33137 | U/W NCF DSCR: | 2.14x | ||
| U/W NOI Debt Yield: | 9.3% |
Property Summary
| Building | Year Built/ Renovated | Stories | Rentable SF | Occupancy | Major Tenants |
| Bridge South | 2017 | 2 | 7,076 | 100.0% | Yves Saint Laurent (4,183 SF) Balenciaga (2,893 SF) |
| Bridge North | 2017 | 2 | 12,603 | 100.0% | Dolce & Gabanna (5,320 SF) Alexander McQueen (4,460 SF) Mason Margiela (2,823 SF) |
| Buick | 1926/2015 | 4 | 82,396 | 97.1% | Holly Hunt (24,897 SF) Dacra (18,828 SF)(1) MDDA (Management Office) (10,776 SF)(1) |
| City View Garage | 2015 | 7 | 40,853 | 84.3% | Luxury Brand Partners (18,077 SF) Pura Vida (2,977 SF) Citco (2,614 SF) Rise Nation (2,613 SF) |
| Collins | 2015 | 2 | 17,026 | 100.0% | Cartier (7,735 SF) Loro Piana (4,767 SF) Tod’s (4,524 SF) |
| Hermes | 2015 | 3 | 13,500 | 100.0% | Hermes (13,500 SF) |
| Jade | 2017 | 3 | 15,324 | 100.0% | Prada (6,442 SF) Celine (5,191 SF) Okami (Ovation) (3,691 SF) |
| JBL | 2014 | 3 | 42,082 | 77.6% | Tom Ford (8,582 SF) COS (4,886 SF) Lanvin (3,367 SF) Omega (3,152 SF) |
| KVA | 2006 | 2 | 5,384 | 100.0% | Fendi (5,384 SF) |
| Laverne | 1961/2017 | 1 | 12,257 | 95.3% | Swan and Bar Bevy (10,180 SF) |
| Lee | 1955/2017 | 3 | 54,961 | 77.9% | Poliform (8,902 SF) Unifor, Inc. (Moltini) (7,384 SF) Dupuis (6,323 SF) Poltrona Frau (5,842 SF) |
| Newton | 1983/2018 | 2 | 15,000 | 100.0% | Luminaire (15,000 SF) |
| Palm Court | 2014 | 2 | 148,993 | 82.4% | Christian Dior (10,595 SF) Louis Vuitton (10,244 SF) St. Roche (MIA Market) (9,292 SF) Harry Winston (7,219 SF) Giorgio Armani (6,976 SF) |
| Penny Lane | 2017 | 3 | 22,439 | 100.0% | Fendi Casa/Luxury Living (22,439 SF) |
| Twery | 2006 | 2 | 7,200 | 100.0% | OTL (7,200 SF) |
Source: Appraisal and underwritten rent roll.
(1) Sponsor-affiliated office space.
COVID-19 Update. The Miami Design District Whole Loan is current as of the January 2021 debt service payment. Pursuant to a loan amendment dated April 29, 2020, debt service for the months of May, June and July 2020 were deferred until the maturity date or earlier repayment of the Miami Design District Whole Loan. Additionally, pursuant to a loan amendment dated October 2020, the Miami Design District Borrower deposited $10,474,740 as a debt service reserve (see “Escrows” below) and postponed any test for a Trigger Period (see “Lockbox and Cash Management” below) until the quarter commencing April 1, 2021. The Miami Design District Property was closed between March 19 and May 18, 2020 due to COVID-19 restrictions, and was closed for ten days in June 2020 due to civil unrest, over which time no damaged occurred. As of January 14, 2021, the borrower sponsor has reported that the Miami Design District Property is open and operating with safety precautions including reduced hours (Monday – Saturday: 11am - 7pm and Sunday: 12pm - 5pm), rigorous cleaning protocols, masks and hand sanitizer stations, complimentary in-house personal shoppers to shop and deliver goods to customers, and contactless parking and free valet service. Many retailers and restaurants are offering curbside pick-up. Five tenants (3.5% of NRA and 4.5% of UW rent) fully or partially abated their rent for December 2020. Three tenants (1.0% of NRA and 1.2% of UW rent) fully or partially abated their rent for January 2021. Two tenants (4.2% of NRA and 3.1% of UW rent) partially deferred their rent for December 2020. 91.3% of tenants by net rentable area and 95.6% of tenants by underwritten base rent have paid their full December 2020 rent payments.
Major Tenants.
Hermes (13,500 square feet, 2.7% of net rentable area, 4.4% of underwritten base rent). Hermes International (“Hermes”) designs, produces and distributes personal luxury accessories and apparel. The company is over 183 years old and operates 311 boutiques worldwide under the Hermes name that sell items such as leather, scarves, men’s clothes, ties, women’s fashions, perfume, watches, stationery, shoes, hats, gloves and jewelry. Hermes occupies its own building on a lease that expires in February 2025, with two five-year renewal options each with six months’ notice. Hermes is currently paying an annual rent of $109.27 PSF, with annual rent increases of 3%. If at any time less than six of the permanent retail store tenants (including Armani, Balenciaga, Bulgari, Burberry, Carolina Herrera, Cartier, Celine, Chanel, Chloe, Dior, Christian Louboutin, DeBeers, Dunhill, Fendi, Givenchy, Gucci, Kiton, LV, Marc Jacobs, Prada, Pucci, Tag Heuer, Tiffany, Tomas Maier, Van Cleef, Versace, YSL and Zegna) are open and operating for a period of six or more
THE INFORMATION IN THIS STRUCTURAL AND COLLATERAL TERM SHEET IS NOT COMPLETE AND MAY BE AMENDED PRIOR TO THE TIME OF SALE. THIS TERM SHEET IS NOT AN OFFER TO SELL THESE SECURITIES AND IT IS NOT A SOLICITATION OF AN OFFER TO BUY THESE SECURITIES IN ANY JURISDICTION WHERE THE OFFER OR SALE IS NOT PERMITTED.
65
| Retail - Luxury Retail | Loan #3 | Cut-off Date Balance: | $80,000,000 | |
| 151 NE 40th Street | Miami Design District | Cut-off Date LTV: | 46.7% | |
| Miami, FL 33137 | U/W NCF DSCR: | 2.14x | ||
| U/W NOI Debt Yield: | 9.3% |
consecutive months, then Hermes will have the right to pay alternate rent of 6% of gross sales. If such co-tenancy event continues for an additional 12 months (18 months total), then Hermes will have the right, within 30 days after the expiration of the 18 month period, to terminate the lease.
Harry Winston (7,219 square feet, 1.5% of net rentable area, 4.4% of underwritten base rent). Founded in 1932, Harry Winston is a jewelry retailer known for its expertise, fine craftsmanship, quality gems and innovative gemstone settings. In 2013, the Swatch Group Ltd. acquired Harry Winston. Harry Winston has retail salons around the world, including locations in New York, London, Paris, Geneva, Tokyo, Hong Kong and Shanghai. Harry Winston occupies 7,219 square feet in the Palm Court building on a lease that expires in March 2025. Harry Winston is currently paying annual rent of $202.69 PSF, with annual rent increases of 3%. If at any time less than six of the permanent retail store tenants (including LV, Hermes, Cartier, Dior, Dior Homme, Zegna, Gucci, Dolce G, Tiffany, Valentino, Chanel, J.P. Tod’s, Prada, YSL, Bulgari, Tag Heuer, Zenith, Fendi and Giorgio) (three of which must be LV, Hermes, Cartier and Dior) are open and operating for a period of six or more consecutive months, then Harry Winston will have the right to pay alternate rent of 6% of gross sales. If such co-tenancy event continues for an additional 12 months (18 months total), then Harry Winston will have the right, within 30 days after the expiration of the 18 month period, to terminate the lease.
Holly Hunt (24,897 square feet, 5.0% of net rentable area, 3.6% of underwritten base rent). Founded in 1983, Holly Hunt is a luxury home furnishing showroom with products including indoor and outdoor furniture, lighting, rugs, textiles and leathers. Holly Hunt partners with iconic modern brands such as Vladimir Kagan furniture designs and Assemblage bespoke wallcoverings. Holly Hunt renewed its lease in May 2020 for 24,897 square feet of showroom/gallery space in the Buick building. The lease expires on April 30, 2025. Holly Hunt is currently paying annual rent of $50.21 PSF, with annual rent increases of 3.5% starting May 1, 2021. The lease does not have any renewal or termination options.
Fendi Casa/Luxury Living (22,439 square feet, 4.5% of net rentable area, 3.4% of underwritten base rent). Founded nearly 40 years ago, Fendi Casa/Luxury Living designs, manufactures in Italy, and distributes high-end furniture for international luxury brands. Luxury Living Group has been producing and distributing furniture for the collections of Fendi Casa, Bentley Home, Trussardi Casa, Bugatti Home, Paul Mathieu for Luxury Living Collections and Luxury Living Outdoor. Fendi Casa/Luxury Living occupies 22,439 square feet in the Penny Lane building on a lease that expires on April 16, 2027. The lease requires current annual base rent of $52.00 PSF. The lease does not have any renewal or termination options.
Tom Ford (8,582 square feet, 1.7% of net rentable area, 3.4% of underwritten base rent). In April 2005, Tom Ford announced the creation of the Tom Ford brand for luxury clothing, accessories, fragrance and cosmetics. Ford was joined in this venture by former Gucci Group President and Chief Executive Officer Domenico De Sole, who serves as Chairman of the company. That same year, Ford announced his partnership with Marcolin Group to produce and distribute optical frames and sunglasses, as well as an alliance with Esteé Lauder to create the Tom Ford Beauty brand. Presently, there are 113 freestanding Tom Ford stores and shop-in-shops in locations such as New York, Toronto, Beverly Hills, Zurich, Milan, Hong Kong, Shanghai, Rome, London and Sydney. Tom Ford occupies 8,582 square feet in the JBL building under a lease that expires in March 2025. Tom Ford is currently paying an annual rent of $134.74 PSF with 3% annual increases. The lease does not have any renewal or termination options.
THE INFORMATION IN THIS STRUCTURAL AND COLLATERAL TERM SHEET IS NOT COMPLETE AND MAY BE AMENDED PRIOR TO THE TIME OF SALE. THIS TERM SHEET IS NOT AN OFFER TO SELL THESE SECURITIES AND IT IS NOT A SOLICITATION OF AN OFFER TO BUY THESE SECURITIES IN ANY JURISDICTION WHERE THE OFFER OR SALE IS NOT PERMITTED.
66
| Retail - Luxury Retail | Loan #3 | Cut-off Date Balance: | $80,000,000 | |
| 151 NE 40th Street | Miami Design District | Cut-off Date LTV: | 46.7% | |
| Miami, FL 33137 | U/W NCF DSCR: | 2.14x | ||
| U/W NOI Debt Yield: | 9.3% |
The following table presents certain information relating to the tenancy at the Miami Design District Property:
Tenant Summary(1)
| 2019 Sales | ||||||||||||
| Tenant Name | Tenant Type | Credit Rating (Fitch/ KBRA/ | Tenant NRSF | % of NRSF | Annual U/W Base Rent PSF | Annual U/W Base Rent | % of Total Annual U/W Base Rent | $ | PSF | Occ. Cost % | Lease Exp. Date | Term. Option (Y/N) |
| Hermes | Fashion | NR/NR/NR | 13,500 | 2.7% | $112.55 | $1,519,425 | 4.4% | $28,719,988 | $2,127 | 8.2% | 2/23/2025 | N |
| Harry Winston | Jewelry/ Watches | NR/NR/NR | 7,219 | 1.5% | $208.77 | $1,507,111 | 4.4% | $3,648,299 | $505 | 55.0% | 3/31/2025 | N |
| Holly Hunt | Showroom/Gallery | NR/NR/NR | 24,897 | 5.0% | $50.21 | $1,250,000 | 3.6% | NAV | NAV | NAV | 4/30/2025 | N |
| Fendi Casa/Luxury Living | Showroom/Gallery | NR/NR/NR | 22,439 | 4.5% | $52.00 | $1,166,828 | 3.4% | NAV | NAV | NAV | 4/16/2027 | N |
| Tom Ford | Fashion | NR/NR/NR | 8,582 | 1.7% | $134.74 | $1,156,342 | 3.4% | $6,740,439 | $785 | 24.3% | 3/31/2025 | N |
| Subtotal/Wtd. Avg. | 76,637 | 15.4% | $86.12 | $6,599,706 | 19.2% | |||||||
| Other Tenants | 363,340 | 73.1% | $76.67 | $27,857,171 | 80.8% | |||||||
| Vacant | 57,117 | 11.5% | $0 | $0 | 0.0% | |||||||
| Total/Wtd. Avg. | 497,094 | 100.0% | $78.32(2) | $34,456,877 | 100.0% | |||||||
| (1) | Information is based on the underwritten rent roll. Tenants ordered by % of Total Annual U/W Base Rent. |
| (2) | Total/Wtd. Avg. Annual U/W Base Rent PSF excludes vacant space. |
The following table presents certain information relating to the lease rollover schedule at the Miami Design District Property:
Lease Expiration Schedule(1)(2)
| Year Ending December 31, | No. of Leases Expiring | Expiring NRSF | % of Total NRSF Expiring | Cumulative Expiring NRSF | Cumulative % of Total NRSF Expiring | Annual U/W Base Rent Expiring | % of Total Annual U/W Base Rent Expiring | Annual U/W Base Rent PSF Expiring |
| MTM | 6 | 21,152 | 4.3% | 21,152 | 4.3% | $36,000 | 0.1% | $1.70 |
| 2020 | 3 | 7,976 | 1.6% | 29,128 | 5.9% | $365,585 | 1.1% | $45.84 |
| 2021 | 8 | 18,240 | 3.7% | 47,368 | 9.5% | $754,850 | 2.2% | $41.38 |
| 2022 | 13 | 39,196 | 7.9% | 86,564 | 17.4% | $1,529,325 | 4.4% | $39.02 |
| 2023 | 8 | 39,034 | 7.9% | 125,598 | 25.3% | $1,143,141 | 3.3% | $29.29 |
| 2024 | 10 | 50,071 | 10.1% | 175,669 | 35.3% | $4,853,973 | 14.1% | $96.94 |
| 2025 | 29 | 143,457 | 28.9% | 319,126 | 64.2% | $15,511,582 | 45.0% | $108.13 |
| 2026 | 1 | 5,384 | 1.1% | 324,510 | 65.3% | $594,394 | 1.7% | $110.40 |
| 2027 | 7 | 43,506 | 8.8% | 368,016 | 74.0% | $4,157,724 | 12.1% | $95.57 |
| 2028 | 8 | 44,058 | 8.9% | 412,074 | 82.9% | $3,881,931 | 11.3% | $88.11 |
| 2029 | 2 | 9,300 | 1.9% | 421,374 | 84.8% | $591,460 | 1.7% | $63.60 |
| 2030 | 2 | 7,827 | 1.6% | 429,201 | 86.3% | $1,036,912 | 3.0% | $132.48 |
| 2031(3) | 1 | 10,776 | 2.2% | 439,977 | 88.5% | $0 | 0.0% | $0.00 |
| Thereafter | 0 | 0 | 0.0% | 439,977 | 88.5% | $0 | 0.0% | $0.00 |
| Vacant | 0 | 57,117 | 11.5% | 497,094 | 100.0% | $0 | 0.0% | $0.00 |
| Total/Wtd. Avg. | 98 | 497,094 | 100.0% | $34,456,877 | 100.0% | $78.32(4) |
| (1) | Information is based on the underwritten rent roll. |
| (2) | Certain tenants may have lease termination options that are exercisable prior to the originally stated expiration date of the subject lease and that are not considered in the Lease Rollover Schedule. |
| (3) | 2031 includes space for a management office that has no rent associated with it. |
| (4) | Total/Wtd. Avg. Annual U/W Base Rent PSF Expiring excludes vacant space. |
The following table presents historical occupancy percentages at the Miami Design District Property:
Historical Occupancy
12/31/2016(1) | 12/31/2017(1) | 12/31/2018(1) | 12/31/2019(1) | 9/1/2020(2) |
| 78.1% | 87.0% | 93.1% | 92.4% | 88.5% |
| (1) | Information obtained from the borrower. |
| (2) | Information obtained from the underwritten rent roll. |
THE INFORMATION IN THIS STRUCTURAL AND COLLATERAL TERM SHEET IS NOT COMPLETE AND MAY BE AMENDED PRIOR TO THE TIME OF SALE. THIS TERM SHEET IS NOT AN OFFER TO SELL THESE SECURITIES AND IT IS NOT A SOLICITATION OF AN OFFER TO BUY THESE SECURITIES IN ANY JURISDICTION WHERE THE OFFER OR SALE IS NOT PERMITTED.
67
| Retail - Luxury Retail | Loan #3 | Cut-off Date Balance: | $80,000,000 | |
| 151 NE 40th Street | Miami Design District | Cut-off Date LTV: | 46.7% | |
| Miami, FL 33137 | U/W NCF DSCR: | 2.14x | ||
| U/W NOI Debt Yield: | 9.3% |
Cash Flow Analysis
| 2017 | 2018 | 2019 | U/W
| %(1) | U/W $ per SF | |
| Gross Potential Rent(2) | $24,853,605 | $29,909,090 | $31,279,003 | $41,080,090 | 68.9% | $82.64 |
| Reimbursements | 12,575,427 | 14,238,369 | 15,158,900 | 14,928,995 | 25.0 | 30.03 |
| Other Income(3) | 3,986,235 | 3,979,719 | 4,136,244 | 3,655,678 | 6.1 | 7.35 |
| Net Rental Income | $41,415,267 | $48,127,178 | $50,574,148 | $59,664,763 | 100.0% | $120.03 |
| (Vacancy & Concessions) | 0 | 0 | 0 | (6,623,213) | (16.1) | (13.32) |
| Effective Gross Income | $41,415,267 | $48,127,178 | $50,574,148 | $53,041,550 | 88.9% | $106.70 |
| Real Estate Taxes | 4,610,638 | 5,462,967 | 5,582,649 | 6,140,915 | 11.6 | 12.35 |
| Insurance | 611,547 | 718,405 | 691,057 | 775,000 | 1.5 | 1.56 |
| Other Operating Expenses | 10,578,921 | 9,812,182 | 10,483,050 | 9,091,534 | 17.1 | 18.29 |
| Total Operating Expenses | $15,801,105 | $15,993,554 | $16,756,756 | $16,007,449 | 30.2% | $32.20 |
| Net Operating Income | $25,614,162 | $32,133,624 | $33,817,392 | $37,034,101 | 69.8% | $74.50 |
| Replacement Reserves | 0 | 0 | 0 | 99,419 | 0.2 | 0.20 |
| TI/LC | 0 | 0 | 0 | 994,188 | 1.9 | 2.00 |
| Net Cash Flow | $25,614,162 | $32,133,624 | $33,817,392 | $35,940,495 | 67.8% | $72.30 |
| NOI DSCR(4) | 1.53x | 1.92x | 2.02x | 2.21x | ||
| NCF DSCR(4) | 1.53x | 1.92x | 2.02x | 2.14x | ||
| NOI Debt Yield(4) | 6.4% | 8.0% | 8.5% | 9.3% | ||
| NCF Debt Yield(4) | 6.4% | 8.0% | 8.5% | 9.0% |
| (1) | Represents (i) percent of Net Rental Income for all revenue fields, (ii) percent of Gross Potential Rent for Vacancy & Concessions and (iii) percent of Effective Gross Income for all other fields. |
| (2) | U/W Gross Potential Rent is based on the September 2020 rent roll with adjustments made for executed leases and tenants that have vacated or are expected to vacate after loan closing. U/W Gross Potential Rent includes grossed up vacant space $6,623,213 and contractual rent increases through March 2021. |
| (3) | Other Income consists of parking income, temporary tenant income, events revenue, % in lieu and overage rent. |
| (4) | Debt service coverage ratios and debt yields are based on the Miami Design District Senior Loan and exclude the Miami Design District Subordinate Companion Loan. |
Appraisal. The appraiser concluded to an “as-is” Appraised Value for the Miami Design District Property of $856,000,000 as of March 1, 2020. The appraisal also provided an “Upon Stabilization” value of $883,000,000 as of March 1, 2021, which value assumes physical and economic stabilization and results in an Appraised Value Per SF, Cut-off Date LTV Ratio and LTV Ratio at Maturity of $1,776, 45.3% and 45.3%, respectively, based on the principal balance of the Miami Design District Senior Loan. The appraisal also provided a “land” value of $600,000,000 for the land portion (assumed unimproved) of the Miami Design District Property, which value would result in a Cut-off Date LTV Ratio and LTV Ratio at Maturity of 66.7% and 66.7%, respectively, based on the principal balance of the Miami Design District Senior Loan.
Environmental Matters. According to the Phase I environmental site assessment dated February 20, 2020, there was no evidence of any recognized environmental conditions at the Miami Design District Property.
Market Overview and Competition. The Miami Design District Property is located in the Buena Vista neighborhood, in the northeastern portion of Miami, Florida. According to the appraisal, the Miami-Fort Lauderdale-West Palm Beach metro area (“Miami MSA”) had a population of approximately 2.79 million, with a 3.4% unemployment rate and a 6.0% personal income growth rate for 2019. Major employers include University of Miami, Jackson Health System, Publix Super Markets, Inc., Baptist Health Systems of Southern Florida and American Airlines. The Miami MSA has an international draw, ranking first in the country in immigration by ratio to population, ranking second in the country in overseas visitors (after New York City) and ranking second in the country in international cargo receipts (after Anchorage). The Miami MSA is the only metro area in the country where more than half of its residents are foreign-born.
Primary access to the Miami Design District Property is by Interstates 95 and 195 via Biscayne Boulevard or Miami Avenue, and by neighborhood north/south roadways including NW 2nd Avenue, N Miami Avenue, NE 2nd Avenue and Federal Highway, between east/west roadways from NE 38th Street to NE 54th Street. The Miami International Airport is located approximately 7.0 miles west, the Miami central business district is located approximately 5.0 miles south, and South Beach is located approximately 6.5 miles southeast of the Miami Design District Property.
The Miami Design District Property is a part of the Wynwood-Design District commercial real estate submarket, known to be a creative neighborhood and shopping destination dedicated to innovative fashion, design, art, architecture and dining. The area contains multiple retail, design and furniture showroom properties which together draw regional demand from both local shoppers and tourists. For 2019, the Wynwood-Design District submarket had approximately 3.5 million square feet of inventory (71,010 square feet of new completions), with a 10.2% vacancy rate and overall asking rents of $59.53 PSF. Within the 0.25-mile radius of the Miami Design
THE INFORMATION IN THIS STRUCTURAL AND COLLATERAL TERM SHEET IS NOT COMPLETE AND MAY BE AMENDED PRIOR TO THE TIME OF SALE. THIS TERM SHEET IS NOT AN OFFER TO SELL THESE SECURITIES AND IT IS NOT A SOLICITATION OF AN OFFER TO BUY THESE SECURITIES IN ANY JURISDICTION WHERE THE OFFER OR SALE IS NOT PERMITTED.
68
| Retail - Luxury Retail | Loan #3 | Cut-off Date Balance: | $80,000,000 | |
| 151 NE 40th Street | Miami Design District | Cut-off Date LTV: | 46.7% | |
| Miami, FL 33137 | U/W NCF DSCR: | 2.14x | ||
| U/W NOI Debt Yield: | 9.3% |
District Property, 2019 inventory was approximately 1.2 million square feet (43,327 square feet of new completions), with a 6.7% vacancy rate and overall asking rents of $85.95 PSF.
According to the appraisal, the estimated 2019 population within a one-, three- and five-mile radius of the Miami Design District Property was 33,589, 216,668 and 572,510, respectively. The estimated 2019 average household income within the same radii was $68,975, $57,649 and $68,788, respectively.
The following table presents certain information relating to the appraiser’s market rent conclusions for the Miami Design District Property:
Market Rent Summary
| Market Rent (PSF) | Lease Term (Years) | Rent Increase Projection | |
| Retail Fashion | $115 | 10 | 3% per annum |
| Retail General | $40 | 10 | 3% per annum |
| Retail Jewelry | $180 | 10 | 3% per annum |
| Retail Restaurant - Full Service | $45 | 10 | 3% per annum |
| Retail Restaurant - Limited Service | $30 | 10 | 3% per annum |
| Retail Restaurant - Drink | $45 | 10 | 3% per annum |
| Retail Showroom | $45 | 10 | 3% per annum |
| Retail Art Gallery | $140 | 10 | 3% per annum |
| Retail Services | $45 | 10 | 3% per annum |
| Office | $27 | 10 | 3% per annum |
| Storage | $30 | 5 | 0% |
THE INFORMATION IN THIS STRUCTURAL AND COLLATERAL TERM SHEET IS NOT COMPLETE AND MAY BE AMENDED PRIOR TO THE TIME OF SALE. THIS TERM SHEET IS NOT AN OFFER TO SELL THESE SECURITIES AND IT IS NOT A SOLICITATION OF AN OFFER TO BUY THESE SECURITIES IN ANY JURISDICTION WHERE THE OFFER OR SALE IS NOT PERMITTED.
69
| Retail - Luxury Retail | Loan #3 | Cut-off Date Balance: | $80,000,000 | |
| 151 NE 40th Street | Miami Design District | Cut-off Date LTV: | 46.7% | |
| Miami, FL 33137 | U/W NCF DSCR: | 2.14x | ||
| U/W NOI Debt Yield: | 9.3% |
The following table presents recent office leasing data at comparable properties with respect to the Miami Design District Property:
Comparable Office Leases
Property Address | Year Built | Distance from Subject | Total GLA (SF) | Anchor/Notable Tenants | Occupancy | Sales PSF | NNN Rent PSF |
Miami Design District 151 NE 40th Street Miami, FL | 2014-2019 | N/A | 497,094(1) | Hermes, Christian Dior, Louis Vuitton, Cartier, Tom Ford, Prada, Tiffany & Co., Van Kleef & Arpels, Dolce & Gabbana, Yves Saint Laurent, Tod’s, Omega, Fendi, A. Lange Sohne, Versace, Tag Heuer, Giorgio Armani, Bulgari, Valentino, IWC | 88.5%(1) | $1,018(2) | $50 - $125 |
Bal Harbour Shops 9700 Collins Avenue Bal Harbour, FL | 1965, 1982 | 9.0 miles | 463,114 | Saks 5th Avenue, Neiman Marcus, Dolce & Gabbana, Balenciaga, Gucci, Loro Piana, Prada, Ralph Lauren, Saint Laurent Paris, Valentino, Chanel, Dior, Fendi, Louis Vuitton, Jimmy Choo, Bulgari, Panerai, Van Cleef & Arpels, Tiffany & Co. | (+/-) 99% | $3,530 | $200 - $350 |
Aventura Mall 19501 Biscayne Boulevard Aventura, FL | 1983,
1997,
2008, 2017
| 15.0 miles | 2,086,948 | Nordstrom, Macy’s, Bloomingdales, JC Penny, Apple, Chanel, Louis Vuitton, Gucci, Cartier, Burberry, Fendi, Tag Heuer, Tiffani & Co., Givenchy, Rolex | (+/-) 98% | $1,625 | $150 - $250 |
Brickell City Center 701 S Miami Avenue Miami, FL | 2016-2017 | 5.0 miles | 483,372 | Saks 5th Avenue, Apple, Coach, Cole Haan, Boss, Intermix, IRO, Lululemon, Victoria’s Secret, Pandora, Kendra Scott, Zara | (+/-) 95% | $1,055 | $50 - $175 |
Worth Avenue Retail 100-300 Worth Avenue Palm Beach, FL | 1938,
1983, 2010
| 70.0 miles | 8,440 | Saks 5th Avenue, Neiman Marcus, Bruno Cucinelli, Ralph Lauren, Loro Piana, Jimmy Choo, Tiffany & Co., Chanel, Intermix, Michael Kors, Valentino, MaxMara, Torneau, Louis Vuitton, Panerai, Hublot, Gucci | (+/-) 98% | N/A | $100 - $250 |
Lincoln Road Pedestrian Mall 400-1100 Lincoln Road Miami Beach, FL | 1950,
2006, 2010
| 5.5 miles | 10,261 | Nike, Anthropologie, Athleta, Guess, Banana Republic, GAP, H&M, Intermix, J. Crew, Pandora, Lululemon, Sephora, Zadig & Voltaire, Zara, Victoria’s Secret, Macy’s, Ross Dress for Less and Marshals | (+/-) 90% | N/A | $150 - $300 |
Source: Appraisal.
| (1) | Information obtained from underwritten rent roll. |
| (2) | Information is as of December 31, 2019, as provided by the borrower sponsor, and only includes tenants reporting sales. |
Escrows.
Real Estate Taxes – The Miami Design District Borrower deposited at loan origination $2,100,000 to the real estate tax reserve and is required to deposit monthly 1/12 of the annual estimated real estate taxes (currently $525,000) to the tax reserve.
Insurance – Unless the Miami Design District Property is covered by a blanket policy for which the premiums have been prepaid (as currently), the Miami Design District Borrower is required to deposit monthly 1/12 of the annual estimated insurance premiums to the insurance reserve.
Replacement Reserve – The Miami Design District Borrower is required to deposit monthly $8,285 for replacements to the Miami Design District Property.
TI/LC Reserve – The Miami Design District Borrower deposited at loan origination $4,907,050 for outstanding landlord obligations related to nine tenants and is required to deposit monthly $82,849 for future tenant improvements and leasing commissions.
Free/Gap Rent Reserve – The Miami Design District Borrower deposited at loan origination the amount of $1,724,567 for gap rent and free rent, which total reserve includes $460,756 of gap rent for periods of one to seven months related to four tenants and $1,263,811 of free rent through March 31, 2021 related to seven tenants.
THE INFORMATION IN THIS STRUCTURAL AND COLLATERAL TERM SHEET IS NOT COMPLETE AND MAY BE AMENDED PRIOR TO THE TIME OF SALE. THIS TERM SHEET IS NOT AN OFFER TO SELL THESE SECURITIES AND IT IS NOT A SOLICITATION OF AN OFFER TO BUY THESE SECURITIES IN ANY JURISDICTION WHERE THE OFFER OR SALE IS NOT PERMITTED.
70
| Retail - Luxury Retail | Loan #3 | Cut-off Date Balance: | $80,000,000 | |
| 151 NE 40th Street | Miami Design District | Cut-off Date LTV: | 46.7% | |
| Miami, FL 33137 | U/W NCF DSCR: | 2.14x | ||
| U/W NOI Debt Yield: | 9.3% |
Debt Service Reserve – The Miami Design District Borrower deposited on December 1, 2020 the amount of $10,474,740 (equal to 6.0 months of interest-only debt service on the Miami Design District Whole Loan) as a debt service reserve. So long as no event of default is continuing, funds in the debt service reserve will be applied to debt service payments beginning January 1, 2021.
Lockbox and Cash Management. The Miami Design District Whole Loan is structured with a hard lockbox and springing cash management. All rents from the Miami Design District Property are required to be deposited directly to the lockbox account and so long as a Trigger Period (as defined below) is not continuing, funds in the lockbox account will be transferred to the borrower’s operating account. During a Trigger Period, the Miami Design District Borrower will not have access to the funds in the lockbox account and such funds will be transferred on each business day to the lender-controlled cash management account and disbursed according to the Miami Design District Whole Loan documents. During a Trigger Period, all excess cash is required to be held by the lender as additional security for the Miami Design District Whole Loan; however, provided no event of default is continuing as to which the lender has accelerated the Miami Design District Whole Loan or initiated an enforcement action, the Miami Design District Borrower is permitted to use excess cash to pay the costs of replacements at the Miami Design District Property not otherwise included in the annual budget or to pay for leasing costs.
A “Trigger Period” will occur during either (a) the period commencing upon the occurrence of an event of default and ending upon the cure or waiver of the event of default, or (b) the period beginning when the trailing six month (annualized) debt yield is less than 6.50% (tested quarterly beginning with the quarter commencing April 1, 2021, for two consecutive quarters) and ending when the trailing six month (annualized) debt yield is at least 6.50% (tested quarterly for two consecutive quarters).
Property Management. The Miami Design District Property is managed by Design District Management, Inc., a borrower affiliate.
Partial Release. Not permitted.
Real Estate Substitution. Not permitted.
Subordinate and Mezzanine Indebtedness. The Miami Design District Property also secures thirteen pari passu senior promissory notes (the “Miami Design District Pari Passu Companion Loan”), which have an aggregate Cut-off Date principal balance of $320,000,000, and the Miami Design District Subordinate Companion Loan, which has a Cut-off Date principal balance of $100,000,000. The Miami Design District Pari Passu Companion Loan and the Miami Design District Subordinate Companion Loan accrue interest at the same rate as the Miami Design District Mortgage Loan. The Miami Design District Mortgage Loan is entitled to payments of interest on a pro rata and pari passu basis with the Miami Design District Pari Passu Companion Loan, which payments are senior in right of payment to the Miami Design District Subordinate Companion Loan. The holders of the promissory notes evidencing the Miami Design District Whole Loan have entered into a co-lender agreement that sets forth the allocation of collections on the Miami Design District Whole Loan. See “Description of the Mortgage Pool—The Whole Loans—The Non-Serviced AB Whole Loans—The Miami Design District Whole Loan” and “Pooling and Servicing Agreement—Servicing of the Non-Serviced Mortgage Loans” in the Preliminary Prospectus.
Subordinate Note Summary
| B-Note Original Principal Balance | B-Note Interest Rate | Original Term (mos.) | Original Amort. Term (mos.) | Original IO Term (mos.) | Whole Loan UW NCF DSCR | Whole Loan UW NOI Debt Yield | Whole Loan Cut-off Date LTV | ||
| Miami Design District Subordinate Companion Loan | $100,000,000 | 4.1325% | 120 | 0 | 120 | 1.72x | 7.4% | 58.4% | |
Ground Lease. None.
Right of First Offer / Right of First Refusal. None.
Terrorism Insurance. The Miami Design District Borrower is required to obtain and maintain property insurance that covers perils and acts of terrorism and is required to obtain and maintain business interruption insurance for 24 months plus a 12-month extended period of indemnity; provided that the Miami Design District Borrower will only be required to pay for terrorism insurance a maximum of two times the annual insurance premiums payable for the Miami Design District Property at the time with respect to the property and business interruption policies. See “Risk Factors—Risks Relating to the Mortgage Loans—Terrorism Insurance May Not Be Available for All Mortgaged Properties” in the Preliminary Prospectus.
THE INFORMATION IN THIS STRUCTURAL AND COLLATERAL TERM SHEET IS NOT COMPLETE AND MAY BE AMENDED PRIOR TO THE TIME OF SALE. THIS TERM SHEET IS NOT AN OFFER TO SELL THESE SECURITIES AND IT IS NOT A SOLICITATION OF AN OFFER TO BUY THESE SECURITIES IN ANY JURISDICTION WHERE THE OFFER OR SALE IS NOT PERMITTED.
71
| Property Types – Various | Loan #4 | Cut-off Date Balance: | $40,495,000 | |
| Property Addresses – Various | ExchangeRight Net Leased Portfolio #42 | Cut-off Date LTV: | 59.7% | |
| U/W NCF DSCR: | 2.70x | |||
| U/W NOI Debt Yield: | 9.4% |
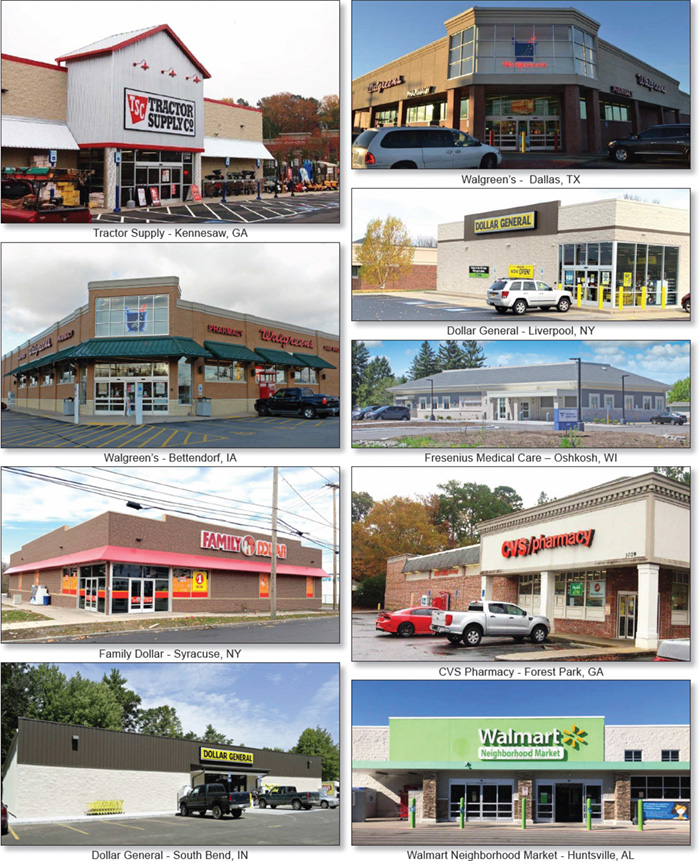
THE INFORMATION IN THIS STRUCTURAL AND COLLATERAL TERM SHEET IS NOT COMPLETE AND MAY BE AMENDED PRIOR TO THE TIME OF SALE. THIS TERM SHEET IS NOT AN OFFER TO SELL THESE SECURITIES AND IT IS NOT A SOLICITATION OF AN OFFER TO BUY THESE SECURITIES IN ANY JURISDICTION WHERE THE OFFER OR SALE IS NOT PERMITTED.
72
| Property Types – Various | Loan #4 | Cut-off Date Balance: | $40,495,000 | |
| Property Addresses – Various | ExchangeRight Net Leased Portfolio #42 | Cut-off Date LTV: | 59.7% | |
| U/W NCF DSCR: | 2.70x | |||
| U/W NOI Debt Yield: | 9.4% |
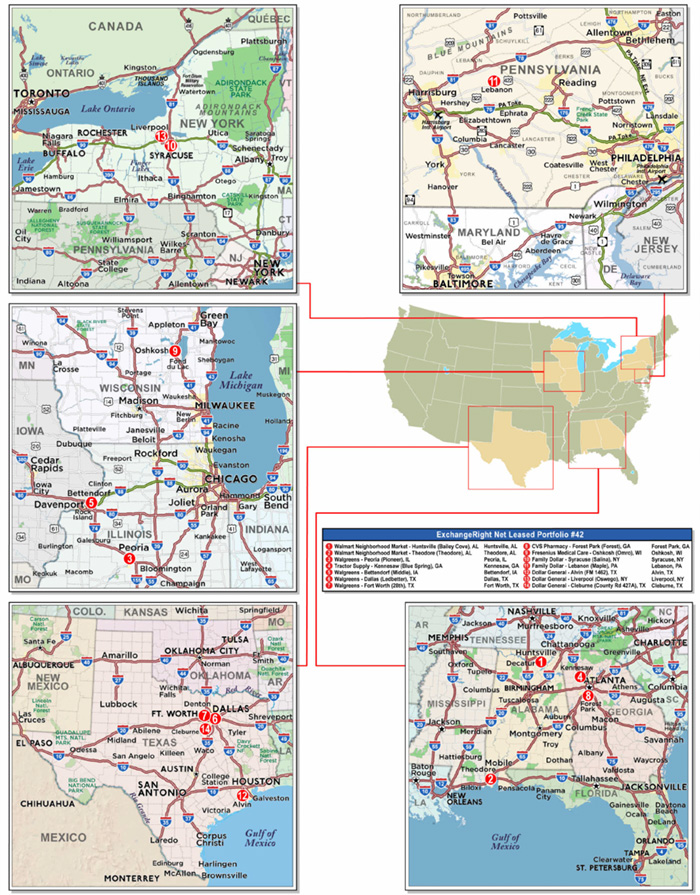
THE INFORMATION IN THIS STRUCTURAL AND COLLATERAL TERM SHEET IS NOT COMPLETE AND MAY BE AMENDED PRIOR TO THE TIME OF SALE. THIS TERM SHEET IS NOT AN OFFER TO SELL THESE SECURITIES AND IT IS NOT A SOLICITATION OF AN OFFER TO BUY THESE SECURITIES IN ANY JURISDICTION WHERE THE OFFER OR SALE IS NOT PERMITTED.
73
| No. 4 – ExchangeRight Net Leased Portfolio #42 | |||||||
| Mortgage Loan Information | Mortgaged Property Information | ||||||
| Mortgage Loan Seller: | Bank of America, National Association | Single Asset/Portfolio: | Portfolio | ||||
| Credit Assessment (Fitch/KBRA/S&P): | NR/NR/NR | Property Type – Subtype(2): | Various/Various | ||||
| Original Principal Balance: | $40,495,000 | Location(2): | Various | ||||
| Cut-off Date Balance: | $40,495,000 | Size: | 222,970 SF | ||||
| % of Initial Pool Balance: | 4.5% | Cut-off Date Balance Per SF: | $181.62 | ||||
| Loan Purpose: | Acquisition | Maturity Date Balance Per SF: | $181.62 | ||||
| Borrower Sponsor: | David Fisher; Joshua Ungerecht; Warren Thomas | Year Built/Renovated(2): | Various/Various | ||||
| Guarantors: | David Fisher; Joshua Ungerecht; Warren Thomas | Title Vesting: | Fee | ||||
| Mortgage Rate: | 3.412083% | Property Manager: | Self-managed | ||||
| Note Date: | December 22, 2020 | Current Occupancy (As of)(4): | 100.0% (2/1/2021) | ||||
| Seasoning: | 1 month | YE 2020 Occupancy(3): | NAV | ||||
| Maturity Date: | January 1, 2031 | YE 2019 Occupancy(3): | NAV | ||||
| IO Period: | 120 months | YE 2018 Occupancy(3): | NAV | ||||
| Loan Term (Original): | 120 months | YE 2017 Occupancy(3): | NAV | ||||
| Amortization Term (Original): | NAP | As-Is Appraised Value(4): | $67,835,000 | ||||
| Loan Amortization Type: | Interest-only, Balloon | As-Is Appraisal Value Per SF: | $304.23 | ||||
| Call Protection: | L(25),D(91),O(4) | As-Is Appraisal Valuation Date(5): | Various | ||||
| Lockbox Type: | Hard/Springing Cash Management | Underwriting and Financial Information(4) | |||||
| Additional Debt: | None | YE 2020 NOI(3): | NAV | ||||
| Additional Debt Type (Balance): | NAP | YE 2019 NOI(3): | NAV | ||||
| YE 2018 NOI(3): | NAV | ||||||
| YE 2017 NOI(3): | NAV | ||||||
| U/W Revenues: | $3,928,127 | ||||||
| U/W Expenses: | $117,844 | ||||||
| Escrows and Reserves(1) | U/W NOI: | $3,810,283 | |||||
| Initial | Monthly | Cap | U/W NCF: | $3,780,987 | |||
| Taxes | $18,110 | $5,276 | NAP | U/W DSCR based on NOI/NCF: | 2.72x / 2.70x | ||
| Insurance | $438 | $219 | NAP | U/W Debt Yield based on NOI/NCF: | 9.4% / 9.3% | ||
| Replacement Reserve | $170,000 | $723 | NAP | U/W Debt Yield at Maturity based on NOI/NCF: | 9.4% / 9.3% | ||
| TI/LC Reserve | $500,000 | Springing | NAP | Cut-off Date LTV Ratio: | 59.7% | ||
| Required Repair Reserve | $14,851 | $0 | NAP | LTV Ratio at Maturity: | 59.7% | ||
| Sources and Uses | ||||||||
| Sources | Uses | |||||||
| Original Mortgage Loan Amount | $40,495,000 | 58.7% | Purchase Price | $67,579,865 | 97.9% | |||
| Cash Equity Contribution | 28,520,167 | 41.3 | Closing Costs(6) | 731,902 | 1.1 | |||
| Reserves | 703,399 | 1.0 | ||||||
| Total Sources | $69,015,167 | 100.0% | Total Uses | $69,015,167 | 100.0% | |||
| (1) | See “Escrows” section. |
| (2) | See “The Properties” section. |
| (3) | Historical occupancy and NOI are unavailable because the ExchangeRight Properties (as defined below) were acquired by the borrower sponsor between November 24, 2020 and December 22, 2020. |
| (4) | While the ExchangeRight Net Leased Portfolio #42 Mortgage Loan (as defined below) was originated after the emergence of the novel coronavirus pandemic and the economic disruption resulting from measures to combat the pandemic, the pandemic is an evolving situation and could impact the ExchangeRight Net Leased Portfolio #42 Mortgage Loan more severely than assumed in the underwriting of the ExchangeRight Net Leased Portfolio #42 Mortgage Loan and could adversely affect the NOI, NCF and occupancy information, as well as the appraised value and the DSCR, LTV and Debt Yield metrics presented above. See “Risk Factors—Risks Related to Market Conditions and Other External Factors—The Coronavirus Pandemic Has Adversely Affected the Global Economy and Will Likely Adversely Affect the Performance of the Mortgage Loans” in the Preliminary Prospectus. |
| (5) | The individual appraisals are dated between November 6, 2020 and November 24, 2020. |
| (6) | The ExchangeRight Properties were acquired between November 24, 2020 and December 22, 2020. Closing Costs do not include costs incurred in connection with the closings of the acquisitions prior to the closing of the ExchangeRight Net Leased Portfolio #42 Mortgage Loan. |
The Mortgage Loan. The mortgage loan (the “ExchangeRight Net Leased Portfolio #42 Mortgage Loan”) is evidenced by a single promissory note in the original principal amount of $40,495,000 and secured by the fee interests in fourteen cross-collateralized, net leased, single-tenant retail and medical office properties located across eight states (the “ExchangeRight Properties”).
The Borrower and Borrower Sponsor. The borrower is ExchangeRight Net Leased Portfolio 42 DST, a Delaware statutory trust (the “ExchangeRight Net Leased Portfolio #42 Borrower”) that permits up to 250 members and is structured to be bankruptcy-remote with an independent trustee. See “Description of the Mortgage Pool—Mortgage Pool Characteristics—Delaware Statutory Trusts” in the Preliminary Prospectus. Legal counsel to the ExchangeRight Net Leased Portfolio #42 Borrower delivered a non-consolidation opinion
THE INFORMATION IN THIS STRUCTURAL AND COLLATERAL TERM SHEET IS NOT COMPLETE AND MAY BE AMENDED PRIOR TO THE TIME OF SALE. THIS TERM SHEET IS NOT AN OFFER TO SELL THESE SECURITIES AND IT IS NOT A SOLICITATION OF AN OFFER TO BUY THESE SECURITIES IN ANY JURISDICTION WHERE THE OFFER OR SALE IS NOT PERMITTED.
74
| Property Types – Various | Loan #4 | Cut-off Date Balance: | $40,495,000 | |
| Property Addresses – Various | ExchangeRight Net Leased Portfolio #42 | Cut-off Date LTV: | 59.7% | |
| U/W NCF DSCR: | 2.70x | |||
| U/W NOI Debt Yield: | 9.4% |
in connection with the origination of the ExchangeRight Net Leased Portfolio #42 Mortgage Loan. The borrower sponsors are David Fisher, Joshua Ungerecht and Warren Thomas, the same sponsors as for the ExchangeRight REIT 2 mortgage loan and ExchangeRight Net Leased Portfolio #41 mortgage loan. ExchangeRight Real Estate, LLC has more than 13 million square feet under management. ExchangeRight Real Estate, LLC has interests in more than 750 investment-grade retail and Class B/B+ multifamily properties located across 38 states. David Fisher, Joshua Ungerecht and Warren Thomas, the owners of ExchangeRight Real Estate, LLC, are the guarantors of certain non-recourse carveout liabilities under the ExchangeRight Net Leased Portfolio #42 Mortgage Loan. Warren Thomas was a guarantor of a mortgage loan secured by a mortgaged property that was subject to a foreclosure sale in November 2009. See “Description of the Mortgage Pool—Loan Purpose; Default History, Bankruptcy Issues and Other Proceedings” in the Preliminary Prospectus.
The ExchangeRight Net Leased Portfolio #42 Borrower has master leased the ExchangeRight Properties to a master tenant (the “ExchangeRight Net Leased Portfolio #42 Master Tenant”) owned by ExchangeRight Real Estate, LLC, which is in turn owned by the ExchangeRight Net Leased Portfolio #42 Mortgage Loan non-recourse carveout guarantors. The ExchangeRight Net Leased Portfolio #42 Master Tenant is a Delaware limited liability company structured to be bankruptcy-remote and has one independent director. The master lease generally requires the ExchangeRight Net Leased Portfolio #42 Master Tenant to operate, maintain and manage the ExchangeRight Properties and pay all expenses incurred in the maintenance and repair of the ExchangeRight Properties other than capital expenses (however, under the ExchangeRight Net Leased Portfolio #42 Mortgage Loan, replacement reserves may be made available to the ExchangeRight Net Leased Portfolio #42 Master Tenant for the payment of capital expenses). The ExchangeRight Net Leased Portfolio #42 Master Tenant’s interest in all tenant rents was assigned to the ExchangeRight Net Leased Portfolio #42 Borrower, which in turn collaterally assigned its interest to the lender. The master lease is subordinate to the ExchangeRight Net Leased Portfolio #42 Mortgage Loan and, upon an event of default under the ExchangeRight Net Leased Portfolio #42 Mortgage Loan, the lender has the right to cause the ExchangeRight Net Leased Portfolio #42 Borrower to terminate the master lease. A default under the master lease is an event of default under the ExchangeRight Net Leased Portfolio #42 Mortgage Loan and gives rise to recourse liability to the non-recourse carveout guarantors for losses, unless such default arises solely in connection with the failure of the ExchangeRight Net Leased Portfolio #42 Master Tenant to pay rent as a result of the ExchangeRight Properties not generating sufficient cash flow for the payment of such rent.
The lender has the right to require the ExchangeRight Net Leased Portfolio #42 Borrower to convert from a Delaware statutory trust to a limited liability company upon (i) an event of default under the ExchangeRight Net Leased Portfolio #42 Mortgage Loan or the lender’s determination of an imminent default, (ii) the lender’s determination that the ExchangeRight Net Leased Portfolio #42 Borrower will be unable to make a material decision or take a material action required in connection with the operation and maintenance of any ExchangeRight Property, and (iii) 90 days prior to the stated maturity date of the ExchangeRight Net Leased Portfolio #42 Mortgage Loan, if an executed commitment from an institutional lender to refinance the ExchangeRight Net Leased Portfolio #42 Mortgage Loan is not delivered to the lender.
Any time after December 22, 2021, the borrower sponsor has the right to effect a one-time transfer of all (but not less than all) of the outstanding ownership interests in the ExchangeRight Net Leased Portfolio #42 Borrower to an Approved Transferee (as defined below) and to replace the non-recourse carveout guarantors as the persons who control the ExchangeRight Net Leased Portfolio #42 Borrower with a person affiliated with such Approved Transferee who would then control the ExchangeRight Net Leased Portfolio #42 Borrower; provided that certain conditions are satisfied, including among others: (i) no event of default exists under the ExchangeRight Net Leased Portfolio #42 Mortgage Loan, (ii) the Approved Transferee owns 100% of the beneficial ownership interests in the ExchangeRight Net Leased Portfolio #42 Borrower and at least 51% of the ExchangeRight Net Leased Portfolio #42 Master Tenant, (iii) a person affiliated with the Approved Transferee executes a replacement guaranty and environmental indemnity pursuant to which it agrees to be liable for all indemnity obligations (including environmental liabilities and obligations) for which the existing non-recourse carveout guarantors are liable under the non-recourse carveout guaranty and environmental indemnity agreement, (iv) the delivery of a REMIC opinion, an insolvency opinion and other opinions required by the lender, and (v) the receipt of rating agency confirmation that such transfer and guarantor replacement will not result in a downgrade of the respective ratings assigned to the BANK 2021-BNK31 certificates (such a transfer and replacement, a “Qualified Transfer”). A Cash Sweep Period (as defined below) will be triggered if a Qualified Transfer does not occur by January 1, 2028 (36 months prior to the maturity date of the ExchangeRight Net Leased Portfolio #42 Mortgage Loan). See “Lockbox and Cash Management”.
“Approved Transferee” means (A) an eligible institution that is, or is wholly-owned and controlled by, a bank, savings and loan association, investment bank, insurance company, trust company, real estate investment trust, commercial credit corporation, pension plan, pension fund or pension advisory firm, mutual fund, government entity or plan or institution similar to any of the foregoing or (B) any person that (1)(i) has never been indicted or convicted of, or pled guilty or no contest to a felony, (ii) has never been indicted or convicted of, or pled guilty or no contest to a Patriot Act offense and is not on any government watch list, (iii) has never been the subject of a voluntary or involuntary (to the extent the same has not been discharged) bankruptcy proceeding, (iv) has no material outstanding judgments against it or its interests and (v) is not a sanctioned entity, (2) is regularly engaged in the business of owning or operating commercial properties, or interests therein, which are similar to the ExchangeRight Properties, (3) owns interests in, or operates, at least five retail properties with a minimum of 750,000 square feet in the aggregate, and (4) has either total assets of at least $100,000,000 or an investment grade rating.
COVID-19 Update. As of January 19, 2021, the ExchangeRight Properties are open and operating. All seven tenants have remained current on all rent and lease obligations. The first debt service payment on the ExchangeRight Net Leased Portfolio #42 Mortgage Loan is due in February 2021 and, as of January 19, 2021, the ExchangeRight Net Leased Portfolio #42 Mortgage Loan is not subject to any forbearance, modification or debt service relief request.
The Properties. The ExchangeRight Properties are comprised of 13 single-tenant retail properties and one single-tenant medical office property totaling 222,970 square feet and located across eight states. The ExchangeRight Properties are located in Alabama (two
THE INFORMATION IN THIS STRUCTURAL AND COLLATERAL TERM SHEET IS NOT COMPLETE AND MAY BE AMENDED PRIOR TO THE TIME OF SALE. THIS TERM SHEET IS NOT AN OFFER TO SELL THESE SECURITIES AND IT IS NOT A SOLICITATION OF AN OFFER TO BUY THESE SECURITIES IN ANY JURISDICTION WHERE THE OFFER OR SALE IS NOT PERMITTED.
75
| Property Types – Various | Loan #4 | Cut-off Date Balance: | $40,495,000 | |
| Property Addresses – Various | ExchangeRight Net Leased Portfolio #42 | Cut-off Date LTV: | 59.7% | |
| U/W NCF DSCR: | 2.70x | |||
| U/W NOI Debt Yield: | 9.4% |
properties, 38.5% of NRA), Texas (four properties, 21.6% of NRA), Georgia (two properties, 13.1% of NRA), New York (two properties, 6.8% of NRA) and Iowa (one property, 6.5% of NRA), with the three remaining ExchangeRight Properties located in Illinois, Wisconsin and Pennsylvania. Built between 1997 and 2020 (with eight properties built between 2016 and 2020), the ExchangeRight Properties range in size from 6,831 square feet to 43,101 square feet.
The ExchangeRight Properties are leased to seven nationally recognized tenants in diverse retail and medical office segments, which tenants consist of Walmart Neighborhood Market, Walgreens, Dollar General, Tractor Supply, Family Dollar, CVS Pharmacy and Fresenius Medical Care. All seven tenants are subsidiaries of investment grade-rated entities. The ExchangeRight Properties have a weighted average remaining lease term of approximately 11.3 years. Leases representing 90.4% of NRA and 88.7% of the underwritten base rent expire after the stated maturity date of the ExchangeRight Net Leased Portfolio #42 Mortgage Loan. For the purposes of the preceding two sentences, the Walgreens leases, each of which grants early termination rights to Walgreens, were assumed to expire on the date when the earliest termination right under each such lease, if exercised, would be effective.
The following table presents certain information relating to the ExchangeRight Properties, which are presented in descending order of their Appraised Values.
ExchangeRight Properties Summary
Tenant Name City, State | Year Built/ Renov. | Tenant NRSF | % of Portfolio NRSF | Lease Expiration Date(1) | Appraised Value | % of Portfolio Appraised Value | Annual U/W Base Rent | Annual U/W Base Rent PSF | % of Annual U/W Base Rent | Renewal Options(2) | |
| Walmart Neighborhood Market Huntsville, AL | 2016/NAP | 43,101 | 19.3% | 1/26/2031 | $12,100,000 | 17.8% | $707,011 | $16.40 | 17.5% | 17x5 yrs. | |
| Walmart Neighborhood Market Theodore, AL | 2016/NAP | 42,661 | 19.1% | 1/26/2031 | $11,350,000 | 16.7% | $663,453 | $15.55 | 16.4% | 17x5 yrs. | |
Walgreens Peoria, IL | 2001/NAP | 14,490 | 6.5% | 7/31/2032 | $6,300,000 | 9.3% | $390,000 | $26.92 | 9.7% | 6x5 yrs. | |
Tractor Supply Kennesaw, GA | 2020/NAP | 19,156 | 8.6% | 9/30/2035 | $5,925,000 | 8.7% | $355,000 | $18.53 | 8.8% | 4x5 yrs. | |
Walgreens Bettendor, IA | 2003/NAP | 14,503 | 6.5% | 12/31/2030 | $5,800,000 | 8.6% | $360,000 | $24.82 | 8.9% | 6x5 yrs. | |
Walgreens Dallas, TX | 2000/NAP | 15,047 | 6.7% | 7/31/2031 | $5,800,000 | 8.6% | $335,949 | $22.33 | 8.3% | 9x5 yrs. | |
Walgreens Fort Worth, TX | 2000/NAP | 15,047 | 6.7% | 7/31/2031 | $5,800,000 | 8.6% | $335,489 | $22.30 | 8.3% | 9x5 yrs. | |
CVS Pharmacy Forest Park, GA | 1997/NAP | 10,125 | 4.5% | 12/31/2035 | $3,000,000 | 4.4% | $165,000 | $16.30 | 4.1% | 4x5 yrs. | |
Fresenius Medical Care Oshkosh, WI | 2019/NAP | 7,243 | 3.2% | 3/31/2035 | $2,950,000 | 4.3% | $167,147 | $23.08 | 4.1% | 3x5 yrs. | |
Family Dollar Syracuse, NY | 2016/NAP | 8,320 | 3.7% | 9/30/2031 | $2,200,000 | 3.2% | $142,838 | $17.17 | 3.5% | 6x5 yrs. | |
Family Dollar Lebanon, PA | 2017/NAP | 8,320 | 3.7% | 3/31/2033 | $2,100,000 | 3.1% | $133,712 | $16.07 | 3.3% | 6x5 yrs. | |
Dollar General Alvin, TX | 2020/NAP | 9,026 | 4.0% | 10/11/2035 | $1,600,000 | 2.4% | $99,673 | $11.04 | 2.5% | 5x5 yrs. | |
Dollar General Liverpool, NY | 2015/2020 | 6,831 | 3.1% | 9/30/2030 | $1,500,000 | 2.2% | $96,701 | $14.16 | 2.4% | 4x5 yrs. | |
Dollar General Cleburne, TX | 2018/NAP | 9,100 | 4.1% | 9/1/2033 | $1,410,000 | 2.1% | $85,552 | $9.40 | 2.1% | 3x5 yrs. | |
| Total/Weighted Average | 222,970 | 100.0% | $67,835,000 | 100.0% | $4,037,526 | $18.11 | 100.0% | ||||
| (1) | For the purposes of the table and loan underwriting, the Walgreens leases, each of which grants early termination rights to Walgreens, were assumed to expire on the date as of when the earliest termination right under each such lease, if exercised, would be effective. |
| (2) | Where any termination right has been assumed to be the lease expiration date, the Renewal Options as shown reflect periods between subsequent termination rights. |
THE INFORMATION IN THIS STRUCTURAL AND COLLATERAL TERM SHEET IS NOT COMPLETE AND MAY BE AMENDED PRIOR TO THE TIME OF SALE. THIS TERM SHEET IS NOT AN OFFER TO SELL THESE SECURITIES AND IT IS NOT A SOLICITATION OF AN OFFER TO BUY THESE SECURITIES IN ANY JURISDICTION WHERE THE OFFER OR SALE IS NOT PERMITTED.
76
| Property Types – Various | Loan #4 | Cut-off Date Balance: | $40,495,000 | |
| Property Addresses – Various | ExchangeRight Net Leased Portfolio #42 | Cut-off Date LTV: | 59.7% | |
| U/W NCF DSCR: | 2.70x | |||
| U/W NOI Debt Yield: | 9.4% |
Major Tenants. The following table presents certain information relating to the major tenants at the ExchangeRight Properties:
Major Tenants
| Tenant Name | Credit Rating (Fitch/Moody’s/S&P)(1) | No of Prop. | Tenant NRSF | % of NRSF | Annual U/W Base Rent | Annual U/W Base Rent PSF | % of Total Annual U/W Base Rent |
| Major Tenants | |||||||
| Walmart Neighborhood Market | AA / Aa2 / AA | 2 | 85,762 | 38.5% | $1,370,464 | $15.98 | 33.9% |
| Walgreens | BBB- / Baa2 / BBB | 4 | 59,087 | 26.5% | $1,421,438 | $24.06 | 35.2% |
| Dollar General | NR / Baa2 / BBB | 3 | 24,957 | 11.2% | $281,926 | $11.30 | 7.0% |
| Tractor Supply | NR / Baa1 / BBB | 1 | 19,156 | 8.6% | $355,000 | $18.53 | 8.8% |
| Family Dollar | NR / Baa2 / NR | 2 | 16,640 | 7.5% | $276,550 | $16.62 | 6.8% |
| CVS Pharmacy | NR / Baa2 / BBB | 1 | 10,125 | 4.5% | $165,000 | $16.30 | 4.1% |
| Fresenius Medical Care | BBB- / Baa3 / BBB | 1 | 7,243 | 3.2% | $167,147 | $23.08 | 4.1% |
| Total Major Tenants | 14 | 222,970 | 100.0% | $4,037,526 | $18.11 | 100.0% | |
| Vacant Space | 0 | 0.0% | |||||
| Collateral Total | 222,970 | 100.0% | |||||
| (1) | Certain ratings are those of the parent company whether or not the parent company guarantees the lease. |
The following table presents certain information relating to the lease expiration schedule at the ExchangeRight Properties:
Lease Expiration Schedule(1)(2)
| Year Ending December 31, | No. of Leases Expiring | Expiring NRSF | % of Total NRSF | Cumulative Expiring NRSF | Cumulative % of Total NRSF | Annual U/W Base Rent | % of Total Annual U/W Base Rent | Annual U/W Base Rent PSF |
| 2021 | 0 | 0 | 0.0% | 0 | 0.0% | $0 | 0.0% | $0.00 |
| 2022 | 0 | 0 | 0.0% | 0 | 0.0% | $0 | 0.0% | $0.00 |
| 2023 | 0 | 0 | 0.0% | 0 | 0.0% | $0 | 0.0% | $0.00 |
| 2024 | 0 | 0 | 0.0% | 0 | 0.0% | $0 | 0.0% | $0.00 |
| 2025 | 0 | 0 | 0.0% | 0 | 0.0% | $0 | 0.0% | $0.00 |
| 2026 | 0 | 0 | 0.0% | 0 | 0.0% | $0 | 0.0% | $0.00 |
| 2027 | 0 | 0 | 0.0% | 0 | 0.0% | $0 | 0.0% | $0.00 |
| 2028 | 0 | 0 | 0.0% | 0 | 0.0% | $0 | 0.0% | $0.00 |
| 2029 | 0 | 0 | 0.0% | 0 | 0.0% | $0 | 0.0% | $0.00 |
| 2030 | 2 | 21,334 | 9.6% | 21,334 | 9.6% | $456,701 | 11.3% | $21.41 |
| 2031 | 5 | 124,176 | 55.7% | 145,510 | 65.3% | $2,184,740 | 54.1% | $17.59 |
| Thereafter | 7 | 77,460 | 34.7% | 222,970 | 100.0% | $1,396,085 | 34.6% | $18.02 |
| Vacant | 0 | 0 | 0.0% | 222,970 | 100.0% | $0 | 0.0% | $0.00 |
| Total/Weighted Average | 14 | 222,970 | 100.0% | $4,037,526 | 100.0% | $18.11 |
| (1) | Information obtained from the underwritten rent roll. |
| (2) | For the purposes of the table and loan underwriting, the Walgreens leases, each of which grants early termination rights to Walgreens, were assumed to expire on the date as of when the earliest termination right under each such lease, if exercised, would be effective. |
The following table presents historical occupancy percentages at the ExchangeRight Properties:
Historical Occupancy
12/31/2016(1) | 12/31/2017(1) | 12/31/2018(1) | 12/31/2019(1) | 2/1/2021 |
| NAV | NAV | NAV | NAV | 100.0% |
| (1) | The ExchangeRight Properties were acquired by the borrower sponsor between November 24, 2020 and December 22, 2020. Historical occupancy for the portfolio of ExchangeRight Properties is not available. |
THE INFORMATION IN THIS STRUCTURAL AND COLLATERAL TERM SHEET IS NOT COMPLETE AND MAY BE AMENDED PRIOR TO THE TIME OF SALE. THIS TERM SHEET IS NOT AN OFFER TO SELL THESE SECURITIES AND IT IS NOT A SOLICITATION OF AN OFFER TO BUY THESE SECURITIES IN ANY JURISDICTION WHERE THE OFFER OR SALE IS NOT PERMITTED.
77
| Property Types – Various | Loan #4 | Cut-off Date Balance: | $40,495,000 | |
| Property Addresses – Various | ExchangeRight Net Leased Portfolio #42 | Cut-off Date LTV: | 59.7% | |
| U/W NCF DSCR: | 2.70x | |||
| U/W NOI Debt Yield: | 9.4% |
Underwritten Net Cash Flow. The following table presents certain information relating to the underwritten net cash flow at the ExchangeRight Properties:
Cash Flow Analysis(1)
| U/W | % of Effective Gross Income | U/W $ per SF | |
| Gross Potential Rent(2) | $4,134,871 | 105.3% | $18.54 |
| (Vacancy & Credit Loss)(3) | (206,744) | (5.3) | (0.93) |
| Effective Gross Income | $3,928,127 | 100.0% | $17.62 |
| Total Expenses(4) | $117,844 | 3.0% | $0.53 |
| Net Operating Income | $3,810,283 | 97.0% | $17.09 |
| TI/LC | 20,617 | 0.5 | 0.09 |
| Replacement Reserves | 8,679 | 0.2 | 0.04 |
| Net Cash Flow | $3,780,987 | 96.3% | $16.96 |
| NOI DSCR | 2.72x | ||
| NCF DSCR | 2.70x | ||
| NOI Debt Yield | 9.4% | ||
| NCF Debt Yield | 9.3% |
| (1) | The ExchangeRight Properties were acquired by the borrower sponsor between November 24, 2020 and December 22, 2020. Accordingly, historical operating statements are not available. |
| (2) | Gross Potential Rent is inclusive of straight-line rent (averaged over the lesser of the loan term or the remaining lease term) for investment grade tenants that have rent increases during the loan term. |
| (3) | The ExchangeRight Properties were 100.0% occupied as of February 1, 2021. |
| (4) | U/W Total Expenses consist of a 3.0% property management fee. |
Appraisals. The ExchangeRight Properties were valued individually between November 6, 2020 and November 24, 2020, with the individual values reflecting an aggregate “as-is” appraised value of $67,835,000.
Environmental Matters. The Phase I environmental site assessments for the ExchangeRight Properties are dated from September 2, 2020 to November 24, 2020. There was no evidence of any recognized environmental conditions at the ExchangeRight Properties, except that a recognized environmental condition was identified at the Walgreens - Fort Worth (28th), TX property, caused by a tanker truck that overturned at an adjacent, up-gradient property in January 2002, resulting in the release of 4,000 gallons of gasoline, which impacted surface soils and groundwater at the subject property. Six groundwater monitoring wells were installed where the release impacted soils, and groundwater data collected between January 2002 and May 2020 has shown a decreasing trend of benzene, toluene, ethylbenzene and xylenes (BTEX) constituent concentrations. In September 2017, a response action plan (RAP) was approved by the Texas Commission on Environmental Quality. The remediation action set forth in the RAP involves injecting a suite of compounds into the soil to accelerate the rate of attenuation of chemicals of concern, and five injection wells were installed in February 2019. The May 2020 sampling revealed benzene concentrations slightly above tier-1 groundwater protective concentration levels, and groundwater monitoring is ongoing under the RAP. A responsible party unrelated to the ExchangeRight Net Leased Portfolio #42 Borrower has been identified and has paid for the environmental investigations and remedial actions. Accordingly, the Phase I found that it is unlikely that the owner of the subject property would be required to financially participate in the investigation or remediation. The Phase I also found that a vapor intrusion condition is unlikely to exist at the property.
Escrows.
Real Estate Taxes – The ExchangeRight Net Leased Portfolio #42 Borrower deposited at loan origination $18,110 for real estate taxes. Commencing upon any of (i) an event of default under the ExchangeRight Net Leased Portfolio #42 Mortgage Loan, (ii) an event of default under a tenant lease, (iii) a tenant no longer being liable to pay property taxes directly to the taxing authority, or (iv) the ExchangeRight Net Leased Portfolio #42 Borrower failing to provide evidence that such property taxes have been paid in full on or prior to the date when due, the ExchangeRight Net Leased Portfolio #42 Borrower will be required to make monthly deposits for real estate taxes in an amount equal to 1/12th of the estimated annual amount due. The ExchangeRight Net Leased Portfolio #42 Borrower will be required to pay property taxes for the Dollar General - Alvin (FM 1462), TX property, including the entire tax parcel of which such property is a part, until the ExchangeRight Net Leased Portfolio #42 Borrower obtains a separate tax parcel identification number for such property (initially $5,276).
Insurance – Unless waived due to a blanket policy being in place, as is currently the case, the ExchangeRight Net Leased Portfolio #42 Mortgage Loan documents require that the ExchangeRight Net Leased Portfolio #42 Borrower will be required to make monthly escrows of 1/12th of the estimated annual all-risk insurance premiums due. The ExchangeRight Net Leased Portfolio #42 Borrower deposited
THE INFORMATION IN THIS STRUCTURAL AND COLLATERAL TERM SHEET IS NOT COMPLETE AND MAY BE AMENDED PRIOR TO THE TIME OF SALE. THIS TERM SHEET IS NOT AN OFFER TO SELL THESE SECURITIES AND IT IS NOT A SOLICITATION OF AN OFFER TO BUY THESE SECURITIES IN ANY JURISDICTION WHERE THE OFFER OR SALE IS NOT PERMITTED.
78
| Property Types – Various | Loan #4 | Cut-off Date Balance: | $40,495,000 | |
| Property Addresses – Various | ExchangeRight Net Leased Portfolio #42 | Cut-off Date LTV: | 59.7% | |
| U/W NCF DSCR: | 2.70x | |||
| U/W NOI Debt Yield: | 9.4% |
at loan origination $438 for flood insurance premiums and is required to escrow flood insurance monthly (initially $219.08) for the Family Dollar - Lebanon (Maple), PA property, which is currently in a flood zone.
Replacement Reserve – The ExchangeRight Net Leased Portfolio #42 Borrower deposited at loan origination $170,000 and is required to deposit $723 monthly for replacements.
Tenant Improvements and Leasing Commissions Reserve - The ExchangeRight Net Leased Portfolio #42 Borrower deposited at loan origination $500,000 for tenant improvements and leasing commissions. During an event of default, the ExchangeRight Net Leased Portfolio #42 Borrower will be required to make monthly deposits in the amount of $2,762 for tenant improvements and leasing commissions.
Required Repair Reserve – The ExchangeRight Net Leased Portfolio #42 Borrower deposited at loan origination $14,851 (representing 125% of the estimated cost of repairs) for specified repairs at each of the Tractor Supply - Kennesaw (Blue Spring), GA property and the Walgreens - Bettendorf (Middle), IA property.
Lockbox and Cash Management. The ExchangeRight Net Leased Portfolio #42 Mortgage Loan is structured with a hard lockbox and springing cash management. The ExchangeRight Net Leased Portfolio #42 Borrower is required to (or to cause the ExchangeRight Net Leased Portfolio #42 Master Tenant or property manager to) cause all rents relating to the ExchangeRight Properties to be transmitted directly by the tenant of each property into the lockbox account and, to the extent that such rents are received by the ExchangeRight Net Leased Portfolio #42 Borrower (or ExchangeRight Net Leased Portfolio #42 Master Tenant or property manager), cause such amounts to be deposited into the lockbox account within one business day following receipt. The lockbox account bank is required to sweep such funds into the ExchangeRight Net Leased Portfolio #42 Master Tenant’s operating account on each business day other than during a Cash Sweep Period (as defined below). Upon the delivery of notice by the lender of the commencement of the initial Cash Sweep Period, if any, the ExchangeRight Net Leased Portfolio #42 Borrower is required to establish a lender-controlled cash management account, into which account all funds in the lockbox account will be required to be transferred on each business day so long as a Cash Sweep Period is continuing. So long as a Cash Sweep Period is continuing, funds in the cash management account are required to be applied (i) to make the next monthly deposits (to the extent required) into the real estate taxes and insurance reserves as described above under “Escrows”, (ii) to reserve the next monthly debt service payment due on the ExchangeRight Net Leased Portfolio #42 Mortgage Loan, (iii) to make the next monthly deposits into the replacement reserve as described above under “Escrows”, (iv) to make the next monthly deposits into the tenant improvements and leasing commissions reserve as described above under “Escrows”, (v) to pay operating expenses set forth in the annual budget (which is required to be approved by the lender) and additional operating expenses reasonably approved by the lender and (vi) to deposit any remainder into a cash collateral subaccount to be held as additional security for the ExchangeRight Net Leased Portfolio #42 Mortgage Loan. Upon cessation of a Cash Sweep Period, all available amounts on deposit in the cash management account must be deposited in the ExchangeRight Net Leased Portfolio #42 Borrower’s operating account.
A “Cash Sweep Period” means a period:
| (i) | commencing if and when the interest-only debt service coverage ratio (based on net cash flow for the trailing 12 months) for any calendar quarter is less than 1.50x and ending if and when the interest-only debt service coverage ratio (based on net cash flow for the trailing 12 months) is at least 1.55x for two consecutive calendar quarters, or |
| (ii) | commencing on January 1, 2028 (36 months before the maturity date of the ExchangeRight Net Leased Portfolio #42 Mortgage Loan), and ending if and when a Qualified Transfer occurs to a transferee with either (a) a minimum net worth of at least $200,000,000 and total assets of at least $400,000,000 or (b) an investment grade rating, an affiliate of the transferee executes a full recourse guaranty guaranteeing the payment of the entire amount of the ExchangeRight Net Leased Portfolio #42 Mortgage Loan (in lieu of the replacement guaranty and environmental indemnity agreement described in the “Qualified Transfer” definition above), and the ExchangeRight Net Leased Portfolio #42 Borrower is converted to a Delaware limited liability company. |
Property Management. The ExchangeRight Properties are managed by NLP Management, LLC, an affiliate of the ExchangeRight Net Leased Portfolio #42 Borrower.
Partial Release. Not permitted.
Real Estate Substitution. Not permitted.
Subordinate and Mezzanine Indebtedness. Not permitted
Ground Lease. None.
Rights of First Refusal. The related single tenant at each of the following five ExchangeRight Properties has a right of first refusal (“ROFR”) to purchase the related ExchangeRight Property: Family Dollar - Lebanon (Maple), PA; Family Dollar - Syracuse (Salina), NY; Tractor Supply - Kennesaw (Blue Spring), GA; Walgreens - Bettendorf (Middle), IA; and Walgreens - Peoria (Pioneer), IL properties.
The related single tenant at each of the following two ExchangeRight Properties has a right of first offer (“ROFO”) to purchase the related ExchangeRight Property: Walmart Neighborhood Market - Huntsville (Bailey Cove), AL; and Walmart Neighborhood Market - Theodore (Theodore), AL, properties.
THE INFORMATION IN THIS STRUCTURAL AND COLLATERAL TERM SHEET IS NOT COMPLETE AND MAY BE AMENDED PRIOR TO THE TIME OF SALE. THIS TERM SHEET IS NOT AN OFFER TO SELL THESE SECURITIES AND IT IS NOT A SOLICITATION OF AN OFFER TO BUY THESE SECURITIES IN ANY JURISDICTION WHERE THE OFFER OR SALE IS NOT PERMITTED.
79
| Property Types – Various | Loan #4 | Cut-off Date Balance: | $40,495,000 | |
| Property Addresses – Various | ExchangeRight Net Leased Portfolio #42 | Cut-off Date LTV: | 59.7% | |
| U/W NCF DSCR: | 2.70x | |||
| U/W NOI Debt Yield: | 9.4% |
No such ROFR or ROFO will apply to the mortgagee or any other party that acquires title or right of possession to the leased premises through a foreclosure, deed-in-lieu of foreclosure or any other enforcement action under the applicable mortgage, but each such ROFR or ROFO will apply to subsequent purchasers of the applicable Mortgaged Property. See “Description of the Mortgage Pool—Tenant Issues—Purchase Options and Rights of First Refusal” in the Preliminary Prospectus.
Terrorism Insurance. The ExchangeRight Net Leased Portfolio #42 Mortgage Loan documents require that the property insurance policy required to be maintained by the ExchangeRight Net Leased Portfolio #42 Borrower provide coverage for perils and acts of terrorism in an amount equal to the full replacement cost of the ExchangeRight Properties, as well as business interruption insurance covering no less than the 18-month period following the occurrence of a casualty event, together with a 6-month extended period of indemnity. See “Risk Factors—Risks Relating to the Mortgage Loans—Terrorism Insurance May Not Be Available for All Mortgaged Properties” in the Preliminary Prospectus.
THE INFORMATION IN THIS STRUCTURAL AND COLLATERAL TERM SHEET IS NOT COMPLETE AND MAY BE AMENDED PRIOR TO THE TIME OF SALE. THIS TERM SHEET IS NOT AN OFFER TO SELL THESE SECURITIES AND IT IS NOT A SOLICITATION OF AN OFFER TO BUY THESE SECURITIES IN ANY JURISDICTION WHERE THE OFFER OR SALE IS NOT PERMITTED.
80
(THIS PAGE INTENTIONALLY LEFT BLANK)
THE INFORMATION IN THIS STRUCTURAL AND COLLATERAL TERM SHEET IS NOT COMPLETE AND MAY BE AMENDED PRIOR TO THE TIME OF SALE. THIS TERM SHEET IS NOT AN OFFER TO SELL THESE SECURITIES AND IT IS NOT A SOLICITATION OF AN OFFER TO BUY THESE SECURITIES IN ANY JURISDICTION WHERE THE OFFER OR SALE IS NOT PERMITTED.
81
| Office – CBD | Loan #5 | Cut-off Date Balance: | $38,000,000 | |
| 250 West 57th Street | 250 West 57th Street | Cut-off Date LTV: | 54.5% | |
| New York, NY 10107 | UW NCF DSCR: | 3.49x | ||
| UW NOI Debt Yield: | 11.1% |

THE INFORMATION IN THIS STRUCTURAL AND COLLATERAL TERM SHEET IS NOT COMPLETE AND MAY BE AMENDED PRIOR TO THE TIME OF SALE. THIS TERM SHEET IS NOT AN OFFER TO SELL THESE SECURITIES AND IT IS NOT A SOLICITATION OF AN OFFER TO BUY THESE SECURITIES IN ANY JURISDICTION WHERE THE OFFER OR SALE IS NOT PERMITTED.
82
| Office – CBD | Loan #5 | Cut-off Date Balance: | $38,000,000 | |
| 250 West 57th Street | 250 West 57th Street | Cut-off Date LTV: | 54.5% | |
| New York, NY 10107 | UW NCF DSCR: | 3.49x | ||
| UW NOI Debt Yield: | 11.1% |
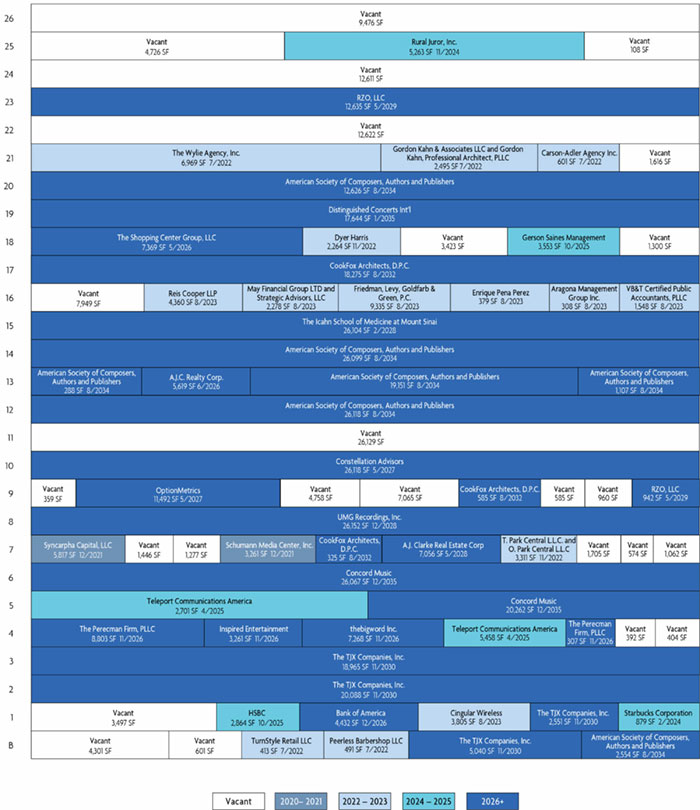
THE INFORMATION IN THIS STRUCTURAL AND COLLATERAL TERM SHEET IS NOT COMPLETE AND MAY BE AMENDED PRIOR TO THE TIME OF SALE. THIS TERM SHEET IS NOT AN OFFER TO SELL THESE SECURITIES AND IT IS NOT A SOLICITATION OF AN OFFER TO BUY THESE SECURITIES IN ANY JURISDICTION WHERE THE OFFER OR SALE IS NOT PERMITTED.
83
| Office – CBD | Loan #5 | Cut-off Date Balance: | $38,000,000 | |
| 250 West 57th Street | 250 West 57th Street | Cut-off Date LTV: | 54.5% | |
| New York, NY 10107 | UW NCF DSCR: | 3.49x | ||
| UW NOI Debt Yield: | 11.1% |
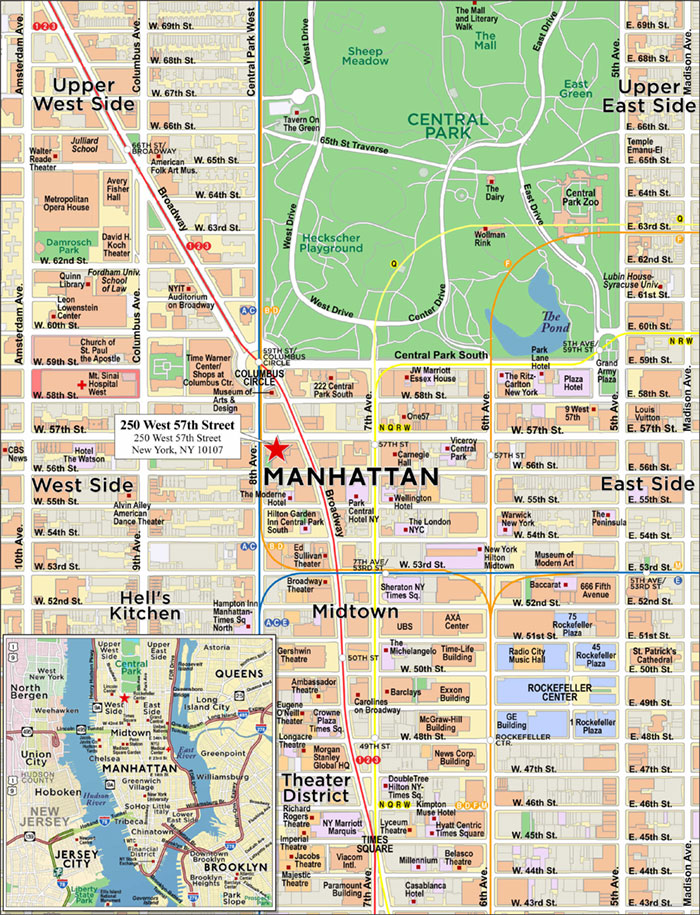
THE INFORMATION IN THIS STRUCTURAL AND COLLATERAL TERM SHEET IS NOT COMPLETE AND MAY BE AMENDED PRIOR TO THE TIME OF SALE. THIS TERM SHEET IS NOT AN OFFER TO SELL THESE SECURITIES AND IT IS NOT A SOLICITATION OF AN OFFER TO BUY THESE SECURITIES IN ANY JURISDICTION WHERE THE OFFER OR SALE IS NOT PERMITTED.
84
| No. 5 – 250 West 57th Street | |||||||
| Mortgage Loan Information | Mortgaged Property Information(3) | ||||||
| Mortgage Loan Seller: | Morgan Stanley Mortgage Capital Holdings LLC | Single Asset/Portfolio: | Single Asset | ||||
Credit Assessment (Fitch/KBRA/S&P): | NR/NR/NR | Property Type – Subtype: | Office – CBD | ||||
| Original Principal Balance(1): | $38,000,000 | Location: | New York, NY | ||||
| Cut-off Date Balance(1): | $38,000,000 | Size: | 543,743 SF | ||||
| % of Initial Pool Balance: | 4.2% | Cut-off Date Balance Per SF(1): | $331.04 | ||||
| Loan Purpose: | Recapitalization | Maturity Date Balance Per SF(1): | $331.04 | ||||
| Borrower Sponsors: | Empire State Realty OP, L.P. | Year Built/Renovated: | 1921/2017-2020 | ||||
| Guarantor: | Empire State Realty OP, L.P. | Title Vesting: | Fee | ||||
| Mortgage Rate: | 2.8290% | Property Manager: | Self-managed | ||||
| Note Date: | November 12, 2020 | Current Occupancy (As of): | 79.8% (10/29/2020) | ||||
| Seasoning: | 2 months | YE 2019 Occupancy: | 75.7% | ||||
| Maturity Date: | December 1, 2030 | YE 2018 Occupancy: | 82.8% | ||||
| IO Period: | 120 months | YE 2017 Occupancy: | 71.4% | ||||
| Loan Term (Original): | 120 months | YE 2016 Occupancy: | 77.1% | ||||
| Amortization Term (Original): | NAP | Appraised Value: | $330,000,000 | ||||
| Loan Amortization Type: | Interest-only, Balloon | Appraised Value Per SF: | $606.90 | ||||
| Call Protection: | L(26),D(87),O(7) | Appraisal Valuation Date: | November 1, 2020 | ||||
| Lockbox Type: | Hard/Upfront Cash Management | Underwriting and Financial Information(3)(4) | |||||
| Additional Debt(1): | Yes | TTM NOI (6/30/2020): | $19,265,309 | ||||
| Additional Debt Type (Balance)(1): | Pari Passu ($142,000,000) | YE 2019 NOI: | $18,978,463 | ||||
| YE 2018 NOI: | $19,146,149 | ||||||
| YE 2017 NOI: | $16,889,331 | ||||||
| U/W Revenues: | $36,164,898 | ||||||
| U/W Expenses: | $16,274,317 | ||||||
| Escrows and Reserves(2) | U/W NOI: | $19,890,581 | |||||
| Initial | Monthly | Cap | U/W NCF: | $18,012,345 | |||
| Taxes | $3,841,605 | $768,321 | NAP | U/W DSCR based on NOI/NCF(1): | 3.85x / 3.49x | ||
| Insurance | $0 | Springing | NAP | U/W Debt Yield based on NOI/NCF(1): | 11.1% / 10.0% | ||
| Replacement Reserve | $0 | Springing | NAP | U/W Debt Yield at Maturity based on NOI/NCF(1): | 11.1% / 10.0% | ||
| TI/LC Reserve | $859,958 | Springing | NAP | Cut-off Date LTV Ratio(1): | 54.5% | ||
| Free Rent Reserve | $4,194,083 | $0 | NAP | LTV Ratio at Maturity(1): | 54.5% | ||
| Sources and Uses | ||||||||
| Sources | Uses | |||||||
| Whole Loan Amount(1) | $180,000,000 | 100.0% | Return of Equity | $164,840,700 | 91.6% | |||
| Reserves | 8,895,646 | 4.9 | ||||||
| Closing Costs | 6,263,654 | 3.5 | ||||||
| Total Sources | $180,000,000 | 100.0% | Total Uses | $180,000,000 | 100.0% | |||
| (1) | The 250 West 57th Street Mortgage Loan (as defined below) is a part of the 250 West 57th Street Whole Loan (as defined below) with an original aggregate principal balance of $180,000,000. The Cut-off Date Balance Per SF, Maturity Date Balance Per SF, U/W DSCR based on NOI/NCF, U/W Debt Yield based on NOI/NCF, U/W Debt Yield at Maturity based on NOI/NCF, Cut-off Date LTV Ratio and LTV Ratio at Maturity numbers presented above are based on the aggregate principal balance of the promissory notes comprising the 250 West 57th Street Whole Loan. |
| (2) | See “Escrows” below for further discussion of reserve requirements. |
| (3) | The novel coronavirus pandemic is an evolving situation and could impact the 250 West 57th Street Whole Loan more severely than assumed in the underwriting of the 250 West 57th Street Whole Loan and could adversely affect the NOI, NCF and occupancy information, as well as the appraised value and the DSCR, LTV and Debt Yield metrics presented above and herein. See “Risk Factors—Risks Related to Market Conditions and Other External Factors—The Coronavirus Pandemic Has Adversely Affected the Global Economy and Will Likely Adversely Affect the Performance of the Mortgage Loans” in the Preliminary Prospectus. |
| (4) | The borrower has informed the lender that it has applied for an Industrial and Commercial Abatement Program (“ICAP”) tax abatement, which has not yet been received. See “The Property—Tax Abatement” below. Approximately $2,178,571 of ICAP benefits were underwritten. Excluding such ICAP benefits, the UW NCF DSCR would be 3.16x, and the UW NOI Debt Yield and the UW NOI Debt Yield at Maturity would be 10.1%. The Appraised Value assumes that the ICAP is in place and has a net present value of $11,000,000. If such net present value of $11,000,000 was excluded from the Appraised Value of $330,000,000, the Cut-off Date LTV Ratio and LTV Ratio at Maturity would be 56.4%. There can be no assurance of what the actual Appraised Value would be if the ICAP abatement is not obtained. |
The Mortgage Loan. The mortgage loan (the “250 West 57th Street Mortgage Loan”) is part of a whole loan (the “250 West 57th Street Whole Loan”) evidenced by four pari passu promissory notes in the aggregate original principal amount of $180,000,000 and secured by a first priority fee mortgage encumbering an office property located in New York, New York (the “250 West 57th Street Property”). The non-controlling Notes A-2-2 and A-3, in the aggregate original principal amount of $38,000,000, represent the 250 West 57th Street Mortgage Loan and will be included in the BANK 2021-BNK31 securitization trust. The controlling Note A-1, in the original principal amount of $87,000,000, was contributed to the BANK 2020-BNK29 securitization and the non-controlling Note A-2-1, in the original principal amount of $55,000,000 (together with Note A-1, the “250 West 57th Street Non-Serviced Pari Passu
THE INFORMATION IN THIS STRUCTURAL AND COLLATERAL TERM SHEET IS NOT COMPLETE AND MAY BE AMENDED PRIOR TO THE TIME OF SALE. THIS TERM SHEET IS NOT AN OFFER TO SELL THESE SECURITIES AND IT IS NOT A SOLICITATION OF AN OFFER TO BUY THESE SECURITIES IN ANY JURISDICTION WHERE THE OFFER OR SALE IS NOT PERMITTED.
85
| Office – CBD | Loan #5 | Cut-off Date Balance: | $38,000,000 | |
| 250 West 57th Street | 250 West 57th Street | Cut-off Date LTV: | 54.5% | |
| New York, NY 10107 | UW NCF DSCR: | 3.49x | ||
| UW NOI Debt Yield: | 11.1% |
Companion Loans”), was contributed to the BANK 2020-BNK30 securitization. The 250 West 57th Street Whole Loan will be serviced pursuant to the pooling and servicing agreement for the BANK 2020-BNK29 securitization trust. See “Description of the Mortgage Pool—The Whole Loans—The Non-Serviced Pari Passu Whole Loans” and “Pooling and Servicing Agreement—Servicing of the Non-Serviced Mortgage Loans” in the Preliminary Prospectus.
Note Summary
| Notes | Original Principal Balance | Cut-off Date Balance | Note Holder | Controlling Interest |
| A-1 | $87,000,000 | $87,000,000 | BANK 2020-BNK29 | Yes |
| A-2-1 | $55,000,000 | $55,000,000 | BANK 2020-BNK30 | No |
| A-2-2 | $15,000,000 | $15,000,000 | BANK 2021-BNK31 | No |
| A-3 | $23,000,000 | $23,000,000 | BANK 2021-BNK31 | No |
| Total | $180,000,000 | $180,000,000 |
The Borrower and the Borrower Sponsor. The borrower is ESRT 250 West 57th St., L.L.C. (the “250 West 57th Street Borrower”), a Delaware limited liability company structured with two independent directors. The borrower sponsor and the non-recourse carveout guarantor is Empire State Realty OP, L.P. (“ESRT”). Headquartered in New York, New York, ESRT owns, manages, operates, acquires and repositions office and retail properties in Manhattan and the greater New York metropolitan area, including the Empire State Building. ESRT’s office and retail portfolio covers 10.1 million rentable SF, including 9.4 million rentable SF in 14 office properties, with nine in Manhattan and the remaining five properties in Fairfield County, Connecticut and Westchester County, New York.
The Property. The 250 West 57th Street Property is a Class B, 26-story office property totaling 543,743 square feet, including 67,867 square feet of retail space, located in New York City. The 250 West 57th Street Property was built in 1921 and underwent an approximately $28.7 million renovation starting in 2017 and finishing earlier in 2020. The renovation included a new lobby, new retail storefronts, transportation upgrades, the addition of a west terrace, restroom and common area renovations, and new mechanical upgrades throughout. The 250 West 57th Street Borrower anticipates approximately $4.2 million of capital expenditures over the next three years, which include Local Law 11 work, riser pipe replacement and landlord work for the Concord Music space; however, such work is generally not required or reserved for under the 250 West 57th Street Whole Loan documents.
The renovation of the 250 West 57th Street Property included converting multi-tenanted floors into single tenancy floors. The 8th, 10th through 15th, 17th, 19th, 20th and 22nd through 24th floors have been converted to single tenant use. The 250 West 57th Street Borrower intends to convert the 4th, 16th and 21st floors into single tenant spaces, once existing leases on those floors expire. Approximately 282,000 square feet of new leases have been signed at the building since 2017. Tenants that have signed leases over the past three years include American Society of Composers, Authors and Publishers (“ASCAP”) (87,943 square feet), Concord Music, Inc. (“Concord Music”) (46,329 square feet), The Icahn School of Medicine at Mount Sinai (“The Icahn School of Medicine”) (26,104 square feet), CookFox Architects, D.P.C. (19,185 square feet) and Distinguished Concerts Int’l (17,644 square feet), which have long-term leases at the 250 West 57th Street Property.
The 250 West 57th Street Property was 79.8% leased as of October 29, 2020 to 45 tenants. Aside from ASCAP (16.8% of underwritten rent), which is the largest overall tenant at the 250 West 57th Street Property and the largest office tenant, and The TJX Companies, Inc. (“TJ Maxx”) (14.0% of underwritten rent), which is the second largest overall tenant at the 250 West 57th Street Property by underwritten rent and the largest retail tenant, no other tenant accounts for more than 9.2% of underwritten rent or 8.5% of total SF. The 250 West 57th Street Property contains a retail component that comprises 12.5% of the total rentable area and accounts for approximately 28.2% of underwritten rent. The largest retail tenant is TJ Maxx (46,644 square feet), which leases the Eighth Avenue corner space. TJ Maxx leases 2,794 square feet at grade, 20,000 square feet on the 2nd floor, 18,965 square feet on the 3rd floor and 4,885 square feet in the basement. In 2018, TJ Maxx extended its lease through November 30, 2030 and expanded on the 3rd floor. The retail component has strong credit tenancy, including HSBC Bank, Bank of America, TJ Maxx and Starbucks.
The three largest office tenants are ASCAP (87,943 square feet) on the 12th, 13th, 14th and 20th floors, Concord Music (46,329 square feet) on the 5th and 6th floors, and Lighthouse Guild International Inc. (37,680 square feet) on the 9th and 10th floors. In total, the three largest office tenants represent 31.6% of net rentable area and 32.6% of underwritten rent.
Tax Abatement. The 250 West 57th Street Borrower has applied for a 10-year Industrial and Commercial Abatement Program (“ICAP”) tax abatement based on the recent renovation of the 250 West 57th Street Property. The 250 West 57th Street Borrower filed a notice with the Department of Finance of the City of New York on April 28, 2020 certifying that all construction at the 250 West 57th Street Property necessary to obtain the partial tax exemption had been completed. The 250 West 57th Street Borrower has represented that it has complied with all of the statutory requirements of the ICAP program, other than providing proof to the Department of Finance of the City of New York that all of the outstanding violations against the 250 West 57th Street Property set forth in the loan documents have been cleared and removed of record. The 250 West 57th Street Borrower anticipates submitting the evidence of clearing and removing of record the outstanding violations to the Department of Finance on or about November 1, 2021 and receiving the final approval for the ICAP tax abatement benefits no later than November 1, 2021. In the event that the 250 West 57th Street Borrower fails to clear each of the existing violations from the public record by November 12, 2021 (subject to extension due to force majeure delays, as defined in the related loan documents, including without limitation pandemic related delays), the 250 West 57th Street Borrower is required to deposit $18,200,000, which will be held as additional collateral for the 250 West 57th Street Whole Loan until the earlier of (i) delivery of a Final Certificate of Eligibility by the New York City Department of Finance evidencing the final approval of the ICAP abatement and (ii) the repayment or defeasance of the 250 West 57th Street Whole Loan.
THE INFORMATION IN THIS STRUCTURAL AND COLLATERAL TERM SHEET IS NOT COMPLETE AND MAY BE AMENDED PRIOR TO THE TIME OF SALE. THIS TERM SHEET IS NOT AN OFFER TO SELL THESE SECURITIES AND IT IS NOT A SOLICITATION OF AN OFFER TO BUY THESE SECURITIES IN ANY JURISDICTION WHERE THE OFFER OR SALE IS NOT PERMITTED.
86
| Office – CBD | Loan #5 | Cut-off Date Balance: | $38,000,000 | |
| 250 West 57th Street | 250 West 57th Street | Cut-off Date LTV: | 54.5% | |
| New York, NY 10107 | UW NCF DSCR: | 3.49x | ||
| UW NOI Debt Yield: | 11.1% |
Once the violations are cleared, the ICAP abatement is expected to commence retroactively in the tax year of 2020/2021 and expire in 2029/2030, providing the 250 West 57th Street Borrower a 100% exemption from any increases in the 250 West 57th Street Property’s real estate taxes for the first five years, then phasing out the exemption by 20% every year thereafter. According to the related appraisal, if the ICAP is obtained it would result in an estimated annual tax savings of $2,178,571, which would then decline following the first five years as described above. We cannot assure you that the ICAP abatement will be obtained.
The below table presents certain information relating to the major tenants at the 250 West 57th Street Property:
Major Tenants(1)
| Tenant Name | Credit Rating (Fitch/Moody’s/S&P)(2) | Tenant NRSF | % of NRSF | Annual U/W Base Rent PSF(3) | Annual U/W Base Rent | % of Total Annual U/W Base Rent | Lease Expiration | Renewal Options | Term. Option (Y/N) |
| Office Tenants | |||||||||
| ASCAP | NR/NR/NR | 87,943 | 16.2% | $59.70 | $5,250,340 | 16.8% | 8/31/2034 | 2 x 5-year | N |
| Concord Music(4) | NR/NR/NR | 46,329 | 8.5% | $62.00 | $2,872,398 | 9.2% | 12/10/2035 | 1 x 5-year | N |
| Lighthouse Guild International Inc. | NR/NR/NR | 37,680 | 6.9% | $55.28 | $2,082,950 | 6.7% | 5/31/2027 | 1 x 5-year | N |
| UMG Recordings, Inc. | NR/NR/NR | 26,152 | 4.8% | $65.00 | $1,699,880 | 5.4% | 12/31/2028 | 1 x 5-year | N |
| The Icahn School of Medicine(5) | A/A2/A- | 26,104 | 4.8% | $60.00 | $1,566,240 | 5.0% | 2/29/2028 | 1 x 5-year | N |
| Subtotal/Wtd. Avg. | 224,208 | 41.2% | $60.09 | $13,471,808 | 43.0% | ||||
| Retail Tenants | |||||||||
| The TJX Companies, Inc. | NR/A2/A | 46,644 | 8.6% | $94.26 | $4,396,663 | 14.0% | 11/30/2030 | 1 x 5-year | N |
| Bank of America | A+/A2/A- | 4,432 | 0.8% | $329.87 | $1,461,984 | 4.7% | 12/31/2026 | 1 x 5-year | N |
| Cingular Wireless | NR/NR/NR | 3,805 | 0.7% | $381.57 | $1,451,874 | 4.6% | 8/31/2023 | 1 x 5-year | N |
| HSBC | A+/A3/A- | 2,864 | 0.5% | $412.50 | $1,181,400 | 3.8% | 10/18/2025 | 1 x 5-year | N |
| Subtotal/Wtd. Avg. | 57,745 | 10.6% | $147.06 | $8,491,921 | 27.1% | ||||
| Non-Major Tenants | 151,831 | 27.9% | $61.45 | $9,330,195 | 29.8% | ||||
| Occupied Collateral Total | 433,784 | 79.8% | $72.14 | $31,293,924 | 100.0% | ||||
| Vacant Space | 109,959 | 20.2% | |||||||
| Collateral Total | 543,743 | 100.0% | |||||||
| (1) | Information is based on the underwritten rent roll as of October 29, 2020. |
| (2) | Certain ratings are those of the parent company whether or not the parent company guarantees the lease. |
| (3) | Total/Wtd. Avg. Annual UW Rent PSF excludes vacant space. |
| (4) | Concord Music has free rent for eleven months starting in the month of the commencement date of its lease (which commencement date occurs upon completion of landlord work). According to the borrower sponsor, the landlord work completion date and commencement date occurred on December 11, 2020. At origination, $2,468,189 was reserved in respect of such free rent. |
| (5) | The Icahn School of Medicine has free rent for each of the following months: March 2021, July 2021, November 2021, March 2022, July 2022, March 2023, July 2023, March 2024, July 2024, March 2025, March 2026 and March 2027. At origination, $1,566,240 was reserved in respect of such free rent. |
THE INFORMATION IN THIS STRUCTURAL AND COLLATERAL TERM SHEET IS NOT COMPLETE AND MAY BE AMENDED PRIOR TO THE TIME OF SALE. THIS TERM SHEET IS NOT AN OFFER TO SELL THESE SECURITIES AND IT IS NOT A SOLICITATION OF AN OFFER TO BUY THESE SECURITIES IN ANY JURISDICTION WHERE THE OFFER OR SALE IS NOT PERMITTED.
87
| Office – CBD | Loan #5 | Cut-off Date Balance: | $38,000,000 | |
| 250 West 57th Street | 250 West 57th Street | Cut-off Date LTV: | 54.5% | |
| New York, NY 10107 | UW NCF DSCR: | 3.49x | ||
| UW NOI Debt Yield: | 11.1% |
The following table presents certain information relating to the lease rollover schedule at the 250 West 57th Street Property:
Lease Expiration Schedule(1)(2)
| Year Ending December 31, | No. of Leases Expiring(3) | Expiring NRSF | % of Total NRSF | Cumulative Expiring NRSF | Cumulative % of Total NRSF | Annual U/W Base Rent | % of Total Annual U/W Base Rent | Annual U/W Base Rent PSF |
| MTM | 1 | 0 | 0.0% | 0 | 0.0% | $1,766 | 0.0% | $0.00 |
| 2021 | 2 | 9,078 | 1.7% | 9,078 | 1.7% | $504,770 | 1.6% | $55.60 |
| 2022 | 6 | 16,544 | 3.0% | 25,622 | 4.7% | $817,102 | 2.6% | $49.39 |
| 2023 | 7 | 22,013 | 4.0% | 47,635 | 8.8% | $2,421,172 | 7.7% | $109.99 |
| 2024 | 3 | 6,214 | 1.1% | 53,849 | 9.9% | $625,999 | 2.0% | $100.74 |
| 2025 | 5 | 14,562 | 2.7% | 68,411 | 12.6% | $1,995,403 | 6.4% | $137.03 |
| 2026 | 6 | 37,059 | 6.8% | 105,470 | 19.4% | $3,404,269 | 10.9% | $91.86 |
| 2027 | 4 | 37,680 | 6.9% | 143,150 | 26.3% | $2,089,316 | 6.7% | $55.45 |
| 2028 | 4 | 59,312 | 10.9% | 202,462 | 37.2% | $3,647,144 | 11.7% | $61.49 |
| 2029 | 1 | 13,577 | 2.5% | 216,039 | 39.7% | $870,259 | 2.8% | $64.10 |
| 2030 | 1 | 46,644 | 8.6% | 262,683 | 48.3% | $4,396,663 | 14.0% | $94.26 |
| 2031 | 0 | 0 | 0.0% | 262,683 | 48.3% | $0 | 0.0% | $0.00 |
| Thereafter | 5 | 171,101 | 31.5% | 433,784 | 79.8% | $10,520,061 | 33.6% | $61.48 |
| Vacant | 0 | 109,959 | 20.2% | 543,743 | 100.0% | $0 | 0.0% | $0.00 |
| Total/Wtd. Avg.(4) | 45 | 543,743 | 100.0% | $31,293,924 | 100.0% | $72.14 |
| (1) | Information is based on the underwritten rent roll as of October 29, 2020. |
| (2) | Certain tenants may have lease termination options that are exercisable prior to the stated expiration date of the subject lease or leases that are not considered in the lease rollover schedule. |
| (3) | No. of Leases Expiring includes six telecom tenants, one broadcast tenant and a management office that have no SF associated with their leases. |
| (4) | Total Annual U/W Base Rent PSF excludes vacant space. |
The following table presents historical occupancy percentages at the 250 West 57th Street Property:
Historical Occupancy
2016(1) | 2017(1) | 2018(1) | 2019(1) | 10/29/2020(2) |
| 77.1% | 71.4% | 82.8% | 75.7% | 79.8% |
| (1) | Information obtained from the borrower sponsor. |
| (2) | Information based on the underwritten rent roll. |
THE INFORMATION IN THIS STRUCTURAL AND COLLATERAL TERM SHEET IS NOT COMPLETE AND MAY BE AMENDED PRIOR TO THE TIME OF SALE. THIS TERM SHEET IS NOT AN OFFER TO SELL THESE SECURITIES AND IT IS NOT A SOLICITATION OF AN OFFER TO BUY THESE SECURITIES IN ANY JURISDICTION WHERE THE OFFER OR SALE IS NOT PERMITTED.
88
| Office – CBD | Loan #5 | Cut-off Date Balance: | $38,000,000 | |
| 250 West 57th Street | 250 West 57th Street | Cut-off Date LTV: | 54.5% | |
| New York, NY 10107 | UW NCF DSCR: | 3.49x | ||
| UW NOI Debt Yield: | 11.1% |
Operating History and Underwritten Net Cash Flow. The following table presents certain information relating to the historical operating performance and underwritten net cash flow at the 250 West 57th Street Property:
Cash Flow Analysis(1)
| 2017 | 2018 | 2019 | TTM 6/30/2020 | U/W(2)(3)(4) | %(5) | U/W $ per SF | |
| Base Rent | $26,715,440 | $29,685,939 | $30,865,279 | $30,280,926 | $30,349,547 | 83.9% | $55.82 |
| Rent Steps | 0 | 0 | 0 | 0 | 944,377 | 2.6 | 1.74 |
| SL Rent | 0 | 0 | 0 | 0 | 453,629 | 1.3 | 0.83 |
| Gross Potential Rent | $26,715,440 | $29,685,939 | $30,865,279 | $30,280,926 | $31,747,553 | 87.8% | $58.39 |
| Recoveries | 2,879,551 | 2,644,596 | 3,204,234 | 3,808,372 | 3,724,742 | 10.3 | 6.85 |
| Other Income | 156,376 | 374,306 | 472,969 | 692,603 | 692,603 | 1.9 | 1.27 |
| Net Rental Income | $29,751,367 | $32,704,841 | $34,542,482 | $34,781,901 | $36,164,898 | 100.0% | $66.51 |
| Vacancy | 0 | 0 | 0 | 0 | 0 | 0.0 | 0.00 |
| Effective Gross Income | $29,751,367 | $32,704,841 | $34,542,482 | $34,781,901 | $36,164,898 | 100.0 | $66.51 |
| Real Estate Taxes | 5,946,368 | 6,338,112 | 7,209,415 | 7,876,811 | 6,391,309 | 17.7 | 11.75 |
| Insurance | 269,348 | 272,947 | 281,778 | 289,728 | 350,000 | 1.0 | 0.64 |
| Management Fee | 0 | 0 | 0 | 0 | 0 | 0.0 | 0.00 |
| Other Operating Expenses | 6,646,320 | 6,947,633 | 8,072,826 | 7,350,053 | 9,533,008 | 26.4 | 17.53 |
| Total Operating Expenses | $12,862,036 | $13,558,692 | $15,564,019 | $15,516,592 | $16,274,317 | 45.0% | $29.93 |
| Net Operating Income | $16,889,331 | $19,146,149 | $18,978,463 | $19,265,309 | $19,890,581 | 55.0% | $36.58 |
| Replacement Reserves | 0 | 0 | 0 | 0 | 114,186 | 0.3 | 0.21 |
| TI/LC | 0 | 0 | 0 | 0 | 1,764,049 | 4.9 | 3.24 |
| Net Cash Flow | $16,889,331 | $19,146,149 | $18,978,463 | $19,265,309 | $18,012,345 | 49.8% | $33.13 |
| NOI DSCR(6) | 3.27x | 3.71x | 3.68x | 3.73x | 3.85x | ||
| NCF DSCR(6) | 3.27x | 3.71x | 3.68x | 3.73x | 3.49x | ||
| NOI Debt Yield(6) | 9.4% | 10.6% | 10.5% | 10.7% | 11.1% | ||
| NCF Debt Yield(6) | 9.4% | 10.6% | 10.5% | 10.7% | 10.0% |
| (1) | For the avoidance of doubt, no COVID specific adjustments have been made to the lender underwriting. |
| (2) | U/W Gross Potential Rent is based on the rent roll as of August 1, 2020, with updates received on October 29, 2020, and includes (i) rent steps of $944,377 through December 31, 2021 and (ii) straight-line rent credit of $453,629 for investment grade tenants. |
| (3) | U/W Real Estate Taxes represent the anticipated 2020/2021 abated taxes. See “The Property—Tax Abatement” section above. We cannot assure you that the abatement will be obtained. |
| (4) | U/W Other Operating Expenses includes a 3% management fee, equal to $1,000,000. The 250 West 57th Street Property is self-managed. |
| (5) | Represents (i) percent of Net Rental Income for all revenue fields, (ii) percent of Gross Potential Rent for Vacancy and Concessions & Credit Loss and (iii) percent of Effective Gross Income for all other fields. |
| (6) | Debt service coverage ratios and debt yields are based on the 250 West 57th Street Whole Loan. |
Appraisal. The appraiser concluded to an “as-is” value as of November 1, 2020 of $330,000,000.
Environmental Matters. According to the Phase I environmental site assessment dated October 20, 2020, there was no evidence of any recognized environmental conditions at the 250 West 57th Street Property.
COVID-19 Update. As of January 7, 2021 the 250 West 57th Street Whole Loan is current as of the January debt service payment and is not subject to any forbearance, modification or debt service relief request. As of January 20, 2020, the 250 West 57th Street Borrower has reported that the 250 West 57th Street Property is open and operating, while a few tenants are still closed due to the COVID-19 pandemic, with 90.7% of tenants by occupied NRA and 92.3% of tenants by underwritten base rent having paid their full January 2021 rent payments. As of January 15, 2020, ten tenants (16.2% of NRA and 16.8% of underwritten base rent) at the 250 West 57th Street Property have requested rent relief and five of such tenants (9.4% of NRA and 10.6% of underwritten base rent) have been granted deferrals of rent by the 250 West 57th Street Borrower. Three of the five tenants (6.1% of NRA and 6.6% of underwritten base rent) were granted between 1 and 3 months of deferred rent with repayment over fixed periods. One of the five tenants (3.2% of NRA and 3.9% of underwritten base rent) is in discussions with the 250 West 57th Street Borrower regarding a rent deferral plan. One of the five tenants (0.1% of NRA and 0.1% of underwritten base rent) is paying 25% of its monthly gross sales from April to December 2020 and is required to resume paying fixed rent in January 2021. The borrower confirmed that rent has not yet been collected for this tenant.
Market Overview and Competition. The 250 West 57th Street Property is located in New York, New York on the south side of West 57th Street between Broadway and Eighth Avenue in the West Side office submarket of Midtown Manhattan. The 250 West 57th Street Property is in close proximity to Carnegie Hall, Lincoln Center and Central Park, as well as Columbus Circle. Primary access to the 250 West 57th Street Property is provided by four subway lines at the 57th Street station, one block east, and four additional subway lines at the 59th Street - Columbus Circle subway station, two blocks north. Local arteries include the following streets: Eighth Avenue,
THE INFORMATION IN THIS STRUCTURAL AND COLLATERAL TERM SHEET IS NOT COMPLETE AND MAY BE AMENDED PRIOR TO THE TIME OF SALE. THIS TERM SHEET IS NOT AN OFFER TO SELL THESE SECURITIES AND IT IS NOT A SOLICITATION OF AN OFFER TO BUY THESE SECURITIES IN ANY JURISDICTION WHERE THE OFFER OR SALE IS NOT PERMITTED.
89
| Office – CBD | Loan #5 | Cut-off Date Balance: | $38,000,000 | |
| 250 West 57th Street | 250 West 57th Street | Cut-off Date LTV: | 54.5% | |
| New York, NY 10107 | UW NCF DSCR: | 3.49x | ||
| UW NOI Debt Yield: | 11.1% |
Broadway and 57th Street. The 250 West 57th Street Property is also accessible from both the West Side Highway and FDR Drive. These roadways provide access to all regional and interstate roadways. According to the appraisal, as of the third quarter of 2020, the vacancy rate in the West Side office submarket was approximately 10.8%, with average asking rents of $79.57 PSF and inventory of approximately 31.0 million SF. According to the appraisal, as of the third quarter of 2020, the vacancy rate in the Midtown office market was approximately 10.6%, with average asking rents of $82.97 PSF and inventory of approximately 248.4 million SF.
The following table presents certain information relating to the appraisal’s market rent conclusion for the 250 West 57th Street Property:
Market Rent Summary
| Market Rent (PSF) | Lease Term (Years) | Lease Type (Reimbursements) | Rent Increase Projection | |
| Office (Floors 4-10) | $61.00 | 10 (major); 5 (minor) | Modified Gross | 10.0% year 5 (major); 5.0% year 4 (minor) |
| Office (Floors 11-19) | $66.00 | 10 (major); 5 (minor) | Modified Gross | 10.0% year 5 (major); 5.0% year 4 (minor) |
| Office (Floors 20-26) | $71.00 | 10 (major); 5 (minor) | Modified Gross | 10.0% year 5 (major); 5.0% year 4 (minor) |
| Retail (Inline) | $300.00 | 10 | Modified Gross | 3.0% annually |
| Retail (Corner) | $350.00 | 10 | Modified Gross | 3.0% annually |
| Retail (Floors 2-3) | $75.00 | 10 | Modified Gross | 3.0% annually |
| Retail (Interior) | $50.00 | 10 | Modified Gross | 3.0% annually |
| Retail (Lower Level) | $35.00 | 10 | Modified Gross | 3.0% annually |
| Storage | $35.00 | 10 | Modified Gross | 10.0% year 5 |
Source: Appraisal.
The following table presents comparable office leases with respect to the 250 West 57th Street Property:
Comparable Office Lease Summary
| Property/Location | Year Built | SF | Tenant Name | Size (SF) | Lease Date | Rent PSF | Lease Type |
114 W. 41st Street New York, NY | 1915 | 261,000 | Spring Fertility Clinic | 31,862 | 8/1/2020 | $70.00 | Modified Gross |
1501 Broadway New York, NY | 1926 | 508,812 | American Academy McAllister Institute | 10,500 | 6/1/2020 | $50.00 | Modified Gross |
1411 Broadway New York, NY | 1969 | 914,000 | Screenvision | 25,000 | 4/1/2020 | $77.65 | Modified Gross |
135 West 50th Street New York, NY | 1964 | 687,568 | Industrious | 36,853 | 2/1/2020 | $52.00 | Gross |
1330 Avenue of the Americas New York, NY | 1965 | 415,000 | Hunt Companies | 10,400 | 2/1/2020 | $88.00 | Modified Gross |
1350 Avenue of the Americas | 1966 | 424,000 | The Mark Foundation for Cancer Research | 4,325 | 2/1/2020 | $86.00 | Gross |
1411 Broadway New York, NY | 1969 | 914,000 | TruMid Financial | 12,771 | 1/1/2020 | $76.00 | Modified Gross |
311 West 43rd Street New York, NY | 1905 | 155,000 | Amnesty International | 12,208 | 12/1/2019 | $63.00 | Modified Gross |
Source: Appraisal.
THE INFORMATION IN THIS STRUCTURAL AND COLLATERAL TERM SHEET IS NOT COMPLETE AND MAY BE AMENDED PRIOR TO THE TIME OF SALE. THIS TERM SHEET IS NOT AN OFFER TO SELL THESE SECURITIES AND IT IS NOT A SOLICITATION OF AN OFFER TO BUY THESE SECURITIES IN ANY JURISDICTION WHERE THE OFFER OR SALE IS NOT PERMITTED.
90
| Office – CBD | Loan #5 | Cut-off Date Balance: | $38,000,000 | |
| 250 West 57th Street | 250 West 57th Street | Cut-off Date LTV: | 54.5% | |
| New York, NY 10107 | UW NCF DSCR: | 3.49x | ||
| UW NOI Debt Yield: | 11.1% |
The following table presents comparable retail leases with respect to the 250 West 57th Street Property:
Comparable Retail Lease Summary
| Property/Location | Year Built | SF | Tenant Name | Size (SF) | Lease Date | Rent PSF | Lease Type |
1796 Broadway New York, NY | 1941 | 387,428 | Venchi | 801 | 8/1/2020 | $375.00 | Modified Gross |
973 Eighth Avenue New York, NY | 1987 | 257,885 | Dunkin | 1,100 | 3/1/2020 | $245.00 | Modified Gross |
1740 Broadway New York, NY | 1950 | 519,600 | Sweetgreen | 2,706 | 2/1/2020 | $215.00 | Modified Gross |
934 Eighth Avenue New York, NY | 1930 | 5,210 | Popeyes | 1,100 | 1/1/2020 | $225.00 | Modified Gross |
1695 Broadway New York, NY | 1925 | 16,500 | Fle Fle Grill | 1,200 | 11/1/2019 | $300.00 | Modified Gross |
1804 Broadway New York, NY | 1941 | 387,428 | Lenscrafters | 1,375 | 9/1/2019 | $380.00 | Modified Gross |
1700 Broadway New York, NY | 1968 | 596,559 | Shake Shack | 2,009 | 6/1/2019 | $308.00 | Modified Gross |
871 Eighth Avenue New York, NY | 1942 | 59,701 | Just Baked | 520 | 3/1/2019 | $415.00 | Modified Gross |
Source: Appraisal.
Escrows.
Taxes – The 250 West 57th Street Whole Loan documents provide for an upfront reserve of approximately $3,841,605 for real estate taxes and ongoing monthly deposits into a reserve for real estate taxes in an amount equal to 1/12 of the real estate taxes that the lender estimates will be payable during the next twelve months for the 250 West 57th Street Property (initially $768,321).
Insurance – The 250 West 57th Street Whole Loan documents provide for monthly deposits into a reserve for insurance premiums in an amount equal to 1/12 of the insurance premiums that the lender estimates will be payable for the renewal of coverage upon the expiration of the insurance policies; provided that such monthly deposits are not required so long as (i) no event of default is continuing, (ii) the liability and casualty insurance coverage for the 250 West 57th Street Property is included in a blanket policy approved by the lender in its reasonable discretion, and (iii) the 250 West 57th Street Borrower provides the lender with evidence of payment of the insurance premiums and renewals of the insurance policies, no later than ten days prior to the expiration of the current policy.
Replacement Reserve – During a Debt Yield Reserve Trigger Period (as defined below), the 250 West 57th Street Whole Loan documents provide for monthly deposits of approximately $9,543 into a reserve for approved capital expenditures, provided that such deposits are not required if such deposits would cause the amount then on deposit in such reserve to exceed $458,058. However, such deposits are required to resume when (i) a Debt Yield Reserve Trigger Period is continuing and (ii) the balance in such reserve is less than $458,058. “Debt Yield Reserve Trigger Period” means a period (a) commencing upon the debt yield being less than 8.5% at the end of any calendar quarter and (b) expiring upon the debt yield being equal to or greater than 8.5% at the end of any calendar quarter.
TI/LC Reserve – The 250 West 57th Street Whole Loan documents provide for an upfront reserve of $859,958 for outstanding unfunded tenant improvements and/or leasing commissions. During a Debt Yield Reserve Trigger Period, the 250 West 57th Street Whole Loan documents provide for monthly deposits of approximately $90,885 for future tenant improvements and leasing commissions, provided that such deposits are not required if such deposits would cause the amount then on deposit in such reserve to exceed $4,362,456. However, such deposits are required to resume when (i) a Debt Yield Reserve Trigger Period is continuing and (ii) the balance in such reserve falls below $4,362,456.
Free Rent Reserve – The 250 West 57th Street Whole Loan documents provide for an upfront reserve of approximately $4,194,083 for future rent credits or abatements granted to three tenants at the 250 West 57th Street Property, including RZO LLC, The Icahn School of Medicine and Concord Music. In addition, in the event that the landlord work for the tenant Concord Music is not completed by November 30, 2020, the 250 West 57th Street Borrower is required, at the lender’s request following the rent commencement date, to deposit the amount of any additional rent abatements due to Concord Music into the free rent reserve.
Lockbox and Cash Management. The 250 West 57th Street Whole Loan is structured with a hard lockbox and in place cash management. The 250 West 57th Street Borrower is required to direct each tenant of the 250 West 57th Street Property to deposit all rents directly into the lockbox account, and to deposit any funds received by the 250 West 57th Street Borrower and property manager, notwithstanding such direction, into the lockbox account within two business days of receipt. On each business day, all funds in the lockbox account are required to be transferred to a lender-controlled cash management account. Provided no event of default under the 250 West 57th Street Whole Loan documents is continuing, all funds in the cash management account are required to be applied on each monthly payment date: (i) to make the monthly deposits into the real estate tax and insurance reserves as described above under “Escrows,” (ii) to pay debt service on the 250 West 57th Street Whole Loan, (iii) to make the required monthly deposit, if any, into the replacement reserve as described above under “Escrows,” (iv) to make the required monthly deposit, if any, into the Rollover (TI/LC) Funds reserve as described above, (v) during a Cash Sweep Event Period (as defined below), to pay operating expenses set
THE INFORMATION IN THIS STRUCTURAL AND COLLATERAL TERM SHEET IS NOT COMPLETE AND MAY BE AMENDED PRIOR TO THE TIME OF SALE. THIS TERM SHEET IS NOT AN OFFER TO SELL THESE SECURITIES AND IT IS NOT A SOLICITATION OF AN OFFER TO BUY THESE SECURITIES IN ANY JURISDICTION WHERE THE OFFER OR SALE IS NOT PERMITTED.
91
| Office – CBD | Loan #5 | Cut-off Date Balance: | $38,000,000 | |
| 250 West 57th Street | 250 West 57th Street | Cut-off Date LTV: | 54.5% | |
| New York, NY 10107 | UW NCF DSCR: | 3.49x | ||
| UW NOI Debt Yield: | 11.1% |
forth in the annual budget (which is required to be reasonably approved by the lender during a Cash Sweep Event Period) and lender-approved extraordinary expenses, and (vi) to disburse any remainder in the following order of priority: (a) during a Cash Sweep Event Period, into an excess cash flow subaccount to be held as additional security for the 250 West 57th Street Whole Loan during such Cash Sweep Event Period, and (b) to the extent that no Cash Sweep Event Period is continuing, to the 250 West 57th Street Borrower.
“Cash Sweep Event Period” means a period:
| (i) | commencing upon an event of default under the 250 West 57th Street Whole Loan documents and ending upon the cure, if applicable, of such event of default; or |
| (ii) | commencing upon the debt yield on the 250 West 57th Street Whole Loan falling below 6.5% for two consecutive calendar quarters (a “Debt Yield Event”), and ending on the date the debt yield equals or exceeds 6.5% for two consecutive calendar quarters. |
The 250 West 57th Street Borrower may cure a Debt Yield Event by depositing with the lender cash or a letter of credit in an amount which, if applied to reduce the outstanding principal balance of the 250 West 57th Street Whole Loan, would cause the debt yield to be equal to or greater than 6.5% for two consecutive calendar quarters, as described above.
Property Management. The 250 West 57th Street Property is managed by ESRT Management, L.L.C., an affiliate of the 250 West 57th Street Borrower.
Partial Release. Not permitted.
Real Estate Substitution. Not permitted.
Subordinate and Mezzanine Indebtedness. None.
Letter of Credit. The 250 West 57th Street Borrower has the right, but not the obligation, to end a Cash Sweep Event Period commenced in connection with a Debt Yield Event by depositing with the lender a letter of credit in an amount which would cause the debt yield to be equal to or greater than 6.5% for two consecutive calendar quarters, as described above.
Right of First Offer / Right of First Refusal. None.
Ground Lease. None.
Terrorism Insurance. The 250 West 57th Street Borrower is required to obtain and maintain an “all risk” property insurance policy that covers perils of terrorism and acts of terrorism in an amount equal to the “full replacement cost” of the 250 West 57th Street Property together with business income insurance covering not less than the 18-month period commencing at the time of loss, together with an extended period of indemnity endorsement of up to twelve months. Notwithstanding the foregoing, for so long as the Terrorism Risk Insurance Act of 2002, as extended and modified by the Terrorism Risk Insurance Program Reauthorization Act of 2015 (“TRIPRA”), is in effect (including any extensions thereof or if another federal governmental program is in effect relating to “acts of terrorism” which provides substantially similar protections as TRIPRA), the lender is required to accept terrorism insurance which insures against “covered acts” as defined by TRIPRA (or such other program) as full compliance with the loan documents, but only in the event that TRIPRA (or such other program) continues to cover both domestic and foreign acts of terrorism. See “Risk Factors—Risks Relating to the Whole Loans—Terrorism Insurance May Not Be Available for All Mortgaged Properties” in the Preliminary Prospectus.
THE INFORMATION IN THIS STRUCTURAL AND COLLATERAL TERM SHEET IS NOT COMPLETE AND MAY BE AMENDED PRIOR TO THE TIME OF SALE. THIS TERM SHEET IS NOT AN OFFER TO SELL THESE SECURITIES AND IT IS NOT A SOLICITATION OF AN OFFER TO BUY THESE SECURITIES IN ANY JURISDICTION WHERE THE OFFER OR SALE IS NOT PERMITTED.
92
(THIS PAGE INTENTIONALLY LEFT BLANK)
THE INFORMATION IN THIS STRUCTURAL AND COLLATERAL TERM SHEET IS NOT COMPLETE AND MAY BE AMENDED PRIOR TO THE TIME OF SALE. THIS TERM SHEET IS NOT AN OFFER TO SELL THESE SECURITIES AND IT IS NOT A SOLICITATION OF AN OFFER TO BUY THESE SECURITIES IN ANY JURISDICTION WHERE THE OFFER OR SALE IS NOT PERMITTED.
93
| Property Types – Various | Loan #6 | Cut-off Date Balance: | $37,564,000 | |
| Property Addresses – Various | ExchangeRight REIT 2 | Cut-off Date LTV: | 63.0% | |
| U/W NCF DSCR: | 2.61x | |||
| U/W NOI Debt Yield: | 9.3% |
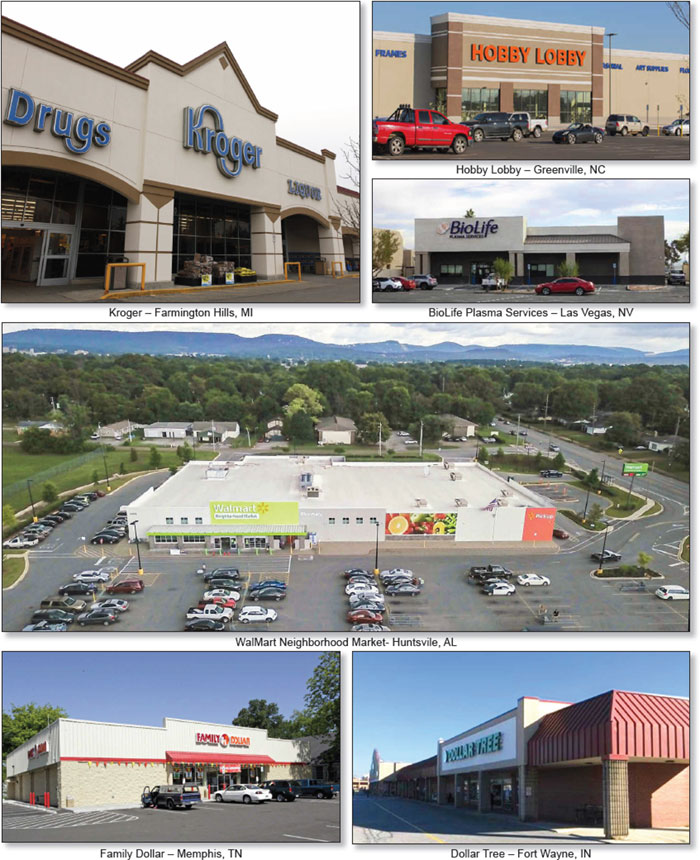
THE INFORMATION IN THIS STRUCTURAL AND COLLATERAL TERM SHEET IS NOT COMPLETE AND MAY BE AMENDED PRIOR TO THE TIME OF SALE. THIS TERM SHEET IS NOT AN OFFER TO SELL THESE SECURITIES AND IT IS NOT A SOLICITATION OF AN OFFER TO BUY THESE SECURITIES IN ANY JURISDICTION WHERE THE OFFER OR SALE IS NOT PERMITTED.
94
| Property Types – Various | Loan #6 | Cut-off Date Balance: | $37,564,000 | |
| Property Addresses – Various | ExchangeRight REIT 2 | Cut-off Date LTV: | 63.0% | |
| U/W NCF DSCR: | 2.61x | |||
| U/W NOI Debt Yield: | 9.3% |
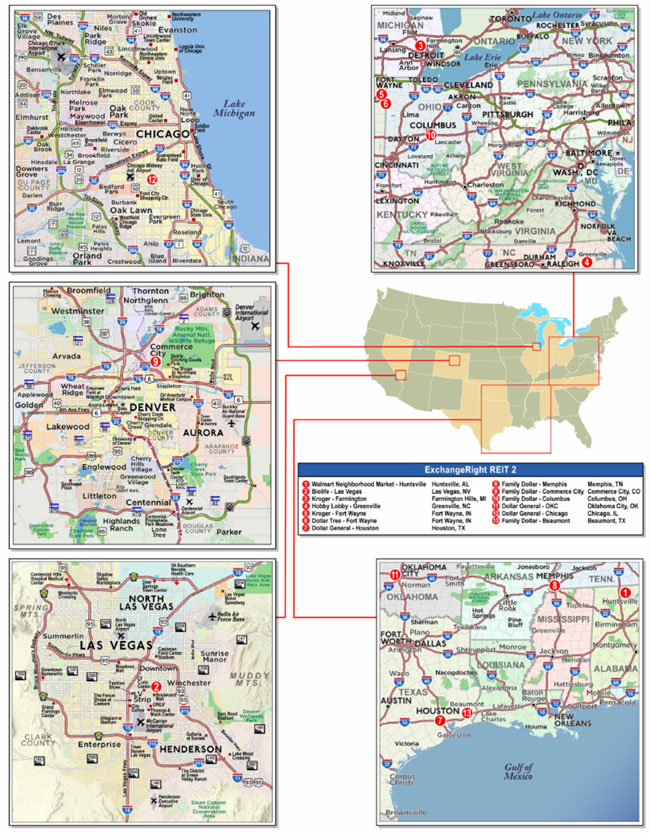
THE INFORMATION IN THIS STRUCTURAL AND COLLATERAL TERM SHEET IS NOT COMPLETE AND MAY BE AMENDED PRIOR TO THE TIME OF SALE. THIS TERM SHEET IS NOT AN OFFER TO SELL THESE SECURITIES AND IT IS NOT A SOLICITATION OF AN OFFER TO BUY THESE SECURITIES IN ANY JURISDICTION WHERE THE OFFER OR SALE IS NOT PERMITTED.
95
| No. 6 – ExchangeRight REIT 2 | |||||||
| Mortgage Loan Information | Mortgaged Property Information | ||||||
| Mortgage Loan Seller: | Wells Fargo Bank, National Association | Single Asset/Portfolio: | Portfolio | ||||
| Credit Assessment (Fitch/KBRA/S&P): | NR/NR/NR | Property Type – Subtype: | Various – See Table | ||||
| Original Principal Balance: | $37,564,000 | Location: | Various – See Table | ||||
| Cut-off Date Balance: | $37,564,000 | Size: | 289,623 SF | ||||
| % of Initial Pool Balance: | 4.1% | Cut-off Date Balance Per SF:
| $129.70 | ||||
| Loan Purpose(1): | Acquisition/Refinance | Maturity Date Balance Per SF: | $129.70 | ||||
| Borrower Sponsors: | David Fisher; Joshua Ungerecht; Warren Thomas | Year Built/Renovated: | Various – See Table | ||||
| Guarantors: | David Fisher; Joshua Ungerecht; Warren Thomas | Title Vesting: | Fee | ||||
| Mortgage Rate: | 3.4520% | Property Manager: | Self-managed | ||||
| Note Date: | December 24, 2020 | Current Occupancy (As of): | 100.0% (2/1/2021) | ||||
| Seasoning: | 1 month | YE 2019 Occupancy(3): | NAV | ||||
| Maturity Date: | January 11, 2031 | YE 2018 Occupancy(3): | NAV | ||||
| IO Period: | 120 months | YE 2017 Occupancy(3): | NAV | ||||
| Loan Term (Original): | 120 months | YE 2016 Occupancy(3): | NAV | ||||
| Amortization Term (Original): | NAP | As-Is Appraised Value(4)(5): | $59,660,000 | ||||
| Loan Amortization Type: | Interest-only, Balloon | As-Is Appraisal Value Per SF(4)(5): | $205.99 | ||||
| Call Protection: | L(25),D(91),O(4) | As-Is Appraisal Valuation Date(6): | Various | ||||
| Lockbox Type: | Hard/Springing Cash Management | Underwriting and Financial Information(4) | |||||
| Additional Debt: | None | YE 2019 NOI(3): | NAV | ||||
| Additional Debt Type (Balance): | NAP | YE 2018 NOI(3): | NAV | ||||
| YE 2017 NOI(3): | NAV | ||||||
| YE 2016 NOI(3): | NAV | ||||||
| U/W Revenues: | $4,390,361 | ||||||
| Escrows and Reserves(2) | U/W Expenses: | $880,880 | |||||
| Initial | Monthly | Cap | U/W NOI: | $3,509,481 | |||
| Taxes | $149,361 | $36,036 | NAP | U/W NCF: | $3,425,500 | ||
| Insurance | $0 | Springing | NAP | U/W DSCR based on NOI/NCF: | 2.67x / 2.61x | ||
| Replacement Reserves | $0 | $4,130 | $148,695(2) | U/W Debt Yield based on NOI/NCF: | 9.3% / 9.1% | ||
| TI/LC Reserve | $500,000 | $18,101 | $250,000 | U/W Debt Yield at Maturity based on NOI/NCF: | 9.3% / 9.1% | ||
| Deferred Maintenance | $72,301 | $0 | NAP | Cut-off Date LTV Ratio: | 63.0% | ||
| Tenant Specific TI/LC | $75,000 | $0 | NAP | LTV Ratio at Maturity: | 63.0% | ||
| Sources and Uses | ||||||||
| Sources | Uses | |||||||
| Original loan amount | $37,564,000 | 59.3% | Purchase price(1) | $61,860,151 | 97.7% | |||
| Cash equity contribution | 25,756,466 | 40.7 | Reserves | 796,662 | 1.3 | |||
| Closing Costs | 663,653 | 1.0 | ||||||
| Total Sources | $63,320,466 | 100.0% | Total Uses | $63,320,466 | 100.0% | |||
| (1) | Seven of the ExchangeRight REIT 2 Properties (as defined below) were acquired from an affiliate of the borrower in September 2019 for $11,469,922, while the remaining six properties were acquired from unaffiliated third parties between April 2020 and December 2020 for $50,390,230. |
| (2) | See “Escrows” section. |
| (3) | Historical occupancy and NOI are unavailable, as the ExchangeRight REIT 2 Properties were acquired by the borrower between September 2019 and December 2020, and such information was not provided by the seller. |
| (4) | While the ExchangeRight REIT 2 Mortgage Loan (as defined below) was originated after the emergence of the novel coronavirus pandemic and the economic disruption resulting from measures to combat the pandemic, the pandemic is an evolving situation and could impact the ExchangeRight REIT 2 Mortgage Loan more severely than assumed in the underwriting of the ExchangeRight REIT 2 Mortgage Loan and could adversely affect the NOI, NCF and occupancy information, as well as the appraised value and the DSCR, LTV and Debt Yield metrics presented above. See “Risk Factors—Risks Related to Market Conditions and Other External Factors—The Coronavirus Pandemic Has Adversely Affected the Global Economy and Will Likely Adversely Affect the Performance of the Mortgage Loans” in the Preliminary Prospectus. |
| (5) | Three properties (Kroger – Fort Wayne, Dollar Tree – Fort Wayne, and Kroger – Farmington Hills) are situated within larger retail centers that are owned by the borrower; however, the shop space at each of these centers is master leased to an affiliate of the borrower, each under a 50-year space lease executed in 2020 with an annual rental rate of $1 for the remainder of the lease term. The borrower-affiliated entity subleases the shop space to the existing tenants and will receive all cash flow from the shop spaces. The appraisals for these three properties included the master leased shop space; however, the value attributed to such master leased shop space is excluded from the appraised values represented herein. |
| (6) | The individual appraisals are dated between October 7, 2020 and December 16, 2020. |
The Mortgage Loan. The mortgage loan (the “ExchangeRight REIT 2 Mortgage Loan”) is evidenced by a single promissory note in the original principal amount of $37,564,000 and secured by the fee interests in 12 single tenant retail properties and one single tenant medical office property totaling 289,623 square feet (the “ExchangeRight REIT 2 Properties”) located across 11 states.
THE INFORMATION IN THIS STRUCTURAL AND COLLATERAL TERM SHEET IS NOT COMPLETE AND MAY BE AMENDED PRIOR TO THE TIME OF SALE. THIS TERM SHEET IS NOT AN OFFER TO SELL THESE SECURITIES AND IT IS NOT A SOLICITATION OF AN OFFER TO BUY THESE SECURITIES IN ANY JURISDICTION WHERE THE OFFER OR SALE IS NOT PERMITTED.
96
| Property Types – Various | Loan #6 | Cut-off Date Balance: | $37,564,000 | |
| Property Addresses – Various | ExchangeRight REIT 2 | Cut-off Date LTV: | 63.0% | |
| U/W NCF DSCR: | 2.61x | |||
| U/W NOI Debt Yield: | 9.3% |
The Borrower and Borrower Sponsor. The borrower is ExchangeRight Essential Income Strategy Properties 2, LLC, a Delaware limited liability company and single purpose entity with at least one independent director. Legal counsel to the borrower delivered a non-consolidation opinion in connection with the origination of the ExchangeRight REIT 2 Mortgage Loan. The borrower sponsors and non-recourse carveout guarantors are David Fisher, Joshua Ungerecht, and Warren Thomas, the same sponsors as for the ExchangeRight Net Leased Portfolio #42 mortgage loan and ExchangeRight Net Leased Portfolio #41 mortgage loan, all of whom serve as managing partners of ExchangeRight Real Estate, LLC. ExchangeRight Real Estate, LLC has more than 13 million square feet under management across over 775 properties across 38 states with a focus on investment grade, necessity-based retail and healthcare. Warren Thomas was subject to a foreclosure sale in November 2009. See “Description of the Mortgage Pool—Loan Purpose; Default History, Bankruptcy Issues and Other Proceedings” in the Preliminary Prospectus.
COVID-19 Update. As of January 7, 2021, all of the ExchangeRight REIT 2 Properties are open and operating. All tenants have remained current on all rent and lease obligations through and including January 2021. The first debt service payment is due on February 11, 2021, and, as of January 7, 2021, the ExchangeRight REIT 2 Mortgage Loan is not subject to any forbearance, modification or debt service relief request.
The Properties. The ExchangeRight REIT 2 Properties comprise 12 single tenant retail properties and one single tenant medical office property totaling 289,623 square feet and located across 11 states. The ExchangeRight REIT 2 Properties are located in Indiana (two properties, 24.4% of net rentable area), North Carolina (one property, 19.0% of net rentable area), Michigan (one property, 15.2% of net rentable area), Alabama (one property, 14.5% of net rentable area), and Texas (two properties, 6.4% of net rentable area), with the six remaining properties located in Nevada, Illinois, Tennessee, Oklahoma, Ohio, and Colorado. Built between 1954 and 2016 with four properties renovated between 1999 and 2020, the ExchangeRight REIT 2 Properties range in size from 8,017 square feet to 60,782 square feet. Ten of the 13 properties, representing 82.9% of underwritten base rent, were built or renovated since 2011. Three properties (Kroger – Fort Wayne; Dollar Tree – Fort Wayne; and Kroger – Farmington Hills) are situated within larger retail centers that are owned by the borrower; however, the shop space at each of these centers is master leased to an affiliate of the borrower, each under a 50-year space lease executed in 2020 with an annual rental rate of $1 for the remainder of the lease term. The borrower-affiliated entity subleases the shop space to the existing tenants and will receive all cash flow from the shop spaces, thus the shop space income was not considered in the lender’s underwriting of the ExchangeRight REIT 2 Mortgage Loan.
The ExchangeRight REIT 2 Properties are leased to seven nationally recognized tenants, six of which, representing 86.4% of underwritten base rent, are investment grade-rated entities or subsidiaries of investment grade-rated entities. Five of the ExchangeRight REIT 2 Properties, representing 75.9% of underwritten base rent, have leases expiring after the stated maturity date of the ExchangeRight REIT 2 Mortgage Loan. One tenant (BioLife Plasma Services – Las Vegas) has a termination option, which is detailed on the table below.
THE INFORMATION IN THIS STRUCTURAL AND COLLATERAL TERM SHEET IS NOT COMPLETE AND MAY BE AMENDED PRIOR TO THE TIME OF SALE. THIS TERM SHEET IS NOT AN OFFER TO SELL THESE SECURITIES AND IT IS NOT A SOLICITATION OF AN OFFER TO BUY THESE SECURITIES IN ANY JURISDICTION WHERE THE OFFER OR SALE IS NOT PERMITTED.
97
| Property Types – Various | Loan #6 | Cut-off Date Balance: | $37,564,000 | |
| Property Addresses – Various | ExchangeRight REIT 2 | Cut-off Date LTV: | 63.0% | |
| U/W NCF DSCR: | 2.61x | |||
| U/W NOI Debt Yield: | 9.3% |
The following table presents certain information relating to the ExchangeRight REIT 2 Properties.
Properties Summary
Tenant Name City, State | Year Built/ Renovated | Tenant NRSF | %of Portfolio NRSF | Appraised Value | % of Portfolio Appraised Value | Annual U/W Base Rent PSF | % of Annual U/W Base Rent | Lease Expiration Date | Renewal Options | Term. Option? |
| Walmart Neighborhood Market Huntsville, AL | 2016/NAP | 41,951 | 14.5% | 12,650,000 | 21.2% | $17.61 | 19.2% | 10/4/2031 | 17x5 yrs. | N |
BioLife Plasma Services Las Vegas, NV | 1999/2020 | 15,450 | 5.3% | 11,100,000 | 18.6% | $43.09 | 17.3% | 11/30/2035 | 3x5 yrs. | Y(1) |
Kroger Farmington Hills, MI | 1972/2017 | 43,909 | 15.2% | 9,400,000 | 15.8% | $12.58 | 14.4% | 4/30/2034 | 8x5 yrs. | N |
Hobby Lobby Greenville, NC | 2016/NAP | 55,060 | 19.0% | 8,150,000 | 13.7% | $9.49 | 13.6% | 5/31/2031 | 3x5 yrs. | N |
Kroger Fort Wayne, IN | 1988/1999 | 60,782 | 21.0% | 7,570,000 | 12.7% | $7.26 | 11.5% | 4/30/2034 | 8x5 yrs. | N |
Dollar Tree Fort Wayne, IN | 1988/1999 | 10,000 | 3.5% | 1,490,000 | 2.5% | $10.50 | 2.7% | 10/31/2027 | 3x5 yrs. | N |
Dollar General Houston, TX | 2011/NAP | 8,373 | 2.9% | 1,450,000 | 2.4% | $16.13 | 3.5% | 6/30/2022 | 5x5 yrs. | N |
Family Dollar Commerce City, CO | 1999/NAP | 8,017 | 2.8% | 1,450,000 | 2.4% | $13.67 | 2.8% | 6/30/2023 | 5x5 yrs. | N |
Family Dollar Memphis, TN | 2012/NAP | 9,255 | 3.2% | 1,450,000 | 2.4% | $13.20 | 3.2% | 12/31/2025 | 6x5 yrs. | N |
Dollar General Oklahoma City, OK | 2012/NAP | 8,549 | 3.0% | 1,300,000 | 2.2% | $13.02 | 2.9% | 9/30/2022 | 5x5 yrs. | N |
Family Dollar Columbus, OH | 2011/NAP | 8,505 | 2.9% | 1,300,000 | 2.2% | $14.53 | 3.2% | 1/31/2022 | 4x5 yrs. | N |
Dollar General Chicago, IL | 1954/2012 | 9,692 | 3.3% | 1,250,000 | 2.1% | $14.19 | 3.6% | 2/28/2022 | 3x5 yrs. | N |
Family Dollar Beaumont, TX | 2011/NAP | 10,080 | 3.5% | 1,100,000 | 1.8% | $8.18 | 2.1% | 1/31/2026 | 5x5 yrs. | N |
| Total/Weighted Average | 289,623 | 100.0% | $59,660,000 | 100.0% | $13.28 | 100.0% |
| (1) | BioLife Plasma Services has the right to terminate its lease at any time along with a termination fee in an amount equal to the net present value of the total rent and CAM due over the remaining lease term. |
The following table presents certain information relating to the major tenants at the ExchangeRight REIT 2 Properties:
Major Tenants
| Tenant Name | Credit Rating (Fitch/Moody’s/S&P)(1) | No of Prop. | Tenant NRSF | % of NRSF | Annual U/W Base Rent(2) | Annual U/W Base Rent PSF(2) | % of Total Annual U/W Base Rent |
| Major Tenants | |||||||
| Kroger | NR / Baa1 / BBB | 2 | 104,691 | 36.1% | $993,853 | $9.49 | 25.8% |
| Walmart Neighborhood Market | AA / Aa2 / AA | 1 | 41,951 | 14.5% | $738,640(3) | $17.61(3) | 19.2% |
| BioLife Plasma Services | NR / Baa2 / NR | 1 | 15,450 | 5.3% | $665,763(3) | $43.09(3) | 17.3% |
| Hobby Lobby | NR / NR / NR | 1 | 55,060 | 19.0% | $522,500 | $9.49 | 13.6% |
| Family Dollar | NR / Baa2 / NR | 4 | 35,857 | 12.4% | $437,834 | $12.21 | 11.4% |
| Dollar General | NR / Baa2 / BBB | 3 | 26,614 | 9.2% | $383,876 | $14.42 | 10.0% |
| Dollar Tree | NR / Baa2 / BBB | 1 | 10,000 | 3.5% | $105,000 | $10.50 | 2.7% |
| Total Major Tenants | 13 | 289,623 | 100.0% | $3,847,466 | $13.28 | 100.0% | |
| Vacant Space | 0 | 0.0% | |||||
| Collateral Total | 289,623 | 100.0% | |||||
| (1) | Certain ratings are those of the parent company whether or not the parent company guarantees the lease. |
| (2) | Annual U/W Base Rent and Annual U/W Base Rent PSF include contractual rent increases through December 2021 totalling $55,606. |
| (3) | The lender applied straight-line rent averaging credit for Walmart Neighborhood Market and BioLife Plasma Services separately from the underwritten base rent shown in the table above. See “Cash Flow Analysis” section below. |
THE INFORMATION IN THIS STRUCTURAL AND COLLATERAL TERM SHEET IS NOT COMPLETE AND MAY BE AMENDED PRIOR TO THE TIME OF SALE. THIS TERM SHEET IS NOT AN OFFER TO SELL THESE SECURITIES AND IT IS NOT A SOLICITATION OF AN OFFER TO BUY THESE SECURITIES IN ANY JURISDICTION WHERE THE OFFER OR SALE IS NOT PERMITTED.
98
| Property Types – Various | Loan #6 | Cut-off Date Balance: | $37,564,000 | |
| Property Addresses – Various | ExchangeRight REIT 2 | Cut-off Date LTV: | 63.0% | |
| U/W NCF DSCR: | 2.61x | |||
| U/W NOI Debt Yield: | 9.3% |
The following table presents certain information relating to the historical sales at the ExchangeRight REIT 2 Properties:
Historical Sales(1)
| 2018 Sales (PSF) | 2019 Sales (PSF) | TTM Sales (PSF) | TTM Period | Occupancy Cost(2) | |
| Kroger – Farmington Hills | $763 | $762 | NAV | NAP | 2.4% |
| Kroger – Fort Wayne | $663 | $648 | NAV | NAP | 1.7% |
| Dollar General – Houston | NAV | $200 | $198 | Jun-2020 | 9.4% |
| Family Dollar – Commerce City | $164 | $159 | $159 | Jun-2020 | 11.0% |
| Family Dollar – Memphis | $223 | $212 | $180 | Mar-2020 | 9.8% |
| Family Dollar – Columbus | $246 | $146 | $169 | Jan-2020 | 11.3% |
| Family Dollar – Beaumont | $174 | $157 | $166 | Jan-2020 | 6.0% |
| (1) | Information obtained from the borrower. |
| (2) | Occupancy cost is based on the underwritten base rent and reimbursements divided by most recently reported sales. |
The following table presents certain information relating to the lease expiration schedule at the ExchangeRight REIT 2 Properties:
Lease Expiration Schedule(1)(2)
| Year Ending December 31, | No. of Leases Expiring | Expiring NRSF | % of Total NRSF | Cumulative Expiring NRSF | Cumulative % of Total NRSF | Annual U/W Base Rent | % of Total Annual U/W Base Rent | Annual U/W Base Rent PSF |
| MTM | 0 | 0 | 0.0% | 0 | 0.0% | $0 | 0.0% | $0.00 |
| 2021 | 0 | 0 | 0.0% | 0 | 0.0% | $0 | 0.0% | $0.00 |
| 2022 | 4 | 35,119 | 12.1% | 35,119 | 12.1% | $507,432 | 13.2% | $14.45 |
| 2023 | 1 | 8,017 | 2.8% | 43,136 | 14.9% | $109,578 | 2.8% | $13.67 |
| 2024 | 0 | 0 | 0.0% | 43,136 | 14.9% | $0 | 0.0% | $0.00 |
| 2025 | 1 | 9,255 | 3.2% | 52,391 | 18.1% | $122,200 | 3.2% | $13.20 |
| 2026 | 1 | 10,080 | 3.5% | 62,471 | 21.6% | $82,500 | 2.1% | $8.18 |
| 2027 | 1 | 10,000 | 3.5% | 72,471 | 25.0% | $105,000 | 2.7% | $10.50 |
| 2028 | 0 | 0 | 0.0% | 72,471 | 25.0% | $0 | 0.0% | $0.00 |
| 2029 | 0 | 0 | 0.0% | 72,471 | 25.0% | $0 | 0.0% | $0.00 |
| 2030 | 0 | 0 | 0.0% | 72,471 | 25.0% | $0 | 0.0% | $0.00 |
| 2031 | 2 | 97,011 | 33.5% | 169,482 | 58.5% | $1,261,140 | 32.8% | $13.00 |
| Thereafter | 3 | 120,141 | 41.5% | 289,623 | 100.0% | $1,659,616 | 43.1% | $13.81 |
| Vacant | 0 | 0 | 0.0% | 289,623 | 100.0% | $0 | 0.0% | $0.00 |
| Total/Weighted Average | 13 | 289,623 | 100.0% | $3,847,466 | 100.0% | $13.28 |
| (1) | Information obtained from the underwritten rent roll. |
| (2) | Certain tenants may have lease termination options that are exercisable prior to the originally stated expiration date of the related lease and are not considered in the lease expiration schedule. |
The following table presents historical occupancy percentages at the ExchangeRight REIT 2 Properties:
Historical Occupancy
12/31/2016(1) | 12/31/2017(1) | 12/31/2018(1) | 12/31/2019(1) | 2/1/2021(2) |
| NAV | NAV | NAV | NAV | 100.0% |
| (1) | Historical occupancy information is not available, as the ExchangeRight REIT 2 Properties were acquired by the borrower between September 2019 and December 2020, and such information was not provided by the seller. |
| (2) | Information obtained from the underwritten rent roll. |
THE INFORMATION IN THIS STRUCTURAL AND COLLATERAL TERM SHEET IS NOT COMPLETE AND MAY BE AMENDED PRIOR TO THE TIME OF SALE. THIS TERM SHEET IS NOT AN OFFER TO SELL THESE SECURITIES AND IT IS NOT A SOLICITATION OF AN OFFER TO BUY THESE SECURITIES IN ANY JURISDICTION WHERE THE OFFER OR SALE IS NOT PERMITTED.
99
| Property Types – Various | Loan #6 | Cut-off Date Balance: | $37,564,000 | |
| Property Addresses – Various | ExchangeRight REIT 2 | Cut-off Date LTV: | 63.0% | |
| U/W NCF DSCR: | 2.61x | |||
| U/W NOI Debt Yield: | 9.3% |
Underwritten Net Cash Flow. The following table presents certain information relating to the underwritten net cash flow at the ExchangeRight REIT 2 Properties:
Cash Flow Analysis(1)
| U/W | %(2) | U/W $ per SF | |
| Base Rent | $3,847,466(3) | 83.9% | $13.28 |
| IG Rent Averaging | 32,255(4) | 0.7 | 0.11 |
| Gross Potential Rent | $3,879,721 | 84.6% | $13.40 |
| Total Recoveries | 704,626 | 15.4 | 2.43 |
| Net Rental Income | 4,584,347 | 100.0% | $15.83 |
| (Vacancy & Credit Loss) | (193,986)(5) | (5.0) | (0.67) |
| Effective Gross Income | $4,390,361 | 95.8% | $15.16 |
| Real Estate Taxes | $338,753 | 7.7% | $1.17 |
| Insurance | 44,363 | 1.0 | 0.15 |
| Management Fee | 131,711 | 3.0 | 0.45 |
| Other Operating Expenses | 366,053 | 8.3 | 1.26 |
| Total Operating Expenses | $880,880 | 20.1% | $3.04 |
| Net Operating Income | $3,509,481 | 79.9% | $12.12 |
| Replacement Reserves | 39,702 | 0.9 | 0.14 |
| TI/LC | 44,279 | 1.0 | 0.15 |
| Net Cash Flow | $3,425,500 | 78.0% | $11.83 |
| NOI DSCR | 2.67x | ||
| NCF DSCR | 2.61x | ||
| NOI Debt Yield | 9.3% | ||
| NCF Debt Yield | 9.1% |
| (1) | Historical operating statements are not available, as the borrower acquired the ExchangeRight REIT 2 Properties between September 2019 and December 2020, and such information was not provided by the seller. |
| (2) | Represents (i) percent of Net Rental Income for all revenue fields, (ii) percent of Gross Potential Rent for Vacancy & Credit Loss and (iii) percent of Effective Gross Income for all other fields. |
| (3) | Underwritten base rent includes contractual rent steps through December 2021 totaling $55,605. |
| (4) | IG Rent Averaging represents straight line rent averaging for the Walmart Neighborhood Market – Huntsville and BioLife Plasma Services – Las Vegas properties. |
| (5) | The ExchangeRight REIT 2 Properties were underwritten to 95.0% economic vacancy and were 100.0% occupied as of February 1, 2021. |
Appraisal. According to the appraisals dated between October 7, 2020 and December 16, 2020, the ExchangeRight REIT 2 Properties had an aggregate “As-is” value of $59,660,000.
Environmental Matters. The Phase I environmental site assessments for the ExchangeRight REIT 2 Properties dated from June 10, 2020 to November 11, 2020 identified recognized environmental conditions at the Family Dollar – Commerce City property and the Hobby Lobby – Greenville property. No recognized environmental conditions were identified at the remaining 11 ExchangeRight REIT 2 Properties.
The Family Dollar – Commerce City property is located within the boundaries of a National Priority List site, and the property situated approximately two miles to the south-southeast is listed on various databases for the historical release of chlorinated solvents. Since the identification of the chlorinated solvent contamination on the non-collateral site, various remediation activities have been performed, including ongoing groundwater investigations. Based on the location of the subject property relative to the contaminated site, a recognized environmental condition was identified. According to the environmental consultant, further investigation on behalf of the subject property owner is not warranted at this time; however, periodic review of publicly available records should be performed to evaluate the protectiveness of environmental remedies as they pertain to the subject property until case closure is achieved.
The Hobby Lobby – Greenville property is situated approximately 300 feet from a non-collateral property that operated as a dry cleaning facility from the 1980s until 1994, and a release of chlorinated solvents was discovered at the non-collateral site in 2014. Based on documented impacts to groundwater at the subject property and the open regulatory status, the chlorinated solvent release was determined to be a recognized environmental condition by the environmental consultant. The release is currently being addressed under a NCDEQ DSCA Program Agreement, and onsite drinking water is provided by the municipal system. Based on the enrollment of the non-collateral site in the DSCA program and the ongoing investigation, the environmental consultant recommended the subject property owner continue to cooperate with the remediation unit, such as allowing reasonable access to allow additional assessment to be conducted.
THE INFORMATION IN THIS STRUCTURAL AND COLLATERAL TERM SHEET IS NOT COMPLETE AND MAY BE AMENDED PRIOR TO THE TIME OF SALE. THIS TERM SHEET IS NOT AN OFFER TO SELL THESE SECURITIES AND IT IS NOT A SOLICITATION OF AN OFFER TO BUY THESE SECURITIES IN ANY JURISDICTION WHERE THE OFFER OR SALE IS NOT PERMITTED.
100
| Property Types – Various | Loan #6 | Cut-off Date Balance: | $37,564,000 | |
| Property Addresses – Various | ExchangeRight REIT 2 | Cut-off Date LTV: | 63.0% | |
| U/W NCF DSCR: | 2.61x | |||
| U/W NOI Debt Yield: | 9.3% |
Escrows.
Taxes – The loan documents require an upfront reserve of $149,361 for real estate taxes plus ongoing monthly reserves, initially $36,036.
Ongoing monthly reserves for real estate taxes related to any tenant that is required to pay taxes directly pursuant to its leases (“Tax Paying Tenants”) are not required as long as (i) no event of default has occurred and is continuing; (ii) the borrower provides proof of payment directly to the taxing authority by 15 days prior to the delinquency date; (iii) the lease with the applicable Tax Paying Tenant is in full force and effect and not subject to any default beyond any applicable grace or notice and cure period; and (iv) no material change has occurred with respect to the applicable Tax Paying Tenant that would, in the lender’s reasonable determination, jeopardize such tenant’s ability to timely pay the taxes. Tax Paying Tenants currently include the Walmart Neighborhood Market – Huntsville, BioLife Plasma Services – Las Vegas, and Hobby Lobby – Greenville properties.
Insurance – Ongoing monthly reserves for insurance are not required as long as (i) no event of default has occurred and is continuing; (ii) the ExchangeRight REIT 2 Properties are part of a blanked or umbrella policy approved by the lender; (iii) the borrower provides the lender with evidence of renewal of insurance policies; and (iv) the borrower provides the lender with paid receipts for insurance premiums by no later than 10 business days prior to the policy expiration dates.
In addition, the borrower is not required to deposit ongoing monthly insurance reserves related to any tenant who pays all insurance premiums directly to the applicable insurance company pursuant to such tenant’s lease (“Insurance Paying Tenants”) as long as (i) no event of default has occurred and is continuing; (ii) the borrower provides proof of payment by the applicable Insurance Paying Tenant (or borrower) directly to the insurance company by no later than 15 days prior to the due date for such premiums; (iii) the lease with the applicable Insurance Paying Tenant is in full force and effect and not subject to any default beyond any applicable grace or notice and cure period; and (iv) no material change has occurred with respect to the applicable Insurance Paying Tenant that would, in the lender’s reasonable determination, jeopardize such tenant’s ability to timely pay the insurance premiums. Insurance Paying Tenants currently include the Walmart Neighborhood Market – Huntsville, Hobby Lobby – Greenville, and Dollar General – Chicago properties.
Replacement Reserve – The loan documents require ongoing monthly replacement reserves in an amount equal to $4,130. Replacement reserves are subject to a cap of $148,695 as long as (i) no event of default has occurred and is continuing; and (ii) the ExchangeRight REIT 2 Properties are being adequately maintained.
In addition, the borrower is not required to deposit ongoing monthly replacement reserves related to any tenant that is obligated under its lease to pay replacements and/or alterations for its premises (“Replacement Reserve Paying Tenants”) as long as (a) no event of default has occurred and is continuing; (b) the borrower provides proof of payment of replacements by all Replacement Reserve Paying Tenants; (c) the lease with the applicable Replacement Reserve Paying Tenant is in full force and effect and not subject to any default beyond any applicable grace or notice and cure period; and (d) no material change has occurred with respect to the applicable Replacement Reserve Paying Tenant that would, in the lender’s reasonable determination, jeopardize such tenant’s ability to timely pay the replacements for its premises. Replacement Reserve Paying Tenants currently include the Walmart Neighborhood Market – Huntsville, and BioLife Plasma Services– Las Vegas properties.
TI/LC Reserve – The loan documents require an upfront reserve of $500,000 for general tenant improvements and leasing commissions (“TI/LC”). The loan documents also require ongoing monthly general TI/LC reserves in an amount equal to $18,101; provided, however, that as long as no event of default has occurred and is continuing, ongoing monthly TI/LC reserves are not required unless the funds on deposit in the General TI/LC Reserve account are less than $250,000.
Deferred Maintenance Reserve – The loan documents require an upfront reserve of $72,301 for immediate repairs.
Tenant Specific TI/LC Reserve – The loan documents require an upfront reserve of $75,000 for an outstanding tenant improvement allowance at the Family Dollar – Beaumont property.
Lockbox and Cash Management. The ExchangeRight REIT 2 Mortgage Loan is structured with an in-place hard lockbox with springing cash management, into which the borrower is required to cause all rents to be deposited directly. Prior to a Cash Trap Event Period (as defined below), all funds in the lockbox account are required to be distributed to the borrower’s operating account. During a Cash Trap Event Period, all excess funds are required to be swept to an excess cash flow subaccount controlled by the lender.
A Cash Trap Event Period will commence upon the earlier of the following:
| (i) | the occurrence of an event of default; |
| (ii) | the net cash flow debt service coverage ratio (tested quarterly) being less than 1.50x; |
| (iii) | the monthly payment date occurring in January 2028 (unless a Permitted Transfer has occurred prior to such date; see “Permitted Transfer” section below); and |
| (iv) | the tenant Walmart Neighborhood Market (at the Huntsville, Alabama property) failing to renew or extend its lease on terms and conditions acceptable to the lender and in accordance with the loan documents at least 12 months prior lease expiration (as of the closing date, Walmart Neighborhood Market’s lease at the Huntsville, Alabama property is scheduled to expire on October 4, 2031). |
THE INFORMATION IN THIS STRUCTURAL AND COLLATERAL TERM SHEET IS NOT COMPLETE AND MAY BE AMENDED PRIOR TO THE TIME OF SALE. THIS TERM SHEET IS NOT AN OFFER TO SELL THESE SECURITIES AND IT IS NOT A SOLICITATION OF AN OFFER TO BUY THESE SECURITIES IN ANY JURISDICTION WHERE THE OFFER OR SALE IS NOT PERMITTED.
101
| Property Types – Various | Loan #6 | Cut-off Date Balance: | $37,564,000 | |
| Property Addresses – Various | ExchangeRight REIT 2 | Cut-off Date LTV: | 63.0% | |
| U/W NCF DSCR: | 2.61x | |||
| U/W NOI Debt Yield: | 9.3% |
A Cash Trap Event Period will end upon the occurrence of the following:
| ● | with regard to clause (i), the cure of such event of default; |
| ● | with regard to clause (ii), the net cash flow debt service coverage ratio being equal to or greater than 1.60x for two consecutive calendar quarters; |
| ● | with regard to clause (iii), the date a Permitted Transfer occurs; or |
| ● | with regard to clause (iv), either (a) a Re-Tenanting Event (as defined below); or (b) the lender receiving evidence reasonably satisfactory to the lender that Walmart Neighborhood Market extended the terms of its lease pursuant to the terms of its lease or otherwise on terms and conditions acceptable to the lender and in accordance with the loan documents, including (without limitation) a tenant estoppel certificate confirming that all obligations of the borrower to Walmart have been fulfilled with respect to tenant improvements and leasing commissions and such tenant is paying full unabated rent (or such amounts have been reserved by the lender). |
A “Re-Tenanting Event” will occur upon the lender receiving satisfactory evidence (including, without limitation, an estoppel certificate from each replacement tenant) that the property leased to Walmart has been leased to one or more satisfactory replacement tenants with each tenant being in occupancy, open for business and paying full, unabated rent, with all tenant improvement costs and leasing commissions having been paid.
Permitted Transfer. A “Permitted Transfer” means either a Qualified Transfer or a Qualified REIT Transfer (as defined below). A Cash Trap Event Period (see “Lockbox and Cash Management Section”) will be triggered if a Permitted Transfer does not occur prior to the monthly payment date occurring in January 2028 (36 months prior to the maturity date of the ExchangeRight REIT 2 Mortgage Loan).
A “Qualified Transfer” means any time following December 24, 2021, the borrower sponsor has the right to effect a one-time transfer of all (but not less than all) of the outstanding ownership interests in the borrower to an Approved Transferee (as defined below) and to replace the non-recourse carveout guarantors as the persons who control the borrower with such Approved Transferee; provided that certain conditions are satisfied, including among others: (i) no event of default exists under the ExchangeRight REIT 2 Mortgage Loan; (ii) the Approved Transferee executes a payment guaranty and environmental indemnity, pursuant to which it agrees to be liable for all indemnity obligations (including environmental liabilities and obligations) for which the existing non-recourse carveout guarantors are liable under the non-recourse carveout guaranty; (iii) immediately following a transfer, the Approved Transferee is in control of the borrower and owns (directly or indirectly) 100% of the legal and beneficial ownership interests in the borrower; and (iv) if required by the lender, rating agency confirmation from each applicable rating agency.
“Approved Transferee” means either (A) an eligible institution that is, or is wholly-owned and controlled by, a bank, savings and loan association, investment bank, insurance company, trust company, real estate investment trust, commercial credit corporation, pension plan, pension fund or pension advisory firm, mutual fund, government entity or plan or institution similar to any of the foregoing; or (B) any person that (1) is a Qualified Transferee (as defined below), (2) is regularly engaged in the business of owning or operating commercial properties, or interests therein, which are similar to the ExchangeRight REIT 2 Properties, (3) owns interests in, or operates, at least five retail properties with a minimum of 750,000 square feet in the aggregate, (4) maintains either (i) a net worth of at least $200,000,000 and total assets of at least $400,000,000, or (ii) an investment grade rating by S&P or Moody’s, (5) at all times owns no less than 100% of the legal and beneficial ownership of the borrow, and (6) is not a Delaware statutory trust.
A “Qualified Transferee” means a transferee that (i) has never been indicted or convicted of, or pled guilty or no contest to a felony, (ii) has never been indicted or convicted of, or pled guilty or no contest to a Patriot Act offense, is not a sanctioned target, and is not on any government watch list, (iii) has never been the subject of a voluntary or involuntary (to the extent the same has not been discharged) bankruptcy proceeding, (iv) has no material outstanding judgments against it or its interests and (v) is not a crowdfunded entity and is not owned by a crowdfunded entity,
A “Qualified REIT Transfer” means any time following December 24, 2021, the borrower sponsor has the right to effect a one-time transfer of all (but not less than all) of the outstanding ownership interests in the borrower to an Approved REIT (as defined below) and to replace the non-recourse carveout guarantors as the persons who control the borrower with such Approved REIT; provided that certain conditions are satisfied, including among others: (i) no event of default exists under the ExchangeRight REIT 2 Mortgage Loan; (ii) following a transfer, the existing borrower sponsor of the ExchangeRight REIT 2 Mortgage Loan will (a) own at least a 1% direct or indirect equity ownership interest in each of the borrower and any SPE component entity, (b) control the borrower and SPE component entity, and (c) control the day-to-day operation of the ExchangeRight REIT 2 Properties; (iii) if required by the lender, rating agency confirmation from each applicable rating agency; (iv) if the transfer would cause the transferee to acquire or to increase its direct or indirect interest in the borrower to an amount equal to or greater than 20% (or 10% if such person is nor formed, organized or incorporated in, or is not a citizen of the United States of America), such transferee and all other persons that would trigger such ownership thresholds in the borrower are required to be a Qualified Transferee; (v) the Approved REIT executes a payment guaranty and environmental indemnity, pursuant to which it agrees to be liable for all indemnity obligations (including environmental liabilities and obligations) for which the existing non-recourse carveout guarantors are liable under the non-recourse carveout guaranty; and (vi) following a transfer, the Approved REIT will own, directly or indirectly, no less than 51% of the legal and beneficial ownership interests in the borrower and SPE component entity.
“Approved REIT” means a real estate investment trust that (i) meets the requirements of a Qualified Transferee and for whom the lender receives a reasonably acceptable credit check; (ii) is at all times (a) owned, directly or indirectly, by the sponsor in an amount that is not less than 1% of all equity interests, and (b) under the control of one or more persons that (1) meet the requirements of a Qualified Transferee and for whom the lender receives a reasonably acceptable credit check, and (2) is at all times owned, directly or indirectly, by the sponsor in an amount not less than 51% of all equity interests, and controlled by the sponsor; and (iii) is otherwise reasonably acceptable to the lender in all respects.
THE INFORMATION IN THIS STRUCTURAL AND COLLATERAL TERM SHEET IS NOT COMPLETE AND MAY BE AMENDED PRIOR TO THE TIME OF SALE. THIS TERM SHEET IS NOT AN OFFER TO SELL THESE SECURITIES AND IT IS NOT A SOLICITATION OF AN OFFER TO BUY THESE SECURITIES IN ANY JURISDICTION WHERE THE OFFER OR SALE IS NOT PERMITTED.
102
| Property Types – Various | Loan #6 | Cut-off Date Balance: | $37,564,000 | |
| Property Addresses – Various | ExchangeRight REIT 2 | Cut-off Date LTV: | 63.0% | |
| U/W NCF DSCR: | 2.61x | |||
| U/W NOI Debt Yield: | 9.3% |
Property Management. The ExchangeRight REIT 2 Properties are managed by ER Net Leased Property Management, LLC, an affiliate of the borrower.
Partial Release. Not permitted.
Real Estate Substitution. Not permitted.
Subordinate and Mezzanine Indebtedness. Not permitted.
Ground Lease. None.
Rights of First Refusal. The related single tenant at each of the following three properties has a right of first refusal (“ROFR”) to purchase the related property: Kroger – Farmington Hills, Kroger – Fort Wayne, and Walmart Neighborhood Market – Huntsville. Each ROFR is not extinguished by a foreclosure of the related property; however, each ROFR does not apply to foreclosure or deed-in-lieu thereof. See “Description of the Mortgage Pool—Tenant Leases—Purchase Options and Rights of First Refusal” in the Preliminary Prospectus.
Terrorism Insurance. The loan documents require that the property insurance policy required to be maintained by the borrower provide coverage for perils and acts of terrorism in an amount equal to 100% of the full replacement cost of the ExchangeRight REIT 2 Properties, as well as business interruption insurance covering no less than the 18-month period following the occurrence of a casualty event, together with a 6-month extended period of indemnity. See “Risk Factors—Risks Relating to the Mortgage Loans—Terrorism Insurance May Not Be Available for All Mortgaged Properties” in the Preliminary Prospectus.
THE INFORMATION IN THIS STRUCTURAL AND COLLATERAL TERM SHEET IS NOT COMPLETE AND MAY BE AMENDED PRIOR TO THE TIME OF SALE. THIS TERM SHEET IS NOT AN OFFER TO SELL THESE SECURITIES AND IT IS NOT A SOLICITATION OF AN OFFER TO BUY THESE SECURITIES IN ANY JURISDICTION WHERE THE OFFER OR SALE IS NOT PERMITTED.
��103
| Self Storage – Self Storage | Loan #7 | Cut-off Date Balance: | $36,917,578 | |
| Property Addresses – Various | U-Haul AREC Portfolio 43 | Cut-off Date LTV: | 48.2% | |
| U/W NCF DSCR: | 1.90x | |||
| U/W NOI Debt Yield: | 10.8% |
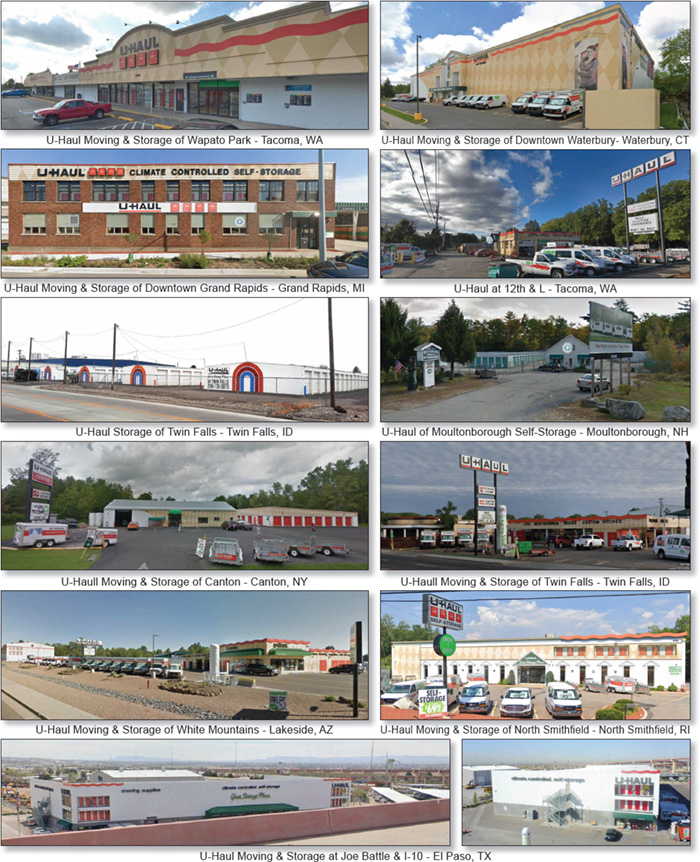
THE INFORMATION IN THIS STRUCTURAL AND COLLATERAL TERM SHEET IS NOT COMPLETE AND MAY BE AMENDED PRIOR TO THE TIME OF SALE. THIS TERM SHEET IS NOT AN OFFER TO SELL THESE SECURITIES AND IT IS NOT A SOLICITATION OF AN OFFER TO BUY THESE SECURITIES IN ANY JURISDICTION WHERE THE OFFER OR SALE IS NOT PERMITTED.
104
| Self Storage – Self Storage | Loan #7 | Cut-off Date Balance: | $36,917,578 | |
| Property Addresses – Various | U-Haul AREC Portfolio 43 | Cut-off Date LTV: | 48.2% | |
| U/W NCF DSCR: | 1.90x | |||
| U/W NOI Debt Yield: | 10.8% |
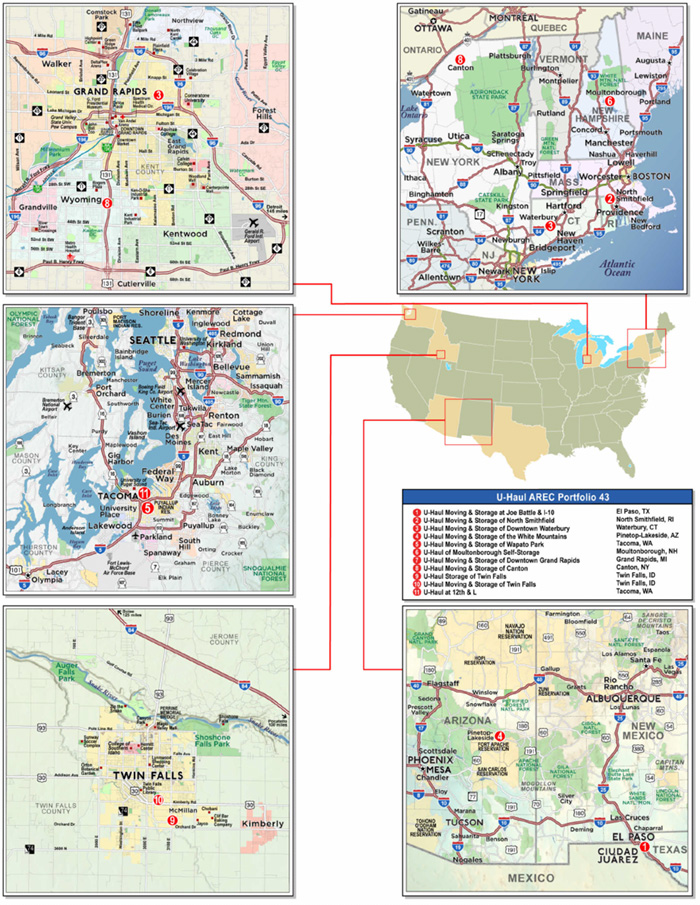
THE INFORMATION IN THIS STRUCTURAL AND COLLATERAL TERM SHEET IS NOT COMPLETE AND MAY BE AMENDED PRIOR TO THE TIME OF SALE. THIS TERM SHEET IS NOT AN OFFER TO SELL THESE SECURITIES AND IT IS NOT A SOLICITATION OF AN OFFER TO BUY THESE SECURITIES IN ANY JURISDICTION WHERE THE OFFER OR SALE IS NOT PERMITTED.
105
| No. 7 – U-Haul AREC Portfolio 43 | |||||||
| Mortgage Loan Information | Mortgaged Property Information | ||||||
| Mortgage Loan Seller: | Bank of America, National Association | Single Asset/Portfolio: | Portfolio | ||||
| Credit Assessment (Fitch/KBRA/S&P): | NR/NR/NR | Property Type – Subtype: | Self Storage - Self Storage | ||||
| Original Principal Balance: | $37,000,000 | Location: | Various | ||||
| Cut-off Date Balance: | $36,917,578 | Size: | 410,161 SF | ||||
| % of Initial Pool Balance: | 4.1% | Cut-off Date Balance Per SF: | $90.01 | ||||
| Loan Purpose: | Recapitalization | Maturity Date/ARD Balance Per SF(1): | $61.80 | ||||
| Borrower Sponsor: | AMERCO | Year Built/Renovated: | Various/Various | ||||
| Guarantor: | AMERCO | Title Vesting: | Fee | ||||
| Mortgage Rate(1): | 2.8000% | Property Manager: | Self-managed | ||||
| Note Date: | December 23, 2020 | Current Occupancy (As of)(4): | 96.0% (10/1/2020) | ||||
| Seasoning: | 1 month | YE 2019 Occupancy(3): | 83.1% | ||||
| Anticipated Repayment Rate(1): | January 1, 2031 | YE 2018 Occupancy(3): | 69.8% | ||||
| Maturity Date(1): | January 1, 2046 | YE 2017 Occupancy(3): | 59.7% | ||||
| IO Period: | 0 months | YE 2016 Occupancy(3): | 53.9% | ||||
| Loan Term (Original)(1): | 120 months | As-Is Appraised Value(4)(5): | $76,650,000 | ||||
| Amortization Term (Original): | 300 months | As-Is Appraisal Value Per SF(5): | $186.88 | ||||
| Loan Amortization Type(1): | Amortizing ARD | As-Is Appraisal Valuation Date(5): | Various | ||||
| Call Protection: | L(25),D(91),O(4) | Underwriting and Financial Information(4) | |||||
| Lockbox Type: | Soft/Springing Cash Management | TTM 10/31/2020 NOI(3): | 4,123,388 | ||||
| Additional Debt: | None | YE 2019 NOI(3): | 2,444,712 | ||||
| Additional Debt Type (Balance): | NAP | YE 2018 NOI(3): | 1,887,714 | ||||
| YE 2017 NOI(3): | NAV | ||||||
| U/W Revenues: | $5,983,448 | ||||||
| U/W Expenses: | $1,997,402 | ||||||
| U/W NOI: | $3,986,046 | ||||||
| Escrows and Reserves(2) | U/W NCF: | $3,910,613 | |||||
| Initial | Monthly | Cap | U/W DSCR based on NOI/NCF: | 1.94x / 1.90x | |||
| Taxes | $550,000 | Springing | NAP | U/W Debt Yield based on NOI/NCF: | 10.8% / 10.6% | ||
| Insurance | $0 | Springing | NAP | U/W Debt Yield at Maturity/ARD based on NOI/NCF(1): | 15.7% / 15.4% | ||
| Replacement Reserve | $37,716 | $6,286 | $37,716 | Cut-off Date LTV Ratio(5): | 48.2% | ||
| Required Repair Reserve | $112,006 | $0 | NAP | LTV Ratio at Maturity/ARD(1)(5): | 33.1% | ||
| Sources and Uses | ||||||||
| Sources | Uses | |||||||
| Original Mortgage Loan Amount | $37,000,000 | 100.0% | Principal Equity Distribution (6) | $35,457,657 | 95.8% | |||
| Closing Costs | 842,621 | 2.3 | ||||||
| Upfront Reserves | 699,722 | 1.9 | ||||||
| Total Sources | $37,000,000 | 100.0% | Total Uses | $37,000,000 | 100.0% | |||
| (1) | The U-Haul AREC Portfolio 43 Mortgage Loan (as defined below) has an initial term of 120 months to the anticipated repayment date (“ARD”) of January 1, 2031, with a final maturity date of January 1, 2046. Prior to the ARD, the U-Haul AREC Portfolio 43 Mortgage Loan will accrue interest at a rate equal to the Initial Interest Rate (as defined below). From and after the ARD until the outstanding principal balance of the U-Haul AREC Portfolio 43 Mortgage Loan and all accrued interest has been paid in full, or until the final maturity date on January 1, 2046, the U-Haul AREC Portfolio 43 Mortgage Loan will accrue interest at a rate equal to the Extension Rate (as defined below), and all excess cash flow from the U-Haul AREC Portfolio 43 Properties (as defined below) will be collected by the lender (see “The Mortgage Loan” below). |
| (2) | See “Escrows” below for further discussion of reserve requirements. |
| (3) | The U-Haul AREC Portfolio 43 Properties were acquired by the U-Haul AREC Portfolio 43 Borrowers (as defined below) from 1979 through 2019. Historical occupancy and NOI do not represent full year performance of the complete portfolio. In 2017, 6.0% of the portfolio (by TTM NOI) was acquired and, in 2019, 5.4% of the portfolio (by TTM NOI) was acquired. |
| (4) | While the U-Haul AREC Portfolio 43 Mortgage Loan was originated after the emergence of the novel coronavirus pandemic and the economic disruption resulting from measures to combat the pandemic, the pandemic is an evolving situation and could impact the U-Haul AREC Portfolio 43 Mortgage Loan more severely than assumed in the underwriting of the U-Haul AREC Portfolio 43 Mortgage Loan and could adversely affect the NOI, NCF and occupancy information, as well as the appraised value and the DSCR, LTV and Debt Yield metrics presented above. See “Risk Factors—Risks Related to Market Conditions and Other External Factors—The Coronavirus Pandemic Has Adversely Affected the Global Economy and Will Likely Adversely Affect the Performance of the Mortgage Loans” in the Preliminary Prospectus. |
| (5) | The Appraised Value shown reflects a “Bulk Portfolio Value” of $76,650,000. The Cut-off Date LTV Ratio and LTV Ratio at ARD assuming the aggregate as-is values of the individual properties of $70,480,000 are 52.4% and 36.0% respectively. The individual appraisal values are dated between October 29, 2020 and November 5, 2020. |
| (6) | The U-Haul AREC Portfolio 43 Borrowers maintain a cost basis in the U-Haul AREC Portfolio 43 Properties of $44,961,303. |
THE INFORMATION IN THIS STRUCTURAL AND COLLATERAL TERM SHEET IS NOT COMPLETE AND MAY BE AMENDED PRIOR TO THE TIME OF SALE. THIS TERM SHEET IS NOT AN OFFER TO SELL THESE SECURITIES AND IT IS NOT A SOLICITATION OF AN OFFER TO BUY THESE SECURITIES IN ANY JURISDICTION WHERE THE OFFER OR SALE IS NOT PERMITTED.
106
| Self Storage – Self Storage | Loan #7 | Cut-off Date Balance: | $36,917,578 | |
| Property Addresses – Various | U-Haul AREC Portfolio 43 | Cut-off Date LTV: | 48.2% | |
| U/W NCF DSCR: | 1.90x | |||
| U/W NOI Debt Yield: | 10.8% |
The Mortgage Loan. The mortgage loan (the “U-Haul AREC Portfolio 43 Mortgage Loan”) is evidenced by a promissory note in the original principal amount of $37,000,000 and secured by the fee interests in a portfolio of eleven self storage properties located across nine states and totaling 410,161 square feet (the “U-Haul AREC Portfolio 43 Properties”).
The U-Haul AREC Portfolio 43 Mortgage Loan has an initial term of 120 months to an anticipated repayment date (“ARD”) of January 1, 2031. Prior to the ARD, the U-Haul AREC Portfolio 43 Mortgage Loan will accrue interest at a rate equal to 2.8000% (the “Initial Interest Rate”). From and after the ARD until the outstanding principal balance of the U-Haul AREC Portfolio 43 Mortgage Loan and all accrued interest has been paid in full, or until the final maturity date on January 1, 2046, the U-Haul AREC Portfolio 43 Mortgage Loan will accrue interest at a rate equal to 3.0000% plus the greater of (a) the Initial Interest Rate and (b) the 10-year swap rate as of the ARD plus 1.8800% (the “Extension Rate”), and all excess cash flow from the U-Haul AREC Portfolio 43 Properties will be collected by the lender and applied as follows: first, to pay interest at the Initial Interest Rate, second, to reduce the principal balance of the U-Haul AREC Portfolio 43 Mortgage Loan until the entire outstanding principal balance is paid in full, and third, to pay any additional interest on the U-Haul AREC Portfolio 43 Mortgage Loan that has accrued at the Extension Rate and has been deferred until repayment of the U-Haul AREC Portfolio 43 Mortgage Loan.
The Borrowers and Borrower Sponsor. The borrowers are UHIL 43, LLC and AREC 43, LLC (individually and collectively, the “U-Haul AREC Portfolio 43 Borrowers”), each a Delaware limited liability company structured to be bankruptcy-remote with at least two independent directors. Legal counsel to the U-Haul AREC Portfolio 43 Borrowers delivered a non-consolidation opinion in connection with the origination of the U-Haul AREC Portfolio 43 Mortgage Loan.
The sponsor and non-recourse carve-out guarantor is AMERCO, a Nevada corporation. AMERCO (NASDAQ: UHAL) is a leading self-moving and self storage company and the parent company of U-Haul International, Inc. As of March 31, 2020, AMERCO had 2,065 owned or operated locations (66.7 million square feet), 20,100 independent dealers, a fleet of 176,000 rental trucks, 127,000 rental trailers and 41,000 towing devices, and reported net earnings of approximately $442.04 million.
COVID-19 Update. The first payment date for the U-Haul AREC Portfolio 43 Mortgage Loan is February 1, 2021. As of December 23, 2020, the U-Haul AREC Portfolio 43 Mortgage Loan is not subject to any forbearance, modification or debt service relief request. As of December 23, 2020, the borrower sponsor has reported that the U-Haul AREC Portfolio 43 Properties are all open and operating and no rent relief requests were made by tenants at the U-Haul AREC Portfolio 43 Properties.
The Properties. The U-Haul AREC Portfolio 43 Properties are comprised of eleven U-Haul branded properties containing a total of 4,661 traditional storage units, 242 parking units and 480 U-Box units. Additionally, two properties (U-Haul Moving & Storage of Wapato Park and U-Haul of Moultonborough Self-Storage) receive additional income via commercial leases (5.4% EGI as of TTM October 2020). The U-Haul AREC Portfolio 43 Properties range in size from 8,092 square feet to 80,426 square feet and are managed by affiliates of AMERCO.
The U-Haul AREC Portfolio 43 Properties are located across nine states, with the largest presence in Texas (one property, 19.6% of square feet), Arizona (one property, 16.0% of square feet) and Connecticut (one property, 15.0% of square feet), with the remaining eight properties (49.4% of square feet) located across six different states. The U-Haul AREC Portfolio 43 Properties were built between 1920 and 2013. As of October 1, 2020, the U-Haul AREC Portfolio 43 Properties were 96.0% occupied by square feet.
The following table presents detailed information with respect to each of the U-Haul AREC Portfolio 43 Properties.
U-Haul AREC Portfolio 43 Properties Summary
| Property Name | City, State | SF(1) | Storage & Parking Units/U Box(1) | Allocated Loan Amount (“ALA”) | % of ALA | Appraised Value(2) | % of Appraised Value |
| U-Haul Moving & Storage at Joe Battle & I-10 | El Paso, TX | 80,426 | 1,092 / 69 | 8,144,654 | 22.0% | 15,700,000 | 20.5% |
| U-Haul Moving & Storage of North Smithfield | North Smithfield, RI | 44,831 | 651 / 260 | 6,100,000 | 16.5% | 10,500,000 | 13.7% |
| U-Haul Moving & Storage of Downtown Waterbury | Waterbury, CT | 61,320 | 646 / 0 | 5,374,441 | 14.5% | 10,410,000 | 13.6% |
| U-Haul Moving & Storage of the White Mountains | Pinetop-Lakeside, AZ | 65,625 | 666 / 66 | 5,044,000 | 13.6% | 8,030,000 | 10.5% |
| U-Haul Moving & Storage of Wapato Park | Tacoma, WA | 42,595 | 643 / 0 | 4,300,000 | 11.6% | 12,210,000 | 15.9% |
| U-Haul of Moultonborough Self-Storage | Moultonborough, NH | 30,000 | 215 / 0 | 2,100,000 | 5.7% | 3,360,000 | 4.4% |
| U-Haul Moving & Storage of Downtown Grand Rapids | Grand Rapids, MI | 22,090 | 298 / 13 | 1,972,928 | 5.3% | 3,900,000 | 5.1% |
| U-Haul Moving & Storage of Canton | Canton, NY | 20,062 | 293 / 35 | 1,448,933 | 3.9% | 2,350,000 | 3.1% |
| U-Haul Storage of Twin Falls | Twin Falls, ID | 35,120 | 264 / 0 | 1,095,044 | 3.0% | 1,694,574 | 2.2% |
| U-Haul Moving & Storage of Twin Falls | Twin Falls, ID | 8,092 | 135 / 37 | 1,020,000 | 2.8% | 1,675,426 | 2.2% |
| U-Haul at 12th & L(3) | Tacoma, WA | N/A | N/A / 0 | 400,000 | 1.1% | 650,000 | 0.8% |
| Total/Weighted Average: | 410,161 | 4,903 / 480 | 37,000,000 | 100.0% | 76,650,000 | 100.0% |
| (1) | Based on the rent roll as of October 1, 2020. |
| (2) | Total Appraised value shown reflects a “Bulk Portfolio Value”. The aggregate as-is appraised value of individual properties is $70,480,000. |
| (3) | U-Haul at 12th & L does not have associated SF or unit count as this is a remote property which has its SF and unit count rolled together with its parent property of U-Haul Moving & Storage of Wapato Park. |
THE INFORMATION IN THIS STRUCTURAL AND COLLATERAL TERM SHEET IS NOT COMPLETE AND MAY BE AMENDED PRIOR TO THE TIME OF SALE. THIS TERM SHEET IS NOT AN OFFER TO SELL THESE SECURITIES AND IT IS NOT A SOLICITATION OF AN OFFER TO BUY THESE SECURITIES IN ANY JURISDICTION WHERE THE OFFER OR SALE IS NOT PERMITTED.
107
| Self Storage – Self Storage | Loan #7 | Cut-off Date Balance: | $36,917,578 | |
| Property Addresses – Various | U-Haul AREC Portfolio 43 | Cut-off Date LTV: | 48.2% | |
| U/W NCF DSCR: | 1.90x | |||
| U/W NOI Debt Yield: | 10.8% |
The following table presents certain information with respect to the individual performance of the U-Haul AREC Portfolio 43 Properties:
Performance Summary
| Property Name | Storage & Parking Units / U-Box | Year Built/Renovated | Date Acquired | 10/1/2020 Occupancy by SF | 10/31/2020 TTM NOI | % of Total 10/31/2020 TTM NOI |
| U-Haul Moving & Storage at Joe Battle & I-10 | 1,092 / 69 | 2013 / NAP | 11/5/2010 | 94.3% | $772,533 | 18.7% |
| U-Haul Moving & Storage of North Smithfield | 651 / 260 | 1980 / 2017 | 8/20/2014 | 99.0% | $667,354 | 16.2% |
| U-Haul Moving & Storage of Downtown Waterbury | 646 / 0 | 2002 / NAP | 8/14/2014 | 96.3% | $527,254 | 12.8% |
| U-Haul Moving & Storage of the White Mountains | 666 / 66 | 1984 / NAP | 6/21/2013 | 99.2% | $510,845 | 12.4% |
| U-Haul Moving & Storage of Wapato Park | 643 / 0 | 1963 / 2016 | 8/25/2015 | 83.3% | (1) | |
| U-Haul of Moultonborough Self-Storage | 215 / 0 | 2000 / NAP | 7/3/2019 | 100.0% | $223,226 | 5.4% |
| U-Haul Moving & Storage of Downtown Grand Rapids | 298 / 13 | 1920 / 2017 | 3/30/2017 | 99.5% | $249,095 | 6.0% |
| U-Haul Moving & Storage of Canton | 293 / 35 | 1950 / NAP | 1/1/1979 | 93.6% | $179,706 | 4.4% |
| U-Haul Storage of Twin Falls | 264 / 0 | 1981 / NAP | 1/24/2019 | 100.0% | (2) | |
| U-Haul Moving & Storage of Twin Falls | 135 / 37 | 1969 / NAP | 2/1/1979 | 99.5% | $241,316(2) | 5.9% |
| U-Haul at 12th & L | N/A / 0 | 1960 / NAP | 8/1/1979 | N/A(1) | $752,060(1) | 18.2% |
| Total/Weighted Average(3): | 4,903 / 480 | 96.0% | $4,123,388 | 100.0% |
| (1) | U-Haul at 12th & L and U-Haul Moving & Storage of Wapato Park are operated as one property but located on two non-adjacent parcels. |
| (2) | U-Haul Moving & Storage of Twin Falls and U-Haul Storage of Twin Falls are operated as one property but located on two non-adjacent parcels. |
| (3) | The Weighted Average occupancy is based on allocated loan amounts for the individual properties. |
The following table presents historical occupancy percentages at the U-Haul AREC Portfolio 43 Properties:
Historical Occupancy
12/31/2016(1) | 12/31/2017(1) | 12/31/2018(1) | 12/31/2019(1) | 10/1/2020 |
| 53.9% | 59.7% | 69.8% | 83.1% | 96.0% |
| (1) | The U-Haul AREC Portfolio 43 Properties were acquired by the borrower sponsor between January 1, 1979 and July 3, 2019. Historical occupancy does not represent full year performance of the complete portfolio. |
The following table presents detailed information for the U-Haul AREC Portfolio 43 Properties by market:
Market Summary
| State | Count | SF | Storage/Parking/ U Box Units | % Climate Control Units | Storage & RV Occ. by Unit(1) | Storage & RV Occ. by SF(1) | Wtd. Avg. Year Built | Monthly GPR – Storage & RV | % of Monthly GPR – Storage & RV | Allocated Loan Amount (“ALA”) | % of ALA |
| Texas | 1 | 80,426 | 897 / 195 / 69 | 60.1% | 94.6% | 94.5% | 2013 | $128,990 | 25.4% | $8,144,654 | 22.0% |
| Arizona | 1 | 65,625 | 619 / 47 / 66 | 31.5% | 96.1% | 98.1% | 1984 | $62,077 | 12.2% | $5,044,000 | 13.6% |
| Connecticut | 1 | 61,320 | 646 / 0 / 0 | 100.0% | 95.7% | 96.3% | 2002 | $91,933 | 18.1% | $5,374,441 | 14.5% |
| Rhode Island | 1 | 44,831 | 651 / 0 / 260 | 100.0% | 97.8% | 99.0% | 1980 | $54,207 | 10.7% | $6,100,000 | 16.5% |
| Idaho | 2 | 43,212 | 399 / 0 / 37 | 28.8% | 99.7% | 99.9% | 1975 | $24,365 | 4.8% | $2,115,044 | 5.7% |
| Washington | 2 | 42,595 | 643 / 0 / 0 | 100.0% | 80.4% | 83.3% | 1963 | $61,033 | 12.0% | $4,700,000 | 12.7% |
| New Hampshire | 1 | 30,000 | 215 / 0 / 0 | 0.0% | 100.0% | 100.0% | 2000 | $31,514 | 6.2% | $2,100,000 | 5.7% |
| Michigan | 1 | 22,090 | 298 / 0 / 13 | 100.0% | 99.7% | 99.5% | 1920 | $29,675 | 5.8% | $1,972,928 | 5.3% |
| New York | 1 | 20,062 | 293 / 0 / 35 | 77.8% | 89.1% | 93.6% | 1950 | $23,750 | 4.7% | $1,448,933 | 3.9% |
| Total/Wtd. Avg.(2) | 11 | 410,161 | 4,661 / 242 / 480 | 71.3% | 94.3% | 95.4% | 1985 | $507,545 | 100.0% | $37,000,000 | 100.0% |
| (1) | Occupancy rates are as of October 1, 2020. |
| (2) | The Wtd. Avg. figures are based on allocated loan amounts for the individual properties. |
THE INFORMATION IN THIS STRUCTURAL AND COLLATERAL TERM SHEET IS NOT COMPLETE AND MAY BE AMENDED PRIOR TO THE TIME OF SALE. THIS TERM SHEET IS NOT AN OFFER TO SELL THESE SECURITIES AND IT IS NOT A SOLICITATION OF AN OFFER TO BUY THESE SECURITIES IN ANY JURISDICTION WHERE THE OFFER OR SALE IS NOT PERMITTED.
108
| Self Storage – Self Storage | Loan #7 | Cut-off Date Balance: | $36,917,578 | |
| Property Addresses – Various | U-Haul AREC Portfolio 43 | Cut-off Date LTV: | 48.2% | |
| U/W NCF DSCR: | 1.90x | |||
| U/W NOI Debt Yield: | 10.8% |
Demographic Summary(1)
| Property Name | City, State | 1-mile Population | 3-mile Population | 5-mile Population | 1-mile Average Household Income | 3-mile Average Household Income | 5-mile Average Household Income |
| U-Haul Moving & Storage at Joe Battle & I-10 | El Paso, TX | 2,924 | 77,938 | 196,035 | $98,644 | $58,256 | $57,983 |
| U-Haul Moving & Storage of North Smithfield | North Smithfield, RI | 1,765 | 54,908 | 94,394 | $87,201 | $67,021 | $83,762 |
| U-Haul Moving & Storage of Downtown Waterbury | Waterbury, CT | 22,160 | 100,213 | 168,811 | $37,211 | $59,795 | $73,029 |
| U-Haul Moving & Storage of the White Mountains | Pinetop-Lakeside, AZ | 2,884 | 9,259 | 13,810 | $51,812 | $59,927 | $61,225 |
| U-Haul Moving & Storage of Wapato Park | Tacoma, WA | 17,708 | 134,317 | 289,408 | $77,295 | $66,614 | $74,476 |
| U-Haul of Moultonborough Self-Storage | Moultonborough, NH | 336 | 2,077 | 4,967 | $93,418 | $96,451 | $107,227 |
| U-Haul Moving & Storage of Downtown Grand Rapids | Grand Rapids, MI | 17,538 | 147,327 | 276,756 | $61,571 | $63,746 | $69,824 |
| U-Haul Moving & Storage of Canton | Canton, NY | 212 | 7,163 | 9,790 | $84,929 | $88,936 | $85,476 |
| U-Haul Storage of Twin Falls | Twin Falls, ID | 1,042 | 36,798 | 61,443 | $54,527 | $62,641 | $65,190 |
| U-Haul Moving & Storage of Twin Falls | Twin Falls, ID | 8,354 | 47,427 | 62,699 | $51,467 | $62,006 | $65,611 |
| U-Haul at 12th & L | Tacoma, WA | 29,564 | 109,559 | 260,308 | $72,025 | $80,160 | $86,683 |
| Total/Weighted Average(2): | 8,148 | 69,472 | 140,535 | $73,264 | $65,256 | $72,014 |
| (1) | Based on appraisals for each property. |
| (2) | The Weighted Average figures are based on allocated loan amounts for the individual properties. |
Operating History and Underwritten Net Cash Flow. The following table presents certain information relating to the operating history and underwritten net cash flow at the U-Haul AREC Portfolio 43 Properties:
Cash Flow Analysis
| 2018(1) | 2019(1) | 10/31/2020 TTM | U/W | % EGI | U/W $ per SF | |||||||
| Potential Gross Income | $2,643,254 | $3,225,699 | $4,739,193 | $6,094,366 | 101.9% | $14.86 | ||||||
| Other Income(2) | 818,489 | 905,236 | 1,191,109 | 1,160,319 | 19.4 | 2.83 | ||||||
| (Vacancy & Credit loss) | 0 | 0 | 0 | (1,271,237) | (21.2) | (3.10) | ||||||
| Effective Gross Income | $3,461,743 | $4,130,935 | $5,930,302 | $5,983,448 | 100.0% | $14.59 | ||||||
| Real Estate Taxes | 726,480 | 782,256 | 893,541 | 881,393 | 14.7 | 2.15 | ||||||
| Insurance | 29,532 | 39,807 | 53,373 | 76,506 | 1.3 | 0.19 | ||||||
| Other Operating Expenses | 818,017 | 864,160 | 860,000 | 1,039,503 | 17.4 | 2.53 | ||||||
| Total Operating Expenses | $1,574,029 | $1,686,223 | $1,806,914 | $1,997,402 | 33.4% | $4.87 | ||||||
| Net Operating Income | $1,887,714 | $2,444,712 | $4,123,388 | $3,986,046 | 66.6% | $9.72 | ||||||
| Replacement Reserves | 0 | 0 | 0 | 75,433 | 1.3 | 0.18 | ||||||
| Net Cash Flow | $1,887,714 | $2,444,712 | $4,123,388 | $3,910,613 | 65.4% | $9.53 | ||||||
| NOI DSCR | 0.92x | 1.19x | 2.00x | 1.94x | ||||||||
| NCF DSCR | 0.92x | 1.19x | 2.00x | 1.90x | ||||||||
| NOI Debt Yield | 5.1% | 6.6% | 11.2% | 10.8% | ||||||||
| NCF Debt Yield | 5.1% | 6.6% | 11.2% | 10.6% |
| (1) | Historical information does not represent full year performance of the complete portfolio due to the U-Haul AREC Portfolio 43 Properties being acquired over a period from 1979-2019. In 2017, 6.0% of the portfolio (by TTM NOI) was acquired and, in 2019, 5.4% of the portfolio (by TTM NOI) was acquired. |
| (2) | Other Income includes packing and moving supplies, U-Box portable storage income, U-Move truck and trailer rental income, third-party lease income and other miscellaneous income. U/W third party lease income totals $286,489 and includes (i) five office/retail and two cell tower leases at U-Haul Moving & Storage of Wapato Park, (ii) a cell tower lease to a dry cleaner at U-Haul of Moultonborough Self-Storage. |
Appraisals. The appraiser concluded to a “bulk portfolio value” of $76,650,000 as of December 15, 2020 for the U-Haul AREC Portfolio 43 Properties, which reflects an 8.8% premium over the aggregate of the “as-is” values of all of the U-Haul AREC Portfolio 43 Properties as a whole. The U-Haul AREC Portfolio 43 Properties were also valued individually between October 29, 2020 and November 5, 2020, with the individual values reflecting an aggregate “as-is” appraised value of $70,480,000.
Environmental Matters. The Phase I environmental site assessments for the U-Haul AREC Portfolio 43 Properties are dated November 6, 2020. There are recognized environmental conditions or controlled recognized environmental conditions at three of the U-Haul AREC Portfolio 43 Properties: the U-Haul Moving & Storage of Downtown Waterbury, U-Haul Moving & Storage of Downtown Grand Rapids and U-Haul at 12th & L Properties. The U-Haul AREC Portfolio 43 Borrowers maintain a pollution legal liability-type environmental insurance policy that covers the U-Haul Moving & Storage of Downtown Waterbury, U-Haul Moving & Storage of Wapato Park, U-Haul
THE INFORMATION IN THIS STRUCTURAL AND COLLATERAL TERM SHEET IS NOT COMPLETE AND MAY BE AMENDED PRIOR TO THE TIME OF SALE. THIS TERM SHEET IS NOT AN OFFER TO SELL THESE SECURITIES AND IT IS NOT A SOLICITATION OF AN OFFER TO BUY THESE SECURITIES IN ANY JURISDICTION WHERE THE OFFER OR SALE IS NOT PERMITTED.
109
| Self Storage – Self Storage | Loan #7 | Cut-off Date Balance: | $36,917,578 | |
| Property Addresses – Various | U-Haul AREC Portfolio 43 | Cut-off Date LTV: | 48.2% | |
| U/W NCF DSCR: | 1.90x | |||
| U/W NOI Debt Yield: | 10.8% |
of Moultonborough Self-Storage, U-Haul Moving & Storage of Downtown Grand Rapids, U-Haul Moving & Storage of Canton and U-Haul at 12th & L Mortgaged Properties. Great American E&S Insurance Company issued the policy with a coverage limit of $6,000,000 per each occurrence and in the aggregate and with self-insured retention of no more than $50,000 per event. The policy names the lender as an additional insured and expires in December 2033 with respect to the lender and in December 2030 with respect to the U-Haul AREC Portfolio 43 Borrowers. See “Description of the Mortgage Pool—Environmental Considerations” in the Preliminary Prospectus.
Escrows.
Real Estate Taxes and Insurance – The U-Haul AREC Portfolio 43 Borrowers deposited at loan origination $550,000 for real estate taxes. The U-Haul AREC Portfolio 43 Borrowers will not be required to deposit monthly reserves for real estate taxes or insurance premiums so long as (i) no event of default exists, (ii) the U-Haul AREC Portfolio 43 Borrowers provide the lender with proof of current taxes or insurance premiums paid and (iii)(a) the U-Haul AREC Portfolio 43 Borrowers maintain in a reserve with the lender an amount sufficient to pay taxes or insurance premiums for six months or (b) as it relates to insurance premiums, the U-Haul AREC Portfolio 43 Properties are covered by an acceptable blanket policy.
Replacement Reserve – The U-Haul AREC Portfolio 43 Borrowers deposited at loan origination $37,716 and are required to deposit $6,286 monthly for replacements any time that the balance of the Replacement Reserve is below $37,716.
Required Repair Reserve – The U-Haul AREC Portfolio 43 Borrowers deposited at loan origination $112,006 (representing 125% of the estimated cost of certain immediate repairs).
Lockbox and Cash Management. A soft lockbox is in place with respect to the U-Haul AREC Portfolio 43 Mortgage Loan, with springing cash management upon the occurrence of a Cash Sweep Period (as defined below). During the continuance of a Cash Sweep Period, all funds are required to be swept each business day to a lender-controlled cash management account and disbursed in accordance with the U-Haul AREC Portfolio 43 Mortgage Loan documents with all excess cash flow required to be held in the excess cash flow subaccount as additional security for the U-Haul AREC Portfolio 43 Mortgage Loan for so long as a Cash Sweep Period exists, unless collected after the ARD, in which case all excess cash flow will be applied first, to pay interest at the Initial Interest Rate, second, to reduce the principal balance of the U-Haul AREC Portfolio 43 Mortgage Loan until the entire outstanding principal balance is paid in full, and third, to pay any additional interest on the U-Haul AREC Portfolio 43 Mortgage Loan that has accrued at the Extension Rate and has been deferred until repayment of the U-Haul AREC Portfolio 43 Mortgage Loan.
A “Cash Sweep Period” means a period (a) commencing upon the occurrence of an event of default and ending upon the lender’s acceptance of the cure of the event of default; (b) during a DSCR Trigger Period (as defined below); (c) during a Tax/Insurance Trigger Period (as defined below); or (d) commencing upon the property manager becoming insolvent or becoming a debtor in any bankruptcy action and ending upon the property manager being replaced by a qualified manager. A Cash Sweep Period may not be cured if any other event of default is continuing under the U-Haul AREC Portfolio 43 Mortgage Loan documents or if a Cash Sweep Period has occurred more than five times during the term of the U-Haul AREC Portfolio 43 Mortgage Loan. A Cash Sweep Period may not be cured if triggered by an event of default caused by a bankruptcy action of the U-Haul AREC Portfolio 43 Borrowers. Additionally, 60 days prior to the ARD of the U-Haul AREC Portfolio 43 Mortgage Loan, a Cash Sweep Period will be automatically triggered and will continue until the U-Haul AREC Portfolio 43 Mortgage Loan is repaid in full.
A “DSCR Trigger Period” will commence upon the trailing-twelve month debt service coverage ratio being less than 1.15x (based on net operating income) for two consecutive calendar quarters, and will end upon the trailing-twelve month debt service coverage ratio being equal to or greater than 1.15x (based on net operating income) for four consecutive calendar quarters.
A “Tax/Insurance Trigger Period” will commence upon the U-Haul AREC Portfolio 43 Borrowers’ failure to provide timely evidence of payment of property taxes or proof of insurance, and will end upon the U-Haul AREC Portfolio 43 Borrowers providing such evidence or proof.
Property Management. The U-Haul AREC Portfolio 43 Properties are managed by U-Haul Co. of Arizona, U-Haul Co. of Connecticut, U-Haul Co. of Idaho, Inc., U-Haul Co. of Michigan, U-Haul Co. of New Hampshire, Inc., U-Haul Co. of New York and Vermont, Inc., U-Haul Co. of Rhode Island, U-Haul Co. of Texas and U-Haul Co. of Washington, affiliates of the U-Haul AREC Portfolio 43 Borrowers.
Partial Release. After the expiration of the defeasance lockout period and prior to the monthly payment date occurring in October 2030, the U-Haul AREC Portfolio 43 Borrowers have the right to obtain a release of any one or more individual U-Haul AREC Portfolio 43 Properties, provided no event of default is continuing and subject to the conditions set forth in the U-Haul AREC Portfolio 43 Mortgage Loan documents, including, among others, (1) partial defeasance of the U-Haul AREC Portfolio 43 Mortgage Loan in a principal amount equal to 125% of the allocated loan amount for the individual U-Haul AREC Portfolio 43 Property being released, (2) after giving effect to the partial defeasance, the debt yield of the remaining U-Haul AREC Portfolio 43 Properties is at least the greater of the debt yield immediately prior to the partial defeasance and 10.6%, (3) after giving effect to the partial defeasance, the debt service coverage ratio of the remaining U-Haul AREC Portfolio 43 Properties is at least the greater of the debt service coverage ratio immediately prior to the partial defeasance and 1.90x, and (4) certain REMIC-related conditions are satisfied.
Real Estate Substitution. Not permitted.
Subordinate and Mezzanine Indebtedness. Not permitted
Ground Lease. None.
THE INFORMATION IN THIS STRUCTURAL AND COLLATERAL TERM SHEET IS NOT COMPLETE AND MAY BE AMENDED PRIOR TO THE TIME OF SALE. THIS TERM SHEET IS NOT AN OFFER TO SELL THESE SECURITIES AND IT IS NOT A SOLICITATION OF AN OFFER TO BUY THESE SECURITIES IN ANY JURISDICTION WHERE THE OFFER OR SALE IS NOT PERMITTED.
110
| Self Storage – Self Storage | Loan #7 | Cut-off Date Balance: | $36,917,578 | |
| Property Addresses – Various | U-Haul AREC Portfolio 43 | Cut-off Date LTV: | 48.2% | |
| U/W NCF DSCR: | 1.90x | |||
| U/W NOI Debt Yield: | 10.8% |
Expansion of Property. The U-Haul AREC Portfolio 43 Borrowers are permitted to acquire a fee simple estate in vacant land that is adjacent and contiguous to an existing individual property, subject to certain conditions (including receipt of rating agency confirmation, a REMIC opinion and satisfactory environmental assessment). The acquired land will thereafter be considered a part of the individual property, will be subject to the lien of the U-Haul AREC Portfolio 43 Mortgage Loan and will be governed by the U-Haul AREC Portfolio 43 Mortgage Loan documents.
The U-Haul AREC Portfolio 43 Borrowers are permitted to acquire a leasehold estate in property that is operated as a storage facility but that is not contiguous to an existing individual property, subject to certain conditions (including receipt of rating agency confirmation, a REMIC opinion and satisfactory environmental assessment) and provided that the acquired facility will only be operated as a remote storage facility, U-Box storage facility or vehicle or RV storage facility. All rents from the acquired property will thereafter be considered rents due under the U-Haul AREC Portfolio 43 Mortgage Loan documents.
Terrorism Insurance. The U-Haul AREC Portfolio 43 Borrowers are required to obtain and maintain property insurance and business interruption insurance that covers perils of terrorism and acts of terrorism in an amount equal to the full replacement cost of the U-Haul AREC Portfolio 43 Properties and 24 months of business interruption insurance plus 6 months of extended indemnity. See “Risk Factors—Risks Relating to the Mortgage Loans—Terrorism Insurance May Not Be Available for All Mortgaged Properties” in the Preliminary Prospectus.
Earthquake Insurance. Seismic risk assessments dated November 6, 2020 for U-Haul at 12th & L property and U-Haul Moving & Storage of Wapato Park property indicated a probable maximum loss of 13% and 17%, respectively. Earthquake insurance was obtained.
THE INFORMATION IN THIS STRUCTURAL AND COLLATERAL TERM SHEET IS NOT COMPLETE AND MAY BE AMENDED PRIOR TO THE TIME OF SALE. THIS TERM SHEET IS NOT AN OFFER TO SELL THESE SECURITIES AND IT IS NOT A SOLICITATION OF AN OFFER TO BUY THESE SECURITIES IN ANY JURISDICTION WHERE THE OFFER OR SALE IS NOT PERMITTED.
111
| Office - CBD | Loan #8 | Cut-off Date Balance: | $34,555,371 | |
| 110 North Carpenter Street | McDonald’s Global HQ | Cut-off Date LTV: | 41.0% | |
| Chicago, IL 60607 | U/W NCF DSCR: | 1.45x | ||
| U/W NOI Debt Yield: | 11.9% |

THE INFORMATION IN THIS STRUCTURAL AND COLLATERAL TERM SHEET IS NOT COMPLETE AND MAY BE AMENDED PRIOR TO THE TIME OF SALE. THIS TERM SHEET IS NOT AN OFFER TO SELL THESE SECURITIES AND IT IS NOT A SOLICITATION OF AN OFFER TO BUY THESE SECURITIES IN ANY JURISDICTION WHERE THE OFFER OR SALE IS NOT PERMITTED.
112
| Office - CBD | Loan #8 | Cut-off Date Balance: | $34,555,371 | |
| 110 North Carpenter Street | McDonald’s Global HQ | Cut-off Date LTV: | 41.0% | |
| Chicago, IL 60607 | U/W NCF DSCR: | 1.45x | ||
| U/W NOI Debt Yield: | 11.9% |

THE INFORMATION IN THIS STRUCTURAL AND COLLATERAL TERM SHEET IS NOT COMPLETE AND MAY BE AMENDED PRIOR TO THE TIME OF SALE. THIS TERM SHEET IS NOT AN OFFER TO SELL THESE SECURITIES AND IT IS NOT A SOLICITATION OF AN OFFER TO BUY THESE SECURITIES IN ANY JURISDICTION WHERE THE OFFER OR SALE IS NOT PERMITTED.
113
| No. 8 – McDonald’s Global HQ | ||||||||
| Mortgage Loan Information | Mortgaged Property Information | |||||||
| Mortgage Loan Seller: | Bank of America, National Association | Single Asset/Portfolio: | Single Asset | |||||
Credit Assessment (Fitch/KBRA/S&P): | Asf/A(sf)/NR | Property Type – Subtype: | Office – CBD | |||||
| Original Principal Balance(1): | $35,000,000 | Location: | Chicago, IL | |||||
| Cut-off Date Balance(1): | $34,555,371 | Size: | 575,018 SF | |||||
| % of Initial Pool Balance: | 3.8% | Cut-off Date Balance Per SF(1): | $291.89 | |||||
| Loan Purpose: | Acquisition | Maturity Date Balance Per SF(1): | $120.04 | |||||
| Borrower Sponsor: | Normandy Properties | Year Built/Renovated: | 2018/NAP | |||||
| Guarantor: | William I. Snyder | Title Vesting: | Fee | |||||
| Mortgage Rate: | 2.9350% | Property Manager: | Sterling Bay Property Management, LLC | |||||
| Note Date: | October 29, 2020 | Current Occupancy (As of)(7): | 97.3% (11/4/2020) | |||||
| Seasoning: | 3 months | YE 2019 Occupancy: | 96.4% | |||||
| Maturity Date: | November 1, 2030 | YE 2018 Occupancy: | 94.2% | |||||
| IO Period: | 0 months | YE 2017 Occupancy(6): | NAV | |||||
| Loan Term (Original): | 120 months | YE 2016 Occupancy(6): | NAV | |||||
| Amortization Term (Original)(2): | 270 months | As-Is Appraised Value(7)(8): | $409,000,000 | |||||
| Loan Amortization Type: | Amortizing Balloon | As-Is Appraised Value Per SF: | $711.28 | |||||
| Call Protection(3): | L(27), D(89), O(4) | As-Is Appraisal Valuation Date: | September 28, 2020 | |||||
| Lockbox Type: | Hard/Upfront Cash Management | Underwriting and Financial Information(7) | ||||||
| Additional Debt(1)(4): | Yes | TTM NOI (8/31/2020): | $10,812,656 | |||||
| Additional Debt Type (Balance) (1)(4): | Pari Passu ($133,285,001), Subordinate ($110,000,000) | YE 2019 NOI: | $7,895,362 | |||||
| YE 2018 NOI(6): | NAV | |||||||
| YE 2017 NOI(6): | NAV | |||||||
| U/W Revenues: | $35,092,657 | |||||||
| U/W Expenses: | $15,037,235 | |||||||
| Escrows and Reserves(5) | U/W NOI: | $20,055,422 | ||||||
| Initial | Monthly | Cap | U/W NCF: | $19,947,666 | ||||
| Taxes | $0 | Springing | NAP | U/W DSCR based on NOI/NCF(1): | 1.46x / 1.45x | |||
| Insurance | $0 | Springing | NAP | U/W Debt Yield based on NOI/NCF(1): | 11.9% / 11.9% | |||
| Replacement Reserve | $0 | Springing | NAP | U/W Debt Yield at Maturity based on NOI/NCF(1): | 29.1% / 28.9% | |||
| TI/LC Reserve | $0 | Springing | NAP | Cut-off Date LTV Ratio(1): | 41.0% | |||
| Free Rent Reserve | $6,161,307 | $0 | NAP | LTV Ratio at Maturity(1): | 16.9% | |||
| Sources and Uses | ||||||||
| Sources | Uses | |||||||
| Original whole loan amount | $280,000,000 | 66.6% | Purchase Price | $412,500,000 | 98.1% | |||
| Borrower Equity | 140,508,313 | 33.4 | Upfront Reserves | 6,161,307 | 1.5 | |||
| Closing Costs | 1,847,006 | 0.4 | ||||||
| Total Sources | $420,508,313 | 100.0% | Total Uses | $420,508,313 | 100.0% | |||
| (1) | The Cut-off Date Balance Per SF, Maturity Date Balance Per SF, U/W DSCR based on NOI/NCF, U/W Debt Yield based on NOI/NCF, U/W Debt Yield at Maturity based on NOI/NCF, Cut-off Date LTV Ratio and LTV Ratio at Maturity numbers presented above are based on the McDonald’s Global HQ Senior Loan (as defined below). |
| (2) | The Amortization Term (Original) is shown for the McDonald’s Global HQ Whole Loan (as defined below). The McDonald’s Global HQ Senior Loan (as defined below) amortizes in 186 months. See the amortization schedule for the McDonald’s Global HQ Senior Loan set forth on Annex A-4 in the Preliminary Prospectus. |
| (3) | Defeasance of the McDonald’s Global HQ Whole Loan is permitted at any time after the earlier to occur of (a) the end of the two-year period commencing on the closing date of the securitization of the last portion of the McDonald’s Global HQ Whole Loan to be securitized and (b) October 29, 2023. The assumed prepayment lockout period of 27 payments is based on the closing date of this transaction in February 2021. |
| (4) | See “Subordinate and Mezzanine Indebtedness” section. |
| (5) | See “Escrows” section. |
| (6) | Further historical occupancy and NOI is not available, as construction of the McDonald’s Global HQ Property (as defined below) was completed in 2018. |
| (7) | While the McDonald’s Global HQ Whole Loan was originated after the emergence of the novel coronavirus pandemic and the economic disruption resulting from measures to combat the pandemic, the pandemic is an evolving situation and could impact the McDonald’s Global HQ Whole Loan more severely than assumed in the underwriting of the McDonald’s Global HQ Whole Loan and could adversely affect the NOI, NCF and occupancy information, as well as the appraised value and DSCR, LTV and Debt Yield metrics presented above. See “Risk Factors—Risks Related to Market Conditions and Other External Factors—The Coronavirus Pandemic Has Adversely Affected the Global Economy and Will Likely Adversely Affect the Performance of the Mortgage Loans” in the Preliminary Prospectus. |
| (8) | The appraisal also provided a “Hypothetical As If Dark” value of $225,000,000 as of September 28, 2020, which value would result in an Appraised Value Per SF, Cut-off Date LTV Ratio and LTV Ratio at Maturity of $391.29, 74.6% and 30.7%, respectively, based on the principal balance of the McDonald’s Global HQ Senior Loan. |
THE INFORMATION IN THIS STRUCTURAL AND COLLATERAL TERM SHEET IS NOT COMPLETE AND MAY BE AMENDED PRIOR TO THE TIME OF SALE. THIS TERM SHEET IS NOT AN OFFER TO SELL THESE SECURITIES AND IT IS NOT A SOLICITATION OF AN OFFER TO BUY THESE SECURITIES IN ANY JURISDICTION WHERE THE OFFER OR SALE IS NOT PERMITTED.
114
| Office - CBD | Loan #8 | Cut-off Date Balance: | $34,555,371 | |
| 110 North Carpenter Street | McDonald’s Global HQ | Cut-off Date LTV: | 41.0% | |
| Chicago, IL 60607 | U/W NCF DSCR: | 1.45x | ||
| U/W NOI Debt Yield: | 11.9% |
The Mortgage Loan. The mortgage loan (the “McDonald’s Global HQ Mortgage Loan”) is part of a whole loan (the “McDonald’s Global HQ Whole Loan”) evidenced by seven pari passu senior promissory notes in the aggregate original principal amount of $170,000,000 (together, the “McDonald’s Global HQ Senior Loan”) and one note in the original principal amount of $110,000,000 (the “McDonald’s Global HQ Subordinate Companion Loan”) that is subordinate to the McDonald’s Global HQ Senior Loan. The McDonald’s Global HQ Whole Loan is secured by a first priority fee mortgage encumbering a 575,018 square foot office building located in Chicago, Illinois (the “McDonald’s Global HQ Property”). The McDonald’s Global HQ Mortgage Loan is evidenced by Notes A-1, A-4-2 and A-5 with an aggregate original principal amount of $35,000,000. The remaining promissory notes comprising the McDonald’s Global HQ Whole Loan are summarized in the below table. The McDonald’s Global HQ Whole Loan is being serviced pursuant to the pooling and servicing agreement for the BANK 2020-BNK30 securitization trust. See “Description of the Mortgage Pool—The Whole Loans—The Non-Serviced AB Whole Loans—The McDonald’s Global HQ Whole Loan” and “Pooling and Servicing Agreement—Servicing of the Non-Serviced Mortgage Loans” in the Preliminary Prospectus.
Note Summary
| Notes | Original Balance | Cut-off Date Balance | Note Holder | Controlling Piece |
| A-1 | $1,000,000 | $987,296 | BANK 2021-BNK31 | No |
| A-2 | $60,000,000 | $59,237,778 | BANK 2020-BNK30 | No |
| A-3 | $50,000,000 | $49,364,815 | BANK 2020-BNK29 | No |
| A-4-1 | $15,000,000 | $14,809,445 | Bank of America, National Association | No |
| A-4-2 | $10,000,000 | $9,872,963 | BANK 2021-BNK31 | No |
| A-5 | $24,000,000 | $23,695,111 | BANK 2021-BNK31 | No |
| A-6 | $10,000,000 | $9,872,963 | BANK 2020-BNK30 | No |
| B | $110,000,000 | $110,000,000 | BANK 2020-BNK30 (loan-specific certificates) | Yes(1) |
| Total | $280,000,000 | $277,840,371 |
| (1) | The holder of Note B is the controlling noteholder unless a “control appraisal period” has occurred and is continuing under the co-lender agreement, in which case Note A-2 will become the controlling noteholder. For so long as Note B is included in the BANK 2020-BNK30 securitization and a control appraisal event does not exist, such rights will be exercised by the controlling class representative of the BANK 2020-BNK30 loan-specific certificates. |
The Borrower and Borrower Sponsor. The borrower is 110 NC LLC (the “McDonald’s Global HQ Borrower”), a Delaware limited liability company structured to be bankruptcy-remote with at least two independent directors. Legal counsel to the borrower delivered a non-consolidation opinion in connection with the origination of the McDonald’s Global HQ Whole Loan.
The borrower sponsor is Normandy Properties, a commercial real estate owner and operator owned by a family office controlled by the Snyder family. The Snyder family has continuously operated in the steel and precious metals industries since the 1800’s. William I. Snyder is the non-recourse carveout guarantor for the McDonald’s Global HQ Whole Loan.
The Property. The McDonald’s Global HQ Property is a 575,018 square foot, 9-story, Class A, LEED Platinum office building with a ground floor multi-tenant retail component. The McDonald’s Global HQ Property was built in 2018 on a 1.99-acre site, occupying an entire city block in the Fulton Market District of downtown Chicago, Illinois. The McDonald’s Global HQ Property features floor plates between 56,393 and 80,233 rentable square feet above a two-level subterranean garage that includes 320 parking spaces (0.56 spaces per 1,000 square feet), bicycle storage and tenant storage. The sustainability features of the McDonald’s Global HQ Property include a green roof and terrace landscaping, three rooftop beehives, low-flow plumbing fixtures, and recycling and waste prevention efforts which have a goal of diverting 200,000 pounds of material away from the landfill annually.
The McDonald’s Global HQ Property was built-to-suit for McDonald’s Corporation (“McDonald’s”) for the relocation of its global headquarter operations from the western suburbs of Chicago, which move brought 2,500 jobs to downtown Chicago. McDonald’s occupies a total of 532,526 square feet (92.6% of net rentable area), which includes a 9,765 square foot retail restaurant, 6,040 square feet of storage space, a dedicated 8,121 square foot lobby featuring a two-story art installation using kitchen equipment from a McDonald’s restaurant, the entirety of the office space on floors 2 through 8, a double-height, column-free auditorium on the 6th floor, and a 23,644 square foot amenity floor on the 9th floor with a tenant lounge/bar area, work café, professionally managed fitness center with locker rooms, and a rooftop deck that offers sweeping views of the Chicago skyline. The McDonald’s space also includes five other landscaped terraces located on building set-back points on floors 3, 6 and 8. McDonald’s leases 295 of 320 parking spaces in the garage.
The remaining rentable area at the McDonald’s Global HQ Property is comprised of 42,492 square feet of retail space, currently leased to Walgreens, FedEx Retail, One Medical and Politan Row (a chef-driven upscale food hall), with 15,657 square feet remaining to be leased. The retail tenants serve as amenities for the office users and for the surrounding neighborhood. The McDonald’s Global HQ Property was 97.3% leased, as of November 4, 2020.
COVID-19 Update. The McDonald’s Global HQ Whole Loan is current as of the January 2021 debt service payment. As of January 11, 2021, the borrower sponsor has reported that 100% of tenants by net rentable area and 100% of tenants by underwritten base rent with rent payable have paid their full January 2021 rent payments. The food hall tenant, Politan Row (under a rent abatement period through June 2021), had closed from April to July 2020 due to Chicago’s city guidelines. After re-opening for outdoor dining in August 2020, Politan Row has announced their plans to temporarily close and re-open in the spring of 2021.
THE INFORMATION IN THIS STRUCTURAL AND COLLATERAL TERM SHEET IS NOT COMPLETE AND MAY BE AMENDED PRIOR TO THE TIME OF SALE. THIS TERM SHEET IS NOT AN OFFER TO SELL THESE SECURITIES AND IT IS NOT A SOLICITATION OF AN OFFER TO BUY THESE SECURITIES IN ANY JURISDICTION WHERE THE OFFER OR SALE IS NOT PERMITTED.
115
| Office - CBD | Loan #8 | Cut-off Date Balance: | $34,555,371 | |
| 110 North Carpenter Street | McDonald’s Global HQ | Cut-off Date LTV: | 41.0% | |
| Chicago, IL 60607 | U/W NCF DSCR: | 1.45x | ||
| U/W NOI Debt Yield: | 11.9% |
Major Tenant.
McDonald’s (532,526 square feet, 92.6% of net rentable area; 92.2% of underwritten base rent). McDonald’s (NYSE: MCD) (Moody’s/S&P: Baa1/BBB+) is a worldwide fast food brand with an equity market capitalization of approximately $160 billion. For its fiscal year 2019, McDonald’s is estimated to have served 70 million people daily across 100 countries in its 38,695 locations, reporting system-wide sales of $100.2 billion.
The McDonald’s 15-year triple-net lease commenced on August 1, 2018 and expires on July 31, 2033. The lease requires current average annual rent of $33.10 PSF, with 2.25% annual increases every August through the lease term. McDonald’s has four 5-year options to extend the lease at 95% of market rent with 20 months’ notice. McDonald’s has the option to contract up to one full floor, but not less than half of one floor, effective August 1, 2028, upon 12 months’ notice and subject to a contraction fee equal to the sum of (x) tenant improvements credited by the landlord and brokerage commissions paid allocable to the contracted space and (y) any rent abatements received allocable to the contracted space plus interest, which sum is estimated to be approximately $5.8 million. McDonald’s has the option to terminate its lease effective July 31, 2030, upon 18 months’ notice and subject to a termination fee equal to the sum of (x) tenant improvements credited by the landlord and brokerage commissions paid and (y) any rent abatements received plus interest, which sum is estimated to be approximately $25.8 million. The exercise by McDonald’s of either its contraction or termination option would trigger a Cash Sweep Period (see “Escrows” below).
McDonald’s received a tenant improvement allowance of $51,747,189, with no remaining amounts owed by the landlord, and reportedly invested an additional $114,682,118 toward the improvement of its office space and $3,152,925 toward its retail space. Pursuant to its lease, McDonald’s is entitled to a remaining amount of $4,979,640 of free rent owed through August 2021 and an $874,042 operating expense cap credit, which amounts have been fully reserved by the lender (see “Escrows” below).
The following table presents certain information relating to the tenancy at the McDonald’s Global HQ Property:
Tenant Summary(1)
| Tenant Name | Credit Rating (Fitch/ Moody’s/ | Tenant NRSF | % of NRSF | Annual U/W Base Rent PSF(3) | Annual U/W Base Rent(3) | % of Total Annual U/W Base Rent | Lease Expiration Date | Termination Option (Y/N) |
| Office | ||||||||
| McDonald’s(4) | NR/Baa1/BBB+ | 522,761 | 90.9% | $33.40 | $17,458,413 | 89.7% | 7/31/2033 | Y(5) |
| Retail | ||||||||
| Politan Row(6) | NR/NR/NR | 10,453 | 1.8% | $39.92 | $417,323 | 2.1% | 5/31/2029 | N |
| McDonald’s | NR/Baa1/BBB+ | 9,765 | 1.7% | $50.82 | $496,218 | 2.5% | 7/31/2033 | N |
| Walgreens | BBB-/Baa2/BBB | 9,369 | 1.6% | $55.00 | $515,295 | 2.6% | 9/30/2048 | Y(7) |
| One Medical(8) | NR/NR/NR | 4,889 | 0.9% | $87.13 | $425,979 | 2.2% | 12/31/2030 | N |
| FedEx Retail(9) | NR/Baa2/BBB | 2,124 | 0.4% | $75.00 | $159,300 | 0.8% | 12/31/2028 | N |
| Vacant (Retail) | 15,657 | 2.7% | $0.00 | $0 | 0.0% | |||
| Retail Subtotal | 52,257 | 9.1% | $55.03(10) | $2,014,114 | 10.3% | |||
| Collateral Total | 575,018 | 100.0% | $34.81(10) | $19,472,527 | 100.0% | |||
| (1) | Information is based on the underwritten rent roll. |
| (2) | Certain ratings are those of the parent company whether or not the parent guarantees the lease. |
| (3) | The leases are on a net basis with the tenant responsible for a pro rata share of all operating expenses and real estate taxes, except for the lease to Politan Row, which is a full service gross lease. |
| (4) | McDonald’s is entitled to a remaining amount of $4,979,640 of free rent owed through August 2021, which amount has been fully reserved by the lender. McDonald’s has four 5-year options to extend the lease at 95% of market rent with 20 months’ notice. |
| (5) | McDonald’s has a one-time right to contract one full floor, but not less than half of one floor, effective August 1, 2028, upon 12 months’ notice and payment of a contraction fee. McDonald’s has a one-time right to terminate its lease effective July 31, 2030, upon 18 months’ notice and payment of a termination fee. |
| (6) | Politan Row is in a rent abatement period through June 2021. $240,784, representing the rent owed between the loan origination date and the end of the tenant’s rent abatement period, has been fully reserved by the lender. Politan Row has one 5-year option to extend the lease at fixed rent of a 2.5% increase over the last year of the current term with 18-24 months’ notice. |
| (7) | Walgreens has rights to terminate its lease effective September 30, 2033, September 30, 2038, or September 20, 2043, each with 12 months’ notice. |
| (8) | One Medical has a rent commencement date of February 1, 2021. $66,840, representing the rent owed between the loan origination date and the tenant’s rent commencement date, has been fully reserved by the lender. One Medical has two 5-year options to extend the lease at fair market rent with 12 months’ notice. |
| (9) | FedEx Retail has two 5-year options to extend the lease at fair market rent with 12-18 months’ notice. |
| (10) | Annual UW Rent PSF excludes vacant space. |
THE INFORMATION IN THIS STRUCTURAL AND COLLATERAL TERM SHEET IS NOT COMPLETE AND MAY BE AMENDED PRIOR TO THE TIME OF SALE. THIS TERM SHEET IS NOT AN OFFER TO SELL THESE SECURITIES AND IT IS NOT A SOLICITATION OF AN OFFER TO BUY THESE SECURITIES IN ANY JURISDICTION WHERE THE OFFER OR SALE IS NOT PERMITTED.
116
| Office - CBD | Loan #8 | Cut-off Date Balance: | $34,555,371 | |
| 110 North Carpenter Street | McDonald’s Global HQ | Cut-off Date LTV: | 41.0% | |
| Chicago, IL 60607 | U/W NCF DSCR: | 1.45x | ||
| U/W NOI Debt Yield: | 11.9% |
The following table presents certain information relating to the lease rollover schedule at the McDonald’s Global HQ Property:
Lease Expiration Schedule(1)(2)
| Year Ending December 31, | No. of Leases Expiring | Expiring NRSF | % of Total NRSF Expiring | Cumulative Expiring NRSF | Cumulative % of Total NRSF Expiring | Annual U/W Base Rent Expiring | % of Total Annual U/W Base Rent Expiring | Annual U/W Base Rent PSF Expiring |
| 2021 | 0 | 0 | 0.0% | 0 | 0.0% | $0 | 0.0% | $0.00 |
| 2022 | 0 | 0 | 0.0% | 0 | 0.0% | $0 | 0.0% | $0.00 |
| 2023 | 0 | 0 | 0.0% | 0 | 0.0% | $0 | 0.0% | $0.00 |
| 2024 | 0 | 0 | 0.0% | 0 | 0.0% | $0 | 0.0% | $0.00 |
| 2025 | 0 | 0 | 0.0% | 0 | 0.0% | $0 | 0.0% | $0.00 |
| 2026 | 0 | 0 | 0.0% | 0 | 0.0% | $0 | 0.0% | $0.00 |
| 2027 | 0 | 0 | 0.0% | 0 | 0.0% | $0 | 0.0% | $0.00 |
| 2028 | 1 | 2,124 | 0.4% | 2,124 | 0.4% | $159,300 | 0.8% | $75.00 |
| 2029 | 1 | 10,453 | 1.8% | 12,577 | 2.2% | $417,323 | 2.1% | $39.92 |
| 2030 | 1 | 4,889 | 0.9% | 17,466 | 3.0% | $425,979 | 2.2% | $87.13 |
| 2031 | 0 | 0 | 0.0% | 17,466 | 3.0% | $0 | 0.0% | $0.00 |
| Thereafter | 3 | 541,895 | 94.2% | 559,361 | 97.3% | $18,469,925 | 94.9% | $34.08 |
| Vacant | 0 | 15,657 | 2.7% | 575,018 | 100.0% | $0 | 0.0% | $0.00 |
| Total/Wtd. Avg. | 6 | 575,018 | 100.0% | $19,472,527 | 100.0% | $34.81(3) |
| (1) | Information is based on the underwritten rent roll. |
| (2) | Certain tenants may have lease termination options that are exercisable prior to the originally stated expiration date of the subject lease and that are not considered in the Lease Rollover Schedule. |
| (3) | Total/Wtd. Avg. UW Rent PSF Rolling excludes vacant space. |
The following table presents historical occupancy percentages at the McDonald’s Global HQ Property:
Historical Occupancy
12/31/2016(1) | 12/31/2017(1) | 12/31/2018(2) | 12/31/2019(2) | 11/4/2020(3) |
| NAP | NAP | 94.2% | 96.4% | 97.3% |
| (1) | Historical occupancy is not available, as construction of the McDonald’s Global HQ Property was completed in 2018. |
| (2) | Information obtained from the borrower. |
| (3) | Information obtained from the underwritten rent roll. |
THE INFORMATION IN THIS STRUCTURAL AND COLLATERAL TERM SHEET IS NOT COMPLETE AND MAY BE AMENDED PRIOR TO THE TIME OF SALE. THIS TERM SHEET IS NOT AN OFFER TO SELL THESE SECURITIES AND IT IS NOT A SOLICITATION OF AN OFFER TO BUY THESE SECURITIES IN ANY JURISDICTION WHERE THE OFFER OR SALE IS NOT PERMITTED.
117
| Office - CBD | Loan #8 | Cut-off Date Balance: | $34,555,371 | |
| 110 North Carpenter Street | McDonald’s Global HQ | Cut-off Date LTV: | 41.0% | |
| Chicago, IL 60607 | U/W NCF DSCR: | 1.45x | ||
| U/W NOI Debt Yield: | 11.9% |
Cash Flow Analysis(1)
| 2019 | TTM 8/31/2020 | U/W | %(2) | U/W $ per SF | |
| Gross Potential Rent(3) | $18,248,384 | $19,124,507 | $21,927,087 | 59.4% | $38.13 |
| Reimbursements(4) | 2,098,850 | 5,290,150 | 14,342,820 | 38.9 | 24.94 |
| Other Income(5) | 68,742 | 67,777 | 636,245 | 1.7 | 1.11 |
| Net Rental Income | $20,415,976 | $24,482,435 | $36,906,152 | 100.0% | $64.18 |
| (Vacancy & Concessions) | 0 | 0 | (1,813,495) | (8.3) | (3.15) |
| Effective Gross Income | $20,415,976 | $24,482,435 | $35,092,657 | 95.1% | $61.03 |
| Real Estate Taxes | 7,595,293 | 8,376,386 | 8,665,944 | 24.7 | 15.07 |
| Insurance | 244,110 | 223,065 | 280,299 | 0.8 | 0.49 |
| Other Operating Expenses | 4,681,212 | 5,070,327 | 6,090,992 | 17.4 | 10.59 |
| Total Operating Expenses | $12,520,615 | $13,669,779 | $15,037,235 | 42.9% | $26.15 |
| Net Operating Income | $7,895,362 | $10,812,656 | $20,055,422 | 57.1% | $34.88 |
| Replacement Reserves | 0 | 0 | 57,502 | 0.2 | 0.10 |
| TI/LC | 0 | 0 | 50,254 | 0.1 | 0.09 |
| Net Cash Flow | $7,895,362 | $10,812,656 | $19,947,666 | 56.8% | $34.69 |
| NOI DSCR(6) | 0.57x | 0.79x | 1.46x | ||
| NCF DSCR(6) | 0.57x | 0.79x | 1.45x | ||
| NOI Debt Yield(6) | 4.7% | 6.4% | 11.9% | ||
| NCF Debt Yield(6) | 4.7% | 6.4% | 11.9% |
| (1) | Further historical information is not available because the McDonald’s Global HQ Property was built in 2018. |
| (2) | Represents (i) percent of Net Rental Income for all revenue fields, (ii) percent of Gross Potential Rent for Vacancy & Credit Loss and (iii) percent of Effective Gross Income for all other fields. |
| (3) | U/W Gross Potential Rent includes vacant space at market rent ($782,850) and straight-line rent averaging for McDonald’s, Walgreens and FedEx Retail ($1,671,710). |
| (4) | Expense Reimbursements on McDonald’s space were subject to a cap of $13.50 PSF in 2019 and $15.25 PSF in 2020, after which the cap is no longer in effect. As a result, historical reimbursements are not indicative of contractual obligations going forward. |
| (5) | U/W Other Income includes parking income of $586,445. The parking operator, Imperial Parking, pays minimum annual rent of $466,200 plus 40% of gross parking revenue in excess of $450,000 and 45% of gross parking revenue in excess of $600,000. |
| (6) | Debt service coverage ratios and debt yields are based on the McDonald’s Global HQ Senior Loan and exclude the McDonald’s Global HQ Subordinate Companion Loan. |
Appraisal. The appraiser concluded to an “as-is” Appraised Value for the McDonald’s Global HQ Property of $409,000,000 as of September 28, 2020. The appraisal also provided a “Hypothetical As If Dark” value of $225,000,000 as of September 28, 2020, which value would result in an Appraised Value Per SF, Cut-off Date LTV Ratio and LTV Ratio at Maturity of $391.29, 74.6% and 30.7%, respectively, based on the principal balance of the McDonald’s Global HQ Senior Loan.
Environmental Matters. According to the Phase I environmental site assessment dated August 28, 2020, there was no evidence of any recognized environmental conditions at the McDonald’s Global HQ Property.
Market Overview and Competition. The McDonald’s Global HQ Property is located at 110 North Carpenter Street, in Chicago’s Fulton Market district on the western border of the central business district. The Chicago-Naperville-Joliet Core Based Statistical Area (the “Chicago CBSA”) ranks second nationally in total office inventory behind New York, with nearly 239 million square feet of office space. Historically, the Chicago CBSA has been considered the business center of the Midwest, as it is a transportation, banking and investment hub, and a research and educational center attracting various corporate headquarters and regional companies.
According to the appraisal, Fulton Market is evolving from a warehouse district historically to a fast-growing and increasingly diverse area of retail, residential, hospitality and office use. Large corporations, restaurateurs and retailers alike are locating to the area, including McDonald’s, Google, Inc., Uber, Rick Bayless, Soho House and Billy Reid. Fulton Market offers housing options, new and alternative office space, sweeping views of the Chicago skyline, work/live/play amenities including award-winning dining and entertainment, and an educated labor pool. Fulton Market features convenient access via Interstate-90/94 and Interstate-290, as well as a number of nearby public transportation options, including new Chicago Transit Authority Green and Pink line stops, Blue Line stations, three Union Pacific Metra routes from the Ogilvie Transportation Center, and commuter service and Amtrak service out of Chicago’s Union Station. In addition, multiple Divvy shared bike stations surround the Fulton Market area.
From 2016 to 2019, the Fulton Market office submarket Class A inventory increased from 550,000 square feet to 1,829,352 square feet, with 1,175,962 square feet of positive absorption and an increase in average asking rate from $45.10 PSF to $49.00 PSF. From year-end 2019 to the end of the second quarter of 2020, Class A inventory increased by 49.6% to 2,736,850 square feet, which meaningful addition of new supply in the short term has pushed direct vacancy to 18.5% and asking rent to $45.28 PSF. 450,922 square feet of positive absorption occurred in the second quarter of 2020, with further leasing activity expected to stabilize the vacancy rate.
THE INFORMATION IN THIS STRUCTURAL AND COLLATERAL TERM SHEET IS NOT COMPLETE AND MAY BE AMENDED PRIOR TO THE TIME OF SALE. THIS TERM SHEET IS NOT AN OFFER TO SELL THESE SECURITIES AND IT IS NOT A SOLICITATION OF AN OFFER TO BUY THESE SECURITIES IN ANY JURISDICTION WHERE THE OFFER OR SALE IS NOT PERMITTED.
118
| Office - CBD | Loan #8 | Cut-off Date Balance: | $34,555,371 | |
| 110 North Carpenter Street | McDonald’s Global HQ | Cut-off Date LTV: | 41.0% | |
| Chicago, IL 60607 | U/W NCF DSCR: | 1.45x | ||
| U/W NOI Debt Yield: | 11.9% |
According to the appraisal, the estimated 2020 population within a one-, three- and five-mile radius was 45,852, 411,562 and 948,591, respectively, and the estimated 2020 average household income within the same radii was $152,747, $133,446 and $111,456, respectively. Within a one-mile radius, population and average household income have grown at a compound annual rate of 2.48% and 3.82%, respectively, from 2000 to 2020.
The following table presents certain information relating to the appraiser’s market rent conclusions for the McDonald’s Global HQ Property:
Market Rent Summary
| Office | Retail (North) | Retail (Southeast) | Retail (Southwest) | |
| Market Rent (PSF) | $33 Net | $60 Modified | $50 Modified | $50 Net |
| Lease Term (Years) | 10 | 10 | 10 | 10 |
| Rent Increase Projection | 2.5% per annum | 2.5% per annum | 2.5% per annum | 2.5% per annum |
The following table presents recent comparable office sales data with respect to the McDonald’s Global HQ Property:
Comparable Office Sales
Property Address | Submarket | Year Built/ Renovated | Total GLA (SF) / Stories | Occupancy | Date of Sale | Sale Price / PSF | Cap Rate |
McDonald’s Global HQ 110 North Carpenter Street | Fulton Market | 2018 / N/A | 575,018(1) / 9 | 97.3%(1) | Sept-20 | $412,500,000 / $717 | 4.86%(2) |
Mondelez Headquarters 905 West Fulton Market | Fulton Market | 2019 / N/A | 98,000 / 5 | 97% | May-20 | $85,000,000 / $867 | 4.50% |
| 500 West Monroe Street | West Loop | 1992 / 2018 | 966,924 / 44 | 99% | Oct-19 | $412,000,000 / $426 | 7.00% |
Fulton West 1330 West Fulton Street | Fulton Market | 2017 / N/A | 289,287 / 9 | 98% | Sept-19 | $167,500,000 / $579 | 5.40% |
811 West Fulton 811 West Fulton Market | Fulton Market | 2018 / N/A | 65,000 / 7 | 100% | Sept-19 | $50,300,000 / $774 | 5.00% |
River Point 444 West Lake Street | West Loop | 2016 / N/A | 1,082,211 / 52 | 99% | Dec-18 | $865,361,600 / $800 | 4.30% |
One South Dearborn 1 South Dearborn Street | Central Loop | 2005 / N/A | 828,538 / 40 | 95% | Jan-18 | $360,250,000 / $435 | 5.99% |
Source: Appraisal.
| (1) | Information obtained from the underwritten rent roll. |
| (2) | Cap Rate calculated based on the lender’s underwritten NOI. |
THE INFORMATION IN THIS STRUCTURAL AND COLLATERAL TERM SHEET IS NOT COMPLETE AND MAY BE AMENDED PRIOR TO THE TIME OF SALE. THIS TERM SHEET IS NOT AN OFFER TO SELL THESE SECURITIES AND IT IS NOT A SOLICITATION OF AN OFFER TO BUY THESE SECURITIES IN ANY JURISDICTION WHERE THE OFFER OR SALE IS NOT PERMITTED.
119
| Office - CBD | Loan #8 | Cut-off Date Balance: | $34,555,371 | |
| 110 North Carpenter Street | McDonald’s Global HQ | Cut-off Date LTV: | 41.0% | |
| Chicago, IL 60607 | U/W NCF DSCR: | 1.45x | ||
| U/W NOI Debt Yield: | 11.9% |
The following table presents recent office leasing data at comparable properties with respect to the McDonald’s Global HQ Property:
Comparable Office Leases
Property Address | Submarket | Year Built | Total GLA (SF) / Stories | Tenant | Lease Date/ Term (yrs) | Lease Size (SF) | Initial Rent PSF | Rent Steps per annum/TI PSF |
McDonald’s Global HQ 110 North Carpenter Street | Fulton Market | 2018 | 575,018(1) / 9 | McDonald’s | Aug-18 / 15.0 | 532,526(1) | $33.40(1) | 2.25% / $97.17 |
Salesforce Tower 333 West Wolf Point Plaza | River North | 2023 | 1,242,956 / 57 | Salesforce.com | Jun-23 / 17.0 | 525,059 | $41.10 | 2.25% / $110.00 |
BMO Tower 310 South Canal Street | West Loop | 2022 | 1,485,861 / 50 | BMO Harris Bank | Apr-22 / 17.0 | 214,710 | $34.50 | 2.50% / $50.00 |
| 625 West Adams Street | West Loop | 2018 | 441,616 / 20 | CDW | Jun-21 / 15.0 | 249,429 | $30.00 | 2.50% / $140.00 |
| 167 North Green Street | Fulton Market | 2020 | 600,000 / 17 | Duff & Phelps | Nov-20 / 15.0 | 46,000 | $36.50 | 2.50% / $125.00 |
| 333 North Green Street | Fulton Market | 2019 | 553,443 / 19 | WPP | Apr-20 / 15.0 | 265,108 | $32.00 | 2.50% / $195.00 |
| 333 North Green Street | Fulton Market | 2019 | 553,443 / 19 | Flexport | Apr-20 / 7.0 | 40,733 | $34.00 | 2.50% / $88.44 |
| 333 North Green Street | Fulton Market | 2019 | 553,443 / 19 | Convene | Dec-19 / 15.0 | 96,077 | $41.00 | 2.00% / $175.00 |
Mondelez Headquarters 905 West Fulton Market | Fulton Market | 2019 | 98,000 / 5 | Mondelez International | Jan-19 / 15.0 | 77,099 | $37.00 | 2.50% / $120.00 |
Source: Appraisal.
| (1) | Information obtained from underwritten rent roll. Initial Rent PSF for the McDonald’s Global HQ Property is a straight line average incorporating the 2.25% annual increases. |
Escrows.
Real Estate Taxes – During a Cash Sweep Period (as defined below), the McDonald’s Global HQ Borrower is required to deposit monthly 1/12 of the annual estimated real estate taxes, which reserve will be disbursed to the McDonald’s Global HQ Borrower when the Cash Sweep Period expires.
Insurance – During a Cash Sweep Period, the McDonald’s Global HQ Borrower is required to deposit monthly 1/12 of the annual estimated insurance premiums (unless the McDonald’s Global HQ Property is covered by a blanket policy), which will be disbursed to the McDonald’s Global HQ Borrower when the Cash Sweep Period expires.
Replacement Reserve – During a Cash Sweep Period, the McDonald’s Global HQ Borrower is required to deposit monthly $9,584 for replacements, which reserve will be disbursed to the McDonald’s Global HQ Borrower when the Cash Sweep Period expires.
TI/LC Reserve – The McDonald’s Global HQ Borrower is required to deposit any lease termination fees received in connection with any termination or modification, reduction of rents, shortening of term or surrender of space. The McDonald’s Global HQ Borrower is also required during a Cash Sweep Period to deposit monthly $95,836 for tenant improvements and leasing commissions, which amounts will be disbursed to the McDonald’s Global HQ Borrower when the Cash Sweep Period expires.
Free Rent Reserve – The McDonald’s Global HQ Borrower deposited at loan origination $6,161,307 for rent credits and an operating expense cap credit owed to McDonald’s ($5,853,682), rent credit to Politan Row ($240,784) and rent credit to One Medical ($66,840), which amounts are required to be disbursed to the McDonald’s Global HQ Borrower in installments through August 2021, to simulate tenant rent payments.
A “Cash Sweep Period” will occur during the existence of any of (a) an event of default until cured or waived by the lender, (b) a DSCR Sweep Period (as defined below) or (c) a Tenant Sweep Period (as defined below). During the continuance of a Cash Sweep Period, all excess cash is required to be held by the lender as additional collateral for the McDonald’s Global HQ Whole Loan. A Cash Sweep Period may be cured once during the McDonald’s Global HQ Whole Loan term; if occurring more than once, all excess cash will continue to be collected and held by the lender and the McDonald’s Global HQ Borrower will not be entitled to any disbursement of such excess cash until the repayment in full of the McDonald’s Global HQ Whole Loan.
A “DSCR Sweep Period” will commence when the trailing twelve month debt service coverage ratio is less than 1.05x, tested quarterly beginning with the calendar quarter ending December 31, 2021, and will end when the trailing twelve month debt service coverage ratio is at least 1.05x, tested quarterly for two consecutive quarters.
THE INFORMATION IN THIS STRUCTURAL AND COLLATERAL TERM SHEET IS NOT COMPLETE AND MAY BE AMENDED PRIOR TO THE TIME OF SALE. THIS TERM SHEET IS NOT AN OFFER TO SELL THESE SECURITIES AND IT IS NOT A SOLICITATION OF AN OFFER TO BUY THESE SECURITIES IN ANY JURISDICTION WHERE THE OFFER OR SALE IS NOT PERMITTED.
120
| Office - CBD | Loan #8 | Cut-off Date Balance: | $34,555,371 | |
| 110 North Carpenter Street | McDonald’s Global HQ | Cut-off Date LTV: | 41.0% | |
| Chicago, IL 60607 | U/W NCF DSCR: | 1.45x | ||
| U/W NOI Debt Yield: | 11.9% |
A “Tenant Sweep Period” will occur during the existence of any of:
(a) McDonald’s (or its replacement tenant) terminating its lease or surrendering all or any portion of its leased space (or giving notice of its intent to terminate its lease or surrender all or any portion of its leased space), until the earlier to occur of (x) McDonald’s revoking such notice(s), termination or surrender, and reaffirming its lease or (y) a replacement tenant acceptable to the lender entering into a replacement lease for the surrendered McDonald’s space and being open for business or in occupancy of more than 50% of the space and paying full, unabated rent pursuant to its replacement lease;
(b) McDonald’s (or its replacement tenant) failing to pay base rent or the occurrence of any other material monetary or non-monetary default under its lease beyond notice and cure periods, until such default is cured to the satisfaction of the lender;
(c) McDonald’s (or its replacement tenant or, if applicable, the lease guarantor of a replacement tenant) availing itself of any creditor’s rights laws, until (i) McDonald’s (or its replacement tenant or, if applicable, the lease guarantor of a replacement tenant) has assumed its lease without any material revisions and a court has affirmed such assumption of the lease pursuant to a final, non-appealable order, and (ii) McDonald’s (or its replacement tenant) is operating its business or is in occupancy of more than 50% of the space for at least 60 consecutive business days and is paying full rent as required under the lease; or
(d) McDonald’s (or its replacement tenant) experiences a downgrade in its long-term unsecured debt rating below “BBB-” by S&P or the equivalent by any rating agency rating securities backed by the McDonald’s Global HQ Whole Loan, until its long-term unsecured debt rating is at least “BBB-” by S&P or the equivalent by any rating agency rating securities backed by the McDonald’s Global HQ Whole Loan.
Lockbox and Cash Management. The McDonald’s Global HQ Whole Loan is structured with a hard lockbox and in place cash management. Revenues from the McDonald’s Global HQ Property are required to be deposited by tenants directly into the lockbox account, then transferred on each business day to the lender-controlled cash management account and disbursed according to the McDonald’s Global HQ Whole Loan documents.
Property Management. The McDonald’s Global HQ Property is managed by Sterling Bay Property Management, LLC, a real estate firm specializing in built-to-suit urban headquarter campuses whose clients include Google, McDonald’s Uber and Hilshire Brands.
Partial Release. Not permitted.
Real Estate Substitution. Not permitted.
Subordinate and Mezzanine Indebtedness. The McDonald’s Global HQ Property also secures four pari passu senior promissory notes (the “McDonald’s Global HQ Pari Passu Companion Loan”) which had an aggregate original principal balance of $135,000,000, and the McDonald’s Global HQ Subordinate Companion Loan, which had an original principal balance of $110,000,000. The McDonald’s Global HQ Mortgage Loan, the McDonald’s Global HQ Pari Passu Companion Loan and the McDonald’s Global HQ Subordinate Companion Loan accrue interest at the same rate. The McDonald’s Global HQ Mortgage Loan is entitled to payments of interest on a pro rata and pari passu basis with the McDonald’s Global HQ Pari Passu Companion Loan, which payments are senior in right of payment to the McDonald’s Global HQ Subordinate Companion Loan. Payments of principal will amortize the McDonald’s Global HQ Mortgage Loan and the McDonald’s Global HQ Pari Passu Companion Loan in 186 months, before the McDonald’s Global HQ Subordinate Companion Loan begins to amortize. See Annex A-4 (the amortization schedule for the McDonald’s Global HQ Senior Loan) in the Preliminary Prospectus. The holders of the promissory notes evidencing the McDonald’s Global HQ Whole Loan have entered into a co-lender agreement that sets forth the allocation of collections on the McDonald’s Global HQ Whole Loan. See “Description of the Mortgage Pool—The Whole Loans—The Non-Serviced AB Whole Loans—The McDonald’s Global HQ Whole Loan” and “Pooling and Servicing Agreement—Servicing of the Non-Serviced Mortgage Loans” in the Preliminary Prospectus.
Subordinate Note Summary
| B-Note Original Principal Balance | B-Note Interest Rate | Original Term (mos.) | Original Amort. Term (mos.) | Original IO Term (mos.) | Whole Loan UW NCF DSCR | Whole Loan UW NOI Debt Yield | Whole Loan Cut-off Date LTV | ||
| McDonald’s Global HQ Subordinate Companion Loan | $110,000,000 | 2.9350% | 120 | 0 | 120 | 1.17x | 7.2% | 67.9% | |
Ground Lease. None.
Right of First Offer / Right of First Refusal. None.
Terrorism Insurance. The McDonald’s Global HQ Borrower is required to obtain and maintain property insurance that covers perils and acts of terrorism and is required to obtain and maintain business interruption insurance for 24 months plus a 12-month extended period of indemnity. See “Risk Factors—Risks Relating to the Mortgage Loans—Terrorism Insurance May Not Be Available for All Mortgaged Properties” in the Preliminary Prospectus.
THE INFORMATION IN THIS STRUCTURAL AND COLLATERAL TERM SHEET IS NOT COMPLETE AND MAY BE AMENDED PRIOR TO THE TIME OF SALE. THIS TERM SHEET IS NOT AN OFFER TO SELL THESE SECURITIES AND IT IS NOT A SOLICITATION OF AN OFFER TO BUY THESE SECURITIES IN ANY JURISDICTION WHERE THE OFFER OR SALE IS NOT PERMITTED.
121
| Self Storage – Self Storage | Loan #9 | Cut-off Date Balance: | $32,600,000 | |
| Property Addresses – Various | Inland SE Self Storage Portfolio | Cut-off Date LTV: | 58.7% | |
| U/W NCF DSCR: | 1.85x | |||
| U/W NOI Debt Yield: | 9.5% |
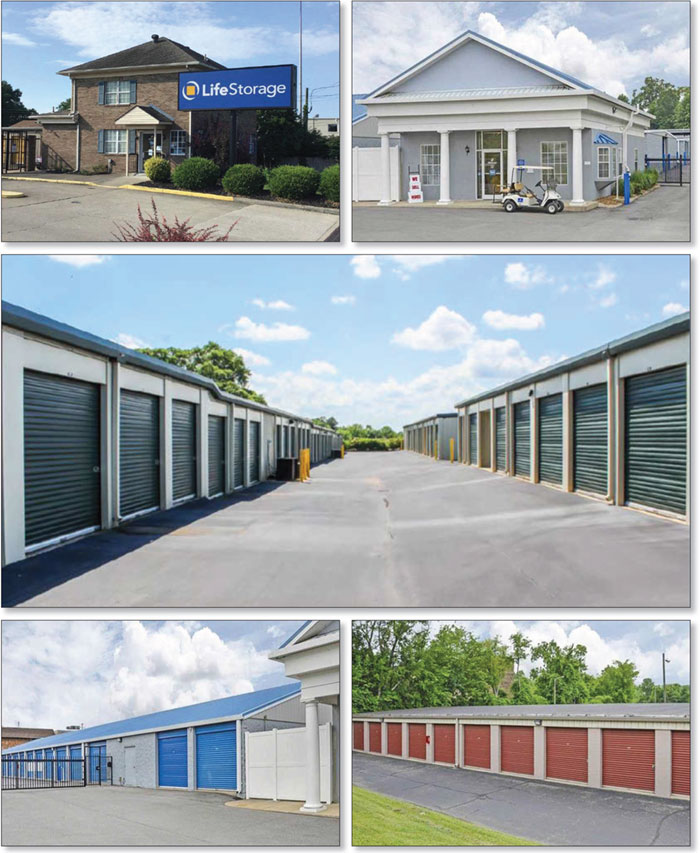
THE INFORMATION IN THIS STRUCTURAL AND COLLATERAL TERM SHEET IS NOT COMPLETE AND MAY BE AMENDED PRIOR TO THE TIME OF SALE. THIS TERM SHEET IS NOT AN OFFER TO SELL THESE SECURITIES AND IT IS NOT A SOLICITATION OF AN OFFER TO BUY THESE SECURITIES IN ANY JURISDICTION WHERE THE OFFER OR SALE IS NOT PERMITTED.
122
| Self Storage – Self Storage | Loan #9 | Cut-off Date Balance: | $32,600,000 | |
| Property Addresses – Various | Inland SE Self Storage Portfolio | Cut-off Date LTV: | 58.7% | |
| U/W NCF DSCR: | 1.85x | |||
| U/W NOI Debt Yield: | 9.5% |
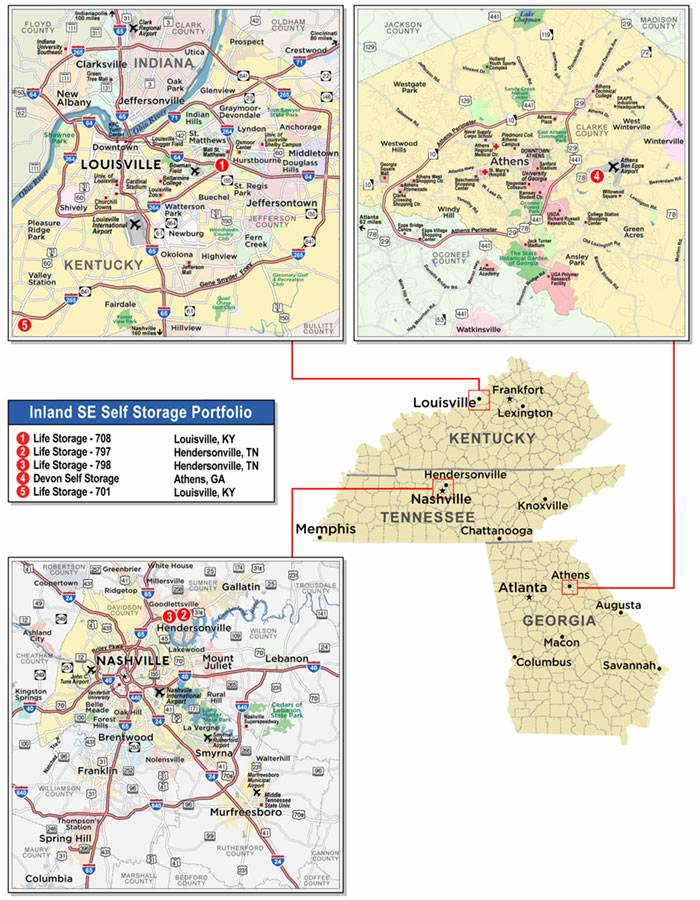
THE INFORMATION IN THIS STRUCTURAL AND COLLATERAL TERM SHEET IS NOT COMPLETE AND MAY BE AMENDED PRIOR TO THE TIME OF SALE. THIS TERM SHEET IS NOT AN OFFER TO SELL THESE SECURITIES AND IT IS NOT A SOLICITATION OF AN OFFER TO BUY THESE SECURITIES IN ANY JURISDICTION WHERE THE OFFER OR SALE IS NOT PERMITTED.
123
| No. 9 – Inland SE Self Storage Portfolio | |||||||
| Mortgage Loan Information | Mortgaged Property Information | ||||||
| Mortgage Loan Seller: | Wells Fargo Bank, National Association | Single Asset/Portfolio: | Portfolio | ||||
Credit Assessment (Fitch/KBRA/S&P): | NR/NR/NR | Property Type – Subtype: | Self Storage – Self Storage | ||||
| Original Principal Balance: | $32,600,000 | Location: | Various | ||||
| Cut-off Date Balance: | $32,600,000 | Size: | 407,213 SF | ||||
| % of Initial Pool Balance: | 3.6% | Cut-off Date Balance Per SF: | $80.06 | ||||
| Loan Purpose: | Acquisition | Maturity Date Balance Per SF: | $71.20 | ||||
| Borrower Sponsor: | Inland Private Capital Corporation | Year Built/Renovated: | Various – See Table | ||||
| Guarantor: | Inland Private Capital Corporation | Title Vesting: | Fee | ||||
| Mortgage Rate: | 2.8910% | Property Manager(4): | Various | ||||
| Note Date: | December 15, 2020 | Current Occupancy (As of)(5): | 89.2% (11/11/2020) | ||||
| Seasoning: | 1 month | 2019 Occupancy(5): | 88.3% | ||||
| Maturity Date: | January 11, 2031 | 2018 Occupancy(5)(6): | 88.5% | ||||
| IO Period: | 60 months | 2017 Occupancy(5)(6): | 90.7% | ||||
| Loan Term (Original): | 120 months | 2016 Occupancy (7): | NAV | ||||
| Amortization Term (Original): | 360 months | As-Is Appraised Value(8): | $55,500,000 | ||||
| Loan Amortization Type: | Interest-only, Amortizing Balloon | As-Is Appraised Value Per SF(8): | $136.29 | ||||
| Call Protection: | L(25),GRTR 1% or YM(88),O(7) | As-Is Appraisal Valuation Date(8): | November 25, 2020 | ||||
| Lockbox Type: | Springing | Underwriting and Financial Information(9) | |||||
| Additional Debt: | Yes | TTM NOI (Various): | $3,246,907 | ||||
| Additional Debt Type (Balance)(1): | Future Unsecured Debt | YE 2019 NOI: | $3,365,564 | ||||
| YE 2018 NOI: | $3,466,891 | ||||||
| YE 2017 NOI: | $3,404,878 | ||||||
| U/W Revenues: | $4,686,487 | ||||||
| U/W Expenses: | $1,599,204 | ||||||
| U/W NOI: | $3,087,283 | ||||||
| U/W NCF: | $3,011,485 | ||||||
| Escrows and Reserves(2) | U/W DSCR based on NOI/NCF: | 1.90x / 1.85x | |||||
| Initial | Monthly | Cap | U/W Debt Yield based on NOI/NCF: | 9.5% / 9.2% | |||
| Taxes | $0 | Springing | NAP | U/W Debt Yield at Maturity based on NOI/NCF: | 10.6% / 10.4% | ||
| Insurance | $0 | Springing | NAP | Cut-off Date LTV Ratio(8): | 58.7% | ||
| Replacement Reserve | $155,000 | $5,892 | $155,000 | LTV Ratio at Maturity(8): | 52.2% | ||
| Trust Reserve(3) | $0 | Springing | NAP | ||||
| Sources and Uses | |||||||||
| Sources | Uses | ||||||||
| Original loan amount | $32,600,000 | 60.3% | Purchase price | $53,300,000 | 98.7% | ||||
| Sponsor equity | 21,422,016 | 39.7 | Upfront reserves | 155,000 | 0.3 | ||||
| Closing costs | 567,016 | 1.0 | |||||||
| Total Sources | $54,022,016 | 100.0% | Total Uses | $54,022,016 | 100.0% | ||||
| (1) | See “Permitted Additional Unsecured Subordinate Indebtedness” section below. |
| (2) | See “Escrows” section below. |
| (3) | Additionally, and unrelated and separate from the Inland SE Self Storage Portfolio Mortgage Loan (as defined below), the Inland SE Self Storage Portfolio Borrower (as defined below) funded $5,114,500 into a separate trust reserve account controlled by the borrower (the “Borrower Trust Account”), which will be used for pay for (i) repairs and replacements of the structure, foundation, roof, exterior walls, and parking lot improvements at the Inland SE Self Storage Properties (as defined below), (ii) leasing commissions, (iii) any environmental costs, (iv) any repairs identified in the property condition reports, (v) insurance deductibles, (vi) costs arising related to extraordinary measures taken to conserve and protect the property in the context of any pandemic, including COVID-19, and (vii) any other necessary property improvements at the Inland SE Self Storage Properties. Upon the occurrence of a Conversion Event or Drop Down Distribution (as defined in “Escrows” section below), the borrower will be required to deposit the funds with the lender as additional collateral for the loan. |
| (4) | See “Property Management” section below. |
| (5) | See “Historical Occupancy” section below for property-level occupancy statistics. |
| (6) | 2017 and 2018 occupancy excludes the Devon Self Storage Property, as the borrower sponsor acquired the property in October 2020 and such information was not provided by the seller. |
| (7) | The borrower sponsor acquired the Inland SE Self Storage Properties in September 2020 and October 2020 and 2016 occupancy information was not provided by the seller. |
| (8) | The individual property level appraised values total $53,150,000, which would equate to a Cut-off Date LTV Ratio and LTV Ratio at Maturity of 61.3% and 54.6%, respectively; however, the appraiser concluded to a portfolio value of $55,500,000 based on the assumption that the individual properties would be sold as part of a multi-property portfolio. See “Appraisals” section below for property-level appraised values. |
THE INFORMATION IN THIS STRUCTURAL AND COLLATERAL TERM SHEET IS NOT COMPLETE AND MAY BE AMENDED PRIOR TO THE TIME OF SALE. THIS TERM SHEET IS NOT AN OFFER TO SELL THESE SECURITIES AND IT IS NOT A SOLICITATION OF AN OFFER TO BUY THESE SECURITIES IN ANY JURISDICTION WHERE THE OFFER OR SALE IS NOT PERMITTED.
124
| Self Storage – Self Storage | Loan #9 | Cut-off Date Balance: | $32,600,000 | |
| Property Addresses – Various | Inland SE Self Storage Portfolio | Cut-off Date LTV: | 58.7% | |
| U/W NCF DSCR: | 1.85x | |||
| U/W NOI Debt Yield: | 9.5% |
| (9) | While the Inland SE Self Storage Portfolio Mortgage Loan was originated after the emergence of the novel coronavirus pandemic and the economic disruption resulting from measures to combat the pandemic, the pandemic is an evolving situation and could impact the Inland SE Self Storage Portfolio Mortgage Loan more severely than assumed in the underwriting of the Inland SE Self Storage Portfolio Mortgage Loan and could adversely affect the NOI, NCF and occupancy information, as well as the appraised value and the DSCR, LTV and Debt Yield metrics presented above. See “Risk Factors—Risks Related to Market Conditions and Other External Factors—Coronavirus Pandemic Has Adversely Affected the Global Economy and Will Likely Adversely Affect the Performance of the Mortgage Loans” in the Preliminary Prospectus. |
The Mortgage Loan. The mortgage loan (the “Inland SE Self Storage Portfolio Mortgage Loan”) is evidenced by a single promissory note secured by the fee simple interests in five self storage properties located in Louisville, Kentucky (2), Hendersonville, Tennessee (2), and Athens, Georgia.
The Borrower and Borrower Sponsor. The borrower is Self-Storage Portfolio XII DST (the “Inland SE Self Storage Portfolio Borrower”), a Delaware statutory trust (“DST”) that is a single purpose, bankruptcy-remote entity. The Inland SE Self Storage Portfolio Borrower has entered into (i) a master lease with an affiliated master tenant with respect to the Devon Self Storage Property and (ii) a master lease with an affiliated master tenant with respect to the four remaining Inland SE Self Storage Properties. The master tenants are structured to be single purpose entities. The master tenants’ interests in the master leases and all rents are assigned to the lender. The borrower sponsor has a 100% ownership interest in the master tenants. The master leases are subordinate to the Inland SE Self Storage Portfolio Mortgage Loan. There is no income underwritten from the master lease as the Inland SE Self Storage Portfolio was underwritten to the underlying property income. The borrower is managed by an affiliated signatory trustee that is controlled by the guarantor. The signatory trustee and the master tenant have one independent director, which is the same for each. Legal counsel to the Inland SE Self Storage Portfolio Borrower delivered a non-consolidation opinion in connection with the origination of the Inland SE Self Storage Portfolio Mortgage Loan. See “Description of the Mortgage Pool—Delaware Statutory Trusts” in the Preliminary Prospectus.
The lender has the right to require the Inland SE Self Storage Portfolio Borrower to convert from a Delaware statutory trust to a Delaware limited liability company upon: (i) written notice from the lender that the lender has determined that the Inland SE Self Storage Portfolio is in jeopardy of being foreclosed upon due to a default under the loan documents unless the borrower, within 10 business days of such notice, provides a reasoned opinion of tax counsel that either (a) the borrower is able to remedy the default situation without effectuating a conversion or (b) that effectuating a conversion would not reasonably be expected to improve the ability of the borrower to remedy the default; provided, that, if the borrower has failed to remedy such default to the lender’s satisfaction within 30 days of receipt of tax counsel opinion, the borrower shall effect a Conversion Event; or (ii) if, at least 30 days’ prior to the maturity date, the lender such not received evidence (either a loan commitment or an executed contract of sale) that the Inland SE Self Storage Portfolio Mortgage Loan will be paid off in full on the maturity date.
The borrower sponsor and carve-out guarantor of the Inland SE Self Storage Portfolio Mortgage Loan is Inland Private Capital Corporation (“IPCC”). IPCC is an industry leader in securitized 1031 exchange transactions, sponsoring over 255 private placement programs since its inception which have provided more than $5.5 billion in equity and have served over 12,500 investors. According to the borrower sponsor, through December 31, 2019, IPCC-sponsored private placements have included 716 properties comprised of more than 52 million square feet of gross leasable area. According to the borrower sponsor, as of December 31, 2019, IPCC has $7.8 billion assets under management, 8.1% of which is attributed to self storage properties. IPCC has had previous foreclosures and is involved in ongoing foreclosures unrelated to the Inland SE Self Storage Portfolio. See “Description of the Mortgage Pool—Loan Purpose; Default History, Bankruptcy Issues and Other Proceedings” in the Preliminary Prospectus.
The Properties. The Life Storage - 708 Property, the Life Storage - 797 Property, the Life Storage – 798 Property, the Devon Self Storage Property, and the Life Storage - 701 Property (collectively, the “Inland SE Self Storage Properties”) comprise five self storage properties built between 1986 and 2006. As of November 11, 2020 the Inland SE Self Storage Properties were 89.2% occupied with individual property occupancy rates ranging from 81.1% to 95.3%. The Inland SE Self Storage Properties comprise 407,213 square feet of rentable area, including 3,253 traditional self storage units (22.3% climate controlled).
Life Storage - 708 Property
The Life Storage - 708 Property is a 682-unit, 76,180 square-foot self storage facility located in Louisville, Kentucky, and situated on a 3.7-acre site. Constructed in 1987, the property comprises 8 one- and two-story buildings and does not contain any climate controlled units. Amenities include surveillance cameras, keypad entry, and on-site management. As of November 11, 2020, the Life Storage - 708 Property was 89.8% occupied and has averaged 90.1% occupancy since 2017.
Life Storage - 797 Property
The Life Storage - 797 Property is a 644-unit, 93,465 square-foot self storage facility located in Hendersonville, Tennessee, and situated on a 5.7-acre site. Constructed in 1986, the property comprises 16 one-story buildings and 23.9% of the units are climate controlled. Amenities include surveillance cameras and keypad entry. As of November 11, 2020, the Life Storage - 797 Property was 95.3% occupied and has averaged 89.5% occupancy since 2017.
Life Storage - 798 Property
The Life Storage - 798 Property is a 580-unit, 68,225 square-foot self storage facility located in Hendersonville, Tennessee, and situated on a 5.5-acre site. Constructed in 1997, the property comprises 8 one-story buildings and 44.3% of the units are climate controlled. Amenities include surveillance cameras, keypad entry, and on-site management. As of November 11, 2020, the Life Storage - 798 Property was 92.9% occupied and has averaged 89.6% occupancy since 2017.
THE INFORMATION IN THIS STRUCTURAL AND COLLATERAL TERM SHEET IS NOT COMPLETE AND MAY BE AMENDED PRIOR TO THE TIME OF SALE. THIS TERM SHEET IS NOT AN OFFER TO SELL THESE SECURITIES AND IT IS NOT A SOLICITATION OF AN OFFER TO BUY THESE SECURITIES IN ANY JURISDICTION WHERE THE OFFER OR SALE IS NOT PERMITTED.
125
| Self Storage – Self Storage | Loan #9 | Cut-off Date Balance: | $32,600,000 | |
| Property Addresses – Various | Inland SE Self Storage Portfolio | Cut-off Date LTV: | 58.7% | |
| U/W NCF DSCR: | 1.85x | |||
| U/W NOI Debt Yield: | 9.5% |
Devon Self Storage Property
The Devon Self Storage Property is a 708-unit, 102,775 square-foot self storage facility located in Athens, Georgia, and situated on an 8.4-acre site. Constructed in 2006 and 2011, the property comprises 10 one-story buildings and 44.4% of the units are climate controlled. Amenities include surveillance cameras, keypad entry, and on-site management. As of November 11, 2020, the Devon Self Storage Property was 81.1% occupied and has averaged 84.9% occupancy since 2019.
Life Storage - 701 Property
The Life Storage - 701 Property is a 639-unit, 66,568 square-foot self storage facility located in Louisville, Kentucky, and situated on a 3.7-acre site. Constructed in 1994, the property comprises 16 one- and two-story buildings and does not contain any climate controlled units. Amenities include surveillance cameras and keypad entry. As of November 11, 2020, the Life Storage - 701 Property was 88.9% occupied and has averaged 90.3% occupancy since 2017.
COVID-19 Update. As of January 15, 2021, the Inland SE Self Storage Properties are open and operating with normal business hours. Total accounts receivable as of December 31, 2020 totaled $32,174 (9.1% of total underwritten base rent per month) compared to $17,703 (5.0% of total underwritten base rent per month) as of November 30, 2020. The first debt service payment is due in February 2021 and, as of the date hereof, the Inland SE Self Storage Portfolio Mortgage Loan is not subject to any modification or forbearance requests.
The following table presents certain information relating to the Inland SE Self Storage Properties:
| Property Name – Location | Cut-off Date Balance | Cut-off Date Balance PSF |
% of Total Balance | Appraised Value | Cut-off Date LTV Ratio | U/W NCF | % Total U/W NCF |
| Life Storage - 708 - Louisville, KY | $7,550,000 | $99.11 | 23.2% | $11,700,000 | 64.5% | $717,516 | 23.8% |
| Life Storage - 797 - Hendersonville, TN | $7,200,000 | $77.03 | 22.1% | $11,450,000 | 62.9% | $691,706 | 23.0% |
| Life Storage - 798 - Hendersonville, TN | $7,000,000 | $102.60 | 21.5% | $10,800,000 | 64.8% | $648,102 | 21.5% |
| Devon Self Storage - Athens, GA | $5,650,000 | $54.97 | 17.3% | $11,200,000 | 50.4% | $457,669 | 15.2% |
| Life Storage - 701 - Louisville, KY | $5,200,000 | $78.12 | 16.0% | $8,000,000 | 65.0% | $496,492 | 16.5% |
| Total/Weighted Average | $32,600,000 | $80.06 | 100.0% | $55,500,000(1) | 58.7%(1) | $3,011,485 | 100.0% |
| (1) | The individual property level appraised values total $53,150,000, which would equate to a Cut-off Date LTV Ratio and LTV Ratio at Maturity of 61.3% and 54.6%, respectively; however, the appraiser concluded to a portfolio value of $55,500,000 based on the assumption that the individual properties would be sold as part of a multi-property portfolio. |
The following table presents information with respect to the unit mix of the Inland SE Self Storage Properties:
| Property Name – Location | Year Built/ Renovated | Net Rentable Area (SF) | % GLA | Self Storage Units | % Climate Controlled | Current Occupancy (11/11/2020) |
| Life Storage - 708 - Louisville, KY | 1987/NAP | 76,180 | 18.7% | 682 | 0.0% | 89.8% |
| Life Storage - 797 - Hendersonville, TN | 1986/NAP | 93,465 | 23.0% | 644 | 23.9% | 95.3% |
| Life Storage - 798 - Hendersonville, TN | 1997/NAP | 68,225 | 16.8% | 580 | 44.3% | 92.9% |
| Devon Self Storage - Athens, GA | 2006/2011 | 102,775 | 25.2% | 708 | 44.4% | 81.1% |
| Life Storage - 701 - Louisville, KY | 1994/NAP | 66,568 | 16.3% | 639 | 0.0% | 88.9% |
| Total/Weighted Average | 407,213 | 100.0% | 3,253 | 22.3% | 89.2% |
The following table presents historical occupancy percentages at the Inland SE Self Storage Properties:
Historical Occupancy
Property | 2017(1)(2) | 2018(1)(2) | 2019(1)(2) | 11/11/2020(3) |
| Life Storage - 708 | 92.3% | 90.0% | 88.2% | 89.8% |
| Life Storage - 797 | 89.5%(4) | 85.9% | 87.2% | 95.3% |
| Life Storage - 798 | 89.8%(4) | 88.1% | 87.5% | 92.9% |
| Devon Self Storage | NAV(5) | NAV(5) | 88.7% | 81.1% |
| Life Storage - 701 | 91.3% | 90.6% | 90.3% | 88.9% |
| (1) | Information obtained from the borrower. |
| (2) | Represents the average occupancy rate over the course of each year. |
| (3) | Information obtained from the underwritten rent roll. |
| (4) | Represents the average occupancy between June 2017 and December 2017. |
| (5) | The borrower sponsor acquired the Devon Self Storage Property in October 2020 and 2017 and 2018 occupancy information was not provided by the seller. |
THE INFORMATION IN THIS STRUCTURAL AND COLLATERAL TERM SHEET IS NOT COMPLETE AND MAY BE AMENDED PRIOR TO THE TIME OF SALE. THIS TERM SHEET IS NOT AN OFFER TO SELL THESE SECURITIES AND IT IS NOT A SOLICITATION OF AN OFFER TO BUY THESE SECURITIES IN ANY JURISDICTION WHERE THE OFFER OR SALE IS NOT PERMITTED.
126
| Self Storage – Self Storage | Loan #9 | Cut-off Date Balance: | $32,600,000 | |
| Property Addresses – Various | Inland SE Self Storage Portfolio | Cut-off Date LTV: | 58.7% | |
| U/W NCF DSCR: | 1.85x | |||
| U/W NOI Debt Yield: | 9.5% |
Operating History and Underwritten Net Cash Flow. The following table presents certain information relating to the historical operating performance and underwritten net cash flow at the Inland SE Self Storage Properties:
Cash Flow Analysis
| 2017(1) | 2018 | 2019 | TTM Various(2) | U/W(3) | %(4) | U/W $ per SF | |
| Base Rent | $4,424,511 | $4,445,664 | $4,326,701 | $4,263,207 | $4,263,207 | 77.9% | $10.47 |
| Grossed Up Vacant Space | 0 | 0 | 0 | 0 | 785,980 | 14.4 | 1.93 |
| Gross Potential Rent | $4,424,511 | $4,445,664 | $4,326,701 | $4,263,207 | $5,049,187 | 92.3% | $12.40 |
| Other Income(5) | 345,111 | 360,425 | 438,104 | 423,280 | 423,280 | 7.7 | 1.04 |
| Net Rental Income | $4,769,622 | $4,806,089 | $4,764,805 | $4,686,487 | $5,472,467 | 100.0% | $13.44 |
| (Vacancy) | 0 | 0 | 0 | 0 | (785,980)(6) | (15.6) | (1.93) |
| Effective Gross Income | $4,769,622 | $4,806,089 | $4,764,805 | $4,686,487 | $4,686,487 | 85.6% | $11.51 |
| Real Estate Taxes | 322,962 | 341,832 | 334,891 | 344,701 | 344,397 | 7.3 | 0.85 |
| Insurance | 42,992 | 40,936 | 46,109 | 51,272 | 41,687 | 0.9 | 0.10 |
| Management Fee | 38,425 | 38,463 | 38,975 | 54,812 | 234,324 | 5.0 | 0.58 |
| Other Operating Expenses | 960,366 | 917,967 | 979,266 | 988,795 | 978,796 | 20.9 | 2.40 |
| Total Operating Expenses | $1,364,745 | $1,339,198 | $1,399,241 | $1,439,580 | $1,599,204 | 34.1% | $3.93 |
| Net Operating Income | $3,404,878 | $3,466,891 | $3,365,564 | $3,246,907 | $3,087,283 | 65.9% | $7.58 |
| Replacement Reserves | 0 | 0 | 0 | 0 | 75,798 | 1.6 | 0.19 |
| Net Cash Flow | $3,404,878 | $3,466,891 | $3,365,564 | $3,246,907 | $3,011,485 | 64.3% | $7.40 |
| NOI DSCR | 2.09x | 2.13x | 2.07x | 2.00x | 1.90x | ||
| NCF DSCR | 2.09x | 2.13x | 2.07x | 2.00x | 1.85x | ||
| NOI Debt Yield | 10.4% | 10.6% | 10.3% | 10.0% | 9.5% | ||
| NCF Debt Yield | 10.4% | 10.6% | 10.3% | 10.0% | 9.2% |
| (1) | Represents Annualized 7 12/31/2017 for the Life Storage – 797 Property and the Life Storage – 798 Property. |
| (2) | Represents TTM 8/31/2020 for the Devon Self Storage Property and the TTM 10/31/2020 for the remaining Inland SE Self Storage Properties. |
| (3) | For the avoidance of doubt, no COVID-19 specific adjustments have been incorporated in the lender U/W. |
| (4) | Represents (i) percent of Net Rental Income for all revenue fields, (ii) percent of Gross Potential Rent for Vacancy and (iii) percent of Effective Gross Income for all other fields. |
| (5) | Other income includes late payment charges, locks, boxes, insurance, U-Haul income, and other miscellaneous charges. |
| (6) | The underwritten economic vacancy is 15.6%. The Inland SE Self Storage Properties were 89.2% physically occupied as of November 11, 2020. |
THE INFORMATION IN THIS STRUCTURAL AND COLLATERAL TERM SHEET IS NOT COMPLETE AND MAY BE AMENDED PRIOR TO THE TIME OF SALE. THIS TERM SHEET IS NOT AN OFFER TO SELL THESE SECURITIES AND IT IS NOT A SOLICITATION OF AN OFFER TO BUY THESE SECURITIES IN ANY JURISDICTION WHERE THE OFFER OR SALE IS NOT PERMITTED.
127
| Self Storage – Self Storage | Loan #9 | Cut-off Date Balance: | $32,600,000 | |
| Property Addresses – Various | Inland SE Self Storage Portfolio | Cut-off Date LTV: | 58.7% | |
| U/W NCF DSCR: | 1.85x | |||
| U/W NOI Debt Yield: | 9.5% |
Appraisals. The appraiser concluded to an “as-is” appraised value for the Inland SE Self Storage Properties of $55,500,000 as of November 25, 2020, based on the assumption that the individual properties would be sold as a multi-property portfolio. The sum of the individual “as-is” appraised values for each of the Inland SE Self Storage Properties equates to $53,150,000, as of November 12, 2020 to November 19, 2020.
Environmental Matters. Based on Phase I environmental site assessments dated as of September 1, 2020 and September 18, 2020, there was no evidence of any recognized environmental conditions at any of the Inland SE Self Storage Properties.
Market Overview and Competition. The Inland SE Self Storage Properties are located within the metropolitan statistical areas of Louisville, Kentucky (two properties, 39.1% of ALA), Nashville, Tennessee (two properties, 43.6% of ALA), and Athens, Georgia (one property, 17.3% of ALA).
The following table presents certain local demographic data related to the Inland SE Self Storage Properties:
| Property Name – Location | 2020 Population (within 1-mi. / 3-mi. / 5-mi. Radius) | 2020 Average Household Income (within 1-mi. / 3-mi. / 5-mi. Radius) |
| Life Storage - 708 - Louisville, KY | 11,384 / 100,274 / 240,527 | $89,624 / $92,128 / $96,398 |
| Life Storage - 797 - Hendersonville, TN | NAV / 46,341 / 102,319 | NAV / $92,652 / $89,479 |
| Life Storage - 798 - Hendersonville, TN | NAV / 44,023 / 108,810 | NAV / $86,280 / $86,215 |
| Devon Self Storage - Athens, GA | 4,813 / 57,868 / 93,607 | $43,181 / $47,848 / $55,032 |
| Life Storage - 701 - Louisville, KY | 9,619 / 84,812 / 179,674 | $56,617 / $60,969 / $57,468 |
The following table presents certain information relating to certain self storage lease comparables provided in the appraisals for the Inland SE Self Storage Properties:
| Property Name – Location | Current Occupancy (11/11/2020) | Competitive Set Average Occupancy Rate | Monthly Underwritten Rent/Unit | Appraiser’s Monthly Market Rent/Unit |
| Life Storage - 708 - Louisville, KY | 89.8% | 89.9% | $135 | $126 |
| Life Storage - 797 - Hendersonville, TN | 95.3% | 87.0% | $133 | $111 |
| Life Storage - 798 - Hendersonville, TN | 92.9% | 87.4% | $143 | $116 |
| Devon Self Storage - Athens, GA | 81.1% | 79.8% | $135 | $125 |
| Life Storage - 701 - Louisville, KY | 88.9% | 89.6% | $102 | $100 |
The following table presents certain information relating to some comparable self storage properties for the Life Storage - 708 Property:
Competitive Set(1)
(Life Storage - 708 Property)
Life Storage - 708 (Subject) | Public Storage | Lyndon Mini Storage | A-1 Self Storage | Public Storage | J-Town Village Storage | |
| Location | Louisville, KY | Louisville, KY | Louisville, KY | Louisville, KY | Louisville, KY | Louisville, KY |
| Distance to Ormond Depot | -- | 1.7 miles | 2.2 miles | 2.6 miles | 3.0 miles | 3.3 miles |
| Property Type | Self Storage | Self Storage | Self Storage | Self Storage | Self Storage | Self Storage |
| Year Built/Renovated | 1987/NAP | 1987/NAP | 1989/NAP | 1995/NAP | 2017/NAP | 1987/NAP |
| Total Units | 682(2) | 329 | 100 | 403 | 682 | 200 |
| % of Climate Controlled Units | 0.0% | 0.0% | 0.0% | 0.0% | NAV | 0.0% |
| Total SF | 76,180 SF(2) | 34,320 SF | 10,724 SF | 51,600 SF | 87,000 SF | 20,000 SF |
| Occupancy | 89.8%(2) | 97.3% | 92.0% | 70.0% | 95.0% | 95.0% |
| (1) | Information obtained from the appraisal. |
| (2) | Information obtained from the underwritten rent roll as of 11/11/2020. |
THE INFORMATION IN THIS STRUCTURAL AND COLLATERAL TERM SHEET IS NOT COMPLETE AND MAY BE AMENDED PRIOR TO THE TIME OF SALE. THIS TERM SHEET IS NOT AN OFFER TO SELL THESE SECURITIES AND IT IS NOT A SOLICITATION OF AN OFFER TO BUY THESE SECURITIES IN ANY JURISDICTION WHERE THE OFFER OR SALE IS NOT PERMITTED.
128
| Self Storage – Self Storage | Loan #9 | Cut-off Date Balance: | $32,600,000 | |
| Property Addresses – Various | Inland SE Self Storage Portfolio | Cut-off Date LTV: | 58.7% | |
| U/W NCF DSCR: | 1.85x | |||
| U/W NOI Debt Yield: | 9.5% |
The following table presents certain information relating to some comparable self storage properties for the Life Storage - 797 Property and the Life Storage - 798 Property:
Competitive Set(1)
(Life Storage - 797 Property and Life Storage - 798 Property)
Life Storage – 797 (Subject) | Life Storage - 798 (Subject) | Assured Storage Hendersonville | New Shackle Self Storage | Go Store It | Istorage - Hendersonville | Storplace of Rivergate | |
| Location | Hendersonville, TN | Hendersonville, TN | Hendersonville, TN | Hendersonville, TN | Hendersonville, TN | Hendersonville, TN | Madison, TN |
| Distance to Life Storage - 797 | -- | 0.7 miles | 0.7 miles | 0.8 miles | 2.3 miles | 1.7 miles | 3.3 miles |
| Distance to Life Storage - 798 | 0.7 miles | -- | 1.2 miles | 0.1 miles | 1.5 miles | 1.2 miles | 2.7 miles |
| Property Type | Self Storage | Self Storage | Self Storage | Self Storage | Self Storage | Self Storage | Self Storage |
Year Built/ Renovated | 1986/NAP | 1997/NAP | 1998/NAP | 2018/NAP | 1998/NAP | 2009/NAP | 1996/NAP |
| Total Units | 644(2) | 580(2) | 293 | 639 | 270 | 879 | 383 |
| % of Climate Controlled Units | 23.9% | 44.3% | NAV(3) | NAV(3) | NAV(3) | NAV(3) | NAV(3) |
| Total SF | 93,465 SF(2) | 68,225 SF(2) | 38,925 SF | 74,145 SF | 33,750 SF | 107,450 SF | 49,008 SF |
| Total Occupancy | 95.3%(2) | 92.9%(2) | 92.0% | 65.0% | 91.0% | 89.0% | 92.0% |
| (1) | Information obtained from the appraisals. The appraiser identified the same competitive set for both the Life Storage – 797 Property and the Life Storage – 798 Property. |
| (2) | Information obtained from the underwritten rent rolls as of 11/11/2020. |
| (3) | The appraiser noted that each of the properties in the competitive set has climate controlled units; however, the % of Climate Controlled Units was not available. |
The following table presents certain information relating to some comparable self storage properties for the Devon Self Storage Property:
Competitive Set(1)
(Devon Self Storage Property)
Devon Self Storage (Subject) | Storage Pro Self Storage | U Haul Storage | Five Points Storage | Storagemart | Elbow Room Self Storage | Chase Street Self Storage | |
| Location | Athens, GA | Athens, GA | Athens, GA | Athens, GA | Athens, GA | Athens, GA | Athens, GA |
| Distance to Devon Self Storage | -- | 1.2 miles | 4.3 miles | 3.4 miles | 4.4 miles | 4.4 miles | 3.2 miles |
| Property Type | Self Storage | Self Storage | Self Storage | Self Storage | Self Storage | Self Storage | Self Storage |
| Year Built/Renovated | 2006/2011 | 1993/NAP | 1972/1989 | 2019/NAP | 2003/NAP | 2006/NAP | 2014/NAP |
| Total Units | 708(2) | 360 | 538 | 439 | 346 | 470 | 686 |
| % of Climate Controlled Units | 44.4% | NAV(3) | NAV(3) | NAV(3) | NAV(3) | NAV(3) | NAV(3) |
| Total SF | 102,775 SF(2) | 45,000 SF | 65,600 SF | 52,650 SF | 46,150 SF | 61,110 SF | 82,373 SF |
| Occupancy | 81.1%(2) | 88.0% | 90.0% | 40.0% | 85.0% | 89.0% | 87.0% |
| (1) | Information obtained from the appraisal. |
| (2) | Information obtained from the underwritten rent roll as of 11/11/2020. |
| (3) | The appraiser noted that each of the properties in the competitive set has climate controlled units; however, the % of Climate Controlled Units was not available. |
THE INFORMATION IN THIS STRUCTURAL AND COLLATERAL TERM SHEET IS NOT COMPLETE AND MAY BE AMENDED PRIOR TO THE TIME OF SALE. THIS TERM SHEET IS NOT AN OFFER TO SELL THESE SECURITIES AND IT IS NOT A SOLICITATION OF AN OFFER TO BUY THESE SECURITIES IN ANY JURISDICTION WHERE THE OFFER OR SALE IS NOT PERMITTED.
129
| Self Storage – Self Storage | Loan #9 | Cut-off Date Balance: | $32,600,000 | |
| Property Addresses – Various | Inland SE Self Storage Portfolio | Cut-off Date LTV: | 58.7% | |
| U/W NCF DSCR: | 1.85x | |||
| U/W NOI Debt Yield: | 9.5% |
The following table presents certain information relating to some comparable self storage properties for the Life Storage – 701 Property:
Competitive Set(1)
(Life Storage - 701 Property)
Life Storage - 701 (Subject) | Public Storage | Public Storage | Extra Space Storage | Fort Locks Self Storage | Public Storage | Stor-All Mini Storage | |
| Location | Louisville, KY | Louisville, KY | Louisville, KY | Louisville, KY | Louisville, KY | Shively, KY | Shively, KY |
| Distance to Life Storage - 701 | -- | 1.0 miles | 1.7 miles | 2.0 miles | 2.3 miles | 2.4 miles | 2.9 miles |
| Property Type | Self Storage | Self Storage | Self Storage | Self Storage | Self Storage | Self Storage | Self Storage |
| Year Built/Renovated | 1994/NAP | 1998/NAP | 2005/NAP | 1996/NAP | 1986/NAP | 2000/NAP | 1992/NAP |
| Total Units | 639(2) | 593 | 397 | 457 | 315 | 820 | 886 |
| % of Climate Controlled Units | 0.0% | 0.0% | 0.0% | NAV(3) | 0.0% | NAV(3) | NAV(3) |
| Total SF | 66,568 SF(2) | 59,305 SF | 49,651 SF | 55,136 SF | 35,600 SF | 94,128 SF | 103,665 SF |
| Occupancy | 88.9%(2) | 87.0% | 95.0% | 90.0% | 80.3% | 95.0% | 90.0% |
| (1) | Information obtained from the appraisal. |
| (2) | Information obtained from the underwritten rent roll as of 11/11/2020. |
| (3) | The appraiser noted that these properties have climate controlled units; however, the % of Climate Controlled Units was not available. |
Escrows.
Taxes – The loan documents do not require ongoing monthly real estate tax reserves (in an amount equal to one-twelfth of the real estate taxes that the lender estimates will be payable during the next 12 months) so long as (i) no event of default has occurred or is continuing, (ii) the NCF DSCR (as defined below) being at least 1.20x, (iii) no Cash Trap Event Period (as defined below) has occurred or is continuing, and (iv) the borrower providing lender evidence of payment at least 10 days prior to the date such taxes would be delinquent.
Insurance – The loan documents do not require ongoing monthly insurance reserves so long as (i) no event of default has occurred and is continuing, (ii) no Cash Trap Event Period has occurred or is continuing, (iii) the NCF DSCR being at least 1.20x, (iv) the borrower providing the lender with evidence that the Inland SE Self Storage Properties are insured pursuant to a blanket policy and such policy is in full force and effect, and (v) the borrower providing the lender with evidence of payment of the insurance premiums and renewals at least 10 business days prior to the expiration dates.
Replacement Reserve – The loan documents require an upfront replacement reserve equal to $155,000 and ongoing monthly replacement reserves of $5,892 subject to a cap of $155,000.
Trust Reserve – The loan documents require a springing deposit of all amounts then held in the Borrower Trust Account into a reserve with lender in the event the Inland SE Self Storage Portfolio Borrower remains a Delaware statutory trust and desires or is required by its trust agreement or trustee either to (i) convert to a different form of entity under applicable Delaware law (a “Conversion Event”) or (ii) contribute one or more of the Inland SE Self Storage Properties to a new single purpose borrower owned in substantially the same proportions as immediately prior to such transfer by the same beneficial owners of the Inland SE Self Storage Portfolio Borrower (a “Drop Down Contribution”).
Lockbox and Cash Management. Upon the occurrence and continuance of a Cash Trap Event Period (as defined below), the Inland SE Self Storage Portfolio Borrower is required to establish a lender-controlled lockbox account and the Inland SE Self Storage Portfolio Borrower, master tenants, and property managers are required to (i) cause all rents to be deposited directly into the lockbox account within two business days and (ii) cause the master tenants to deposit all of the master tenants’ income within two business days of receipt. During a Cash Trap Event Period, funds in the lockbox account are required to be swept to a lender-controlled cash management account, and all excess funds are required to be swept to an excess cash flow subaccount controlled by the lender.
A “Cash Trap Event Period” will commence upon the earlier of the following:
| (i) | the occurrence and continuance of an event of default; |
| (ii) | the net cash flow debt service coverage ratio (based on a 30-year amortization term; “NCF DSCR”) being less than 1.20x (tested quarterly); or |
(iii) any bankruptcy or similar insolvency of the property manager or the property manager being in default under the management agreement.
A Cash Trap Event Period will end upon the occurrence of the following:
| ● | with regard to clause (i), the cure of such event of default; |
| ● | with regard to clause (ii), the NCF DSCR being greater than or equal to 1.25x for two consecutive calendar quarters; and |
THE INFORMATION IN THIS STRUCTURAL AND COLLATERAL TERM SHEET IS NOT COMPLETE AND MAY BE AMENDED PRIOR TO THE TIME OF SALE. THIS TERM SHEET IS NOT AN OFFER TO SELL THESE SECURITIES AND IT IS NOT A SOLICITATION OF AN OFFER TO BUY THESE SECURITIES IN ANY JURISDICTION WHERE THE OFFER OR SALE IS NOT PERMITTED.
130
| Self Storage – Self Storage | Loan #9 | Cut-off Date Balance: | $32,600,000 | |
| Property Addresses – Various | Inland SE Self Storage Portfolio | Cut-off Date LTV: | 58.7% | |
| U/W NCF DSCR: | 1.85x | |||
| U/W NOI Debt Yield: | 9.5% |
| ● | with regard to clause (iii), the cure of all defaults under the management agreement or replacement of such manager with a qualified manager acceptable to lender. |
Property Management. The Inland SE Self Storage Properties are managed by Life Storage Solutions, LLC and Devon Self Storage Holdings (US) LLC.
Partial Release. Provided no event of default is ongoing, the Inland SE Self Storage Portfolio Borrower has the right, at any time after the lockout period and prior to the open period start date, to obtain the release of any of the Inland SE Self Storage Properties from the lien of the Inland SE Self Storage Portfolio Mortgage Loan, provided that certain conditions are satisfied, including, but not limited to, the following:
| (i) | partial prepayment in an amount equal to at least 120% of the allocated loan amount for the property being released together with the applicable yield maintenance premium; |
| (ii) | the NCF DSCR immediately following the release being at least equal to the greater of (a) 1.85x and (b) the NCF DSCR (for 12 full calendar months) immediately prior to the release (capped at 1.95x); |
| (iii) | the net cash flow debt yield (for 12 full calendar months) immediately following the release being at least equal to the greater of (a) 9.3% and (b) the net cash flow debt yield immediately prior to the release (capped at 9.8%); |
| (iv) | unless the aggregate allocated loan amounts of all released properties is less than 25% of the original principal balance of the loan, the loan-to-value ratio immediately following the release being less than or equal to the lesser of (a) 58.7% and (b) the loan-to-value ratio immediately prior to the release; |
| (v) | compliance with all applicable REMIC requirements; and |
| (vi) | rating agency confirmation that such release will not result in a downgrade, withdrawal or qualification of the respective ratings assigned to the BANK 2021-BNK31 certificates. |
Real Estate Substitution. Not permitted.
Subordinate and Mezzanine Indebtedness. Not permitted.
Permitted Additional Unsecured Subordinate Indebtedness. The loan documents permit the borrower to obtain unsecured loans from IPCC provided (i) such guarantor loans will be unsecured; (ii) such guarantor loans will be subordinate to the Inland SE Self Storage Portfolio Mortgage Loan; (iii) IPCC and the Inland SE Self Storage Portfolio Borrower will enter into a subordination and standstill agreement; (iv) the proceeds of such loans will be used solely to pay (a) debt service, (b) approved re-leasing expenses, (c) approved capital expenditures, (d) extraordinary operating expenses or capital expenses, and (e) actual operating expenses (in the respective case, as a result of insufficient reserves held by the borrower with respect to (b), (c) or (d) or insufficient reserve funds held by the borrower and insufficient Rents being paid pursuant to leases with respect to (a) and (e)); (v) the aggregate amount of all such loans shall not exceed $2,934,000 (or 9% of the original principal amount of the loan); (vi) such guarantor loans will have no maturity date; and (vii) such guarantor loans will be payable only out of excess cash.
Ground Lease. None.
Terrorism Insurance. The Inland SE Self Storage Portfolio Mortgage Loan documents require that the “all risk” insurance policies required to be maintained by the Inland SE Self Storage Portfolio Borrower provides coverage for terrorism in an amount equal to the full replacement cost of the Inland SE Self Storage Properties, as well as business interruption insurance covering no less than the 18-month period following the occurrence of a casualty event, together with a 6-month extended period of indemnity.
THE INFORMATION IN THIS STRUCTURAL AND COLLATERAL TERM SHEET IS NOT COMPLETE AND MAY BE AMENDED PRIOR TO THE TIME OF SALE. THIS TERM SHEET IS NOT AN OFFER TO SELL THESE SECURITIES AND IT IS NOT A SOLICITATION OF AN OFFER TO BUY THESE SECURITIES IN ANY JURISDICTION WHERE THE OFFER OR SALE IS NOT PERMITTED.
131
| Office – Suburban | Loan #10 | Cut-off Date Balance: | $30,900,000 | |
350 Holger Way San Jose, CA 95134 | 350 Holger Way | Cut-off Date LTV: U/W NCF DSCR: U/W NOI Debt Yield: | 61.2% 3.11x 11.0% |

THE INFORMATION IN THIS STRUCTURAL AND COLLATERAL TERM SHEET IS NOT COMPLETE AND MAY BE AMENDED PRIOR TO THE TIME OF SALE. THIS TERM SHEET IS NOT AN OFFER TO SELL THESE SECURITIES AND IT IS NOT A SOLICITATION OF AN OFFER TO BUY THESE SECURITIES IN ANY JURISDICTION WHERE THE OFFER OR SALE IS NOT PERMITTED.
132
| Office – Suburban | Loan #10 | Cut-off Date Balance: | $30,900,000 | |
350 Holger Way San Jose, CA 95134 | 350 Holger Way | Cut-off Date LTV: U/W NCF DSCR: U/W NOI Debt Yield: | 61.2% 3.11x 11.0% |

THE INFORMATION IN THIS STRUCTURAL AND COLLATERAL TERM SHEET IS NOT COMPLETE AND MAY BE AMENDED PRIOR TO THE TIME OF SALE. THIS TERM SHEET IS NOT AN OFFER TO SELL THESE SECURITIES AND IT IS NOT A SOLICITATION OF AN OFFER TO BUY THESE SECURITIES IN ANY JURISDICTION WHERE THE OFFER OR SALE IS NOT PERMITTED.
133
| No. 10 – 350 Holger Way | |||||||||
| Mortgage Loan Information | Mortgaged Property Information(3) | ||||||||
| Mortgage Loan Seller: | Wells Fargo Bank, National Association | Single Asset/Portfolio: | Single Asset | ||||||
Credit Assessment (Fitch/KBRA/S&P): | NR/NR/NR | Property Type – Subtype: | Office – Suburban | ||||||
| Original Principal Balance: | $30,900,000 | Location: | San Jose, CA | ||||||
| Cut-off Date Balance: | $30,900,000 | Size: | 96,502 SF | ||||||
| % of Initial Pool Balance: | 3.4% | Cut-off Date Balance Per SF: | $320.20 | ||||||
| Loan Purpose: | Acquisition | Maturity Date Balance Per SF: | $320.20 | ||||||
| Borrower Sponsor: | Joseph J. Sitt | Year Built/Renovated: | 1999/2019 | ||||||
| Guarantor: | Joseph J. Sitt | Title Vesting: | Fee | ||||||
| Mortgage Rate: | 3.2790% | Property Manager: | Thor Management Company LLC | ||||||
| Note Date: | December 23, 2020 | Current Occupancy (As of): | 100.0% (2/1/2021) | ||||||
| Seasoning: | 1 month | YE 2019 Occupancy(2): | NAV | ||||||
| Maturity Date: | January 11, 2031 | YE 2018 Occupancy(2): | NAV | ||||||
| IO Period: | 120 months | YE 2017 Occupancy(2): | NAV | ||||||
| Loan Term (Original): | 120 months | YE 2016 Occupancy(2): | NAV | ||||||
| Amortization Term (Original): | NAP | As-Is Appraised Value: | $50,500,000 | ||||||
| Loan Amortization Type: | Interest-only, Balloon | As-Is Appraised Value Per SF: | $523.31 | ||||||
| Call Protection: | L(25),D(88),O(7) | As-Is Appraisal Valuation Date: | November 23, 2020 | ||||||
| Lockbox Type: | Hard/Upfront Cash Management | ||||||||
| Additional Debt: | None | Underwriting and Financial Information(3) | |||||||
| Additional Debt Type (Balance): | NAP | T9M Annualized NOI (9/30/2020)(4): | $388,323 | ||||||
| YE 2019 NOI(2): | NAV | ||||||||
| YE 2018 NOI(2): | NAV | ||||||||
| YE 2017 NOI(2): | NAV | ||||||||
| U/W Revenues: | $4,429,361 | ||||||||
| U/W Expenses: | $1,037,128 | ||||||||
| Escrows and Reserves(1) | U/W NOI(4): | $3,392,233 | |||||||
| Initial | Monthly | Cap | U/W NCF: | $3,196,627 | |||||
| Taxes | $162,700 | $40,675 | NAP | U/W DSCR based on NOI/NCF: | 3.30x / 3.11x | ||||
| Insurance | $0 | Springing | NAP | U/W Debt Yield based on NOI/NCF: | 11.0% / 10.3% | ||||
| Replacement Reserve | $0 | $2,216 | $53,184 | U/W Debt Yield at Maturity based on NOI/NCF: | 11.0% / 10.3% | ||||
| TI/LC | $0 | $8,042 | $289,506 | Cut-off Date LTV Ratio: | 61.2% | ||||
| LTV Ratio at Maturity: | 61.2% | ||||||||
| Sources and Uses | ||||||||
| Sources | Uses | |||||||
| Original mortgage loan amount | $30,900,000 | 56.8% | Purchase price | $50,500,000 | 92.7% | |||
| Sponsor equity | 23,548,561 | 43.2 | Upfront reserves | 162,700 | 0.3 | |||
| Closing costs | 3,785,861 | 7.0 | ||||||
| Total Sources | $54,448,561 | 100.0% | Total Uses | $54,448,561 | 100.0% | |||
| (1) | See “Escrows” section below. |
| (2) | The 350 Holger Way Property (as defined below) underwent a complete renovation during 2019 and the 350 Holger Way Borrower (as defined below) acquired the 350 Holger Way Property in conjunction with the closing of the 350 Holger Way Mortgage Loan (as defined below). There is no historical occupancy and limited historical performance available. See “Historical Occupancy” and “Historical Operating Performance and Underwritten Net Cash Flow” sections below. |
| (3) | While the 350 Holger Way Mortgage Loan was originated after the emergence of the novel coronavirus pandemic and the economic disruption resulting from measures to combat the pandemic, the pandemic is an evolving situation and could impact the 350 Holger Way Mortgage Loan more severely than assumed in the underwriting of the 350 Holger Way Mortgage Loan and could adversely affect the NOI, NCF and occupancy information, as well as the appraised value and the DSCR, LTV and Debt Yield metrics presented above. See “Risk Factors—Risks Related to Market Conditions and Other External Factors—Coronavirus Pandemic Has Adversely Affected the Global Economy and Will Likely Adversely Affect the Performance of the Mortgage Loans” in the Preliminary Prospectus. |
| (4) | The increase from T9M Annualized NOI to U/W NOI is due to NXP USA, Inc. (“NXP”), the sole tenant, lease beginning in February 1, 2020 and rent payments beginning in August 1, 2020. |
THE INFORMATION IN THIS STRUCTURAL AND COLLATERAL TERM SHEET IS NOT COMPLETE AND MAY BE AMENDED PRIOR TO THE TIME OF SALE. THIS TERM SHEET IS NOT AN OFFER TO SELL THESE SECURITIES AND IT IS NOT A SOLICITATION OF AN OFFER TO BUY THESE SECURITIES IN ANY JURISDICTION WHERE THE OFFER OR SALE IS NOT PERMITTED.
134
| Office – Suburban | Loan #10 | Cut-off Date Balance: | $30,900,000 | |
350 Holger Way San Jose, CA 95134 | 350 Holger Way | Cut-off Date LTV: U/W NCF DSCR: U/W NOI Debt Yield: | 61.2% 3.11x 11.0% |
The Mortgage Loan. The mortgage loan (the “350 Holger Way Mortgage Loan”) is evidenced by a single promissory note secured by a first mortgage encumbering the fee interest in a 96,502 square foot suburban office property located in San Jose, California (the “350 Holger Way Property”).
The Borrower and Borrower Sponsor. The borrowers are Thor 350 Holger Way LLC and Thor 350 Holger San Jose LLC (the “350 Holger Way Borrower”), as tenants in common. The 350 Holger Way Borrower is made up of two newly formed single purpose entities, each with an independent director. Legal counsel to the borrower delivered a non-consolidation opinion in connection with the origination of the 350 Holger Way Mortgage Loan.
The borrower sponsor and carveout guarantor is Joseph J. Sitt. Mr. Sitt is the Chairman of Thor Equities Group, an urban real estate development, leasing, and management company of commercial property. Founded in 1986 by Mr. Sitt, the company owns property in the United States, Europe, and Latin America, with portfolio transactions and a development pipeline of more than $20 billion and over 50 million square feet. Mr. Sitt has disclosed numerous issues with his portfolio including delinquencies, foreclosures, and deeds in lieu of foreclosure. See “Description of the Mortgage Pool—Loan Purpose; Default History, Bankruptcy Issues and Other Proceedings” in the Preliminary Prospectus.
The Property. The 350 Holger Way Property is a Class A, three-story single tenant, suburban office building totaling 96,502 square feet located in San Jose, California. The 350 Holger Way Borrower acquired the property in December 2020 for $50.5 million ($523 per square foot). The property includes a two-story lobby, open office areas, private offices, conference rooms and lab space. Situated on a 4.66 acre parcel, the 350 Holger Way Property contains 338 surface parking spaces, resulting in a parking ratio of 3.5 spaces per 1,000 square feet of net rentable area. The property was constructed in 1999 and fully renovated in 2019 at a total cost of approximately $22.3 million ($231 per square foot). This included approximately $8.9 million ($92 per square foot) invested in the tenant build out, including a $30 per square foot tenant improvement allowance ($2.9 million), with the remainder, approximately $62 per square foot ($6.0 million), funded by the tenant. Capital improvements included completely new interiors, an outdoor amenity area, and upgraded exteriors, landscaping and parking lot. Additionally, the building’s roof and HVAC were replaced in 2018. As of February 1, 2021, the property was fully occupied by NXP.
COVID-19 Update. As of January 6, 2021, the 350 Holger Way Property is open; however, most, if not all, employees were working remotely. NXP has paid 100% of December 2020 and January 2021 rental payments. The first debt service payment is due in February 2021.
Tenant.
NXP. (96,502 square feet, 100.0% of net rentable area; 100.0% of underwritten base rent; July 31, 2027 lease expiration) NXP is a Netherlands based manufacturer and distributor of semiconductor products. The company operates in more than 30 countries, employs approximately 29,000 employees, and serves over 26,000 customers. NXP is a wholly owned subsidiary of NXP B.V. (Fitch/ Moody’s /S&P: BBB-/Baa3/BBB) which guarantees the lease. The guaranty is capped at $35 million, which is reduced every 12 months to $7.725 million during the last year of the lease term. NXP’s lease began February 1, 2020 and there is one 5-year renewal option at fair market value, with 12 months’ notice.
The following table presents certain information relating to the tenancy at the 350 Holger Way Property:
Major Tenants
| Tenant Name | Credit Rating (Fitch/ Moody’s/ | Tenant NRSF | % of NRSF | Annual U/W Base Rent PSF(1) | Annual U/W Base Rent(1) | % of Total Annual U/W Base Rent | Lease Expiration Date | Extension Options | Termination Option (Y/N) |
| Major Tenants | |||||||||
| NXP | BBB-/Baa3/BBB(2) | 96,502 | 100.0% | $37.57 | $3,625,357 | 100.0% | 7/31/2027 | 1, 5-year | N |
| Total Major Tenants | 96,502 | 100.0% | $37.57 | $3,625,357 | 100.0% | ||||
| Non-Major Tenants | 0 | 0.0% | |||||||
| Occupied Collateral Total | 96,502 | 100.0% | $37.57 | $3,625,357 | 100.0% | ||||
| Vacant Space | 0 | 0.0% | |||||||
| Collateral Total | 96,502 | 100.0% | |||||||
| (1) | The Annual U/W Base Rent PSF and Annual U/W Base Rent shown above represent the straight line rent average through the end of the lease term. |
| (2) | Credit Rating represents that of NXP B.V., which is the operating company for NXP N.V., the parent company of the tenant. |
THE INFORMATION IN THIS STRUCTURAL AND COLLATERAL TERM SHEET IS NOT COMPLETE AND MAY BE AMENDED PRIOR TO THE TIME OF SALE. THIS TERM SHEET IS NOT AN OFFER TO SELL THESE SECURITIES AND IT IS NOT A SOLICITATION OF AN OFFER TO BUY THESE SECURITIES IN ANY JURISDICTION WHERE THE OFFER OR SALE IS NOT PERMITTED.
135
| Office – Suburban | Loan #10 | Cut-off Date Balance: | $30,900,000 | |
350 Holger Way San Jose, CA 95134 | 350 Holger Way | Cut-off Date LTV: U/W NCF DSCR: U/W NOI Debt Yield: | 61.2% 3.11x 11.0% |
The following table presents certain information relating to the lease rollover schedule at the 350 Holger Way Property:
Lease Expiration Schedule(1)
| Year Ending December 31, | No. of Leases Expiring | Expiring NRSF | % of Total NRSF | Cumulative Expiring NRSF | Cumulative % of Total NRSF | Annual U/W Base Rent | % of Total Annual U/W Base Rent | Annual U/W Base Rent PSF |
| MTM | 0 | 0 | 0.0% | 0 | 0.0% | $0 | 0.0% | $0.00 |
| 2021 | 0 | 0 | 0.0% | 0 | 0.0% | $0 | 0.0% | $0.00 |
| 2022 | 0 | 0 | 0.0% | 0 | 0.0% | $0 | 0.0% | $0.00 |
| 2023 | 0 | 0 | 0.0% | 0 | 0.0% | $0 | 0.0% | $0.00 |
| 2024 | 0 | 0 | 0.0% | 0 | 0.0% | $0 | 0.0% | $0.00 |
| 2025 | 0 | 0 | 0.0% | 0 | 0.0% | $0 | 0.0% | $0.00 |
| 2026 | 0 | 0 | 0.0% | 0 | 0.0% | $0 | 0.0% | $0.00 |
| 2027 | 1 | 96,502 | 100.0% | 96,502 | 100.0% | $3,625,357 | 100.0% | $37.57 |
| 2028 | 0 | 0 | 0.0% | 96,502 | 100.0% | $0 | 0.0% | $0.00 |
| 2029 | 0 | 0 | 0.0% | 96,502 | 100.0% | $0 | 0.0% | $0.00 |
| 2030 | 0 | 0 | 0.0% | 96,502 | 100.0% | $0 | 0.0% | $0.00 |
| 2031 | 0 | 0 | 0.0% | 96,502 | 100.0% | $0 | 0.0% | $0.00 |
| Thereafter | 0 | 0 | 0.0% | 96,502 | 100.0% | $0 | 0.0% | $0.00 |
| Vacant | 0 | 0 | 0.0% | 96,502 | 100.0% | $0 | 0.0% | $0.00 |
| Total/Weighted Average | 1 | 96,502 | 100.0% | $3,625,357 | 100.0% | $37.57 |
| (1) | Information obtained from the underwritten rent roll. |
The following table presents historical occupancy percentages at the 350 Holger Way Property:
Historical Occupancy
12/31/2016(1) | 12/31/2017(1) | 12/31/2018(1) | 12/31/2019(1) | 2/1/2021(2) |
| NAV | NAV | NAV | NAV | 100.0% |
| (1) | The 350 Holger Way Property was acquired at loan closing and no historical occupancy is available. |
| (2) | Information obtained from the underwritten rent roll. |
THE INFORMATION IN THIS STRUCTURAL AND COLLATERAL TERM SHEET IS NOT COMPLETE AND MAY BE AMENDED PRIOR TO THE TIME OF SALE. THIS TERM SHEET IS NOT AN OFFER TO SELL THESE SECURITIES AND IT IS NOT A SOLICITATION OF AN OFFER TO BUY THESE SECURITIES IN ANY JURISDICTION WHERE THE OFFER OR SALE IS NOT PERMITTED.
136
| Office – Suburban | Loan #10 | Cut-off Date Balance: | $30,900,000 | |
350 Holger Way San Jose, CA 95134 | 350 Holger Way | Cut-off Date LTV: U/W NCF DSCR: U/W NOI Debt Yield: | 61.2% 3.11x 11.0% |
Historical Operating Performance and Underwritten Net Cash Flow. The following table presents certain information relating to the historical operating performance and underwritten net cash flow at the 350 Holger Way Property:
Cash Flow Analysis
| Annualized 9/30/2020 | U/W | %(1) | U/W $ per SF | |
| Base Rent | $2,815,285 | $3,625,357(2) | 78.6% | $37.57 |
| Contractual Rent Steps | 0 | 0 | 0.0 | 0.00 |
| Free Rent | 2,521,919 | 0 | 0.0 | 0.00 |
| Grossed Up Vacant Space | 0 | 0 | 0.0 | 0.00 |
| Gross Potential Rent | $293,367 | $3,625,357 | 78.6% | $37.57 |
| Other Income | 5,836 | 0 | 0.0 | 0.00 |
| Total Recoveries | 730,211 | 985,272 | 21.40 | 10.21 |
| Net Rental Income | $1,029,413 | $4,610,629 | 100.0% | $47.78 |
| (Vacancy & Credit Loss) | 0 | (181,268) | (5.0) | (1.88) |
| Effective Gross Income | $1,029,413 | $4,429,361 | 96.1% | $45.90 |
| Real Estate Taxes | 296,063 | 613,646 | 13.9 | 6.36 |
| Insurance | 142,103 | 120,270 | 2.7 | 1.25 |
| Management Fee | 37,073 | 132,881 | 3.0 | 1.38 |
| Other Operating Expenses | 165,852 | 170,332 | 3.8 | 1.77 |
| Total Operating Expenses | $641,091 | $1,037,128 | 23.4% | $10.75 |
| Net Operating Income | $388,323 | $3,392,233(3) | 76.6% | $35.15 |
| Replacement Reserves | 0 | 26,592 | 0.6 | 0.28 |
| TI/LC | 0 | 169,014 | 3.8 | 1.75 |
| Net Cash Flow | $388,323 | $3,196,627 | 72.2% | $33.12 |
| NOI DSCR | 0.38x | 3.30x | ||
| NCF DSCR | 0.38x | 3.11x | ||
| NOI Debt Yield | 1.3% | 11.0% | ||
| NCF Debt Yield | 1.3% | 10.3% |
| (1) | Represents (i) percent of Net Rental Income for all revenue fields, (ii) percent of Gross Potential Rent for Vacancy & Credit Loss and (iii) percent of Effective Gross Income for all other fields. |
| (2) | NXP’s rent includes 3% annual escalations. The U/W Base rent represents the straight line average of the rent through the lease term due to the investment grade rating. |
| (3) | The increase from T9M Annualized NOI to U/W NOI is due to NXP, the sole tenant, lease beginning in February 1, 2020 and they began paying rent in August 1, 2020. |
Appraisal. The appraiser concluded to an “As-Is Market Value” of $50,500,000 as of November 23, 2020. The appraiser provided a “Hypothetical Go Dark Value” of $34,600,000.
Environmental Matters. According to the Phase I environmental site assessment dated October 20, 2020 there are no significant issues and no further inspection is necessary.
Market Overview and Competition. The 350 Holger Way Property is located in what is known as the “Golden Triangle”, which encompasses the area between State Highway 237, Interstate 880, and U.S. Highway 101. The area is home to many notable high-tech firms including Google, Samsung, Raytheon, and Micron. The 350 Holger Way Property is located approximately 8.2 miles downtown San Jose and 5.0 miles from the Norman Y. Mineta San Jose International Airport. Additionally, the 350 Holger Way Property is located approximately 0.6 miles from the @First Marketplace retail development which is a Target-anchored retail center with dining and shopping options including Chipotle, Panera Bread, Five Guys, and CVS. Located approximately 0.4 miles to Highway 237 and 1.9 miles to I-880, the property has access throughout the region. According to the appraisal, the estimated 2020 population within a three- and five-mile radius was approximately 94,887 and 299,718, respectively; and the estimated 2020 average household income within the same radii was approximately $185,110 and $172,233, respectively.
According to a third-party market research report, the property is situated within the North San Jose office submarket of the Greater Silicon Valley office market. As of the third quarter of 2020, the North San Jose office submarket reported a total inventory of approximately 5.7 million square feet with a 15.7% vacancy rate and average asking rent of $41.76 per square foot. The appraiser concluded to a market rent for the 350 Holger Way Property of $33.60 per square foot, net.
THE INFORMATION IN THIS STRUCTURAL AND COLLATERAL TERM SHEET IS NOT COMPLETE AND MAY BE AMENDED PRIOR TO THE TIME OF SALE. THIS TERM SHEET IS NOT AN OFFER TO SELL THESE SECURITIES AND IT IS NOT A SOLICITATION OF AN OFFER TO BUY THESE SECURITIES IN ANY JURISDICTION WHERE THE OFFER OR SALE IS NOT PERMITTED.
137
| Office – Suburban | Loan #10 | Cut-off Date Balance: | $30,900,000 | |
350 Holger Way San Jose, CA 95134 | 350 Holger Way | Cut-off Date LTV: U/W NCF DSCR: U/W NOI Debt Yield: | 61.2% 3.11x 11.0% |
The following table presents certain information relating to the appraisal’s market rent conclusion for the 350 Holger Way Property:
Market Rent Summary(1)
| Market Rent (PSF) | $33.60 | |
| Lease Term (Years) | 7 | |
| Lease Type (Reimbursements) | Net | |
| Rent Increase Projection | 3.00% per annum | |
| Tenant Improvements | $30.00 | |
| Leasing Commissions | 6.0% | |
| Free Rent | 6 months | |
| (1) | Information obtained from the appraisal. |
The table below presents certain information relating to comparable sales pertaining to the 350 Holger Way Property identified by the appraiser:
Comparable Sales(1)
| Property Name | Location | Year Built/Renovated | Rentable Area (SF) | Sale Date | Sale Price | Sale Price (PSF) |
| 350 Holger Way (Subject) | San Jose, CA | 1999/2019 | 96,502 | Dec. 2020 | $50,500,000 | $523 |
| 250 Holger Way | San Jose, CA | 2000/2019 | 76,142 | Sep. 2020 | $38,250,000 | $502 |
| District 237 | San Jose, CA | 2000/2019 | 142,710 | Jun. 2020 | $95,200,000 | $667 |
| 2300 Orchard Pkwy. | San Jose, CA | 1997/2019 | 116,381 | Sep. 2019 | $61,000,000 | $524 |
| 2811 Orchard Parkway | San Jose, CA | 1981/2017 | 84,696 | Oct. 2018 | $35,000,000 | $413 |
| Orchard Trimble Campus | San Jose, CA | 1984/2017 | 216,035 | Jun. 2018 | $93,500,000 | $433 |
| (1) | Information obtained from the appraisal. |
The following table presents certain information relating to comparable leases related to 350 Holger Way Property:
Comparable Leases(1)
| Property Name/Location | Year Built/ Renovated | Total GLA (SF) | Distance from Subject | Occupancy | Tenant | Tenant Size | Lease Term | Annual Base Rent PSF | Lease Type |
| 350 Holger Way (Subject)(2) San Jose, CA | 1999/2019 | 96,502 | - | 100% | NXP | 96,502 | 7.5 Yrs. | $37.57(3) | NNN |
100 Headquarters Drive & 200 Holger Way San Jose, CA | 2000/2019 | 142,710 | 0.4 miles | 100% | Raytheon | 142,710 | 12.0 Yrs. | $34.20 | NNN |
4453 N. 1st Street San Jose, CA | 2019/NAP | 187,660 | 1.4 miles | 49.8%(4) | Rambus | 89,425 | 10.7 Yrs. | $39.12 | NNN |
2880 Junction Avenue San Jose, CA | 1990/2019 | 79,974 | 2.0 miles | 100% | CA Inc. | 79,947 | 6.3 Yrs. | $31.80 | NNN |
110 Rio Robles San Jose, CA | 1984/2018 | 110,562 | 1.8 miles | 100% | Inphi | 110,562 | 10.0 Yrs. | $30.00 | NNN |
250 Holger Way San Jose, CA | 2000/2019 | 76,142 | 0.2 miles | 100% | CDK Global, Inc. | 76,142 | 7.5 Yrs. | $32.40 | NNN |
| (1) | Information obtained from the appraisal. |
| (2) | Information obtained from the underwritten rent roll. |
| (3) | Represents the straight line rent average over the lease term. |
| (4) | Information obtained from a third party source. |
Escrows.
Real Estate Taxes – The loan documents require an upfront real estate tax reserve of $162,700 and ongoing monthly real estate tax reserves in an amount equal to one-twelfth of the real estate taxes that the lender estimates will be payable during the next 12 months (initially $40,675).
THE INFORMATION IN THIS STRUCTURAL AND COLLATERAL TERM SHEET IS NOT COMPLETE AND MAY BE AMENDED PRIOR TO THE TIME OF SALE. THIS TERM SHEET IS NOT AN OFFER TO SELL THESE SECURITIES AND IT IS NOT A SOLICITATION OF AN OFFER TO BUY THESE SECURITIES IN ANY JURISDICTION WHERE THE OFFER OR SALE IS NOT PERMITTED.
138
| Office – Suburban | Loan #10 | Cut-off Date Balance: | $30,900,000 | |
350 Holger Way San Jose, CA 95134 | 350 Holger Way | Cut-off Date LTV: U/W NCF DSCR: U/W NOI Debt Yield: | 61.2% 3.11x 11.0% |
However, the 350 Holger Way Borrower’s obligation to make tax reserve payments will be waived so long as, (i) no event of default is continuing, (ii) the Major Tenant (as defined below) is obligated to pay, and is actually paying, the taxes directly to the appropriate public office, (iii) no more than thirty days prior to the applicable delinquency date, the 350 Holger Way Borrower delivers evidence reasonably satisfactory to the lender that the taxes have been paid and (iv) the lease to the Major Tenant is in full force and effect and neither the 350 Holger Way Borrower or the Major Tenant is in default of any of its obligations beyond applicable notice and cure periods.
Insurance – The loan documents require ongoing monthly insurance reserves in an amount equal to one-twelfth of the insurance premiums that the lender estimates will be payable for the renewal of the coverage afforded by the policies upon the expiration thereof.
However, the 350 Holger Way Borrower’s obligation to make insurance reserve payments will be waived so long as, (i) no event of default is continuing, (ii) the insurance policies maintained by the 350 Holger Way Borrower are part of a blanket or umbrella policy approved by the lender in its reasonable discretion and (iii) the 350 Holger Way Borrower provides the lender with paid receipts for the payment of the insurance premiums by no later than fifteen business days prior to the expiration dates of said policies. Additionally, the 350 Holger Way Borrower’s obligation to make insurance reserve payments will be waived so long as, (i) the Major Tenant is obligated to pay, and is actually paying, insurance premiums directly to the respective insurer or agent, (ii) no more than thirty days prior to the applicable delinquency date or the renewal date, the 350 Holger Way Borrower delivers evidence reasonably satisfactory to the lender that the insurance premiums for the property have been paid in full and (iii) the lease to the Major Tenant is in full force and effect and neither the 350 Holger Way Borrower or the Major Tenant is in default of any of its obligations beyond applicable notice and cure periods.
Replacement Reserve – The loan documents require ongoing monthly replacement reserves of $2,216 ($0.28 per square foot annually). The replacement reserve is subject to a cap of $53,184 ($0.55 per square foot), as long as there is no event of default continuing and the 350 Holger Way Property is being adequately maintained, as reasonably determined by the lender.
TI/LC Reserve – The loan documents require ongoing monthly TI/LC reserves of $8,042 ($1.00 PSF annually). The TI/LC reserve is subject to a cap of $289,506 ($3.00 per square foot), as long as there is no event of default continuing.
Lockbox and Cash Management. The 350 Holger Way Mortgage Loan is structured with an in-place hard lockbox and the 350 Holger Way Borrower and property manager are required to direct the tenant to pay rent directly into such lockbox account, and to deposit any rents otherwise received in such account within five business day after receipt. All amounts in the lockbox account will be swept periodically into a lender-controlled cash management account and disbursed by the lender in accordance with the 350 Holger Way Mortgage Loan documents on each monthly payment date. So long as no Cash Trap Event Period (as defined below) is in effect, all excess cash flow on deposit in the lockbox account after application of the cash flow waterfall will be disbursed to the 350 Holger Way Borrower. During a Cash Trap Event Period, all excess funds are required to be swept to an excess cash flow subaccount controlled by the lender and held as additional security for so long as the Cash Trap Event Period continues, provided however, that if the Cash Trap Event Period is solely as a result of a go dark trigger and/or a credit downgrade trigger, and has been continuing for a period of 24 months, then all excess cash flow, in excess of the amount held in the excess cash flow account after the 24 month period, shall be disbursed to the 350 Holger Way Borrower.
A “Cash Trap Event Period” will commence upon the earlier of the following:
| (i) | the occurrence of an event of default under the loan documents; |
| (ii) | the amortizing net cash flow debt service coverage ratio (“NCF DSCR”) being less than 1.25x for two consecutive calendar quarters unless, within seven days of receipt from the lender, the 350 Holger Way Borrower makes a cash deposit or posts a letter of credit in an amount which if applied to the outstanding principal balance of the 350 Holger Way Mortgage Loan that would result in the NCF DSCR being equal to or greater than 1.25x; or |
| (iii) | the occurrence of a Major Tenant Event Period. |
A Cash Trap Event Period will end upon the occurrence of the following:
| ● | with regard to clause (i), the cure of such event of default; |
| ● | with regard to clause (ii), the amortizing NCF DSCR being greater than or equal to 1.25x for two consecutive calendar quarters; |
| ● | with regard to clause (iii), the termination of a Major Tenant Event Period. |
A “Major Tenant Event Period” will commence upon the earlier of the following:
| (i) | a default under the Major Tenant (as defined below) lease, beyond any applicable notice and/or cure period; |
| (ii) | Major Tenant or the 350 Holger Way Borrower terminates or cancels the Major tenant lease, or gives notice thereof; |
| (iii) | Major Tenant goes dark, vacates or otherwise fails to continuously occupy its entire space, or gives notice thereof, other than in connection with a temporary closure for repairs or renovations (not to exceed 90 days), or as required by law as a result of the COVID-19 pandemic; |
| (iv) | Major Tenant files bankruptcy or otherwise becomes involved as a debtor in a bankruptcy proceeding; |
| (v) | Major Tenant enters into a modification of the lease without the lenders consent; |
| (vi) | Major Tenant fails to renew or extend the lease on or prior to the earlier of (a) 24 months prior to the lease expiration, or (b) the deadline under the Major Tenant lease to provide notice of renewal; or |
THE INFORMATION IN THIS STRUCTURAL AND COLLATERAL TERM SHEET IS NOT COMPLETE AND MAY BE AMENDED PRIOR TO THE TIME OF SALE. THIS TERM SHEET IS NOT AN OFFER TO SELL THESE SECURITIES AND IT IS NOT A SOLICITATION OF AN OFFER TO BUY THESE SECURITIES IN ANY JURISDICTION WHERE THE OFFER OR SALE IS NOT PERMITTED.
139
| Office – Suburban | Loan #10 | Cut-off Date Balance: | $30,900,000 | |
350 Holger Way San Jose, CA 95134 | 350 Holger Way | Cut-off Date LTV: U/W NCF DSCR: U/W NOI Debt Yield: | 61.2% 3.11x 11.0% |
| (vii) | Either (a) the long-term unsecured debt rating for the Major Tenant or its parent company is downgraded below “BBB-” by S&P, “BBB-” by Fitch and “Baa3” by Moody’s, or (b) Major Tenant and its parent company or no longer rated by S&P, Fitch, or Moody’s. |
A Cash Trap Event Period caused solely by (iii) or (vii) above, will be limited to 24 months.
A Major Tenant means the tenant known as NXP and any replacement tenant that enters into a lease for all or any portion of the space.
A Major Tenant Event Period will be terminated upon the following:
| ● | With regard to clause (i) either (a) a Major Tenant Re-Tenanting Event (as defined below) has occurred, or (b) the default is cured and no other default under the Major Tenant lease occurs for a period of two consecutive calendar months; |
| ● | With regard to clause (ii) above, a Major Tenant Re-Tenanting Event has occurred; |
| ● | With regard to clause (iii) above, a Major Tenant Re-Tenanting Event has occurred or Major Tenant has resumed its normal business operations in all, or substantially all, of its space and is paying full, unabated rent for a period of two consecutive calendar quarters; |
| ● | With regard to clause (iv) above, a Major Tenant Re-Tenanting Event has occurred or the bankruptcy or insolvency proceeding has terminated in a manner satisfactory to the lender, the Major Tenant lease has been affirmed, with terms satisfactory to the lender; |
| ● | With regard to clause (v) above, the lender approves the applicable modification of the lease in its sole discretion; |
| ● | With regard to clause (vi) above, a Major Tenant Re-Tenanting Event has occurred or the Major Tenant renews or extends the term pursuant to the terms thereof or otherwise on terms acceptable to the lender; or |
| ● | With regard to clause (vii) above, the long-term unsecured debt rating for the Major Tenant and/or its parent company is equal to or greater than “BBB-” for S&P or Fitch, or “Baa3” for Moody’s. |
A “Major Tenant Re-Tenanting Event” means the lender has received satisfactory evidence that all of the Major Tenant space (or a portion thereof, so long as the rents under the replacement lease or leases are sufficient to achieve a NCF DSCR of at least 1.25x) has been leased to one or more satisfactory replacement tenants under a replacement lease on terms satisfactory to the lender, that each tenant has taken occupancy, is open for business, has commenced paying full unabated rent, and all tenant improvement costs and leasing commissions have been paid or reserved with the lender.
Property Management. The 350 Holger Way Property is managed by Thor Management Company LLC.
Partial Release. Not permitted.
Real Estate Substitution. Not permitted.
Subordinate and Mezzanine Indebtedness. Not permitted.
Ground Lease. None.
Terrorism Insurance. The loan documents require that the “all risk” insurance policy required to be maintained by the borrower provides coverage for terrorism in an amount equal to the full replacement cost of the property, as well as business interruption insurance covering no less than the 18-month period following the occurrence of a casualty event, together with a 6-month extended period of indemnity (provided that if TRIPRA or a similar statute is not in effect, the 350 Holger Way Borrower will not be obligated to pay terrorism insurance premiums in excess of two times the premium for a separate special form or all-risk policy on a stand-alone basis).
Earthquake Insurance. A seismic risk assessment dated October 22, 2020 indicated a probable maximum loss of 10%. Earthquake insurance is not required.
THE INFORMATION IN THIS STRUCTURAL AND COLLATERAL TERM SHEET IS NOT COMPLETE AND MAY BE AMENDED PRIOR TO THE TIME OF SALE. THIS TERM SHEET IS NOT AN OFFER TO SELL THESE SECURITIES AND IT IS NOT A SOLICITATION OF AN OFFER TO BUY THESE SECURITIES IN ANY JURISDICTION WHERE THE OFFER OR SALE IS NOT PERMITTED.
140
(THIS PAGE INTENTIONALLY LEFT BLANK)
THE INFORMATION IN THIS STRUCTURAL AND COLLATERAL TERM SHEET IS NOT COMPLETE AND MAY BE AMENDED PRIOR TO THE TIME OF SALE. THIS TERM SHEET IS NOT AN OFFER TO SELL THESE SECURITIES AND IT IS NOT A SOLICITATION OF AN OFFER TO BUY THESE SECURITIES IN ANY JURISDICTION WHERE THE OFFER OR SALE IS NOT PERMITTED.
141
| No. 11 – ExchangeRight Net Leased Portfolio #41 | |||||||
| Mortgage Loan Information | Mortgaged Property Information(5) | ||||||
| Mortgage Loan Seller: | Morgan Stanley Mortgage Capital Holdings LLC | Single Asset/Portfolio: | Portfolio | ||||
| Credit Assessment (S&P/Fitch/KBRA): | NR/NR/NR | Property Type – Subtype(2): | Various | ||||
| Original Principal Balance(1): | $26,338,000 | Location(2): | Various | ||||
| Cut-off Date Balance(1): | $26,338,000 | Size: | 332,181 SF | ||||
| % of Initial Pool Balance: | 2.9% | Cut-off Date Balance Per SF(1): | $199.70 | ||||
| Loan Purpose: | Acquisition | Maturity Date Balance Per SF(1): | $199.70 | ||||
| Borrower Sponsor: | Warren Thomas; David Fisher; Joshua Ungerecht | Year Built/Renovated(2): | Various/Various | ||||
| Guarantors: | ExchangeRight Real Estate, LLC; Warren Thomas; David Fisher; Joshua Ungerecht | Title Vesting: | Fee | ||||
| LLC | Property Manager: | Self-managed | |||||
| Mortgage Rate: | 3.2050% | Current Occupancy (As of): | 100.0% (2/1/2021) | ||||
| Note Date: | November 24, 2020 | YE 2019 Occupancy(3): | NAV | ||||
| Seasoning: | 2 months | YE 2018 Occupancy(3): | NAV | ||||
| Maturity Date: | December 1, 2030 | YE 2017 Occupancy(3): | NAV | ||||
| IO Period: | 120 months | YE 2016 Occupancy(3): | NAV | ||||
| Loan Term (Original): | 120 months | As-Is Appraised Value(4): | $108,140,000 | ||||
| Amortization Term (Original): | NAP | As-Is Appraisal Value Per SF: | $325.55 | ||||
| Loan Amortization Type: | Interest-only, Balloon | As-Is Appraisal Valuation Date: | Various | ||||
| Call Protection: | L(26),D,(90),O(4) | ||||||
| Lockbox Type: | Hard/Springing Cash Management | Underwriting and Financial Information(5) | |||||
| Additional Debt(1): | Yes | YE 2019 NOI(3): | NAV | ||||
| Additional Debt Type (Balance) (1): | Pari Passu ($40,000,000) | YE 2018 NOI(3): | NAV | ||||
| YE 2017 NOI(3): | NAV | ||||||
| YE 2016 NOI(3): | NAV | ||||||
| U/W Revenues: | $5,998,997 | ||||||
| Escrows and Reserves | U/W Expenses: | $179,970 | |||||
| Initial | Monthly | Cap | U/W NOI: | $5,819,027 | |||
| RE Taxes | $190,224 | Springing | NAP | U/W NCF: | $5,596,413 | ||
| Insurance | $440 | $220 | NAP | U/W DSCR based on NOI/NCF(1): | 2.70x / 2.60x | ||
| Replacement Reserve | $0 | $2,860 | NAP | U/W Debt Yield based on NOI/NCF(1): | 8.8% / 8.4% | ||
| Deferred Maintenance | $34,460 | $0 | NAP | U/W Debt Yield at Maturity based on NOI/NCF(1): | 8.8% / 8.4% | ||
| TI/LC Reserve | $500,000 | Springing | NAP | Cut-off Date LTV Ratio(1): | 61.3% | ||
| Environmental Escrow | $28,836 | Springing | NAP | LTV Ratio at Maturity(1): | 61.3% | ||
| Sources and Uses | ||||||||
| Sources | Uses | |||||||
| Original Whole Loan Amount(1): | $66,338,000 | 61.0% | Purchase price | $106,997,444 | 98.3% | |||
| Borrower Equity: | 42,489,253 | 39.0 | Closing costs | 1,075,849 | 1.0 | |||
| Reserves | 753,960 | 0.7 | ||||||
| Total Sources | $108,827,253 | 100.0% | Total Uses | $108,827,253 | 100.0% | |||
| (1) | The ExchangeRight Net Leased Portfolio #41 Mortgage Loan (as defined below) is a part of the ExchangeRight Net Leased Portfolio #41 Whole Loan (as defined below) with an original aggregate principal balance of $66,338,000. The Cut-off Date Balance Per SF, Maturity Date Balance Per SF, U/W DSCR based on NOI/NCF, U/W Debt Yield based on NOI/NCF, U/W Debt Yield at Maturity based on NOI/NCF, Cut-off Date LTV Ratio and LTV Ratio at Maturity numbers presented above are based on the aggregate principal balance of the promissory notes comprising the ExchangeRight Net Leased Portfolio #41 Whole Loan. |
| (2) | See “The Properties” section below. |
| (3) | Historical occupancy and NOI are unavailable because the ExchangeRight Properties (as defined below) were acquired by the borrower sponsor between January 30, 2019 and October 30, 2020. |
| (4) | The appraisals are dated as of October 17, 2020 through October 26, 2020. |
| (5) | The novel coronavirus pandemic is an evolving situation and could impact the ExchangeRight Net Leased Portfolio #41 Whole Loan more severely than assumed in the underwriting of the ExchangeRight Net Leased Portfolio #41 Whole Loan and could adversely affect the NOI, NCF and occupancy information, as well as the appraised value and the DSCR, LTV and Debt Yield metrics presented above. See “Risk Factors—Risks Related to Market Conditions and Other External Factors—The Coronavirus Pandemic Has Adversely Affected the Global Economy and Will Likely Adversely Affect the Performance of the Mortgage Loans” in the Preliminary Prospectus. |
THE INFORMATION IN THIS STRUCTURAL AND COLLATERAL TERM SHEET IS NOT COMPLETE AND MAY BE AMENDED PRIOR TO THE TIME OF SALE. THIS TERM SHEET IS NOT AN OFFER TO SELL THESE SECURITIES AND IT IS NOT A SOLICITATION OF AN OFFER TO BUY THESE SECURITIES IN ANY JURISDICTION WHERE THE OFFER OR SALE IS NOT PERMITTED.
142
| Property Types – Various | Loan #11 | Cut-off Date Balance: | $26,338,000 | |
| Property Addresses – Various | ExchangeRight Net Leased Portfolio #41 | Cut-off Date LTV: | 61.3% | |
| U/W NCF DSCR: | 2.60x | |||
| U/W NOI Debt Yield: | 8.8% |
The Mortgage Loan. The mortgage loan (the “ExchangeRight Net Leased Portfolio #41 Mortgage Loan”) is part of a whole loan (the “ExchangeRight Net Leased Portfolio #41 Whole Loan”) evidenced by two promissory notes in the aggregate original principal amount of $66,338,000 and secured by the fee interests in 18 net leased, single-tenant retail and medical office properties located in twelve states (the “ExchangeRight Net Leased Portfolio #41 Properties”). The non-controlling Note A-2, in the original principal amount of $26,338,000, represents the ExchangeRight Net Leased Portfolio #41 Mortgage Loan and will be included in the BANK 2021-BNK31 securitization trust. The controlling Note A-1 in the original principal amount of $40,000,000 (the “ExchangeRight Net Leased Portfolio #41 Non-Serviced Pari Passu Companion Loan”), was contributed to the BANK 2020-BNK30 securitization transaction. The ExchangeRight Net Leased Portfolio #41 Whole Loan will be serviced pursuant to the pooling and servicing agreement for the BANK 2020-BNK30 securitization trust. See “Description of the Mortgage Pool—The Whole Loans—The Non-Serviced Pari Passu Whole Loans” and “Pooling and Servicing Agreement—Servicing of the Non-Serviced Mortgage Loans” in the Preliminary Prospectus.
Note Summary
| Notes | Original Principal Balance | Cut-off Date Balance | Note Holder | Controlling Interest |
| A-1 | $40,000,000 | $40,000,000 | BANK 2020-BNK30 | Yes |
| A-2 | $26,338,000 | $26,338,000 | BANK 2021-BNK31 | No |
| Total | $66,338,000 | $66,338,000 |
The Borrower and Borrower Sponsor. The borrower for the ExchangeRight Net Leased Portfolio #41 Whole Loan is ExchangeRight Net Leased Portfolio 41 DST (the “ExchangeRight Net Leased Portfolio #41 Borrower”), a Delaware statutory trust. The borrower sponsors are Warren Thomas, David Fisher and Joshua Ungerecht, the same sponsors as the ExchangeRight Net Leased Portfolio #42 Mortgage Loan and the ExchangeRight REIT 2 Mortgage Loan, all of whom serve as managers of ExchangeRight Real Estate, LLC. ExchangeRight Real Estate, LLC has more than 13 million SF of commercial properties under management and owns more than 775 investment-grade retail and Class B multifamily properties located in 39 states. ExchangeRight Real Estate, LLC and its three owners, David Fisher, Joshua Ungerecht and Warren Thomas (collectively, the “Individual Guarantors”), are the guarantors of certain non-recourse carveout liabilities under the ExchangeRight Net Leased Portfolio #41 Whole Loan. Warren Thomas was subject to a foreclosure sale in November, 2009. See “Description of the Mortgage Pool— Loan Purpose; Default History, Bankruptcy Issues and Other Proceedings” in the Preliminary Prospectus.
The ExchangeRight Net Leased Portfolio #41 Borrower has master leased the ExchangeRight Net Leased Portfolio #41 Properties to a master tenant (the “ExchangeRight Net Leased Portfolio #41 Master Tenant”) owned by ExchangeRight Real Estate, LLC, which is in turn owned by the Individual Guarantors. The ExchangeRight Net Leased Portfolio #41 Master Tenant is a Delaware limited liability company structured to be bankruptcy-remote, with one independent director. The master lease generally imposes responsibility on the ExchangeRight Net Leased Portfolio #41 Master Tenant for the operation, maintenance and management of the ExchangeRight Net Leased Portfolio #41 Properties and payment of all expenses incurred in the maintenance and repair of the ExchangeRight Net Leased Portfolio #41 Properties, other than capital expenses. The ExchangeRight Net Leased Portfolio #41 Master Tenant’s interest in all tenant rents was assigned to the ExchangeRight Net Leased Portfolio #41 Borrower, which in turn collaterally assigned its interest to the lender. The master lease is subordinate to the ExchangeRight Net Leased Portfolio #41 Whole Loan and, upon an event of default under the ExchangeRight Net Leased Portfolio #41 Whole Loan, the lender has the right to cause the ExchangeRight Net Leased Portfolio #41 Borrower to terminate the master lease. A default under the master lease is an event of default under the ExchangeRight Net Leased Portfolio #41 Whole Loan and gives rise to recourse liability to the non-recourse carveout guarantors for losses, unless such default arises solely in connection with the failure of the ExchangeRight Net Leased Portfolio #41 Master Tenant to pay rent as a result of the ExchangeRight Net Leased Portfolio #41 Properties not generating sufficient cash flow for the payment of such rent.
The lender has the right to require the ExchangeRight Net Leased Portfolio #41 Borrower to convert from a Delaware statutory trust to a limited liability company upon (i) an event of default or the lender’s good faith determination of imminent default under the ExchangeRight Net Leased Portfolio #41 Whole Loan, (ii) the lender’s good faith determination that the ExchangeRight Net Leased Portfolio #41 Borrower will be unable to make a material decision or take a material action required in connection with the operation and maintenance of any ExchangeRight Property, and (iii) 90 days prior to the maturity date of the ExchangeRight Net Leased Portfolio #41 Whole Loan, if an executed commitment from an institutional lender to refinance the ExchangeRight Net Leased Portfolio #41 Whole Loan is not delivered to the lender.
At any time after November 24, 2021, the borrower sponsor has the right to effect a one-time transfer of all (but not less than all) of the outstanding ownership interests in the ExchangeRight Net Leased Portfolio #41 Borrower to an Approved Transferee (as defined below) and to replace the non-recourse carveout guarantors as the person who controls the ExchangeRight Net Leased Portfolio #41 Borrower with such Approved Transferee; provided that certain conditions are satisfied, including among others: (i) no event of default has occurred and is continuing, (ii) the Approved Transferee owns 100% of the beneficial ownership interests in, and controls, the ExchangeRight Net Leased Portfolio #41 Borrower and ExchangeRight Net Leased Portfolio #41 Master Tenant, (iii) the Approved Transferee executes a full payment guarantee and indemnity pursuant to which it agrees to be liable (from and after the transfer) for all indemnity obligations (including environmental liabilities and obligations) for which the existing non-recourse carveout guarantors are liable under the non-recourse carveout guaranty, (iv) the delivery of a REMIC opinion, a non-consolidation opinion and other opinions required by the lender and (v) the receipt of confirmation from each applicable rating agency that such transfer and guarantor replacement will not result in a downgrade of the respective ratings assigned to all securities representing an interest in the ExchangeRight Net Leased Portfolio #41 Whole Loan (such a transfer and replacement, a “Qualified Transfer”). A Cash Management
THE INFORMATION IN THIS STRUCTURAL AND COLLATERAL TERM SHEET IS NOT COMPLETE AND MAY BE AMENDED PRIOR TO THE TIME OF SALE. THIS TERM SHEET IS NOT AN OFFER TO SELL THESE SECURITIES AND IT IS NOT A SOLICITATION OF AN OFFER TO BUY THESE SECURITIES IN ANY JURISDICTION WHERE THE OFFER OR SALE IS NOT PERMITTED.
143
| Property Types – Various | Loan #11 | Cut-off Date Balance: | $26,338,000 | |
| Property Addresses – Various | ExchangeRight Net Leased Portfolio #41 | Cut-off Date LTV: | 61.3% | |
| U/W NCF DSCR: | 2.60x | |||
| U/W NOI Debt Yield: | 8.8% |
Period (as defined below) will be triggered if a Qualified Transfer does not occur by December 1, 2027 (36 months prior to the maturity date of the ExchangeRight Net Leased Portfolio #41 Whole Loan). See “Lockbox and Cash Management” below.
“Approved Transferee” means (A) a depository institution that satisfies certain ratings criteria and is wholly-owned and controlled by a bank, savings and loan association, investment bank, insurance company, trust company, real estate investment trust, commercial credit corporation, pension plan, pension fund or pension advisory firm, mutual fund, government entity or plan or institution similar to any of the foregoing or (B) any person that (1)(i) has never been indicted or convicted of, or pled guilty or no contest to a felony, (ii) has never been indicted or convicted of, or pled guilty or no contest to a Patriot Act offense and is not on any government watch list, (iii) has never been the subject of a voluntary or involuntary (to the extent the same has not been discharged) bankruptcy proceeding, (iv) has no material outstanding judgments, litigations or regulatory actions against it or its interests and (v) is not crowdfunded, (2) is regularly engaged in the business of owning or operating commercial properties, or interests therein, which are similar to the ExchangeRight Net Leased Portfolio #41 Properties, (3) owns interests in, or operates, at least five retail properties with a minimum of 750,000 SF in the aggregate, (4) satisfies certain net worth or ratings criteria and (5) causes a conversion of the ExchangeRight Net Leased Portfolio #41 Borrower into a Delaware limited liability company.
The Properties. The ExchangeRight Net Leased Portfolio #41 Properties are comprised of 18 single-tenant retail and medical office properties totaling 332,181 SF and located across twelve states. The ExchangeRight Net Leased Portfolio #41 Properties are located in Arizona (two properties, 7.7% of NRA and 22.5% of underwritten rent), Virginia (two properties, 15.8% of NRA and 19.8% of underwritten rent), Texas (four properties, 29.3% of NRA and 13.1% of underwritten rent), Alabama (one property, 12.6% of NRA and 11.5% of underwritten rent) and Pennsylvania (two properties, 8.5% of NRA and 6.1% of underwritten rent), with the seven remaining ExchangeRight Net Leased Portfolio #41 Properties located in Ohio, Arkansas, Illinois, Georgia, Louisiana, Wisconsin and Indiana. Built between 1982 and 2020, with 8 of the 18 properties built between 2018 and 2020 (inclusive), the ExchangeRight Net Leased Portfolio #41 Properties range in size from 6,192 SF to 62,812 SF.
The ExchangeRight Net Leased Portfolio #41 Properties are leased to the following eleven nationally recognized tenants operating in diverse retail segments: Walmart Neighborhood Market, BioLife Plasma Services L.P., Dignity Health, Walgreens, Tractor Supply, Dollar General, Natural Grocers, Hobby Lobby, CVS Pharmacy, Fresenius Medical Care and Dollar Tree. The ExchangeRight Net Leased Portfolio #41 Properties have a weighted average remaining lease term of approximately 13.8 years. Leases representing 67.4% of NRA and 70.0% of the underwritten base rent expire after the maturity date of the ExchangeRight Net Leased Portfolio #41 Whole Loan. For the purposes of the preceding two sentences, the Walgreens leases, which grant early termination rights to Walgreens, were assumed to expire on the date when the earliest termination right under the lease, if exercised, would be effective.
THE INFORMATION IN THIS STRUCTURAL AND COLLATERAL TERM SHEET IS NOT COMPLETE AND MAY BE AMENDED PRIOR TO THE TIME OF SALE. THIS TERM SHEET IS NOT AN OFFER TO SELL THESE SECURITIES AND IT IS NOT A SOLICITATION OF AN OFFER TO BUY THESE SECURITIES IN ANY JURISDICTION WHERE THE OFFER OR SALE IS NOT PERMITTED.
144
| Property Types – Various | Loan #11 | Cut-off Date Balance: | $26,338,000 | |
| Property Addresses – Various | ExchangeRight Net Leased Portfolio #41 | Cut-off Date LTV: | 61.3% | |
| U/W NCF DSCR: | 2.60x | |||
| U/W NOI Debt Yield: | 8.8% |
The following table presents certain information relating to the ExchangeRight Net Leased Portfolio #41 Properties.
ExchangeRight Net Leased Portfolio #41 Properties Summary
Tenant Name City, State | Year Built/ Renovated | Tenant NRSF | %of Portfolio NRSF | Lease Expiration Date(1) | Appraised Value | % of Portfolio Appraised Value | Annual U/W Base Rent | Annual U/W Base Rent PSF | % of Annual U/W Base Rent | Renewal Options(2) | |
Dignity Health Glendale, AZ | 2019 / NAP | 11,060 | 3.3% | 8/22/2034 | $15,250,000 | 14.1% | $799,453 | $72.28 | 12.7% | 6, 5-year | |
| Walmart Neighborhood Market Mobile, AL | 2015 / NAP | 41,920 | 12.6% | 11/10/2030 | $13,000,000 | 12.0% | $728,559 | $17.38 | 11.5% | 17, 5-year | |
| Walmart Neighborhood Market Forest, VA | 2015 / NAP | 41,117 | 12.4% | 6/9/2030 | $12,700,000 | 11.7% | $732,330 | $17.81 | 11.6% | 17, 5-year | |
| BioLife Plasma Services L.P. Avondale, AZ | 2020 / NAP | 14,410 | 4.3% | 10/1/2035(3) | $10,450,000 | 9.7% | $621,802 | $43.15 | 9.8% | 3, 5-year | |
| BioLife Plasma Services L.P. Richmond, VA | 1998 / 2020 | 11,269 | 3.4% | 10/31/2035(3) | $8,800,000 | 8.1% | $517,010 | $45.88 | 8.2% | 3, 5-year | |
Natural Grocers Little Rock, AR | 2015 / NAP | 15,000 | 4.5% | 4/30/2031 | $6,385,000 | 5.9% | $367,050 | $24.47 | 5.8% | 4, 5-year | |
Walgreens Columbus, OH | 2000 / 2018 | 15,120 | 4.6% | 1/31/2031 | $5,650,000 | 5.2% | $387,000 | $25.60 | 6.1% | 7, 5-year | |
CVS Pharmacy Schaumburg, IL | 2005 / NAP | 13,013 | 3.9% | 1/31/2031 | $5,200,000 | 4.8% | $285,000 | $21.90 | 4.5% | 6, 5-year | |
Hobby Lobby Odessa, TX | 1982 / NAP | 62,812 | 18.9% | 4/30/2031 | $5,100,000 | 4.7% | $312,000 | $4.97 | 4.9% | 2, 5-year | |
Tractor Supply Toughkenamon, PA | 2018 / NAP | 19,097 | 5.7% | 4/30/2033 | $5,000,000 | 4.6% | $288,000 | $15.08 | 4.6% | 3, 5-year | |
Walgreens Harker Heights, TX | 2006/ NAP | 14,820 | 4.5% | 10/31/2031 | $5,000,000 | 4.6% | $300,000 | $20.24 | 4.8% | Monthly | |
| Fresenius Medical Care Hephzibah, GA | 2015 / NAP | 6,192 | 1.9% | 6/30/2030 | $3,590,000 | 3.3% | $220,023 | $35.53 | 3.5% | 3, 5-year | |
Tractor Supply Alexandria, LA | 2008 / NAP | 19,097 | 5.7% | 10/31/2030 | $3,440,000 | 3.2% | $214,992 | $11.26 | 3.4% | 5, 5-year | |
Dollar Tree Brown Deer, WI | 2020 / NAP | 9,560 | 2.9% | 1/31/2031 | $2,000,000 | 1.8% | $131,450 | $13.75 | 2.1% | 4, 5-year | |
| Dollar General Odessa, TX | 2019 / NAP | 10,566 | 3.2% | 10/31/2034 | $1,875,000 | 1.7% | $116,200 | $11.00 | 1.8% | 3, 5-year | |
Dollar General New Castle, PA | 2019 / NAP | 9,100 | 2.7% | 10/31/2034 | $1,600,000 | 1.5% | $99,729 | $10.96 | 1.6% | 3, 5-year | |
Dollar General Evansville, IN | 2020 / NAP | 9,026 | 2.7% | 9/30/2035 | $1,550,000 | 1.4% | $97,600 | $10.81 | 1.5% | 5, 5-year | |
Dollar General Harlingen, TX | 2020 / NAP | 9,002 | 2.7% | 9/30/2035 | $1,550,000 | 1.4% | $96,536 | $10.72 | 1.5% | 5, 5-year | |
| Total/Weighted Average | 332,181 | 100.0% | $108,140,000 | 100.0% | $6,314,734 | $19.01 | 100.0% | ||||
| (1) | For the purposes of the table and loan underwriting, the Walgreens leases, which each grant early termination rights to Walgreens, were assumed to expire on the date as of when the earliest termination right under each lease, if exercised, would be effective. |
| (2) | Where any termination right effective date has been assumed to be the lease expiration date, the Renewal Options as shown reflect periods between subsequent termination right effective dates. |
| (3) | The tenant has the right to terminate its lease upon providing 30 days’ written notice to the landlord and paying the net present value of the total obligation for base rent and additional rent for the remainder of the current lease term. |
THE INFORMATION IN THIS STRUCTURAL AND COLLATERAL TERM SHEET IS NOT COMPLETE AND MAY BE AMENDED PRIOR TO THE TIME OF SALE. THIS TERM SHEET IS NOT AN OFFER TO SELL THESE SECURITIES AND IT IS NOT A SOLICITATION OF AN OFFER TO BUY THESE SECURITIES IN ANY JURISDICTION WHERE THE OFFER OR SALE IS NOT PERMITTED.
145
| Property Types – Various | Loan #11 | Cut-off Date Balance: | $26,338,000 | |
| Property Addresses – Various | ExchangeRight Net Leased Portfolio #41 | Cut-off Date LTV: | 61.3% | |
| U/W NCF DSCR: | 2.60x | |||
| U/W NOI Debt Yield: | 8.8% |
Major Tenants. The following table presents certain information relating to the major tenants at the ExchangeRight Net Leased Portfolio #41 Properties:
Major Tenants
| Tenant Name | Credit Rating (S&P/Moody’s/Fitch)(1) | No of
Prop.
| Tenant NRSF | % of NRSF | Annual U/W Base Rent | Annual U/W Base Rent PSF | % of Total Annual U/W Base Rent |
| Major Tenants | |||||||
| Walmart Neighborhood Market | AA / Aa2 / AA | 2 | 83,037 | 25.0% | $1,460,889 | $17.59 | 23.1% |
| BioLife Plasma Services L.P. | NR / NR / NR | 2 | 25,679 | 7.7% | $1,138,812 | $44.35 | 18.0% |
| Dignity Health | BBB+ / Baa1 / BBB+ | 1 | 11,060 | 3.3% | $799,453 | $72.28 | 12.7% |
| Walgreens | BBB / Baa2 / BBB | 2 | 29,940 | 9.0% | $687,000 | $22.95 | 10.9% |
| Tractor Supply | NR / NR / NR | 2 | 38,194 | 11.5% | $502,992 | $13.17 | 8.0% |
| Dollar General | BBB / Baa2 / NR | 4 | 37,694 | 11.3% | $410,064 | $10.88 | 6.5% |
| Natural Grocers | NR / NR / NR | 1 | 15,000 | 4.5% | $367,050 | $24.47 | 5.8% |
| Hobby Lobby | NR / NR / NR | 1 | 62,812 | 18.9% | $312,000 | $4.97 | 4.9% |
| CVS Pharmacy | BBB / Baa2 / NR | 1 | 13,013 | 3.9% | $285,000 | $21.90 | 4.5% |
| Fresenius Medical Care | BBB / Baa3 / BBB- | 1 | 6,192 | 1.9% | $220,023 | $35.53 | 3.5% |
| Dollar Tree | BBB- / Baa2 / NR | 1 | 9,560 | 2.9% | $131,450 | $13.75 | 2.1% |
| Total Major Tenants | 18 | 332,181 | 100.0% | $6,314,734 | $19.01 | 100.0% | |
| Vacant Space | 0 | 0.0% | |||||
| Collateral Total | 332,181 | 100.0% | |||||
| (1) | Certain ratings are those of the parent company whether or not the parent company guarantees the lease. |
The following table presents certain information relating to the lease expiration schedule at the ExchangeRight Net Leased Portfolio #41 Properties:
Lease Expiration Schedule(1)(2)(3)
| Year Ending December 31, | No. of Leases Expiring | Expiring NRSF | % of Total NRSF | Cumulative Expiring NRSF | Cumulative % of Total NRSF | Annual U/W Base Rent | % of Total Annual U/W Base Rent | Annual U/W Base Rent PSF |
| 2021 | 0 | 0 | 0.0% | 0 | 0.0% | $0 | 0.0% | $0.00 |
| 2022 | 0 | 0 | 0.0% | 0 | 0.0% | $0 | 0.0% | $0.00 |
| 2023 | 0 | 0 | 0.0% | 0 | 0.0% | $0 | 0.0% | $0.00 |
| 2024 | 0 | 0 | 0.0% | 0 | 0.0% | $0 | 0.0% | $0.00 |
| 2025 | 0 | 0 | 0.0% | 0 | 0.0% | $0 | 0.0% | $0.00 |
| 2026 | 0 | 0 | 0.0% | 0 | 0.0% | $0 | 0.0% | $0.00 |
| 2027 | 0 | 0 | 0.0% | 0 | 0.0% | $0 | 0.0% | $0.00 |
| 2028 | 0 | 0 | 0.0% | 0 | 0.0% | $0 | 0.0% | $0.00 |
| 2029 | 0 | 0 | 0.0% | 0 | 0.0% | $0 | 0.0% | $0.00 |
| 2030 | 4 | 108,326 | 32.6% | 108,326 | 32.6% | $1,895,904 | 30.0% | $17.50 |
| 2031 | 6 | 130,325 | 39.2% | 238,651 | 71.8% | $1,782,500 | 28.2% | $13.68 |
| Thereafter | 8 | 93,530 | 28.2% | 332,181 | 100.0% | $2,636,330 | 41.8% | $28.19 |
| Vacant | 0 | 0 | 0.0% | 332,181 | 100.0% | $0 | 0.0% | $0.00 |
| Total/Weighted Average | 18 | 332,181 | 100.0% | $6,314,734 | 100.0% | $19.01 |
| (1) | Information is based on the underwritten rent roll. |
| (2) | Certain tenants may have lease termination options that are exercisable prior to the stated expiration date of the subject lease or leases which are not considered in the lease rollover schedule. |
| (3) | For the purposes of the table and loan underwriting, the Walgreens leases, which each grant early termination rights to Walgreens, were assumed to expire on the date as of when the earliest termination right under each lease, if exercised, would be effective. |
The following table presents historical occupancy percentages at the ExchangeRight Net Leased Portfolio #41 Properties:
Historical Occupancy
12/31/2016(1) | 12/31/2017(1) | 12/31/2018(1) | 12/31/2019(1) | 2/1/2021(2) |
| NAV | NAV | NAV | NAV | 100.0% |
| (1) | The ExchangeRight Net Leased Portfolio #41 Properties were acquired by the borrower sponsor between January 30, 2019 and October 30, 2020. Historical occupancy for the portfolio of ExchangeRight Net Leased Portfolio #41 Properties is not available. |
| (2) | information obtained from the underwritten rent roll. |
THE INFORMATION IN THIS STRUCTURAL AND COLLATERAL TERM SHEET IS NOT COMPLETE AND MAY BE AMENDED PRIOR TO THE TIME OF SALE. THIS TERM SHEET IS NOT AN OFFER TO SELL THESE SECURITIES AND IT IS NOT A SOLICITATION OF AN OFFER TO BUY THESE SECURITIES IN ANY JURISDICTION WHERE THE OFFER OR SALE IS NOT PERMITTED.
146
| Property Types – Various | Loan #11 | Cut-off Date Balance: | $26,338,000 | |
| Property Addresses – Various | ExchangeRight Net Leased Portfolio #41 | Cut-off Date LTV: | 61.3% | |
| U/W NCF DSCR: | 2.60x | |||
| U/W NOI Debt Yield: | 8.8% |
Underwritten Net Cash Flow. The following table presents certain information relating to the underwritten net cash flow at the ExchangeRight Net Leased Portfolio #41 Properties:
Cash Flow Analysis(1)(2)
| U/W | % of Effective Gross Income | U/W $ per SF | |
| Base Rent | $6,314,734 | 105.3% | $19.01 |
| Reimbursements | 0 | 0.0 | 0.00 |
| (Vacancy & Credit Loss) | (315,737) | (5.3) | (0.95) |
| Effective Gross Income | $5,998,997 | 100.0% | $18.06 |
| Total Expenses(3) | $179,970 | 3.0% | $0.54 |
| Net Operating Income | $5,819,027 | 97.0% | $17.52 |
| CapEx | 49,865 | 0.8 | 0.15 |
| TI/LC | 222,749 | 3.7 | 0.67 |
| Plus Other | 50,000 | 0.8 | 0.15 |
| Net Cash Flow | $5,596,413 | 93.3% | $16.85 |
| NOI DSCR(4) | 2.70x | ||
| NCF DSCR(4) | 2.60x | ||
| NOI Debt Yield(4) | 8.8% | ||
| NCF Debt Yield(4) | 8.4% |
| (1) | For the avoidance of doubt, no COVID specific adjustments have been made to the lender underwriting. |
| (2) | Historical financial information is not available because the ExchangeRight Properties were acquired by the borrower sponsor between January 30, 2019 and October 30, 2020. |
| (3) | Total Expenses consist of a 3.0% management fee. |
| (4) | Debt service coverage ratios and debt yields are based on the ExchangeRight Net Leased Portfolio #41 Whole Loan. |
COVID-19 Update. As of January 4, 2021, the ExchangeRight Net Leased Portfolio #41 Whole Loan is current as of the January debt service payment and is not subject to any forbearance, modification or debt service relief request. As of January 4, 2021, the ExchangeRight Net Leased Portfolio #41 Properties are open and operating, all tenants have remained current on all rent and lease obligations, and no lease modification or rent relief requests have been received.
THE INFORMATION IN THIS STRUCTURAL AND COLLATERAL TERM SHEET IS NOT COMPLETE AND MAY BE AMENDED PRIOR TO THE TIME OF SALE. THIS TERM SHEET IS NOT AN OFFER TO SELL THESE SECURITIES AND IT IS NOT A SOLICITATION OF AN OFFER TO BUY THESE SECURITIES IN ANY JURISDICTION WHERE THE OFFER OR SALE IS NOT PERMITTED.
147
| No. 12 – Coleman Highline | |||||||
| Mortgage Loan Information | Mortgaged Property Information(10) | ||||||
| Mortgage Loan Seller: | Wells Fargo Bank, National Association | Single Asset/Portfolio: | Single Asset | ||||
Credit Assessment (Fitch/KBRA/Moody’s): | NR/NR/NR | Property Type – Subtype: | Office – Suburban | ||||
| Original Principal Balance(1): | $22,000,000 | Location: | San Jose, CA | ||||
| Cut-off Date Balance(1): | $22,000,000 | Size: | 357,106 SF | ||||
| % of Initial Pool Balance: | 2.4% | Cut-off Date Balance Per SF(1): | $469.61 | ||||
| Loan Purpose: | Acquisition | Maturity Date/ARD Balance Per SF(1): | $469.61 | ||||
| Borrower Sponsor: | BREIT Operating Partnership, L.P. | Year Built/Renovated: | 2017/NAP | ||||
| Guarantor: | BREIT Operating Partnership, L.P. | Title Vesting: | Fee | ||||
| Mortgage Rate: | 2.8675% | Property Manager: | EQ Management, LLC | ||||
| Note Date: | October 30, 2020 | Current Occupancy (As of): | 100.0% (2/1/2021) | ||||
| Seasoning: | 3 months | YE 2019 Occupancy(8): | NAV | ||||
| Anticipated Repayment Date(2): | November 6, 2030 | YE 2018 Occupancy(8): | NAV | ||||
| Maturity Date(2): | November 6, 2032 | YE 2017 Occupancy(8): | NAV | ||||
| IO Period: | 120 months | YE 2016 Occupancy(8): | NAV | ||||
| Loan Term (Original/ARD) (2): | 120 months | As-Stabalized Appraised Value(9): | $296,800,000 | ||||
| Amortization Term (Original): | NAP | As-Stabalized Appraised Value Per SF(9): | $831.13 | ||||
| Loan Amortization Type: | Interest-only, ARD | As-Stabalized Appraisal Valuation Date(9): | January 1, 2022 | ||||
| Call Protection(3): | GRTR 0.5% or YM(27), GRTR 0.5% or YM or D(86), O(7) | ||||||
| Lockbox Type: | Hard/Springing Cash Management | Underwriting and Financial Information(10) | |||||
| Additional Debt(1): | Yes | TTM NOI(8): | NAV | ||||
| Additional Debt Type (Balance): | Pari Passu($145,700,000) | YE 2019 NOI(8): | NAV | ||||
| YE 2018 NOI(8): | NAV | ||||||
| YE 2017 NOI(8): | NAV | ||||||
| U/W Revenues: | $21,742,740 | ||||||
| U/W Expenses: | $6,234,846 | ||||||
| Escrows and Reserves | U/W NOI: | $15,507,894 | |||||
| Initial | Monthly | Cap | U/W NCF: | $15,507,894 | |||
| Taxes(4) | $0 | Springing | NAP | U/W DSCR based on NOI/NCF(1): | 3.18x / 3.18x | ||
| Insurance(5) | $0 | Springing | NAP | U/W Debt Yield based on NOI/NCF(1): | 9.2% / 9.2% | ||
| Unfunded Obligations Reserve(6) | $14,814,604 | $0 | NAP | U/W Debt Yield at Maturity/ARD based on NOI/NCF(1): | 9.2% / 9.2% | ||
| Debt Service Reserve(7) | $4,875,587 | $0 | NAP | Cut-off Date LTV Ratio(1) (9): | 56.5% | ||
| LTV Ratio at Maturity/ARD(1)(9): | 56.5% | ||||||
| Sources and Uses | ||||||||
| Sources | Uses | |||||||
| Original whole loan amount | $167,700,000 | 55.6% | Purchase Price | $275,000,000 | 91.2% | |||
| Borrower Equity | 133,838,667 | 44.4 | Unfunded Obligations Reserve | 14,814,604 | 4.9 | |||
| Debt Service Reserve | 4,875,587 | 1.6 | ||||||
| Closing Costs | 6,848,476 | 2.3 | ||||||
| Total Sources | $301,538,667 | 100.0% | Total Uses | $301,538,667 | 100.0% | |||
| (1) | The Coleman Highline Mortgage Loan (as defined below) is part of the Coleman Highline Whole Loan (as defined below) with an original aggregate principal balance of $167,700,000. The Cut-off Date Balance Per square foot, Maturity Date/ARD Balance Per square foot, U/W Debt Yield based on NOI/NCF, U/W Debt Yield at Maturity Date/ARD based on NOI/NCF, U/W DSCR based on NOI/NCF, Cut-off Date LTV Ratio and LTV Ratio at Maturity/ARD numbers presented above are based on the Coleman Highline Whole Loan. |
| (2) | The Coleman Highline Mortgage Loan has an anticipated repayment date of November 6, 2030 and a final maturity date of November 6, 2032. See “The Mortgage Loan” for further discussion of the ARD (as defined below). |
| (3) | At any time after the earlier of (i) October 30, 2023 and (ii) two years from the closing date of the securitization that includes the last pari passu note of the Coleman Highline Whole Loan to be securitized, BCORE Coleman Owner LLC (the “Coleman Highline Borrower”) has the right to defease the Coleman Highline Whole Loan in whole, but not in part. Additionally, the Coleman Highline Borrower may prepay the Coleman Highline Whole Loan at any time during the term with a 10-day prior notice and, if such prepayment occurs before May 6, 2030, payment of the yield maintenance premium. |
| (4) | During a cash sweep period, the Coleman Highline Whole Loan documents require ongoing monthly real estate tax reserve deposits in an amount equal to one-twelfth of the real estate taxes that the lender estimates will be payable during the next 12 months. |
| (5) | During a cash sweep period, the Coleman Highline Whole Loan documents require ongoing monthly insurance reserve deposits in an amount equal to one-twelfth of the insurance premiums that the lender estimates will be payable for the renewal of the required coverages during the next 12 months; provided that so long as no event of default is continuing, to the extent insurance is maintained by the Coleman Highline Borrower under one or more blanket policies reasonably acceptable to the lender, the Coleman Highline Borrower is not required to make ongoing monthly insurance reserve deposits. |
| (6) | The Coleman Highline Whole Loan documents require an upfront deposit of $14,814,604 for unfunded tenant improvement allowances, free rent and leasing commissions related to the Roku lease. Any unused portion of the reserve, as of December 15, 2021, is deemed forfeited by Roku pursuant to the Building 1 lease. Provided there is no event of default, any remaining funds in the Unfunded Obligations Reserve thereafter will be released to the Coleman Highline Borrower on the earlier of (i) payment of the Coleman Highline Whole Loan in full, or (ii) subject to the cash management requirements, delivery of evidence reasonably acceptable to the lender that the Unfunded Obligations associated with the Roku lease have been fully satisfied. |
THE INFORMATION IN THIS STRUCTURAL AND COLLATERAL TERM SHEET IS NOT COMPLETE AND MAY BE AMENDED PRIOR TO THE TIME OF SALE. THIS TERM SHEET IS NOT AN OFFER TO SELL THESE SECURITIES AND IT IS NOT A SOLICITATION OF AN OFFER TO BUY THESE SECURITIES IN ANY JURISDICTION WHERE THE OFFER OR SALE IS NOT PERMITTED.
148
| Office – Suburban | Loan #12 | Cut-off Date Balance: | $22,000,000 | |
| 1143 & 1155 Coleman Avenue | Coleman Highline | Cut-off Date LTV: | 56.5% | |
| San Jose, CA 95110 | U/W NCF DSCR: | 3.18x | ||
| U/W NOI Debt Yield: | 9.2% |
| (7) | The Coleman Highline Whole Loan documents require an upfront deposit of $4,875,587, which is equal to twelve months of debt service. On each payment date, the lender will apply reserve funds in an amount equal to the difference between the debt service payable and the payment received from the Coleman Highline Borrower. The Debt Service Reserve will be released if, after October 30, 2021, the following conditions have been satisfied: (a) no Cash Sweep Period is continuing; (b) either (i) Roku or (ii) a tenant under a replacement lease for the Roku space has made all rental payments due under the Roku lease or replacement lease for the preceding three months; (c) the debt service coverage ratio equals or exceeds (i) if the Roku lease is in place, 3.40x or (ii) if a replacement lease is in place, 2.00x; and (d) no portion of the Debt Service Reserve funds have been allocated to debt service payments in the preceding eleven months. |
| (8) | No historical operating or occupancy statements are available because the Coleman Highline Property (as defined below) was completed in 2017 and was acquired in connection with the origination of the Coleman Highline Whole Loan. No historical operating or occupancy statements are available |
| (9) | The Appraised Value represents the prospective market value upon stabilization as of January 1, 2022. This assumes that the remaining tenant improvements have been completed on Building 1 (as defined below) and Roku has moved into its space. The As Is Appraised Value, as of October 12, 2020, is $275,700,000, representing a 60.8% loan-to-value ratio. The appraisal also provided a hypothetical as if vacant value, as of October 12, 2020, of $203,300,000, representing an 82.5% loan-to-dark value ratio. |
| (10) | The novel coronavirus pandemic is an evolving situation and could impact the Coleman Highline Mortgage Loan more severely than assumed in the underwriting of the Coleman Highline Mortgage Loan and could adversely affect the NOI, NCF and occupancy information, as well as the appraised value and the DSCR, LTV and Debt Yield metrics presented above and herein. See “Risk Factors—Risks Related to Market Conditions and Other External Factors—The Coronavirus Pandemic Has Adversely Affected the Global Economy and Will Likely Adversely Affect the Performance of the Mortgage Loans” in the Preliminary Prospectus. |
The Mortgage Loan. The mortgage loan (the “Coleman Highline Mortgage Loan”) is part of a whole loan (the “Coleman Highline Whole Loan”) that is evidenced by three pari passu promissory notes in the aggregate original principal amount of $167,700,000. The Coleman Highline Whole Loan is secured by a first priority fee mortgage encumbering two Class A office buildings located in San Jose, California (the “Coleman Highline Property”). The Coleman Highline Whole Loan has an anticipated repayment date of November 6, 2030 (the “ARD”) and a maturity date of November 6, 2032. Prior to the ARD, the Coleman Highline Whole Loan accrues interest at a fixed rate of 2.8675% per annum (the “Initial Interest Rate”) and requires payments of interest only through the ARD. In the event the Coleman Highline Whole Loan is not repaid in full on or before the ARD, the Coleman Highline Borrower will be required to make interest payments based on an interest rate equal to the Initial Interest Rate plus 2.000% per annum (“Rate Increase”). From and after the ARD, interest payments will continue to be made as provided prior to the ARD, with amounts accrued with respect to the Rate Increase being deferred and paid on the Maturity Date, if not paid sooner by the Coleman Highline Borrower. The ARD automatically triggers a cash sweep period whereby all excess cash flow, after payments of debt service on the Coleman Highline Whole Loan, required deposits to escrows and reserves, and budgeted operating expenses, is required to be used to first pay down the principal balance of the Coleman Highline Whole Loan and thereafter, repay the accrued interest. See “Description of the Mortgage Loans—Certain Terms of the Mortgage Loans—ARD Loans” in the Preliminary Prospectus.
The Coleman Highline Mortgage Loan is evidenced by the non-controlling promissory Note A-3 in the original principal amount of $22,000,000. The controlling promissory Note A-1 was securitized in BANK 2020-BNK29 and the non-controlling promissory Note A-2 was securitized in BANK 2020-BNK30 (the “Coleman Highline Non-Serviced Pari Passu Companion Loans”). The Coleman Highline Whole Loan will be serviced pursuant to the pooling and servicing agreement for the BANK 2020-BNK29 securitization trust. See “Description of the Mortgage Pool—The Whole Loans—The Non-Serviced Pari Passu Whole Loans” and “Pooling and Servicing Agreement” in the Preliminary Prospectus.
| Coleman Highline Whole Loan Summary | ||||
| Notes | Original Balance | Cut-off Date Balance | Note Holder | Controlling Piece |
| A-1 | $85,000,000 | $85,000,000 | BANK 2020-BNK29 | Yes |
| A-2 | $60,700,000 | $60,700,000 | BANK 2020-BNK30 | No |
| A-3 | $22,000,000 | $22,000,000 | BANK 2021–BNK 31 | No |
| Total Whole Loan | $167,700,000 | $167,700,000 | ||
The Property. The Coleman Highline Property is a 357,106 SF, Class A office campus located in San Jose, California. Built in 2017, the Coleman Highline Property is 100.0% leased to Roku, Inc. (“Roku” or “Tenant”) as its world headquarters, and is comprised of the following components:
| ● | “Building 1” – a 162,557 SF, 5-story office building; |
| ● | “Building 2” – a 194,549 SF, 6-story office building; |
| ● | “Amenity Building” – a 6,000 SF, 1-story amenities building, programmed as a fitness center; and |
| ● | “Parking Structure” – a 3-story parking garage with 409 parking spaces. |
The Coleman Highline Property is the first phase (“Phase I”) in the larger Coleman Highline mixed-use development, which is expected to include up to eight office buildings totaling 1.5 million SF, a 175-room hotel, 1,600 residential units, and supporting retail. The second phase of the development (“Phase II”), which includes Buildings 3 and 4, was completed in 2020 and is also fully leased to Roku. The Coleman Highline project includes a pedestrian walkway to the Santa Clara Station of Caltrain, access to Valley Transportation Authority (“VTA”) bus and light rail lines and an anticipated future Bay Area Rapid Transit (“BART”) stop.
The Coleman Highline Borrower is acquiring the Coleman Highline Property for $275,000,000, approximately $770 per rentable square foot. The Coleman Highline Property was designed by Gensler and features expansive glasslines, large floorplates (approximately 32,500 SF), and 14’ slab-to-slab heights. The Coleman Highline Property has a modern build-out with an open lobby. Additionally, the Highline extension, an elevated terrace with outdoor landscaped urban courtyards, connects Building 2 with the Amenity Building.
In addition to the Parking Structure, the Coleman Highline Property is subject to a Declaration of Covenants, Conditions and Restrictions (the “CCR”) which provides that (i) all parking structures on the Coleman Highline Property and the adjacent Phase II, which includes a 1,704 space parking garage, are to be shared parking between the Coleman Highline Property and Phase II and (ii) all parking structures throughout the Coleman Highline development are subject to various control rights of CAP Tranche 2, LLC (the “Declarant”), an entity unrelated to the Coleman Highline Borrower. However, the Declarant has agreed that the Coleman Highline Property will
THE INFORMATION IN THIS STRUCTURAL AND COLLATERAL TERM SHEET IS NOT COMPLETE AND MAY BE AMENDED PRIOR TO THE TIME OF SALE. THIS TERM SHEET IS NOT AN OFFER TO SELL THESE SECURITIES AND IT IS NOT A SOLICITATION OF AN OFFER TO BUY THESE SECURITIES IN ANY JURISDICTION WHERE THE OFFER OR SALE IS NOT PERMITTED.
149
| Office – Suburban | Loan #12 | Cut-off Date Balance: | $22,000,000 | |
| 1143 & 1155 Coleman Avenue | Coleman Highline | Cut-off Date LTV: | 56.5% | |
| San Jose, CA 95110 | U/W NCF DSCR: | 3.18x | ||
| U/W NOI Debt Yield: | 9.2% |
always have access to sufficient parking to satisfy all legal requirements, as well as parking requirements contained in the Roku lease. In addition to the two parking structures in Phase I and Phase II, there are approximately 314 surface parking spaces in the development. Roku is entitled to primarily unreserved parking spaces equaling a parking ratio of approximately 3.2 spaces per 1,000 SF.
Building 1 is currently in warm shell condition. It was initially leased to 8x8, Inc. in January 2019, but 8x8, Inc. outgrew the space prior to moving in and has assigned the lease to Roku, which is required to begin paying rent January 1, 2021; 8x8, Inc. is required to pay rent through December 31, 2020. There is a $14.8 million outstanding tenant improvement allowance, which was reserved at loan closing, and must be used by December 15, 2021. Building 2 is completely built out and Roku took occupancy in phases between January and September 2019.
Major Tenant.
Roku (357,106 SF; 100.0% of NRA; 100.0% of underwritten base rent). Roku has been a tenant at the Coleman Highline Property since 2019. A public company founded in 2002, Roku is a pioneer of streaming television. Its streaming devices are used by consumers in North America, Latin America, and parts of Europe including the UK, Ireland and France. Roku is the number one streaming platform in the U.S. by hours streamed and its Roku Channel was watched by an estimated 46 million people in the U.S. as of the third quarter of 2020. The company is divided into two segments: Player, which is the sale of streaming players and audio products, and Platform, which generates revenue from advertising, content distribution and ongoing subscription services. As of December 31, 2019, Roku reported a net loss of $59.9 million and total revenue of $1.1 billion, representing an increase of 52.0% from December 31, 2018, with $515.5 million of cash and cash equivalents. Year-over-year, as of the third quarter of 2020, Roku increased its active accounts from 32.3 million to 46.0 million and its streaming hours by 54%. Additionally, Platform revenue increased by 78% year-over-year and gross profit was up by 81%. In the third quarter of 2020, Roku reported net income from operations of $12.0 million and adjusted EBITDA (net income or loss excluding (i) other income, (ii) stock-based compensation expense, (iii) depreciation and amortization, and (iv) income tax expense) of $56.2 million. Year-to-date through the third quarter of 2020, Roku reported a net loss of $85.0 million and adjusted EBITDA of $36.5 million.
Roku currently leases 100.0% of Building 1 and Building 2, for a total of 357,106 SF (the “Roku Premises”). There is no remaining free rent and all outstanding tenant improvements were reserved at loan closing.
| ● | Roku leases 162,557 SF in Building 1 under a lease expiring on December 31, 2029, with one, 5-year renewal option and no termination options. Building 1 was originally leased to 8x8, Inc. (“Assignor”), however, Assignor never moved in and assigned the lease to Roku. Assignor is required to pay rent through December 31, 2020, with Roku’s rent commencing January 1, 2021 and including 3% annual rent escalations. The two months of rent required to be paid by 8x8, Inc. between loan closing and Roku’s required rent start date was not reserved at loan closing. Some work has been completed on the building, however, the majority of the space is in shell condition, as tenant improvement work was put on hold due to COVID restrictions. The remaining $14.8 million tenant improvement allowance, approximately $91 PSF, was reserved at loan closing and work is expected to resume in 2021. If the tenant improvement allowance is not used by December 15, 2021, the remaining amount will be forfeited by Roku. |
| ● | Roku leases 194,549 SF in Building 2 under a lease expiring on September 30, 2020, with one, 7-year renewal option at 97.5% of fair market value and no termination options. The Building 2 lease has staggered lease commencement dates of January 23, 2019 for floors 1 and 2, April 23, 2019 for floor 3, and September 1, 2019 for floors 4-6, and includes 3% annual rent escalations. The Building 2 lease expires September 30, 2030. In addition to base rent for Building 2, Roku is responsible for a monthly payment in the estimated amount of $19,315 (the “Highline Extension Payment”), which represents the reimbursement of amortized capital expenditures for the construction of the connector between Building 2 and the amenities building. Roku fully moved into the space prior to the COVID outbreak and all free rent has burned off. |
Roku has provided a letter of credit for each lease (collectively, the “Roku LC”), which Roku LCs have been collaterally assigned to the lender. With respect to:
| ● | Building 1, Roku provided an $8.1 million letter of credit, which may be reduced by 50% on the later of (i) January 1, 2022 or (ii) the 37th full calendar month of the lease term, so long as Roku has a market capitalization on a public exchange of at least $2.4 billion and is not in default under the lease. The letter of credit can be further reduced by 25% of the original letter of credit amount on the later of (i) July 1, 2026 or (ii) the 91st full calendar month of the lease term, if Roku has a market capitalization of at least $3.6 billion and is not in default under its lease. |
| ● | Building 2, Roku provided a $6.3 million letter of credit, which may be reduced by 50% on the later of (i) July 23, 2026 or (ii) the 90th full calendar month of the lease term, if Roku is cash flow positive based on a trailing twelve month adjusted EBITDA (net income or loss excluding (i) other income, (ii) stock-based compensation expense, (iii) depreciation and amortization, and (iv) income tax expense) basis as of the most recently completed fiscal quarter. |
The Coleman Highline Borrower may draw on the Roku LC (i) to pay amounts due to the landlord under the terms of the lease, (ii) if the lease has terminated prior to expiration of the lease term, or as a result of Roku’s breach or default under the lease, (iii) Roku has filed a voluntary petition for bankruptcy, (iv) an involuntary petition has been filed against Roku under the bankruptcy code, and (v) if the letter of credit has not been renewed through the expiration date.
THE INFORMATION IN THIS STRUCTURAL AND COLLATERAL TERM SHEET IS NOT COMPLETE AND MAY BE AMENDED PRIOR TO THE TIME OF SALE. THIS TERM SHEET IS NOT AN OFFER TO SELL THESE SECURITIES AND IT IS NOT A SOLICITATION OF AN OFFER TO BUY THESE SECURITIES IN ANY JURISDICTION WHERE THE OFFER OR SALE IS NOT PERMITTED.
150
| Office – Suburban | Loan #12 | Cut-off Date Balance: | $22,000,000 | |
| 1143 & 1155 Coleman Avenue | Coleman Highline | Cut-off Date LTV: | 56.5% | |
| San Jose, CA 95110 | U/W NCF DSCR: | 3.18x | ||
| U/W NOI Debt Yield: | 9.2% |
If the Coleman Highline Borrower draws on a Roku LC, the proceeds are required to be placed in reserve with the lender, and are required to be disbursed by the lender upon the Coleman Highline Borrower’s request for the payment of:
| (i) | shortfalls in the payment of debt service; |
| (ii) | shortfalls in the required deposits into the reserve accounts; |
| (iii) | tenant improvement costs, tenant allowances, tenant relocations costs, tenant reimbursements, tenant inducement payments and leasing commission obligations under leases entered into, or existing as of the origination of the loan; or |
| (iv) | vacant space preparation costs and marketing costs with respect to potential leasing of the Coleman Highline Property. |
The following table presents certain information relating to the tenancy at the Coleman Highline Property:
Major Tenant
| Tenant Name | Credit Rating (Fitch/Moody’s/ S&P) | Tenant NRSF | % of NRSF | Annual U/W Base Rent PSF(1) | Annual U/W Base Rent(1) | % of Total Annual U/W Base Rent | Lease Expiration Date | Extension Options | Termination Option (Y/N) |
| Roku-Building 1(2) | NR/NR/NR | 162,557 | 45.5% | $45.83 | $7,450,130 | 44.9% | 12/31/2029 | 1, 5-year(4) | N |
| Roku-Building 2(3) | NR/NR/NR | 194,549 | 54.5% | $47.02 | $9,148,134 | 55.1% | 9/30/2030 | 1, 7-year(5) | N |
| Occupied Collateral Total | 357,106 | 100.0% | $46.48 | $16,598,264 | 100.0% | ||||
Vacant Space | 0 | 0.0% | |||||||
| Collateral Total | 357,106 | 100.0% | $46.48 | $16,598,264 | 100.0% | ||||
| (1) | The Annual U/W Base Rent and Annual U/W Base Rent PSF shown above include 3% annual contractual rent steps through November 1, 2021 totaling $259,700. |
| (2) | Roku has not yet moved in, and has not yet commenced paying rent on its Building 1 space. There is no free rent remaining and all outstanding tenant improvements were reserved at loan closing. Roku is required to begin paying rent January 1, 2021. 8x8, Inc. is required to pay rent until December 31, 2020. See “Major Tenant” for additional information. |
| (3) | Building 2 rent includes the Highline Extension Payment of $231,782 annually. |
| (4) | Roku has one, 5-year renewal option for Building 1 at fair market value and with 12-15 months’ prior notice. |
| (5) | Roku has one, 7-year renewal option for Building 2 at 97.5% of fair market value and with 15-18 months’ prior notice. |
The following table presents certain information relating to the lease rollover schedule at the Coleman Highline Property:
Lease Expiration Schedule(1)
| Year Ending December 31, | No. of Leases Expiring | Expiring NRSF | % of Total NRSF | Cumulative Expiring NRSF | Cumulative % of Total NRSF | Annual U/W Base Rent | % of Total Annual U/W Base Rent | Annual U/W Base Rent PSF |
| MTM | 0 | 0 | 0.0% | 0 | 0.0% | $0 | 0.0% | $0.00 |
| 2020 | 0 | 0 | 0.0% | 0 | 0.0% | $0 | 0.0% | $0.00 |
| 2021 | 0 | 0 | 0.0% | 0 | 0.0% | $0 | 0.0% | $0.00 |
| 2022 | 0 | 0 | 0.0% | 0 | 0.0% | $0 | 0.0% | $0.00 |
| 2023 | 0 | 0 | 0.0% | 0 | 0.0% | $0 | 0.0% | $0.00 |
| 2024 | 0 | 0 | 0.0% | 0 | 0.0% | $0 | 0.0% | $0.00 |
| 2025 | 0 | 0 | 0.0% | 0 | 0.0% | $0 | 0.0% | $0.00 |
| 2026 | 0 | 0 | 0.0% | 0 | 0.0% | $0 | 0.0% | $0.00 |
| 2027 | 0 | 0 | 0.0% | 0 | 0.0% | $0 | 0.0% | $0.00 |
| 2028 | 0 | 0 | 0.0% | 0 | 0.0% | $0 | 0.0% | $0.00 |
| 2029 | 1 | 162,557 | 45.5% | 162,557 | 45.5% | $7,450,130 | 44.9% | $45.83 |
| 2030 | 1 | 194,549 | 54.5% | 357,106 | 100.0% | $9,148,134 | 55.1% | $47.02 |
| Thereafter | 0 | 0 | 0.0% | 357,106 | 100.0% | $0 | 0.0% | $0.00 |
| Vacant | 0 | 0 | 0.0% | 357,106 | 100.0% | $0 | 0.0% | $0.00 |
| Total/Weighted Average | 2 | 357,106 | 100.0% | $16,598,264 | 100.0% | $46.48 |
| (1) | Information obtained from the underwritten rent roll. |
THE INFORMATION IN THIS STRUCTURAL AND COLLATERAL TERM SHEET IS NOT COMPLETE AND MAY BE AMENDED PRIOR TO THE TIME OF SALE. THIS TERM SHEET IS NOT AN OFFER TO SELL THESE SECURITIES AND IT IS NOT A SOLICITATION OF AN OFFER TO BUY THESE SECURITIES IN ANY JURISDICTION WHERE THE OFFER OR SALE IS NOT PERMITTED.
151
| Office – Suburban | Loan #12 | Cut-off Date Balance: | $22,000,000 | |
| 1143 & 1155 Coleman Avenue | Coleman Highline | Cut-off Date LTV: | 56.5% | |
| San Jose, CA 95110 | U/W NCF DSCR: | 3.18x | ||
| U/W NOI Debt Yield: | 9.2% |
The following table presents historical occupancy percentages at the Coleman Highline Property:
Historical Occupancy(1)
12/31/2016 | 12/31/2017 | 12/31/2018 | 12/31/2019 | 2/1/2021(2) |
| NAV | NAV | NAV | NAV | 100.0% |
| (1) | No historical occupancy information is available as the Coleman Highline Property was completed in 2017 and was acquired in connection with the origination of the Coleman Highline Whole Loan. |
| (2) | Information obtained from the underwritten rent roll. |
COVID-19 Update. Building 2 is open and operating, while Building 1 is still in shell condition. As of January 11, 2021, the Coleman Highline Mortgage Loan is current and is not subject to any forbearance, modification or debt service relief request. The majority of Roku employees are working remotely; however, Roku is current on rent payments as of January 11, 2021 and has not requested any relief. As of January 11, 2021, 100% of rent by square feet and by underwritten base rent was paid for December 2020 and January 2021.
Market Overview and Competition. The Coleman Highline Property is part of the larger Coleman Highline mixed-use development in San Jose, California, adjacent to the Norman Y. Mineta San Jose International Airport. The Coleman Highline Property is located in an area with a high concentration of technology companies, including Google, Facebook, Amazon and Intel. The Coleman Highline Property is located approximately 0.6 miles from the Santa Clara Caltrain station and is connected to that station via a pedestrian footbridge. In addition, VTS operates buses and light rail with stops along Coleman Avenue, and a BART stop is planned adjacent to the Santa Clara Caltrain station. The Coleman Highline Property is 0.7 miles from Interstate 880 and 2.5 miles from U.S. Highway 101.
In addition to the amenities in the larger Coleman Highline project, the Coleman Highline Property is within walking distance to a retail center that includes multiple dining options and a gym. It is also located adjacent to the 175-room Element Hotel and the proposed Gateway Crossing project which is planned to include 1,565 residential units, 157 affordable housing units, as well as 45,000 SF of retail space and a hotel. In addition, the Coleman Highline property is approximately 0.5 miles from the San Jose Earthquakes stadium, home to Major League Soccer’s San Jose Earthquakes, as well as 0.8 miles from Santa Clara University, a private Jesuit university with approximately 5,400 undergraduate students.
According to a third party market research provider, the estimated 2020 population within a one-, three- and five-mile radius of the Coleman Highline Property was approximately 10,205, 176,399 and 642,978, respectively; and the estimated 2020 average household income within the same radii was approximately $130,114, $135,262 and $140,271, respectively.
According to the appraisal, the subject is located in the San Jose Airport office submarket. As of the second quarter of 2020, the submarket contained approximately 5.5 million SF of office space, with an overall vacancy rate of 8.3% and average asking rent of $44.76 PSF. The appraiser concluded to market rent for the office space at the Coleman Highline Property of $46.20 PSF (see table below).
The following table presents certain information relating to the appraisal’s market rent conclusion for the Coleman Highline Property:
Market Rent Summary(1)
| Office | |
| Market Rent (PSF) | $46.20 |
| Lease Term (Years) | 10.5 |
| Lease Type (Reimbursements) | NNN |
| Rent Increase Projection | 3.0% per annum |
| Concessions | 6 months |
| Tenant Improvements (New Tenants) (PSF) | $40 |
| Tenant Improvements (Renewals) (PSF) | $22.50 |
| (1) | Information obtained from the appraisal. |
THE INFORMATION IN THIS STRUCTURAL AND COLLATERAL TERM SHEET IS NOT COMPLETE AND MAY BE AMENDED PRIOR TO THE TIME OF SALE. THIS TERM SHEET IS NOT AN OFFER TO SELL THESE SECURITIES AND IT IS NOT A SOLICITATION OF AN OFFER TO BUY THESE SECURITIES IN ANY JURISDICTION WHERE THE OFFER OR SALE IS NOT PERMITTED.
152
| Office – Suburban | Loan #12 | Cut-off Date Balance: | $22,000,000 | |
| 1143 & 1155 Coleman Avenue | Coleman Highline | Cut-off Date LTV: | 56.5% | |
| San Jose, CA 95110 | U/W NCF DSCR: | 3.18x | ||
| U/W NOI Debt Yield: | 9.2% |
The table below presents certain information relating to comparable sales pertaining to the Coleman Highline Property identified by the appraiser:
Comparable Sales(1)
| Property Name | Location | Year Built/Renovated | Occupancy | Rentable Area (SF) | Sale Date | Sale Price | Sale Price (PSF) |
| 675 Creekside Way | Campbell, CA | 2018/NAP | 100% | 177,815 | Mar-20 | $139,000,000 | $782 |
| 2215-2225 Lawson Lane | Santa Clara, CA | 2014/NAP | 100% | 328,867 | Feb-20 | $276,300,000 | $840 |
| 20300 Stevens Creek Boulevard | Cupertino, CA | 1985/2009 | 100% | 300,041 | Aug-19 | $290,000,000 | $967 |
| 110, 120&130 Holger Way & 95 Headquarter | San Jose, CA | 2010/NAP | 100% | 603,999 | Mar-19 | $429,000,000 | $710 |
| 131 Albright Way | Los Gatos, CA | 2015/NAP | 100% | 113,500 | Jan-19 | $85,000,000 | $749 |
| (1) | Information obtained from the appraisal. |
The following table presents certain information relating to comparable office leases related to Coleman Highline Property:
Comparable Office Leases(1)
| Property Name/Location | Year Built/ Renovated | Total GLA (SF) | Distance from Subject | Occupancy | Tenant | Tenant Size (SF) | Lease Start Date | Lease Term | Annual Base Rent PSF | Lease Type |
Coleman Highline Building 1 (Subject) 1143 & 1155 Coleman Avenue San Jose, CA | 2017/NAP(2) | 162,557(2) | - | 100.0%(2) | Roku(2) | 162,557(2) | Jan. 2021(2) | 9.0 Yrs. (2) | $45.83(2) | NNN |
Coleman Highline Building 2 (Subject) 1143 & 1155 Coleman Avenue San Jose, CA | 2017/NAP(2) | 194,549(2) | - | 100.0%(2) | Roku(2) | 194,549(2) | Sep. 2019(2)(3) | 11.1 Yrs. (2)(3) | $47.02(2)(3) | NNN |
2390 Mission College Blvd Santa Clara, CA | 2018/NAP | 42,188 | 4.2 miles | 100.0% | InfoBlox, Inc. | 42,188 | May-20 | 10.5 Yrs | $42.00 | NNN
|
4301-4401 Great Santa Clara, CA | 1984/NAP | 301,163 | 4.8 miles | 100.0% | Airbnb
| 301,163 | Dec-19 | 11.0 Yrs | $45.00 | NNN |
6220 America Ctr Drive San Jose, CA | 2017/NAP | 232,253 | 6.1 miles | 97.5%(4) | Bill.com | 137,613 | Dec-19 | 10.0 Yrs | $45.00 | NNN |
Coleman Highline Ph 4 San Jose, CA | 2021/NAP | 643,990 | 0.0 miles | 100.0% | Verizon | 643,990 | Jul-19
| 15.0 Yrs
| $49.20 | NNN |
675 Creekside Way Campbell, CA | 2017/NAP | 177,815 | 5.7 miles | 100.0% | 8x8, Inc. | 177,815 | Jul-19 | 11.0 Yrs | $44.40 | NNN |
3315 Scott Blvd Santa Clara, CA | 2013/NAP | 157,205 | 4.4 miles | 100.0%(4) | Edelman Financial
| 41,252 | Jul-19
| 6.1 Yrs
| $46.20
| NNN |
| (1) | Information obtained from the appraisal. |
| (2) | Information obtained from the underwritten rent roll. |
| (3) | Building 2 has staggered lease start dates of January 23, 2019 for floors 1 and 2, April 23, 2019 for floor 3, and September 1, 2019 for floors 4-6. The Annual Base Rent PSF includes the annual Highline Extension Payment of $231,782. |
| (4) | Information obtained from a third party market research provider |
THE INFORMATION IN THIS STRUCTURAL AND COLLATERAL TERM SHEET IS NOT COMPLETE AND MAY BE AMENDED PRIOR TO THE TIME OF SALE. THIS TERM SHEET IS NOT AN OFFER TO SELL THESE SECURITIES AND IT IS NOT A SOLICITATION OF AN OFFER TO BUY THESE SECURITIES IN ANY JURISDICTION WHERE THE OFFER OR SALE IS NOT PERMITTED.
153
| Office – Suburban | Loan #12 | Cut-off Date Balance: | $22,000,000 | |
| 1143 & 1155 Coleman Avenue | Coleman Highline | Cut-off Date LTV: | 56.5% | |
| San Jose, CA 95110 | U/W NCF DSCR: | 3.18x | ||
| U/W NOI Debt Yield: | 9.2% |
Operating History and Underwritten Net Cash Flow. The following table presents certain information relating to the historical operating performance and underwritten net cash flow at the Coleman Highline Property:
Cash Flow Analysis(1)
| U/W | %(2) | U/W $ per SF | |||||
| Base Rent | $16,598,264(3) | 73.5% | $46.48 | ||||
| Rent Averaging Credit | 0 | 0.0 | 0.00 | ||||
| Grossed Up Vacant Space | 0 | 0.0 | 0.00 | ||||
| Gross Potential Rent | $16,598,264 | 73.5% | $46.48 | ||||
| Total Recoveries | 5,974,389(4) | 26.5 | 16.73 | ||||
| Net Rental Income | $22,572,653 | 100.0% | $63.21 | ||||
| (Vacancy & Credit Loss) | (829,913)(5) | 5.0 | (2.32) | ||||
| Effective Gross Income | $21,742,740 | 96.3% | $60.89 | ||||
| Real Estate Taxes | 3,257,146 | 15.0 | $9.12 | ||||
| Insurance | 468,892 | 2.2 | 1.31 | ||||
| Management Fee | 309,585 | 1.4 | 0.87 | ||||
| Other Operating Expenses | 2,199,223 | 10.1 | 6.16 | ||||
| Total Operating Expenses | $6,234,846 | 28.7% | $17.46 | ||||
| Net Operating Income | $15,507,894 | 71.3% | $43.43 | ||||
| Replacement Reserves | 0 | 0.0 | 0.00 | ||||
| TI/LC | 0 | 0.0 | 0.00 | ||||
| Net Cash Flow | $15,507,894 | 71.3% | $43.43 | ||||
| NOI DSCR(6) | 3.18x | ||||||
| NCF DSCR(6) | 3.18x | ||||||
| NOI Debt Yield(6) | 9.2% | ||||||
| NCF Debt Yield(6) | 9.2% |
| (1) | No historical operating or occupancy statements are available because the Coleman Highline Property was completed in 2017 and was acquired in connection with the origination of the Coleman Highline Whole Loan. For avoidance of doubt, no COVID-19 specific adjustments have been incorporated in the lender underwriting. |
| (2) | Represents (i) percent of Net Rental Income for all revenue fields, (ii) percent of Base Rent for Vacancy & Credit Loss and (iii) percent of Effective Gross Income for all other fields. |
| (3) | Gross Potential Base Rent is based on leases in-place with 3% annual rent escalations through November 1, 2021. It also includes the annual Highline Extension Payment of $231,782. |
| (4) | Total Recoveries are based on underwritten expenses net of vacancy. |
| (5) | The underwritten economic vacancy is 5.0%. The Coleman Highline Property was 100.0% leased as February 1, 2021. |
| (6) | The debt service coverage ratios and debt yields are based on the Coleman Highline Whole Loan. |
THE INFORMATION IN THIS STRUCTURAL AND COLLATERAL TERM SHEET IS NOT COMPLETE AND MAY BE AMENDED PRIOR TO THE TIME OF SALE. THIS TERM SHEET IS NOT AN OFFER TO SELL THESE SECURITIES AND IT IS NOT A SOLICITATION OF AN OFFER TO BUY THESE SECURITIES IN ANY JURISDICTION WHERE THE OFFER OR SALE IS NOT PERMITTED.
154
(THIS PAGE INTENTIONALLY LEFT BLANK)
THE INFORMATION IN THIS STRUCTURAL AND COLLATERAL TERM SHEET IS NOT COMPLETE AND MAY BE AMENDED PRIOR TO THE TIME OF SALE. THIS TERM SHEET IS NOT AN OFFER TO SELL THESE SECURITIES AND IT IS NOT A SOLICITATION OF AN OFFER TO BUY THESE SECURITIES IN ANY JURISDICTION WHERE THE OFFER OR SALE IS NOT PERMITTED.
155
| No. 13 – Fresh Pond Cambridge | |||||||
| Mortgage Loan Information | Mortgaged Property Information(2) | ||||||
| Mortgage Loan Seller: | Morgan Stanley Mortgage Capital Holdings LLC | Single Asset/Portfolio: | Single Asset | ||||
| Credit Assessment (S&P/Fitch/KBRA): | NR/NR/NR | Property Type – Subtype: | Retail – Anchored | ||||
| Original Principal Balance(1): | $20,000,000 | Location: | Cambridge, MA | ||||
| Cut-off Date Balance(1): | $20,000,000 | Size: | 226,730 SF | ||||
| % of Initial Pool Balance: | 2.2% | Cut-off Date Balance Per SF(1): | $220.53 | ||||
| Loan Purpose: | Refinance | Maturity Date Balance Per SF(1): | $220.53 | ||||
| Borrower Sponsors: | Nishan Atinizian; Kevork D. Atinizian | Year Built/Renovated: | 1950-1978/NAP | ||||
| Guarantors: | Nishan Atinizian; Kevork D. Atinizian | Title Vesting: | Fee | ||||
| Mortgage Rate: | 3.1500% | Property Manager: | Self-managed | ||||
| Note Date: | October 27, 2020 | Current Occupancy (As of): | 82.8% (8/28/2020) | ||||
| Seasoning: | 3 months | YE 2019 Occupancy: | 96.6% | ||||
| Maturity Date: | November 1, 2030 | YE 2018 Occupancy: | 100.0% | ||||
| IO Period: | 120 months | YE 2017 Occupancy: | 100.0% | ||||
| Loan Term (Original): | 120 months | YE 2016 Occupancy: | 100.0% | ||||
| Amortization Term (Original): | NAP | Appraised Value: | $113,000,000 | ||||
| Loan Amortization Type: | Interest-only, Balloon | Appraised Value Per SF: | $498.39 | ||||
| Call Protection: | L(27),D(86),O(7) | Appraisal Valuation Date: | August 20, 2020 | ||||
| Lockbox Type: | Hard/Springing Cash Management | Underwriting and Financial Information(2) | |||||
| Additional Debt(1): | Yes | TTM NOI (7/31/2020): | $5,830,516 | ||||
| Additional Debt Type (Balance)(1): | Pari Passu ($30,000,000) | YE 2019 NOI: | $5,956,917 | ||||
| YE 2018 NOI: | $6,021,017 | ||||||
| YE 2017 NOI: | $5,640,435 | ||||||
| U/W Revenues: | $7,749,504 | ||||||
| Escrows and Reserves | U/W Expenses: | $2,040,040 | |||||
| Initial | Monthly | Cap | U/W NOI: | $5,709,464 | |||
| Taxes | $93,522 | $93,522 | NAP | U/W NCF: | $5,330,825 | ||
| Insurance | $0 | Springing | NAP | U/W DSCR based on NOI/NCF(1): | 3.58x / 3.34x | ||
| Replacement Reserve | $0 | $2,834 | NAP | U/W Debt Yield based on NOI/NCF(1): | 11.4% / 10.7% | ||
| Deferred Maintenance | $79,376 | $0 | NAP | U/W Debt Yield at Maturity based on NOI/NCF(1): | 11.4% / 10.7% | ||
| TI/LC Reserve | $0 | $28,341 | $680,190 | Cut-off Date LTV Ratio(1): | 44.2% | ||
| Whole Foods Reserve | $339,891 | $0 | NAP | LTV Ratio at Maturity(1): | 44.2% | ||
| Sources and Uses | ||||||||
| Sources | Uses | |||||||
| Whole Loan Amount(1) | $50,000,000 | 100.0% | Loan Payoff | $29,483,222 | 59.0% | |||
| Return of Equity | 18,339,687 | 36.7 | ||||||
| Closing Costs | 1,664,302 | 3.3 | ||||||
| Reserves | 512,789 | 1.0 | ||||||
| Total Sources | $50,000,000 | 100.0% | Total Uses | $50,000,000 | 100.0% | |||
| (1) | The Fresh Pond Cambridge Mortgage Loan (as defined below) is a part of the Fresh Pond Cambridge Whole Loan (as defined below) with an original aggregate principal balance of $50,000,000. The Cut-off Date Balance PSF, Maturity Date Balance PSF, UW NOI Debt Yield, UW NOI Debt Yield at Maturity, UW NCF DSCR, Cut-off Date LTV Ratio and Maturity Date LTV Ratio numbers presented above are based on the aggregate principal balance of the promissory notes comprising the Fresh Pond Cambridge Whole Loan. |
| (2) | The novel coronavirus pandemic is an evolving situation and could impact the Fresh Pond Cambridge Whole Loan more severely than assumed in the underwriting of the Fresh Pond Cambridge Whole Loan and could adversely affect the NOI, NCF and occupancy information, as well as the appraised value and the DSCR, LTV and Debt Yield metrics presented above and herein. See “Risk Factors—Risks Related to Market Conditions and Other External Factors—The Coronavirus Pandemic Has Adversely Affected the Global Economy and Will Likely Adversely Affect the Performance of the Mortgage Loans” in the Preliminary Prospectus. |
The Mortgage Loan. The mortgage loan (the “Fresh Pond Cambridge Mortgage Loan”) is part of a whole loan (the “Fresh Pond Cambridge Whole Loan”) evidenced by two pari passu promissory notes in the aggregate original principal amount of $50,000,000 and secured by a first priority fee mortgage encumbering a retail property located in Cambridge, Massachusetts (the “Fresh Pond Cambridge Property”). The non-controlling Note A-2, in the original principal amount of $20,000,000, represents the Fresh Pond Cambridge Mortgage Loan and will be included in the BANK 2021-BNK31 securitization trust. The controlling Note A-1, in the original principal amount of $30,000,000, was contributed to the BANK 2020-BNK30 securitization. The Fresh Pond Cambridge Whole Loan will be serviced pursuant to the pooling and servicing agreement for the BANK 2020-BNK30 securitization trust. See “Description of the Mortgage Pool—The Whole Loans—The Non-Serviced Pari Passu Whole Loans” and “Pooling and Servicing Agreement—Servicing of the Non-Serviced Mortgage Loans” in the Preliminary Prospectus.
THE INFORMATION IN THIS STRUCTURAL AND COLLATERAL TERM SHEET IS NOT COMPLETE AND MAY BE AMENDED PRIOR TO THE TIME OF SALE. THIS TERM SHEET IS NOT AN OFFER TO SELL THESE SECURITIES AND IT IS NOT A SOLICITATION OF AN OFFER TO BUY THESE SECURITIES IN ANY JURISDICTION WHERE THE OFFER OR SALE IS NOT PERMITTED.
156
| Retail - Anchored | Loan # 13 | Cut-off Date Balance: | $20,000,000 | |
| 168-210 Alewife Brook Parkway | Fresh Pond Cambridge | Cut-off Date LTV: | 44.2% | |
| Cambridge, MA 02138 | UW NCF DSCR: | 3.34x | ||
| UW NOI Debt Yield: | 11.4% |
Note Summary
| Notes | Original Principal Balance | Cut-off Date Balance | Note Holder | Controlling Interest |
| A-1 | $30,000,000 | $30,000,000 | BANK 2020-BNK30 | Yes |
| A-2 | $20,000,000 | $20,000,000 | BANK 2021-BNK31 | No |
| Total | $50,000,000 | $50,000,000 |
The Property. The Fresh Pond Cambridge Property is a 226,730 square foot shopping center in Cambridge, Massachusetts, with 188,643 square feet of retail space (83.2% of net rentable area) and 38,087 square feet of office space (16.8% of net rentable area). The Fresh Pond Cambridge Property was built between 1950 and 1978. The borrower invested approximately $4.1 million into the Fresh Pond Cambridge Property between 2014 and 2019. The capital expenditures included a large upgrade to the façade of the building, an upgrade to the roof, new signage and exterior lighting.
The Fresh Pond Cambridge Property is anchored by Whole Foods Market and TJ Maxx/HomeGoods (“TJX”). The junior anchors are Staples and PetSmart. As of August 28, 2020, the Fresh Pond Cambridge Property was 82.8% leased to 10 retail tenants and seven office tenants. National tenants include Whole Foods Market, TJX, Staples and PetSmart, which collectively represent 55.7% of net rentable area and 62.6% of the underwritten rent. The Fresh Pond Cambridge Property contains an office component that comprises 16.8% of the total net rentable area and accounts for approximately 18.1% of underwritten rent. None of the office tenants represent more than 4.7% of net rentable area or contribute more than 5.0% of the underwritten rent. The largest office tenant is Action for Boston Community Development (“ABCD”), leasing 4.7% of the square feet and contributing 5.0% of the underwritten rent. The Fresh Pond Cambridge Property benefits from long term tenancy, with six tenants (57.2% of the net rentable area and 64.8% of underwritten rent) having been in occupancy for over 20 years and nine tenants (65.4% of the net rentable area and 77.1% of underwritten rent) having been in occupancy for over ten years.
The Fresh Pond Cambridge Property had originally been anchored by a 47,744 square foot Toys R Us pursuant to a 25-year lease (the “Master Lease”) with an original expiration in October 2017. In 2006, the Master Lease space was subleased to PetSmart and Modell’s, both of which had terms expiring in 2018. The Master Lease was assigned to an affiliate of Urban Edge, which extended the Master Lease until January 2023. PetSmart extended its sublease until January 2023 and Modell’s vacated. The former Modell’s space was immediately subleased to A.C. Moore; however, A.C Moore vacated the Fresh Pond Cambridge Property and terminated its sublease in February 2020 when the chain filed for bankruptcy. Rent from this vacated space is not underwritten and the space is not included in underwritten occupancy.
The Fresh Pond Cambridge Property also includes a 4.3-acre outparcel improved with a free standing movie theater leased to Apple Cinema, a 4,889 square foot auto repair garage rented to Aladdin Auto on a tenant-at-will basis, and a yard/storage area rented to Bostonian Towing (the “Release Parcel”). The Release Parcel is expected to be released without payment of any release price once it has been legally subdivided. See “Release of Property” below. The Release Parcel is not included in the underwriting, the appraised value or in any of the loan credit metrics.
Major Tenants.
Whole Foods Market (45,150 square feet, 19.9% of net rentable area, 24.5% of underwritten rent). Whole Foods Market, a subsidiary of Amazon, is a multinational supermarket chain headquartered in Austin, Texas. A USDA Certified Organic grocer in the United States, the chain is popularly known for its organic selections. Currently, Whole Foods Market has over 500 stores in North America and the United Kingdom. Whole Foods Market has been an anchor at the Fresh Pond Cambridge Property since 1993 and has expanded and extended its lease since then. Whole Foods Market has a lease expiration of January 31, 2028 and has four, five-year renewal options remaining.
TJX (35,432 square feet, 15.6% of net rentable area, 21.6% of underwritten rent). TJX is an off-price retailer of apparel and home fashions in the United States and worldwide. As of August 1, 2020, TJX operated a total of 4,557 stores in nine countries, the United States, Canada, the United Kingdom, Ireland, Germany, Poland, Austria, the Netherlands, and Australia, and four e-commerce sites. TJX has been a tenant at the Fresh Pond Cambridge Property since 1980 and has expanded since then. TJX has exercised three of its five 5-year extension options, most recently in January 2020 when it elected to extend its term for an additional 10 years. TJX has a lease expiration of January 31, 2031 and has two, five-year renewal options remaining.
PetSmart (27,731 square feet, 12.2% of net rentable area, 6.3% of underwritten rent). PetSmart is a large pet specialty retailer providing products and services including grooming, dog training, PetsHotel and Everyday Adoption Centers. As of February 2020, PetSmart operates a total of 1,660 stores throughout North America. PetSmart is occupying its space pursuant to a sublease of the Master Lease. There are two, five-year renewal options remaining under the Master Lease. PetSmart has been a subtenant at the Fresh Pond Cambridge Property since 2006. The rent paid by PetSmart is in excess of the contractual rent paid by Urban Edge to the borrower, and there is a profit sharing agreement in place whereby Urban Edge is required to pay the borrower an amount equal to 30% of the monthly minimum rent paid by any sublease tenant that is in excess of the rent due under the Master Lease (less 30% of attorneys’ fees and brokerage fees related to the sublease). The Fresh Pond Cambridge Whole Loan was underwritten based on the prime lease rent on the PetSmart space and the income from the profit-sharing arrangement with Urban Edge.
Staples (18,000 square feet, 7.9% of net rentable area, 10.1% of underwritten rent). Staples is an office supply retailer based in the United States providing office and school supplies, office furnishings, electronics and software, as well as offering printing and
THE INFORMATION IN THIS STRUCTURAL AND COLLATERAL TERM SHEET IS NOT COMPLETE AND MAY BE AMENDED PRIOR TO THE TIME OF SALE. THIS TERM SHEET IS NOT AN OFFER TO SELL THESE SECURITIES AND IT IS NOT A SOLICITATION OF AN OFFER TO BUY THESE SECURITIES IN ANY JURISDICTION WHERE THE OFFER OR SALE IS NOT PERMITTED.
157
| Retail - Anchored | Loan # 13 | Cut-off Date Balance: | $20,000,000 | |
| 168-210 Alewife Brook Parkway | Fresh Pond Cambridge | Cut-off Date LTV: | 44.2% | |
| Cambridge, MA 02138 | UW NCF DSCR: | 3.34x | ||
| UW NOI Debt Yield: | 11.4% |
technological services. Staples opened its first store in 1985 and has since expanded throughout North America and overseas. Staples operates over 2,000 retail stores worldwide. Staples has been a tenant at the Fresh Pond Cambridge Property since 1992 and has extended its lease multiple times, most recently in 2019. Staples has a lease expiration of September 30, 2027 and has two, five-year renewal options remaining.
The below table presents certain information relating to the major tenants at the Fresh Pond Cambridge Property:
Major Tenants(1)
| Tenant Name | Credit Rating (Fitch/Moody’s/S&P)(2) | Tenant NRSF | % of NRSF | Annual U/W Base Rent PSF(3) | Annual U/W Base Rent | % of Total Annual U/W Base Rent | Most Recent Sales | PSF | Occ. % | Lease Expiration | Renewal Options | Term. Option (Y/N) |
| Whole Foods Market | A+/A2/AA- | 45,150 | 19.9% | $34.74 | $1,568,628 | 24.5% | $66,395,502 | $1,471 | 2.4% | 1/31/2028 | 4 x 5 year | N |
| TJX | NR/A2/A | 35,432 | 15.6% | $39.07 | $1,384,231 | 21.6% | $18,050,495 | $509 | 7.7% | 1/31/2031 | 2 x 5 year | N |
| PetSmart(4) | NR/Caa2/B- | 27,731 | 12.2% | $14.62 | $405,428 | 6.3% | NAV | NAV | NAV | 1/1/2023 | 2 x 5 year | N |
| Staples | NR/B3/B | 18,000 | 7.9% | $36.00 | $648,000 | 10.1% | $5,715,031 | $318 | 11.3% | 9/30/2027 | 2 x 5 year | N |
| ABCD | NR/NR/NR | 10,700 | 4.7% | $30.00 | $321,000 | 5.0% | NAV | NAV | NAV | 6/30/2025 | 1 x 5 year | N |
| Subtotal/Wtd. Avg. | 137,013 | 60.4% | $31.58 | $4,327,287 | 67.6% | |||||||
| Non-Major Tenants | 50,773 | 22.4% | $40.82 | $2,072,420 | 32.4% | |||||||
| Occupied Collateral Total | 187,786 | 82.8% | $34.08 | $6,399,707 | 100.0% | |||||||
| Vacant Space | 38,944 | 17.2% | ||||||||||
| Collateral Total | 226,730 | 100.0% | ||||||||||
| (1) | Information is based on the underwritten rent roll as of August 28, 2020. |
| (2) | Certain ratings are those of the parent company whether or not the parent company guarantees the lease. |
| (3) | Total/Wtd. Avg. Annual UW Rent PSF excludes vacant space. |
| (4) | PetSmart is occupying its space pursuant to a sublease of the Master Lease. The Fresh Pond Cambridge Whole Loan was underwritten based on the prime lease rent on the PetSmart space and the income from the profit-sharing arrangement with Urban Edge (as described above under “Major Tenants—PetSmart”). |
The following table presents certain information relating to the lease rollover schedule at the Fresh Pond Cambridge Property:
Lease Expiration Schedule(1)(2)
| Year Ending December 31, | No. of Leases Expiring | Expiring NRSF | % of Total NRSF | Cumulative Expiring NRSF | Cumulative % of Total NRSF | Annual U/W Base Rent | % of Total Annual U/W Base Rent | Annual U/W Base Rent PSF |
| 2021 | 2 | 4,600 | 2.0% | 4,600 | 2.0% | $155,800 | 2.4% | $33.87 |
| 2022 | 3 | 11,287 | 5.0% | 15,887 | 7.0% | $346,840 | 5.4% | $30.73 |
| 2023 | 4 | 45,619 | 20.1% | 61,506 | 27.1% | $1,208,297 | 18.9% | $26.49 |
| 2024 | 1 | 2,538 | 1.1% | 64,044 | 28.2% | $111,024 | 1.7% | $43.74 |
| 2025 | 3 | 20,640 | 9.1% | 84,684 | 37.4% | $782,523 | 12.2% | $37.91 |
| 2026 | 1 | 4,520 | 2.0% | 89,204 | 39.3% | $194,364 | 3.0% | $43.00 |
| 2027 | 1 | 18,000 | 7.9% | 107,204 | 47.3% | $648,000 | 10.1% | $36.00 |
| 2028 | 1 | 45,150 | 19.9% | 152,354 | 67.2% | $1,568,628 | 24.5% | $34.74 |
| 2029 | 0 | 0 | 0.0% | 152,354 | 67.2% | $0 | 0.0% | $0.00 |
| 2030 | 0 | 0 | 0.0% | 152,354 | 67.2% | $0 | 0.0% | $0.00 |
| 2031 | 1 | 35,432 | 15.6% | 187,786 | 82.8% | $1,384,231 | 21.6% | $39.07 |
| Thereafter | 0 | 0 | 0.0% | 187,786 | 82.8% | $0 | 0.0% | $0.00 |
| Vacant | 0 | 38,944 | 17.2% | 226,730 | 100.0% | $0 | 0.0% | $0.00 |
| Total(3) | 17 | 226,730 | 100.0% | $6,399,707 | 100.0% | $34.08 |
| (1) | Information is based on the underwritten rent roll as of August 28, 2020. |
| (2) | Certain tenants may have lease termination options that are exercisable prior to the stated expiration date of the subject lease or leases that are not considered in the lease rollover schedule. |
| (3) | Total Annual U/W Base Rent PSF excludes vacant space. |
THE INFORMATION IN THIS STRUCTURAL AND COLLATERAL TERM SHEET IS NOT COMPLETE AND MAY BE AMENDED PRIOR TO THE TIME OF SALE. THIS TERM SHEET IS NOT AN OFFER TO SELL THESE SECURITIES AND IT IS NOT A SOLICITATION OF AN OFFER TO BUY THESE SECURITIES IN ANY JURISDICTION WHERE THE OFFER OR SALE IS NOT PERMITTED.
158
| Retail - Anchored | Loan # 13 | Cut-off Date Balance: | $20,000,000 | |
| 168-210 Alewife Brook Parkway | Fresh Pond Cambridge | Cut-off Date LTV: | 44.2% | |
| Cambridge, MA 02138 | UW NCF DSCR: | 3.34x | ||
| UW NOI Debt Yield: | 11.4% |
The following table presents historical occupancy percentages at the Fresh Pond Cambridge Property:
Historical Occupancy
2016(1) | 2017(1) | 2018(1) | 2019(1) | 8/28/2020(2) |
| 100.0% | 100.0% | 100.0% | 96.6% | 82.8% |
| (1) | Information obtained from the borrower sponsor. |
| (2) | Information based on the underwritten rent roll. |
Operating History and Underwritten Net Cash Flow. The following table presents certain information relating to the historical operating performance and underwritten net cash flow at the Fresh Pond Cambridge Property:
Cash Flow Analysis(1)
| 2017 | 2018 | 2019 | TTM 7/31/2020 | U/W(2) | %(3) | U/W $ per SF | |
| Base Rent | $6,452,733 | $6,751,799 | $6,899,426 | $7,050,584 | $7,035,628 | 79.2% | $31.03 |
| Rent Steps | 0 | 0 | 0 | 0 | 70,589 | 0.8 | 0.31 |
| SL Rent(4) | 0 | 0 | 0 | 0 | 225,955 | 2.5 | 1.00 |
| Gross Potential Rent | $6,452,733 | $6,751,799 | $6,899,426 | $7,050,584 | $7,332,172 | 82.6% | $32.34 |
| Recoveries | 1,417,552 | 1,594,480 | 1,593,511 | 1,475,941 | 1,475,941 | 16.6 | 6.51 |
| Other Income(5) | 172,645 | 111,065 | 160,024 | 135,017 | 72,347 | 0.8 | 0.32 |
| Net Rental Income | $8,042,929 | $8,457,344 | $8,652,960 | $8,661,542 | $8,880,460 | 100.0% | $39.17 |
| Discounts & Concession | 0 | 3,375 | 30,774 | 0 | 0 | 0.0 | 0.00 |
| Vacancy | 0 | 50,400 | 192,361 | 495,516 | 1,130,956 | 15.4 | 4.99 |
| Effective Gross Income | $8,042,929 | $8,403,569 | $8,429,826 | $8,166,026 | $7,749,504 | 87.3% | $34.18 |
| Real Estate Taxes | 954,420 | 978,801 | 982,142 | 992,625 | 1,089,802 | 14.1 | 4.81 |
| Insurance | 133,942 | 84,707 | 99,012 | 92,455 | 98,806 | 1.3 | 0.44 |
| Management Fee | 623,796 | 629,796 | 629,796 | 629,796 | 230,799 | 3.0 | 1.02 |
| Other Operating Expenses | 690,336 | 689,248 | 761,958 | 620,634 | 620,634 | 8.0 | 2.74 |
| Total Operating Expenses | $2,402,494 | $2,382,552 | $2,472,908 | $2,335,510 | $2,040,040 | 26.3% | $9.00 |
| Net Operating Income | $5,640,435 | $6,021,017 | $5,956,917 | $5,830,516 | $5,709,464 | 73.7% | $25.18 |
| Replacement Reserves | 0 | 0 | 0 | 0 | 34,010 | 0.4 | 0.15 |
| TI/LC | 0 | 0 | 0 | 0 | 344,630 | 4.4 | 1.52 |
| Net Cash Flow | $5,640,435 | $6,021,017 | $5,956,917 | $5,830,516 | $5,330,825 | 68.8% | $23.51 |
| NOI DSCR(6) | 3.53x | 3.77x | 3.73x | 3.65x | 3.58x | ||
| NCF DSCR(6) | 3.53x | 3.77x | 3.73x | 3.65x | 3.34x | ||
| NOI Debt Yield(6) | 11.3% | 12.0% | 11.9% | 11.7% | 11.4% | ||
| NCF Debt Yield(6) | 11.3% | 12.0% | 11.9% | 11.7% | 10.7% |
| (1) | For the avoidance of doubt, no COVID specific adjustments have been made to the lender underwriting. |
| (2) | U/W Gross Potential Rent is based on the rent roll as of August 28, 2020. |
| (3) | Represents (i) percent of Net Rental Income for all revenue fields, (ii) percent of Gross Potential Rent for Vacancy and Concessions & Credit Loss and (iii) percent of Effective Gross Income for all other fields. |
| (4) | U/W SL Rent is attributed to TJ Maxx. |
| (5) | Other Income includes billboard income ($14,688), signage income ($5,623) and profit sharing income from the Master Lease ($52,036). |
| (6) | Debt service coverage ratios and debt yields are based on the Fresh Pond Cambridge Whole Loan. |
COVID-19 Update. As of January 4, 2021, the Fresh Pond Cambridge Whole Loan is current as of the January debt service payment and is not subject to any forbearance, modification or debt service relief request. As of January 14, 2021, the borrower has reported that the Fresh Pond Cambridge Property is open and operating with 97.2% of tenants by occupied net rentable area and 97.4% of tenants by underwritten base rent having paid their full January 2021 rent payments. As of January 14, 2021, the borrower has reported that three tenants were granted some form of rent relief. TJX (15.6% of net rentable area and 21.6% of underwritten rent) was granted deferred rent from June to August 2020 with repayment expected in six equal installments starting in January 2021. The tenant made its first repayment of deferred rent as agreed. Mattress Firm (2.0% of net rentable area and 3.0% of underwritten rent) was granted deferred rent from March to May 2020, of which 50% was forgiven and the remaining deferred amount is required to be repaid across six equal installments starting in January 2021. The tenant made its first repayment of deferred rent as agreed. All Dental (1.1% of net rentable area and 1.9% of underwritten rent) was granted rent relief from April to May 2020 and repayment was received in October 2020.
Market Overview and Competition. The Fresh Pond Cambridge Property is located in Cambridge, Massachusetts within the Metro Boston retail market and the West Cambridge Alewife submarket. Major employers in the area include Harvard University (“Harvard”),
THE INFORMATION IN THIS STRUCTURAL AND COLLATERAL TERM SHEET IS NOT COMPLETE AND MAY BE AMENDED PRIOR TO THE TIME OF SALE. THIS TERM SHEET IS NOT AN OFFER TO SELL THESE SECURITIES AND IT IS NOT A SOLICITATION OF AN OFFER TO BUY THESE SECURITIES IN ANY JURISDICTION WHERE THE OFFER OR SALE IS NOT PERMITTED.
159
| Retail - Anchored | Loan # 13 | Cut-off Date Balance: | $20,000,000 | |
| 168-210 Alewife Brook Parkway | Fresh Pond Cambridge | Cut-off Date LTV: | 44.2% | |
| Cambridge, MA 02138 | UW NCF DSCR: | 3.34x | ||
| UW NOI Debt Yield: | 11.4% |
Massachusetts Institute of Technology (“MIT”), Novartis, Biogen Idec, Sanofi/Genzyme, Cambridge Innovation Center, Akamai Technologies, Draper Laboratory, Takeda Pharmaceutics/Millennium, Pfizer, EF International, Microsoft, Broad Institute and Google. The presence of Harvard and MIT has resulted in a large student population within the community. The Fresh Pond Cambridge Property is located 1.5 miles north of Harvard and 3 miles north of MIT. Many biotechnology and information technology firms are located in two, Class A office complexes: One Kendall Square and Technology Square, both situated approximately half a mile west of the Fresh Pond Cambridge Property. According to the appraisal, as of the fourth quarter of 2020, the Metro Boston retail market had approximately 239.3 million SF of retail space inventory, overall vacancy in the market was approximately 3.0% and asking rent was $19.64 PSF. According to the appraisal, as of the fourth quarter of 2020, the West Cambridge Alewife submarket had approximately 1.3 million SF of retail space inventory, overall vacancy in the market was approximately 4.0% and asking rent was $47.26 PSF. According to the appraisal, the 2020 estimated population within a one-, three- and five-mile radius of the Fresh Pond Cambridge Property was 34,066, 367,767 and 862,562, respectively. The 2020 estimated median household income within a one-, three- and five-mile radius of the Fresh Pond Cambridge Property was $112,972, $91,403 and $90,811, respectively.
The following table presents certain information relating to the appraisal’s market rent conclusion for the Fresh Pond Cambridge Property:
Market Rent Summary
| Market Rent (PSF) | Lease Term (Years) | Lease Type (Reimbursements) | Rent Increase Projection | |
| Junior Anchor Space: | $38.00 | 120 | NNN + 10% CAM charge | 10% every 5 years |
| Anchor Space: | $35.00 | 120 | NNN + 10% CAM charge | 10% every 5 years |
| Small In-Line (< 5,000 SF) Space: | $50.00 | 60 | NNN + 15% CAM charge | 2.00%/year |
| Office Space: | $35.00 | 60 | Gross + Tenant Electric | $1.00 PSF annually |
| Yoga Studio Space: | $20.00 | 60 | NNN | 2.00%/year |
| Large In-Line (<>5,000 SF) Space: | $45.00 | 60 | NNN + 15% CAM charge | 2.00%/year |
Source: Appraisal.
The following table presents comparable retail leases with respect to the Fresh Pond Cambridge Property:
Comparable Retail Lease Summary
Property Name/ City, State | NRA | Lease Type | Tenant Name | Lease Area (SF) | Lease Date | Lease Term (Mos.) | Rent PSF |
Fresh Pond Cambridge (subject) Cambridge, MA | 226,730 | NNN | Whole Foods Market | 45,150 | April 2005 | 273 | $34.74 |
North Quincy Plaza Quincy, MA | 80,510 | NNN | 99 Ranch Market | 55,087 | Jan. 2020 | 240 | $32.49 |
1045 Massachusetts Avenue Cambridge, MA | 20,000 | NNN | Design Within Reach | 20,000 | July 2019 | 60 | $38.50 |
Porter Square Galleria Cambridge, MA | 54,265 | NNN | Target | 28,893 | Nov. 2018 | 120 | $40.42 |
Meadow Glen Mall Medford, MA | 283,194 | NNN | Dick’s Sporting Goods | 49,018 | Dec. 2017 | 120 | $22.57 |
Source: Appraisal.
Release of Property. On any business day, the borrower has a right to obtain the free release of the Release Parcel (as defined above under “The Property”), without prepayment or defeasance, provided no event of default is continuing and subject to the conditions set forth in the Fresh Pond Cambridge Whole Loan documents, including, among others, (1) title to the Release Parcel is transferred to an individual or entity other than the borrower, (2) the remaining property is a separate legally subdivided parcel and a separate tax lot or under local law will become a separate tax parcel on January 1st of the following year as a result of such transfer (provided that the borrower must continue to escrow taxes for the Release Parcel until it is a separate tax parcel), (3) conveyance of the Release Parcel does not (i) materially and adversely affect the use or operation of, or access to or from, the remaining property, or a reciprocal easement agreement or other agreement reasonably acceptable to the lender has been executed allowing the borrower to continue to use the Release Parcel for such purpose, (ii) cause any portion of the remaining property to be in violation of any legal requirements, (iii) create any liens on the remaining property, except for utility, access, parking and other easements necessary for infrastructure that are necessary for the Release Parcel so long as such easements do not have a material adverse effect on the use or operation of, or access to or from, or the value of, the remaining property, or (iv) violate the terms of any document or instrument relating to, or cause the reduction or abatement of any rental payments due under any lease at, the Fresh Pond Cambridge Property or violate any provisions relating to parking availability, and (4) certain REMIC-related conditions are satisfied.
THE INFORMATION IN THIS STRUCTURAL AND COLLATERAL TERM SHEET IS NOT COMPLETE AND MAY BE AMENDED PRIOR TO THE TIME OF SALE. THIS TERM SHEET IS NOT AN OFFER TO SELL THESE SECURITIES AND IT IS NOT A SOLICITATION OF AN OFFER TO BUY THESE SECURITIES IN ANY JURISDICTION WHERE THE OFFER OR SALE IS NOT PERMITTED.
160
(THIS PAGE INTENTIONALLY LEFT BLANK)
THE INFORMATION IN THIS STRUCTURAL AND COLLATERAL TERM SHEET IS NOT COMPLETE AND MAY BE AMENDED PRIOR TO THE TIME OF SALE. THIS TERM SHEET IS NOT AN OFFER TO SELL THESE SECURITIES AND IT IS NOT A SOLICITATION OF AN OFFER TO BUY THESE SECURITIES IN ANY JURISDICTION WHERE THE OFFER OR SALE IS NOT PERMITTED.
161
| No. 14 – Holliswood Owners Corp. | |||||||
| Mortgage Loan Information | Mortgaged Property Information | ||||||
| Mortgage Loan Seller: | NCB | Single Asset/Portfolio: | Single Asset | ||||
Credit Assessment (Fitch/KBRA/S&P): | NR/AA/AAA | Property Type – Subtype: | Multifamily – Cooperative | ||||
| Original Principal Balance: | $20,000,000 | Location: | Hollis, NY | ||||
| Cut-off Date Balance: | $19,967,346 | Size: | 262 Units | ||||
| % of Initial Pool Balance: | 2.2% | Cut-off Date Balance Per Unit: | $76,211 | ||||
| Loan Purpose: | Refinance | Maturity Date Balance Per Unit: | $58,372 | ||||
| Borrower Sponsor(1): | NAP | Year Built/Renovated: | 1949/2006 | ||||
| Guarantor(1): | NAP | Title Vesting: | Fee | ||||
| Mortgage Rate: | 3.0000% | Property Manager: | A. Michael Tyler Realty Corp. | ||||
| Note Date: | December 29, 2020 | Current Occupancy (As of)(5): | 96.1% (11/10/2020) | ||||
| Seasoning: | 1 month | YE 2019 Occupancy(5): | NAP | ||||
| Maturity Date: | January 1, 2031 | YE 2018 Occupancy(5): | NAP | ||||
| IO Period: | NAP | YE 2017 Occupancy(5): | NAP | ||||
| Loan Term (Original): | 120 months | YE 2016 Occupancy(5): | NAP | ||||
| Amortization Term (Original): | 360 months | Appraised Value(7): | $55,840,000 | ||||
| Loan Amortization Type: | Amortizing Balloon | Appraised Value Per Unit(7): | $213,130 | ||||
| Call Protection: | GRTR 1% or YM(113),1%(3),O(4) | Appraisal Valuation Date(7): | November 10, 2020 | ||||
| Lockbox Type: | None | Underwriting and Financial Information | |||||
| Additional Debt(2): | Yes | TTM NOI(6): | NAP | ||||
| Additional Debt Type (Balance)(2): | Floating ($0) | YE 2019 NOI(6): | NAP | ||||
| YE 2018 NOI(6): | NAP | ||||||
| YE 2017 NOI(6): | NAP | ||||||
| U/W Revenues: | $5,270,919 | ||||||
| Escrows and Reserves | U/W Expenses: | $2,449,930 | |||||
| Initial | Monthly | Cap | U/W NOI: | $2,820,989 | |||
| Taxes | $123,683 | $61,841(3) | NAP | U/W NCF: | $2,754,989 | ||
| Insurance | NAP | Springing(3) | NAP | U/W DSCR based on NOI/NCF: | 2.79x / 2.72x | ||
| Capital Improvements | $5,075,115(4) | NAP | NAP | U/W Debt Yield based on NOI/NCF: | 14.1% / 13.8% | ||
| U/W Debt Yield at Maturity based on NOI/NCF: | 18.4% / 18.0% | ||||||
| Cut-off Date LTV Ratio(7): | 35.8% | ||||||
| LTV Ratio at Maturity(7): | 27.4% | ||||||
Coop-Rental Value(8): Coop-LTV as Rental(8): | $54,300,000 36.8% | ||||||
| Sources and Uses | ||||||||
| Sources | Uses | |||||||
| Original Loan Amount | $20,000,000 | 100.0% | Loan Payoff | $9,530,742 | 47.7% | |||
| Capital Improvement Escrow | 5,075,115 | 25.4 | ||||||
| Proceeds to Borrower | 4,742,744 | 23.7 | ||||||
| Closing Costs | 527,717 | 2.6 | ||||||
| Real Estate Tax Escrow | 123,683 | 0.6 | ||||||
| Total Sources | $20,000,000 | 100.0% | Total Uses | $20,000,000 | 100.0% | |||
| (1) | The Holliswood Owners Corp. Property (as defined below) is owned by the Holliswood Owners Corp. Borrower (as defined below), which is a cooperative housing corporation. No individual or entity (other than the Holliswood Owners Corp. Borrower) has recourse obligations with respect to the Holliswood Owners Corp. Mortgage Loan (as defined below), including pursuant to any guaranty or environmental indemnity. |
| (2) | The Holliswood Owners Corp. Property also secures a subordinate second lien mortgage loan to the Holliswood Owners Corp. Borrower in the amount of up to $1,000,000 (the “Holliswood Owners Corp. Subordinate Loan”) which permits advances from time to time. The outstanding balance of the Holliswood Owners Corp. Subordinate Loan as of the cut-off date is $0. National Cooperative Bank, N.A. is the holder of the Holliswood Owners Corp. Subordinate Loan. With regard to the interest rate, term, payment terms and other statistical information relating to the Holliswood Owners Corp. Subordinate Loan, see “Description of the Mortgage Pool—Additional Indebtedness—Other Secured Indebtedness—Additional Debt Financing For Mortgage Loans Secured by Residential Cooperatives” in the Preliminary Prospectus. All statistical information presented above relating to balances per unit, debt yields, debt service coverage ratios and loan-to-value ratios are based solely on the Holliswood Owners Corp. Mortgage Loan (as defined below). |
| (3) | The Holliswood Owners Corp. Borrower is required to deposit, simultaneously with each monthly loan payment, 1/12 of the estimated annual real estate tax payments due to the applicable taxing authority. In addition, the Holliswood Owners Corp. Borrower may be required to deposit, simultaneously with each monthly loan payment, 1/12 of the annual insurance premiums upon the occurrence of an event of default under the applicable loan documents. |
THE INFORMATION IN THIS STRUCTURAL AND COLLATERAL TERM SHEET IS NOT COMPLETE AND MAY BE AMENDED PRIOR TO THE TIME OF SALE. THIS TERM SHEET IS NOT AN OFFER TO SELL THESE SECURITIES AND IT IS NOT A SOLICITATION OF AN OFFER TO BUY THESE SECURITIES IN ANY JURISDICTION WHERE THE OFFER OR SALE IS NOT PERMITTED.
162
Multifamily – Cooperative 196-04 Pompeii Avenue and 87-09 Pompeii Avenue Hollis, NY 11423 | Loan #14 Holliswood Owners Corp. | Cut-off Date Balance: Cut-off Date LTV: U/W NCF DSCR: U/W NOI Debt Yield: | $19,967,346 35.8% 2.72x 14.1% |
| (4) | At origination the Holliswood Owners Corp. Borrower executed and delivered (i) a Collateral Security Agreement for Capital Improvements pursuant to which the Holliswood Owners Corp. Borrower deposited with the lender the sum of $5,000,000 for the purpose of providing funds for anticipated future capital improvement work at the property; and (ii) a Collateral Security Agreement for Capital Improvements pursuant to which the Holliswood Owners Corp. Borrower deposited with the lender the sum of $75,115 for the purpose of providing funds for the completion of a Local Law 87 Energy Efficiency Report, and potential remediation work associated with that report. |
| (5) | With respect to Current Occupancy (As of), such occupancy is based on the property vacancy assumption set forth in the appraisal utilized for purposes of determining the Appraised Value of the Holliswood Owners Corp. Property as a multifamily rental property (i.e., the Coop - Rental Value). Additionally, the Occupancy (As of) date is based on the appraisal valuation date for the Holliswood Owners Corp. With respect to YE 2016 Occupancy, YE 2017 Occupancy, YE 2018 Occupancy and YE 2019 Occupancy, such historical occupancy is not reported for residential cooperatives as all units are owned by tenant-shareholders, the cooperative sponsor and/or the Holliswood Owners Corp. Borrower. |
| (6) | TTM NOI, YE 2019 NOI, YE 2018 NOI and YE 2017 NOI are “not available”. Residential cooperatives are not-for-profit entities that set maintenance fees to cover current expenses and plan for future capital needs. A residential cooperative can increase or decrease maintenance fees according to its anticipated expenses and level of cash reserves. |
| (7) | For purposes of determining the Appraised Value, the Appraised Value per Unit, the Cut-off Date LTV Ratio and the Maturity Date LTV Ratio, the value estimate reflected in the appraisal of the Holliswood Owners Corp. Property is determined as if such residential cooperative property is operated as a residential cooperative and, in general, such value equals the sum of (i) the gross share value of all cooperative units in such residential cooperative property, based in part on various comparable sales of cooperative apartment units in the market, plus (ii) the amount of the underlying debt encumbering such residential cooperative property. See “Description of the Mortgage Pool—Certain Characteristics of Mortgage Loans Secured by Residential Cooperatives” in the Preliminary Prospectus. |
| (8) | The Coop-Rental Value and the Coop-LTV as Rental assumes the Holliswood Owners Corp. Property is operated as a multifamily rental property. See “Risk Factors—Risks Relating to the Mortgage Loans—Residential Cooperative Properties Have Special Risks,” and “Description of the Mortgage Pool—Property Types—Multifamily Properties” in the Preliminary Prospectus. |
The Mortgage Loan. The mortgage loan (the “Holliswood Owners Corp. Mortgage Loan”) is evidenced by a promissory note secured by the first priority mortgage encumbering the fee interest in a 262-unit, cooperative apartment building located in Hollis, New York (the “Holliswood Owners Corp. Property”).
COVID-19 Update. The first debt service payment for the Holliswood Owners Corp. Mortgage Loan is due on February 1, 2021. As of the date hereof, the Holliswood Owners Corp. Mortgage Loan is not subject to any modification or forbearance request.
The Borrower. The borrower is Holliswood Owners Corp., a cooperative housing corporation organized under the laws of the State of New York (the “Holliswood Owners Corp. Borrower”). The Holliswood Owners Corp. Property is owned in fee simple by the Holliswood Owners Corp. Borrower. No individual or entity (other than the Holliswood Owners Corp. Borrower) has recourse obligations with respect to the Holliswood Owners Corp. Mortgage Loan, including pursuant to any guaranty or environmental indemnity.
The Property. The Holliswood Owners Corp. Property consists of 262 residential units with shares in ten, two-story, walk-up residential cooperative apartment buildings located in Hollis, New York. The Holliswood Owners Corp. Property was constructed in 1949 and converted to cooperative ownership in 1981. The Holliswood Owners Corp. Property is 95.4% (250 units) shareholder-owned and 4.6% unsold (12 units). The 12 unsold units are sponsor-owned units which generate a positive carry of approximately $27,245 per year. The Holliswood Owners Corp. Property also has two non-saleable apartments without shares, which are leased to residential tenants.
The Holliswood Owners Corp. Property features on-site laundry rooms and a parking garage, both of which are income producing to the cooperative.
The following table presents certain information relating to the unit mix of the Holliswood Owners Corp. Property:
Unit Mix Summary
| Unit Type | Total No. of Units | % of Total Units | Average Unit Size (SF) | Total Size (SF) | ||
| 1 Bedroom | 181 | 69.1% | 650 | 117,650 | ||
| 2 Bedroom | 81 | 30.9% | 850 | 68,850 | ||
| Total/Weighted Average | 262 | 100.00% | 712 | 186,500 |
| Source: | Maintenance Schedule. |
THE INFORMATION IN THIS STRUCTURAL AND COLLATERAL TERM SHEET IS NOT COMPLETE AND MAY BE AMENDED PRIOR TO THE TIME OF SALE. THIS TERM SHEET IS NOT AN OFFER TO SELL THESE SECURITIES AND IT IS NOT A SOLICITATION OF AN OFFER TO BUY THESE SECURITIES IN ANY JURISDICTION WHERE THE OFFER OR SALE IS NOT PERMITTED.
163
Multifamily – Cooperative 196-04 Pompeii Avenue and 87-09 Pompeii Avenue Hollis, NY 11423 | Loan #14 Holliswood Owners Corp. | Cut-off Date Balance: Cut-off Date LTV: U/W NCF DSCR: U/W NOI Debt Yield: | $19,967,346 35.8% 2.72x 14.1% |
Underwritten Net Cash Flow. The following table presents certain information relating to the underwritten net cash flow at the Holliswood Owners Corp. Property:
Cash Flow Analysis(1)
| U/W | U/W $ per Unit | |
| Base Rent | $5,333,819 | $20,358 |
| Parking Income | 134,400 | 513 |
| Laundry Income | 19,000 | 73 |
| Less Vacancy & Credit Loss(2) | (216,300) | (826) |
| Effective Gross Income | $5,270,919 | $20,118 |
| Total Operating Expenses | 2,449,930 | 9,351 |
| Net Operating Income | $2,820,989 | $10,767 |
| Capital Expenditures | 66,000 | 252 |
| Net Cash Flow | $2,754,989 | $10,515 |
| Occupancy % | 96.1% | |
| NOI DSCR(3) | 2.79x | |
| NCF DSCR(3) | 2.72x | |
| NOI Debt Yield(3) | 14.1% | |
| NCF Debt Yield(3) | 13.8% |
| (1) | Residential cooperatives are generally organized and operated as not-for-profit entities that set maintenance fees to cover current expenses and plan for future capital needs. The underwritten Net Operating Income and the underwritten Net Cash Flow for the Holliswood Owners Corp. Property is the projected net operating income and projected net cash flow reflected in the appraisal. Underwritten Net Operating Income, in general, equals projected operating income at the Holliswood Owners Corp. Property assuming such property is operated as a rental property with rents and other income set at the prevailing market rates, reduced by underwritten property operating expenses and a market-rate vacancy assumption – in each case as determined by the appraiser. Underwritten Net Cash Flow equals the projected net operating income less projected replacement reserves – as determined by the appraiser. However, the projected net cash flow used in such determinations may differ materially from the scheduled monthly maintenance payments from the tenant-shareholders upon which residential cooperatives depend. |
| (2) | The vacancy reported reflects the vacancy assumption in the related appraisal for purposes of determining the appraised value of the Holliswood Owners Corp. Property as a multifamily rental property. |
| (3) | Debt service coverage ratios and debt yields are based on the Holliswood Owners Corp. Mortgage Loan only and do not include any subordinate debt. |
Market Overview and Competition. The subject property is located to the north of Hillside Avenue and to the west of Francis Lewis Boulevard on a site circumscribed by Pompeii and Dunton Avenues and bisected by Marengo Street in the Holliswood neighborhood of Queens (Queens County), City and State of New York.
The subject property is located in the Holliswood neighborhood of the Borough of Queens, Queens County, in the City and State of New York. The area comprises a larger district, which is bounded on the north by the Horace Harding Expressway, to the south by Hillside Avenue, to the east by 210th Street/the Clearview Expressway, and to the west by the Van Wyck Expressway, and includes the long-established neighborhoods of Briarwood, Fresh Meadows, Hillcrest, Holliswood, Jamaica, Jamaica Estates, Jamaica Hills, Kew Gardens Hills, Pomonok, and Utopia.
The subject area is served by Queens Hospital Center, approximately two miles east of the subject; the 103rd Precinct of the NYPD, 1.6 miles southwest of the subject in Jamaica; and Engine 301, Ladder 150 of the FDNY, 1/2 mile south of the subject 91-04 197th Street in Hollis. The subject area is served by Cunningham Park, immediately north of the subject, The King Manor Museum, and the Queens Botanical Garden; MTA subway service on the F line at the Jamaica – 179th Street Station; and MTA bus service is available along Hillside Avenue and Francis Lewis Boulevard in the subject vicinity. LIRR rail service on the Hempstead and Port Jefferson lines is available at the Hollis station, half a mile from the subject. Hillside Avenue and the Grand Central Parkway connect the subject area to I-278/The Brooklyn Queens Expressway and all boroughs, I-678 and the Outer Bridge Crossing, area airports, New Jersey and the
THE INFORMATION IN THIS STRUCTURAL AND COLLATERAL TERM SHEET IS NOT COMPLETE AND MAY BE AMENDED PRIOR TO THE TIME OF SALE. THIS TERM SHEET IS NOT AN OFFER TO SELL THESE SECURITIES AND IT IS NOT A SOLICITATION OF AN OFFER TO BUY THESE SECURITIES IN ANY JURISDICTION WHERE THE OFFER OR SALE IS NOT PERMITTED.
164
Multifamily – Cooperative 196-04 Pompeii Avenue and 87-09 Pompeii Avenue Hollis, NY 11423 | Loan #14 Holliswood Owners Corp. | Cut-off Date Balance: Cut-off Date LTV: U/W NCF DSCR: U/W NOI Debt Yield: | $19,967,346 35.8% 2.72x 14.1% |
I-95 corridor beyond, as well as to Midtown and Downtown Manhattan. Driving time to midtown is approximately 50-60 minutes in moderate traffic. The Holliswood neighborhood is home to 35 public schools, 6 public libraries, 7 hospitals or clinics, and 17 parks.
According to a third-party market research report, the Holliswood Owners Corp. Property is located within the Southeast Queens submarket. According to the report, the Southeast Queens submarket reported a 3.4% vacancy rate as of the fourth quarter of 2020.
The following table presents certain information relating to comparable multifamily properties for the Holliswood Owners Corp. Property:
| Property | Distance to Subject | Year Built/ Renovated | Units | Average Unit Size (SF) | Asking Monthly Rent Per Unit(1) | Asking Monthly Rent PSF(1) |
| Holliswood Owners Corp. | - | 1949/2006 | 262 | 712 | $1,711 | $2.43 |
| 193-20 Jamaica Ave | 0.5 miles | 1956/NAV | 120 | 358 | $1,300 | $3.63 |
| 88-73 193rd St | 0.4 miles | 1939/NAV | 64 | 400 | $1,368 | $3.38 |
| 188-30-188-34 87th Dr | 0.4 miles | 1950/NAV | 96 | 629 | $2,066 | $3.28 |
| 195-24-195-30 Jamaica Ave | 0.5 miles | 1963/NAV | 67 | 730 | $1,986 | $2.72 |
| 19011 Hillside Ave | 0.4 miles | 2015/NAV | 22 | 729 | $1,899 | $2.61 |
| 190-05 Hillside Ave | 0.4 miles | 1960/NAV | 109 | 688 | $1,288 | $1.87 |
| 196-03-196-11 Jamaica Ave | 0.5 miles | 1950/NAV | 99 | 500 | $887 | $1.77 |
| Total/Weighted Average(2) | 577 | 552 | $1,464 | $2.75 |
| (1) | The Asking Monthly Rent Per Unit and Asking Monthly Rent PSF for the Holliswood Owners Corp. Property is estimated using market rents for residential units as determined by the appraiser. |
| (2) | Total/Weighted Average excludes the Holliswood Owners Corp. Property. |
THE INFORMATION IN THIS STRUCTURAL AND COLLATERAL TERM SHEET IS NOT COMPLETE AND MAY BE AMENDED PRIOR TO THE TIME OF SALE. THIS TERM SHEET IS NOT AN OFFER TO SELL THESE SECURITIES AND IT IS NOT A SOLICITATION OF AN OFFER TO BUY THESE SECURITIES IN ANY JURISDICTION WHERE THE OFFER OR SALE IS NOT PERMITTED.
165
| No. 15 – Harvard West (Roseburg DHS Office) | |||||||
| Mortgage Loan Information | Mortgaged Property Information | ||||||
| Mortgage Loan Seller: | Morgan Stanley Mortgage Capital Holdings LLC | Single Asset/Portfolio: | Single Asset | ||||
| Credit Assessment (S&P/Fitch/KBRA): | NR/NR/NR | Property Type – Subtype: | Office – Suburban | ||||
| Original Principal Balance: | $18,000,000 | Location: | Roseburg, OR | ||||
| Cut-off Date Balance: | $18,000,000 | Size: | 80,798 SF | ||||
| % of Initial Pool Balance: | 2.0% | Cut-off Date Balance Per SF: | $222.78 | ||||
| Loan Purpose: | Refinance | Maturity Date Balance Per SF: | $222.78 | ||||
| Borrower Sponsors: | Rubicon Investments Corporation | Year Built/Renovated: | 1979/2016 | ||||
| Guarantors: | Rubicon Investments Corporation | Title Vesting: | Fee | ||||
| Mortgage Rate: | 3.2200% | Property Manager: | Self-managed | ||||
| Note Date: | November 13, 2020 | Current Occupancy (As of): | 100.0% (2/1/2021) | ||||
| Seasoning: | 2 months | YE 2019 Occupancy: | 100.0% | ||||
| Maturity Date: | December 1, 2030 | YE 2018 Occupancy: | 100.0% | ||||
| IO Period: | 120 months | YE 2017 Occupancy: | NAV | ||||
| Loan Term (Original): | 120 months | YE 2016 Occupancy: | NAV | ||||
| Amortization Term (Original): | NAP | Appraised Value: | $27,310,000 | ||||
| Loan Amortization Type: | Interest-only, Balloon | Appraised Value Per SF: | $338.00 | ||||
| Call Protection: | L(26),D(87),O(7) | Appraisal Valuation Date: | September 28, 2020 | ||||
| Lockbox Type: | Springing | Underwriting and Financial Information(1) | |||||
| Additional Debt: | No | TTM NOI (9/30/2020): | $1,739,723 | ||||
| Additional Debt Type (Balance): | NAP | YE 2019 NOI: | $1,703,016 | ||||
| YE 2018 NOI: | $1,699,670 | ||||||
| YE 2017 NOI: | NAV | ||||||
| U/W Revenues: | $2,223,994 | ||||||
| Escrows and Reserves | U/W Expenses: | $413,801 | |||||
| Initial | Monthly | Cap | U/W NOI: | $1,810,193 | |||
| Taxes(2) | $0 | Springing | NAP | U/W NCF: | $1,794,034 | ||
| Insurance(3) | $0 | Springing | NAP | U/W DSCR based on NOI/NCF: | 3.08x / 3.05x | ||
| Replacement Reserve | $0 | $1,347 | $32,328 | U/W Debt Yield based on NOI/NCF: | 10.1% / 10.0% | ||
| U/W Debt Yield at Maturity based on NOI/NCF: | 10.1% / 10.0% | ||||||
| Cut-off Date LTV Ratio: | 65.9% | ||||||
| LTV Ratio at Maturity: | 65.9% | ||||||
| Sources and Uses | ||||||||
| Sources | Uses | |||||||
| Loan Amount | $18,000,000 | 100.0% | Loan Payoff | $17,597,738 | 97.8% | |||
| Return of Equity | 260,453 | 1.4 | ||||||
| Closing Costs | 141,809 | 0.8 | ||||||
| Total Sources | $18,000,000 | 100.0% | Total Uses | $18,000,000 | 100.0% | |||
| (1) | The novel coronavirus pandemic is an evolving situation and could impact the Harvard West (Roseburg DHS Office) Mortgage Loan more severely than assumed in the underwriting of the Harvard West (Roseburg DHS Office) Mortgage Loan and could adversely affect the NOI, NCF and occupancy information, as well as the appraised value and the DSCR, LTV and Debt Yield metrics presented above and herein. See “Risk Factors—Risks Related to Market Conditions and Other External Factors—The Coronavirus Pandemic Has Adversely Affected the Global Economy and Will Likely Adversely Affect the Performance of the Mortgage Loans” in the Preliminary Prospectus. |
| (2) | Monthly tax reserves are springing upon any of the following: (i) an event of default, (ii) the borrower’s failure to provide the lender with evidence that taxes have been paid when due. |
| (3) | Monthly insurance reserves are springing upon any of the following: (i) an event of default, (ii) failure to provide written evidence of blanket policy. |
The Mortgage Loan. The mortgage loan (the “Harvard West (Roseburg DHS Office) Mortgage Loan”) is evidenced by a promissory note in the original principal amount of $18,000,000 and secured by a first priority fee mortgage encumbering an office property located in Roseburg, Oregon (the “Harvard West (Roseburg DHS Office) Property”).
The Property. The Harvard West (Roseburg DHS Office) Property is an 80,798 square foot office property located in Roseburg, Oregon. The Harvard West (Roseburg DHS Office) Property consists of a three-story building situated on a 5.65-acre site that contains 328 parking spaces (4.1 per 1,000 SF of NRA). The Harvard West (Roseburg DHS Office) Property was built in 1979 and most recently renovated in 2016. In 2016, the Harvard West (Roseburg DHS Office) Property underwent a $15.7 million ($195 PSF) renovation and was converted into office space for the Oregon Department of Human Services. Since the renovation, the borrower has invested $2.1 million ($26 PSF) on capital expenditures, including building improvements, electrical upgrades, and landscaping. In 2019, the borrower invested $954,996 ($12 PSF) to construct additional parking.
THE INFORMATION IN THIS STRUCTURAL AND COLLATERAL TERM SHEET IS NOT COMPLETE AND MAY BE AMENDED PRIOR TO THE TIME OF SALE. THIS TERM SHEET IS NOT AN OFFER TO SELL THESE SECURITIES AND IT IS NOT A SOLICITATION OF AN OFFER TO BUY THESE SECURITIES IN ANY JURISDICTION WHERE THE OFFER OR SALE IS NOT PERMITTED.
166
| Office - Suburban | Loan # 15 | Cut-off Date Balance: | $18,000,000 | |
| 738 West Harvard Avenue | Harvard West (Roseburg DHS Office) | Cut-off Date LTV: | 65.9% | |
| Roseburg, OR 97471 | UW NCF DSCR: | 3.05x | ||
| UW NOI Debt Yield: | 10.1% |
The Harvard West (Roseburg DHS Office) Property is 100% leased to the State of Oregon - Department of Human Services. Formed in 1971, the Oregon Department of Human Services (“ODHS”) is a state government agency that supports individuals in achieving wellbeing and independence. The ODHS is divided into five offices: Assistance (Self-Sufficiency), Children and Youth (Child Welfare), Intellectual/Developmental Disabilities, Seniors and People with Physical Disabilities, and Vocational Rehabilitation. The tenant executed a 15-year lease which commenced in December 2016 and was scheduled to expire in November 2031. In August 2019, the tenant exercised its lease extension option early through November 2035.
The below table presents certain information relating to the major tenants at the Harvard West (Roseburg DHS Office) Property:
Major Tenants(1)
| Tenant Name | Credit Rating (Fitch/Moody’s/S&P)(2) | Tenant NRSF | % of NRSF | Annual U/W Base Rent PSF | Annual U/W Base Rent | % of Total Annual U/W Base | Lease Expiration | Renewal Options | Term. Option (Y/N) |
| ODHS(3) | AA+/Aa1/AA+ | 80,798 | 100.0% | $25.28 | $2,042,186 | 100.0% | 11/30/2035 | 1 x 4 year | N |
| Subtotal/Wtd. Avg. | 80,798 | 100.0% | $25.28 | $2,042,186 | 100.0% | ||||
| Vacant Space | 0 | 0.0% | |||||||
| Collateral Total | 80,798 | 100.0% | |||||||
| (1) | Information is based on the underwritten rent roll as of February 1, 2021. |
| (2) | Certain ratings are those of the parent company whether or not the parent company guarantees the lease. |
| (3) | The Annual U/W Base Rent is based on the rent roll as of February 1, 2021, and includes straight lined rent for ODHS for the remainder of the loan term, and assuming no downward rent adjustment is made under the lease. The lease provides for a downward adjustment of rent in year 11 of the lease term (starting December 1, 2026) if the rent under the lease is higher than the fair market rent and escalations (as determined by an MAI appraisal), provided that rent may not be adjusted below 95% of the rent in year 10 of the lease term. |
The following table presents certain information relating to the lease rollover schedule at the Harvard West (Roseburg DHS Office) Property:
Lease Expiration Schedule(1)(2)
| Year Ending December 31, | No. of Leases Expiring | Expiring NRSF | % of Total NRSF | Cumulative Expiring NRSF | Cumulative % of Total NRSF | Annual U/W Base Rent | % of Total Annual U/W Base Rent | Annual U/W Base Rent PSF |
| 2021 | 0 | 0 | 0.0% | 0 | 0.0% | $0 | 0.0% | $0.00 |
| 2022 | 0 | 0 | 0.0% | 0 | 0.0% | $0 | 0.0% | $0.00 |
| 2023 | 0 | 0 | 0.0% | 0 | 0.0% | $0 | 0.0% | $0.00 |
| 2024 | 0 | 0 | 0.0% | 0 | 0.0% | $0 | 0.0% | $0.00 |
| 2025 | 0 | 0 | 0.0% | 0 | 0.0% | $0 | 0.0% | $0.00 |
| 2026 | 0 | 0 | 0.0% | 0 | 0.0% | $0 | 0.0% | $0.00 |
| 2027 | 0 | 0 | 0.0% | 0 | 0.0% | $0 | 0.0% | $0.00 |
| 2028 | 0 | 0 | 0.0% | 0 | 0.0% | $0 | 0.0% | $0.00 |
| 2029 | 0 | 0 | 0.0% | 0 | 0.0% | $0 | 0.0% | $0.00 |
| 2030 | 0 | 0 | 0.0% | 0 | 0.0% | $0 | 0.0% | $0.00 |
| 2031 | 0 | 0 | 0.0% | 0 | 0.0% | $0 | 0.0% | $0.00 |
| Thereafter | 1 | 80,798 | 100.0% | 80,798 | 100.0% | $2,042,186 | 100.0% | $25.28 |
| Vacant | 0 | 0 | 0.0% | 80,798 | 100.0% | $0 | 0.0% | $0.00 |
| Total | 1 | 80,798 | 100.0% | $2,042,186 | 100.0% | $25.28 |
| (1) | Information is based on the underwritten rent roll as of February 1, 2021. |
| (2) | Certain tenants may have lease termination options that are exercisable prior to the stated expiration date of the subject lease or leases that are not considered in the lease rollover schedule. |
THE INFORMATION IN THIS STRUCTURAL AND COLLATERAL TERM SHEET IS NOT COMPLETE AND MAY BE AMENDED PRIOR TO THE TIME OF SALE. THIS TERM SHEET IS NOT AN OFFER TO SELL THESE SECURITIES AND IT IS NOT A SOLICITATION OF AN OFFER TO BUY THESE SECURITIES IN ANY JURISDICTION WHERE THE OFFER OR SALE IS NOT PERMITTED.
167
| Office - Suburban | Loan # 15 | Cut-off Date Balance: | $18,000,000 | |
| 738 West Harvard Avenue | Harvard West (Roseburg DHS Office) | Cut-off Date LTV: | 65.9% | |
| Roseburg, OR 97471 | UW NCF DSCR: | 3.05x | ||
| UW NOI Debt Yield: | 10.1% |
Operating History and Underwritten Net Cash Flow. The following table presents certain information relating to the historical operating performance and underwritten net cash flow at the Harvard West (Roseburg DHS Office) Property:
Cash Flow Analysis(1)
| 2018 | 2019 | TTM 9/30/2020 | U/W(2) | %(3) | U/W $ per SF | |
| Gross Potential Rent | $1,763,296 | $1,798,562 | $1,825,496 | $2,042,186 | 90.0% | $25.28 |
| Other Income | 53,769 | 53,769 | 53,769 | 0 | 0.0 | 0.00 |
| Reimbursements | 204,712 | 209,307 | 216,864 | 227,195 | 10.0 | 2.81 |
| Net Rental Income | $2,021,777 | $2,061,638 | $2,096,128 | $2,269,381 | 100.0% | $28.09 |
| Vacancy | 0 | 0 | 0 | -45,388 | -2.2 | -0.56 |
| Effective Gross Income | $2,021,777 | $2,061,638 | $2,096,128 | $2,223,994 | 98.0% | $27.53 |
| Real Estate Taxes | 161,281 | 169,541 | 180,676 | 191,015 | 8.6 | 2.36 |
| Insurance | 69,601 | 74,999 | 71,421 | 72,718 | 3.3 | 0.90 |
| Management Fee | 20,218 | 20,616 | 20,961 | 66,720 | 3.0 | 0.83 |
| Other Operating Expenses | 71,008 | 93,466 | 83,348 | 83,348 | 3.7 | 1.03 |
| Total Operating Expenses | $322,108 | $358,622 | $356,406 | $413,801 | 18.6% | $5.12 |
| Net Operating Income | $1,699,670 | $1,703,016 | $1,739,723 | $1,810,193 | 81.4% | $22.40 |
| Replacement Reserves | 0 | 0 | 0 | 16,160 | 0.7 | 0.20 |
| TI/LC | 0 | 0 | 0 | 0 | 0.0 | 0.00 |
| Net Cash Flow | $1,699,670 | $1,703,016 | $1,739,723 | $1,794,034 | 80.7% | $22.20 |
| NOI DSCR | 2.89x | 2.90x | 2.96x | 3.08x | ||
| NCF DSCR | 2.89x | 2.90x | 2.96x | 3.05x | ||
| NOI Debt Yield | 9.4% | 9.5% | 9.7% | 10.1% | ||
| NCF Debt Yield | 9.4% | 9.5% | 9.7% | 10.0% |
| (1) | For the avoidance of doubt, no COVID specific adjustments have been made to the lender underwriting. |
| (2) | U/W Gross Potential Rent is based on the rent roll as of February 1, 2021, and includes straight lined rent for the sole tenant for the remainder of the loan term, and assuming no downward rent adjustment is made under the lease. The lease provides for a downward adjustment of rent in year 11 of the lease term (starting December 1, 2026) if the rent under the lease is higher than the fair market rent and escalations (as determined by an MAI appraisal), provided that rent may not be adjusted below 95% of the rent in year 10 of the lease term. |
| (3) | Represents (i) percent of Net Rental Income for all revenue fields, (ii) percent of Gross Potential Rent for Vacancy and (iii) percent of Effective Gross Income for all other fields. |
COVID-19 Update. As of January 4, 2021, the Harvard West (Roseburg DHS Office) Mortgage Loan is current as of the January debt service payment and is not subject to any forbearance, modification or debt service relief request. As of January 4, 2021, the borrower has reported that the Harvard West (Roseburg DHS Office) Property is open and operating and the sole tenant has paid 100.0% of rent for December 2020. In addition, the sole tenant has not requested rent relief.
Market Overview and Competition. The Harvard West (Roseburg DHS Office) Property is located in Roseburg, Oregon within the Southwest Oregon office market and the Douglas County submarket. Major employers in the area include Roseburg Forest Products Co. and Mercy Healthcare, Inc., with 2,874 employees. Significant development in the immediate area consists of retail, office, and residential properties. The local area is comprised of 44% retail uses, followed by 28% office uses, 16% multi-family uses, and 12% industrial uses. According to the appraisal, as of the second quarter of 2020, the Southwest Oregon office market had approximately 18.7 million SF of office space inventory, overall vacancy in the market was approximately 4.3% and asking rent was $19.11 PSF. According to the appraisal, as of the second quarter of 2020, the Douglas County submarket had approximately 2.0 million SF of office space inventory, overall vacancy in the market was approximately 1.9% and asking rent was $16.52 PSF. According to the appraisal, the 2019 estimated population within a one-, three- and five-mile radius of the Harvard West (Roseburg DHS Office) Property was 6,374, 26,534 and 39,255, respectively. The 2019 estimated average household income within a one-, three- and five-mile radius of the Harvard West (Roseburg DHS Office) Property was $53,182, $64,297 and $63,651, respectively. According to the appraisal, the concluded market rent is $23.00.
THE INFORMATION IN THIS STRUCTURAL AND COLLATERAL TERM SHEET IS NOT COMPLETE AND MAY BE AMENDED PRIOR TO THE TIME OF SALE. THIS TERM SHEET IS NOT AN OFFER TO SELL THESE SECURITIES AND IT IS NOT A SOLICITATION OF AN OFFER TO BUY THESE SECURITIES IN ANY JURISDICTION WHERE THE OFFER OR SALE IS NOT PERMITTED.
168
| Office - Suburban | Loan # 15 | Cut-off Date Balance: | $18,000,000 | |
| 738 West Harvard Avenue | Harvard West (Roseburg DHS Office) | Cut-off Date LTV: | 65.9% | |
| Roseburg, OR 97471 | UW NCF DSCR: | 3.05x | ||
| UW NOI Debt Yield: | 10.1% |
The following table presents comparable office leases with respect to the Harvard West (Roseburg DHS Office) Property:
Comparable Office Lease Summary
Property Name/ City, State | NRA | Lease Type | Tenant Name | Lease Area (SF) | Lease Date | Lease Term (YRS.) | Rent PSF |
Harvard West (Roseburg DHS Office) (subject) Roseburg, OR | 80,798 | Modified Gross | State of Oregon - Department of Human Services | 80,798 | Dec. 2016 | 19 | $25.28 |
NGP Rubicon Aurora, CO | 116,500 | Full Service Gross | Defense Health Agency | 101,285 | May 2019 | 10 | $22.33 |
Granite Regional Park Sacramento, CA | 135,000 | Full Service Gross | CA Dpt. of Tax & Fee Admin | 33,075 | Feb. 2019 | 8 | $25.86 |
U.S. General Services Admin Colorado Springs, CO | 64,439 | Full Service Gross | GSA | 64,439 | Jan. 2019 | 15 | $21.44 |
USFS Office Jerome, ID | 18,744 | Modified Gross | US Forest Service | 18,744 | April 2018 | 20 | $28.07 |
GSA Office Building Lakewood, CO | 82,407 | Full Service Gross | GSA | 40,953 | Oct. 2017 | 5 | $26.84 |
GSA Office Building Cheyenne, WY | 106,107 | Full Service Gross | US Government Services Admin | 106,107 | Sept. 2017 | 5 | $25.29 |
Source: Appraisal.
THE INFORMATION IN THIS STRUCTURAL AND COLLATERAL TERM SHEET IS NOT COMPLETE AND MAY BE AMENDED PRIOR TO THE TIME OF SALE. THIS TERM SHEET IS NOT AN OFFER TO SELL THESE SECURITIES AND IT IS NOT A SOLICITATION OF AN OFFER TO BUY THESE SECURITIES IN ANY JURISDICTION WHERE THE OFFER OR SALE IS NOT PERMITTED.
169
| BANK 2021-BNK31 | Transaction Contact Information |
| VII. | Transaction Contact Information |
Questions regarding this Structural and Collateral Term Sheet may be directed to any of the following individuals:
| Wells Fargo Securities, LLC | |
| Brigid Mattingly | Tel. (312) 269-3062 |
| A.J. Sfarra | Tel. (212) 214-5613 |
| Alex Wong | Tel. (212) 214-5615 |
| BofA Securities, Inc. | |
| Leland F. Bunch, III | Tel. (646) 855-3953 |
| Danielle Caldwell | Tel. (646) 855-3421 |
| Morgan Stanley & Co. | |
| Nishant Kapur | Tel. (212) 761-1483 |
| Jane Lam | Tel. (212) 761-3507 |
| Brandon Atkins | Tel. (212) 761-4846 |
THE INFORMATION IN THIS STRUCTURAL AND COLLATERAL TERM SHEET IS NOT COMPLETE AND MAY BE AMENDED PRIOR TO THE TIME OF SALE. THIS TERM SHEET IS NOT AN OFFER TO SELL THESE SECURITIES AND IT IS NOT A SOLICITATION OF AN OFFER TO BUY THESE SECURITIES IN ANY JURISDICTION WHERE THE OFFER OR SALE IS NOT PERMITTED.
170