Exhibit 99.2

Corporate Presentation 43rd Annual J.P. Morgan Healthcare Conference—January 15, 2025
Legal Disclaimer & Forward-Looking Statements Certain statements in this presentation and the accompanying oral commentary are forward-looking statements. These statements relate to future events or the future business and financial performance of Biomea Fusion, Inc. (the “Company”) and involve known and unknown risks, uncertainties and other factors that may cause the actual results, levels of activity, performance or achievements of the Company or its industry to be materially different from those expressed or implied by any forward-looking statements. In some cases, forward-looking statements can be identified by terminology such as “may,” “will,” “could,” “would,” “should,” “expect,” “plan,” “anticipate,” “intend,” “believe,” “estimate,” “predict,” “potential” or other comparable terminology. All statements other than statements of historical fact could be deemed forward-looking, including any projections of financial information or profitability, the initiation, timing and results of pending or future preclinical studies and clinical trials, the actual or potential actions of the Food and Drug Administration (FDA), the status and timing of ongoing research, development and corporate partnering activities, any statements about historical results that may suggest trends for the Company’s business; any statements of the plans, strategies, and objectives of management for future operations and any statements of expectation or belief regarding future events, potential markets or market size, or technology developments. The Company has based these forward-looking statements on its current expectations, assumptions, estimates and projections. While the Company believes these expectations, assumptions, estimates and projections are reasonable, such forward-looking statements are only predictions and involve known and unknown risks and uncertainties, many of which are beyond the Company’s control. For a discussion of these and other risks and uncertainties, and other important factors, any of which could cause our actual results to differ from those contained in the forward-looking statements, see the section entitled “Risk Factors” in our most recent annual report on Form 10-K filed with the Securities and Exchange Commission (the SEC), as well as discussions of potential risks, uncertainties, and other important factors in our other subsequent filings with the SEC. The forward-looking statements in this presentation are made only as of the date hereof. Except as required by law, the Company assumes no obligation and does not intend to update these forward-looking statements or to conform these statements to actual results or to changes in the Company’s expectations. This presentation also contains estimates and other statistical data made by independent parties and by us relating to market size and growth and other data about our industry. This data involves a number of assumptions and limitations, and you are cautioned not to give undue weight to such estimates. In addition, projections, assumptions, and estimates of our future performance and the future performance of the markets in which we operate are necessarily subject to a high degree of uncertainty and risk. J.P. Morgan Healthcare Conference – January 15, 2025 Slide 2

Biomea Fusion: A Diabetes and Obesity Medicines Company Study Indications Anticipated Milestones for 2025 COVALENT-111 Type 2 Diabetes 2H 2025: 52 Week Data Phase 2 Icovamenib COVALENT-112 Type 1 Diabetes 2H 2025: Open Label Data (BMF-219) Phase 2 Menin Program (Potential Type 2 Diabetes COVALENT- 311 1H 2025 Meet with FDA to Discuss Phase II/III (Adaptive Severe Insulin Deficient Best-In-Class) Phase 2/3 Design) and Advance to Late-stage Development Diabetes COVALENT-211 Type 2 Diabetes 1H 2025 Meet with FDA to Discuss Phase II and Initiate Phase 2 GLP-1RA combination Combination Study BMF-650 GLP-1R Agonist IND-Enabling Diabetes/Obesity 2H 2025 IND Cleared and First Participant Dosed (Potential Best-In- Studies Class) BMF-500 COVALENT-103 AML/ALL Dose Escalation Completion – Partnering Strategy FLT-3 Program Phase 1 (Acute Leukemia) J.P. Morgan Healthcare Conference – January 15, 2025 Slide 3

A Long History of Developing Multi-Billion Dollar Drugs—Together Thomas Butler Ramses Erdtmann Juan Frías, M.D. Naomi Cretcher Heow Tan Franco Valle Chairman & CEO President & COO Chief Medical Chief of People Chief Technical & Chief Financial Officer Quality Officer Officer Co-Founder Co-Founder The FUSIONTM SYSTEM icovamenib* Co-Inventor Co-Inventor J.P. Morgan Healthcare Conference – January 15, 2025 Slide 4
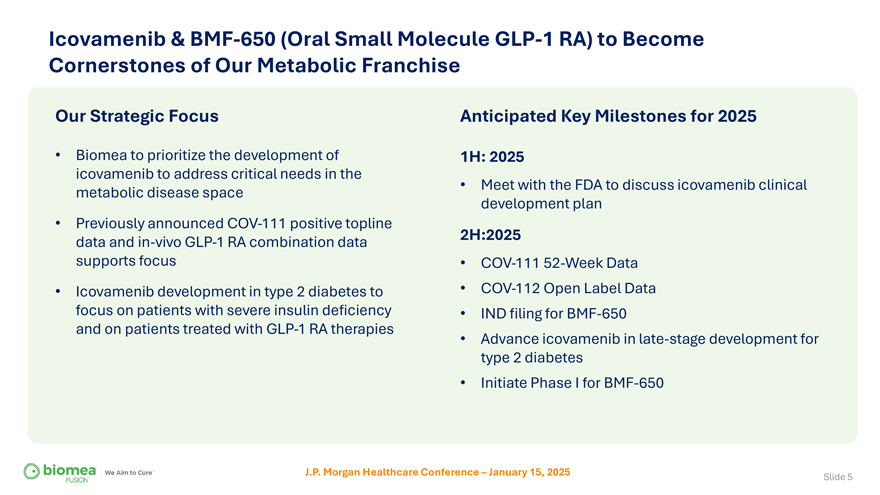
Icovamenib & BMF-650 (Oral Small Molecule GLP-1 RA) to Become Cornerstones of Our Metabolic Franchise Our Strategic Focus Anticipated Key Milestones for 2025 • Biomea to prioritize the development of 1H: 2025 icovamenib to address critical needs in the metabolic disease space • Meet with the FDA to discuss icovamenib clinical development plan • Previously announced COV-111 positive topline data and in-vivo GLP-1 RA combination data 2H:2025 supports focus • COV-111 52-Week Data • Icovamenib development in type 2 diabetes to • COV-112 Open Label Data focus on patients with severe insulin deficiency • IND filing for BMF-650 and on patients treated with GLP-1 RA therapies • Advance icovamenib in late-stage development for type 2 diabetes • Initiate Phase I for BMF-650 J.P. Morgan Healthcare Conference – January 15, 2025 Slide 5
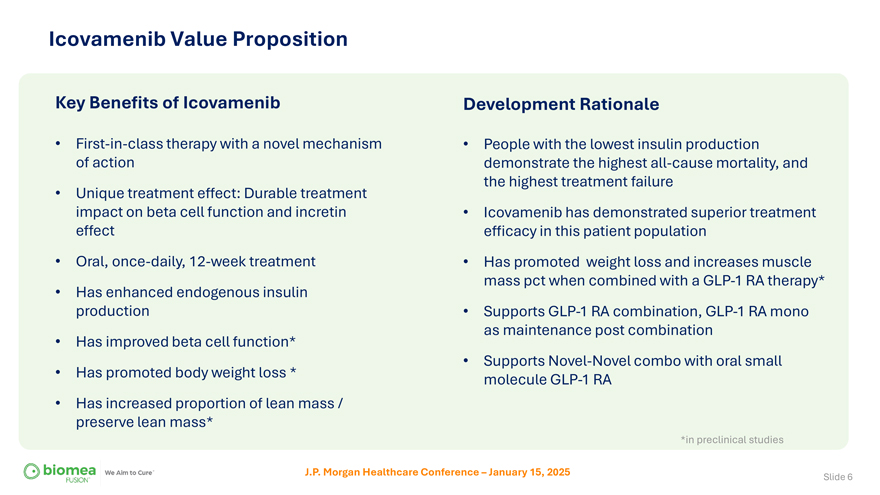
Icovamenib Value Proposition Key Benefits of Icovamenib • First-in-class therapy with a novel mechanism of action • Unique treatment effect: Durable treatment impact on beta cell function and incretin effect • Oral, once-daily, 12-week treatment • Has enhanced endogenous insulin production • Has improved beta cell function* • Has promoted body weight loss * • Has increased proportion of lean mass / preserve lean mass* Development Rationale • People with the lowest insulin production demonstrate the highest all-cause mortality, and the highest treatment failure • Icovamenib has demonstrated superior treatment efficacy in this patient population • Has promoted weight loss and increases muscle mass pct when combined with a GLP-1 RA therapy* • Supports GLP-1 RA combination, GLP-1 RA mono as maintenance post combination • Supports Novel-Novel combo with oral small molecule GLP-1 RA *in preclinical studies J.P. Morgan Healthcare Conference – January 15, 2025 Slide 6
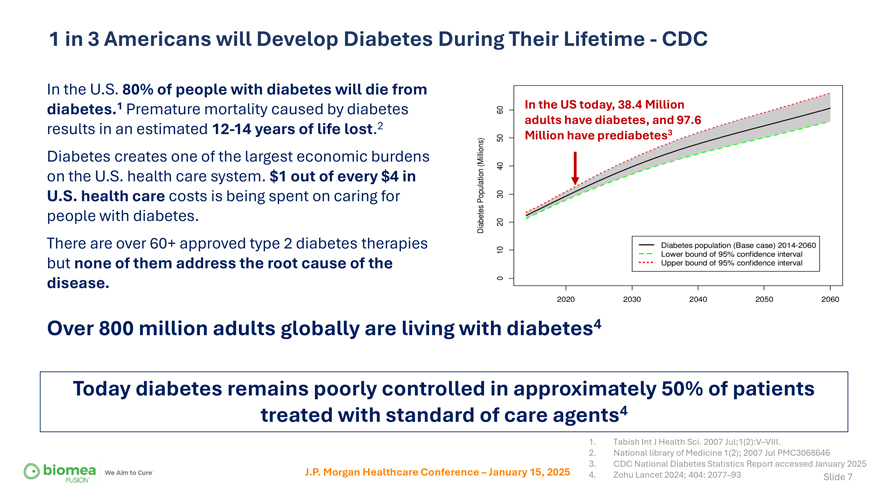
1 in 3 Americans will Develop Diabetes During Their Lifetime—CDC In the U.S. 80% of people with diabetes will die from diabetes.1 Premature mortality caused by diabetes results in an estimated 12-14 years of life lost.2 Diabetes creates one of the largest economic burdens on the U.S. health care system. $1 out of every $4 in U.S. health care costs is being spent on caring for people with diabetes. There are over 60+ approved type 2 diabetes therapies but none of them address the root cause of the disease. In the US today, 38.4 Million adults have diabetes, and 97.6 Million have prediabetes3 Over 800 million adults globally are living with diabetes4 Today diabetes remains poorly controlled in approximately 50% of patients treated with standard of care agents4 J.P. Morgan Healthcare Conference – January 15, 2025 1. Tabish Int J Health Sci. 2007 Jul;1(2):V–VIII. 2. National library of Medicine 1(2); 2007 Jul PMC3068646 3. CDC National Diabetes Statistics Report accessed January 2025 4. Zohu Lancet 2024; 404: 2077–93 Slide 7
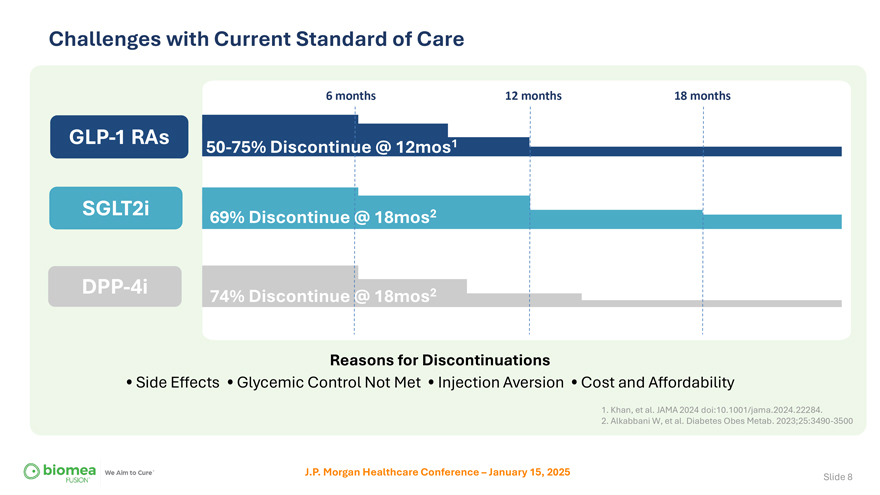
Challenges with Current Standard of Care 6 months 12 months 18 months GLP-1 RAs 50-75% Discontinue @ 12mos1 SGLT2i 69% Discontinue @ 18mos2 DPP-4i 74% Discontinue @ 18mos2 Reasons for Discontinuations • Side Effects • Glycemic Control Not Met • Injection Aversion • Cost and Affordability 1. Khan, et al. JAMA 2024 doi:10.1001/jama.2024.22284. 2. Alkabbani W, et al. Diabetes Obes Metab. 2023;25:3490-3500 J.P. Morgan Healthcare Conference – January 15, 2025 Slide 8
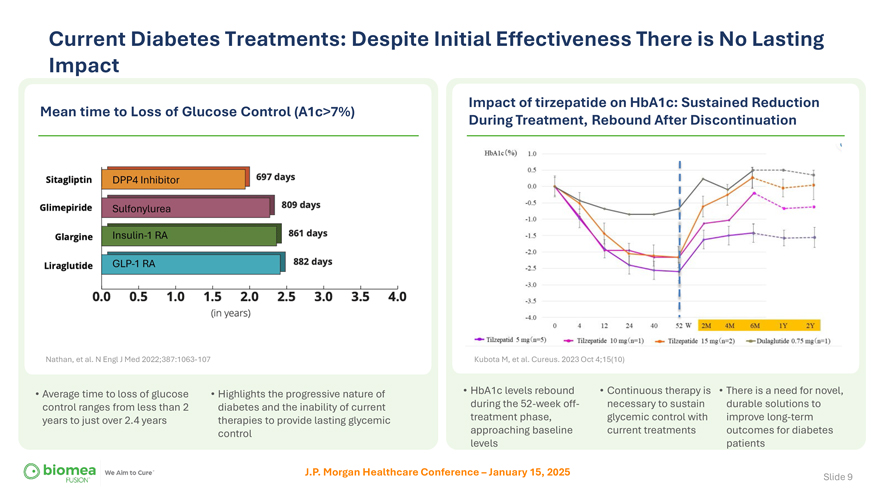
Current Diabetes Treatments: Despite Initial Effectiveness There is No Lasting Impact Mean time to Loss of Glucose Control (A1c>7%) Nathan, et al. N Engl J Med 2022;387:1063-107 Impact of tirzepatide on HbA1c: Sustained Reduction During Treatment, Rebound After Discontinuation Kubota M, et al. Cureus. 2023 Oct 4;15(10) • Average time to loss of glucose control ranges from less than 2 years to just over 2.4 years • Highlights the progressive nature of diabetes and the inability of current therapies to provide lasting glycemic control • HbA1c levels rebound during the 52-week off-treatment phase, approaching baseline levels • Continuous therapy is necessary to sustain glycemic control with current treatments • There is a need for novel, durable solutions to improve long-term outcomes for diabetes patients J.P. Morgan Healthcare Conference – January 15, 2025 Slide 9
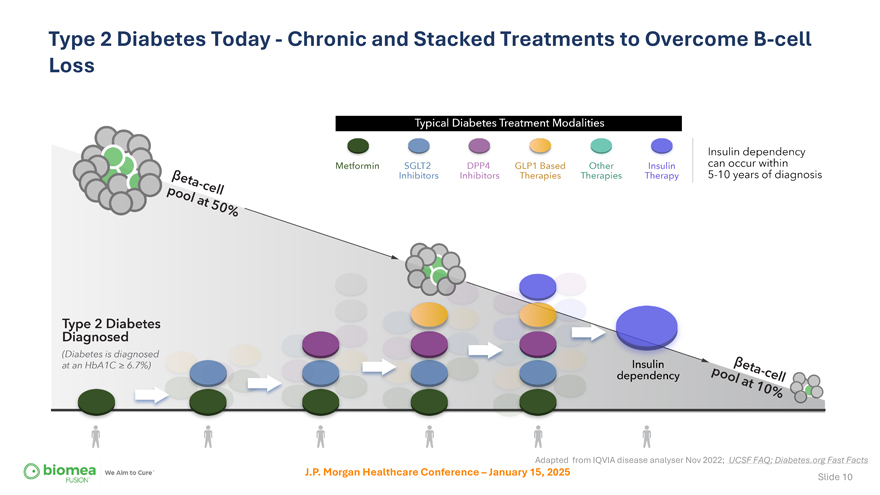
Type 2 Diabetes Today—Chronic and Stacked Treatments to Overcome B-cell Loss Adapted from IQVIA disease analyser Nov 2022; UCSF FAQ; Diabetes.org Fast Facts J.P. Morgan Healthcare Conference – January 15, 2025 Slide 10
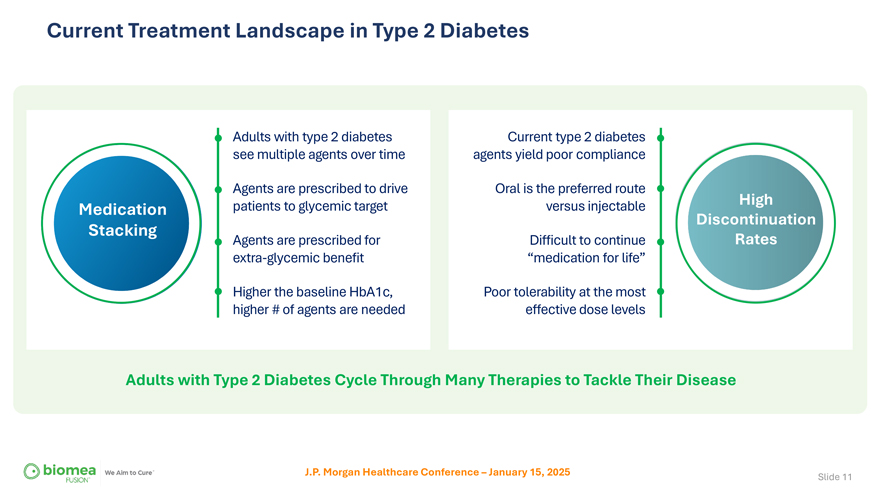
Current Treatment Landscape in Type 2 Diabetes Adults with type 2 diabetes see multiple agents over time Agents are prescribed to drive Medication patients to glycemic target Stacking Agents are prescribed for extra-glycemic benefit Higher the baseline HbA1c, higher # of agents are needed Current type 2 diabetes agents yield poor compliance Oral is the preferred route versus injectable High Discontinuation Difficult to continue Rates “medication for life” Poor tolerability at the most effective dose levels Adults with Type 2 Diabetes Cycle Through Many Therapies to Tackle Their Disease J.P. Morgan Healthcare Conference – January 15, 2025 Slide 11
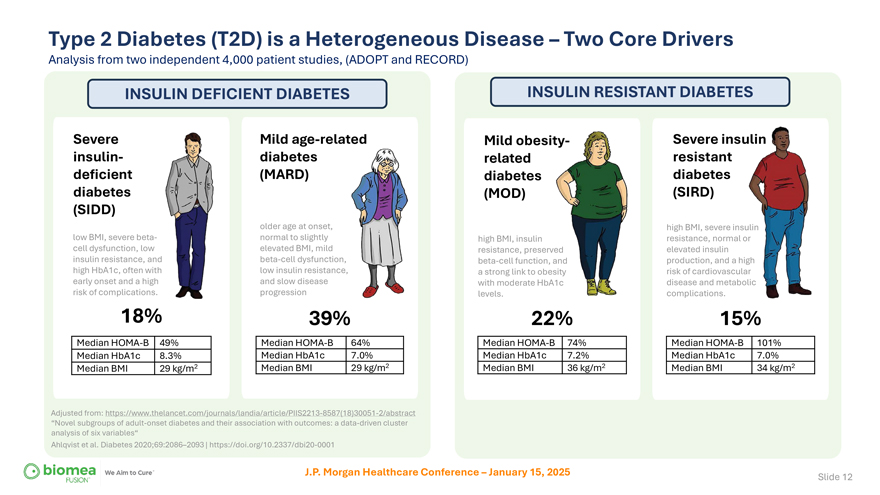
Type 2 Diabetes (T2D) is a Heterogeneous Disease – Two Core Drivers Analysis from two independent 4,000 patient studies, (ADOPT and RECORD) INSULIN DEFICIENT DIABETES Severe insulin-deficient diabetes (SIDD) low BMI, severe beta-cell dysfunction, low insulin resistance, and high HbA1c, often with early onset and a high risk of complications. 18% Median HOMA-B 49% Median HbA1c 8.3% Median BMI 29 kg/m2 Mild age-related diabetes (MARD) older age at onset, normal to slightly elevated BMI, mild beta-cell dysfunction, low insulin resistance, and slow disease progression 39% Median HOMA-B 64% Median HbA1c 7.0% Median BMI 29 kg/m2 Adjusted from: https://www.thelancet.com/journals/landia/article/PIIS2213-8587(18)30051-2/abstract “Novel subgroups of adult-onset diabetes and their association with outcomes: a data-driven cluster analysis of six variables“ Ahlqvist et al. Diabetes 2020;69:2086–2093 | https://doi.org/10.2337/dbi20-0001 INSULIN RESISTANT DIABETES Mild obesit related diabetes (MOD) high BMI, insulin resistance, preserved beta-cell function, and a strong link to obesity with moderate HbA1c levels. 22% Median HOMA-B 74% Median HbA1c 7.2% Median BMI 36 kg/m2 Severe insulin resistant diabetes (SIRD) high BMI, severe ins resistance, normal elevated insulin production, and a hi risk of cardiovascul disease and metab complications. 15% Median HOMA-B 101% Median HbA1c 7.0% Median BMI 34 kg/m2 J.P. Morgan Healthcare Conference – January 15, 2025 Slide 12
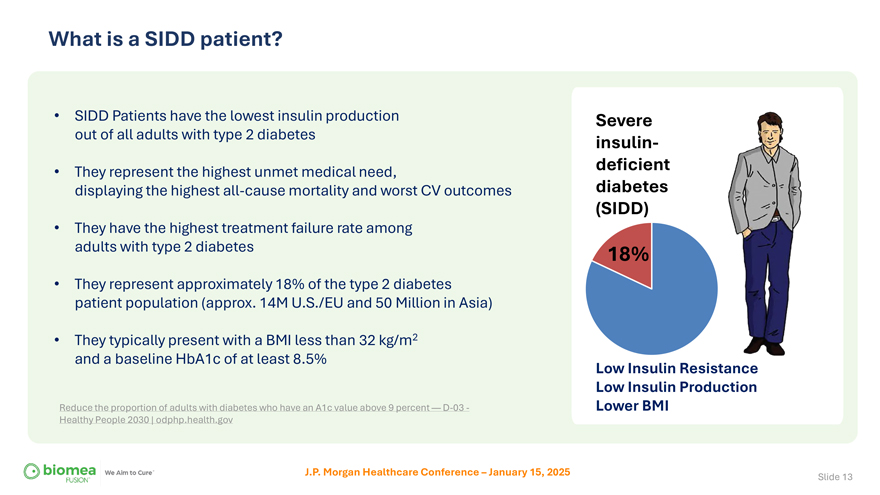
What is a SIDD patient? • SIDD Patients have the lowest insulin production out of all adults with type 2 diabetes • They represent the highest unmet medical need, displaying the highest all-cause mortality and worst CV outcomes • They have the highest treatment failure rate among adults with type 2 diabetes • They represent approximately 18% of the type 2 diabetes patient population (approx. 14M U.S./EU and 50 Million in Asia) • They typically present with a BMI less than 32 kg/m2 and a baseline HbA1c of at least 8.5% Reduce the proportion of adults with diabetes who have an A1c value above 9 percent — D-03—Healthy People 2030 | odphp.health.gov Severe insulin-deficient diabetes (SIDD) 18% Low Insulin Resistance Low Insulin Production Lower BMI J.P. Morgan Healthcare Conference – January 15, 2025 Slide 13
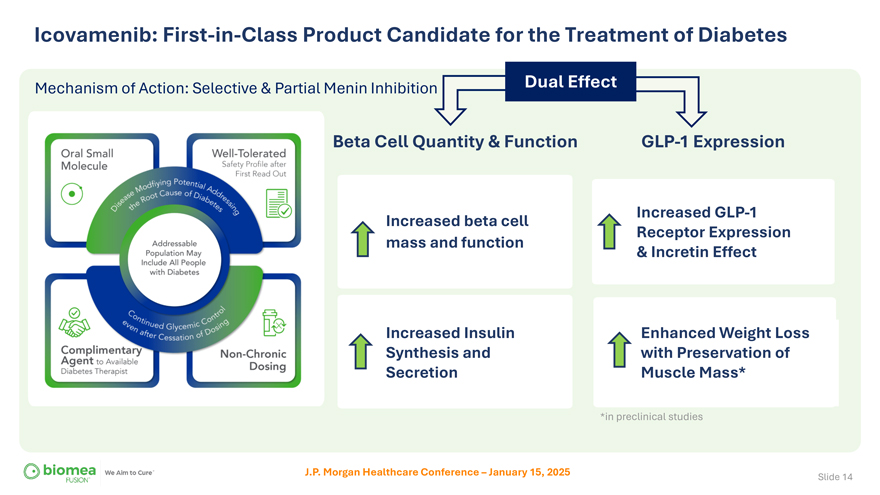
Icovamenib: First-in-Class Product Candidate for the Treatment of Diabetes Mechanism of Action: Selective & Partial Menin Inhibition Dual Effect Beta Cell Quantity & Function Increased beta cell mass and function Increased Insulin Synthesis and Secretion GLP-1 Expression Increased GLP-1 Receptor Expression & Incretin Effect Enhanced Weight Loss with Preservation of Muscle Mass* *in preclinical studies J.P. Morgan Healthcare Conference – January 15, 2025 Slide 14
COVALENT-111 Phase 2a Double-Blinded, Randomized Placebo Controlled Study in Type 2 Diabetes
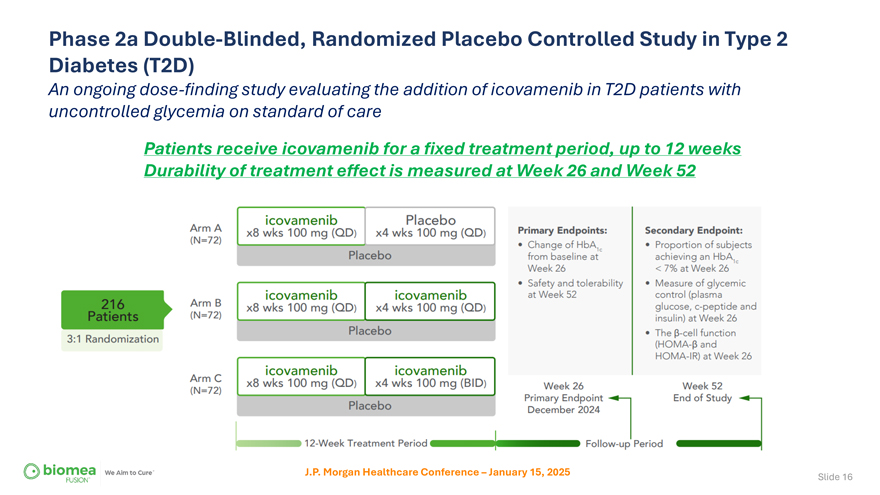
Phase 2a Double-Blinded, Randomized Placebo Controlled Study in Type 2 Diabetes (T2D) An ongoing dose-finding study evaluating the addition of icovamenib in T2D patients with uncontrolled glycemia on standard of care Patients receive icovamenib for a fixed treatment period, up to 12 weeks Durability of treatment effect is measured at Week 26 and Week 52 J.P. Morgan Healthcare Conference – January 15, 2025 Slide 16
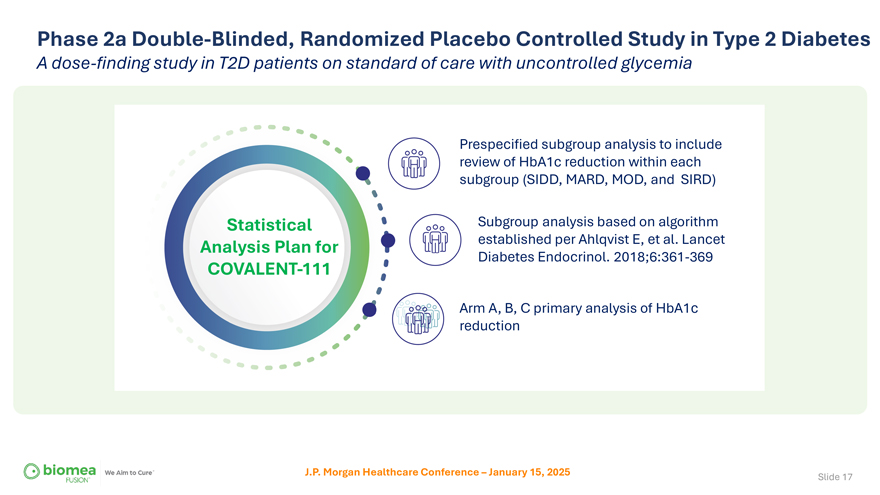
Phase 2a Double-Blinded, Randomized Placebo Controlled Study in Type 2 Diabetes A dose-finding study in T2D patients on standard of care with uncontrolled glycemia Prespecified subgroup analysis to include review of HbA1c reduction within each subgroup (SIDD, MARD, MOD, and SIRD) Statistical Subgroup analysis based on algorithm Analysis Plan for established per Ahlqvist E, et al. Lancet Diabetes Endocrinol. 2018;6:361-369 COVALENT-111 Arm A, B, C primary analysis of HbA1c reduction J.P. Morgan Healthcare Conference – January 15, 2025 Slide 17
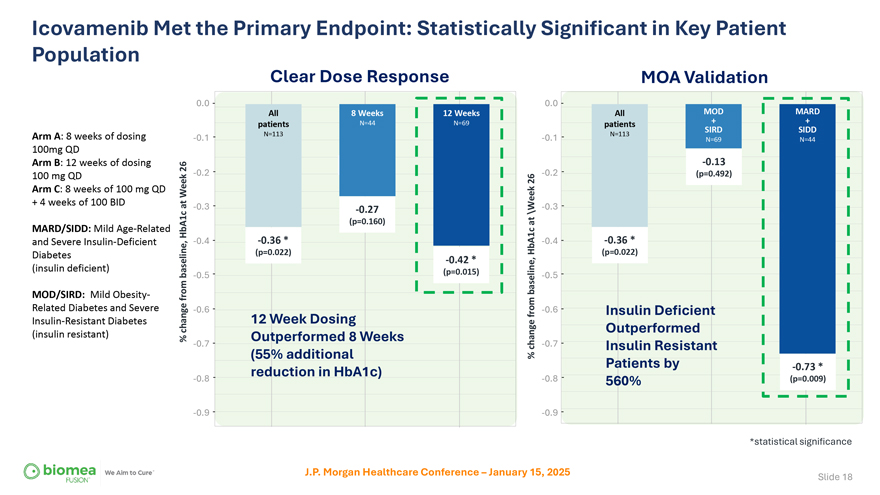
Icovamenib Met the Primary Endpoint: Statistically Significant in Key Patient Population Arm A: 8 weeks of dosing 100mg QD Arm B: 12 weeks of dosing 100 mg QD Arm C: 8 weeks of 100 mg QD + 4 weeks of 100 BID MARD/SIDD: Mild Age-Related and Severe Insulin-Deficient Diabetes (insulin deficient) MOD/SIRD: Mild Obesity-Related Diabetes and Severe Insulin-Resistant Diabetes (insulin resistant) Clear Dose Response MOA Validation 0.0 0.0 All 8 Weeks 12 Weeks All MOD + MARD + patients N=44 N=69 patients N=113 N=113 SIRD SIDD -0.1 -0.1 N=69 N=44 -0.13 26 -0.2 -0.2 (p=0.492) Week26 at -0.3 -0.3 -0.27 \Week (p=0.160) at HbA1c -0.4 -0.36 * HbA1c -0.4 -0.36 * (p=0.022) (p=0.022) -0.42 * baseline, -0.5 (p=0.015) -0.5 baseline, from -0.6 from -0.6 Insulin Deficient change 12 Week Dosing Outperformed % Outperformed 8 Weeks -0.7 change -0.7 Insulin Resistant (55% additional % Patients by -0.73 * reduction in HbA1c) -0.8 -0.8 560% (p=0.009) -0.9 -0.9 *statistical significance J.P. Morgan Healthcare Conference – January 15, 2025 Slide 18
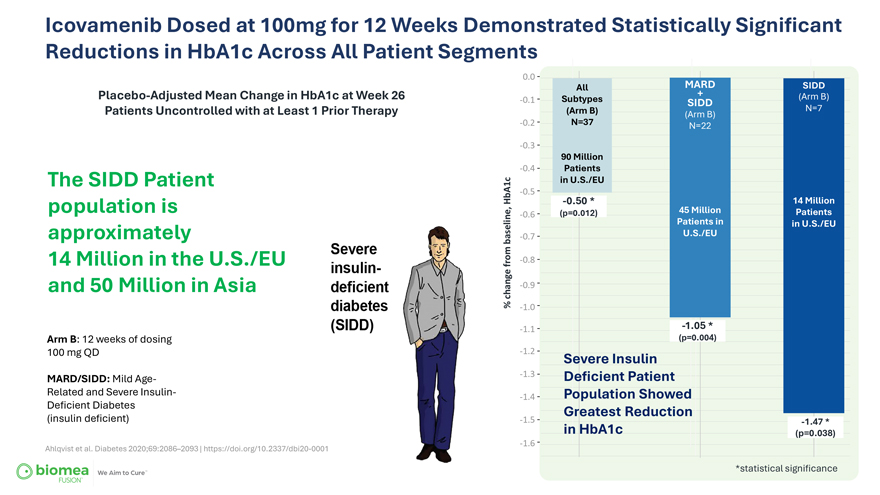
Icovamenib Dosed at 100mg for 12 Weeks Demonstrated Statistically Significant Reductions in HbA1c Across All Patient Segments Placebo-Adjusted Mean Change in HbA1c at Week 26 Patients Uncontrolled with at Least 1 Prior Therapy The SIDD Patient population is approximately 14 Million in the U.S./EU and 50 Million in Asia Arm B: 12 weeks of dosing 100 mg QD MARD/SIDD: Mild Age-Related and Severe Insulin-Deficient Diabetes (insulin deficient) Ahlqvist et al. Diabetes 2020;69:2086–2093 | https://doi.org/10.2337/dbi20-0001 0.0 All MARD SIDD + (Arm B) -0.1 Subtypes SIDD (Arm B) N=7 (Arm B) -0.2 N=37 N=22 -0.3 90 Million -0.4 Patients in U.S./EU -0.5 HbA1c -0.50 * 14 Million (p=0.012) 45 Million Patients -0.6 Patients in in U.S./EU baseline, -0.7 U.S./EU from -0.8 change -0.9 % -1.0 -1.1 -1.05 * (p=0.004) -1.2 Severe Insulin -1.3 Deficient Patient -1.4 Population Showed Greatest Reduction -1.5 -1.47 * in HbA1c (p=0.038) -1.6 *statistical significance Slide 19
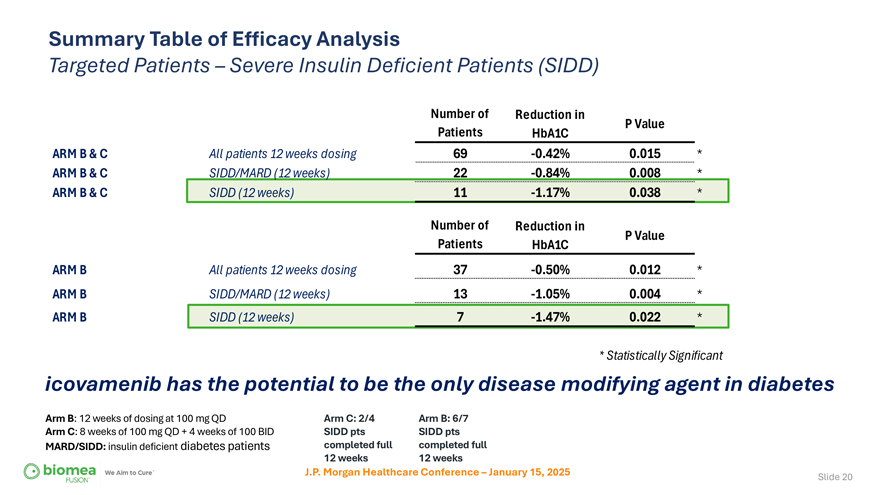
Summary Table of Efficacy Analysis Targeted Patients – Severe Insulin Deficient Patients (SIDD) Number of Reduction in P Value Patients HbA1C ARM B & C All patients 12 weeks dosing 69 -0.42% 0.015 * ARM B & C SIDD/MARD (12 weeks) 22 -0.84% 0.008 * ARM B & C SIDD (12 weeks) 11 -1.17% 0.038 * Number of Reduction in P Value Patients HbA1C ARM B All patients 12 weeks dosing 37 -0.50% 0.012 * ARM B SIDD/MARD (12 weeks) 13 -1.05% 0.004 * ARM B SIDD (12 weeks) 7 -1.47% 0.022 * * Statistically Significant icovamenib has the potential to be the only disease modifying agent in diabetes Arm B: 12 weeks of dosing at 100 mg QD Arm C: 2/4 Arm B: 6/7 Arm C: 8 weeks of 100 mg QD + 4 weeks of 100 BID SIDD pts SIDD pts MARD/SIDD: insulin deficient diabetes patients completed full completed full 12 weeks 12 weeks J.P. Morgan Healthcare Conference – January 15, 2025 Slide 20
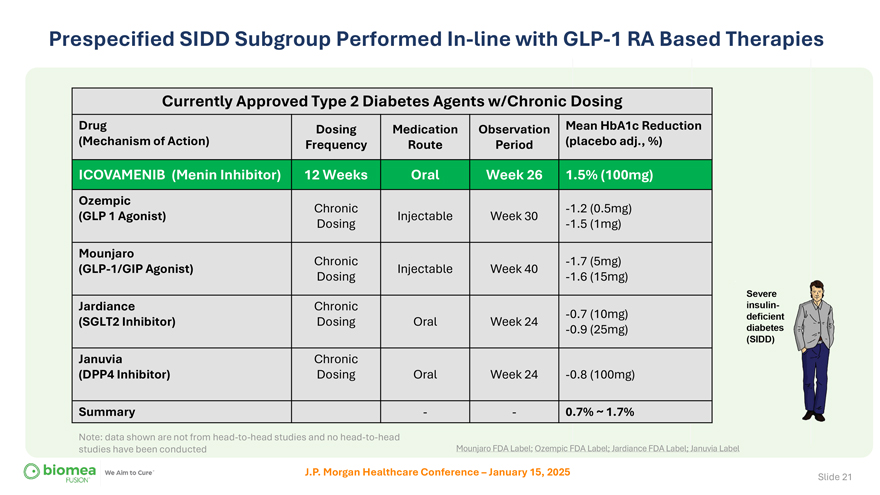
Prespecified SIDD Subgroup Performed In-line with GLP-1 RA Based Therapies Currently Approved Type 2 Diabetes Agents w/Chronic Dosing Drug Dosing Medication Observation Mean HbA1c Reduction (Mechanism of Action) Frequency Route Period (placebo adj., %) ICOVAMENIB (Menin Inhibitor) 12 Weeks Oral Week 26 1.5% (100mg) Ozempic Chronic -1.2 (0.5mg) (GLP 1 Agonist) Injectable Week 30 Dosing -1.5 (1mg) Mounjaro Chronic -1.7 (5mg) (GLP-1/GIP Agonist) Injectable Week 40 Dosing -1.6 (15mg) Jardiance Chronic -0.7 (10mg) (SGLT2 Inhibitor) Dosing Oral Week 24 -0.9 (25mg) Januvia Chronic (DPP4 Inhibitor) Dosing Oral Week 24 -0.8 (100mg) Summary — 0.7% ~ 1.7% Note: data shown are not from head-to-head studies and no head-to-head studies have been conducted Mounjaro FDA Label; Ozempic FDA Label; Jardiance FDA Label; Januvia Label J.P. Morgan Healthcare Conference – January 15, 2025 Slide 21
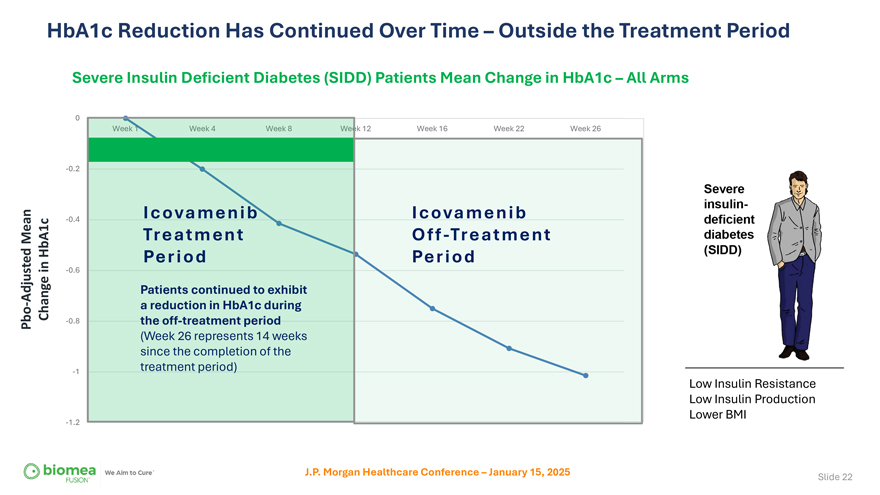
HbA1c Reduction Has Continued Over Time – Outside the Treatment Period Severe Insulin Deficient Diabetes (SIDD) Patients Mean Change in HbA1c – All Arms 0 k 12 Week 16 Week 22 Week 26 -0.2 -0.4 Icovamenib Icovamenib Mean Treatment Off-Treatment HbA1c in Period Period -0.6 Adjusted Patients continued to exhibit—Change a reduction in HbA1c during Pbo -0.8 the off-treatment period (Week 26 represents 14 weeks since the completion of the -1 treatment period) Low Insulin Resistance Low Insulin Production Lower BMI -1.2 J.P. Morgan Healthcare Conference – January 15, 2025 Slide 22
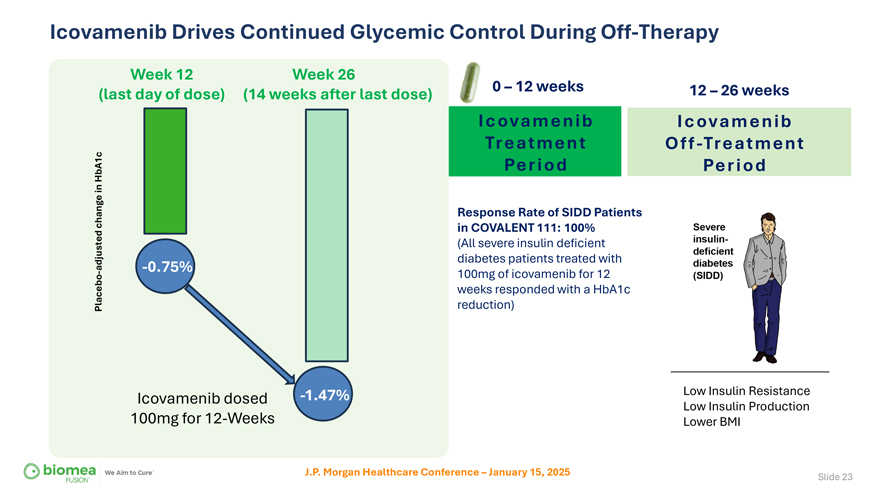
Icovamenib Drives Continued Glycemic Control During Off-Therapy Week 12 Week 26 (last day of dose) (14 weeks after last dose) 0 – 12 weeks 12 – 26 weeks Icovamenib Icovamenib Treatment Off-Treatment HbA1c Period Period in change Response Rate of SIDD Patients in COVALENT 111: 100% (All severe insulin deficient adjusted -0.75% diabetes patients treated with—100mg of icovamenib for 12 weeks responded with a HbA1c Placebo reduction) Icovamenib dosed -1.47% Low Insulin Resistance Low Insulin Production 100mg for 12-Weeks Lower BMI J.P. Morgan Healthcare Conference – January 15, 2025 Slide 23
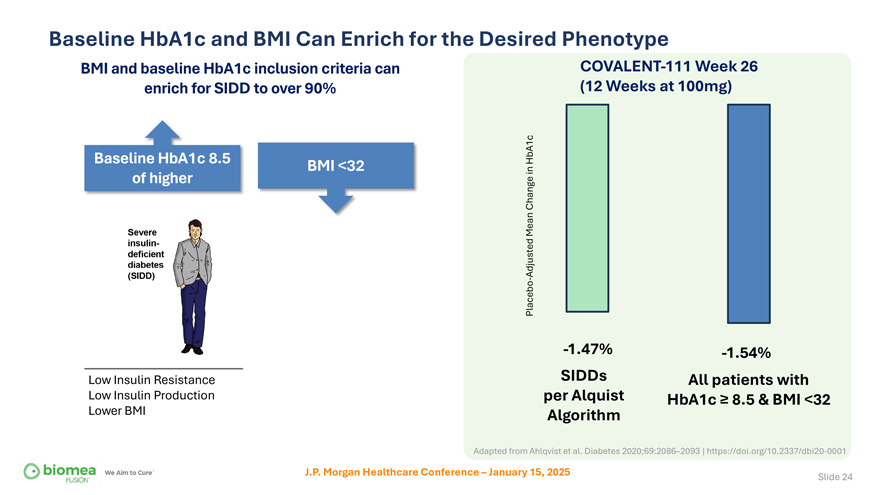
Baseline HbA1c and BMI Can Enrich for the Desired Phenotype BMI and baseline HbA1c inclusion criteria can COVALENT-111 Week 26 enrich for SIDD to over 90% (12 Weeks at 100mg) Baseline HbA1c 8.5 HbA1c BMI <32 in of higher Change Mean Adjusted Placebo—-1.47% -1.54% Low Insulin Resistance SIDDs All patients with Low Insulin Production per Alquist HbA1c ≥ 8.5 & BMI <32 Lower BMI Algorithm Adapted from Ahlqvist et al. Diabetes 2020;69:2086–2093 | https://doi.org/10.2337/dbi20-0001 J.P. Morgan Healthcare Conference – January 15, 2025 Slide 24

icovamenib in combination with GLP-1 based therapies
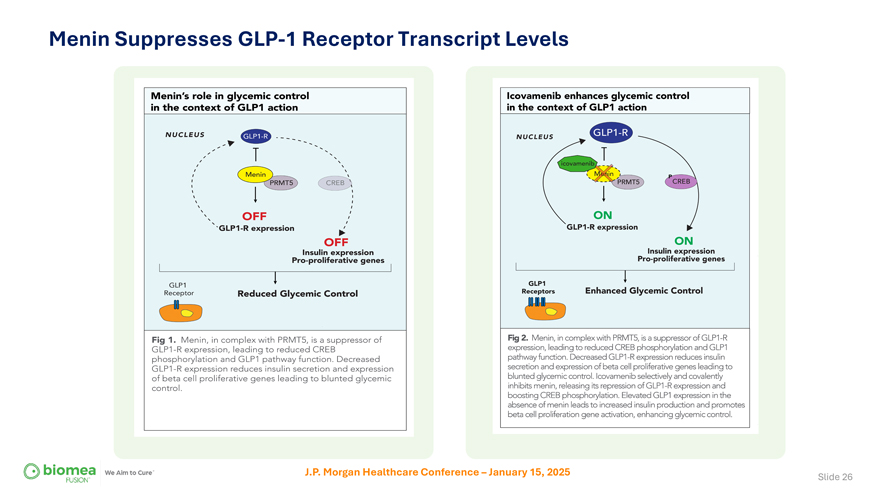
Menin Suppresses GLP-1 Receptor Transcript Levels J.P. Morgan Healthcare Conference – January 15, 2025 Slide 26
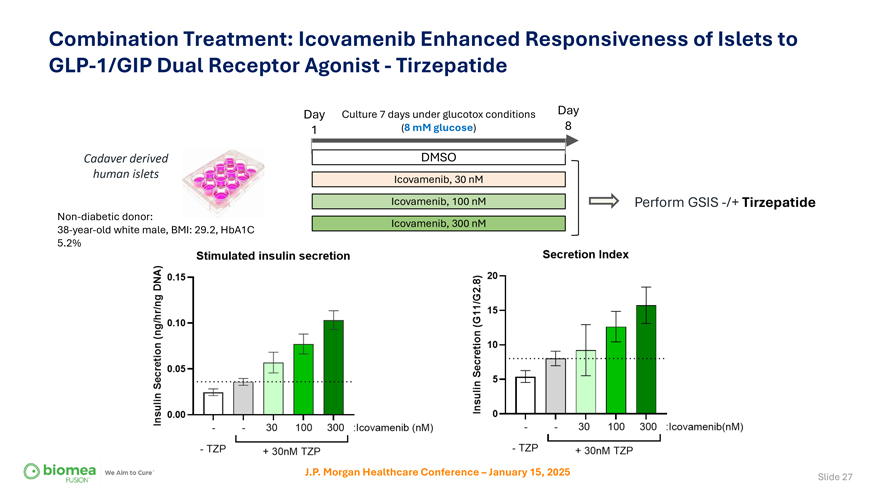
Combination Treatment: Icovamenib Enhanced Responsiveness of Islets to GLP-1/GIP Dual Receptor Agonist—Tirzepatide Day Culture 7 days under glucotox conditions Day 1 (8 mM glucose) 8 Cadaver derived DMSO human islets Icovamenib, 30 nM Icovamenib, 100 nM Perform GSIS -/+ Tirzepatide Non-diabetic donor: Icovamenib, 300 nM 38-year-old white male, BMI: 29.2, HbA1C 5.2% J.P. Morgan Healthcare Conference – January 15, 2025 Slide 27
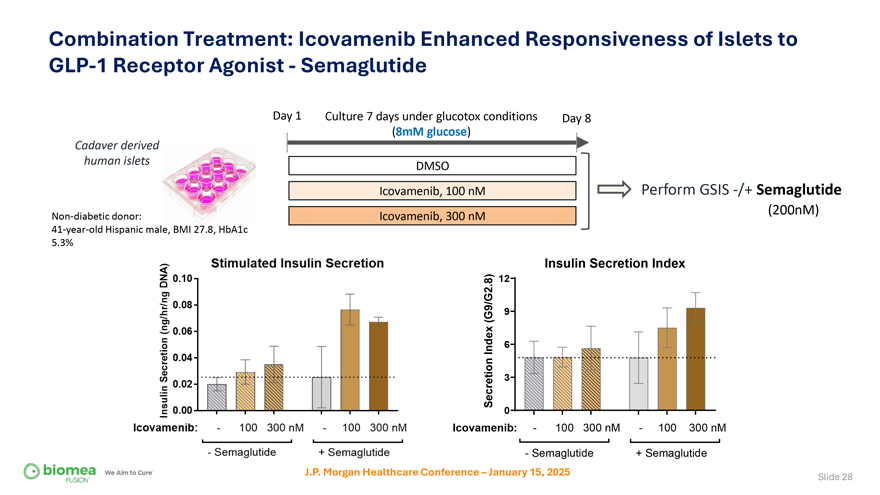
Combination Treatment: Icovamenib Enhanced Responsiveness of Islets to GLP-1 Receptor Agonist—Semaglutide Day 1 Culture 7 days under glucotox conditions Day 8 Cadaver derived (8mM glucose) human islets DMSO Icovamenib, 100 nM Perform GSIS -/+ Semaglutide Non-diabetic donor: Icovamenib, 300 nM (200nM) 41-year-old Hispanic male, BMI 27.8, HbA1c 5.3% Insulin Secretion Index 8) 12 . (G9/G2 9 Index 6 Secretion 3 0 Icovamenib:—100 300 nM—100 300 nM—Semaglutide + Semaglutide J.P. Morgan Healthcare Conference – January 15, 2025 Slide 28
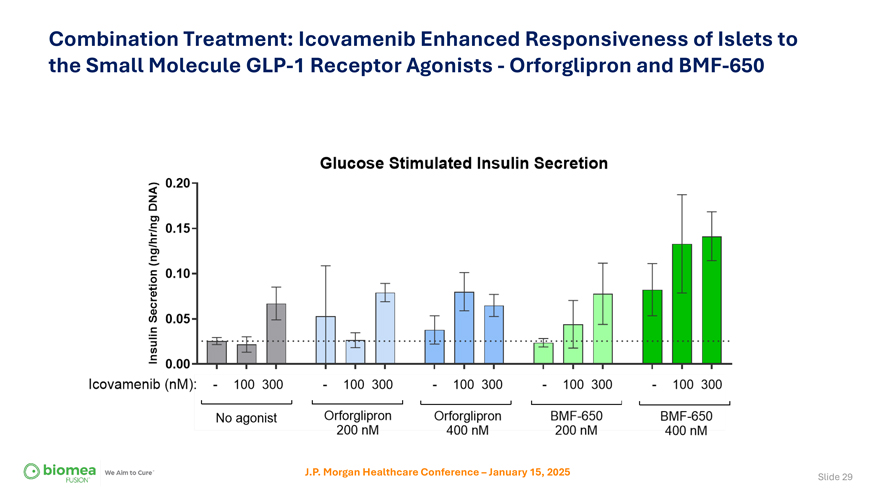
Combination Treatment: Icovamenib Enhanced Responsiveness of Islets to the Small Molecule GLP-1 Receptor Agonists—Orforglipron and BMF-650 J.P. Morgan Healthcare Conference – January 15, 2025 Slide 29
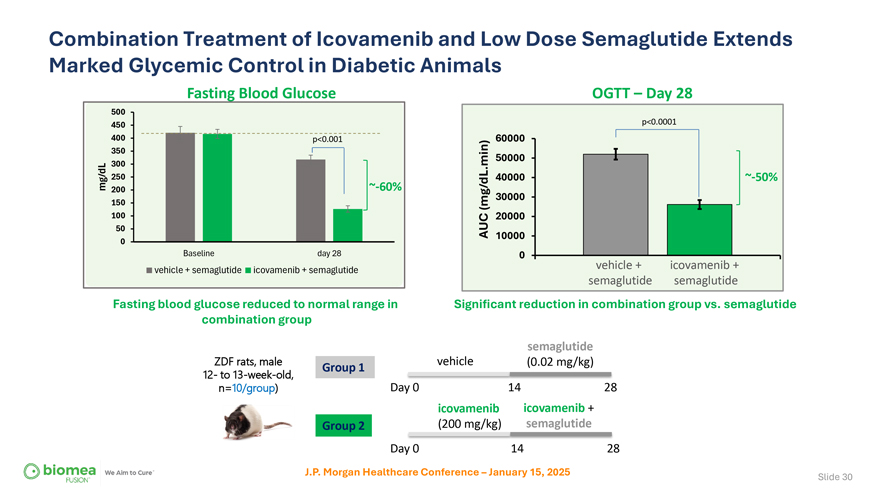
Combination Treatment of Icovamenib and Low Dose Semaglutide Extends Marked Glycemic Control in Diabetic Animals Fasting Blood Glucose OGTT – Day 28 500 450 p<0.0001 400 p<0.001 60000 350 min) 50000 300 . 250 40000 ~-50% mg/dL 200 ~-60% 30000 150 (mg/dL 100 20000 50 AUC 10000 0 Baseline day 28 0 vehicle + icovamenib + vehicle + semaglutide icovamenib + semaglutide semaglutide semaglutide Fasting blood glucose reduced to normal range in Significant reduction in combination group vs. semaglutide combination group semaglutide ZDF rats, male Group 1 vehicle (0.02 mg/kg) 12- to 13-week-old, Day 0 14 28 n=10/group) icovamenib icovamenib + Group 2 (200 mg/kg) semaglutide Day 0 14 28 J.P. Morgan Healthcare Conference – January 15, 2025 Slide 30
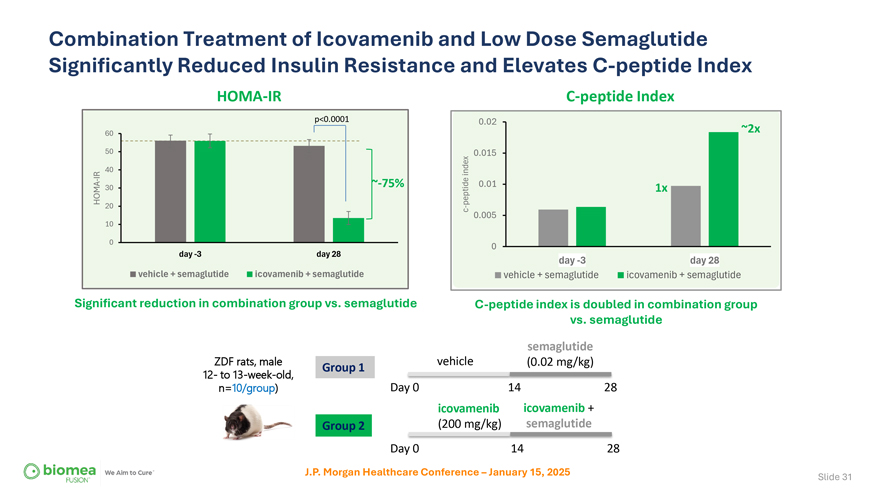
Combination Treatment of Icovamenib and Low Dose Semaglutide Significantly Reduced Insulin Resistance and Elevates C-peptide Index HOMA-IR C-peptide Index p<0.0001 0.02 60 ~2x 50 0.015 40 index IR—~-75% 0.01 HOMA 30 peptide 1x 20 c—0.005 10 0 0 day -3 day 28 day -3 day 28 vehicle + semaglutide icovamenib + semaglutide vehicle + semaglutide icovamenib + semaglutide Significant reduction in combination group vs. semaglutide C-peptide index is doubled in combination group vs. semaglutide semaglutide ZDF rats, male Group 1 vehicle (0.02 mg/kg) 12- to 13-week-old, Day 0 14 28 n=10/group) icovamenib icovamenib + Group 2 (200 mg/kg) semaglutide Day 0 14 28 J.P. Morgan Healthcare Conference – January 15, 2025 Slide 31
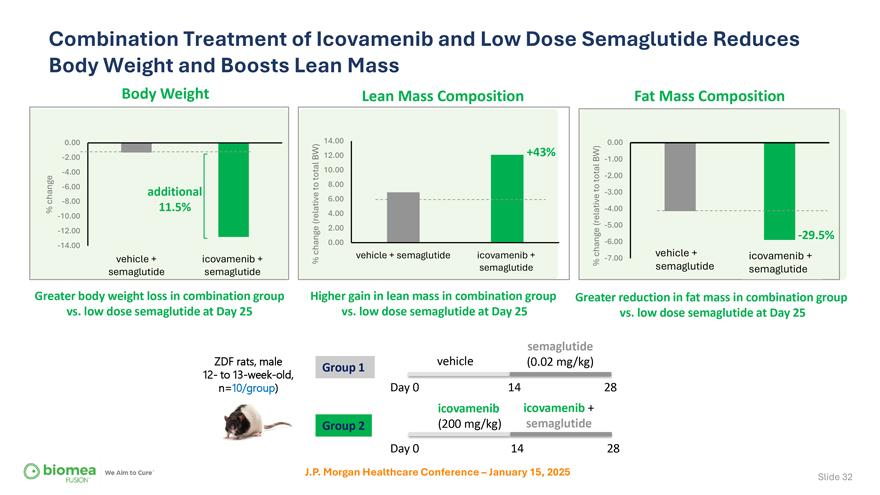
Combination Treatment of Icovamenib and Low Dose Semaglutide Reduces Body Weight and Boosts Lean Mass Body Weight Lean Mass Composition Fat Mass Composition 0.00 14.00 0.00 -2.00 BW) 12.00 +43% BW) -1.00 -4.00 10.00 total total -2.00 -6.00to 8.00 additional to -3.00 change -8.00 6.00 % 11.5% -4.00 -10.00 (relative 4.00 (relative 2.00 -5.00 -12.00 -29.5% -14.00 change 0.00 -6.00 vehicle + semaglutide icovamenib + change vehicle + icovamenib + vehicle + icovamenib + % -7.00 semaglutide % semaglutide semaglutide semaglutide semaglutide Greater body weight loss in combination group Higher gain in lean mass in combination group Greater reduction in fat mass in combination group vs. low dose semaglutide at Day 25 vs. low dose semaglutide at Day 25 vs. low dose semaglutide at Day 25 semaglutide ZDF rats, male Group 1 vehicle (0.02 mg/kg) 12- to 13-week-old, Day 0 14 28 n=10/group) icovamenib icovamenib + Group 2 (200 mg/kg) semaglutide Day 0 14 28 J.P. Morgan Healthcare Conference – January 15, 2025 Slide 32
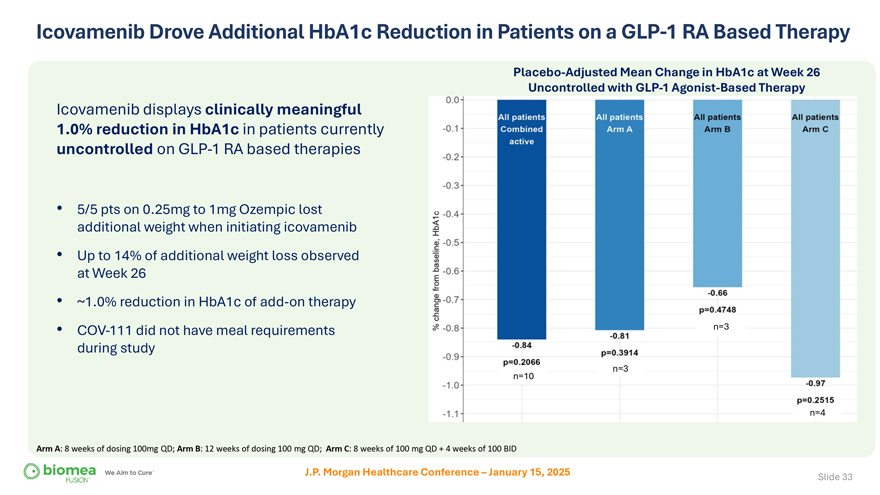
Icovamenib Drove Additional HbA1c Reduction in Patients on a GLP-1 RA Based Therapy Placebo-Adjusted Mean Change in HbA1c at Week 26 Uncontrolled with GLP-1 Agonist-Based Therapy Icovamenib displays clinically meaningful 1.0% reduction in HbA1c in patients currently uncontrolled on GLP-1 RA based therapies • 5/5 pts on 0.25mg to 1mg Ozempic lost additional weight when initiating icovamenib • Up to 14% of additional weight loss observed at Week 26 • ~1.0% reduction in HbA1c of add-on therapy • COV-111 did not have meal requirements n=3 during study n=3 n=10 n=4 Arm A: 8 weeks of dosing 100mg QD; Arm B: 12 weeks of dosing 100 mg QD; Arm C: 8 weeks of 100 mg QD + 4 weeks of 100 BID J.P. Morgan Healthcare Conference – January 15, 2025 Slide 33
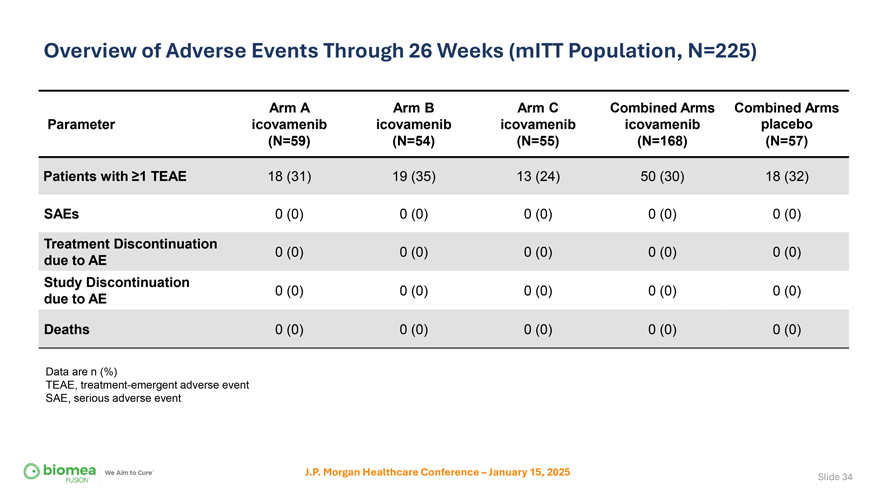
Overview of Adverse Events Through 26 Weeks (mITT Population, N=225) Arm A Arm B Arm C Combined Arms Combined Arms Parameter icovamenib icovamenib icovamenib icovamenib placebo (N=59) (N=54) (N=55) (N=168) (N=57) Patients with ≥1 TEAE 18 (31) 19 (35) 13 (24) 50 (30) 18 (32) SAEs 0 (0) 0 (0) 0 (0) 0 (0) 0 (0) Treatment Discontinuation 0 (0) 0 (0) 0 (0) 0 (0) 0 (0) due to AE Study Discontinuation 0 (0) 0 (0) 0 (0) 0 (0) 0 (0) due to AE Deaths 0 (0) 0 (0) 0 (0) 0 (0) 0 (0) Data are n (%) TEAE, treatment-emergent adverse event SAE, serious adverse event J.P. Morgan Healthcare Conference – January 15, 2025 Slide 34
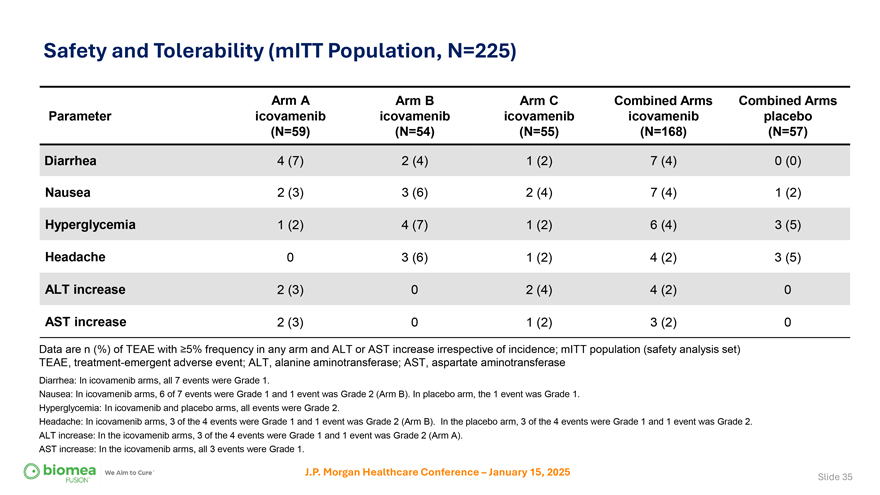
Safety and Tolerability (mITT Population, N=225) Arm A Arm B Arm C Combined Arms Combined Arms Parameter icovamenib icovamenib icovamenib icovamenib placebo (N=59) (N=54) (N=55) (N=168) (N=57) Diarrhea 4 (7) 2 (4) 1 (2) 7 (4) 0 (0) Nausea 2 (3) 3 (6) 2 (4) 7 (4) 1 (2) Hyperglycemia 1 (2) 4 (7) 1 (2) 6 (4) 3 (5) Headache 0 3 (6) 1 (2) 4 (2) 3 (5) ALT increase 2 (3) 0 2 (4) 4 (2) 0 AST increase 2 (3) 0 1 (2) 3 (2) 0 Data are n (%) of TEAE with ≥5% frequency in any arm and ALT or AST increase irrespective of incidence; mITT population (safety analysis set) TEAE, treatment-emergent adverse event; ALT, alanine aminotransferase; AST, aspartate aminotransferase Diarrhea: In icovamenib arms, all 7 events were Grade 1. Nausea: In icovamenib arms, 6 of 7 events were Grade 1 and 1 event was Grade 2 (Arm B). In placebo arm, the 1 event was Grade 1. Hyperglycemia: In icovamenib and placebo arms, all events were Grade 2. Headache: In icovamenib arms, 3 of the 4 events were Grade 1 and 1 event was Grade 2 (Arm B). In the placebo arm, 3 of the 4 events were Grade 1 and 1 event was Grade 2. ALT increase: In the icovamenib arms, 3 of the 4 events were Grade 1 and 1 event was Grade 2 (Arm A). AST increase: In the icovamenib arms, all 3 events were Grade 1. J.P. Morgan Healthcare Conference – January 15, 2025 Slide 35
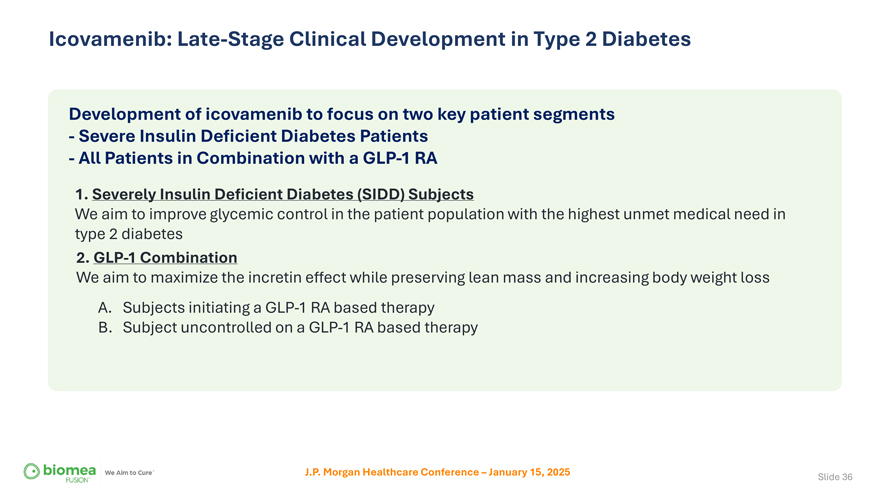
Icovamenib: Late-Stage Clinical Development in Type 2 Diabetes Development of icovamenib to focus on two key patient segments—Severe Insulin Deficient Diabetes Patients—All Patients in Combination with a GLP-1 RA 1. Severely Insulin Deficient Diabetes (SIDD) Subjects We aim to improve glycemic control in the patient population with the highest unmet medical need in type 2 diabetes 2. GLP-1 Combination We aim to maximize the incretin effect while preserving lean mass and increasing body weight loss A. Subjects initiating a GLP-1 RA based therapy B. Subject uncontrolled on a GLP-1 RA based therapy J.P. Morgan Healthcare Conference – January 15, 2025 Slide 36
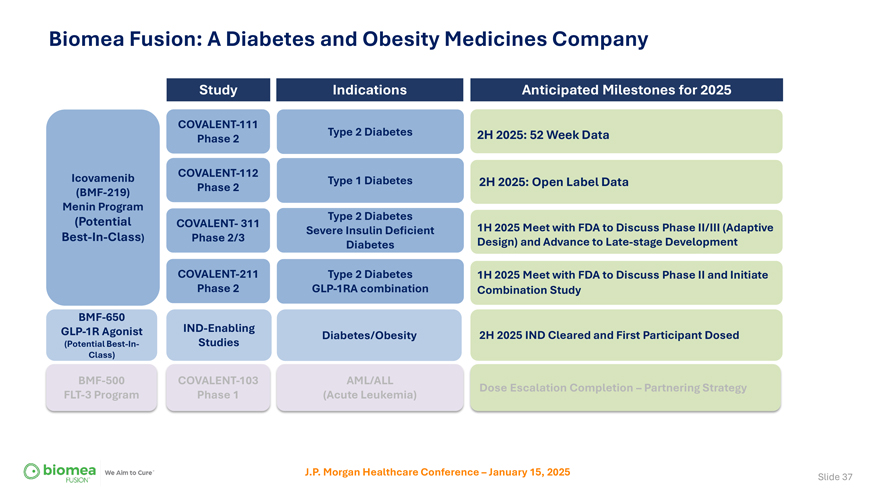
Biomea Fusion: A Diabetes and Obesity Medicines Company Study Indications Anticipated Milestones for 2025 COVALENT-111 Type 2 Diabetes 2H 2025: 52 Week Data Phase 2 Icovamenib COVALENT-112 Type 1 Diabetes 2H 2025: Open Label Data (BMF-219) Phase 2 Menin Program (Potential Type 2 Diabetes COVALENT- 311 1H 2025 Meet with FDA to Discuss Phase II/III (Adaptive Severe Insulin Deficient Best-In-Class) Phase 2/3 Design) and Advance to Late-stage Development Diabetes COVALENT-211 Type 2 Diabetes 1H 2025 Meet with FDA to Discuss Phase II and Initiate Phase 2 GLP-1RA combination Combination Study BMF-650 GLP-1R Agonist IND-Enabling Diabetes/Obesity 2H 2025 IND Cleared and First Participant Dosed (Potential Best-In- Studies Class) BMF-500 COVALENT-103 AML/ALL Dose Escalation Completion – Partnering Strategy FLT-3 Program Phase 1 (Acute Leukemia) J.P. Morgan Healthcare Conference – January 15, 2025 Slide 37
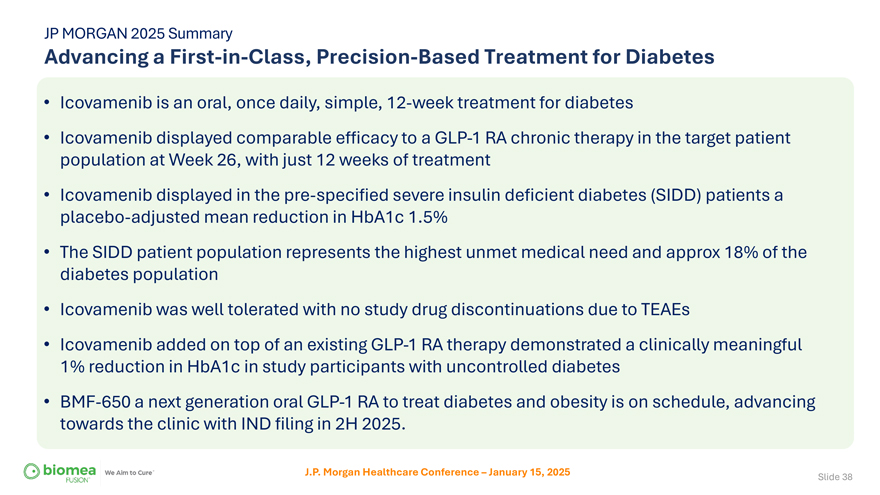
JP MORGAN 2025 Summary Advancing a First-in-Class, Precision-Based Treatment for Diabetes • Icovamenib is an oral, once daily, simple, 12-week treatment for diabetes • Icovamenib displayed comparable efficacy to a GLP-1 RA chronic therapy in the target patient population at Week 26, with just 12 weeks of treatment • Icovamenib displayed in the pre-specified severe insulin deficient diabetes (SIDD) patients a placebo-adjusted mean reduction in HbA1c 1.5% • The SIDD patient population represents the highest unmet medical need and approx 18% of the diabetes population • Icovamenib was well tolerated with no study drug discontinuations due to TEAEs • Icovamenib added on top of an existing GLP-1 RA therapy demonstrated a clinically meaningful 1% reduction in HbA1c in study participants with uncontrolled diabetes • BMF-650 a next generation oral GLP-1 RA to treat diabetes and obesity is on schedule, advancing towards the clinic with IND filing in 2H 2025. J.P. Morgan Healthcare Conference – January 15, 2025 Slide 38
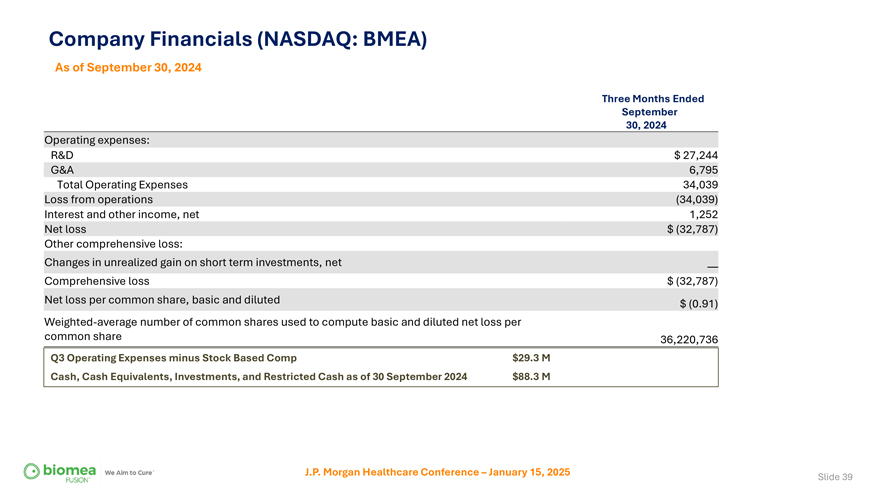
Company Financials (NASDAQ: BMEA) As of September 30, 2024 Three Months Ended September 30, 2024 Operating expenses: R&D $ 27,244 G&A 6,795 Total Operating Expenses 34,039 Loss from operations (34,039) Interest and other income, net 1,252 Net loss $ (32,787) Other comprehensive loss: Changes in unrealized gain on short term investments, net —Comprehensive loss $ (32,787) Net loss per common share, basic and diluted $ (0.91) Weighted-average number of common shares used to compute basic and diluted net loss per common share 36,220,736 Q3 Operating Expenses minus Stock Based Comp $29.3 M Cash, Cash Equivalents, Investments, and Restricted Cash as of 30 September 2024 $88.3 M J.P. Morgan Healthcare Conference – January 15, 2025 Slide 39