Exhibit 99.2
Dear Shareholder,
We delivered solid financial performance in Q4 - we came in the middle of our guidance on all metrics, while Non-GAAP Net Income was slightly ahead. For the full year 2022 we achieved $569.6M of ex-TAC, $156.7M of Adjusted EBITDA and positive Free Cash Flow.
| 2022 was a challenging year, but also a year of significant accomplishments. I am very proud of our team at Taboola and the way we were able to manage through the macro environment, keep our heads down and execute. 2022 was the second best year we have had for signing new publisher partnerships, with over 90% higher new revenue per month than 2020 and 2021; we won a lot. Great new publisher partners joined us, such as Buzzfeed Japan, HuffPo, Prisa, Grupo Godó, Network18, United Internet Media, Dumont and Gendai. We won back publishers that had previously left us, such as Slate, Kicker, Ouest and more. We signed key renewals: CBSi,Tegna, Fox Sports and BuzzFeed Brazil. | | 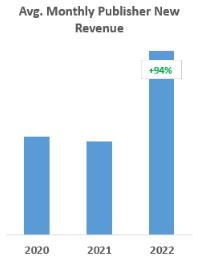 |
As part of our “Taboola Anywhere” strategy, 2022 was a year when Taboola News, our version of “Apple News” but for Android devices, exceeded $50M in annual revenue. As part of our “Taboola Anything” strategy, eCommerce gained meaningful momentum with Dynamic Creative Optimization (DCO) rolling out, and the recent announcement of TIME launching our new Taboola Turnkey Commerce solution. More on eCommerce below.
We finished the year with a transformative 30-year partnership - Yahoo. This includes Yahoo advertisers buying Taboola network, building new contextual segments, and powering native advertising exclusively for nearly 900M users a month. BIG.
2023 is assumed to be pre Yahoo rollout, while 2024 will have partial Yahoo contribution and meaningful gains. In 2023, we are guiding to 6% lower ex-TAC compared to 2022, Adjusted EBITDA of $70M and positive Free Cash Flow. There are 4 reasons for weaker year over year results:
| - | Entering 2023 with lower jumping-off point, $50M less ex-TAC than 2022 due to softer H2 2022. We expect to return to year-over-year growth in Q3 and Q4 as we lap the tough first half comparables from 2022. |
| - | Investing in successful Yahoo transition, ~$30M this year (people, servers, infrastructures). |
| - | Investing in performance advertising, eCommerce, and header bidding. We believe these 3 growth investments will help us double and triple Taboola revenue when Yahoo launches. |
| - | Winning market share - over time, we can see net pre-payments to publishers being insignificant to none as we become even more strategic. This year we budget ~$15M for it. |
While it’s hard to accept declines this year, it’s very rare that management teams know what the future will look like and are willing to guide for it. 2024 will be a step change in revenue with Yahoo ramping. While we are not fully guiding for 2024 -- we expect to generate at least $200M in Adjusted EBITDA, and at least $100M in Free Cash Flow in 2024. I would also note that 2024 will still be a partial year of Yahoo.
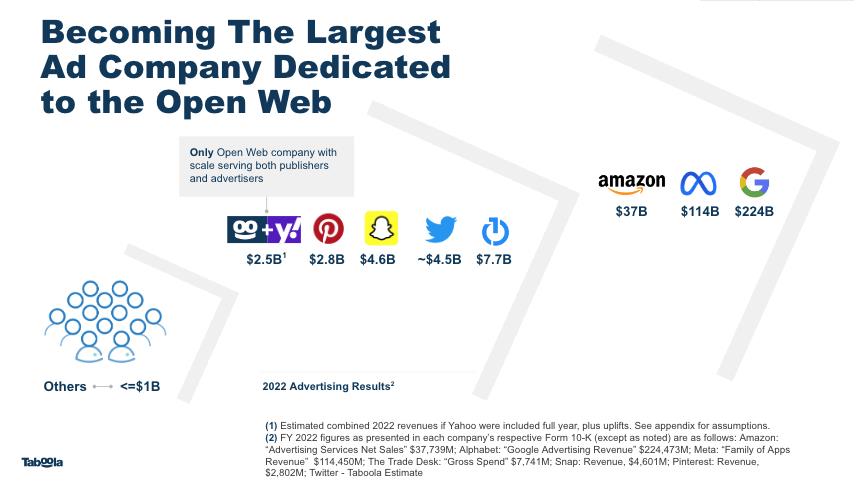
Taking a step back, especially with Google and Meta now being less than 50% of the ad market, and privacy concerns on the rise, advertisers will be looking for contextual advertising partners with scale. With the Yahoo partnership, we are one step further towards our long-term goal of becoming the largest open web advertising company in the world by revenue. We estimate we would have had 2022 revenue of ~$2.5 billion if Yahoo had been on our network and we were fully integrated as of the beginning of the year. That would have put us side by side to companies like Twitter, Snap, Pinterest and TTD - with mainly Google, Meta and Amazon (much) bigger than us. And Taboola is the only company to my knowledge at our size that is dedicated to the open web, serving both publishers and advertisers like we are. The open web will have a “walled garden strong” company that is going after our estimated $70B TAM, and I believe we are making meaningful steps towards that vision.
eCommerce, Performance Advertising and Header Bidding
We spoke previously about our three primary focus areas for investment: performance advertising, eCommerce and header bidding. These are where we have the most to gain as a company to further drive growth in years to come. Let me briefly update on how we’re doing on each.
Our goal with our investments in performance advertising is to make Taboola the first and best choice for any performance advertisers that want to reach consumers in the open web. We are currently focusing our investments in four key areas. First, we are working on new bidding strategies that will help advertisers with different goals to be successful on our network. Previously, we had shared how SmartBid automates the bidding process for our advertising partners. Now we are working on enhancements to SmartBid that will allow advertisers to do things like set a target CPA and allow the algorithm complete latitude to even set the initial bid (rather than just adjust the bid across the network as SmartBid did previously) or to maximize conversions (even at the expense of CPA targets). Second, we are working on new ways of finding high intent nuggets for very specific audiences in our supply. Third, we are investing in new ways to help advertisers drive clicks and conversions, such as with new creative formats and enhanced landing pages. For instance, we are currently working on Generative Artificial Intelligence that will help advertisers write more creative and appealing headlines and even generate new images from scratch. (Come see a demo of this amazing new generative AI technology at our Yahoo Deal Information Session on March 1 - it is really cool stuff.) Fourth, we are investing in technologies that will be smarter about how we match ads with users and especially how we ensure that advertisers see results as quickly as possible. I just came back from a trip to Israel during which I spent time with our R&D teams working on this and I have to tell you - I was blown away about how passionate our 200 person tech team is, and about the future of the Taboola advertising platform. We have so much more that we can do.
We continue to see good progress with our investments in eCommerce as well. We previously shared that while still a small portion of the overall revenue, we are seeing “hockey stick” type of growth from our dynamic creative optimization (DCO) technology, which is a way for merchants to automatically place their product libraries on our network. It has allowed us to significantly grow the amount of eCommerce demand that shows up in our traditional Taboola placements, such as in the bottom of article feeds. We recently launched “eCommerce circulation widgets” to help drive users to commerce pages; it looks like the image on the right. | | |
| We also just announced an exciting new initiative in eCommerce that we call Taboola Turnkey Commerce. This was the missing link to take our eCommerce business to the next level. Every publisher that wants to get into eCommerce, but has little or no content attractive to retailers, can now do it with Taboola. Taboola does all of the work for the publishers, from using our data to know which content makes sense for us to write on behalf of the publisher, to driving traffic to it, and of course monetizing it with relationships with merchants and service providers. We are very excited to have announced our first two publisher partners for this initiative: TIME and Advance Publications (their NJ.com site). The financial services section on NJ.com, written by Taboola, looks like the image on the right. | | |
Last but not least, we are investing heavily in header bidding. This is important to our future because this is one of the ways that we will expand beyond our traditional bottom of article placements and continue to grow our share of open web, which we estimate to be a $70 billion advertising market and still dominated by display ads. Header bidding allows us to compete for this supply using our first party data, our unique demand from performance advertisers that bid on a cost-per-click basis, and our proprietary technology that is able to combine this data and demand to predict which ads are likely to perform well with a particular user in a particular context and from that, generate a profitable CPM-based bid. We launched this technology with our first partner, Microsoft, in April 2022 and we are generating hundreds of millions of dollars of revenue from that partnership. Since then, we have started beta testing the technology with an additional 50+ publisher partners and we are starting to see traction.
For the first time, we’re starting to see a few publishers generating a few millions of dollars a year from it on top of our core partnership, which increases our share of wallet, and our moat as we look to win new partnerships and expand existing relationships.
2023 Yahoo Integration Planning
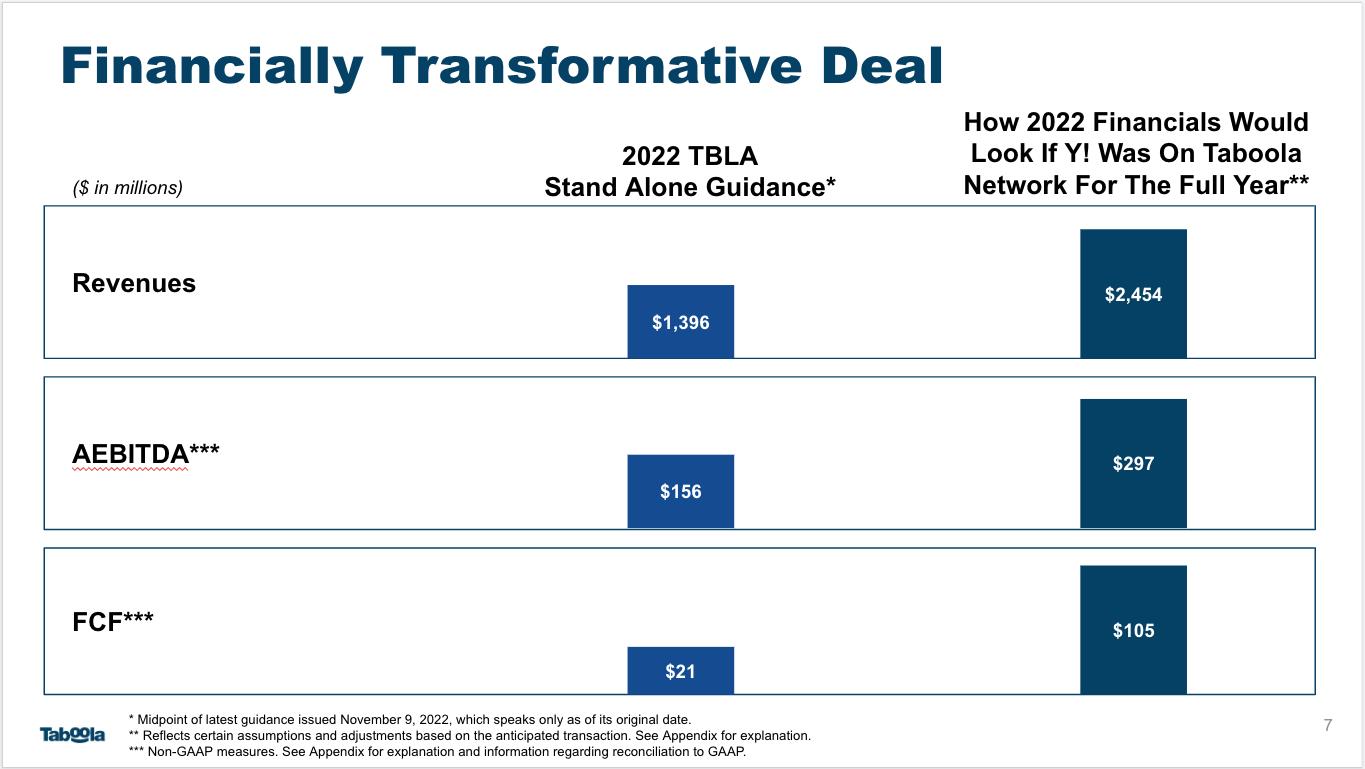
2023 will be a year of investment in our newly signed 30-year agreement to be the exclusive native advertising partner for Yahoo. We are very excited about this new partnership, as it will be financially transformative for our company. As we discussed at the time we announced the deal, if our integration with Yahoo had been completed before the start of 2022, we believe this deal would have generated approximately an incremental $1 billion of revenue, almost doubled our Adjusted EBITDA and would have increased Free Cash Flow by 5x.
Having said that, 2023 will require significant investment to integrate Yahoo and transition the revenue. We expect the transition to occur in three phases. Currently, in Phase 0, we are designing the technology migration plan - you can think of this phase as designing the plumbing system between the two platforms so, when completed, advertisers on Yahoo’s platform can spend on Taboola’s supply and advertisers on Taboola’s platform can spend on Yahoo’s supply. Soon, we will move to Phase 1 of the migration, in which we will build that plumbing system and “test the pipes” by starting to flow small amounts of demand between the platforms, move some of the supply and transition a small number of advertisers to test the experience. We expect Phase 1 to be complete in the second half of 2023. Once we validate the pipes and our transition plans, Phase 2 will begin and will involve transitioning the advertisers and supply from Yahoo to Taboola. At this point, the migration will mostly be “blocking and tackling” but we still need to be thoughtful in the process because we want every advertiser making the transition to have a great experience and to thrive and grow on the Taboola platform - we don’t want to trade long-term gains for short-term revenue. We expect Phase 2 to begin in the second half of 2023 and be completed sometime in 2024, at which point we will be fully ramped and will be able to focus on additional growth opportunities from our partnership with Yahoo.
Q4 Financial Performance
Let me finish by sharing our financial results. Below are the results of Q4 and Full Year 2022 versus our guidance.
| (dollars in millions) | | Q4 2022 Actuals | | | Q4 2022 Guidance | | | FY 2022 Actuals | | | FY 2022 Guidance | |
| Revenues | | $ | 371.3 | | | $ | 358 - $374 | | | $ | 1,401.2 | | | $ | 1,388 - $1,404 | |
| Gross profit | | $ | 133.2 | | | $ | 127 - $139 | | | $ | 464.3 | | | $ | 458 - $470 | |
| ex-TAC Gross Profit* | | $ | 158.9 | | | $ | 153- $165 | | | $ | 569.6 | | | $ | 564 - $576 | |
| Adjusted EBITDA* | | $ | 63.5 | | | $ | 59 - $67 | | | $ | 156.7 | | | $ | 152 - $160 | |
| Non-GAAP Net Income* | | $ | 43.3 | | | $ | 35 - $43 | | | $ | 91.4 | | | $ | 83 - $91 | |
After a relatively strong start to 2022 in Q1, the macro environment softened in Europe in Q2 and then in the rest of the world starting in Q3. Incremental revenue from new business contributed 8% growth while existing business was a 17% headwind in Q4. The macro softness resulted in softer advertiser demand and weaker yield, which is what caused the decrease in existing business. While we are very excited about new customer contracts signed in the quarter and remain optimistic about the depth of our pipeline, we are especially proud of those previously lost customers that returned to Taboola. We think this demonstrates true differentiation in the marketplace and is indicative of the win-win partnerships we establish with our customers. Adjusted EBITDA exceeded the mid-point of our guidance as we benefited from cost management initiatives that we started in Q2 and accelerated in Q3. We continue to examine our business and cut unnecessary costs. Our continued focus on operational efficiency also allowed us to exceed our Non-GAAP Net Income guidance.
Q1 and FY 2023, 2024 Guidance
Below is our Q1 2023 and full year 2023 guidance. Our outlook assumes that the macro environment continues to be challenging but does not meaningfully deteriorate and that, as a result, the current softness in the online advertising market continues but does not worsen. In addition, we assume a substantial ramp in investment related to our Yahoo partnership but, to be conservative, do not factor in the associated revenue. It also assumes continued investment in our key company priorities of performance advertising, eCommerce and header bidding. Despite these significant investments, we still expect to have positive Free Cash Flow in 2023. We also believe our investments will start to show returns in 2024 and, while we are not fully guiding, we expect to generate at least $200M in Adjusted EBITDA and $100M in Free Cash Flow in 2024, despite being a partial year for Yahoo. Finally, it is important to note that when looking at Q1 2023 growth rates, a year on year comparison is distorted due to a relatively strong first quarter in 2022 and a substantially weaker second half, which negatively impacted our run rate coming into 2023.
| | Q1 2023 Guidance | | | FY 2023 Guidance | |
| | | Unaudited | |
| | | (dollars in millions) | |
| Revenues | |
| $299 - $325 | | |
| $1,419 - $1,469 | |
| Gross profit | |
| $76 - $88 | | |
| $416 - $436 | |
| ex-TAC Gross Profit* | |
| $103 - $115 | | |
| $526 - $546 | |
| Adjusted EBITDA* | |
| ($6) - $6 |
| |
| $60 - $80 | |
| Non-GAAP Net Income (loss)* | |
| ($23) - ($11) |
| |
| ($10) - $10 |
|
For more information on our Q4 results and our full year 2023 and Q1 2023 guidance, please see our Q4 2022 earnings press release, which was furnished to the SEC and also posted on Taboola’s website today at https://investors.taboola.com.
In Summary
We remain fully committed to building an alternative to the walled gardens, expanding our core market and entering new markets. We are grateful our shareholders trust us to continue investing in the long term drivers of the business which we categorize into four channels: 1) performance advertising, 2) e-Commerce, 3) header bidding, and as of now having a 4th priority - making Yahoo successful.
This is a year of investment for us, with meaningful financial gains starting in 2024 and continuing beyond. Many companies would go into defensive mode in times like this, we’re continuing to play offense, and I believe our future is incredibly strong.
Kind regards,
-- Adam Singolda
Founder & CEO Taboola
*About Non-GAAP Financial Information
This letter includes ex-TAC Gross Profit, Adjusted EBITDA, Ratio of Adjusted EBITDA to ex-TAC Gross Profit, Free Cash Flow, Non-GAAP Net Income (loss), Non-GAAP EPS basic and diluted and IPO Pro forma Non-GAAP EPS basic and diluted, which are non-GAAP financial measures. These non-GAAP financial measures are not measures of financial performance in accordance with GAAP and may exclude items that are significant in understanding and assessing the Company’s financial results. Therefore, these measures should not be considered in isolation or as an alternative to revenues, gross profit, earnings per share, net income (loss), cash flows from operations or other measures of profitability, liquidity or performance under GAAP. You should be aware that the Company’s presentation of these measures may not be comparable to similarly-titled measures used by other companies.
The Company believes non-GAAP financial measures provide useful information to management and investors regarding future financial and business trends relating to the Company. The Company believes that the use of these measures provides an additional tool for investors to use in evaluating operating results and trends and in comparing the Company’s financial measures with other similar companies, many of which present similar non-GAAP financial measures to investors. Non-GAAP financial measures are subject to inherent limitations because they reflect the exercise of judgments by management about which items are excluded or included in calculating them. Please refer to the appendix at the end of this letter for reconciliations to the most directly comparable measures in accordance with GAAP.
**About Cash Investment in Publisher Prepayments (Net)
We calculate cash investment in publisher prepayments (net) for a specific measurement period as the gross amount of cash publisher prepayments we made in that measurement period minus the amortization of publisher prepayments that were included in traffic acquisition cost during that measurement period, which were the result of cash publisher prepayments made in that measurement period and previous periods.
Note Regarding Forward-Looking Statements
Certain statements in this letter are forward-looking statements. Forward-looking statements generally relate to future events including future financial or operating performance of Taboola.com Ltd. (the “Company”). In some cases, you can identify forward-looking statements by terminology such as “may”, “should”, “expect”, “guidance”, “intend”, “will”, “estimate”, “anticipate”, “believe”, “predict”, “target”, “potential” or “continue”, or the negatives of these terms or variations of them or similar terminology. Such forward-looking statements are subject to risks, uncertainties, and other factors which could cause actual results to differ materially from those expressed or implied by such forward looking statements.
These forward-looking statements are based upon estimates and assumptions that, while considered reasonable by the Company and its management, are inherently uncertain. Uncertainties and risk factors that could affect the Company’s future performance and cause results to differ from the forward-looking statements in this letter include, but are not limited to: the ability to recognize the anticipated benefits of the Connexity acquisition and the business combination between the Company and ION Acquisition Corp. 1 Ltd. (together, the “Business Combinations”), which may be affected by, among other things, competition, the ability of the Company to grow and manage growth profitably, maintain relationships with customers and retain its management and key employees; the Company’s ability to successfully integrate the Connexity acquisition; costs related to the Business Combinations; changes in applicable laws or regulations; the Company’s estimates of expenses and profitability and underlying assumptions with respect to accounting presentations and purchase price and other adjustments; the Company’s ability to transition to and fully launch the native advertising service for Yahoo on the currently anticipated schedule or at all; the timing and amount of any margin, profitability, cash flow or other financial contributions resulting from the integration of Yahoo with our service; the risk that the Yahoo integration results in a decline in the Company’s financial performance during the preparation and roll out of the new service and beyond; the ability to generate or achieve the financial results, including the increase in Adjusted EBITDA and Free Cash Flow in 2024 to the levels assumed in this letter or at all; ability to transform the Company into an alternative to the walled gardens in the Open Web; the ability to become the largest open web advertising company in the world by revenue; ability to attract new digital properties and advertisers; ability to meet minimum guarantee requirements in contracts with digital properties; intense competition in the digital advertising space, including with competitors who have significantly more resources; ability to grow and scale the Company’s ad and content platform through new relationships with advertisers and digital properties; ability to secure high quality content from digital properties; ability to maintain relationships with current advertiser and digital property partners; ability to make continued investments in the Company’s AI-powered technology platform; the need to attract, train and retain highly-skilled technical workforce; changes in the regulation of, or market practice with respect to, “third party cookies” and its impact on digital advertising; continued engagement by users who interact with the Company’s platform on various digital properties; the impact of the ongoing COVID-19 pandemic; reliance on a limited number of partners for a significant portion of the Company’s revenue; changes in laws and regulations related to privacy, data protection, advertising regulation, competition and other areas related to digital advertising; ability to enforce, protect and maintain intellectual property rights; and risks related to the fact that we are incorporated in Israel and governed by Israeli law; and other risks and uncertainties set forth in the Company’s Annual Report on Form 20-F for the year ended December 31, 2021 under Item 3.D. “Information About the Company - Risk Factors” and in the Company’s subsequent filings with the Securities and Exchange Commission.
Nothing in this letter should be regarded as a representation by any person that the forward-looking statements set forth herein will be achieved or that any of the contemplated results of such forward-looking statements will be achieved. You should not place undue reliance on these forward-looking statements, which speak only as of the date they were made. The Company undertakes no duty to update these forward-looking statements except as may be required by law.
APPENDIX: Non-GAAP Reconciliation
RECONCILIATION OF GAAP TO NON-GAAP FINANCIAL MEASURES FOR Q4 AND YEARS ENDED DECEMBER 31, 2022 AND 2021 (Unaudited)
The following table provides a reconciliation of revenues to ex-TAC Gross Profit.
| | | Three months ended December 31, | | | Year ended December 31, | |
| | | 2022 | | | 2021 | | | 2022 | | | 2021 | |
| | | (dollars in thousands) | |
| Revenues | | $ | 371,267 | | | $ | 407,668 | | | $ | 1,401,150 | | | $ | 1,378,458 | |
| Traffic acquisition cost | | | 212,399 | | | | 238,458 | | | | 831,508 | | | | 859,595 | |
| Other cost of revenues | | | 25,694 | | | | 25,568 | | | | 105,389 | | | | 77,792 | |
| Gross profit | | $ | 133,174 | | | $ | 143,642 | | | $ | 464,253 | | | $ | 441,071 | |
| Add back: Other cost of revenues | | | 25,694 | | | | 25,568 | | | | 105,389 | | | | 77,792 | |
| ex-TAC Gross Profit | | $ | 158,868 | | | $ | 169,210 | | | $ | 569,642 | | | $ | 518,863 | |
The following table provides a reconciliation of net income (loss) to Adjusted EBITDA.
| | | Three months ended December 31, | | | Year ended December 31, | |
| | | 2022 | | | 2021 | | | 2022 | | | 2021 | |
| | | (dollars in thousands) | |
| Net income (loss) | | $ | 15,184 | | | $ | 585 | | | $ | (11,975 | ) | | $ | (24,948 | ) |
| Adjusted to exclude the following: | | | | | | | | | | | | |
| Finance (income) expenses, net | | | 3,176 | | | | 1,783 | | | | (9,213 | ) | | | (11,293 | ) |
| Income tax expenses | | | 6,675 | | | | 16,277 | | | | 7,523 | | | | 22,976 | |
| Depreciation and amortization | | | 22,510 | | | | 23,061 | | | | 91,221 | | | | 53,111 | |
| Share-based compensation expenses (1) | | | 13,214 | | | | 20,641 | | | | 63,830 | | | | 124,235 | |
| Restructuring expenses (2) | | | — | | | | — | | | | 3,383 | | | | — | |
| Holdback compensation expenses (3) | | | 2,736 | | | | 2,882 | | | | 11,091 | | | | 3,722 | |
| M&A costs | | | — | | | | 154 | | | | 816 | | | | 11,661 | |
| Adjusted EBITDA | | $ | 63,495 | | | $ | 65,383 | | | $ | 156,676 | | | $ | 179,464 | |
1 For the year ended December 31, 2021, a substantial majority is share-based compensation expenses related to going public.
2 Costs associated with the Company’s cost restructuring program implemented in September 2022.
3 Represents share-based compensation due to holdback of Taboola Ordinary shares issuable under compensatory arrangements relating to Connexity acquisition.
We calculate Ratio of net income (loss) to gross profit as net income (loss) divided by gross profit. We calculate Ratio of Adjusted EBITDA to ex-TAC Gross Profit, a non-GAAP measure, as Adjusted EBITDA divided by ex-TAC Gross Profit. We believe that the Ratio of Adjusted EBITDA to ex-TAC Gross Profit is useful because TAC is what we must pay digital properties to obtain the right to place advertising on their websites, and we believe focusing on ex-TAC Gross Profit better reflects the profitability of our business. The following table reconciles Ratio of net income (loss) to gross profit and Ratio of Adjusted EBITDA to ex-TAC Gross Profit for the period shown.
| | Three months ended December 31, | | | Year ended December 31, | |
| | | 2022 | | | 2021 | | | 2022 | | | 2021 | |
| | | (dollars in thousands) | |
| Gross profit | | $ | 133,174 | | | $ | 143,642 | | | $ | 464,253 | | | $ | 441,071 | |
| Net income (loss) | | $ | 15,184 | | | $ | 585 | | | $ | (11,975 | ) | | $ | (24,948 | ) |
| Ratio of net income (loss) to gross profit | | | 11.4 | % | | | 0.4 | % | | | (2.6 | %) | | | (5.7 | %) |
| | | | | | | | | | | | | | | | | |
| ex-TAC Gross Profit | | $ | 158,868 | | | $ | 169,210 | | | $ | 569,642 | | | $ | 518,863 | |
| Adjusted EBITDA | | $ | 63,495 | | | $ | 65,383 | | | $ | 156,676 | | | $ | 179,464 | |
| Ratio of Adjusted EBITDA margin to ex-TAC Gross Profit | | | 40.0 | % | | | 38.6 | % | | | 27.5 | % | | | 34.6 | % |
The following table provides a reconciliation of net income (loss) to Non-GAAP Net Income*.
| | | Three months ended December 31, | | | Year ended December 31, | |
| | | 2022 | | | 2021 | | | 2022 | | | 2021 | |
| | | (dollars in thousands) | |
| Net income (loss) | | $ | 15,184 | | | $ | 585 | | | $ | (11,975 | ) | | $ | (24,948 | ) |
| Amortization of acquired intangibles | | | 15,966 | | | | 15,821 | | | | 63,557 | | | | 23,007 | |
| Share-based compensation expenses (1) | | | 13,214 | | | | 20,641 | | | | 63,830 | | | | 124,235 | |
| Restructuring expenses (2) | | | — | | | | — | | | | 3,383 | | | | — | |
| Holdback compensation expenses (3) | | | 2,736 | | | | 2,882 | | | | 11,091 | | | | 3,722 | |
| M&A costs | | | — | | | | 154 | | | | 816 | | | | 11,661 | |
| Revaluation of Warrants | | | 2,517 | | | | (5,565 | ) | | | (24,471 | ) | | | (22,656 | ) |
| Foreign currency exchange rate (4) | | | (4,430 | ) | | | 1,106 | | | | (1,377 | ) | | | 4,625 | |
| Income tax effects | | | (1,909 | ) | | | (1,778 | ) | | | (13,472 | ) | | | (6,060 | ) |
| Non-GAAP Net Income | | $ | 43,278 | | | $ | 33,846 | | | $ | 91,382 | | | $ | 113,586 | |
| | | | | | | | | | | | | | | | | |
| Non-GAAP EPS basic | | $ | 0.17 | | | $ | 0.14 | | | $ | 0.36 | | | $ | 0.79 | |
| Non-GAAP EPS diluted | | $ | 0.16 | | | $ | 0.12 | | | $ | 0.35 | | | $ | 0.68 | |
* Three months and year ended December 31, 2021 have been adjusted to include the impact of foreign currency exchange rates to be consistent with current period presentation.
1 For the year ended December 31, 2021, a substantial majority is share-based compensation expenses related to going public.
2 Costs associated with the Company’s cost restructuring program implemented in September 2022.
3 Represents share-based compensation due to holdback of Taboola Ordinary shares issuable under compensatory arrangements relating to Connexity acquisition.
4 Represents income or loss related to the remeasurement of monetary assets and liabilities to the Company’s functional currency using exchange rates in effect at the end of the reporting period.
The following table provides a reconciliation of the number of shares used to calculate GAAP EPS to IPO Pro forma Non-GAAP EPS basic and diluted.
| | | Three months ended December 31, | | | Year ended December 31, | |
| | | 2022 | | | 2021 | | | 2022 | | | 2021 | |
| | | | | | | | | | |
| GAAP weighted-average shares used to compute net income (loss) per share, basic | | | 261,922,644 | | | | 243,850,858 | | | | 254,284,781 | | | | 142,883,475 | |
| Add: Non-GAAP adjustment for Ordinary shares issued in connection with going public | | | — | | | | — | | | | — | | | | 84,769,190 | |
| IPO Pro forma Non-GAAP weighted-average shares used to compute net income per share, basic | | | 261,922,644 | | | | 243,850,858 | | | | 254,284,781 | | | | 227,652,665 | |
| | | | | | | | | | | | | | | | | |
| GAAP weighted-average shares used to compute net income (loss) per share, diluted | | | 263,160,470 | | | | 271,857,016 | | | | 254,284,781 | | | | 142,883,475 | |
| Add: Non-GAAP adjustment for Ordinary shares issued in connection with going public | | | — | | | | — | | | | — | | | | 84,769,190 | |
| Add: Dilutive Ordinary share equivalents | | | — | | | | — | | | | 5,519,155 | | | | 23,155,427 | |
| IPO Pro forma Non-GAAP weighted-average shares used to compute net income per share, diluted | | | 263,160,470 | | | | 271,857,016 | | | | 259,803,936 | | | | 250,808,092 | |
| | | | | | | | | | | | | | | | | |
| IPO Pro forma Non-GAAP EPS, basic (1) | | $ | 0.165 | | | $ | 0.139 | | | $ | 0.359 | | | $ | 0.499 | |
| IPO Pro forma Non-GAAP EPS, diluted (1) | | $ | 0.164 | | | $ | 0.124 | | | $ | 0.352 | | | $ | 0.453 | |
1 IPO Pro Forma Non-GAAP EPS basic and diluted is presented only for the year ended December 31, 2021 assuming Taboola went public and consummated the related transactions in each case as of January 1, 2021. Therefore the Non-GAAP net income does not include any adjustments of undistributed earnings previously allocated to participating securities, assuming these securities converted to Ordinary shares in each case as of January 1, 2021.
The following table provides a reconciliation of net cash provided by operating activities to Free Cash Flow.
| | Three months ended December 31, | | | Year ended December 31, | |
| | 2022 | | | 2021 | | | 2022 | | | 2021 | |
| | (dollars in thousands) | |
| Net cash provided by operating activities | | $ | 20,058 | | | $ | 22,968 | | | $ | 53,484 | | | $ | 63,521 | |
| Purchases of property and equipment, including capitalized internal-use software | | | (6,438 | ) | | | (10,296 | ) | | | (34,914 | ) | | | (39,070 | ) |
| Free Cash Flow | | $ | 13,620 | | | $ | 12,672 | | | $ | 18,570 | | | $ | 24,451 | |
APPENDIX: Non-GAAP Guidance Reconciliation
RECONCILIATION OF GAAP TO NON-GAAP FINANCIAL MEASURES FOR Q1 2023 AND FULL YEAR 2023 GUIDANCE
(Unaudited)
The following table provides a reconciliation of projected gross profit to ex-TAC Gross Profit.
| | | | Q1 2023 Guidance | | | FY 2023 Guidance | |
| | | Unaudited | |
| | | (dollars in millions) | |
| Revenues | |
| $299 - $325 | | |
| $1,419 - $1,469 | |
| Traffic acquisition cost | |
| ($196 - $210) |
| |
| ($893 - $923) |
|
| Other cost of revenues | |
| ($26 - $28) |
| |
| ($107 - $113) |
|
| Gross profit | |
| $76 - $88 | | |
| $416 - $436 | |
| Add back: Other cost of revenues | |
| $26 - $28 | | |
| $107 - $113 | |
| ex-TAC Gross Profit | |
| $103 - $115 | | |
| $526 - $546 | |
Although we provide a projection for Free Cash Flow, we are not able to provide a projection for net cash provided by operating activities, the most directly comparable GAAP measure. Certain elements of net cash provided by operating activities, including taxes and timing of collections and payments, are not predictable therefore projecting an accurate forecast is difficult. As a result, it is impractical for us to provide projections on net cash provided by operating activities or to reconcile our Free Cash Flow projections without unreasonable efforts. Consequently, no disclosure of projected net cash provided by operating activities is included. For the same reasons, we are unable to address the probable significance of the unavailable information.
APPENDIX: Assumptions: If Yahoo Were On Taboola Network For FY 2022
All numbers are management estimates based on the following assumptions and sources:
| ● | Revenue baseline is equal to the expected FY 2022 financials for TBLA at guidance midpoint (66% of combined Revenues) + FY 2022 expected financials for Yahoo Native supply* that will be serviced by TBLA (34% of combined Revenues) |
| ● | Revenue uplift on Yahoo supply from improved yield due to the application of Taboola technology and data |
| ● | Revenue uplift on stand-alone Taboola supply from improved yield due to advertiser demand from Yahoo and additional data |
| ● | Operating expenses based on bottom up model of resources needed to support deal |
| ● | Assumes no ramp up time - numbers assume Yahoo is part of Taboola network from the beginning of 2022 and assumes uplifts and operating expenses start from the beginning of the year |
* Yahoo Q1 to Q3 2022 actuals, plus Yahoo forecast for Q4 2022