Free signup for more
- Track your favorite companies
- Receive email alerts for new filings
- Personalized dashboard of news and more
- Access all data and search results
Filing tables
Filing exhibits
Related financial report
TBLA similar filings
- 10 May 23 Taboola Beats Guidance in Q1 On All Metrics; Raises Mid-point for 2023; Announcing Up to $40M Buyback and $50M Debt Repayment
- 17 Apr 23 Regulation FD Disclosure
- 1 Mar 23 Regulation FD Disclosure
- 24 Feb 23 Results of Operations and Financial Condition
- 17 Jan 23 Yahoo and Taboola Announce Closing of Deal; 30-Year Strategic Partnership, Taboola to Power Recommendations for Yahoo
- 3 Jan 23 Submission of Matters to a Vote of Security Holders
Filing view
External links
Exhibit 99.3
INVESTOR PRESENTATION
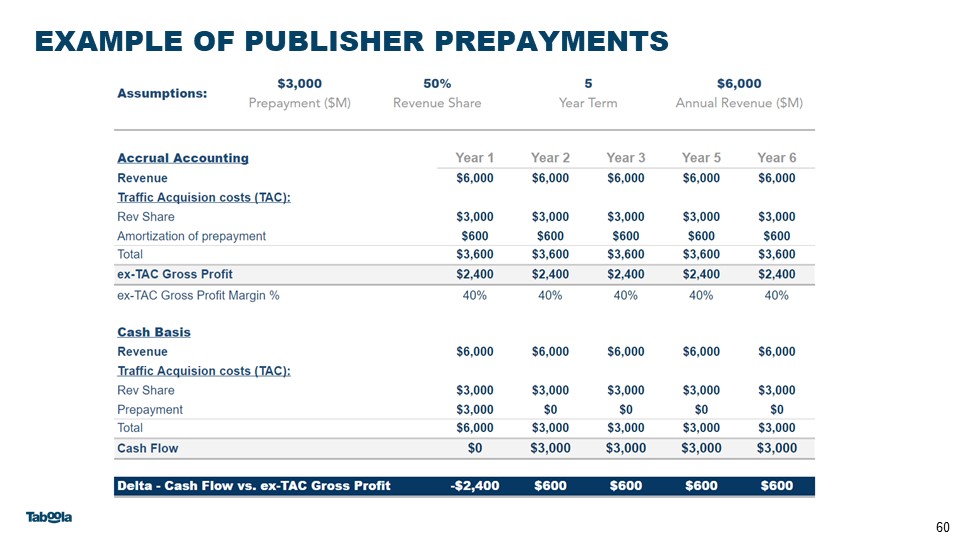
2 Certain statements in this presentation are forward-looking statements, including our Q1 and full-year 2023 guidance. Forward-looking statements generally relate to future events including future financial or operating performance of Taboola.com Ltd. (the “Company”). In some cases, you can identify forward-looking statements by terminology such as “may”, “should”, “expect”,”guidance”, “intend”, “will”, “estimate”, “anticipate”, “believe”, “predict”,”target”, “potential” or “continue”, or the negatives of these terms or variations of them or similar terminology. Such forward-looking statements are subject to risks, uncertainties, and other factors which could cause actual results to differ materially from those expressed or implied by such forward looking statements. These forward-looking statements are based upon estimates and assumptions that, while considered reasonable by the Company and its management, are inherently uncertain. Uncertainties and risk factors that could affect the Company’s future performance and cause results to differ from the forward-looking statements in this press release include, but are not limited to: the ability to recognize the anticipated benefits of the recent acquisition of Connexity and the business combination between the Company and ION Acquisition Corp. 1 Ltd. (together, the “Business Combinations”), which may be affected by, among other things, competition, the ability of the Company to grow and manage growth profitably, maintain relationships with customers and retain its management and key employees; the Company’s ability to successfully integrate the Connexity acquisition; costs related to the Business Combinations; changes in applicable laws or regulations; the Company’s estimates of expenses and profitability and underlying assumptions with respect to accounting presentations and purchase price and other adjustments; ability to attract new digital properties and advertisers; the ability to generate or achieve the financial results, including the increase in Adjusted EBITDA and Free Cash Flow in 2024 to the levels assumed in this letter or at all; ability to meet minimum guarantee requirements in contracts with digital properties; intense competition in the digital advertising space, including with competitors who have significantly more resources; ability to grow and scale the Company’s ad and content platform through new relationships with advertisers and digital properties; ability to secure high quality content from digital properties; ability to maintain relationships with current advertiser and digital property partners; ability to make continued investments in the Company’s AI-powered technology platform; the need to attract, train and retain highly-skilled technical workforce; changes in the regulation of, or market practice with respect to, “third party cookies” and its impact on digital advertising; continued engagement by users who interact with the Company’s platform on various digital properties; the impact of the ongoing COVID-19 pandemic; reliance on a limited number of partners for a significant portion of the Company’s revenue; changes in laws and regulations related to privacy, data protection, advertising regulation, competition and other areas related to digital advertising; ability to enforce, protect and maintain intellectual property rights; and risks related to the fact that we are incorporated in Israel and governed by Israeli law; and other risks and uncertainties set forth in the Company’s Annual Report on Form 20-F for the year ended December 31, 2021 under Item 3.D. “Information About the Company - Risk Factors” and in the Company’s subsequent filings with the Securities and Exchange Commission (“SEC”). Nothing in this presentation should be regarded as a representation by any person that the forward-looking statements set forth herein will be achieved or that any of the contemplated results of such forward-looking statements will be achieved. You should not place undue reliance on these forward-looking statements, which speak only as of the date they were made. The Company undertakes no duty to update these forward-looking statements except as may be required by law. Forward-Looking Statements - Disclaimer Non-GAAP Financial Measures This Presentation includes ex-TAC Gross Profit, Adjusted EBITDA, Ratio of Adjusted EBITDA to ex-TAC Gross Profit, Free Cash Flow, Non-GAAP Net Income and Non-GAAP EPS Diluted, which are non-GAAP financial measures. These non-GAAP financial measures are not measures of financial performance in accordance with GAAP and may exclude items that are significant in understanding and assessing the Company’s financial results. Therefore, these measures should not be considered in isolation or as an alternative to revenues, gross profit, earnings per share, net income, cash flows from operations or other measures of profitability, liquidity or performance under GAAP. You should be aware that the Company’s presentation of these measures may not be comparable to similarly-titled measures used by other companies. The Company believes non-GAAP financial measures provide useful information to management and investors regarding future financial and business trends relating to the Company. The Company believes that the use of these measures provides an additional tool for investors to use in evaluating operating results and trends and in comparing the Company’s financial measures with other similar companies, many of which present similar non-GAAP financial measures to investors. Non-GAAP financial measures are subject to inherent limitations because they reflect the exercise of judgments by management about which items are excluded or included in calculating them. Please refer to the appendix at the end of this presentation for reconciliations to the most directly comparable measures in accordance with GAAP. Industry and Market Data In this presentation, the Company relies on and refer to certain information and statistics obtained from third-party sources, which it believes to be reliable. The Company has not independently verified the accuracy or completeness of any such third-party information. You are cautioned not to give undue weight to such industry and market data. This presentation may include trademarks, service marks, trade names and copyrights of other companies, which are the property of their respective owners. Solely for convenience, some of the trademarks, service marks, trade names and copyrights referred to in this Presentation may be listed without the TM, SM, (c) or (r) symbols, but the Company will assert, to the fullest extent under applicable law, the right of the applicable owners, if any, to these trademarks, service marks, trade names and copyrights. About Cash Investment in Publisher Prepayments (Net) We calculate cash investment in publisher prepayments (net) for a specific measurement period as the gross amount of cash publisher prepayments we made in that measurement period minus the amortization of publisher prepayments that were included in traffic acquisition cost during that measurement period, which were the result of cash publisher prepayments made in that measurement period and previous periods.
‹#› Certain statements in this presentation are forward-looking statements, including our Q1 and full-year 2023 guidance. Forward-looking statements generally relate to future events including future financial or operating performance of Taboola.com Ltd. (the “Company”). In some cases, you can identify forward-looking statements by terminology such as “may”, “should”, “expect”,”guidance”, “intend”, “will”, “estimate”, “anticipate”, “believe”, “predict”,”target”, “potential” or “continue”, or the negatives of these terms or variations of them or similar terminology. Such forward-looking statements are subject to risks, uncertainties, and other factors which could cause actual results to differ materially from those expressed or implied by such forward looking statements. These forward-looking statements are based upon estimates and assumptions that, while considered reasonable by the Company and its management, are inherently uncertain. Uncertainties and risk factors that could affect the Company’s future performance and cause results to differ from the forward-looking statements in this press release include, but are not limited to: the ability to recognize the anticipated benefits of the recent acquisition of Connexity and the business combination between the Company and ION Acquisition Corp. 1 Ltd. (together, the “Business Combinations”), which may be affected by, among other things, competition, the ability of the Company to grow and manage growth profitably, maintain relationships with customers and retain its management and key employees; the Company’s ability to successfully integrate the Connexity acquisition; costs related to the Business Combinations; changes in applicable laws or regulations; the Company’s estimates of expenses and profitability and underlying assumptions with respect to accounting presentations and purchase price and other adjustments; ability to attract new digital properties and advertisers; the ability to generate or achieve the financial results, including the increase in Adjusted EBITDA and Free Cash Flow in 2024 to the levels assumed in this letter or at all; ability to meet minimum guarantee requirements in contracts with digital properties; intense competition in the digital advertising space, including with competitors who have significantly more resources; ability to grow and scale the Company’s ad and content platform through new relationships with advertisers and digital properties; ability to secure high quality content from digital properties; ability to maintain relationships with current advertiser and digital property partners; ability to make continued investments in the Company’s AI-powered technology platform; the need to attract, train and retain highly-skilled technical workforce; changes in the regulation of, or market practice with respect to, “third party cookies” and its impact on digital advertising; continued engagement by users who interact with the Company’s platform on various digital properties; the impact of the ongoing COVID-19 pandemic; reliance on a limited number of partners for a significant portion of the Company’s revenue; changes in laws and regulations related to privacy, data protection, advertising regulation, competition and other areas related to digital advertising; ability to enforce, protect and maintain intellectual property rights; and risks related to the fact that we are incorporated in Israel and governed by Israeli law; and other risks and uncertainties set forth in the Company’s Annual Report on Form 20-F for the year ended December 31, 2021 under Item 3.D. “Information About the Company - Risk Factors” and in the Company’s subsequent filings with the Securities and Exchange Commission (“SEC”). Nothing in this presentation should be regarded as a representation by any person that the forward-looking statements set forth herein will be achieved or that any of the contemplated results of such forward-looking statements will be achieved. You should not place undue reliance on these forward-looking statements, which speak only as of the date they were made. The Company undertakes no duty to update these forward-looking statements except as may be required by law. Forward-Looking Statements - Disclaimer Non-GAAP Financial Measures This Presentation includes ex-TAC Gross Profit, Adjusted EBITDA, Ratio of Adjusted EBITDA to ex-TAC Gross Profit, Free Cash Flow, Non-GAAP Net Income and Non-GAAP EPS Diluted, which are non-GAAP financial measures. These non-GAAP financial measures are not measures of financial performance in accordance with GAAP and may exclude items that are significant in understanding and assessing the Company’s financial results. Therefore, these measures should not be considered in isolation or as an alternative to revenues, gross profit, earnings per share, net income, cash flows from operations or other measures of profitability, liquidity or performance under GAAP. You should be aware that the Company’s presentation of these measures may not be comparable to similarly-titled measures used by other companies. The Company believes non-GAAP financial measures provide useful information to management and investors regarding future financial and business trends relating to the Company. The Company believes that the use of these measures provides an additional tool for investors to use in evaluating operating results and trends and in comparing the Company’s financial measures with other similar companies, many of which present similar non-GAAP financial measures to investors. Non-GAAP financial measures are subject to inherent limitations because they reflect the exercise of judgments by management about which items are excluded or included in calculating them. Please refer to the appendix at the end of this presentation for reconciliations to the most directly comparable measures in accordance with GAAP. Industry and Market Data In this presentation, the Company relies on and refer to certain information and statistics obtained from third-party sources, which it believes to be reliable. The Company has not independently verified the accuracy or completeness of any such third-party information. You are cautioned not to give undue weight to such industry and market data. This presentation may include trademarks, service marks, trade names and copyrights of other companies, which are the property of their respective owners. Solely for convenience, some of the trademarks, service marks, trade names and copyrights referred to in this Presentation may be listed without the TM, SM, (c) or (r) symbols, but the Company will assert, to the fullest extent under applicable law, the right of the applicable owners, if any, to these trademarks, service marks, trade names and copyrights. About Cash Investment in Publisher Prepayments (Net) We calculate cash investment in publisher prepayments (net) for a specific measurement period as the gross amount of cash publisher prepayments we made in that measurement period minus the amortization of publisher prepayments that were included in traffic acquisition cost during that measurement period, which were the result of cash publisher prepayments made in that measurement period and previous periods.
TODAY’S PRESENTERS ADAM SINGOLDA FOUNDER & CEO STEPHEN WALKER CFO Founded Taboola over 15 years ago Has led the company as its CEO ever since 8+ years at Taboola Led several of Idealab's portfolio companies, including Perfect Market Prior experience at Disney & General Electric
AGENDA Capturing Share of $70B Open Web Ad Market & Taboola Overview Q4 Updates & Momentum Taboola’s Differentiation and Why We Win 1 2 3 Financial Update 4
POWERING RECOMMENDATIONS FOR THE OPEN WEB HELPING PEOPLE DISCOVER THINGS THEY MAY LIKE
TABOOLA = SEARCH “IN REVERSE” FROM PEOPLE LOOKING FOR INFORMATION TO INFORMATION LOOKING FOR PEOPLE
THE OPEN WEB where we spend 25% of our time $70B* WHAT video, product, tv show, app,... WHERE article page, homepage, app, ctv,... RECOMMENDATION AI, personalized, relevant, based on the user and the context * Company estimate
DONE WRONG...
...DONE RIGHT Walled garden integrated ad experience Paid Organic Paid Organic Organic Paid Paid Paid
TABOOLA REVOLUTION Bring power of walled gardens to open web with Tens of billions clicks a year Paid Editorial
(BUT) OPEN WEB TODAY IS NOT PERSONALIZED
INVESTOR PRESENTATION
ROCKET FUEL NASA/MAF/Steven Seipel 500M+ DAU Context Tens of billions clicks a year Curiosity graph(“people who read this also do this”) 90% of revenue direct(pixel on page) Source: Company data
TECH DIFFERENTIATION 10 years partnerships, trust
AN OPEN WEB POWERED BYTABOOLA RECOMMENDATIONS 298 584 1,426 4,909 2010 2015 2020 2025 Source: Data Age 2025, sponsored by Seagate with data from IDC Global DataSphere Nov 2018 The Number of interactions/Capita/Day
Over the next 3 years WE EXPECT TO CROSS $1B EX-TAC WHILE MAINTAINING OUR MARGINS
AGENDA Capturing Share of $70B Open Web Ad Market & Taboola Overview Q4 Updates & Momentum Taboola’s Differentiation and Why We Win 1 2 3 Financial Update 4
TABOOLA’S DIFFERENTIATION Growth fueled by a network effect Long-term yield increases Taboola’s technology is resilient to the future disappearance of third-party cookies Platform advantage driven by Taboola’s technology (Brands & Agencies, Taboola News, Newsroom) Connexity provides further differentiation 1 2 3 4 HOW IT DRIVES SUPERIOR FINANCIAL PERFORMANCE & EXPANDING MARGINS 5
ex-TAC Margin has increased significantly since 2015 Competitive landscape has not changed significantly in that time period Margins increase as competitive advantages increase 1 1 (1) Non-GAAP measure, see appendix for reconciliation to GAAP EXPANDING EX-TAC MARGINS POINT TO COMPETITIVE ADVANTAGE 1
More Publisher Partners More Users Reached More Frequently More Data Generated Higher Yield Better Targeting Drives Better Results for Advertisers GROWTH WITH A BUILT-IN NETWORK EFFECT SCALE MATTERS IN OUR INDUSTRY 1
WHAT MAKES UP YIELD Click Through Rate (CTR): The number of clicks that an ad receives divided by the number of times the ad is shown (impressions) A high CTR is a good indication that users find your ads relevant Cost Per Click (CPC): The amount advertisers pay for each click on their ads. Conversion Rate: The percentage of users who have completed a desired action (e.g. purchase) after clicking on an ad. CTR Click Through Rate CPC Cost Per Click Conversion Rate YIELD 2
CTR and Conversions Click Through Rate, Conversion Rates CPC Cost Per Click HOW WE INCREASE YIELD Algorithmic improvements drive better prediction of what users will engage with More advertisers on the platform and higher diversity of campaigns More data that provides more contextual signals enables more accurate targeting Better user experience increases the likelihood of engagement with the ad More advertisers on the platform increases auction density Better attribution measurement better reflects the value of conversions Automated bidding (SmartBid) optimizes bids dynamically 2
(1) Source: Company data. Clicks represent total clicks on Taboola recommendations, including paid advertisements (“sponsored content”) and editorial ("organic") content Taboola’s strong yield performance despite 3rd party cookies being blocked in the industry for years: Apple started blocking 3rd party cookies in 2017 Firefox, Edge, etc are also blocking 3rd party cookies GDPR launched in 2018 CCPA launched in 2019 IDFA launched April, 2021 TABOOLA TECH IS BUILT FOR A COOKIE-LESS, IDFA / ATT WORLD Taboola has its own1st party cookie –recommending personalized editorial content enables serving our own 1st party identifier Unique readership context –deep access to the context of the page, allowing advertisers to target context (vs. “3rd party cookie behavior”) People click on Taboola recommendations tens of billions of times a year1 3
COMPREHENSIVE PUBLISHER PLATFORM PLATFORM ADVANTAGE DRIVEN BY INVESTMENT IN TECHNOLOGY CAPABILITIES NOT AVAILABLE FROM OUR COMPETITORS COMPREHENSIVE ADVERTISER PLATFORM 4
TABOOLA FOR BRANDS & AGENCIESHigh Impact Placements: a premium solution for achieving brand awareness Premium Ad Placements & Experiences Brand Safety & Adjacency Control Unique Readership Data & Insights 4
TABOOLA NEWS Bringing Premium Content To People Everywhere & Driving Audience For Our Publisher Partners Taboola News delivers relevant content from our premium publisher partners, integrated into mobile phones and other user touchpoints. It creates new opportunities for engagement and revenue for mobile carriers, device manufacturers, publishers and brands. ‹#› Running in more than 60 markets around the world With over 85M Monthly devices Becoming a meaningful source of traffic to our publishers WORKING WITH THE TOP OEMS: 4
Easily ANALYZE: Real-Time Audience Data Article Engagement Metrics Trending Topic Insights Subscription Analytics Instantly ACT: Identify high-performing content A/B test Headlines & Images Boost subscriptions ACTIONABLE INSIGHTS TO GROW READERSHIP & ENGAGEMENT 4 NEWSROOM
Must-know information, hand-curated by editors Personalized recommendations, powered by editor-enhanced algo FOR ALL FOR YOU 4
1/3 OPEN WEB PUBLISHER REVENUE Source: Company Estimates. 1/3 OF OPEN WEB PUBLISHER REVENUE WILL BE E-COMMERCE 5
5 CONNEXITY FURTHERS OUR COMPETITIVE ADVANTAGE INTRINSIC VALUE OF BUSINESSSignificant expansion of our addressable TAM with long runway of growth SYNERGIESTremendous opportunity to leverage our scale, combined relationships and Connexity’s e-commerce market maker capabilities STRATEGIC VALUE⅓ of Open Web Publisher Revenue will be e-commerce1 and Taboola with Connexity is uniquely differentiated 1 Company estimates.
5 CONNEXITY SYNERGIES SHORT-TERM Connexity on Taboola Publishers, growing publishers % of traffic with intent Take Connexity Global Expanding Connexity’s Client base by Leveraging Taboola Ad Sales MEDIUM-TERM Connexity merchant demand on Taboola publisher supply Better personalization/yield by merging data: recommendations + e-commerce
AGENDA Capturing Share of $70B Open Web Ad Market & Taboola Overview Q4 Updates & Momentum Taboola’s Differentiation and Why We Win 1 2 3 Financial Update 4
Q4 2022 IN REVIEW - capturing more of the $70 billion Open Web ad market Renewing and building new long term relationships Signed new digital property partner agreements, including competitive wins with Prisa, Grupo Godó, Network18, Kodansha, Buzzfeed Japan. Signed key renewals and new deals with CBSi, Tegna, Fox Sports, United Internet Media, as well as our massive new deal to bring us to all Yahoo properties. Seeing strength in key business areas Taboola Header Bidding selected by 50+ publishers Taboola News continues to gain meaningful traction
$1,401M Revenues $570M ex-TAC Gross Profit1 2022 Actuals (1) Non-GAAP measures, see appendix for reconciliation to GAAP $157M Adj. EBITDA1 $1,388 to $1,404M $564 to $576M Guidance $152 to $160M -2% 10% GROWTH RATE 16% $464M Gross Profit $458 to $470M 5% DELIVERED ON FY 2022 FINANCIAL EXPECTATIONS
(1) Non-GAAP measures, see appendix for reconciliation to GAAP. We calculate Adjusted EBITDA as Net income (loss) before net financial expenses, income tax expenses/ benefit and depreciation and amortization, further adjusted to exclude share-based compensation and other noteworthy income and expense items such as certain merger or acquisition related costs, which may vary from period-to-period. Revenues ex-TAC Gross Profit1 Adj. EBITDA2 Gross Profit $299 to $325M $103 to $115M 1Q 2023 GUIDANCE -$6 to $6M FY 2023 GUIDANCE $76 to $88M GUIDANCE IN 2023: Investing for Yahoo temporarily impacts expected performance (1) Non-GAAP measure, see appendix for reconciliation to GAAP (2) Non-GAAP measure, see appendix for note regarding reconciliation $1,419 to $1,469M $416 to $436M $526 to $546M $60 to $80M GUIDANCE IN 2024: At least $200M in Adj. EBITDA and $100M Free Cash Flow
AGENDA Capturing Share of $70B Open Web Ad Market & Taboola Overview Q4 Updates & Momentum Taboola’s Differentiation and Why We Win 1 2 3 Financial Update 4
TABOOLA FOCUSES ON PROFITABLE GROWTH Upside in our model Conservative growth assumed for core base Additional upside from existing growth initiatives Long-term model 20%+ ex-TAC Gross Profit Growth 30%+ Ratio of Adjusted EBITDA to ex-TAC Gross Profit (1),(2),(3) Non-GAAP measure, see appendix for reconciliation to GAAP PROFITABLE GROWTH Rule of 40 Business
CONTINUED GROWTH FROM NEW SUPPLY... HELPS PROVIDE FUEL FOR GROWTH FROM A STRONG INSTALLED BASE. (1) New digital property partners within the first 12 months that were live on our network. Pro forma effect of the Connexity acquisition as if completed on January 1, 2021. (2) Net Dollar Retention (ex-TAC Gross Profit) is the net growth of ex- TAC Gross Profit from existing digital property partners, including the growth of new digital property partners (beyond the revenue contribution determined based on the run-rate revenue generated by them when they are first on-boarded) for the given period divided by the ex-TAC Gross Profit from the same period in the prior-year. Pro forma effect of the Connexity acquisition as if completed on January 1, 2021. New Publisher1 ex-TAC Gross Profit Approximately 40% of total growth Historically 10%+ new supply growth Projecting similar range going forward 1 2 Net Dollar Retention2 Growth Has Two Elements Approximately 60% of total growth Improvements in yield More supply from existing pubs Historically 110-120% on average 1 2 GROWTH DRIVEN BY CORE OPEN WEB INSTALLED BASE Outliers
EXCEPTIONAL NEW PUBLISHER MOMENTUM IN 2022 2022 Was A Banner Year For New Publisher Partnerships Measured by average gross Revenues added per month from new publishers Over 90% higher than 2020 and 2021 average Second best year on record Outliers Sample of New Publisher Partnerships in 2022 Gray TV Huffington Post Penske Media Dumont Time.com United Internet Media Buzzfeed Prisa Grupo Godó Network 18 Kicker Media News Group
EXCEPTIONAL NEW PUBLISHER MOMENTUM IN 2022 2022 Was A Banner Year For New Publisher Partnerships Measured by average gross Revenues added per month from new publishers Over 90% higher than 2020 and 2021 average Second best year on record Outliers Sample of New Publisher Partnerships in 2022 Gray TV Huffington Post Penske Media Dumont Fox Sports Time.com United Internet Media Buzzfeed Prisa Grupo Godó Network 18 Kicker Media News Group
Non-GAAP measure; see appendix for reconciliation to GAAP Non-GAAP measure; see Note in appendix regarding Adjusted EBITDA Reconciliation. Non-GAAP measure; calculated as December 31, 2022. Cash, cash equivalents and short-term investments of $262.8 million minus long-term loan (including current portion) of $235.0 million. Note: The Company’s current estimate of minimum cash and cash equivalents needed for working capital is $80-100 million. It is only one factor considered in evaluating operating, investing and other strategies, is highly dependent on multiple conditions, is not a projection and subject to change at any time without notice. Growth Rate includes actual results for 2017-2022 Cash, cash equivalents and short-term investments. STRONG FINANCIAL PROFILE HIGH PROFITABILITY FAST GROWING STRONG BALANCE SHEET GENERATING CASH FLOW 21.6% 27.5% $262.8M $165M $570M 2022A ex-TAC1 $157M 2022A Adj. EBITDA2 $27.8M Q4 2022 Net Cash3 Strong Positive Free Cash Flow Generation Five Year Compounded ex-TAC Growth Rate4 2022 Adjusted EBITDAMargin %2 Q4 2022 Cash Balance5 Free Cash Flow Cumulative in 2020 - 2022
Thank you. ‹#›
APPENDIX
OUR MODEL IN A NUTSHELL ‹#› Revenues(1) Traffic Acq Cost (Value to publishers) ex-TAC Gross Profit(2) Cost of Revenues Gross profit R&D S&M G&A Operating Income $909 ($627) $282 ($48) $234 ($73) ($110) ($34) $17 $1.00 (100%) ($0.69) $0.31 ($0.05) $0.26 ($0.08) ($0.12) ($0.04) – = – = – – – = Model components: Sample inputs / financials: Illustrative Taboola economics: (1) Revenue paid by Advertisers, before traffic acquisition costs (TAC) paid to Publishers. CNX Revenues paid by advertisers after traffic acquisition costs paid to Publishers. (2) Revenue to Taboola after TAC paid to Publishers. Non-GAAP measure, see appendix for reconciliation to GAAP (3) Non-GAAP measure, see appendix for reconciliation to GAAP(4) Non cash charges, Cash charges excluded from Adjusted EBITDA ‹#› Adjusted EBITDA(3) $67 Dep, Amort, Share Based Comp, Other item $50 + = Change in WC, Other items(4) + PP&E and Capitalized Platform Costs ($22) Free Cash Flow(3) $45 + =
HISTORICAL REVENUES & EX-TAC GROSS PROFIT1 (REPORTED BASIS) 48 (1) Non-GAAP measure, see appendix for reconciliation to GAAP 1
HISTORICAL & PROJECTED REVENUES & EX-TAC GROSS PROFIT1 (REPORTED BASIS) ‹#› (1) Non-GAAP measure, see appendix for reconciliation to GAAP Note: 2022 projections reflect the mid-point of current company guidance.
SELECTED GAAP AND NON-GAAP METRICS ‹#› 1 2 (1)Non-GAAP measures, see appendix for reconciliation to GAAP Note: 2023 projections reflect the midpoint of current company guidance. 2 1 2 (1) (1) 1 1
(1) Non-GAAP measure, see appendix for reconciliation to GAAP FY 2023 GUIDANCE 50 1 2 2 1 2 (1) 1 1 1 1 1 1 1
(1) Non-GAAP measure, see appendix for reconciliation to GAAP FY 2023 GUIDANCE ‹#› 1 2 2 1 2 (1) 1 1 1 1
INVESTOR PRESENTATION
ADDITIONAL MODELING ASSUMPTIONS Interest payment of approximately $5M per quarter associated with $235M term loan related to the Connexity acquisition. Share based compensation of $128M in 2021 unusually high as a result of going public triggering event, 2022 at $75M and 2023 estimated at $71M. Depreciation & Amortization of $53M in 2021; increase related to Connexity Purchase Price Accounting allocation, 2022 at $91M and 2023 estimated at $91M. CAPEX of $35M in 2022 includes investments in property and equipment, leasehold improvements and capitalized software, 2023 estimated at $30M. Free Cash Flow before publisher prepayments (net) expected to be 50 - 60% of Adjusted EBITDA in long-term models. ‹#›
ADJUSTED EBITDA RECONCILIATION 52 1A substantial majority is share-based compensation expenses related to going public. 2 Relates to the acquisition of ION Acquisition Corp. 1 Ltd. and going public. 1 2
ADJUSTED EBITDA RECONCILIATION ‹#›
2022 QUARTERLY RESULTS: ADJUSTED EBITDA RECONCILIATION 53 1A substantial majority is share-based compensation expenses related to going public. 2 Relates to the acquisition of ION Acquisition Corp. 1 Ltd. and going public. 1 2
2022 QUARTERLY RESULTS: ADJUSTED EBITDA RECONCILIATION ‹#› 1A substantial majority is share-based compensation expenses related to going public. 2 Relates to the acquisition of ION Acquisition Corp. 1 Ltd. and going public. 1 2 1 2
EX-TAC GROSS PROFIT RECONCILIATION ‹#›
RATIO OF ADJUSTED EBITDA TO EX-TAC GROSS PROFIT RECONCILIATION ‹#›
EX-TAC GROSS PROFIT MARGIN RECONCILIATION ‹#›
HISTORICAL ADJ. GROSS PROFIT MARGIN RECONCILIATION Note: Adj. Gross Profit Margin is calculated by dividing Gross profit by ex-TAC Gross Profit. 57
HISTORICAL & PROJECTED ADJ. GROSS PROFIT MARGIN RECONCILIATION Note: Adj. Gross Profit Margin is calculated by dividing Gross profit by ex-TAC Gross Profit. ‹#›
‹#› 1 HISTORICAL FREE CASH FLOW RECONCILIATION (1) Adj. EBITDA plus the change in working capital reflects the Net cash provided by operating activities. 1
SUPPLEMENTAL CASH FLOW INFORMATION (1) We calculate cash investment in publisher prepayments (net) for a specific measurement period as the gross amount of cash publisher prepayments we made in that measurement period minus the amortization of publisher prepayments that were included in traffic acquisition cost during that measurement period, which were the result of cash publisher prepayments made in that measurement period and previous periods. ‹#› 1
EXAMPLE OF PUBLISHER PREPAYMENTS ‹#› 1
CONSOLIDATED BALANCE SHEET ($ in millions) As of Dec 31, 2019 As of Dec 31, 2020 As of Dec 31, 2021 As of Dec 31, 2022 Cash, cash equivalents and short-term deposits $ 116 $ 243 $ 319 $263 Total Assets $ 482 $ 580 $ 1,598 $1,530 Total Liabilities & Convertible Shares $ 475 $ 534 $ 830 $695 Accumulated Deficit $ (40) $ (31) $ (56) $(68) Additional Paid-in-capital $ 47 $ 78 $ 824 $903 Total Shareholders' Equity $ 7 $ 47 $ 768 $835 ‹#›
2023 FULL YEAR GUIDANCE: EX-TAC GROSS PROFIT RECONCILIATION ‹#›
Note Regarding Adjusted EBITDA Guidance Although we provide guidance for Adjusted EBITDA, we are not able to provide guidance for projected Net income (loss), the most directly comparable GAAP measures. Certain elements of Net income (loss), including share-based compensation expenses, are not predictable due to the high variability and difficulty of making accurate forecasts. As a result, it is impractical for us to provide guidance on Net Income (loss) or to reconcile our Adjusted EBITDA guidance without unreasonable efforts. Consequently, no disclosure of projected Net income (loss) is included. For the same reasons, we are unable to address the probable significance of the unavailable information.
THANK YOU!