
Q1 2024 Earnings May 8, 2024 Exhibit 99.2
Safe harbor statement This presentation contains “forward-looking” statements, which are subject to the safe harbor provisions of the Private Securities Litigation Reform Act of 1995, including statements regarding the Company’s financial guidance for the second quarter of 2024 and for the full year ending December 31, 2024, the Company’s growth, customer demand and application adoption, the Company’s research and development efforts and future application releases, the Company’s business strategy, statements about artificial intelligence and the Company’s expectations regarding future revenue, expenses, cash flows and net income or loss. These statements are not guarantees of future performance, but are based on management’s expectations as of the date of this presentation and assumptions that are inherently subject to uncertainties, risks and changes in circumstances that are difficult to predict. Forward-looking statements involve known and unknown risks, uncertainties and other factors that may cause actual results, performance or achievements to be materially different from any future results, performance or achievements. Important factors that could cause actual results to differ materially from those expressed or implied by these forward-looking statements include the following: risks associated with the continued economic uncertainty, including persistent inflation, labor shortages, high interest rates, foreign currency exchange volatility, concerns of economic slowdown or recession, reduced spending by customers and geopolitical instability; failure to continue our recent growth rates; the effects of increased usage of, or interruptions or performance problems associated with, our learning platform; the impact on our business and prospects from health pandemics and epidemics; our history of losses and expectation that we will not be profitable for the foreseeable future; or ability to acquire new customers and successfully retain existing customers; failure of the markets for our applications to develop at anticipated rates; failure to manage our growth effectively; and changes in the spending policies or budget priorities for government funding of Higher Education and K-12 institutions. These and other important risk factors are described more fully in the Company’s most recent Annual Report on Form 10-K and subsequent Quarterly Reports on Form 10-Q and other documents filed with the Securities and Exchange Commission and could cause actual results to vary from expectations. All information provided in this presentation is as of the date hereof and Instructure undertakes no duty to update this information except as required by law. Non-GAAP Financial Information Instructure has provided in this presentation financial information that has not been prepared in accordance with generally accepted accounting principles in the United States (“GAAP”). These financial measures include Non-GAAP Operating Income, Non-GAAP Operating Income Margin, Adjusted EBITDA, Adjusted EBITDA Margin, Non-GAAP Net Income, Free Cash Flow, Unlevered Free Cash Flow and Adjusted Unlevered Free Cash Flow, Non-GAAP Gross Profit, Non-GAAP Gross Profit Margin, Subscription and Support Non-GAAP Gross Profit, Subscription and Support Non-GAAP Gross Margin, Net Debt, Net Leverage Ratio, Organic Constant Currency Revenue Growth and Organic Constant Currency Subscription and Support Revenue Growth. In addition to Instructure’s results determined in accordance with GAAP, Instructure believes these non-GAAP measures are useful in evaluating its operating performance and liquidity. Instructure believes that non-GAAP financial information, when taken collectively, may be helpful to investors because it provides consistency and comparability with past financial performance and assists in comparisons with other companies, some of which use similar non-GAAP financial information to supplement their GAAP results. The non-GAAP financial information is presented for supplemental informational purposes only, and should not be considered a substitute for financial information presented in accordance with GAAP, and may be different from similarly-titled non-GAAP measures used by other companies. We urge you to review the reconciliation of our historical non-GAAP financial measures to the most directly comparable GAAP financial measures set forth in the Appendix to this presentation, and not to rely on any single financial measure in isolation to evaluate our business. We are unable to provide guidance or a reconciliation for forward-looking non-GAAP measures because we cannot provide a meaningful or accurate calculation or estimation of certain items without unreasonable effort. This is due to the inherent difficulty in forecasting and quantifying certain amounts that are necessary for such reconciliation, including stock-based compensation and amortization of acquisition-related intangibles. Thus, we are unable to present a quantitative reconciliation of non-GAAP guidance to GAAP guidance because such information is not available. Given the recent completion of the acquisition of Parchment, Instructure is introducing Organic Constant Currency Subscription and Support Revenue Growth and Organic Constant Currency Revenue Growth, which are non-GAAP financial measures that Instructure believes will assist investors comparing results from period to period without the impact of past acquisitions or the impact of foreign currency exchange rates. Instructure is also introducing Subscription and Support non-GAAP Gross Margins to better reflect continued scale in the business. In addition, Instructure is updating the grouping of the presentation of the adjustments to Non-GAAP Operating Income, Adjusted EBITDA, Non-GAAP Net Income, Adjusted Unlevered Free Cash Flow, and Non-GAAP Gross Profit to better present underlying drivers of change. These measures are not being recasted.

Steve Daly Chief Executive Officer Business Overview 1Q 2024 Highlights

Our vision is to be the ecosystem that powers learning for a lifetime and turns that learning into opportunities Elevate student success Amplify the power of teaching Inspire everyone to learn together
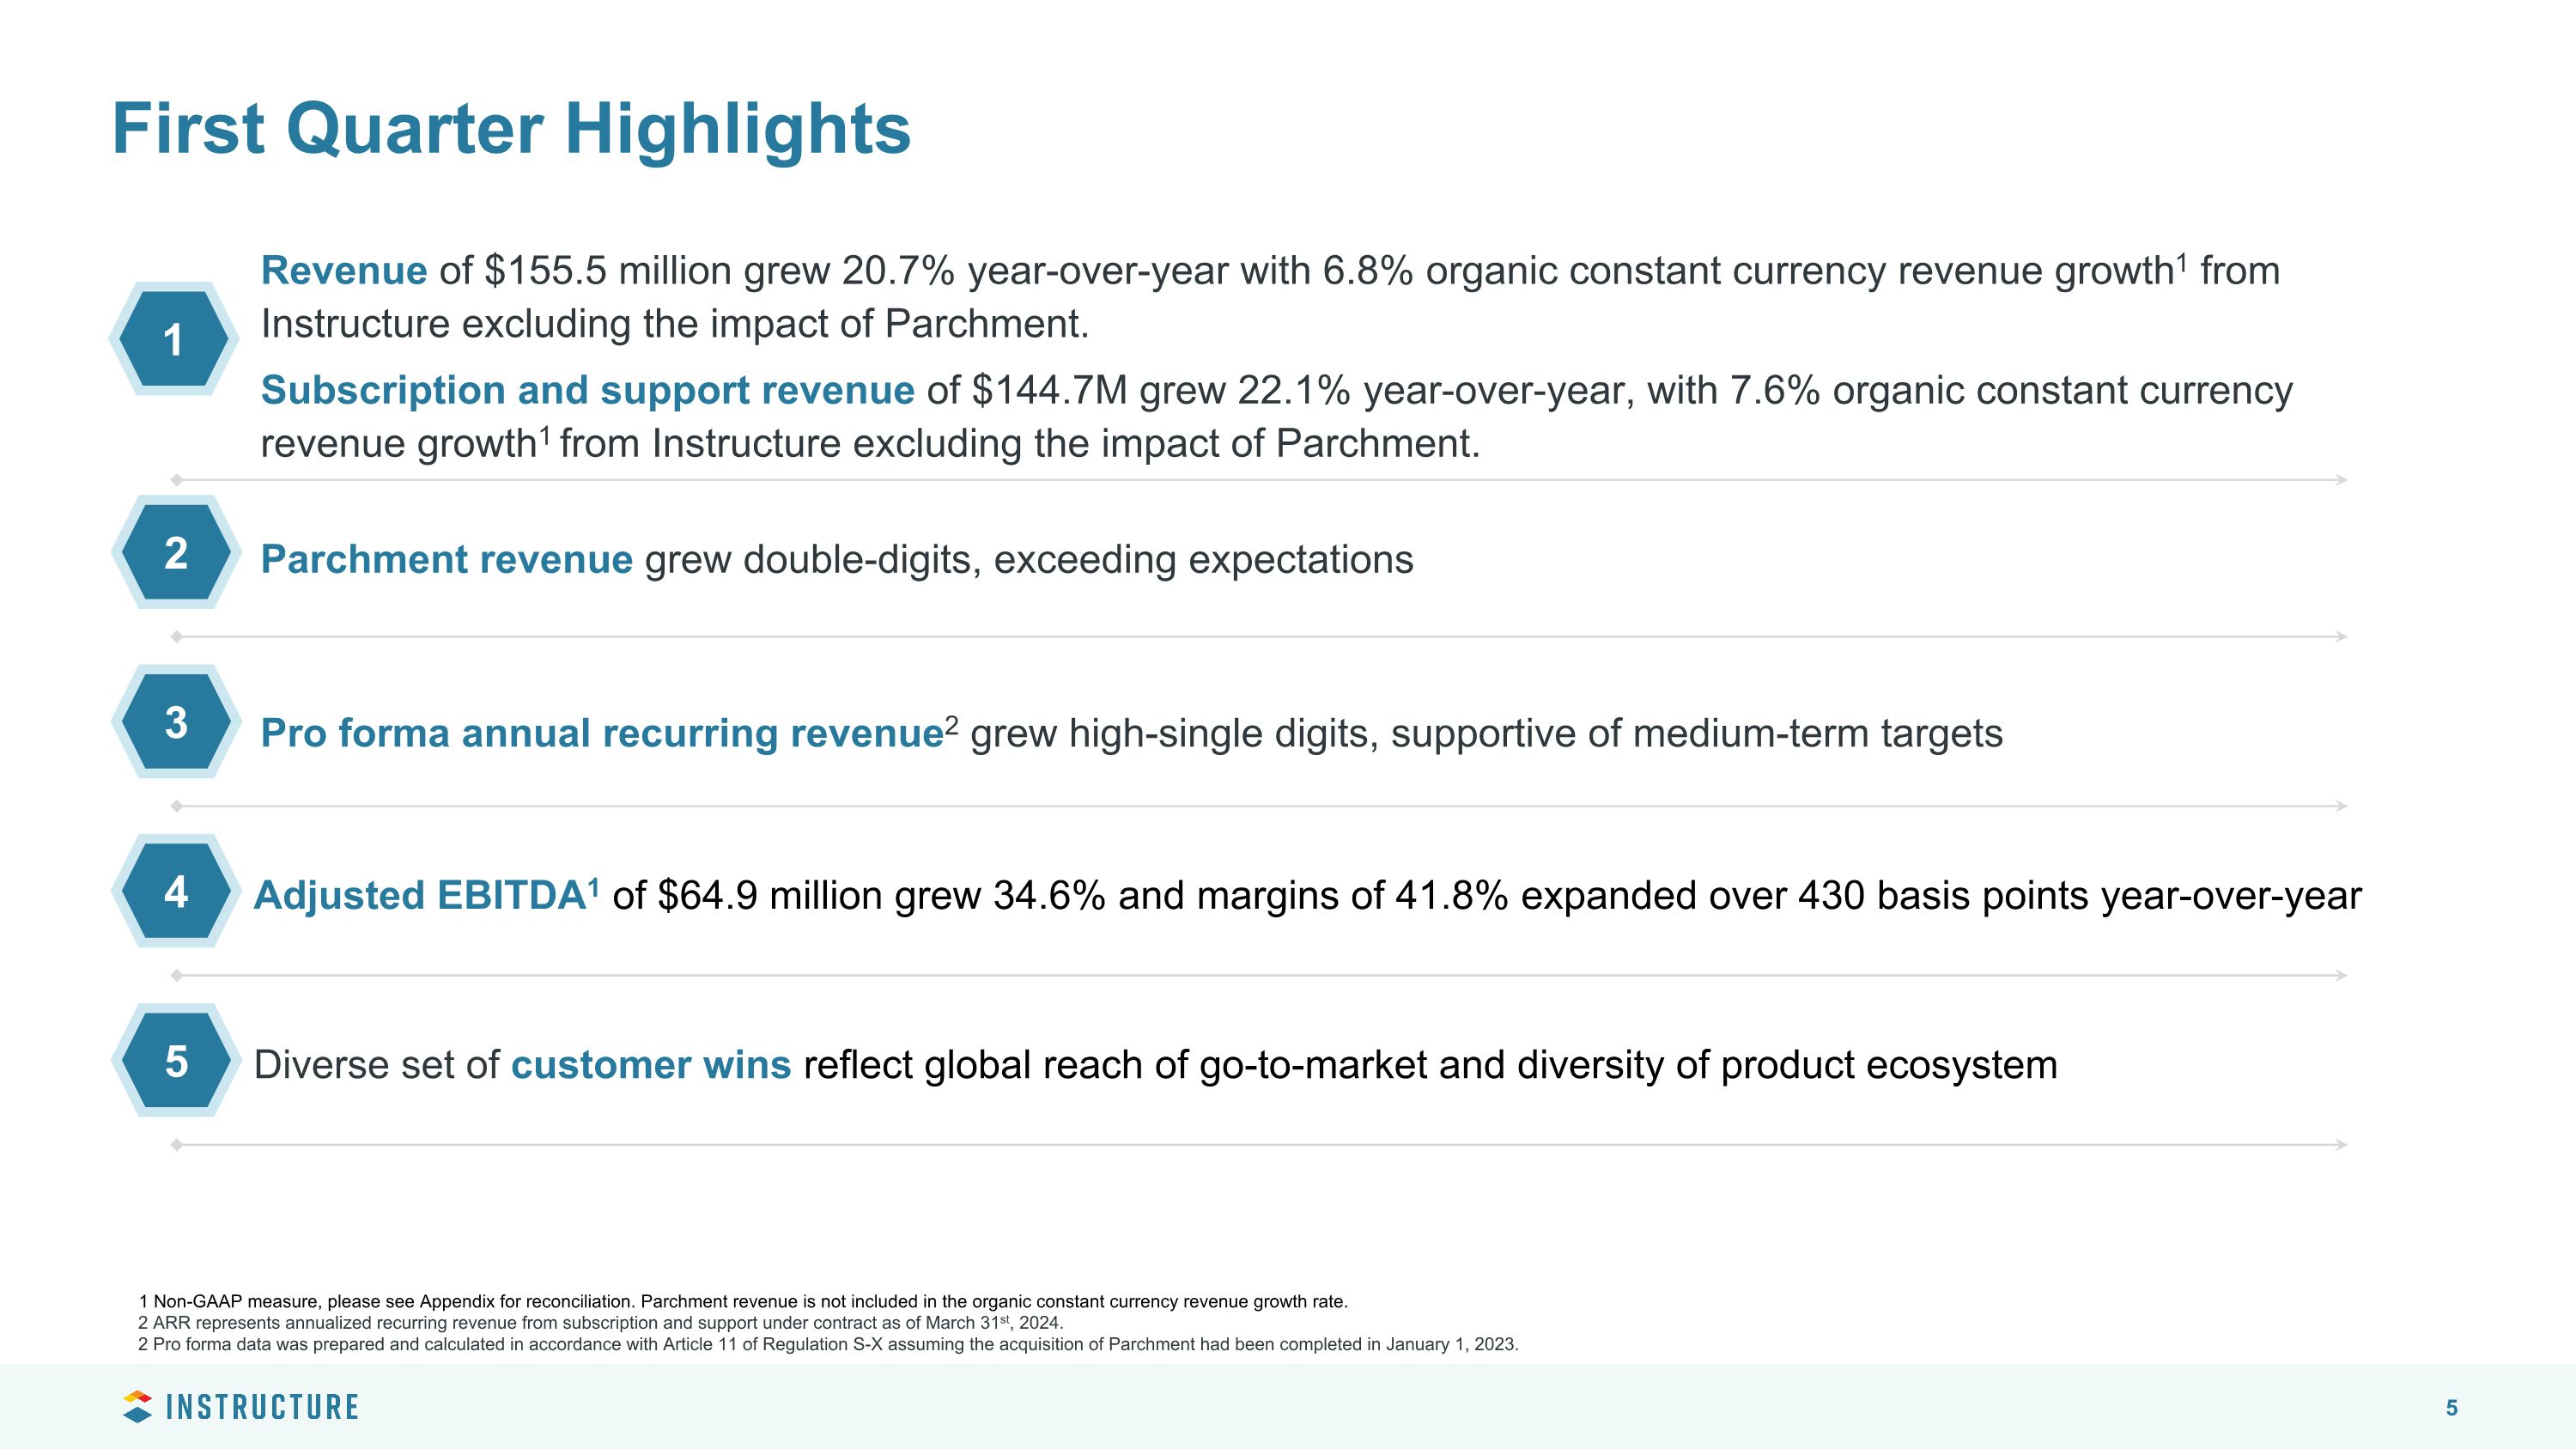
Pro forma annual recurring revenue2 grew high-single digits, supportive of medium-term targets Parchment revenue grew double-digits, exceeding expectations Revenue of $155.5 million grew 20.7% year-over-year with 6.8% organic constant currency revenue growth1 from Instructure excluding the impact of Parchment. Subscription and support revenue of $144.7M grew 22.1% year-over-year, with 7.6% organic constant currency revenue growth1 from Instructure excluding the impact of Parchment. Adjusted EBITDA1 of $64.9 million grew 34.6% and margins of 41.8% expanded over 430 basis points year-over-year Diverse set of customer wins reflect global reach of go-to-market and diversity of product ecosystem 1 2 3 4 5 1 2 3 4 5 2 ARR represents annualized recurring revenue from subscription and support under contract as of March 31st, 2024. 2 Pro forma data was prepared and calculated in accordance with Article 11 of Regulation S-X assuming the acquisition of Parchment had been completed in January 1, 2023. First Quarter Highlights 1 Non-GAAP measure, please see Appendix for reconciliation. Parchment revenue is not included in the organic constant currency revenue growth rate.
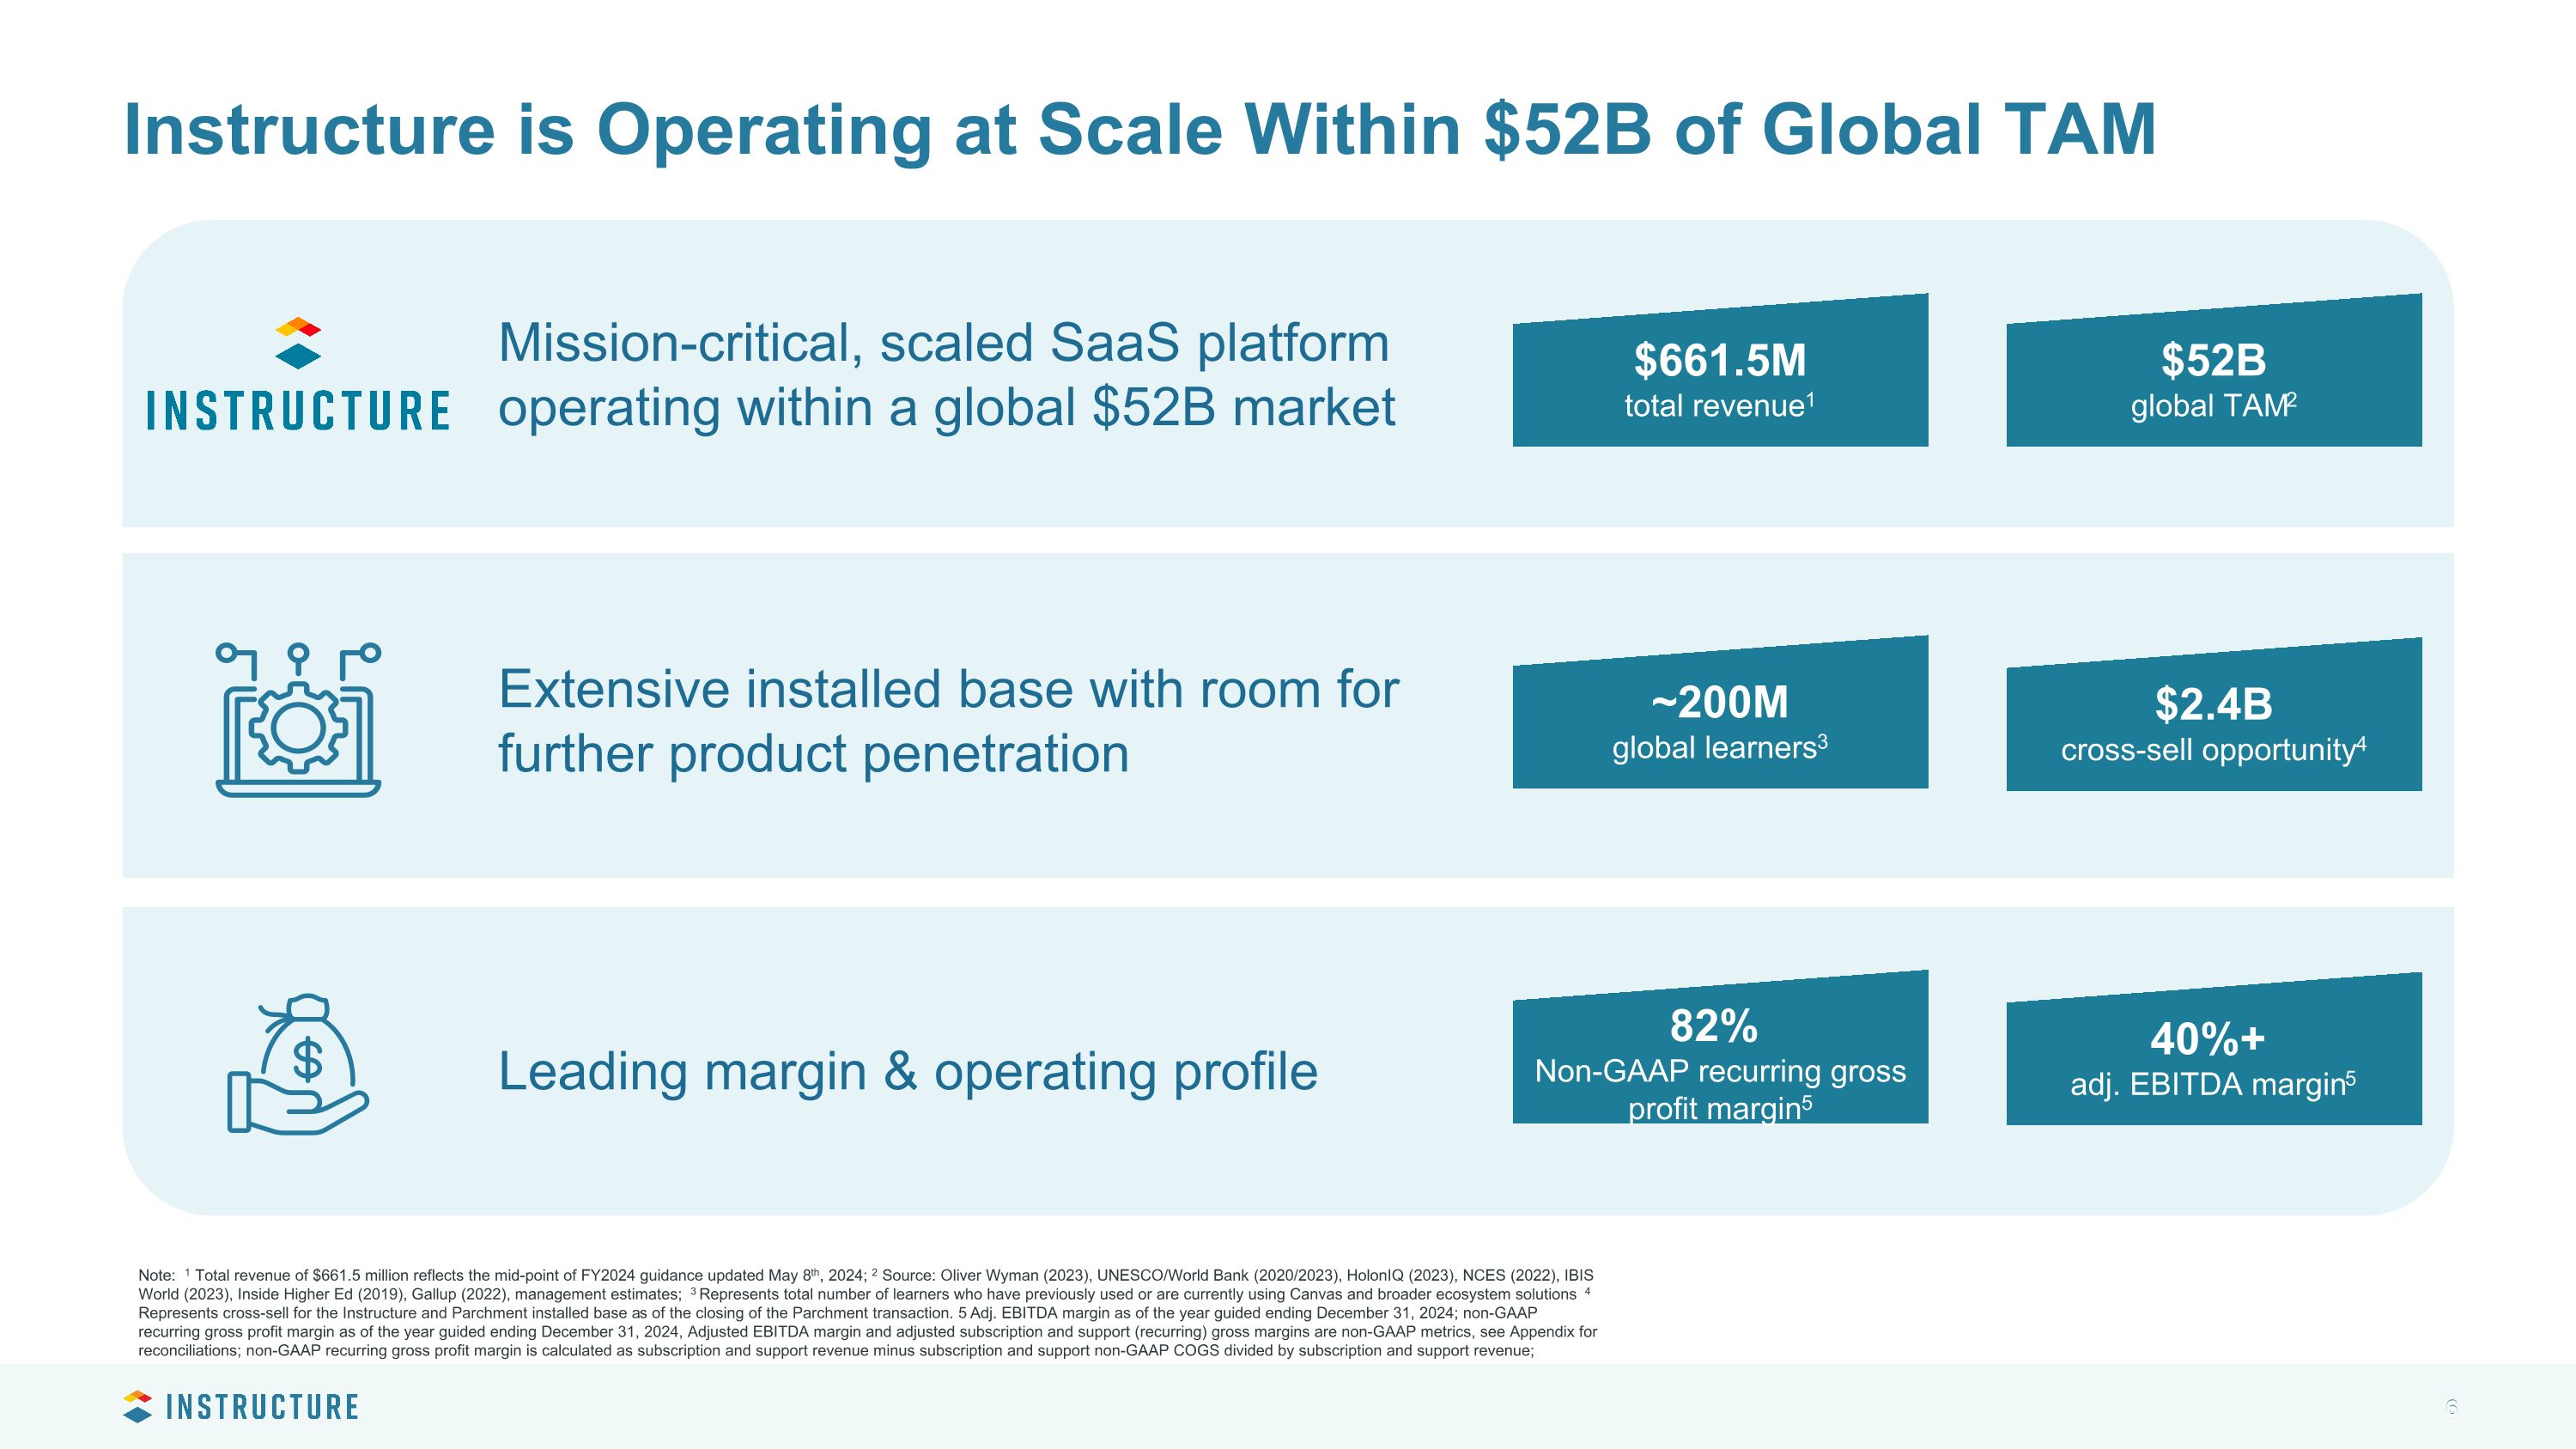
6 Mission-critical, scaled SaaS platform operating within a global $52B market Extensive installed base with room for further product penetration Leading margin & operating profile Note: 1 Total revenue of $661.5 million reflects the mid-point of FY2024 guidance updated May 8th, 2024; 2 Source: Oliver Wyman (2023), UNESCO/World Bank (2020/2023), HolonIQ (2023), NCES (2022), IBIS World (2023), Inside Higher Ed (2019), Gallup (2022), management estimates; 3 Represents total number of learners who have previously used or are currently using Canvas and broader ecosystem solutions 4 Represents cross-sell for the Instructure and Parchment installed base as of the closing of the Parchment transaction. 5 Adj. EBITDA margin as of the year guided ending December 31, 2024; non-GAAP recurring gross profit margin as of the year guided ending December 31, 2024, Adjusted EBITDA margin and adjusted subscription and support (recurring) gross margins are non-GAAP metrics, see Appendix for reconciliations; non-GAAP recurring gross profit margin is calculated as subscription and support revenue minus subscription and support non-GAAP COGS divided by subscription and support revenue; Instructure is Operating at Scale Within $52B of Global TAM $661.5M total revenue1 $52B global TAM2 ~200M global learners3 $2.4B cross-sell opportunity4 82% Non-GAAP recurring gross profit margin5 40%+ adj. EBITDA margin5

Technology Adoption is Being Driven by Key Sector Challenges Increased enrollment in online and shorter form courses More adults returning to school; changing demographic Demand for flexibility: omni-channel expectations More emphasis on skills and outcomes Learning evidence across a lifetime, ROI of degrees under pressure Increased focus on career readiness; employment outcomes Teacher workload increasing; staffing problematic Digitization still nascent; benefits unrealized Increased focus on teacher preparation, retention and ongoing development Explosion of devices and connectivity at school and at home Unmanaged proliferation of apps, services and software; privacy and security paramount Growing demand; consolidation likely Pronounced expectations around privacy, security, ethical use Significant potential for personalization, adaptivity and insights Efficiency and productivity impacts are real; cost concerns Learning is�atomizing Focus on readiness, skills & jobs Scaling quality instruction EdTech�sprawl AI / Personalized learning
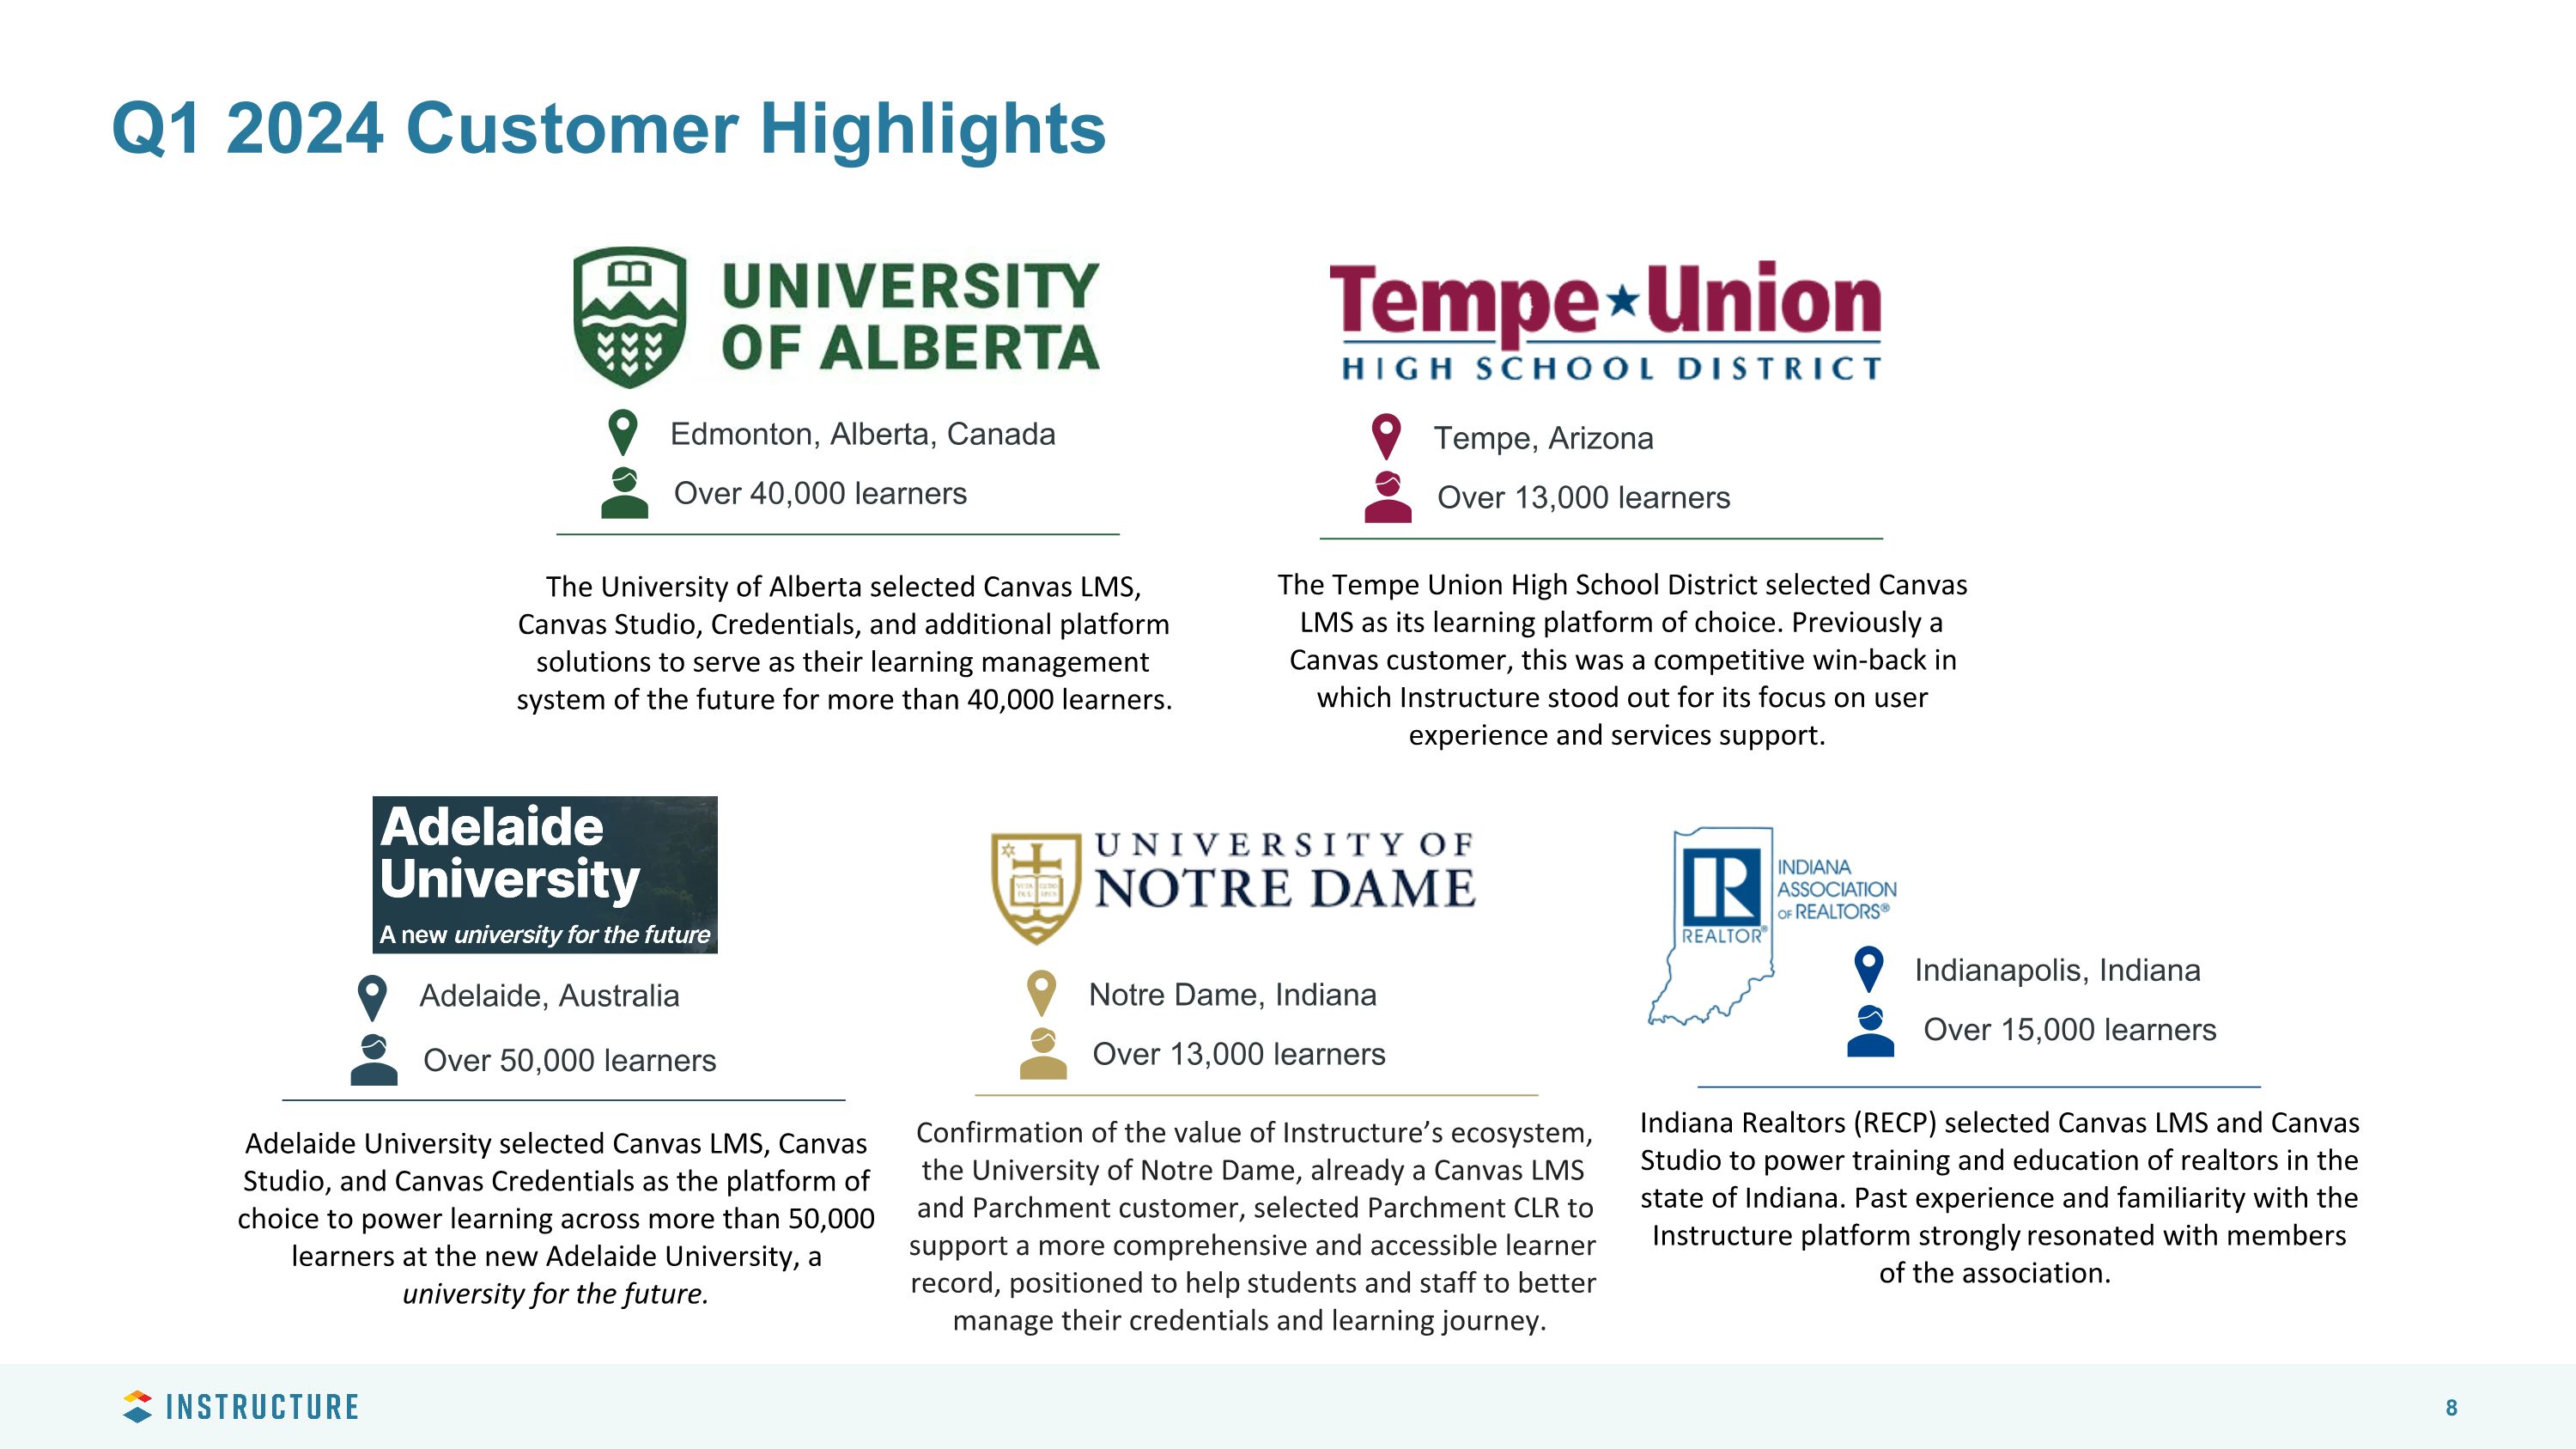
Q1 2024 Customer Highlights Edmonton, Alberta, Canada Over 40,000 learners Adelaide, Australia Over 50,000 learners The University of Alberta selected Canvas LMS, Canvas Studio, Credentials, and additional platform solutions to serve as their learning management system of the future for more than 40,000 learners. Adelaide University selected Canvas LMS, Canvas Studio, and Canvas Credentials as the platform of choice to power learning across more than 50,000 learners at the new Adelaide University, a university for the future. Indianapolis, Indiana Over 15,000 learners Tempe, Arizona Over 13,000 learners The Tempe Union High School District selected Canvas LMS as its learning platform of choice. Previously a Canvas customer, this was a competitive win-back in which Instructure stood out for its focus on user experience and services support. Indiana Realtors (RECP) selected Canvas LMS and Canvas Studio to power training and education of realtors in the state of Indiana. Past experience and familiarity with the Instructure platform strongly resonated with members of the association. Notre Dame, Indiana Over 13,000 learners Confirmation of the value of Instructure’s ecosystem, the University of Notre Dame, already a Canvas LMS and Parchment customer, selected Parchment CLR to support a more comprehensive and accessible learner record, positioned to help students and staff to better manage their credentials and learning journey.
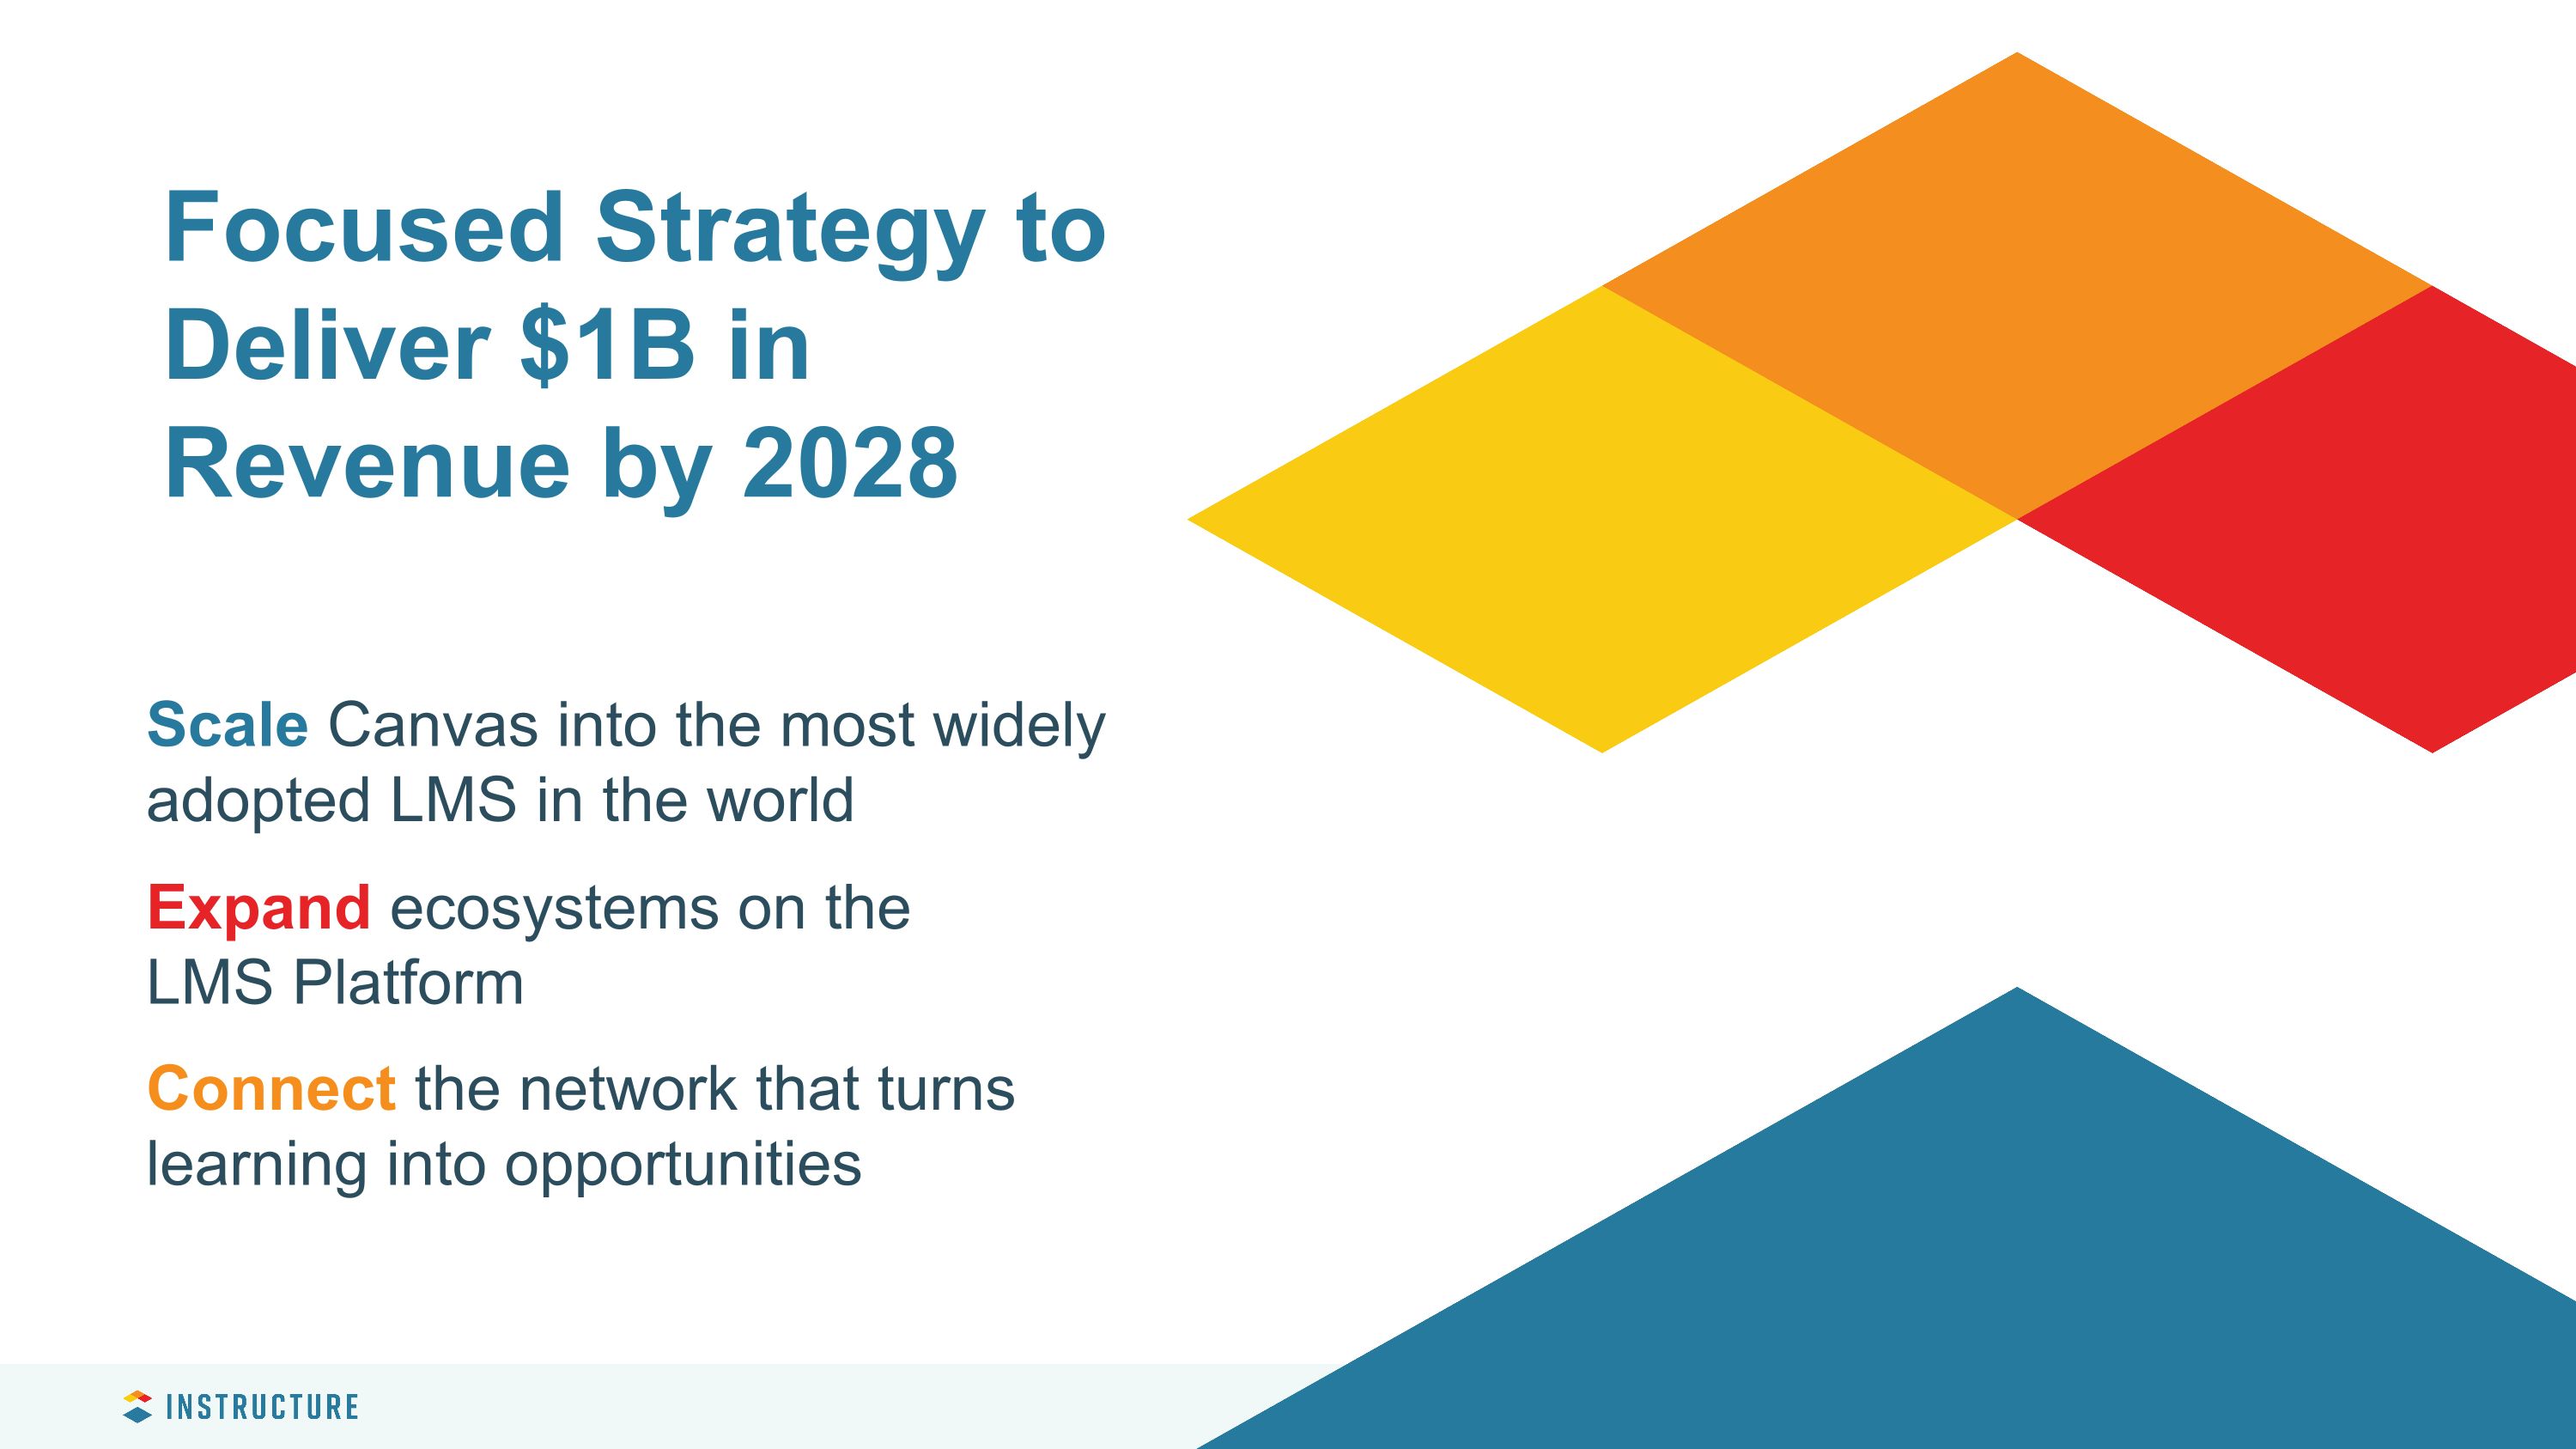
Focused Strategy to Deliver $1B in Revenue by 2028 Scale Canvas into the most widely adopted LMS in the world Expand ecosystems on the LMS Platform Connect the network that turns learning into opportunities

Peter Walker Chief Financial Officer 1Q 2024 Financial Review Fiscal Year 2024 Guidance Update
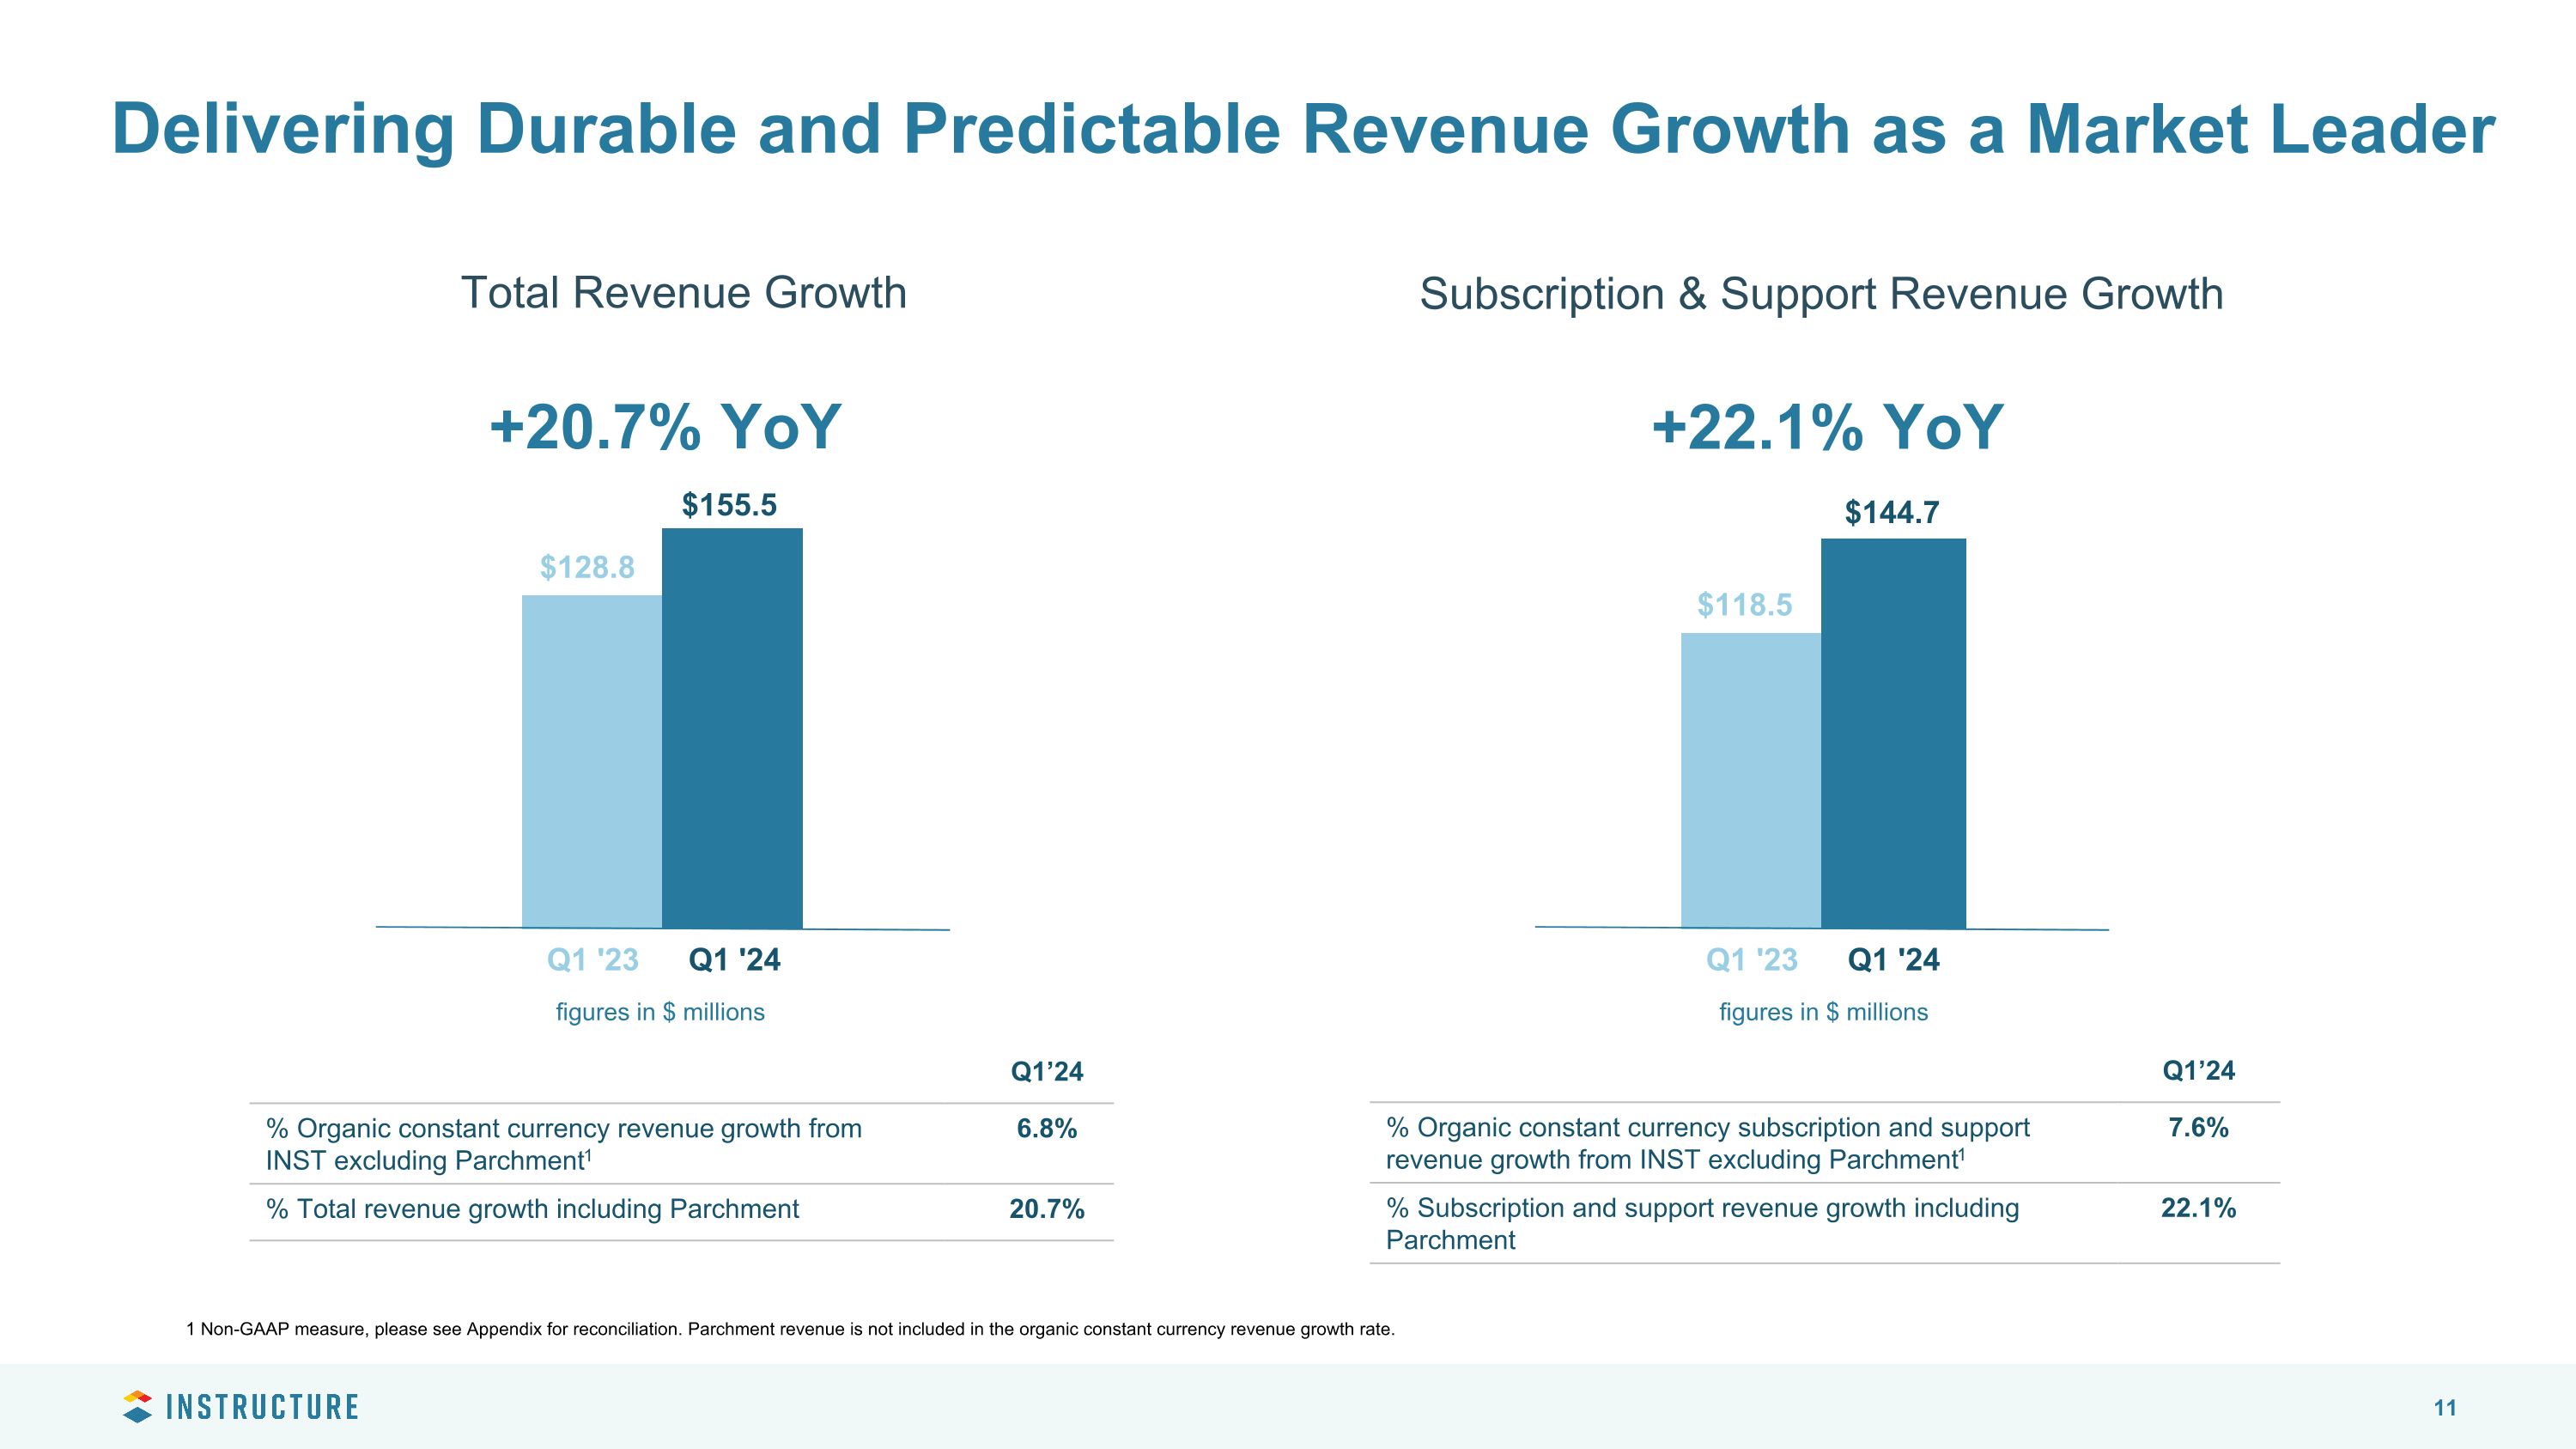
Delivering Durable and Predictable Revenue Growth as a Market Leader Total Revenue Growth +20.7% YoY Q1’24 % Organic constant currency revenue growth from INST excluding Parchment1 6.8% % Total revenue growth including Parchment 20.7% Subscription & Support Revenue Growth +22.1% YoY Q1’24 % Organic constant currency subscription and support revenue growth from INST excluding Parchment1 7.6% % Subscription and support revenue growth including Parchment 22.1% $128.8 $155.5 Q1 '23 Q1 '24 $118.5 $144.7 Q1 '23 Q1 '24 figures in $ millions figures in $ millions 1 Non-GAAP measure, please see Appendix for reconciliation. Parchment revenue is not included in the organic constant currency revenue growth rate.
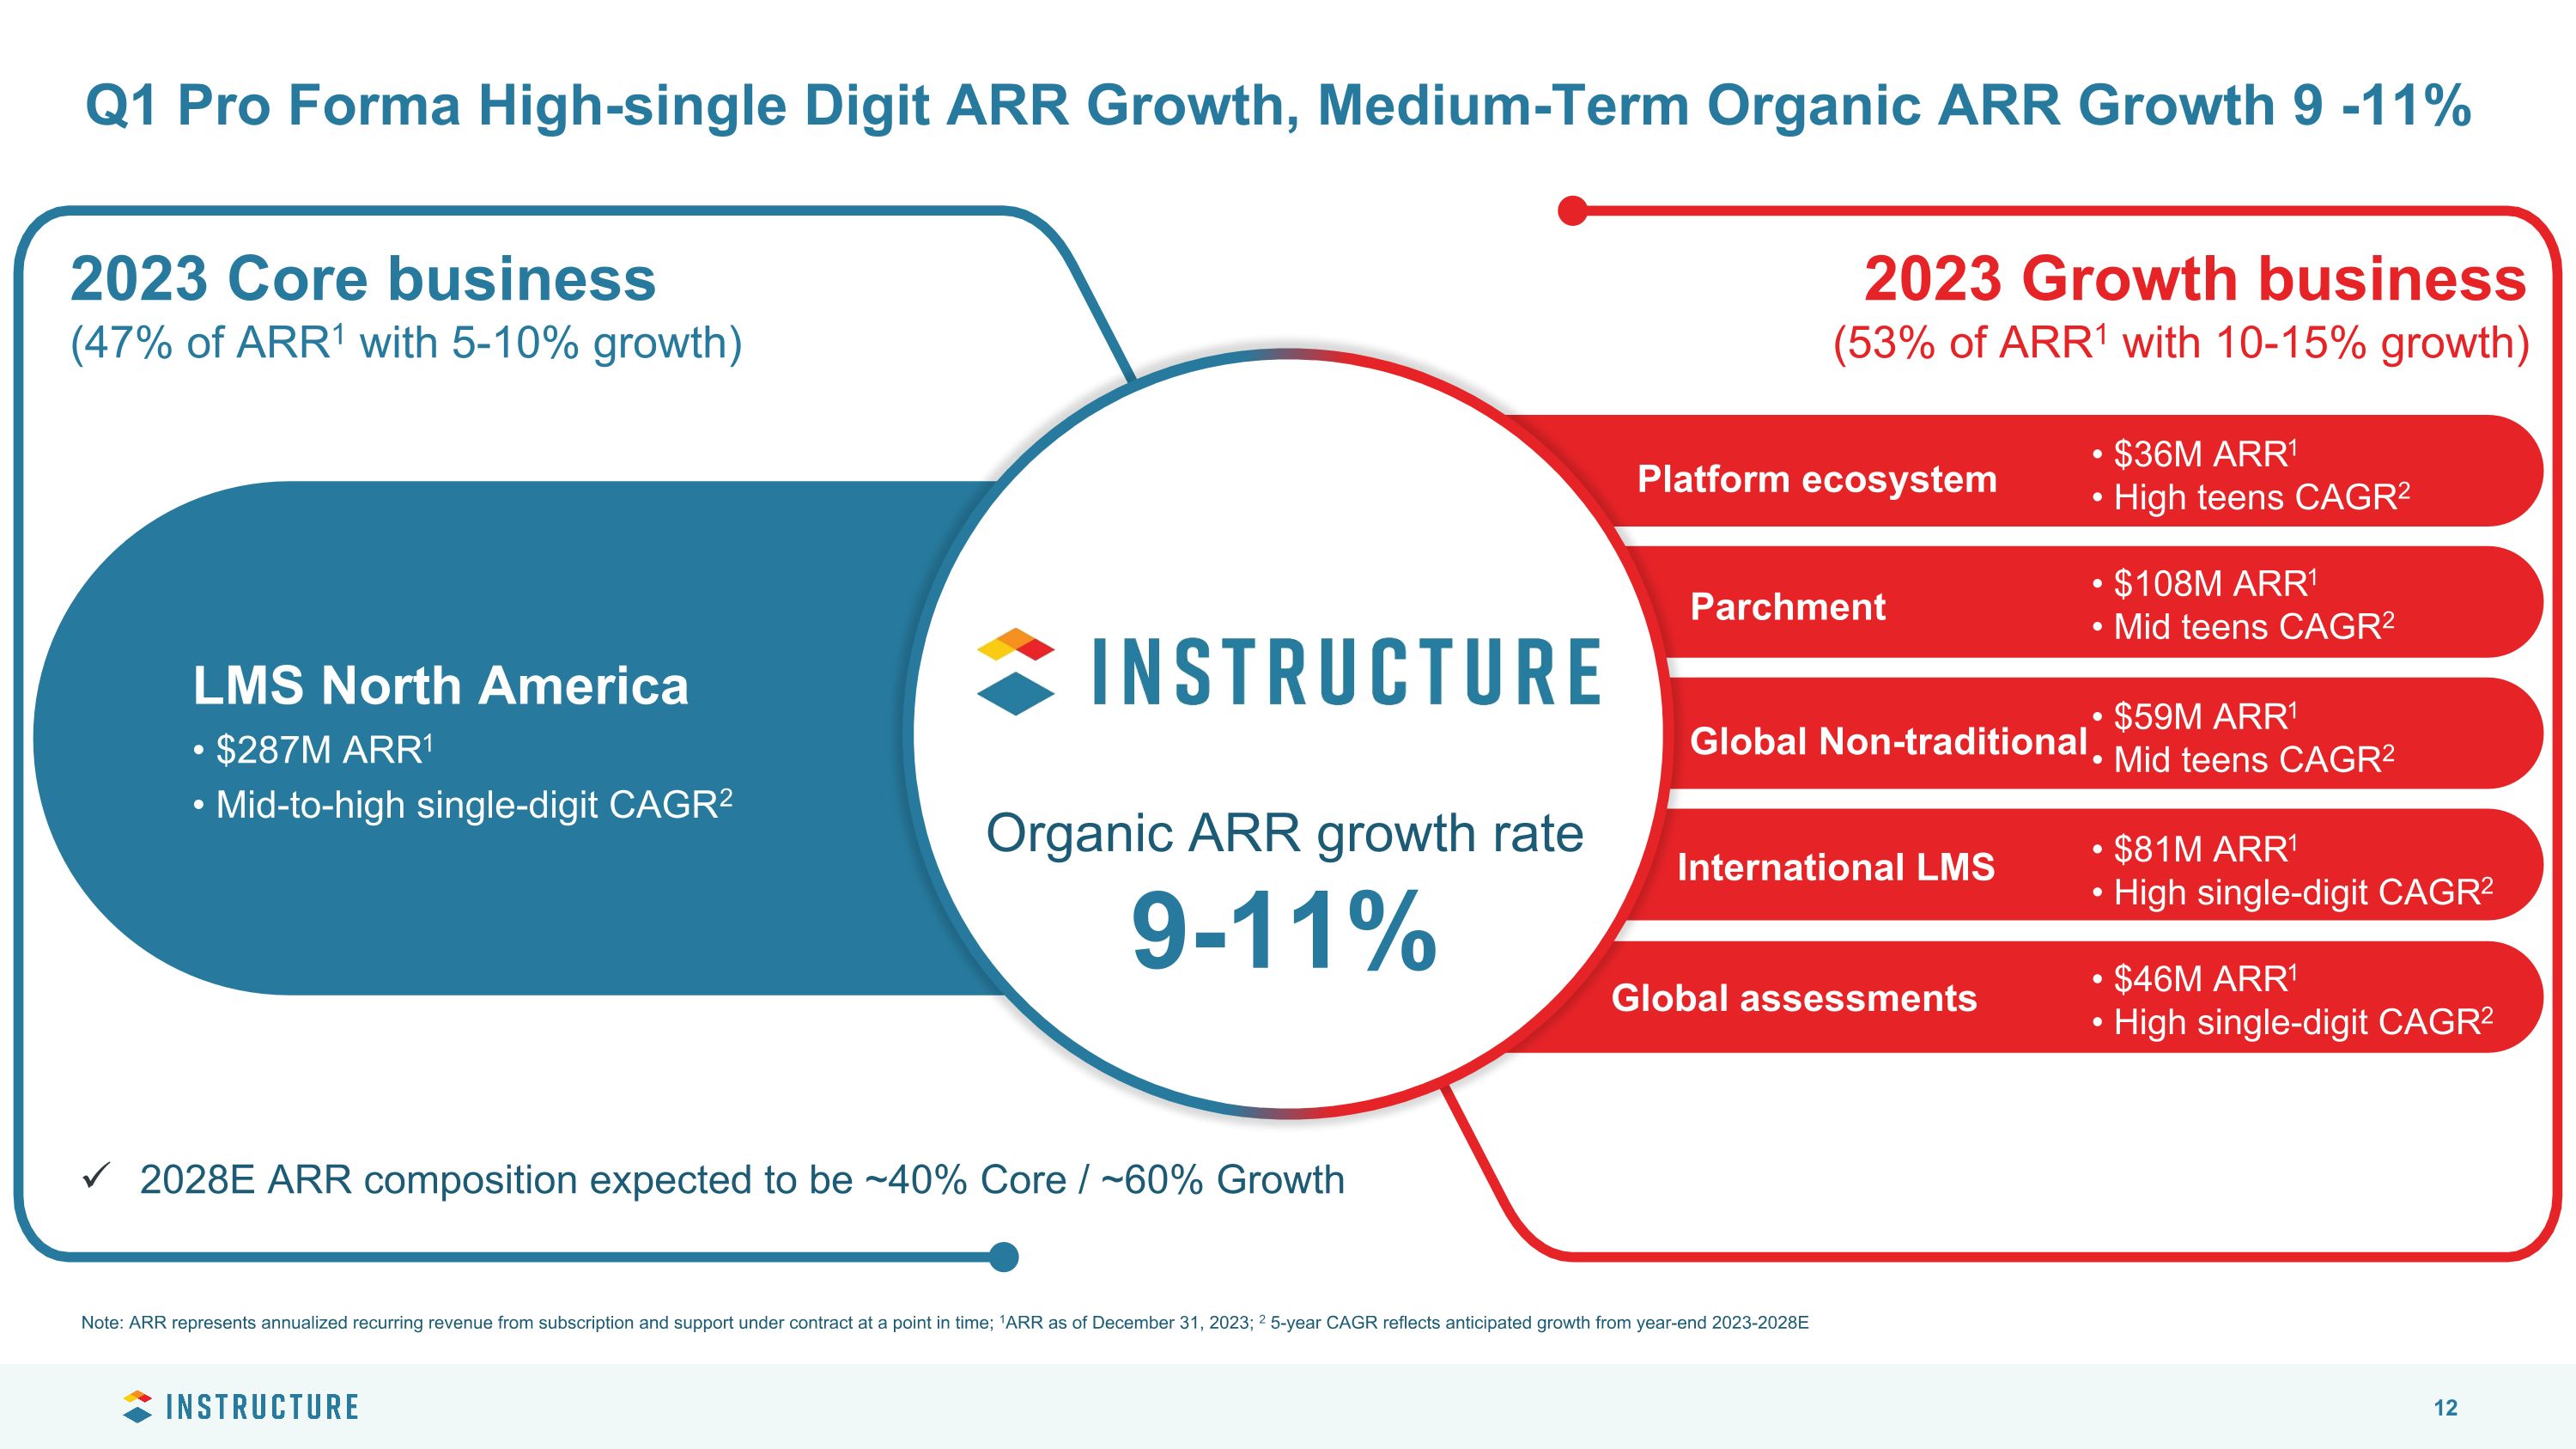
Global assessments • $46M ARR1 • High single-digit CAGR2 • $81M ARR1 • High single-digit CAGR2 International LMS Global Non-traditional • $59M ARR1 • Mid teens CAGR2 • $108M ARR1 • Mid teens CAGR2 Parchment Platform ecosystem • $36M ARR1 • High teens CAGR2 LMS North America • $287M ARR1 • Mid-to-high single-digit CAGR2 Q1 Pro Forma High-single Digit ARR Growth, Medium-Term Organic ARR Growth 9 -11% Note: ARR represents annualized recurring revenue from subscription and support under contract at a point in time; 1ARR as of December 31, 2023; 2 5-year CAGR reflects anticipated growth from year-end 2023-2028E 2023 Growth business (53% of ARR1 with 10-15% growth) 2023 Core business (47% of ARR1 with 5-10% growth) 2028E ARR composition expected to be ~40% Core / ~60% Growth Organic ARR growth rate 9-11%
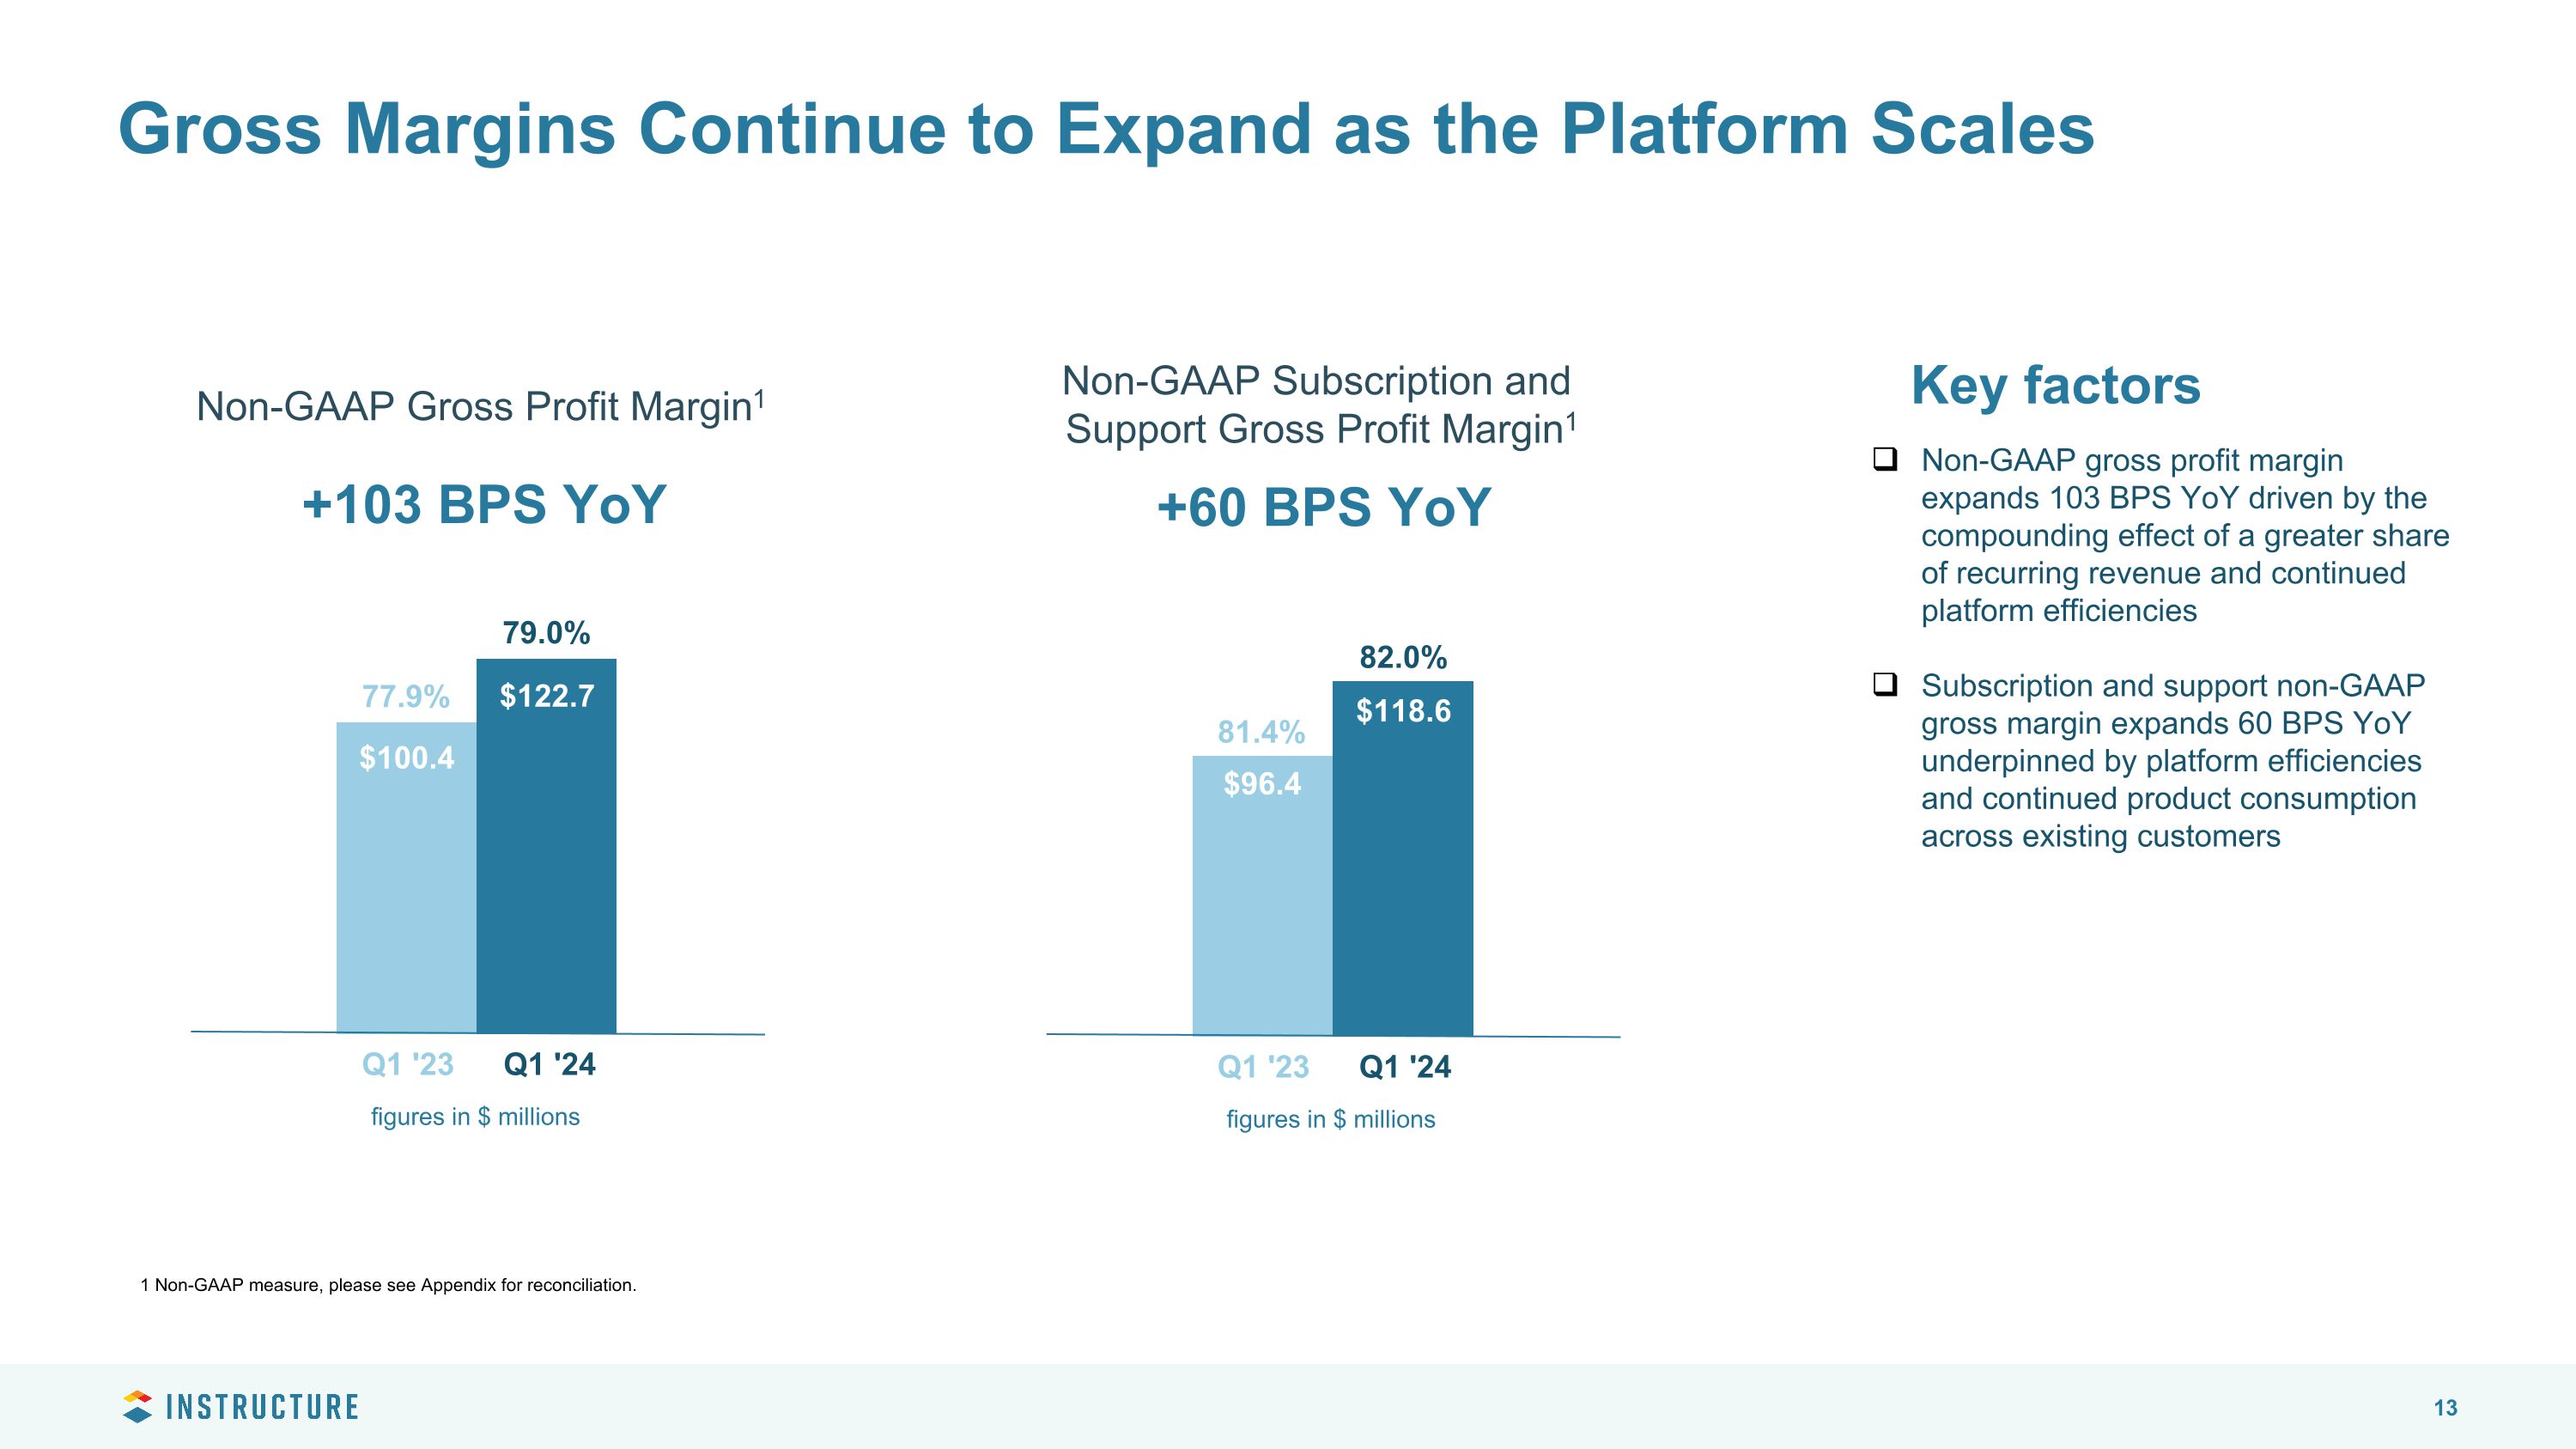
Non-GAAP Subscription and Support Gross Profit Margin1 +60 BPS YoY Non-GAAP Gross Profit Margin1 +103 BPS YoY Gross Margins Continue to Expand as the Platform Scales 81.4% 82.0% Q1 '23 Q1 '24 figures in $ millions $96.4 $118.6 Non-GAAP gross profit margin expands 103 BPS YoY driven by the compounding effect of a greater share of recurring revenue and continued platform efficiencies Subscription and support non-GAAP gross margin expands 60 BPS YoY underpinned by platform efficiencies and continued product consumption across existing customers 77.9% 79.0% Q1 '23 Q1 '24 figures in $ millions $100.4 $122.7 Key factors 1 Non-GAAP measure, please see Appendix for reconciliation.
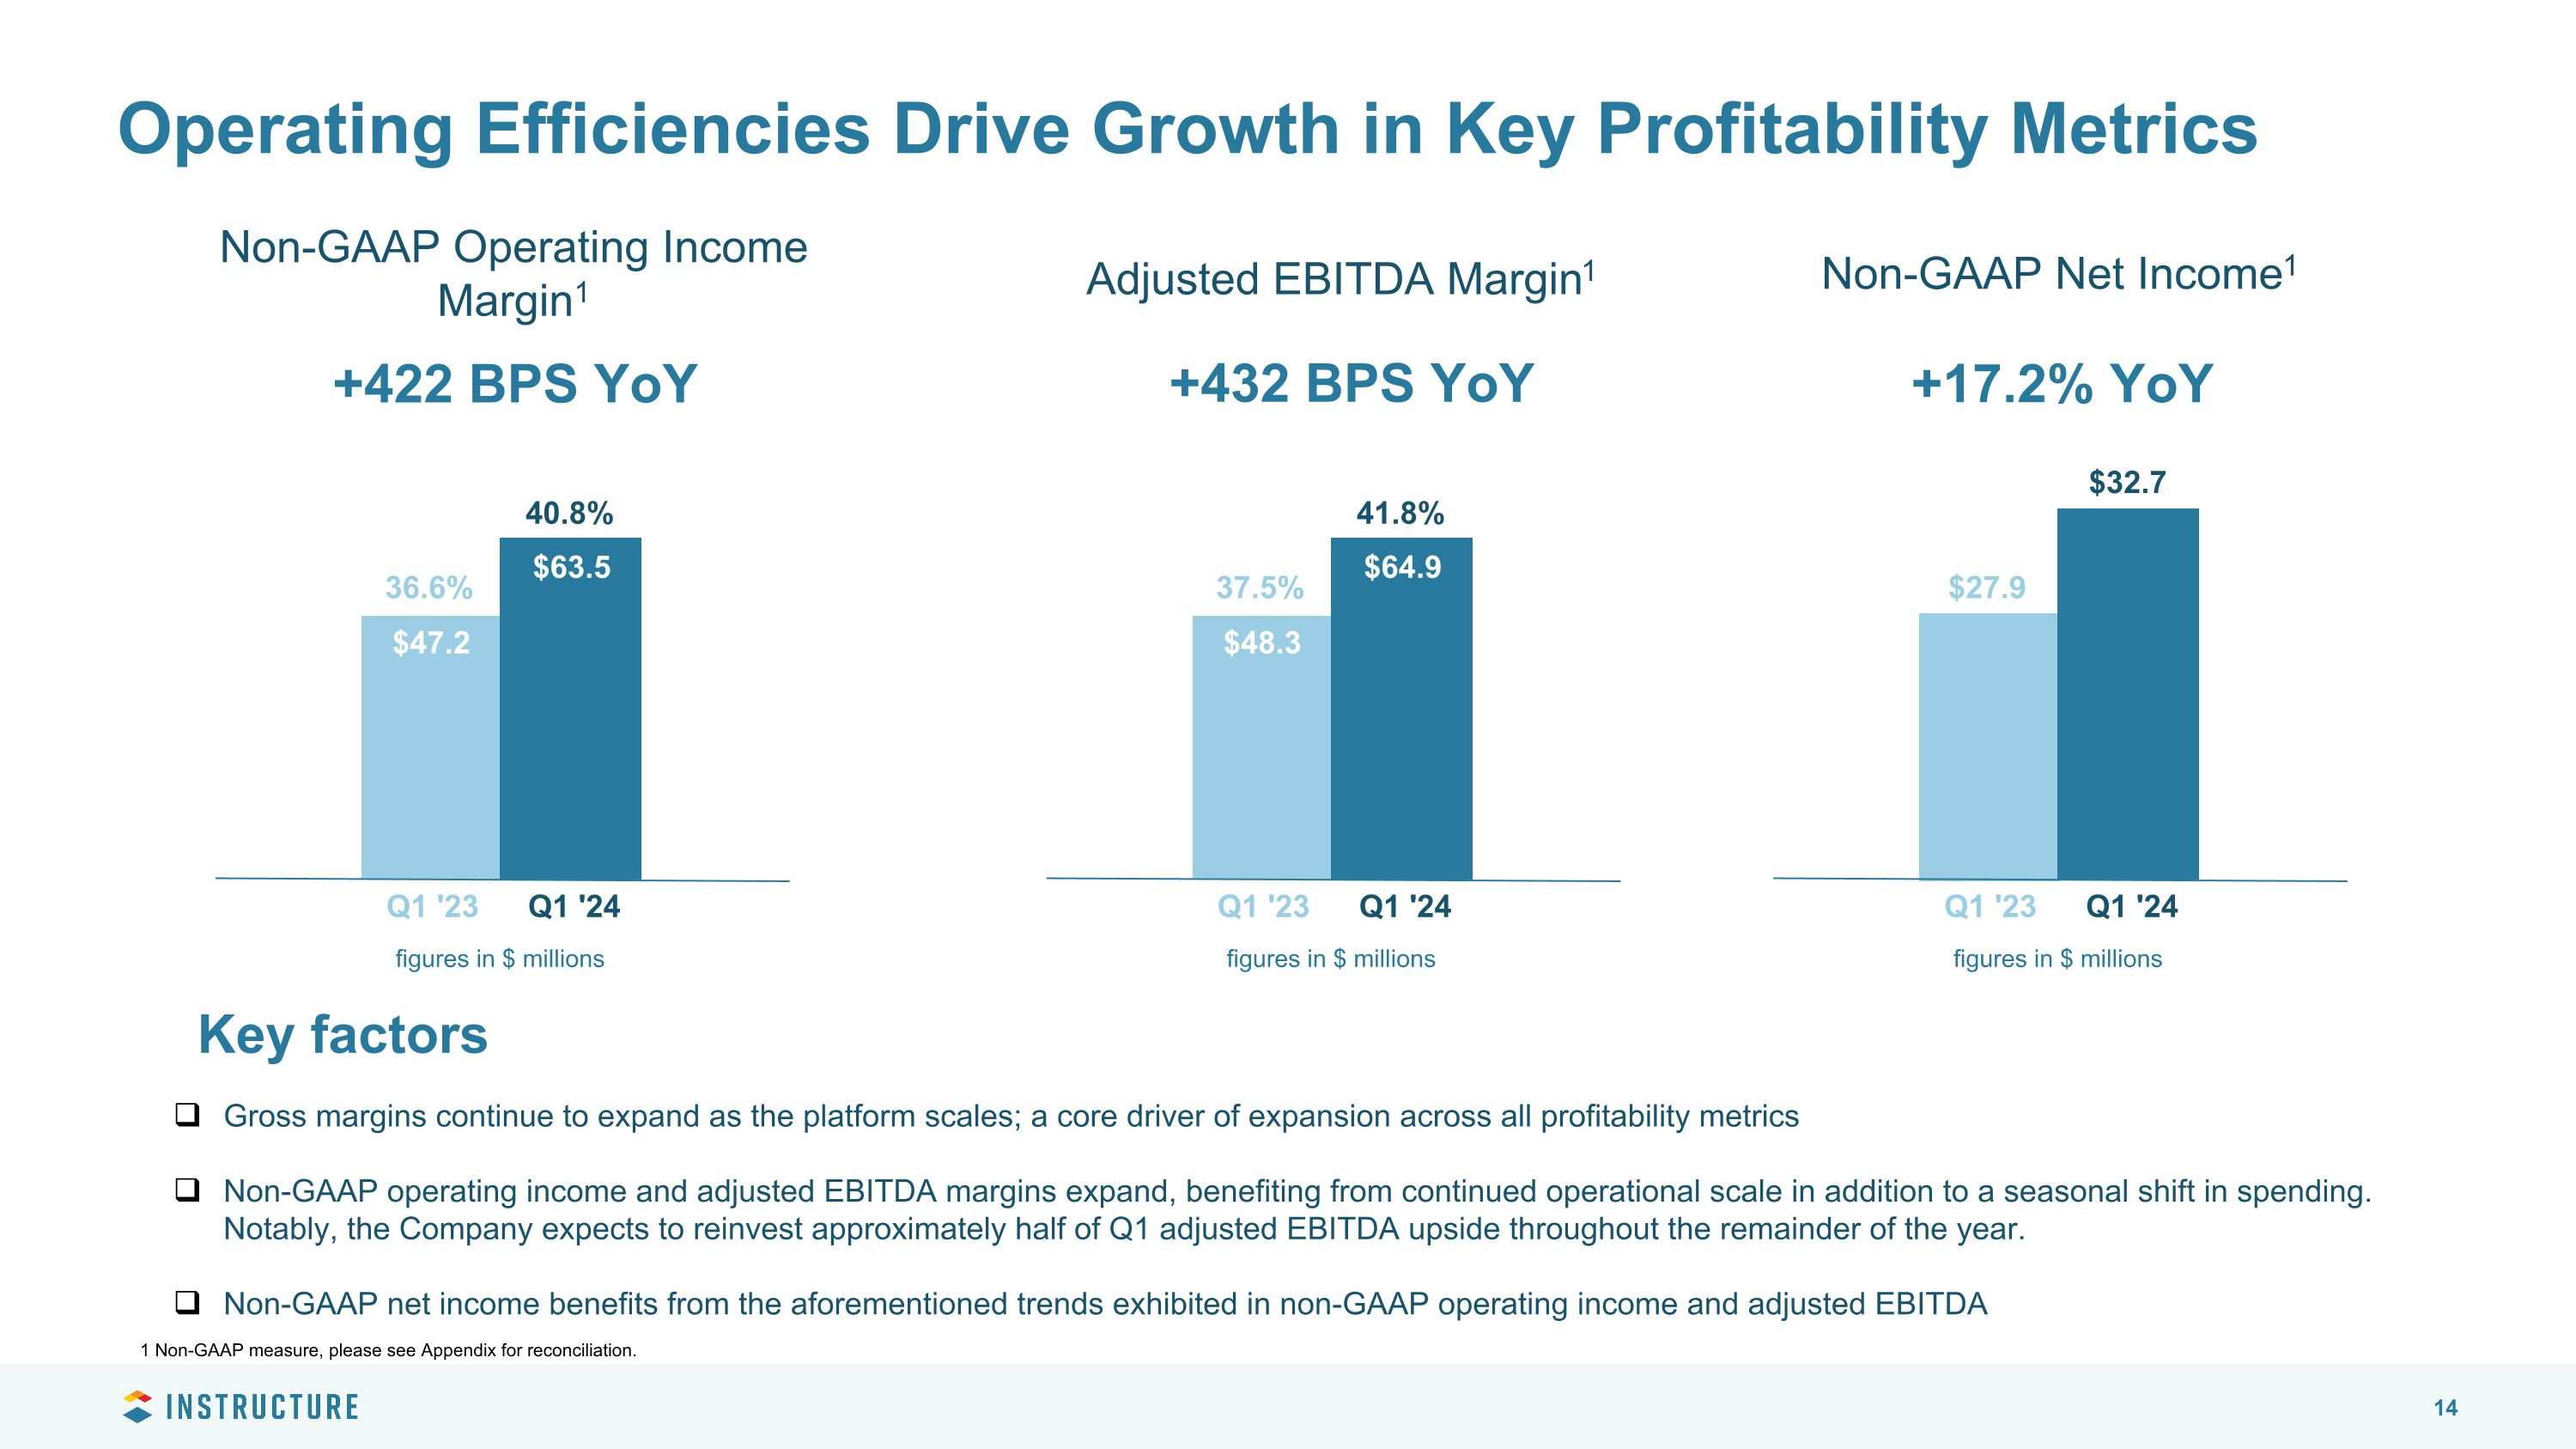
+432 BPS YoY Adjusted EBITDA Margin1 +422 BPS YoY Non-GAAP Operating Income Margin1 Operating Efficiencies Drive Growth in Key Profitability Metrics +17.2% YoY Gross margins continue to expand as the platform scales; a core driver of expansion across all profitability metrics Non-GAAP operating income and adjusted EBITDA margins expand, benefiting from continued operational scale in addition to a seasonal shift in spending. Notably, the Company expects to reinvest approximately half of Q1 adjusted EBITDA upside throughout the remainder of the year. Non-GAAP net income benefits from the aforementioned trends exhibited in non-GAAP operating income and adjusted EBITDA Non-GAAP Net Income1 36.6% 40.8% Q1 '23 Q1 '24 figures in $ millions $47.2 $63.5 37.5% 41.8% Q1 '23 Q1 '24 figures in $ millions $48.3 $64.9 $27.9 $32.7 Q1 '23 Q1 '24 figures in $ millions Key factors 1 Non-GAAP measure, please see Appendix for reconciliation.
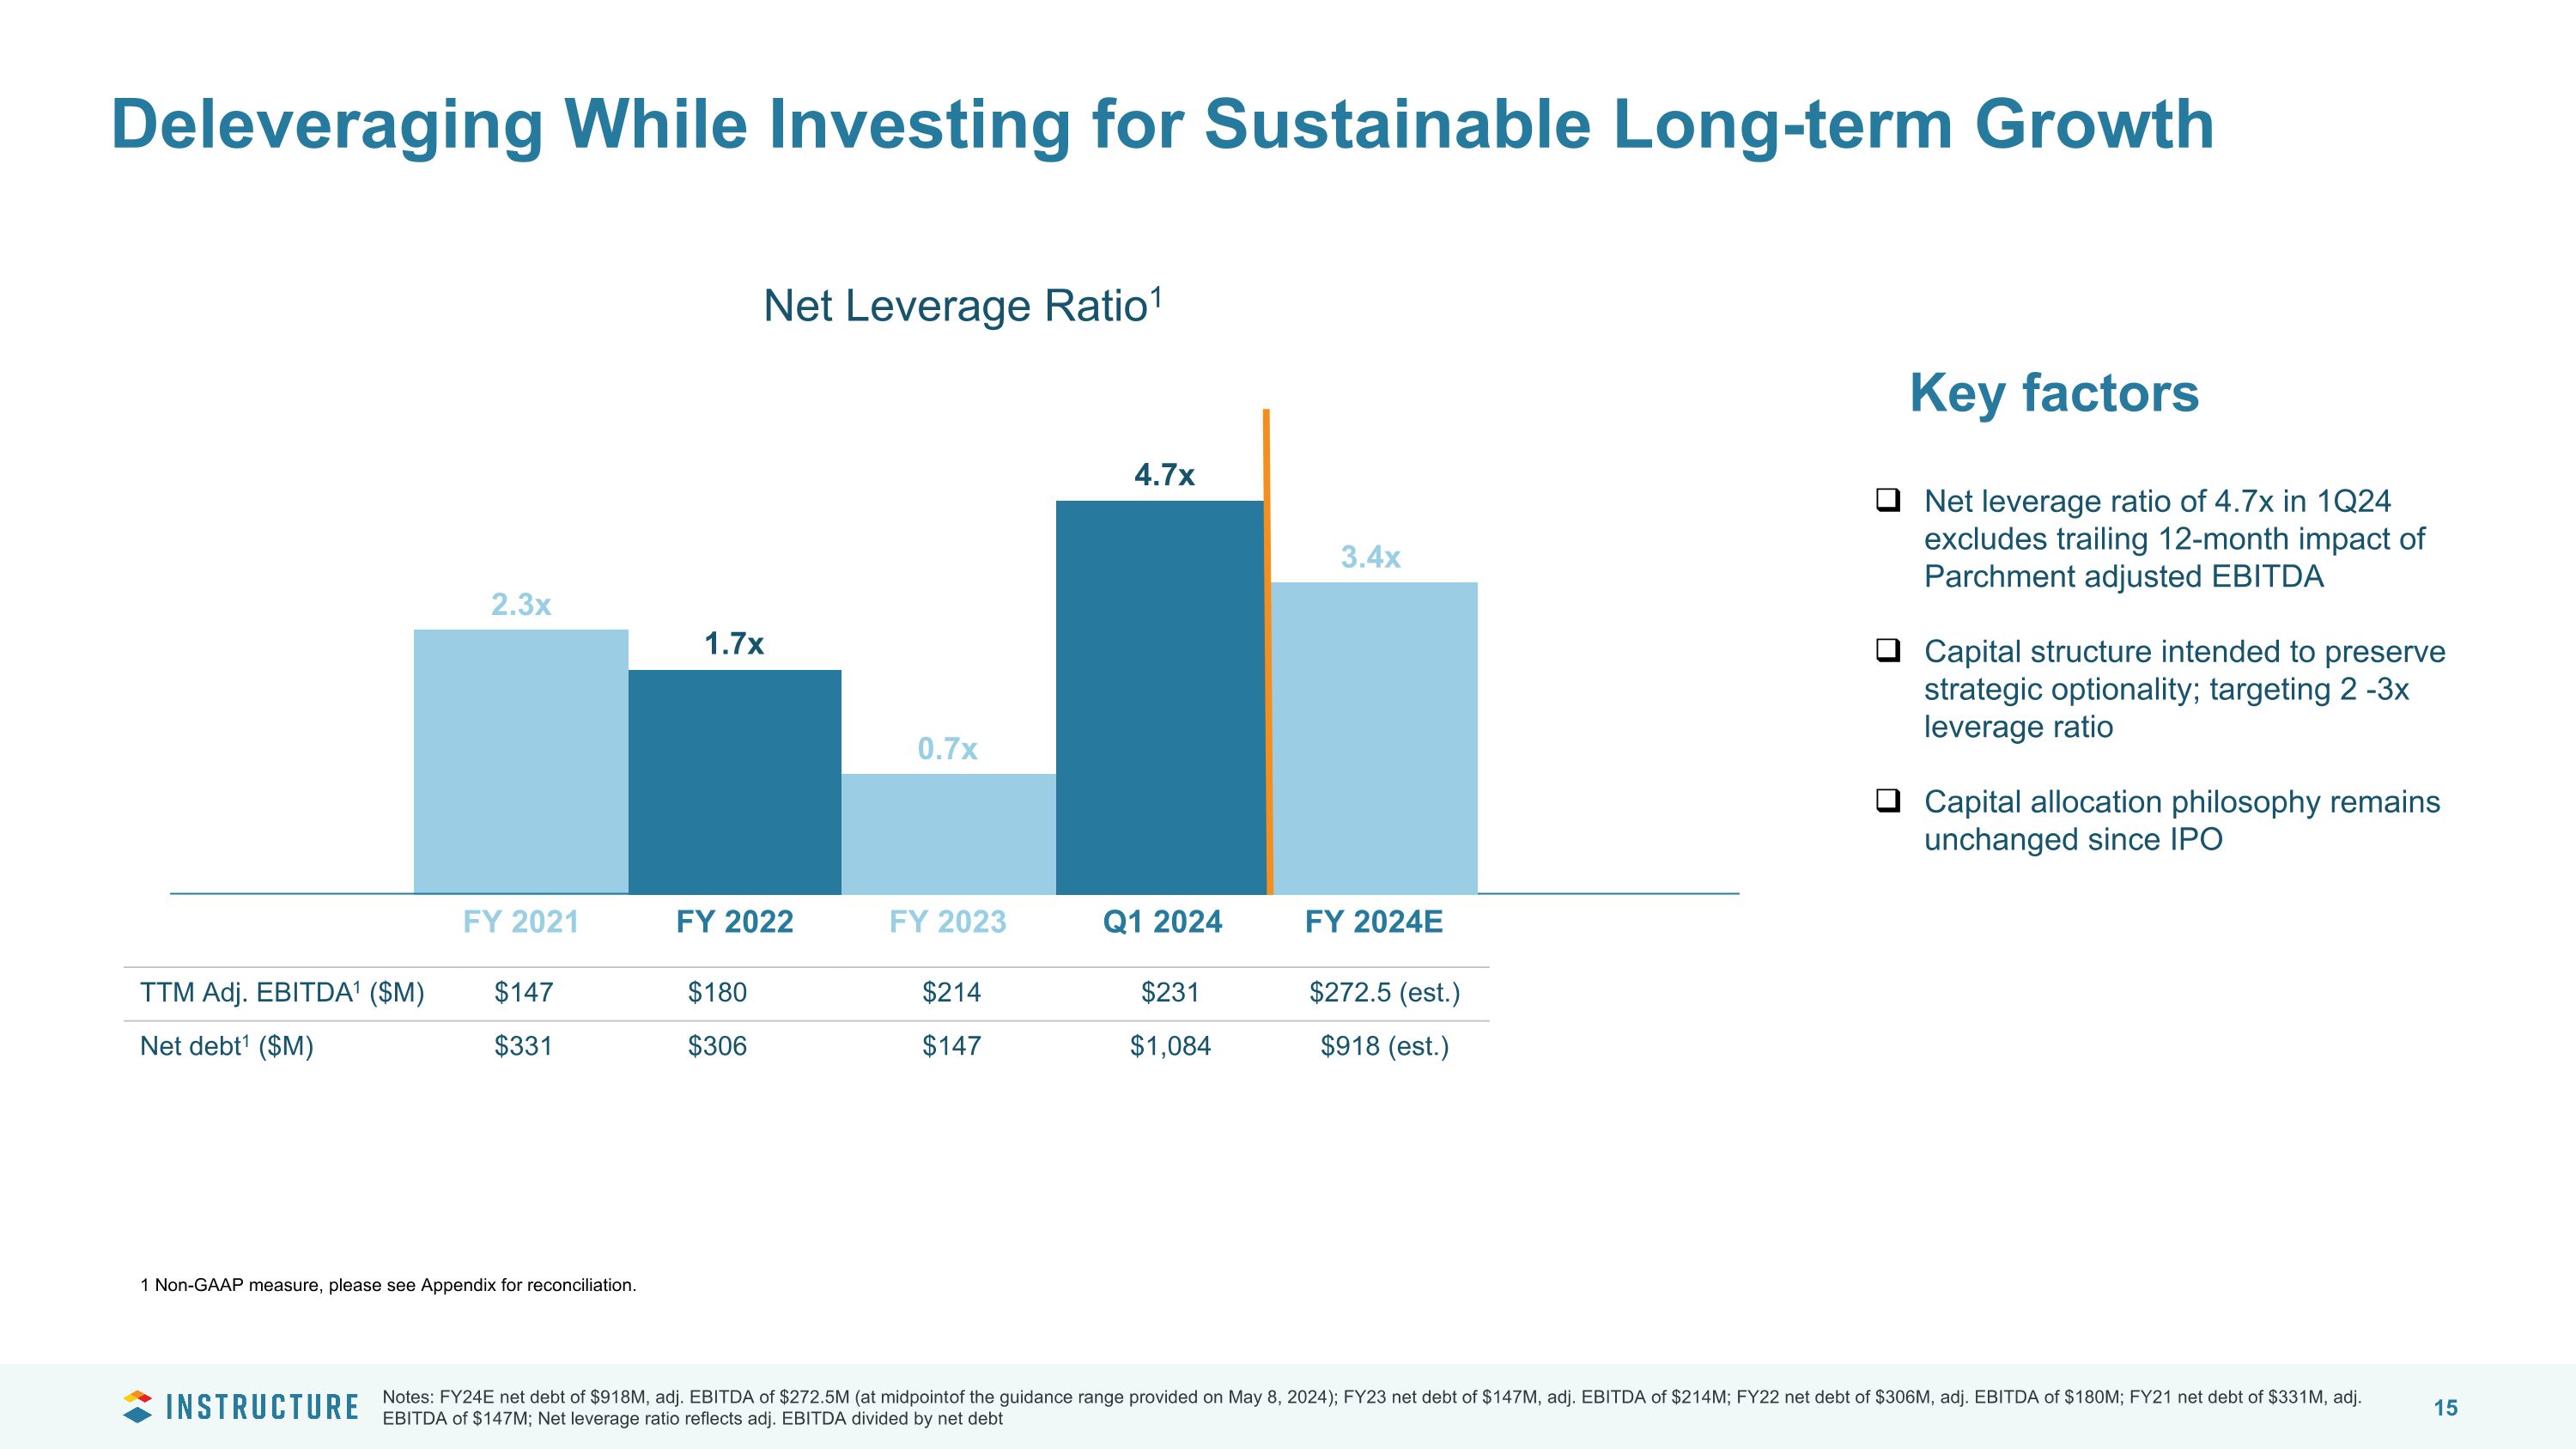
Deleveraging While Investing for Sustainable Long-term Growth TTM Adj. EBITDA1 ($M) $147 $180 $214 $231 $272.5 (est.) Net debt1 ($M) $331 $306 $147 $1,084 $918 (est.) Notes: FY24E net debt of $918M, adj. EBITDA of $272.5M (at midpoint of the guidance range provided on May 8, 2024); FY23 net debt of $147M, adj. EBITDA of $214M; FY22 net debt of $306M, adj. EBITDA of $180M; FY21 net debt of $331M, adj. EBITDA of $147M; Net leverage ratio reflects adj. EBITDA divided by net debt Net Leverage Ratio1 Net leverage ratio of 4.7x in 1Q24 excludes trailing 12-month impact of Parchment adjusted EBITDA Capital structure intended to preserve strategic optionality; targeting 2 -3x leverage ratio Capital allocation philosophy remains unchanged since IPO Key factors 2.3x 1.7x FY 2021 $63 FY 2022 FY 2023 Q1 2024 0.7x 4.7x FY 2024E 3.4x 1 Non-GAAP measure, please see Appendix for reconciliation.
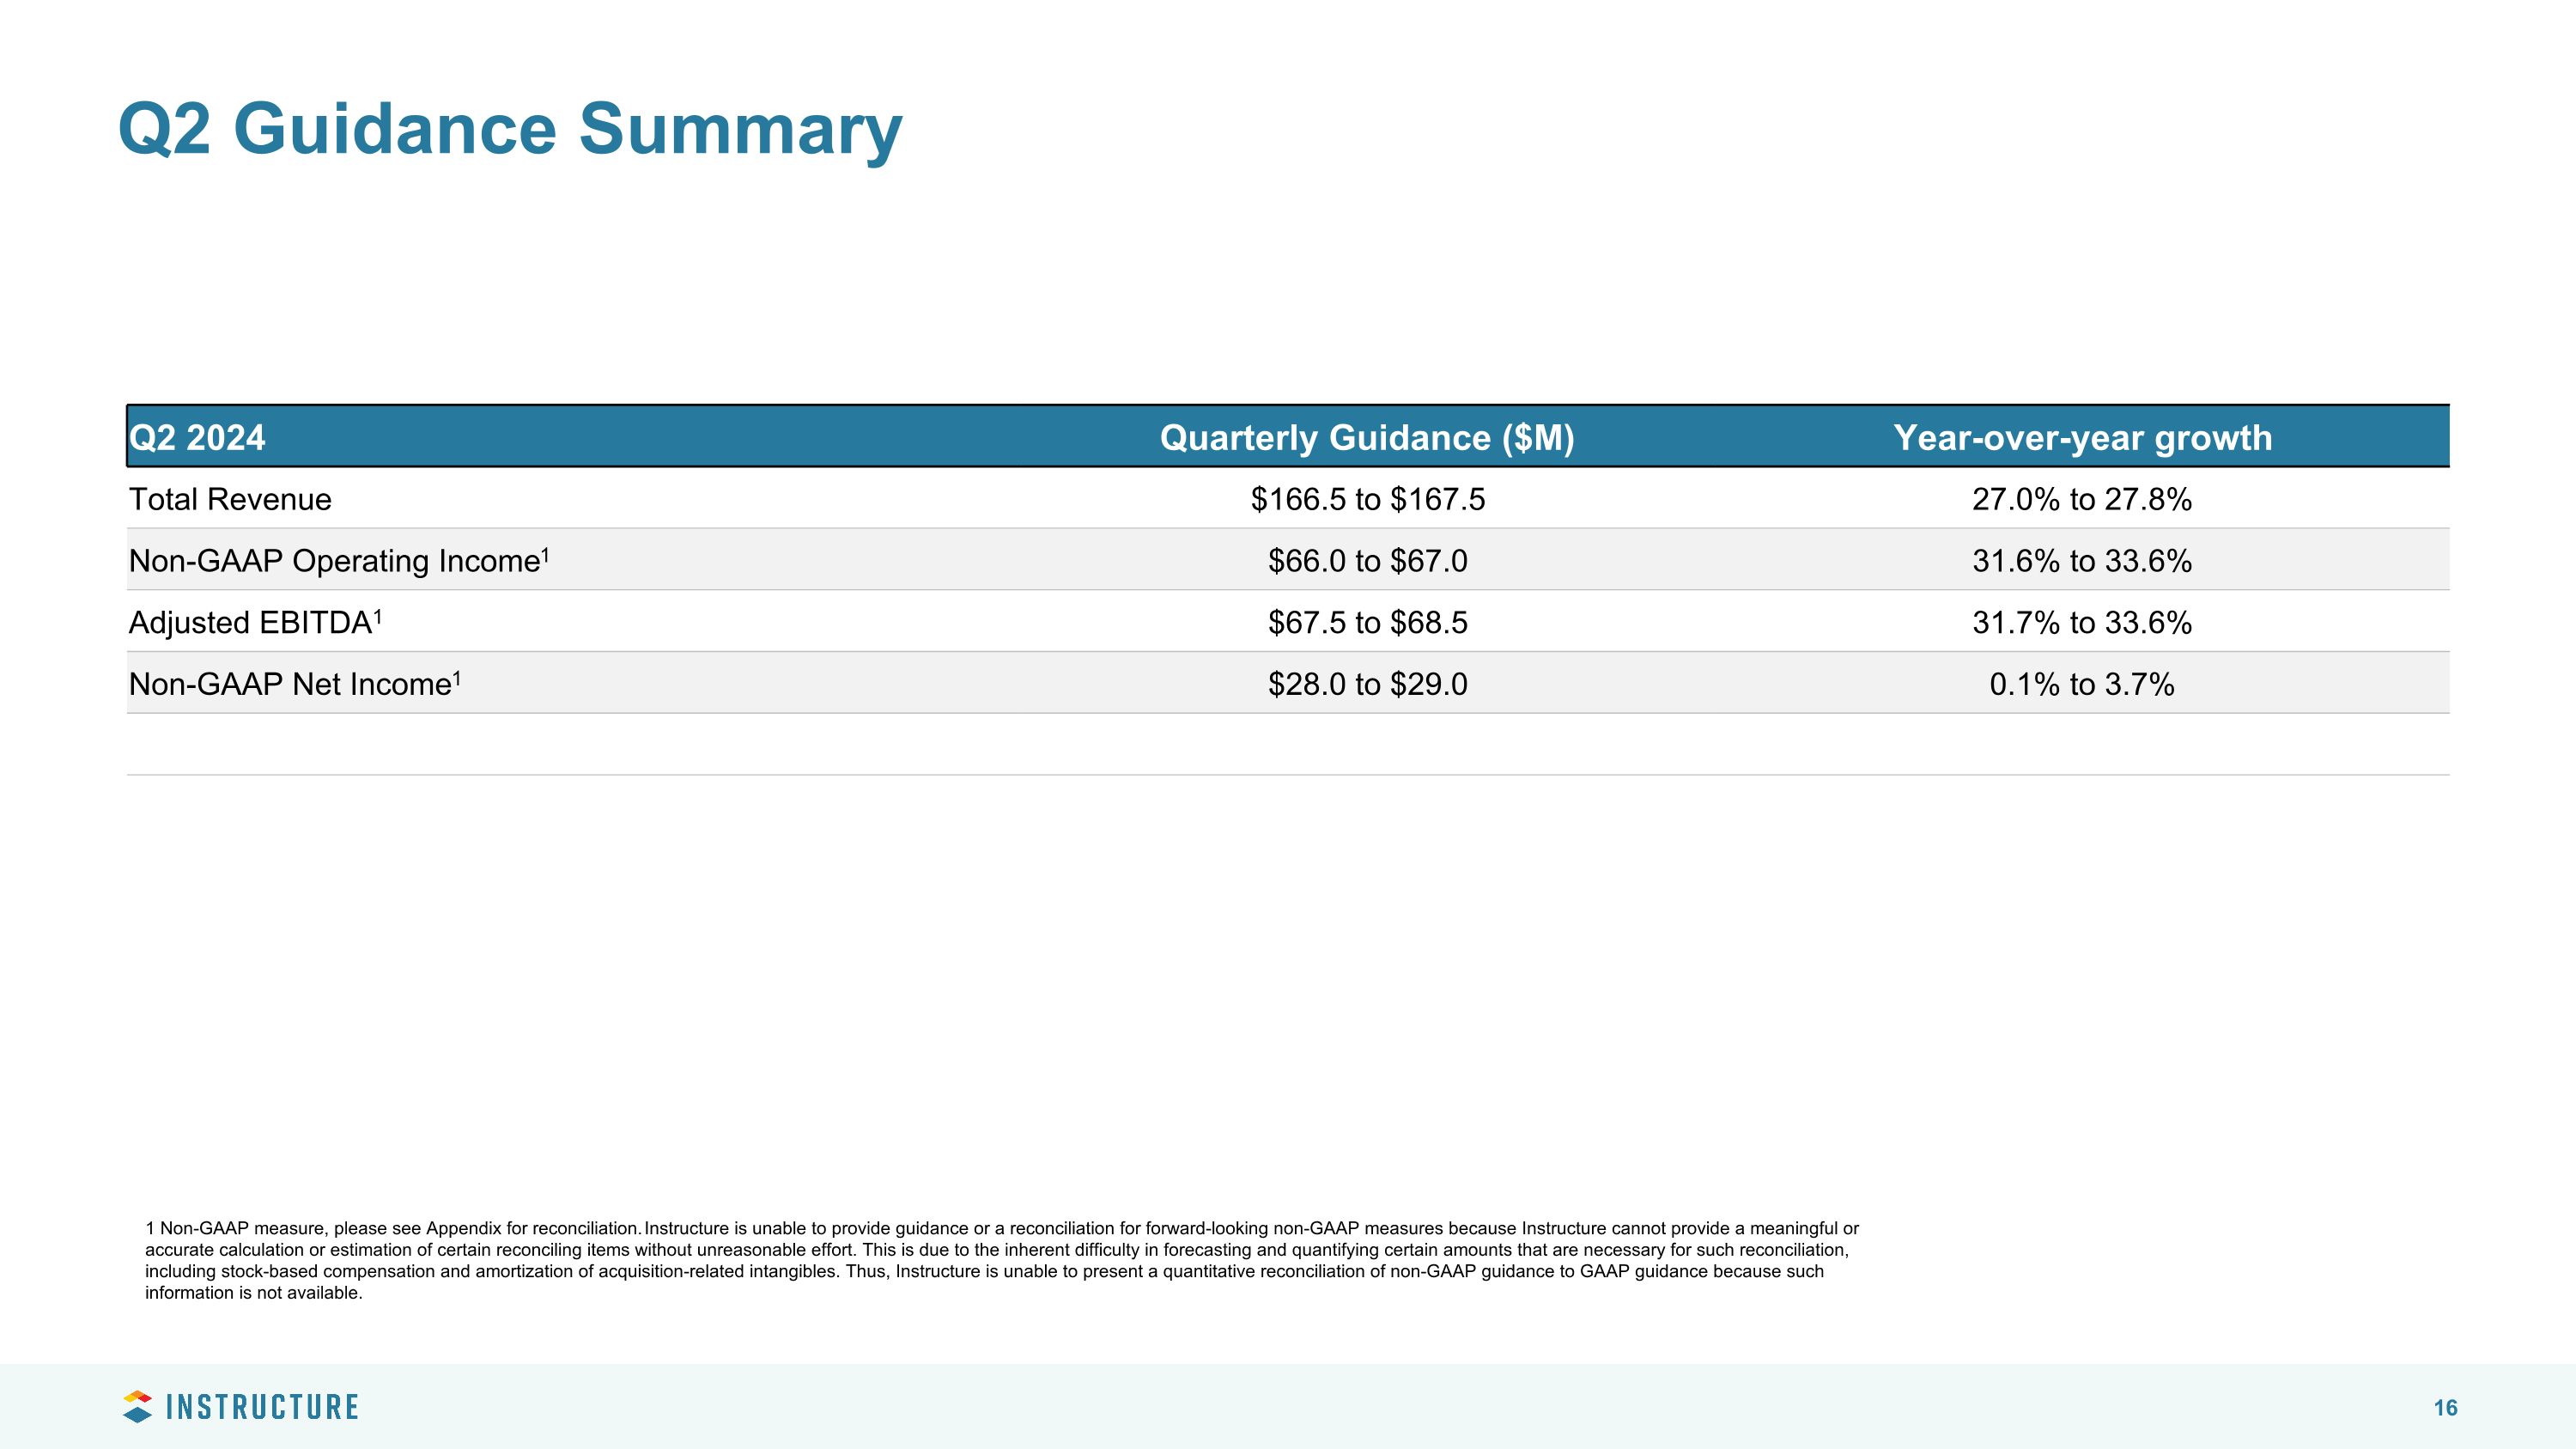
Q2 2024 Quarterly Guidance ($M) Year-over-year growth Total Revenue $166.5 to $167.5 27.0% to 27.8% Non-GAAP Operating Income1 $66.0 to $67.0 31.6% to 33.6% Adjusted EBITDA1 $67.5 to $68.5 31.7% to 33.6% Non-GAAP Net Income1 $28.0 to $29.0 0.1% to 3.7% Q2 Guidance Summary 1 Non-GAAP measure, please see Appendix for reconciliation. Instructure is unable to provide guidance or a reconciliation for forward-looking non-GAAP measures because Instructure cannot provide a meaningful or accurate calculation or estimation of certain reconciling items without unreasonable effort. This is due to the inherent difficulty in forecasting and quantifying certain amounts that are necessary for such reconciliation, including stock-based compensation and amortization of acquisition-related intangibles. Thus, Instructure is unable to present a quantitative reconciliation of non-GAAP guidance to GAAP guidance because such information is not available.
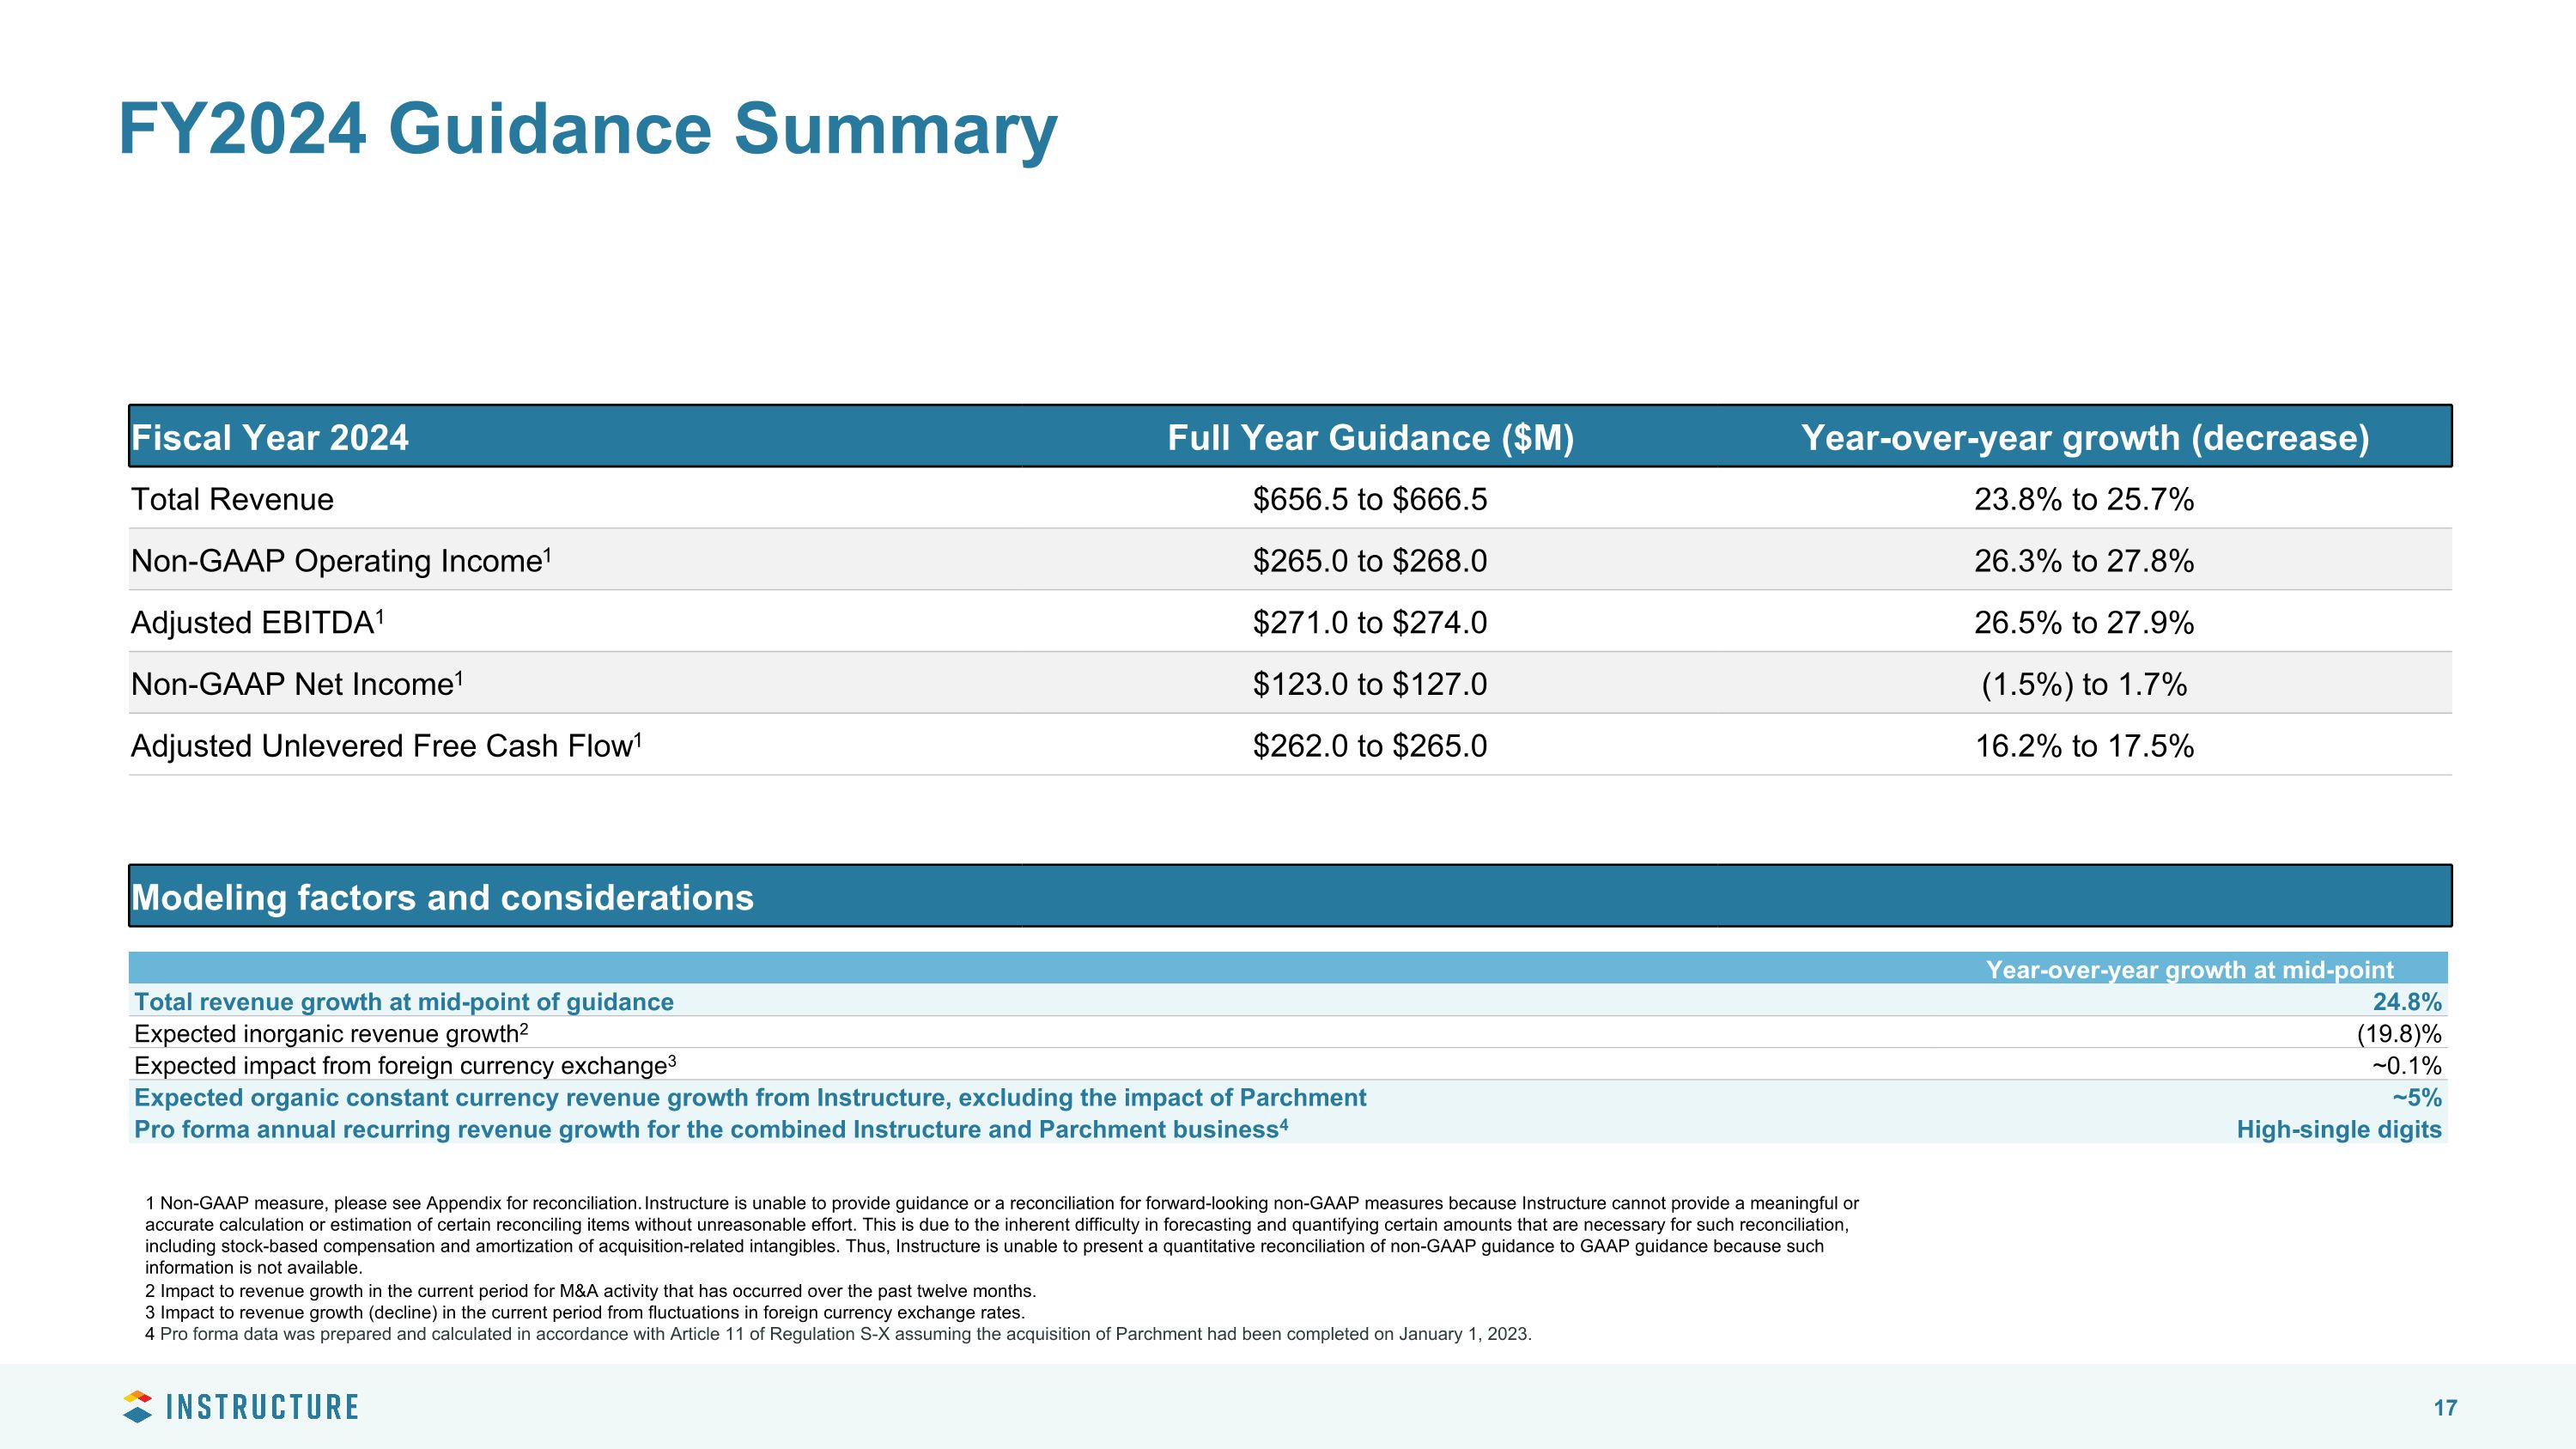
Fiscal Year 2024 Full Year Guidance ($M) Year-over-year growth (decrease) Total Revenue $656.5 to $666.5 23.8% to 25.7% Non-GAAP Operating Income1 $265.0 to $268.0 26.3% to 27.8% Adjusted EBITDA1 $271.0 to $274.0 26.5% to 27.9% Non-GAAP Net Income1 $123.0 to $127.0 (1.5%) to 1.7% Adjusted Unlevered Free Cash Flow1 $262.0 to $265.0 16.2% to 17.5% FY2024 Guidance Summary Modeling factors and considerations 2 Impact to revenue growth in the current period for M&A activity that has occurred over the past twelve months. 3 Impact to revenue growth (decline) in the current period from fluctuations in foreign currency exchange rates. 4 Pro forma data was prepared and calculated in accordance with Article 11 of Regulation S-X assuming the acquisition of Parchment had been completed on January 1, 2023. Year-over-year growth at mid-point Total revenue growth at mid-point of guidance 24.8% Expected inorganic revenue growth2 (19.8)% Expected impact from foreign currency exchange3 ~0.1% Expected organic constant currency revenue growth from Instructure, excluding the impact of Parchment ~5% Pro forma annual recurring revenue growth for the combined Instructure and Parchment business4 High-single digits 1 Non-GAAP measure, please see Appendix for reconciliation. Instructure is unable to provide guidance or a reconciliation for forward-looking non-GAAP measures because Instructure cannot provide a meaningful or accurate calculation or estimation of certain reconciling items without unreasonable effort. This is due to the inherent difficulty in forecasting and quantifying certain amounts that are necessary for such reconciliation, including stock-based compensation and amortization of acquisition-related intangibles. Thus, Instructure is unable to present a quantitative reconciliation of non-GAAP guidance to GAAP guidance because such information is not available.
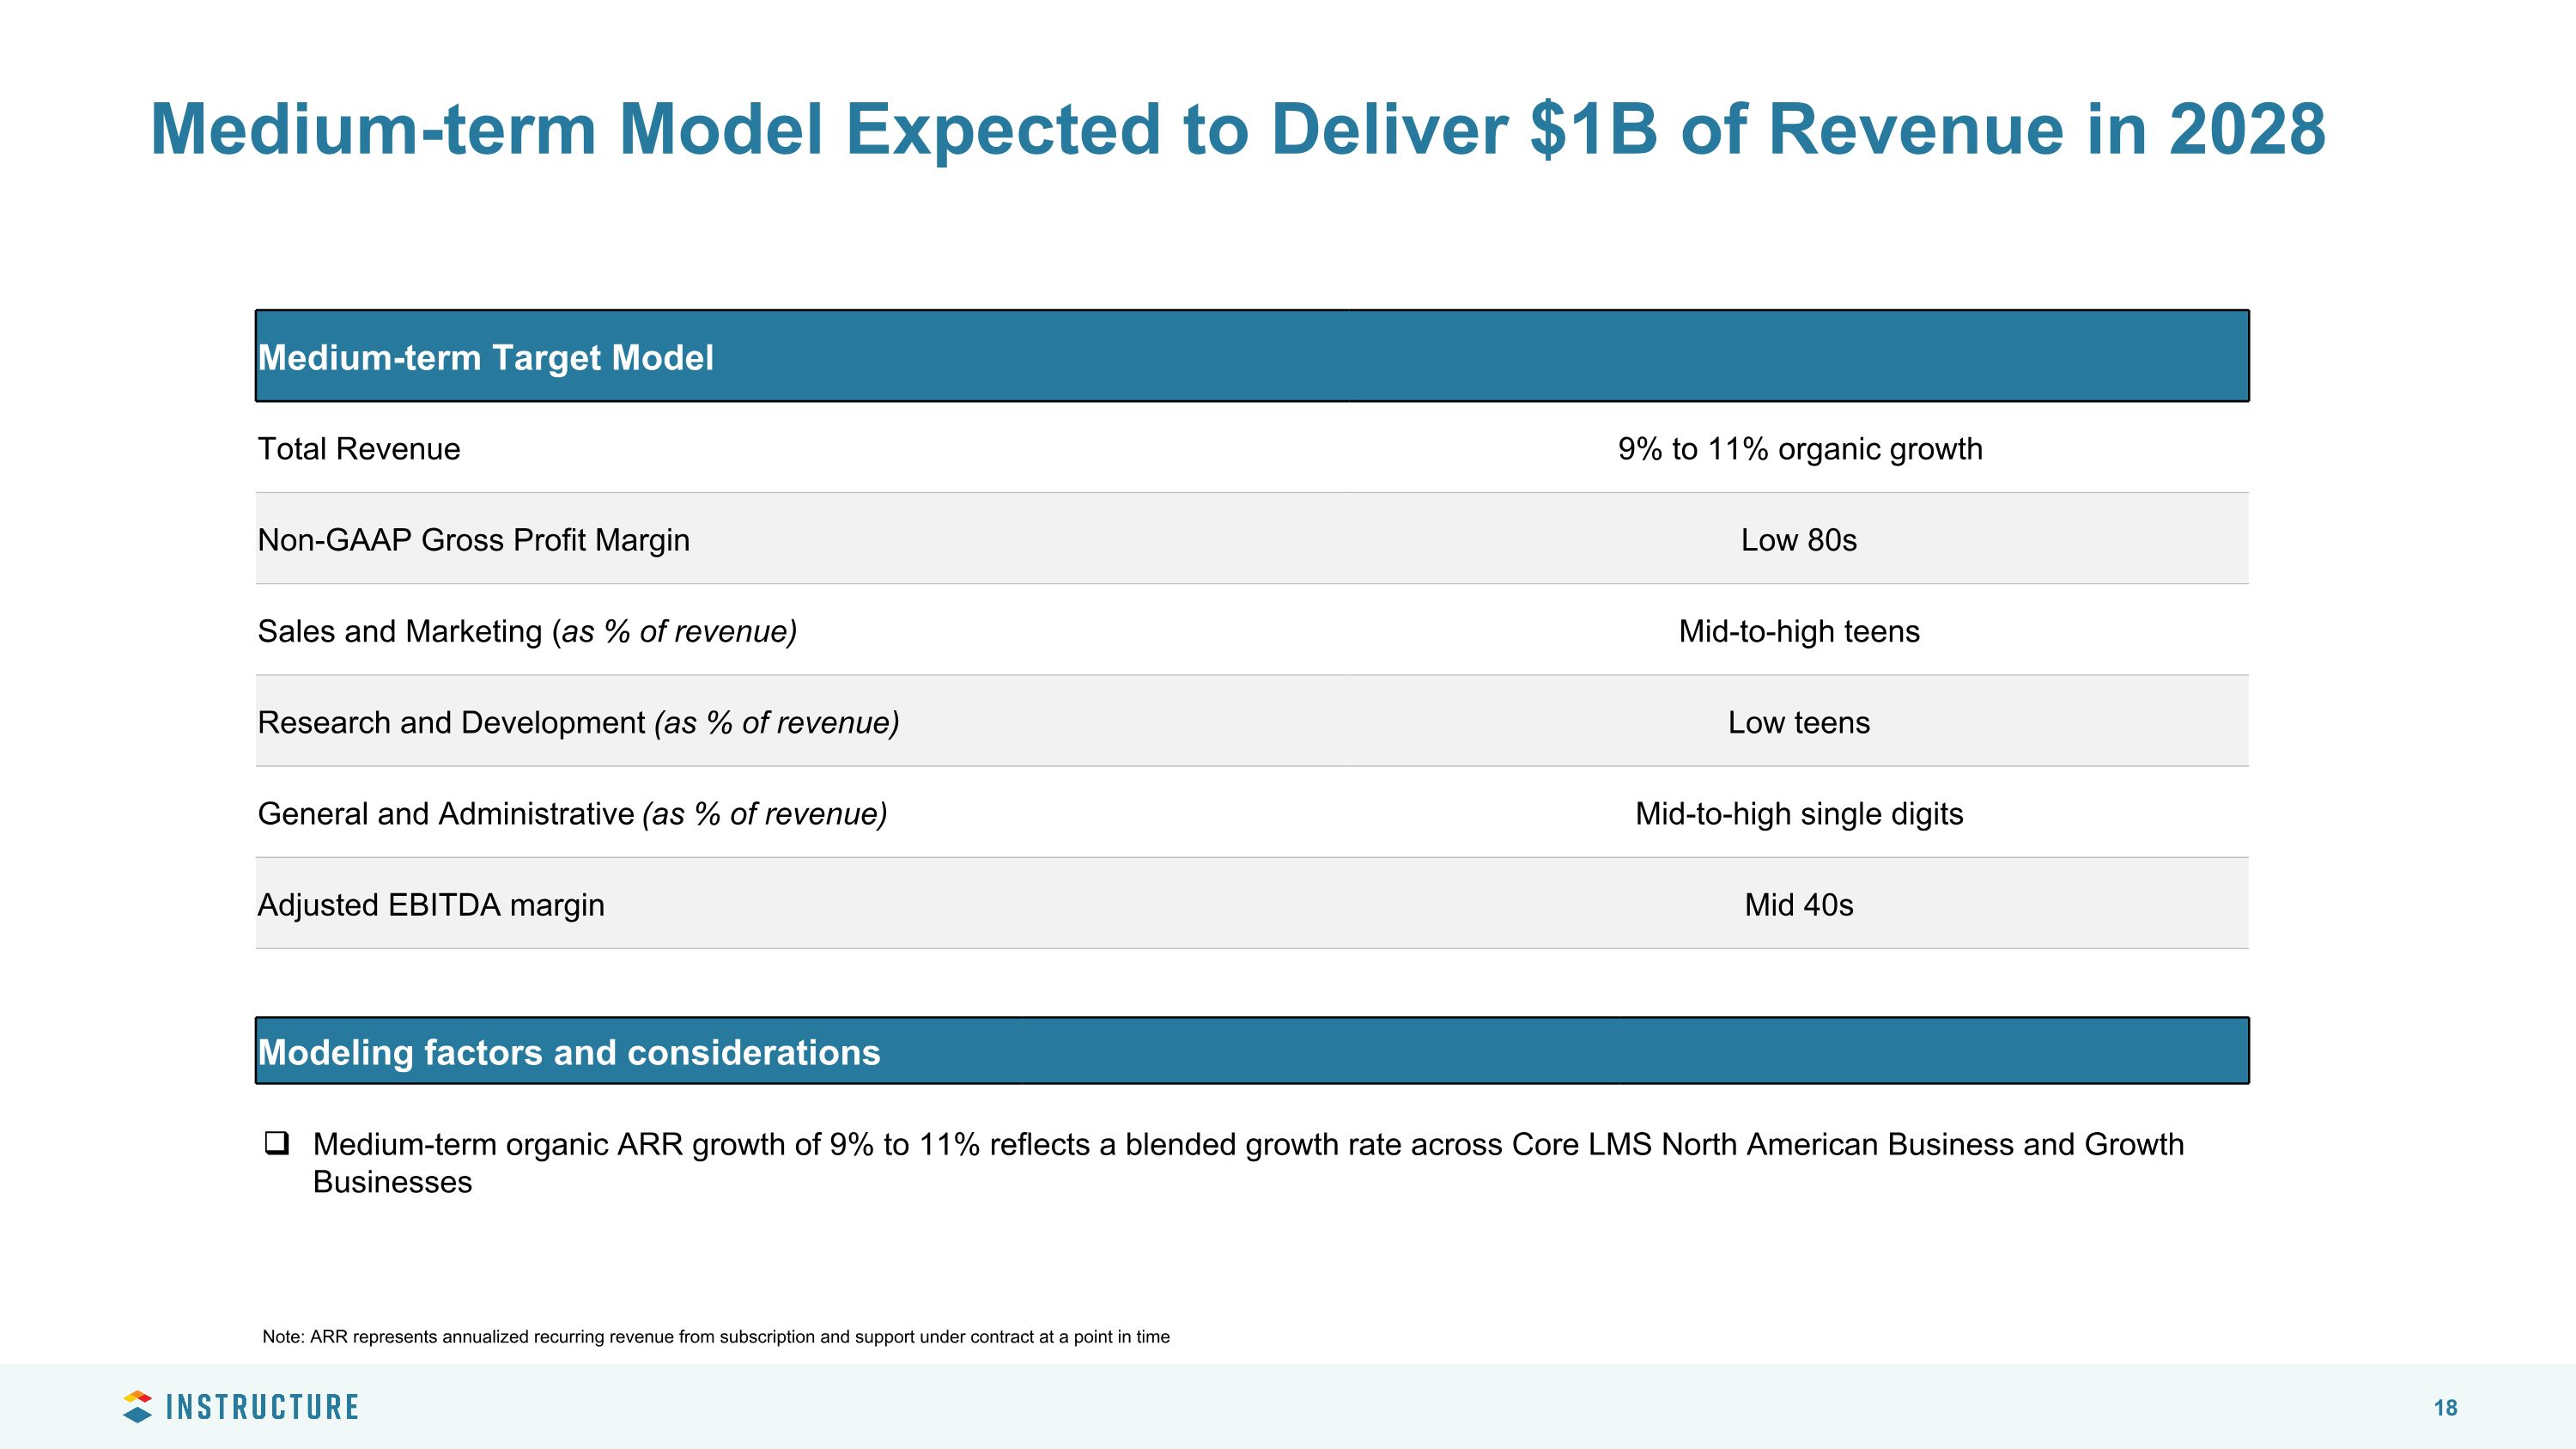
Medium-term Target Model Total Revenue 9% to 11% organic growth Non-GAAP Gross Profit Margin Low 80s Sales and Marketing (as % of revenue) Mid-to-high teens Research and Development (as % of revenue) Low teens General and Administrative (as % of revenue) Mid-to-high single digits Adjusted EBITDA margin Mid 40s Medium-term Model Expected to Deliver $1B of Revenue in 2028 Modeling factors and considerations Medium-term organic ARR growth of 9% to 11% reflects a blended growth rate across Core LMS North American Business and Growth Businesses Note: ARR represents annualized recurring revenue from subscription and support under contract at a point in time
Appendix
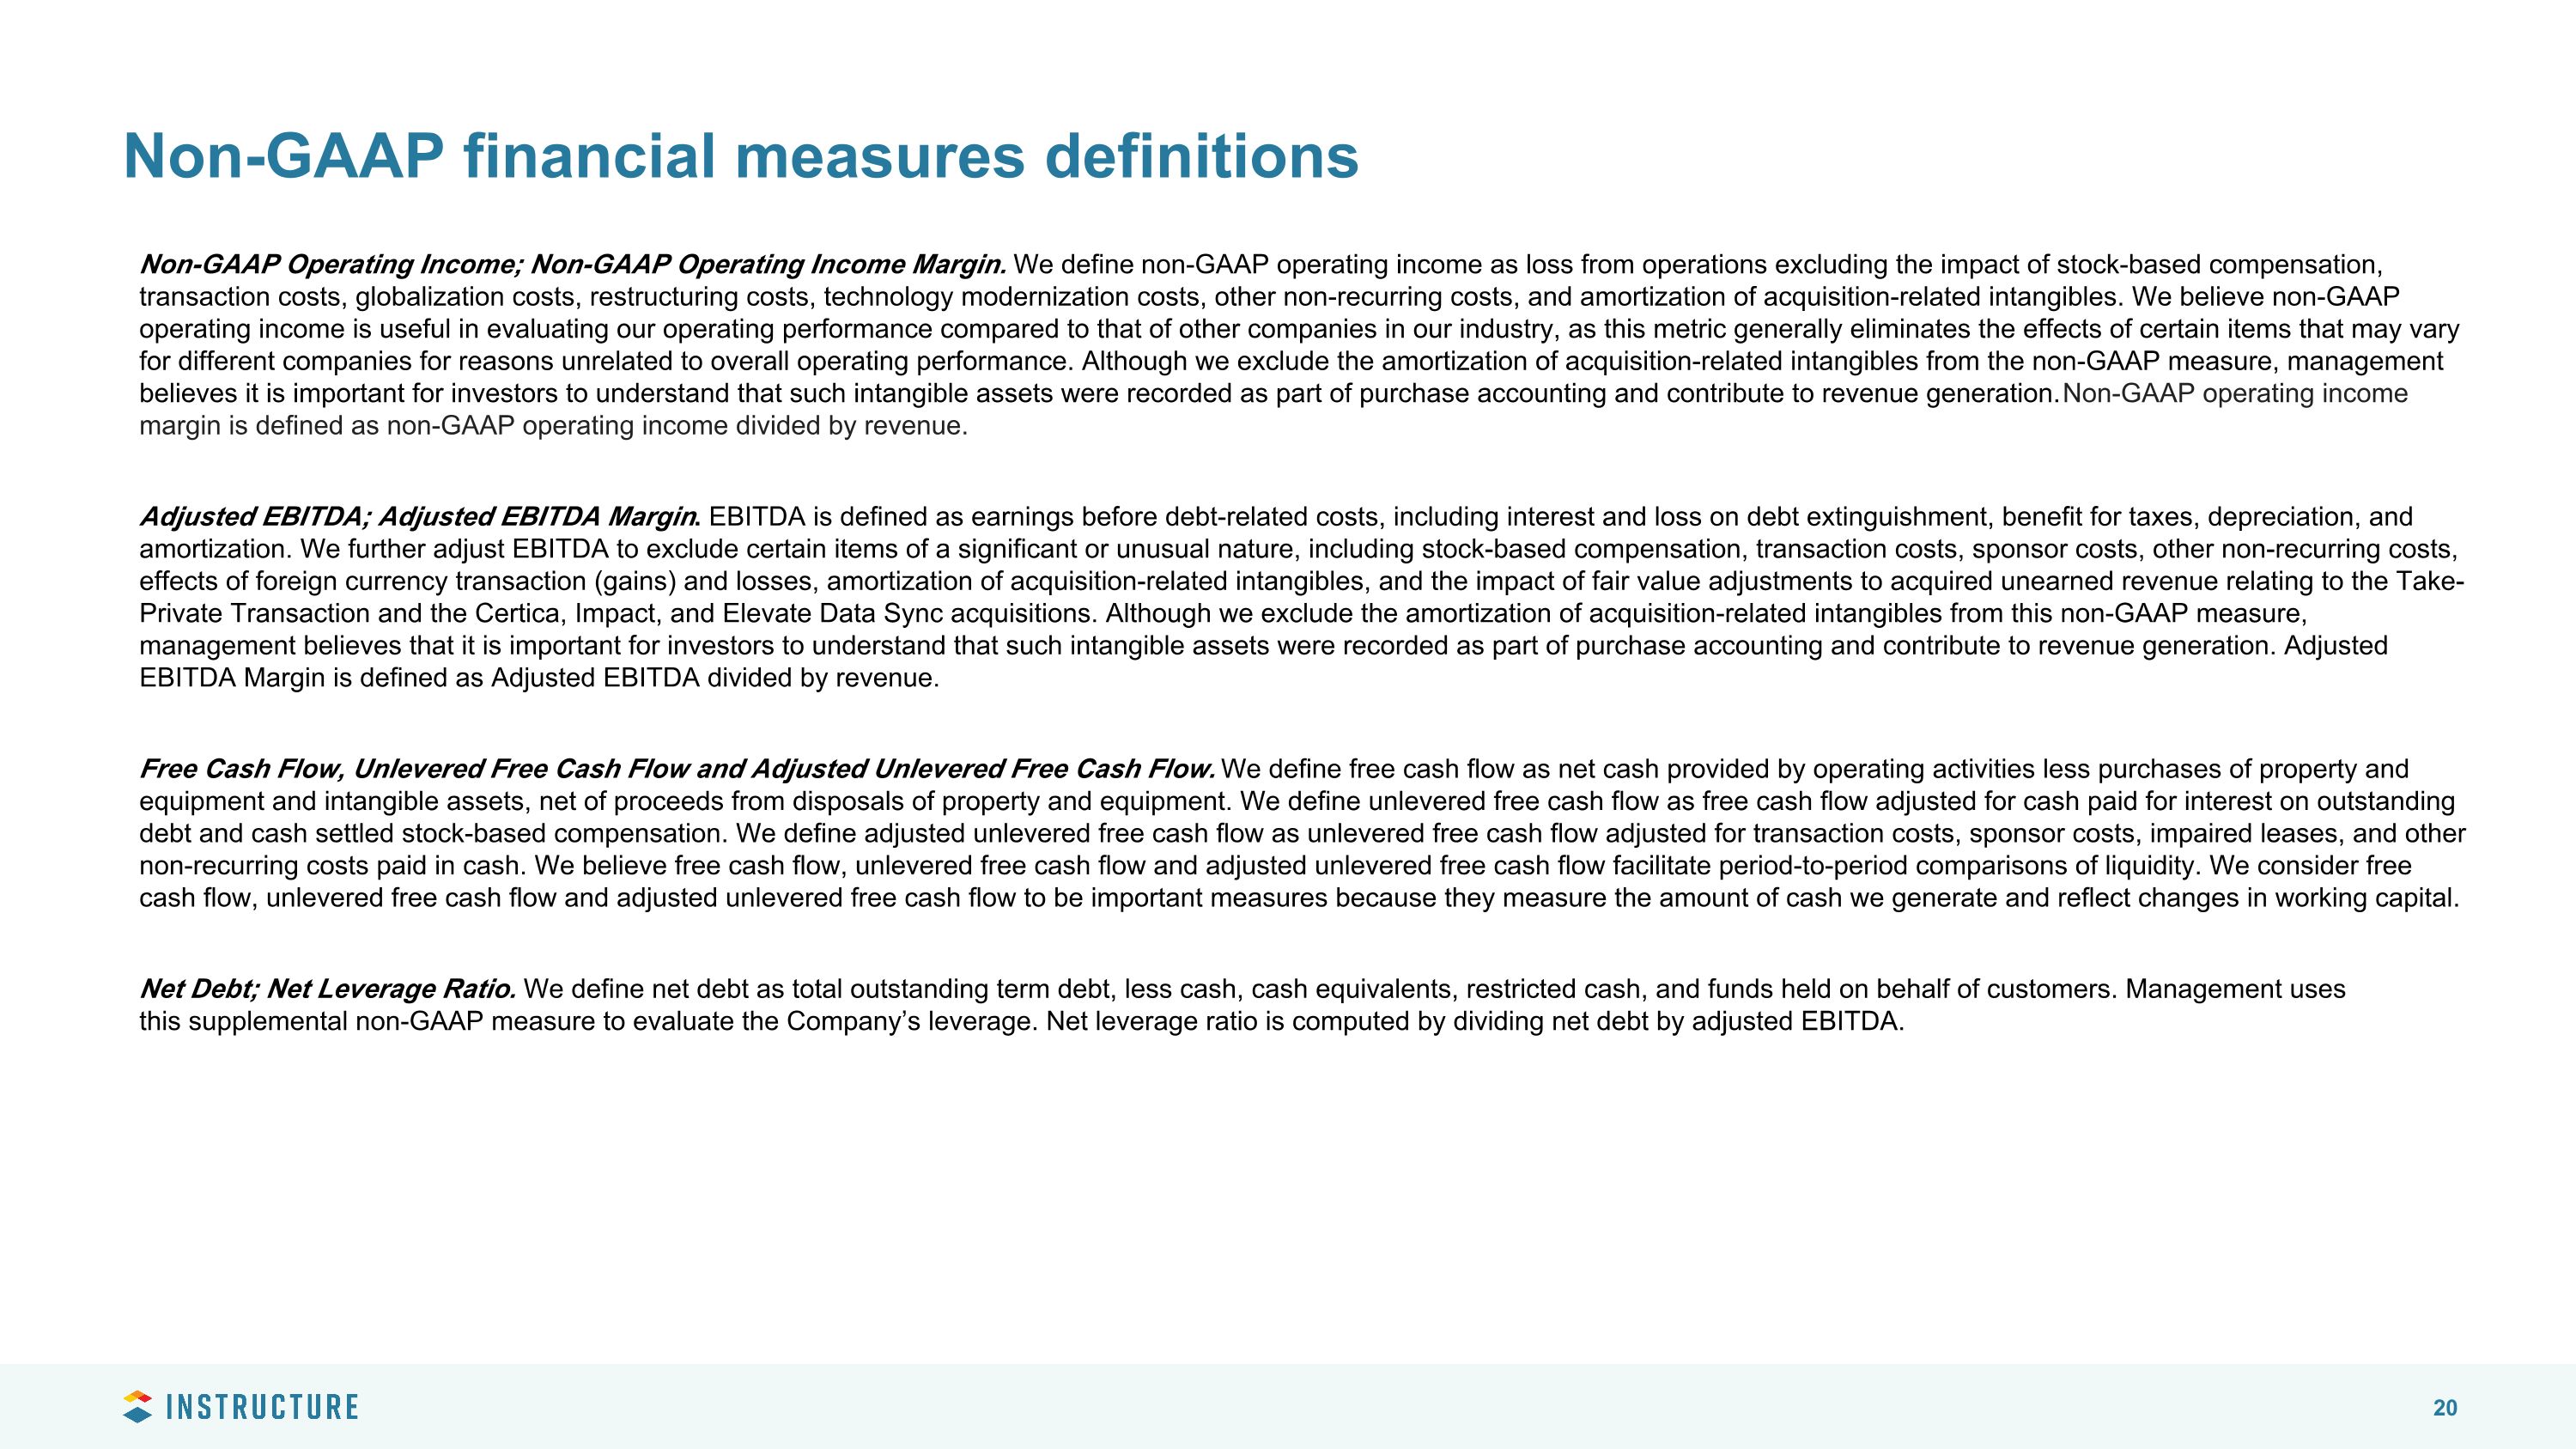
Non-GAAP financial measures definitions Non-GAAP Operating Income; Non-GAAP Operating Income Margin. We define non-GAAP operating income as loss from operations excluding the impact of stock-based compensation, transaction costs, globalization costs, restructuring costs, technology modernization costs, other non-recurring costs, and amortization of acquisition-related intangibles. We believe non-GAAP operating income is useful in evaluating our operating performance compared to that of other companies in our industry, as this metric generally eliminates the effects of certain items that may vary for different companies for reasons unrelated to overall operating performance. Although we exclude the amortization of acquisition-related intangibles from the non-GAAP measure, management believes it is important for investors to understand that such intangible assets were recorded as part of purchase accounting and contribute to revenue generation. Non-GAAP operating income margin is defined as non-GAAP operating income divided by revenue. Adjusted EBITDA; Adjusted EBITDA Margin. EBITDA is defined as earnings before debt-related costs, including interest and loss on debt extinguishment, benefit for taxes, depreciation, and amortization. We further adjust EBITDA to exclude certain items of a significant or unusual nature, including stock-based compensation, transaction costs, sponsor costs, other non-recurring costs, effects of foreign currency transaction (gains) and losses, amortization of acquisition-related intangibles, and the impact of fair value adjustments to acquired unearned revenue relating to the Take-Private Transaction and the Certica, Impact, and Elevate Data Sync acquisitions. Although we exclude the amortization of acquisition-related intangibles from this non-GAAP measure, management believes that it is important for investors to understand that such intangible assets were recorded as part of purchase accounting and contribute to revenue generation. Adjusted EBITDA Margin is defined as Adjusted EBITDA divided by revenue. Free Cash Flow, Unlevered Free Cash Flow and Adjusted Unlevered Free Cash Flow. We define free cash flow as net cash provided by operating activities less purchases of property and equipment and intangible assets, net of proceeds from disposals of property and equipment. We define unlevered free cash flow as free cash flow adjusted for cash paid for interest on outstanding debt and cash settled stock-based compensation. We define adjusted unlevered free cash flow as unlevered free cash flow adjusted for transaction costs, sponsor costs, impaired leases, and other non-recurring costs paid in cash. We believe free cash flow, unlevered free cash flow and adjusted unlevered free cash flow facilitate period-to-period comparisons of liquidity. We consider free cash flow, unlevered free cash flow and adjusted unlevered free cash flow to be important measures because they measure the amount of cash we generate and reflect changes in working capital. Net Debt; Net Leverage Ratio. We define net debt as total outstanding term debt, less cash, cash equivalents, restricted cash, and funds held on behalf of customers. Management uses this supplemental non-GAAP measure to evaluate the Company’s leverage. Net leverage ratio is computed by dividing net debt by adjusted EBITDA.

Non-GAAP financial measures definitions Non-GAAP Net Income. We define non-GAAP net income as net loss excluding the impact of stock-based compensation, amortization of acquisition-related intangibles, transaction costs, globalization costs, restructuring costs, technology modernization costs, other non-recurring costs, effects of foreign currency transaction (gains) and losses that we do not believe are reflective of our ongoing operations, and loss on extinguishment of debt. The tax effects of the adjustments are calculated using the statutory tax rate, taking into consideration the nature of the item and the relevant taxing jurisdiction. We believe Non-GAAP net income is useful in evaluating our operating performance compared to that of other companies in our industry, as this metric generally eliminates the effects of certain items that may vary for different companies for reasons unrelated to overall operating performance. Although we exclude the amortization of acquisition-related intangibles from the non-GAAP measure, management believes it is important for investors to understand that such intangible assets were recorded as part of purchase accounting and contribute to revenue generation. Basic non-GAAP net income per common share is computed by dividing non-GAAP net income by the weighted-average number of common shares outstanding for the period. Diluted non-GAAP net income per common share is computed by giving effect to all potentially dilutive common stock equivalents outstanding for the period. Non-GAAP Gross Profit; Non-GAAP Gross Profit Margin. We define non-GAAP gross profit as gross profit excluding the impact of stock-based compensation, transaction costs, other non-recurring costs, amortization of acquisition-related intangibles, and fair value adjustments to deferred revenue in connection with purchase accounting that we do not believe are reflective of our ongoing operations. Although we exclude the amortization of acquisition-related intangibles from the non-GAAP measure, management believes it is important for investors to understand that such intangible assets were recorded as part of purchase accounting and contribute to revenue generation. Non-GAAP Gross Profit Margin is defined as Non-GAAP gross profit divided by revenue. Subscription and Support Non-GAAP Gross Profit; Subscription and Support Non-GAAP Gross Profit Margin. We define subscription and support Non-GAAP gross profit as subscription and support gross profit excluding the impact of stock-based compensation, transaction costs, globalization costs, restructuring costs, technology modernization costs, and amortization of acquisition-related intangibles. Subscription and support non-GAAP gross profit margin is defined as subscription and support non-GAAP gross profit divided by recurring revenue. Organic Constant Currency Revenue Growth. We define organic constant currency revenue growth as revenue growth excluding the impact of revenue from the acquisitions completed within each respective period and the impacts of foreign currency exchange rates by converting the current period's revenue in local currency to U.S. dollars using foreign currency exchange rates for the same period of the prior year. Organic Constant Currency Subscription and Support Revenue Growth. We define organic constant currency subscription and support revenue growth as subscription and support revenue growth excluding the impact of recurring revenue from the acquisitions completed within each respective period and the impacts of foreign currency exchange rates by converting the current period's revenue in local currency to U.S. dollars using foreign currency exchange rates for the same period of the prior year. Subscription and support revenue is recurring revenue.
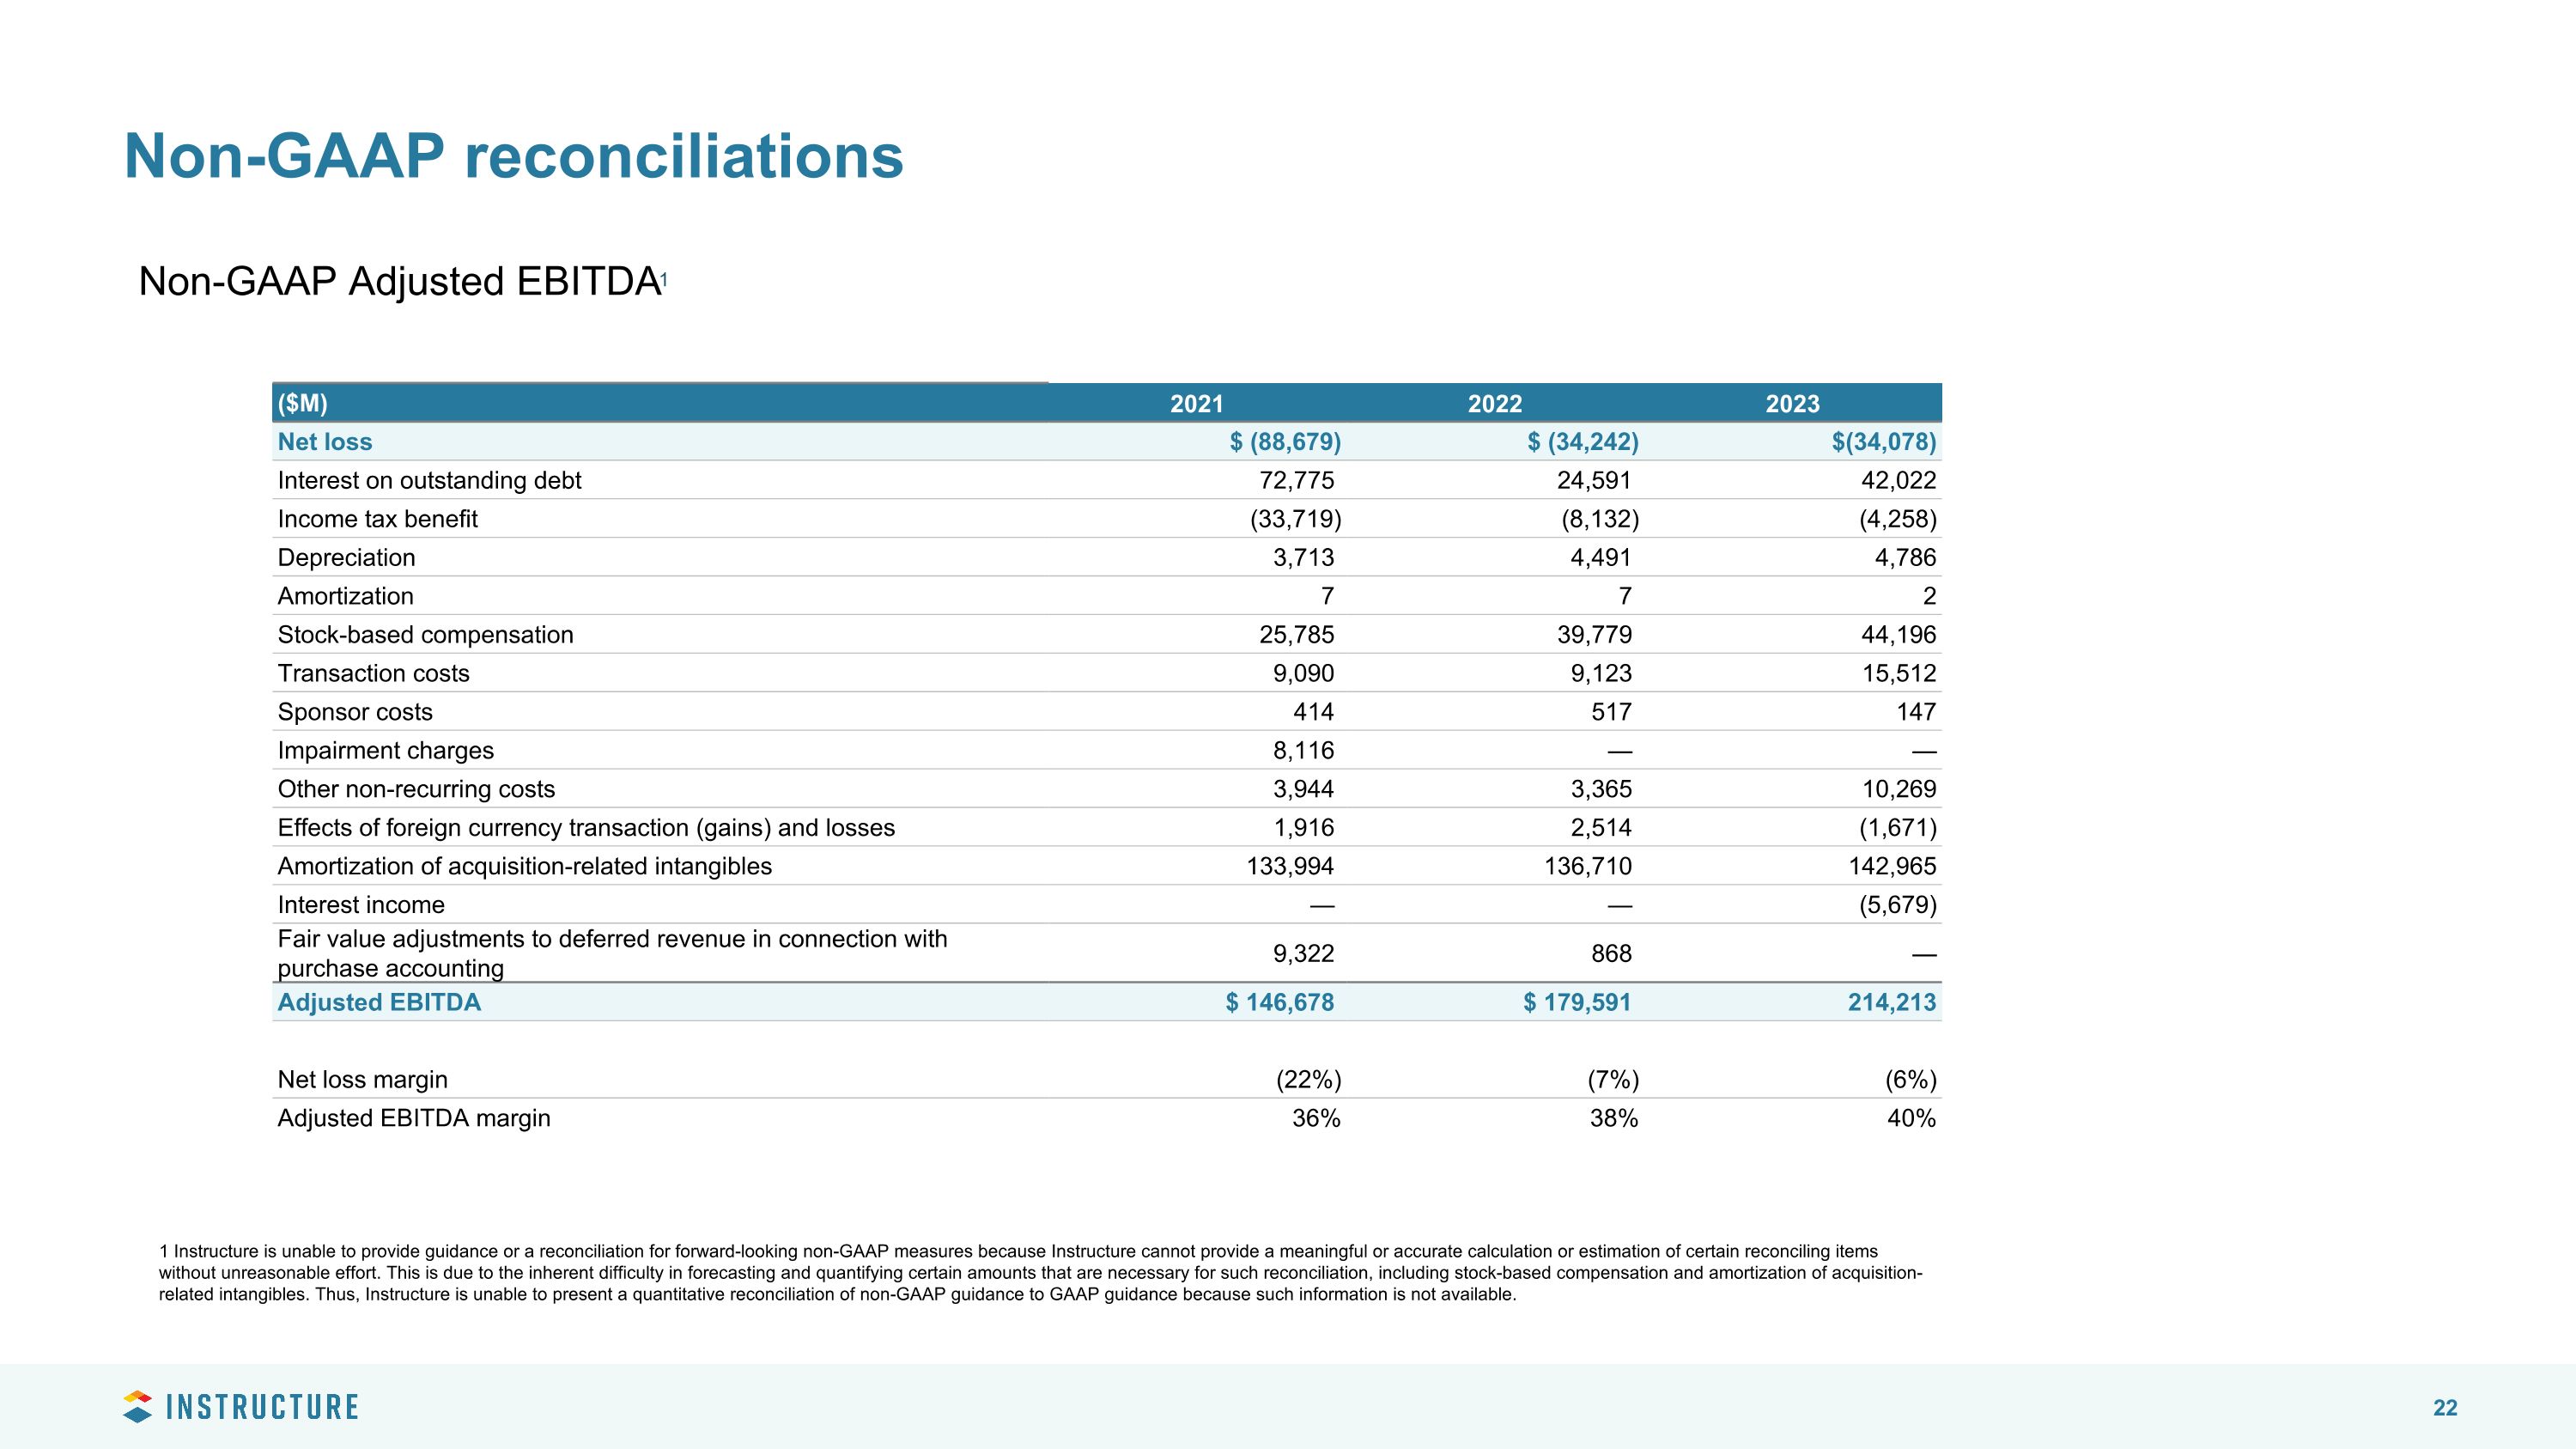
Non-GAAP reconciliations ($M) 2021 2022 2023 Net loss $ (88,679) $ (34,242) $(34,078) Interest on outstanding debt 72,775 24,591 42,022 Income tax benefit (33,719) (8,132) (4,258) Depreciation 3,713 4,491 4,786 Amortization 7 7 2 Stock-based compensation 25,785 39,779 44,196 Transaction costs 9,090 9,123 15,512 Sponsor costs 414 517 147 Impairment charges 8,116 — — Other non-recurring costs 3,944 3,365 10,269 Effects of foreign currency transaction (gains) and losses 1,916 2,514 (1,671) Amortization of acquisition-related intangibles 133,994 136,710 142,965 Interest income — — (5,679) Fair value adjustments to deferred revenue in connection with purchase accounting 9,322 868 — Adjusted EBITDA $ 146,678 $ 179,591 214,213 Net loss margin (22%) (7%) (6%) Adjusted EBITDA margin 36% 38% 40% Non-GAAP Adjusted EBITDA1 1 Instructure is unable to provide guidance or a reconciliation for forward-looking non-GAAP measures because Instructure cannot provide a meaningful or accurate calculation or estimation of certain reconciling items without unreasonable effort. This is due to the inherent difficulty in forecasting and quantifying certain amounts that are necessary for such reconciliation, including stock-based compensation and amortization of acquisition-related intangibles. Thus, Instructure is unable to present a quantitative reconciliation of non-GAAP guidance to GAAP guidance because such information is not available.
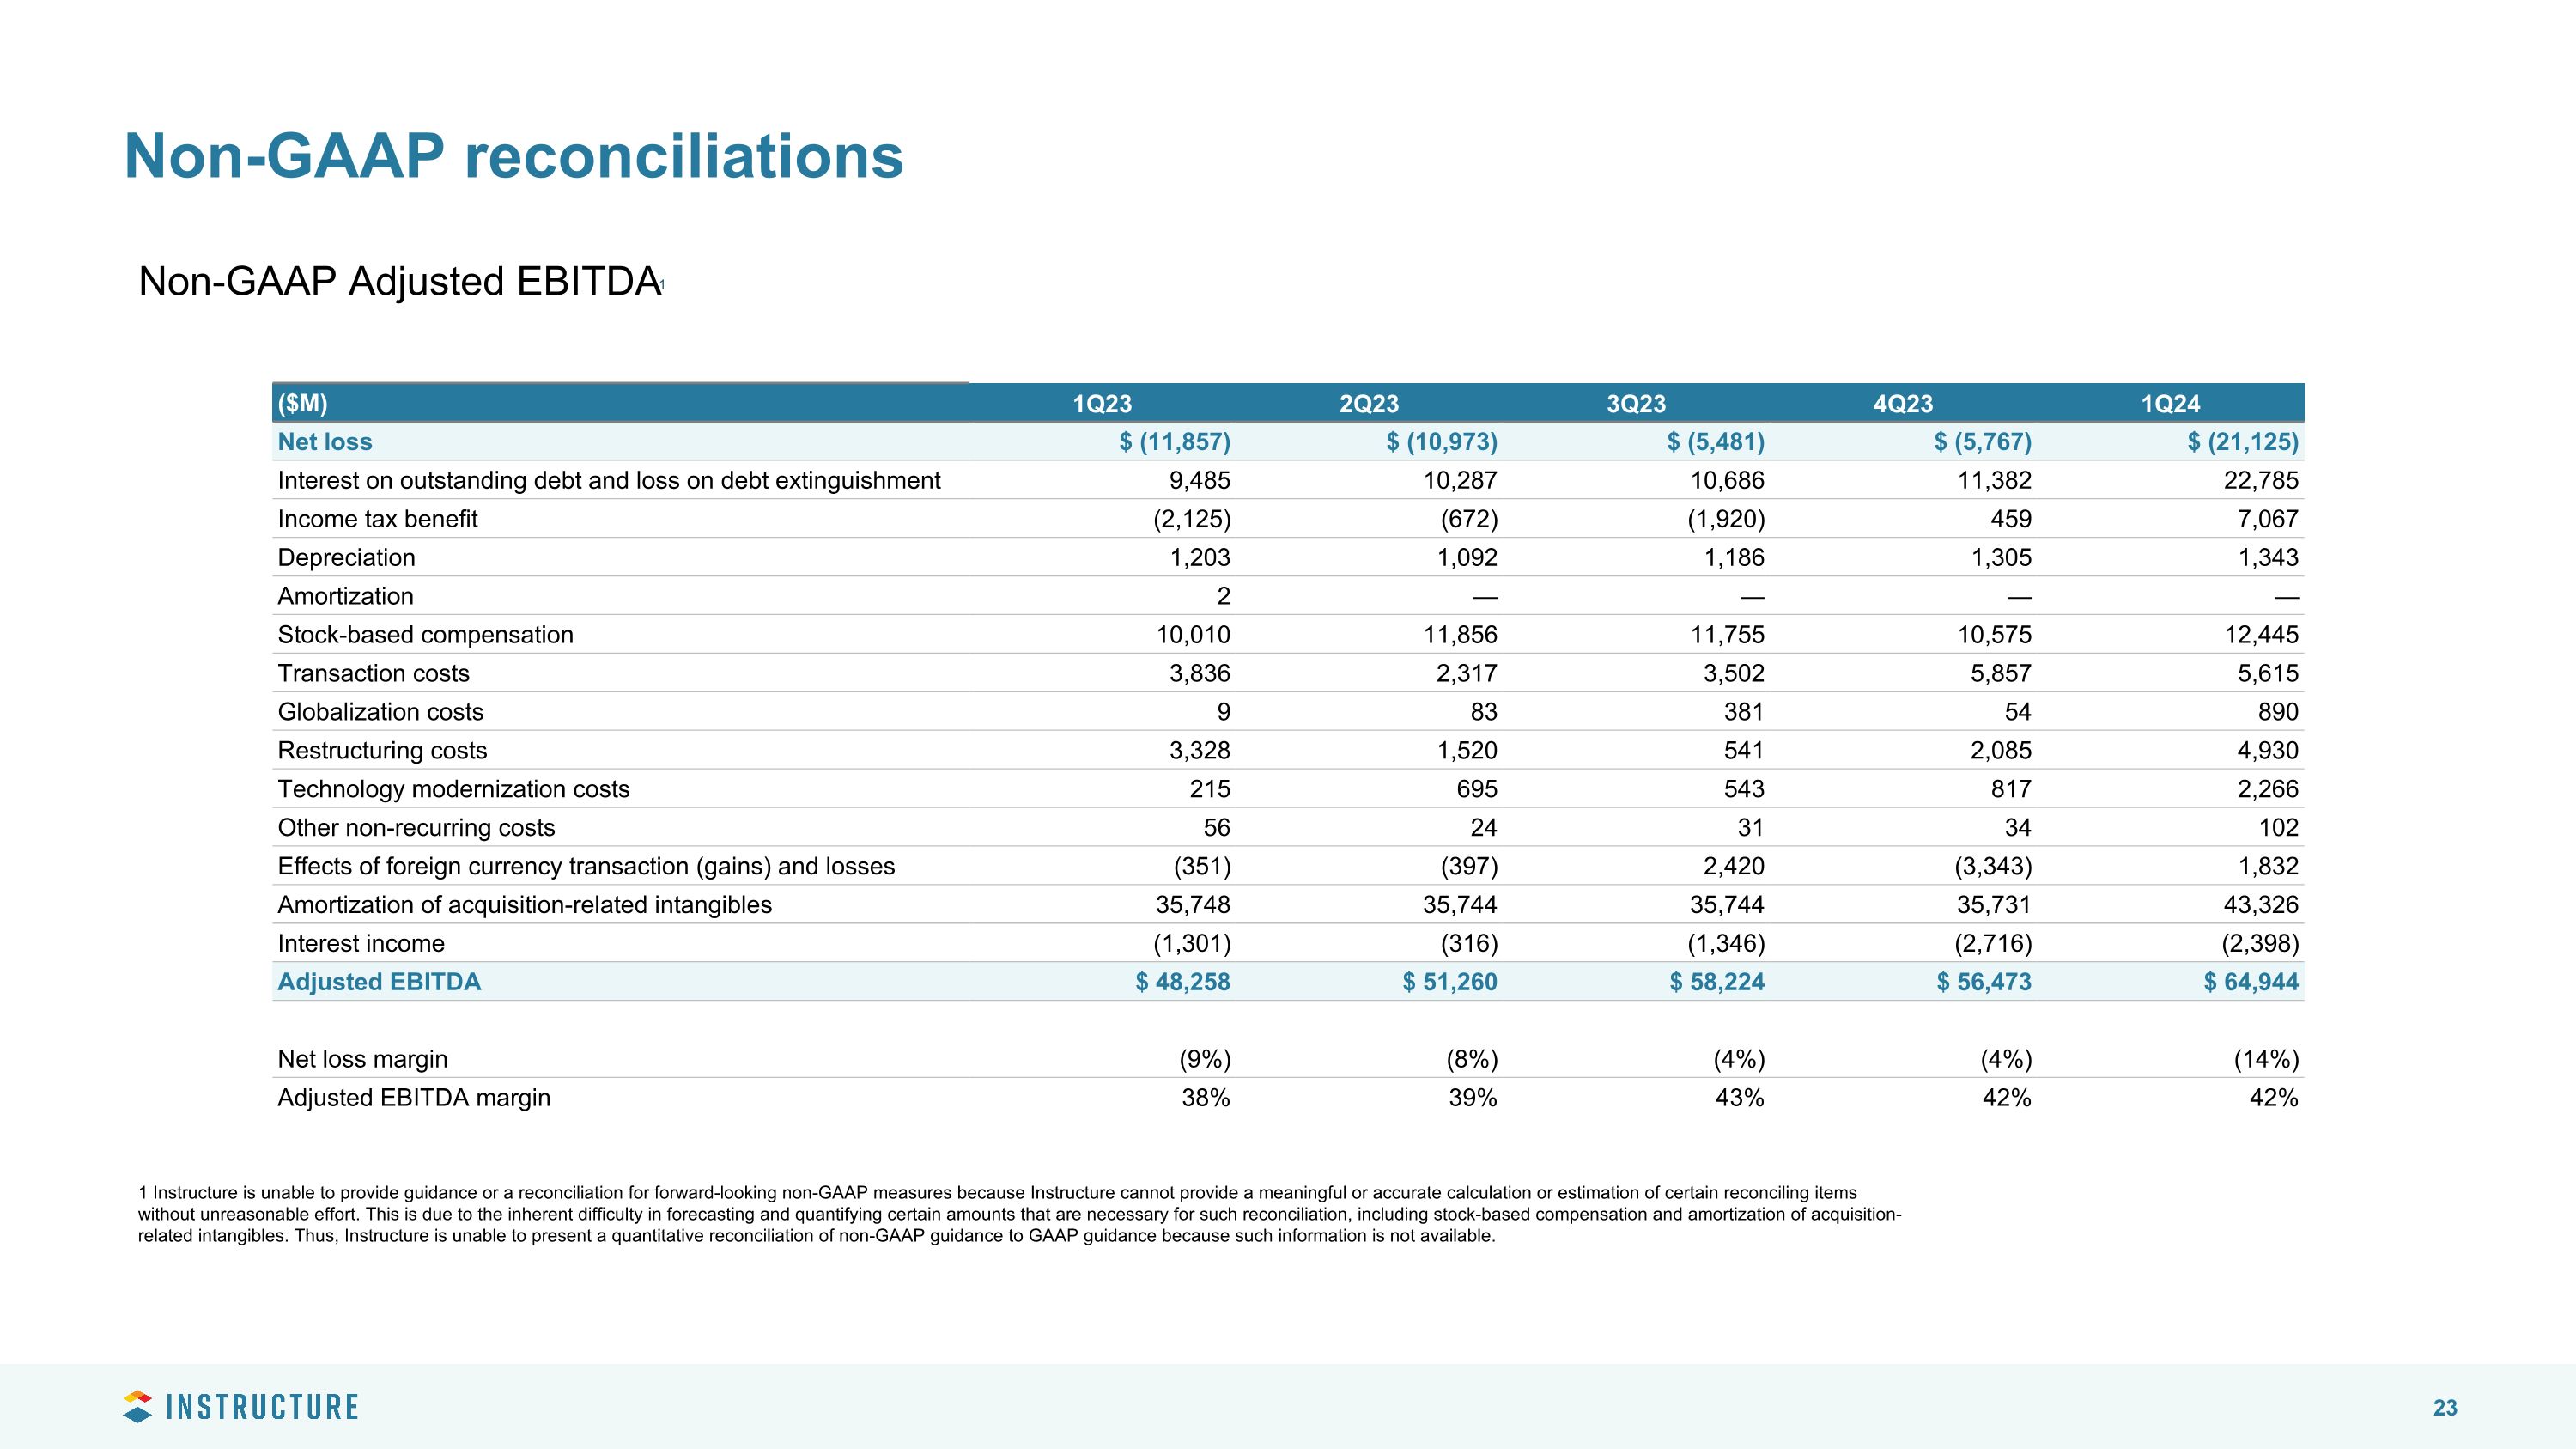
Non-GAAP reconciliations ($M) 1Q23 2Q23 3Q23 4Q23 1Q24 Net loss $ (11,857) $ (10,973) $ (5,481) $ (5,767) $ (21,125) Interest on outstanding debt and loss on debt extinguishment 9,485 10,287 10,686 11,382 22,785 Income tax benefit (2,125) (672) (1,920) 459 7,067 Depreciation 1,203 1,092 1,186 1,305 1,343 Amortization 2 — — — — Stock-based compensation 10,010 11,856 11,755 10,575 12,445 Transaction costs 3,836 2,317 3,502 5,857 5,615 Globalization costs 9 83 381 54 890 Restructuring costs 3,328 1,520 541 2,085 4,930 Technology modernization costs 215 695 543 817 2,266 Other non-recurring costs 56 24 31 34 102 Effects of foreign currency transaction (gains) and losses (351) (397) 2,420 (3,343) 1,832 Amortization of acquisition-related intangibles 35,748 35,744 35,744 35,731 43,326 Interest income (1,301) (316) (1,346) (2,716) (2,398) Adjusted EBITDA $ 48,258 $ 51,260 $ 58,224 $ 56,473 $ 64,944 Net loss margin (9%) (8%) (4%) (4%) (14%) Adjusted EBITDA margin 38% 39% 43% 42% 42% Non-GAAP Adjusted EBITDA1 1 Instructure is unable to provide guidance or a reconciliation for forward-looking non-GAAP measures because Instructure cannot provide a meaningful or accurate calculation or estimation of certain reconciling items without unreasonable effort. This is due to the inherent difficulty in forecasting and quantifying certain amounts that are necessary for such reconciliation, including stock-based compensation and amortization of acquisition-related intangibles. Thus, Instructure is unable to present a quantitative reconciliation of non-GAAP guidance to GAAP guidance because such information is not available.
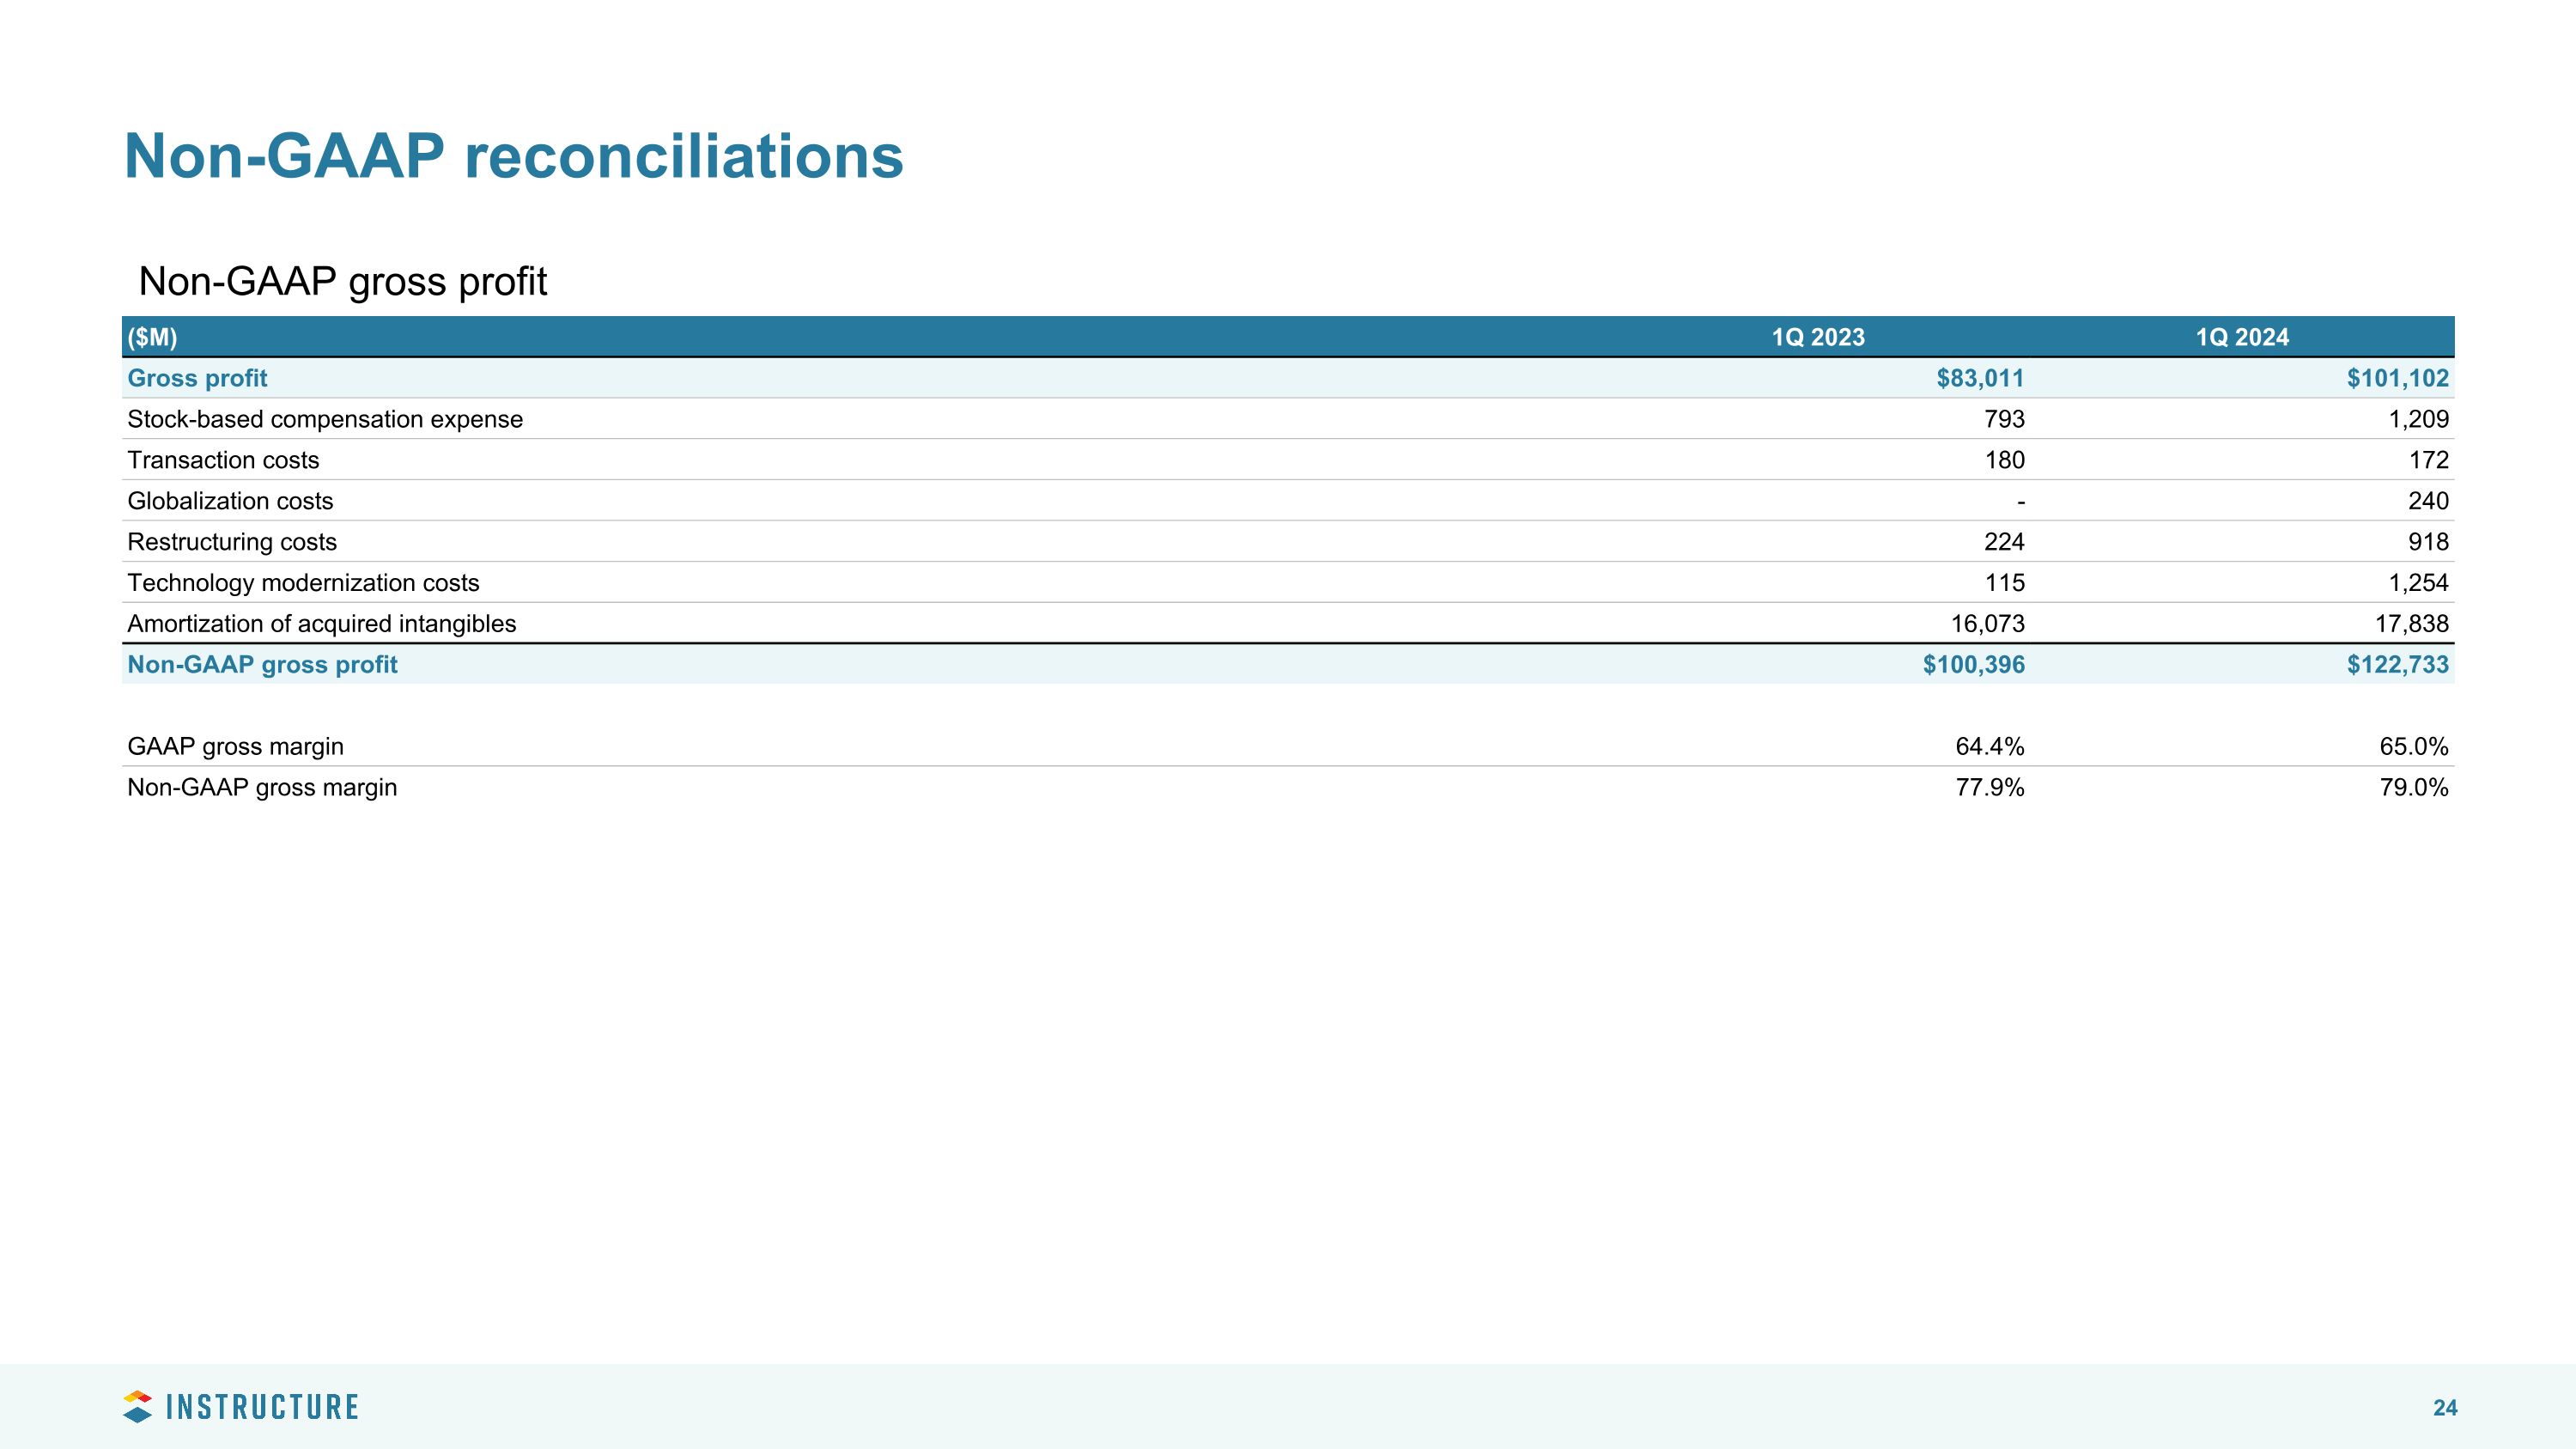
Non-GAAP reconciliations Non-GAAP gross profit ($M) 1Q 2023 1Q 2024 Gross profit $83,011 $101,102 Stock-based compensation expense 793 1,209 Transaction costs 180 172 Globalization costs - 240 Restructuring costs 224 918 Technology modernization costs 115 1,254 Amortization of acquired intangibles 16,073 17,838 Non-GAAP gross profit $100,396 $122,733 GAAP gross margin 64.4% 65.0% Non-GAAP gross margin 77.9% 79.0%
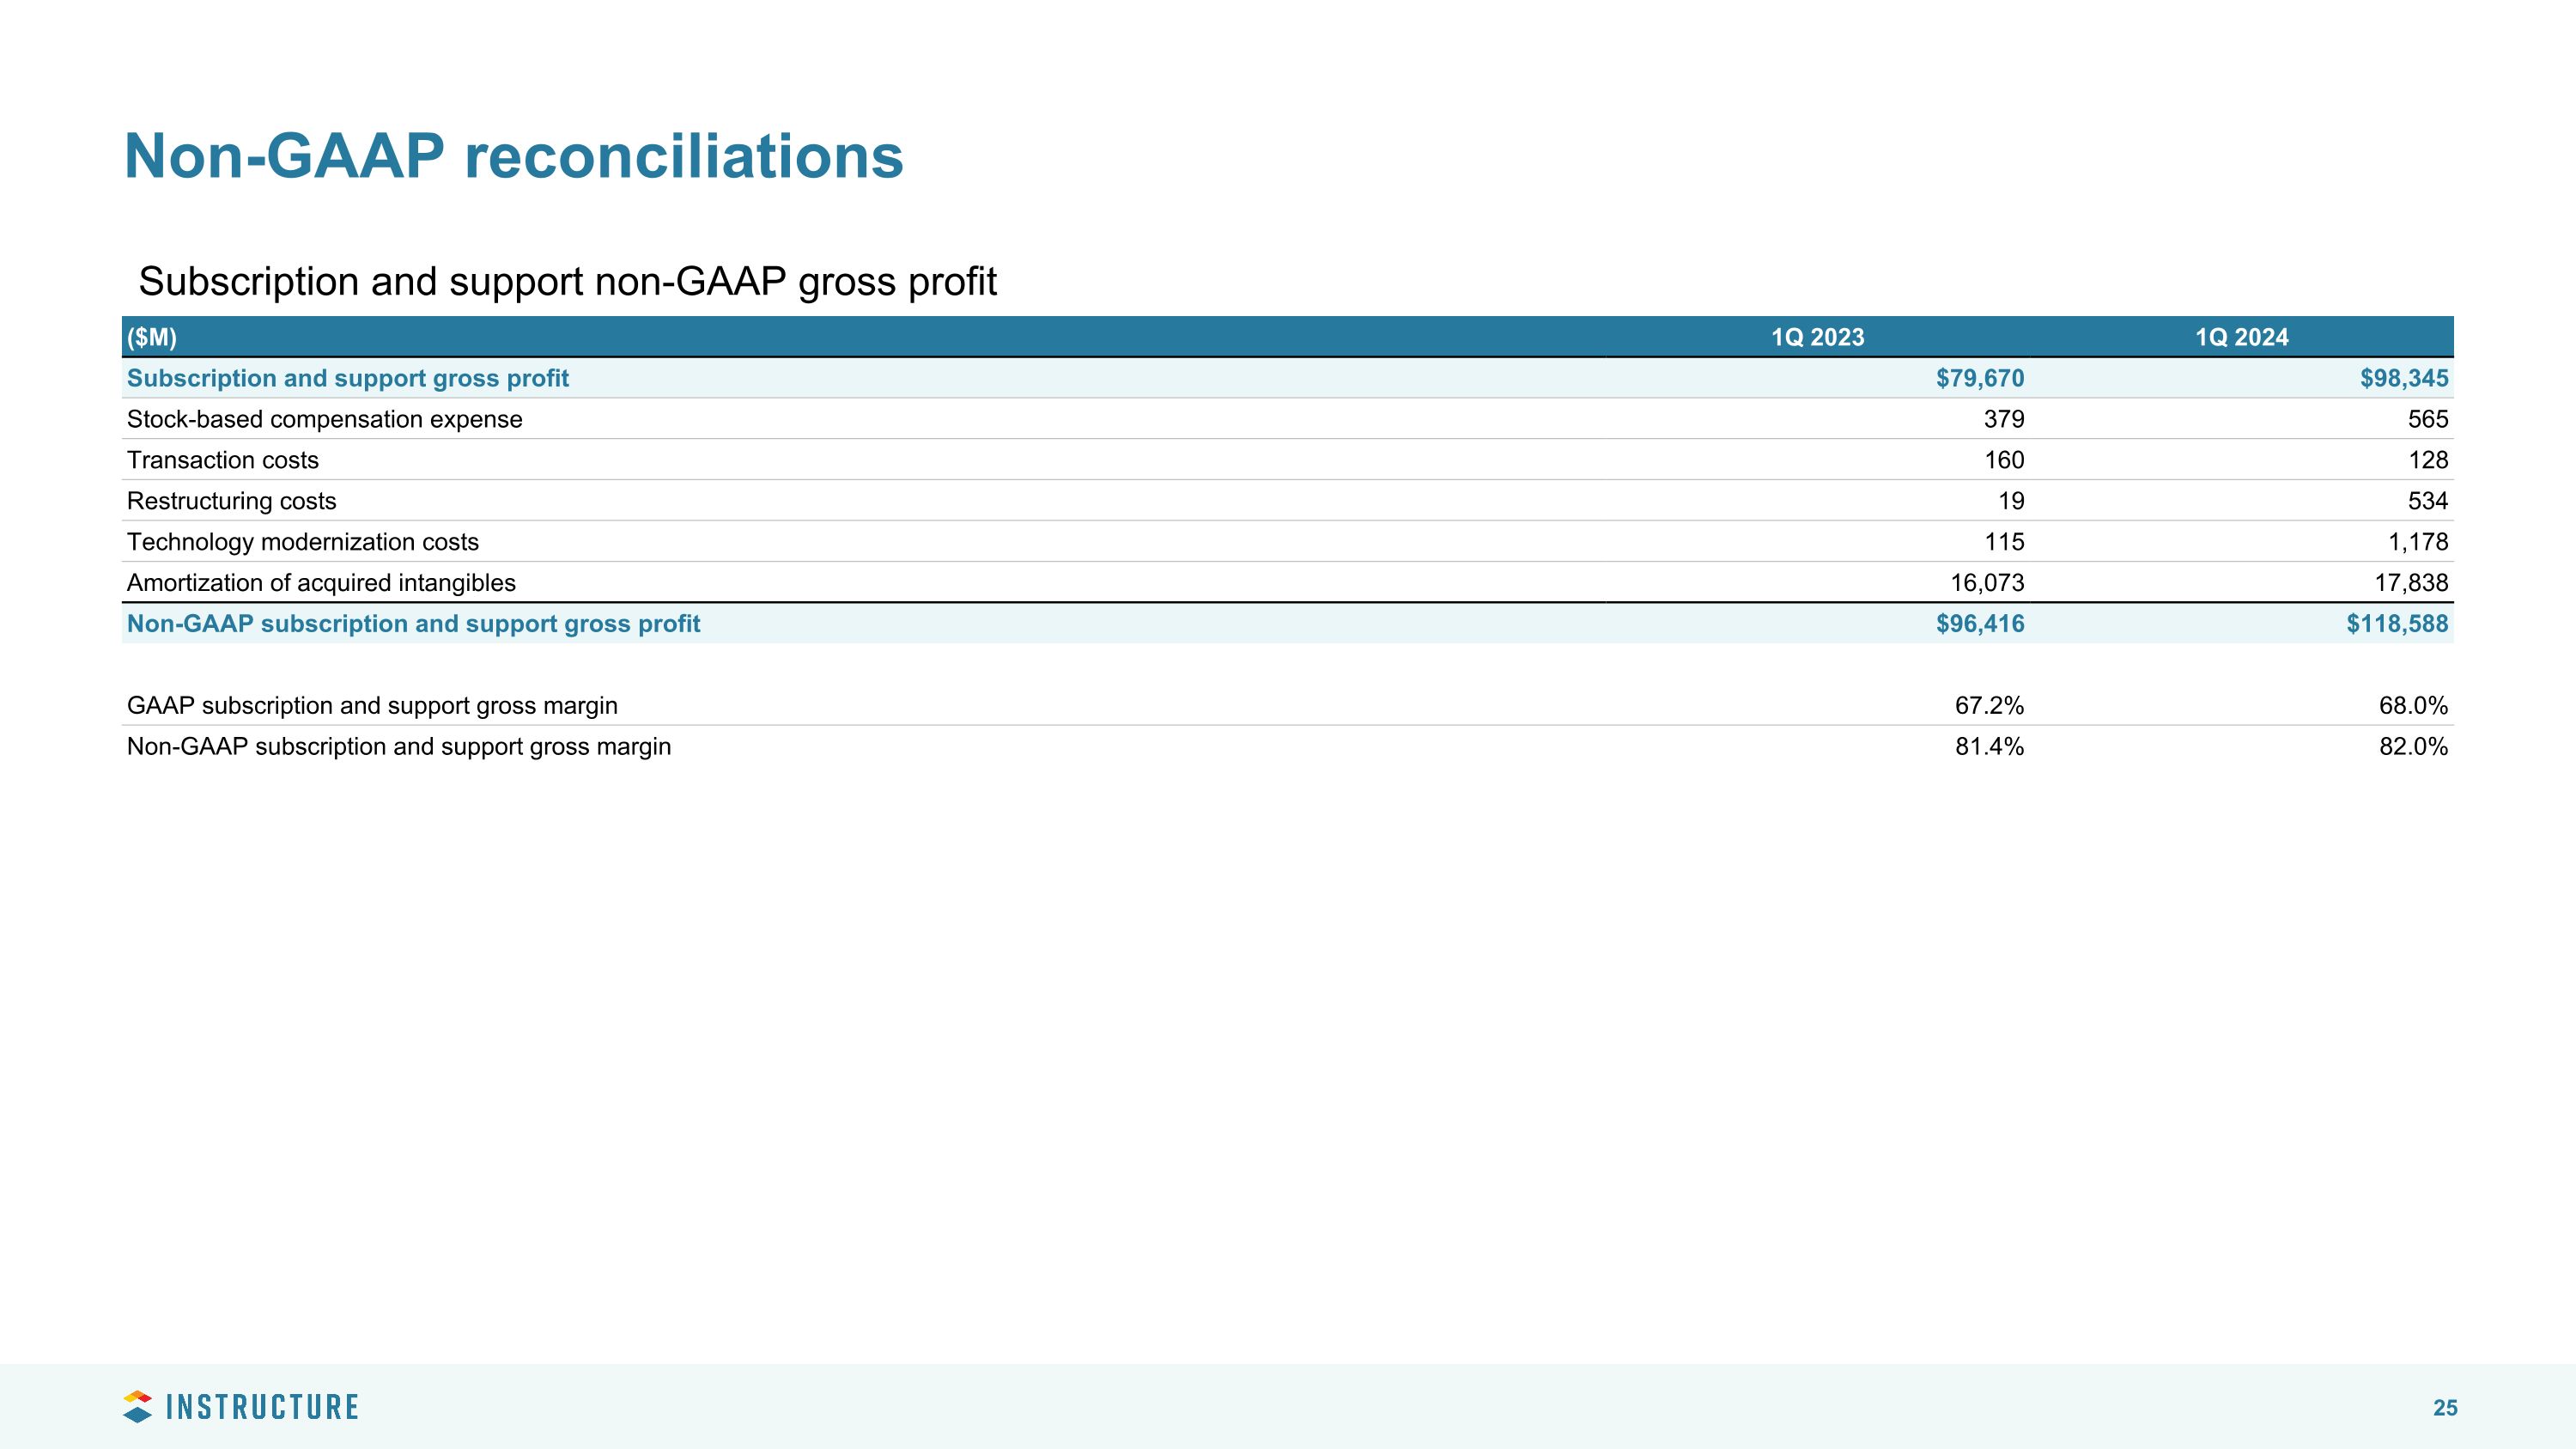
Non-GAAP reconciliations Subscription and support non-GAAP gross profit ($M) 1Q 2023 1Q 2024 Subscription and support gross profit $79,670 $98,345 Stock-based compensation expense 379 565 Transaction costs 160 128 Restructuring costs 19 534 Technology modernization costs 115 1,178 Amortization of acquired intangibles 16,073 17,838 Non-GAAP subscription and support gross profit $96,416 $118,588 GAAP subscription and support gross margin 67.2% 68.0% Non-GAAP subscription and support gross margin 81.4% 82.0%
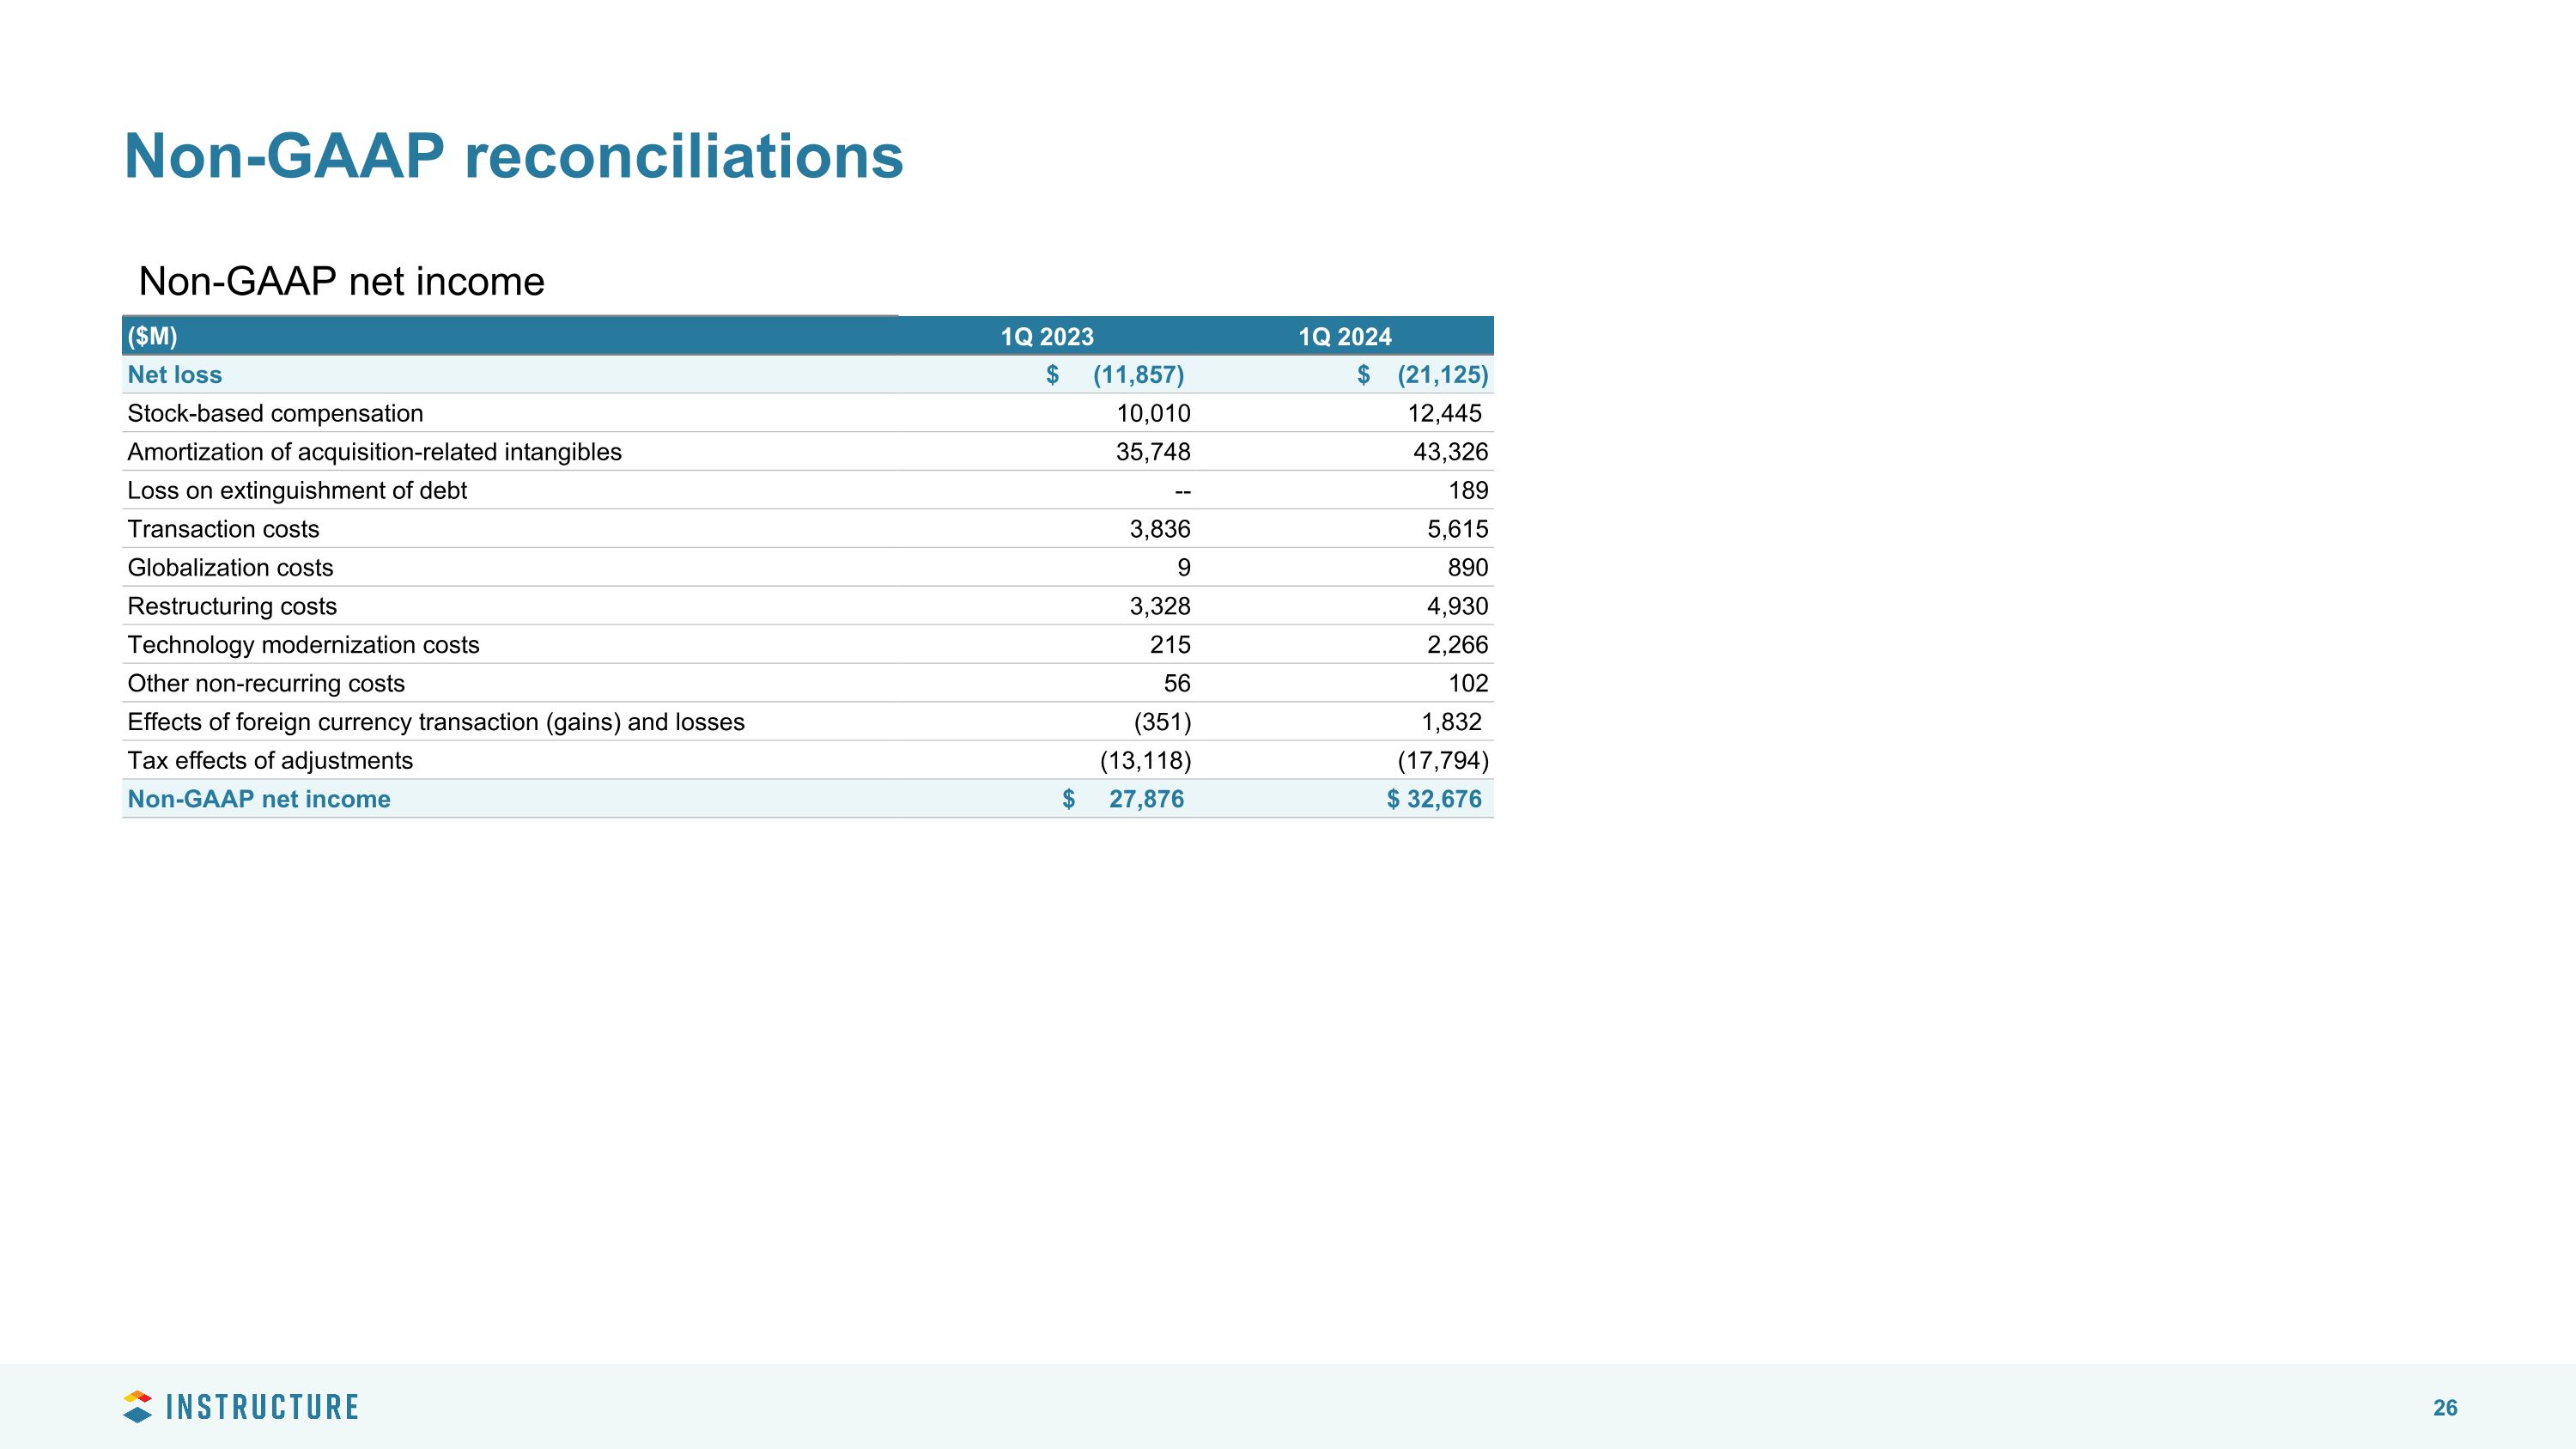
Non-GAAP reconciliations ($M) 1Q 2023 1Q 2024 Net loss $ (11,857) $ (21,125) Stock-based compensation 10,010 12,445 Amortization of acquisition-related intangibles 35,748 43,326 Loss on extinguishment of debt -- 189 Transaction costs 3,836 5,615 Globalization costs 9 890 Restructuring costs 3,328 4,930 Technology modernization costs 215 2,266 Other non-recurring costs 56 102 Effects of foreign currency transaction (gains) and losses (351) 1,832 Tax effects of adjustments (13,118) (17,794) Non-GAAP net income $ 27,876 $ 32,676 Non-GAAP net income
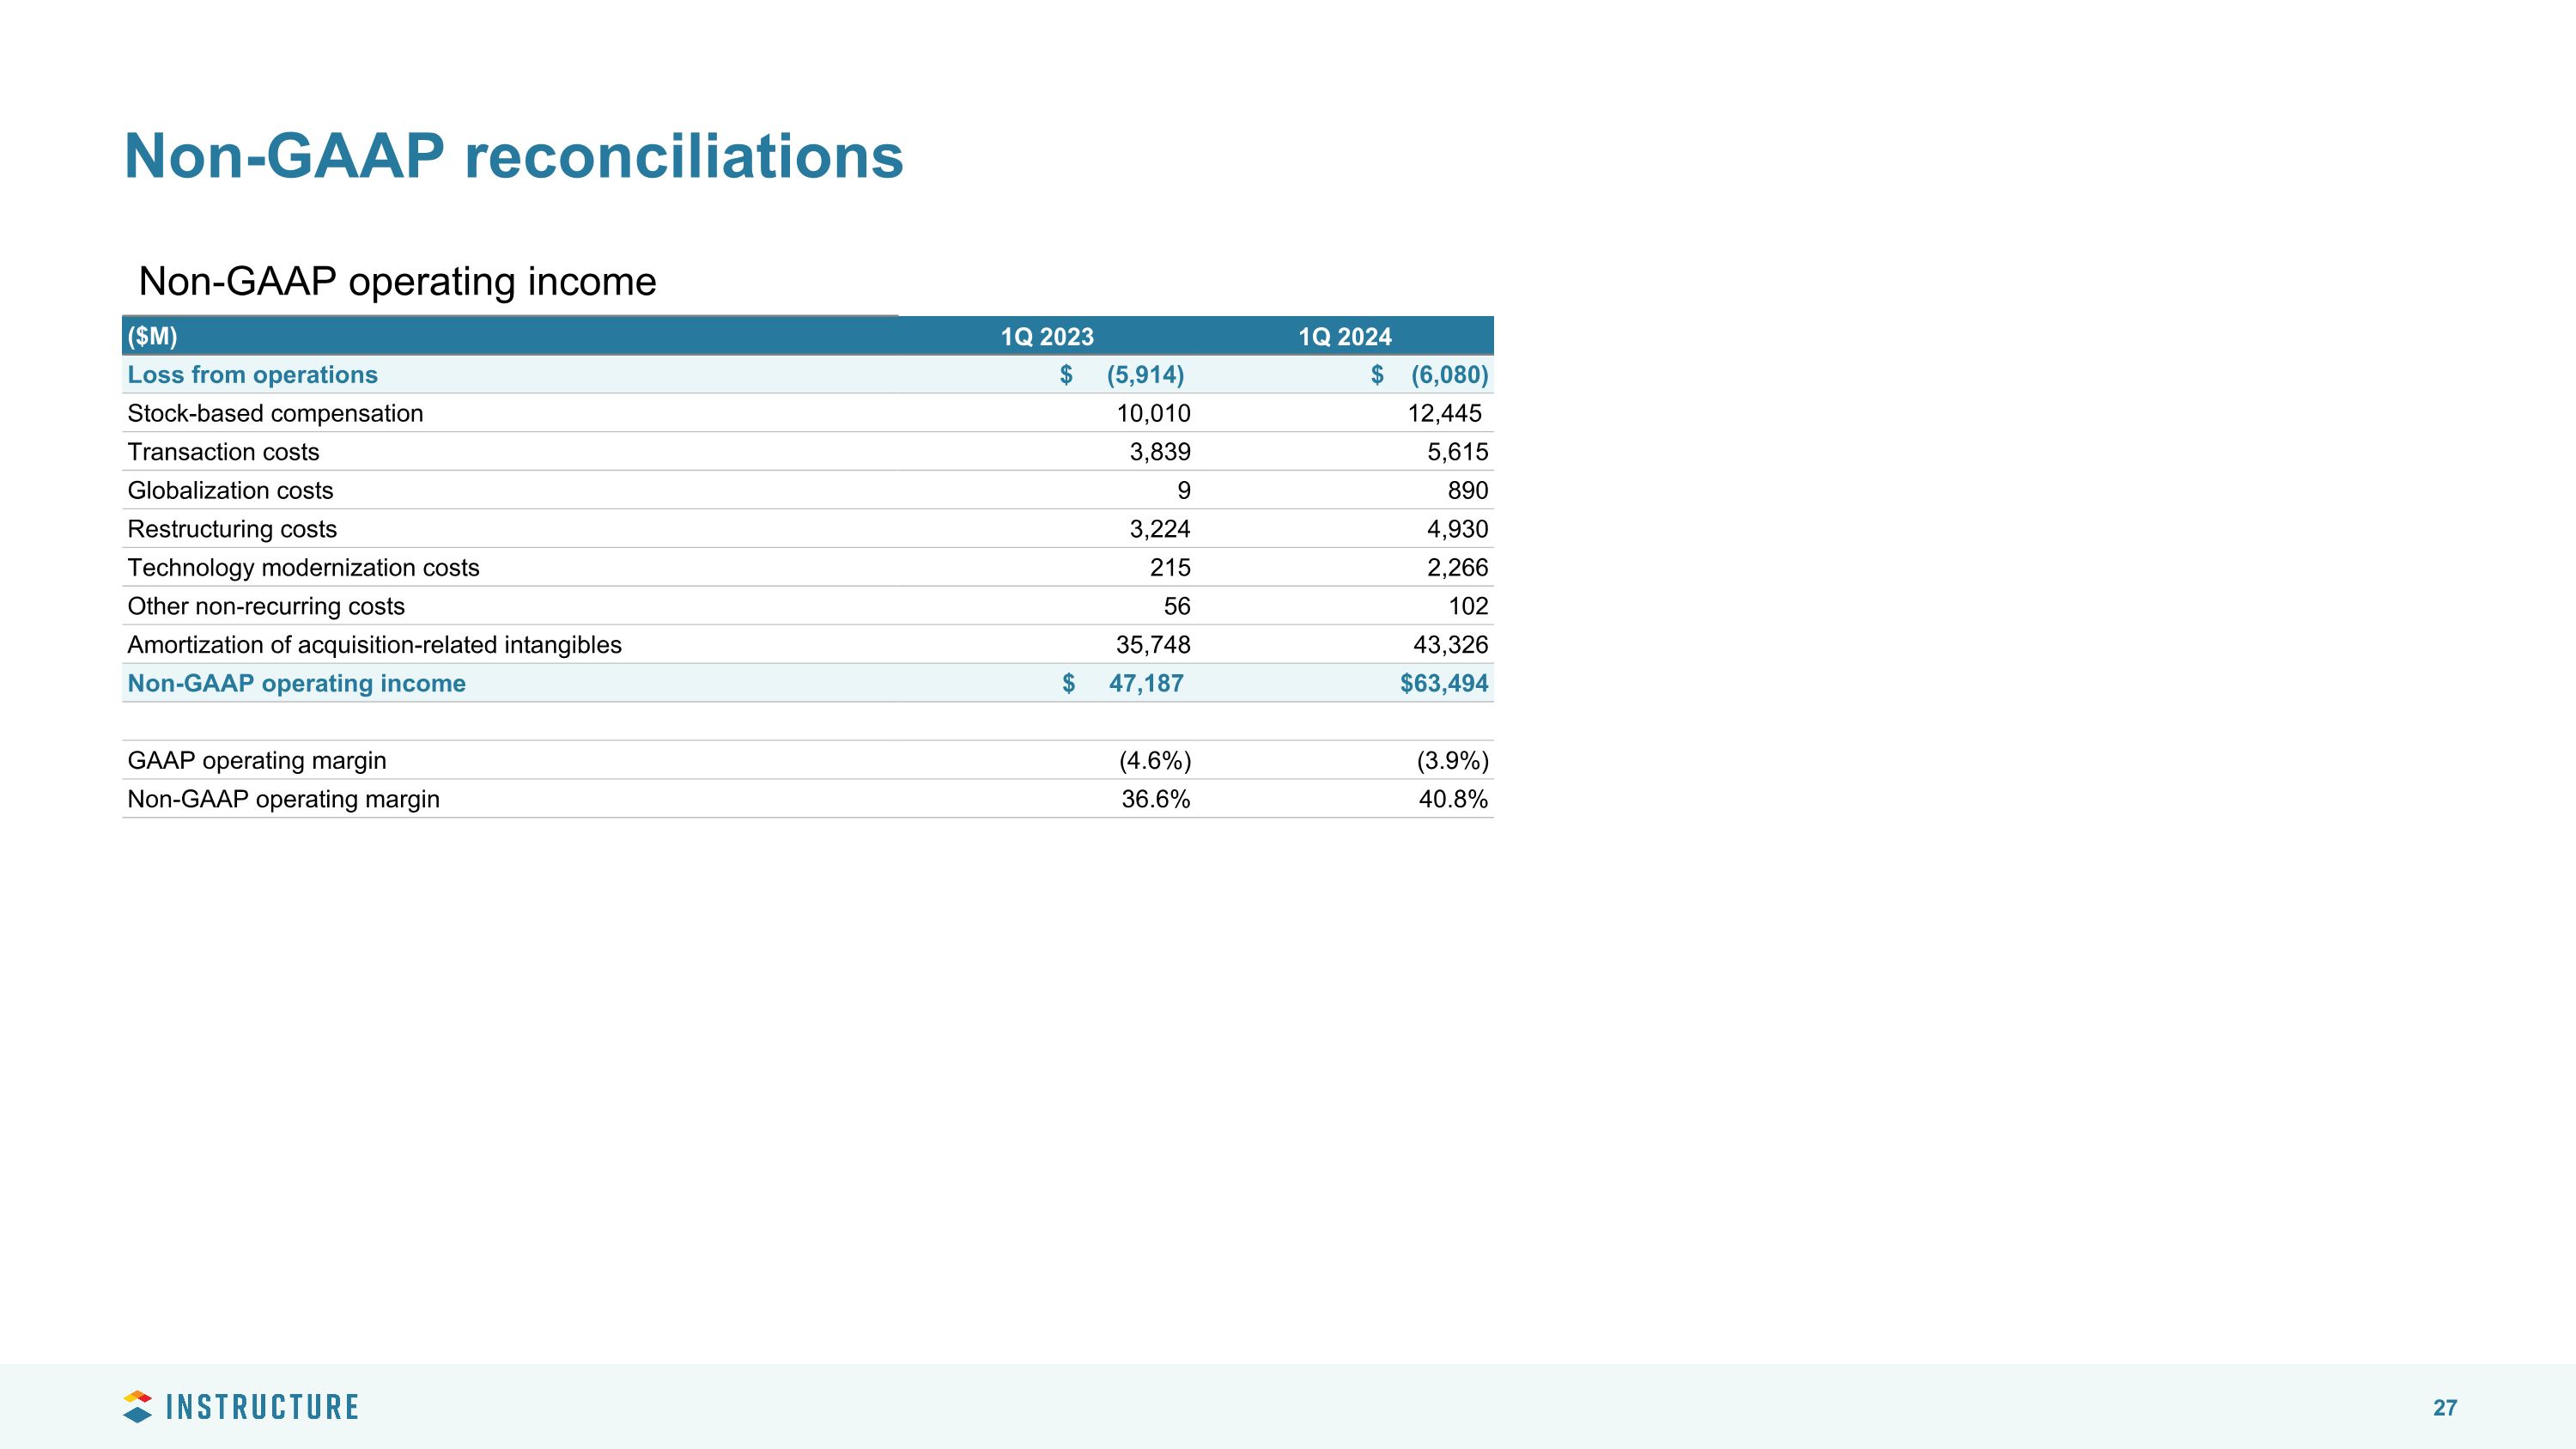
Non-GAAP reconciliations ($M) 1Q 2023 1Q 2024 Loss from operations $ (5,914) $ (6,080) Stock-based compensation 10,010 12,445 Transaction costs 3,839 5,615 Globalization costs 9 890 Restructuring costs 3,224 4,930 Technology modernization costs 215 2,266 Other non-recurring costs 56 102 Amortization of acquisition-related intangibles 35,748 43,326 Non-GAAP operating income $ 47,187 $63,494 GAAP operating margin (4.6%) (3.9%) Non-GAAP operating margin 36.6% 40.8% Non-GAAP operating income
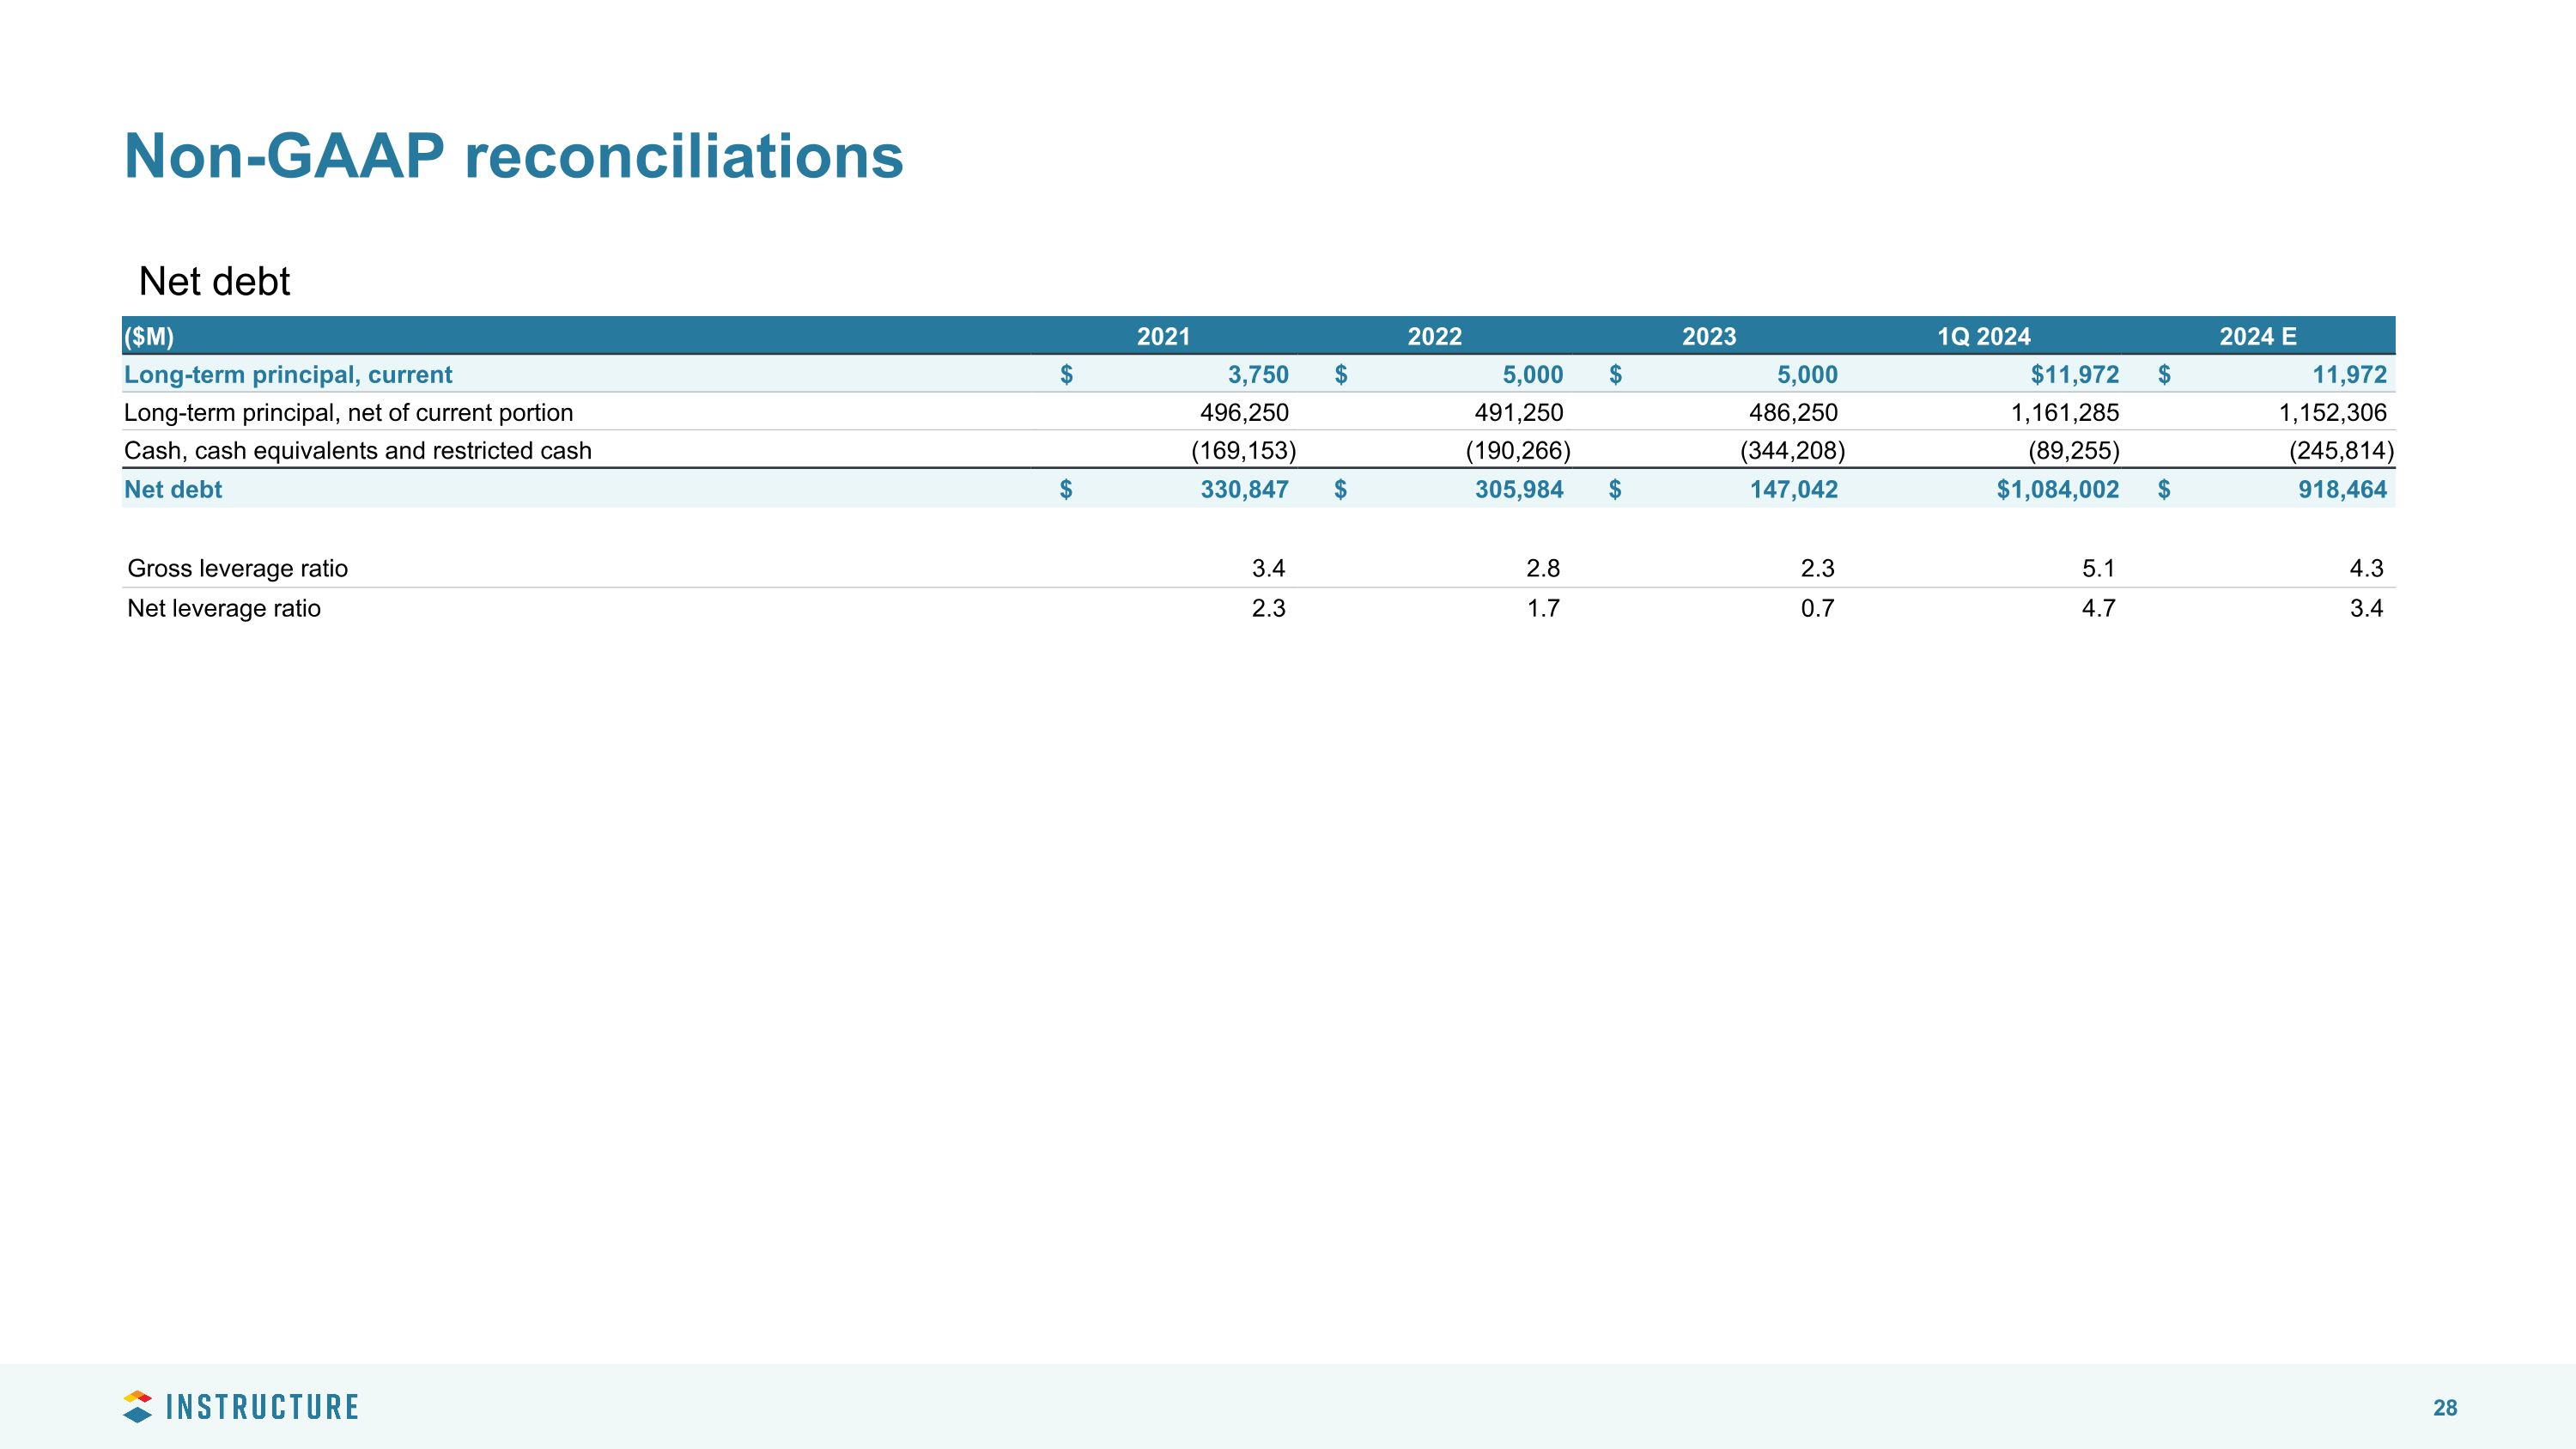
Non-GAAP reconciliations ($M) 2021 2022 2023 1Q 2024 2024 E Long-term principal, current $ 3,750 $ 5,000 $ 5,000 $11,972 $ 11,972 Long-term principal, net of current portion 496,250 491,250 486,250 1,161,285 1,152,306 Cash, cash equivalents and restricted cash (169,153) (190,266) (344,208) (89,255) (245,814) Net debt $ 330,847 $ 305,984 $ 147,042 $1,084,002 $ 918,464 Gross leverage ratio 3.4 2.8 2.3 5.1 4.3 Net leverage ratio 2.3 1.7 0.7 4.7 3.4 Net debt
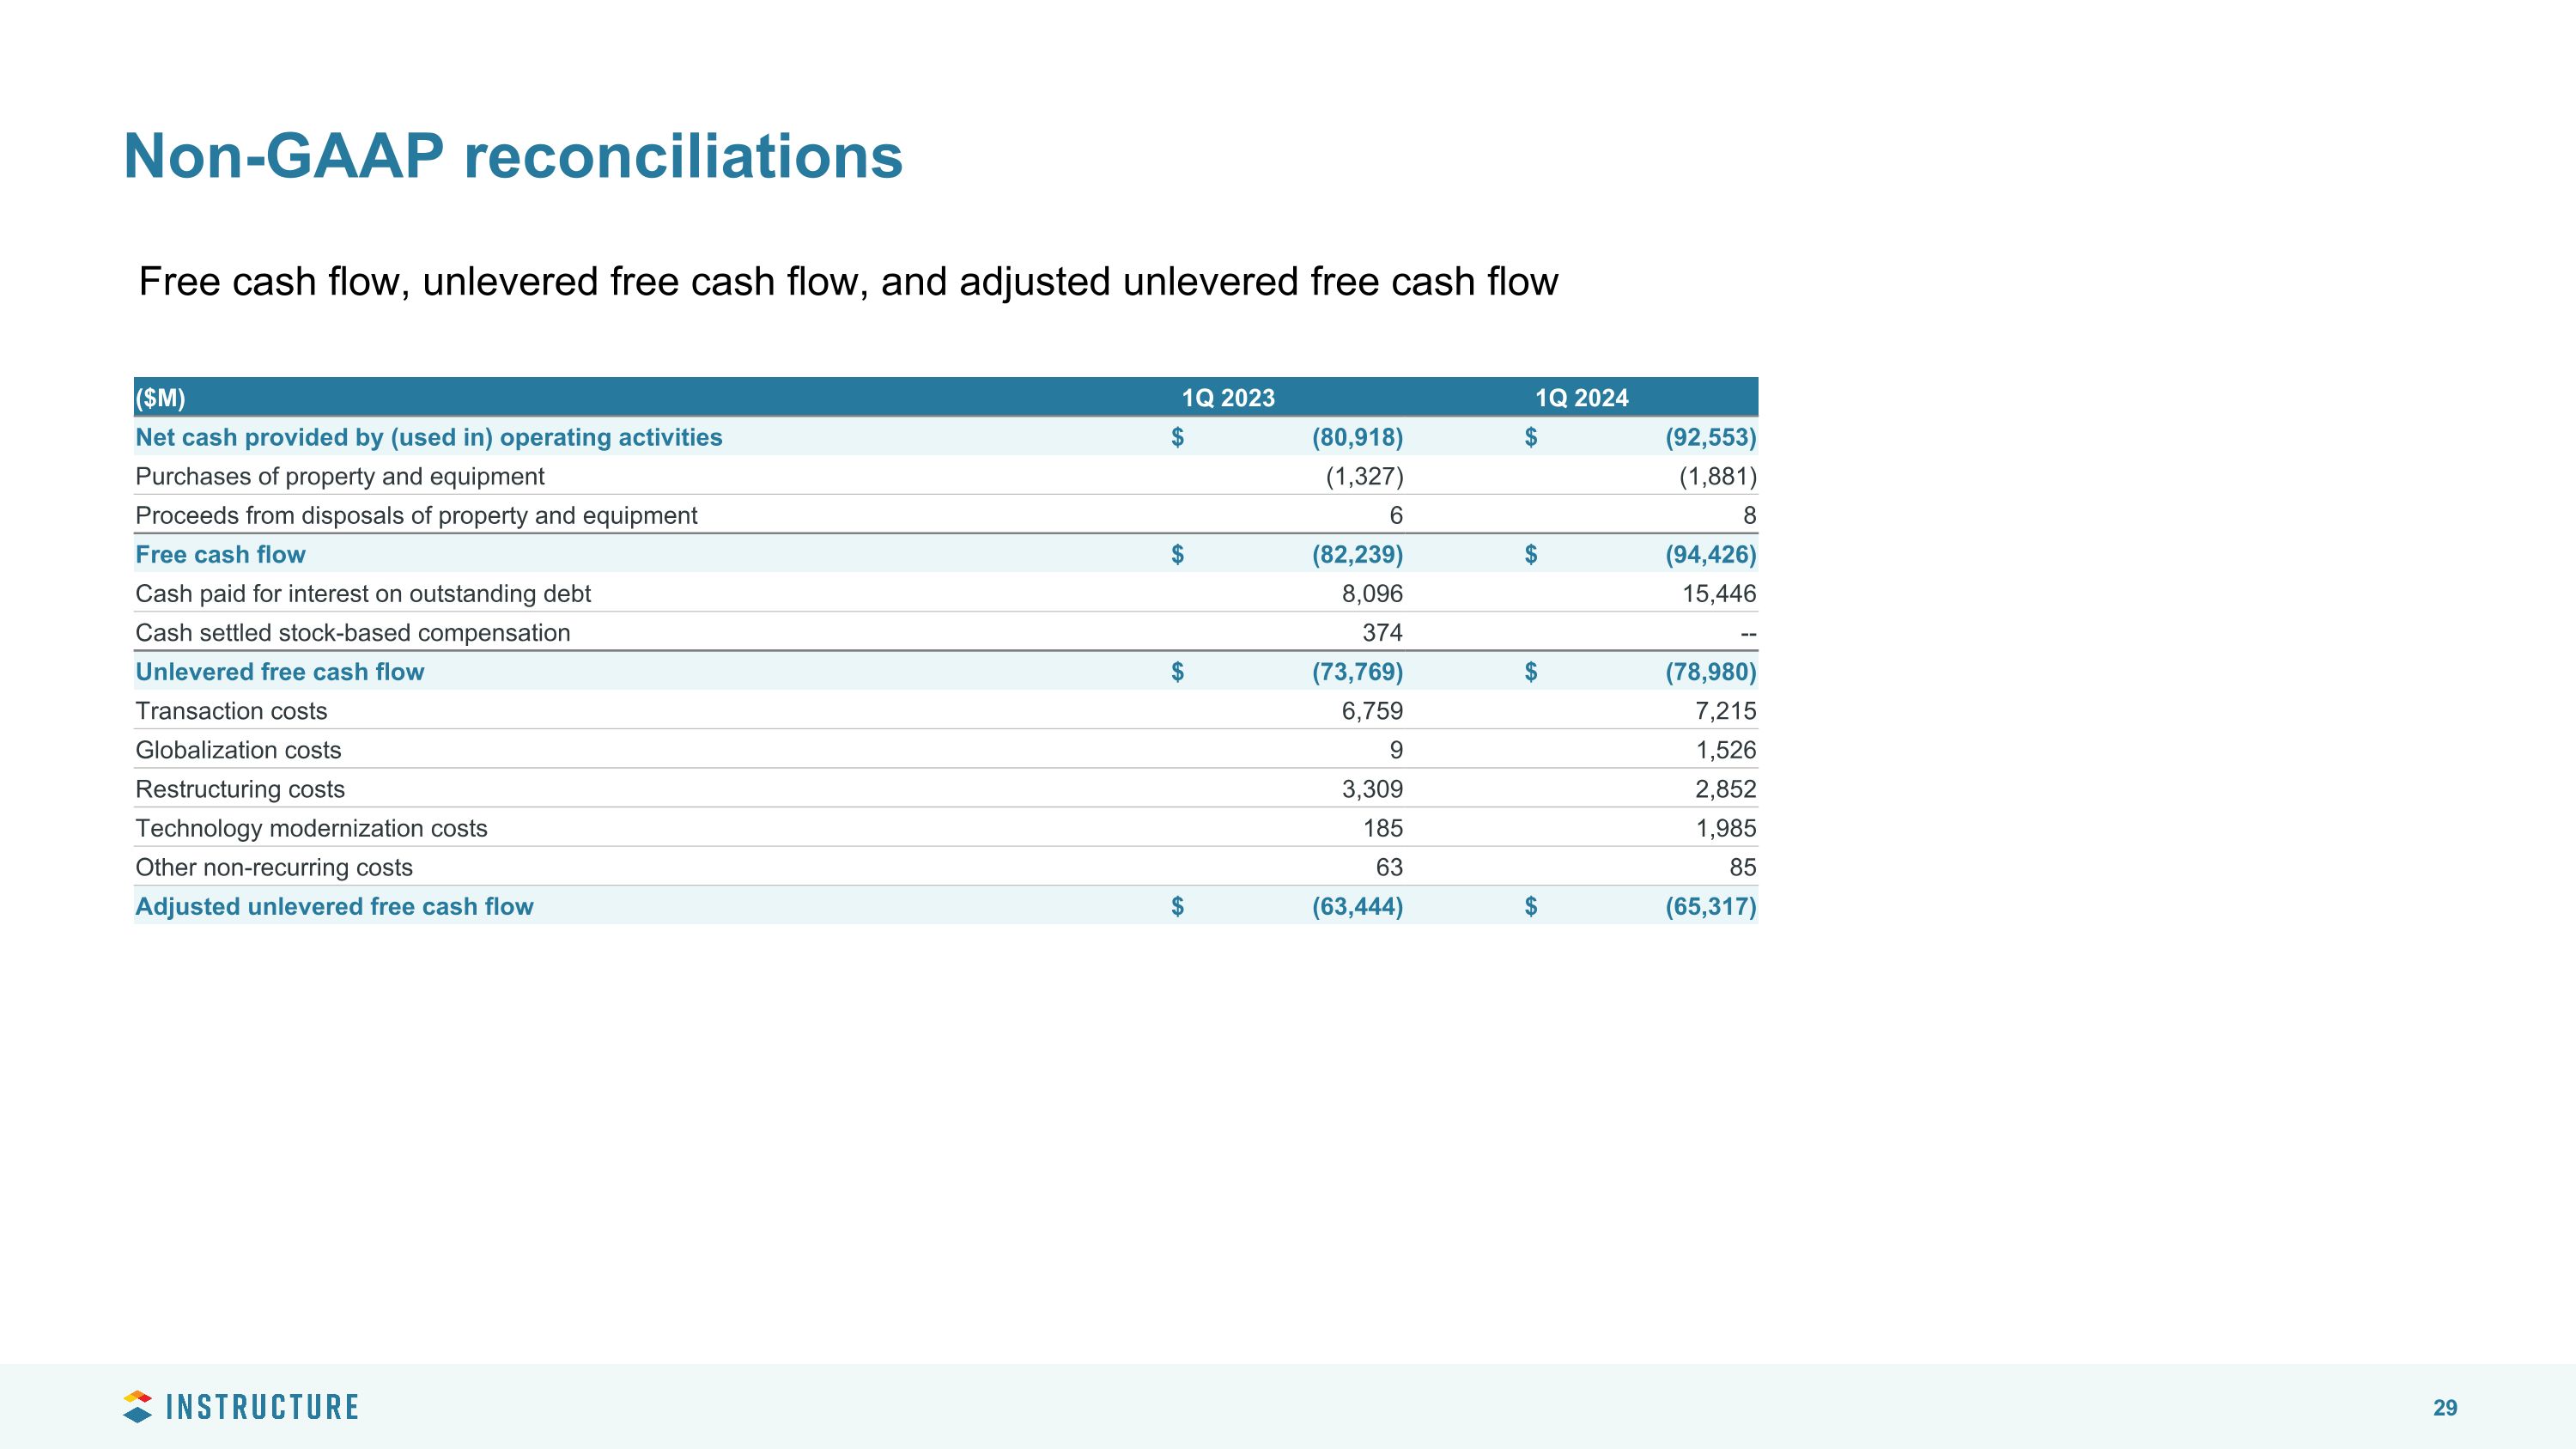
Non-GAAP reconciliations ($M) 1Q 2023 1Q 2024 Net cash provided by (used in) operating activities $ (80,918) $ (92,553) Purchases of property and equipment (1,327) (1,881) Proceeds from disposals of property and equipment 6 8 Free cash flow $ (82,239) $ (94,426) Cash paid for interest on outstanding debt 8,096 15,446 Cash settled stock-based compensation 374 -- Unlevered free cash flow $ (73,769) $ (78,980) Transaction costs 6,759 7,215 Globalization costs 9 1,526 Restructuring costs 3,309 2,852 Technology modernization costs 185 1,985 Other non-recurring costs 63 85 Adjusted unlevered free cash flow $ (63,444) $ (65,317) Free cash flow, unlevered free cash flow, and adjusted unlevered free cash flow
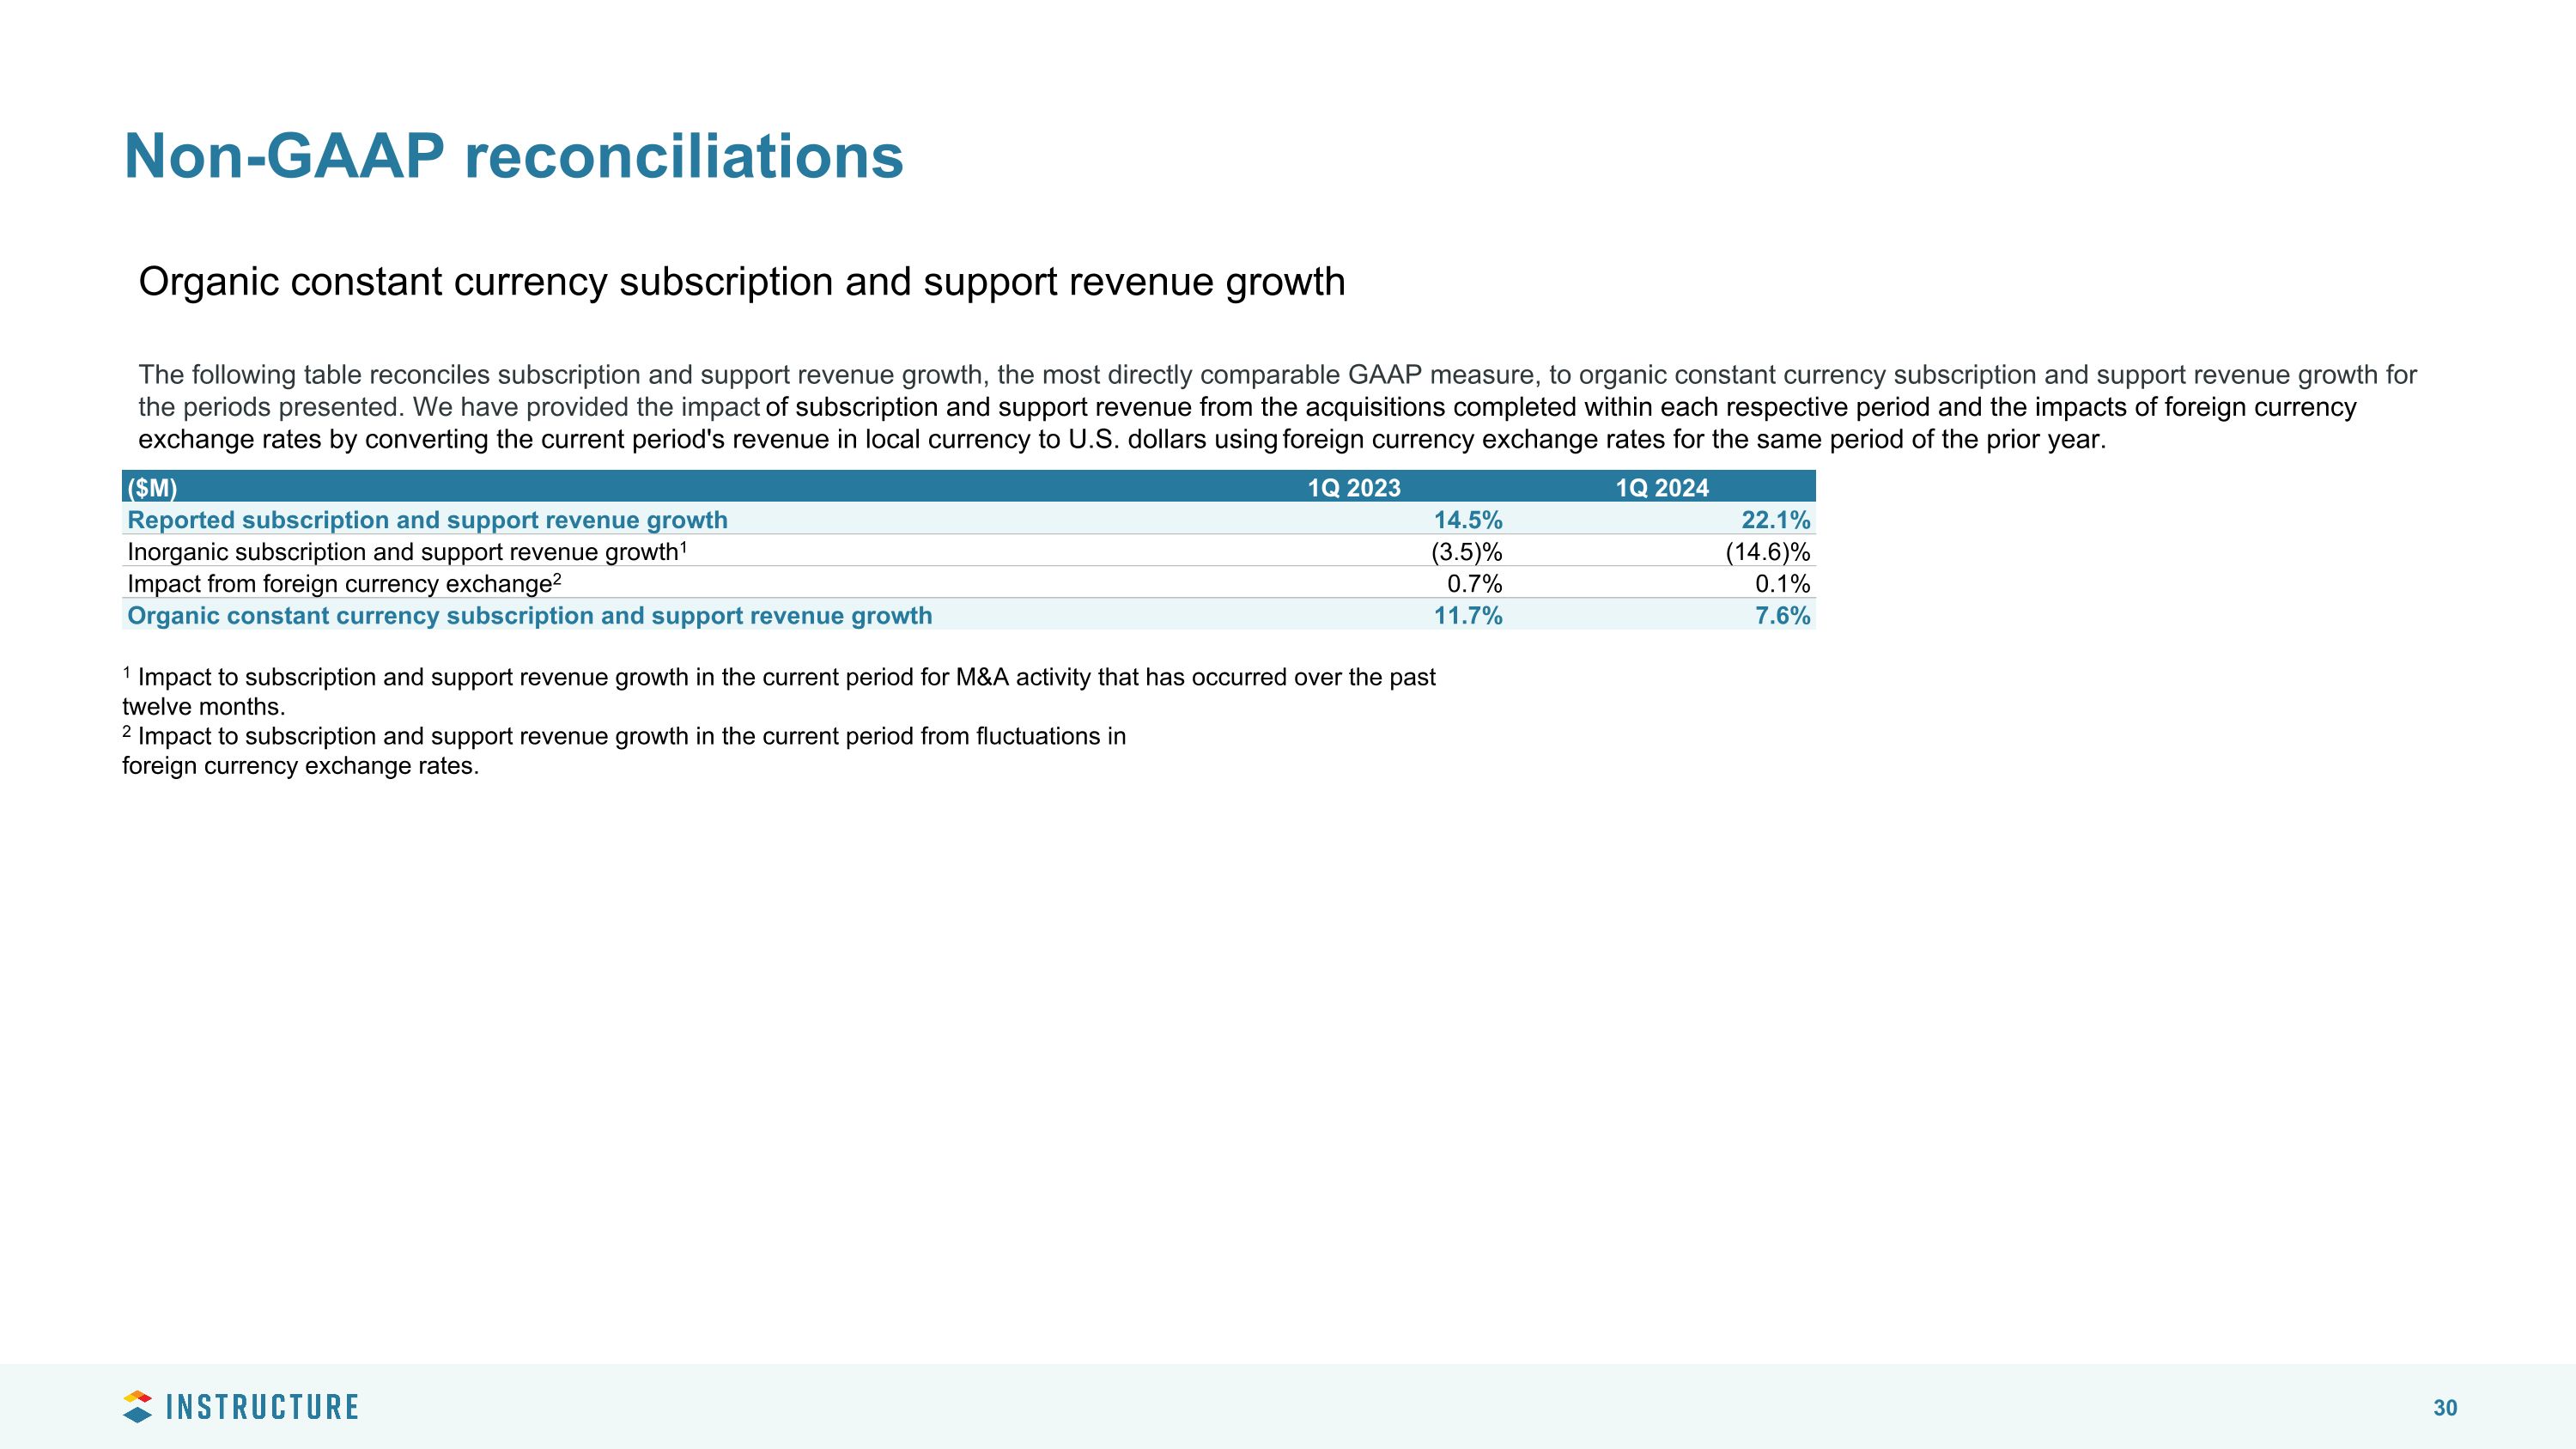
Non-GAAP reconciliations Organic constant currency subscription and support revenue growth The following table reconciles subscription and support revenue growth, the most directly comparable GAAP measure, to organic constant currency subscription and support revenue growth for the periods presented. We have provided the impact of subscription and support revenue from the acquisitions completed within each respective period and the impacts of foreign currency exchange rates by converting the current period's revenue in local currency to U.S. dollars using foreign currency exchange rates for the same period of the prior year. ($M) 1Q 2023 1Q 2024 Reported subscription and support revenue growth 14.5% 22.1% Inorganic subscription and support revenue growth1 (3.5)% (14.6)% Impact from foreign currency exchange2 0.7% 0.1% Organic constant currency subscription and support revenue growth 11.7% 7.6% 1 Impact to subscription and support revenue growth in the current period for M&A activity that has occurred over the past twelve months. 2 Impact to subscription and support revenue growth in the current period from fluctuations in foreign currency exchange rates.
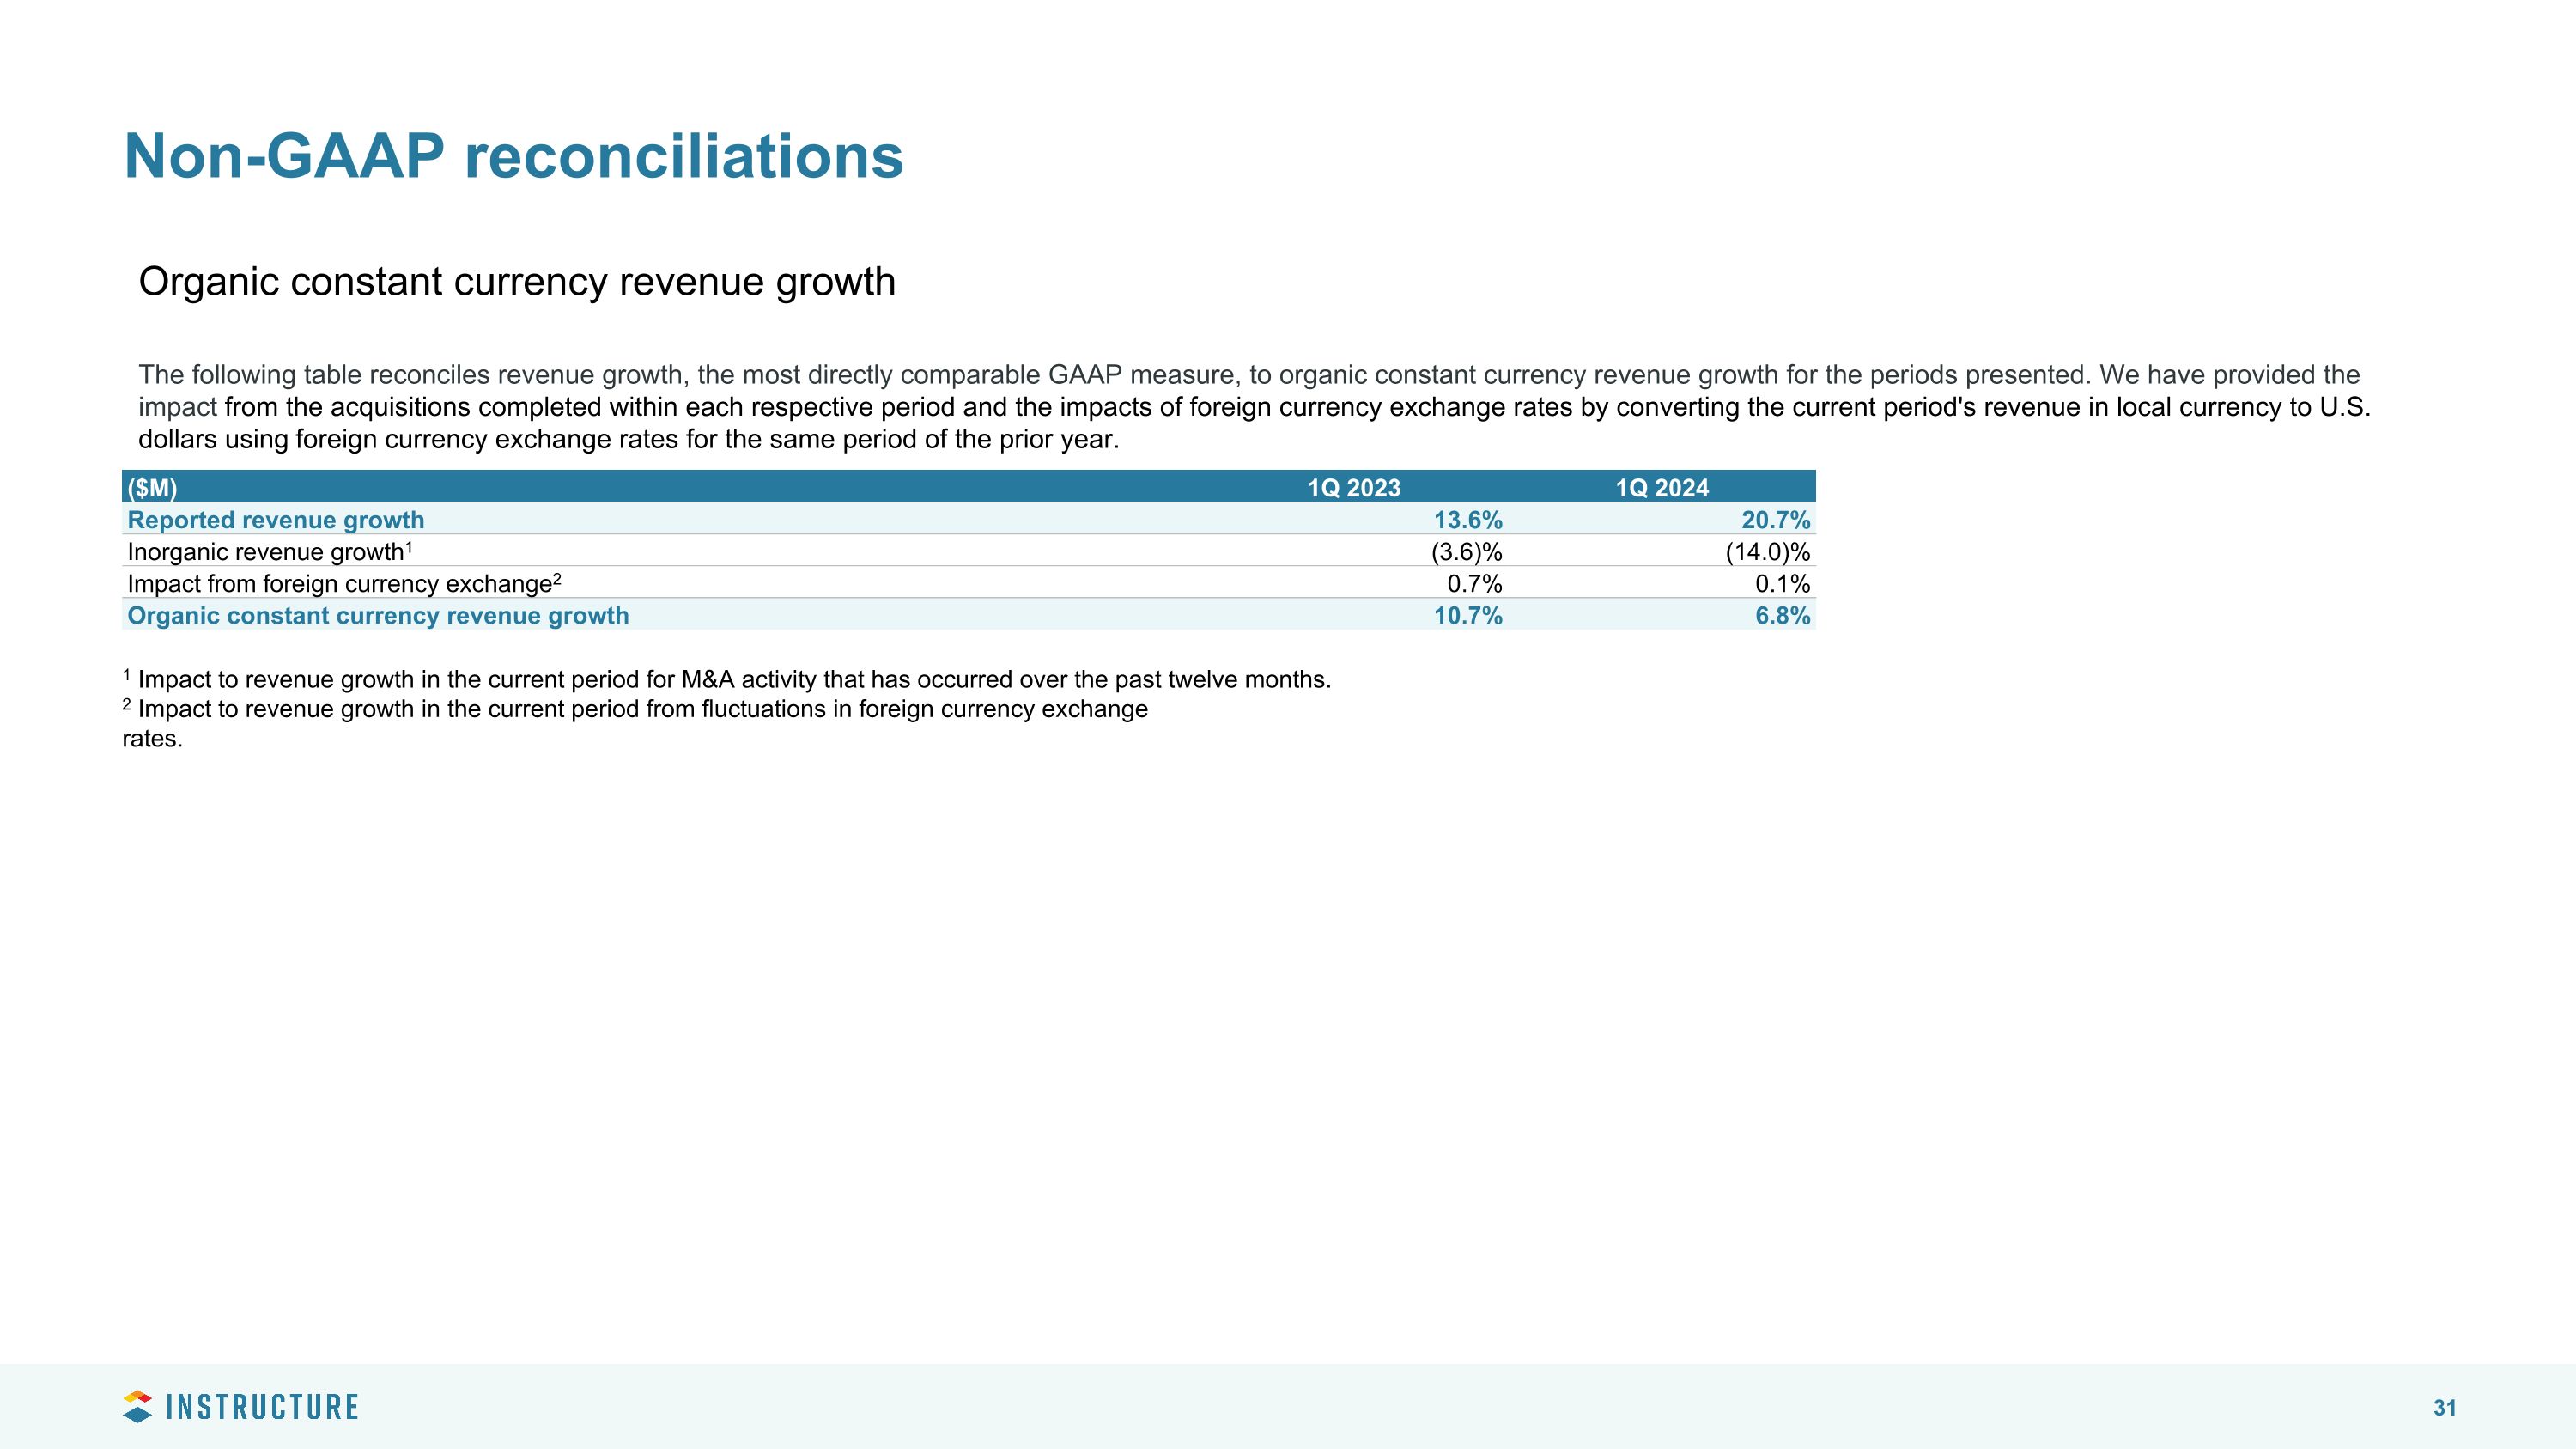
Non-GAAP reconciliations Organic constant currency revenue growth The following table reconciles revenue growth, the most directly comparable GAAP measure, to organic constant currency revenue growth for the periods presented. We have provided the impact from the acquisitions completed within each respective period and the impacts of foreign currency exchange rates by converting the current period's revenue in local currency to U.S. dollars using foreign currency exchange rates for the same period of the prior year. ($M) 1Q 2023 1Q 2024 Reported revenue growth 13.6% 20.7% Inorganic revenue growth1 (3.6)% (14.0)% Impact from foreign currency exchange2 0.7% 0.1% Organic constant currency revenue growth 10.7% 6.8% 1 Impact to revenue growth in the current period for M&A activity that has occurred over the past twelve months. 2 Impact to revenue growth in the current period from fluctuations in foreign currency exchange rates.


