united states
securities and exchange commission
washington, d.c. 20549
form n-csr
certified shareholder report of registered management
investment companies
Investment Company Act file number 333-252816 and 811-23637
DGI Investment Trust
(Exact name of registrant as specified in charter)
c/o Oriental Trust, 254 Munoz Rivera Ave., 10th Floor, San Juan Puerto Rico 00918
(Address of principal executive offices) (Zip code)
Maggie Bull, Ultimus Fund Solutions LLC
2 Easton Oval, Suite 300, Columbus OH 43219
(Name and address of agent for service)
Registrant's telephone number, including area code: 513-869-4262
Date of fiscal year end: 6/30
Date of reporting period: 6/30/22
Item 1. Reports to Stockholders.
(a) Include a copy of the report transmitted to stockholders pursuant to Rule 30e-1 under the Act (17 CFR 270.30e-1).
DGI Balanced Fund
Annual Report
June 30, 2022
This report and the financial statements contained herein are submitted for the general information of shareholders and are not authorized for distribution to prospective investors unless preceded or accompanied by an effective prospectus, which contains information about the Fund’s investment objective, risks, fees and expenses. Investors are reminded to read the prospectus carefully before investing in the Fund.
To Our Shareholders:
We are pleased to update you on the DGI Balanced Fund (the “Fund”). As of June 30, 2022, the Fund completed its first full year after it was registered on May 24,2021 under the Investment Company Act of 1940.
The Fund continues to seek long term positive returns for its shareholders by participating in equity markets while limiting volatility with a majority of the portfolio invested in fixed income securities.
The yearlong period ending June 30, 2022, saw two very different periods for financial markets. During the six months ending December 31, 2021, equity markets saw positive returns while interest rates remained at the lowest levels of recent years. During the second six months of our fiscal year ending June 30, 2022, both equity and long-term fixed income securities had significantly negative returns. Concern about rapidly rising inflation has led to higher interest rates that are now expected to continue to rise. These higher interest rates have led to negative returns for long-term fixed income securities as their prices adjust to higher rates. Equity markets have declined due to investor concerns that rising interest rates and inflation could cause weakness in the economy.
During the Fiscal year ended June 30, 2022, the Fund had a total return of -10.45% for the year. This disappointing return reflects the negative forces affecting financial markets mentioned above.
The investment outlook for the markets is clouded somewhat by uncertainty from rising interest rates and economic volatility, but in our opinion the long-term economic outlook is positive. Participation in equity investments has historically been important when seeking to achieve returns that maintain and grow the real value of savings. The Fund’s strategy seeks to provide participation in that growth while attempting to cushion the risk of equity market declines with a significant position in fixed income securities.
We thank you for your continued investment in the DGI Balanced Fund.

| DGI Balanced Fund |
| PORTFOLIO REVIEW (Unaudited) |
| June 30, 2022 |
| |
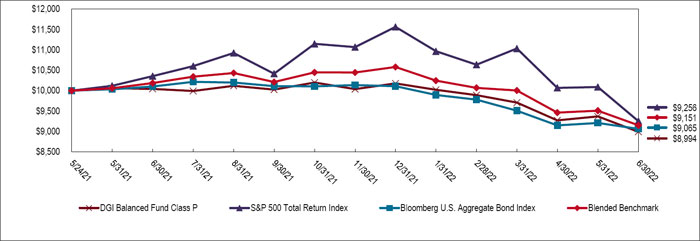
The Fund’s performance figures* for the periods ended June 30, 2022, compared to its benchmarks:
| | One Year | Since Inception (a) |
| DGI Balanced Fund - Class P Shares | (10.45)% | (9.16)% |
| DGI Balanced Fund - Class T Shares | (10.45)% | (9.16)% |
| DGI Balanced Fund - Class NT Shares | (10.45)% | (9.16)% |
| Blended Benchmark Index (67% Bloomberg U.S. Aggregate Bond Index /33% S&P 500 Total Return Index) | (10.17)% | (7.72)% |
| Bloomberg U.S. Aggregate Bond Index ** | (10.29)% | (8.51)% |
| S&P 500 Total Return Index *** | (10.62)% | (6.76)% |
| | | |
| (a) | Inception date is May 24, 2021. |
| * | The performance data quoted is historical. Past performance is no guarantee of future results. Current performance may be higher or lower than the performance data quoted. The principal value and investment return of an investment will fluctuate so that your shares, when redeemed, may be worth more or less than their original cost. Total Returns for periods of less than one year are not annualized. The returns shown do not reflect the deduction of taxes that a shareholder would pay on Fund distributions or on the redemptions of Fund shares. The estimated total annual operating expense ratio for each share class is 1.18% per the Fund’s Prospectus dated October 28, 2021. For performance information current to the most recent month-end, please call 1-877-910-4232. |
| ** | The Bloomberg U.S. Aggregate Bond Index is a broad-based flagship benchmark that measures the investment grade, U.S. dollar-denominated, fixed-rate taxable bond market. The index includes Treasuries, government-related and corporate securities, Mortgage-Backed Securities (agency fixed-rate pass-throughs), Asset-Backed Securities and Commercial Mortgage-Backed Securities (agency and non-agency). Investors cannot invest directly into an index. Index returns are gross of any fees, brokerage commissions or other expenses of investing. |
| *** | The S&P 500 Total Return Index is a widely accepted, unmanaged index of U.S. stock market performance which does not take into account charges, fees and other expenses. Investors cannot invest directly in an index. Index returns are gross of any fees, brokerage commissions or other expenses of investing. |
Comparison of Change in Value of a $10,000 Investment
Since Inception May 24, 2021 through June 30, 2022
| Holdings by Type of Investment | | % of Net Assets | |
| U.S. Government Agencies | | | 44.1 | % |
| Exchange Traded Funds | | | 31.3 | % |
| Common Stock | | | 12.4 | % |
| Collateralized Mortgage Obligations | | | 0.1 | % |
| Short-Term Investment | | | 11.7 | % |
| Other Assets Less Liabilities | | | 0.4 | % |
| | | | 100.0 | % |
| | | | | |
Please refer to the Portfolio of Investments that follows in this annual report for a detail of the Fund’s holdings.
| DGI BALANCED FUND |
| SCHEDULE OF INVESTMENTS |
| June 30, 2022 |
| Shares | | | | | | | | | | | Fair Value | |
| | | | | COMMON STOCK — 12.4% | | | | | | | | | | |
| | | | | BANKING - 12.4% | | | | | | | | | | |
| | 685,000 | | | First BanCorporation | | | | | | | | $ | 8,843,350 | |
| | 420,000 | | | Popular, Inc. | | | | | | | | | 32,310,600 | |
| | | | | TOTAL COMMON STOCK (Cost $22,633,543) | | | | | | | 41,153,950 | |
| | | | | | | | | | | | | | | |
| | | | | EXCHANGE-TRADED FUNDS — 31.3% | | | | | | | | | | |
| | | | | EQUITY - 31.3% | | | | | | | | | | |
| | 139,300 | | | iShares MSCI EAFE ETF | | | | | | | | | 8,704,857 | |
| | 160,000 | | | iShares MSCI Emerging Markets ETF | | | | | | | | | 6,416,000 | |
| | 156,000 | | | iShares Russell 2000 Index Fund | | | | | | | | | 26,420,160 | |
| | 113,400 | | | SPDR S&P 500 ETF Trust | | | | | | | | | 42,780,150 | |
| | 30,500 | | | SPDR S&P China ETF | | | | | | | | | 2,800,510 | |
| | 201,000 | | | Vanguard FTSE Emerging Markets ETF | | | | | | | | | 8,371,650 | |
| | 156,000 | | | Vanguard MSCI Europe ETF | | | | | | | | | 8,239,920 | |
| | | | | TOTAL EXCHANGE-TRADED FUNDS (Cost $105,731,333) | | | | | | 103,733,247 | |
| | | | | | | | | | | | | | | |
| Principal | | | | | | | Coupon Rate | | | | | |
| Amount ($) | | | | | Spread | | (%) | | Maturity | | | |
| | | | | COLLATERALIZED MORTGAGE OBLIGATIONS — 0.1% | | | | | | |
| | 221,462 | | | CFSC Mortgage Trust Series 1 1ZZ(a) | | | | 3.7700 | | 03/25/23 | | | 221,462 | |
| | 4,900 | | | CFSC Mortgage Trust Series 1 1R(a) | | | | 8.0000 | | 03/25/23 | | | — | |
| | 1,073,997 | | | Federal National Mortgage Association Series 2011-M1 X(b),(c) | | US0001M + 6.000% | | 4.3764 | | 07/25/38 | | | 135,126 | |
| | 61,898 | | | Government National Mortgage Association Series IGCT 4Z(a) | | | | 7.5000 | | 12/01/22 | | | 61,898 | |
| | 984 | | | Lehman Brothers Grantor Trust Series 1993-3E(a) | | | | 15.0000 | | 10/24/23 | | | — | |
| | | | | TOTAL COLLATERALIZED MORTGAGE OBLIGATIONS (Cost $356,751) | | | | | 418,486 | |
| | | | | | | | | | | | | | | |
See accompanying notes to financials.
| DGI BALANCED FUND |
| SCHEDULE OF INVESTMENTS (Continued) |
| June 30, 2022 |
| Principal | | | | | Coupon Rate | | | | | |
| Amount ($) | | | | | (%) | | Maturity | | Fair Value | |
| | | | | U.S. GOVERNMENT & AGENCIES — 44.1% | | | | | | | | |
| | | | | FEDERAL HOME LOAN MORTGAGE CORP. — 0.6%(d) | | | | | |
| | 2,060 | | | Federal Home Loan Mortgage Corporation Series B70084 | | 7.5000 | | 06/01/23 | | $ | 2,065 | |
| | 478,182 | | | Federal Home Loan Mortgage Corporation Series D97349 | | 6.0000 | | 09/01/25 | | | 503,455 | |
| | 23,490 | | | Federal Home Loan Mortgage Corporation Series D75702 | | 7.5000 | | 01/01/26 | | | 24,293 | |
| | 29,998 | | | Federal Home Loan Mortgage Corporation Series D79168 | | 8.0000 | | 02/01/27 | | | 30,323 | |
| | 804,621 | | | Federal Home Loan Mortgage Corporation Series J20654 | | 3.0000 | | 08/01/27 | | | 803,626 | |
| | 59,284 | | | Federal Home Loan Mortgage Corporation Series C10178 | | 6.5000 | | 05/01/28 | | | 62,326 | |
| | 288,121 | | | Federal Home Loan Mortgage Corporation Series P51380 | | 5.5000 | | 03/01/36 | | | 296,711 | |
| | 189,498 | | | Federal Home Loan Mortgage Corporation Series C02554 | | 6.0000 | | 06/01/36 | | | 202,819 | |
| | | | | | | | | | | | 1,925,618 | |
| | | | | FEDERAL NATIONAL MORTGAGE ASSOCIATION — 12.0%(d) | | | | | |
| | 537 | | | Federal National Mortgage Association Series 179193 | | 7.0000 | | 07/01/22 | | | 536 | |
| | 26,098 | | | Federal National Mortgage Association Series 426650 | | 6.5000 | | 03/01/24 | | | 27,406 | |
| | 85,065 | | | Federal National Mortgage Association Series 426648 | | 7.0000 | | 04/01/24 | | | 86,386 | |
| | 22,193 | | | Federal National Mortgage Association Series 426646 | | 8.0000 | | 10/01/24 | | | 22,372 | |
| | 12,086 | | | Federal National Mortgage Association Series 426645 | | 8.5000 | | 10/01/24 | | | 12,179 | |
| | 1,384 | | | Federal National Mortgage Association Series 302501 | | 8.5000 | | 12/01/24 | | | 1,394 | |
| | 91,721 | | | Federal National Mortgage Association Series 426651 | | 6.5000 | | 03/01/26 | | | 96,364 | |
| | 23,898 | | | Federal National Mortgage Association Series 511569 | | 8.5000 | | 07/01/26 | | | 24,124 | |
| | 196,957 | | | Federal National Mortgage Association Series AE1268 | | 3.5000 | | 10/01/26 | | | 196,227 | |
| | 22,469 | | | Federal National Mortgage Association Series 367023 | | 7.5000 | | 11/01/26 | | | 22,514 | |
| | 248,498 | | | Federal National Mortgage Association Series AE1285 | | 3.5000 | | 12/01/26 | | | 247,599 | |
| | 32,360 | | | Federal National Mortgage Association Series 367025 | | 8.0000 | | 12/01/26 | | | 32,715 | |
| | 788,273 | | | Federal National Mortgage Association Series AJ1905 | | 3.0000 | | 02/01/27 | | | 785,140 | |
| | 138,567 | | | Federal National Mortgage Association Series 426649 | | 7.0000 | | 02/01/27 | | | 142,806 | |
| | 293,276 | | | Federal National Mortgage Association Series AI9096 | | 3.5000 | | 03/01/27 | | | 292,299 | |
| | 10,598 | | | Federal National Mortgage Association Series 374925 | | 7.5000 | | 03/01/27 | | | 10,620 | |
| | 571,862 | | | Federal National Mortgage Association Series AL3274 | | 3.0000 | | 05/01/27 | | | 570,636 | |
| | 403,343 | | | Federal National Mortgage Association Series AJ1913 | | 3.0000 | | 06/01/27 | | | 396,790 | |
| | 31,113 | | | Federal National Mortgage Association Series 426647 | | 7.5000 | | 06/01/27 | | | 31,425 | |
| | 1,669,552 | | | Federal National Mortgage Association Series AP1217 | | 2.5000 | | 07/01/27 | | | 1,648,836 | |
| | 550,830 | | | Federal National Mortgage Association Series AI9133 | | 3.5000 | | 11/01/27 | | | 552,325 | |
| | 1,134,060 | | | Federal National Mortgage Association Series AR5151 | | 2.5000 | | 04/01/28 | | | 1,119,964 | |
| | | | | | | | | | | | | |
See accompanying notes to financials.
| DGI BALANCED FUND |
| SCHEDULE OF INVESTMENTS (Continued) |
| June 30, 2022 |
| Principal | | | | | Coupon Rate | | | | | |
| Amount ($) | | | | | (%) | | Maturity | | Fair Value | |
| | | | | U.S. GOVERNMENT & AGENCIES — 44.1% (Continued) | | | | | |
| | | | | FEDERAL NATIONAL MORTGAGE ASSOCIATION — 12.0%(d) (Continued) | | | | |
| | 126,993 | | | Federal National Mortgage Association Series AU2244 | | 3.0000 | | 09/01/28 | | $ | 126,720 | |
| | 1,274,211 | | | Federal National Mortgage Association Series AR5202 | | 3.0000 | | 11/01/28 | | | 1,271,474 | |
| | 696,000 | | | Federal National Mortgage Association Series AR5223 | | 3.0000 | | 02/01/29 | | | 694,502 | |
| | 790,952 | | | Federal National Mortgage Association Series AS2542 | | 3.0000 | | 04/01/29 | | | 787,792 | |
| | 599,803 | | | Federal National Mortgage Association Series AS2465 | | 3.0000 | | 04/01/29 | | | 594,534 | |
| | 69,589 | | | Federal National Mortgage Association Series 488061 | | 7.0000 | | 04/01/29 | | | 72,594 | |
| | 786,497 | | | Federal National Mortgage Association Series AV6988 | | 3.0000 | | 05/01/29 | | | 784,806 | |
| | 28,534 | | | Federal National Mortgage Association Series 488076 | | 7.0000 | | 05/01/29 | | | 28,582 | |
| | 1,903,963 | | | Federal National Mortgage Association Series AV1451 | | 3.0000 | | 06/01/29 | | | 1,899,863 | |
| | 1,498,156 | | | Federal National Mortgage Association Series AV6999 | | 3.0000 | | 06/01/29 | | | 1,494,932 | |
| | 1,561,422 | | | Federal National Mortgage Association Series AV6993 | | 3.0000 | | 06/01/29 | | | 1,558,064 | |
| | 958,635 | | | Federal National Mortgage Association Series AV1452 | | 3.0000 | | 07/01/29 | | | 956,570 | |
| | 98,513 | | | Federal National Mortgage Association Series 504137 | | 7.5000 | | 07/01/29 | | | 102,481 | |
| | 74,681 | | | Federal National Mortgage Association Series 504148 | | 7.5000 | | 08/01/29 | | | 76,530 | |
| | 755,135 | | | Federal National Mortgage Association Series AV7011 | | 3.0000 | | 09/01/29 | | | 752,118 | |
| | 40,232 | | | Federal National Mortgage Association Series 523120 | | 7.0000 | | 01/01/30 | | | 40,644 | |
| | 845,916 | | | Federal National Mortgage Association Series AV7045 | | 3.0000 | | 02/01/30 | | | 843,314 | |
| | 19,818 | | | Federal National Mortgage Association Series 523123 | | 7.5000 | | 02/01/30 | | | 19,858 | |
| | 176,107 | | | Federal National Mortgage Association Series 567014 | | 6.5000 | | 03/01/31 | | | 185,055 | |
| | 796,614 | | | Federal National Mortgage Association Series AX5513 | | 3.0000 | | 04/01/31 | | | 793,421 | |
| | 179,003 | | | Federal National Mortgage Association Series 573448 | | 6.5000 | | 04/01/31 | | | 189,049 | |
| | 845,535 | | | Federal National Mortgage Association Series AX5544 | | 3.0000 | | 08/01/31 | | | 842,926 | |
| | 1,191,934 | | | Federal National Mortgage Association Series AX5551 | | 2.5000 | | 10/01/31 | | | 1,171,136 | |
| | 490,809 | | | Federal National Mortgage Association Series AX5567 | | 3.0000 | | 12/01/31 | | | 484,758 | |
| | 827,057 | | | Federal National Mortgage Association Series BD9019 | | 3.0000 | | 01/01/32 | | | 820,146 | |
| | 778,142 | | | Federal National Mortgage Association Series 695394 | | 5.0000 | | 06/01/33 | | | 818,770 | |
| | 223,033 | | | Federal National Mortgage Association Series 850040 | | 6.5000 | | 06/01/36 | | | 236,711 | |
| | 1,950,478 | | | Federal National Mortgage Association Series | | 2.5000 | | 01/01/37 | | | 1,869,876 | |
| | 96,122 | | | Federal National Mortgage Association Series 931180 | | 5.5000 | | 04/01/39 | | | 100,119 | |
| | 490,324 | | | Federal National Mortgage Association Series 953131 | | 4.5000 | | 09/01/39 | | | 503,080 | |
| | 2,531,751 | | | Federal National Mortgage Association Series AI9098 | | 4.0000 | | 03/01/42 | | | 2,559,758 | |
| | 1,538,136 | | | Federal National Mortgage Association Series AS3545 | | 4.0000 | | 09/01/44 | | | 1,551,825 | |
| | 1,648,589 | | | Federal National Mortgage Association Series AV7027 | | 4.0000 | | 11/01/44 | | | 1,663,262 | |
| | 579,876 | | | Federal National Mortgage Association Series AX5471 | | 3.0000 | | 07/01/45 | | | 550,486 | |
| | | | | | | | | | | | | |
See accompanying notes to financials.
| DGI BALANCED FUND |
| SCHEDULE OF INVESTMENTS (Continued) |
| June 30, 2022 |
| Principal | | | | | Coupon Rate | | | | | |
| Amount ($) | | | | | (%) | | Maturity | | Fair Value | |
| | | | | U.S. GOVERNMENT & AGENCIES — 44.1% (Continued) | | | | | | | | |
| | | | | FEDERAL NATIONAL MORTGAGE ASSOCIATION — 12.0%(d) (Continued) | | | | |
| | 858,352 | | | Federal National Mortgage Association Series AV7076 | | 3.0000 | | 07/01/45 | | $ | 816,448 | |
| | 4,897,589 | | | Federal National Mortgage Association Series AS8523 | | 3.0000 | | 11/01/46 | | | 4,635,256 | |
| | 1,508,257 | | | Federal National Mortgage Association Series AX5564 | | 3.0000 | | 12/01/46 | | | 1,428,406 | |
| | | | | | | | | | | | 39,646,523 | |
| | | | | FEDERAL MORTGAGE OBLIGATION — 0.0% | | | | | | | | |
| | 2,338 | | | R&G Federal Mortgage Trust Series(a) | | – | | 08/25/23 | | | — | |
| | | | | | | | | | | | | |
| | | | | GOVERNMENT NATIONAL MORTGAGE ASSOCIATION — 31.5% | | | | | | |
| | 36,527 | | | Government National Mortgage Association Series 325279 | | 8.0000 | | 09/15/22 | | | 36,531 | |
| | 6,718 | | | Government National Mortgage Association Series 406065 | | 7.5000 | | 01/15/25 | | | 6,736 | |
| | 7,261 | | | Government National Mortgage Association Series 406062 | | 7.5000 | | 01/15/25 | | | 7,280 | |
| | 12,235 | | | Government National Mortgage Association Series 439194 | | 7.5000 | | 08/15/25 | | | 12,268 | |
| | 55,181 | | | Government National Mortgage Association Series 425509 | | 8.0000 | | 09/15/25 | | | 57,042 | |
| | 126,963 | | | Government National Mortgage Association Series 705899 | | 3.5000 | | 01/15/26 | | | 126,561 | |
| | 28,564 | | | Government National Mortgage Association Series 385183 | | 7.5000 | | 01/15/26 | | | 28,841 | |
| | 27,321 | | | Government National Mortgage Association Series 5127 | | 4.0000 | | 07/20/26 | | | 27,245 | |
| | 311,780 | | | Government National Mortgage Association Series 711631 | | 3.5000 | | 02/15/27 | | | 311,553 | |
| | 69,933 | | | Government National Mortgage Association Series 5310 | | 3.5000 | | 02/20/27 | | | 68,464 | |
| | 450,380 | | | Government National Mortgage Association Series 705941 | | 3.0000 | | 04/15/27 | | | 442,751 | |
| | 284,485 | | | Government National Mortgage Association Series 711651 | | 3.5000 | | 05/15/27 | | | 284,265 | |
| | 970,674 | | | Government National Mortgage Association Series 740018 | | 3.5000 | | 07/15/27 | | | 974,481 | |
| | 416,256 | | | Government National Mortgage Association Series 705951 | | 2.5000 | | 08/15/27 | | | 398,100 | |
| | 908,165 | | | Government National Mortgage Association Series 744440 | | 3.5000 | | 10/15/27 | | | 911,419 | |
| | 309,100 | | | Government National Mortgage Association Series 705956 | | 2.5000 | | 11/15/27 | | | 295,138 | |
| | 33,685 | | | Government National Mortgage Association Series 711707 | | 2.5000 | | 01/15/28 | | | 32,299 | |
| | 369,973 | | | Government National Mortgage Association Series 767026 | | 2.5000 | | 02/15/28 | | | 353,435 | |
| | 415,984 | | | Government National Mortgage Association Series 721979 | | 2.5000 | | 03/15/28 | | | 399,538 | |
| | 413,527 | | | Government National Mortgage Association Series 722012 | | 3.0000 | | 09/15/28 | | | 406,491 | |
| | 372,557 | | | Government National Mortgage Association Series 722016 | | 2.5000 | | 12/15/28 | | | 355,913 | |
| | 419,604 | | | Government National Mortgage Association Series 722033 | | 3.0000 | | 06/15/29 | | | 410,541 | |
| | 56,835 | | | Government National Mortgage Association Series 626932 | | 3.0000 | | 04/15/30 | | | 55,762 | |
| | 103,338 | | | Government National Mortgage Association Series 548539 | | 6.0000 | | 10/15/31 | | | 109,056 | |
| | 422,953 | | | Government National Mortgage Association Series 635142 | | 3.0000 | | 11/20/31 | | | 414,732 | |
| | 113,000 | | | Government National Mortgage Association Series 636427 | | 6.0000 | | 11/15/34 | | | 119,176 | |
| | | | | | | | | | | | | |
See accompanying notes to financials.
| DGI BALANCED FUND |
| SCHEDULE OF INVESTMENTS (Continued) |
| June 30, 2022 |
| Principal | | | | | Coupon Rate | | | | | |
| Amount ($) | | | | | (%) | | Maturity | | Fair Value | |
| | | | | U.S. GOVERNMENT & AGENCIES — 44.1% (Continued) | | | | | | | | |
| | | | | GOVERNMENT NATIONAL MORTGAGE ASSOCIATION — 31.5% (Continued) | | | | |
| | 105,531 | | | Government National Mortgage Association Series 636567 | | 6.0000 | | 07/15/35 | | $ | 111,379 | |
| | 66,703 | | | Government National Mortgage Association Series 643754 | | 6.0000 | | 10/15/35 | | | 70,328 | |
| | 175,914 | | | Government National Mortgage Association Series 592885 | | 6.0000 | | 05/15/36 | | | 185,665 | |
| | 1,870,391 | | | Government National Mortgage Association Series 655703 | | 6.0000 | | 08/15/37 | | | 2,073,116 | |
| | 1,446,878 | | | Government National Mortgage Association Series 722002 | | 3.5000 | | 03/15/38 | | | 1,438,643 | |
| | 644,232 | | | Government National Mortgage Association Series 767055 | | 3.0000 | | 05/15/38 | | | 611,571 | |
| | 682,655 | | | Government National Mortgage Association Series 767066 | | 3.0000 | | 06/15/38 | | | 648,156 | |
| | 2,243,570 | | | Government National Mortgage Association Series 721997 | | 3.5000 | | 01/15/39 | | | 2,234,009 | |
| | 1,410,406 | | | Government National Mortgage Association Series 678638 | | 4.5000 | | 08/15/39 | | | 1,476,841 | |
| | 571,954 | | | Government National Mortgage Association Series 678639 | | 5.0000 | | 08/15/39 | | | 603,255 | |
| | 1,781,972 | | | Government National Mortgage Association Series 678641 | | 4.5000 | | 09/15/39 | | | 1,865,885 | |
| | 130,274 | | | Government National Mortgage Association Series 719894 | | 4.5000 | | 09/15/39 | | | 134,794 | |
| | 1,030,921 | | | Government National Mortgage Association Series 678642 | | 5.0000 | | 09/15/39 | | | 1,094,579 | |
| | 597,719 | | | Government National Mortgage Association Series 678645 | | 4.5000 | | 10/15/39 | | | 625,532 | |
| | 454,088 | | | Government National Mortgage Association Series 678646 | | 5.0000 | | 10/15/39 | | | 477,120 | |
| | 522,125 | | | Government National Mortgage Association Series 678643 | | 5.5000 | | 11/15/39 | | | 563,650 | |
| | 374,178 | | | Government National Mortgage Association Series 678660 | | 5.0000 | | 03/15/40 | | | 391,409 | |
| | 437,775 | | | Government National Mortgage Association Series 722009 | | 3.5000 | | 07/15/40 | | | 435,910 | |
| | 1,819,540 | | | Government National Mortgage Association Series 705892 | | 4.0000 | | 11/15/40 | | | 1,867,802 | |
| | 437,669 | | | Government National Mortgage Association Series 705894 | | 4.5000 | | 11/15/40 | | | 455,693 | |
| | 539,679 | | | Government National Mortgage Association Series 705937 | | 4.0000 | | 01/15/42 | | | 551,104 | |
| | 2,089,733 | | | Government National Mortgage Association Series 705936 | | 3.5000 | | 02/15/42 | | | 2,090,105 | |
| | 54,384 | | | Government National Mortgage Association Series 5302 | | 3.5000 | | 02/20/42 | | | 52,678 | |
| | 2,215,902 | | | Government National Mortgage Association Series 711653 | | 3.5000 | | 05/20/42 | | | 2,192,910 | |
| | 1,835,869 | | | Government National Mortgage Association Series 721969 | | 3.0000 | | 11/15/42 | | | 1,754,329 | |
| | 2,018,803 | | | Government National Mortgage Association Series 711731 | | 3.0000 | | 03/15/43 | | | 1,928,857 | |
| | 1,766,501 | | | Government National Mortgage Association Series 722001 | | 3.5000 | | 06/15/43 | | | 1,766,814 | |
| | 966,800 | | | Government National Mortgage Association Series 722008 | | 3.0000 | | 08/15/43 | | | 922,924 | |
| | 1,194,003 | | | Government National Mortgage Association Series 722010 | | 3.5000 | | 08/15/43 | | | 1,194,216 | |
| | 688,144 | | | Government National Mortgage Association Series 722011 | | 4.0000 | | 08/15/43 | | | 705,028 | |
| | 2,464,522 | | | Government National Mortgage Association Series 722013 | | 3.5000 | | 09/15/43 | | | 2,464,954 | |
| | 655,721 | | | Government National Mortgage Association Series 722020 | | 3.0000 | | 12/15/43 | | | 623,519 | |
| | 2,043,824 | | | Government National Mortgage Association Series 722021 | | 3.5000 | | 12/15/43 | | | 2,044,188 | |
| | 4,138,260 | | | Government National Mortgage Association Series 609103 | | 3.5000 | | 01/15/44 | | | 4,138,985 | |
| | | | | | | | | | | | | |
See accompanying notes to financials.
| DGI BALANCED FUND |
| SCHEDULE OF INVESTMENTS (Continued) |
| June 30, 2022 |
| Principal | | | | | Coupon Rate | | | | | |
| Amount ($) | | | | | (%) | | Maturity | | Fair Value | |
| | | | | U.S. GOVERNMENT & AGENCIES — 44.1% (Continued) | | | | | | | | |
| | | | | GOVERNMENT NATIONAL MORTGAGE ASSOCIATION — 31.5% (Continued) | | | | | |
| | 2,348,288 | | | Government National Mortgage Association Series 609163 | | 3.5000 | | 07/15/44 | | $ | 2,348,705 | |
| | 2,968,619 | | | Government National Mortgage Association Series 609200 | | 3.5000 | | 10/15/44 | | | 2,969,144 | |
| | 2,180,453 | | | Government National Mortgage Association Series 609214 | | 3.0000 | | 11/20/44 | | | 2,049,371 | |
| | 2,864,252 | | | Government National Mortgage Association Series 626921 | | 3.0000 | | 03/15/45 | | | 2,722,381 | |
| | 8,729,040 | | | Government National Mortgage Association Series 626934 | | 3.0000 | | 04/20/45 | | | 8,162,229 | |
| | 5,653,774 | | | Government National Mortgage Association Series 626941 | | 3.0000 | | 05/15/45 | | | 5,373,745 | |
| | 3,085,204 | | | Government National Mortgage Association Series 635068 | | 3.0000 | | 04/15/46 | | | 2,932,837 | |
| | 2,420,564 | | | Government National Mortgage Association Series AE3319 | | 3.0000 | | 07/15/46 | | | 2,300,669 | |
| | 1,589,823 | | | Government National Mortgage Association Series AW2756 | | 3.0000 | | 09/15/46 | | | 1,511,066 | |
| | 1,768,000 | | | Government National Mortgage Association Series 635133 | | 3.0000 | | 10/20/46 | | | 1,653,533 | |
| | 2,555,574 | | | Government National Mortgage Association Series AW3558 | | 3.0000 | | 11/15/46 | | | 2,428,969 | |
| | 1,112,575 | | | Government National Mortgage Association Series 635153 | | 3.0000 | | 12/20/46 | | | 1,045,475 | |
| | 2,123,182 | | | Government National Mortgage Association Series 690615 | | 3.0000 | | 06/15/47 | | | 2,011,226 | |
| | 2,333,643 | | | Government National Mortgage Association Series 690625 | | 3.0000 | | 07/20/47 | | | 2,182,122 | |
| | 580,858 | | | Government National Mortgage Association Series BC3027 | | 3.0000 | | 03/15/48 | | | 552,168 | |
| | 2,325,748 | | | Government National Mortgage Association Series AD6371 | | 3.0000 | | 03/15/48 | | | 2,198,963 | |
| | 3,291,239 | | | Government National Mortgage Association Series BE1665 | | 4.0000 | | 05/20/48 | | | 3,319,917 | |
| | 2,902,845 | | | Government National Mortgage Association Series BG5690 | | 4.0000 | | 09/15/48 | | | 2,950,796 | |
| | 1,017,012 | | | Government National Mortgage Association Series BJ1540 | | 3.5000 | | 09/20/48 | | | 1,006,487 | |
| | 817,356 | | | Government National Mortgage Association Series BJ1536 | | 3.5000 | | 09/20/48 | | | 808,848 | |
| | 2,925,541 | | | Government National Mortgage Association Series BJ9877 | | 4.0000 | | 11/15/48 | | | 2,974,152 | |
| | 1,991,595 | | | Government National Mortgage Association Series BJ9885 | | 4.0000 | | 12/15/48 | | | 2,024,669 | |
| | 1,186,187 | | | Government National Mortgage Association Series BJ9893 | | 3.5000 | | 12/20/48 | | | 1,173,838 | |
| | 1,075,165 | | | Government National Mortgage Association Series BJ9892 | | 3.5000 | | 01/15/49 | | | 1,057,703 | |
| | | | | | | | | | | | 104,200,579 | |
| | | | | TOTAL U.S. GOVERNMENT & AGENCIES (Cost $150,400,391) | | | | | 145,772,720 | |
| | | | | | | | | | | | | |
See accompanying notes to financials.
| DGI BALANCED FUND |
| SCHEDULE OF INVESTMENTS (Continued) |
| June 30, 2022 |
| Shares | | | | | Fair Value | |
| | | | | SHORT-TERM INVESTMENT — 11.7% | | | | |
| | | | | MONEY MARKET FUND - 11.7% | | | | |
| | 38,664,500 | | | Dreyfus Treasury Obligations Cash Management Fund, Institutional Class, 1.32% (Cost $38,664,500)(e) | | $ | 38,664,500 | |
| | | | | | | | | |
| | | | | TOTAL INVESTMENTS - 99.6% (Cost $317,786,518) | | $ | 329,742,903 | |
| | | | | OTHER ASSETS IN EXCESS OF LIABILITIES - 0.4% | | | 1,163,991 | |
| | | | | NET ASSETS - 100.0% | | $ | 330,906,894 | |
| EAFE | - Europe, Australasia and Far East |
| | |
| ETF | - Exchange-Traded Fund |
| | |
| MSCI | - Morgan Stanley Capital International |
| | |
| SPDR | - Standard & Poor’s Depositary Receipt |
| | |
| US0001M | -ICE LIBOR USD 1 Month |
| (a) | The value of this security has been determined in good faith under policies of the Board of Trustees. The total value of these securities is $283,360 or 0.1% of net assets. |
| (b) | Interest only security. |
| (c) | Variable rate security; the rate shown represents the rate on June 30, 2022. |
| (d) | Issuer operates under a Congressional charter; its securities are neither issued nor guaranteed by the U.S. government. The Federal National Mortgage Association and the Federal Home Loan Mortgage Corporation currently operate under a federal conservatorship. |
| (e) | Rate disclosed is the seven day effective yield as of June 30, 2022. |
See accompanying notes to financials.
| DGI Balanced Fund |
| STATEMENT OF ASSETS AND LIABILITIES |
| June 30, 2022 |
| ASSETS | | | | |
| Investment securities: | | | | |
| At cost | | $ | 317,786,518 | |
| At value | | $ | 329,742,903 | |
| Interest and dividends receivable | | | 1,878,204 | |
| Prepaid expenses & other assets | | | 335,066 | |
| TOTAL ASSETS | | | 331,956,173 | |
| | | | | |
| LIABILITIES | | | | |
| Due to custodian | | | 72,438 | |
| Redemptions Payable | | | 45,716 | |
| Advisory fees payable | | | 257,166 | |
| Accrued tax liability | | | 445,825 | |
| Transfer agency fees payable | | | 83,743 | |
| Administration fees payable | | | 60,205 | |
| Trustees fees payable | | | 7,249 | |
| Accrued expenses and other liabilities | | | 76,937 | |
| TOTAL LIABILITIES | | | 1,049,279 | |
| NET ASSETS | | $ | 330,906,894 | |
| | | | | |
| Net Assets Consist Of: | | | | |
| Paid in capital ($0 par value, unlimited shares authorized) | | $ | 317,120,911 | |
| Accumulated earnings | | | 13,785,983 | |
| NET ASSETS | | $ | 330,906,894 | |
| | | | | |
| Net Asset Value Per Share: | | | | |
| Class P Shares | | | | |
| Net Assets | | $ | 201,136,143 | |
| Shares of beneficial interest outstanding ($0 par value, unlimited shares authorized) | | | 19,464,721 | |
| Net asset value (Net Assets ÷ Shares Outstanding), offering price and redemption price per share | | $ | 10.33 | |
| | | | | |
| Class T Shares | | | | |
| Net Assets | | $ | 108,581,454 | |
| Shares of beneficial interest outstanding ($0 par value, unlimited shares authorized) | | | 10,508,281 | |
| Net asset value (Net Assets ÷ Shares Outstanding), offering price and redemption price per share | | $ | 10.33 | |
| | | | | |
| Class NT Shares | | | | |
| Net Assets | | $ | 21,189,297 | |
| Shares of beneficial interest outstanding ($0 par value, unlimited shares authorized) | | | 2,050,556 | |
| Net asset value (Net Assets ÷ Shares Outstanding), offering price and redemption price per share | | $ | 10.33 | |
| | | | | |
See accompanying notes to financials.
| DGI Balanced Fund |
| STATEMENT OF OPERATIONS |
| For the Year Ended June 30, 2022 |
| INVESTMENT INCOME | | | | |
| Dividends (Foreign Taxes Withheld: $104,888) | | $ | 3,283,010 | |
| Interest | | | 4,501,229 | |
| TOTAL INVESTMENT INCOME | | | 7,784,239 | |
| | | | | |
| EXPENSES | | | | |
| Investment advisory fees | | | 3,479,684 | |
| Tax Expense | | | 445,825 | |
| Transfer agent fees | | | 384,809 | |
| Administrative services fees | | | 331,988 | |
| Offering costs | | | 153,488 | |
| Legal fees | | | 106,866 | |
| Trustees fees and expenses | | | 77,346 | |
| Printing and postage expenses | | | 74,166 | |
| Compliance officer fees | | | 39,320 | |
| Custodian fees | | | 29,942 | |
| Insurance fees | | | 26,898 | |
| Audit and tax fees | | | 12,750 | |
| Other expenses | | | 71,143 | |
| TOTAL EXPENSES | | | 5,234,225 | |
| | | | | |
| NET INVESTMENT INCOME | | | 2,550,014 | |
| | | | | |
| NET REALIZED AND UNREALIZED LOSS ON INVESTMENTS | | | | |
| Net realized loss on: | | | | |
| Investments | | | (2,064 | ) |
| | | | | |
| Net change in unrealized appreciation on: | | | | |
| Investments | | | (41,353,426 | ) |
| | | | | |
| NET REALIZED AND UNREALIZED LOSS ON INVESTMENTS | | | (41,355,490 | ) |
| | | | | |
| NET DECREASE IN NET ASSETS RESULTING FROM OPERATIONS | | $ | (38,805,476 | ) |
| | | | | |
See accompanying notes to financials.
| DGI Balanced Fund |
| STATEMENTS OF CHANGES IN NET ASSETS |
| | | Year Ended | | | Period* Ended | |
| | | June 30, | | | June 30, | |
| | | 2022 | | | 2021 | |
| FROM OPERATIONS | | | | | | | | |
| Net investment income | | $ | 2,550,014 | | | $ | 862,268 | |
| Net realized loss from investments | | | (2,064 | ) | | | (52,239 | ) |
| Net change in unrealized appreciation/(depreciation) on investments | | | (41,353,426 | ) | | | 591,642 | |
| Net increase/(decrease) in net assets resulting from operations | | | (38,805,476 | ) | | | 1,401,671 | |
| | | | | | | | | |
| DISTRIBUTIONS | | | | | | | | |
| Distributions to shareholders | | | (1,528,381 | ) | | | — | |
| | | | | | | | | |
| FROM SHARES OF BENEFICIAL INTEREST | | | | | | | | |
| Proceeds from contribution in-kind | | | | | | | | |
| Class P Shares | | | — | | | | 236,498,768 | |
| Class T Shares | | | — | | | | 131,075,028 | |
| Class NT Shares | | | — | | | | 25,546,005 | |
| Proceeds from shares sold: | | | | | | | | |
| Class P Shares | | | 7,220,111 | | | | 694,972 | |
| Class T Shares | | | 555,901 | | | | 477 | |
| Class NT Shares | | | 117,748 | | | | 95 | |
| Payments for shares redeemed: | | | | | | | | |
| Class P Shares | | | (17,946,771 | ) | | | (1,833,403 | ) |
| Class T Shares | | | (9,118,818 | ) | | | (1,101,044 | ) |
| Class NT Shares | | | (1,717,810 | ) | | | (252,179 | ) |
| Net increase/(decrease) in net assets from shares of beneficial interest | | | (20,889,639 | ) | | | 390,628,719 | |
| | | | | | | | | |
| TOTAL INCREASE/(DECREASE) IN NET ASSETS | | | (61,223,496 | ) | | | 392,030,390 | |
| | | | | | | | | |
| NET ASSETS | | | | | | | | |
| Beginning of year/period | | | 392,130,390 | | | | 100,000 | |
| End of year/period | | $ | 330,906,894 | | | $ | 392,130,390 | |
| | | | | | | | | |
| SHARE ACTIVITY | | | | | | | | |
| Class P Shares: | | | | | | | | |
| Shares issues in connection with Contribution in-kind | | | — | | | | 20,503,647 | |
| Shares Sold | | | 649,098 | | | | 59,979 | |
| Shares Redeemed | | | (1,598,158 | ) | | | (158,541 | ) |
| Net increase/(decrease) in shares of beneficial interest outstanding | | | (949,060 | ) | | | 20,405,085 | |
| | | | | | | | | |
| Class T Shares: | | | | | | | | |
| Shares issues in connection with Contribution in-kind | | | — | | | | 11,363,656 | |
| Shares Sold | | | 48,282 | | | | 41 | |
| Shares Redeemed | | | (808,866 | ) | | | (94,832 | ) |
| Net increase/(decrease) in shares of beneficial interest outstanding | | | (760,584 | ) | | | 11,268,865 | |
| | | | | | | | | |
| Class NT Shares: | | | | | | | | |
| Shares issues in connection with Contribution in-kind | | | — | | | | 2,214,735 | |
| Shares sold | | | 10,131 | | | | 8 | |
| Shares redeemed | | | (152,630 | ) | | | (21,688 | ) |
| Net increase/(decrease) in shares of beneficial interest outstanding | | | (142,499 | ) | | | 2,193,055 | |
| | | | | | | | | |
| * | DGI Balanced Fund commenced operations on May 24, 2021. |
See accompanying notes to financials.
| DGI Balanced Fund |
| FINANCIAL HIGHLIGHTS |
| |
| Per Share Data and Ratios for a Share of Beneficial Interest Outstanding Throughout each Year/Period |
| | | Class P Shares | |
| | | Year Ended | | | Period* Ended | |
| | | June 30, | | | June 30, | |
| | | 2022 | | | 2021 | |
| Net asset value, beginning of year/period | | $ | 11.58 | | | $ | 11.53 | |
| Activity from investment operations: | | | | | | | | |
| Net investment income (1,2) | | | 0.08 | | | | 0.03 | |
| Net realized and unrealized gain/(loss) on investments | | | (1.28 | ) | | | 0.02 | |
| Total from investment operations | | | (1.20 | ) | | | 0.05 | |
| Distribution to Shareholders from Ordinary Income | | | (0.05 | ) | | | — | |
| Total distributions | | | (0.05 | ) | | | — | |
| Net asset value, end of year/period | | | 10.33 | | | $ | 11.58 | |
| Total return (3) | | | (10.45 | )% | | | 0.43 | % |
| Net assets, end of year/period (000’s) | | $ | 201,136 | | | $ | 236,301 | |
| Ratio of expenses to average net assets (4) | | | 1.40 | % | | | 1.17 | %(5) |
| Ratio of net investment income to average net assets (2,4) | | | 0.68 | % | | | 2.10 | %(5) |
| Portfolio Turnover Rate | | | 3 | % | | | 0 | %(6) |
| | | | | | | | | |
| * | The DGI Balanced Fund commenced operations on May 24, 2021. |
| (1) | Per share amounts calculated using the average shares method, which more appropriately presents the per share data for the period. |
| (2) | Recognition of net investment income by the Fund is affected by the timing of the declaration of dividends by the underlying investment companies in which the Fund invests. |
| (3) | Total returns are historical and assume changes in share price and reinvestment of dividends, if any. Total returns for periods of less than one year are not annualized. |
| (4) | Does not include the expenses of other investment companies in which the Fund invests, if any. |
See accompanying notes to financials.
| DGI Balanced Fund |
| FINANCIAL HIGHLIGHTS |
| |
| Per Share Data and Ratios for a Share of Beneficial Interest Outstanding Throughout each Year/Period |
| | | Class T Shares | |
| | | Year Ended | | | Period* Ended | |
| | | June 30, | | | June 30, | |
| | | 2022 | | | 2021 | |
| Net asset value, beginning of year/period | | $ | 11.58 | | | $ | 11.53 | |
| Activity from investment operations: | | | | | | | | |
| Net investment income (1,2) | | | 0.08 | | | | 0.03 | |
| Net realized and unrealized gain/(loss) on investments | | | (1.28 | ) | | | 0.02 | |
| Total from investment operations | | | (1.20 | ) | | | 0.05 | |
| Distribution to Shareholders from Ordinary Income | | | (0.05 | ) | | | — | |
| Total distributions | | | (0.05 | ) | | | — | |
| Net asset value, end of year/period | | $ | 10.33 | | | $ | 11.58 | |
| Total return (3) | | | (10.45 | )% | | | 0.43 | % |
| Net assets, end of year/period (000’s) | | $ | 108,581 | | | $ | 130,443 | |
| Ratio of expenses to average net assets (4) | | | 1.40 | % | | | 1.17 | %(5) |
| Ratio of net investment income to average net assets (2,4) | | | 0.68 | % | | | 2.10 | %(5) |
| Portfolio Turnover Rate | | | 3 | % | | | 0 | %(6) |
| | | | | | | | | |
| * | The DGI Balanced Fund commenced operations on May 24, 2021. |
| (1) | Per share amounts calculated using the average shares method, which more appropriately presents the per share data for the period. |
| (2) | Recognition of net investment income by the Fund is affected by the timing of the declaration of dividends by the underlying investment companies in which the Fund invests. |
| (3) | Total returns are historical and assume changes in share price and reinvestment of dividends, if any. Total returns for periods of less than one year are not annualized. |
| (4) | Does not include the expenses of other investment companies in which the Fund invests, if any. |
See accompanying notes to financials.
| DGI Balanced Fund |
| FINANCIAL HIGHLIGHTS |
| |
| Per Share Data and Ratios for a Share of Beneficial Interest Outstanding Throughout each Year/Period |
| | | Class NT Shares | |
| | | Year Ended | | | Period* Ended | |
| | | June 30, | | | June 30, | |
| | | 2022 | | | 2021 | |
| Net asset value, beginning of year/period | | $ | 11.58 | | | $ | 11.53 | |
| Activity from investment operations: | | | | | | | | |
| Net investment income (1,2) | | | 0.08 | | | | 0.03 | |
| Net realized and unrealized gain/(loss) on investments | | | (1.28 | ) | | | 0.02 | |
| Total from investment operations | | | (1.20 | ) | | | 0.05 | |
| Distribution to Shareholders from Ordinary Income | | | (0.05 | ) | | | — | |
| Total distributions | | | (0.05 | ) | | | — | |
| Net asset value, end of year/period | | $ | 10.33 | | | $ | 11.58 | |
| Total return (3) | | | (10.45 | )% | | | 0.43 | % |
| Net assets, end of year/period (000’s) | | $ | 21,189 | | | $ | 25,386 | |
| Ratio of expenses to average net assets (4) | | | 1.40 | % | | | 1.17 | %(5) |
| Ratio of net investment income to average net assets (2,4) | | | 0.68 | % | | | 2.10 | %(5) |
| Portfolio Turnover Rate | | | 3 | % | | | 0 | %(6) |
| | | | | | | | | |
| * | The DGI Balanced Fund commenced operations on May 24, 2021. |
| (1) | Per share amounts calculated using the average shares method, which more appropriately presents the per share data for the period. |
| (2) | Recognition of net investment income by the Fund is affected by the timing of the declaration of dividends by the underlying investment companies in which the Fund invests. |
| (3) | Total returns are historical and assume changes in share price and reinvestment of dividends, if any. Total returns for periods of less than one year are not annualized. |
| (4) | Does not include the expenses of other investment companies in which the Fund invests, if any. |
See accompanying notes to financials.
| DGI Balanced Fund |
| NOTES TO FINANCIAL STATEMENTS |
| June 30, 2022 |
The DGI Balanced Fund (the “Fund”) is a diversified series of shares of beneficial interest of DGI Investment Trust (the “Trust”), a collective investment trust formed and organized under the laws of the Commonwealth of Puerto Rico (the “Commonwealth” or “Puerto Rico”) pursuant to a certain Deed of Constitution of Trust, dated January 28, 2021, as amended and restated from time to time (the “Deed of Trust”), and is registered under the Investment Company Act of 1940, as amended (the “1940 Act”), as a diversified, open-end management investment company. The Fund offers Class P, Class T and Class NT shares. The Fund commenced investment operations on May 24, 2021. The Fund’s investment objective is to seek long-term capital appreciation and current income. Investment in the Fund is intended for residents of Puerto Rico.
As of the close of business on May 21, 2021, all of the assets of the Puerto Rico Diversified Tax Managed Total Return IRA Trust were acquired by the Fund. The net asset value of the Fund’s shares on the close of business May 21, 2021, after the reorganization, and the value of in-kind capital contributions of securities and cash valued was as follows:
| | Net Asset | | |
| Share | Value Per | Capital | |
| Class | Share | Contribution | Shares Issued |
| Class P | $11.53 | $236,498,768 | 20,503,647 |
| Class T | 11.53 | 131,075,028 | 11,363,656 |
| Class NT | 11.53 | 25,546,005 | 2,214,735 |
Each share class represents an interest in the same assets of the Fund and classes are identical except for differences in tax treatment. All classes of shares of the Fund have equal voting privileges with respect to the Fund. The Fund’s income, expenses and realized and unrealized gains and losses are allocated proportionately each day based upon the relative net assets of such class.
| 2. | SIGNIFICANT ACCOUNTING POLICIES |
The following is a summary of significant accounting policies followed by the Fund in preparation of its financial statements. The policies are in conformity with U.S. generally accepted accounting principles in the United States of America (“U.S. GAAP”) . The preparation of the financial statements requires management to make estimates and assumptions that affect the reported amounts of assets and liabilities and disclosure of contingent assets and liabilities at the date of the financial statements and the reported amounts of income and expenses for the period. Actual results could differ from those estimates. The Fund is an investment company and accordingly follows the investment company accounting and reporting guidance of the Financial Accounting Standards Board (“FASB”) Accounting Standard Codification Topic 946 “Financial Services – Investment Companies”.
Securities Valuation – The Fund’s assets will be valued based upon market quotations when such quotations are available. A security listed or traded on any exchange in the United States will be valued at its last sales price on the principal exchange on which it is traded prior to the time the assets of the Fund are valued. If no sale is reported at that time or the security is traded in the over-the-counter (“OTC”) market, the most recent bid will be used for purposes of the valuation. Assets for which market quotations are not readily available will be valued at fair value as determined in good faith by the Fund’s investment adviser, pursuant to procedures approved by the Board of Trustees of the Trust (the “Board”) . Debt securities (other than short-term obligations) are valued each day by an independent pricing service approved by the Board based on methods which include consideration of: yields or prices of securities of comparable quality, coupon, maturity and type, indications as to values from dealers, and general market conditions or market quotations from a major market maker in the securities. Investments valued in currencies other than the U.S. dollar are converted to U.S. dollars using exchange rates obtained from pricing services. Short-term debt obligations having 60 days or less remaining until maturity, at time of purchase, may be valued at amortized cost. These prices may change depending on market conditions.
| DGI Balanced Fund |
| NOTES TO FINANCIAL STATEMENTS (Continued) |
| June 30, 2022 |
Exchange Traded Funds – The Funds may invest in exchange traded funds (“ETFs”). ETFs are a type of index fund bought and sold on a securities exchange. An ETF trades like common stock and represents a fixed portfolio of securities designed to track the performance and dividend yield of a particular domestic or foreign market index. The Funds may purchase an ETF to temporarily gain exposure to a portion of the U.S. or a foreign market. The risks of owning an ETF generally reflect the risks of owning the underlying securities they are designed to track, although the lack of liquidity on an ETF could result in it being more volatile. Additionally, ETFs have fees and expenses that reduce their value.
The Fund utilizes various methods to measure the fair value of all of its investments on a recurring basis. GAAP establishes a hierarchy that prioritizes inputs to valuation methods. The three levels of input are:
Level 1 – Unadjusted quoted prices in active markets for identical assets and liabilities that the Fund has the ability to access.
Level 2 – Observable inputs other than quoted prices included in Level 1 that are observable for the asset or liability, either directly or indirectly. These inputs may include quoted prices for the identical instrument in an inactive market, prices for similar instruments, interest rates, prepayment speeds, credit risk, yield curves, default rates and similar data.
Level 3 – Unobservable inputs for the asset or liability, to the extent relevant observable inputs are not available; representing the Fund’s own assumptions about the assumptions a market participant would use in valuing the asset or liability, and would be based on the best information available.
The availability of observable inputs can vary from security to security and is affected by a wide variety of factors, including, for example, the type of security, whether the security is new and not yet established in the marketplace, the liquidity of markets, and other characteristics particular to the security. To the extent that valuation is based on models or inputs that are less observable or unobservable in the market, the determination of fair value requires more judgment. Accordingly, the degree of judgment exercised in determining fair value is greatest for instruments categorized in Level 3.
The inputs used to measure fair value may fall into different levels of the fair value hierarchy. In such cases, for disclosure purposes, the level in the fair value hierarchy within which the fair value measurement falls in its entirety, is determined based on the lowest level input that is significant to the fair value measurement in its entirety.
The inputs or methodology used for valuing securities are not necessarily an indication of the risk associated with investing in those securities. The following tables summarize the inputs used as of June 30, 2022 for the Fund’s assets and liabilities measured at fair value:
| DGI Balanced Fund | | | | | | | | | | | | |
| | | | | | | | | | | | | |
| Assets * | | Level 1 | | | Level 2 | | | Level 3 | | | Total | |
| U.S. Government Agencies | | $ | — | | | $ | 145,772,720 | | | $ | — | | | $ | 145,772,720 | |
| Collateralized Mortgage Obligations | | | — | | | | 135,126 | | | | 283,360 | | | | 418,486 | |
| Exchange Traded Funds | | | 103,733,247 | | | | — | | | | — | | | | 103,733,247 | |
| Common Stock | | | 41,153,950 | | | | — | | | | — | | | | 41,153,950 | |
| Money Market Fund | | | 38,664,500 | | | | — | | | | — | | | | 38,664,500 | |
| Total | | $ | 183,551,697 | | | $ | 145,907,846 | | | $ | 283,360 | | | $ | 329,742,903 | |
| * | Refer to the Portfolio of Investments for classification. |
| DGI Balanced Fund |
| NOTES TO FINANCIAL STATEMENTS (Continued) |
| June 30, 2022 |
The following table is a reconciliation of assets in which Level 3 inputs were used in determining value:
| | | Collateralized | |
| | | Mortgage | |
| | | Obligations | |
| Beginning Balance | | $ | 620,254 | |
| Securities received in reorganization | | | — | |
| Total realized gain/(loss) | | | (233,135 | ) |
| Unrealized Appreciation/(Depreciation) | | | (74 | ) |
| Cost of Purchases | | | — | |
| Proceeds from Sales | | | — | |
| Proceeds from Principal | | | (103,583 | ) |
| Accrued Interest | | | (102 | ) |
| Net transfers in/out of level 3 | | | — | |
| Ending Balance | | $ | 283,360 | |
These securities were valued based on non-executable broker quotes.
Security Transactions and Investment Income – Security transactions are accounted for on trade date basis. Interest income is recognized on an accrual basis. Discounts are accreted and premiums are amortized on securities purchased over the lives of the respective securities. Dividend income is recorded on the ex-dividend date. Realized gains or losses from sales of securities are determined by comparing the identified cost of the security lot sold with the net sales proceeds.
Dividends and Distributions – The Fund expects to declare and distribute all of its net investment income, if any, to shareholders as dividends at least annually. The amount of any distribution will vary, and there is no guarantee the Fund will pay either an income dividend or a capital gains distribution. Distributions will be reinvested in shares of the Fund, unless otherwise directed by the shareholder. Generally, distributions within taxable accounts are taxable events for shareholders whether the distributions are received in cash or reinvested.
Dividends consisting of Ordinary Dividends to individual shareholders will be distributed net of the 15% tax imposed by the Puerto Rico Internal Revenue Code of 2011, as amended (the “PR Code”), which will be automatically withheld at source by the Fund. All dividend distributions by the Fund to a tax advantaged account, such as a Puerto Rico tax-qualified retirement plan or IRA account, will be made on a gross basis, without any tax withholding, and will be reinvested automatically in shares of the Fund. Such distributions may be taxed as ordinary income when withdrawn from the tax-advantaged account.
In general, the Fund’s distributions will be subject to Puerto Rico income taxes as dividend income, capital gains, or some combination of both, unless you are investing through a tax advantaged arrangement, such as a Puerto Rico tax-qualified retirement plan or an IRA, in which case your distributions may be taxed as ordinary income when withdrawn from the tax-advantaged account. Such distributions will also be subject to U.S federal income taxes and the PFIC rules if received by a U.S. person not residing in Puerto Rico. Distributions to residents of Puerto Rico who own, directly or indirectly, less than 10% of the total shares of the Fund will not be subject to U.S. federal income taxes.
Cash – The Fund considers its investment in an FDIC insured interest bearing savings account to be cash. The Fund maintains cash balances, which, at times, may exceed federally insured limits. The Fund maintains these balances with a high-quality financial institution.
| 3. | INVESTMENT TRANSACTIONS AND ASSOCIATED RISKS |
For the year ended June 30, 2022, the aggregate purchases and sales of investments (excluding U.S. Government securities and short-term investments) were $11,063,138 and $22,006,867, respectively.
| DGI Balanced Fund |
| NOTES TO FINANCIAL STATEMENTS (Continued) |
| June 30, 2022 |
| 4. | INVESTMENT ADVISORY AGREEMENT AND TRANSACTION WITH RELATED PARTIES |
Oriental Trust, a separately identifiable division of Oriental Bank, the “Adviser”, acts as investment adviser to the Fund under an investment advisory agreement (the “Advisory Agreement”) with the Fund. Under the Advisory Agreement, the Fund pays to the Adviser a monthly advisory fee at an annual rate of 0.93% of its average daily net assets. Pursuant to the advisory agreement, the Fund incurred $3,479,684 in advisory fees for the year ended June 30, 2022.
The distributor of the Fund is Oriental Financial Services LLC (the “Distributor”).
Pursuant to a separate servicing agreement with Ultimus Fund Solutions, LLC (“UFS”), the Fund pays UFS fees for providing administration, fund accounting and transfer agency services to the Fund. Certain officers of the Trust are also officers of UFS, and are not paid any fees directly by the Fund for serving in such capacities.
In addition, certain affiliates of UFS provide ancillary services to the Fund as follows:
Northern Lights Compliance Services, LLC (“NLCS”), an affiliate of UFS, provides a Chief Compliance Officer to the Trust, as well as related compliance services, pursuant to a consulting agreement between NLCS and the Trust. Under the terms of such agreement, NLCS receives fees from the Fund.
Blu Giant, LLC (“Blu Giant”), an affiliate of UFS, provides EDGAR conversion and filing services as well as print management services for the Fund on an ad-hoc basis. For the provision of these services, Blu Giant receives fees from the Fund.
The Fund is intended solely for residents of Puerto Rico. The Fund will be treated as a registered investment company under the PR Code. As such, the Fund will be exempt from Puerto Rico income tax for a taxable year if it distributes to its shareholders at least 90% of its net income for the taxable year within the time period provided by the PR Code. The Fund did not distribute 90% if its income to shareholders for the taxable year ended June 30, 2021 and therefore recorded a tax expense of $445,825.
The Fund will be treated as a “passive foreign investment company” (“PFIC”) under the United States Internal Revenue Code of 1986, as amended (the “US Code”). As such, the Fund will not qualify as a regulated investment company under Subchapter M of the US Code and will be treated as a non-U.S. corporation whose only business activity in the United States is trading in stocks or securities for its own account; which, under the US Code, does not constitute engaging in the conduct of a trade or business within the United States, even if its principal office is located therein. As a result, the Fund will be subject to U.S. federal income tax withholding only with respect to certain types of income from United States sources considered fixed, determinable, annual and periodic income (such as dividends and interest paid by U.S. payors).
In general, the Fund’s distributions will be subject to Puerto Rico income taxes as dividend income, capital gains, or some combination of both, unless you are investing through a tax-advantaged arrangement, such as a Puerto Rico tax-qualified retirement plan or an IRA, in which case your distributions may be taxed as ordinary income when withdrawn from the tax-advantaged account. Such distributions will also be subject to U.S federal income taxes and the PFIC rules if received by a U.S. person not residing in Puerto Rico. Distributions to residents of Puerto Rico who own, directly or indirectly, less than 10% of the total shares of the Fund will not be subject to U.S. federal income taxes.
| DGI Balanced Fund |
| NOTES TO FINANCIAL STATEMENTS (Continued) |
| June 30, 2022 |
| 6. | TAX COMPONENTS OF CAPITAL |
The tax attributes of distributions paid during the fiscal year ended June 30, 2022, were as follows:
| | | Fiscal Year Ended | |
| | | June 30, 2022 | |
| Ordinary Income | | $ | 1,528,381 | |
| Long-Term Capital Gain | | | — | |
| Return of Capital | | | — | |
| Total | | $ | 1,528,381 | |
The Fund’s net investment income and net realized gain (loss) on investments reflected in the financial statements differ from distributable net investment income and net realized gain (loss) on investments for tax purposes. Permanent book and tax differences are primarily attributable to the tax adjustments for r paydowns from mortgage-backed securities, as follows:
| | | 2022 | |
| Net investment income per statement of operations | | $ | 2,550,014 | |
| Reclassification of realized loss on securities’ paydown for tax purposes | | | 713,476 | |
| Distributable net investment income for tax purposes | | $ | 3,263,490 | |
| | | | | |
| Net realized gain (loss) on investments per statement of operations | | $ | (2,064 | ) |
| Reclassification of realized loss on securities’ paydown for tax purposes | | | (713,476 | ) |
| Net realized loss on investments and futures contracts for tax purposes | | $ | (715,540 | ) |
The undistributed net investment income and accumulated net realized loss on investments (tax basis) at June 30, 2022, was as follows:
| | | 2022 | |
| Undistributed net investment income, beginning of the year | | $ | 862,268 | |
| Net investment income for the year | | | 3,263,490 | |
| Distributions Undistributed net investment income, end of the year | | $ | (1,528,381 | ) |
| | | | 2,597,377 | |
| | | | | |
| Accumulated net realized loss on investments and future contracts,beginning of the year | | $ | (52,239 | ) |
| Net realized loss on investment and future contracts for the year, tax basis | | | (715,540 | ) |
| Distributions | | | — | |
| end of the year, tax basis | | $ | (767,779 | ) |
The beneficial ownership, either directly or indirectly, of more than 25% of the voting securities of the Fund creates presumption of control of the Fund, under Section 2(a) 9 of the 1940 Act. As of June 30, 2022, Pershing, holding shares for the benefit of others in nominee name, held approximately 99.5% of the voting securities of the Fund.
Subsequent events after the date of the Statement of Assets and Liabilities have been evaluated through the date the financial statements were issued. Management has determined that no events or transactions occurred requiring adjustment or disclosure in the financial statements.

REPORT OF INDEPENDENT REGISTERED PUBLIC ACCOUNTING FIRM
To the Board of Trustees of DGI Investment Trust
and the Shareholders of DGI Balanced Fund
Opinion on the Financial Statements
We have audited the accompanying statement of assets and liabilities of the DGI Balanced Fund, a series of shares of beneficial interest in DGI Investment Trust (the “Fund”), including the schedule of investments, as of June 30, 2022, and the related statement of operations for the year then ended, and the statements of changes in net assets and the financial highlights for the year then ended, and for the period May 24, 2021 (commencement of operations) to June 30, 2021, and the related notes (collectively referred to as the “financial statements”). In our opinion, the financial statements present fairly, in all material respects, the financial position of the Fund as of June 30, 2022, and the results of its operations for the year then ended, and the changes in its net assets and its financial highlights for the year then ended and for the period May 24, 2021 to June 30, 2021, in conformity with accounting principles generally accepted in the United States of America.
Basis for Opinion
These financial statements are the responsibility of the Fund’s management. Our responsibility is to express an opinion on the Fund’s financial statements based on our audits. We are a public accounting firm registered with the Public Company Accounting Oversight Board (United States) (“PCAOB”) and are required to be independent with respect to the Fund in accordance with the U.S. federal securities law and the applicable rules and regulations of the Securities and Exchange Commission and the PCAOB.
We conducted our audits in accordance with the standards of the PCAOB. Those standards require that we plan and perform the audits to obtain reasonable assurance about whether the financial statements are free of material misstatement, whether due to error or fraud. The Fund is not required to have, nor were we engaged to perform, an audit of its internal control over financial reporting. As part of our audits we are required to obtain an understanding of internal control over financial reporting but not for the purpose of expressing an opinion on the effectiveness of the Fund’s internal control over financial reporting. Accordingly, we express no such opinion.
Our audits included performing procedures to assess the risk of material misstatement of the financial statements, whether due to error or fraud, and performing procedures that respond to those risks. Such procedures included examining, on a test basis, evidence regarding the amounts and disclosures in the financial statements. Our procedures included confirmation of securities owned as of June 30, 2022 by correspondence with the custodian. Our audits also included evaluating the accounting principles used and significant estimates made by management, as well as evaluating the overall presentation of the financial statements. We believe that our audits provide a reasonable basis for our opinion.

BBD, LLP
We have served as the auditor of one or more of the Funds in the DGI Investment Trust since 2021
Philadelphia, Pennsylvania
August 29, 2022
| DGI Balanced Fund |
| EXPENSE EXAMPLES (Unaudited) |
| June 30, 2022 |
As a shareholder of the DGI Balanced Fund, you incur ongoing costs, including management fees and certain Fund expenses. This example is intended to help you understand your ongoing costs (in dollars) of investing in the Fund and compare these costs with the ongoing costs of investing in other mutual funds.
The example is based on an investment of $1,000 invested at the beginning of the period and held for the entire period from January 1, 2022 through June 30, 2022.
Actual Expenses
The “Actual Expenses” line in the table below provides information about actual account values and actual expenses. You may use the information below, together with the amount you invested, to estimate the expenses that you paid over the period. Simply divide your account value by $1,000 (for example, an $8,600 account value divided by $1,000 = 8.6), then multiply the result by the number in the table under the heading entitled “Expenses Paid During Period” to estimate the expenses you paid on your account during this period.
Hypothetical Example for Comparison Purposes
The “Hypothetical” line in the table below provides information about hypothetical account values and hypothetical expenses based on the Fund’s actual expense ratio and an assumed rate of return of 5% per year before expenses, which is not the Fund’s actual return. The hypothetical account values and expenses may not be used to estimate the actual ending account balances or expenses you paid for the period. You may use this information to compare this 5% hypothetical example with the 5% hypothetical examples that appear in the shareholder reports of other funds.
Please note that the expenses shown in the table are meant to highlight your ongoing costs only and do not reflect any transactional costs, such as sales loads, or redemption fees. Therefore, the table is useful in comparing ongoing costs only, and will not help you determine the relative total costs of owning different funds. In addition, if these transactional costs were included, your costs would have been higher.
| | | | | | | | | | | Hypothetical (5% return before | |
| | | | | | | Actual | | expenses) | |
| | | | | Beginning | | | | | | | | | |
| | | | | Account | | Ending | | Expenses Paid | | Ending | | Expenses Paid | |
| | | Annualized | | Value | | Account Value | | During Period | | Account Value | | During Period | |
| | | Expense Ratio | | 1/1/2022 | | 6/30/2022 | | 1/1/22-6/30/22 | | 6/30/2022 | | 1/1/22-6/30/22 | |
| | | | | | | | | | | | | | |
| Class P* | | 1.62% | | $1,000.00 | | $883.70 | | $7.57 | | $1,016.76 | | $8.10 | |
| Class T* | | 1.62% | | $1,000.00 | | $883.70 | | $7.57 | | $1,016.76 | | $8.10 | |
| Class NT* | | 1.62% | | $1,000.00 | | $883.70 | | $7.57 | | $1,016.76 | | $8.10 | |
| * | Expenses paid during the period are equal to the Fund’s annualized expense ratio, multiplied by the average account value over the period, multiplied by 181/365 (to reflect the full half-year period). |
| DGI Balanced Fund |
| LIQUIDITY RISK MANAGEMENT PROGRAM (Unaudited) |
| June 30, 2022 |
The Fund has adopted and implemented a written liquidity risk management program (the “Program”) as required by Rule 22e-4 (the “Liquidity Rule”) under the Investment Company Act of 1940, as amended. The Program is reasonably designed to assess and manage the Fund’s liquidity risk, taking into consideration, among other factors, the Fund’s investment strategy and the liquidity of its portfolio investments during normal and reasonably foreseeable stressed conditions; its short- and long-term cash flow projections; and its cash holdings and access to other funding sources. The Fund’s Board of Trustees (the “Board”) approved the appointment of the Fund’s investment adviser to serve as Liquidity Program Administrator (the “LPA”). The LPA is responsible for the Program’s administration and oversight and for reporting to the Board on at least an annual basis regarding the Program’s operation and effectiveness. The annual written report assessing the Program (the “Report”) was presented to the Board at the June 22, 2022 Board meeting and covered the period from May 23, 2021 through March 31, 2022. (the “Review Period”).
During the Review Period, the Fund did not experience unusual stress or disruption to its operations related to purchase and redemption activity. Also, during the Review Period, the Fund held adequate levels of cash and highly liquid investments to meet shareholder redemption activities in accordance with applicable requirements. During the Review Period, the Fund held more than 99.9% of its assets in highly liquid investments and the Fund was not required to establish a highly liquid investment minimum. The Report concluded that the Liquidity Program is reasonably designed to prevent violations of the Liquidity Rule and has been effectively implemented.
| DGI Balanced Fund |
| TRUSTEES AND OFFICERS (Unaudited) |
| June 30, 2022 |
The Board is responsible for the overall management of the Trust, including general supervision and review of the investment activities of the Trust. The Board, in turn, elects the officers of the Trust (“Officers”), who are responsible for administering the day-to-day operations of the Trust and its separate series, as applicable. The current trustees of the Trust (“Trustees”) and Officers, their years of birth, position with the Trust, term of office with the Trust and length of time served, and their principal occupation and other directorships for the past five years are set forth below.
The address of each Trustee and Officer, with the exception of Lynn Bowley, Maggie Bull and James Colantino, is: DGI Investment Trust c/o Oriental Trust, 254 Muñoz Rivera Avenue, 10th Floor, San Juan, Puerto Rico 00918. The address of Lynn Bowley is: 4221 North 203rd Street, Suite 100, Elkhorn, NE 68022; the address of Maggie Bull is: 2 Easton Oval, Suite 300, Columbus, OH 43219; and the address of James Colantino is 80 Arkay Drive, Suite 110, Hauppauge, NY 11788.
The Statement of Additional Information (“SAI”) includes additional information about the Trustees and is available, without charge, upon request. Shareholders may call 1-787-620-0000 to request the SAI.
| DGI Balanced Fund |
| TRUSTEES AND OFFICERS (Unaudited)(Continued) |
| June 30, 2022 |
| Name and Year of Birth | Position with
the Trust | Term of Office
and Length of
Time Served | Principal
Occupation
During Past Five Years | Number of
Portfolios
in Fund
Complex
Overseen
by
Trustees | Other
Directorships
Held by
Trustee During
Past Five Years |
| Independent Trustees of the Trust1 | | | | |
Angel E. Vazquez
Hernandez
(1968) | Trustee | Since May 2021 | President of Pan Pepin, Inc. (bread company) since January 2021; President of B. Fernandez & Hnos., Inc. (product distribution company) from June 2003 to January 2021. | 1 | Fundacion Rafael Hernandez Colon (non-profit) since May 2010. |
| Ivan C. Lopez Morales (1966) | Trustee | Since May 2021 | Senior Vice President of Assurant Inc. (insurance company) April 2017 - 2021 (retired); Chief Executive Officer of Lopez Consulting since December 2020; President of ESOPO Corporation (real estate company) since August 2005. | 1 | Caribbean American Life Assurance Company (subsidiary of Assurant Inc.) 1997 -2021 (retired); Caribbean American Property Insurance Company (subsidiary of Assurant Inc.) 1997-2021 (retired); Director of various other, non-public subsidiaries of Assurant Inc. until May 2021. |
| Joshua Aaron Sigmon (1981) | Trustee | Since May 2021 | Principal of MHR Fund Management LLC (private equity firm) since September 2018; Head of Special Opportunities of Axar Capital LP (investment firm) from September 2016 to September 2018; Managing Director of Fortress Investment Group LLC (credit fund) from March 2015 to July 2016. | 1 | Planet Financial Group, LLC (mortgage servicer) since October 2019; Momental Investments LLC (investment firm) since October 2019; SCPG HoldCo (pharmacy company) since September 2019; Terra Capital Partners (asset manager) from July 2017 to December 2018. |
| DGI Balanced Fund |
| TRUSTEES AND OFFICERS (Unaudited)(Continued) |
| June 30, 2022 |
| Name and Year of Birth | Position with the Trust | Term of Office and Length of Time Served | Principal Occupation
During Past Five Years | Number of Portfolios in Fund Complex Overseen by Trustees | Other Directorships Held by Trustee During Past Five Years |
| Interested Trustee of the Trust |
| Carlos A. Gonzalez2, 3 (1951) | Chair of the Board, Trustee and Portfolio Manager | Since January 2021 | Consultant with OFG Bancorp* (bank holding company) since September 1998. | 1 | Scenic Hudson (nonprofit land trust) since October 2009; Empresas Caparra (private family real estate business) since January 1995. |
| Officers of the Trust |
| Jose R. Fernandez Martinez (1963) | President, Principal Executive Officer and Chief Executive Officer | Since May 2021 | President, Chief Executive Officer, and Vice Chairman of the Board of OFG Bancorp* and Oriental Bank* (commercial bank) since 2004; President of Oriental Insurance LLC* (insurance company) since 2004; Chairman of Oriental Pension Consultants* (retirement plan administrator) since 2004; President and Chief Executive Officer of Oriental International Bank, Inc.* (international bank) since 2004; President of OFG Ventures LLC* (private investment company) since 2019. | N/A | N/A |
Maritza Arizmendi Diaz
(1968) | Principal Financial Officer, Chief Financial Officer and Treasurer | Since May 2021 | Chief Financial Officer of OFG Bancorp* and Oriental Bank* since March 2017; Director of Oriental International Bank, Inc.* since June 2020; Chief Financial Officer and Treasurer of OFG Ventures LLC* since June 2020. | N/A | N/A |
Hugh Gonzalez Robison3
(1979) | Chief Legal Officer, General Counsel and Secretary | Since May 2021 | General Counsel at OFG Bancorp* and Oriental Bank* since January 2021; Secretary of Oriental Financial Services LLC* since 2017; Assistant Secretary of OFG Bancorp* and Oriental Bank* since 2014; Secretary of OFG USA LLC* (commercial lender) since 2017; Secretary of OFG Ventures LLC* since 2019; Deputy General Counsel at Oriental Bank* from July 2012 to December 2020. | N/A | N/A |
| N. Lynn Bowley (1958) | Chief Compliance Officer | Since May 2021 | Senior Vice President and Senior Compliance Officer of Northern Lights Compliance Services, LLC since January 2007. | N/A | N/A |
| Luana Santos (1975) | AntiMoney Laundering Compliance Officer | Since May 2021 | Vice President, BSA/AML Compliance Officer of Oriental Bank* since July 2017; Vice President, Assistant BSA/AML Compliance Officer of Oriental Bank* from September 2015 to July 2017. | N/A | N/A |
| Maggie Bull (1965) | Assistant Secretary | Since May 2021 | Vice President, Senior Legal Counsel, Ultimus Fund Solutions, LLC (“Ultimus”) since February 2020; Senior Attorney of Ultimus Fund Solutions, LLC June 2017- January 2020; Legal Counsel of Meeder Investment Management from January 2011 to September 2016; Chief Compliance Officer of Meeder Funds from March 2011 to September 2016. | N/A | N/A |
| James Colantino (1969) | Assistant Treasurer | Since May 2021 | Senior Vice President-Fund Administration of Gemini Fund Services, LLC since 2012. | N/A | N/A |
| 1 | The trustees of the Trust who are not “interested persons” of the Trust as defined under section 2(a)(19) of the 1940 Act (independent trustees). |
| 2 | Mr. González is an “interested person” of the Trust as defined by the 1940 Act because he is an affiliated person of the adviser. |
| 3 | Mr. González is the uncle of Hugh González Robison, the Fund’s General Counsel and Secretary. |
| * | Denotes an affiliate of the Fund. |
PROXY VOTING POLICY
Information regarding how the Fund voted proxies relating to portfolio securities for the most recent twelve month period ended June 30 as well as a description of the policies and procedures that the Fund uses to determine how to vote proxies is available without charge, upon request, by calling 1-877-910-4232 or by referring to the Securities and Exchange Commission’s (“SEC”) website at http://www.sec.gov.
PORTFOLIO HOLDINGS
The Fund files its complete schedule of portfolio holdings with the SEC for the first and third quarters of each fiscal year as an exhibit to Form N-PORT. Form N-PORT are available on the SEC’s website at http://www.sec.gov. The information on Form N-PORT is available without charge, upon request, by calling 1-877-910-4232.
| |
| INVESTMENT ADVISER |
| Oriental Trust |
| 254 Munoz Rivera Avenue, 10th Floor |
| San Juan, Puerto Rico 00918 |
| |
| ADMINISTRATOR |
| Ultimus Fund Solutions, LLC |
| 225 Pictoria Drive, Suite 450 |
| Cincinnati, OH 45246 |
| |
| |
| DGIPR-AR-22 |
(b) Include a copy of each notice transmitted to stockholders in reliance on Rule 30e-3 under the Act (17 CFR 270.30e-3) that contains disclosures specified by paragraph (c)(3) of that rule.
Item 2. Code of Ethics.
(a) As of the end of the period covered by this report, the registrant has adopted a code of ethics that applies to the registrant's principal executive officer, principal financial officer, principal accounting officer or controller, or persons performing similar functions, regardless of whether these individuals are employed by the registrant or a third party.
(b) For purposes of this item, “code of ethics” means written standards that are reasonably designed to deter wrongdoing and to promote:
| (1) | Honest and ethical conduct, including the ethical handling of actual or apparent conflicts of interest between personal and professional relationships; |
| (2) | Full, fair, accurate, timely, and understandable disclosure in reports and documents that a registrant files with, or submits to, the Commission and in other public communications made by the registrant; |
(3) Compliance with applicable governmental laws, rules, and regulations;
| (4) | The prompt internal reporting of violations of the code to an appropriate person or persons identified in the code; and |
(5) Accountability for adherence to the code.
(c) Amendments: During the period covered by the report, there have not been any amendments to the provisions of the code of ethics.
(d) Waivers: During the period covered by the report, the registrant has not granted any express or implicit waivers from the provisions of the code of ethics.
(e) The Code of Ethics is not posted on Registrant’s website.
(f) A copy of the Code of Ethics is attached as an exhibit.
Item 3. Audit Committee Financial Expert.
(a) The Registrant’s board of trustees has determined that Ivan C. Lopez Morales is the audit committee financial expert, as defined in Item 3 of Form N-CSR. Mr. Lopez is independent for purposes of this Item 3.
Item 4. Principal Accountant Fees and Services.
2022 - $17,500
2021 - $10,000
2022 – N/A
2021 – N/A
2022 – N/A
2021 – N/A
Preparation of Federal & State income tax returns, assistance with calculation of required income, capital gain and excise distributions and preparation of Federal excise tax returns.
2022 - $0
2021 - $0
| (e) | (1) Audit Committee’s Pre-Approval Policies |
The registrant’s Audit Committee is required to pre-approve all audit services and, when appropriate, any non-audit services (including audit-related, tax and all other services) to the registrant. The registrant’s Audit Committee also is required to pre-approve, when appropriate, any non-audit services (including audit-related, tax and all other services) to its adviser, or any entity controlling, controlled by or under common control with the adviser that provides ongoing services to the registrant, to the extent that the services
may be determined to have an impact on the operations or financial reporting of the registrant. Services are reviewed on an engagement by engagement basis by the Audit Committee.
| (2) | Percentages of Services Approved by the Audit Committee |
2021 2022
Audit-Related Fees: 0.00% 0.00%
Tax Fees: 0.00% 0.00%
All Other Fees: 0.00% 0.00%
| (f) | During the audit of registrant's financial statements for the most recent fiscal year, less than 50 percent of the hours expended on the principal accountant's engagement were attributed to work performed by persons other than the principal accountant's full-time, permanent employees. |
| (g) | The aggregate non-audit fees billed by the registrant's accountant for services rendered to the registrant, and rendered to the registrant's investment adviser (not including any sub-adviser whose role is primarily portfolio management and is subcontracted with or overseen by another investment adviser), and any entity controlling, controlled by, or under common control with the adviser that provides ongoing services to the registrant: |
2022 - $0
2021 - $0
(h) The registrant's audit committee has considered whether the provision of non-audit services to the registrant's investment adviser (not including any sub-adviser whose role is primarily portfolio management and is subcontracted with or overseen by another investment adviser), and any entity controlling, controlled by, or under common control with the investment adviser that provides ongoing services to the registrant, that were not pre-approved pursuant to paragraph (c)(7)(ii) of Rule 2-01 of Regulation S-X, is compatible with maintaining the principal accountant's independence.
(i) Not Applicable.
(j) Not Applicable.
Item 5. Audit Committee of Listed Companies. Not applicable to open-end investment companies.
Item 6. Schedule of Investments. Schedule of investments in securities of unaffiliated issuers is included under Item 1.
Item 7. Disclosure of Proxy Voting Policies and Procedures for Closed-End Funds. Not applicable to open-end investment companies.
Item 8. Portfolio Managers of Closed-End Management Investment Companies. Not applicable to open-end investment companies.
Item 9. Purchases of Equity Securities by Closed-End Funds. Not applicable to open-end investment companies.
Item 10. Submission of Matters to a Vote of Security Holders. None
Item 11. Controls and Procedures.
(a) Based on an evaluation of the Registrant’s disclosure controls and procedures as of a date within 90 days of filing date of this Form N-CSR, the principal executive officer and principal financial officer of the Registrant have concluded that the disclosure controls and procedures of the Registrant are reasonably designed to ensure that the information required in filings on Form N-CSR is recorded, processed, summarized, and reported by the filing date, including that information required to be disclosed is accumulated and communicated to the Registrant’s management, including the Registrant’s principal executive officer and principal financial officer, as appropriate to allow timely decisions regarding required disclosure.
(b) There were no significant changes in the Registrant’s internal control over financial reporting that occurred during the Registrant’s last fiscal half-year that have materially affected, or are reasonably likely to materially affect, the Registrant’s internal control over financial reporting.
Item 12. Disclosure of Securities Lending Activities for Closed-End Management Investment Companies. Not applicable to open-end investment companies.
Item 13. Exhibits.
(a)(1) Code of Ethics filed herewith.
(a)(2) Certifications required by Section 302 of the Sarbanes-Oxley Act of 2002 (and Item 11(a)(2) of Form N-CSR) are filed herewith.
(a)(3) Not applicable for open-end investment companies.
(b) Certifications required by Section 906 of the Sarbanes-Oxley Act of 2002 (and Item 11(b) of Form N-CSR) are filed herewith.
SIGNATURES
Pursuant to the requirements of the Securities Exchange Act of 1934 and the Investment Company Act of 1940, the registrant has duly caused this report to be signed on its behalf by the undersigned, thereunto duly authorized.
(Registrant) DGI Investment Trust
By (Signature and Title)
/s/ Jose R. Fernandez Martinez
Jose R. Fernandez Martinez, Principal Executive Officer/President
Date 9/2/22
Pursuant to the requirements of the Securities Exchange Act of 1934 and the Investment Company Act of 1940, this report has been signed below by the following persons on behalf of the registrant and in the capacities and on the dates indicated.
By (Signature and Title)
/s/ Jose R. Fernandez Martinez
Jose R. Fernandez Martinez, Principal Executive Officer/President
Date 9/2/22
By (Signature and Title)
/s/ Maritza Arizmendi Diaz
Maritza Arizmendi Diaz, Principal Financial Officer/Treasurer
Date 9/2/22