united states
securities and exchange commission
washington, d.c. 20549
form n-csr
certified shareholder report of registered
management investment companies
| Investment Company Act file number | 333-252816 and 811-23637 | |
DGI Investment Trust
(Exact name of registrant as specified in charter)
| c/o Oriental Trust, 254 Munoz Rivera Ave., 10th Floor, San Juan Puerto Rico | | 00918 |
| (Address of principal executive offices) | | (Zip code) |
Maggie Bull, Ultimus Fund Solutions LLC
2 Easton Oval, Suite 300, Columbus OH 43219
(Name and address of agent for service)
| Registrant’s telephone number, including area code: | 513-869-4262 | |
| Date of fiscal year end: | 6/30 | |
| | | |
| Date of reporting period: | 6/30/24 | |
Item 1. Reports to Stockholders.
Annual Shareholder Report - June 30, 2024
This annual shareholder report contains important information about DGI Balanced Fund for the period of December 6, 2023 to June 30, 2024. You can find additional information about the Fund at https://funddocs.filepoint.com/dgi_balanced/?file=DGI-Balanced-Summary.pdf. You can also request this information by contacting us at (787) 620-0000.
What were the Fund’s costs for the last year?
(based on a hypothetical $10,000 investment)
(Expenses for the full reporting period would be higher.)
| Class Name | Costs of a $10,000 investment | Costs paid as a percentage of a $10,000 investment |
|---|
| Class A | $88 | 1.55% |
How did the Fund perform during the reporting period?
During this Period, the Fund had a total return of 11.48%. Strong positive returns from the equity portion of the portfolio were dampened somewhat by the more modest positive returns from the fixed-income portion of the portfolio. The investment outlook for the markets is generally positive because, in the opinion of the Fund’s investment adviser, the long-term economic outlook is positive. Participation in equity investments over time has historically been important when seeking to achieve returns that maintain and grow the real value of savings. The Fund’s strategy seeks to provide participation in that potential growth while attempting to cushion the risk of possible equity market declines with a significant position in fixed-income securities.
How has the Fund performed since inception?
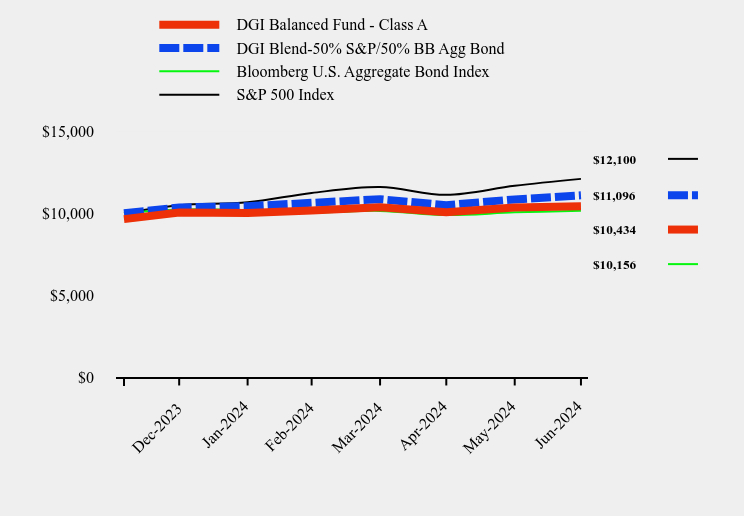
Total Return Based on $10,000 Investment
| DGI Balanced Fund - Class A | DGI Blend-50% S&P/50% BB Agg Bond | Bloomberg U.S. Aggregate Bond Index | S&P 500 Index |
|---|
| Dec-2023 | $9,649 | $10,000 | $10,000 | $10,000 |
| Dec-2023 | $10,046 | $10,362 | $10,228 | $10,495 |
| Jan-2024 | $10,028 | $10,435 | $10,200 | $10,671 |
| Feb-2024 | $10,166 | $10,639 | $10,056 | $11,241 |
| Mar-2024 | $10,378 | $10,860 | $10,149 | $11,603 |
| Apr-2024 | $10,065 | $10,501 | $9,893 | $11,129 |
| May-2024 | $10,351 | $10,850 | $10,060 | $11,681 |
| Jun-2024 | $10,434 | $11,096 | $10,156 | $12,100 |
Average Annual Total Returns
| Since Inception (December 6, 2023) |
|---|
| DGI Balanced Fund - Class A | 8.13% |
| With Load | 4.34% |
| DGI Blend-50% S&P/50% BB Agg Bond | 10.96% |
| Bloomberg U.S. Aggregate Bond Index | 1.56% |
| S&P 500 Index | 21.00% |
The Fund's past performance is not a good predictor of how the Fund will perform in the future. The graph and table do not reflect the deduction of taxes that a shareholder would pay on fund distributions or redemption of fund shares.
- Net Assets$301,566,770
- Number of Portfolio Holdings155
- Advisory Fee $2,766,219
- Portfolio Turnover4%
Asset Weighting (% of total investments)
| Value | Value |
|---|
| Collateralized Mortgage Obligations | 0.0% |
| Common Stocks | 4.7% |
| Exchange-Traded Funds | 47.3% |
| Money Market Funds | 9.6% |
| U.S. Government & Agencies | 38.4% |
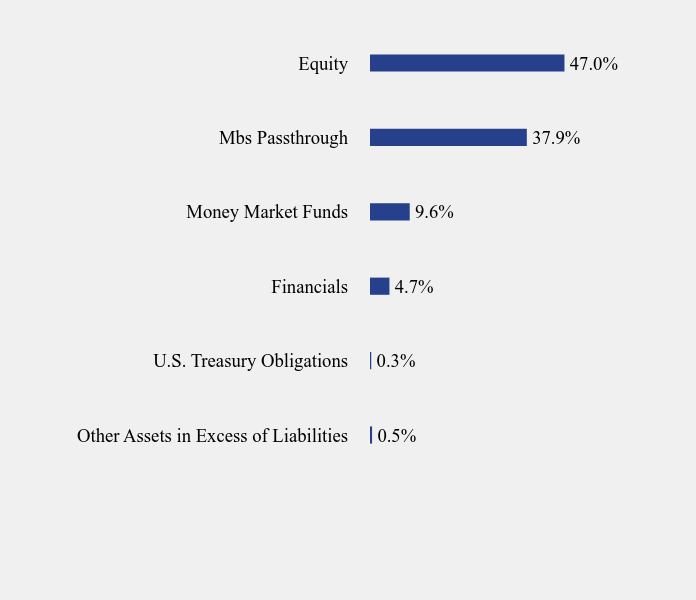
What did the Fund invest in?
Sector Weighting (% of net assets)
| Value | Value |
|---|
| Other Assets in Excess of Liabilities | 0.5% |
| U.S. Treasury Obligations | 0.3% |
| Financials | 4.7% |
| Money Market Funds | 9.6% |
| Mbs Passthrough | 37.9% |
| Equity | 47.0% |
Top 10 Holdings (% of net assets)
| Holding Name | % of Net Assets |
| SPDR S&P 500 ETF Trust | 20.5% |
| iShares Russell 2000 ETF | 13.4% |
| Dreyfus Treasury Obligations Cash Management Fund, Institutional Class | 9.6% |
| Popular, Inc. | 4.7% |
| iShares MSCI EAFE ETF | 3.6% |
| Vanguard MSCI Europe ETF | 3.5% |
| Vanguard FTSE Emerging Markets ETF | 2.9% |
| iShares MSCI Emerging Markets ETF | 2.3% |
| Government National Mortgage Association Series 626934 | 2.3% |
| Government National Mortgage Association Series 626941 | 1.4% |
No material changes occurred during the year ended June 30, 2024.
DGI Balanced Fund - Class A (DGIAX)
Annual Shareholder Report - June 30, 2024
Where can I find additional information about the Fund?
Additional information is available on the Fund's website ( https://funddocs.filepoint.com/dgi_balanced/?file=DGI-Balanced-Summary.pdf ), including its:
Prospectus
Financial information
Holdings
Proxy voting information
Annual Shareholder Report - June 30, 2024
This annual shareholder report contains important information about DGI Balanced Fund for the period of December 6, 2023 to June 30, 2024. You can find additional information about the Fund at https://funddocs.filepoint.com/dgi_balanced/?file=DGI-Balanced-Summary.pdf. You can also request this information by contacting us at (787) 620-0000.
What were the Fund’s costs for the last year?
(based on a hypothetical $10,000 investment)
(Expenses for the full reporting period would be higher.)
| Class Name | Costs of a $10,000 investment | Costs paid as a percentage of a $10,000 investment |
|---|
| Class C | $131 | 2.30% |
How did the Fund perform during the reporting period?
During this Period, the Fund had a total return of 11.48%. Strong positive returns from the equity portion of the portfolio were dampened somewhat by the more modest positive returns from the fixed-income portion of the portfolio. The investment outlook for the markets is generally positive because, in the opinion of the Fund’s investment adviser, the long-term economic outlook is positive. Participation in equity investments over time has historically been important when seeking to achieve returns that maintain and grow the real value of savings. The Fund’s strategy seeks to provide participation in that potential growth while attempting to cushion the risk of possible equity market declines with a significant position in fixed-income securities.
How has the Fund performed since inception?
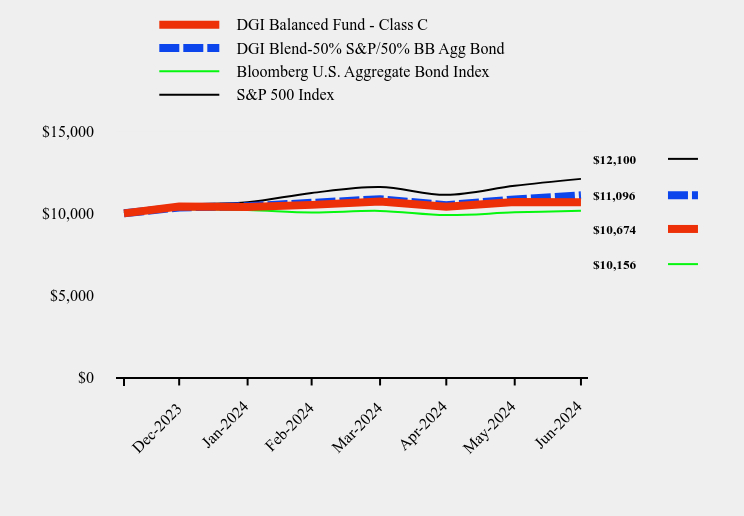
Total Return Based on $10,000 Investment
| DGI Balanced Fund - Class C | DGI Blend-50% S&P/50% BB Agg Bond | Bloomberg U.S. Aggregate Bond Index | S&P 500 Index |
|---|
| Dec-2023 | $10,000 | $10,000 | $10,000 | $10,000 |
| Dec-2023 | $10,411 | $10,362 | $10,228 | $10,495 |
| Jan-2024 | $10,382 | $10,435 | $10,200 | $10,671 |
| Feb-2024 | $10,516 | $10,639 | $10,056 | $11,241 |
| Mar-2024 | $10,727 | $10,860 | $10,149 | $11,603 |
| Apr-2024 | $10,402 | $10,501 | $9,893 | $11,129 |
| May-2024 | $10,688 | $10,850 | $10,060 | $11,681 |
| Jun-2024 | $10,674 | $11,096 | $10,156 | $12,100 |
Average Annual Total Returns
| Since Inception (December 6, 2023) |
|---|
| DGI Balanced Fund - Class C | 7.74% |
| DGI Blend-50% S&P/50% BB Agg Bond | 10.96% |
| Bloomberg U.S. Aggregate Bond Index | 1.56% |
| S&P 500 Index | 21.00% |
The Fund's past performance is not a good predictor of how the Fund will perform in the future. The graph and table do not reflect the deduction of taxes that a shareholder would pay on fund distributions or redemption of fund shares.
- Net Assets$301,566,770
- Number of Portfolio Holdings155
- Advisory Fee $2,766,219
- Portfolio Turnover4%
Asset Weighting (% of total investments)
| Value | Value |
|---|
| Collateralized Mortgage Obligations | 0.0% |
| Common Stocks | 4.7% |
| Exchange-Traded Funds | 47.3% |
| Money Market Funds | 9.6% |
| U.S. Government & Agencies | 38.4% |
What did the Fund invest in?
Sector Weighting (% of net assets)
| Value | Value |
|---|
| Other Assets in Excess of Liabilities | 0.5% |
| U.S. Treasury Obligations | 0.3% |
| Financials | 4.7% |
| Money Market Funds | 9.6% |
| Mbs Passthrough | 37.9% |
| Equity | 47.0% |
Top 10 Holdings (% of net assets)
| Holding Name | % of Net Assets |
| SPDR S&P 500 ETF Trust | 20.5% |
| iShares Russell 2000 ETF | 13.4% |
| Dreyfus Treasury Obligations Cash Management Fund, Institutional Class | 9.6% |
| Popular, Inc. | 4.7% |
| iShares MSCI EAFE ETF | 3.6% |
| Vanguard MSCI Europe ETF | 3.5% |
| Vanguard FTSE Emerging Markets ETF | 2.9% |
| iShares MSCI Emerging Markets ETF | 2.3% |
| Government National Mortgage Association Series 626934 | 2.3% |
| Government National Mortgage Association Series 626941 | 1.4% |
No material changes occurred during the year ended June 30, 2024.
DGI Balanced Fund - Class C (DGICX)
Annual Shareholder Report - June 30, 2024
Where can I find additional information about the Fund?
Additional information is available on the Fund's website ( https://funddocs.filepoint.com/dgi_balanced/?file=DGI-Balanced-Summary.pdf ), including its:
Prospectus
Financial information
Holdings
Proxy voting information
Annual Shareholder Report - June 30, 2024
This annual shareholder report contains important information about DGI Balanced Fund for the period of December 6, 2023 to June 30, 2024. You can find additional information about the Fund at https://funddocs.filepoint.com/dgi_balanced/?file=DGI-Balanced-Summary.pdf. You can also request this information by contacting us at (787) 620-0000.
What were the Fund’s costs for the last year?
(based on a hypothetical $10,000 investment)
(Expenses for the full reporting period would be higher.)
| Class Name | Costs of a $10,000 investment | Costs paid as a percentage of a $10,000 investment |
|---|
| Class I | $74 | 1.30% |
How did the Fund perform during the reporting period?
During this Period, the Fund had a total return of 11.48%. Strong positive returns from the equity portion of the portfolio were dampened somewhat by the more modest positive returns from the fixed-income portion of the portfolio. The investment outlook for the markets is generally positive because, in the opinion of the Fund’s investment adviser, the long-term economic outlook is positive. Participation in equity investments over time has historically been important when seeking to achieve returns that maintain and grow the real value of savings. The Fund’s strategy seeks to provide participation in that potential growth while attempting to cushion the risk of possible equity market declines with a significant position in fixed-income securities.
How has the Fund performed since inception?
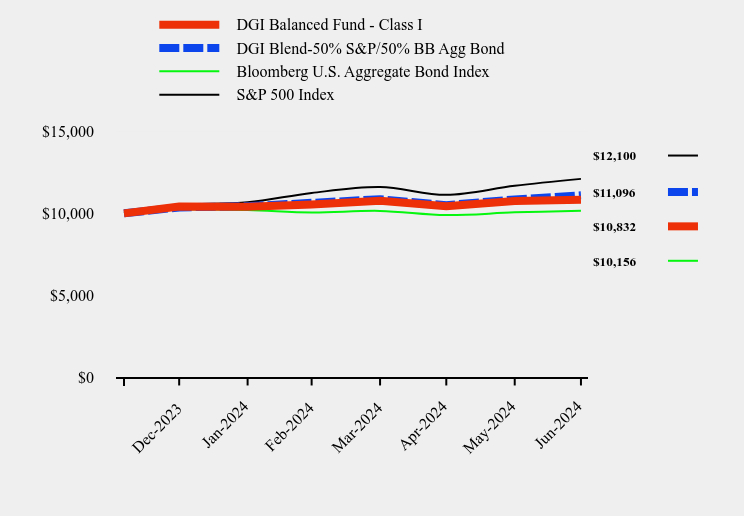
Total Return Based on $10,000 Investment
| DGI Balanced Fund - Class I | DGI Blend-50% S&P/50% BB Agg Bond | Bloomberg U.S. Aggregate Bond Index | S&P 500 Index |
|---|
| Dec-2023 | $10,000 | $10,000 | $10,000 | $10,000 |
| Dec-2023 | $10,421 | $10,362 | $10,228 | $10,495 |
| Jan-2024 | $10,402 | $10,435 | $10,200 | $10,671 |
| Feb-2024 | $10,545 | $10,639 | $10,056 | $11,241 |
| Mar-2024 | $10,765 | $10,860 | $10,149 | $11,603 |
| Apr-2024 | $10,440 | $10,501 | $9,893 | $11,129 |
| May-2024 | $10,746 | $10,850 | $10,060 | $11,681 |
| Jun-2024 | $10,832 | $11,096 | $10,156 | $12,100 |
Average Annual Total Returns
| Since Inception (December 6, 2023) |
|---|
| DGI Balanced Fund - Class I | 8.32% |
| DGI Blend-50% S&P/50% BB Agg Bond | 10.96% |
| Bloomberg U.S. Aggregate Bond Index | 1.56% |
| S&P 500 Index | 21.00% |
The Fund's past performance is not a good predictor of how the Fund will perform in the future. The graph and table do not reflect the deduction of taxes that a shareholder would pay on fund distributions or redemption of fund shares.
- Net Assets$301,566,770
- Number of Portfolio Holdings155
- Advisory Fee $2,766,219
- Portfolio Turnover4%
Asset Weighting (% of total investments)
| Value | Value |
|---|
| Collateralized Mortgage Obligations | 0.0% |
| Common Stocks | 4.7% |
| Exchange-Traded Funds | 47.3% |
| Money Market Funds | 9.6% |
| U.S. Government & Agencies | 38.4% |
What did the Fund invest in?
Sector Weighting (% of net assets)
| Value | Value |
|---|
| Other Assets in Excess of Liabilities | 0.5% |
| U.S. Treasury Obligations | 0.3% |
| Financials | 4.7% |
| Money Market Funds | 9.6% |
| Mbs Passthrough | 37.9% |
| Equity | 47.0% |
Top 10 Holdings (% of net assets)
| Holding Name | % of Net Assets |
| SPDR S&P 500 ETF Trust | 20.5% |
| iShares Russell 2000 ETF | 13.4% |
| Dreyfus Treasury Obligations Cash Management Fund, Institutional Class | 9.6% |
| Popular, Inc. | 4.7% |
| iShares MSCI EAFE ETF | 3.6% |
| Vanguard MSCI Europe ETF | 3.5% |
| Vanguard FTSE Emerging Markets ETF | 2.9% |
| iShares MSCI Emerging Markets ETF | 2.3% |
| Government National Mortgage Association Series 626934 | 2.3% |
| Government National Mortgage Association Series 626941 | 1.4% |
No material changes occurred during the year ended June 30, 2024.
DGI Balanced Fund - Class I (DGIIX)
Annual Shareholder Report - June 30, 2024
Where can I find additional information about the Fund?
Additional information is available on the Fund's website ( https://funddocs.filepoint.com/dgi_balanced/?file=DGI-Balanced-Summary.pdf ), including its:
Prospectus
Financial information
Holdings
Proxy voting information
Annual Shareholder Report - June 30, 2024
This annual shareholder report contains important information about DGI Balanced Fund for the period of July 1, 2023 to June 30, 2024. You can find additional information about the Fund at https://funddocs.filepoint.com/dgi_balanced/?file=DGI-Balanced-Summary.pdf. You can also request this information by contacting us at (787) 620-0000.
What were the Fund’s costs for the last year?
(based on a hypothetical $10,000 investment)
| Class Name | Costs of a $10,000 investment | Costs paid as a percentage of a $10,000 investment |
|---|
| Class NT | $130 | 1.30% |
How did the Fund perform during the reporting period?
During this Period, the Fund had a total return of 11.48%. Strong positive returns from the equity portion of the portfolio were dampened somewhat by the more modest positive returns from the fixed-income portion of the portfolio. The investment outlook for the markets is generally positive because, in the opinion of the Fund’s investment adviser, the long-term economic outlook is positive. Participation in equity investments over time has historically been important when seeking to achieve returns that maintain and grow the real value of savings. The Fund’s strategy seeks to provide participation in that potential growth while attempting to cushion the risk of possible equity market declines with a significant position in fixed-income securities.
How has the Fund performed since inception?
Total Return Based on $10,000 Investment
| DGI Balanced Fund - Class NT | DGI Blend-50% S&P/50% BB Agg Bond | Bloomberg U.S. Aggregate Bond Index | S&P 500 Index |
|---|
| May-2021 | $10,000 | $10,000 | $10,000 | $10,000 |
| Jun-2021 | $10,043 | $10,230 | $10,105 | $10,356 |
| Sep-2021 | $10,035 | $10,266 | $10,110 | $10,416 |
| Dec-2021 | $10,178 | $10,827 | $10,112 | $11,565 |
| Mar-2022 | $9,708 | $10,264 | $9,512 | $11,033 |
| Jun-2022 | $8,994 | $9,187 | $9,065 | $9,256 |
| Sep-2022 | $8,524 | $8,752 | $8,634 | $8,804 |
| Dec-2022 | $8,751 | $9,175 | $8,796 | $9,470 |
| Mar-2023 | $8,910 | $9,654 | $9,057 | $10,180 |
| Jun-2023 | $9,113 | $10,030 | $8,980 | $11,070 |
| Sep-2023 | $8,883 | $9,706 | $8,690 | $10,708 |
| Dec-2023 | $9,773 | $10,604 | $9,282 | $11,960 |
| Mar-2024 | $10,096 | $11,114 | $9,210 | $13,222 |
| Jun-2024 | $10,159 | $11,356 | $9,216 | $13,789 |
Average Annual Total Returns
| 1 Year | Since Inception (May 23, 2021) |
|---|
| DGI Balanced Fund - Class NT | 11.48% | 0.51% |
| DGI Blend-50% S&P/50% BB Agg Bond | 13.22% | 4.18% |
| Bloomberg U.S. Aggregate Bond Index | 2.63% | |
| S&P 500 Index | 24.56% | 10.90% |
The Fund's past performance is not a good predictor of how the Fund will perform in the future. The graph and table do not reflect the deduction of taxes that a shareholder would pay on fund distributions or redemption of fund shares.
- Net Assets$301,566,770
- Number of Portfolio Holdings155
- Advisory Fee $2,766,219
- Portfolio Turnover4%
Asset Weighting (% of total investments)
| Value | Value |
|---|
| Collateralized Mortgage Obligations | 0.0% |
| Common Stocks | 4.7% |
| Exchange-Traded Funds | 47.3% |
| Money Market Funds | 9.6% |
| U.S. Government & Agencies | 38.4% |
What did the Fund invest in?
Sector Weighting (% of net assets)
| Value | Value |
|---|
| Other Assets in Excess of Liabilities | 0.5% |
| U.S. Treasury Obligations | 0.3% |
| Financials | 4.7% |
| Money Market Funds | 9.6% |
| Mbs Passthrough | 37.9% |
| Equity | 47.0% |
Top 10 Holdings (% of net assets)
| Holding Name | % of Net Assets |
| SPDR S&P 500 ETF Trust | 20.5% |
| iShares Russell 2000 ETF | 13.4% |
| Dreyfus Treasury Obligations Cash Management Fund, Institutional Class | 9.6% |
| Popular, Inc. | 4.7% |
| iShares MSCI EAFE ETF | 3.6% |
| Vanguard MSCI Europe ETF | 3.5% |
| Vanguard FTSE Emerging Markets ETF | 2.9% |
| iShares MSCI Emerging Markets ETF | 2.3% |
| Government National Mortgage Association Series 626934 | 2.3% |
| Government National Mortgage Association Series 626941 | 1.4% |
No material changes occurred during the year ended June 30, 2024.
DGI Balanced Fund - Class NT (DGINX)
Annual Shareholder Report - June 30, 2024
Where can I find additional information about the Fund?
Additional information is available on the Fund's website ( https://funddocs.filepoint.com/dgi_balanced/?file=DGI-Balanced-Summary.pdf ), including its:
Prospectus
Financial information
Holdings
Proxy voting information
Annual Shareholder Report - June 30, 2024
This annual shareholder report contains important information about DGI Balanced Fund for the period of July 1, 2023 to June 30, 2024. You can find additional information about the Fund at https://funddocs.filepoint.com/dgi_balanced/?file=DGI-Balanced-Summary.pdf. You can also request this information by contacting us at (787) 620-0000.
What were the Fund’s costs for the last year?
(based on a hypothetical $10,000 investment)
| Class Name | Costs of a $10,000 investment | Costs paid as a percentage of a $10,000 investment |
|---|
| Class P | $130 | 1.30% |
How did the Fund perform during the reporting period?
During this Period, the Fund had a total return of 11.48%. Strong positive returns from the equity portion of the portfolio were dampened somewhat by the more modest positive returns from the fixed-income portion of the portfolio. The investment outlook for the markets is generally positive because, in the opinion of the Fund’s investment adviser, the long-term economic outlook is positive. Participation in equity investments over time has historically been important when seeking to achieve returns that maintain and grow the real value of savings. The Fund’s strategy seeks to provide participation in that potential growth while attempting to cushion the risk of possible equity market declines with a significant position in fixed-income securities.
How has the Fund performed since inception?
Total Return Based on $10,000 Investment
| DGI Balanced Fund - Class P | DGI Blend-50% S&P/50% BB Agg Bond | Bloomberg U.S. Aggregate Bond Index | S&P 500 Index |
|---|
| May-2021 | $10,000 | $10,000 | $10,000 | $10,000 |
| Jun-2021 | $10,043 | $10,230 | $10,105 | $10,356 |
| Sep-2021 | $10,026 | $10,266 | $10,110 | $10,416 |
| Dec-2021 | $10,178 | $10,827 | $10,112 | $11,565 |
| Mar-2022 | $9,708 | $10,264 | $9,512 | $11,033 |
| Jun-2022 | $8,994 | $9,187 | $9,065 | $9,256 |
| Sep-2022 | $8,524 | $8,752 | $8,634 | $8,804 |
| Dec-2022 | $8,751 | $9,175 | $8,796 | $9,470 |
| Mar-2023 | $8,910 | $9,654 | $9,057 | $10,180 |
| Jun-2023 | $9,113 | $10,030 | $8,980 | $11,070 |
| Sep-2023 | $8,883 | $9,706 | $8,690 | $10,708 |
| Dec-2023 | $9,773 | $10,604 | $9,282 | $11,960 |
| Mar-2024 | $10,096 | $11,114 | $9,210 | $13,222 |
| Jun-2024 | $10,159 | $11,356 | $9,216 | $13,789 |
Average Annual Total Returns
| 1 Year | Since Inception (May 23, 2021) |
|---|
| DGI Balanced Fund - Class P | 11.48% | 0.51% |
| DGI Blend-50% S&P/50% BB Agg Bond | 13.22% | 4.18% |
| Bloomberg U.S. Aggregate Bond Index | 2.63% | |
| S&P 500 Index | 24.56% | 10.90% |
The Fund's past performance is not a good predictor of how the Fund will perform in the future. The graph and table do not reflect the deduction of taxes that a shareholder would pay on fund distributions or redemption of fund shares.
- Net Assets$301,566,770
- Number of Portfolio Holdings155
- Advisory Fee $2,766,219
- Portfolio Turnover4%
Asset Weighting (% of total investments)
| Value | Value |
|---|
| Collateralized Mortgage Obligations | 0.0% |
| Common Stocks | 4.7% |
| Exchange-Traded Funds | 47.3% |
| Money Market Funds | 9.6% |
| U.S. Government & Agencies | 38.4% |
What did the Fund invest in?
Sector Weighting (% of net assets)
| Value | Value |
|---|
| Other Assets in Excess of Liabilities | 0.5% |
| U.S. Treasury Obligations | 0.3% |
| Financials | 4.7% |
| Money Market Funds | 9.6% |
| Mbs Passthrough | 37.9% |
| Equity | 47.0% |
Top 10 Holdings (% of net assets)
| Holding Name | % of Net Assets |
| SPDR S&P 500 ETF Trust | 20.5% |
| iShares Russell 2000 ETF | 13.4% |
| Dreyfus Treasury Obligations Cash Management Fund, Institutional Class | 9.6% |
| Popular, Inc. | 4.7% |
| iShares MSCI EAFE ETF | 3.6% |
| Vanguard MSCI Europe ETF | 3.5% |
| Vanguard FTSE Emerging Markets ETF | 2.9% |
| iShares MSCI Emerging Markets ETF | 2.3% |
| Government National Mortgage Association Series 626934 | 2.3% |
| Government National Mortgage Association Series 626941 | 1.4% |
No material changes occurred during the year ended June 30, 2024.
DGI Balanced Fund - Class P (DGIBX)
Annual Shareholder Report - June 30, 2024
Where can I find additional information about the Fund?
Additional information is available on the Fund's website ( https://funddocs.filepoint.com/dgi_balanced/?file=DGI-Balanced-Summary.pdf ), including its:
Prospectus
Financial information
Holdings
Proxy voting information
Annual Shareholder Report - June 30, 2024
This annual shareholder report contains important information about DGI Balanced Fund for the period of July 1, 2023 to June 30, 2024. You can find additional information about the Fund at https://funddocs.filepoint.com/dgi_balanced/?file=DGI-Balanced-Summary.pdf. You can also request this information by contacting us at (787) 620-0000.
What were the Fund’s costs for the last year?
(based on a hypothetical $10,000 investment)
| Class Name | Costs of a $10,000 investment | Costs paid as a percentage of a $10,000 investment |
|---|
| Class T | $130 | 1.30% |
How did the Fund perform during the reporting period?
During this Period, the Fund had a total return of 11.48%. Strong positive returns from the equity portion of the portfolio were dampened somewhat by the more modest positive returns from the fixed-income portion of the portfolio. The investment outlook for the markets is generally positive because, in the opinion of the Fund’s investment adviser, the long-term economic outlook is positive. Participation in equity investments over time has historically been important when seeking to achieve returns that maintain and grow the real value of savings. The Fund’s strategy seeks to provide participation in that potential growth while attempting to cushion the risk of possible equity market declines with a significant position in fixed-income securities.
How has the Fund performed since inception?
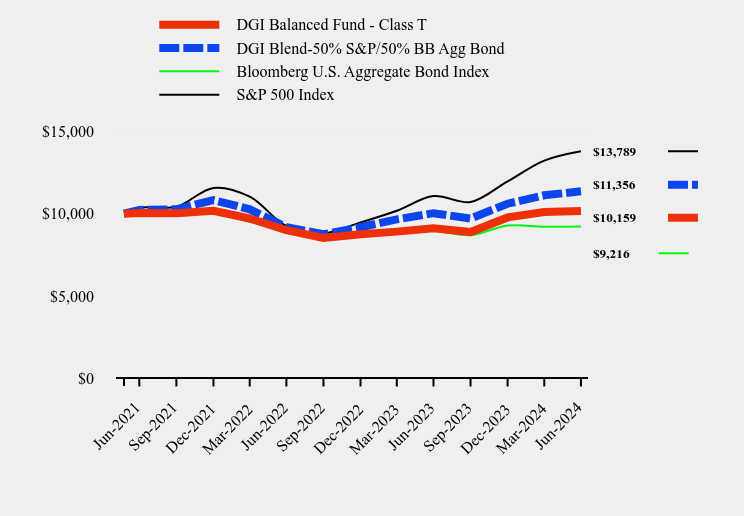
Total Return Based on $10,000 Investment
| DGI Balanced Fund - Class T | DGI Blend-50% S&P/50% BB Agg Bond | Bloomberg U.S. Aggregate Bond Index | S&P 500 Index |
|---|
| May-2021 | $10,000 | $10,000 | $10,000 | $10,000 |
| Jun-2021 | $10,043 | $10,230 | $10,105 | $10,356 |
| Sep-2021 | $10,026 | $10,266 | $10,110 | $10,416 |
| Dec-2021 | $10,178 | $10,827 | $10,112 | $11,565 |
| Mar-2022 | $9,708 | $10,264 | $9,512 | $11,033 |
| Jun-2022 | $8,994 | $9,187 | $9,065 | $9,256 |
| Sep-2022 | $8,524 | $8,752 | $8,634 | $8,804 |
| Dec-2022 | $8,751 | $9,175 | $8,796 | $9,470 |
| Mar-2023 | $8,910 | $9,654 | $9,057 | $10,180 |
| Jun-2023 | $9,113 | $10,030 | $8,980 | $11,070 |
| Sep-2023 | $8,883 | $9,706 | $8,690 | $10,708 |
| Dec-2023 | $9,773 | $10,604 | $9,282 | $11,960 |
| Mar-2024 | $10,096 | $11,114 | $9,210 | $13,222 |
| Jun-2024 | $10,159 | $11,356 | $9,216 | $13,789 |
Average Annual Total Returns
| 1 Year | Since Inception (May 23, 2021) |
|---|
| DGI Balanced Fund - Class T | 11.48% | 0.51% |
| DGI Blend-50% S&P/50% BB Agg Bond | 13.22% | 4.18% |
| Bloomberg U.S. Aggregate Bond Index | 2.63% | |
| S&P 500 Index | 24.56% | 10.90% |
The Fund's past performance is not a good predictor of how the Fund will perform in the future. The graph and table do not reflect the deduction of taxes that a shareholder would pay on fund distributions or redemption of fund shares.
- Net Assets$301,566,770
- Number of Portfolio Holdings155
- Advisory Fee $2,766,219
- Portfolio Turnover4%
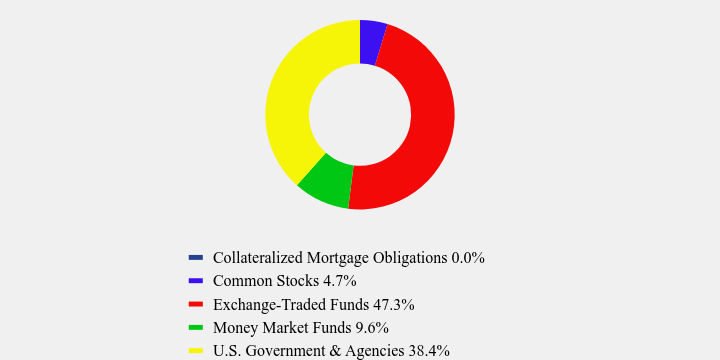
Asset Weighting (% of total investments)
| Value | Value |
|---|
| Collateralized Mortgage Obligations | 0.0% |
| Common Stocks | 4.7% |
| Exchange-Traded Funds | 47.3% |
| Money Market Funds | 9.6% |
| U.S. Government & Agencies | 38.4% |
What did the Fund invest in?
Sector Weighting (% of net assets)
| Value | Value |
|---|
| Other Assets in Excess of Liabilities | 0.5% |
| U.S. Treasury Obligations | 0.3% |
| Financials | 4.7% |
| Money Market Funds | 9.6% |
| Mbs Passthrough | 37.9% |
| Equity | 47.0% |
Top 10 Holdings (% of net assets)
| Holding Name | % of Net Assets |
| SPDR S&P 500 ETF Trust | 20.5% |
| iShares Russell 2000 ETF | 13.4% |
| Dreyfus Treasury Obligations Cash Management Fund, Institutional Class | 9.6% |
| Popular, Inc. | 4.7% |
| iShares MSCI EAFE ETF | 3.6% |
| Vanguard MSCI Europe ETF | 3.5% |
| Vanguard FTSE Emerging Markets ETF | 2.9% |
| iShares MSCI Emerging Markets ETF | 2.3% |
| Government National Mortgage Association Series 626934 | 2.3% |
| Government National Mortgage Association Series 626941 | 1.4% |
No material changes occurred during the year ended June 30, 2024.
DGI Balanced Fund - Class T (DGITX)
Annual Shareholder Report - June 30, 2024
Where can I find additional information about the Fund?
Additional information is available on the Fund's website ( https://funddocs.filepoint.com/dgi_balanced/?file=DGI-Balanced-Summary.pdf ), including its:
Prospectus
Financial information
Holdings
Proxy voting information
Item 2. Code of Ethics.
| (a) | The registrant has, as of the end of the period covered by this report, adopted a code of ethics that applies to the registrant’s principal executive officer, principal financial officer, and principal accounting officer or controller, or persons performing similar functions, regardless of whether these individuals are employed by the registrant or a third party. |
| | |
| (b) | Not applicable |
| | |
| (c) | During the period covered by this report, there were no amendments to any provision of the code of ethics. |
| | |
| (d) | During the period covered by this report, there were no waivers or implicit waivers of a provision of the code of ethics. |
| | |
| (e) | Not applicable |
| | |
| (f) | See Item 19(a)(1) |
Item 3. Audit Committee Financial Expert.
| (a)(1) | The Registrant’s board of trustees has determined that Ivan C. Lopez Morales is the audit committee financial expert, as defined in Item 3 of Form N-CSR. Mr. Lopez is independent for purposes of this Item 3. |
Item 4. Principal Accountant Fees and Services.
| (a) | Audit Fees. The aggregate fees billed for each of the last two fiscal years for professional services rendered by the registrant’s principal accountant for the audit of the registrant’s annual financial statements or services that are normally provided by the accountant in connection with statutory and regulatory filings or engagements for those fiscal years are as follows: |
2024 – $21,500
2023 – $17,500
| (b) | Audit-Related Fees. There were no fees billed in each of the last two fiscal years for assurances and related services by the principal accountant that are reasonably related to the performance of the audit of the registrant’s financial statements and are not reported under paragraph (a) of this item. |
| (c) | Tax Fees. The aggregate fees billed in each of the last two fiscal years for professional services rendered by the principal accountant for tax compliance are as follows: |
2024 – N/A
2023 – N/A
Preparation of Federal & State income tax returns, assistance with calculation of required income, capital gain and excise distributions and preparation of Federal excise tax returns.
| (d) | All Other Fees. The aggregate fees billed in each of the last two fiscal years for products and services provided by the registrant’s principal accountant, other than the services reported in paragraphs (a) through (c) of this item were $0 and $0 for the fiscal years ended June 30, 2023 and 2024, respectively. |
| (e)(1) | The audit committee does not have pre-approval policies and procedures. Instead, the audit committee or audit committee chairman approves on a case-by-case basis each audit or non-audit service before the principal accountant is engaged by the registrant. |
| | |
| (e)(2) | There were no services described in each of paragraphs (b) through (d) of this Item that were approved by the audit committee pursuant to paragraph (c)(7)(i)(C) of Rule 2-01 of Regulation S-X. |
| | |
| (f) | Not applicable. The percentage of hours expended on the principal accountant’s engagement to audit the registrant’s financial statements for the most recent fiscal year that were attributed to work performed by persons other than the principal accountant’s full-time, permanent employees was zero percent (0%). |
| (g) | All non-audit fees billed by the registrant’s principal accountant for services rendered to the registrant for the fiscal years ended June 30, 2023 and 2024, respectively are disclosed in (b)-(d) above. There were no audit or non-audit services performed by the registrant’s principal accountant for the registrant’s adviser. |
| | |
| (h) | Not applicable. |
| | |
| (i) | Not applicable. |
| | |
| (j) | Not applicable. |
Item 5. Audit Committee of Listed Companies.
Not applicable
Item 6. Investments.
Schedule of investments in securities of unaffiliated issuers is included under Item 7.
Item 7. Financial Statements and Financial Highlights for Open-End Management Investment Companies.

DGI Balanced Fund
Annual Financial Statements
June 30, 2024
This report and the financial statements contained herein are submitted for the general information of shareholders and are not authorized for distribution to prospective investors unless preceded or accompanied by an effective prospectus, which contains information about the Fund’s investment objective, risks, fees and expenses. Investors are reminded to read the prospectus carefully before investing in the Fund.
DGI BALANCED FUND
SCHEDULE OF INVESTMENTS
June 30, 2024
| Shares | | | | | Fair Value | |
| | | | | COMMON STOCK — 4.7% | | | | |
| | | | | BANKING - 4.7% | | | | |
| | 160,000 | | | Popular, Inc. (Cost $10,175,193) | | $ | 14,148,800 | |
| | | | | | | | | |
| | | | | EXCHANGE-TRADED FUNDS — 47.0% | | | | |
| | | | | EQUITY - 47.0% | | | | |
| | 139,300 | | | iShares MSCI EAFE ETF | | | 10,911,369 | |
| | 160,000 | | | iShares MSCI Emerging Markets ETF | | | 6,814,400 | |
| | 48,000 | | | iShares MSCI India ETF | | | 2,677,440 | |
| | 199,000 | | | iShares Russell 2000 Index Fund | | | 40,375,110 | |
| | 113,400 | | | SPDR S&P 500 ETF Trust | | | 61,714,548 | |
| | 201,000 | | | Vanguard FTSE Emerging Markets ETF | | | 8,795,760 | |
| | 156,000 | | | VANGUARD MSCI EUROPE ETF | | | 10,416,120 | |
| | | | | TOTAL EXCHANGE-TRADED FUNDS (Cost $113,914,545) | | | 141,704,747 | |
Principal Amount ($) | | | | | Spread | | | Coupon Rate
(%) | | | Maturity | | | | |
| | | | | COLLATERALIZED MORTGAGE OBLIGATIONS — 0.0%(a) | | | | | | | | | | | | | |
| | 814,703 | | | Federal National Mortgage Association Series 2011-M1X (Cost $53,293)(b),(c) | | SOFR30A + 5.886% | | | 0.5500 | | | 07/25/38 | | | | 64,572 | |
| | | | | | | | | | | | | | | | | | |
| | | | | U.S. GOVERNMENT & AGENCIES — 38.2% | | | | | | | | | | | | | |
| | | | | FEDERAL HOME LOAN MORTGAGE CORP. — 1.5%(d) | | | | | | | | | | | | | |
| | 120,816 | | | Federal Home Loan Mortgage Corporation Series D97349 | | | | | 6.0000 | | | 09/01/25 | | | | 121,423 | |
| | 6,708 | | | Federal Home Loan Mortgage Corporation Series D75702 | | | | | 7.5000 | | | 01/01/26 | | | | 6,701 | |
| | 17,522 | | | Federal Home Loan Mortgage Corporation Series D79168 | | | | | 8.0000 | | | 02/01/27 | | | | 17,532 | |
| | 429,890 | | | Federal Home Loan Mortgage Corporation Series J20654 | | | | | 3.0000 | | | 08/01/27 | | | | 413,752 | |
| | 41,752 | | | Federal Home Loan Mortgage Corporation Series C10178 | | | | | 6.5000 | | | 05/01/28 | | | | 42,997 | |
| | 140,402 | | | Federal Home Loan Mortgage Corporation Series P51380 | | | | | 5.5000 | | | 03/01/36 | | | | 139,183 | |
| | 148,431 | | | Federal Home Loan Mortgage Corporation Series C02554 | | | | | 6.0000 | | | 06/01/36 | | | | 151,887 | |
| | 3,925,310 | | | Federal Home Loan Mortgage Corporation Series SB0645 | | | | | 2.0000 | | | 12/01/36 | | | | 3,464,284 | |
| | | | | | | | | | | | | | | | | 4,357,759 | |
See accompanying notes to financial statements.
DGI BALANCED FUND
SCHEDULE OF INVESTMENTS (Continued)
June 30, 2024
| Principal | | | | | | | | Coupon Rate | | | | | | | |
| Amount ($) | | | | | | | | (%) | | | Maturity | | | Fair Value | |
| | | | | U.S. GOVERNMENT & AGENCIES — 38.2% (Continued) | | | | | | | | | | | | | |
| | | | | FEDERAL NATIONAL MORTGAGE ASSOCIATION — 9.1%(d) | | | | | | | | | | | | | |
| | 311 | | | Federal National Mortgage Association Series 426645 | | | | | 8.5000 | | | 10/01/24 | | | $ | 310 | |
| | 38,420 | | | Federal National Mortgage Association Series 426651 | | | | | 6.5000 | | | 03/01/26 | | | | 39,142 | |
| | 2,983 | | | Federal National Mortgage Association Series 511569 | | | | | 8.5000 | | | 07/01/26 | | | | 2,978 | |
| | 77,656 | | | Federal National Mortgage Association Series AE1268 | | | | | 3.5000 | | | 10/01/26 | | | | 75,752 | |
| | 11,390 | | | Federal National Mortgage Association Series 367023 | | | | | 7.5000 | | | 11/01/26 | | | | 11,379 | |
| | 142,910 | | | Federal National Mortgage Association Series AE1285 | | | | | 3.5000 | | | 12/01/26 | | | | 139,166 | |
| | 19,103 | | | Federal National Mortgage Association Series 367025 | | | | | 8.0000 | | | 12/01/26 | | | | 19,091 | |
| | 387,650 | | | Federal National Mortgage Association Series AJ1905 | | | | | 3.0000 | | | 02/01/27 | | | | 373,715 | |
| | 45,810 | | | Federal National Mortgage Association Series 426649 | | | | | 7.0000 | | | 02/01/27 | | | | 47,141 | |
| | 160,048 | | | Federal National Mortgage Association Series AI9096 | | | | | 3.5000 | | | 03/01/27 | | | | 155,168 | |
| | 6,634 | | | Federal National Mortgage Association Series 374925 | | | | | 7.5000 | | | 03/01/27 | | | | 6,628 | |
| | 264,166 | | | Federal National Mortgage Association Series AL3274 | | | | | 3.0000 | | | 05/01/27 | | | | 256,039 | |
| | 202,042 | | | Federal National Mortgage Association Series AJ1913 | | | | | 3.0000 | | | 06/01/27 | | | | 194,502 | |
| | 4,102 | | | Federal National Mortgage Association Series 426647 | | | | | 7.5000 | | | 06/01/27 | | | | 4,099 | |
| | 809,042 | | | Federal National Mortgage Association Series AP1217 | | | | | 2.5000 | | | 07/01/27 | | | | 777,986 | |
| | 357,740 | | | Federal National Mortgage Association Series AI9133 | | | | | 3.5000 | | | 11/01/27 | | | | 345,912 | |
| | 678,031 | | | Federal National Mortgage Association Series AR5151 | | | | | 2.5000 | | | 04/01/28 | | | | 649,211 | |
| | 72,257 | | | Federal National Mortgage Association Series AU2244 | | | | | 3.0000 | | | 09/01/28 | | | | 68,931 | |
| | 793,646 | | | Federal National Mortgage Association Series AR5202 | | | | | 3.0000 | | | 11/01/28 | | | | 757,836 | |
| | 437,900 | | | Federal National Mortgage Association Series AR5223 | | | | | 3.0000 | | | 02/01/29 | | | | 420,221 | |
| | 338,856 | | | Federal National Mortgage Association Series AS2465 | | | | | 3.0000 | | | 04/01/29 | | | | 321,095 | |
| | 578,472 | | | Federal National Mortgage Association Series AS2542 | | | | | 3.0000 | | | 04/01/29 | | | | 548,593 | |
| | 52,633 | | | Federal National Mortgage Association Series 488061 | | | | | 7.0000 | | | 04/01/29 | | | | 54,172 | |
| | 493,984 | | | Federal National Mortgage Association Series AV6988 | | | | | 3.0000 | | | 05/01/29 | | | | 473,689 | |
| | 1,052,316 | | | Federal National Mortgage Association Series AV6993 | | | | | 3.0000 | | | 06/01/29 | | | | 1,007,621 | |
| | 1,035,379 | | | Federal National Mortgage Association Series AV6999 | | | | | 3.0000 | | | 06/01/29 | | | | 990,936 | |
| | 1,051,040 | | | Federal National Mortgage Association Series AV1451 | | | | | 3.0000 | | | 06/01/29 | | | | 1,005,754 | |
| | 642,617 | | | Federal National Mortgage Association Series AV1452 | | | | | 3.0000 | | | 07/01/29 | | | | 608,592 | |
| | 75,721 | | | Federal National Mortgage Association Series 504137 | | | | | 7.5000 | | | 07/01/29 | | | | 75,516 | |
See accompanying notes to financial statements.
DGI BALANCED FUND
SCHEDULE OF INVESTMENTS (Continued)
June 30, 2024
| Principal | | | | | | | | Coupon Rate | | | | | | | |
| Amount ($) | | | | | | | | (%) | | | Maturity | | | Fair Value | |
| | | | | U.S. GOVERNMENT & AGENCIES — 38.2% (Continued) | | | | | | | | | | | | | |
| | | | | FEDERAL NATIONAL MORTGAGE ASSOCIATION — 9.1%(d) (Continued) | | | | | | | | | | | | | |
| | 33,502 | | | Federal National Mortgage Association Series 504148 | | | | | 7.5000 | | | 08/01/29 | | | $ | 33,295 | |
| | 528,799 | | | Federal National Mortgage Association Series AV7011 | | | | | 3.0000 | | | 09/01/29 | | | | 501,350 | |
| | 30,621 | | | Federal National Mortgage Association Series 523120 | | | | | 7.0000 | | | 01/01/30 | | | | 31,509 | |
| | 609,268 | | | Federal National Mortgage Association Series AV7045 | | | | | 3.0000 | | | 02/01/30 | | | | 578,425 | |
| | 12,787 | | | Federal National Mortgage Association Series 523123 | | | | | 7.5000 | | | 02/01/30 | | | | 12,774 | |
| | 144,397 | | | Federal National Mortgage Association Series 567014 | | | | | 6.5000 | | | 03/01/31 | | | | 148,980 | |
| | 595,920 | | | Federal National Mortgage Association Series AX5513 | | | | | 3.0000 | | | 04/01/31 | | | | 563,041 | |
| | 136,835 | | | Federal National Mortgage Association Series 573448 | | | | | 6.5000 | | | 04/01/31 | | | | 141,261 | |
| | 646,247 | | | Federal National Mortgage Association Series AX5544 | | | | | 3.0000 | | | 08/01/31 | | | | 608,926 | |
| | 847,721 | | | Federal National Mortgage Association Series AX5551 | | | | | 2.5000 | | | 10/01/31 | | | | 782,478 | |
| | 392,340 | | | Federal National Mortgage Association Series AX5567 | | | | | 3.0000 | | | 12/01/31 | | | | 371,329 | |
| | 635,870 | | | Federal National Mortgage Association Series BD9019 | | | | | 3.0000 | | | 01/01/32 | | | | 598,198 | |
| | 654,670 | | | Federal National Mortgage Association Series 695394 | | | | | 5.0000 | | | 06/01/33 | | | | 647,134 | |
| | 179,717 | | | Federal National Mortgage Association Series 850040 | | | | | 6.5000 | | | 06/01/36 | | | | 186,745 | |
| | 1,495,747 | | | Federal National Mortgage Association Series CB2736 | | | | | 2.5000 | | | 01/01/37 | | | | 1,352,994 | |
| | 86,961 | | | Federal National Mortgage Association Series 931180 | | | | | 5.5000 | | | 04/01/39 | | | | 87,419 | |
| | 446,667 | | | Federal National Mortgage Association Series 953131 | | | | | 4.5000 | | | 09/01/39 | | | | 434,758 | |
| | 2,271,306 | | | Federal National Mortgage Association Series AI9098 | | | | | 4.0000 | | | 03/01/42 | | | | 2,142,283 | |
| | 1,432,785 | | | Federal National Mortgage Association Series AS3545 | | | | | 4.0000 | | | 09/01/44 | | | | 1,344,360 | |
| | 1,504,479 | | | Federal National Mortgage Association Series AV7027 | | | | | 4.0000 | | | 11/01/44 | | | | 1,411,666 | |
| | 545,519 | | | Federal National Mortgage Association Series AX5471 | | | | | 3.0000 | | | 07/01/45 | | | | 478,027 | |
| | 727,627 | | | Federal National Mortgage Association Series AV7076 | | | | | 3.0000 | | | 07/01/45 | | | | 638,629 | |
| | 4,325,186 | | | Federal National Mortgage Association Series AS8523 | | | | | 3.0000 | | | 11/01/46 | | | | 3,779,366 | |
| | 1,419,837 | | | Federal National Mortgage Association Series AX5564 | | | | | 3.0000 | | | 12/01/46 | | | | 1,241,025 | |
| | | | | | | | | | | | | | | | | 27,547,147 | |
| | | | | GOVERNMENT NATIONAL MORTGAGE ASSOCIATION — 27.3% | | | | | | | | | | | | | |
| | 150 | | | Government National Mortgage Association Series 406062 | | | | | 7.5000 | | | 01/15/25 | | | | 149 | |
| | 1,418 | | | Government National Mortgage Association Series 406065 | | | | | 7.5000 | | | 01/15/25 | | | | 1,416 | |
| | 2,933 | | | Government National Mortgage Association Series 439194 | | | | | 7.5000 | | | 08/15/25 | | | | 2,929 | |
| | 10,202 | | | Government National Mortgage Association Series 425509 | | | | | 8.0000 | | | 09/15/25 | | | | 10,203 | |
| | 40,454 | | | Government National Mortgage Association Series 705899 | | | | | 3.5000 | | | 01/15/26 | | | | 39,736 | |
| | 6,201 | | | Government National Mortgage Association Series 385183 | | | | | 7.5000 | | | 01/15/26 | | | | 6,190 | |
| | 14,495 | | | Government National Mortgage Association Series 5127 | | | | | 4.0000 | | | 07/20/26 | | | | 14,158 | |
| | 158,678 | | | Government National Mortgage Association Series 711631 | | | | | 3.5000 | | | 02/15/27 | | | | 154,485 | |
See accompanying notes to financial statements.
DGI BALANCED FUND
SCHEDULE OF INVESTMENTS (Continued)
June 30, 2024
| Principal | | | | | | | | Coupon Rate | | | | | | | |
| Amount ($) | | | | | | | | (%) | | | Maturity | | | Fair Value | |
| | | | | U.S. GOVERNMENT & AGENCIES — 38.2% (Continued) | | | | | | | | | | | | | |
| | | | | GOVERNMENT NATIONAL MORTGAGE ASSOCIATION — 27.3% (Continued) | | | | | | | | | | | | | |
| | 40,270 | | | Government National Mortgage Association Series 5310 | | | | | 3.5000 | | | 02/20/27 | | | $ | 38,932 | |
| | 267,233 | | | Government National Mortgage Association Series 705941 | | | | | 3.0000 | | | 04/15/27 | | | | 258,745 | |
| | 128,940 | | | Government National Mortgage Association Series 711651 | | | | | 3.5000 | | | 05/15/27 | | | | 125,436 | |
| | 509,412 | | | Government National Mortgage Association Series 740018 | | | | | 3.5000 | | | 07/15/27 | | | | 494,617 | |
| | 259,041 | | | Government National Mortgage Association Series 705951 | | | | | 2.5000 | | | 08/15/27 | | | | 248,499 | |
| | 513,095 | | | Government National Mortgage Association Series 744440 | | | | | 3.5000 | | | 10/15/27 | | | | 497,958 | |
| | 198,300 | | | Government National Mortgage Association Series 705956 | | | | | 2.5000 | | | 11/15/27 | | | | 189,297 | |
| | 21,008 | | | Government National Mortgage Association Series 711707 | | | | | 2.5000 | | | 01/15/28 | | | | 20,152 | |
| | 157,715 | | | Government National Mortgage Association Series 767026 | | | | | 2.5000 | | | 02/15/28 | | | | 150,553 | |
| | 231,245 | | | Government National Mortgage Association Series 721979 | | | | | 2.5000 | | | 03/15/28 | | | | 220,218 | |
| | 283,270 | | | Government National Mortgage Association Series 722012 | | | | | 3.0000 | | | 09/15/28 | | | | 271,375 | |
| | 228,694 | | | Government National Mortgage Association Series 722016 | | | | | 2.5000 | | | 12/15/28 | | | | 216,395 | |
| | 244,523 | | | Government National Mortgage Association Series 722033 | | | | | 3.0000 | | | 06/15/29 | | | | 234,046 | |
| | 37,103 | | | Government National Mortgage Association Series 626932 | | | | | 3.0000 | | | 04/15/30 | | | | 34,831 | |
| | 81,760 | | | Government National Mortgage Association Series 548539 | | | | | 6.0000 | | | 10/15/31 | | | | 83,690 | |
| | 309,744 | | | Government National Mortgage Association Series 635142 | | | | | 3.0000 | | | 11/20/31 | | | | 289,227 | |
| | 48,085 | | | Government National Mortgage Association Series 636427 | | | | | 6.0000 | | | 11/15/34 | | | | 48,966 | |
| | 52,410 | | | Government National Mortgage Association Series 636567 | | | | | 6.0000 | | | 07/15/35 | | | | 53,531 | |
| | 59,913 | | | Government National Mortgage Association Series 643754 | | | | | 6.0000 | | | 10/15/35 | | | | 61,194 | |
| | 159,290 | | | Government National Mortgage Association Series 592885 | | | | | 6.0000 | | | 05/15/36 | | | | 164,573 | |
| | 1,706,321 | | | Government National Mortgage Association Series 655703 | | | | | 6.0000 | | | 08/15/37 | | | | 1,810,282 | |
| | 1,165,958 | | | Government National Mortgage Association Series 722002 | | | | | 3.5000 | | | 03/15/38 | | | | 1,074,021 | |
| | 578,391 | | | Government National Mortgage Association Series 767055 | | | | | 3.0000 | | | 05/15/38 | | | | 517,786 | |
| | 612,683 | | | Government National Mortgage Association Series 767066 | | | | | 3.0000 | | | 06/15/38 | | | | 548,496 | |
| | 1,983,265 | | | Government National Mortgage Association Series 721997 | | | | | 3.5000 | | | 01/15/39 | | | | 1,830,668 | |
| | 675,807 | | | Government National Mortgage Association Series 678638 | | | | | 4.5000 | | | 08/15/39 | | | | 671,094 | |
| | 529,562 | | | Government National Mortgage Association Series 678639 | | | | | 5.0000 | | | 08/15/39 | | | | 539,407 | |
| | 1,577,139 | | | Government National Mortgage Association Series 678641 | | | | | 4.5000 | | | 09/15/39 | | | | 1,566,154 | |
| | 119,309 | | | Government National Mortgage Association Series 719894 | | | | | 4.5000 | | | 09/15/39 | | | | 118,477 | |
| | 950,207 | | | Government National Mortgage Association Series 678642 | | | | | 5.0000 | | | 09/15/39 | | | | 967,870 | |
| | 515,727 | | | Government National Mortgage Association Series 678645 | | | | | 4.5000 | | | 10/15/39 | | | | 512,127 | |
| | 420,901 | | | Government National Mortgage Association Series 678646 | | | | | 5.0000 | | | 10/15/39 | | | | 428,727 | |
| | 401,291 | | | Government National Mortgage Association Series 678643 | | | | | 5.5000 | | | 11/15/39 | | | | 417,118 | |
| | 347,751 | | | Government National Mortgage Association Series 678660 | | | | | 5.0000 | | | 03/15/40 | | | | 354,218 | |
See accompanying notes to financial statements.
DGI BALANCED FUND
SCHEDULE OF INVESTMENTS (Continued)
June 30, 2024
| Principal | | | | | | | | Coupon Rate | | | | | | | |
| Amount ($) | | | | | | | | (%) | | | Maturity | | | Fair Value | |
| | | | | U.S. GOVERNMENT & AGENCIES — 38.2% (Continued) | | | | | | | | | | | | | |
| | | | | GOVERNMENT NATIONAL MORTGAGE ASSOCIATION — 27.3% (Continued) | | | | | | | | | | | | | |
| | 395,106 | | | Government National Mortgage Association Series 722009 | | | | | 3.5000 | | | 07/15/40 | | | $ | 364,580 | |
| | 1,571,034 | | | Government National Mortgage Association Series 705892 | | | | | 4.0000 | | | 11/15/40 | | | | 1,519,853 | |
| | 350,816 | | | Government National Mortgage Association Series 705894 | | | | | 4.5000 | | | 11/15/40 | | | | 348,369 | |
| | 485,638 | | | Government National Mortgage Association Series 705937 | | | | | 4.0000 | | | 01/15/42 | | | | 469,818 | |
| | 1,738,598 | | | Government National Mortgage Association Series 705936 | | | | | 3.5000 | | | 02/15/42 | | | | 1,602,353 | |
| | 42,370 | | | Government National Mortgage Association Series 5302 | | | | | 3.5000 | | | 02/20/42 | | | | 37,889 | |
| | 1,888,980 | | | Government National Mortgage Association Series 711653 | | | | | 3.5000 | | | 05/20/42 | | | | 1,719,265 | |
| | 1,699,972 | | | Government National Mortgage Association Series 721969 | | | | | 3.0000 | | | 11/15/42 | | | | 1,521,659 | |
| | 1,709,746 | | | Government National Mortgage Association Series 711731 | | | | | 3.0000 | | | 03/15/43 | | | | 1,530,539 | |
| | 1,545,313 | | | Government National Mortgage Association Series 722001 | | | | | 3.5000 | | | 06/15/43 | | | | 1,424,098 | |
| | 807,622 | | | Government National Mortgage Association Series 722008 | | | | | 3.0000 | | | 08/15/43 | | | | 718,906 | |
| | 1,095,141 | | | Government National Mortgage Association Series 722010 | | | | | 3.5000 | | | 08/15/43 | | | | 1,009,306 | |
| | 634,401 | | | Government National Mortgage Association Series 722011 | | | | | 4.0000 | | | 08/15/43 | | | | 613,723 | |
| | 1,960,082 | | | Government National Mortgage Association Series 722013 | | | | | 3.5000 | | | 09/15/43 | | | | 1,806,316 | |
| | 611,856 | | | Government National Mortgage Association Series 722020 | | | | | 3.0000 | | | 12/15/43 | | | | 539,350 | |
| | 1,718,626 | | | Government National Mortgage Association Series 722021 | | | | | 3.5000 | | | 12/15/43 | | | | 1,583,814 | |
| | 3,260,348 | | | Government National Mortgage Association Series 609103 | | | | | 3.5000 | | | 01/15/44 | | | | 3,004,755 | |
| | 1,924,212 | | | Government National Mortgage Association Series 609163 | | | | | 3.5000 | | | 07/15/44 | | | | 1,773,370 | |
| | 2,493,159 | | | Government National Mortgage Association Series 609200 | | | | | 3.5000 | | | 10/15/44 | | | | 2,297,562 | |
| | 1,675,594 | | | Government National Mortgage Association Series 609214 | | | | | 3.0000 | | | 11/20/44 | | | | 1,460,200 | |
| | 2,503,278 | | | Government National Mortgage Association Series 626921 | | | | | 3.0000 | | | 03/15/45 | | | | 2,203,481 | |
| | 7,883,116 | | | Government National Mortgage Association Series 626934 | | | | | 3.0000 | | | 04/20/45 | | | | 6,788,095 | |
| | 4,792,824 | | | Government National Mortgage Association Series 626941 | | | | | 3.0000 | | | 05/15/45 | | | | 4,219,222 | |
| | 2,702,351 | | | Government National Mortgage Association Series 635068 | | | | | 3.0000 | | | 04/15/46 | | | | 2,378,658 | |
| | 2,250,614 | | | Government National Mortgage Association Series AE3319 | | | | | 3.0000 | | | 07/15/46 | | | | 1,981,064 | |
| | 1,246,862 | | | Government National Mortgage Association Series AW2756 | | | | | 3.0000 | | | 09/15/46 | | | | 1,097,522 | |
| | 1,593,628 | | | Government National Mortgage Association Series 635133 | | | | | 3.0000 | | | 10/20/46 | | | | 1,372,439 | |
| | 2,125,426 | | | Government National Mortgage Association Series AW3558 | | | | | 3.0000 | | | 11/15/46 | | | | 1,870,775 | |
| | 981,656 | | | Government National Mortgage Association Series 635153 | | | | | 3.0000 | | | 12/20/46 | | | | 852,651 | |
| | 1,948,217 | | | Government National Mortgage Association Series 690615 | | | | | 3.0000 | | | 06/15/47 | | | | 1,707,522 | |
| | 1,875,461 | | | Government National Mortgage Association Series 690625 | | | | | 3.0000 | | | 07/20/47 | | | | 1,614,892 | |
| | 540,080 | | | Government National Mortgage Association Series BC3027 | | | | | 3.0000 | | | 03/15/48 | | | | 475,381 | |
| | 2,015,836 | | | Government National Mortgage Association Series AD6371 | | | | | 3.0000 | | | 03/15/48 | | | | 1,764,328 | |
| | 3,128,790 | | | Government National Mortgage Association Series BE1665 | | | | | 4.0000 | | | 05/20/48 | | | | 3,048,813 | |
See accompanying notes to financial statements.
DGI BALANCED FUND
SCHEDULE OF INVESTMENTS (Continued)
June 30, 2024
| Principal | | | | | | | | Coupon Rate | | | | | | | |
| Amount ($) | | | | | | | | (%) | | | Maturity | | | Fair Value | |
| | | | | U.S. GOVERNMENT & AGENCIES — 38.2% (Continued) | | | | | | | | | | | | | |
| | | | | GOVERNMENT NATIONAL MORTGAGE ASSOCIATION — 27.3% (Continued) | | | | | | | | | | | | | |
| | 2,565,612 | | | Government National Mortgage Association | | | | | 4.0000 | | | 09/15/48 | | | $ | 2,481,934 | |
| | 966,221 | | | Government National Mortgage Association Series BJ1540 | | | | | 3.5000 | | | 09/20/48 | | | | 879,507 | |
| | 684,760 | | | Government National Mortgage Association Series BJ1536 | | | | | 3.5000 | | | 09/20/48 | | | | 623,319 | |
| | 2,710,459 | | | Government National Mortgage Association Series BJ9877 | | | | | 4.0000 | | | 11/15/48 | | | | 2,622,024 | |
| | 1,890,677 | | | Government National Mortgage Association Series BJ9885 | | | | | 4.0000 | | | 12/15/48 | | | | 1,828,928 | |
| | 995,560 | | | Government National Mortgage Association Series BJ9893 | | | | | 3.5000 | | | 12/20/48 | | | | 906,175 | |
| | 929,469 | | | Government National Mortgage Association Series BJ9892 | | | | | 3.5000 | | | 01/15/49 | | | | 847,301 | |
| | | | | | | | | | | | | | | | | 82,197,702 | |
| | | | | U.S. TREASURY NOTES — 0.3% | | | | | | | | | | | | | |
| | 1,000,000 | | | United States Treasury Notes | | | | | 4.3750 | | | 05/15/34 | | | | 1,002,500 | |
| | | | | | | | | | | | | | | | | | |
| | | | | TOTAL U.S. GOVERNMENT & AGENCIES (Cost $126,401,797) | | | | | | | | | | | | 115,105,108 | |
| Shares | | | | | | |
| | | | | SHORT-TERM INVESTMENT — 9.6% | | | | |
| | | | | MONEY MARKET FUND - 9.6% | | | | |
| | 28,888,251 | | | Dreyfus Treasury Obligations Cash Management Fund, Institutional Class, 5.18% (e) (Cost $28,888,251) | | | 28,888,251 | |
| | | | | | | | | |
| | | | | TOTAL INVESTMENTS - 99.5% (Cost $279,433,079) | | $ | 299,911,478 | |
| | | | | OTHER ASSETS IN EXCESS OF LIABILITIES - 0.5% | | | 1,655,292 | |
| | | | | NET ASSETS - 100.0% | | $ | 301,566,770 | |
| EAFE | - Europe, Australasia and Far East |
| ETF | - Exchange-Traded Fund |
| MSCI | - Morgan Stanley Capital International |
| SPDR | - Standard & Poor’s Depositary Receipt |
| SOFR30A | - United States 30 Day Average SOFR Secured Overnight Financing Rate |
| (a) | Percentage rounds to less than 0.1%. |
| (b) | Interest only securities. |
| (c) | Variable rate security; the rate shown represents the rate on June 30, 2024. |
| (d) | Issuer operates under a Congressional charter; its securities are neither issued nor guaranteed by the U.S. government. The Federal National Mortgage Association and the Federal Home Loan Mortgage Corporation currently operate under a federal conservatorship. |
| (e) | Rate disclosed is the seven day annualized effective yield as of June 30, 2024. |
See accompanying notes to financial statements.
DGI Balanced Fund
STATEMENT OF ASSETS AND LIABILITIES
June 30, 2024
| ASSETS | | | |
| Investment securities: | | | | |
| At cost | | $ | 279,433,079 | |
| At value | | $ | 299,911,478 | |
| Subscriptions receivable | | | 15,053 | |
| Reclaims receivable | | | 1,040,747 | |
| Dividends and interest receivable | | | 767,538 | |
| Receivable for securities sold | | | 9,035 | |
| Prepaid expenses & other assets | | | 321,573 | |
| TOTAL ASSETS | | | 302,065,424 | |
| | | | | |
| LIABILITIES | | | | |
| Due to custodian | | | 72,004 | |
| Redemptions payable | | | 9,576 | |
| Advisory fees payable | | | 229,971 | |
| Distribution (12b-1) fees payable | | | 235 | |
| Transfer agency fees payable | | | 65,995 | |
| Administration fees payable | | | 67,034 | |
| Accrued expenses and other liabilities | | | 53,839 | |
| TOTAL LIABILITIES | | | 498,654 | |
| | | | | |
| NET ASSETS | | $ | 301,566,770 | |
| | | | | |
| Net Assets Consist Of: | | | | |
| Paid in capital ($0 par value, unlimited shares authorized) | | $ | 260,603,527 | |
| Accumulated earnings | | | 40,963,243 | |
| NET ASSETS | | $ | 301,566,770 | |
See accompanying notes to financial statements.
DGI Balanced Fund
STATEMENT OF ASSETS AND LIABILITIES (Continued)
June 30, 2024
| Net Asset Value Per Share: | | | |
| Class A Shares | | | |
| Net Assets | | $ | 1,242,520 | |
| Shares of beneficial interest outstanding ($0 par value, unlimited shares authorized) | | | 109,814 | |
| Net asset value (Net Assets ÷ Shares Outstanding) and redemption price per share | | $ | 11.31 | |
| Maximum offering price per share (maximum sales charge of 3.50%) | | $ | 11.72 | |
| | | | | |
| Class C Shares | | | | |
| Net Assets | | $ | 1,077 | |
| Shares of beneficial interest outstanding ($0 par value, unlimited shares authorized) | | | 96 | |
| Net asset value (Net Assets ÷ Shares Outstanding), offering price and redemption price per share (1) | | $ | 11.27 | (2) |
| | | | | |
| Class I Shares | | | | |
| Net Assets | | $ | 1,084 | |
| Shares of beneficial interest outstanding ($0 par value, unlimited shares authorized) | | | 96 | |
| Net asset value (Net Assets ÷ Shares Outstanding), offering price and redemption price per share | | $ | 11.33 | (2) |
| | | | | |
| Class P Shares | | | | |
| Net Assets | | $ | 183,886,102 | |
| Shares of beneficial interest outstanding ($0 par value, unlimited shares authorized) | | | 16,225,747 | |
| Net asset value (Net Assets ÷ Shares Outstanding), offering price and redemption price per share | | $ | 11.33 | |
| | | | | |
| Class T Shares | | | | |
| Net Assets | | $ | 98,514,629 | |
| Shares of beneficial interest outstanding ($0 par value, unlimited shares authorized) | | | 8,692,555 | |
| Net asset value (Net Assets ÷ Shares Outstanding), offering price and redemption price per share | | $ | 11.33 | |
| | | | | |
| Class NT Shares | | | | |
| Net Assets | | $ | 17,921,358 | |
| Shares of beneficial interest outstanding ($0 par value, unlimited shares authorized) | | | 1,581,325 | |
| Net asset value (Net Assets ÷ Shares Outstanding), offering price and redemption price per share | | $ | 11.33 | |
| (1) | Redemptions made within 1 year of purchase may be assessed a redemption fee of 1.00%. |
| (2) | Net asset value may not recalculate due to the rounding of net assets and/or shares outstanding. |
See accompanying notes to financial statements.
DGI Balanced Fund
STATEMENT OF OPERATIONS
For the Year Ended June 30, 2024
| INVESTMENT INCOME | | | |
| Dividends (Foreign Taxes Withheld: $768,897) | | $ | 3,570,784 | |
| Interest | | | 4,122,374 | |
| TOTAL INVESTMENT INCOME | | | 7,693,158 | |
| | | | | |
| EXPENSES | | | | |
| Investment advisory fees | | | 2,766,219 | |
| Distribution (12b-1) fees | | | | |
| Class A | | | 876 | |
| Class C | | | 6 | |
| Transfer agent fees | | | 367,916 | |
| Legal fees | | | 284,961 | |
| Administrative services fees | | | 276,022 | |
| Trustees fees and expenses | | | 38,350 | |
| Compliance officer fees | | | 38,018 | |
| Printing and postage expenses | | | 35,991 | |
| Audit and tax fees | | | 20,463 | |
| Insurance fees | | | 15,148 | |
| Other expenses | | | 23,853 | |
| TOTAL EXPENSES | | | 3,867,823 | |
| | | | | |
| NET INVESTMENT INCOME | | | 3,825,335 | |
| | | | | |
| NET REALIZED AND UNREALIZED GAIN ON INVESTMENTS | | | | |
| Net realized gain on: | | | | |
| Investments | | | 18,380,085 | |
| | | | | |
| Net change in unrealized appreciation on: | | | | |
| Investments | | | 10,026,363 | |
| | | | | |
| NET REALIZED AND UNREALIZED GAIN ON INVESTMENTS | | | 28,406,448 | |
| | | | | |
| NET INCREASE IN NET ASSETS RESULTING FROM OPERATIONS | | $ | 32,231,783 | |
See accompanying notes to financial statements.
DGI Balanced Fund
STATEMENTS OF CHANGES IN NET ASSETS
| | | Year Ended
June 30,
2024* | | | Year Ended
June 30,
2023 | |
| FROM OPERATIONS | | | | | | | | |
| Net investment income | | $ | 3,825,335 | | | $ | 4,908,370 | |
| Net realized gain from investments | | | 18,380,085 | | | | - | |
| Net change in unrealized appreciation/(depreciation) on investments | | | 10,026,363 | | | | (1,504,349 | ) |
| Net increase in net assets resulting from operations | | | 32,231,783 | | | | 3,404,021 | |
| | | | | | | | | |
| DISTRIBUTIONS | | | | | | | | |
| Distributions to shareholders | | | | | | | | |
| Class P Shares | | | (2,906,951 | ) | | | (2,259,828 | ) |
| Class T Shares | | | (1,547,269 | ) | | | (1,214,725 | ) |
| Class NT Shares | | | (293,916 | ) | | | (235,855 | ) |
| Total distributions to shareholders | | | (4,748,136 | ) | | | (3,710,408 | ) |
| | | | | | | | | |
| FROM SHARES OF BENEFICIAL INTEREST | | | | | | | | |
| Proceeds from shares sold: | | | | | | | | |
| Class A Shares | | | 1,731,443 | | | | - | |
| Class C Shares | | | 1,000 | | | | - | |
| Class I Shares | | | 1,000 | | | | - | |
| Class P Shares | | | 5,953,815 | | | | 6,107,787 | |
| Class T Shares | | | 201,208 | | | | 311,471 | |
| Class NT Shares | | | 42,365 | | | | 51,152 | |
| Net asset value of shares issued in reinvestment of distributions: | | | | | | | | |
| Class T Shares | | | 2,869,494 | | | | 1,656,916 | |
| Payments for shares redeemed: | | | | | | | | |
| Class A Shares | | | (516,461 | ) | | | - | |
| Class P Shares | | | (21,068,450 | ) | | | (24,565,890 | ) |
| Class T Shares | | | (11,626,380 | ) | | | (12,669,645 | ) |
| Class NT Shares | | | (2,617,360 | ) | | | (2,380,849 | ) |
| Net decrease in net assets from shares of beneficial interest | | | (25,028,326 | ) | | | (31,489,058 | ) |
| | | | | | | | | |
| TOTAL INCREASE/(DECREASE) IN NET ASSETS | | | 2,455,321 | | | | (31,795,445 | ) |
| | | | | | | | | |
| NET ASSETS | | | | | | | | |
| Beginning of year | | | 299,111,449 | | | | 330,906,894 | |
| End of year | | $ | 301,566,770 | | | $ | 299,111,449 | |
| * | Class A, Class C, and Class I shares commenced investment operations on December 6, 2023. |
See accompanying notes to financial statements.
DGI Balanced Fund
STATEMENTS OF CHANGES IN NET ASSETS (Continued)
| | | Year Ended
June 30,
2024* | | | Year Ended
June 30,
2023 | |
| SHARE ACTIVITY | | | | | | | | |
| Class A Shares: | | | | | | | | |
| Shares Sold | | | 155,793 | | | | - | |
| Shares Redeemed | | | (45,979 | ) | | | - | |
| Net increase in shares of beneficial interest outstanding | | | 109,814 | | | | - | |
| | | | | | | | | |
| Class C Shares: | | | | | | | | |
| Shares Sold | | | 96 | | | | - | |
| Net increase in shares of beneficial interest outstanding | | | 96 | | | | - | |
| | | | | | | | | |
| Class I Shares: | | | | | | | | |
| Shares Sold | | | 96 | | | | - | |
| Net increase in shares of beneficial interest outstanding | | | 96 | | | | - | |
| | | | | | | | | |
| Class P Shares: | | | | | | | | |
| Shares Sold | | | 546,514 | | | | 602,763 | |
| Shares Redeemed | | | (1,966,321 | ) | | | (2,421,930 | ) |
| Net decrease in shares of beneficial interest outstanding | | | (1,419,807 | ) | | | (1,819,167 | ) |
| | | | | | | | | |
| Class T Shares: | | | | | | | | |
| Shares Sold | | | 18,438 | | | | 31,046 | |
| Shares Reinvested | | | 297,049 | | | | 169,766 | |
| Shares Redeemed | | | (1,084,822 | ) | | | (1,247,203 | ) |
| Net decrease in shares of beneficial interest outstanding | | | (769,335 | ) | | | (1,046,391 | ) |
| | | | | | | | | |
| Class NT Shares: | | | | | | | | |
| Shares Sold | | | 3,865 | | | | 5,081 | |
| Shares Redeemed | | | (244,675 | ) | | | (233,502 | ) |
| Net decrease in shares of beneficial interest outstanding | | | (240,810 | ) | | | (228,421 | ) |
| * | Class A, Class C, and Class I shares commenced investment operations on December 6, 2023. |
See accompanying notes to financial statements.
DGI Balanced Fund
FINANCIAL HIGHLIGHTS
Per Share Data and Ratios for a Share of Beneficial Interest Outstanding Throughout the Period
| | | Class A Shares | |
| | | Period* Ended | |
| | | June 30, | |
| | | 2024 | |
| Net asset value, beginning of period | | $ | 10.46 | |
| | | | | |
| Activity from investment operations: | | | | |
| Net investment income (1,2) | | | 0.09 | |
| Net realized and unrealized gain/(loss) on investments | | | 0.76 | |
| Total from investment operations | | | 0.85 | |
| | | | | |
| Net asset value, end of period | | $ | 11.31 | |
| | | | | |
| Total return (3) | | | 8.13 | % |
| | | | | |
| Net assets, end of period (000’s) | | $ | 1,243 | |
| | | | | |
| Ratio of expenses to average net assets (4,5) | | | 1.55 | % |
| | | | | |
| Ratio of net investment income to average net assets (2,4,5) | | | 1.04 | % |
| | | | | |
| Portfolio Turnover Rate (6) | | | 4 | % |
| * | The DGI Balanced Fund Class A shares commenced operations on December 6, 2023. |
| (1) | Per share amounts calculated using the average shares method, which more appropriately presents the per share data for the period. |
| (2) | Recognition of net investment income by the Fund is affected by the timing of the declaration of dividends by the underlying investment companies in which the Fund invests. |
| (3) | Total returns are historical and assume changes in share price and reinvestment of dividends, if any. Total returns for periods of less than one year are not annualized. |
| (4) | Does not include the expenses of other investment companies in which the Fund invests, if any. |
| (5) | Annualized. |
| (6) | Not Annualized. |
See accompanying notes to financial statements.
DGI Balanced Fund
FINANCIAL HIGHLIGHTS
Per Share Data and Ratios for a Share of Beneficial Interest Outstanding Throughout the Period
| | | Class C Shares | |
| | | Period* Ended | |
| | | June 30, | |
| | | 2024 | |
| Net asset value, beginning of period | | $ | 10.46 | |
| | | | | |
| Activity from investment operations: | | | | |
| Net investment income (1,2) | | | 0.03 | |
| Net realized and unrealized gain/(loss) on investments | | | 0.78 | |
| Total from investment operations | | | 0.81 | |
| | | | | |
| Net asset value, end of period | | $ | 11.27 | |
| | | | | |
| Total return (3) | | | 7.74 | % |
| | | | | |
| Net assets, end of period (4) | | $ | 1,077 | |
| | | | | |
| Ratio of expenses to average net assets (5,6) | | | 2.30 | % |
| | | | | |
| Ratio of net investment income to average net assets (2,5,6) | | | 0.29 | % |
| | | | | |
| Portfolio Turnover Rate (7) | | | 4 | % |
| * | The DGI Balanced Fund Class C shares commenced operations on December 6, 2023. |
| (1) | Per share amounts calculated using the average shares method, which more appropriately presents the per share data for the period. |
| (2) | Recognition of net investment income by the Fund is affected by the timing of the declaration of dividends by the underlying investment companies in which the Fund invests. |
| (3) | Total returns are historical and assume changes in share price and reinvestment of dividends, if any. Total returns for periods of less than one year are not annualized. |
| (4) | Actual net asset amount |
| (5) | Does not include the expenses of other investment companies in which the Fund invests, if any. |
| (6) | Annualized. |
| (7) | Not Annualized. |
See accompanying notes to financial statements.
DGI Balanced Fund
FINANCIAL HIGHLIGHTS
Per Share Data and Ratios for a Share of Beneficial Interest Outstanding Throughout the Period
| | | Class I Shares | |
| | | Period* Ended | |
| | | June 30, | |
| | | 2024 | |
| Net asset value, beginning of period | | $ | 10.46 | |
| | | | | |
| Activity from investment operations: | | | | |
| Net investment income (1,2) | | | 0.10 | |
| Net realized and unrealized gain/(loss) on investments | | | 0.77 | |
| Total from investment operations | | | 0.87 | |
| | | | | |
| Net asset value, end of period | | $ | 11.33 | |
| | | | | |
| Total return (3) | | | 8.32 | % |
| | | | | |
| Net assets, end of period (4) | | $ | 1,084 | |
| | | | | |
| Ratio of expenses to average net assets (5,6) | | | 1.30 | % |
| | | | | |
| Ratio of net investment income to average net assets (2,5,6) | | | 1.29 | % |
| | | | | |
| Portfolio Turnover Rate (7) | | | 4 | % |
| * | The DGI Balanced Fund Class I shares commenced operations on December 6, 2023. |
| (1) | Per share amounts calculated using the average shares method, which more appropriately presents the per share data for the period. |
| (2) | Recognition of net investment income by the Fund is affected by the timing of the declaration of dividends by the underlying investment companies in which the Fund invests. |
| (3) | Total returns are historical and assume changes in share price and reinvestment of dividends, if any. Total returns for periods of less than one year are not annualized. |
| (4) | Actual net asset amount |
| (5) | Does not include the expenses of other investment companies in which the Fund invests, if any. |
| (6) | Annualized. |
| (7) | Not Annualized. |
See accompanying notes to financial statements.
DGI Balanced Fund
FINANCIAL HIGHLIGHTS
Per Share Data and Ratios for a Share of Beneficial Interest Outstanding Throughout each Year/Period
| | | Class P Shares | |
| | | Year Ended
June 30,
2024 | | | Year Ended
June 30,
2023 | | | Year Ended
June 30,
2022 | | | Period* Ended
June 30,
2021 | |
| Net asset value, beginning of year/period | | $ | 10.34 | | | $ | 10.33 | | | $ | 11.58 | | | $ | 11.53 | |
| | | | | | | | | | | | | | | | | |
| Activity from investment operations: | | | | | | | | | | | | | | | | |
| Net investment income (1,2) | | | 0.14 | | | | 0.16 | | | | 0.08 | | | | 0.03 | |
| Net realized and unrealized gain/(loss) on investments | | | 1.02 | | | | (0.03 | ) | | | (1.28 | ) | | | 0.02 | |
| Total from investment operations | | | 1.16 | | | | 0.13 | | | | (1.20 | ) | | | 0.05 | |
| | | | | | | | | | | | | | | | | |
| Distribution to Shareholders from Ordinary Income | | | (0.17 | ) | | | (0.12 | ) | | | (0.05 | ) | | | - | |
| Total distributions | | | (0.17 | ) | | | (0.12 | ) | | | (0.05 | ) | | | - | |
| | | | | | | | | | | | | | | | | |
| Net asset value, end of year/period | | $ | 11.33 | | | $ | 10.34 | | | $ | 10.33 | | | $ | 11.58 | |
| | | | | | | | | | | | | | | | | |
| Total return (3) | | | 11.48 | % | | | 1.32 | % | | | (10.45 | )% | | | 0.43 | % |
| | | | | | | | | | | | | | | | | |
| Net assets, end of year/period (000’s) | | $ | 183,886 | | | $ | 182,443 | | | $ | 201,136 | | | $ | 236,301 | |
| | | | | | | | | | | | | | | | | |
| Ratio of expenses to average net assets (4) | | | 1.30 | % | | | 1.31 | %(5) | | | 1.40 | % | | | 1.17 | %(6) |
| | | | | | | | | | | | | | | | | |
| Ratio of net investment income to average net assets (2,4) | | | 1.29 | % | | | 1.58 | % | | | 0.68 | % | | | 2.10 | %(6) |
| | | | | | | | | | | | | | | | | |
| Portfolio Turnover Rate | | | 4 | % | | | 2 | % | | | 3 | % | | | 0 | %(7) |
| * | The DGI Balanced Fund Class P shares commenced operations on May 23, 2021. |
| (1) | Per share amounts calculated using the average shares method, which more appropriately presents the per share data for the period. |
| (2) | Recognition of net investment income by the Fund is affected by the timing of the declaration of dividends by the underlying investment companies in which the Fund invests. |
| (3) | Total returns are historical and assume changes in share price and reinvestment of dividends, if any. Total returns for periods of less than one year are not annualized. |
| (4) | Does not include the expenses of other investment companies in which the Fund invests, if any. |
| (5) | Excludes the reversal of tax expenses accrued during the fiscal year ended June 30, 2022. Had this reversal been included, the ratio of expenses to average net assets would have been 1.16% for the fiscal year ended June 30, 2023. |
| (6) | Annualized. |
| (7) | Not Annualized. |
See accompanying notes to financial statements.
DGI Balanced Fund
FINANCIAL HIGHLIGHTS
Per Share Data and Ratios for a Share of Beneficial Interest Outstanding Throughout each Year/Period
| | | Class T Shares | |
| | | Year Ended
June 30,
2024 | | | Year Ended
June 30,
2023 | | | Year Ended
June 30,
2022 | | | Period* Ended
June 30,
2021 | |
| Net asset value, beginning of year/period | | $ | 10.34 | | | $ | 10.33 | | | $ | 11.58 | | | $ | 11.53 | |
| | | | | | | | | | | | | | | | | |
| Activity from investment operations: | | | | | | | | | | | | | | | | |
| Net investment income (1,2) | | | 0.14 | | | | 0.16 | | | | 0.08 | | | | 0.03 | |
| Net realized and unrealized gain/(loss) on investments | | | 1.02 | | | | (0.03 | ) | | | (1.28 | ) | | | 0.02 | |
| Total from investment operations | | | 1.16 | | | | 0.13 | | | | (1.20 | ) | | | 0.05 | |
| | | | | | | | | | | | | | | | | |
| Distribution to Shareholders from Ordinary Income | | | (0.17 | ) | | | (0.12 | ) | | | (0.05 | ) | | | - | |
| Total distributions | | | (0.17 | ) | | | (0.12 | ) | | | (0.05 | ) | | | - | |
| | | | | | | | | | | | | | | | | |
| Net asset value, end of year/period | | $ | 11.33 | | | $ | 10.34 | | | $ | 10.33 | | | $ | 11.58 | |
| | | | | | | | | | | | | | | | | |
| Total return (3) | | | 11.48 | % | | | 1.32 | % | | | (10.45 | )% | | | 0.43 | % |
| | | | | | | | | | | | | | | | | |
| Net assets, end of year/period (000’s) | | $ | 98,515 | | | $ | 97,828 | | | $ | 108,581 | | | $ | 130,443 | |
| | | | | | | | | | | | | | | | | |
| Ratio of expenses to average net assets (4) | | | 1.30 | % | | | 1.31 | %(5) | | | 1.40 | % | | | 1.17 | %(6) |
| | | | | | | | | | | | | | | | | |
| Ratio of net investment income to average net assets (2,4) | | | 1.29 | % | | | 1.58 | % | | | 0.68 | % | | | 2.10 | %(6) |
| | | | | | | | | | | | | | | | | |
| Portfolio Turnover Rate | | | 4 | % | | | 2 | % | | | 3 | % | | | 0 | %(7) |
| * | The DGI Balanced Fund Class T shares commenced operations on May 23, 2021. |
| (1) | Per share amounts calculated using the average shares method, which more appropriately presents the per share data for the period. |
| (2) | Recognition of net investment income by the Fund is affected by the timing of the declaration of dividends by the underlying investment companies in which the Fund invests. |
| (3) | Total returns are historical and assume changes in share price and reinvestment of dividends, if any. Total returns for periods of less than one year are not annualized. |
| (4) | Does not include the expenses of other investment companies in which the Fund invests, if any. |
| (5) | Excludes the reversal of tax expenses accrued during the fiscal year ended June 30, 2022. Had this reversal been included, the ratio of expenses to average net assets would have been 1.16% for the fiscal year ended June 30, 2023. |
| (6) | Annualized. |
| (7) | Not Annualized. |
See accompanying notes to financial statements.
DGI Balanced Fund
FINANCIAL HIGHLIGHTS
Per Share Data and Ratios for a Share of Beneficial Interest Outstanding Throughout each Year/Period
| | | Class NT Shares | |
| | | Year Ended
June 30,
2024 | | | Year Ended
June 30,
2023 | | | Year Ended
June 30,
2022 | | | Period* Ended
June 30,
2021 | |
| Net asset value, beginning of year/period | | $ | 10.34 | | | $ | 10.33 | | | $ | 11.58 | | | $ | 11.53 | |
| | | | | | | | | | | | | | | | | |
| Activity from investment operations: | | | | | | | | | | | | | | | | |
| Net investment income (1,2) | | | 0.14 | | | | 0.16 | | | | 0.08 | | | | 0.03 | |
| Net realized and unrealized gain/(loss) on investments | | | 1.02 | | | | (0.03 | ) | | | (1.28 | ) | | | 0.02 | |
| Total from investment operations | | | 1.16 | | | | 0.13 | | | | (1.20 | ) | | | 0.05 | |
| | | | | | | | | | | | | | | | | |
| Distribution to Shareholders from Ordinary Income | | | (0.17 | ) | | | (0.12 | ) | | | (0.05 | ) | | | - | |
| Total distributions | | | (0.17 | ) | | | (0.12 | ) | | | (0.05 | ) | | | - | |
| | | | | | | | | | | | | | | | | |
| Net asset value, end of year/period | | $ | 11.33 | | | $ | 10.34 | | | $ | 10.33 | | | $ | 11.58 | |
| | | | | | | | | | | | | | | | | |
| Total return (3) | | | 11.48 | % | | | 1.32 | % | | | (10.45 | )% | | | 0.43 | % |
| | | | | | | | | | | | | | | | | |
| Net assets, end of year/period (000’s) | | $ | 17,921 | | | $ | 18,840 | | | $ | 21,189 | | | $ | 25,386 | |
| | | | | | | | | | | | | | | | | |
| Ratio of expenses to average net assets (4) | | | 1.30 | % | | | 1.31 | %(5) | | | 1.40 | % | | | 1.17 | %(6) |
| | | | | | | | | | | | | | | | | |
| Ratio of net investment income to average net assets (2,4) | | | 1.29 | % | | | 1.58 | % | | | 0.68 | % | | | 2.10 | %(6) |
| | | | | | | | | | | | | | | | | |
| Portfolio Turnover Rate | | | 4 | % | | | 2 | % | | | 3 | % | | | 0 | %(7) |
| * | The DGI Balanced Fund Class NT shares commenced operations on May 23, 2021. |
| (1) | Per share amounts calculated using the average shares method, which more appropriately presents the per share data for the period. |
| (2) | Recognition of net investment income by the Fund is affected by the timing of the declaration of dividends by the underlying investment companies in which the Fund invests. |
| (3) | Total returns are historical and assume changes in share price and reinvestment of dividends, if any. Total returns for periods of less than one year are not annualized. |
| (4) | Does not include the expenses of other investment companies in which the Fund invests, if any. |
| (5) | Excludes the reversal of tax expenses accrued during the fiscal year ended June 30, 2022. Had this reversal been included, the ratio of expenses to average net assets would have been 1.16% for the fiscal year ended June 30, 2023. |
| (6) | Annualized. |
| (7) | Not Annualized. |
See accompanying notes to financial statements.
DGI Balanced Fund
NOTES TO FINANCIAL STATEMENTS
June 30, 2024
1. ORGANIZATION
The DGI Balanced Fund (the “Fund”) is a diversified series of shares of beneficial interest of DGI Investment Trust (the “Trust”), a collective investment trust formed and organized under the laws of the Commonwealth of Puerto Rico (the “Commonwealth” or “Puerto Rico”) pursuant to a certain Deed of Constitution of Trust, dated January 28, 2021, as amended and restated from time to time (the “Deed of Trust”), and is registered under the Investment Company Act of 1940, as amended (the “1940 Act”), as a diversified, open-end management investment company. The Fund offers Class A, Class C, Class I, Class P, Class T, and Class NT shares. The Fund commenced investment operations for Class P, Class T, and Class NT shares on May 23, 2021. Class A, Class C, and Class I shares commenced investment operations on December 6, 2023. The Fund’s investment objective is to seek long-term capital appreciation and current income. Investment in the Fund is intended for residents of Puerto Rico.
Class A shares are offered at net asset value plus a maximum sales charge of 3.50%. A contingent deferred sales charge (“CDSC”) of 1.00% is assessed on redemptions of Class C shares made within one year after a purchase of such shares. Each class of shares represents an interest in the same portfolio of investments of the Fund and are identical in all respects to each other class of the Fund, except as set forth in the Fund’s multiple class plan pursuant to Rule 18f-3 under the 1940 Act.
2. SIGNIFICANT ACCOUNTING POLICIES
The following is a summary of significant accounting policies followed by the Fund in preparation of its financial statements. The policies are in conformity with U.S. generally accepted accounting principles in the United States of America (“U.S. GAAP”). The preparation of the financial statements requires management to make estimates and assumptions that affect the reported amounts of assets and liabilities and disclosure of contingent assets and liabilities at the date of the financial statements and the reported amounts of income and expenses for the period. Actual results could differ from those estimates. The Fund is an investment company and accordingly follows the investment company accounting and reporting guidance of the Financial Accounting Standards Board (“FASB”) Accounting Standard Codification Topic 946 “Financial Services – Investment Companies”.
Securities Valuation – The Fund’s assets will be valued based upon market quotations when such quotations are available. A security listed or traded on any exchange in the United States will be valued at its last sales price on the principal exchange on which it is traded prior to the time the assets of the Fund are valued. If no sale is reported at that time or the security is traded in the over-the-counter (“OTC”) market, the most recent bid will be used for purposes of the valuation. Assets for which market quotations are not readily available will be valued at fair value as determined in good faith by the Fund’s investment adviser, pursuant to procedures approved by the Board of Trustees of the Trust (the “Board”). Debt securities (other than short-term obligations) are valued each day by an independent pricing service approved by the Board based on methods which include consideration of: yields or prices of securities of comparable quality, coupon, maturity and type, indications as to values from dealers, and general market conditions or market quotations from a major market maker in the securities. Investments valued in currencies other than the U.S. dollar are converted to U.S. dollars using exchange rates obtained from pricing services. Short-term debt obligations having 60 days or less remaining until maturity, at time of purchase, may be valued at amortized cost. These prices may change depending on market conditions.
Exchange Traded Funds – The Funds may invest in exchange traded funds (“ETFs”). ETFs are a type of index fund bought and sold on a securities exchange. An ETF trades like common stock and represents a fixed portfolio of securities designed to track the performance and dividend yield of a particular domestic or foreign market index. The Funds may purchase an ETF to temporarily gain exposure to a portion of the U.S. or a foreign market. The risks of owning an ETF generally reflect the risks of owning the underlying securities they are designed to track, although the lack of liquidity on an ETF could result in it being more volatile. Additionally, ETFs have fees and expenses that reduce their value.
The Fund utilizes various methods to measure the fair value of all of its investments on a recurring basis. GAAP establishes a hierarchy that prioritizes inputs to valuation methods. The three levels of input are:
Level 1 – Unadjusted quoted prices in active markets for identical assets and liabilities that the Fund has the ability to access.
DGI Balanced Fund
NOTES TO FINANCIAL STATEMENTS (Continued)
June 30, 2024
Level 2 – Observable inputs other than quoted prices included in Level 1 that are observable for the asset or liability, either directly or indirectly. These inputs may include quoted prices for the identical instrument in an inactive market, prices for similar instruments, interest rates, prepayment speeds, credit risk, yield curves, default rates and similar data.
Level 3 – Unobservable inputs for the asset or liability, to the extent relevant observable inputs are not available; representing the Fund’s own assumptions about the assumptions a market participant would use in valuing the asset or liability, and would be based on the best information available.
The availability of observable inputs can vary from security to security and is affected by a wide variety of factors, including, for example, the type of security, whether the security is new and not yet established in the marketplace, the liquidity of markets, and other characteristics particular to the security. To the extent that valuation is based on models or inputs that are less observable or unobservable in the market, the determination of fair value requires more judgment. Accordingly, the degree of judgment exercised in determining fair value is greatest for instruments categorized in Level 3.
The inputs used to measure fair value may fall into different levels of the fair value hierarchy. In such cases, for disclosure purposes, the level in the fair value hierarchy within which the fair value measurement falls in its entirety, is determined based on the lowest level input that is significant to the fair value measurement in its entirety.
The inputs or methodology used for valuing securities are not necessarily an indication of the risk associated with investing in those securities. The following tables summarize the inputs used as of June 30, 2024 for the Fund’s assets and liabilities measured at fair value:
DGI Balanced Fund
| Assets* | | Level 1 | | | Level 2 | | | Level 3 | | | Total | |
| Common Stock | | $ | 14,148,800 | | | $ | - | | | $ | - | | | $ | 14,148,800 | |
| Exchange Traded Funds | | | 141,704,747 | | | | - | | | | - | | | | 141,704,747 | |
| Collateralized Mortgage Obligations | | | - | | | | 64,572 | | | | - | | | | 64,572 | |
| U.S. Government & Agencies | | | - | | | | 115,105,108 | | | | - | | | | 115,105,108 | |
| Money Market Fund | | | 28,888,251 | | | | - | | | | - | | | | 28,888,251 | |
| Total | | $ | 184,741,798 | | | $ | 115,169,680 | | | $ | - | | | $ | 299,911,478 | |
| * | Refer to the Schedule of Investments for classification. |
The Funds did not hold any Level 3 securities during the period.
Security Transactions and Investment Income – Security transactions are accounted for on a trade date basis. Interest income is recognized on an accrual basis. Discounts are accreted and premiums are amortized on securities purchased over the lives of the respective securities using the effective interest method. Dividend income is recorded on the ex-dividend date. Withholding taxes on foreign dividends have been provided for in accordance with the Fund’s understanding of the applicable country’s tax rules and rates. The Fund files for tax reclaims for the refund of such withholding taxes according to tax treaties. Tax reclaims that are deemed collectible are booked as tax reclaim receivable on the Statement of Assets and Liabilities. Realized gains or losses from sales of securities are determined by comparing the identified cost of the security lot sold with the net sales proceeds.
Dividends and Distributions – The Fund expects to declare and distribute all of its net investment income, if any, to shareholders as dividends at least annually. The amount of any distribution will vary, and there is no guarantee the Fund will pay either an income dividend or a capital gains distribution. Distributions will be reinvested in shares of the Fund, unless otherwise directed by the shareholder. Generally, distributions within taxable accounts are taxable events for shareholders whether the distributions are received in cash or reinvested.
DGI Balanced Fund
NOTES TO FINANCIAL STATEMENTS (Continued)
June 30, 2024
Dividends consisting of Ordinary Dividends to individual shareholders will be distributed net of the 15% tax imposed by the Puerto Rico Internal Revenue Code of 2011, as amended (the “PR Code”), which will be automatically withheld at source by the Fund. All dividend distributions by the Fund to a tax advantaged account, such as a Puerto Rico tax-qualified retirement plan or IRA account, will be made on a gross basis, without any tax withholding, and will be reinvested automatically in shares of the Fund. Such distributions may be taxed as ordinary income when withdrawn from the tax-advantaged account.
In general, the Fund’s distributions will be subject to Puerto Rico income taxes as dividend income, capital gains, or some combination of both, unless you are investing through a tax advantaged arrangement, such as a Puerto Rico tax-qualified retirement plan or an IRA, in which case your distributions may be taxed as ordinary income when withdrawn from the tax-advantaged account. Such distributions will also be subject to U.S federal income taxes and the passive foreign investment company (“PFIC”) rules if received by a U.S. person not residing in Puerto Rico. Distributions to residents of Puerto Rico who own, directly or indirectly, less than 10% of the total shares of the Fund will not be subject to U.S. federal income taxes on dividends received from the Fund.
Taxation – The Fund recognizes the tax benefits of uncertain tax positions only where the position is more likely than not to be sustained on its merits in examination by the tax authorities. Management has analyzed the Fund’s tax positions, and has concluded that no liability should be recorded related to uncertain tax positions taken on returns filed for open tax years. As of June 30, 2024, there were no uncertain tax positions for the Fund or unrecognized tax benefits. The Fund remains subject to income tax examinations for its PR income taxes filed for the fiscal years 2021 to 2023, or expected to be filed in 2024. The Fund recognizes interest and penalties, if any, on the Statement of Operations. For the year ended June 30, 2024, the Fund did not incur any interest or penalties.
Cash – The Fund considers its investment in an FDIC insured interest bearing savings account to be cash. The Fund maintains cash balances, which, at times, may exceed federally insured limits. The Fund maintains these balances with a high-quality financial institution.
Net Asset Value – The net asset value per share of the Fund is determined as of the close of regular trading on each day that the New York Stock Exchange is open for business by adding the assets value of all securities and other assets of the Fund, then subtracting its liabilities, and then dividing the result by the total number of shares outstanding.
Indemnification – The Fund indemnifies its officers and Trustees for certain liabilities that may arise from the performance of their duties to the Fund. Additionally, in the normal course of business, the Fund enters into contracts that contain a variety of representations and warranties and which provide general indemnities. The Fund’s maximum exposure under these arrangements is unknown, as this would involve future claims that may be made against the Fund that have not yet occurred. However, based on experience, the risk of loss due to these warranties and indemnities appears to be remote.
3. INVESTMENT TRANSACTIONS AND ASSOCIATED RISKS
For the year ended June 30, 2024, the aggregate purchases and sales of investments (excluding U.S. Government securities and short-term investments) were $10,179,507 and $32,835,713 respectively. For the year ended June 30, 2024, the aggregate purchases and sales of U.S. Government securities were $991,563 and $12,615,204, respectively.
The Fund is subject to the risks of investing in equity securities. Equity securities are subject to changes in value, and their values may be more volatile than other asset classes, as a result of such factors as a company’s business performance, investor perceptions, stock market trends and general economic conditions. The Fund may invest in smaller companies, which may be subject to more abrupt or erratic market movements than stocks of larger, more established companies. The Fund may also invest in large-cap stocks, which as a group could fall out of favor with the market, causing the Fund to underperform investments that focus solely on small- or medium-capitalization stocks. Large cap companies may trail the returns of the overall stock market. The Fund may also invest in investment companies and exchange-traded funds (“ETFs”), which may not achieve their investment objectives or execute their investment strategies effectively, or a large purchase or redemption activity by shareholders might negatively affect the value of the shares.
DGI Balanced Fund
NOTES TO FINANCIAL STATEMENTS (Continued)
June 30, 2024
The Fund may also invest in mortgage- and asset-backed securities, which are subject to credit and interest rate risks, as well as extension and prepayment risks. Rising interest rates tend to extend the duration of mortgage-related securities, making them more sensitive to changes in interest rates. As a result, in a period of rising interest rates, if the Fund holds mortgage-related securities, it may exhibit additional volatility. When interest rates decline, the value of mortgage-related securities with prepayment features may not increase as much as other fixed-income securities because borrowers may pay off their mortgages sooner than expected. Moreover, to the extent the Fund invests in FHA/VA Mortgage Securities, the yield of the shares will depend in some part on the rate at which principal payments are made on such securities, which in turn will depend on the rate at which principal prepayments are made on the underlying mortgage loans. These securities also are subject to risk of default on the underlying mortgage or asset, particularly during periods of economic downturn. Small movements in interest rates (both increases and decreases) may quickly and significantly reduce the value of certain mortgage-backed securities.
The Fund may also invest in debt securities, which are subject to similar risks. For instance, increases in the federal funds rate may expose fixed-income and related markets to heightened volatility and may reduce liquidity for certain Fund investments, which could cause the value of the Fund’s investments and share price to decline. The Fund may invest in corporate debt securities, which are subject to the risk of the issuer’s inability to meet principal and interest payments on the obligations and may also be subject to price volatility due to factors such as market interest rates, market perception of the creditworthiness of the issuer and general market liquidity. The market value of a debt security generally reacts inversely to interest rate changes. Furthermore, issuers of fixed-income securities could default or be downgraded if they fail to make required payments of principal or interest. The Fund only invests in investment grade securities; however, the Fund will not be required to dispose of a debt that has its rating downgraded subsequent to the Fund’s purchase.
The Fund may invest in U.S. government obligations, which have different levels of credit support and, therefore, different degrees of credit risk. The U.S. government does not guarantee the market value of the securities it issues, so those values may fluctuate. In addition, the payment obligations on certain securities in which the Fund may invest, including securities issued by certain U.S. Government agencies and U.S. Government sponsored enterprises, are not guaranteed by the U.S. Government or supported by the full faith and credit of the United States.
To the extent that the Fund invests a significant portion of its assets in the Commonwealth of Puerto Rico (the “Puerto Rico”), the Fund is more susceptible to factors adversely affecting Puerto Rico. Puerto Rico’s economy suffered a severe and prolonged recession from 2007 to 2017, with real gross national product contracting approximately 15% during this period. Since 2017, Puerto Rico and several of its instrumentalities have entered debt-restructuring proceedings under Titles III and VI of the Puerto Rico Oversight, Management & Economic Stability Act (“PROMESA”). However, Puerto Rico has begun to implement the plan of adjustment approved on January 18, 2022 in the court-supervised debt-restructuring process under Title III of PROMESA, setting the stage for its exit from bankruptcy. Puerto Rico is also susceptible to hurricanes, major storms and earthquakes that affect the local economy and its population has declined over the past decade. Therefore, any factors affecting Puerto Rico will have a greater effect on the Fund’s performance than they would in a more geographically diversified fund.
Overall, the value of stocks and other securities can be highly volatile, and prices may fluctuate widely, which means you should expect a wide range of returns and could lose money, even over a long time period. Various economic, industry, regulatory, political, or other factors (such as natural disasters, epidemics and pandemics, war, terrorism, conflicts or social unrest) may disrupt U.S. and world economies and can dramatically affect markets generally, certain industry sectors, and/or individual companies.
4. INVESTMENT ADVISORY AGREEMENT AND TRANSACTION WITH RELATED PARTIES
Oriental Trust (the “Adviser”), a separately identifiable division of Oriental Bank, acts as investment adviser to the Fund under an investment advisory agreement (the “Advisory Agreement”) with the Fund. Under the Advisory Agreement, the Fund pays to the Adviser a monthly advisory fee at an annual rate of 0.93% of its average daily net assets. Pursuant to the advisory agreement, the Fund incurred $2,766,219 in advisory fees for the year ended June 30, 2024.
Effective June 30, 2023, Northern Lights Distributors, LLC, (the “Distributor”) is the distributor for the Fund. Prior to June 30, 2023, the distributor of the Fund was Oriental Financial Services LLC.
DGI Balanced Fund
NOTES TO FINANCIAL STATEMENTS (Continued)
June 30, 2024
Pursuant to a separate servicing agreement with Ultimus Fund Solutions, LLC (“UFS”), an affiliate of the Distributor, the Fund pays UFS fees for providing administration, fund accounting and transfer agency services to the Fund. Certain officers of the Trust are also officers of UFS, and are not paid any fees directly by the Fund for serving in such capacities.
The Trust has adopted a Distribution Plan (the “Plan”) pursuant to Rule 12b- 1 under the 1940 Act. The Plan provides that a monthly service and/or distribution fee is calculated by the Fund at an annual rate of 0.25% of its average daily net assets for Class A shares and 1.00% of its average daily net assets for Class C shares and is paid to the Distributor to provide compensation for ongoing shareholder servicing and distribution-related activities or services and/or maintenance of the Fund’s shareholder accounts not otherwise required to be provided by the Advisor. For the year ended June 30, 2024, $876 and $6 of 12b-1 fees were accrued for Class A shares and Class C shares, respectively.
The Distributor acts as the Fund’s principal underwriter in a continuous public offering of the Fund’s Class A, Class C, and Class I shares. For the year ended June 30, 2024, the Distributor received $38,125 and $20 in underwriting commissions for sales of Class A shares and Class C shares, respectively, of which $0 and $0 was retained by the principal underwriter for Class A shares and Class C shares, respectively.
In addition, certain affiliates of UFS provide ancillary services to the Fund as follows:
Northern Lights Compliance Services, LLC (“NLCS”), an affiliate of the Distributor and UFS, provides a Chief Compliance Officer to the Trust, as well as related compliance services, pursuant to a consulting agreement between NLCS and the Trust. Under the terms of such agreement, NLCS receives fees from the Fund.
Blu Giant, LLC (“Blu Giant”), an affiliate of the Distributor and UFS, provides EDGAR conversion and filing services as well as print management services for the Fund on an ad-hoc basis. For the provision of these services, Blu Giant receives fees from the Fund.
Certain officers and directors of the Fund are also officers and directors of the Adviser. The Fund also has three independent directors, who are paid based upon fees per meeting and disclosed in the Prospectus. For the year ended June 30, 2024, the independent directors received $32,724 in fees.
5. TAX INFORMATION
The Fund is intended solely for residents of Puerto Rico. The Fund will be treated as a registered investment company under the PR Code. As such, the Fund will be exempt from Puerto Rico income tax for a taxable year if it distributes to its shareholders at least 90% of its net income for the taxable year within the time period provided by the PR Code.
The Fund did not distribute 90% of its income to shareholders for the taxable year June 30, 2021 and therefore recorded a tax expense of $445,825 during the fiscal year ended June 30, 2022. During the fiscal year ended June 30, 2023, it was determined that the Fund was not responsible for this tax expense and the accrual was reversed.
The Fund will be treated as a PFIC under the United States Internal Revenue Code of 1986, as amended (the “US Code”). As such, the Fund will not qualify as a regulated investment company under Subchapter M of the US Code and will be treated as a non-U.S. corporation whose only business activity in the United States is trading in stocks or securities for its own account; which, under the US Code, does not constitute engaging in the conduct of a trade or business within the United States, even if its principal office is located therein. As a result, the Fund will be subject to U.S. federal income tax withholding only with respect to certain types of income from United States sources considered fixed, determinable, annual and periodic income (such as dividends and interest paid by U.S. payors).
In general, the Fund’s distributions will be subject to Puerto Rico income taxes as dividend income, capital gains, or some combination of both, unless you are investing through a tax-advantaged arrangement, such as a Puerto Rico tax-qualified retirement plan or an IRA, in which case your distributions may be taxed as ordinary income when withdrawn from the tax-advantaged account. Such distributions will also be subject to U.S federal income taxes and the PFIC rules if received by a U.S. person not residing in Puerto Rico. Distributions to residents of Puerto Rico who own, directly or indirectly, less than 10% of the total shares of the Fund will not be subject to U.S. federal income taxes.
DGI Balanced Fund
NOTES TO FINANCIAL STATEMENTS (Continued)
June 30, 2024
6. TAX COMPONENTS OF CAPITAL
The tax attributes of distributions paid during the fiscal years ended June 30, 2024 and June 30, 2023, were as follows:
| | | Fiscal Year Ended
June 30,
2024 | | | Fiscal Year Ended
June 30,
2023 | |
| Ordinary Income | | $ | 4,748,136 | | | $ | 3,710,408 | |
| Long-Term Capital Gain | | | - | | | | - | |
| Return of Capital | | | - | | | | - | |
| Total | | $ | 4,748,136 | | | $ | 3,710,408 | |
The Fund’s net investment income and net realized gain (loss) on investments reflected in the financial statements differ from distributable net investment income and net realized gain (loss) on investments for tax purposes. Permanent book and tax differences are primarily attributable to the tax adjustments for paydowns from mortgage-backed securities, as follows:
| | | 2024 | |
| Net investment income per statement of operations | | $ | 3,825,335 | |
| Reclassification of realized loss on securities’ paydown for tax purposes | | | 209,231 | |
| Distributable net investment income for tax purposes | | $ | 4,034,566 | |
| Net realized gain (loss) on investments per statement of operations | | $ | 18,380,085 | |
| Reclassification of realized loss on securities’ paydown for tax purposes | | | (209,231 | ) |
| Net realized loss on investments for tax purposes | | $ | 18,170,854 | |
The undistributed net investment income and accumulated net realized loss on investments (tax basis) at June 30, 2024, was as follows:
| | | 2024 | |
| Undistributed net investment income, beginning of the year | | $ | 2,575,613 | |
| Net investment income for the year | | | 4,034,566 | |
| Distributions | | | (4,748,136 | ) |
| Undistributed net investment income, end of the year | | $ | 1,862,043 | |
| Accumulated net realized loss on investments, beginning of the year | | $ | (1,052,402 | ) |
| Net realized loss on investments for the year, tax basis | | | 18,170,854 | |
| Distributions | | | - | |
| Undistributed realized gain, end of the year, tax basis | | $ | 17,118,452 | |
7. CONTROL OWNERSHIP
The beneficial ownership, either directly or indirectly, of more than 25% of the voting securities of the Fund creates presumption of control of the Fund, under Section 2(a) 9 of the 1940 Act. As of June 30, 2024, Pershing, holding shares for the benefit of others in nominee name, held approximately 99.6% of the voting securities of the Fund.
8. SUBSEQUENT EVENTS
Subsequent events after the date of the Statement of Assets and Liabilities have been evaluated through the date the financial statements were issued. Management has determined that no events or transactions occurred requiring adjustment or disclosure in the financial statements.

REPORT OF INDEPENDENT REGISTERED PUBLIC ACCOUNTING FIRM
To the Shareholders of DGI Balanced Fund and
Board of Trustees of DGI Investment Trust
Opinion on the Financial Statements
We have audited the accompanying statement of assets and liabilities, including the schedule of investments, of DGI Balanced Fund, a series of shares of beneficial interest in DGI Investment Trust (the “Fund”) as of June 30, 2024, the related statement of operations for the year then ended, the statements of changes in net assets and financial highlights for each of the years in the two year period then ended, and the related notes, (collectively referred to as the “financial statements”). In our opinion, the financial statements present fairly, in all material respects, the financial position of the Fund as of June 30, 2024, the results of its operations for the year then ended, and the changes in net assets and the financial highlights for each of the years in the two year period then ended, in conformity with accounting principles generally accepted in the United States of America.
The Fund’s financial highlights for the period ended June 30, 2022, and prior, were audited by other auditors whose report dated August 29, 2022, expressed an unqualified opinion on those financial highlights.
Basis for Opinion
These financial statements are the responsibility of the Fund’s management. Our responsibility is to express an opinion on the Fund’s financial statements based on our audits. We are a public accounting firm registered with the Public Company Accounting Oversight Board (United States) (“PCAOB”) and are required to be independent with respect to the Fund in accordance with the U.S. federal securities laws and the applicable rules and regulations of the Securities and Exchange Commission and the PCAOB.
We conducted our audits in accordance with the standards of the PCAOB. Those standards require that we plan and perform the audits to obtain reasonable assurance about whether the financial statements are free of material misstatement whether due to error or fraud.
Our audits included performing procedures to assess the risks of material misstatement of the financial statements, whether due to error or fraud, and performing procedures that respond to those risks. Such procedures included examining, on a test basis, evidence regarding the amounts and disclosures in the financial statements. Our procedures included confirmation of securities owned as of June 30, 2024, by correspondence with the custodian. Our audits also included evaluating the accounting principles used and significant estimates made by management, as well as evaluating the overall presentation of the financial statements. We believe that our audits provide a reasonable basis for our opinion.
We have served as the Fund’s auditor since 2023.

COHEN & COMPANY, LTD.
Philadelphia, Pennsylvania
August 29, 2024
COHEN & COMPANY, LTD.
800.229.1099 | 866.818.4538 fax | cohencpa.com
Registered with the Public Company Accounting Oversight Board
PROXY VOTING POLICY
Information regarding how the Fund voted proxies relating to portfolio securities for the most recent twelve month period ended June 30 as well as a description of the policies and procedures that the Fund uses to determine how to vote proxies is available without charge, upon request, by calling (787) 620-0000 or by referring to the Securities and Exchange Commission’s (“SEC”) website at http://www.sec.gov.
PORTFOLIO HOLDINGS
The Fund files its complete schedule of portfolio holdings with the SEC for the first and third quarters of each fiscal year as an exhibit to Form N-PORT. Form N-PORT are available on the SEC’s website at http://www.sec.gov. The information on Form N-PORT is available without charge, upon request, by calling (787) 620-0000.
INVESTMENT ADVISER
Oriental Trust
254 Munoz Rivera Avenue, 10th Floor
San Juan, Puerto Rico 00918
ADMINISTRATOR
Ultimus Fund Solutions, LLC
225 Pictoria Drive, Suite 450
Cincinnati, OH 45246
Item 8. Changes in and Disagreements with Accountants for Open-End Management Investment Companies.
Not applicable
Item 9. Proxy Disclosures for Open-End Management Investment Companies.
Not applicable
Item 10. Remuneration Paid to Directors, Officers, and Others of Open-End Management Investment Companies.
Included under Item 7
Item 11. Statement Regarding Basis for Approval of Investment Advisory Contract.
Not applicable
Item 12. Disclosure of Proxy Voting Policies and Procedures for Closed-End Management Investment Companies.
Not applicable
Item 13. Portfolio Managers of Closed-End Management Investment Companies.
Not applicable
Item 14. Purchases of Equity Securities by Closed-End Management Investment Company and Affiliated Purchasers.
Not applicable
Item 15. Submission of Matters to a Vote of Security Holders.
None
Item 16. Controls and Procedures.
| (a) | The registrant’s Principal Executive Officer and Principal Financial Officer have concluded that the registrant’s disclosure controls and procedures (as defined in Rule 30a-3(c) under the Act) are effective in design and operation and are sufficient to form the basis of the certifications required by Rule 30a-(2) under the Act, based on their evaluation of these disclosure controls and procedures as of a date within 90 days of this report on Form N-CSR. |
| (b) | There were no changes in the registrant’s internal control over financial reporting (as defined in Rule 30a-3(d) under the Act) during the period covered by this report that have materially affected, or are reasonably likely to materially affect, the registrant’s internal control over financial reporting. |
Item 17. Disclosure of Securities Lending Activities for Closed-End Management Investment Companies.
Not applicable
Item 18. Recovery of Erroneously Awarded Compensation.
Item 19. Exhibits.
| (a)(3) | A separate certification for each principal executive officer and principal financial officer of the registrant as required by Rule 30a-2(a) under the Act (17 CFR 270.30a-2(a)): Attached hereto. |
| (b) | Certifications required by Rule 30a-2(b) under the Act (17 CFR 270.30a-2(b)): Attached hereto |
SIGNATURES
Pursuant to the requirements of the Securities Exchange Act of 1934 and the Investment Company Act of 1940, the registrant has duly caused this report to be signed on its behalf by the undersigned, thereunto duly authorized.
| (Registrant) | DGI Investment Trust | |
By (Signature and Title)
Ramon Rosado-Linera, Principal Executive Officer/President
Pursuant to the requirements of the Securities Exchange Act of 1934 and the Investment Company Act of 1940, this report has been signed below by the following persons on behalf of the registrant and in the capacities and on the dates indicated.
By (Signature and Title)
Ramon Rosado-Linera, Principal Executive Officer/President
By (Signature and Title)
| /s/ Maritza Arizmendi Diaz | |
Maritza Arizmendi Diaz, Principal Financial Officer/Treasurer