UNITED STATES
SECURITIES AND EXCHANGE COMMISSION
Washington, D.C. 20549
FORM N-CSR
CERTIFIED SHAREHOLDER REPORT OF REGISTERED
MANAGEMENT INVESTMENT COMPANIES
Investment Company Act file number 811-23710
Milliman Variable Insurance Trust
(Exact name of registrant as specified in charter)
71 South Wacker Drive, 31st Floor
Chicago, IL 60606
(Address of principal executive offices) (Zip code)
Ehsan Sheikh
71 South Wacker Drive, 31st Floor
Chicago, IL 60606
(Name and address of agent for service)
(312) 726-0677
Registrant’s telephone number, including area code
Date of fiscal year end: December 31, 2024
Date of reporting period: December 31, 2024
Item 1. Reports to Stockholders.
| | |
| Milliman - Capital Group Hedged U.S. Growth Fund | |
Class 3true |
| Annual Shareholder Report | December 31, 2024 |
This annual shareholder report contains important information about the Milliman - Capital Group Hedged U.S. Growth Fund for the period of January 1, 2024, to December 31, 2024. You can find additional information about the Fund at https://millimanfunds.com/capgroup/resources. You can also request this information by contacting us at 1-855-700-7959.
WHAT WERE THE FUND COSTS FOR THE PAST YEAR? (based on a hypothetical $10,000 investment)
| | |
Class Name | Costs of a $10,000 investment | Costs paid as a percentage of a $10,000 investment |
| Class 3 | $113 | 1.09% |
HOW DID THE FUND PERFORM LAST YEAR AND WHAT AFFECTED ITS PERFORMANCE?
The Milliman - Capital Group Hedged U.S. Growth Fund seeks to provide upside participation in the total return of a portfolio of growth-oriented equity securities selected by Capital Group while protecting against equity security price losses within the -5% to -20% range.
For the year ending December 31, 2024, the Milliman Capital Group Hedged U.S. Growth Fund returned 8.05% v.s. the benchmark (S&P 500 Price Index) return of 23.31%. The Fund achieved reduced volatility and reduced losses throughout the year. The ratio of Fund-to-Benchmark volatility was 67%, while that of the maximum peak-to-trough drawdown was 57%. Sizeable positions in Boardcom Inc. and NVIDIA Corp. were top contributors to the performance. Positions in the healthcare sector such as Regeneron Pharmaceuticals, Inc. and Biomarin Pharmaceutical, Inc. were top detractors from the performance. The option overlay detracted from the performance of the fund, specifically in Q1 and Q4, following strong rallies in domestic equities.
| |
Top Contributors |
| ↑ | Broadcom, Inc. |
| ↑ | NVIDIA Corp. |
| ↑ | Amazon.com, Inc. |
| ↑ | Meta Platforms, Inc. - Class A |
| ↑ | Alphabet, Inc. - Class C |
| |
Top Detractors |
| ↓ | Option Overlay |
| ↓ | Regeneron Pharmaceuticals, Inc. |
| ↓ | Biomarin Pharmaceutical, Inc. |
| ↓ | Dollar Tree, Inc. |
| ↓ | Caesars Entertainment, Inc. |
HOW DID THE FUND PERFORM SINCE INCEPTION?*
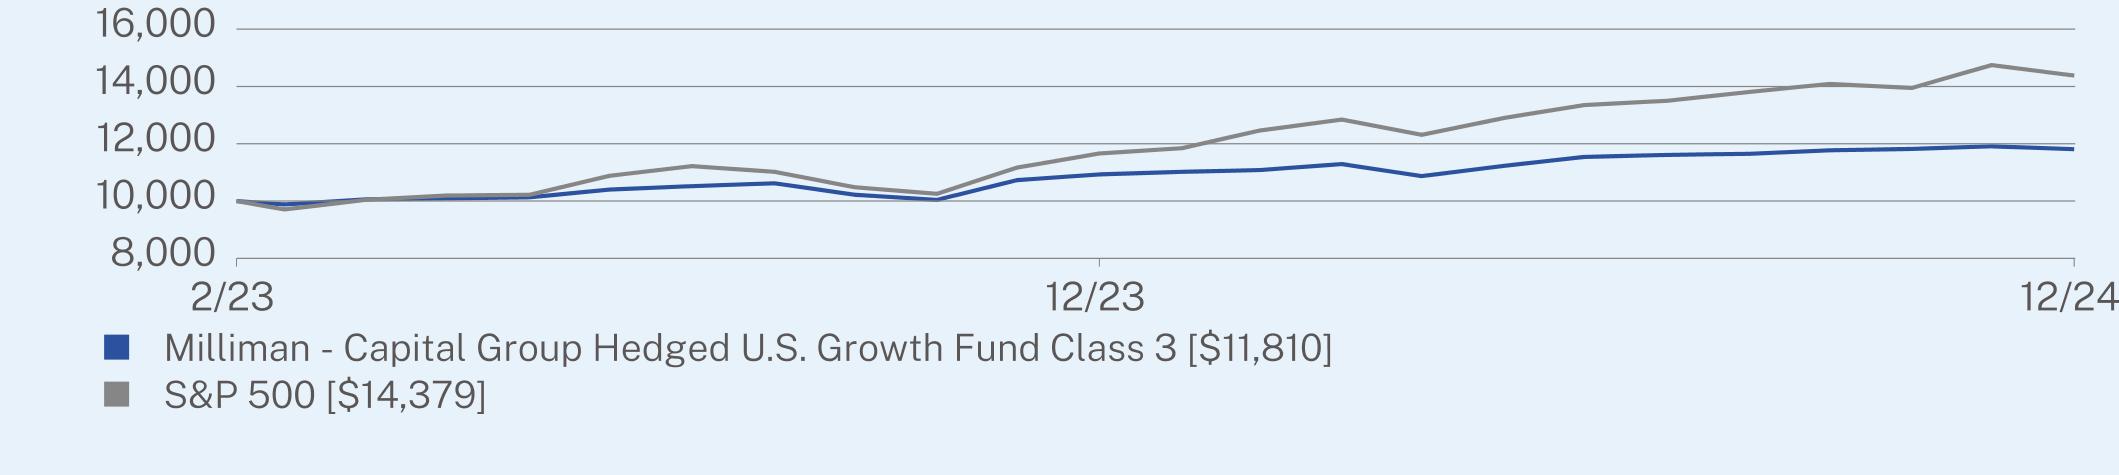
The $10,000 chart reflects a hypothetical $10,000 investment in the class of shares noted. The chart uses total return performance and assumes reinvestment of dividends and capital gains. Fund expenses, including 12b-1 fees, management fees and other expenses were deducted.
| Milliman - Capital Group Hedged U.S. Growth Fund | PAGE 1 | TSR-AR-600833719 |
CUMULATIVE PERFORMANCE (Initial Investment of $10,000)
ANNUAL AVERAGE TOTAL RETURN (%)
| | |
| | 1 Year | Since Inception
(02/10/2023) |
Class 3 (without sales charge) | 8.05 | 9.21 |
S&P 500 | 23.31 | 21.21 |
Visit https://millimanfunds.com/capgroup/resources for more recent performance information.
DISCLAIMER
The materials in this document represent the opinion of the authors at the time of authorship; they may change, and are not representative of the views of Milliman FRM or its parents, subsidiaries, or affiliates. Milliman FRM does not certify the information, nor does it guarantee the accuracy and completeness of such information. Use of such information is voluntary and should not be relied upon unless an independent review of its accuracy and completeness has been performed. Materials may not be reproduced without the express consent of Milliman FRM. Milliman Financial Risk Management LLC is an SEC-registered investment advisor and subsidiary of Milliman, Inc.
| * | The Fund’s past performance is not a good predictor of how the Fund will perform in the future.The graph and table do not reflect the deduction of taxes that a shareholder would pay on Fund distributions or redemption of Fund shares. |
KEY FUND STATISTICS (as of December 31, 2024)
| |
Net Assets | $3,544,414 |
Number of Holdings | 72 |
Net Advisory Fee | $0 |
Portfolio Turnover | 33% |
WHAT DID THE FUND INVEST IN? (as of December 31, 2024)*
| |
Top Sectors | (%) of net assets |
Information Technology | 29.2% |
Industrials | 16.0% |
Health Care | 15.7% |
Consumer Discretionary | 14.0% |
Communication Services | 13.2% |
Consumer Staples | 4.6% |
Financials | 4.5% |
Materials | 0.9% |
Energy | 0.7% |
Cash & Other | 1.2% |
| |
Top 10 Issuers | (%) of net assets |
Microsoft Corp. | 7.5% |
Broadcom, Inc. | 6.2% |
Alphabet, Inc. | 6.1% |
Amazon.com, Inc. | 5.8% |
Meta Platforms, Inc. | 4.2% |
Apple, Inc. | 4.1% |
TransDigm Group, Inc. | 4.1% |
Salesforce, Inc. | 3.5% |
NVIDIA Corp. | 2.6% |
Eli Lilly & Co. | 2.4% |
| * | The Global Industry Classification Standard (“GICS®”) was developed by and/or is the exclusive property of MSCI, Inc. (“MSCI”) and Standard & Poor’s Financial Services LLC (“S&P”). GICS® is a service mark of MSCI and S&P and has been licensed for use by U.S. Bank Global Fund Services. |
| Milliman - Capital Group Hedged U.S. Growth Fund | PAGE 2 | TSR-AR-600833719 |
For additional information about the Fund; including its prospectus, financial information, holdings and proxy information, scan the QR code or visit https://millimanfunds.com/capgroup/resources.
HOUSEHOLDING
To reduce Fund expenses, only one copy of most shareholder documents may be mailed to shareholders with multiple accounts at the same address (Householding). If you would prefer that your Milliman, Inc documents not be householded, please contact Milliman, Inc at 1-855-700-7959, or contact your financial intermediary. Your instructions will typically be effective within 30 days of receipt by Milliman, Inc or your financial intermediary.
| Milliman - Capital Group Hedged U.S. Growth Fund | PAGE 3 | TSR-AR-600833719 |
100001093011810100001166114379
| | |
| Milliman - Capital Group Hedged U.S. Income and Growth Fund | |
Class 3true |
| Annual Shareholder Report | December 31, 2024 |
This annual shareholder report contains important information about the Milliman - Capital Group Hedged U.S. Income and Growth Fund for the period of January 1, 2024, to December 31, 2024. You can find additional information about the Fund at https://millimanfunds.com/capgroup/resources. You can also request this information by contacting us at 1-855-700-7959.
WHAT WERE THE FUND COSTS FOR THE PAST YEAR? (based on a hypothetical $10,000 investment)
| | |
Class Name | Costs of a $10,000 investment | Costs paid as a percentage of a $10,000 investment |
| Class 3 | $114 | 1.09% |
HOW DID THE FUND PERFORM LAST YEAR AND WHAT AFFECTED ITS PERFORMANCE?
The Milliman - Capital Group Hedged U.S. Income & Growth Fund seeks to provide upside participation in the total return of a portfolio of income and growth oriented equity securities selected by Capital Group while protecting against equity security price losses within the -5% to -20% range.
For the year ending December 31, 2024, the Milliman - Capital Group Hedged U.S. Income & Growth Fund returned 8.72% v.s. the benchmark (S&P 500 Price Index) return of 23.31%. The Fund achieved reduced volatility and reduced losses throughout the year. The ratio of Fund-to-Benchmark volatility was 56%, while that of the maximum peak-to-trough drawdown was 45%. Positions in Broadcom, Inc. and JPMorgan Chase & Co were top contributors to the performance, while Intel Corporation and Celanese Corporation were top detractors from the performance. The option overlay detracted from the performance of the fund, specifically in Q1 and Q4, following strong rallies in domestic equities.
| |
Top Contributors |
| ↑ | Broadcom, Inc. |
| ↑ | JPMorgan Chase & Co. |
| ↑ | Philip Morris International, Inc. |
| ↑ | Constellation Energy Corp. |
| ↑ | Microsoft Corp. |
| |
Top Detractors |
| ↓ | Option Overlay |
| ↓ | Intel Corp. |
| ↓ | Celanese Corp. - Class A |
| ↓ | CVS Health Corp. |
| ↓ | Archer-Daniels Midland Co. |
HOW DID THE FUND PERFORM SINCE INCEPTION?*
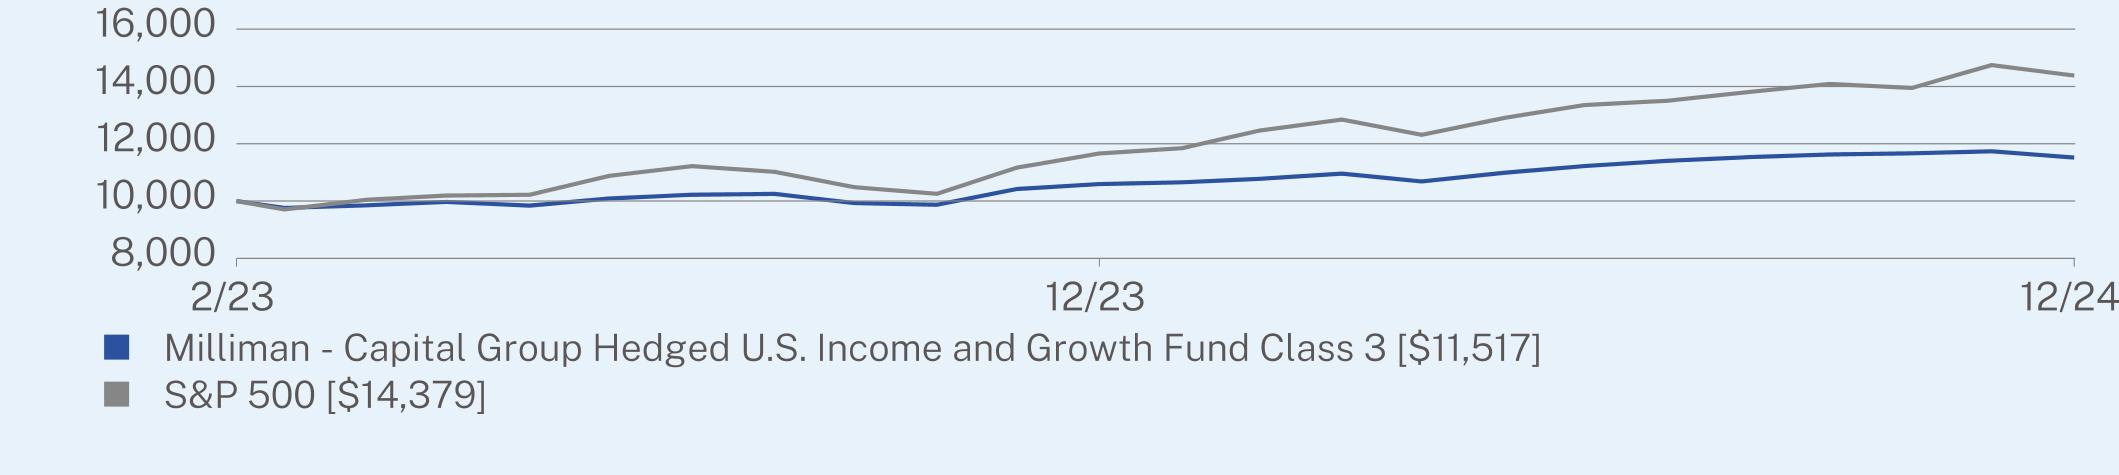
The $10,000 chart reflects a hypothetical $10,000 investment in the class of shares noted. The chart uses total return performance and assumes reinvestment of dividends and capital gains. Fund expenses, including 12b-1 fees, management fees and other expenses were deducted.
| Milliman - Capital Group Hedged U.S. Income and Growth Fund | PAGE 1 | TSR-AR-600833693 |
CUMULATIVE PERFORMANCE (Initial Investment of $10,000)
ANNUAL AVERAGE TOTAL RETURN (%)
| | |
| | 1 Year | Since Inception
(02/10/2023) |
Class 3 (without sales charge) | 8.72 | 7.77 |
S&P 500 | 23.31 | 21.21 |
Visit https://millimanfunds.com/capgroup/resources for more recent performance information.
DISCLAIMER
The materials in this document represent the opinion of the authors at the time of authorship; they may change, and are not representative of the views of Milliman FRM or its parents, subsidiaries, or affiliates. Milliman FRM does not certify the information, nor does it guarantee the accuracy and completeness of such information. Use of such information is voluntary and should not be relied upon unless an independent review of its accuracy and completeness has been performed. Materials may not be reproduced without the express consent of Milliman FRM. Milliman Financial Risk Management LLC is an SEC-registered investment advisor and subsidiary of Milliman, Inc.
| * | The Fund’s past performance is not a good predictor of how the Fund will perform in the future.The graph and table do not reflect the deduction of taxes that a shareholder would pay on Fund distributions or redemption of Fund shares. |
KEY FUND STATISTICS (as of December 31, 2024)
| |
Net Assets | $3,455,017 |
Number of Holdings | 56 |
Net Advisory Fee | $0 |
Portfolio Turnover | 28% |
WHAT DID THE FUND INVEST IN? (as of December 31, 2024)*
| |
Top Sectors | (%) of net assets |
Information Technology | 22.8% |
Health Care | 15.4% |
Financials | 15.0% |
Industrials | 10.8% |
Consumer Staples | 7.6% |
Consumer Discretionary | 7.2% |
Communication Services | 6.2% |
Energy | 4.6% |
Utilities | 4.1% |
Cash & Other | 6.3% |
| |
Top 10 Issuers | (%) of net assets |
Broadcom, Inc. | 9.5% |
Microsoft Corp. | 7.7% |
Philip Morris International, Inc. | 4.0% |
Apple, Inc. | 3.7% |
UnitedHealth Group, Inc. | 3.3% |
Marsh & McLennan Cos., Inc. | 3.2% |
AbbVie, Inc. | 3.1% |
Eli Lilly & Co. | 3.1% |
Alphabet, Inc. | 2.7% |
JPMorgan Chase & Co. | 2.7% |
| * | The Global Industry Classification Standard (“GICS®”) was developed by and/or is the exclusive property of MSCI, Inc. (“MSCI”) and Standard & Poor’s Financial Services LLC (“S&P”). GICS® is a service mark of MSCI and S&P and has been licensed for use by U.S. Bank Global Fund Services. |
| Milliman - Capital Group Hedged U.S. Income and Growth Fund | PAGE 2 | TSR-AR-600833693 |
For additional information about the Fund; including its prospectus, financial information, holdings and proxy information, scan the QR code or visit https://millimanfunds.com/capgroup/resources.
HOUSEHOLDING
To reduce Fund expenses, only one copy of most shareholder documents may be mailed to shareholders with multiple accounts at the same address (Householding). If you would prefer that your Milliman, Inc documents not be householded, please contact Milliman, Inc at 1-855-700-7959, or contact your financial intermediary. Your instructions will typically be effective within 30 days of receipt by Milliman, Inc or your financial intermediary.
| Milliman - Capital Group Hedged U.S. Income and Growth Fund | PAGE 3 | TSR-AR-600833693 |
100001059311517100001166114379
Item 2. Code of Ethics.
A copy of the registrant’s Code of Ethics is filed herewith.
Item 3. Audit Committee Financial Expert.
The registrant’s board of trustees has determined that there is at least one audit committee financial expert serving on its audit committee. Eric Berg is the “audit committee financial expert” and is considered to be “independent” as each term is defined in Item 3 of Form N-CSR.
Item 4. Principal Accountant Fees and Services.
The registrant has engaged its principal accountant to perform audit services, audit-related services, tax services and other services during the past two fiscal years. “Audit services” refer to performing an audit of the registrant’s annual financial statements or services that are normally provided by the accountant in connection with statutory and regulatory filings or engagements for those fiscal years. “Audit-related services” refer to the assurance and related services by the principal accountant that are reasonably related to the performance of the audit. “Tax services” refer to professional services rendered by the principal accountant for tax compliance, tax advice, and tax planning. The following table details the aggregate fees billed or expected to be billed for each of the last two fiscal years for audit fees, audit-related fees, tax fees and other fees by the principal accountant.
| | FYE 12/31/2024 | FYE 12/31/2023 |
| (a) Audit Fees | $34,373 | $49,102 |
| (b) Audit-Related Fees | - | - |
| (c) Tax Fees | 5,000 | 7,500 |
| (d) All Other Fees | - | - |
(e)(1) The audit committee has adopted pre-approval policies and procedures that require the audit committee to pre-approve all audit and non-audit services of the registrant, including services provided to any entity affiliated with the registrant.
(e)(2) The percentage of fees billed by Cohen & Company, Ltd. applicable to non-audit services pursuant to waiver of pre-approval requirement were as follows:
| | FYE 12/31/2024 | FYE 12/31/2023 |
| Audit-Related Fees | 0% | 0% |
| Tax Fees | 0% | 0% |
| All Other Fees | 0% | 0% |
(f) Not applicable
(g) The following table indicates the non-audit fees billed or expected to be billed by the registrant’s accountant for services to the registrant and to the registrant’s investment adviser (and any other controlling entity, etc.—not sub-adviser) for the last two years.
| Non-Audit Related Fees | FYE 12/31/2024 | FYE 12/31/2023 |
| Registrant | $5,000 | $7,500 |
| Registrant’s Investment Adviser | - | - |
(h) The audit committee of the board of trustees has considered whether the provision of non-audit services that were rendered to the registrant’s investment adviser is compatible with maintaining the principal accountant’s independence and has concluded that the provision of such non-audit services by the accountant has not compromised the accountant’s independence.
(i) Not applicable
(j) Not applicable
Item 5. Audit Committee of Listed Registrants.
Not applicable
Item 6. Investments.
| (a) | Schedule of Investments is included within the financial statements filed under Item 7 of this Form. |
Item 7. Financial Statements and Financial Highlights for Open-End Investment Companies.
Milliman - Capital Group Hedged U.S. Growth Fund
Milliman - Capital Group Hedged U.S. Income and
Growth Fund
Core Financial Statements
December 31, 2024
TABLE OF CONTENTS
Milliman - Capital Group Hedged U.S. Growth Fund
Schedule of Investments
December 31, 2024
| | | | | | | | | | |
| |
COMMON STOCKS - 98.8%
| | | | | | | | | |
Communication Services - 13.2%
| | | | | | | | | |
Alphabet, Inc. - Class C(a) | | | | | | 1,139 | | | $216,911 |
Charter Communications, Inc. - Class A(b) | | | | | | 68 | | | 23,308 |
Meta Platforms, Inc. - Class A | | | | | | 254 | | | 148,720 |
Netflix, Inc.(b) | | | | | | 68 | | | 60,610 |
Take-Two Interactive Software, Inc.(b) | | | | | | 98 | | | 18,040 |
| | | | | | | | | 467,589 |
Consumer Discretionary - 14.0%
| | | | | | | | | |
Amazon.com, Inc.(a)(b) | | | | | | 938 | | | 205,788 |
Burlington Stores, Inc.(b) | | | | | | 128 | | | 36,488 |
Caesars Entertainment, Inc.(b) | | | | | | 855 | | | 28,574 |
DoorDash, Inc. - Class A(b) | | | | | | 164 | | | 27,511 |
Floor & Decor Holdings, Inc. - Class A(b) | | | | | | 258 | | | 25,723 |
Hilton Worldwide Holdings, Inc. | | | | | | 277 | | | 68,463 |
NIKE, Inc. - Class B | | | | | | 262 | | | 19,826 |
Royal Caribbean Cruises Ltd. | | | | | | 93 | | | 21,454 |
Tesla, Inc.(b) | | | | | | 53 | | | 21,403 |
TopBuild Corp.(b) | | | | | | 138 | | | 42,965 |
| | | | | | | | | 498,195 |
Consumer Staples - 4.6%
| | | | | | | | | |
Celsius Holdings, Inc.(b) | | | | | | 210 | | | 5,531 |
Costco Wholesale Corp. | | | | | | 45 | | | 41,232 |
Dollar Tree, Inc.(b) | | | | | | 162 | | | 12,140 |
Monster Beverage Corp.(b) | | | | | | 413 | | | 21,707 |
Philip Morris International, Inc. | | | | | | 687 | | | 82,681 |
| | | | | | | | | 163,291 |
Energy - 0.7%
| | | | | | | | | |
EOG Resources, Inc. | | | | | | 204 | | | 25,006 |
Financials - 4.5%
| | | | | | | | | |
Affirm Holdings, Inc.(b) | | | | | | 267 | | | 16,260 |
Apollo Global Management, Inc. | | | | | | 121 | | | 19,984 |
Blue Owl Capital, Inc. - Class A | | | | | | 920 | | | 21,399 |
First Republic Bank(b) | | | | | | 303 | | | 1 |
MSCI, Inc. | | | | | | 46 | | | 27,601 |
PNC Financial Services Group, Inc. | | | | | | 129 | | | 24,878 |
Progressive Corp. | | | | | | 103 | | | 24,680 |
S&P Global, Inc. | | | | | | 47 | | | 23,407 |
| | | | | | | | | 158,210 |
Health Care - 15.7%
| | | | | | | | | |
Abbott Laboratories | | | | | | 595 | | | 67,300 |
Alnylam Pharmaceuticals, Inc.(b) | | | | | | 200 | | | 47,062 |
BioMarin Pharmaceutical, Inc.(b) | | | | | | 322 | | | 21,165 |
Danaher Corp. | | | | | | 148 | | | 33,973 |
| | | | | | | | | | |
The accompanying notes are an integral part of these financial statements.
TABLE OF CONTENTS
Milliman - Capital Group Hedged U.S. Growth Fund
Schedule of Investments
December 31, 2024(Continued)
| | | | | | | | | | |
COMMON STOCKS - (Continued)
|
Health Care - (Continued)
|
Dexcom, Inc.(b) | | | | | | 300 | | | $23,331 |
Eli Lilly & Co. | | | | | | 112 | | | 86,464 |
Insulet Corp.(b) | | | | | | 126 | | | 32,895 |
IQVIA Holdings, Inc.(b) | | | | | | 107 | | | 21,027 |
Molina Healthcare, Inc.(b) | | | | | | 73 | | | 21,247 |
Regeneron Pharmaceuticals, Inc.(b) | | | | | | 49 | | | 34,904 |
Sarepta Therapeutics, Inc.(b) | | | | | | 128 | | | 15,564 |
Thermo Fisher Scientific, Inc. | | | | | | 114 | | | 59,306 |
UnitedHealth Group, Inc. | | | | | | 102 | | | 51,598 |
Vertex Pharmaceuticals, Inc.(b) | | | | | | 103 | | | 41,478 |
| | | | | | | | | 557,314 |
Industrials - 16.0%
| | | | | | | | | |
Carrier Global Corp. | | | | | | 775 | | | 52,902 |
Copart, Inc.(b) | | | | | | 992 | | | 56,931 |
Dayforce, Inc.(b) | | | | | | 400 | | | 29,056 |
General Electric Co. | | | | | | 203 | | | 33,858 |
Ingersoll Rand, Inc. | | | | | | 543 | | | 49,120 |
RTX Corp. | | | | | | 346 | | | 40,039 |
Saia, Inc.(b) | | | | | | 30 | | | 13,672 |
TransDigm Group, Inc. | | | | | | 114 | | | 144,470 |
Uber Technologies, Inc.(b) | | | | | | 597 | | | 36,011 |
United Rentals, Inc. | | | | | | 66 | | | 46,493 |
Woodward, Inc. | | | | | | 205 | | | 34,116 |
XPO, Inc.(b) | | | | | | 240 | | | 31,476 |
| | | | | | | | | 568,144 |
Information Technology - 29.2%(c)
| | | | | | | | | |
Apple, Inc.(a) | | | | | | 578 | | | 144,743 |
Applied Materials, Inc. | | | | | | 174 | | | 28,298 |
Autodesk, Inc.(b) | | | | | | 67 | | | 19,803 |
Broadcom, Inc.(a) | | | | | | 955 | | | 221,407 |
EPAM Systems, Inc.(b) | | | | | | 59 | | | 13,795 |
First Solar, Inc.(b) | | | | | | 114 | | | 20,091 |
Micron Technology, Inc. | | | | | | 208 | | | 17,505 |
Microsoft Corp. | | | | | | 632 | | | 266,388 |
NVIDIA Corp. | | | | | | 676 | | | 90,780 |
Palo Alto Networks, Inc.(b) | | | | | | 202 | | | 36,756 |
Qorvo, Inc.(b) | | | | | | 78 | | | 5,455 |
Salesforce, Inc. | | | | | | 369 | | | 123,368 |
ServiceNow, Inc.(b) | | | | | | 44 | | | 46,645 |
| | | | | | | | | 1,035,034 |
| | | | | | | | | | |
The accompanying notes are an integral part of these financial statements.
TABLE OF CONTENTS
Milliman - Capital Group Hedged U.S. Growth Fund
Schedule of Investments
December 31, 2024(Continued)
| | | | | | | | | | |
COMMON STOCKS - (Continued)
|
Materials - 0.9%
| | | | | | | | | |
Linde PLC | | | | | | 74 | | | $30,982 |
TOTAL COMMON STOCKS
(Cost $2,642,289) | | | | | | | | | 3,503,765 |
| | | Notional Amount | | | Contracts | | | |
PURCHASED OPTIONS - 1.1%(d)
| | | | | | | | | |
Over-the-Counter Put Options - 1.1%
| | | | | | | | | |
Milliman - Capital Group Growth Basket, Counterparty: Bank of America, Expiration: 02/10/2025; Exercise Price: $9,500.00(e) | | | $3,493,621 | | | 357 | | | 37,813 |
TOTAL PURCHASED OPTIONS
(Cost $21,063) | | | | | | | | | 37,813 |
TOTAL INVESTMENTS - 99.9%
(Cost $2,663,352) | | | | | | | | | $3,541,578 |
Other Assets in Excess of Liabilities - 0.1% | | | | | | | | | 2,836 |
TOTAL NET ASSETS - 100.0% | | | | | | | | | $3,544,414 |
| | | | | | | | | | |
Percentages are stated as a percent of net assets.
The Global Industry Classification Standard (“GICS®”) was developed by and/or is the exclusive property of MSCI, Inc. (“MSCI”) and Standard & Poor’s Financial Services LLC (“S&P”). GICS® is a service mark of MSCI and S&P and has been licensed for use by U.S. Bank Global Fund Services.
PLC - Public Limited Company
(a)
| All or a portion of security has been pledged as collateral. The total value of assets committed as collateral as of December 31, 2024 is $226,303 which represented 6.4% of net assets. |
(b)
| Non-income producing security. |
(c)
| To the extent that the Fund invests more heavily in a particular industry or sector of the economy, its performance will be especially sensitive to developments that significantly affect those industries or sectors. |
(d)
| Held in connection with written option contracts. See Schedule of Options Written for further information. |
(e)
| Comprised of a proprietary basket of securities. The underlying components of the basket as of December 31, 2024 are shown below: |
| | | | | | | | | | |
Microsoft Corp. | | | 632 | | | $266,549 | | | 7.63% |
Broadcom, Inc. | | | 950 | | | 220,157 | | | 6.30% |
Alphabet, Inc. - Class C | | | 1,136 | | | 216,328 | | | 6.19% |
Amazon.com, Inc. | | | 932 | | | 204,538 | | | 5.86% |
Meta Platforms, Inc. - Class A | | | 253 | | | 148,180 | | | 4.24% |
TransDigm Group, Inc. | | | 113 | | | 143,634 | | | 4.11% |
Apple, Inc. | | | 573 | | | 143,559 | | | 4.11% |
Salesforce, Inc. | | | 364 | | | 121,737 | | | 3.49% |
NVIDIA Corp. | | | 674 | | | 90,569 | | | 2.59% |
Eli Lilly & Co. | | | 112 | | | 86,568 | | | 2.48% |
Philip Morris International, Inc. | | | 689 | | | 82,882 | | | 2.37% |
Hilton Worldwide Holdings, Inc. | | | 276 | | | 68,329 | | | 1.96% |
Abbott Laboratories | | | 594 | | | 67,191 | | | 1.93% |
| | | | | | | | | | |
The accompanying notes are an integral part of these financial statements.
TABLE OF CONTENTS
Milliman - Capital Group Hedged U.S. Growth Fund
Schedule of Investments
December 31, 2024(Continued)
| | | | | | | | | | |
Netflix, Inc. | | | 68 | | | $60,683 | | | 1.74% |
Thermo Fisher Scientific, Inc. | | | 114 | | | 59,139 | | | 1.69% |
Copart, Inc. | | | 992 | | | 56,956 | | | 1.63% |
Carrier Global Corp. | | | 773 | | | 52,745 | | | 1.51% |
UnitedHealth Group, Inc. | | | 102 | | | 51,708 | | | 1.48% |
Ingersoll Rand, Inc. | | | 542 | | | 49,053 | | | 1.40% |
Alnylam Pharmaceuticals, Inc. | | | 201 | | | 47,219 | | | 1.35% |
United Rentals, Inc. | | | 66 | | | 46,631 | | | 1.33% |
ServiceNow, Inc. | | | 43 | | | 46,001 | | | 1.32% |
TopBuild Corp. | | | 139 | | | 43,133 | | | 1.23% |
Vertex Pharmaceuticals, Inc. | | | 103 | | | 41,496 | | | 1.19% |
Costco Wholesale Corp. | | | 45 | | | 41,030 | | | 1.17% |
RTX Corp. | | | 347 | | | 40,188 | | | 1.15% |
Palo Alto Networks, Inc. | | | 202 | | | 36,831 | | | 1.05% |
Burlington Stores, Inc. | | | 128 | | | 36,483 | | | 1.04% |
Uber Technologies, Inc. | | | 596 | | | 35,954 | | | 1.04% |
Regeneron Pharmaceuticals, Inc. | | | 49 | | | 34,685 | | | 0.99% |
Woodward, Inc. | | | 205 | | | 34,122 | | | 0.98% |
Danaher Corp. | | | 147 | | | 33,818 | | | 0.97% |
General Electric Co. | | | 202 | | | 33,766 | | | 0.97% |
Insulet Corp. | | | 127 | | | 33,092 | | | 0.95% |
XPO, Inc. | | | 241 | | | 31,613 | | | 0.91% |
Linde PLC | | | 74 | | | 31,043 | | | 0.89% |
Dayforce, Inc. | | | 396 | | | 28,773 | | | 0.82% |
Caesars Entertainment, Inc. | | | 855 | | | 28,580 | | | 0.82% |
Applied Materials, Inc. | | | 173 | | | 28,092 | | | 0.80% |
MSCI, Inc. | | | 46 | | | 27,864 | | | 0.80% |
DoorDash, Inc. - Class A | | | 163 | | | 27,367 | | | 0.78% |
Floor & Decor Holdings, Inc. - Class A | | | 257 | | | 25,590 | | | 0.73% |
EOG Resources, Inc. | | | 204 | | | 24,997 | | | 0.72% |
PNC Financial Services Group, Inc. | | | 129 | | | 24,960 | | | 0.71% |
Progressive Corp. | | | 103 | | | 24,711 | | | 0.71% |
Dexcom, Inc. | | | 300 | | | 23,314 | | | 0.67% |
S&P Global, Inc. | | | 47 | | | 23,276 | | | 0.67% |
Charter Communications, Inc. - Class A | | | 68 | | | 23,235 | | | 0.67% |
Monster Beverage Corp. | | | 414 | | | 21,755 | | | 0.62% |
Blue Owl Capital, Inc. - Class A | | | 918 | | | 21,345 | | | 0.61% |
Top 50 Holdings | | | | | | 3,191,469 | | | 91.35% |
Other Securities | | | | | | 302,152 | | | 8.65% |
Total Underlying Positions | | | | | | $3,493,621 | | | 100.00% |
| | | | | | | | | | |
The accompanying notes are an integral part of these financial statements.
TABLE OF CONTENTS
Milliman - Capital Group Hedged U.S. Growth Fund
Schedule of Written Options
December 31, 2024
| | | | | | | | | | |
WRITTEN OPTIONS - (0.3)%
|
Over-the-Counter Call Options - (0.2)%
| | | | | | | | | |
Milliman - Capital Group Growth Basket, Counterparty: Bank of America; Expiration: 02/10/2025; Exercise Price: $10,450.00(a) | | | $(3,493,621) | | | (357) | | | $(4,605) |
Over-the-Counter Put Options - (0.1)%
| | | | | | | | | |
Milliman - Capital Group Growth Basket, Counterparty: Bank of America; Expiration: 02/10/2025; Exercise Price: $8,000.00(a) | | | (3,493,621) | | | (357) | | | (4,584) |
TOTAL WRITTEN OPTIONS
(Premiums received $21,063) | | | | | | | | | $(9,189) |
| | | | | | | | | | |
Percentages are stated as a percent of net assets.
(a)
| Comprised of a proprietary basket of securities. The underlying components of the basket as of December 31, 2024 are shown in the Schedule of Investments. |
The following summary of the fair valuations according to the inputs used as of December 31, 2024 in valuing the Fund’s assets and liabilities (see Note 2 in Notes to Financial Statements):
| | | | | | | | | | | | | |
Assets
| | | | | | | | | | | | |
Investments:
|
Common Stocks | | | $3,503,765 | | | $— | | | $— | | | $3,503,765 |
Purchased Options | | | — | | | 37,813 | | | — | | | 37,813 |
Total Investments | | | $3,503,765 | | | $37,813 | | | $— | | | $3,541,578 |
Liabilities
| | | | | | | | | | | | |
Investments:
|
Written Options | | | $— | | | $(9,189) | | | $— | | | $(9,189) |
Total Investments | | | $— | | | $(9,189) | | | $— | | | $(9,189) |
| | | | | | | | | | | | | |
The accompanying notes are an integral part of these financial statements.
TABLE OF CONTENTS
Milliman - Capital Group Hedged U.S. Income and Growth Fund
Schedule of Investments
December 31, 2024
| | | | | | | | | | |
COMMON STOCKS - 98.7%
| | | | | | | | | |
Communication Services - 6.2%
| | | | | | | | | |
Alphabet, Inc. - Class A | | | | | | 500 | | | $94,650 |
Comcast Corp. - Class A | | | | | | 2,117 | | | 79,451 |
Meta Platforms, Inc. - Class A | | | | | | 67 | | | 39,229 |
| | | | | | | | | 213,330 |
Consumer Discretionary - 7.2%
| | | | | | | | | |
Darden Restaurants, Inc. | | | | | | 273 | | | 50,966 |
General Motors Co. | | | | | | 740 | | | 39,420 |
Home Depot, Inc. | | | | | | 198 | | | 77,020 |
Royal Caribbean Cruises Ltd. | | | | | | 177 | | | 40,832 |
Yum! Brands, Inc. | | | | | | 304 | | | 40,785 |
| | | | | | | | | 249,023 |
Consumer Staples - 7.6%
| | | | | | | | | |
Constellation Brands, Inc. - Class A | | | | | | 206 | | | 45,526 |
Keurig Dr Pepper, Inc. | | | | | | 1,755 | | | 56,371 |
Philip Morris International, Inc. | | | | | | 1,135 | | | 136,597 |
Target Corp. | | | | | | 171 | | | 23,116 |
| | | | | | | | | 261,610 |
Energy - 4.6%
| | | | | | | | | |
Chevron Corp. | | | | | | 268 | | | 38,817 |
EOG Resources, Inc. | | | | | | 477 | | | 58,471 |
Exxon Mobil Corp. | | | | | | 332 | | | 35,713 |
Halliburton Co. | | | | | | 1,001 | | | 27,217 |
| | | | | | | | | 160,218 |
Financials - 15.0%
| | | | | | | | | |
Blackrock, Inc. | | | | | | 66 | | | 67,657 |
Blackstone, Inc. | | | | | | 287 | | | 49,485 |
Capital One Financial Corp. | | | | | | 211 | | | 37,626 |
Discover Financial Services | | | | | | 206 | | | 35,685 |
Intercontinental Exchange, Inc. | | | | | | 204 | | | 30,398 |
JPMorgan Chase & Co. | | | | | | 391 | | | 93,727 |
KKR & Co., Inc. | | | | | | 363 | | | 53,691 |
Marsh & McLennan Cos., Inc. | | | | | | 517 | | | 109,816 |
Wells Fargo & Co. | | | | | | 593 | | | 41,652 |
| | | | | | | | | 519,737 |
Health Care - 15.4%
| | | | | | | | | |
Abbott Laboratories | | | | | | 534 | | | 60,401 |
AbbVie, Inc. | | | | | | 606 | | | 107,686 |
CVS Health Corp. | | | | | | 716 | | | 32,141 |
Danaher Corp. | | | | | | 174 | | | 39,942 |
Elevance Health, Inc. | | | | | | 67 | | | 24,716 |
Eli Lilly & Co. | | | | | | 138 | | | 106,536 |
Gilead Sciences, Inc. | | | | | | 519 | | | 47,940 |
UnitedHealth Group, Inc. | | | | | | 224 | | | 113,313 |
| | | | | | | | | 532,675 |
| | | | | | | | | | |
The accompanying notes are an integral part of these financial statements.
TABLE OF CONTENTS
Milliman - Capital Group Hedged U.S. Income and Growth Fund
Schedule of Investments
December 31, 2024(Continued)
| | | | | | | | | | |
COMMON STOCKS - (Continued)
|
Industrials - 10.8%
| | | | | | | | | |
Boeing Co.(a) | | | | | | 146 | | | $25,842 |
Caterpillar, Inc. | | | | | | 163 | | | 59,130 |
CSX Corp. | | | | | | 1,146 | | | 36,981 |
General Electric Co. | | | | | | 354 | | | 59,044 |
L3Harris Technologies, Inc. | | | | | | 126 | | | 26,495 |
Northrop Grumman Corp. | | | | | | 130 | | | 61,008 |
Paychex, Inc. | | | | | | 324 | | | 45,431 |
RTX Corp. | | | | | | 526 | | | 60,869 |
| | | | | | | | | 374,800 |
Information Technology - 22.8%
| | | | | | | | | |
Apple, Inc. | | | | | | 512 | | | 128,215 |
Applied Materials, Inc. | | | | | | 237 | | | 38,543 |
Broadcom, Inc. | | | | | | 1,422 | | | 329,677 |
Microsoft Corp. | | | | | | 632 | | | 266,388 |
NVIDIA Corp. | | | | | | 191 | | | 25,649 |
| | | | | | | | | 788,472 |
Materials - 2.2%
| | | | | | | | | |
Celanese Corp. | | | | | | 432 | | | 29,899 |
Linde PLC | | | | | | 106 | | | 44,379 |
| | | | | | | | | 74,278 |
Real Estate - 2.8%
| | | | | | | | | |
Extra Space Storage, Inc. | | | | | | 238 | | | 35,605 |
Welltower, Inc. | | | | | | 471 | | | 59,360 |
| | | | | | | | | 94,965 |
Utilities - 4.1%
| | | | | | | | | |
Constellation Energy Corp. | | | | | | 236 | | | 52,796 |
Sempra | | | | | | 488 | | | 42,807 |
Southern Co. | | | | | | 558 | | | 45,934 |
| | | | | | | | | 141,537 |
TOTAL COMMON STOCKS
(Cost $2,695,174) | | | | | | | | | 3,410,645 |
| | | Notional
Amount | | | Contracts | | | |
PURCHASED OPTIONS - 0.7%(b)
|
Over-the-Counter Put Options - 0.7%
| | | | | | | | | |
Milliman - Capital Group Income and Growth Basket, Counterparty: Bank of America, Expiration: 02/10/2025; Exercise Price: $9,500.00(c) | | | $3,397,089 | | | 349 | | | 24,301 |
TOTAL PURCHASED OPTIONS
(Cost $7,678) | | | | | | | | | 24,301 |
TOTAL INVESTMENTS - 99.4%
(Cost $2,702,852) | | | | | | | | | $3,434,946 |
Other Assets in Excess of Liabilities - 0.6% | | | | | | | | | 20,071 |
TOTAL NET ASSETS - 100.0% | | | | | | | | | $3,455,017 |
| | | | | | | | | | |
The accompanying notes are an integral part of these financial statements.
TABLE OF CONTENTS
Milliman - Capital Group Hedged U.S. Income and Growth Fund
Schedule of Investments
December 31, 2024(Continued)
Percentages are stated as a percent of net assets.
The Global Industry Classification Standard (“GICS®”) was developed by and/or is the exclusive property of MSCI, Inc. (“MSCI”) and Standard & Poor’s Financial Services LLC (“S&P”). GICS® is a service mark of MSCI and S&P and has been licensed for use by U.S. Bank Global Fund Services.
PLC - Public Limited Company
(a)
| Non-income producing security. |
(b)
| Held in connection with written option contracts. See Schedule of Options Written for further information. |
(c)
| Comprised of a proprietary basket of securities. The underlying components of the basket as of December 31, 2024 are shown below: |
| | | | | | | | | | |
Broadcom, Inc. | | | 1,411 | | | $327,070 | | | 9.63% |
Microsoft Corp. | | | 631 | | | 265,984 | | | 7.83% |
Philip Morris International, Inc. | | | 1,136 | | | 136,757 | | | 4.03% |
Apple, Inc. | | | 507 | | | 127,076 | | | 3.74% |
UnitedHealth Group, Inc. | | | 223 | | | 112,691 | | | 3.32% |
Marsh & McLennan Cos., Inc. | | | 515 | | | 109,468 | | | 3.22% |
AbbVie, Inc. | | | 604 | | | 107,354 | | | 3.16% |
Eli Lilly & Co. | | | 137 | | | 106,076 | | | 3.12% |
Alphabet, Inc. - Class A | | | 498 | | | 94,206 | | | 2.77% |
JPMorgan Chase & Co. | | | 390 | | | 93,525 | | | 2.75% |
Comcast Corp. - Class A | | | 2,116 | | | 79,407 | | | 2.34% |
Home Depot, Inc. | | | 198 | | | 77,008 | | | 2.27% |
Blackrock, Inc. | | | 65 | | | 66,896 | | | 1.97% |
Northrop Grumman Corp. | | | 130 | | | 61,134 | | | 1.80% |
RTX Corp. | | | 527 | | | 60,943 | | | 1.79% |
Abbott Laboratories | | | 532 | | | 60,223 | | | 1.77% |
Welltower, Inc. | | | 471 | | | 59,307 | | | 1.75% |
Caterpillar, Inc. | | | 162 | | | 58,813 | | | 1.73% |
General Electric Co. | | | 352 | | | 58,673 | | | 1.73% |
EOG Resources, Inc. | | | 477 | | | 58,441 | | | 1.72% |
Keurig Dr Pepper, Inc. | | | 1,746 | | | 56,097 | | | 1.65% |
KKR & Co., Inc. | | | 361 | | | 53,356 | | | 1.57% |
Constellation Energy Corp. - Class A | | | 234 | | | 52,351 | | | 1.54% |
Darden Restaurants, Inc. | | | 272 | | | 50,790 | | | 1.49% |
Blackstone, Inc. | | | 285 | | | 49,058 | | | 1.44% |
Gilead Sciences, Inc. | | | 517 | | | 47,761 | | | 1.41% |
Southern Co. | | | 557 | | | 45,833 | | | 1.35% |
Constellation Brands, Inc. | | | 206 | | | 45,495 | | | 1.34% |
Paychex, Inc. | | | 324 | | | 45,468 | | | 1.34% |
Linde PLC | | | 105 | | | 43,982 | | | 1.29% |
Sempra | | | 486 | | | 42,638 | | | 1.26% |
Wells Fargo & Co. | | | 591 | | | 41,502 | | | 1.22% |
Yum! Brands, Inc. | | | 303 | | | 40,699 | | | 1.20% |
Royal Caribbean Cruises Ltd. | | | 174 | | | 40,249 | | | 1.18% |
Danaher Corp. | | | 173 | | | 39,672 | | | 1.17% |
Meta Platforms, Inc. - Class A | | | 67 | | | 39,302 | | | 1.16% |
General Motors Co. | | | 735 | | | 39,132 | | | 1.15% |
Chevron Corp. | | | 266 | | | 38,578 | | | 1.13% |
Applied Materials, Inc. | | | 235 | | | 38,277 | | | 1.13% |
| | | | | | | | | | |
The accompanying notes are an integral part of these financial statements.
TABLE OF CONTENTS
Milliman - Capital Group Hedged U.S. Income and Growth Fund
Schedule of Investments
December 31, 2024(Continued)
| | | | | | | | | | |
Capital One Financial Corp. | | | 210 | | | $37,479 | | | 1.10% |
CSX Corp. | | | 1,145 | | | 36,937 | | | 1.09% |
Exxon Mobil Corp. | | | 331 | | | 35,626 | | | 1.05% |
Extra Space Storage, Inc. | | | 238 | | | 35,568 | | | 1.05% |
Discover Financial Services | | | 205 | | | 35,452 | | | 1.04% |
CVS Health Corp. | | | 710 | | | 31,868 | | | 0.94% |
Intercontinental Exchange, Inc. | | | 203 | | | 30,286 | | | 0.89% |
Celanese Corp. | | | 433 | | | 29,960 | | | 0.88% |
Halliburton Co. | | | 998 | | | 27,129 | | | 0.80% |
L3Harris Technologies, Inc. | | | 126 | | | 26,576 | | | 0.78% |
Boeing Co. | | | 145 | | | 25,684 | | | 0.76% |
Top 50 Holdings | | | | | | 3,323,857 | | | 97.84% |
Other Securities | | | | | | 73,232 | | | 2.16% |
Total Underlying Positions | | | | | | $3,397,089 | | | 100.00% |
| | | | | | | | | | |
The accompanying notes are an integral part of these financial statements.
TABLE OF CONTENTS
Milliman - Capital Group Hedged U.S. Income and Growth Fund
Schedule of Written Options
December 31, 2024
| | | | | | | | | | |
WRITTEN OPTIONS - (0.1)%
|
Over-the-Counter Call Options - (0.0)%(a)
| | | | | | | | | |
Milliman - Capital Group Income and Growth Basket, Counterparty: Bank of America; Expiration: 02/10/2025; Exercise Price: $10,330.00(b) | | | $(3,397,089) | | | (349) | | | $(548) |
Over-the-Counter Put Options - (0.1)%
| | | | | | | | | |
Milliman - Capital Group Income and Growth Basket, Counterparty: Bank of America; Expiration: 02/10/2025; Exercise Price: $8,000.00(b) | | | (3,397,089) | | | (349) | | | (1,871) |
TOTAL WRITTEN OPTIONS
(Premiums received $7,678) | | | | | | | | | $(2,419) |
| | | | | | | | | | |
Percentages are stated as a percent of net assets.
(a)
| Represents less than 0.05% of net assets. |
(b)
| Comprised of a proprietary basket of securities. The underlying components of the basket as of December 31, 2024 are shown in the Schedule of Investments. |
The following summary of the fair valuations according to the inputs used as of December 31, 2024 in valuing the Fund’s assets and liabilities (see Note 2 in Notes to Financial Statements).
| | | | | | | | | | | | | |
Assets:
| | | | | | | | | | | | |
Investments:
| | | | | | | | | | | | |
Common Stocks | | | $3,410,645 | | | $— | | | $— | | | $3,410,645 |
Purchased Options | | | — | | | 24,301 | | | — | | | 24,301 |
Total Investments | | | $3,410,645 | | | $24,301 | | | $— | | | $3,434,946 |
Liabilities:
| | | | | | | | | | | | |
Investments:
| | | | | | | | | | | | |
Written Options | | | $— | | | $(2,419) | | | $— | | | $(2,419) |
Total Investments | | | $— | | | $(2,419) | | | $— | | | $(2,419) |
| | | | | | | | | | | | | |
The accompanying notes are an integral part of these financial statements.
TABLE OF CONTENTS
Milliman Variable Insurance Trust
Statements of Assets and Liabilities
December 31, 2024
| | | | | | | |
Assets:
| | | | | | |
Investments, at value | | | $ 3,541,578 | | | $ 3,434,946 |
Cash - interest bearing deposit account | | | 25,376 | | | 35,298 |
Cash held as collateral | | | 127 | | | — |
Receivable from Adviser | | | 12,817 | | | 12,573 |
Dividends receivable | | | 1,571 | | | 2,078 |
Interest receivable | | | 124 | | | 151 |
Prepaid expenses | | | 25,717 | | | 25,717 |
Total assets | | | 3,607,310 | | | 3,510,763 |
Liabilities:
| | | | | | |
Written option contracts, at value | | | 9,189 | | | 2,419 |
Payable for fund administration and accounting fees | | | 9,535 | | | 9,438 |
Professional fees payable | | | 33,623 | | | 33,621 |
Payable to directors | | | 3,749 | | | 3,749 |
Payable for distribution and shareholder servicing fees | | | 2,243 | | | 2,196 |
Other liabilities | | | 4,557 | | | 4,323 |
Total liabilities | | | 62,896 | | | 55,746 |
Net Assets | | | $ 3,544,414 | | | $ 3,455,017 |
Net Assets Consists of:
| | | | | | |
Paid-in capital | | | $2,995,552 | | | $ 3,067,565 |
Total distributable earnings | | | 548,862 | | | 387,452 |
Total net assets | | | $3,544,414 | | | $ 3,455,017 |
Class 3
| | | | | | |
Net assets | | | $ 3,544,414 | | | $ 3,455,017 |
Shares issued and outstanding | | | 300,001 | | | 306,310 |
Net asset value per share | | | $11.81 | | | $11.28 |
Cost:
| | | | | | |
Investments, at cost | | | $ 2,663,352 | | | $ 2,702,852 |
Proceeds:
| | | | | | |
Written options premium | | | $21,063 | | | $7,678 |
| | | | | | | |
The accompanying notes are an integral part of these financial statements.
TABLE OF CONTENTS
Milliman Variable Insurance Trust
Statements of Operations
For the Year Ended December 31, 2024
| | | | | | | |
INVESTMENT INCOME:
| | | | | | |
Dividend income | | | $32,150 | | | $64,771 |
Interest income | | | 2,496 | | | 2,774 |
Total investment income | | | 34,646 | | | 67,545 |
EXPENSES:
| | | | | | |
Investment advisory fee | | | 26,420 | | | 25,837 |
Professional fees and expenses | | | 152,963 | | | 152,953 |
Fund administration and accounting fees | | | 57,432 | | | 56,728 |
Trustees’ fees | | | 27,122 | | | 27,140 |
Distribution expenses | | | 8,578 | | | 8,388 |
Transfer agent fees | | | 6,043 | | | 6,042 |
Reports to shareholders | | | 4,460 | | | 4,384 |
Custodian fees | | | 4,027 | | | 3,480 |
Insurance expense | | | 29,060 | | | 29,060 |
Offering costs | | | 4,511 | | | 4,502 |
Other expenses and fees | | | 3,614 | | | 3,613 |
Total expenses | | | 324,230 | | | 322,127 |
Expense reimbursement by Adviser | | | (286,830) | | | (285,554) |
Net expenses | | | 37,400 | | | 36,573 |
NET INVESTMENT INCOME/(LOSS) | | | (2,754) | | | 30,972 |
REALIZED AND UNREALIZED GAIN
| | | | | | |
Net realized gain (loss) from:
| | | | | | |
Investments | | | 186,815 | | | 86,760 |
Written option contracts | | | (494,606) | | | (313,641) |
Net realized gain (loss) | | | (307,791) | | | (226,881) |
Net change in unrealized appreciation on:
| | | | | | |
Investments | | | 402,359 | | | 345,004 |
Written option contracts | | | 172,677 | | | 129,355 |
Net change in unrealized appreciation | | | 575,036 | | | 474,359 |
Net realized and unrealized gain | | | 267,245 | | | 247,478 |
NET INCREASE IN NET ASSETS RESULTING FROM OPERATIONS | | | $264,491 | | | $278,450 |
| | | | | | | |
The accompanying notes are an integral part of these financial statements.
TABLE OF CONTENTS
Milliman Variable Insurance Trust
Statements of Changes in Net Assets
| | | | | | | |
OPERATIONS:
| | | | | | | | | | | | |
Net investment income/(loss) | | | $(2,754) | | | $(513) | | | $30,972 | | | $36,583 |
Net realized loss | | | (307,791) | | | (33,447) | | | (226,881) | | | (123,020) |
Net change in unrealized appreciation | | | 575,036 | | | 315,064 | | | 474,359 | | | 262,994 |
Net increase in net assets from operations | | | 264,491 | | | 281,104 | | | 278,450 | | | 176,557 |
DISTRIBUTIONS TO SHAREHOLDERS:
| | | | | | | | | | | | |
Distributions to shareholders - Class 3 | | | — | | | — | | | (30,973) | | | (36,583) |
Return of capital - Class 3 | | | — | | | — | | | (192) | | | (196) |
Total distributions to shareholders | | | — | | | — | | | (31,165) | | | (36,779) |
CAPITAL TRANSACTIONS:
| | | | | | | | | | | | |
Subscriptions - Class 3 | | | — | | | 3,053,804 | | | — | | | 3,000,010 |
Reinvestments - Class 3 | | | — | | | — | | | 31,165 | | | 36,779 |
Redemptions - Class 3 | | | — | | | (54,985) | | | — | | | — |
Net increase in net assets from capital transactions | | | — | | | 2,998,819 | | | 31,165 | | | 3,036,789 |
Net Increase in Net Assets | | | 264,491 | | | 3,279,923 | | | 278,450 | | | 3,176,567 |
NET ASSETS:
| | | | | | | | | | | | |
Beginning of the period | | | 3,279,923 | | | — | | | 3,176,567 | | | — |
End of the period | | | $3,544,414 | | | $3,279,923 | | | $3,455,017 | | | $3,176,567 |
SHARES TRANSACTIONS
| | | | | | | | | | | | |
Subscriptions - Class 3 | | | — | | | 305,223 | | | — | | | 300,001 |
Reinvestments - Class 3 | | | — | | | — | | | 2,783 | | | 3,526 |
Redemptions - Class 3 | | | — | | | (5,222) | | | — | | | — |
Total increase in shares outstanding | | | — | | | 300,001 | | | 2,783 | | | 303,527 |
| | | | | | | | | | | | | |
(a)
| Inception date of the Fund was February 10, 2023. |
The accompanying notes are an integral part of these financial statements.
TABLE OF CONTENTS
Milliman Variable Insurance Trust
Financial Highlights
| | | | | | | | | | | | | | | | |
Milliman - Capital Group Hedged U.S. Growth Fund - Class 3
| | | | | | | | | | | | | | | | | | | | | | | | | | | |
12/31/2024 | | | $10.93 | | | (0.01) | | | 0.89 | | | 0.88 | | | — | | | — | | | $11.81 | | | 8.05% | | | $3,544 | | | 9.45% | | | 1.09% | | | (0.08)% | | | 33% |
12/31/2023(f) | | | $10.00 | | | (0.00)(g) | | | 0.93 | | | 0.93 | | | — | | | — | | | $10.93 | | | 9.30% | | | $3,280 | | | 6.24% | | | 1.09% | | | (0.02)% | | | 32% |
Milliman - Capital Group Hedged U.S. Income and Growth Fund - Class 3
| | | | | | | | | | | | | | | | | | | | | | | | |
12/31/2024 | | | $10.47 | | | 0.10 | | | 0.81 | | | 0.91 | | | (0.10) | | | (0.10)(h) | | | $11.28 | | | 8.72% | | | $3,455 | | | 9.60% | | | 1.09% | | | 0.92% | | | 28% |
12/31/2023(f) | | | $10.00 | | | 0.12 | | | 0.47 | | | 0.59 | | | (0.12) | | | (0.12)(h) | | | $10.47 | | | 5.93% | | | $3,177 | | | 6.30% | | | 1.09% | | | 1.38% | | | 22% |
| | | | | | | | | | | | | | | | | | | | | | | | | | | | | | | | | | | | | | | | |
(a)
| Net investment income (loss) per share has been calculated based on average shares outstanding during the year.
|
(b)
| Total return is based on the change in net asset value of a share during the period, assumes reinvestment of dividends and distributions at net asset value and is not annualized for periods less than one year. Total return reflects waivers/reimbursements by the manager. Performance would have been lower had the waivers/reimbursements not been in effect. Total return does not include fees, charges, or expenses imposed by the variable annuity and life insurance contracts for which the Funds serve as an underlying investment vehicle. If total return had taken these into account, performance would have been lower.
|
(c)
| Annualized for periods less than one year.
|
(d)
| Net expenses reflect fee waivers and expense reimbursements by the Advisor.
|
(e)
| Not annualized for periods less than one year.
|
(f)
| Inception date of the Fund was February 10, 2023.
|
(g)
| Amount represents less than $0.005 per share.
|
(h)
| A portion of total distributions amounting to less than $0.005 per share is return of capital. |
The accompanying notes are an integral part of these financial statements.
TABLE OF CONTENTS
Milliman Variable Insurance Trust
Notes to Financial Statements
December 31, 2024
1. ORGANIZATION
Milliman Variable Insurance Trust (the “Trust”) was organized under the laws of the state of Delaware as a Delaware statutory trust on November 2, 2020, and is registered with the U.S. Securities and Exchange Commission (“SEC”) under the Investment Company Act of 1940, as amended (the “1940 Act”), as an open-end management investment company. As of December 31, 2024, the Trust consisted of 2 operational series (each, a “Fund” and together, the “Funds”). Each of the Funds is classified as non-diversified under the 1940 Act. Each Fund offers shares only to insurance company separate accounts funding variable annuity contracts and variable life insurance policies and other qualified investors. All shares of the Funds have equal rights and privileges. As of December 31, 2024, only Class 3 shares were offered, which have no front-end sales load, deferred sales charge, or redemption fee.
The Funds and their respective commencement dates are as follows:
| | | | |
Milliman - Capital Group Hedged U.S. Growth Fund | | | February 10, 2023 |
Milliman - Capital Group Hedged U.S. Income and Growth Fund | | | February 10, 2023 |
| | | | |
The Milliman - Capital Group Hedged U.S. Growth Fund’s investment objective is to provide long-term growth of capital, while also seeking to provide a hedge against downside equity exposure.
The Milliman - Capital Group Hedged U.S. Income and Growth Fund's investment objective is to produce income and provide long-term growth of capital, while also seeking to provide a hedge against downside equity exposure.
Each Fund seeks to achieve its investment objective by primarily investing its assets in a combination of common stocks (to provide long equity exposure) and derivatives (to create a hedge against the Fund’s downside equity exposure).
2. SIGNIFICANT ACCOUNTING POLICIES
The following is a summary of significant accounting policies consistently followed by each Fund in the preparation of its financial statements. These policies are in conformity with U.S. generally accepted accounting principles (“GAAP”). The Trust is an investment company and follows accounting and reporting guidance under Financial Accounting Standards Board (“FASB”) Accounting Standards Codification (“ASC”) Topic 946, Financial Services – Investment Companies.
Use of Estimates – The preparation of financial statements in conformity with GAAP requires management to make estimates and assumptions that affect the reported amount of assets and liabilities and disclosure of contingent assets and liabilities, as well as reported amounts of increases and decreases in net assets from operations during the reporting period. Actual results could differ from those estimates.
Computation of Net Asset Value – The net asset values (“NAV”) of the Funds are determined as of the close of regular trading on the New York Stock Exchange (“NYSE”) (generally 4:00 p.m. ET) on each business day the NYSE is open for regular trading. If the NYSE closes early on a valuation day, the Funds shall determine NAV as of that time.
Valuation – The Board of Trustees of the Trust (the “Board”) has adopted Pricing and Valuation Procedures (“Valuation Procedures”) to be used for valuing all securities and other assets held by the Funds, including those for which market quotations are not readily available or are deemed not be reliable. The Board has designated Milliman Financial Risk Management LLC (“Milliman”) as the valuation designee, which has established a pricing committee comprised of representatives of Milliman (the “Pricing Committee”) to provide input to Milliman in making fair value determinations in accordance with the Valuation Procedures.
Equity securities, including shares of exchange-traded funds (“ETFs”), listed on any national or foreign exchange (excluding the Nasdaq National Market (“Nasdaq”) and the London Stock Exchange Alternative Investment Market (“AIM”)) will be valued at the last sale price on the exchange on which they are principally traded, or, for Nasdaq and AIM securities, the official closing price. Securities traded on more than one securities exchange are valued at the last sale price or official closing price, as applicable, at the close of the exchange representing the principal market for such securities.
TABLE OF CONTENTS
Milliman Variable Insurance Trust
Notes to Financial Statements
December 31, 2024(Continued)
Exchange-traded options, including FLexible EXchange® Options (“FLEX Options”), are valued at a market-based price provided by the exchange on which the options contract is traded at the official close of that exchange’s trading date. If the exchange on which the options contract is traded is unable to provide a market price, exchange-traded options prices will be provided by a model-pricing provider. Over-the-counter options (“OTC Options”), including certain binary options, are valued at the mean of the most recent bid and asked price, if available, or otherwise at their closing bid price. Custom basket options are valued using the prices of the underlying components of the basket. Otherwise, the value of an options contract will be determined by the Pricing Committee in accordance with the Valuation Procedures.
Fixed income securities will generally be valued using a third-party pricing service vendor (a “Pricing Service”). Fixed income securities having a remaining maturity of 60 days or less when purchased will be valued at cost adjusted for amortization of premiums and accretion of discounts, provided the Pricing Committee has determined that the use of amortized cost is an appropriate reflection of fair value given market and issuer specific conditions existing at the time of the determination.
Open-end investment companies, with the exception of ETFs, are valued at their respective NAVs.
The Funds’ accounting agent may obtain all market quotations used in valuing securities from a Pricing Service. If no quotation can be obtained from a Pricing Service, then the Funds’ accounting agent will contact the Pricing Committee. The Pricing Committee will then attempt to obtain one or more broker quotes for the security or other asset daily and will value the security or other asset accordingly. If no quotation is available from either a Pricing Service, or one or more brokers, or if the Pricing Committee has reason to question the reliability or accuracy of a quotation supplied or the use of amortized cost, the value of any portfolio security or other asset held by a Fund for which reliable market quotations are not readily available will be determined by Milliman in a manner that most appropriately reflects fair market value of the security or other asset on the valuation date.
The Trust follows the authoritative guidance (GAAP) for fair value measurements, which established a framework for measuring fair value and a hierarchy for inputs and techniques used in measuring fair value that maximizes the use of observable inputs and minimizes the use of unobservable inputs and techniques by requiring that the most observable inputs be used when available. The guidance established three tiers of inputs that may be used to measure fair value as follows:
Level 1 –
| Unadjusted quoted prices in active markets for identical assets or liabilities that the Funds have the ability to access. |
Level 2 –
| Observable inputs other than quoted prices included in Level 1 that are observable for the asset or liability, either directly or indirectly. These inputs may include quoted prices for the identical instrument on an inactive market, prices for similar instruments, interest rates, prepayment speeds, credit risk, yield curves, default rates and similar data. |
Level 3 –
| Unobservable inputs for the asset or liability, to the extent relevant observable inputs are not available, representing the Funds’ own assumptions about the assumptions a market participant would use in valuing the asset or liability, and would be based on the best information available. |
The inputs used to value the Funds’ investments at December 31, 2024, are summarized at the end of each Fund’s Schedule of Investments. The inputs or techniques used for valuing securities are not necessarily an indication of the risk associated with investing in those securities.
Cash and cash equivalents – Cash and cash equivalents include amounts held in interest-bearing demand deposit accounts with the Funds’ custodian. The rate on the demand deposit account was 4.13% as of December 31, 2024.
Offering Costs – Offering costs directly attributable to a series of the Trust are charged to that series, such as certain registration fees, while expenses which are attributable to more than one series are allocated among the respective series on a pro rata basis.
Offering costs are recorded as a deferred asset and amortized on a straight-line basis for a period of twelve months upon commencement of operations of each Fund. Offering costs include legal fees pertaining to the preparation, review
TABLE OF CONTENTS
Milliman Variable Insurance Trust
Notes to Financial Statements
December 31, 2024(Continued)
and filing of each Fund’s initial registration statement with the SEC, and printing, mailing or other distribution charges related to each Fund’s prospectus and statement of additional information. Offering costs are subject to the Funds' Expense Limitation Agreement (See Note 5).
Investment Transactions, Investment Income and Expenses – Investment transactions are accounted for on a trade date basis for financial reporting purposes. Realized gains and losses from investment transactions are recorded on an identified cost basis. Dividend income is recognized on the ex-dividend date. Interest income, including accretion of discounts and amortization of premiums, is recognized on an accrual basis using the effective yield method.
Expenses are accrued daily. Expenses of the Trust, which are directly identifiable to a specific series, are applied to that series. Expenses which are not identifiable to a specific series are allocated in such a manner as deemed equitable, taking into consideration the nature and type of expense.
Distributions to Shareholders – Distributions to shareholders are recorded on the ex-dividend date. The Funds intend to pay out dividends from their net investment income, if any, annually. Distributions of net realized capital gains, if any, will be declared and paid at least annually by the Funds. The Funds may periodically make reclassifications among certain of its capital accounts as a result of the recognition and characterization of certain income and capital gain distributions determined annually in accordance with federal tax regulations which may differ from GAAP. Distributions that exceed earnings and profits for tax purposes are reported as a return of capital.
3. DERIVATIVES
Disclosures about derivative instruments are intended to improve financial reporting for derivative instruments by enabling investors to understand how and why an entity uses derivatives, how derivatives are accounted for, and how derivative instruments affect an entity’s results of operations and financial position.
In seeking to create a hedge against a Fund’s downside equity exposure, Milliman primarily intends to purchase and sell either OTC options and/or FLEX Options on common stocks and/or indices or ETFs representing those common stocks. OTC options are traded and privately negotiated in the OTC market and are subject to counterparty risk of the writer of the options contract. Many counterparties to OTC options are financial institutions, such as banks and broker-dealers, and their creditworthiness (and ability to pay or perform) may be negatively impacted by factors affecting financial institutions generally. FLEX Options are options contracts that trade on an exchange but provide an investor with the ability to customize key contract terms like strike price, style and expiration date, while achieving price discovery (i.e., determining market prices) in competitive, transparent auctions markets and avoiding the counterparty exposure of OTC options positions. Like traditional exchange-traded options, FLEX Options are guaranteed for settlement by the Options Clearing Corporation (“OCC”), a market clearinghouse that guarantees performance by counterparties to certain derivatives contracts. Milliman is not restricted in its use of OTC or exchange-traded options and may use either type to achieve the Funds’ principal investment strategies.
The Funds will purchase and sell call and put options. In general, put options give the holder (i.e., the buyer) the right to sell an asset (or deliver the cash value of the underlying asset) and the seller (i.e., the writer) of the put has the obligation to buy the asset (or receive cash value of the underlying asset) at a certain defined price. Call options give the holder (i.e., the buyer) the right to buy an asset (or receive cash value of the underlying asset) and the seller (i.e., the writer) the obligation to sell the asset (or deliver cash value of the underlying asset) at a certain defined price.
When a Fund purchases an option, an amount equal to the premium paid by the Fund is recorded as an investment and is subsequently adjusted to the current value of the option purchased. If an option expires on the stipulated expiration date or if the Fund enters into a closing sale transaction, a gain or loss is realized. If a call option is exercised, the cost of the security acquired is increased by the premium paid for the call or, if cash-settled, a gain or loss is realized. If a put option is exercised, a gain or loss is realized from the sale of the underlying security, or the transfer of the relative cash amount if cash-settled, and the proceeds are decreased by the premium originally paid.
When a Fund writes an option, an amount equal to the premium received by the Fund is recorded as a liability and is subsequently adjusted to the current value of the option written. Premiums received from writing options that expire unexercised are treated by the Fund on the expiration date as realized gain from written options. The difference between the premium and the amount paid on effecting a closing purchase transaction, including brokerage commissions, is also treated as a realized gain, or if the premium is less than the amount paid for the closing purchase transaction, as a realized
TABLE OF CONTENTS
Milliman Variable Insurance Trust
Notes to Financial Statements
December 31, 2024(Continued)
loss. If a call option written by the Fund is exercised, the premium received is added to the proceeds from the sale of the underlying security, or the transfer of the relevant cash amount if cash-settled, in determining whether the Fund has a realized a gain or loss. If a put option written by the Fund is exercised, the premium received reduces the cost basis of the securities purchased by the Fund if physical delivery is required, or the corresponding cash amount if cash-settled. The Fund, as a writer of an option, bears the market risk of an unfavorable change in the price of the asset underlying the written option. Risk of loss on written options may exceed amounts recognized on the Statements of Assets and Liabilities.
The following tables summarize derivatives held by the Fund and their impact on the Funds’ results of operations.
The location and value of derivative instruments on the Statements of Assets and Liabilities as of December 31, 2024, was as follows:
| | | | | | | | | | |
Milliman - Capital Group Hedged U.S. Growth Fund
| | | | | | | | | |
Assets - Purchased options | | | Investments, at value | | | $37,813 | | | $37,813 |
Liabilities - Written options | | | Options written, at value | | | $9,189 | | | $9,189 |
Milliman - Capital Group Hedged U.S. Income and Growth Fund
| | | | | | | | | |
Assets - Purchased options | | | Investments, at value | | | $24,301 | | | $24,301 |
Liabilities - Written options | | | Options written, at value | | | $2,419 | | | $2,419 |
| | | | | | | | | | |
The location and effect of derivative instruments on the Statements of Operations for the period ended December 31, 2024, was as follows:
| | | | |
Milliman - Capital Group Hedged U.S. Growth Fund
| | | | | | | | | |
Purchased options | | | Investments | | | $(130,711) | | | $(130,711) |
Written options | | | Written Options | | | (494,606) | | | (494,606) |
| | | | | | $(625,317) | | | $(625,317) |
| | | | | | | | | | |
| | | | | | | | | | |
Milliman - Capital Group Hedged U.S. Income and Growth Fund
| | | | | | | | | |
Purchased options | | | Investments | | | $(72,424) | | | $(72,424) |
Written options | | | Written Options | | | (313,641) | | | (313,641) |
| | | | | | $(386,065) | | | $(386,065) |
| | | | | | | | | | |
TABLE OF CONTENTS
Milliman Variable Insurance Trust
Notes to Financial Statements
December 31, 2024(Continued)
| | | | |
Milliman - Capital Group Hedged U.S. Growth Fund
| | | | | | | | | |
Purchased options | | | Investments | | | $58,451 | | | $58,451 |
Written options | | | Written Options | | | 172,677 | | | 172,677 |
| | | | | | $231,128 | | | $231,128 |
| | | | | | | | | | |
| | | | | | | | | | |
Milliman - Capital Group Hedged U.S. Income and Growth Fund
| | | | | | | | | |
Purchased options | | | Investments | | | $37,762 | | | $37,762 |
Written options | | | Written Options | | | 129,355 | | | 129,355 |
| | | | | | $167,117 | | | $167,117 |
| | | | | | | | | | |
The notional amounts of derivative instruments outstanding relative to each Fund’s net assets as of period end and the amounts of net realized gain (loss) and net change in unrealized appreciation (depreciation) on financial derivative instruments during the period, as disclosed in the Schedules of Investments, serve as indicators of the volume of financial derivative activity for the Funds.
Because OTC options are not guaranteed for settlement by a clearing broker, they are generally considered to have greater counterparty risk than exchange-traded options, such as FLEX Options, which are issued and guaranteed for settlement by the OCC and their clearing houses (“clearing members”) rather than a bank or a broker. To the extent the Fund uses FLEX Options, although clearing members guarantee performance of their clients’ obligations to the clearing house, there is a risk that the assets of the Fund might not be fully protected in the event of the clearing member’s bankruptcy, as the Fund would be limited to recovering only a pro rata share of all available funds segregated on behalf of the clearing member’s customers for the relevant account class. The use of certain derivatives involves leverage, which can cause the Fund’s portfolio to be more volatile than if the portfolio had not been leveraged. Leverage can significantly magnify the effect of price movements of the reference asset, disproportionately increasing the Fund’s losses and reducing the Fund’s opportunities for gains when the reference asset changes in unexpected ways. In some instances, such leverage could result in losses that exceed the original amount invested.
In order to better define its contractual rights and to secure rights to help the Funds mitigate their counterparty risk, the Funds may enter into International Swaps and Derivatives Association, Inc. Master Agreements (“ISDA Master Agreements”) or similar agreement with derivative contract counterparties. An ISDA Master Agreement is a bilateral agreement between the Fund and a counterparty that governs over-the-counter derivatives and foreign currency exchange contracts and typically contains, among other things, collateral posting items and netting provisions in the event of a default or termination event. Under an ISDA Master Agreement, the Fund may, under certain circumstances, offset with the counterparty certain derivative financial instrument payables and/or receivables with collateral held and/or posted and create one single net payment. The provisions of an ISDA Master Agreement typically permit a single net payment in the event of default (close-out) netting including the bankruptcy or insolvency of the counterparty. However, bankruptcy or insolvency laws of a particular jurisdiction may impose restrictions on or prohibitions against the right of offset in bankruptcy, insolvency or other events.
For financial reporting purposes, the Funds do not offset derivative assets and derivative liabilities that are subject to netting arrangements in the Statements of Assets and Liabilities.
TABLE OF CONTENTS
Milliman Variable Insurance Trust
Notes to Financial Statements
December 31, 2024(Continued)
At December 31, 2024, derivative assets and liabilities subject to offsetting provisions were as follows:
Milliman - Capital Group Hedged U.S. Growth Fund
| | | | | | | | | | | | | | | | |
Bank of America | | | $37,813 | | | $(9,189) | | | $(28,497) | | | $(127) | | | $ — |
| | | | | | | | | | | | | | | | |
| | | | | | | | | | | | | | | | |
Bank of America | | | $9,189 | | | $(9,189) | | | $— | | | $— | | | $ — |
| | | | | | | | | | | | | | | | |
Milliman - Capital Group Hedged U.S. Income and Growth Fund
| | | | | | | | | | | | | | | | |
Bank of America | | | $24,301 | | | $(2,419) | | | $— | | | $— | | | $21,882 |
| | | | | | | | | | | | | | | | |
| | | | | | | | | | | | | | | | |
Bank of America | | | $2,419 | | | $(2,419) | | | $— | | | $— | | | $ — |
| | | | | | | | | | | | | | | | |
(1)
| Excess of collateral is not shown for financial reporting purposes. |
(2)
| Net exposure represents the receivable due from or payable due to the counterparty in the event of default. |
4. FEDERAL TAX INFORMATION
No provision for federal income taxes has been made, as it is each Fund’s policy to comply with the Subchapter M provision of the Internal Revenue Code of 1986, as amended, and to distribute to shareholders each year, all of its taxable income and realized gains.
Each Fund files U.S. federal, state, and local tax returns as required. The Fund’s tax returns are subject to examination by the relevant tax authorities until expiration of the applicable statute of limitations, which is generally three years after the tax returns are filed. The Funds recognize interest and penalties, if any, related to unrecognized tax benefits as income tax expense on the Statements of Operations. The Funds do not have any unrecognized tax benefits or uncertain tax positions that would require a provision for income tax. Accordingly, the Funds did not incur any interest or penalties for the year ended December 31, 2024.
For financial reporting purposes, any permanent differences resulting from different book and tax treatment are reclassified between distributable earnings and paid-in capital in the period that the differences arise. These differences are primarily due to net operating losses. Results of operations and net assets are not affected by these reclassifications. As of December 31, 2024, the following reclassifications were made on the applicable Funds’ Statements of Assets and Liabilities for permanent differences:
| | | | | | | |
Milliman - Capital Group Hedged U.S. Growth Fund | | | $ 2,754 | | | $ (2,754) |
| | | | | | | |
TABLE OF CONTENTS
Milliman Variable Insurance Trust
Notes to Financial Statements
December 31, 2024(Continued)
At December 31, 2024, the cost of investments, including derivatives, and unrealized appreciation/depreciation for federal income tax purposes for each Fund were as follows:
| | | | | | | | | | | | | |
Milliman - Capital Group Hedged U.S. Growth Fund | | | $ 2,642,887 | | | $1,055,596 | | | $(166,094) | | | $ 889,502 |
Milliman - Capital Group Hedged U.S. Income and Growth Fund | | | 2,695,519 | | | 836,340 | | | (99,332) | | | 737,008 |
| | | | | | | | | | | | | |
For the year ended December 31, 2024, the tax character of distributions by the Milliman - Capital Group Hedged U.S. Income and Growth Fund, was as follows:
| | | | | | | |
Milliman - Capital Group Hedged U.S. Income and Growth Fund | | | $ 30,973 | | | $ — | | | $ 192 | | | $ 31,165 |
| | | | | | | | | | | | | |
For the period ended December 31, 2023, the tax character of distributions by the Milliman - Capital Group Hedged U.S. Income and Growth Fund, was as follows:
| | | | | | | |
Milliman - Capital Group Hedged U.S. Income and Growth Fund | | | $36,583 | | | $ — | | | $196 | | | $36,779 |
| | | | | | | | | | | | | |
As of December 31, 2024, the components of distributable earnings/(accumulated deficit) on a tax basis were as follows:
| | | | | | | | | | | | | | | | | | | |
Milliman - Capital Group Hedged U.S. Growth Fund | | | $ — | | | $ — | | | $ (340,640) | | | $ — | | | $889,502 | | | $ 548,862 |
Milliman - Capital Group Hedged U.S. Income and Growth Fund | | | — | | | — | | | (349,556) | | | — | | | 737,008 | | | 387,452 |
| | | | | | | | | | | | | | | | | | | |
Capital loss carryforwards represent realized losses that may be carried forward for an unlimited period and applied against future capital gains for U.S. federal income tax purposes. Such capital loss carryforwards will retain their character as either short-term or long-term capital losses. As of December 31, 2024, the tax character of the applicable Funds’ capital loss carryforwards was as follows:
| | | | | | | | | | |
Milliman - Capital Group Hedged U.S. Growth Fund | | | $ (340,640) | | | $ — | | | $ (340,640) |
Milliman - Capital Group Hedged U.S. Income and Growth Fund | | | (349,556) | | | — | | | (349,556) |
| | | | | | | | | | |
5. ADVISORY FEES AND OTHER AGREEMENTS
The Trust has an Investment Advisory Agreement with Milliman to furnish investment advisory services to the Funds. Pursuant to the Investment Advisory Agreement, Milliman is entitled to receive an annual fee, payable monthly, equal to 0.77% of each Fund's average daily net assets.
TABLE OF CONTENTS
Milliman Variable Insurance Trust
Notes to Financial Statements
December 31, 2024(Continued)
Capital International, Inc. (the “Sub-Adviser”) serves as investment sub-adviser to each Fund. Under the Investment Sub-Advisory Agreement (the “Sub-Advisory Agreement”) with Milliman, the Sub-Adviser provides to Milliman a list of securities that comprise a Fund’s Investable Universe. That list is comprised of a portfolio of securities representing the Sub-Adviser’s recommendations to Milliman as to the common stocks and/or cash or cash equivalents on which Milliman could purchase for a Fund. The Sub-Adviser does not have responsibility for the day-to-day management of the Funds’ portfolios nor review and oversight of the Funds’ investment strategies. Rather, Milliman will make determinations on which common stocks to purchase and derivatives to transact based upon industry weightings, market capitalizations, and other financial characteristics of the common stocks contained in the Investable Universe. Milliman will also make determinations on which common stocks to purchase and derivatives to transact based on Milliman’s evaluation of the market liquidity of those common stocks and derivatives. Pursuant to the terms of the Sub-Advisory Agreement, the Sub-Adviser may remove stocks from, and/or add stocks to, the list, which may result in Milliman selling stocks that have been removed or purchasing stocks that have been added to the list, as well as resetting some of the derivatives positions. For services provided under the Sub-Advisory Agreement, Milliman pays the Sub-Adviser a fee out of the advisory fee Milliman receives from each Fund.
Milliman has contractually agreed to waive advisory fees and/or reimburse expenses to the extent necessary to limit each Fund’s total annual Fund operating expenses (which include any offering and organizational expenses, but exclude taxes, interest, brokerage fees and commissions, Rule 12b-1 fees, acquired fund fees and expenses, short-sale dividend expenses, and extraordinary or non-routine expenses not incurred in the ordinary course of each Fund’s business) to 0.84% of each Fund's average daily net assets (the “Expense Limitation Agreement”) until at least April 30, 2025. During its term, the Expense Limitation Agreement cannot be terminated or amended to increase the applicable limit without approval of the Board. Milliman may recoup from each Fund any advisory fees waived or expenses reimbursed pursuant to the applicable Expense Limitation Agreement for a period of three years from the date on which such waiver or reimbursement occurred; provided, however, that such recoupment shall not be made if it would cause the Fund’s total annual Fund operating expenses to exceed the lesser of (a) the expense limitation in effect at the time of the reimbursement, or (b) the expense limitation in effect at the time of recoupment, if any. No amounts were recouped during the year ended December 31, 2024. As of December 31, 2024, the amounts eligible for recoupment and the year of expiration are as follows:
| | | | |
Milliman - Capital Group Hedged U.S. Growth Fund | | | $286,830 | | | $140,414 | | | $427,244 |
Milliman - Capital Group Hedged U.S. Income and Growth Fund | | | 285,554 | | | 138,199 | | | 423,753 |
| | | | | | | | | | |
U.S. Bancorp Fund Services, LLC d/b/a U.S. Bank Global Fund Services, a subsidiary of U.S. Bancorp, serves as each Fund’s fund accountant, administrator, and transfer agent pursuant to certain fund accounting servicing, fund administration servicing and transfer agent servicing agreements. U.S. Bank National Association, a subsidiary of U.S. Bancorp, serves as the Funds’ custodian pursuant to a custody agreement. Foreside Fund Services, LLC (the “Distributor”) serves as the Funds’ distributor pursuant to a distribution agreement.
The Trust has adopted a Distribution Plan under Rule 12b-1 (“Rule 12b-1 Plan”) of the 1940 Act with respect to each Fund’s Class 3 shares. The Rule 12b-1 Plan permits each Fund to pay the Distributor, as the Funds’ principal underwriter, for expenses associated with the distribution of Class 3 shares of the Funds. Under the Rule 12b-1 Plan, the Distributor is paid an annual fee of 0.25% of the average daily net assets of Class 3 shares. All Rule 12b-1 Plan payments received by the Distributor shall be used solely for distribution-related expenses and shall not be retained as profit by the Distributor. Accordingly, no compensation is payable by the Funds to the Distributor for such distribution services. However, Milliman has entered into an agreement with the Distributor under which it makes payments to the Distributor in consideration for its services under the distribution agreement. The payments made by Milliman to the Distributor do not represent an additional expense to the Funds or their shareholders.
Certain employees of Foreside Fund Officer Services, LLC, an affiliate of the Distributor, serve as Chief Compliance Officer and Anti-Money Laundering Officer to the Trust.
Certain Trustees and Officers of the Trust are also Officers or employees of Milliman and, during their terms of office, receive no compensation from the Funds.
TABLE OF CONTENTS
Milliman Variable Insurance Trust
Notes to Financial Statements
December 31, 2024(Continued)
6. INVESTMENT TRANSACTIONS
Purchases and sales of investments, excluding short-term obligations and U.S. Government Securities, for the year ended December 31, 2024, were as follows:
| | | | | | | |
Milliman - Capital Group Hedged U.S. Growth Fund | | | $1,153,482 | | | $1,754,178 |
Milliman - Capital Group Hedged U.S. Income and Growth Fund | | | 949,119 | | | 1,281,721 |
| | | | | | | |
7. BENEFICIAL OWNERSHIP
The beneficial ownership, either directly or indirectly, of more than 25% of the voting securities of a Fund creates a presumption of control of that Fund, under Section 2(a)(9) of the 1940 Act. As of December 31, 2024, American General Life Insurance Company directly owned 100% of the outstanding shares of each Fund.
8. RISKS
The Funds could lose money over short periods due to short-term market movements and over longer periods during more prolonged market downturns. Assets may decline in value due to factors affecting financial markets generally or particular asset classes or industries represented in the markets. The value of options or other assets may also decline due to general market conditions, economic trends or events that are not specifically related to the issuer of the security or other asset, or due to factors that affect a particular issuer, country, region, market, industry, sector or asset class.
The principal risks of investing in the Funds are described more fully in the Funds’ prospectus.
9. GUARANTEES AND INDEMNIFICATIONS
In the normal course of business, the Funds enter into contracts with service providers that contain general indemnification clauses. The Funds’ maximum exposure under these arrangements is unknown, as this would involve future claims that may be made against the Funds that have not yet occurred.
10. ACCOUNTING STANDARD UPDATES
Each Fund included herein is deemed to be an individual reporting segment and is not part of a consolidated reporting entity. The objective and strategy of each Fund is used by Milliman to make investment decisions, and the results of the operations, as shown in the statements of operations and the financial highlights for each Fund is the information utilized for the day-to-day management of the Funds. Each Fund is party to the expense agreements as disclosed in the notes to the financial statements and resources are not allocated to a fund based on performance measurements. Due to the significance of oversight and their role, Milliman is deemed to be the Chief Operating Decision Maker.
11. SUBSEQUENT EVENTS
Management has evaluated events and transactions for potential recognition or disclosure through the date the financial statements were issued and has determined that no additional items require recognition or disclosure.
TABLE OF CONTENTS
Milliman Variable Insurance Trust
Report of Independent Registered Public Accounting Firm
To the Shareholders and Board of Trustees of
Milliman Variable Insurance Trust
Opinion on the Financial Statements
We have audited the accompanying statements of assets and liabilities, including the schedules of investments and schedules of written options, of Milliman - Capital Group Hedged U.S. Growth Fund and Milliman - Capital Group Hedged U.S. Income and Growth Fund (the “Funds”), each a series of Milliman Variable Insurance Trust, as of December 31, 2024, the related statements of operations, the statements of changes in net assets, and the financial highlights for each of the periods indicated below, and the related notes (collectively referred to as the “financial statements”). In our opinion, the financial statements present fairly, in all material respects, the financial position of each of the Funds as of December 31, 2024, the results of their operations, the changes in net assets and the financial highlights for each of the periods indicated below, in conformity with accounting principles generally accepted in the United States of America.
| | | | | | | | | | |
Milliman - Capital Group Hedged U.S. Growth and Milliman - Capital Group Hedged U.S. Income and Growth Fund | | | For the year ended
December 31, 2024 | | | For the year ended December 31, 2024 and for the
period February 10, 2023 (commencement of operations)
through December 31, 2023 |
| | | | | | | |
Basis for Opinion
These financial statements are the responsibility of the Funds’ management. Our responsibility is to express an opinion on the Funds’ financial statements based on our audits. We are a public accounting firm registered with the Public Company Accounting Oversight Board (United States) (“PCAOB”) and are required to be independent with respect to the Funds in accordance with the U.S. federal securities laws and the applicable rules and regulations of the Securities and Exchange Commission and the PCAOB.
We conducted our audits in accordance with the standards of the PCAOB. Those standards require that we plan and perform the audit to obtain reasonable assurance about whether the financial statements are free of material misstatement whether due to error or fraud.
Our audits included performing procedures to assess the risks of material misstatement of the financial statements, whether due to error or fraud, and performing procedures that respond to those risks. Such procedures included examining, on a test basis, evidence regarding the amounts and disclosures in the financial statements. Our procedures included confirmation of securities owned as of December 31, 2024, by correspondence with the custodian and brokers. Our audits also included evaluating the accounting principles used and significant estimates made by management, as well as evaluating the overall presentation of the financial statements. We believe that our audits provide a reasonable basis for our opinion.
We have served as the auditor of one or more investment companies advised by Milliman Financial Risk Management LLC since 2021.
COHEN & COMPANY, LTD.
Cleveland, Ohio
February 13, 2025
TABLE OF CONTENTS
Milliman Variable Insurance Trust
Board Considerations Regarding Approval of Investment Management
Agreements (Unaudited)
At a meeting held on August 6, 2024 (the “Meeting”), the Board of Trustees (the “Board” or the “Trustees”) of the Milliman Variable Insurance Trust (the “Trust”), including the Trustees who are not “interested persons” (as that term is defined in the Investment Company Act of 1940, as amended (the “1940 Act”)) of the Trust (the “Independent Trustees”), voting separately, reviewed and unanimously approved the continuance of (i) the Investment Advisory Agreement (the “Investment Advisory Agreement”) between Milliman Financial Risk Management LLC (the “Adviser”) and the Trust, on behalf of the Milliman - Capital Group Hedged U.S. Growth Fund and Milliman - Capital Group Hedged U.S. Income and Growth Fund series of the Trust (each, a “Fund,” and collectively, the “Funds”); and (ii) the Sub-Advisory Agreement between the Adviser and Capital International, Inc. (the “Sub-Adviser”) with respect to the Funds (the “Sub-Advisory Agreement”).
During the Meeting, the Independent Trustees had met in executive session with counsel and had discussed the proposed Investment Advisory Agreement and Sub-Advisory Agreement and the requirements under the 1940 Act that apply to the Board’s consideration and approval of those agreements. In considering the Investment Advisory Agreement and Sub-Advisory Agreement, the Board, including the Independent Trustees, reviewed the Board materials and other information from counsel and from the Adviser and Sub-Adviser, including: (i) information describing the nature, quality and extent of the services provided by the Adviser and Sub-Adviser to the Funds; (ii) information concerning the financial condition, business, operations, and compliance programs of the Adviser and Sub-Adviser, as well as the portfolio management team of the Adviser that manages each Fund’s portfolio; (iii) information describing each Fund’s investment advisory fee and operating expenses; (iv) a copy of the current Forms ADV for the Adviser and Sub-Adviser; and (v) a memorandum from Trust counsel regarding the responsibilities of the Trustees in considering investment advisory arrangements under the 1940 Act. The Board also considered presentations made by, and discussions held with, representatives of the Adviser at the Meeting, as well as during the regularly scheduled meetings of the Board. The Adviser discussed with the Board information regarding the advisory fees, sub-advisory fees and expenses of each Fund. With respect to each Fund, the Adviser also discussed other investment companies being offered to insurance company separate accounts that utilize similar strategies, noting their comparative fees and expenses, although management stated that they did not view those other investment companies as being appropriate peer comparisons because those other investment companies utilize simpler investment strategies. The Board also received details about the Adviser’s profitability as it pertains to its management of the Funds and across the rest of its advisory business.
During its review of this information, the Board focused on, and analyzed, the factors that the Board deemed relevant, including: (i) the nature, extent and quality of the services provided to each Fund by the Adviser and Sub-Adviser; (ii) the Adviser’s and Sub-Adviser’s personnel and operations; (iii) the Funds’ expense levels; (iv) any “fall-out” benefits to the Adviser or Sub-Adviser (i.e., the ancillary benefits that are realized by the Adviser or Sub-Adviser from their relationship with the Trust and the Funds); (v) the effect of asset growth on a Fund’s expenses; and (vi) possible conflicts of interest.
The Board, including the Independent Trustees, considered the following in respect of the Funds:
(a) The nature, extent and quality of services provided to the Funds by the Adviser and Sub-Adviser, including personnel and operations of the Adviser and Sub-Adviser. The Board reviewed the services that the Adviser and Sub-Adviser provide to the Funds. The Board noted the responsibilities that the Adviser has as each Fund’s investment adviser, including: the responsibility for the management and investment of each Fund’s portfolio; executing portfolio security and other asset trades; monitoring compliance with each Fund’s investment objective, policies, and limitations; the responsibility for quarterly reporting to the Board; and the oversight of general portfolio compliance with relevant law. The Board then noted the responsibilities that the Sub-Adviser has as each Fund’s non-discretionary sub-adviser, which requires the Sub-Adviser to design, monitor and provide one or more model portfolios (as updated from time to time) (“Model Portfolios”) that meet certain parameters, as agreed upon between the Adviser and Sub-Adviser. The Board also reviewed the Adviser’s and Sub-Adviser’s experience in managing other portfolios. Based on its consideration and review of the foregoing information, the Board determined that the Funds had benefited, and were likely to continue to benefit, from the nature, quality and extent of the services provided by the Adviser and Sub-Adviser.
TABLE OF CONTENTS
Milliman Variable Insurance Trust
Board Considerations Regarding Approval of Investment Management
Agreements (Unaudited)(Continued)
(b) Comparison of services provided and fees paid, and the cost of the services provided and profits realized by the Adviser and Sub-Adviser from their relationship with the Funds; “fall-out” benefits. The Board compared both the services provided to the Funds by the Adviser and Sub-Adviser and the related fees to those of other investment advisers with respect to similar funds. In particular, the Board considered each Fund’s advisory fee and expense ratio to other investment companies that the Adviser considered to be similar to the Funds, even if not necessarily in the same peer group due to the unique strategies implemented by the Adviser in managing the Funds. The Board noted that the Adviser has proposed to continue its Expense Limitation Agreements whereby the Adviser waives its advisory fees and/or reimburses expenses to keep each Fund’s expenses from exceeding certain levels. The Board noted that because of the Expense Limitation Agreements, the Adviser would continue to supplement a portion of each Fund’s operating expenses for a period of time and considered the resulting benefits that would accrue to the Funds. After considering each Fund’s fees, and in light of the nature, quality and extent of services provided by the Adviser and Sub-Adviser, and the costs incurred by the Adviser and Sub-Adviser in providing those services, the Board concluded that the level of fees paid to the Adviser and Sub-Adviser with respect to the Funds was fair and reasonable. The Board also considered the Adviser’s profitability, noting that it continues to operate the Funds at a loss.
The Board considered that the Adviser and Sub-Adviser may experience certain “fall-out” benefits based on the potential success of the Funds and/or the Trust, but that such benefits are not presently quantifiable. The Board noted that the Trust’s service providers are not affiliated with the Adviser or Sub-Adviser, so that such services do not give rise to “fall-out” benefits for the Adviser or Sub-Adviser.
(c) The extent to which economies of scale are realized by the Funds, and whether fee levels reflect such economies of scale. The Board considered the assets under management attributable to the Funds, together with the fees paid to the Adviser (after giving effect to the Expense Limitation Agreements). In light of current asset levels relative to the costs of operating the Funds, the Board determined that the Adviser was not yet operating at a level where economies of scale could be shared with the Funds. The Board also considered that the Funds did not compensate the Sub-Adviser directly, but that the Sub-Adviser was compensated by the Adviser out of the Adviser’s investment advisory fee.
(d) Investment performance of the Funds and of the Adviser and Sub-Adviser. The Board reviewed the performance of each Fund and noted that each Fund performed as anticipated. The Board also considered the performance of the Adviser and its portfolio managers in managing each Fund, as well as the performance of the Model Portfolios provided by the Sub-Adviser. The Board noted that the Adviser and Sub-Adviser demonstrated effective management expertise and, after considering all of the information, concluded that each Fund was likely to benefit from the Adviser’s continued management of its portfolio and the Model Portfolio services provided by the Sub-Adviser.
Conclusion. No single factor was determinative to the decision of the Board. Based on the foregoing and such other matters as were deemed relevant, the Board, having requested such information from the Adviser and Sub-Adviser as it believed reasonably necessary to evaluate the terms of the Investment Advisory Agreement and Sub-Advisory Agreement, and having determined that the information provided by the Adviser and Sub-Adviser was sufficiently responsive to their requests to permit consideration of the Investment Advisory Agreement and Sub-Advisory Agreement, concluded that the advisory fees and total expense ratios for the Funds were reasonable in relation to the services provided by the Adviser and Sub-Adviser to the Funds, as well as the costs incurred and benefits gained by the Adviser and Sub-Adviser in providing such services. The Board also found the advisory fees, which were inclusive of the sub-advisory fees, to be reasonable in comparison to the fees charged by advisers to other similar funds. After full consideration of the above factors as well as other factors, the Board, including the Independent Trustees, unanimously approved the continuance of the Investment Advisory Agreement and Sub-Advisory Agreement on behalf of each Fund.
| (b) | Financial Highlights are included within the financial statements filed under Item 7 of this Form. |
Item 8. Changes in and Disagreements with Accountants for Open-End Investment Companies.
There were no changes in or disagreements with accountants during the period covered by this report.
Item 9. Proxy Disclosure for Open-End Investment Companies.
There were no matters submitted to a vote of shareholders during the period covered by this report.
Item 10. Remuneration Paid to Directors, Officers, and Others of Open-End Investment Companies.
For the year ended December 31, 2024, the aggregate remuneration the Registrant paid the directors, all members of any advisory board and any officers are disclosed in the Financial Statements.
Item 11. Statement Regarding Basis for Approval of Investment Advisory Contract.
See core financial statements above. Approval of Investment Advisory Agreement.
Item 12. Disclosure of Proxy Voting Policies and Procedures for Closed-End Management Investment Companies.
Not applicable to open-end investment companies.
Item 13. Portfolio Managers of Closed-End Management Investment Companies.
Not applicable to open-end investment companies.
Item 14. Purchases of Equity Securities by Closed-End Management Investment Company and Affiliated Purchasers.
Not applicable to open-end investment companies.
Item 15. Submission of Matters to a Vote of Security Holders.
There have been no material changes to the procedures by which shareholders may recommend nominees to the registrant’s board of trustees.
Item 16. Controls and Procedures.
| (a) | The Registrant’s President/Principal Executive Officer and Treasurer/Principal Financial Officer have reviewed the Registrant’s disclosure controls and procedures (as defined in Rule 30a-3(c) under the Investment Company Act of 1940 (the “Act”)) as of a date within 90 days of the filing of this report, as required by Rule 30a-3(b) under the Act and Rules 13a-15(b) or 15d-15(b) under the Securities Exchange Act of 1934. Based on their review, such officers have concluded that the disclosure controls and procedures are effective in ensuring that information required to be disclosed in this report is appropriately recorded, processed, summarized and reported and made known to them by others within the Registrant and by the Registrant’s service provider. |
| (b) | There were no changes in the Registrant’s internal control over financial reporting (as defined in Rule 30a-3(d) under the Act) that occurred during the period covered by this report that have materially affected, or are reasonably likely to materially affect, the Registrant’s internal control over financial reporting. |
Item 17. Disclosure of Securities Lending Activities for Closed-End Management Investment Companies
Not applicable to open-end investment companies.
Item 18. Recovery of Erroneously Awarded Compensation.
Not applicable
Item 19. Exhibits.
(2) Any policy required by the listing standards adopted pursuant to Rule 10D-1 under the Exchange Act (17 CFR 240.10D-1) by the registered national securities exchange or registered national securities association upon which the registrant’s securities are listed. Not Applicable.
(3) A separate certification for each principal executive officer and principal financial officer of the registrant as required by Rule 30a-2(a) under the Investment Company Act of 1940 (17 CFR 270.30a-2(a)). Filed herewith.
(4) Any written solicitation to purchase securities under Rule 23c-1 under the Act sent or given during the period covered by the report by or on behalf of the registrant to 10 or more persons. Not applicable.
(5) Change in the registrant’s independent public accountant. Provide the information called for by Item 4 of Form 8-K under the Exchange Act (17 CFR 249.308). Unless otherwise specified by Item 4, or related to and necessary for a complete understanding of information not previously disclosed, the information should relate to events occurring during the reporting period. Not applicable.
SIGNATURES
Pursuant to the requirements of the Securities Exchange Act of 1934 and the Investment Company Act of 1940, the registrant has duly caused this report to be signed on its behalf by the undersigned, thereunto duly authorized.
| | (Registrant) | Milliman Variable Insurance Trust | |
| | By (Signature and Title)* | /s/ Adam Schenck | |
| | | Adam Schenck, President | |
Pursuant to the requirements of the Securities Exchange Act of 1934 and the Investment Company Act of 1940, this report has been signed below by the following persons on behalf of the registrant and in the capacities and on the dates indicated.
| | By (Signature and Title)* | /s/ Adam Schenck | |
| | | Adam Schenck, President | |
| | By (Signature and Title)* | /s/ Blake Graves | |
| | | Blake Graves, Treasurer and Principal Financial Officer | |
* Print the name and title of each signing officer under his or her signature.