| | |
| UNITED STATES
SECURITIES AND EXCHANGE COMMISSION |
| | |
| CERTIFIED SHAREHOLDER REPORT OF REGISTERED
MANAGEMENT INVESTMENT COMPANIES
|
| | |
| Investment Company Act file number: | (811-23643) |
| | |
| Exact name of registrant as specified in charter: | Putnam ETF Trust |
| | |
| Address of principal executive offices: | 100 Federal Street, Boston, Massachusetts 02110 |
| | |
| Name and address of agent for service: | Stephen Tate, Vice President
100 Federal Street
Boston, Massachusetts 02110 |
| | |
| Copy to: | Stephanie A. Capistron, Esq.
Dechert LLP
One International Place, 40th Floor
100 Oliver Street
Boston, MA 02110–2605 |
| | |
| Registrant’s telephone number, including area code: | (617) 292-1000 |
| | |
| Date of fiscal year end: | April 30, 2023 |
| | |
| Date of reporting period: | September 29, 2022 (commencement of operations) – October 31, 2022 |
| | |
|
Item 1. Report to Stockholders: | |
| | |
| The following is a copy of the report transmitted to stockholders pursuant to Rule 30e-1 under the Investment Company Act of 1940: | |
Putnam
BDC Income
ETF
Semiannual report
10 | 31 | 22
Message from the Trustees
December 13, 2022
Dear Shareholder:
Financial markets are reminding us that the journey to long-term returns often involves weathering periods of heightened volatility. This year, stocks and bonds have experienced losses, and U.S. real gross domestic product growth has been weaker than expected. Persistent inflation has caused the U.S. Federal Reserve to raise interest rates. The Fed may maintain high interest rates in 2023 until inflation indicators move meaningfully lower.
While this environment is challenging, you can be confident that Putnam portfolio managers are working for you. Investment teams are actively researching new and attractive opportunities for your fund while assessing risks. When stock prices are down, as they are today, it can be a favorable time for active managers to identify opportunities with long-term potential.
Thank you for investing with Putnam.

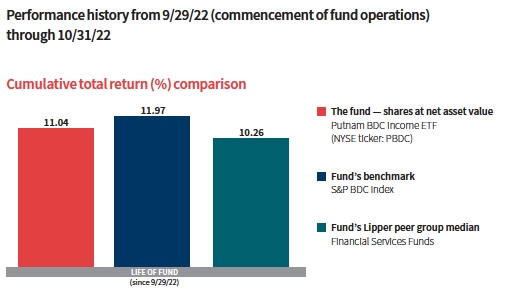
Data are historical. Past performance does not guarantee future results. More recent returns may be less or more than those shown. Share price, principal value, and return will fluctuate, and you may have a gain or a loss when you sell your shares. Performance of fund shares assumes reinvestment of distributions and does not account for taxes. Fund returns in the bar chart are at net asset value (NAV). See below and page 7 for additional performance information, including fund returns at market price. Index results should be compared with fund performance at NAV. The short-term results of a relatively new fund are not necessarily indicative of its long-term prospects. To obtain the most recent month-end performance, call 1-833-228-5577 (toll free).
Lipper peer group median is provided by Lipper, a Refinitiv company.

This comparison shows your fund’s performance in the context of broad market indexes for the period from 9/29/22 (commencement of fund operations) to 10/31/22. See above and page 7 for additional fund performance information. Index descriptions can be found on page 11.
All Bloomberg indices are provided by Bloomberg Index Services Limited.

How was the market environment for business development companies [BDCs] during the reporting period?
The abbreviated reporting period from the commencement of fund operations on September 29, 2022, through October 31, 2022, was marked by strong gains in BDC stocks. Investors welcomed data that showed the U.S. economy grew at a modest pace and inflation eased in the third quarter of calendar 2022. This raised hopes that the U.S. Federal Reserve might temper the degree and pace of its future interest-rate hikes. Better-than-expected corporate earnings also contributed to a broader risk-on sentiment across equity markets.
The Fed did not have a policy meeting scheduled for October 2022. However, at its September 2022 meeting, the Fed affirmed that ongoing interest-rate increases were appropriate and forecasted its target rate to be 4.40% by the end of 2022. It also lowered its U.S. growth forecast for 2022, while noting that it continues to see robust job gains.
How did the fund perform in this environment?
For the period from its commencement of operations on September 29, 2022, through October 31, 2022, the fund gained 11.04%, underperforming the 11.97% return for the S&P BDC Index, the fund’s benchmark. This was due to the fund’s more defensive positioning. The fund is currently positioned with a bias toward BDCs that own a higher proportion of first-lien loans. [First-lien loans are at the top of the capital structure and are paid back first in the event of financial stress.] The benchmark has a proportionately greater exposure to BDCs with second-lien loans and equity, which tend to carry greater risk.
What was your strategy in this environment?
BDCs provide financing to privately held U.S. small and midsize companies that are under-served by traditional banks. They lend to a broad range of companies and industries across the U.S. economy. These companies may be facing challenges and need help to expand or improve their performance. As such, we believe BDCs offer a distinctive investment opportunity by giving public market investors private credit market exposure.
Since we are concerned about a potential recession in 2023, the fund is positioned with a conservative bias with respect to the economic cycle. We have been adding to holdings that we believe have a strong credit record and higher first-lien loan exposure.
Which holdings and strategies aided the fund’s performance versus the benchmark during the reporting period?
The fund’s overweight positioning in the strongly performing Runway Growth Finance Corp. was a top contributor to fund results. This BDC lends to late-stage and growth companies seeking an alternative to raising equity. We view this company as underleveraged, that is, having a low ratio of debt capital to equity capital. We believe this gives management the ability to deploy more capital for new strategic initiatives. In addition to the company trading below the average BDC valuation, we see the potential for the dividend to increase with interest rates rising and the company being asset sensitive. [Asset sensitive indicates the BDC has more floating-rate assets than floating-rate liabilities.]
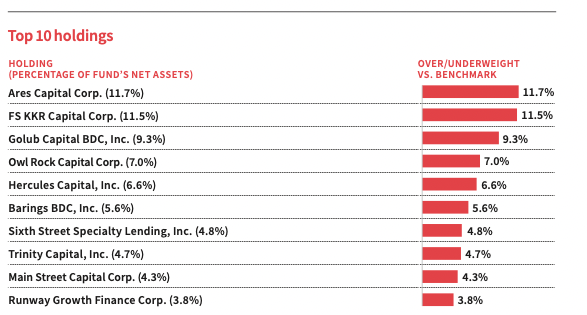
This table shows the fund’s top 10 holdings by percentage of the fund’s net assets as of 10/31/22. Short-term investments and derivatives, if any, are excluded. Holdings may vary over time.

Hercules Capital was another solid performer for the fund. This BDC is focused on providing loans to high-growth, innovative companies in the technology, life sciences, and sustainable and renewable technology industries. Management declared a quarterly dividend in October 2022 that was 9% higher than the dividend declared in the previous year. It was the third regular dividend raise in the past 12 months.
Both these top contributors ranked in the top 10 holdings of the portfolio at period-end.
What about detractors during the period?
Trinity Capital, a provider of venture debt and equipment lease financing, was the fund’s top detractor. Trinity Capital fell in response to a downgrade around concerns about the company’s exposure to cryptocurrency mining rates. Following the third quarter of calendar 2022, the company disclosed that a significant equipment finance loan to bitcoin miner Core Scientific, Inc. had been placed on nonaccrual. We continue to hold Trinity Capital despite this misstep, believing that the current valuation is not reflective of the BDC’s strong long-term credit record.
Our decision to not hold Prospect Capital weighed on benchmark-relative performance. The stock rallied strongly in October amid the risk-on market sentiment. This BDC provides financing to middle-market companies with a focus on refinancings, leveraged buyouts, and acquisitions, among other transactions. We are reluctant to hold Prospect Capital now given its relatively high exposure to equity positions. The BDC’s net asset value declined 4.5% in the third quarter of 2022, a significantly steeper decline than that of the average BDC. We anticipate it could drop further in the event of a recession.
ADVANTAGES OF AN ACTIVE ETF
This ETF (exchange-traded fund) is actively managed and offers:
• Potential for outperformance: Active strategies aim to outperform passive indexes through investment research and portfolio positioning.
• Active risk management: Proactive analysis seeks to identify better risk/reward potential than an index offers and seeks to reduce unintended risks.
• Professional oversight: Experienced portfolio managers balance risk and return while delivering the ETF’s structural benefits.
Active ETFs may be more cost-effective and tax-efficient than a traditional actively managed mutual fund.
• Cost competitive: ETFs may reduce costs to investors, with a simplified fee structure compared to alternatives.
• Tax efficient: The structure of ETFs can reduce the impact of capital gains distributions relative to other investment vehicles.
• Intraday liquidity: ETFs trade at any time of day, offering convenience and price clarity when buying and selling.
What accounts for BDCs’ attractive yields?
A significant portion of a BDC’s total return is derived from dividends. As registered investment companies, BDCs are required to distribute 90% of their net income in the form of dividends to shareholders. Additionally, many BDCs issue floating-rate loans, which allow investors to capture more income in rising interest-rate environments. When prevailing interest rates are low, BDCs can offset some of the falling interest rates with the use of asset yield floors, an agreed-upon minimum interest rate associated with a floating-rate loan product. Consequently, they may offer higher-than-average yields. Over the long term,
our research indicates that dividend yields are typically between 8%–10%, with the potential to be higher or lower.
What is your outlook as we head into 2023?
In November 2022, after the close of the reporting period, Fed policymakers announced a fourth consecutive interest-rate increase of 0.75%. In a post-meeting statement, Fed Chair Jerome Powell stated that it was “premature” to expect a pause on interest-rate hikes.
In our view, the Fed still has a way to go to bring inflation to its target rate of 2.00%. Given the Fed’s interest-rate hiking bias, risk asset prices have not bottomed, in our view. As such, we do not believe the recent bear market rally was justified by economic activity. Growth is slowing, causing us to have a more cautious view of equities and corporate credit. Looking ahead, we expect market volatility to persist and investor sentiment to fluctuate given a myriad of uncertainties, Fed monetary policy, and fears of a recession in 2023.
Against this backdrop, we’ll continue to look for BDCs with a track record of stable-to-increasing dividends across an economic cycle and strong credit histories.
Thank you, Mike, for sharing this update about the fund.
The views expressed in this report are exclusively those of Putnam Management and are subject to change. They are not meant as investment advice.
Please note that the holdings discussed in this report may not have been held by the fund for the entire period. Portfolio composition is subject to review in accordance with the fund’s investment strategy and may vary in the future. Current and future portfolio holdings are subject to risk.
Your fund’s performance
This section shows your fund’s performance, price, and distribution information for the period from September 29, 2022 (commencement of fund operations) through October 31, 2022, the end of the first half of its current fiscal year. We also include performance information as of the most recent calendar quarter-end. Performance should always be considered in light of a fund’s investment strategy. Data represent past performance. Past performance does not guarantee future results. More recent returns may be less or more than those shown. Investment return, net asset value, and market price will fluctuate, and you may have a gain or a loss when you sell your shares. For the most recent month-end performance, please visit putnam.com or call 1-833-228-5577 (toll free).
Fund performance Total return for the period ended 10/31/22
| |
| | Life of fund |
| | (since 9/29/22) |
| Net asset value | 11.04% |
| Market price | 11.18 |
Performance assumes reinvestment of distributions and does not account for taxes. The short-term results of a relatively new fund are not necessarily indicative of its long-term prospects.
Performance includes the deduction of management fees.
Comparative index returns For the period ended 10/31/22
| |
| | Life of fund |
| | (since 9/29/22) |
| S&P BDC Index | 11.97% |
| Lipper Financial Services Funds category median* | 10.26 |
Index and Lipper results should be compared with fund performance at net asset value.
Lipper peer group median is provided by Lipper, a Refinitiv company.
* Over the life-of-fund period ended 10/31/22, there were 85 funds in this Lipper category.
Fund price and distribution information For the period ended 10/31/22
| | |
| Share value | Net asset value | Market price |
| 9/29/22* | $25.00 | $25.00 |
| 10/31/22 | 27.76 | 27.79 |
The classification of distributions, if any, is an estimate. Final distribution information will appear on your year-end tax forms.
* Inception date of the ETF.
The fund made no distributions during the period.
Fund performance as of most recent calendar quarter
Total return for the period ended 9/30/22
| |
| | Life of fund |
| | (since 9/29/22) |
| Net asset value | 0.39% |
| Market price | 0.48 |
See the discussion following the fund performance table above for information about the calculation of fund performance.
Your fund’s expenses
As an investor, you pay ongoing expenses, such as management fees, and other expenses (with certain exceptions). Using the following information, you can estimate how these expenses affect your investment and compare them with the expenses of other funds. You may also pay brokerage commissions in connection with your purchase or sale of shares of the fund, which are not shown in this section and would have resulted in higher total expenses. The expenses shown in the example also do not reflect transaction costs, which would have resulted in higher total expenses. For more information, see your fund’s prospectus or talk to your financial representative.
Expense ratios
| | |
| Estimated total annual operating expenses for the fiscal year ended 4/30/23* | 10.61% |
| Annualized expense ratio for the period from 9/29/22 (commencement of operations) | |
| to 10/31/22 | 0.75% |
Estimated fiscal year expense information in this table is taken from the most recent prospectus, is subject to change, and may differ from that shown for the annualized expense ratio and in the financial highlights of this report.
Prospectus expense information also includes the estimated impact of acquired fund fees and expenses of 9.86%, which is not included in the financial highlights or annualized expense ratio. Expenses are shown as a percentage of average net assets.
* Expenses are based on estimated amounts for the current fiscal year.
Expenses per $1,000
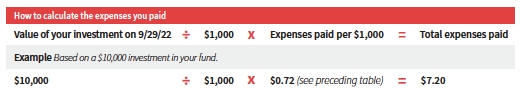
The following table shows the expenses you would have paid on a $1,000 investment from 9/29/22 (commencement of operations) to 10/31/22. It also shows how much a $1,000 investment would be worth at the close of the period, assuming actual returns and expenses.
| | |
| Expenses paid per $1,000*† | $0.72 |
| Ending value (after expenses) | $1,110.40 |
* Expenses are calculated using the fund’s annualized expense ratio, which represents the ongoing expenses as a percentage of average net assets for the period from 9/29/22 (commencement of operations) to 10/31/22.
† Expenses are calculated by multiplying the expense ratio by the average account value for the period; then multiplying the result by the number of days in the period (33); and then dividing that result by the number of days in the year (365).
Estimate the expenses you paid
To estimate the ongoing expenses you paid for the period from 9/29/22 (commencement of operations) to 10/31/22, use the following calculation method. To find the value of your investment on 9/29/22, call 1-833-228-5577.
Compare expenses using the SEC’s method
The Securities and Exchange Commission (SEC) has established guidelines to help investors assess fund expenses. Per these guidelines, the following table shows your fund’s expenses based on a $1,000 investment, assuming a hypothetical 5% annualized return. You can use this information to compare the ongoing expenses (but not transaction expenses or total costs) of investing in the fund with those of other funds. All shareholder reports will provide this information to help you make this comparison. Please note that you cannot use this information to estimate your actual ending account balance and expenses paid during the period.
| | |
| Expenses paid per $1,000*† | $3.82 |
| Ending value (after expenses) | $1,021.42 |
* Expenses are calculated using the fund’s annualized expense ratio, which represents the ongoing expenses as a percentage of average net assets for the period from 9/29/22 (commencement of operations) to 10/31/22.
† Expenses are calculated by multiplying the expense ratio by the average account value for the six-month period; then multiplying the result by the number of days in the six-month period (184); and then dividing that result by the number of days in the year (365).
Consider these risks before investing
Business development companies (BDCs) generally invest in less mature U.S. private companies or thinly traded U.S. public companies, which involves greater risk than well-established publicly traded companies. The fund will be sensitive to, and its performance will depend to a greater extent on, the overall condition of the financials sector.
The use of leverage by BDCs magnifies gains and losses on amounts invested and increases the risks associated with investing in BDCs. A BDC may make investments with greater risk of volatility and loss of principal than other investment options and may also be highly speculative and aggressive. Certain BDCs may also be difficult to value since many of the assets of BDCs do not have readily ascertainable market values.
As a non-diversified fund, the fund invests in fewer issuers and is more vulnerable than a more broadly diversified fund to fluctuations in the values of the securities it holds. Our investment techniques, analyses, and judgments may not produce the outcome we intend. The investments we select for the fund may not perform as well as other securities that we do not select for the fund. We, or the fund’s other service providers, may experience disruptions or operating errors that could have a negative effect on the fund. You can lose money by investing in the fund.
Terms and definitions
Important terms
Total return shows how the value of the fund’s shares changed over time, assuming you held the shares through the entire period and reinvested all distributions in the fund.
Net asset value (NAV) is the value of all your fund’s assets, minus any liabilities, divided by the number of outstanding shares.
Market price is the current trading price of one share of the fund. Market prices are set by transactions between buyers and sellers on exchanges such as the New York Stock Exchange.
Comparative indexes
Bloomberg U.S. Aggregate Bond Index is an unmanaged index of U.S. investment-grade fixed income securities.
ICE BofA (Intercontinental Exchange Bank of America) U.S. 3-Month Treasury Bill Index is an unmanaged index that seeks to measure the performance of U.S. Treasury bills available in the marketplace.
S&P 500® Index is an unmanaged index of common stock performance.
S&P BDC Index is an unmanaged index designed to track leading business development companies that trade on major U.S. exchanges.
Indexes assume reinvestment of all distributions and do not account for fees. Securities and performance of a fund and an index will differ. You cannot invest directly in an index.
BLOOMBERG® is a trademark and service mark of Bloomberg Finance L.P. and its affiliates (collectively “Bloomberg”). Bloomberg or Bloomberg’s licensors own all proprietary rights in the Bloomberg Indices. Neither Bloomberg nor Bloomberg’s licensors approve or endorse this material, or guarantee the accuracy or completeness of any information herein, or make any warranty, express or implied, as to the results to be obtained therefrom, and to the maximum extent allowed by law, neither shall have any liability or responsibility for injury or damages arising in connection therewith.
ICE Data Indices, LLC (“ICE BofA”), used with permission. ICE BofA permits use of the ICE BofA indices and related data on an “as is” basis; makes no warranties regarding same; does not guarantee the suitability, quality, accuracy, timeliness, and/or completeness of the ICE BofA indices or any data included in, related to, or derived therefrom; assumes no liability in connection with the use of the foregoing; and does not sponsor, endorse, or recommend Putnam Investments, or any of its products or services.
Lipper, a Refinitiv company, is a third-party industry-ranking entity that ranks funds. Its rankings do not reflect sales charges. Lipper rankings are based on total return at net asset value relative to other funds that have similar current investment styles or objectives as determined by Lipper. Lipper may change a fund’s category assignment at its discretion. Lipper category medians reflect performance trends for funds within a category.
Other information for shareholders
Proxy voting
Putnam is committed to managing our funds in the best interests of our shareholders. Putnam ETF proxy voting guidelines and procedures, as well as information regarding how your fund voted proxies relating to portfolio securities during the period ended June 30, 2023, will be available at putnam.com under the About Putnam section and on the Securities and Exchange Commission (SEC) website, www.sec.gov. If you have questions about finding forms on the SEC’s website, you may call the SEC at 1-800-SEC-0330.
Fund portfolio holdings
The fund will file a complete schedule of its portfolio holdings with the SEC for the first and third quarters of each fiscal year on Form N-PORT within 60 days of the end of such fiscal quarter. Shareholders may obtain the fund’s Form N-PORT on the SEC’s website at www.sec.gov.
Trustee approval of management contract
General conclusions
In September 2022, the Putnam ETF Trust’s (the “Trust”) Board of Trustees, which oversees the management of each Putnam exchange-traded fund, approved your fund’s management contract with Putnam Investment Management, LLC (“Putnam Management”) and the sub-management contract with respect to your fund between Putnam Management and its affiliate, Putnam Investments Limited (“PIL”).
The Trustees of the Trust who are not “interested persons” (as this term is defined in the Investment Company Act of 1940, as amended) of the Trust (“Independent Trustees”) requested and evaluated all information they deemed reasonably necessary under the circumstances in connection with their approval of your fund’s management contract and sub-management contract. In May and September 2022, the Trustees met with representatives of Putnam Management, and separately in executive session, to consider the information that Putnam Management had provided and other information developed with the assistance of independent counsel to the Independent Trustees.
On September 23, 2022, the Board, including the Independent Trustees, approved the initial execution of your fund’s management and sub-management contracts. (Because PIL is an affiliate of Putnam Management and Putnam Management remains fully responsible for all services provided by PIL, the Trustees have not attempted to evaluate PIL as a separate entity, and all subsequent references to Putnam Management below should be deemed to include reference to PIL as necessary or appropriate in the context.)
The Independent Trustees’ approval was based on the following conclusions:
• That the proposed fee schedule for your fund would represent reasonable compensation in light of the nature and quality of the services to be provided to the fund and the fees paid by competitive funds; and
• That the proposed fee schedule would represent an appropriate sharing between fund shareholders and Putnam Management of such economies of scale as may exist in the management of the fund at anticipated future asset levels.
These conclusions were based on a comprehensive consideration of all information provided to the Trustees and were not the result of any single factor. Some of the factors that figured particularly in the Trustees’ deliberations and how the Trustees considered these factors are described below, although individual Trustees may have evaluated the information presented differently, giving different weights to various factors.
Management fee schedules and total expenses
Your fund has an all-inclusive management fee that covers all of the other expenses of the fund with limited exceptions. The Independent Trustees considered the benefits to your fund of the greater predictability in expenses that the all-inclusive management fee provides.
The Trustees considered the proposed management fee for your fund in light of the fund’s proposed investment program. The Trustees also focused on the competitiveness of your fund’s management fee and projected total expense ratio in comparison to market competitors.
Investment performance
Because your fund was not yet operational, the Trustees were not able to consider your fund’s performance before their initial approval of your fund’s management and sub-management contracts.
Brokerage and soft-dollar allocations
The Trustees considered various potential benefits that Putnam Management may receive in connection with the services it provides under the management contract with your fund. These include benefits related to brokerage allocation and the use of soft dollars, whereby a portion of the commissions paid by the fund for brokerage may be used to acquire research services that are expected to be useful to Putnam Management in managing the assets of the fund and of other clients.
Financial statements
These sections of the report, as well as the accompanying Notes, constitute the fund’s financial statements.
The fund’s portfolio lists all the fund’s investments and their values as of the last day of the reporting period. Holdings are organized by asset type and industry sector, country, or state to show areas of concentration and diversification.
Statement of assets and liabilities shows how the fund’s net assets and share price are determined. All investment and non-investment assets are added together. Any unpaid expenses and other liabilities are subtracted from this total. The result is divided by the number of shares to determine the net asset value per share.
Statement of operations shows the fund’s net investment gain or loss. This is done by first adding up all the fund’s earnings — from dividends and interest income — and subtracting its operating expenses to determine net investment income (or loss). Then, any net gain or loss the fund realized on the sales of its holdings — as well as any unrealized gains or losses over the period — is added to or subtracted from the net investment result to determine the fund’s net gain or loss for the fiscal period.
Statement of changes in net assets shows how the fund’s net assets were affected by the fund’s net investment gain or loss, by distributions to shareholders, and by changes in the number of the fund’s shares. It lists distributions and their sources (net investment income or realized capital gains) over the current reporting period and the most recent fiscal year-end. The distributions listed here may not match the sources listed in the Statement of operations because the distributions are determined on a tax basis and may be paid in a different period from the one in which they were earned. Dividend sources are estimated at the time of declaration. Actual results may vary. Any non-taxable return of capital cannot be determined until final tax calculations are completed after the end of the fund’s fiscal period.
Financial highlights provide an overview of the fund’s investment results, per-share distributions, expense ratios, net investment income ratios, and portfolio turnover in one summary table, reflecting the five most recent reporting periods. In a semiannual report, the highlights table also includes the current reporting period.
| | |
| The fund’s portfolio 10/31/22 (Unaudited) | | |
|
| | |
| INVESTMENT COMPANIES (99.6%)* | Shares | Value |
| Ares Capital Corp. | 33,470 | $650,322 |
| Bain Capital Specialty Finance, Inc. | 15,025 | 189,315 |
| Barings BDC, Inc. | 35,099 | 312,732 |
| BlackRock TCP Capital Corp. | 8,922 | 105,547 |
| Blackstone Secured Lending Fund | 2,200 | 51,238 |
| Capital Southwest Corp. | 3,053 | 57,549 |
| Carlyle Secured Lending, Inc. | 16,625 | 208,644 |
| CION Investment Corp. | 19,545 | 181,964 |
| Fidus Investment Corp. | 4,418 | 83,279 |
| First Eagle Alternative Capital BDC, Inc. | 26,021 | 103,564 |
| FS KKR Capital Corp. | 33,373 | 640,762 |
| Golub Capital BDC, Inc. | 39,955 | 518,216 |
| Hercules Capital, Inc. | 25,039 | 363,817 |
| Main Street Capital Corp. | 6,398 | 236,342 |
| Oaktree Specialty Lending Corp. | 32,215 | 212,619 |
| Owl Rock Capital Corp. | 32,838 | 389,787 |
| PennantPark Investment Corp. | 33,243 | 197,796 |
| Runway Growth Finance Corp. | 15,760 | 213,075 |
| Saratoga Investment Corp. | 9,153 | 207,773 |
| Sixth Street Specialty Lending, Inc. | 14,699 | 266,934 |
| Trinity Capital, Inc. | 22,114 | 263,599 |
| TriplePoint Venture Growth BDC Corp. | 5,820 | 74,379 |
| Total investment companies (cost $5,006,742) | $5,529,253 |
|
| | | |
| SHORT-TERM INVESTMENTS (0.9%)* | Shares | Value |
| State Street Institutional U.S. Government Money Market Fund, Investor Class 2.93% | | 52,483 | $52,483 |
| Total short-term investments (cost $52,483) | $52,483 |
|
| |
| TOTAL INVESTMENTS |
| Total investments (cost $5,059,225) | $5,581,736 |
|
| |
| Key to holding’s abbreviations |
| BDC | Business Development Company |
|
| | | |
| Notes to the fund’s portfolio |
| Unless noted otherwise, the notes to the fund’s portfolio are for the close of the fund’s reporting period, which ran from September 29, 2022 (commencement of operations) through October 31, 2022 (the reporting period). Within the following notes to the portfolio, references to “Putnam Management” represent Putnam Investment Management, LLC, the fund’s manager, an indirect wholly-owned subsidiary of Putnam Investments, LLC and references to “ASC 820” represent Accounting Standards Codification 820 Fair Value Measurements and Disclosures. |
| * | Percentages indicated are based on net assets of $5,552,129. |
| For investments in State Street Institutional U.S. Government Money Market Fund, the rate quoted in the security description is the annualized 7-day yield of the fund at the close of the reporting period. |
|
| ASC 820 establishes a three-level hierarchy for disclosure of fair value measurements. The valuation hierarchy is based upon the transparency of inputs to the valuation of the fund’s investments. The three levels are defined as follows: |
Level 1: Valuations based on quoted prices for identical securities in active markets.
Level 2: Valuations based on quoted prices in markets that are not active or for which all significant inputs are observable, either directly or indirectly.
Level 3: Valuations based on inputs that are unobservable and significant to the fair value measurement.
| The following is a summary of the inputs used to value the fund’s net assets as of the close of the reporting period: |
|
| | | |
| | Valuation inputs |
| Investments in securities: | Level 1 | Level 2 | Level 3 |
| Investment companies | $5,529,253 | $— | $— |
| Short-term investments | 52,483 | — | — |
| Totals by level | $5,581,736 | $— | $— |
The accompanying notes are an integral part of these financial statements.
Statement of assets and liabilities 10/31/22 (Unaudited)
| |
| ASSETS | |
| Investment in securities, at value (Note 1): | |
| Unaffiliated issuers (identified cost $5,059,225) | $5,581,736 |
| Receivable for investments sold | 45,697 |
| Total assets | 5,627,433 |
| |
| LIABILITIES | |
| Payable for investments purchased | 72,074 |
| Payable for compensation of Manager (Note 2) | 3,230 |
| Total liabilities | 75,304 |
| | |
| Net assets | $5,552,129 |
| |
| REPRESENTED BY | |
| Paid-in capital (Unlimited shares authorized) (Notes 1, 4 and 5) | $5,014,071 |
| Total distributable earnings (Note 1) | 538,058 |
| Total — Representing net assets applicable to capital shares outstanding | $5,552,129 |
| |
| COMPUTATION OF NET ASSET VALUE | |
| Net asset value per share | |
| ($5,552,129 divided by 200,000 shares) | $27.76 |
The accompanying notes are an integral part of these financial statements.
Statement of operations For the period 9/29/22 (commencement of operations) to 10/31/22
| |
| INVESTMENT INCOME | |
| Dividends | $645 |
| Total investment income | 645 |
| |
| EXPENSES | |
| Compensation of Manager (Note 2) | 3,294 |
| Total expenses | 3,294 |
| | |
| Net investment loss | (2,649) |
| |
| REALIZED AND UNREALIZED GAIN (LOSS) | |
| Net realized gain (loss) on: | |
| Securities from unaffiliated issuers (Notes 1 and 3) | 18,196 |
| Total net realized gain | 18,196 |
| Change in net unrealized appreciation (depreciation) on: | |
| Securities from unaffiliated issuers | 522,511 |
| Total change in net unrealized appreciation | 522,511 |
| | |
| Net gain on investments | 540,707 |
| |
| Net increase in net assets resulting from operations | $538,058 |
The accompanying notes are an integral part of these financial statements.
Statement of changes in net assets
| | |
| | | For the period |
| | | 9/29/22 |
| | | (commencement |
| | | of operations) |
| INCREASE IN NET ASSETS | | to 10/31/22* |
| Operations | | |
| Net investment loss | | $(2,649) |
| Net realized gain on investments | | 18,196 |
| Change in net unrealized appreciation of investments | | 522,511 |
| Net increase in net assets resulting from operations | | 538,058 |
| Proceeds from shares sold (Note 4) | | 1,889,071 |
| Decrease from shares redeemed (Note 4) | | — |
| Total increase in net assets | | 2,427,129 |
| |
| NET ASSETS | | |
| Beginning of period (Note 5) | | 3,125,000 |
| End of period | | $5,552,129 |
| |
| NUMBER OF FUND SHARES | | |
| Shares outstanding at beginning of period (Note 5) | | 125,000 |
| Shares sold (Note 4) | | 75,000 |
| Shares redeemed (Note 4) | | — |
| Shares outstanding at end of period | | 200,000 |
*Unaudited.
The accompanying notes are an integral part of these financial statements.
Financial highlights
(For a common share outstanding throughout the period)
| | |
| PER-SHARE OPERATING PERFORMANCE | | |
| | | For the period |
| | | 9/29/22 |
| | | (commencement |
| | | of operations) |
| | | to 10/31/22 ** |
| Net asset value, beginning of period | | $25.00 |
| Investment operations: | | |
| Net investment income (loss) a,b | | (.01) |
| Net realized and unrealized | | |
| gain (loss) on investments | | 2.77 |
| Total from investment operations | | 2.76 |
| Less distributions: | | |
| From net investment income | | — |
| Total distributions | | — |
| Net asset value, end of period | | $27.76 |
| Total return at net asset value (%) c | | 11.04* |
| |
| RATIOS AND SUPPLEMENTAL DATA | | |
| Net assets, end of period | | |
| (in thousands) | | $5,552 |
| Ratio of expenses to average | | |
| net assets (%) d | | .07* |
| Ratio of net investment income | | |
| (loss) to average net assets (%) b | | (.06)* |
| Portfolio turnover (%) e | | 10* |
* Not annualized.
** Unaudited.
a Per share net investment income (loss) has been determined on the basis of the weighted average number of shares outstanding during the period.
b Reflects a dividend received by the fund from a single issuer which amounted to the following amounts:
| | |
| | Per share | Percentage of average net assets |
| October 31, 2022 | <$0.01 | 0.01% |
c Total return assumes dividend reinvestment.
d Excludes acquired fund fees and expenses, if any.
e Portfolio turnover excludes securities received or delivered in-kind.
The accompanying notes are an integral part of these financial statements.
Notes to financial statements 10/31/22 (Unaudited)
Within the following Notes to financial statements, references to “ETF” represent exchange-traded fund, references to “State Street” represent State Street Bank and Trust Company, references to “the SEC” represent the Securities and Exchange Commission, references to “Putnam Management” represent Putnam Investment Management, LLC, the fund’s manager, an indirect wholly-owned subsidiary of Putnam Investments, LLC and references to “OTC”, if any, represent over-the-counter. Unless otherwise noted, the “reporting period” represents the period from September 29, 2022 (commencement of operations) through October 31, 2022.
Putnam BDC Income ETF (the fund) is a non-diversified, open-end series of Putnam ETF Trust (the Trust), a Delaware statutory trust organized under the Investment Company Act of 1940, as amended. The fund is an actively managed ETF. The fund’s investment objective is to seek current income. The fund invests mainly in exchange-traded business development companies (“BDCs”). To qualify as a BDC, a company must be organized under the laws of, and have its principal place of business in, the United States, be registered with the SEC and have elected to be regulated as a BDC under the Investment Company Act of 1940, as amended (the “1940 Act”). BDCs are vehicles whose principal business is to invest in, lend capital to or provide services to privately-held U.S. companies or thinly traded U.S. public companies. Putnam Management will seek BDC investments that contribute to stability of dividend income and return potential. In selecting investments, Putnam Management expects to evaluate a BDC’s credit performance and risk level, potential changes in earnings and dividend levels, the impact of changes in interest rates on the BDC, and differences among BDCs in leverage and balance sheet structures. Given that the fund will invest in BDCs, a significant portion of its assets will have exposure to the financials sector. Putnam Management may consider, among other factors, a BDC’s valuation, financial strength, growth potential, competitive position in its industry, projected future earnings, cash flows and dividends, capital policies, and overall market conditions when deciding whether to buy or sell investments. Under normal circumstances, the fund invests at least 80% of the value of its net assets in BDCs. This policy is non-fundamental and may be changed only after 60 days’ notice to shareholders. The fund is “non-diversified,” which means it may invest a greater percentage of its assets in fewer issuers than a “diversified” fund.
In the normal course of business, the fund enters into contracts that may include agreements to indemnify another party under given circumstances. The fund’s maximum exposure under these arrangements is unknown as this would involve future claims that may be, but have not yet been, made against the fund. However, the fund’s management team expects the risk of material loss to be remote.
The fund has entered into contractual arrangements with an investment adviser, administrator, distributor, transfer agent and custodian, who each provide services to the fund. Unless expressly stated otherwise, shareholders are not parties to, or intended beneficiaries of these contractual arrangements, and these contractual arrangements are not intended to create any shareholder right to enforce them against the service providers or to seek any remedy under them against the service providers, either directly or on behalf of the fund.
Under the fund’s Amended and Restated Agreement and Declaration of Trust, any claims asserted against or on behalf of the Putnam Funds, including claims against Trustees and Officers, must be brought in courts of the State of Delaware.
Note 1: Significant accounting policies
The following is a summary of significant accounting policies consistently followed by the fund in the preparation of its financial statements. The preparation of financial statements is in conformity with accounting principles generally accepted in the United States of America and requires management to make estimates and assumptions that affect the reported amounts of assets and liabilities in the financial statements and the reported amounts of increases and decreases in net assets from operations. Actual results could differ from those estimates. Subsequent events after the Statement of assets and liabilities date through the date that the financial statements were issued have been evaluated in the preparation of the financial statements.
Security valuation Portfolio securities and other investments are valued using policies and procedures adopted by the Board of Trustees. The Trustees oversee the implementation of these procedures and have delegated responsibility for valuing the fund’s assets in accordance with these procedures to Putnam Management. Putnam Management has established an internal Valuation Committee that is responsible for making fair value determinations, evaluating the effectiveness of the pricing policies of the fund and reporting to the Trustees.
Investments for which market quotations are readily available are valued at the last reported sales price on their principal exchange, or official closing price for certain markets, and are classified as Level 1 securities under Accounting Standards Codification 820 Fair Value Measurements and Disclosures (ASC 820). If no sales are reported, as in the case of some securities that are traded OTC, a security is valued at its last reported bid price and is generally categorized as a Level 2 security. Short-term securities with remaining maturities of 60 days or less are valued using an independent pricing service approved by the Trustees, and are classified as Level 2 securities.
Investments in open-end investment companies (excluding exchange-traded funds), if any, which can be classified as Level 1 or Level 2 securities, are valued based on their net asset value. The net asset value of such investment companies equals the total value of their assets less their liabilities and divided by the number of their outstanding shares.
To the extent a pricing service or dealer is unable to value a security or provides a valuation that Putnam Management does not believe accurately reflects the security’s fair value, the security will be valued at fair value by Putnam Management in accordance with policies and procedures approved by the Trustees. Certain investments, including certain restricted and illiquid securities and derivatives, are also valued at fair value following procedures approved by the Trustees. These valuations consider such factors as significant market or specific security events such as interest rate or credit quality changes, various relationships with other securities, discount rates, U.S. Treasury, U.S. swap and credit yields, index levels, convexity exposures, recovery rates, sales and other multiples and resale restrictions. These securities are classified as Level 2 or as Level 3 depending on the priority of the significant inputs.
To assess the continuing appropriateness of fair valuations, the Valuation Committee reviews and affirms the reasonableness of such valuations on a regular basis after considering all relevant information that is reasonably available. Such valuations and procedures are reviewed periodically by the Trustees. The fair value of securities is generally determined as the amount that the fund could reasonably expect to realize from an orderly disposition of such securities over a reasonable period of time. By its nature, a fair value price is a good faith estimate of the value of a security in a current sale and does not reflect an actual market price, which may be different by a material amount.
Security transactions and related investment income Security transactions are recorded on the trade date (the date the order to buy or sell is executed). Gains or losses on securities sold are determined on the identified cost basis.
Dividend income, net of any applicable withholding taxes, if any, is recognized on the ex-dividend date except that certain dividends from foreign securities, if any, are recognized as soon as the fund is informed of the ex-dividend date. Non-cash dividends, if any, are recorded at the fair value of the securities received. Dividends representing a return of capital or capital gains, if any, are reflected as a reduction of cost and/or as a realized gain.
Lines of credit Effective October 14, 2022, the fund participates, along with other Putnam funds, in a $100 million unsecured committed line of credit and a $235.5 million unsecured uncommitted line of credit, both provided by State Street. Borrowings may be made for temporary or emergency purposes, including the funding of shareholder redemption requests and trade settlements. Interest is charged to the fund based on the fund’s borrowing at a rate equal to 1.25% plus the higher of (1) the Federal Funds rate and (2) the Overnight Bank Funding Rate for the committed line of credit and 1.30% plus the higher of (1) the Federal Funds rate and (2) the Overnight Bank Funding Rate for the uncommitted line of credit. A closing fee equal to 0.04% of the committed line of credit and 0.04% of the uncommitted line of credit has been paid by the participating funds. In addition, a commitment fee of 0.21% per annum on any unutilized portion of the committed line of credit is allocated to the participating funds based on their relative net assets and paid quarterly. During the reporting period, the fund had no borrowings against these arrangements.
Federal taxes It is the policy of the fund to distribute all of its taxable income within the prescribed time period and otherwise comply with the provisions of the Internal Revenue Code of 1986, as amended (the Code), applicable to regulated investment companies. It is also the intention of the fund to distribute an amount sufficient to avoid imposition of any excise tax under Section 4982 of the Code.
The fund is subject to the provisions of Accounting Standards Codification 740 Income Taxes (ASC 740). ASC 740 sets forth a minimum threshold for financial statement recognition of the benefit of a tax position taken or expected to be taken in a tax return. The fund did not have a liability to record for any unrecognized tax benefits in the accompanying financial statements. No provision has been made for federal taxes on income, capital gains or unrealized appreciation on securities held nor for excise tax on income and capital gains.
Tax cost of investments includes adjustments to net unrealized appreciation (depreciation) which may not necessarily be final tax cost basis adjustments, but closely approximate the tax basis unrealized gains and losses that may be realized and distributed to shareholders. The aggregate identified cost on a financial reporting and tax basis is the same.
Distributions to shareholders Distributions to shareholders from net investment income are recorded by the fund on the ex-dividend date. Distributions from capital gains, if any, are recorded on the ex-dividend date and paid at least annually. The amount and character of income and gains to be distributed are determined in accordance with income tax regulations, which may differ from generally accepted accounting principles. Dividend sources are estimated at the time of declaration. Actual results may vary. Any non-taxable return of capital cannot be determined until final tax calculations are completed after the end of the fund’s fiscal year. Reclassifications are made to the fund’s capital accounts to reflect income and gains available for distribution (or available capital loss carryovers) under income tax regulations.
Expenses of the Trust Expenses directly charged or attributable to any fund will be paid from the assets of that fund. Generally, expenses of the Trust will be allocated among and charged to the assets of each fund on a basis that the Trustees deem fair and equitable, which may be based on the relative assets of each fund or the nature of the services performed and relative applicability to each fund.
Note 2: Management fee, administrative services and other transactions
The fund pays the Manager an annual all-inclusive management fee of 0.75% based on the fund’s average daily net assets computed and paid monthly. The management fee covers investment management services and all of the fund’s organizational and other operating expenses with certain exceptions, including but not limited to: payments under distribution plans, interest and borrowing expenses, taxes, brokerage commissions and other transaction costs, fund proxy expenses, litigation expenses, extraordinary expenses and acquired fund fees and expenses. All costs related to organization and offering of the Trust were borne by the Manager.
Putnam Investments Limited (PIL), an affiliate of Putnam Management, is authorized by the Trustees to manage a separate portion of the assets of the fund as determined by Putnam Management from time to time. PIL did not manage any portion of the assets of the fund during the reporting period. If Putnam Management were to engage the services of PIL, Putnam Management would pay a quarterly sub-management fee to PIL for its services at an annual rate of 0.25% of the average net assets of the portion of the fund managed by PIL.
The fund has adopted a distribution and service plan pursuant to Rule 12b–1 under the 1940 Act that authorizes the fund to pay distribution fees in connection with the sale and distribution of its shares and service fees in connection with the provision of ongoing shareholder support services. No Rule 12b–1 fees are currently paid by the fund.
Note 3: Purchases and sales of securities
During the reporting period, the cost of purchases and the proceeds from sales, excluding short-term investments and in-kind transactions, were as follows:
| | |
| | Cost of purchases | Proceeds from sales |
| Investments in securities (Long-term) | $3,531,873 | $413,876 |
| U.S. government securities (Long-term) | — | — |
| Total | $3,531,873 | $413,876 |
Portfolio securities received or delivered through in-kind transactions were $1,870,549 and no monies, respectively.
The fund may purchase or sell investments from or to other Putnam funds in the ordinary course of business, which can reduce the fund’s transaction costs, at prices determined in accordance with SEC requirements and policies approved by the Trustees. During the reporting period, purchases or sales of long-term securities from or to other Putnam funds, if any, did not represent more than 5% of the fund’s total cost of purchases and/or total proceeds from sales.
Note 4: Capital shares
Shares of the fund are listed and traded on NYSE Arca, Inc., and individual fund shares may only be bought and sold in the secondary market through a broker or dealer at market price. These transactions, which do not involve the fund, are made at market prices that may vary throughout the day, rather than at net asset value (NAV). Shares of the fund may trade at a price greater than the fund’s NAV (premium) or less than the fund’s NAV (discount). An investor may incur costs attributable to the difference between the highest price a buyer is willing to pay to purchase shares (bid) and the lowest price a seller is willing to accept for shares (ask) when buying or selling fund shares in the secondary market (the “bid-ask spread”). The fund will issue and redeem shares in large blocks of 25,000 shares called “Creation Units” on a continuous basis, at NAV, with authorized participants who have entered into agreements with the fund’s distributor. The fund will generally issue and redeem Creation Units in return for a designated portfolio of securities (and an amount of cash) that the fund specifies each day. The fund generally imposes a transaction fee on investors purchasing or redeeming Creation Units. Investors transacting in Creation Units for cash may also pay an additional variable charge to compensate the fund for certain transaction costs and market impact expenses relating to investing in portfolio securities. Such variable charges, if any, are included in proceeds from shares sold in the Statement of changes in net assets.
At the close of the reporting period, Putnam Investment Holdings, LLC owned 125,000 shares of the fund (62.50% of shares outstanding), valued at $3,470,000.
Note 5: Initial capitalization and offering of shares
The fund was established as a series of the Trust on September 28, 2022. The fund had no operations other than those related to organizational matters, including the initial capital contribution of $3,125,000 by Putnam Investment Holdings, LLC and the issuance of 125,000 shares on September 29, 2022.
Note 6: Market, credit and other risks
In the normal course of business, the fund trades financial instruments and enters into financial transactions where risk of potential loss exists due to changes in the market (market risk) or failure of the contracting party to the transaction to perform (credit risk). The fund may be exposed to additional credit risk that an institution or other entity with which the fund has unsettled or open transactions will default.
Beginning in January 2020, global financial markets have experienced, and may continue to experience, significant volatility resulting from the spread of a virus known as Covid–19. The outbreak of Covid–19 has resulted in travel and border restrictions, quarantines, supply chain disruptions, lower consumer demand, and general market uncertainty. The effects of Covid–19 have adversely affected, and may continue to adversely affect, the global economy, the economies of certain nations, and individual issuers, all of which may negatively impact the fund’s performance.
Fund information
Founded over 80 years ago, Putnam Investments was built around the concept that a balance between risk and reward is the hallmark of a well-rounded financial program. We manage funds across income, value, blend, growth, sustainable, asset allocation, absolute return, and global sector categories.
| | |
| Investment Manager | Trustees | Susan G. Malloy |
| Putnam Investment | Liaquat Ahamed, Chair | Vice President and |
| Management, LLC | Aaron M. Cooper | Assistant Treasurer |
| 100 Federal Street | Katinka Domotorffy | |
| Boston, MA 02110 | Catharine Bond Hill | Alan G. McCormack |
| | Mona K. Sutphen | Vice President and |
| Investment Sub-Advisor | | Derivatives Risk Manager |
| Putnam Investments Limited | Officers | |
| 16 St James’s Street | Aaron M. Cooper | Venice Monagan |
| London, England SW1A 1ER | Executive Vice President | Assistant Secretary |
| | and Chief Operating Officer | |
| Distribution Services | | Caitlin Robinson |
| Foreside Fund Services, LLC | James F. Clark | Assistant Secretary |
| Three Canal Plaza, Suite 100 | Vice President and | |
| Portland, ME 04101 | Chief Compliance Officer | Janet C. Smith |
| | | Vice President, |
| Custodian | Peter Fariel | Principal Financial Officer, |
| State Street Bank | Secretary | Principal Accounting Officer, |
| and Trust Company | | and Treasurer |
| | Richard T. Kircher | |
| Legal Counsel | Vice President and | Stephen J. Tate |
| Dechert LLP | BSA Compliance Officer | Vice President and |
| | Chief Legal Officer |
| | Martin Lemaire | |
| | Vice President and | Mark C. Trenchard |
| | Derivatives Risk Manager | Vice President |
Call 1-833-228-5577 (toll free) Monday through Friday between 9:00 a.m. and 5:00 p.m. Eastern Time or visit putnam.com anytime for up-to-date information about the fund’s NAV.

| |
| Item 3. Audit Committee Financial Expert: |
| |
| Item 4. Principal Accountant Fees and Services: |
| |
| Item 5. Audit Committee of Listed Registrants |
| |
| Item 6. Schedule of Investments: |
| |
| The registrant’s schedule of investments in unaffiliated issuers is included in the report to shareholders in Item 1 above. |
| |
| Item 7. Disclosure of Proxy Voting Policies and Procedures For Closed-End Management Investment Companies: |
| |
| Item 8. Portfolio Managers of Closed-End Investment Companies |
| |
| Item 9. Purchases of Equity Securities by Closed-End Management Investment Companies and Affiliated Purchasers: |
| |
| Item 10. Submission of Matters to a Vote of Security Holders: |
| |
| Item 11. Controls and Procedures: |
| |
| (a) The registrant’s principal executive officer and principal financial officer have concluded, based on their evaluation of the effectiveness of the design and operation of the registrant’s disclosure controls and procedures as of a date within 90 days of the filing date of this report, that the design and operation of such procedures are generally effective to provide reasonable assurance that information required to be disclosed by the registrant in this report is recorded, processed, summarized and reported within the time periods specified in the Commission’s rules and forms. |
| |
| (b) Changes in internal control over financial reporting: Not applicable |
| |
| Item 12. Disclosures of Securities Lending Activities for Closed-End Investment Companies: |
| |
| Pursuant to the requirements of the Securities Exchange Act of 1934 and the Investment Company Act of 1940, the registrant has duly caused this report to be signed on its behalf by the undersigned, thereunto duly authorized. |
| |
| By (Signature and Title): |
| |
| /s/ Janet C. Smith
Janet C. Smith
Principal Accounting Officer
|
| |
| Pursuant to the requirements of the Securities Exchange Act of 1934 and the Investment Company Act of 1940, this report has been signed below by the following persons on behalf of the registrant and in the capacities and on the dates indicated. |
| |
| By (Signature and Title): |
| |
| /s/ Aaron Cooper
Aaron Cooper
Principal Executive Officer
|
| |
| By (Signature and Title): |
| |
| /s/ Janet C. Smith
Janet C. Smith
Principal Financial Officer
|