| | |
| UNITED STATES
SECURITIES AND EXCHANGE COMMISSION |
| | |
| CERTIFIED SHAREHOLDER REPORT OF REGISTERED
MANAGEMENT INVESTMENT COMPANIES
|
| | |
| Investment Company Act file number: | (811-23643) |
| | |
| Exact name of registrant as specified in charter: | Putnam ETF Trust |
| | |
| Address of principal executive offices: | 100 Federal Street, Boston, Massachusetts 02110 |
| | |
| Name and address of agent for service: | Stephen Tate, Vice President
100 Federal Street
Boston, Massachusetts 02110 |
| | |
| Copy to: | Bryan Chegwidden, Esq.
Ropes & Gray LLP
1211 Avenue of the Americas
New York, New York 10036 |
| | |
| | James E. Thomas, Esq.
Ropes & Gray LLP
800 Boylston Street
Boston, Massachusetts 02199 |
| | |
| Registrant’s telephone number, including area code: | (617) 292-1000 |
| | |
| Date of fiscal year end: | August 31, 2023 |
| | |
| Date of reporting period: | September 1, 2022 – February 28, 2023 |
| | |
|
Item 1. Report to Stockholders: | |
| | |
| The following is a copy of the report transmitted to stockholders pursuant to Rule 30e-1 under the Investment Company Act of 1940: | |
Putnam
Focused Large Cap
Growth ETF
Semiannual report
2 | 28 | 23
Message from the Trustees
April 11, 2023
Dear Shareholder:
In the first few months of 2023, we have seen continued U.S. economic growth, a strong jobs market, and persistent inflation. Stocks and bonds rallied in January but pulled back when reports of rising prices caused concern that the U.S. Federal Reserve would raise interest rates more than expected. Generally speaking, the Fed wants to slow economic activity to ease price pressures, but without causing a recession.
While Putnam’s investment teams are aware of the Fed’s balancing act, they remain focused on analyzing companies and individual securities. They see the potential risks in today’s economic environment but also monitor how businesses adjust and strive to perform well, even in an uncertain economy. Their insights help them carefully select securities and build portfolios to pursue returns for you.
Thank you for investing with Putnam.

Data are historical. Past performance does not guarantee future results. More recent returns may be less or more than those shown. Share price, principal value, and return will fluctuate, and you may have a gain or a loss when you sell your shares. Performance of fund shares assumes reinvestment of distributions and does not account for taxes. Fund returns in the bar chart are at net asset value (NAV). See below and pages 7–8 for additional performance information, including fund returns at market price. Index results should be compared with fund performance at NAV. To obtain the most recent month-end performance, please visit putnam.com or call 1-833-228-5577.
Returns for periods of less than one year are not annualized.
Lipper peer group median is provided by Lipper, a Refinitiv company.
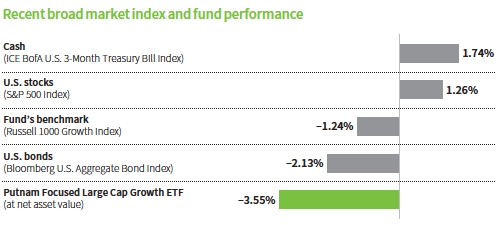
This comparison shows your fund’s performance in the context of broad market indexes for the six months ended 2/28/23. See above and pages 7–8 for additional fund performance information. Index descriptions can be found on page 11.
All Bloomberg indices are provided by Bloomberg Index Services Limited.
|
| 2 Focused Large Cap Growth ETF |


How was the market environment in the six-month reporting period?
Large-cap growth stocks, along with the broader equity markets, faced a difficult market environment. High inflation, the Russia-Ukraine War, and weakening global growth weighed on market sentiment. To address the high inflation, the Federal Reserve maintained its aggressive monetary stance, raising its benchmark interest rate four times during the six-month period. Investors feared the higher interest rates might tip the U.S. economy into a recession. Corporate earnings outlooks also declined for many companies.
Despite these concerns, stocks rallied in November 2022, thanks to better-than-expected third-quarter calendar 2022 earnings reports and cooling inflation. This sparked optimism that the Fed might soon begin to slow the pace of interest-rate hikes. After a difficult December, another rally followed in January 2023 amid more evidence that inflation was abating. This rally renewed hopes that the Fed might temper its aggressive monetary policy. Equities reversed course again in February. Investors feared the Fed might lift interest rates higher than anticipated
|
| Focused Large Cap Growth ETF 3 |

Allocations are shown as a percentage of the fund’s net assets as of 2/28/23. Cash and net other assets, if any, represent the market value weights of cash, derivatives, short-term securities, and other unclassified assets in the portfolio. Summary information may differ from the portfolio schedule included in the financial statements due to the inclusion of derivative securities, any interest accruals, the exclusion of as-of trades, if any, the use of different classifications of securities for presentation purposes, and rounding. Holdings and allocations may vary over time.

This table shows the fund’s top 10 holdings by percentage of the fund’s net assets as of 2/28/23. Short-term investments and derivatives, if any, are excluded. Holdings may vary over time.
|
| 4 Focused Large Cap Growth ETF |

following the release of rising inflation data and continued labor market tightness in January.
For the six-month period ended February 28, 2023, large-cap growth stocks, as measured by the fund’s benchmark, the Russell 1000 Growth Index, returned –1.24%, underperforming the 1.26% return of the broader equity market, as measured by the S&P 500 Index.
How did the fund perform in this environment?
For the six months ended February 28, 2023, the fund underperformed its benchmark and the median of the funds ranked in its Lipper peer group, Large-Cap Growth Funds. As always, we’re focused on what we believe are high-quality companies that can grow at above-market rates across a full economic cycle. These characteristics did not translate into excess returns during the six-month period.
What were some holdings that detracted from performance relative to the benchmark for the reporting period?
American Tower was the top detractor from relative performance for the period. Despite its recent underperformance, we believe the company continues to offer strong long-term growth potential. This company rents space on towers and rooftop antennas to wireless carriers and broadcasters — businesses that are transitioning to 5G wireless technology. We believe the rapid growth in connected devices and systems should drive carriers to invest rapidly in 5G networks globally over the next 15 years.
Live Nation Entertainment, a global market leader in live events and ticketing, also weighed on performance. Revenues have been strong and steady since 2021. However, the stock struggled due to concerns about the regulatory environment and third-party ticket vendors. We remain positive in our outlook for Live Nation due to secular growth tailwinds. An increasing number of concert events from artists reliant on touring for income and consumer demand for experiences over physical goods have translated into steady growth for the global live music industry. We believe more events and fans combined with better monetization from on-site fan spending and ticket pricing can generate increased sponsorship and advertising growth.
ADVANTAGES OF AN ACTIVE ETF
This ETF (exchange-traded fund) is an actively managed, semi-transparent ETF, making it different from a passive ETF or a traditional active ETF. As a semi-transparent ETF, it does not disclose all of the portfolio holdings on a daily basis. Instead, the fund discloses a daily tracking basket, which helps to protect information about portfolio holdings and their weightings from traders who might try to mimic the trades of the portfolio managers.
Active ETFs may be one of the most cost-effective ways for you to take advantage of active management strategies. They offer:
• Potential for outperformance: Active strategies pursue above-benchmark returns through investment research and portfolio positioning.
• Active risk management: Proactive research helps to identify better risk/reward potential and seeks to reduce unintended risk.
• Professional oversight: Experienced portfolio managers help active ETFs balance risk and return while delivering the ETF’s structural benefits.
|
| Focused Large Cap Growth ETF 5 |
Could you provide some examples of stocks that helped the fund’s performance relative to the benchmark for the reporting period?
NVIDIA was the top contributor to relative performance for the period. NVIDIA produces graphics processing units [GPUs] that are used for gaming and entertainment as well as for artificial intelligence. NVIDIA has a best-in-class reputation in the gaming community, in our view, and its market share in discrete GPUs is over 80%.
Another highlight was Dexcom, a company that helps individuals control their Type I or Type II diabetes through continuous glucose monitoring [CGM] systems. CGM systems continuously monitor blood sugar levels and send alerts when blood sugar levels are too high or too low, often to a smartphone or other device. We believe Dexcom is an innovative industry leader with growth potential that should prove resilient regardless of the macroeconomic backdrop. A key pillar in our thesis is Dexcom’s large and growing end market of individuals seeking to control their diabetes.
What is your outlook for the months ahead?
Our focus remains on companies within the large-cap growth universe with what we believe have higher-quality business models and stronger track records that we believe should prove more resilient in a wide array of operating and market scenarios. While we are less certain of the arc of the broader markets for the remainder of calendar 2023, we are optimistic that a heightened focus on business fundamentals will support our strategy and fund performance over time.
Thank you both for your time and insights today.
The views expressed in this report are exclusively those of Putnam Management and are subject to change. They are not meant as investment advice.
Please note that the holdings discussed in this report may not have been held by the fund for the entire period. Portfolio composition is subject to review in accordance with the fund’s investment strategy and may vary in the future. Current and future portfolio holdings are subject to risk. Statements in the Q&A concerning the fund’s performance or portfolio composition relative to those of the fund’s Lipper peer group may reference information produced by Lipper Inc. or through a third party.

This table shows the fund’s largest allocation shifts, by percentage, over the past six months. Allocations are shown as a percentage of the fund’s net assets. Current period summary information may differ from the portfolio schedule included in the financial statements due to the inclusion of derivative securities, any interest accruals, the exclusion of as-of trades, if any, the use of different classifications of securities for presentation purposes, and rounding. Holdings and allocations may vary over time.
|
| 6 Focused Large Cap Growth ETF |
Your fund’s performance
This section shows your fund’s performance, price, and distribution information for periods ended February 28, 2023, the end of the first half of its current fiscal year. We also include performance information as of the most recent calendar quarter-end. Performance should always be considered in light of a fund’s investment strategy. Data represent past performance. Past performance does not guarantee future results. More recent returns may be less or more than those shown. Investment return, net asset value, and market price will fluctuate, and you may have a gain or a loss when you sell your shares. For the most recent month-end performance, please visit putnam.com or call 1-833-228-5577.
Annualized fund performance Total return for periods ended 2/28/23
| | | |
| | Life of fund | | |
| | (since 5/25/21) | 1 year | 6 months |
| Net asset value | –8.58% | –15.76% | –3.55% |
| Market price | –8.44 | –15.39 | –3.47 |
Current performance may be lower or higher than the quoted past performance, which cannot guarantee future results. Performance assumes reinvestment of distributions and does not account for taxes.
Performance includes the deduction of management fees.
Returns for periods of less than one year are not annualized.
For a portion of the periods, the fund had expense limitations, without which returns would have been lower.
Comparative annualized index returns For periods ended 2/28/23
| | | |
| | Life of fund | | |
| | (since 5/25/21) | 1 year | 6 months |
| Russell 1000 Growth Index | –5.16% | –13.34% | –1.24% |
| Lipper Large-Cap Growth Funds category median* | –9.39 | –15.77 | –1.67 |
Index and Lipper results should be compared with fund performance at net asset value.
Returns for periods of less than one year are not annualized.
Lipper peer group median is provided by Lipper, a Refinitiv company.
* Over the 6-month, 1-year, and life-of-fund periods ended 2/28/23, there were 680, 670, and 657 funds, respectively, in this Lipper category.
Fund price and distribution information For the six-month period ended 2/28/23
| | | |
| Distributions | | | |
| Number | | 1 | |
| Income | | $0.024 | |
| Capital gains | | — | |
| Total | | $0.024 | |
| Share value | Net asset value | | Market price |
| 8/31/22 | $22.14 | | $22.18 |
| 2/28/23 | 21.33 | | 21.39 |
The classification of distributions, if any, is an estimate. Final distribution information will appear on your year-end tax forms.
|
| Focused Large Cap Growth ETF 7 |
Annualized fund performance as of most recent calendar quarter
Total return for periods ended 3/31/23
| | | |
| | Life of fund | | |
| | (since 5/25/21) | 1 year | 6 months |
| Net asset value | –4.49% | –13.22% | 14.82% |
| Market price | –4.51 | –13.35 | 14.70 |
See the discussion following the fund performance table on page 7 for information about the calculation of fund performance.
Returns for periods of less than one year are not annualized.
Your fund’s expenses
As an investor, you pay ongoing expenses, such as management fees, and other expenses (with certain exceptions). In the most recent six-month period, your fund’s expenses were limited; had expenses not been limited, they would have been higher. Using the following information, you can estimate how these expenses affect your investment and compare them with the expenses of other funds. You may also pay brokerage commissions in connection with your purchase or sale of shares of the fund, which are not shown in this section and would have resulted in higher total expenses. The expenses shown in the example also do not reflect transaction costs, which would have resulted in higher total expenses. For more information, see your fund’s prospectus or talk to your financial representative.
Expense ratios
| | |
| Total annual operating expenses for the fiscal year ended 8/31/22 | 0.55% |
| Annualized expense ratio for the six-month period ended 2/28/23* | 0.62% |
Fiscal year expense information in this table is taken from the most recent prospectus, is subject to change, and may differ from that shown for the annualized expense ratio and in the financial highlights of this report.
Expenses are shown as a percentage of average net assets.
* Includes one-time annualized proxy cost of 0.07%.
Expenses per $1,000
The following table shows the expenses you would have paid on a $1,000 investment in the fund from 9/1/22 to 2/28/23. It also shows how much a $1,000 investment would be worth at the close of the period, assuming actual returns and expenses.
| | |
| Expenses paid per $1,000*† | $3.02 |
| Ending value (after expenses) | $964.50 |
* Expenses are calculated using the fund’s annualized expense ratio, which represents the ongoing expenses as a percentage of average net assets for the six months ended 2/28/23.
† Expenses are calculated by multiplying the expense ratio by the average account value for the period; then multiplying the result by the number of days in the period (181); and then dividing that result by the number of days in the year (365).
|
| 8 Focused Large Cap Growth ETF |
Estimate the expenses you paid
To estimate the ongoing expenses you paid for the six months ended 2/28/23, use the following calculation method. To find the value of your investment on 9/1/22, call 1-833-228-5577.

Compare expenses using the SEC’s method
The Securities and Exchange Commission (SEC) has established guidelines to help investors assess fund expenses. Per these guidelines, the following table shows your fund’s expenses based on a $1,000 investment, assuming a hypothetical 5% annualized return. You can use this information to compare the ongoing expenses (but not transaction expenses or total costs) of investing in the fund with those of other funds. All shareholder reports will provide this information to help you make this comparison. Please note that you cannot use this information to estimate your actual ending account balance and expenses paid during the period.
| | |
| Expenses paid per $1,000*† | $3.11 |
| Ending value (after expenses) | $1,021.72 |
* Expenses are calculated using the fund’s annualized expense ratio, which represents the ongoing expenses as a percentage of average net assets for the six months ended 2/28/23.
† Expenses are calculated by multiplying the expense ratio by the average account value for the six-month period; then multiplying the result by the number of days in the six-month period (181); and then dividing that result by the number of days in the year (365).
|
| Focused Large Cap Growth ETF 9 |
Consider these risks before investing
Growth stocks may be more susceptible to earnings disappointments, and the market may not favor growth-style investing. The value of investments in the fund’s portfolio may fall or fail to rise over extended periods of time for a variety of reasons, including general economic, political, or financial market conditions; investor sentiment and market perceptions; government actions; geopolitical events or changes; and factors related to a specific issuer, geography, industry, or sector. These and other factors may lead to increased volatility and reduced liquidity in the fund’s portfolio holdings. From time to time, the fund may invest a significant portion of its assets in companies in one or more related industries or sectors, which would make the fund more vulnerable to adverse developments affecting those industries or sectors.
The fund publishes each business day on its website a “Tracking Basket,” the structure of which may affect the price at which shares of the fund trade in the secondary market. ETFs trading on the basis of a published Tracking Basket may trade at a wider bid/ask spread than ETFs that publish their portfolios on a daily basis, and therefore, may cost investors more to trade. Additionally, unlike ETFs that publicly disclose their complete portfolio holdings each business day, the fund provides certain other information intended to allow market participants to estimate the value of positions in fund shares, and there is no guarantee the fund’s arbitrage mechanism will operate as intended and that the fund will not experience wide bid/ask spreads and/or large discount or premiums to NAV. Disruptions to creations and redemptions, the existence of extreme market volatility, or potential lack of an active trading market for the fund’s shares may result in the fund’s shares trading significantly above (at a premium) or below (at a discount) to NAV.
The fund also has a limited public trading history, and there can be no assurance that an active trading market will develop or be maintained or that the market for fund shares will operate as intended. As a result, it may cost investors more to trade fund shares than shares of other ETFs.
Our investment techniques, analyses, and judgments may not produce the outcome we intend. The investments we select for the fund may not perform as well as other securities that we do not select for the fund. We, or the fund’s other service providers, may experience disruptions or operating errors that could have a negative effect on the fund. You can lose money by investing in the fund.
|
| 10 Focused Large Cap Growth ETF |
Terms and definitions
Important terms
Total return shows how the value of the fund’s shares changed over time, assuming you held the shares through the entire period and reinvested all distributions in the fund.
Net asset value (NAV) is the value of all your fund’s assets, minus any liabilities, divided by the number of outstanding shares.
Market price is the current trading price of one share of the fund. Market prices are set by transactions between buyers and sellers on exchanges such as the New York Stock Exchange.
Comparative indexes
Bloomberg U.S. Aggregate Bond Index is an unmanaged index of U.S. investment-grade fixed income securities.
ICE BofA (Intercontinental Exchange Bank of America) U.S. 3-Month Treasury Bill Index is an unmanaged index that seeks to measure the performance of U.S. Treasury bills available in the marketplace.
Russell 1000® Growth Index is an unmanaged index of those companies in the large-cap Russell 1000 Index chosen for their growth orientation.
S&P 500® Index is an unmanaged index of common stock performance.
Indexes assume reinvestment of all distributions and do not account for fees. Securities and performance of a fund and an index will differ. You cannot invest directly in an index.
BLOOMBERG® is a trademark and service mark of Bloomberg Finance L.P. and its affiliates (collectively “Bloomberg”). Bloomberg or Bloomberg’s licensors own all proprietary rights in the Bloomberg Indices. Neither Bloomberg nor Bloomberg’s licensors approve or endorse this material, or guarantee the accuracy or completeness of any information herein, or make any warranty, express or implied, as to the results to be obtained therefrom, and to the maximum extent allowed by law, neither shall have any liability or responsibility for injury or damages arising in connection therewith.
Frank Russell Company is the source and owner of the trademarks, service marks, and copyrights related to the Russell Indexes. Russell® is a trademark of Frank Russell Company.
ICE Data Indices, LLC (“ICE BofA”), used with permission. ICE BofA permits use of the ICE BofA indices and related data on an “as is” basis; makes no warranties regarding same; does not guarantee the suitability, quality, accuracy, timeliness, and/or completeness of the ICE BofA indices or any data included in, related to, or derived therefrom; assumes no liability in connection with the use of the foregoing; and does not sponsor, endorse, or recommend Putnam Investments, or any of its products or services.
Lipper, a Refinitiv company, is a third-party industry-ranking entity that ranks funds. Its rankings do not reflect sales charges. Lipper rankings are based on total return at net asset value relative to other funds that have similar current investment styles or objectives as determined by Lipper. Lipper may change a fund’s category assignment at its discretion. Lipper category medians reflect performance trends for funds within a category.
|
| Focused Large Cap Growth ETF 11 |
Other information for shareholders
Important notice regarding delivery of shareholder documents
In accordance with Securities and Exchange Commission (SEC) regulations, Putnam sends a single notice of internet availability, or a single printed copy, of annual and semiannual shareholder reports, prospectuses, and proxy statements to Putnam shareholders who share the same address, unless a shareholder requests otherwise. If you prefer to receive your own copy of these documents, please call Putnam at 1-800-225-1581, or, for exchange-traded funds only, 1-833-228-5577. We will begin sending individual copies within 30 days.
Proxy voting
Putnam is committed to managing our funds in the best interests of our shareholders. The Putnam funds’ proxy voting guidelines and procedures, as well as information regarding how your fund voted proxies relating to portfolio securities during the 12-month period ended June 30, 2022, are available in the Individual Investors section of putnam.com and on the SEC’s website, www.sec.gov. If you have questions about finding forms on the SEC’s website, you may call the SEC at 1-800-SEC-0330. You may also obtain the Putnam funds’ proxy voting guidelines and procedures at no charge by calling Putnam’s Shareholder Services at 1-800-225-1581, or, for exchange-traded funds only, 1-833-228-5577.
Fund portfolio holdings
The fund will file a complete schedule of its portfolio holdings with the SEC for the first and third quarters of each fiscal year on Form N-PORT within 60 days of the end of such fiscal quarter. Shareholders may obtain the fund’s Form N-PORT on the SEC’s website at www.sec.gov.
Trustee and employee fund ownership
Putnam employees and members of the Board of Trustees place their faith, confidence, and, most importantly, investment dollars in Putnam funds. As of February 28, 2023, Putnam employees had approximately $450,000,000 and the Trustees had approximately $63,000,000 invested in Putnam funds. These amounts include investments by the Trustees’ and employees’ immediate family members as well as investments through retirement and deferred compensation plans.
|
| 12 Focused Large Cap Growth ETF |
Financial statements
These sections of the report, as well as the accompanying Notes, constitute the fund’s financial statements.
The fund’s portfolio lists all the fund’s investments and their values as of the last day of the reporting period. Holdings are organized by asset type and industry sector, country, or state to show areas of concentration and diversification.
Statement of assets and liabilities shows how the fund’s net assets and share price are determined. All investment and non-investment assets are added together. Any unpaid expenses and other liabilities are subtracted from this total. The result is divided by the number of shares to determine the net asset value per share, which is calculated separately for each class of shares. (For funds with preferred shares, the amount subtracted from total assets includes the liquidation preference of preferred shares.)
Statement of operations shows the fund’s net investment gain or loss. This is done by first adding up all the fund’s earnings — from dividends and interest income — and subtracting its operating expenses to determine net investment income (or loss). Then, any net gain or loss the fund realized on the sales of its holdings — as well as any unrealized gains or losses over the period — is added to or subtracted from the net investment result to determine the fund’s net gain or loss for the fiscal period.
Statement of changes in net assets shows how the fund’s net assets were affected by the fund’s net investment gain or loss, by distributions to shareholders, and by changes in the number of the fund’s shares. It lists distributions and their sources (net investment income or realized capital gains) over the current reporting period and the most recent fiscal year-end. The distributions listed here may not match the sources listed in the Statement of operations because the distributions are determined on a tax basis and may be paid in a different period from the one in which they were earned. Dividend sources are estimated at the time of declaration. Actual results may vary. Any non-taxable return of capital cannot be determined until final tax calculations are completed after the fund’s fiscal period.
Financial highlights provide an overview of the fund’s investment results, per-share distributions, expense ratios, net investment income ratios, and portfolio turnover (not required for money market funds) in one summary table, reflecting the five most recent reporting periods. In a semiannual report, the highlights table also includes the current reporting period.
|
| Focused Large Cap Growth ETF 13 |
| | |
| The fund’s portfolio 2/28/23 (Unaudited) | | |
|
| | |
| COMMON STOCKS (97.6%)* | Shares | Value |
| Aerospace and defense (1.9%) | | |
| TransDigm Group, Inc. | 661 | $491,698 |
| | 491,698 |
| Automobiles (2.9%) | | |
| Tesla, Inc. † | 3,681 | 757,219 |
| | 757,219 |
| Building products (0.7%) | | |
| Johnson Controls International PLC | 2,921 | 183,205 |
| | 183,205 |
| Capital markets (2.9%) | | |
| Charles Schwab Corp. (The) | 4,950 | 385,704 |
| MSCI, Inc. | 661 | 345,141 |
| | 730,845 |
| Chemicals (1.4%) | | |
| Sherwin-Williams Co. (The) | 1,633 | 361,465 |
| | 361,465 |
| Commercial services and supplies (1.4%) | | |
| Waste Connections, Inc. | 2,639 | 353,415 |
| | 353,415 |
| Entertainment (1.3%) | | |
| Live Nation Entertainment, Inc. † | 4,633 | 333,854 |
| | 333,854 |
| Equity real estate investment trusts (REITs) (2.0%) | | |
| American Tower Corp. | 2,647 | 524,132 |
| | 524,132 |
| Food and staples retailing (1.9%) | | |
| Costco Wholesale Corp. | 991 | 479,822 |
| | 479,822 |
| Food products (1.5%) | | |
| Hershey Co. (The) | 1,656 | 394,658 |
| | 394,658 |
| Health-care equipment and supplies (1.7%) | | |
| Dexcom, Inc. † | 2,641 | 293,177 |
| IDEXX Laboratories, Inc. † | 329 | 155,696 |
| | 448,873 |
| Health-care providers and services (7.2%) | | |
| HCA Healthcare, Inc. | 1,654 | 402,666 |
| Humana, Inc. | 661 | 327,208 |
| UnitedHealth Group, Inc. | 2,314 | 1,101,325 |
| | 1,831,199 |
| Hotels, restaurants, and leisure (1.9%) | | |
| Chipotle Mexican Grill, Inc. † | 331 | 493,547 |
| | 493,547 |
| Interactive media and services (4.8%) | | |
| Alphabet, Inc. Class A † | 13,554 | 1,220,673 |
| | 1,220,673 |
| Internet and direct marketing retail (4.9%) | | |
| Amazon.com, Inc. † | 13,224 | 1,246,098 |
| | 1,246,098 |
| |
14 Focused Large Cap Growth ETF |
| | |
| COMMON STOCKS (97.6%)* cont. | Shares | Value |
| IT Services (7.5%) | | |
| Accenture PLC Class A | 1,651 | $438,423 |
| Mastercard, Inc. Class A | 2,308 | 820,009 |
| Visa, Inc. Class A | 2,983 | 656,081 |
| | 1,914,513 |
| Life sciences tools and services (1.3%) | | |
| Danaher Corp. | 1,313 | 325,007 |
| | 325,007 |
| Personal products (1.6%) | | |
| Estee Lauder Cos., Inc. (The) Class A | 1,651 | 401,276 |
| | 401,276 |
| Pharmaceuticals (2.3%) | | |
| Eli Lilly and Co. | 990 | 308,108 |
| Merck & Co., Inc. | 2,649 | 281,430 |
| | 589,538 |
| Professional services (0.5%) | | |
| CoStar Group, Inc. † | 1,661 | 117,366 |
| | 117,366 |
| Road and rail (1.1%) | | |
| Union Pacific Corp. | 1,329 | 275,475 |
| | 275,475 |
| Semiconductors and semiconductor equipment (7.8%) | | |
| Advanced Micro Devices, Inc. † | 3,077 | 241,791 |
| Applied Materials, Inc. | 3,308 | 384,224 |
| NVIDIA Corp. | 5,953 | 1,382,048 |
| | 2,008,063 |
| Software (18.9%) | | |
| Cadence Design Systems, Inc. † | 2,975 | 573,997 |
| Intuit, Inc. | 991 | 403,515 |
| Microsoft Corp. | 10,918 | 2,723,168 |
| Oracle Corp. | 5,286 | 461,996 |
| Palo Alto Networks, Inc. † | 2,976 | 560,589 |
| Salesforce, Inc. † | 755 | 123,526 |
| | 4,846,791 |
| Specialty retail (1.5%) | | |
| Home Depot, Inc. (The) | 1,323 | 392,322 |
| | 392,322 |
| Technology hardware, storage, and peripherals (11.8%) | | |
| Apple, Inc. | 20,514 | 3,023,969 |
| | 3,023,969 |
| Textiles, apparel, and luxury goods (3.4%) | | |
| Lululemon Athletica, Inc. (Canada) † | 990 | 306,108 |
| Nike, Inc. Class B | 4,641 | 551,304 |
| | 857,412 |
| Wireless telecommunication services (1.5%) | | |
| T-Mobile US, Inc. † | 2,642 | 375,641 |
| | 375,641 |
| Total common stocks (cost $25,503,111) | $24,978,076 |
|
| |
Focused Large Cap Growth ETF 15 |
| | | |
| SHORT-TERM INVESTMENTS (2.4%)* | Shares | Value |
| Putnam Government Money Market Fund Class P 4.18% L | | 626,682 | $626,682 |
| Total short-term investments (cost $626,682) | $626,682 |
|
| |
| TOTAL INVESTMENTS |
| Total investments (cost $26,129,793) | $25,604,758 |
|
| | | |
| Notes to the fund’s portfolio |
| Unless noted otherwise, the notes to the fund’s portfolio are for the close of the fund’s reporting period, which ran from September 1, 2022 through February 28, 2023 (the reporting period). Within the following notes to the portfolio, references to “Putnam Management” represent Putnam Investment Management, LLC, the fund’s manager, an indirect wholly-owned subsidiary of Putnam Investments, LLC and references to “ASC 820” represent Accounting Standards Codification 820 Fair Value Measurements and Disclosures. |
| * | Percentages indicated are based on net assets of $25,592,738. |
| † | This security is non-income-producing. |
| L | Affiliated company (Note 5). The rate quoted in the security description is the annualized 7-day yield of the fund at the close of the reporting period. |
|
| ASC 820 establishes a three-level hierarchy for disclosure of fair value measurements. The valuation hierarchy is based upon the transparency of inputs to the valuation of the fund’s investments. The three levels are defined as follows: |
Level 1: Valuations based on quoted prices for identical securities in active markets.
Level 2: Valuations based on quoted prices in markets that are not active or for which all significant inputs are observable, either directly or indirectly.
Level 3: Valuations based on inputs that are unobservable and significant to the fair value measurement.
| The following is a summary of the inputs used to value the fund’s net assets as of the close of the reporting period: |
|
| | | |
| | Valuation inputs |
| Investments in securities: | Level 1 | Level 2 | Level 3 |
| Common stocks*: | | | |
| Communication services | $1,930,168 | $— | $— |
| Consumer discretionary | 3,746,598 | — | — |
| Consumer staples | 1,275,756 | — | — |
| Financials | 730,845 | — | — |
| Health care | 3,194,617 | — | — |
| Industrials | 1,421,159 | — | — |
| Information technology | 11,793,336 | — | — |
| Materials | 361,465 | — | — |
| Real estate | 524,132 | — | — |
| Total common stocks | 24,978,076 | — | — |
| Short-term investments | 626,682 | — | — |
| Totals by level | $25,604,758 | $— | $— |
| * Common stock classifications are presented at the sector level, which may differ from the fund’s portfolio presentation. |
The accompanying notes are an integral part of these financial statements.
| |
16 Focused Large Cap Growth ETF |
Statement of assets and liabilities 2/28/23 (Unaudited)
| |
| ASSETS | |
| Investment in securities, at value (Note 1): | |
| Unaffiliated issuers (identified cost $25,503,111) | $24,978,076 |
| Affiliated issuers (identified cost $626,682) (Note 5) | 626,682 |
| Cash | 932 |
| Dividends, interest and other receivables | 19,087 |
| Receivable for investments sold | 557,204 |
| Total assets | 26,181,981 |
| |
| LIABILITIES | |
| Payable for investments purchased | 36,335 |
| Payable for shares of the fund repurchased | 533,180 |
| Payable for compensation of Manager (Note 2) | 16,339 |
| Other accrued expenses | 3,389 |
| Total liabilities | 589,243 |
| | |
| Net assets | $25,592,738 |
| |
| REPRESENTED BY | |
| Paid-in capital (Unlimited shares authorized) (Notes 1 and 4) | $27,718,200 |
| Total distributable earnings (Note 1) | (2,125,462) |
| Total — Representing net assets applicable to capital shares outstanding | $25,592,738 |
| |
| COMPUTATION OF NET ASSET VALUE | |
| Net asset value per share | |
| ($25,592,738 divided by 1,200,001 shares) | $21.33 |
The accompanying notes are an integral part of these financial statements.
|
| Focused Large Cap Growth ETF 17 |
Statement of operations Six months ended 2/28/23 (Unaudited)
| |
| INVESTMENT INCOME | |
| Dividends (net of foreign tax of $147) | $52,974 |
| Interest (including interest income of $2,155 from investments in affiliated issuers) (Note 5) | 2,155 |
| Total investment income | 55,129 |
| |
| EXPENSES | |
| Compensation of Manager (Note 2) | 34,009 |
| Other | 4,342 |
| Fees waived and reimbursed by Manager (Note 2) | (134) |
| Total expenses | 38,217 |
| | |
| Net investment income | 16,912 |
| |
| REALIZED AND UNREALIZED GAIN (LOSS) | |
| Net realized gain (loss) on: | |
| Securities from unaffiliated issuers (Notes 1 and 3) | (704,689) |
| Foreign currency transactions (Note 1) | (1) |
| Securities from in-kind transactions (Notes 1 and 3) | 121,013 |
| Total net realized loss | (583,677) |
| Change in net unrealized appreciation (depreciation) on: | |
| Securities from unaffiliated issuers | 43,351 |
| Assets and liabilities in foreign currencies | 4 |
| Total change in net unrealized appreciation | 43,355 |
| | |
| Net loss on investments | (540,322) |
| |
| Net decrease in net assets resulting from operations | $(523,410) |
The accompanying notes are an integral part of these financial statements.
|
| 18 Focused Large Cap Growth ETF |
Statement of changes in net assets
| | |
| INCREASE (DECREASE) IN NET ASSETS | Six months ended 2/28/23* | Year ended 8/31/22 |
| Operations | | |
| Net investment income (loss) | $16,912 | $(2,267) |
| Net realized loss on investments | | |
| and foreign currency transactions | (583,677) | (884,579) |
| Change in net unrealized appreciation (depreciation) | | |
| of investments and assets and liabilities | | |
| in foreign currencies | 43,355 | (1,518,626) |
| Net decrease in net assets resulting from operations | (523,410) | (2,405,472) |
| Distributions to shareholders (Note 1): | | |
| From ordinary income | | |
| Net investment income | (10,800) | — |
| Proceeds from shares sold (Note 4) | 17,206,412 | 3,467,306 |
| Decrease from shares redeemed (Note 4) | (1,596,923) | (1,367,570) |
| Total increase (decrease) in net assets | 15,075,279 | (305,736) |
| |
| NET ASSETS | | |
| Beginning of period | 10,517,459 | 10,823,195 |
| End of period | $25,592,738 | $10,517,459 |
| |
| NUMBER OF FUND SHARES | | |
| Shares outstanding at beginning of period | 475,001 | 375,001 |
| Shares sold (Note 4) | 800,000 | 150,000 |
| Shares redeemed (Note 4) | (75,000) | (50,000) |
| Shares outstanding at end of period | 1,200,001 | 475,001 |
*Unaudited.
The accompanying notes are an integral part of these financial statements.
|
| Focused Large Cap Growth ETF 19 |
Financial highlights
(For a common share outstanding throughout the period)
| | | |
| PER-SHARE OPERATING PERFORMANCE | | | |
| | | | For the period |
| | | | 5/25/21 |
| | Six months | Year | (commencement |
| | ended | ended | of operations) |
| | 2/28/23** | 8/31/22 | to 8/31/21 |
| Net asset value, beginning of period | $22.14 | $28.86 | $25.00 |
| Investment operations: | | | |
| Net investment income (loss) a | .03 | (.01) | (.01)g |
| Net realized and unrealized | | | |
| gain (loss) on investments | (.82) | (6.71) | 3.87 |
| Total from investment operations | (.79) | (6.72) | 3.86 |
| Less distributions: | | | |
| From net investment income | (.02) | — | — |
| Total distributions | (.02) | — | — |
| Net asset value, end of period | $21.33 | $22.14 | $28.86 |
| Total return at net asset value (%) b | (3.55)* | (23.28) | 15.44* |
| |
| RATIOS AND SUPPLEMENTAL DATA | | | |
| Net assets, end of period | | | |
| (in thousands) | $25,593 | $10,517 | $10,823 |
| Ratio of expenses to average | | | |
| net assets (%) c | .31*e,f | .55 | .15* |
| Ratio of net investment income | | | |
| (loss) to average net assets (%) | .14*e | (.02) | (.03)*g |
| Portfolio turnover (%) d | 25* | 52 | 15* |
* Not annualized.
** Unaudited.
a Per share net investment income (loss) has been determined on the basis of the weighted average number of shares outstanding during the period.
b Total return assumes dividend reinvestment.
c Excludes acquired fund fees and expenses, if any.
d Portfolio turnover excludes securities received or delivered in-kind.
e Reflects waivers of certain fund expenses in connection with investments in Putnam Government Money Market Fund during the period. As a result of such waivers, the expenses of the fund reflect a reduction of less than 0.01% as a percentage of average net assets (Note 2).
f Includes one-time proxy cost of 0.03%.
g Reflects a dividend received by the fund from a single issuer which amounted to the following amounts:
| | |
| | Per share | Percentage of average net assets |
| August 31, 2021 | $0.01 | 0.02% |
The accompanying notes are an integral part of these financial statements.
|
| 20 Focused Large Cap Growth ETF |
Notes to financial statements 2/28/23 (Unaudited)
Within the following Notes to financial statements, references to “ETF” represent exchange-traded fund, references to “State Street” represent State Street Bank and Trust Company, references to “the SEC” represent the Securities and Exchange Commission, references to “Putnam Management” represent Putnam Investment Management, LLC, the fund’s manager, an indirect wholly-owned subsidiary of Putnam Investments, LLC. Additionally, references to “OTC”, if any, represent over-the-counter and references to “ESG”, if any, represent environmental, social and governance. Unless otherwise noted, the “reporting period” represents the period from September 1, 2022 through February 28, 2023.
Putnam Focused Large Cap Growth ETF (the fund) is a non-diversified, open-end series of Putnam ETF Trust (the Trust), a Delaware statutory trust organized under the Investment Company Act of 1940, as amended. The fund is an actively managed ETF that operates pursuant to an exemptive order from the SEC. The fund’s investment objective is to seek capital appreciation. The fund invests mainly in common stocks of large U.S. companies, with a focus on growth stocks. Under normal circumstances, Putnam Management invests at least 80% of the fund’s net assets in companies of a size similar to those in the Russell 1000 Growth Index. This policy may be changed only after 60 days’ notice to shareholders. Growth stocks are stocks of companies whose earnings are expected to grow faster than those of similar firms, and whose business growth and other characteristics may lead to an increase in stock price. As of September 30, 2022, the index was composed of companies having market capitalizations of between approximately $1.4 billion to $2.2 trillion. Putnam Management may consider, among other factors, a company’s valuation, financial strength, growth potential, competitive position in its industry, projected future earnings, cash flows and dividends when deciding whether to buy or sell investments.
In the normal course of business, the fund enters into contracts that may include agreements to indemnify another party under given circumstances. The fund’s maximum exposure under these arrangements is unknown as this would involve future claims that may be, but have not yet been, made against the fund. However, the fund’s management team expects the risk of material loss to be remote.
The fund has entered into contractual arrangements with an investment adviser, administrator, distributor, transfer agent and custodian, who each provide services to the fund. Unless expressly stated otherwise, shareholders are not parties to, or intended beneficiaries of these contractual arrangements, and these contractual arrangements are not intended to create any shareholder right to enforce them against the service providers or to seek any remedy under them against the service providers, either directly or on behalf of the fund.
Under the fund’s Amended and Restated Agreement and Declaration of Trust, any claims asserted against or on behalf of the Putnam Funds, including claims against Trustees and Officers, must be brought in courts of the State of Delaware.
Note 1: Significant accounting policies
The following is a summary of significant accounting policies consistently followed by the fund in the preparation of its financial statements. The preparation of financial statements is in conformity with accounting principles generally accepted in the United States of America and requires management to make estimates and assumptions that affect the reported amounts of assets and liabilities in the financial statements and the reported amounts of increases and decreases in net assets from operations. Actual results could differ from those estimates. Subsequent events after the Statement of assets and liabilities date through the date that the financial statements were issued have been evaluated in the preparation of the financial statements.
Security valuation Portfolio securities and other investments are valued using policies and procedures adopted by the Board of Trustees. The Trustees oversee the implementation of these procedures and have delegated responsibility for valuing the fund’s assets in accordance with these procedures to Putnam Management. Putnam Management has established an internal Valuation Committee that is responsible for making fair value determinations, evaluating the effectiveness of the pricing policies of the fund and reporting to the Trustees.
Investments for which market quotations are readily available are valued at the last reported sales price on their principal exchange, or official closing price for certain markets, and are classified as Level 1 securities under Accounting Standards Codification 820 Fair Value Measurements and Disclosures (ASC 820). If no sales are reported, as in the case of some securities that are traded OTC, a security is valued at its last reported bid price and is generally categorized as a Level 2 security. Short-term securities with remaining maturities of 60 days or less are valued using an independent pricing service approved by the Trustees, and are classified as Level 2 securities.
|
| Focused Large Cap Growth ETF 21 |
Investments in open-end investment companies (excluding exchange-traded funds), if any, which can be classified as Level 1 or Level 2 securities, are valued based on their net asset value. The net asset value of such investment companies equals the total value of their assets less their liabilities and divided by the number of their outstanding shares.
To the extent a pricing service or dealer is unable to value a security or provides a valuation that Putnam Management does not believe accurately reflects the security’s fair value, the security will be valued at fair value by Putnam Management in accordance with policies and procedures approved by the Trustees. Certain investments, including certain restricted and illiquid securities and derivatives, are also valued at fair value following procedures approved by the Trustees. These valuations consider such factors as significant market or specific security events such as interest rate or credit quality changes, various relationships with other securities, discount rates, U.S. Treasury, U.S. swap and credit yields, index levels, convexity exposures, recovery rates, sales and other multiples and resale restrictions. These securities are classified as Level 2 or as Level 3 depending on the priority of the significant inputs.
To assess the continuing appropriateness of fair valuations, the Valuation Committee reviews and affirms the reasonableness of such valuations on a regular basis after considering all relevant information that is reasonably available. Such valuations and procedures are reviewed periodically by the Trustees. The fair value of securities is generally determined as the amount that the fund could reasonably expect to realize from an orderly disposition of such securities over a reasonable period of time. By its nature, a fair value price is a good faith estimate of the value of a security in a current sale and does not reflect an actual market price, which may be different by a material amount.
Security transactions and related investment income Security transactions are recorded on the trade date (the date the order to buy or sell is executed). Gains or losses on securities sold are determined on the identified cost basis.
Interest income, net of any applicable withholding taxes, if any, is recorded on the accrual basis. Amortization and accretion of premiums and discounts on debt securities, if any, is recorded on the accrual basis.
Dividend income, net of any applicable withholding taxes, is recognized on the ex-dividend date except that certain dividends from foreign securities, if any, are recognized as soon as the fund is informed of the ex-dividend date. Non-cash dividends, if any, are recorded at the fair value of the securities received. Dividends representing a return of capital or capital gains, if any, are reflected as a reduction of cost and/or as a realized gain.
Foreign currency translation The accounting records of the fund are maintained in U.S. dollars. The fair value of foreign securities, currency holdings, and other assets and liabilities is recorded in the books and records of the fund after translation to U.S. dollars based on the exchange rates on that day. The cost of each security is determined using historical exchange rates. Income and withholding taxes are translated at prevailing exchange rates when earned or incurred. The fund does not isolate that portion of realized or unrealized gains or losses resulting from changes in the foreign exchange rate on investments from fluctuations arising from changes in the market prices of the securities. Such gains and losses are included with the net realized and unrealized gain or loss on investments. Net realized gains and losses on foreign currency transactions represent net realized exchange gains or losses on disposition of foreign currencies, currency gains and losses realized between the trade and settlement dates on securities transactions and the difference between the amount of investment income and foreign withholding taxes recorded on the fund’s books and the U.S. dollar equivalent amounts actually received or paid. Net unrealized appreciation and depreciation of assets and liabilities in foreign currencies arise from changes in the value of assets and liabilities other than investments at the period end, resulting from changes in the exchange rate.
Lines of credit The fund participates, along with other Putnam funds, in a $100 million ($317.5 million prior to October 14, 2022) unsecured committed line of credit and a $235.5 million unsecured uncommitted line of credit, both provided by State Street. Borrowings may be made for temporary or emergency purposes, including the funding of shareholder redemption requests and trade settlements. Interest is charged to the fund based on the fund’s borrowing at a rate equal to 1.25% plus the higher of (1) the Federal Funds rate and (2) the Overnight Bank Funding Rate for the committed line of credit and 1.30% plus the higher of (1) the Federal Funds rate and (2) the Overnight Bank Funding Rate for the uncommitted line of credit. A closing fee equal to 0.04% of the committed line of credit and 0.04% of the uncommitted line of credit has been paid by the participating funds. In addition, a commitment fee of 0.21% per annum on any unutilized portion of the committed line of credit is allocated to the participating funds based on their relative net assets and paid quarterly. During the reporting period, the fund had no borrowings against these arrangements.
|
| 22 Focused Large Cap Growth ETF |
Federal taxes It is the policy of the fund to distribute all of its taxable income within the prescribed time period and otherwise comply with the provisions of the Internal Revenue Code of 1986, as amended (the Code), applicable to regulated investment companies. It is also the intention of the fund to distribute an amount sufficient to avoid imposition of any excise tax under Section 4982 of the Code.
The fund is subject to the provisions of Accounting Standards Codification 740 Income Taxes (ASC 740). ASC 740 sets forth a minimum threshold for financial statement recognition of the benefit of a tax position taken or expected to be taken in a tax return. The fund did not have a liability to record for any unrecognized tax benefits in the accompanying financial statements. No provision has been made for federal taxes on income, capital gains or unrealized appreciation on securities held nor for excise tax on income and capital gains. Each of the fund’s federal tax returns for the prior periods remains subject to examination by the Internal Revenue Service.
The fund may also be subject to taxes imposed by governments of countries in which it invests. Such taxes are generally based on either income or gains earned or repatriated. The fund accrues and applies such taxes to net investment income, net realized gains and net unrealized gains as income and/or capital gains are earned. In some cases, the fund may be entitled to reclaim all or a portion of such taxes, and such reclaim amounts, if any, are reflected as an asset on the fund’s books. In many cases, however, the fund may not receive such amounts for an extended period of time, depending on the country of investment.
Under the Regulated Investment Company Modernization Act of 2010, the fund will be permitted to carry forward capital losses incurred for an unlimited period and the carry forwards will retain their character as either short-term or long-term capital losses. At August 31, 2022, the fund had the following capital loss carryovers available, to the extent allowed by the Code, to offset future net capital gain, if any:
| | |
| | Loss carryover | |
| Short-term | Long-term | Total |
| $893,643 | $104,892 | $998,535 |
Tax cost of investments includes adjustments to net unrealized appreciation (depreciation) which may not necessarily be final tax cost basis adjustments, but closely approximate the tax basis unrealized gains and losses that may be realized and distributed to shareholders. The aggregate identified cost on a tax basis is $26,154,121, resulting in gross unrealized appreciation and depreciation of $661,635 and $1,210,998, respectively, or net unrealized depreciation of $549,363.
Distributions to shareholders Distributions to shareholders from net investment income are recorded by the fund on the ex-dividend date. Distributions from capital gains, if any, are recorded on the ex-dividend date and paid at least annually. The amount and character of income and gains to be distributed are determined in accordance with income tax regulations, which may differ from generally accepted accounting principles. Dividend sources are estimated at the time of declaration. Actual results may vary. Any non-taxable return of capital cannot be determined until final tax calculations are completed after the end of the fund’s fiscal year. Reclassifications are made to the fund’s capital accounts to reflect income and gains available for distribution (or available capital loss carryovers) under income tax regulations.
Expenses of the Trust Expenses directly charged or attributable to any fund will be paid from the assets of that fund. Generally, expenses of the Trust will be allocated among and charged to the assets of each fund on a basis that the Trustees deem fair and equitable, which may be based on the relative assets of each fund or the nature of the services performed and relative applicability to each fund.
Note 2: Management fee, administrative services and other transactions
The fund pays the Manager an annual all-inclusive management fee of 0.55% based on the fund’s average daily net assets computed and paid monthly. The management fee covers investment management services and all of the fund’s organizational and other operating expenses with certain exceptions, including but not limited to: payments under distribution plans, interest and borrowing expenses, taxes, brokerage commissions and other transaction costs, fund proxy expenses, litigation expenses, extraordinary expenses and acquired fund fees and expenses. All costs related to organization and offering of the Trust were borne by the Manager.
The fund invests in Putnam Government Money Market Fund, an open-end management investment company managed by Putnam Management. Management fees paid by the fund are reduced by an amount equal to the management fees paid by Putnam Government Money Market Fund with respect to assets invested by the fund in Putnam Government Money Market Fund. During the reporting period, management fees paid were reduced by $134 relating to the fund’s investment in Putnam Government Money Market Fund.
|
| Focused Large Cap Growth ETF 23 |
Putnam Investments Limited (PIL), an affiliate of Putnam Management, is authorized by the Trustees to manage a separate portion of the assets of the fund as determined by Putnam Management from time to time. PIL did not manage any portion of the assets of the fund during the reporting period. If Putnam Management were to engage the services of PIL, Putnam Management would pay a quarterly sub-management fee to PIL for its services at an annual rate of 0.25% (prior to September 23, 2022, the annual rate was 0.35%) of the average net assets of the portion of the fund managed by PIL.
The fund has adopted a distribution and service plan pursuant to Rule 12b–1 under the 1940 Act that authorizes the fund to pay distribution fees in connection with the sale and distribution of its shares and service fees in connection with the provision of ongoing shareholder support services. No Rule 12b–1 fees are currently paid by the fund.
Note 3: Purchases and sales of securities
During the reporting period, the cost of purchases and the proceeds from sales, excluding short-term investments and in-kind transactions, were as follows:
| | |
| | Cost of purchases | Proceeds from sales |
| Investments in securities (Long-term) | $3,997,906 | $3,476,374 |
| U.S. government securities (Long-term) | — | — |
| Total | $3,997,906 | $3,476,374 |
Portfolio securities received or delivered through in-kind transactions were $16,007,592 and $1,333,694, respectively.
The fund may purchase or sell investments from or to other Putnam funds in the ordinary course of business, which can reduce the fund’s transaction costs, at prices determined in accordance with SEC requirements and policies approved by the Trustees. During the reporting period, purchases or sales of long-term securities from or to other Putnam funds, if any, did not represent more than 5% of the fund’s total cost of purchases and/or total proceeds from sales.
Note 4: Capital shares
Shares of the fund are listed and traded on NYSE Arca, Inc., and individual fund shares may only be bought and sold in the secondary market through a broker or dealer at market price. These transactions, which do not involve the fund, are made at market prices that may vary throughout the day, rather than at net asset value (NAV). Shares of the fund may trade at a price greater than the fund’s NAV (premium) or less than the fund’s NAV (discount). An investor may incur costs attributable to the difference between the highest price a buyer is willing to pay to purchase shares (bid) and the lowest price a seller is willing to accept for shares (ask) when buying or selling fund shares in the secondary market (the “bid-ask spread”). The fund will issue and redeem shares in large blocks of 25,000 shares called “Creation Units” on a continuous basis, at NAV, with authorized participants who have entered into agreements with the fund’s distributor. The fund will generally issue and redeem Creation Units in return for a designated portfolio of securities (and an amount of cash) that the fund specifies each day. The fund generally imposes a transaction fee on investors purchasing or redeeming Creation Units. Investors transacting in Creation Units for cash may also pay an additional variable charge to compensate the fund for certain transaction costs and market impact expenses relating to investing in portfolio securities. Such variable charges, if any, are included in Other capital in the Statement of changes in net assets.
At the close of the reporting period, Putnam Investment Holdings, LLC owned 925,001 shares of the fund (77.08% of shares outstanding), valued at $19,730,271.
|
| 24 Focused Large Cap Growth ETF |
Note 5: Affiliated transactions
Transactions during the reporting period with any company which is under common ownership or control were as follows:
| | | | | |
| | | | | | Shares |
| | | | | | outstanding |
| | | | | | and fair |
| | Fair value as | Purchase | Sale | Investment | value as |
| Name of affiliate | of 8/31/22 | cost | proceeds | income | of 2/28/23 |
| Short-term investments | | | | | |
| Putnam Government | | | | | |
| Money Market Fund* | $— | $626,682 | $— | $2,155 | $626,682 |
| Total Short-term | | | | | |
| investments | $— | $626,682 | $— | $2,155 | $626,682 |
* Management fees incurred through investment in Putnam Government Money Market Fund have been waived by the fund (Note 2). There were no realized or unrealized gains or losses during the period.
Note 6: Market, credit and other risks
In the normal course of business, the fund trades financial instruments and enters into financial transactions where risk of potential loss exists due to changes in the market (market risk) or failure of the contracting party to the transaction to perform (credit risk). The fund may be exposed to additional credit risk that an institution or other entity with which the fund has unsettled or open transactions will default. Investments in foreign securities involve certain risks, including those related to economic instability, unfavorable political developments, and currency fluctuations.
The Covid–19 pandemic and efforts to contain its spread have resulted in, among other effects, significant market volatility, exchange trading suspensions and closures, declines in global financial markets, higher default rates, significant changes in fiscal and monetary policies, and economic downturns and recessions. The effects of the Covid–19 pandemic have negatively affected, and may continue to negatively affect, the global economy, the economies of the United States and other individual countries, the financial performance of individual issuers, sectors, industries, asset classes, and markets, and the value, volatility, and liquidity of particular securities and other assets. The effects of the Covid–19 pandemic also are likely to exacerbate other risks that apply to the fund, which could negatively impact the fund’s performance and lead to losses on your investment in the fund. The duration of the Covid–19 pandemic and its effects cannot be determined with certainty.
|
| Focused Large Cap Growth ETF 25 |
Shareholder meeting results (Unaudited)
January 11, 2023 special meeting
At the meeting, each of the nominees for Trustees was elected, with all funds of the Trust voting together as a single class, as follows:
| | | |
| | Votes for | Votes against | Votes withheld |
| Liaquat Ahamed | 4,484,567 | — | 444,547 |
| Barbara M. Baumann | 4,422,414 | — | 506,700 |
| Katinka Domotorffy | 4,649,758 | — | 279,356 |
| Catharine Bond Hill | 4,715,090 | — | 214,024 |
| Kenneth R. Leibler | 4,908,146 | — | 20,968 |
| Jennifer Williams Murphy | 4,797,806 | — | 131,308 |
| Marie Pillai | 4,374,937 | — | 554,177 |
| George Putnam III | 4,908,051 | — | 21,063 |
| Robert L. Reynolds | 4,908,146 | — | 20,968 |
| Manoj P. Singh | 4,355,772 | — | 573,342 |
| Mona K. Sutphen | 4,634,643 | — | 294,471 |
All tabulations are rounded to the nearest whole number.
|
| 26 Focused Large Cap Growth ETF |
Putnam family of funds
The following is a list of Putnam’s open-end mutual funds offered to the public. Investors should carefully consider the investment objective, risks, charges, and expenses of a fund before investing. For a prospectus, or a summary prospectus if available, containing this and other information for any Putnam fund or product, contact your financial advisor or call Putnam Investor Services at 1-800-225-1581. Please read the prospectus carefully before investing.
| |
| Blend | Income |
| Core Equity Fund | Convertible Securities Fund |
| Emerging Markets Equity Fund | Core Bond Fund |
| Focused Equity Fund | Diversified Income Trust |
| Focused International Equity Fund | Floating Rate Income Fund |
| International Capital Opportunities Fund | Global Income Trust |
| International Equity Fund | Government Money Market Fund* |
| Research Fund | High Yield Fund |
| Income Fund |
| Global Sector | Money Market Fund† |
| Global Health Care Fund | Mortgage Opportunities Fund |
| Global Technology Fund | Mortgage Securities Fund |
| Short Duration Bond Fund |
| Growth | Ultra Short Duration Income Fund |
| Large Cap Growth Fund | |
| Small Cap Growth Fund | Tax-free Income |
| Sustainable Future Fund | Intermediate-Term Municipal Income Fund |
| Sustainable Leaders Fund | Short-Term Municipal Income Fund |
| Strategic Intermediate Municipal Fund |
| Value | Tax Exempt Income Fund |
| International Value Fund | Tax-Free High Yield Fund |
| Large Cap Value Fund | |
| Small Cap Value Fund | State tax-free income funds:‡ |
| | California, Massachusetts, Minnesota, |
| | New Jersey, New York, Ohio, and Pennsylvania |
|
| Focused Large Cap Growth ETF 27 |
| |
| Asset Allocation | Asset Allocation (cont.) |
| George Putnam Balanced Fund | Retirement Advantage Maturity Fund |
| Retirement Advantage 2065 Fund |
| Dynamic Asset Allocation Balanced Fund | Retirement Advantage 2060 Fund |
| Dynamic Asset Allocation Conservative Fund | Retirement Advantage 2055 Fund |
| Dynamic Asset Allocation Growth Fund | Retirement Advantage 2050 Fund |
| Retirement Advantage 2045 Fund |
| Multi-Asset Income Fund | Retirement Advantage 2040 Fund |
| | Retirement Advantage 2035 Fund |
| | Retirement Advantage 2030 Fund |
| | Retirement Advantage 2025 Fund |
| |
| | Sustainable Retirement Maturity Fund |
| | Sustainable Retirement 2065 Fund |
| | Sustainable Retirement 2060 Fund |
| | Sustainable Retirement 2055 Fund |
| | Sustainable Retirement 2050 Fund |
| | Sustainable Retirement 2045 Fund |
| | Sustainable Retirement 2040 Fund |
| | Sustainable Retirement 2035 Fund |
| | Sustainable Retirement 2030 Fund |
| | Sustainable Retirement 2025 Fund |
* You could lose money by investing in the fund. Although the fund seeks to preserve the value of your investment at $1.00 per share, it cannot guarantee it will do so. An investment in the fund is not insured or guaranteed by the Federal Deposit Insurance Corporation or any other government agency. The fund’s sponsor has no legal obligation to provide financial support to the fund, and you should not expect that the sponsor will provide financial support to the fund at any time.
† You could lose money by investing in the fund. Although the fund seeks to preserve the value of your investment at $1.00 per share, it cannot guarantee it will do so. The fund may impose a fee upon sale of your shares or may temporarily suspend your ability to sell shares if the fund’s liquidity falls below required minimums because of market conditions or other factors. An investment in the fund is not insured or guaranteed by the Federal Deposit Insurance Corporation or any other government agency. The fund’s sponsor has no legal obligation to provide financial support to the fund, and you should not expect that the sponsor will provide financial support to the fund at any time.
‡ Not available in all states.
Check your account balances and the most recent month-end performance in the Individual Investors section at putnam.com.
|
| 28 Focused Large Cap Growth ETF |
Fund information
Founded over 85 years ago, Putnam Investments was built around the concept that a balance between risk and reward is the hallmark of a well-rounded financial program. We manage funds across income, value, blend, growth, sustainable, and asset allocation categories.
| | |
| Investment Manager | Trustees | Richard T. Kircher |
| Putnam Investment | Kenneth R. Leibler, Chair | Vice President and |
| Management, LLC | Barbara M. Baumann, Vice Chair | BSA Compliance Officer |
| 100 Federal Street | Liaquat Ahamed | |
| Boston, MA 02110 | Katinka Domotorffy | Martin Lemaire |
| | Catharine Bond Hill | Vice President and |
| Investment Sub-Advisor | Jennifer Williams Murphy | Derivatives Risk Manager |
| Putnam Investments Limited | Marie Pillai | |
| 16 St James’s Street | George Putnam III | Susan G. Malloy |
| London, England SW1A 1ER | Robert L. Reynolds | Vice President and |
| Manoj P. Singh | Assistant Treasurer |
| Distribution Services | Mona K. Sutphen | |
| Foreside Fund Services, LLC | | Alan G. McCormack |
| Three Canal Plaza, Suite 100 | Officers | Vice President and |
| Portland, ME 04101 | Robert L. Reynolds | Derivatives Risk Manager |
| President | |
| Custodian | | Denere P. Poulack |
| State Street Bank | James F. Clark | Assistant Vice President, |
| and Trust Company | Vice President, Chief Compliance | Assistant Clerk, and |
| Officer, and Chief Risk Officer | Assistant Treasurer |
| Legal Counsel | | |
| Ropes & Gray LLP | Michael J. Higgins | Janet C. Smith |
| | Vice President, Treasurer, | Vice President, |
| | and Clerk | Principal Financial Officer, |
| | | Principal Accounting Officer, |
| | Jonathan S. Horwitz | and Assistant Treasurer |
| Executive Vice President, | |
| | Principal Executive Officer, | Stephen J. Tate |
| | and Compliance Liaison | Vice President and |
| | | Chief Legal Officer |
| | |
| | | Mark C. Trenchard |
| | | Vice President |
Call 1-833-228-5577 Monday through Friday between 9:00 a.m. and 5:00 p.m. Eastern Time or visit putnam.com anytime for up-to-date information about the fund’s NAV.

| |
| Item 3. Audit Committee Financial Expert: |
| |
| Item 4. Principal Accountant Fees and Services: |
| |
| Item 5. Audit Committee of Listed Registrants |
| |
| Item 6. Schedule of Investments: |
| |
| The registrant’s schedule of investments in unaffiliated issuers is included in the report to shareholders in Item 1 above. |
| |
| Item 7. Disclosure of Proxy Voting Policies and Procedures For Closed-End Management Investment Companies: |
| |
| Item 8. Portfolio Managers of Closed-End Investment Companies |
| |
| Item 9. Purchases of Equity Securities by Closed-End Management Investment Companies and Affiliated Purchasers: |
| |
| Item 10. Submission of Matters to a Vote of Security Holders: |
| |
| Item 11. Controls and Procedures: |
| |
| (a) The registrant’s principal executive officer and principal financial officer have concluded, based on their evaluation of the effectiveness of the design and operation of the registrant’s disclosure controls and procedures as of a date within 90 days of the filing date of this report, that the design and operation of such procedures are generally effective to provide reasonable assurance that information required to be disclosed by the registrant in this report is recorded, processed, summarized and reported within the time periods specified in the Commission’s rules and forms. |
| |
| (b) Changes in internal control over financial reporting: Not applicable |
| |
| Item 12. Disclosures of Securities Lending Activities for Closed-End Investment Companies: |
| |
| Pursuant to the requirements of the Securities Exchange Act of 1934 and the Investment Company Act of 1940, the registrant has duly caused this report to be signed on its behalf by the undersigned, thereunto duly authorized. |
| |
| By (Signature and Title): |
| |
| /s/ Janet C. Smith
Janet C. Smith
Principal Accounting Officer
|
| |
| Pursuant to the requirements of the Securities Exchange Act of 1934 and the Investment Company Act of 1940, this report has been signed below by the following persons on behalf of the registrant and in the capacities and on the dates indicated. |
| |
| By (Signature and Title): |
| |
| /s/ Jonathan S. Horwitz
Jonathan S. Horwitz
Principal Executive Officer
|
| |
| By (Signature and Title): |
| |
| /s/ Janet C. Smith
Janet C. Smith
Principal Financial Officer
|