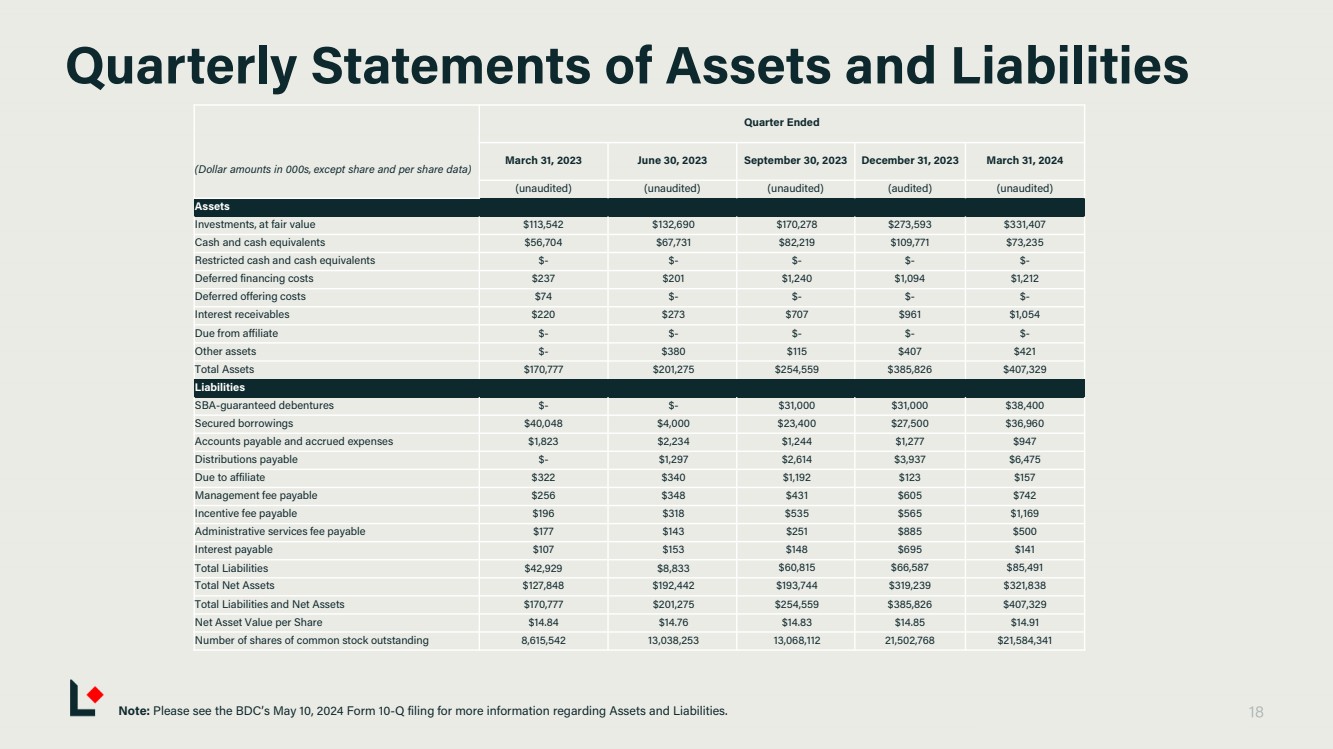
| Quarterly Statements of Assets and Liabilities Note: Please see the BDC’s May 10, 2024 Form 10-Q filing for more information regarding Assets and Liabilities. Quarter Ended (Dollar amounts in 000s, except share and per share data) March 31, 2023 June 30, 2023 September 30, 2023 December 31, 2023 March 31, 2024 (unaudited) (unaudited) (unaudited) (audited) (unaudited) Assets Investments, at fair value $113,542 $132,690 $170,278 $273,593 $331,407 Cash and cash equivalents $56,704 $67,731 $82,219 $109,771 $73,235 Restricted cash and cash equivalents $- $- $- $- $- Deferred financing costs $237 $201 $1,240 $1,094 $1,212 Deferred offering costs $74 $- $- $- $- Interest receivables $220 $273 $707 $961 $1,054 Due from affiliate $- $- $- $- $- Other assets $- $380 $115 $407 $421 Total Assets $170,777 $201,275 $254,559 $385,826 $407,329 Liabilities SBA-guaranteed debentures $- $- $31,000 $31,000 $38,400 Secured borrowings $40,048 $4,000 $23,400 $27,500 $36,960 Accounts payable and accrued expenses $1,823 $2,234 $1,244 $1,277 $947 Distributions payable $- $1,297 $2,614 $3,937 $6,475 Due to affiliate $322 $340 $1,192 $123 $157 Management fee payable $256 $348 $431 $605 $742 Incentive fee payable $196 $318 $535 $565 $1,169 Administrative services fee payable $177 $143 $251 $885 $500 Interest payable $107 $153 $148 $695 $141 Total Liabilities $42,929 $8,833 $60,815 $66,587 $85,491 Total Net Assets $127,848 $192,442 $193,744 $319,239 $321,838 Total Liabilities and Net Assets $170,777 $201,275 $254,559 $385,826 $407,329 Net Asset Value per Share $14.84 $14.76 $14.83 $14.85 $14.91 Number of shares of common stock outstanding 8,615,542 13,038,253 13,068,112 21,502,768 $21,584,341 |