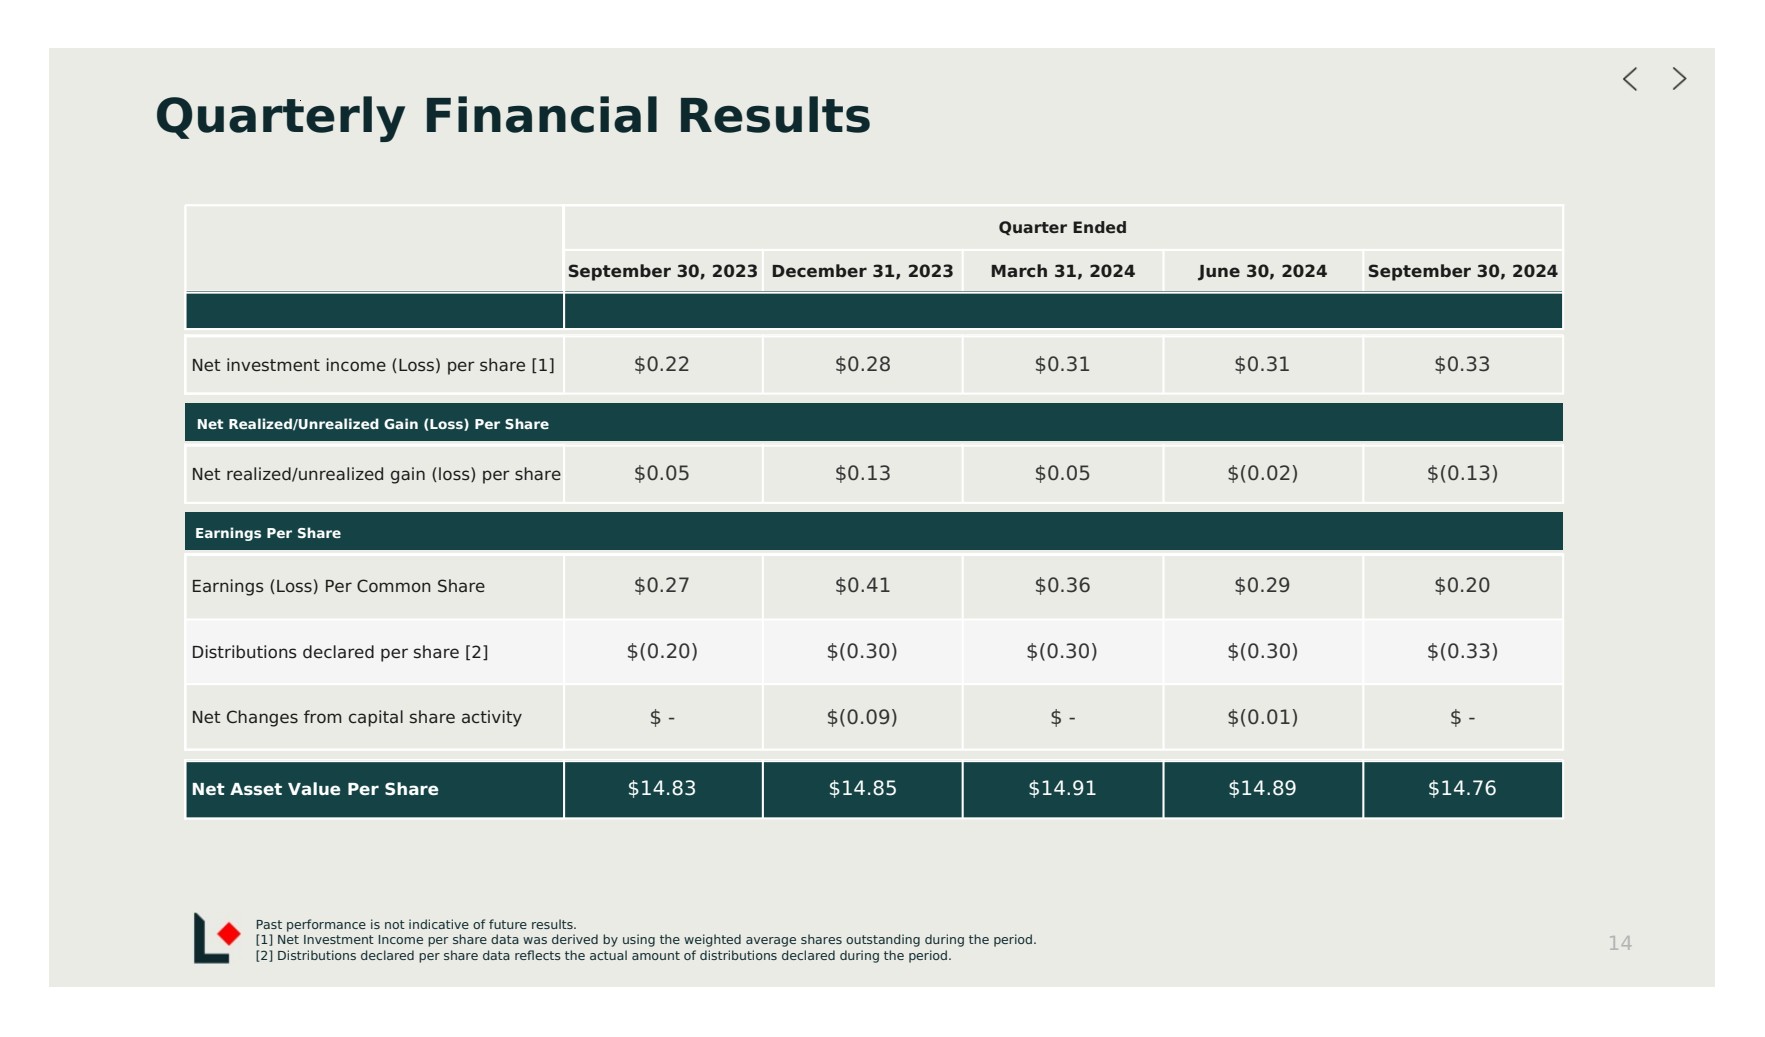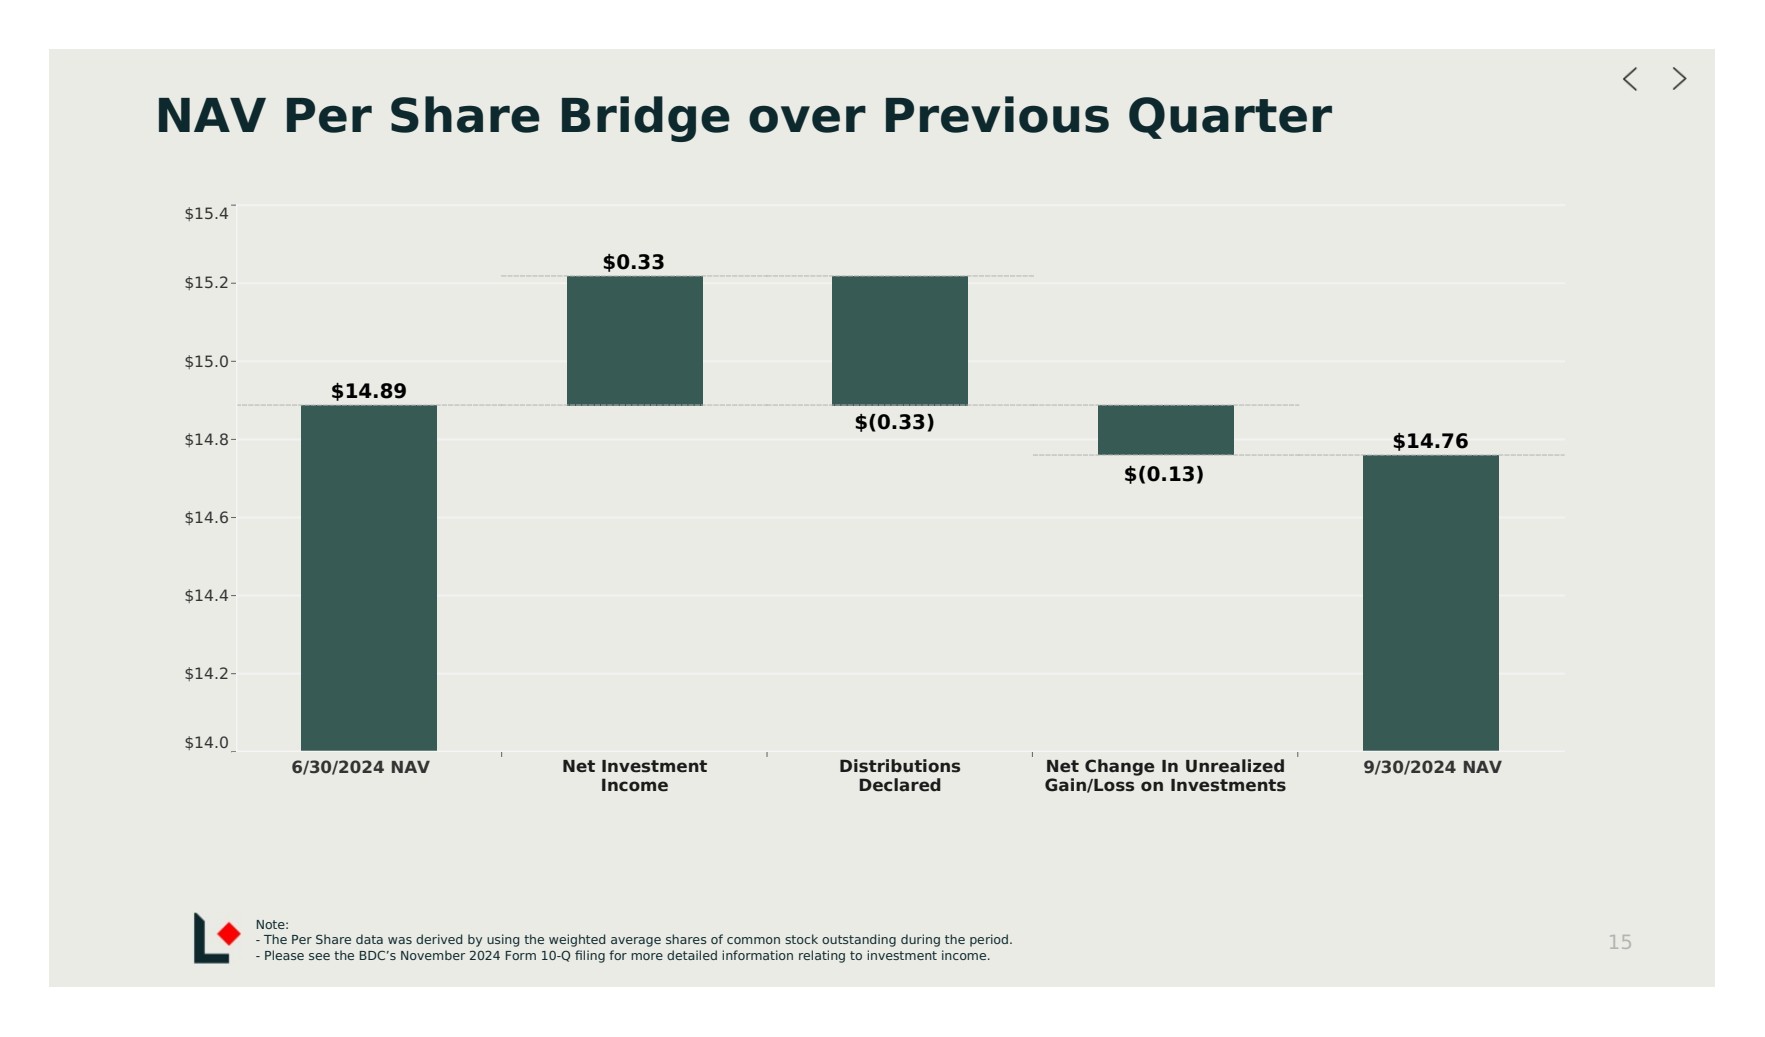
| Quarter Ended Sep, 2023 Dec, 2023 Mar, 2024 June, 2024 Sep, 2024 Rows (unaudited) (audited) (unaudited) (unaudited) (unaudited) Investments, at fair value Cash and cash equivalents Deferred financing costs Interest receivables Due from affiliate Other assets Total Assets $688,409 $1,214 $130 $1,797 $7,234 $216,880 $461,154 $528,670 $1,237 $ - $1,824 $3,892 $99,352 $422,365 $407,329 $421 $ - $1,054 $1,212 $73,235 $331,407 $385,826 $407 $ - $961 $1,094 $109,771 $273,593 $254,559 $115 $ - $707 $1,240 $82,219 $170,278 Assets SBA-guaranteed debentures Secured borrowings Reverse repurchase agreement Accounts payable and accrued expenses Distributions payable Deferred revuene payable Due to affiliate Management fee payable Incentive fee payable Administrative services fee payable Interest and financing payable Income tax payable Total Liabilities Total Net Assets Total Liabilities and Net Assets $688,409 $348,938 $339,471 $156 $789 $ - $1,312 $1,147 $97 $4,404 $7,460 $1,105 $10,996 $147,000 $165,005 $528,670 $334,371 $194,299 $ - $1,287 $ - $1,213 $872 $29 $5,411 $6,738 $894 $20,355 $75,000 $82,500 $407,329 $321,838 $85,491 $ - $141 $500 $1,169 $742 $157 $ - $6,475 $947 $ - $36,960 $38,400 $385,826 $319,239 $66,587 $ - $695 $885 $565 $605 $123 $ - $3,937 $1,277 $ - $27,500 $31,000 $254,559 $193,744 $60,815 $ - $148 $251 $535 $431 $1,192 $ - $2,614 $1,244 $ - $23,400 $31,000 Liabilities Net Asset Value per Share $14.83 $14.85 $14.91 $14.89 $14.76 Asset coverage ratio 456.1% 645.7% 527.1% 288.0% 320.9% Number of shares of common stock outstanding 13,068,112 21,502,768 21,584,341 22,458,336 23,633,167 Note: Please see the BDC’s November 7, 2024 Form 10-Q filing for more information regarding Assets and Liabilities. Quarterly Statements of Assets and Liabilities (Dollar amounts in 000s, except share and per share data) 19 |