Exhibit 99.59
Granite Creek Mine Project
Premier Gold Mines Limited/i-80 Gold Corp. | Page ii
PEA NI 43-101 Technical Report |
Date and Signature Page
This Technical Report on the Granite Creek Mine Project is submitted to i-80 Gold Corp. and is effective May 4, 2021.
The Qualified Persons and Responsible Report Sections are:
| Qualified Person | Responsible for Report Sections |
| Terre Lane | Sections 1.5, 1.6, 1.7, 1.8, 1.9, 1.10, 2, 3, 14, 15, 16, 21, 22, 24, 25, 26, and 27 |
| Dr. Todd Harvey | Sections 1.4, 13 and 17 |
| Rick Moritz | Sections 13, 17, 18, 19, and 23 |
| Dr. Hamid Samari | Sections 1.1, 1.2, 1.3, 14.4, 4, 5, 6, 7, 8, 9, 10, 11, and 12 |
| Larry Breckenridge | Sections 4.4, 4.5, and 20 |
| (Signed) “Terre Lane” | | 11/8/2021 | |
| Signature Terre Lane | | Date | |
| | | | |
| (Signed) “Dr. Todd Harvey” | | 11/8/2021 | |
| Signature Dr. Todd Harvey | | Date | |
| | | | |
| (Signed) “Rick Moritz” | | 11/8/2021 | |
| Signature Rick Moritz | | Date | |
| | | | |
| (Signed) “Dr. Hamid Samari” | | 11/8/2021 | |
| Signature Dr. Hamid Samari | | Date | |
| | | | |
| (Signed) “Larry Breckenridge” | | 11/8/2021 | |
| Signature Larry Breckenridge | | Date | |
 | 11/8/2021 |
Granite Creek Mine Project
Premier Gold Mines Limited/i-80 Gold Corp. | Page iii
PEA NI 43-101 Technical Report |
Table of Contents
| 1.0 | Summary | 19 |
| | 1.1 | Property Description and Ownership | 19 |
| | 1.2 | Geology and Mineralization | 20 |
| | 1.3 | Data Verification and Quality Assurance/Quality Control | 20 |
| | 1.4 | Mineral Processing and Metallurgical Testing | 21 |
| | 1.5 | Previous Resource Estimates and Economic Models | 22 |
| | 1.6 | Mineral Resource Estimate | 23 |
| | 1.7 | Mining Methods | 24 |
| | 1.8 | Infrastructure | 25 |
| | 1.9 | Economic Model Results | 25 |
| | | 1.9.1 | Base Case | 26 |
| | | 1.9.2 | Sensitivity Analyses | 26 |
| | | 1.9.3 | Conclusions of Economic Model | 27 |
| | 1.10 | RECOMMENDATIONS | 27 |
| | | 1.10.1 | Drilling | 27 |
| | | 1.10.2 | Metallurgical Testing | 28 |
| | | 1.10.3 | Permitting / Environmental | 28 |
| | | 1.10.4 | Land Work | 28 |
| | | 1.10.5 | Utilities | 28 |
| 2.0 | INTRODUCTION | 29 |
| | 2.1 | Terms of Reference | 29 |
| | 2.2 | Purpose of Report | 30 |
| | 2.3 | Sources of Information | 31 |
| | 2.4 | Units | 31 |
| 3.0 | RELIANCE ON OTHER EXPERTS | 32 |
| | 4.0 | PROPERTY LOCATION AND DESCRIPTION | 33 |
| | 4.1 | Property Location | 33 |
| | 4.2 | Ownership, Mineral Rights, and Tenure | 34 |
| | | 4.2.1 | History | 34 |
| | | 4.2.2 | Unpatented Federal Lode Mining Claims | 35 |
| | | 4.2.3 | Fee Lands | 36 |
| | | 4.2.4 | Underlying Agreements - Unpatented Federal Mining Claims | 36 |
| | | 4.2.5 | Underlying Agreements - Fee Lands | 37 |
| | 4.3 | Underlying Agreements - Royalty Agreements | 37 |
| | 4.4 | Environmental Liabilities | 39 |
| | 4.5 | Permits | 40 |
| 5.0 | ACCESSIBILITY, CLIMATE, LOCAL RESOURCES, INFRASTRUCTURE AND PHYSIOGRAPHY | 43 |
| | 5.1 | Accessibility and Local Resources | 43 |
| | 11/8/2021 |
Granite Creek Mine Project
Premier Gold Mines Limited/i-80 Gold Corp. | Page iv
PEA NI 43-101 Technical Report |
| | 5.2 | Topography, Elevation, Vegetation, and Climate | 43 |
| | 5.3 | Infrastructure | 44 |
| | 5.4 | Water and Water Discharge | 44 |
| 6.0 | HISTORY | 46 |
| | 6.1 | Prior Ownership and Ownership Changes | 46 |
| | | 6.1.1 | Cordex I Syndicate | 46 |
| | | 6.1.2 | Pinson Mining Company | 46 |
| | | 6.1.3 | Homestake - Barrick | 47 |
| | | 6.1.4 | Atna Resources Ltd. Earn-in and PMC Back-in | 47 |
| | | 6.1.5 | Atna 2011 - 2013 Underground Development | 47 |
| | | 6.1.6 | Osgood Mining Company LLC Acquisition | 48 |
| | | 6.1.7 | i-80 | 48 |
| | 6.2 | Historical Mineral Reserve and Production | 48 |
| 7.0 | GEOLOGIC SETTING AND MINERALIZATION | 50 |
| | 7.1 | Regional Geology | 50 |
| | 7.2 | Local Geology | 51 |
| | 7.3 | Property Geology | 54 |
| | 7.4 | Structural Framework | 56 |
| | | 7.4.1 | Structural Overview | 56 |
| | | 7.4.2 | Faults and Faulting | 58 |
| | 7.5 | Mineralization | 60 |
| | | 7.5.1 | Mag Pit Mineralization | 62 |
| | | 7.5.2 | Underground Mineralized Zones | 62 |
| | | 7.5.3 | CX Zone | 63 |
| | 7.6 | Alteration | 64 |
| 8.0 | DEPOSIT TYPES | 67 |
| 9.0 | EXPLORATION | 68 |
| | 9.1 | Introduction | 68 |
| | 9.2 | Geologic Mapping and Geochemical Sampling | 68 |
| | | 9.2.1 | Osgood Mining Geologic/Structural Mapping | 69 |
| | 9.3 | Geophysical Surveys | 70 |
| | 9.4 | Underground Drifting/Evaluation | 81 |
| | 9.5 | Trenching and Sampling | 81 |
| 10.0 | DRILLING | 83 |
| | 10.1 | Drilling Campaigns | 83 |
| | | 10.1.1 | Overview | 83 |
| | | 10.1.2 | PMC Drilling 1970 to 1996 | 84 |
| | | 10.1.3 | PMC - Homestake Drilling 1997 to 2000 | 84 |
| | | 10.1.4 | PMC - Barrick Drilling 2003 | 84 |
| | | 10.1.5 | Atna Drilling 2004 | 85 |
| | | 10.1.6 | Atna Drilling 2005 - 2006 | 85 |
| | 11/8/2021 |
Granite Creek Mine Project
Premier Gold Mines Limited/i-80 Gold Corp. | Page v
PEA NI 43-101 Technical Report |
| | | 10.1.7 | PMC (Barrick) Drilling 2007 | 86 |
| | | 10.1.8 | PMC (Barrick) 2008 Drilling | 86 |
| | | 10.1.9 | 2012 Atna Mag Pit Core Drilling | 87 |
| | | 10.1.10 | 2013 - 2015 Atna Underground Development RC Drilling | 88 |
| | 10.2 | Representative Drill Sections and Plan | 88 |
| | 10.3 | Drilling, Sampling, and Recovery factors | 95 |
| 11.0 | SAMPLE PREPARATION, ANALYSES, AND SECURITY | 96 |
| | 11.1 | Sampling Methods and Approach | 96 |
| | 11.2 | Reverse Circulation Drilling | 96 |
| | | 11.2.1 | Sampling Methods | 96 |
| | | 11.2.2 | Recovery | 96 |
| | | 11.2.3 | Sample Intervals | 96 |
| | | 11.2.4 | Logging | 97 |
| | 11.3 | Diamond Drilling | 97 |
| | | 11.3.1 | Sampling Methods | 97 |
| | | 11.3.2 | Recovery | 98 |
| | | 11.3.3 | Sample Intervals | 98 |
| | | 11.3.4 | Logging | 99 |
| | 11.4 | Sample Security | 99 |
| | 11.5 | Sample Preparation and Analysis | 99 |
| | | 11.5.1 | PMC 1970 - 1996 | 99 |
| | | 11.5.2 | PMC - Homestake 1997 - 2000 | 100 |
| | | 11.5.3 | PMC Barrick 2000 - 2008 | 100 |
| | | 11.5.4 | Atna 2004 - 2013 | 101 |
| | | 11.5.5 | Atna Underground 2011 - 2016 | 101 |
| | 11.6 | Data Validation | 101 |
| | | 11.6.1 | Summary | 101 |
| | | 11.6.2 | Atna Review of Prior Data | 102 |
| | | 11.6.3 | Barrick Review of Prior Data | 102 |
| | | 11.6.4 | OMC Data Compilation and Validation | 103 |
| | 11.7 | Quality Assurance/Quality Control Overview | 104 |
| | 11.8 | Certified Reference Materials | 105 |
| | 11.9 | GRE Discussion on QA/QC | 107 |
| | | 11.9.1 | GRE Discussion on CRMs | 107 |
| | | 11.9.2 | GRE Discussion on Blanks | 111 |
| | | 11.9.3 | GRE Discussion on Duplicates | 111 |
| | 11.10 | Conclusions | 112 |
| 12.0 | DATA VERIFICATION | 114 |
| | 12.1 | GRE Site Inspection (2021) | 114 |
| | 12.2 | Visual Sample Inspection and Check Sampling | 114 |
| | 12.3 | QP Opinions on Adequacy | 117 |
| | | 12.3.1 | Verification by Dr. Hamid Samari - Geology QP | 117 |
| | 11/8/2021 |
Granite Creek Mine Project
Premier Gold Mines Limited/i-80 Gold Corp. | Page vi
PEA NI 43-101 Technical Report |
| | | 12.3.2 | Verification by Dr. Todd Harvey and Mr. Rick Moritz - Metallurgy QPs | 117 |
| | | 12.3.3 | Verification by Ms. Terre Lane - Mine Planning and Evaluation QP | 118 |
| | | 12.3.4 | Verification by Mr. Larry Breckenridge - Environmental QP | 118 |
| 13.0 | MINERAL PROCESSING AND METALLURGICAL TESTING | 119 |
| | 13.1 | Introduction | 119 |
| | 13.2 | McClelland Laboratories, Inc. March and June 1999 | 120 |
| | 13.3 | McClelland Laboratories Inc 2013 & 2014 | 125 |
| | | 13.3.1 | Atna Resources Ltd. | 125 |
| | | 13.3.2 | Dawson Metallurgical Program 2005 and 2006 | 130 |
| | 13.4 | Sample Representivity | 132 |
| | | 13.4.1 | Overview | 132 |
| | | 13.4.2 | Bulk Samples | 133 |
| | | 13.4.3 | Drillhole Samples | 133 |
| | | 13.4.4 | Metallurgical Composite Assembly | 134 |
| | 13.5 | Deleterious Elements | 135 |
| | | 13.5.1 | Homestake Mining | 135 |
| | | 13.5.2 | Atna Resources 2005 | 135 |
| | | 13.5.3 | Atna Resources 2013 | 136 |
| | 13.6 | Geometallurgical Modeling | 136 |
| | | 13.6.1 | Cyanide Solubility for Different Zones | 138 |
| | | 13.6.2 | Cyanide Solubility Estimation in the Block Model | 149 |
| | | 13.6.3 | Metallurgical Test and Recovery | 150 |
| | | 13.6.4 | Recovery in the Block Model | 1 |
| | 13.7 | Conclusions | 1 |
| | | 13.7.1 | Sample Representivity | 1 |
| | | 13.7.2 | Testwork on Open Pit Samples | 1 |
| | | 13.7.3 | Testwork on Underground Samples | 1 |
| | 13.8 | Recommendations | 2 |
| | | 13.8.1 | Testwork Recommendations | 2 |
| | | 13.8.2 | Geometallurgy Recommendations | 2 |
| 14.0 | MINERAL RESOURCE ESTIMATES | 3 |
| | 14.1 | Introduction | 3 |
| | 14.2 | Drill Hole Database | 3 |
| | 14.3 | Topography | 4 |
| | 14.4 | Geologic Model | 5 |
| | 14.5 | Open Pit Estimation | 6 |
| | | 14.5.1 | Estimation Domains | 6 |
| | | 14.5.2 | Assay Compositing | 12 |
| | | 14.5.3 | Evaluation of Outliers | 15 |
| | | 14.5.4 | Density | 16 |
| | | 14.5.5 | Variography | 16 |
| | | 14.5.6 | Block Model Parameters | 17 |
| | 11/8/2021 |
Granite Creek Mine Project
Premier Gold Mines Limited/i-80 Gold Corp. | Page vii
PEA NI 43-101 Technical Report |
| | | 14.5.7 | Estimation Domains | 17 |
| | | 14.5.8 | Estimation Parameters | 18 |
| | | 14.5.9 | Geometallurgical Modeling | 19 |
| | 14.6 | Open Pit Resource | 20 |
| | | 14.6.1 | Block Model Validation | 20 |
| | | 14.6.2 | Mineral Resource Classification | 27 |
| | | 14.6.3 | Mineral Resource Statement | 28 |
| | | 14.6.4 | Mineral Resource Sensitivity By Domain | 30 |
| | 14.7 | Underground Estimation | 32 |
| | | 14.7.1 | Underground Mining Area | 32 |
| | | 14.7.2 | Underground Domain Modelling | 32 |
| | | 14.7.3 | Domain Analysis | 34 |
| | 14.8 | Underground Resource | 35 |
| | | 14.8.1 | Compositing | 35 |
| | | 14.8.2 | Variography | 37 |
| | | 14.8.3 | Block Model and Estimation | 39 |
| | | 14.8.4 | Resource Classification | 40 |
| | | 14.8.5 | Statement of Mineral Resource | 40 |
| 15.0 | MINERAL RESERVE ESTIMATES | 41 |
| 16.0 | MINING METHODS | 42 |
| | 16.1 | Open Pit | 42 |
| | | 16.1.1 | Introduction | 42 |
| | | 16.1.2 | Whittle Pit Shell Analysis | 42 |
| | | 16.1.3 | Pit Design | 45 |
| | | 16.1.4 | Block Model Coding | 46 |
| | | 16.1.5 | Mining Sequence | 47 |
| | | 16.1.6 | Base Case | 47 |
| | | 16.1.7 | Mine Scheduling | 48 |
| | | 16.1.8 | Mine Operation and Layout | 51 |
| | | 16.1.9 | Heap Leach | 63 |
| | | 16.1.10 | Tailings Storage Facility | 63 |
| | | 16.1.11 | Drilling and Blasting | 63 |
| | | 16.1.12 | Loading and Hauling | 63 |
| | | 16.1.13 | Haul Roads | 63 |
| | | 16.1.14 | Mining Mobile Equipment | 64 |
| | 16.2 | Underground | 64 |
| | | 16.2.1 | Underground Mining Methods | 65 |
| | | 16.2.2 | Overhand Cut and Fill | 65 |
| | | 16.2.3 | Production | 67 |
| | | 16.2.4 | Development | 68 |
| | | 16.2.5 | Unit Operations | 68 |
| | | 16.2.6 | Productivity and Fleet Size | 68 |
| | 11/8/2021 |
Granite Creek Mine Project
Premier Gold Mines Limited/i-80 Gold Corp. | Page viii
PEA NI 43-101 Technical Report |
| | | 16.2.7 | Labor | 69 |
| | | 16.2.8 | Schedule | 69 |
| | | 16.2.9 | Groundwater | 70 |
| | | 16.2.10 | Ventilation | 70 |
| 17.0 | RECOVERY METHODS | 72 |
| | 17.1 | Heap Leach Process Description | 72 |
| | | 17.1.1 | Crushing Circuit | 74 |
| | | 17.1.2 | Agglomeration | 74 |
| | | 17.1.3 | Heap Leach Circuit | 74 |
| | | 17.1.4 | Adsorption, Desorption, Recovery (ADR) | 75 |
| | | 17.1.5 | Conceptual Heap Leach Pad and Pond Design | 75 |
| | | 17.1.6 | Heap Leach Pad | 76 |
| | | 17.1.7 | Liner System | 77 |
| | | 17.1.8 | Liner Design | 77 |
| | | 17.1.9 | Construction | 77 |
| | | 17.1.10 | Over Liner | 78 |
| | | 17.1.11 | Solution Collection System | 78 |
| | | 17.1.12 | Leak Detection and Recovery System | 78 |
| | | 17.1.13 | Leakage Detection Cells | 79 |
| | | 17.1.14 | Solution Storage | 79 |
| | | 17.1.15 | Pond Liner System | 80 |
| | | 17.1.16 | Runoff Collection and Diversion | 80 |
| | 17.2 | CIL Process Description | 81 |
| | | 17.2.1 | CIL Crusher Circuit | 82 |
| | | 17.2.2 | Carbon in Leach (CIL) Circuit | 82 |
| | | 17.2.3 | CIL Strip Circuit | 83 |
| 18.0 | PROJECT INFRASTRUCTURE | 84 |
| 19.0 | MARKET STUDIES AND CONTRACTS | 85 |
| 20.0 | ENVIRONMENTAL STUDIES, PERMITTING, AND SOCIAL OR COMMUNITY IMPACT | 86 |
| | 20.1 | Environmental Setting | 86 |
| | 20.2 | Environmental Permitting Requirements | 86 |
| | | 20.2.1 | NEPA | 86 |
| | | 20.2.2 | State Permits | 88 |
| | 20.3 | Socioeconomic Setting | 88 |
| | 20.4 | Monitoring Requirements | 88 |
| | 20.5 | Mine Closure | 89 |
| | | 20.5.1 | Mine Closure Design Criteria | 89 |
| | | 20.5.2 | Closure Costs | 90 |
| | | 20.5.3 | Closure Cost Limitations | 90 |
| 21.0 | CAPITAL AND OPERATING COSTS | 91 |
| | 21.1 | Capital Cost Estimate | 91 |
| | | 21.1.1 | Sustaining | 92 |
| | 11/8/2021 |
Granite Creek Mine Project
Premier Gold Mines Limited/i-80 Gold Corp. | Page ix
PEA NI 43-101 Technical Report |
| | | 21.1.2 | Facilities | 92 |
| | | 21.1.3 | Process Plant | 93 |
| | | 21.1.4 | Mine Equipment | 93 |
| | | 21.1.5 | G&A Capital | 93 |
| | | 21.1.6 | Working Capital | 93 |
| | | 21.1.7 | Closure | 93 |
| | 21.2 | Operating Cost Estimate | 93 |
| | | 21.2.1 | Labor | 94 |
| | | 21.2.2 | Mining Equipment and Consumables | 97 |
| | | 21.2.3 | Process Plant | 98 |
| | | 21.2.4 | Taxes and Royalties | 98 |
| | | 21.2.5 | General and Administrative | 99 |
| 22.0 | ECONOMIC ANALYSIS | 100 |
| | 22.1 | Model Cases | 100 |
| | 22.2 | Economic Analysis | 101 |
| | 22.3 | Results | 101 |
| | 22.4 | Sensitivity Analyses | 103 |
| | 22.5 | Conclusions of Economic Model | 104 |
| 23.0 | ADJACENT PROPERTIES | 105 |
| 24.0 | OTHER RELEVANT DATA AND INFORMATION | 106 |
| 25.0 | INTERPRETATION AND CONCLUSIONS | 107 |
| 26.0 | RECOMMENDATIONS and Opportunities | 108 |
| | 26.1 | Recommendations | 108 |
| | | 26.1.1 | Metallurgical Testing | 108 |
| | | 26.1.2 | Environmental Recommendations | 108 |
| | | 26.1.3 | Electrical Power Study | 109 |
| | 26.2 | Opportunities | 109 |
| 27.0 | References | 111 |
| CERTIFICATE OF QUALIFIED PERSON | 114 |
| CERTIFICATE OF QUALIFIED PERSON | 116 |
| CERTIFICATE OF QUALIFIED PERSON | 117 |
| CERTIFICATE OF QUALIFIED PERSON | 119 |
| CERTIFICATE OF QUALIFIED PERSON | 120 |
LIST OF FIGURES
| Figure 1-1 NPV@5% Sensitivity to Varying Gold Price, Capital Costs, and Operating Costs | 27 |
| Figure 4-1: Granite Creek Mine Project Location | 33 |
| Figure 4-2: Granite Creek Mine Property and Mining Claims Map | 35 |
| Figure 7-1: Regional Geologic Map of a Portion of the Osgood Mountains | 50 |
| | 11/8/2021 |
Granite Creek Mine Project
Premier Gold Mines Limited/i-80 Gold Corp. | Page x
PEA NI 43-101 Technical Report |
| Figure 7-2: Stratigraphy of the Getchell Trend | 53 |
| Figure 7-3: Geology and Structural Map | 56 |
| Figure 7-4: Geology and Structural Map of Pinson Property on Satellite Image | 57 |
| Figure 7-5: Structure and Lithology of the CX, C, and portions of the A Pits | 59 |
| Figure 7-6: Cross-section A-A’ looking Northeast | 61 |
| Figure 7-7: Alteration of the Mag Pit | 66 |
| Figure 9-1: Gravity Survey, 2,587 Stations, Magee Geophysical Services, 2006 | 71 |
| Figure 9-2: Pinson Local Gravity Interpretation | 72 |
| Figure 9-3: Location of the MT Survey Lines on the Geology and Pit locations (Left) and on the Residual Gravity (Right) | 74 |
| Figure 9-4: MT Resistivity Depth Inversion for Line 6090 | 75 |
| Figure 9-5: MT Resistivity Depth Inversion for Line 12300 | 76 |
| Figure 9-6: MT Resistivity Depth Inversion for Line 13860 | 77 |
| Figure 9-7: MT Resistivity Depth Inversion for Line 15300 | 78 |
| Figure 9-8: MT Resistivity Depth Inversion for Line 17160 | 79 |
| Figure 9-9: MT Resistivity Depth Inversion for Line 19230 | 80 |
| Figure 10-1: Granite Creek Project Drill Plan by Operator | 83 |
| Figure 10-2: Plan View Section Lines of Granite Creek Mine Project | 89 |
| Figure 10-3: Vertical Section A-A1 of the Mag Pit Area | 90 |
| Figure 10-4: Vertical Section B-B1 of the Pit CX and C Area | 91 |
| Figure 10-5: Vertical Section C-C1 of the Pit A Area | 92 |
| Figure 10-6: Vertical Section D-D1 of the Pit B Area | 93 |
| Figure 10-7: Vertical Section E-E1 of the Underground Resource Area | 94 |
| Figure 11-1: Assay Standard Results (2005-2015) | 108 |
| Figure 11-2: CRM OxG60 (2007 - 2009) FA-ICP-ES | 109 |
| Figure 11-3: CRM OxI54 (2007 - 2009) FA-ICP-ES | 109 |
| Figure 11-4: CRM OXL25 (2005 - 2006) FA-GRAV | 109 |
| Figure 11-5: CRM SG31 (2007 - 2009) FA-ICP-ES | 110 |
| Figure 11-6: CRM SJ32 (2007 - 2009) FA-ICP-ES | 110 |
| Figure 11-7: CRM SQ18 (2005 - 2006) FA-AAS | 110 |
| Figure 11-8: Fire Assay Blank Samples (2005-2015) | 111 |
| Figure 11-9: Laboratory Duplicate Comparison (2005-2015) | 112 |
| Figure 12-1: Sample Correlation Plot | 116 |
| Figure 13-1: Plan View Showing Metallurgical Sample Locations | 132 |
| Figure 13-2: Isometric View Showing Metallurgical Sample Locations | 133 |
| Figure 13-3: PCA- Scree Plot for Mag Pit | 139 |
| Figure 13-4: PCA - Biplot for Mag Pit | 139 |
| Figure 13-5: Regression Tree Model for Mag Pit | 140 |
| Figure 13-6: Observed and Predicted Cyanide Solubility for Gold (ppm) | 140 |
| Figure 13-7: Observed and Predicted Cyanide Solubility for Gold (ppm) | 141 |
| Figure 13-8: PCA- Scree Plot for C and Cx Pit | 141 |
| Figure 13-9: PCA - Biplot for C and Cx Pit | 142 |
| Figure 13-10: Regression Tree Model for C and Cx Pit | 142 |
| | 11/8/2021 |
Granite Creek Mine Project
Premier Gold Mines Limited/i-80 Gold Corp. | Page xi
PEA NI 43-101 Technical Report |
| Figure 13-11: Observed and Predicted Cyanide Solubility for Gold (ppm) | 143 |
| Figure 13-12: PCA- Scree Plot for A Pit | 144 |
| Figure 13-13: PCA - Biplot for A Pit | 144 |
| Figure 13-14: Regression Tree Model for A Pit | 145 |
| Figure 13-15: Observed and Predicted Cyanide Solubility for Gold (ppm) | 145 |
| Figure 13-16: PCA- Scree Plot for B Pit | 146 |
| Figure 13-17: PCA - Biplot for B Pit | 146 |
| Figure 13-18: Regression Tree Model for B Pit | 147 |
| Figure 13-19: Observed and Predicted Cyanide Solubility for Gold (ppm) | 147 |
| Figure 13-20: PCA- Scree Plot for Underground Zone | 148 |
| Figure 13-21: PCA - Biplot for Underground Zone | 148 |
| Figure 13-22: Regression Tree Model for Underground Zone | 149 |
| Figure 13-23: Observed and Predicted Cyanide Solubility for Gold (ppm) | 149 |
| Figure 13-24: Cyanide Solubility vs Column Recovery | 152 |
| Figure 13-25: Calculated Head Grade vs Carbon in Leach Recovery | 153 |
| Figure 13-26: Calculated Head Grade vs Carbon in Leach Recovery (Outlier Removed) | 154 |
| Figure 14-1: Drill Holes Used Plan View on Topography | 4 |
| Figure 14-2: Current Topography Used for Resource Estimation | 5 |
| Figure 14-3: Geologic Model Oblique View | 6 |
| Figure 14-4: Open Pit Estimation Zones | 7 |
| Figure 14-5: Example of Numeric Indicator High Grade Trend Analysis Mag Pit | 8 |
| Figure 14-6: Open Pit Zone 3 Sub-Domains | 9 |
| Figure 14-7: High Grade and Low Grade Open Pit Domains in CX Fault | 9 |
| Figure 14-8: Box and Whisker Plot of Open Pit Estimation Domains | 10 |
| Figure 14-9: HG and LG Distributions in Zones 1 and 2 | 11 |
| Figure 14-10: HG and LG Distributions in Zones 3 and 4 | 12 |
| Figure 14-11: Open Pit Interval Length Statistics of Auppm Assays | 13 |
| Figure 14-12: Open Pit Compositing Comparison 20 Foot Intervals | 14 |
| Figure 14-13: Example of Open Pit Cumulative Log Probability Plot Zone 1 HG | 15 |
| Figure 14-14: Open Pit Numeric Indicator Models | 18 |
| Figure 14-15: Open Pit Zone 1 Visual Comparison Composite to Block Model Grade Plan View | 21 |
| Figure 14-16: Open Pit Zone 2 Visual Comparison Composite to Block Model Grade Plan View | 21 |
| Figure 14-17: Open Pit Zone 3 Visual Comparison Composite to Block Model Grade Plan View | 22 |
| Figure 14-18: Open Pit Zone 4 Visual Comparison Composite to Block Model Grade Plan View | 22 |
| Figure 14-19: Open Pit Zone 1 Section Composites and Block Model Cross Section | 23 |
| Figure 14-20: Open Pit Zone 2 Section Composites and Block Model Cross Section | 23 |
| Figure 14-21: Open Pit Zone 3 Section Composites and Block Model Cross Section | 24 |
| Figure 14-22: Open Pit Zone 4 Section Composites and Block Model Cross Section | 24 |
| Figure 14-23: Cumulative Frequency of Composite and Block Data | 25 |
| Figure 14-24: Open Pit Swath Plot X axis, Zone 1 High Grade Domain | 26 |
| Figure 14-25: Open Pit Swath Plot Y axis, Zone 1 High Grade Domain | 26 |
| Figure 14-26: Open Pit Swath Plot Z axis, Zone 1 High Grade Domain | 27 |
| Figure 14-27: Open Pit Constrained Resource Class All Areas Plan View | 28 |
| | 11/8/2021 |
Granite Creek Mine Project
Premier Gold Mines Limited/i-80 Gold Corp. | Page xii
PEA NI 43-101 Technical Report |
| Figure 14-28: Example of Intervals in Vein Structure | 33 |
| Figure 14-29: Plan View of Veins and Faults | 34 |
| Figure 14-30: Underground Gold Assay Boxplot by Domain Group | 35 |
| Figure 14-31: CFP of UG Domain 100_03 | 36 |
| Figure 14-32: Underground Gold Composite Boxplot by Domain Group | 37 |
| Figure 14-33: Example of Underground Domain Variography | 38 |
| Figure 14-34: Cumulative Frequency Plots of Underground Models (ID3, NN, and OK) and Composite Assay Data | 40 |
| Figure 16-1: Marginal Impact Undiscounted Cashflow Mag Pit | 43 |
| Figure 16-2: Marginal Impact Undiscounted Cashflow CX Pit | 44 |
| Figure 16-3: Marginal Impact Undiscounted Cashflow Pit B | 44 |
| Figure 16-4: Marginal Impact Undiscounted Cashflow Pit A | 45 |
| Figure 16-5: Cross-Section of Typical Pit Slope | 46 |
| Figure 16-6: Granite Creek Mine Project Base Case Mine Schedule | 51 |
| Figure 16-7: Conceptual Project Layout | 52 |
| Figure 16-8: Phased Pit and Site Plan Layout Year -1 | 53 |
| Figure 16-9: Phased Pit and Site Plan Layout Year 1 | 54 |
| Figure 16-10: Phased Pit and Site Plan Layout Year 2 | 55 |
| Figure 16-11: Phased Pit and Site Plan Layout Year 3 | 56 |
| Figure 16-12: Phased Pit and Site Plan Layout Year 4 | 57 |
| Figure 16-13: Phased Pit and Site Plan Layout Year 5 | 58 |
| Figure 16-14: Phased Pit and Site Plan Layout Year 6 | 59 |
| Figure 16-15: Phased Pit and Site Plan Layout Year 7 | 60 |
| Figure 16-16: Phased Pit and Site Plan Layout Year 8 | 61 |
| Figure 16-17: Phased Pit and Site Plan Layout Year 9 | 62 |
| Figure 16-18: Pinson Underground Mine Layout | 65 |
| Figure 16-19: Typical Stope | 66 |
| Figure 16-20: Typical Longhole Stope | 67 |
| Figure 16-21: Typical Ventilation of a Stope | 71 |
| Figure 16-22: Isometric View of Ventilation Plan | 71 |
| Figure 17-1: Conceptual Heap Leach Flowsheet | 73 |
| Figure 17-2: Conceptual CIL Flowsheet | 82 |
| Figure 22-1: After Tax NPV@5% Sensitivity to Varying Gold Price, Capital Costs, and Operating Costs | 103 |
| Figure 22-2: IRR Sensitivity to Varying Gold Price, Capital Costs, and Operating Costs | 104 |
LIST OF PHOTOS
| Photo 4-1: Reclaimed Waste Dump | 40 |
| Photo 5-1: Rapid Infiltration Basin 1 | 45 |
| Photo 12-1: Core Boxes Are Stored at the Pinson Site | 114 |
| Photo 12-2: Sample Intervals Selected for Check Assay | 115 |
| Photo 12-3: The Location of Two Surface Rock Chip Samples, the Upper Comus Formation (GRE-R.S.S.1-St.3, left) and the Lower Comus Formation (GRE-R.S.S.2-St.6, right) | 117 |
| | 11/8/2021 |
Granite Creek Mine Project
Premier Gold Mines Limited/i-80 Gold Corp. | Page xiii
PEA NI 43-101 Technical Report |
LIST OF TABLES
| Table 1-1: Summary of Underground Mineral Resources - AMC Technical Report 2019 | 23 |
| Table 1-2: Summary of Open Pit Mineral Resources - AMC Technical Report 2019 | 23 |
| Table 1-3: Granite Creek Mine Project Open Pit Mineral Resource | 23 |
| Table 1-4: Granite Creek Mine Project Underground Mineral Resource | 24 |
| Table 1-5: Key Economic Indicators | 26 |
| Table 1-6 Estimated Costs to Complete the 2-Year Program | 27 |
| Table 2-1: List of Contributing Authors | 29 |
| Table 4-1: Summary of Royalties Related to the Property | 37 |
| Table 4-2: Active Permits | 40 |
| Table 4-3: Water rights | 41 |
| Table 6-1: Granite Creek Mine Property Production Summary | 49 |
| Table 9-1: Salient Results of the Ogee Zone Channel Sample Assays | 81 |
| Table 10-1: Summary of Drilling on the Granite Creek Property Since 1970 | 84 |
| Table 10-2: PMC Drilling through 1996 | 84 |
| Table 10-3: Homestake Drilling | 84 |
| Table 10-4: Barrick Drilling 2003 | 85 |
| Table 10-5: Atna Drilling 2004 | 85 |
| Table 10-6: Atna Drilling 2005-2006 | 85 |
| Table 10-7: PMC - Barrick Drilling 2007 | 86 |
| Table 10-8: PMC - Barrick Drilling 2008 | 87 |
| Table 10-9: Atna Drilling 2012 | 88 |
| Table 10-10: Atna Drilling 2013 - 2015 | 88 |
| Table 11-1: Summary of Errors Within the Granite Creek Project Database | 103 |
| Table 11-2: Initial Data Set and 18 April 2019 Data Subset | 104 |
| Table 11-3: Assay Certificates and Samples Uploaded by Laboratory | 104 |
| Table 11-4: QA/QC 2005 - 2015 | 105 |
| Table 11-5: QA/QC 2005 - 2015 Insertion Rates | 105 |
| Table 11-6: CRMs used in each year | 106 |
| Table 11-7: CRMs Used by Year and Company (2005 - 2015) | 106 |
| Table 11-8: CRMs Selected by GRE for Control Charts | 108 |
| Table 12-1: Summary Table of Hazen Results with Original Assays | 116 |
| Table 13-1: Mag Pit Composites for 1999 Testwork Program | 120 |
| Table 13-2: Preg-Robbing Test Results from the 1999 Testwork Program | 121 |
| Table 13-3: NaOH Bottle Roll Tests from 1999 Testwork Program | 122 |
| Table 13-4: CIL Tests from 1999 Testwork Program | 123 |
| Table 13-5: Column Leach Tests from April 1999 Testwork Program | 124 |
| Table 13-6: Sample Composite List from 2013 Testwork Program | 126 |
| Table 13-7: Bottle Roll Tests Results from 2013 Testwork Program | 127 |
| Table 13-8: Results from Bottle Roll Tests Using NaOH from 2013 Testwork Program | 128 |
| Table 13-9: Sample Composition for Column Leach Tests from 2013 Testwork Program | 129 |
| Table 13-10: Bottle Roll and Column Test Results from 2013 Testwork Program | 129 |
| | 11/8/2021 |
Granite Creek Mine Project
Premier Gold Mines Limited/i-80 Gold Corp. | Page xiv
PEA NI 43-101 Technical Report |
| Table 13-11: Autoclave Pre-treatment Tests from Dawson Testwork Program | 131 |
| Table 13-12: Drillhole Sample Selection and Testing Matrix | 133 |
| Table 13-13: Composite Assays | 134 |
| Table 13-14: Gold and Arsenic Assays CX Pit | 136 |
| Table 13-15: Mag Pit Drill Core Composite Assays | 136 |
| Table 13-16: Available Cyanide Solubility Data in Different Zones | 137 |
| Table 13-17: Numerical equivalent Alteration codes. | 137 |
| Table 13-18: Column Test and CIL Test (McClelland April 1999 Report) | 151 |
| Table 13-19: DML Wilmot 2005 -2006, Memo Autoclave Test Results (Samples from 2005) | 155 |
| Table 13-20: DML Wilmot 2005 -2006, Memo Autoclave Test Results (Samples from 2006) | 155 |
| Table 14-1: Negative Values in Drill Hole Database | 4 |
| Table 14-2: Open Pit Estimation Zone and Pit Name | 7 |
| Table 14-3: Open Pit Numeric Indicator Model Parameters | 7 |
| Table 14-4: Open Pit Compositing Interval Statistics | 13 |
| Table 14-5: Open Pit Compositing Comparison 20 Foot Intervals | 14 |
| Table 14-6: Open Pit Upper Clipping Au ppm Values by Domain | 15 |
| Table 14-7: Open Pit Domain Density Summary | 16 |
| Table 14-8: Open Pit Variogram Parameters | 16 |
| Table 14-9: Block Model Parameters Open Pit | 17 |
| Table 14-10: Open Pit ID2 Estimation Parameters | 18 |
| Table 14-11: Open Pit Combined Estimator Hierarchy | 19 |
| Table 14-12: Open Pit Comparison of Composite Values to Grade Estimation Methods | 25 |
| Table 14-13: Open Pit Mineral Resource Classification Parameters | 27 |
| Table 14-14: Open Pit Parameters for Resource Class Numeric Indicator Model | 28 |
| Table 14-15: Pinson Resource Parameters for Open Pit Optimization | 29 |
| Table 14-16: Open Pit Mineral Resource | 30 |
| Table 14-17: Mineral Resource Sensitivity to Cutoff Grade | 31 |
| Table 14-18: Underground Mineral Deposit Variography | 37 |
| Table 14-19: Underground Block Model Dimensions in Feet | 39 |
| Table 14-20: Comparison of Descriptive Statistics for Underground Assay Intervals, Composited Intervals, and Blocks, Au ppm | 39 |
| Table 14-21: Underground Mineral Resource | 40 |
| Table 16-1: Whittle Pitshell Analysis Parameters | 42 |
| Table 16-2: Selected Whittle Pit Shells for Resource Areas | 45 |
| Table 16-3: Geotechnical Design Parameters | 45 |
| Table 16-4: Summary of Pit Phases | 47 |
| Table 16-5: Base Case Pit Resource | 47 |
| Table 16-6: Granite Creek Mine Project Open Pit Base Case Mine Schedule Summary | 49 |
| Table 16-7: Granite Creek Mine Project Open Pit Mobile Equipment Sizes and Quantities | 64 |
| Table 16-8: Underground Contractor Fleet Size | 69 |
| Table 16-9: Underground Labor by Year | 69 |
| Table 16-10: Underground Production by Year | 70 |
| Table 16-11: Length of Underground Development Types by Year | 70 |
| | 11/8/2021 |
Granite Creek Mine Project
Premier Gold Mines Limited/i-80 Gold Corp. | Page xv
PEA NI 43-101 Technical Report |
| Table 17-1: Heap Capacity | 76 |
| Table 20-1: Mine Closure Cost Summary | 90 |
| Table 21-1: Granite Creek Mine Project Capital Costs | 91 |
| Table 21-2: Granite Creek Mine Project Initial Capital Costs | 92 |
| Table 21-3: Granite Creek Mine Project Facilities Capital Cost | 92 |
| Table 21-4: Granite Creek Mine Project G&A Capital Costs | 93 |
| Table 21-5: Granite Creek Mine Project Operating Cost Summary | 94 |
| Table 21-6: Granite Creek Mine Project Hourly Laborers by Year | 94 |
| Table 21-7: Granite Creek Mine Project Salaried Workers, Mine Management | 94 |
| Table 21-8: Granite Creek Mine Project General and Administrative Positions by Year | 95 |
| Table 21-9: Granite Creek Mine Project Processing Positions by Year | 95 |
| Table 21-10: Granite Creek Mine Project Labor Costs by Year (millions) | 97 |
| Table 21-11: Granite Creek Mine Project Mining Equipment Costs by Year (millions) | 98 |
| Table 21-12: Granite Creek Mine Project Blasting Costs by Year (millions) | 98 |
| Table 21-13: Granite Creek Mine Project Processing Costs by Year (1000s) | 98 |
| Table 22-1: Granite Creek Mine Project Gold Recoveries and Revenues | 102 |
| Table 22-2: Granite Creek Mine Project Summary of Economic Model (millions) | 102 |
| Table 22-3: Granite Creek Mine Project Key Economic Results | 103 |
| Table 22-4: After Tax NPV@5% (1000s) Sensitivity to Gold Price, Capital Costs, and Operating Costs | 103 |
| Table 22-5: IRR Sensitivity to Varying Gold Price, Capital Costs, and Operating Costs | 104 |
| Table 24-1: Transformation Check Points | 106 |
| Table 25-1: Granite Creek Mine Project Key Economic Results | 107 |
| Table 26-1 Estimated Costs to Complete the 2-Year Program | 108 |
LIST OF ACRONYMS AND ABBREVIATIONS
| µm | micron |
| 2D | two-dimensional |
| 3D | three-dimensional |
| AA | atomic absorption |
| AAL | American Assay Laboratories |
| ABA | acid base accounting |
| ACQ | AcQuire database management software |
| ADR | Adsorption-Desorption-Recovery plant |
| ANFO | ammonium nitrate fuel oil |
| ALS | ALS Chemex |
| amsl | above mean sea level |
| ARD | Acid Rock Drainage |
| As | arsenic |
| Atna | Atna Resources Ltd. |
| Au | gold |
| Au(CN)2- | gold cyanide complex |
| Barrick | Barrick Gold Corporation |
| BLM | Bureau of Land Management |
| | 11/8/2021 |
Granite Creek Mine Project
Premier Gold Mines Limited/i-80 Gold Corp. | Page xvi
PEA NI 43-101 Technical Report |
| Ch | Harmony Formation |
| Cp | Preble Formation |
| Com | Osgood Mountain Quartzite |
| CIC | carbon-in-column |
| CIL | carbon-in-leach |
| CIM | Canadian Institute of Mining, Metallurgy and Petroleum |
| COG | cut-off grade |
| Cordex | Cordex Syndicate |
| CPT | corrugated plastic tubing |
| CRM | Certified Reference Material |
| CSAMT | Controlled Source Audio Magento Tellurics |
| Cu | copper |
| EIS | Environmental Impact Statement |
| EM | Electromagnetics |
| Equinox | Equinox Gold Corp. |
| G&A | General and Administrative |
| g/L | gram per liter |
| g/t | grams per tonne |
| gpm | gallons per minute |
| gpm/ft2 | gallons per minute per square foot |
| GRE | Global Resource Engineering Ltd. |
| ha | hectares |
| HDPE | high density polyethylene |
| Hg | mercury |
| HLF | heap leach facility |
| Homestake | Homestake Mining Company |
| Hz | hertz |
| i-80 | i-80 Gold Corp. |
| ICP-AES | Inductively Coupled Plasma-Atomic Emission Spectrometry |
| IAL | Inspectorate American Laboratories |
| IP | Induced Polarization |
| IRR | Internal Rate of Return |
| kg | kilograms |
| Kgd | granodiorite, quartz diorite |
| km | kilometer |
| lb | pound |
| LDRS | Leak Detection and Recovery System |
| LLDPE | linear low-density polyethylene |
| lph/m2 | liters per hour per square meter |
| Ma | million years ago |
| MARS | Multivariate adaptive regression splines |
| mm | millimeter |
| MSHA | Mine Safety and Health Administration |
| | 11/8/2021 |
Granite Creek Mine Project
Premier Gold Mines Limited/i-80 Gold Corp. | Page xvii
PEA NI 43-101 Technical Report |
| MT | Magneto Tellurics |
| NaCN | sodium cyanide |
| NAD | North American Datum |
| NaOH | caustic soda |
| NEPA | National Environmental Policy Act |
| NI | National Instrument |
| NMR | Neutral Metals Release |
| NPV | Net Present Value |
| NPV@9% | Net Present Value at a discount rate of 9% |
| NPV@7% | Net Present Value at a discount rate of 7% |
| NPV@5% | Net Present Value at a discount rate of 5% |
| NSR | net smelter royalty |
| OH- | hydroxide |
| OTCQB | Over the Counter |
| OMC | Osgood Mining Company LLC |
| opt | ounces per ton |
| oz | ounce (troy ounce) |
| Ov | Valmy chert |
| Oc | Comus Formation |
| Pb | Battle Formation |
| PEA | Preliminary Economic Assessment |
| PLS | pregnant leach solution |
| PMC | Pinson Mining Company |
| PoO | Plan of Operations |
| ppb | parts per billion |
| PPfc | Farrell Canyon Formation |
| PPa | Adam Peak Formation |
| PPe | Etchart Limestone |
| ppm | parts per million |
| PR factor | pre-robbing factor |
| Premier | Premier Gold Mines Limited |
| psi | pounds per square inch |
| QA/QC | quality assurance/quality control |
| Qal | quaternary alluvial deposits |
| Qb | quaternary basalt |
| QP | Qualified Person |
| RC | reverse circulation |
| RFF | Range Front Fault |
| RFZ | Range Front Zone |
| RIB | rapid infiltration basin |
| ROD | Record of Decision |
| ROM | run-of-mine |
| SER | Supplemental Environmental Reports |
| | 11/8/2021 |
Granite Creek Mine Project
Premier Gold Mines Limited/i-80 Gold Corp. | Page xviii
PEA NI 43-101 Technical Report |
| SMD | Small Mine Development |
| SME | Society of Mining, Metallurgy, and Exploration |
| Tba | Olivine basalt |
| Tcg | chert, shale |
| TOC | total organic carbon |
| tpd | tonnes per day |
| tpy | tonnes per year |
| Tr | rhyolitic tuffs |
| TSX | Toronto Stock Exchange |
| USGS | U.S. Geological Survey |
| WPCP | Water Pollution Control Permit |
| w/w | weight for weight |
| | 11/8/2021 |
Granite Creek Mine Project
Premier Gold Mines Limited/i-80 Gold Corp. | Page 19
PEA NI 43-101 Technical Report |
Global Resource Engineering Ltd. (GRE) was retained by i-80 Gold Corp. (i-80) to complete a National Instrument 43-101 (NI 43-101) Preliminary Economic Assessment (PEA) Technical Report on the Granite Creek Mine Project (“Granite Creek Mine” or “the Property” or “the Project”) located in Humboldt County, Nevada. The estimates contained in this document were prepared in accordance with the Canadian Institute of Mining, Metallurgy, and Petroleum (CIM) Estimation of Mineral Resources and Mineral Reserves Best Practice Guidelines (November 29, 2019).
i-80 is a British Columbia (Canada) company trading on the Toronto Stock Exchange (TSX) as IAU, and on the U.S. Over the Counter Market Group (OTCQB) as IAUCF.
The preliminary economic assessment is preliminary in nature, it includes inferred mineral resources that are considered too speculative geologically to have the economic considerations applied to them that would enable them to be categorized as mineral reserves, and there is no certainty that the preliminary economic assessment will be realized. Mineral resources are not mineral reserves and do not have demonstrated economic viability.
The Qualified Persons (QPs) responsible for the preparation of this Technical Report are:
| 1.1 | Property Description and Ownership |
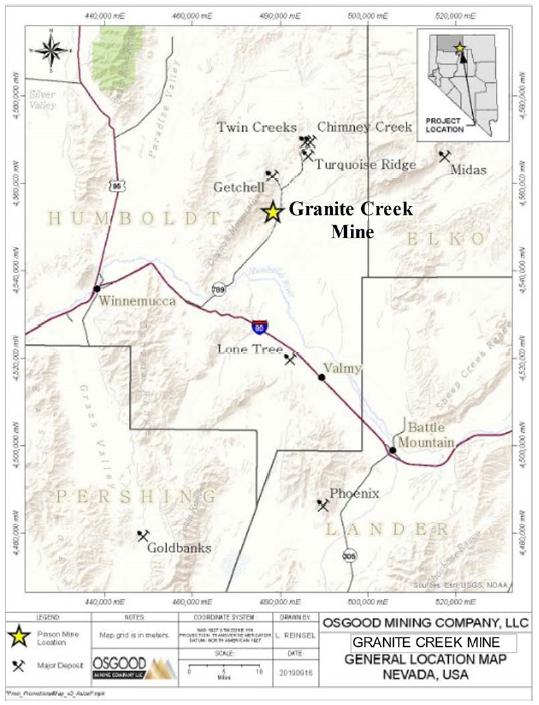
The Property is located in the Potosi mining district, 27 miles northeast of Winnemucca, within the southeastern part of Humboldt County, Nevada. Access to the Property is provided by a combination of paved interstate and state highways and well-maintained, unpaved private roads. The towns of Winnemucca and Battle Mountain are located 35 miles by road to the southwest and 60 miles to the southeast of the Property, respectively.
The Property has had a protracted history of gold exploration and mining activities. Gold was initially discovered at the Property in the mid to late 1930s. Approximately 10,000 troy ounces (oz) of gold was produced from the Property between 1949 and 1950. A further 987,000 oz was produced from various open pit mining operations between 1980 and 1999.
Most recent mining on the Property was completed by former owner Atna Resources Ltd. (Atna) between 2012 and 2013 via an underground operation at the Property. Approximately 30,148 tons of ore containing 7,915 oz of gold were mined and shipped to off-site processing facilities during the course of operations.
| | 11/8/2021 |
Granite Creek Mine Project
Premier Gold Mines Limited/i-80 Gold Corp. | Page 20
PEA NI 43-101 Technical Report |
Osgood Mining Company LLC (OMC) acquired the Property in May 2016 following a Chapter 11 bankruptcy filing by Atna.
In June 2020, i-80 acquired OMC from Waterton Global Resource Management.
| 1.2 | Geology and Mineralization |
The Property is located on the eastern flank of the Osgood Mountains within the Basin and Range tectonic province of northern Nevada. The Granite Creek Mine occurs within a northeast-trending structural corridor known as the Getchell gold trend. This trend also encompasses a number of gold deposits located outside the Property including the Preble, Getchell, Turquoise Ridge, and Twin Creeks. These deposits are hosted in Paleozoic marine sedimentary rocks. Gold mineralization at the Property is described as a Carlin-type, sedimentary-rock hosted system.
The Property geology comprises a sequence of Cambrian to Ordovician sedimentary rocks that form part of the Osgood Mountain Terrane and the Osgood Mountains. Much of the Property comprises shales, hornfels sedimentary rocks and limestone interbeds of the Preble Formation, and an overlying (or juxtaposed), alternating sequence of limestone, shale, and dolomite with tuffaceous shale and intraformational conglomerates belonging to the Comus Formation. The Preble and Comus Formations have been folded into a broad north-plunging anticline and have been intruded by large Cretaceous granodiorite stocks, resulting in irregular contact metamorphism.
Gold mineralization at the Property is strongly structurally controlled, occurring at favorable sites within a fault network occurring around the eastern edge of the Osgood granodiorite and predominantly within Comus Formation host rocks. Mineralization is commonly associated with the decarbonatization of carbonate rocks and the introduction of silica, fine grained pyrite, arsenian pyrite, and remobilized carbon. Continuity of mineralization is highly variable, ranging from 40 to 4,500 feet (12 to 1,372 meters) in strike extent, 250 to 1,800 feet (76 to 550 meters) in down-dip extent and 5 to 400 feet (1.5 to 122 meters) in thickness. The underground mineralization has a variable thickness between 5 and 30 feet (1.5 and 9 meters).
Oxidation reaches depths of up to 1,800 feet (550 meters) within shear zones. Oxide mineralization includes pervasive limonite, hematite, along with other iron and arsenic oxides. Historical production from the open pits was focused on the oxidized material.
Underground mineralization displays pervasive argillization and decarbonatization of host lithologies, along with the formation of dissolution collapse breccias and intense shearing. Where the alteration is strongest, the altered zones consist of punky, spongy decarbonatized limestone in an argillically altered fine-grained, carbon-rich matrix (Gustavson, 2012). Silicification is minor and occurs as a broad overprint on the zone. Historical underground production included both sulfide and oxide material.
| 1.3 | Data Verification and Quality Assurance/Quality Control |
The Property has been historically drilled using a combination of reverse circulation (RC) and diamond drilling. The majority of drilling was completed from surface. More recent drilling was completed as underground diamond core drilling. Sampling protocols adopted by former operators were similar and generally followed industry best practices of the time.
| | 11/8/2021 |
Granite Creek Mine Project
Premier Gold Mines Limited/i-80 Gold Corp. | Page 21
PEA NI 43-101 Technical Report |
RC samples were collected from the drill cyclone in 5-foot (1.5-meter) intervals. Diamond core was sampled predominantly as 5-foot (1.5-meter) intervals but were locally adjusted based on geological alteration and oxidation contacts. RC and core recovery were recorded and considered to be excellent.
Samples were prepared and analyzed by a number of accredited laboratories throughout the Project history, including ALS Chemex, Inspectorate American Laboratories (IAL), and American Assay Laboratories (AAL).
Data validation has been completed by various operators throughout the Project's history. This process comprised the checking of original assay certificates and drillhole records against the digital database. This was completed most recently in April 2019 by OMC.
Quality assurance/quality control (QA/QC) samples including Certified Reference Materials (CRMs), coarse blanks, and field duplicate samples were included regularly with samples submitted between 2005 and 2008. A limited number of CRMs were included with drilling completed in 2012.
In 2021, Dr. Samari of GRE reviewed all prior work on available QA/QC data between 2005 and 2015. Dr. Samari of GRE also reviewed and checked QA/QC procedures and the database provided by i-80 Gold Corp.
In general, the QA/QC sample insertion rates used fall below general accepted industry standards. For future exploration campaigns, standards, blanks, and duplicates, including one standard, one duplicate, and one blank sample, should be inserted every 20 interval samples, as is common within industry standards.
CRM samples show a reasonable level of accuracy, but poor to moderate precision when using standard deviations provided by the CRM supplier. A maximum of three to five different CRM samples would be adequate to monitor laboratory performance at the approximate cutoff grades, average grades, and higher grades of the deposits.
Blank sample results are considered acceptable and suggest no systematic contamination has occurred throughout the analytical process.
Duplicate sample results show suboptimal performance, which may be a result of the heterogenous nature of mineralization, uncrushed samples, and sampling variance. Overall, duplicate samples appear to be positively biased, with duplicate results returning higher grade than original samples.
Based on the review of the project database and all existing project documents and the author’s observations of the geology and mineralization at the project during the site visit, GRE’s QP considers the lithology, mineralization, and assay data contained in the project database to be reasonably accurate and suitable for use in estimating mineral resources.
| 1.4 | Mineral Processing and Metallurgical Testing |
i-80 is evaluating the feasibility of processing material from their Granite Creek Mine gold deposit in Nevada to produce saleable gold products. i-80 is evaluating mining material from the Mag and CX Open Pit mines and processing the mined material in a heap leach facility to produce gold bullion and mining material from the Ogee zone in the underground mine and selling this material (in a toll treating arrangement) to a nearby autoclave facility to process the refractory gold associated with Ogee material.
| | 11/8/2021 |
Granite Creek Mine Project
Premier Gold Mines Limited/i-80 Gold Corp. | Page 22
PEA NI 43-101 Technical Report |
Metallurgical testwork programs were conducted between 1999 and 2014 by metallurgical laboratories on behalf of the Homestake Mining Company (Homestake) (McClelland, 1999a) and Atna (McClelland, 2013; McClelland, 2014; Dawson, 2005; Dawson, 2006a; Dawson, 2006b).
The testwork on the Mag Pit and CX Pit open pit samples showed that:
| • | Many of the Mag Pit samples had high preg-robbing factors due to carbonaceous material in the feed. The QP believes this is a risk to gold recovery if it not treated correctly. |
| • | Testwork on ground materials showed that Mag Pit mineralized rocks were amenable to carbon-in-leach (CIL) methods. |
| • | Column leach tests on the Mag Pit samples achieved gold recoveries in the range of 19% to 82%. This variability is largely associated with the grade of total organic carbon (TOC) indicating a preg-robbing mechanism. |
| • | Column leach tests on the CX Pit samples achieved gold recoveries of 78 to 94%. |
The testwork on the Ogee underground samples showed that: autoclave pre-treatment ahead of cyanide leach testwork demonstrated significant increases in gold recovery relative to baseline cyanide leach tests.
High grade material extracted from the Ogee deposit between 2012 and 2013 was historically trucked eight miles to Newmont Mining Corporation's Twin Creeks autoclave facility for processing the material to produce gold bullion. Gold recoveries from the autoclave processing ranged from 69.2% to 92.6%.
Heap leach laboratory test work was used in conjunction with the available cyanide solubility data for the various pits to develop a geometallurgical recovery model. A variable recovery was applied to each block within the model. A high correlation was found between the actual lab data and the recovery equations for the heap leach model.
An evaluation was also completed for the pregnant solution robbing carbonaceous material to predict potential Carbon in Leach recovery. After identifying those zones with reduced cyanide solubility and/or pregnant solution robbing characteristics, predominately within the Mag Pit, a geometallurgical model was developed to predict recovery. This equation was used to predict a variable recovery for each block within the model. Details related to the modeling process will be found in Section 13.
These gold recoveries have been used to derive cut-off grades for Mineral Resource reporting.
| 1.5 | Previous Resource Estimates and Economic Models |
The following previous mineral resource estimates were completed for the Granite Creek Mine area:
| • | Revised Technical Report on the Pinson Gold Property, Humboldt County, Nevada (Sim, 2005) for Atna Resources |
| • | Technical Report Update, Pinson Gold Property, Humboldt County, Nevada, USA (Atna Resources Ltd., 2007) by Atna Resources personnel for Atna Resources |
| | 11/8/2021 |
Granite Creek Mine Project
Premier Gold Mines Limited/i-80 Gold Corp. | Page 23
PEA NI 43-101 Technical Report |
| • | NI 43-101 Technical Report, Pinson Project, Humboldt County, Nevada (Gustavson, 2012) prepared for Atna Resources |
| • | NI 43-101 Technical Report, Pinson Project, preliminary Feasibility Study, Humboldt County, Nevada (Golder Associates, 2014) for Atna Resources Ltd |
| • | Technical Report, Osgood Pinson Deposit NI 43-101 Technical Report, Humboldt County, Nevada (AMC, 2019) for Osgood Mining Company |
The report Mineral Resource Estimate in the AMC 2019 Technical Report is shown in Table 1-1.
Table 1-1: Summary of Underground Mineral Resources - AMC Technical Report 2019
| Classification | Tonnage (1000s) | Au Grade (opt) | Au Contained (1000s oz) |
| Measured | 268 | 0.297 | 80 |
| Indicated | 550 | 0.305 | 168 |
| Measured and Indicated | 818 | 0.302 | 247 |
| Inferred | 1,939 | 0.338 | 655 |
Table 1-2: Summary of Open Pit Mineral Resources - AMC Technical Report 2019
| Classification | Tonnage (1000s) | Au Grade (opt) | Au Contained (1000s oz) |
| Measured | 10,801 | 0.071 | 763 |
| Indicated | 24,010 | 0.051 | 1,214 |
| Measured and Indicated | 34,811 | 0.057 | 1,976 |
| Inferred | 13,488 | 0.045 | 605 |
The underground resources were reported at a cutoff grade of 0.16 ounces per ton (opt), and the open pit resources were reported at a cutoff grade of 0.10 opt.
The AMC 2019 mineral resources are shown here for completeness. The current GRE Mineral Resource Estimate was prepared independently and supersedes any previously prepared estimates.
| 1.6 | Mineral Resource Estimate |
In January 2021, GRE was contracted to complete a Mineral Resource Estimate incorporating the current drill hole database, previously mined out volumes, and backfilled volumes. This estimate is current as of the effective date of this report.
Table 1-3 shows the pit-constrained open pit Mineral Resource at a gold grade cutoff of 0.35 grams/tonne (gpt), and Table 1-4 shows the underground Mineral Resource at a gold grade cutoff of 5 gpt.
Table 1-3: Granite Creek Mine Project Open Pit Mineral Resource
| Class | Zone | Total Process Material (1000s Tonnes) | Total Contained Au (1000s t. oz) | Au Grade (ppm) |
| Measured | Pit B | 2,584 | 119 | 1.44 |
| Pit A | 281 | 15 | 1.61 |
| CX | 9,447 | 436 | 1.44 |
| MAG | 8,546 | 418 | 1.52 |
| Total | 20,857 | 988 | 1.47 |
| | 11/8/2021 |
Granite Creek Mine Project
Premier Gold Mines Limited/i-80 Gold Corp. | Page 24
PEA NI 43-101 Technical Report |
| Class | Zone | Total Process Material (1000s Tonnes) | Total Contained Au (1000s t. oz) | Au Grade (ppm) |
| Indicated | Pit B | 272 | 12 | 1.34 |
| Pit A | 504 | 14 | 0.89 |
| CX | 2,393 | 107 | 1.39 |
| MAG | 4,279 | 171 | 1.24 |
| Total | 7,448 | 304 | 1.27 |
| Measured + Indicated | Pit B | 2,856 | 131 | 1.43 |
| Pit A | 785 | 29 | 1.14 |
| CX | 11,840 | 543 | 1.43 |
| MAG | 12,824 | 588 | 1.43 |
| Total | 28,306 | 1,291 | 1.42 |
| Inferred | Pit B | 23 | 1 | 0.74 |
| Pit A | 120 | 2 | 0.62 |
| CX | 1,100 | 46 | 1.29 |
| MAG | 288 | 13 | 1.42 |
| Total | 1,531 | 62 | 1.26 |
| 1) The effective date of the Mineral Resources Estimate is May 4th, 2021. |
| 2) The Qualified Persons for the estimate are Terre Lane QP-MMSA and Hamid Samari QP-MMSA of GRE. |
| 3) Mineral resources are reported at a 0.35 g/t cutoff, an assumed gold price of 1,800 $/tr. oz, using variable recovery, a slope angle of 41 degrees, 6% royalty, heap leach processing cost $9.92 per tonne (includes admin), CIL processing cost of $17.63 per tonne (includes admin). |
Table 1-4: Granite Creek Mine Project Underground Mineral Resource
| Resource Class | Tonnage (1000s of tonnes) | Gold Grade (g/t) | Gold Oz (1000s t. oz) |
| Measured | 483 | 10.07 | 156 |
| Indicated | 525 | 10.70 | 181 |
| M&I | 1,008 | 10.40 | 337 |
| Inferred | 741 | 13.41 | 319 |
Notes:
| 1) | Cut-off is 5 g/t based on Mining Cost of $100/tonne, Process Cost of $106/tonne, recovery of 92%, and a gold price of $1600/oz. |
| 2) | Mineral Resources are not Mineral Reserves, and as such, do not have demonstrated economic viability. |
| 3) | Effective Date is May 4, 2021. |
| 4) | Figures are rounded and may show apparent errors in subtotals |
In Table 1-3 and 1-4, it is important to note that mineral resources are not mineral reserves and do not have demonstrated economic viability.
Mine plans for the resource areas were designed and planned using conventional open pit mining method for the low grade, widely distributed gold. The open pit areas are suitable for phased designs. Mechanized over-hand cut and fill underground mining method for the narrow, high grade deposits. This method was chosen for its ability to mine narrow vein deposits with little dilution and reducing labor cost. The underground area utilizes the previously mined development and includes new development to replace the current access which will be destroyed when the CX pit is mined.
| | 11/8/2021 |
Granite Creek Mine Project
Premier Gold Mines Limited/i-80 Gold Corp. | Page 25
PEA NI 43-101 Technical Report |
Granite Creek Mine is a past operating mine and as such has a large portion of the necessary infrastructure in place. A paved county road, number 789, leads to the edge of the property with a short gravel section, less than one mile leading to the existing Granite Creek Mine office.
In addition to the office, the metallurgical laboratory is still on the site, although the analytical equipment has been removed. Within the lab are offices, a wet lab, sample preparation, and a fire assay area. Attached to the lab are a small warehouse and small shop facility.
A 120 kV line feeds the mine-owned transformer, which is further stepped down to 13.8 kV, with available power estimated at 2 MW. Power to the underground operations is supplied at 480 V. There is a small transformer at the mine portal.
Four mine dewatering wells are in place and operational. To keep the mine dry requires pumping approximately 110 gpm, which the system is fully capable of doing. Water from the dewatering system is discharged to one of two Rapid Infiltration Basins (RIBs) on the east side of the county road. Four RIBs have been permitted but has not been constructed. There is also process water well on the east side of the county road, which feeds a process water tank and distribution system. All power lines to the underground mine and dewatering system are above ground and mounted on poles.
There is a fully functional truck scale adjacent to the office facility. This was used to weight trucks when the underground material was toll treated by a third-party mill.
A complete well maintained road system allows access to the historic open pits and underground mine in the CX Pit.
| 1.9 | Economic Model Results |
Ms. Lane of GRE performed an economic analysis of the project by building an economic model based on the following assumptions:
| • | Federal corporate income tax rate of 21% |
| • | Proceeds of Minerals Tax - variable, with a maximum of 5% of Net Proceeds |
| • | Nevada gold and silver mine royalty - variable, with a maximum of 1.1% of gross revenue |
| • | Sales and use taxes are not included in the model |
| • | Equipment depreciated over a straight 7 or 15 years and has no salvage value at the end of mine life |
| • | Depletion allowance, lesser of 15% of net revenue or 50% of operating costs |
| | 11/8/2021 |
Granite Creek Mine Project
Premier Gold Mines Limited/i-80 Gold Corp. | Page 26
PEA NI 43-101 Technical Report |
| • | Gold price of $1,650 per troy ounce |
| • | Gold recovery calculated per block as detailed in Section 13 |
| • | Leaching of 75% of the volume on the heap leach during the first year, 20% during the second year, and 5% during the third year |
| • | Underground material hauled off-site to a third-party Autoclave with 92% payable and $61/tonne material treatment charge and $5/tonne material transportation cost |
| • | Royalties on individual claims calculated by block, ranging from 0.02% to 7.5%, averaging 6.4%. There also is a 10% royalty applied to net profit. |
Ms. Lane of GRE selected the heap leach only case with 0.55 g/t cutoff, mining sequence B → CX → Mag, and contractor operation as the base case as it results in the best overall economic results. The economic model assues a 1 year construction period. The time for permitting has not been included in the economic model, but the permitting for the open pit mine is likely to take two to three years.
Table 1-5 lists the key economic results for the selected scenario.
Table 1-5: Key Economic Indicators
| After Tax Economic Measure | Value |
| After Tax NPV@5% (millions) | $244.9 |
| After Tax NPV@7% (millions) | $213.2 |
| After Tax NPV@9% (millions) | $185.1 |
| After Tax IRR | 34.2% |
| Initial Capital (millions) | $69.9 |
| Payback Period (years) | 3.75 |
| All-in Sustaining Cost ($/oz Au Produced) | $963.4 |
| Cash Cost ($/oz Au Produced) | $900.3 |
Readers are advised that Mineral Resources that are not Mineral Reserves do not have demonstrated economic viability under National Instrument 43-101. This PEA is preliminary in nature and includes inferred Mineral Resources that are considered too speculative geologically to have the economic considerations applied to them that would enable them to be categorized as Mineral Reserves under CIM Definition Standards. Readers are advised that there is no certainty that the results projected in this preliminary economic assessment will be realized.
| 1.9.2 | Sensitivity Analyses |
Ms. Lane of GRE evaluated the after-tax NPV@5% sensitivity to changes in gold price, capital costs, and operating costs. The results indicate that the after-tax NPV@5% is most sensitive to gold price, moderately sensitive to operating cost, and least sensitive to capital cost (see Figure 1-1).
| | 11/8/2021 |
Granite Creek Mine Project
Premier Gold Mines Limited/i-80 Gold Corp. | Page 27
PEA NI 43-101 Technical Report |
Figure 1-1 NPV@5% Sensitivity to Varying Gold Price, Capital Costs, and Operating Costs
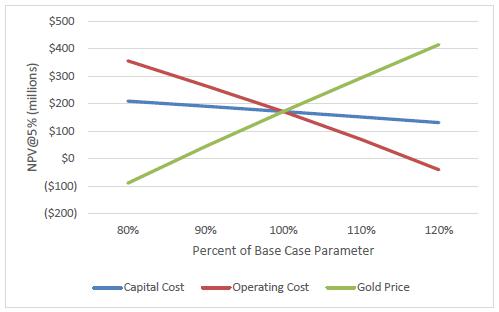
| 1.9.3 | Conclusions of Economic Model |
The project economics shown in the PEA are favorable, providing positive NPV values at varying gold prices, capital costs, and operating costs.
Table 1-6 tabulates the estimated costs to complete an intensive 2-year program designed to maximize the resource within the project area. Components of this program would include:
| • | Undergournd Exploration Drilling |
| • | Open Pit Area Exploration Drilling |
Table 1-6 Estimated Costs to Complete the 2-Year Program
| Exploration Cost Area | Total |
| Underground Exploration Drilling | $4,000,000 |
| OP Exploration Drilling | $2,400,000 |
| Metallurgical Testing | $400,000 |
| Permitting | $1,500,000 |
| Engineering | $750,000 |
| Total | $9,050,000 |
Significant drilling is needed to further upgrade and expand resources at Granite Creek. Drilling should focus on areas adjacent to existing underground infrastructure along strike and dip of historic workings. Many historic intercepts are currently classified as inferred, but can be upgraded to measured and indicated with additional drilling. Areas to focus with underground drilling include the Rangefront, Otto, and Adam Peak fault zones, as well as the area beneath the Ogee Zone. Additional drilling from surface should test the Adam Peak and Otto fault zones to the north along strike and deeper along dip. Further surface drilling should test for extensions of mineralization at depth along the footwall of the Mag fault as well as infill areas of the known open-pit mineralization.
| | 11/8/2021 |
Granite Creek Mine Project
Premier Gold Mines Limited/i-80 Gold Corp. | Page 28
PEA NI 43-101 Technical Report |
| 1.10.2 | Metallurgical Testing |
Additional metallurgical test work should be completed on the project to better define recoveries for all zones of the deposit.
| • | Collect samples for testing which are more spatially and mineralogical representative. |
| • | Complete metallurgical testing to include: |
| • | Cyanide solubility and pregnant solution robbing tests |
| • | Bottle roll tests with carbon to simulate CIL treatment |
| • | Leach column tests to simulate heap leach processing |
| • | Expand the predictive geometallurgical model to better predict heap leach and CIL recovery |
| • | Complete additional autoclave tests, from underground materials, to predict recovery by any lithology or mineralogy variations. |
| 1.10.3 | Permitting / Environmental |
The project currently has valid Nevada state permits for the underground mine. However, these permits are not adequate to support the mine plan described in this PEA. The project will require a full Environmental Impact Statement (EIS) under the National Environmental Policy Act (NEPA) as well as many other state and federal permits.
Nevada is a pro-mining jurisdiction, and there is a high likelihood that the permits can be acquired. However, there is a considerable amount of permitting work to accomplish prior to approval of the EIS with a Record of Decision (RoD) with the Bureau of Land Management (BLM). This includes the creation of several baseline datasets, the creation of many supplemental environmental reports, and ultimately, the EIS. It is recommended that this work commence as soon as possible because permitting may be the critical path to gold production.
| | 11/8/2021 |
Granite Creek Mine Project
Premier Gold Mines Limited/i-80 Gold Corp. | Page 29
PEA NI 43-101 Technical Report |
Global Resource Engineering Ltd. (GRE) was retained by i-80 Gold Corp. (i-80) to complete a National Instrument 43-101 (NI 43-101) Technical Report on the Granite Creek Mine Project (“Granite Creek Mine” or “the Property” or “the Project”). The Property is located in Humboldt County, Nevada.
The Mineral Resource Statement was prepared in accordance with the Canadian Institute of Mining, Metallurgy, and Petroleum (CIM) Estimation of Mineral Resources and Mineral Reserves Best Practice Guidelines (November 29, 2019).
i-80 is a British Columbia (Canada) company trading on the Toronto Stock Exchange (TSX) as IAU, and on the U.S. Over the Counter Market Group (OTCQB) as IAUCF.
The PEA is preliminary in nature and includes Inferred Mineral Resources that are considered too speculative geologically to have the economic considerations applied to them that would enable them to be categorized as Mineral Reserves under National Instrument 43-101. Readers are advised that there is no certainty that the results projected in this Preliminary Economic Assessment (PEA) will be realized.
The independent Qualified Persons (QPs) as defined by NI 43-101 responsible for the preparation of this Technical Report are:
| • | Terre Lane, MMSA 01407QP, Society of Mining, Metallurgy, and Exploration (SME) Registered Member 4053005 |
| • | Todd Harvey, PhD, PE, SME Registered Member 4144120 |
| • | Hamid Samari, PhD, MMSA 01519QP |
| • | Larry Breckenridge, P.E. |
The QPs are collectively referred to as the “Authors” of this PEA. Dr. Samari, Ms. Lane, Mr. Moritz, and Mr. Breckenridge have visited the property (see Section 2.4). In addition to their own work, the Authors have made use of information from other sources and have listed these sources in this document under “References.”
Table 2-1 lists the primary “Qualified Persons” (as defined in the National Instrument 43-101) that compiled different sections of the report.
Table 2-1: List of Contributing Authors
| Section | Section Name | Qualified Person |
| 1 | Summary | Terre Lane |
| 2 | Introduction | Terre Lane |
| 3 | Reliance on Other Experts | Terre Lane |
| 4 | Property Description and Location | Hamid Samari, Larry Breckenridge |
| | 11/8/2021 |
Granite Creek Mine Project
Premier Gold Mines Limited/i-80 Gold Corp. | Page 30
PEA NI 43-101 Technical Report |
| Section | Section Name | Qualified Person |
| 5 | Accessibility, Climate, Local Resources, Infrastructure, and Physiography | Hamid Samari |
| 6 | History | Hamid Samari |
| 7 | Geological Setting and Mineralization | Hamid Samari |
| 8 | Deposit Types | Hamid Samari |
| 9 | Exploration | Hamid Samari |
| 10 | Drilling | Hamid Samari |
| 11 | Sample Preparation, Analyses and Security | Hamid Samari |
| 12 | Data Verification | Hamid Samari |
| 13 | Mineral Processing and Metallurgical Testing | J. Todd Harvey, Rick Moritz |
| 14 | Mineral Resource Estimates | Terre Lane |
| 15 | Mineral Reserve Estimates | Terre Lane |
| 16 | Mining Methods | Terre Lane |
| 17 | Recovery Methods | J. Todd Harvey, Rick Moritz |
| 18 | Project Infrastructure | Rick Moritz |
| 19 | Market Studies and Contracts | Rick Moritz |
| 20 | Environmental Studies, Permitting and Social or Community Impact | Larry Breckenridge |
| 21 | Capital and Operating Costs | Terre Lane |
| 22 | Economic Analysis | Terre Lane |
| 23 | Adjacent Properties | Rick Moritz |
| 24 | Other Relevant Data and Information | Terre Lane |
| 25 | Interpretation and Conclusions | Terre Lane |
| 26 | Recommendations | Terre Lane |
| 27 | References | Terre Lane |
Note: Where multiple authors are cited, refer to author certificate for specific responsibilities.
The purpose of the Technical Report is to provide i-80 and its investors with a PEA of the project. This report contains:
| • | A resource estimate for the Project |
| • | An economic evaluation of the Project costs and revenues |
| • | An independent opinion as to the technical merits of the Project and the appropriate manner to proceed with continuing exploration and project development |
It is intended that this report may be submitted to those Canadian stock exchanges and regulatory agencies that may require it. It is further intended that i-80 may use the report for any lawful purpose to which it is suited.
| | 11/8/2021 |
Granite Creek Mine Project
Premier Gold Mines Limited/i-80 Gold Corp. | Page 31
PEA NI 43-101 Technical Report |
| 2.3 | Sources of Information |
Drill hole and assay data for the property were generated by various owners and operators and provided to GRE by i-80. Geologic maps, reports, results from geochemical sampling, geophysical work, and metallurgical testwork were supplied by i-80, including available work by previous owners and operators.
The Granite Creek Mine Project historically used a local mine grid coordinate system in U.S. feet for all topographic data. GRE prepared all modeling work in the same local grid coordinate system in U.S. feet; however, all resource data is reported in metric units: tonnages are in metric tons and grade is reported as grams per ton (g/t) unless otherwise noted. Cost and revenue are reported in U.S. dollars at the time this report was written.
| | 11/8/2021 |
Granite Creek Mine Project
Premier Gold Mines Limited/i-80 Gold Corp. | Page 32
PEA NI 43-101 Technical Report |
| 3.0 | RELIANCE ON OTHER EXPERTS |
The QPs have relied, in respect of legal aspects, upon the work of the Expert listed below. To the extent permitted under NI 43-101, the QPs disclaim responsibility for the relevant section of the Report:
| • | The following disclosure is made in respect of this Expert: Daniel A. Jensen, Shareholder, Parr Brown Gee & Loveless, a Professional Corporation, as advised in a letter of 23 July 2020 to AMC. |
| • | Report, opinion, or statement relied upon information on mineral tenure and status, title issues, royalties and mining concessions. |
| • | Extent of reliance: full reliance following a review by the QPs. |
| • | GRE has worked with Mr. Richard DeLong, a Nevada permitting specialist who frequently consults for i-80 Gold. His evaluation of the permitting requirements are presented in Section 20 and confirmed by GRE. |
| • | Portion of Report to which disclaimer applies: Section 4.2. |
| | 11/8/2021 |
Granite Creek Mine Project
Premier Gold Mines Limited/i-80 Gold Corp. | Page 33
PEA NI 43-101 Technical Report |
| 4.0 | PROPERTY LOCATION AND DESCRIPTION |
The Property is located 27 miles (43.5 kilometers [km]) northeast of Winnemucca, Nevada, in southeastern Humboldt County (Figure 4-1). The Project site is 35 miles (56.3 km) from Winnemucca by road and is 60 road miles (96.5 km) northwest of Battle Mountain, Nevada. The Project area encompasses approximately five square miles (1,300 hectares) in the Potosi mining district, surrounding and including the existing Granite Creek Mine. The geographic center of the Property is located at UTM 478,294E and 4,553,515N (NAD27, Zone 11 m).
Figure 4-1: Granite Creek Mine Project Location
| | 11/8/2021 |
Granite Creek Mine Project
Premier Gold Mines Limited/i-80 Gold Corp. | Page 34
PEA NI 43-101 Technical Report |
| 4.2 | Ownership, Mineral Rights, and Tenure |
The approximately five square mile project area contains both private land and unpatented Federal lode mining claims on BLM land. I-80 controls the property through a combination of full ownership, majority ownership, and leases.
In April, 2021, i-80 Gold Corp (i-80) through its wholly-owned subsidiary, Premier Gold Mines USA (PGU), acquired Osgood Mining Company LLC (OMC) from Waterton Global Resources Management. OMC being the owner of the Granite Creek Mine Project. Waterton Global Resources Management, through OMC, had acquired the Property in May 2016 from Atna Resources Ltd. (Atna) after Atna filed for Chapter 11 bankruptcy in November of 2015. Atna had acquired its interest in the Property through a series of transactions with Pinson Mining Company (PMC), an affiliate of Barrick Gold Corporation (Barrick), that culminated with Atna negotiating and closing the purchase of all of PMC’s interests in four square miles of the Property (Sections 28, 29, 32, and 33, Township 38 North, Range 42 East) in September 2011.
In May, 2021, i-80 through its wholly-owned subsidiary, PGU, purchased additional property from Seven Dot Cattle Co. LLC. and Christison family. This property, all within Township 38 North, Range 42 East, consisted of: 50% of the approximately 120 acre private parcel in Section 28, 33.3% of the Pinson #1A - 18A mining claims located in Section 32, and 100% of the private parcel consisting of Section 31.
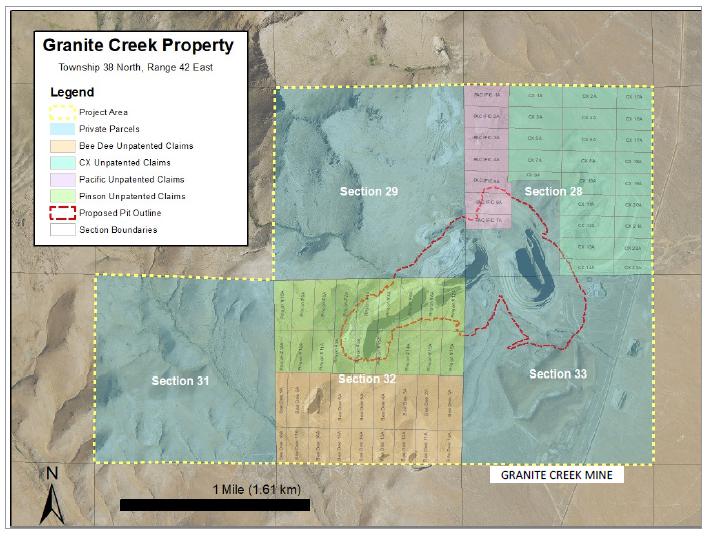
Figure 4-2 shows the properties included in the project area and relation to the proposed mine plans.
| | 11/8/2021 |
Granite Creek Mine Project
Premier Gold Mines Limited/i-80 Gold Corp. | Page 35
PEA NI 43-101 Technical Report |
Figure 4-2: Granite Creek Mine Property and Mining Claims Map
| 4.2.2 | Unpatented Federal Lode Mining Claims |
i-80 controls 68 mining claims covering portions of Sections 28 and 32, Township 38 North, Range 42 East through ownership (full or majority) and leases. Federal and county holding costs for the unpatented mining claims for 2020 will be approximately $12,000 in 2021.
| 4.2.2.1 | Pacific Unpatented Federal Lode Mining Claims |
i-80, through OMC, owns a 100% interest in the Pacific #1A-7A mining claims located in Section 28, Township 38 North, Range 42 East (see Figure 4-2). These claims were initially staked by the Cordilleran Explorations partnership and are subject to the Royal Gold Royalty, the Cordilleran Royalty, and the PMC Royalty described below.
| 4.2.2.2 | CX Unpatented Federal Lode Mining Claims |
i-80, through OMC, owns a 100% interest in the CX #1A-23A claims located in Section 28, Township 38 North, Range 42 East (see Figure 4-2). These claims were initially staked by PMC and are subject to the Royal Gold Royalty and the PMC Royalty described below.
| | 11/8/2021 |
Granite Creek Mine Project
Premier Gold Mines Limited/i-80 Gold Corp. | Page 36
PEA NI 43-101 Technical Report |
| 4.2.2.3 | BEE DEE Unpatented Federal Lode Mining Claims |
i-80, through OMC, controls a 100% interest in the BEE DEE group of claims (20 claims) through a Mining Lease Agreement with Franco-Nevada U.S. Corporation (50%) and S&G Pinson, LLC (50%) as the current lessors (the BEE DEE Lease Agreement). These claims are located in Section 32, Township 38 North, Range 42 East (see Figure 4-2). These claims are subject to a leasehold royalty payable to the lessors pursuant to the BEE DEE Lease Agreement as well as the Royal Gold Royalty and the PMC Royalty described below.
| 4.2.2.4 | Granite Creek Mine Unpatented Federal Lode Mining Claims |
i-80, through OMC and PGU, owns a 75% interest in the Pinson #1A-18A mining claims located in Section 32, Township 38 North, Range 42 East (see Figure 4-2). The remaining 25% interest in these claims is owned by Victor Christison (16.67%) and Michael Murphy (8.33%), and is not leased by OMC. The fact that OMC has not leased the unowned 25% interest in these claims does not preclude OMC from mining the claims. By law, OMC, as the co-owner of an undivided interest in these claims, has the right to mine the claims without permission or approval from (and even over any objections by) the other co-owners, subject, however, to an obligation on the part of OMC to account to the other co-owners for their proportionate shares of mining revenues less their proportionate shares of mining expenses. These claims are subject to the Royal Gold Royalty and the PMC Royalty described below and are also subject to a royalty initially held by Kate Murphy et al. as described in Section 4.2.3.
i-80, through OMC, owns a 100% interest in Sections 29 and 33, Township 38 North, Range 42 East. Section 29 is subject to the Royal Gold Royalty, the Cordilleran Royalty and the PMC Royalty described below. Section 33 is subject to the Royal Gold Royalty, the PMC Royalty, the Goldfield Royalty, and the Conoco Royalty described below.
i-80, through OMC and PGU, also owns a 91.67% interest in the 120-acre (48.5-ha) parcel comprising the east ½ of the southwest ¼ and southeast ¼ of the southwest ¼ of Section 28, Township 38 North, Range 42 East. The remaining interest in this parcel is owned by Michael Murphy (8.33% undivided interest). This parcel is subject to the Royal Gold Royalty and the PMC Royalty described below, as well as a royalty tied to PMC’s purchase of this land as described in Section 4.3.1.5.
i-80, through PGU, owns a 100% interest in Section 31, Township 38 North, Range 42 East.
| 4.2.4 | Underlying Agreements - Unpatented Federal Mining Claims |
OMC controls a 100% interest in the 20 BEE DEE unpatented federal lode mining claims by way of the BEE DEE Lease Agreement. The BEE DEE Lease Agreement provides for monthly minimum advance royalty payments to the lessors (currently Franco-Nevada U.S. Corporation (50%) and S&G Pinson, LLC (50%), which minimum advance royalty payments currently total $35,232.96 per year (subject to increases or decreases in accordance with the Consumer Price Index). OMC is also required under the BEE DEE Lease Agreement to maintain the leased claims with the Bureau of Land Management (BLM) and Humboldt County, Nevada. The BEE DEE Lease Agreement expires 9 May 2040.
The BEE DEE Lease Agreement imposes a two percent (2%) net mint or smelter returns (NSR) royalty on the BEE DEE claims in favor of the lessors.
| | 11/8/2021 |
Granite Creek Mine Project
Premier Gold Mines Limited/i-80 Gold Corp. | Page 37
PEA NI 43-101 Technical Report |
| 4.2.5 | Underlying Agreements - Fee Lands |
As explained in Section 4.2.3, OMC owns a 91.67% interest in the 120-acre patented fee land parcel in the southwest quarter of Section 28, Township 38 North, Range 42 East. The remaining 8.33% interest in that parcel is not leased by OMC. As noted above with respect to the Granite Creek Mine unpatented mining claims (which are only partially owned by OMC), the fact that OMC does not own or lease the outstanding 58.33% interest in this land does not preclude OMC from mining the land. By law, OMC, as the co-owner of an undivided interest in the land, has the right to mine the land without permission or approval from (and even over any objections by) the other co-owners, subject, however, to an obligation on the part of OMC to account to the other co-owners for their proportionate shares of mining revenues less their proportionate shares of mining expenses. OMC’s right to mine this parcel is subject to a 5/12 of two percent NSR royalty resulting from a Deed dated 8 September 2001 from Kate M. Murphy as grantor, a Deed dated 17 September 2001 from Barbara P. Noceto as grantor, and a Deed dated 24 December 2002 from Patricia B. Phillips as grantor, all to OMC’s predecessor in title.
| 4.3 | Underlying Agreements - Royalty Agreements |
The Granite Creek Mine Project is subject to several royalties. The following section, as summarized in Table 4-1, describes the royalties present on the various properties.
Table 4-1: Summary of Royalties Related to the Property
| Section | Property or Agreement Name | Royalty Owner(s) | From % | To % | Remarks |
| 28 | Fee Land |
| PMC purchase | Successors of Kate Murphy, et al. | 2 | 2 | Current royalty rate is 5/12 of 2% (NSR) |
| Royal Gold Royalty | Royal Gold & Duncan | 0.5 | 5 | 4% NSR split between Royal Gold (3.9158%) and Duncan (0.0842%) |
| PMC Royalty | NGM | 10 | 10 | Net profits |
| 28 | Pacific Mining Claims |
| Royal Gold Royalty | Royal Gold & Duncan | 0.5 | 5 | 1% NSR split between Royal Gold (0.97895%) and Duncan (0.02105%) |
| Cordilleran Royalty | Royal Gold | 5 | 5 | NSR |
| PMC Royalty | NGM | 10 | 10 | Net profits |
| 28 | CX Mining Claims |
| Royal Gold Royalty | Royal Gold & Duncan | 0.5 | 5 | 2.5% NSR split between Royal Gold (2.447375%) and Duncan (0.0526275%) |
| PMC Royalty | NGM | 10 | 10 | Net profits |
| 29 | Fee Land |
| Royal Gold Royalty | Royal Gold & Duncan | 0.5 | 5 | 3% NSR split between Royal Gold (2.93685%) and Duncan (0.06315%) |
| Cordilleran Royalty | Royal Gold | 3 | 3 | NSR |
| PMC Royalty | NGM | 10 | 10 | Net profits |
| 32 | BEE DEE Mining Claims |
| BEE DEE Lease Agreement | Franco-Nevada & S&G Pinson | 2 | 10 | Current royalty rate is 2% (NSR), split between Franco-Nevada (1%) and S&G Pinson (1%) |
| Royal Gold Royalty | Royal Gold & Duncan | 0.5 | 5 | 2% NSR split between Royal Gold (1.9579%) and Duncan (0.0421%) |
| PMC Royalty | NGM | 10 | 10 | Net profits |
| | 11/8/2021 |
Granite Creek Mine Project
Premier Gold Mines Limited/i-80 Gold Corp. | Page 38
PEA NI 43-101 Technical Report |
| Section | Property or Agreement Name | Royalty Owner(s) | From % | To % | Remarks |
| 32 | Pinson Mining Claims |
| Murphy royalty | Successors of Kate Murphy, et al. | 5.5 | 7.5 | NSR percentage is a sliding scale based on price per oz of gold. Current rate is 7.5% (for gold price higher than $700/oz). |
| Royal Gold Royalty | Royal Gold & Duncan | 0.5 | 5 | 4% NSR split between Royal Gold (3.9158%) and Duncan (0.084204%) |
| PMC Royalty | NGM | 10 | 10 | Net profits |
| 33 | Fee Land |
| Royal Gold Royalty | Royal Gold & Duncan | 0.5 | 5 | 1% NSR split between Royal Gold (0.97895%) and Duncan (0.02105%) |
| Goldfield Royalty | Franco-Nevada | 2 | 2 | NSR |
| Conoco Royalty | OMC | 5 | 5 | NSR |
| PMC Royalty | NGM | 10 | 10 | Net profits |
Note: All unpatented claims require annual assessment work to maintain validity.
| 4.3.1.1 | Royal Gold Royalty (Royal Gold, Inc. - Current Owner) |
In a NSR Royalty Agreement dated 30 November 1996, PMC agreed to pay Rayrock Mines, Inc. et al. (now Royal Gold, Inc. and D. M. Duncan, Inc.) an overriding NSR royalty that varies depending on the nature of the particular land holding and any underlying royalties existing on that land at the time of the transaction (the Royal Gold Royalty). The Royal Gold Royalty applies to all lands controlled by OMC and the subject of this Report, but it is not payable until 200,000 troy ounces (oz) of gold have been produced. Currently, the Royal Gold Royalty would commence after production of approximately 90,000 additional oz of gold from the Property.
For example, on fee lands now owned by OMC, the Royal Gold Royalty holders receive a 2.5% royalty on parcels not subject to an underlying royalty and a 0.5% royalty on parcels subject to a royalty, which increases to a 1% NSR royalty if the average gross value per ton of ore produced is greater than $175/ton.
On fee lands leased by OMC (of which there are none at present) and subject to royalties payable to a third party, the Royal Gold Royalty varies from a minimum of 0.5% to a maximum of 5% depending on the underlying royalty. The royalty percentage is determined by the difference between a total royalty load of 6% less the underlying royalty; however, the royalty will never exceed 5% or be reduced to less than 0.5%. For example, if the underlying royalty is 4%, then the Royal Gold Royalty would be 6% less 4%, resulting in a 2% royalty payable to the holders of the Royal Gold Royalty. If the underlying royalty is 0.5%, the Royal Gold Royalty would be 6% less 0.5% equaling 5.5%, which is greater than 5%, thus reducing the applicable royalty rate to 5%. If the underlying royalty is 6% or greater, the Royal Gold Royalty rate is limited to 0.5%.
| | 11/8/2021 |
Granite Creek Mine Project
Premier Gold Mines Limited/i-80 Gold Corp. | Page 39
PEA NI 43-101 Technical Report |
On unpatented lode mining claims not subject to underlying third-party agreements with retained royalties, the Royal Gold Royalty is 2.5%. If the unpatented mining claims have underlying retained royalties, then the royalty percentage is determined as described above under patented lands leased by OMC and subject to an underlying royalty with a maximum of 5% and a minimum of 0.5% dependent upon the underlying royalty load.
Table 4-1 lists the applicable Royal Gold Royalty rates for the various parts of the Property.
| 4.3.1.2 | Cordilleran Royalty (Royal Gold Inc. - Current Owners) |
The Cordilleran Explorations partnership, the original developer of the Property, received an overriding royalty on several parcels, including all of the patented Section 29, Township 38 North, Range 42 East, consisting of a 3% NSR. Cordilleran Explorations also received a 5% NSR overriding royalty on the Pacific unpatented lode mining claims located in Section 28, Township 38 North, Range 42 East. Royal Gold, Inc. is the current owner of both royalties.
| 4.3.1.3 | Goldfield Royalty (Franco-Nevada U.S. Corporation - Current Owner) |
In 1981, The Goldfield Corporation, in a Special Warranty Deed, reserved to itself a 2% NSR royalty on the production of minerals from privately owned Section 33 of Township 38 North, Range 42 East (the Goldfield Royalty). Section 33 is now owned by OMC. The Goldfield Royalty is now owned by Franco-Nevada U.S. Corporation.
| 4.3.1.4 | Conoco Royalty (OMC - Current Owner) |
In 1982, PMC acquired three and three-quarter square miles of fee lands from Conoco Inc. (Sections 23, 27, 33, and the west half and northeast quarter of Section 25, Township 38 North, Range 42 East). Conoco retained a 5% NSR royalty (the Conoco Royalty) on those parcels. Only the Section 33 parcel (which is owned by OMC) is part of the Granite Creek Mine Project. OMC now owns the Conoco Royalty as to said Section 33. Consequently, while Section 33 is burdened by the Conoco Royalty, that royalty is payable to OMC.
| 4.3.1.5 | PMC Royalty (NGM - Current Owner) |
All of the Property is subject to a 10% net profits royalty, payable to Nevada Gold Mines LLC (NGM) (which acquired the PMC Royalty from PMC on 1 July 2019), that will be triggered after (but only after) the first 120,000 ounces of gold (and/or the gold-equivalent of other minerals) are produced from the Property (the PMC Royalty). The PMC Royalty was created by a Mineral Production Royalty Agreement dated 31 August 2011, which is the reference date for determining when the 120,000-ounce royalty production threshold has subsequently been reached. The Property has produced approximately 6,834 ounces since the royalty was created.
| 4.4 | Environmental Liabilities |
Environmental liabilities associated with historical mining and processing operations at the site are considered minimal because the site has already been closed in the modern era (OMC, 2020), and it has achieved partial reclamation bond release. Photo 4-1 shows a photograph of the previously reclaimed waste rock dump.
| | 11/8/2021 |
Granite Creek Mine Project
Premier Gold Mines Limited/i-80 Gold Corp. | Page 40
PEA NI 43-101 Technical Report |
Photo 4-1: Reclaimed Waste Dump
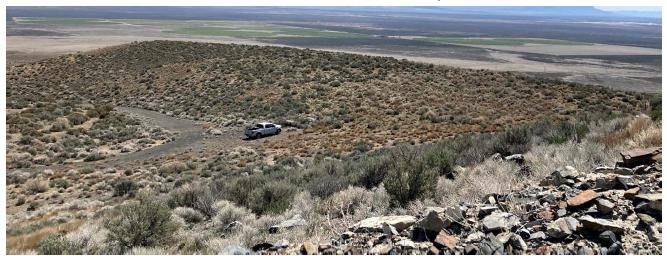
The revegetated hill in the foreground is the reclaimed mine waste and is virtually indistinguishable from surrounding land forms.
Current closure and reclamation financial sureties approved by the BLM and the Nevada Division of Environmental Protection total approximately $2.1M and cover all unreclaimed historical mining, exploration, and development operations at the Property.
No material environmental issues resulting from mining, exploration, and development operations have been identified at the Property. The site is currently and will continue to be monitored in accordance with the permit requirements. OMC is in good standing with all its regulatory obligations under its existing permits.
Many different permits will be required to execute the mining plan outlined in the PEA. Although OMC has all the primary permits in place to conduct underground mining operations at the Property, these permits are not sufficient for the future anticipated activities. OMC underground exploration and mining activities are permitted under Reclamation Permit #0242 and Water Pollution Control Permits (WPCPs) NEV2005102 and NEV2005103. Surface exploration disturbance within the plan boundary is permitted under Reclamation Permit #0047 and Plan of Operations NVN-064101.
However, as mentioned previously, the currently-planned scope of mining outstrips the current permitting.
A list of major active permits held by OMC for the Property is shown in Table 4-2.
Table 4-2: Active Permits
| Permit | Number | Agency |
| Granite Creek Mine Class II Air Quality Operating Permit | AQOP AP1041-3086.01 | NDEP BAPC |
| Mercury Air Emissions Control Program Tier-3 Non-Permit De Minimis | AQOP AP1041-3089 | NDEP BAPC |
| Water Pollution Control Permit: Granite Creek Infiltration Project (covering the four permitted Rapid Infiltration Basins, or RIBs) | NEV2005102 | NDEP BMRR |
| | 11/8/2021 |
Granite Creek Mine Project
Premier Gold Mines Limited/i-80 Gold Corp. | Page 41
PEA NI 43-101 Technical Report |
| Permit | Number | Agency |
| Water Pollution Control Permit: Granite Creek Mining Project (covering other discharges) | NEV2005103 | NDEP BMRR |
| Granite Creek Underground Mine Reclamation Permit | #0242 | NDEP BMRR |
| Granite Creek Mine (surface mine 1980-1999, 938 acres) | #0047 | NDEP BMRR |
Granite Creek Mining Plan of Operations (surface mine 1980-1999) | NVN-064101 (N24-83-004P) | BLM |
| Mining General Stormwater Permit | NVR300000/MSW-42365 | NDEP BWPC |
| Onsite Sewage Disposal System (OSDS) General Permit | GNEVOSDS09S0177 Project Identification #S0049 | NDEP BWPC |
| US ACOE Nationwide Permit | 199400663 Nationwide Permit #26 | US ACOE |
| EPA Hazardous Waste Generator | NV099530966 | EPA |
| Plan of Operations (Exploration Bond Update) | NVN-063764 | BLM |
| Plan of Operations (Mine) | NVN-064101 | BLM |
| EPA Toxic Release Inventory | 89414PNSNM22MIL | EPA |
These permits do not permit on-site mineral processing, nor the large-scale storage of mine waste. Section 20.0 describes the required permitting efforts to execute the Plan of Operations (PoO) described in this PEA.
Granite Creek Mine is located in the Kelly Creek drainage area. OMC currently controls sufficient water rights to operate the underground mine. Table 4-3 lists the water rights held by OMC.
Table 4-3: Water rights
| Application/Cert # | Owner | Diversion Rate (cfs) | Duty (AFA) | Use |
| 43130/13070 | Osgood Mining Company, LLC | 0.860 | 491.8 | Mining, Milling, and Domestic |
| 51388/14222 | Osgood Mining Company, LLC | 1.280 | 287.9 | Mining, Milling, and Domestic |
| 51427/14224 | Osgood Mining Company, LLC | 0.70 | 18.32 | Mining, Milling, and Domestic |
| 57885 | Osgood Mining Company, LLC | 0.90 | 651.57 | Dewatering |
| 57887 | Osgood Mining Company, LLC | 4.00 | 1076.00 | Dewatering |
| 65629 | Osgood Mining Company, LLC | 1.22 | 282.15 | Dewatering |
| 65630 | Osgood Mining Company, LLC | 0.47 | 114.88 | Dewatering |
| 65631 | Osgood Mining Company, LLC | 0.78 | 563.75 | Dewatering |
| 65632 | Osgood Mining Company, LLC | 1.8 | 800.00 | Dewatering |
| 68182 | Osgood Mining Company, LLC | 1.4 | 508.00 | Surface (Granite Creek) |
| 68183 | Osgood Mining Company, LLC | 1.45 | 525.00 | Surface (Granite Creek) |
| 77459 | Osgood Mining Company, LLC | 12.61 | 9129.23 | Mining, Milling, and Dewatering |
| 78956 | Osgood Mining Company, LLC | 1.00 | 723.97 | Mining, Milling, and Dewatering |
| 85178 | Osgood Mining Company, LLC | 2.25 | 1628.93 | Mining, Milling, and Dewatering |
| 85179 | Osgood Mining Company, LLC | 0.60 | 434.385 | Mining, Milling, and Dewatering |
| | 11/8/2021 |
Granite Creek Mine Project
Premier Gold Mines Limited/i-80 Gold Corp. | Page 42
PEA NI 43-101 Technical Report |
The site has full water rights for Granite Creek, the largest drainage that crosses the property. Granite Creek is an ephemeral drainage that is captured upgradient from the CX pit and conveyed in a pipeline to the channel downgradient from the open pits, which then flows between the rapid infiltration basins (RIBs). This water right is useful because if operations require it, this water can be managed at the discretion of the project.
| | 11/8/2021 |
Granite Creek Mine Project
Premier Gold Mines Limited/i-80 Gold Corp. | Page 43
PEA NI 43-101 Technical Report |
| 5.0 | ACCESSIBILITY, CLIMATE, LOCAL RESOURCES, INFRASTRUCTURE AND PHYSIOGRAPHY |
| 5.1 | Accessibility and Local Resources |
The Property is accessed by a combination of paved interstate and state highways, and well-maintained, unpaved private roads. Beginning in Winnemucca, travel east on Interstate 80 for 15 miles (24 km) and turn north at the Golconda exit. Proceed through Golconda to Nevada State Highway 789 and continue 16 miles (26 km) to a fork in the road and the end of the paved surface. The right gravel fork leads to the Ken Snyder Mine and the town of Midas. The Granite Creek Mine deposit is located 4 miles (6 km) north along the left gravel fork, and the Getchell and Turquoise Ridge Mines are 7 miles (11 km) further up the road. The left fork terminates at the Twin Creeks Mine, 15 miles (24 km) north of the end of the pavement.
Winnemucca is the single urban population center in Humboldt County, with a population of more than 7,300, and is the nearest significant source of mining personnel and resources for operations at the Property. Winnemucca is a historical ranching community that grew to support regional large-scale mining following the discovery of several substantial gold deposits in the 1980s. A general aviation airport serves the local community, and a variety of logistical support is available from resident businesses. The active, relatively close-proximity Getchell/Turquoise Ridge and Twin Creeks mining complexes may provide an additional source of logistical support and skilled labor.
| 5.2 | Topography, Elevation, Vegetation, and Climate |
The Property is situated in the Great Basin region of the Basin and Range Physiographic Province. North-south striking mountain ranges and parallel intermontane basins characterize the area. The entire region is a closed drainage system, with all the permanent streams flowing to interior “sinks,” such as the Carson and Humboldt sinks, or interior lakes such as Pyramid and Walker. Elevations in the area range from about 4,000 feet (1,219 meters) above mean sea level (amsl) in the basins, to over 9,000 feet (2,743 meters) amsl in the surrounding ranges. The local terrain near the Project is generally moderate.
Local vegetation consists of mixed sagebrush, shrubs, and grasses. Sagebrush and shrub species include two varieties of sagebrush (big and low); three of rabbitbrush (rubber, green, and low); bitterbrush; little leaf horsebrush; and desert peach. Grasses include Sandberg bluegrass, cheatgrass, Basin wild rye, wheatgrass, needlegrass, pepperweed, Russian thistle, halogeton, phlox, lupine, balsamroot, and Indian paintbrush (BLM, 2001).
The climate in the Project area is semi-arid, with little rainfall, low humidity, and generally clear skies. Based on data provided by the Western Regional Climate Center for the nearby Rye Patch Dam weather station, local average monthly temperatures range from about 43°F (6°C) in January to around 94°F (34°C) in July, and annual extremes range from -28 to 111°F (-33 to 43.9°C). Average annual precipitation is around 7.82 inches (19.86 centimeters), and most precipitation falls as snow during the winter months. Winter and wet weather conditions occasionally limit access to the Project site, but, in general, mining operations may be conducted year-round on the Property.
| | 11/8/2021 |
Granite Creek Mine Project
Premier Gold Mines Limited/i-80 Gold Corp. | Page 44
PEA NI 43-101 Technical Report |
Existing infrastructure at the Project includes an office building, dry and warehouse facilities, and a lined stockpile area on the surface. Over 9,000 feet (2,743 meters) of underground workings have been completed, and four deep dewatering wells were drilled and cased, two of which are currently being operated.
Electrical infrastructure suitable for mine operations is installed, and two re-infiltration basins and associated pipelines have been constructed to re-infiltrate water produced in mine dewatering into the valley aquifer.
The mine is accessed through either of two portals, and dual egress has been established for most areas of the mine. Where dual egress is not possible, rescue chambers have been installed. Equipment is repaired in an underground mine shop. Air doors and a ventilation fan provide required air supply to the workings in compliance with Mine Safety and Health Administration (MSHA) standards.
Landline telephone and digital subscriber line service are available at the Project site. Cellular phone service is also available, but is dependent on the strength of receiving antennas, topography, and lines of sight.
| 5.4 | Water and Water Discharge |
Water rights are presented in Table 4-3. The project has sufficient water rights to run the mineral processing and to account for any additional onsite water needs. Indeed, the site has excess water.
To manage this excess water, the site has four Rapid Infiltration Basins (RIBs). These are closed basins surrounded by a berm, which allow for the infiltration of excess mine water. Two RIBs have been constructed. A total of four RIBs are permitted. The RIBs are permitted for the infiltration of 6,900 gpm of water. Photo 5-1shows a photograph of the RIB 1.
| | 11/8/2021 |
Granite Creek Mine Project
Premier Gold Mines Limited/i-80 Gold Corp. | Page 45
PEA NI 43-101 Technical Report |
Photo 5-1: Rapid Infiltration Basin 1
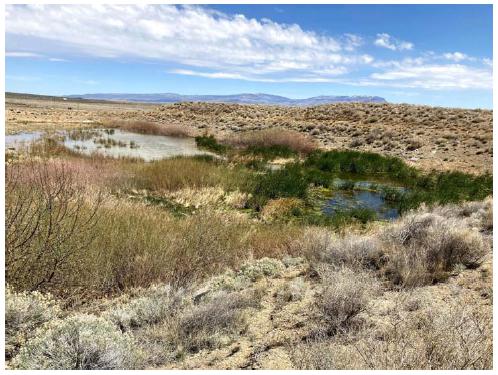
This capacity can be used to dewater the pits, and will likely be sufficient for any reasonable scenario for underground dewatering. This is not based on an evaluation of the hydrogeologic data, but instead on common sense. The existing dewatering of the underground requires 250 gpm of pumping for four hours per day. Mr. Breckenridge of GRE believes that a steady-state discharge rate for a larger and deeper mine will likely only be about two to four times the existing load. This is still far lower than the RIB permit.
There are many prior hydrogeologic studies of the site, and a long history of pit and underground dewatering. This experience has shown that the aquifers appear to be fairly low-yield with compartmentalized stored water and a relatively modest (see above) steady state inflow rate. There also appears to be an unconductive fault between the MAG and CX pit which limits flow between these nearby areas. This is easily observed by the fact that the water level in the MAG pit lake is higher than the water level in the CX pit and underground workings. In other words, pumping CX dry has not dried up MAG.
The mine will start with the B and CX pits. In year three, the mine will start mining the MAG pit. Operations must manage the RIBs in such a way that the MAG pit can be dewatered prior to mining while maintaining a maximum water disposal rate of 6,900 gpm.
The RIBs still require some development. OMC has promised the regulators that they will construct a RIB surge pond (to remove sediments and stabilize flow) and that they will conduct an arsenic attenuation study (See section 20). Also, prior to anticipated demand, two more RIBs should be constructed.
| | 11/8/2021 |
Granite Creek Mine Project
Premier Gold Mines Limited/i-80 Gold Corp. | Page 46
PEA NI 43-101 Technical Report |
The Property has been explored by a number of individuals and mining/exploration companies since the late 1930s. The original discovery on the Property was made by Clovis Pinson and Charles Ogee in the mid to late-1930s, but production did not occur until after World War II, when ore from the original discovery was shipped to and processed at the Getchell mine mill. In 1949 and 1950, total production from the Granite Creek Mine mine amounted to approximately 10,000 short tons (9,071 tonnes) grading approximately 0.14 ounces per ton (opt) (4.8 g/t).
| 6.1 | Prior Ownership and Ownership Changes |
The Property remained functionally dormant from 1950 until 1970, when an exploration group known as the Cordex I Syndicate (John Livermore, Peter Galli, Don Duncan, and Rayrock Resources) leased the Property from the Christison Family (descendants of Mr. Pinson and Property owners), on the strength of its similarity to the Getchell Property and structural position along the range-front fault zone bordering the Osgood Mountains. Following a surface mapping and sampling program in 1971, 17 reverse circulation (RC) drillholes were completed in and around the 1940s era Granite Creek Mine pit, confirming low- grade gold values. An 18th step-out hole encountered a 90-foot (27.4-meter) intercept of 0.17 opt (5.8 g/t) gold (Au). This intercept was interpreted as a subcropping extension of known mineralization northeast of the original pit and was the basis for delineation of what would become the “A” Zone at the Property, a 60-foot (18-meter) by 1,000-foot (305-meter) shear zone. During the late 1970s, the Cordex I Syndicate reorganized into a Nevada Partnership known as PMC, with Rayrock Resources as the Project operator, and began production at the Property.
Cordex Syndicate (Cordex), and its successor, PMC, explored the Property largely through mapping and geochemical sampling. There are three known mapping programs:
| • | A regional mapping program from Preble to Getchell by Pete Chapman in the late 1970s |
| • | A 1:6000-scale mapping program of the Property in 1983 |
| • | A 1:2400-scale mapping program of the Pit areas through the active life of the mine |
| 6.1.2 | Pinson Mining Company |
PMC began developing the A Pit in 1980 and produced gold the following year. Production from the B Pit began in 1982. Step-out drilling in 1982 to 1983 to the northeast of the A Zone intersected two more discrete zones: the C Zone extending east-northeast from the A Zone and the CX Zone extending northeast from the C Zone. Step-out drilling northeast of the CX Zone in 1984 located an apparently independent fault system (striking north-northwest), dipping steeply east that became the core of the Mag deposit, which went into production in 1987. PMC produced from the CX, CX-West and Mag Pits into the mid to late 1990s, until a combination of falling gold prices and erratic mill feed forced closure of the oxide mill in early 1998. Continued attempts to expand production of oxide ore failed, and all active mining ceased on 28 January 1999 (McLachlan, et al., 2000). The project was officially closed in May 2000.
| | 11/8/2021 |
Granite Creek Mine Project
Premier Gold Mines Limited/i-80 Gold Corp. | Page 47
PEA NI 43-101 Technical Report |
In the 1990s, Homestake and Barrick became 50/50 partners in PMC through purchase of minority interests (McLachlan, et al., 2000). Homestake and Barrick conducted an exploration program from 1996 to 2000 through PMC, expending some $12M on the Project. The joint venture explored the deeper feeder fault zones of the Property, exploring for a large, high-grade gold system that would support a refractory mill complex. This work, while successful in identifying gold mineralization with underground grades, failed to identify a deposit of sufficient size to be of development interest to Homestake or Barrick, and the partners concluded the exploration program. Subsequent to that decision, in 2003, Barrick acquired Homestake and drilled an additional three exploration drillholes.
| 6.1.4 | Atna Resources Ltd. Earn-in and PMC Back-in |
In August 2004, Atna acquired an option to earn 70% Joint Venture interest in the Property from PMC, a wholly-owned subsidiary of Barrick, and commenced additional follow-up exploration and development of the Property. Atna completed its earn-in in 2006 and vested in its 70% interest in the Project after expending the required $12M in exploration and development expenditures. PMC elected to back-in to the Project and re-earn an additional 40% interest (bringing PMC’s interest to 70% and Atna’s to 30%) on 5 April 2006. PMC spent over $30M on the Project during the next three-year period and completed its “claw-back” in early 2009. Their work included surface and underground diamond core drilling, RC drilling, underground drifting, and surface infrastructure construction (rapid infiltration basins, mineralized material stockpile pad, underground electrical service upgrades, etc.). A new mining joint venture was formed in 2009 reflecting the Project’s ownership, with PMC owning a 70% interest in the venture and Atna owning a 30% interest. PMC, as the majority interest owner, was the operator of the joint venture.
| 6.1.5 | Atna 2011 - 2013 Underground Development |
In September 2011, Atna negotiated the acquisition of PMC’s 70% joint venture interest in the core property position at the Granite Creek Mine Project. The asset purchase and sale agreement included all right title and interest to the core property described above as well as an evergreen processing agreement with Barrick for the processing of underground refractory ores from Granite Creek Mine at Barrick’s Goldstrike facilities.
Development of the Granite Creek Mine underground mine commenced in early 2012, and mine ramp-up began in late 2012. In total, 6,011 feet (1,832 meters) of primary and secondary development were completed during 2012 and 2013. The primary spiral ramp was driven to the 4530 level from the 4650 adit level, and both top cut and underhand ore mining occurred in three Ogee-zone stope blocks during development. Additional secondary access drifts were in progress when the mine was placed on care and maintenance to access the Range Front and Adams Peak mineral zones but were not completed prior to cessation of underground work. Mining was performed by contract miners using underground mining equipment owned by the contractor. Approximately 30,000 short tons (27,216 tonnes) of ore containing 7,900 oz of gold were mined and shipped to off-site processing facilities.
Work on the Project continued until June of 2013, when the mine was placed on care and maintenance. This decision was driven by a number of factors, including the steep decline in the gold prices in 2013.
| | 11/8/2021 |
Granite Creek Mine Project
Premier Gold Mines Limited/i-80 Gold Corp. | Page 48
PEA NI 43-101 Technical Report |
In May 2014, the status of the underground mine was changed to an intermittent production status. Under this status, periodic mining of ores from stoping areas developed in 2013 was conducted to develop and test revised stoping methods for the underground and to prove mining economics at small production rates.
| 6.1.6 | Osgood Mining Company LLC Acquisition |
In 2016, OMC, a wholly owned subsidiary of Waterton Global Resources Management, acquired the Project. OMC completed numerous drillhole database compilation and verification campaigns, beginning with migration of the ATNA database to Maxwell Datashed Database software in 2017 and database verification and improvement efforts in 2018. In 2016, OMC, with an external consultant, completed a project-scale structural geology study that included surface and underground mapping, historical data review, and cross section interpretation aimed at defining the main structural architecture at Granite Creek Mine and developing exploration and resource drilling targets. This work formed the basis of an updated 3-dimensional (3D) litho-structural model that was used for the 2020 Mineral Resource estimation (AMC, 2020). From 2017 to 2018, OMC also completed an extensive drill material inventory and salvage program that secured the available drill core and RC chips on the property.
OMC continued to maintain compliance and keep all environmental permits for the site in good standing. This included performing permit-related sampling and reporting, as well as renewing permits. In addition, OMC performed regular inspections of the site. During the ownership period, OMC worked with the State of Nevada to close out a Water Pollution Control Permit for a reclaimed portion of the mine, reducing the overall compliance monitoring and reporting liabilities for the operator. In addition, OMC received approval from the State to remove portions of the reclaimed site from the bond.
In addition to these geology and compliance activities, OMC continued to maintain and improve site infrastructure, including a third-party review of hydrology and dewatering requirements that resulted in the replacement of pumps (2019) and the upgrading of two dewatering well process controls. Rapid infiltration basins have been maintained as needed, with water flows being tracked and monitored.
In April, 2021, i-80 Gold Corp was created as a spinout of Premier Gold Mines Limited’s assets located in Nevada concurrent to Equinox Gold Corp acquiring Premier Gold Mines Limited. The same month, the newly created i-80 Gold Corp completed acquisition of OMC from Waterton Global Resources Management. In May, 2021, additional land was purchased by i-80, further increasing the size and ownership in the land package.
| 6.2 | Historical Mineral Reserve and Production |
The issuer is not treating the historical estimate as a current Mineral Resource or Mineral Reserve. The details of the initial reserve can be found in the Gustavson Associates Technical Report (2012).
Historically, the Granite Creek Mine Project, with small additions from the nearby Preble and Kramer Hill mines, was credited with gold production in excess of 1 million ounces and less than 100,000 oz of silver (Tingley, 1998). PMC independently compiled a record of production and credited the Granite Creek Mine Property with production of 986,000 oz of gold through 1999.
| | 11/8/2021 |
Granite Creek Mine Project
Premier Gold Mines Limited/i-80 Gold Corp. | Page 49
PEA NI 43-101 Technical Report |
Table 6-1 shows the historical production and initial reserve from the Granite Creek Mine Project.
Table 6-1: Granite Creek Mine Property Production Summary
| Deposit | Year of Discovery | Years in Production | Initial Reserves | Gold Produced (troy oz) | References |
| Short Tons | Gold Grade (opt) | Contained Gold (oz) | Mill Ore Tons | Leach Ore Tons |
| Gold Deposits of the Pinson Mining Company |
| A | 1963, 1971 | 1980 - 1985 | 2,500,000 | 0.108 | 270,000 | 369,753 | 83,469 | Hill 1971, PMC 1993 |
| B | 1971 | 1982 - 1988 | 3,400,000 | 0.050 | 170,000 | Included | Above | As above |
| C | 1982 | 1988 - 1996 | 233,000 | 0.017 | 3,961 | 10,773 | N/A | PMC 1993, 1999 |
| CX | 1982 | 1990 - 1999 | 1,684,000 | 0.070 | 117,880 | 83,951 | 33,884 | PMC 1993, 1999 |
| CX-West | 1993 | 1994 - 1999 | | | 0 | 3,962 | In CX | PMC 1996, 1999 |
| Mag (mill ore) | 1984 | 1987 - 1999 | 4,300,000 | 0.080 | 344,000 | 301,255 | N/A | PMC 199_, 1999 |
| Mag (leach ore) | | | 2,300,000 | 0.030 | 69,000 | N/A | 59,741 | Foster and Kretschmer 1991, PMC 1999 |
| Felix | 1972 | 1989 - 1992 | 355,000 | 0.030 | 10,650 | 1,133 | 11,641 | PMC 1993, 1999 |
| Blue Bell | 1972, 1983 | 1993 - 1994 | 228,000 | 0.072 | 16,416 | 17,014 | 1,085 | PMC 1993, 1999 |
| Pacific | 1984 | 1992 - 1993 | 130,000 | 0.048 | 6,240 | 4,939 | 2,607 | PMC 1993, 1999 |
| Granite Creek Mine | 08/1999 - 12/1999 | | | | 0 | 2,141 | PMC 1999 |
| Granite Creek Mine Underground | 2012-2013 | *30,148 | *0.263 | *7,915 | **6,834 | | Atna mine records |
| Granite Creek Mine combined production | | | 1,016,062 | 799,614 | 194,568 | Total Granite Creek Mine production: 994,182 oz gold |
| Prior gold production on PMC properties |
| Ogee & Pinson | 1945 | 1949 - 1950 | | | | | ~10,000 | Hill 1971 |
| | | | | | | | | | | |
Notes:
*Underground production is tonnage and grade produced and includes minor low-grade development tonnage that was upgraded by screening to a shippable product.
**Underground production reflects ounces recovered at third-party mills from shipped underground ores.
| | 11/8/2021 |
Granite Creek Mine Project
Premier Gold Mines Limited/i-80 Gold Corp. | Page 50
PEA NI 43-101 Technical Report |
| 7.0 | GEOLOGIC SETTING AND MINERALIZATION |
The Property is located on the eastern flank of the Osgood Mountains within the Basin and Range tectonic province of northern Nevada. The Granite Creek Mine, together with the Preble, Getchell, Turquoise Ridge, and Twin Creeks mines, are on what is referred to as the Getchell gold trend (Getchell trend). The main Getchell trend generally strikes northeast-southwest and has been cross-cut by secondary north-south and northwest-southeast-trending structures. The deposits are hosted in Paleozoic marine sedimentary rocks. The rocks are exposed in the Osgood Mountains and have been complexly thrust faulted (Hotz, et al., 1964) and intruded by the Cretaceous-aged (92 Ma) (Silberman, et al., 1974) Osgood Mountains granodiorite stock. These units are unconformably overlain by Miocene volcanic rocks. Figure 7-1 is a regional geologic map of the Osgood Range.
Figure 7-1: Regional Geologic Map of a Portion of the Osgood Mountains
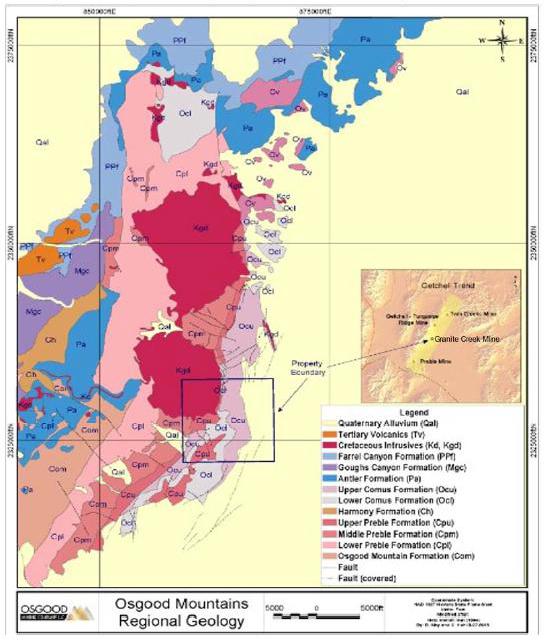
| | 11/8/2021 |
Granite Creek Mine Project
Premier Gold Mines Limited/i-80 Gold Corp. | Page 51
PEA NI 43-101 Technical Report |
As mapped by Hotz and Willden (1964) and Jones (1991, cited in McLachlan et al. 2000), the Osgood Mountains are underlain by Cambrian through Permian metamorphic and sedimentary rocks that were deposited on the rifted western margin of the North American Craton. These rocks have been intruded by the Cretaceous-aged Osgood Mountains granodiorite stock, which forms the core of the Osgood Mountains, and plunge north (Chevillon, et al., 2000). A significant thermal metamorphic aureole surrounds the stock.
At least four Paleozoic terranes, defined by structure, lithology, and age comprise the Osgood Mountains (McLachlan, et al., 2000). These include the:
The Osgood Mountain terrane has been described by Jones (1991, cited in McLachlan et al. 2000) and is comprised of the Cambrian Osgood Mountain Quartzite and the Cambrian Preble Formation. Both units have undergone regional metamorphism and intense, northwest-directed folding (McLachlan, et al., 2000). At the Getchell Project, these two units are folded together to form the northwest-verging Pinson anticline.
The Leviathon allochthon described by Stenger et al. (1998) is exposed at the Turquoise Ridge and Twin Creeks mines. The assemblage was mapped as “Ordovician Valmy” by Hotz and Willden (1964), although it differs somewhat from Valmy Formation (Ov) as exposed in other areas of Nevada (McLachlan, et al., 2000). The Leviathon allochthon is composed of a thick (>980-foot [299-meter]) sequence of mid-ocean ridge basalts and intercalated pelagic sediments that have been thrust over the Twin Creeks member of the Comus Formation (Stenger, et al., 1998). This sequence has not been identified at the Granite Creek Mine.
The Antler overlap sequence in the Osgood Mountains consists of the Pennsylvanian Battle Formation, and Pennsylvanian-Permian Etchart and Adam Peak formations (McLachlan, et al., 2000). The Battle conglomerate consists of cobbles and pebbles of quartzite. The Etchart lies conformably on the Battle and consists of calcareous sandstone underlying fossiliferous limestone. South of the Getchell Project, the Battle and Etchart lie unconformably on the Preble Formation and Osgood Mountain Quartzite (McLachlan, et al., 2000).
The Golconda allochthon comprised of the Mississippian Goughs Canyon and the Pennsylvanian-Permian Farrel Canyon formations is present along the northwest flank of the Osgood Mountains. The thrust strikes north to northeast from the central part of the range to the Dry Hills in the north (McLachlan, et al., 2000). These units are not present at the Granite Creek Mine Project.
The geology at the Property is typified by folded Cambrian to Ordovician sedimentary rocks that have been intruded by Cretaceous stocks, which have been cross-cut by later high-angle structural deformation. Hotz and Willden (1964)suggest the high angle faulting is related to the Basin and Range extension. The older rocks are overlain by Miocene andesitic basalt and the surrounding fault-bounded basins filled with quaternary alluvial (Qal) gravel. The Osgood Mountains have a general northeast trend, although, in the vicinity of the Granite Creek Mine, the east flank of the range trends north. Gold mineralization is primarily hosted by fine-grained marine sedimentary rocks that overlie a large stock of Cretaceous granodiorite. The Property is considered to be part of the Osgood Mountain terrane.
| | 11/8/2021 |
Granite Creek Mine Project
Premier Gold Mines Limited/i-80 Gold Corp. | Page 52
PEA NI 43-101 Technical Report |
At the Property, Cambrian to Ordovician siliciclastic and carbonate rocks have been intruded by the Cretaceous Osgood Mountain granodiorite, resulting in the formation of large metamorphosed aureoles with development of several tungsten-bearing skarns. The lowest stratigraphic units recognized at the Property are the Cambrian phyllitic shales, limestone interbeds, and various hornfelsed sedimentary rocks of the Preble Formation, which are juxtaposed against the granodioritic intrusive. The Preble is overlain by Ordovician sedimentary rocks of the Comus Formation, both of which have been folded into a broad, north-plunging anticline. The west flank of the anticline has been over-thrust by the Ordovician Valmy Formation, which consists of deep-water siliceous shales and cherts. The core of the anticline and scattered localities along the east side of the Osgood Mountains are unconformably overlain or in fault contact with sandstones and conglomerates of the Battle Formation and limestones of the Etchart Formation.
A second structural trend evidenced by the presence of the Golconda and Humboldt thrusts displaced Mississippian volcanics and Pennsylvania shales eastward along the northwest and southern flanks of the Osgood Mountains. Extension during the Tertiary resulted in outflows of rhyolitic tuffs, Miocene basalt, andesite flows, and younger basalt flows.
Gold mineralization at the Property is primarily hosted in the Comus Formation, as shown in Figure 7-2.
The stratigraphy of the Osgood Mountains from youngest to oldest is:
| • | Quaternary: Qal / Qb - Alluvium and basalt |
| • | Tba - Andesite and basalt flows. Dark green to black aphanitic and weakly porphyritic flows, flow breccia |
| • | Tr - Rhyolitic tuffs. Pumice, welded, reworked, tan to white |
| • | Tcg - Chert, shale, rhyolite clasts in a sandy matrix |
| • | Cretaceous: Kgd - Granodiorite, quartz diorite. Equigranular, medium grain intergrowths of feldspar, quartz, biotite, and hornblende. |
| • | Permian / Pennsylvanian: |
| • | PPfc - Farrell Canyon Formation. Interbedded sandstone, chert, shale, siltstone with minor volcanic flows and pyroclastics. Chert, interbedded with sandstone composes up to 50% of the unit. |
| | 11/8/2021 |
Granite Creek Mine Project
Premier Gold Mines Limited/i-80 Gold Corp. | Page 53
PEA NI 43-101 Technical Report |
Figure 7-2: Stratigraphy of the Getchell Trend

| • | PPa - Adam Peak Formation. Chiefly shale and siltstone with 40-60% dolomitic sandstone and chert. Shales and siltstones are dolomitic. Unit contains 2-3% phosphate. |
| • | PPe - Etchart Limestone. Limestone, sandy limestone, dolomite. Lower portion is sandy limestone with local pebble conglomerate. Upper portion is pure limestone with interbedded dolomite and sandy dolomite. Minor calcareous shale. |
| • | Pennsylvanian: Pb - Battle Formation. Poorly bedded, poorly sorted boulder and pebble conglomerate with coarse-grained sandstone and minor limestone clasts composed of Osgood Quartzite and chert in a shaley to sandy matrix. |
| • | Ov - Valmy Chert. Chert, shale, quartzite, volcanics (greenstone). Interbedded chert and shale with quartzite greenstone bed on east side of the Osgood Mountains. Interbedded with shale and minor limestone. Quartzite dominant in lower portion and chert, shale in upper portion. |
| | 11/8/2021 |
Granite Creek Mine Project
Premier Gold Mines Limited/i-80 Gold Corp. | Page 54
PEA NI 43-101 Technical Report |
| • | Oc - Comus Formation - Alternating sequence of limestone, shale, and dolomite. Distinctive tuffaceous shales and tabular intraformational conglomerate. In the Twin Creeks mine area, numerous mafic igneous sills and dikes exist within the sequence. Igneous rocks are not present in the Pinson portion of the Comus Formation. |
| • | Ch - Harmony Formation. Feldspathic sandstone with pebble conglomerate and interbedded shale. Light olive brown, red, reddish green in color. Paradise Valley cherts are separate but mapped with the Harmony Formation. |
| • | Cp - Preble Formation - Dominantly phyllitic shale. Light olive to brown. Upper part contains thin interbeds of limestone rhythmically bedded with shale. |
| • | Com - Osgood Mountain Quartzite. White, gray, light brown, purple brown to green gray, medium to thick-bedded quartzite. Contains Twin Creek Member. Impure quartzite, silty sandstone, phyllitic shale. |
The Property is located on the eastern flank of a large Cretaceous granodiorite stock that forms the southern core of the Osgood Mountains. Rocks adjacent to the eastern side of the stock have a general east dip and strike sub-parallel to the trend of the Osgood Mountains. The oldest units exposed against the granodiorite are Cambrian Preble phyllitic shales, interbedded limestones, and various hornfelsed sediments. Overlying the Preble is a thick package of Ordovician Comus sediments. The lowest portion of the Comus is composed of medium to massively bedded, micritic to silty limestone. The middle portion consists of interbedded limestone and shale layers with local interbedded debris flows. The Upper Comus is comprised of mildly to non-calcareous shales, with minor shaly limestone interbeds.
The depositional relationship between the Preble Formation and the overlying Comus Formation is not clearly understood. In the Getchell Property, the two formations are in fault contact; however, Kretschmer (1984) suggests they are conformable. McLachlan et al. (2000) state that at the Granite Creek Mine Project, the two formations are in fault contact with each other and subparallel to the Range Front Fault (RFF) that juxtaposes Comus Formation in the hanging wall against the Preble Formation in the footwall.
A Cretaceous aged (90 - 92 million years [Ma]) (Silberman, et al., 1974) granodiorite stock intrudes the Paleozoic section in the southern half of the Osgood Mountains. Emplacement of the stock resulted in the formation of an irregular contact metamorphic aureole, which extends as much as 10,000 feet (3,048 meters) from the intrusive contact. The metamorphic event resulted in the formation of maroon-colored, biotite-cordierite hornfels in the Upper Preble Formation and chiastolite hornfels in the Upper Comus Formation within much of the Property area (McLachlan, et al., 2000). In addition, carbonate rocks were metamorphosed to marble and calc-silicates (wollastonite, garnet, diopside, and vesuvianite). Several tungsten-bearing skarn deposits were also formed along the margins of the stock (Silberman, et al., 1974). Two tungsten skarns are on the Property.
Outcrop mapping and historic drilling has revealed the presence of extensive folding of the Paleozoic section in the Osgood Mountains. The most prominent of these folds is the Pinson Anticline. The fold is northeast-plunging and northwest-verging and extends for a distance of approximately three miles southwest from the Granite Creek Mine (McLachlan, et al., 2000). Numerous parasitic folds have also been noted along the limbs of the anticline. Where exposed, the Pinson Anticline is cored by the Cambrian Preble Formation and flanked on the northwest and southeast by sediments of the Ordovician Comus Formation.
| | 11/8/2021 |
Granite Creek Mine Project
Premier Gold Mines Limited/i-80 Gold Corp. | Page 55
PEA NI 43-101 Technical Report |
Mineralization on the Property exhibits strong structural control. A wide variety of mineralized structural orientations have been documented. The most important structural feature on the Property is the network of faults that border the escarpment marking the southern and eastern edge of the Osgood granodiorite (Sim, 2005). This fault system has been variably interpreted as a single master fault (RFF) (McLachlan, et al., 2000) that curves around the stock, or more likely, a network of shorter, straighter segments that collectively accommodate several thousand feet of displacement while making a 50° bend around the southeast corner of the stock (Sim, 2005). The fault system can be divided into three structural and stratigraphically mineralized zones, with each mineralized zone defined by one or more major structural elements. These are referred to as the Range Front, CX, and Mag Zones. Sedimentary rocks in the vicinity of this system generally dip steeply (easterly) away from the contacts of the granodiorite (Sim, 2005).
Figure 7-3 shows the structural and geology map of the Property with the mined-out pits shown for reference.
| | 11/8/2021 |
Granite Creek Mine Project
Premier Gold Mines Limited/i-80 Gold Corp. | Page 56
PEA NI 43-101 Technical Report |
Figure 7-3: Geology and Structural Map

Modified from Hotz and Willden 1964.
In addition to this large-scale fault system, there are numerous northwest and a few east-west structures that have been identified by past mapping and drilling (McLachlan, et al., 2000). In general, these appear to be mostly older than, and truncated by, the main system. Some of these faults have been re-activated and disrupt the continuity of the main Pinson system (Sim, 2005).
In 2016, OMC contracted Mr. Robert Leonardson to generate a comprehensive geological model for the Granite Creek Mine Project. This work included geological interpretation, structural review, and the identification of exploration targets on the Project. The following structural overview is summarized from his report (2016). To have a better view of the lithology units and structures together with topography, Dr. Samari of GRE modified the property geology and structural map on satellite images (Figure 7-4).
Structure at the Getchell Project is highly complex and involves varying stress environments hinged upon the inflection of the RFF around the Osgood Mountain complex. Principal stress north of the inflection point is compressional based on bedding relationships with faulting and transpressional south of the inflection due to strike-slip relationships of the many northeast striking CX-type faults (Leonardson, 2016). A principal thrust orientation of west-northwest - east-southeast (285°-105°) is recognized at the Property based on the dominant bedding attitudes of north-northeast (015°), and the steep easterly dips of the strata. Three main structural elements have been recognized: a frontal ramp striking north-south that is west-verging and extends north to the Getchell Mine along the range front; a northwest-verging oblique ramp extending to the southwest along a second orientation of the range front; and an inflection point where the two ramps intersect. These three elements determine the style and orientation of the subsequent development of two thrust fault suites.
| | 11/8/2021 |
Granite Creek Mine Project
Premier Gold Mines Limited/i-80 Gold Corp. | Page 57
PEA NI 43-101 Technical Report |
Figure 7-4: Geology and Structural Map of Pinson Property on Satellite Image
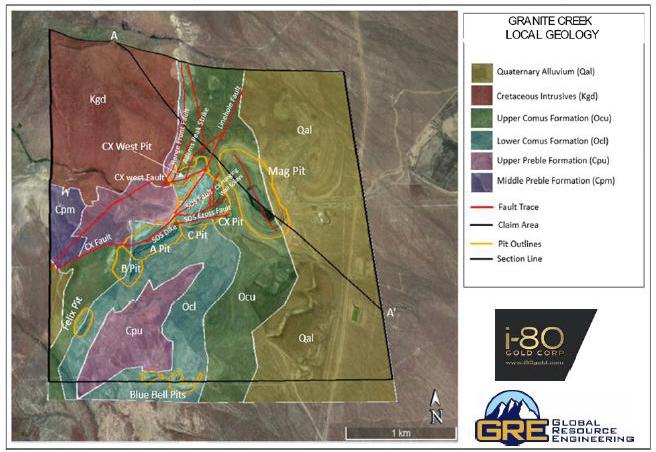
Source: Osgood, 2016 (Prepared on satellite images by GRE, 2021).
The first thrust suite is the west-verging range front on a frontal ramp that rises to the west over the Osgood stock and extends southward from the Getchell Mine area to the inflection point. This imbricated thrust stack sources off a north-south ramp and flat structure approximately 1,500 feet east of the Mag Pit east high wall. South of the inflection point, rocks along the southwest-oriented ramp produce a second thrust suite that dips southeast and strikes southwest. Leonardson (2016) terms this suite of thrusts CX type. A series of vertical east-northeast striking faults, centered on and extending north and south of the inflection point relieved stress between the two ramp structures, allowing the rocks on the south to move to the west-southwest, forming the second thrust suite.
South-dipping thrusts of the CX type include three, and potentially four, main faults named Adam Peak, CX, Disturbed, and South Mountain; the CX fault is the most significant. The source of these faults is to the east from the same north-south ramp structure that sources the RFF suite. A significant cross over thrust in this suite, the Delaney thrust, appears to connect with the Disturbed and South Mountain thrusts.
| | 11/8/2021 |
Granite Creek Mine Project
Premier Gold Mines Limited/i-80 Gold Corp. | Page 58
PEA NI 43-101 Technical Report |
The following subsections give details on significant structural features observed across the Property. Pit structural mapping by Chadwick (2002) collected orientation data and cross-cutting relationships.
The Range Front Zone (RFZ) is comprised of a series of northeast-trending subordinate faults that form a broad persistent zone of shearing and brecciation along the RFF that bounds the eastern margin of the Osgood Mountains. The RFZ involves the entire stratigraphic sequence at the Property, including the Cambrian Preble, Ordovician Comus, and Cretaceous granodiorite.
The RFF is a prominent 020° to 030° striking normal fault that defines the eastern front of the Osgood Mountains. For much of its length, the fault juxtaposes the Comus Formation in the hanging wall against the Preble Formation in the footwall (McLachlan, et al., 2000). The paucity of distinct marker units prevents determination of the amount of offset on the fault, but significant strike-slip displacement is suspected. The contact of the fault exhibits brittle and ductile deformation characteristics. The fault dips to the SE at 55° to 65°.
The CX-West Fault strikes 070° from the southern portion of the exposed granodiorite and has down-dropped stratigraphy significantly to the north. The CX-West, along with several other northeast-trending structures, may represent conjugate accommodation structures that link the main northerly trending faults along which major dip-slip faulting occurred (Leonardson, 2016). These structural intersections are key controls to mineralization and may often host high-grade material pods (McLachlan, et al., 2000).
| 7.4.2.4 | Ogee (Linehole) Fault |
The Ogee Fault is a steeply dipping, north-trending fault that cuts both the Upper and Lower Comus formations. It is also called the Linehole Fault. Drilling indicates that the Ogee Fault is intersected and cut by the CX-West Fault and is slightly offset to the east on the north side of the CX-West Fault (Leonardson, 2016). The intersection of these two structures is referred to as the Ogee zone and contains significant mineralization.
The Adams Peak Shear, as identified from underground workings, occurs primarily in the Upper and Lower Comus formations. The shear consists of multiple vertical structures originating from the RFF that form a brittle broken area of rock (Gustavson, 2012). The structure has not been identified south of the CX-West fault, and its north-easterly extent is unknown.
The CX Zone was discovered between 1982 and 1983 by PMC during a step-out drilling program along the northeast Projection of the A Zone (McLachlan, et al., 2000). The zone is comprised of the dominant CX Fault along with a series of subordinate northeast-trending faults and fault splays. The CX Fault was the primary mineralized structure developed by PMC in the CX open pit.
| | 11/8/2021 |
Granite Creek Mine Project
Premier Gold Mines Limited/i-80 Gold Corp. | Page 59
PEA NI 43-101 Technical Report |
The CX Fault is a complex zone of brittle fracturing that juxtaposes Upper Comus shales against limy beds of the Lower Comus. The fault strikes approximately 035° to 045° and dips 55° to 65° southeast Chadwick (2002), as shown in Figure 7-5. Relative movement on the fault is described as dip slip with the southeast side downthrown, although the amount of displacement is unknown. The fault was an important hydrothermal conduit that focused gold mineralization within the CX Pit.
Figure 7-5: Structure and Lithology of the CX, C, and portions of the A Pits
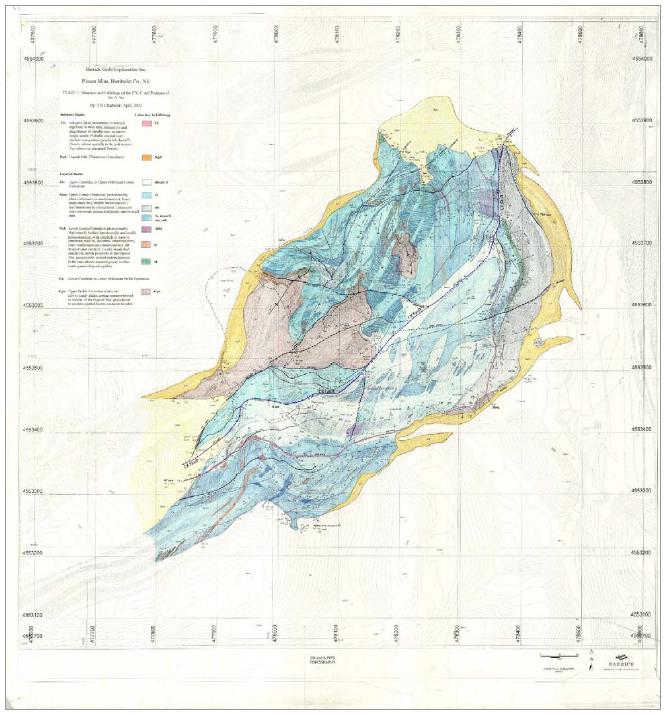
Source: Chadwick 2002
| | 11/8/2021 |
Granite Creek Mine Project
Premier Gold Mines Limited/i-80 Gold Corp. | Page 60
PEA NI 43-101 Technical Report |
The SOS Fault is a steeply south-southeast-dipping structure (McLachlan, et al., 2000). The fault has a strike length of 1,400 feet (427 meters), has an average thickness of 10 feet (3 meters), and intersects the CX fault down dip (Gustavson, 2012).
| 7.4.2.9 | CX Fault Hanging Wall Splays |
Two near-vertical, north-northeast-striking, east-southeast-dipping fault splays have been mapped in the CX Pit (Gustavson, 2012; McLachlan, et al., 2000). These faults are considered hanging wall splays of the CX Fault and extend southward to the SOS Fault. These faults hosted the majority of ore mineralized material mined from the CX Pit. Most of the mineralization contained within these structures appears to rake to the north-northeast and has been intersected in drilling to depths of 1,800 feet (549 meters) (McLachlan, et al., 2000).
The SOS Dike strikes approximately 070°, has a near vertical dip, and is interpreted to be Tertiary in age (Gustavson, 2012). The dike is exposed within the CX Pit and appears to follow a zone of structural weakness that parallels the SOS Fault.
The SOS Cross Fault is a narrow structure that extends from the footwall of the SOS Fault to the SOS Dike on the south (Gustavson, 2012). The fault is near vertical and strikes 020°.
The Mag Zone is defined by a suite of major northwest-striking, northeast-dipping faults termed the Mag Fault that forms a broad zone of alteration approximately 1,200 feet in width. The Mag fault suite is cut by moderate to low angle CX-hanging wall fault splays (Leonardson, 2016).
Underground mineralization associated with the CX and RFF typically strikes northeast to north-northeast, with moderate to subvertical dip and thickness varying between 5 feet and 30 feet. High-grade gold mineralized zones are moderately discontinuous and occur within near-vertical pipe-like bodies at fault intersections and along fault parallel structural corridors. Gold mineralization is characterized by pervasive sulfide that consists of two stages of pyrite development, an early non-ore pyrite stage and a gold-bearing arsenian pyrite stage (Ridgley, et al., 2005). Megascopically, the gold-bearing pyrite is typically dull brassy to black in color and very fine-grained. Pyrite may also be associated with remobilized carbon, imparting a “sooty” appearance to the pyrite. Gold is primarily contained in pyrite as microscopic inclusions or found in arsenian-pyrite rims around fine pyrite grains (Wallace, et al., 1983; Foster, 1994; Ridgley, et al., 2005). Gold mineralization can be found in multiple styles, including fine sulfide associated with quartz veining and brecciation. Foster and Kretschmer (1991) suggest, based on detailed geochemical analyses, that there is a positive Au-mercury (Hg) correlation as well as a negative Au-barium (Ba) association.
Gold mineralization at the Property is primarily hosted by the Upper and Lower Comus Formations, which consist of interbedded shale, siltstone, and limestone. The Upper Comus is the primary host lithology in the Mag Zone and currently is host to the majority of surface resources at the Pinson deposit (Gustavson, 2012). The Upper Comus is also locally mineralized within the A, B, C, CX, CX-West, and portions of the RFZ. The Lower Comus hosts the majority of the higher-grade underground resources.
| | 11/8/2021 |
Granite Creek Mine Project
Premier Gold Mines Limited/i-80 Gold Corp. | Page 61
PEA NI 43-101 Technical Report |
The Preble rocks are a poor host for gold mineralization but do contain localized gold concentrations where they have been brecciated and are adjacent to major hydrothermal conduits.
Figure 7-6 is a representative cross-section through the Property. The section shows features of stratigraphy and structure that are factors in the localization of gold mineralization. Prominent features include high-angle fault zones and the primary host lithology (Upper and Lower Comus Formation).
Figure 7-6: Cross-section A-A’ looking Northeast
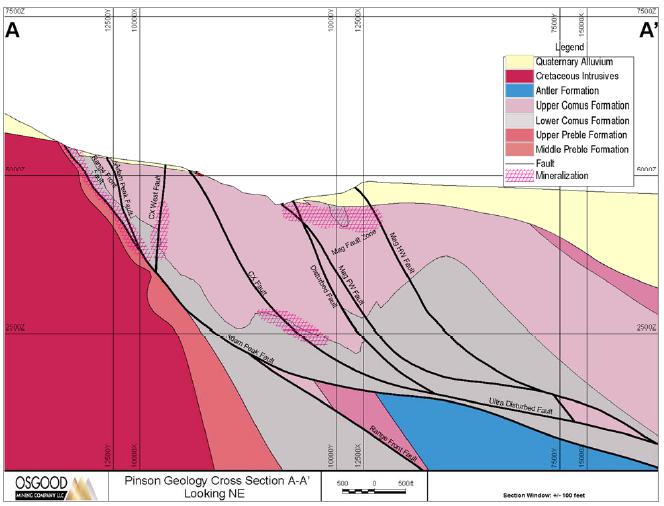
Oxide mineralization includes pervasive limonite and hematite, along with other iron and arsenic oxides. Oxidation is extensive in the CX Fault system, occurring along the entire length of the zone and penetrating to a depth of 1,500 feet (457 meters). Within the RFF system, oxidation is more variable than within the CX Fault system. In some fault and shear zones, oxidation may be present to depths of 1,800 feet (549 meters), whereas in others it may only reach to depths of < 500 feet (152 meters) (Ridgley, et al., 2005).
| | 11/8/2021 |
Granite Creek Mine Project
Premier Gold Mines Limited/i-80 Gold Corp. | Page 62
PEA NI 43-101 Technical Report |
| 7.5.1 | Mag Pit Mineralization |
Gold mineralization within the Mag Pit is hosted by interbedded carbonate and shale of the Upper Comus Formation. The mineralized zone has a north-northwest orientation, sub-parallel to the Mag Fault, dips to the east-northeast and plunges to the south-southeast (McLachlan, et al., 2000). The mineralized body is tabular, has a strike length of approximately 2,500 feet (762 meters), varies from 200 to 400 feet (61 to 122 meters) in width, and ranges in depth from 250 to 300 feet (76 to 91 meters) (Kretschmer, 1985; Foster, et al., 1991). Higher grade zones are localized along high-angle northwest or northeast-trending faults (Foster, et al., 1991; McLachlan, et al., 2000). Mineralization within the Mag deposit is more disseminated and lower grade than the Range Front, CX, and Ogee zones (Gustavson, 2012).
Gold mineralization is spatially associated with decarbonatization, kaolinization, white kaolinite fracture-filling, silicification, and quartz veinlets (McLachlan, et al., 2000). Foster and Kretschmer (1991) report that with the exception of massive limestones, the original carbonate content of the host lithologies was removed during decarbonatization, leaving a porous silty textured rock.
| 7.5.2 | Underground Mineralized Zones |
Two areas of high-grade gold mineralization at the Pinson deposit are amenable to underground mining methods, as shown by previous operators. These include the Range Front-Ogee Zone and the CX Zone. The Range Front-Ogee Zone is located along and adjacent to the range-bounding fault zone, and the CX Zone is within the CX open pit that was mined historically.
| 7.5.2.1 | Range Front-Ogee Zone |
RFZ mineralization consists of discontinuous occurrences of pervasive argillization and decarbonatization within host rock lithologies. Silicification is minor, with carbonate alteration (calcite) occurring along the borders of fault zones. Karst and dissolution breccias that occur along bedding and structural intersections within the Lower Comus Formation are particularly receptive to mineralization. The Ogee Zone, which is a near vertical, pipe-like mineralization shoot, occurs at the intersection of the CX-west and Ogee faults. The upper Ogee Zone is characterized by strong iron oxide staining, whereas the lower portion of the zone, which is hosted by Lower Comus Formation, consists of decarbonatized limestone-siltstone dissolution breccia (Gustavson, 2012). Below the 4,650-foot (1,417-meter) elevation within the Ogee Zone, sulfide mineralization becomes prevalent. The zone has a strike length of approximately 350 feet (107 meters), a vertical extent of 600 feet (183 meters), and averages 30 feet (9 meters) in width.
The RFF bounds the eastern front of the Osgood Mountains. Mineralization hosted within the RFF has a strike length of 4,000 feet, a down dip extent of 3,000 feet (914 meters), and averages 100 feet (30.5 meters) in thickness (Gustavson, 2012). Higher grade gold mineralization within the zone is discontinuous, with strike lengths between 40 and 200 feet (12 and 61 meters) and thicknesses varying from 10 to over 60 feet (3 to 18 meters).
| 7.5.2.3 | CX-West Fault Zone |
Gold mineralization along the CX-West fault Zone strikes approximately northeast, dips steeply to the north-northwest and has a strike length of approximately 3,000 feet (914 meters) (Gustavson, 2012; McLachlan, et al., 2000). The mineralized zone averaged approximately 100 feet (30.5 meters) in width (Gustavson, 2012) and occurred primarily along the fault contact between the Upper and Lower Comus formations (McLachlan, et al., 2000).
| | 11/8/2021 |
Granite Creek Mine Project
Premier Gold Mines Limited/i-80 Gold Corp. | Page 63
PEA NI 43-101 Technical Report |
| 7.5.2.4 | Ogee (Linehole) Fault |
The Linehole Fault zone consists of two fault strands, the Linehole North Fault and the Linehole Fault (Gustavson, 2012). The Linehole North Fault is the extension of the Linehole Fault north of the intersection with the CX-West Fault, and the Linehole Fault the extension to the south of the intersection with the CX-West Fault (Gustavson, 2012; McLachlan, et al., 2000). The Linehole mineralization strikes to the northeast, has a strike length of approximately 4,500 feet (1,372 meters) and a downdip extent of 1,800 feet (549 meters) (McLachlan, et al., 2000). Mineralization averages approximately 15 feet (4.6 meters) in width.
The Adams Peak Shear is a broad structural zone that strikes to the northeast and dips to the northwest (McLachlan, et al., 2000). Mineralization within the shear is highly variable, consisting of multiple strands within the structural zone. The mineralization has a strike length of approximately 1,500 feet (457 meters) and continues down dip to the intersection with the RFF (Gustavson, 2012). The average width of mineralization is approximately 125 feet (38 meters).
The Otto Stope Fault is located between the CX-West and Linehole faults. The mineralization has a strike length of approximately 2,000 feet and an average thickness of 10 feet (3 meters) (Gustavson, 2012).
The CX Zone mineralization can be described as a series of discontinuous occurrences of pervasive argillization and decarbonatization within karst and dissolution breccias along bedding and structural intersections within the Lower Comus Formation (Gustavson, 2012). Silicification is minor, and carbonate alteration (calcite) is common along fault zones. Dissolution breccias formed in the CX Zone are structurally controlled and reflect the geometry of the individual faults. The description of the individual structures that occur within the CX Zone are summarized from Gustavson Associates (2012).
The CX Fault is a zone of continuous mineralization with a strike length of approximately 4,500 feet (1,372 meters) and a width ranging between 10 and 100 feet (3 and 30 meters). Mineralization has a down-dip extent of 1,300 feet (396 meters) as defined by exploration drilling.
The following faults either cut or control the orientation of the mineralization in the CX Zone.
The SOS Fault has an average width of 10 feet and a strike length of 1,400 feet (427 meters) and extends down-dip to its intersection with the CX Fault.
| | 11/8/2021 |
Granite Creek Mine Project
Premier Gold Mines Limited/i-80 Gold Corp. | Page 64
PEA NI 43-101 Technical Report |
| 7.5.3.3 | CX Fault Hanging Wall Splays |
The CX Fault hanging wall splays extend between the CX and SOS faults for approximately 500 feet and have an average thickness of 15 feet (4.6 meters). They extend down-dip to their intersection with the CX Fault.
| 7.5.3.4 | CX Fault Footwall Splay |
The CX Fault footwall splay has a strike length of approximately 500 feet (152 meters), averages 20 feet (6 meters) in width and extends down-dip for 750 feet (229 meters).
The SOS dike has an average thickness of 15 feet (4.6 meters), a strike length of approximately 2,700 feet (823 meters) and extends down-dip to its intersection with the CX Fault.
The SOS Cross Fault strikes between the SOS Fault and the SOS Dike for approximately 700 feet (213 meters), extends down dip to its intersection with the CX Fault, and has an average width of 5 feet (1.5 meters).
Alteration assemblages observed at the Pinson deposit include silicification, decarbonatization, pyrite, and remobilization of carbon. Alteration mapping by Chadwick outlined the distribution of these assemblages within the pits.
In the CX Zone, which follows the strike of the CX Fault and includes the A, B, C, CX, and CX-West pits, McLachlan et al. (2000) documented gradational changes in the style and intensity of observed alteration. In the southwest, within the B Pit, gold mineralization occurs in strongly fractured shale and silty carbonate that has been weakly silicified and clay altered. In the nearby A Pit, alteration consists of intense silicification of carbonate lithologies and formation of gold-rich jasperoid along structures. Gold grains within the jasperoid are typically <5 microns in size and are found as inclusions in arsenian pyrite (McLachlan, et al., 2000). Within the C Pit, located northeast of the A Pit, high-grade material is hosted in decarbonatized carbonates that have been crosscut by small faults.
Within the CX Pit, mineralization consisted of silica and pyrite replacing carbonate along narrow structures, resulting in the formation of intermittent jasperoid and locally silicified wallrock. A large volume of the adjacent hanging wall carbonate-bearing siltstone is decarbonatized, but barren. Within the CX-West Pit, mineralization is hosted in strongly calc-silicate carbonates, which exhibit strong argillic alteration.
Mineralization in the Mag Pit is associated with decarbonatization, kaolinization, white kaolinite fracture-filling, silicification and quartz veining (McLachlan, et al., 2000). Except for some massive limestone units, the original carbonate content of the calcareous host lithologies was removed during decarbonatization, resulting in a porous silty textured rock. Silicification occurs as replacement of the decalcified lithologies and healing fault gouge and breccia. Quartz veining and drusy open space coatings are common throughout the deposit. White kaolinite is commonly formed along fractures within the central portion of the deposit, and elsewhere occurs as an argillic replacement of the host lithologies (McLachlan, et al., 2000). Lithology and alteration relationships can be observed in Chadwick’s 2002 pit maps. Chadwick’s alteration map of the Mag Pit is shown in Figure 7-7.
| | 11/8/2021 |
Granite Creek Mine Project
Premier Gold Mines Limited/i-80 Gold Corp. | Page 65
PEA NI 43-101 Technical Report |
The RFF Zone displays pervasive argillization and decarbonatization of host lithologies along with the formation of dissolution collapse breccias and intense shearing. Where the alteration is strongest, the altered zones consist of punky, spongy decarbonatized limestone in an argillically altered fine-grained, carbon-rich matrix (Gustavson, 2012). Silicification is minor and occurs as a broad overprint on the zone. Calcite veining is also prevalent along the margins of the RFF.
| | 11/8/2021 |
Granite Creek Mine Project
Premier Gold Mines Limited/i-80 Gold Corp. | Page 66
PEA NI 43-101 Technical Report |
Figure 7-7: Alteration of the Mag Pit
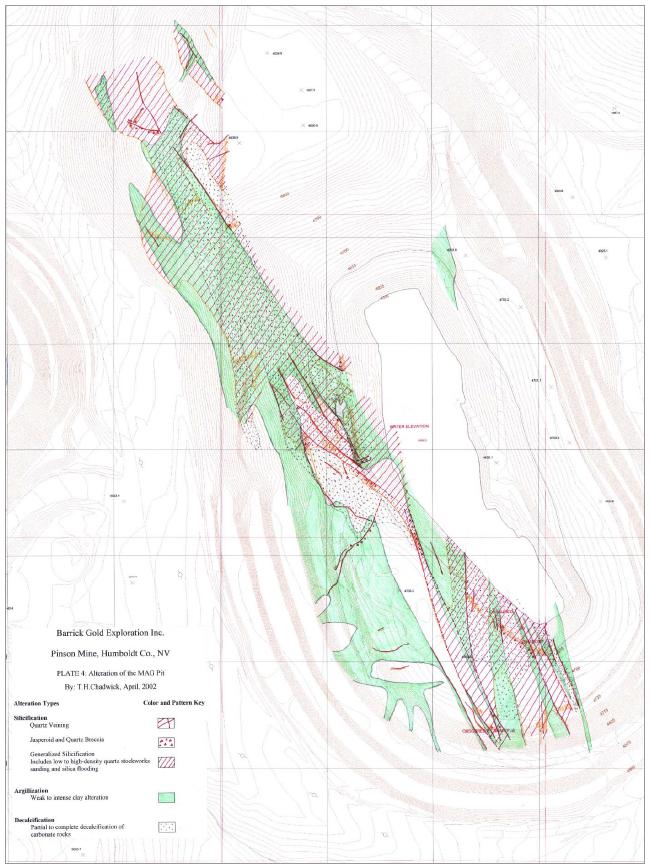
Source: Chadwick 2002
| | 11/8/2021 |
Granite Creek Mine Project
Premier Gold Mines Limited/i-80 Gold Corp. | Page 67
PEA NI 43-101 Technical Report |
The structural setting, alteration mineralogy, and mineralization characteristics of the Pinson deposit are consistent with Carlin-type deposits as defined in Radtke (1985) and Hofstra and Cline (2000).
Carlin-type deposits formed in the mid-Tertiary after the onset of extension in an east-west-trending, subduction-related magmatic belt. The deposits are located along long-lived, deep crustal structures inherited from Late Proterozoic rifting and the formation of a passive margin within Paleozoic carbonate sequences composed of silty limestone to calcareous siltstone. The carbonate sequences are overlain by either structurally controlled siliciclastic sequences controlled by the Early Mississippian-aged Roberts Mountain allochthon or by stratigraphically-controlled siliciclastic sequences. The siliciclastic rocks are less permeable than the underlying carbonate rocks, which traps fluids along major structures, causing them to flow laterally into the permeable and reactive carbonate sequences.
Alteration of host carbonate sequences consists of decarbonatization, argillization, and selective silicification, forming jasperoid and causing carbon flooding. Gangue minerals in Carlin-type deposits consist of calcite, siderite, and ferroan dolomites that can occur as geochemical fronts beyond the mineralized zones.
Gold deposition occurs in arsenian pyrite, is hosted within carbonaceous sequences near major high-angle structural zones, and is concentrated in structural traps and/or replacement horizons of reactive and permeable sedimentary beds.
The Carlin-type deposits typically show enrichment in antimony, arsenic, mercury, thallium, and barium, caused by hydrothermal fluids with temperatures up to 300°C. The source of fluids is likely deep-seated magmas that released gold bearing fluids at depths of 10 to 12 km. These magmas formed during Eocene slab-rollback of the Farallon plate as upwelling asthenosphere impinged on a strongly metasomatized sub-continental lithospheric mantle (Muntean, et al., 2011). Tertiary dikes associated with mineralization and radiometric age dates between 39 to 42 Ma along with isotopic data provide evidence toward the above hypothesis.
Structural pathways, reactive rocks, and sources of heat, gold, sulfur, and iron are required for Carlin-type deposits to form. Large regional structures transecting reactive rocks create contacts, faults, and shears. These secondary structures create pathways and traps for hydrothermal and metalliferous fluids.
| | 11/8/2021 |
Granite Creek Mine Project
Premier Gold Mines Limited/i-80 Gold Corp. | Page 68
PEA NI 43-101 Technical Report |
No exploration work has been conducted by i-80. This section discusses exploration undertaken by previous owners.
Exploration techniques employed on the Property to define additional gold resources have consisted primarily of mapping, geochemical sampling, and drilling. Use of these methods has resulted in the discovery of approximately one million ounces of gold in several open pit deposits. Several geophysical techniques have also been used to aid in the delineation of gold resources, albeit with limited success. The geophysical programs have mostly been applied to exploration programs along strike of known mineralization and as grass-roots applications to locate additional mineralized zones.
Atna became involved in Project planning in July 2004 and began drilling the Property in August 2004 after execution of the earn-in agreement with PMC on 12 August 2004. Atna continued work through April 2006. Atna vested a 70% interest by completing $12M in exploration and development expenditures and completing an NI 43-101 Technical Report of the Project’s resources (Atna Resources Ltd., 2007).
| 9.2 | Geologic Mapping and Geochemical Sampling |
Cordex, and its successor, PMC, explored the Property through geologic mapping and geochemical sampling. There are three known mapping programs:
| • | A regional mapping program from the Preble to the Getchell mines conducted in the late 1970s |
| • | A 1:6000-scale mapping program of the Property in 1983 |
| • | A 1:2400-scale mapping program of the Pinson pit area through the active life of the mine |
Bench mapping in the pits occurred during mining and was followed up by detailed 1:1200-scale mapping of the A, B, C, CX, MAG, CXW, and Blue Bell pits by Tom Chadwick starting in 2000, after mining ceased. These maps were completed under the Homestake/Barrick partnership agreement.
Several geochemical programs were also completed by Cordex and PMC during the active mine life of the Granite Creek Mine, and by Homestake. These included programs:
| • | Cordex took rock chip samples in conjunction with mapping programs. A total of 737 rock chip samples were collected. Samples were assayed for gold, silver, arsenic, antimony, and mercury. Select samples were also analyzed for lead, zinc, copper, and manganese. The combined mapping/sampling programs were responsible for the discoveries of the Blue Bell and Felix Canyon deposits (Sim, 2005). |
| • | PMC completed six float chip geochemical grids consisting of 8,756 samples. These grids covered the MAG deposit and along strike south of the A and B Pits. |
| • | A biogeochemical sagebrush sampling program was conducted in the 1990s with inconclusive results. |
| | 11/8/2021 |
Granite Creek Mine Project
Premier Gold Mines Limited/i-80 Gold Corp. | Page 69
PEA NI 43-101 Technical Report |
| • | Under the Homestake/Barrick JV, an additional 312 rock samples and 273 soil samples were collected. These programs were completed on strike south of the existing pit areas and west of the A, B, C, and CX Pits. |
| 9.2.1 | Osgood Mining Geologic/Structural Mapping |
In 2016, OMC contracted Mr. Robert Leonardson to complete a geological study on the Property that focused on advancing OMC’s understanding of the structural framework and on providing guidance on exploration targeting. This work included structural and geologic mapping of the open pits and underground exposures, construction of Property-wide cross-sections, and report writing that included the identification of exploration targets on the Project.
Mr. Leonardson concluded that potential targets to discover additional gold mineralization are at intersections of the east-dipping north-south faults (Range Front/Mag) with the southeast-dipping CX-type faults. Other areas include the intersection of the sub-vertical northwest-striking faults with the CX-type faults. Examples of the first type are the CX hanging wall splays where they intersect the Mag Fault in the north half of the Mag Pit. The second example is exemplified by the intersection of the Bluebird Fault Zone with the Delaney thrust in the Blue Bell East pit and the intersection of the Bluebell 2 Fault with the CX thrust in the CX B Pit. Zones of limestone decarbonization such as seen in the CX Pit are also potential hosts for gold mineralization. These zones indicate strong fluid/vapor flow through the rock mass. Specific areas for exploration include:
| • | The intersection of the SOS and JP dikes on the south wall of the CX Pit. This area contains the largest block of decarbonization on the Property, and the hydrothermal alteration may represent an “exhaust plume” emanating from depth. |
| • | The Ogee pipe extension located between 1,500 feet and 1,800 feet below the CX-C Pit. A historical hole, HPC-070A intersected a 760-foot interval of low to moderate gold grades above 3,160 feet and high-grade mineralization from 3,160 feet to 3,130 feet near, and just south of, the proposed Ogee high-grade down-dip extension. |
| • | The northern continuation of the fault-propagated anticline in the western portion of the Mag Pit between the Mag Fault and CX Fault and to the north of the Mag Pit. The anticline steepens to the south, and the best chance to intersect high-grade mineralization would be at the intersection with the Disturbed Fault. |
| • | The intersection of the Adam Peak Fault and the Mag Fault suite north of the Mag Pit. |
| • | The CX-B Pit decarbonatization zone at the intersection of the CX and Bluebell 2 faults on the west limb of the Pinson anticline. |
| • | The Mag Pit decarbonatization on the west wall along a section of the Mag Fault intersection with the CX and HW faults and the Disturbed Fault. |
| • | The Mag Pit decarbonatization on the west wall along a portion of the Mag Fault intersections with the Disturbed Fault. |
| • | Bluebell east pit decarbonatization at the intersection of the Bluebell and Delaney faults. |
| • | Traps and fault intersections along the north-northwest-trending Mag Fault suite and the northeast-trending CX type faults. |
| | 11/8/2021 |
Granite Creek Mine Project
Premier Gold Mines Limited/i-80 Gold Corp. | Page 70
PEA NI 43-101 Technical Report |
| • | Flat to ramp traps down dip extension of fluids that mineralized the Bluebell, CX(?) between South Mountain Fault, and the southern Mag suite of faults. Flat to ramp traps along the Adam Peak detachment and subsequent faults (CX, Disturbed, and South Mountain). |
Numerous geophysical surveys have been conducted on the Property. These include both regional and detailed surveys. The regional surveys included gravity and aeromagnetics. Detailed surveys involved mostly electromagnetic techniques and included Induced Polarization (IP), Electromagnetics (EM), Magneto Tellurics (MT), and Controlled Source Audio-frequency Magneto Tellurics (CSAMT) surveys. A summary of these techniques includes:
| • | Airborne EM and magnetics by the U.S. Geological Survey (USGS) at quarter-mile line spacing throughout much of the Getchell Trend |
| • | Ground-based magnetics over the CX Zone completed in 1970 by Cordex |
| • | Regional gravity surveys, both public and private, compiled by Homestake in 1997 |
| • | Ground-based magnetic survey at the north edge of the Mag Pit completed in 1998 by Homestake |
| • | Several generations of AMT (EM, IP, CSAMT) completed by PMC |
| • | Several CSAMT lines completed by Homestake between 1998 and 2000 |
| • | Several EM lines completed by Homestake in 2000 |
| • | A detailed gravity survey over the Property conducted by Magee Geophysical Services, LLC of Reno, Nevada in October 2006 (Magee Geophysical Services, 2006), during which a total of 2,587 gravity readings were acquired using a 100-meter (328-foot) station spacing covering approximately 27 square km (10 square miles) (Figure 9-1). The results were interpreted by Fritz Geophysics in 2007 (Fritz Geophysics, 2007). The existence of about 1,700 drill holes within the gravity survey area allowed a novel approach to be attempted for the detailed gravity data. Typically, gravity surveys are conducted to attempt to determine the thickness of alluvial cover over bedrock, as well as structures, etc., for possible targets of interest. The final gravity response on the bedrock surface is shown in Figure 9-2, overlain on the topography, with interpreted structures, bedrock rock types and drill hole collar locations. Also included are plots of the original surface gravity field measurements and the thickness of alluvium from drill data. The basement rock types defined by the basement gravity response correlate with the general mapped geology. To the north-west the high density is related to the large intrusive, TKg. This intrusive is magnetic as well. To the south-west is a lower density unit that correlates with a mapped Oc, probably Valmey. Through the center of the survey area there is an even lower density unit that trends reasonably north south and is defined by northerly, northwesterly, and northeasterly structures. Further to the east, there is another higher density unit, possibly Valmey again. This unit is at an alluvial thickness of greater than 1,500 feet (457 meters) and is not as well defined as the other units. As the thickness of alluvium increases, the resolution of the surface gravity data decreases. Finally, at the southeast edge of the survey, there is a large basin fault that appears to drop the bedrock to depths greater than 3,000 feet (914 meters). |
| | 11/8/2021 |
Granite Creek Mine Project
Premier Gold Mines Limited/i-80 Gold Corp. | Page 71
PEA NI 43-101 Technical Report |
Figure 9-1: Gravity Survey, 2,587 Stations, Magee Geophysical Services, 2006
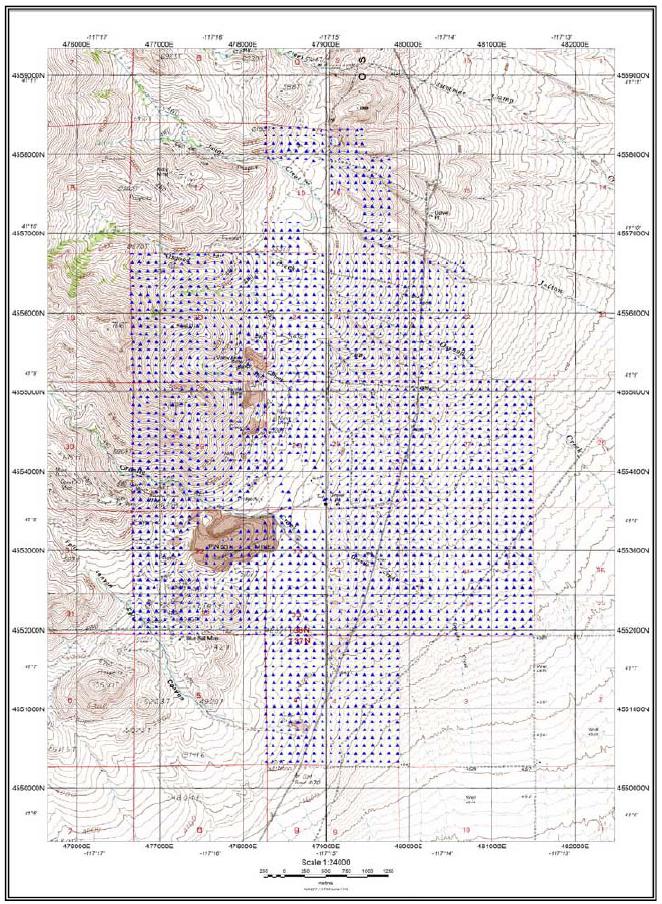
| | 11/8/2021 |
Granite Creek Mine Project
Premier Gold Mines Limited/i-80 Gold Corp. | Page 72
PEA NI 43-101 Technical Report |
Figure 9-2: Pinson Local Gravity Interpretation
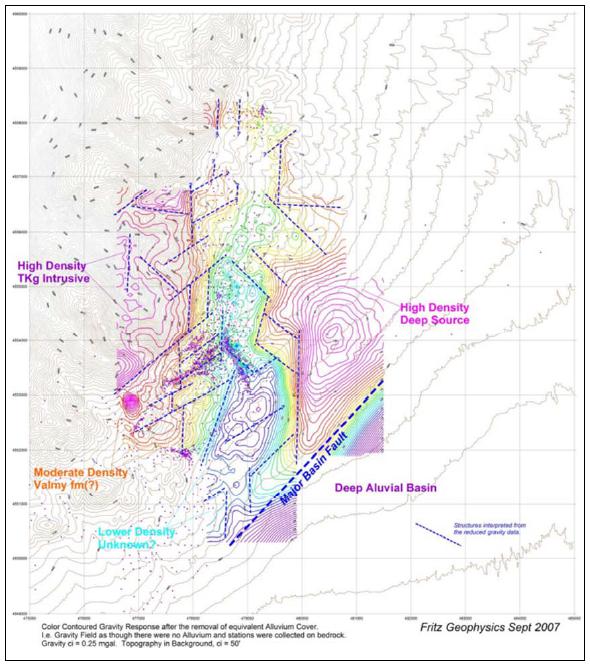
| • | In 2008, Barrick interpreted the geophysical survey data at Pinson (Barrick, 2008). For that work, the 2002 MT survey and 2006 gravity survey and all available geological/geochemical information were combined, and a couple of target areas defined requiring a drillhole test. In 2002, Quantec Geoscience were contracted to acquire TITAN 24 MT data over the Pinson property. Six east-west lines were collected along the Rangefront, spaced on average around 2,000 feet (610 meters) apart. The dipole spacing along line was 300 feet (91 meters). Quantec ran regular 2 dimensional (2D) inversions on the MT data to create resistivity depth sections which have been deemed sufficient for this targeting exercise. |
| | 11/8/2021 |
Granite Creek Mine Project
Premier Gold Mines Limited/i-80 Gold Corp. | Page 73
PEA NI 43-101 Technical Report |
The location of the MT survey lines has been plotted on the geology and pit locations and on the residual gravity with Bourne’s structural interpretation and targets annotated (Figure 9-3). Figure 9-4 to Figure 9-9 show MT resistivity depth inversions for each of the survey lines, with all drilling, surface geological mapping Chadwick’s interpreted sectional geology, and Bourne’s structural targets annotated (Barrick, 2008).
| | 11/8/2021 |
Granite Creek Mine Project
Premier Gold Mines Limited/i-80 Gold Corp. | Page 74
PEA NI 43-101 Technical Report |
Figure 9-3: Location of the MT Survey Lines on the Geology and Pit locations (Left) and on the Residual Gravity (Right)
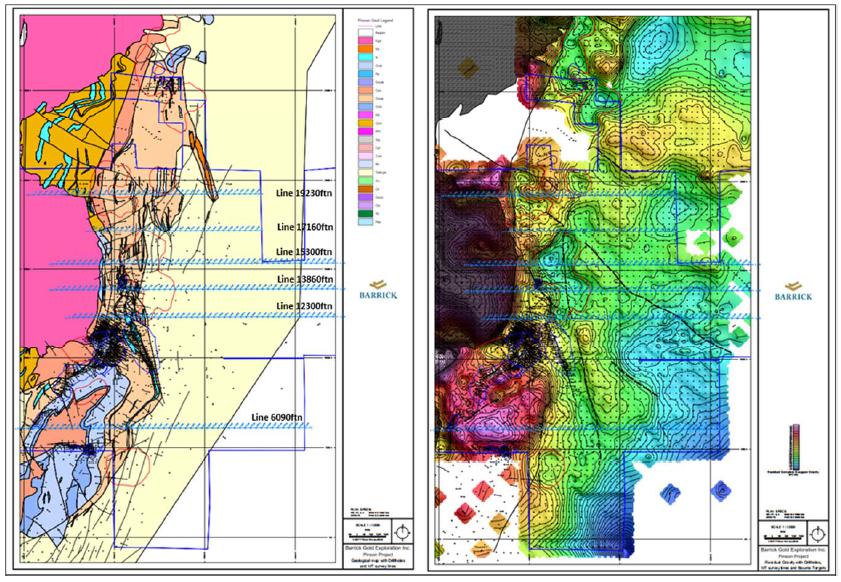
| | 11/8/2021 |
Granite Creek Mine Project
Premier Gold Mines Limited/i-80 Gold Corp. | Page 75
PEA NI 43-101 Technical Report |
Figure 9-4: MT Resistivity Depth Inversion for Line 6090

| | 11/8/2021 |
Granite Creek Mine Project
Premier Gold Mines Limited/i-80 Gold Corp. | Page 76
PEA NI 43-101 Technical Report |
Figure 9-5: MT Resistivity Depth Inversion for Line 12300
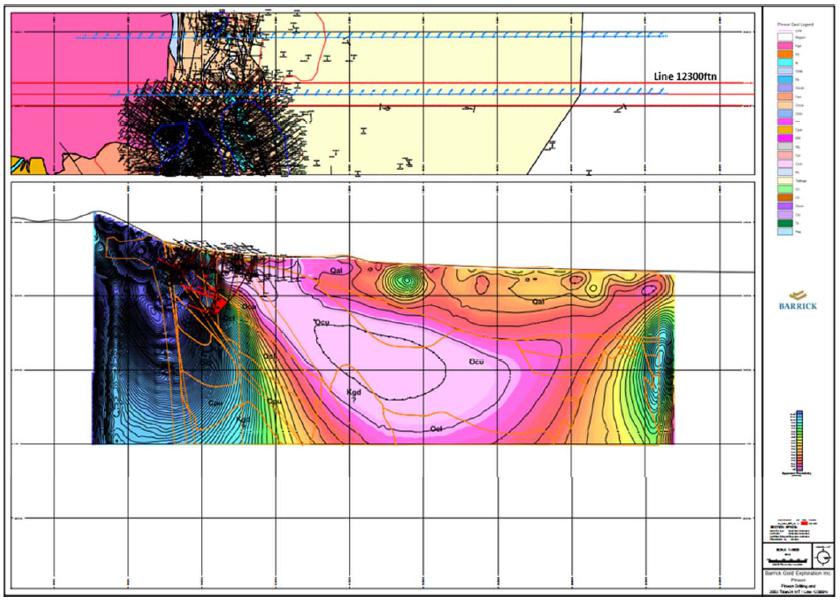
| | 11/8/2021 |
Granite Creek Mine Project
Premier Gold Mines Limited/i-80 Gold Corp. | Page 77
PEA NI 43-101 Technical Report |
Figure 9-6: MT Resistivity Depth Inversion for Line 13860
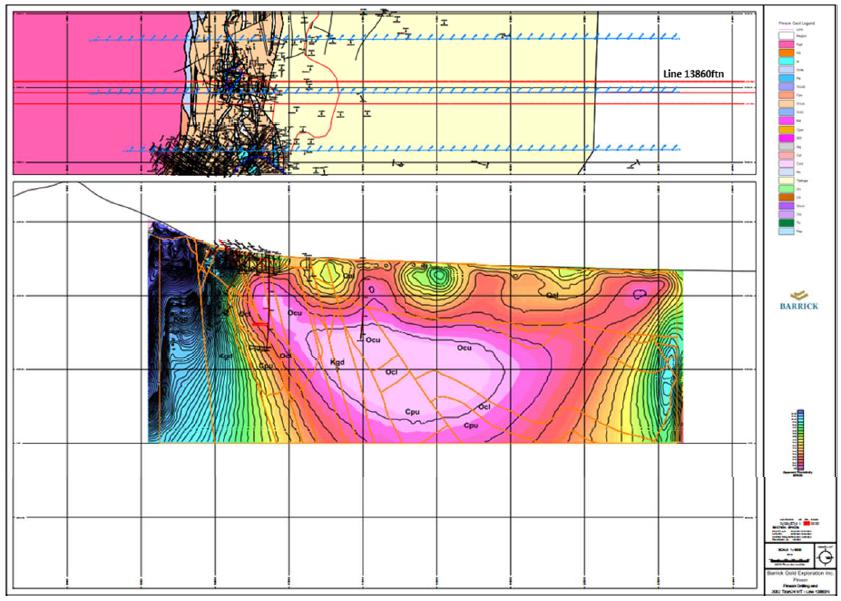
| | 11/8/2021 |
Granite Creek Mine Project
Premier Gold Mines Limited/i-80 Gold Corp. | Page 78
PEA NI 43-101 Technical Report |
Figure 9-7: MT Resistivity Depth Inversion for Line 15300
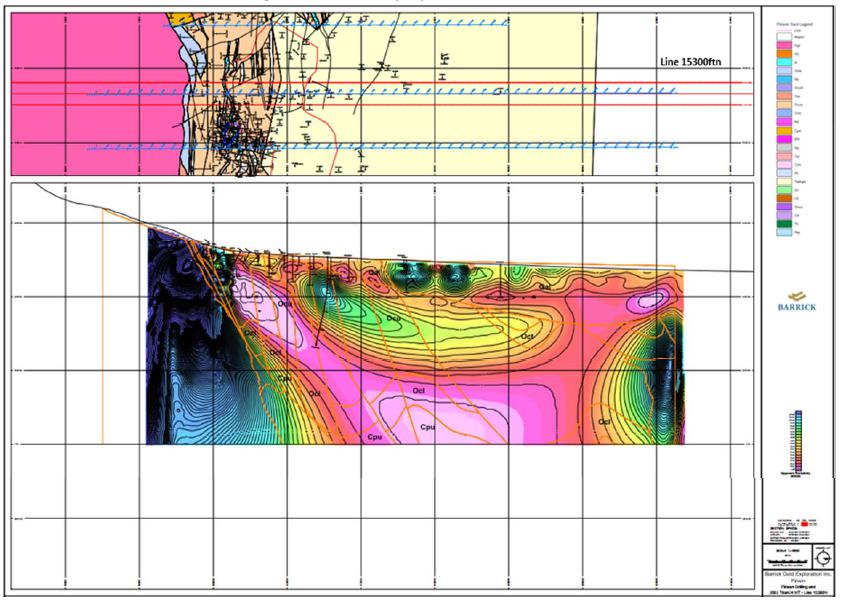
| | 11/8/2021 |
Granite Creek Mine Project
Premier Gold Mines Limited/i-80 Gold Corp. | Page 79
PEA NI 43-101 Technical Report |
Figure 9-8: MT Resistivity Depth Inversion for Line 17160

| | 11/8/2021 |
Granite Creek Mine Project
Premier Gold Mines Limited/i-80 Gold Corp. | Page 80
PEA NI 43-101 Technical Report |
Figure 9-9: MT Resistivity Depth Inversion for Line 19230
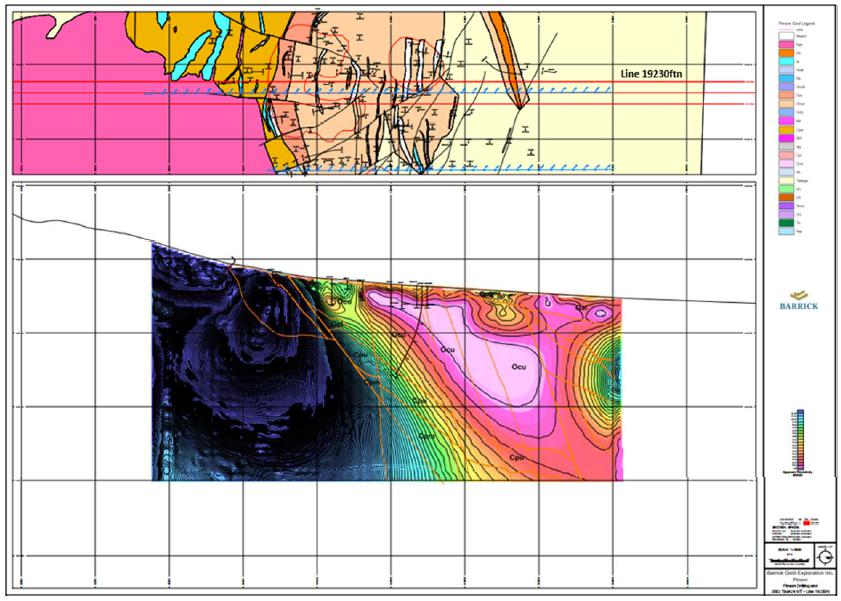
| | 11/8/2021 |
Granite Creek Mine Project
Premier Gold Mines Limited/i-80 Gold Corp. | Page 81
PEA NI 43-101 Technical Report |
| 9.4 | Underground Drifting/Evaluation |
A small exploration drifting program was conducted on the upper “B” zone by Cordex in the 1970s to conduct bulk testing. Results from this program are unavailable.
In May of 2005, Small Mine Development (SMD) of Boise, Idaho, was contracted by Atna to drive exploration drifts, crosscuts, and develop drill stations to complete Atna’s evaluation of the Range Front resource area. Both the Range Front and CX resource areas were of interest in Atna’s program.
The underground development work completed 1,988 feet (606 meters) of 14-foot (4.3-meter) by 16-foot (4.9 meter) adit, 378 feet (115 meters) of decline, and six diamond drill stations (Gustavson, 2012). A small mineability test was also carried out on the newly defined Ogee Zone to evaluate the potential conditions for future stoping. Approximately 400 short tons (363 tonnes) of material were extracted during this test. The results indicated the possibility of drift and fill as a potential mining method.
During 2008, approximately 693 feet (211 meters) of development drifting was completed, and significant geological data was recorded in the RFZ. However, no data on ground conditions was acquired. This data was not collected because it was anticipated that ground conditions would be similar to those encountered at the Getchell Mine, and mineralization would be exploitable by underhand drift and fill stoping methods (Gustavson, 2012).
| 9.5 | Trenching and Sampling |
Atna channel sampled 14 ribs in the Ogee Zone and sent 74 rib and face samples out for assay (Edmondo, et al., 2007). Salient results are summarized in Table 9-1. Assays from the samples indicated that no high-grade mineralization was encountered except where the main drift intersected the Ogee Zone on the 4770 elevation.
Table 9-1: Salient Results of the Ogee Zone Channel Sample Assays
| Sample No. | From feet (meters) | To feet (meters) | Length feet (meters) | Gold Grade opt (g/t) |
| North Rib |
| RFUG-055 | 76 (23.1) | 81 (24.7) | 5 (1.5) | 0.144 (4.94) |
| RFUG-056 | 81 (24.7) | 85 (25.9) | 4 (1.2) | 0.445 (15.26) |
| RFUG-059 | 85 (25.9) | 88 (26.8 ( | 3 (0.9) | 0.274 (9.39) |
| RFUG-061 | 88 (26.8) | 93 (28.3) | 5 (1.5) | 1.448 (49.65) |
| RFUG-063 | 93 (28.3) | 97 (29.6) | 4 (1.2) | 0.176 (6.03) |
| RFUG-064 | 97 (29.6) | 101 (30.8) | 4 (1.2) | 0.739 (25.34 |
| RFUG-067 | 101 (30.8) | 110 (33.5) | 9 (2.7) | 0.996 (34.15) |
| Weighted Average | | | 34 (10.4) | 0.682 (23.38) |
| South Rib |
| RFUG-081 | 77 (23.5) | 80 (24.4 | 3 (0.9) | 0.106 (3.63) |
| RFUG-082 | 80 (24.4) | 83 (25.3) | 3 (0.9) | 0.065 (2.23) |
| RFUG-083 | 83 (25.3) | 93 (28.3) | 10 (3) | 1.082 (37.10) |
| RFUG-084 | 93 (28.3) | 96 (29.3) | 3 (0.9) | 0.894 (30.65) |
| RFUG-086 | 96 (29.3) | 99 (30.2) | 3 (0.9) | 0.355 (12.17) |
| RFUG-087 | 99 (30.2) | 107 (32.6) | 8 (2.4) | 0.028 (0.96) |
| RFUG-088 | 107 (32.6) | 112 (34.1) | 5 (1.5) | 0.228 (7.82) |
| | 11/8/2021 |
Granite Creek Mine Project
Premier Gold Mines Limited/i-80 Gold Corp. | Page 82
PEA NI 43-101 Technical Report |
| Sample No. | From feet (meters) | To feet (meters) | Length feet (meters) | Gold Grade opt (g/t) |
| Weighted Average | | | 35 (10.7) | 0.470 (16.11) |
| | 11/8/2021 |
Granite Creek Mine Project
Premier Gold Mines Limited/i-80 Gold Corp. | Page 83
PEA NI 43-101 Technical Report |
Numerous holes have been drilled in and around the Property prior to 1970. Unfortunately, this drillhole data is no longer available. Since 1970, a total of 2,083 drillholes totaling 955,747.9 feet (291,312 meters) have been drilled within the Property area. Figure 10-1 shows the drilling by each operator and significant time period. PMC and its predecessors, Rayrock Mines and the Cordex Syndicate, account for most of these holes: 1,434 holes totaling 554,435 feet (168,991.8 meters). Homestake drilled 165 holes totaling 160,207.7 feet (48,831.3 meters), and Barrick drilled 106 holes totaling 101,345.1 feet (30,890 meters). Both companies acted as operators for PMC. Atna, the last company to operate at the Granite Creek Mine, drilled 318 holes totaling 119,074.1 feet (36,293.8 meters).
Table 10-1 presents a summary of the drilling at the Property.
Figure 10-1: Granite Creek Project Drill Plan by Operator
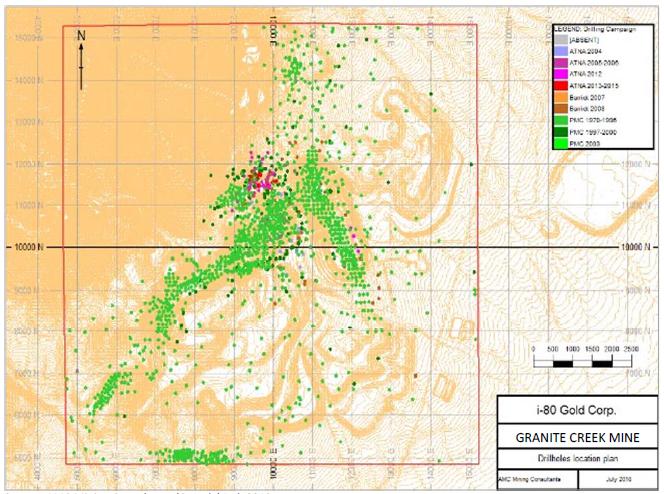
Source: AMC Mining Consultants (Canada) Ltd, 2019
| | 11/8/2021 |
Granite Creek Mine Project
Premier Gold Mines Limited/i-80 Gold Corp. | Page 84
PEA NI 43-101 Technical Report |
Table 10-1: Summary of Drilling on the Granite Creek Property Since 1970
| Company | Surface RC | Surface Core | UG RC | UG Core | Total
Holes | Total
Footage |
#
Holes | Footage
(feet) | #
Holes | Footage
(feet) | #
Holes | Footage
(feet) | #
Holes | Footage
(feet) |
| PMC | 1,426 | 546,313.0 | 8 | 8,122.0 | | | | | 1,434 | 554,435.0 |
| PMC (Homestake) | 136 | 108,335.0 | 29 | 51,872.7 | | | | | 165 | 160,207.7 |
| PMC (Barrick) | 39 | 35,645.0 | 67 | 65,700.1 | 4 | 930.0 | 56 | 19,756.0 | 106 | 101,345.1 |
| Atna | 29 | 18,672.0 | 65 | 52,847.6 | 176 | 32,068.0 | 48 | 15,486.5 | 318 | 119,074.1 |
| Total | 1,630 | 708,965.0 | 169 | 178,542.4 | 180 | 32,998.0 | 104 | 35,242.5 | 2,083 | 955,747.9 |
Note: RC=reverse circulation, UG=underground.
Source: Osgood Mining Company LLC.
Each period of drilling is described in further detail in Sections 10.1.2 to 10.1.10.
| 10.1.2 | PMC Drilling 1970 to 1996 |
Many holes drilled by PMC during this time period were development holes drilled in and adjacent to existing pits. Over 1,400 holes were drilled within the A, B, C, CX, Mag, CX-West, Felix, and Blue Bell pit areas. Many of these holes were drilled vertically, and all but eight were either conventional rotary or RC. The eight core holes that were drilled (8,122 feet [2,475.6 meters]) were in the B, C, CX, and Mag Pit areas to test stratigraphy, metallurgy, or deep mineralized structures (Golder Associates, 2014). Table 10-2 summarizes the drilling PMC conducted through 1996.
Table 10-2: PMC Drilling through 1996
| Company | Surface RC | Surface Core | Total Holes | Total Footage |
| # Holes | Footage (feet) | # Holes | Footage (feet) |
| PMC | 1,426 | 546,313.0 | 8 | 8,122.0 | 1,434 | 554,435.0 |
Source: Osgood Mining Company LLC
| 10.1.3 | PMC - Homestake Drilling 1997 to 2000 |
Between 1997 and 2000, Homestake, as the operator for PMC, drilled 165 holes, as shown in Table 10-3. Of the 165 holes drilled, 136 (108,335 feet [33,020.5 meters]) were directed into the CX and RFF system.
Table 10-3: Homestake Drilling
| Company | Surface RC | Surface Core | Total Holes | Total Footage |
| # Holes | Footage (feet) | # Holes | Footage (feet) |
| PMC (Homestake) | 136 | 108,335.0 | 29 | 51,872.7 | 165 | 160,207.7 |
Source: Osgood Mining Company LLC
| 10.1.4 | PMC - Barrick Drilling 2003 |
Four exploration holes were drilled by Barrick, operator at the time for PMC, to test extensions of the CX Fault Zone near its projected intersection with the Mag Pit fault system. The drilling did not identify significant mineralized zones, and no additional work was conducted by Barrick (Golder Associates, 2014). Table 10-4 shows a summary of the Barrick drilling.
| | 11/8/2021 |
Granite Creek Mine Project
Premier Gold Mines Limited/i-80 Gold Corp. | Page 85
PEA NI 43-101 Technical Report |
Table 10-4: Barrick Drilling 2003
| Company | Surface RC | Surface Core | Total Holes | Total Footage |
| # Holes | Footage (feet) | # Holes | Footage (feet) |
| PMC (Barrick) | 3 | 3,340.0 | 1 | 3,003.3 | 4 | 6,343.3 |
Source: Golder Associates 2014.
The drilling by Atna in 2004 followed up on mineralized zones previously identified by PMC and Homestake. Thirty-one holes totaling 29,739.5 feet (9,064.6 meters) were drilled. These holes were comprised of four RC holes totaling 2,217 feet (675.7 meters) and 27 core holes totaling 27,522.5 feet (8,388.9 meters) (Table 10-5). This drilling program had five objectives:
| • | Improve the grade and thickness of mineralized zones, especially in areas where drilling consisted of only RC drilling. |
| • | Infill drilling, especially where previous drill spacing was greater than 400 feet (121.9 meters). |
| • | Expand mineralized zones both laterally and down-dip. |
| • | Obtain rock quality data on hanging wall, footwall, and mineralized zones. |
| • | Evaluate previously identified targets. |
Table 10-5 shows a summary of the Atna drilling.
Table 10-5: Atna Drilling 2004
| Company | Surface RC | Surface Core | Total Holes | Total Footage |
| # Holes | Footage (feet) | # Holes | Footage (feet) |
| Atna | 4 | 2,217.0 | 27 | 27,522.5 | 31 | 29,739.5 |
Source: Osgood Mining Company LLC.
Of the 31 holes drilled, 13 holes (13,000 feet [3,962.4 meters]) were drilled into the CX Fault Zone and 18 holes (16,739.5 feet [5,102.2 meters]) were drilled into the RFF Zone (Golder Associates, 2014)).
| 10.1.6 | Atna Drilling 2005 - 2006 |
The objective of the 2005 to 2006 drilling program was to define and delineate Measured and Indicated gold Mineral Resources in the upper portions of the RFF Zone where Atna had outlined a 1,000-foot (305-meter) long by 200- to 500-foot (61- to 152.4-meter) thick mineralized zone during its 2004 drilling program. The drilling program was designed to test the upper RFZ between the 5,000 and 4,400 feet (1,524 and 1,341 meters) amsl (Golder Associates, 2014). The program used both surface and underground drilling to delineate the zone. A total of 107 drillholes (55,180.1 feet [16,818.9 meters]) were drilled between 2005 and 2006 (Table 10-6).
Table 10-6: Atna Drilling 2005-2006
| Company | Surface RC | Surface core | UG Core | Total Holes | Total Footage |
| # Holes | Footage (feet) | # Holes | Footage (feet) | # Holes | Footage (feet) |
| Atna | 25 | 16,455.0 | 34 | 23,238.6 | 48 | 15,486.5 | 107 | 55,180.1 |
Source: Osgood Mining Company LLC
| | 11/8/2021 |
Granite Creek Mine Project
Premier Gold Mines Limited/i-80 Gold Corp. | Page 86
PEA NI 43-101 Technical Report |
Surface drilling began in May of 2005. The majority of these holes were core holes, which were pre-collared via RC drilling and completed with core drilling. Fifty-nine (59) drillholes, totaling 39,693.6 feet (12,098.6 meters) of drilling, were completed from surface.
Underground drilling began in September of 2005 after drifting was completed and underground drill rigs became available. In total, 48 holes aggregating 15,486.5 feet (4,720.3 meters) of underground drilling were completed in the Ogee, CX West, and Range Front targets.
| 10.1.7 | PMC (Barrick) Drilling 2007 |
In August of 2007, surface exploration and development drilling began using an Eklund RC drill rig and a Major Drilling core rig. Targets tested included portions of the CX and RFF, Ogee Zone, and the HPR104 area. The HPR104 area is north of the Granite Creek Mine.
Twenty-three (23) surface holes (18,916.2 feet [5,765.7 meters]) were completed during the latter part of 2007 as shown in Table 10-7. The results of the drilling were disappointing in that only thin, sub-economic zones of underground mining gold grades were intersected.
Table 10-7: PMC - Barrick Drilling 2007
| Company | Surface RC | Surface Core | Total Holes | Total Footage |
| # Holes | Footage (feet) | # Holes | Footage (feet) |
| PMC (Barrick) | 7 | 4,935.0 | 16 | 13,981.2 | 23 | 18,916.2 |
Source: Osgood Mining Company LLC.
| 10.1.8 | PMC (Barrick) 2008 Drilling |
Surface drilling began in January of 2008 with three core drills and one RC drill testing areas north of the CX West pit. The core drilling was focused on completing holes pre-collared by RC drilling in 2007 and testing the deep potential of the Getchell Fault system north of the Granite Creek Mine, which had associated gravity and MT anomalies (Golder Associates, 2014). RC drilling was primarily focused on pre-collaring holes for follow-up core drilling north of the CX/CX-West pits. Surface core drilling was completed in April of 2008. RC drilling continued throughout 2008, with the focus on drilling pilot holes for potential dewatering well locations.
Underground exploration began in April 2008 as discussed in Section 9.4. SMD was contracted to rehabilitate existing underground workings and drive exploration headings into the Ogee and CX zones. SMD supplied an underground RC drill for closely-spaced definition drilling, and Connors Drilling was contracted to conduct underground core drilling. The SMD contract was terminated in May of 2008. Connors Drilling remained on site and brought in a second underground core rig in mid-July. Both core rigs continued operation through mid-December, testing the Ogee Zone and conducting widely spaced drilling within the RFZ.
In August 2008, a second surface drilling program was initiated to twin RC holes in key areas of the resource suspected of having downhole contamination. Two core rigs and one RC rig (to pre-collar holes) were used. A third surface core rig was also brought in to complete one deep hole to test the Mag fault-Delaney fault intersection south of the resource area. The drilling program was completed in mid-December and all drilling equipment removed from site.
| | 11/8/2021 |
Granite Creek Mine Project
Premier Gold Mines Limited/i-80 Gold Corp. | Page 87
PEA NI 43-101 Technical Report |
During 2008, total surface drilling included 29 RC holes totaling 27,370 feet (8,342.4 meters) and 50 core holes totaling 48,715.6 feet (14,848.5 meters). Underground drilling included 4 RC holes for 930 feet (283.5 meters) and 56 core holes totaling 19,756 feet (6,021.6 meters) (Table 10-8).
Table 10-8: PMC - Barrick Drilling 2008
| Company | Surface RC | Surface Core | UG RC | UG Core | Total Holes | Total Footage |
| # Holes | Footage (feet) | # Holes | Footage (feet) | # Holes | Footage (ft) | # Holes | Footage (feet) |
| PMC (Barrick) | 29 | 27,370.0 | 50 | 48,715.6 | 4 | 930.0 | 56 | 19,756.0 | 139 | 96,771.6 |
Source: Osgood Mining Company LLC
During the 2008 drilling program, eight holes were drilled north of the Pinson deposit resource area. These holes were designed to twin earlier PMC drilling that were drilled to test the intersection of the Range Front and Linehole Faults. The results of the initial drilling could not reproduce the thick low-grade intercept identified in an earlier hole, hole HPR104. This was considered to constitute downhole contamination in hole HPR104, and the hole was removed from the database. A second round of core drilling did intersect thin, higher-grade mineralization. Hole BPIN-008 intercepted 21.5 feet grading 0.620 opt at a depth of 1,378 feet (Golder Associates, 2014). This mineralization appeared to be structurally controlled by the intersection of the Linehole Fault and the Upper/Lower Comus contact 900 feet northeast of the main portal.
| 10.1.8.2 | Deep Exploration Targets |
Two deep drillholes, BPIN-010C and BPIN-011A, were drilled in 2008. Hole BPIN-010C was drilled to a depth of 2,845.5 feet (867.3 meters) and was designed to test the Lower Comus Formation adjacent to structures identified from a 2006 gravity survey (Golder Associates, 2014). The hole bottomed in Upper Preble Formation, and assay results proved negative. Hole BPIN-011A was drilled to a depth of 2,778 feet (846.7 meters) and ended in argillite and shale of the Upper Comus (Golder Associates, 2014). The hole was designed to test the projected intersection of the Mag and Delaney faults. Analyses of chip samples indicated a 60-foot (18.3-meter) zone of low-grade gold (0.029 opt [0.99 g/t]) at 1,440 feet (438.9 meters) hosted in silicified Upper Comus claystone and shale (Golder Associates, 2014). Subsequent analyses of core from the entire hole indicated narrow zones of mineralization associated with decarbonatization and pyritized sediments.
| 10.1.9 | 2012 Atna Mag Pit Core Drilling |
In 2012, Atna completed four PQ-size core holes, totaling 2,086.5 feet (636 meters), to acquire samples for column leach testing from mineralized material within the Mag Pit resource area. The holes were drilled along strike of the known mineralized zone, with each hole intersecting potential high-grade material. In addition to the metallurgical holes, and additional 56 underground exploration RC holes totaling 7,495 feet (2,284.5 meters) were drilled in the Ogee Zone. Table 10-9 summarizes the drilling conducted by Atna in 2012.
| | 11/8/2021 |
Granite Creek Mine Project
Premier Gold Mines Limited/i-80 Gold Corp. | Page 88
PEA NI 43-101 Technical Report |
Table 10-9: Atna Drilling 2012
| Company | Surface Core | UG RC | Total Holes | Total Footage |
| # Holes | Footage (feet) | # Holes | Footage (feet) |
| Atna | 4 | 2,086.5 | 56 | 7,495.0 | 60 | 9,581.5 |
Source: Osgood Mining Company LLC
| 10.1.10 | 2013 - 2015 Atna Underground Development RC Drilling |
Between 2012 and 2015, Atna completed 120 underground RC holes totaling 24,573 feet (7,489.9 meters) (Table 10-10). These holes were designed to confirm continuity of mineralization and to delineate stope configuration within the Ogee Zone for mining.
Table 10-10: Atna Drilling 2013 - 2015
| Company | UG RC | Total Holes | Total Footage |
| # Holes | Footage (feet) |
| Atna | 120 | 24,573.0 | 120 | 24,573.0 |
Source: Osgood Mining Company LLC
| 10.2 | Representative Drill Sections and Plan |
Figure 10-1 shows the drill plan of the Property in the area of the current Mineral Resource, shown by a red outline. The drillholes are coded by operator and significant time periods. Figure 10-2 shows a plan view with section lines of the Open Pit area. Figure 10-3 to Figure 10-6 show representative vertical sections through the four Open Pit areas. Figure 10-7 shows a vertical section through the underground resource area.
All drill results are from previous operators. i-80 has conducted no drilling on the Property.
| | 11/8/2021 |
Granite Creek Mine Project
Premier Gold Mines Limited/i-80 Gold Corp. | Page 89
PEA NI 43-101 Technical Report |
Figure 10-2: Plan View Section Lines of Granite Creek Mine Project
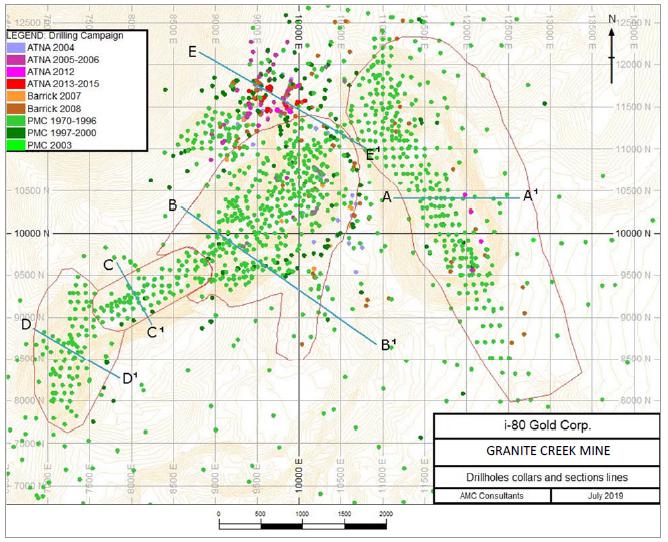
Note: Red outlines show the outline of the open pits.
Source: AMC Mining Consultants (Canada) Ltd 2019
| | 11/8/2021 |
Granite Creek Mine Project
Premier Gold Mines Limited/i-80 Gold Corp. | Page 90
PEA NI 43-101 Technical Report |
Figure 10-3: Vertical Section A-A1 of the Mag Pit Area
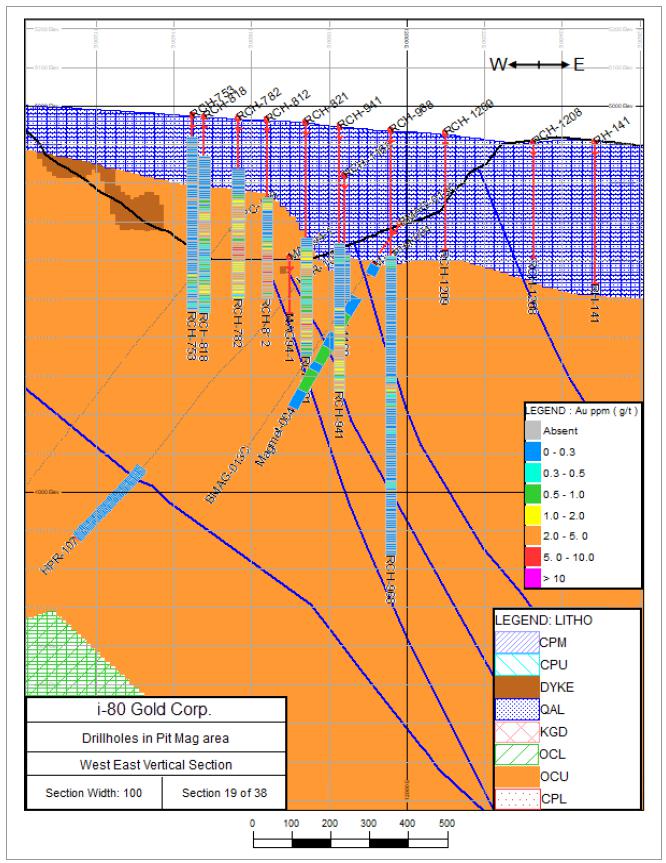
Notes: Blue lines are faults. Black line is a topographic surface. Not all items listed in the legend are on all sections.
Source: AMC Mining Consultants (Canada) Ltd 2019
| | 11/8/2021 |
Granite Creek Mine Project
Premier Gold Mines Limited/i-80 Gold Corp. | Page 91
PEA NI 43-101 Technical Report |
Figure 10-4: Vertical Section B-B1 of the Pit CX and C Area
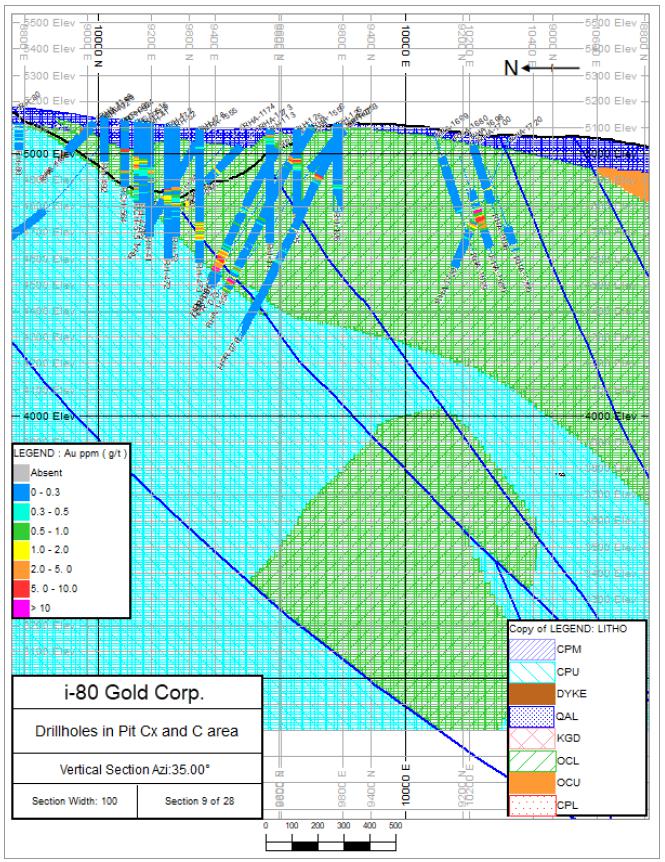
Notes: Blue lines are faults. Black line is a topographic surface. Not all items listed in the legend are on all sections.
Source: AMC Mining Consultants (Canada) Ltd 2019
| | 11/8/2021 |
Granite Creek Mine Project
Premier Gold Mines Limited/i-80 Gold Corp. | Page 92
PEA NI 43-101 Technical Report |
Figure 10-5: Vertical Section C-C1 of the Pit A Area
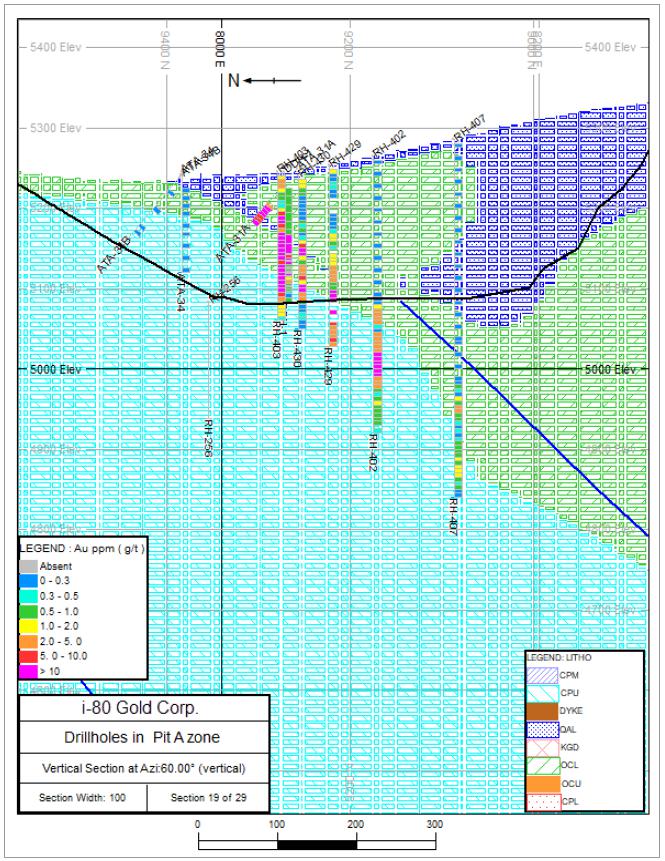
Notes: Blue line is a fault. Black line is a topographic surface. Not all items listed in the legend are on all sections.
Source: AMC Mining Consultants (Canada) Ltd 2019
| | 11/8/2021 |
Granite Creek Mine Project
Premier Gold Mines Limited/i-80 Gold Corp. | Page 93
PEA NI 43-101 Technical Report |
Figure 10-6: Vertical Section D-D1 of the Pit B Area
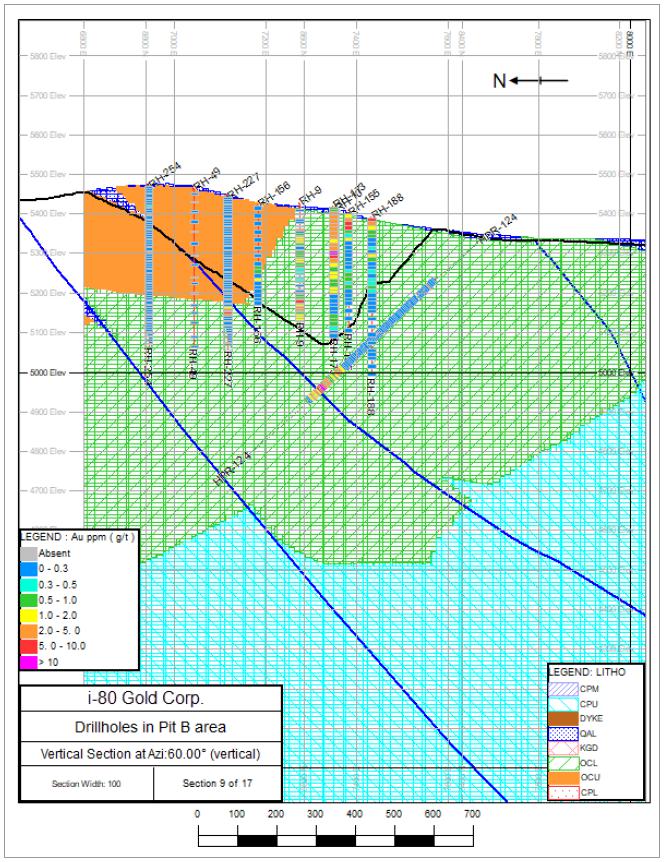
Notes: Blue lines are faults. Black line is a topographic surface. Not all items listed in the legend are on all sections.
Source: AMC Mining Consultants (Canada) Ltd 2019
| | 11/8/2021 |
Granite Creek Mine Project
Premier Gold Mines Limited/i-80 Gold Corp. | Page 94
PEA NI 43-101 Technical Report |
Figure 10-7: Vertical Section E-E1 of the Underground Resource Area
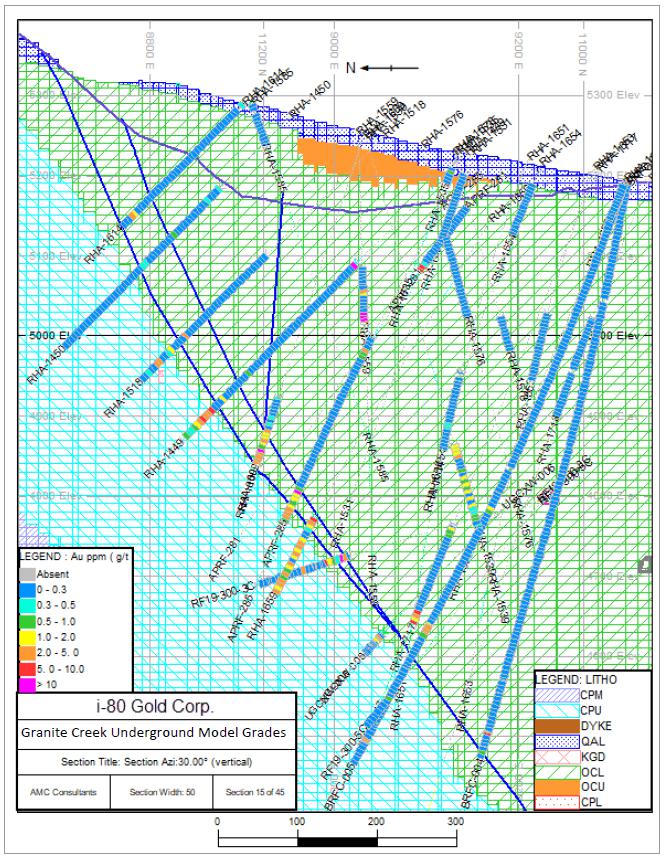
Notes: Blue lines are faults. Top blue line is a topographic surface. Not all items listed in the legend are on all sections.
Source: AMC Mining Consultants (Canada) Ltd 2019
| | 11/8/2021 |
Granite Creek Mine Project
Premier Gold Mines Limited/i-80 Gold Corp. | Page 95
PEA NI 43-101 Technical Report |
| 10.3 | Drilling, Sampling, and Recovery factors |
There are no drilling, sampling or recovery factors that could materially impact the accuracy and reliability of the results. Drilling has been discussed in this section and sampling and recovery factors are discussed in Section 11.0.
| | 11/8/2021 |
Granite Creek Mine Project
Premier Gold Mines Limited/i-80 Gold Corp. | Page 96
PEA NI 43-101 Technical Report |
| 11.0 | SAMPLE PREPARATION, ANALYSES, AND SECURITY |
| 11.1 | Sampling Methods and Approach |
Drilling at the Property used both surface RC and core drilling along with underground core drilling. The RC drilling was used primarily to pre-collar holes to bedrock followed by core drilling. This was done to minimize costs by not core drilling through unmineralized material overlying the mineralized fault zones. Core drilling provides a higher confidence in sample quality versus RC drilling along with providing additional data for engineering studies and detailed geologic definition of structurally controlled high-grade mineralized zones.
The primary objective of the drilling programs was to collect clean, uncontaminated representative samples that were correctly labeled when drilled and logged, and that could be accurately tracked from the drill rig to the assay laboratory. Both Atna and PMC (Barrick) Exploration used similar sampling and analytical protocols.
| 11.2 | Reverse Circulation Drilling |
In this drilling method, cuttings produced by the bit are sent up the drill pipe into a cyclone at surface, where the sample is homogenized prior to collection. From the cyclone, the sample is processed through a rotary splitter that takes a representative split of the sample (usually a quarter split), sending a split portion to the sample port, with the remainder to the reject port. Samples are placed into 10-by-17-inch sample bags that have been clearly labeled with the drillhole number and a unique numbering sequence prepared beforehand using a spreadsheet. This spreadsheet helps in tracking bag numbers, footages drilled, and quality control samples. A representative sample of each interval drilled is also preserved in chip trays that are clearly labeled with the hole number and drill interval for future reference.
Sample recovery for RC drilling is measured by weight of material collected, which is usually eight to ten pounds of material from the quarter split in a typical six-inch diameter hole. Historical RC sample recovery was excellent. Full five to ten-pound bags of sample were collected from every interval. The only exception were 15 samples out of 6,100 that were collected by Atna. The missing samples occurred in an isolated zone of badly broken ground.
Typical truck-mounted RC drill rigs use 20-foot drill rods, with samples collected in five-foot intervals. Both Atna and PMC used this sampling procedure in their drilling programs.
For each RC hole drilled, the drill crew was provided with a sequentially numbered set of sample bags. The outsides of the bags were marked with the drillhole number and a sample number.
To ensure that blanks and standards were inserted into the sample stream correctly (every tenth sample), several steps were taken. First, the sampler was provided with chip trays that were labelled with both the true footage and the corresponding bag number. Second, he was provided with an incompletely labeled set of sample bags that did not include bags for the standards or blanks. Third, since the total depth of the hole was not known prior to drilling, bags for duplicate samples (collected every 100 feet) were labeled with the letters “A”, “B”, “C”, etc. and flagged with a tear-off paper tag.
| | 11/8/2021 |
Granite Creek Mine Project
Premier Gold Mines Limited/i-80 Gold Corp. | Page 97
PEA NI 43-101 Technical Report |
Samples were allowed to drain/dry at the sample site, which was routinely visited by the geologist in charge of the drill program to ensure accurate numbering of the sample suite. Once drained and/or dried, the samples were re-located from the drill site to the shipment staging area, where personnel relabeled the bags containing the duplicate samples by assigning the correct sequential number. This ensured that they were “blind” to the laboratory personnel. The samples were then loaded into 4 x 4 x 3-foot wooden crates in preparation for pickup by the lab.
Representative rock chips for each 5-foot run were collected in clearly labeled 20 compartment plastic chip trays. These trays were taken to the logging trailer, where the geologist logged the chips with the aid of a binocular microscope. The geologist recorded lithology, mineralization, alteration, and other pertinent features on a paper drill log. A schematic graphic log was also produced to aid in interpretation of the stratigraphic sequence.
At the drill site, the drill crew was responsible for obtaining a complete and representative sample of the cored interval. This interval is usually five feet in length but may be shorter depending on how difficult the ground conditions are. Core is recovered from the core barrel via a wire line core tube, which may be outfitted with an inner “triple-tube.”
For core obtained using a triple-tube system, the core was placed on a rack, and the drill crew recorded rock quality determination (RQD) values on a worksheet and photographed the core. For holes drilled with conventional core barrels, RQD values were recorded later by a geologist from the core in the box.
At the drill site, once the RQD values were recorded and the core photographed, the drill crew placed the core in waxed cardboard boxes that were labeled with the company name, Property, hole ID, box number, and from-to footage. Core boxes were partitioned in five, two-foot long sections totaling 10 feet in length. As core was drilled, it was placed in the core boxes in sequential order from top of the run to bottom of the run. A wooden block was inserted at the end of each run, and at the driller's discretion, to indicate problems with drilling, such as caving, voids, or core tube mismatches. The last block of each run was marked with the ending footage on the thin edge of the block and two numbers on the larger surface.
If the core was not photographed for RQD purposes, the drillers marked the breaks they made to fit the core into the core boxes with the letter "M" on each side of the break, so it was not counted in the RQD analysis. After boxing, each core box was securely closed with elastic banding and loaded into the driller's vehicle for transport to the logging area, at which point it was unloaded and logged.
| | 11/8/2021 |
Granite Creek Mine Project
Premier Gold Mines Limited/i-80 Gold Corp. | Page 98
PEA NI 43-101 Technical Report |
Core recovery is measured by the ratio of the length of drill core recovered versus the length of the drilled run and is expressed in percent. Core recovery was excellent with greater than or equal to 99% core recovered (Golder Associates, 2014). Where core loss was recorded, it amounted to less than two feet in zones where voids were present in the stratigraphy.
Once the core was logged, the geologist determined the sample intervals to be sent to the laboratory. The geologist adhered to a set of guidelines to better define boundaries between mineralized material and barren samples. Original core blocks, inserted by the driller to mark the end of a drill run, served as the primary sample boundary, subject to the rules below; where a conflict existed between the inserted core blocks and the guidelines, the guidelines prevailed, and extra blocks were inserted by the geologist to compensate:
| • | A sample must not cross a geologic contact. |
| • | A sample must not cross an obvious alteration boundary, including oxidation. |
| • | A sample must not exceed seven feet long, and only be that long if it occurred in barren material, with 5-foot (1.5-meter) samples being the optimum. |
| • | Any core blocks that do not mark a sample boundary, for whatever reason (such as “cave,” “loss,” “void,” etc.) must be labeled in black marker for photographic visibility. |
Each block that marked a sample boundary was outlined or highlighted in red marker, and the interval boundaries were entered into a sample sequence log. Sample intervals generally ranged from one to six feet in length and averaged 4.6 feet.
During the core sampling process, the sampler was provided with the geologic core log and the sample sequence to allow the sampler to have a better understanding of why and how the sample boundaries were picked and to act as a check on the geologist’s accuracy.
The condition of the rock and whether it was mineralized or not dictated the splitting method of the core. Unmineralized rock was split with a hydraulic splitter. Mineralized and silicified intervals were sawn with a water-cooled diamond-bladed rock saw. Mineralized un-silicified intervals were also typically sawn, but in some instances split with the hydraulic splitter. Broken mineralized core was separated and divided into two equal portions.
To avoid sampling bias, whenever possible, the core was sawn or split perpendicular to the trace of visible bedding. The portion of the core to be saved was placed in the core box in its original position with the core blocks in place, and the box was rubber banded for additional security. The sampled half of the split core was bagged, and the bags were placed in 4- x 4- x 3-foot (1.2- x 1.2- x 0.9-meter) wooden crates for shipment to the laboratory. The remaining core was palletized, covered with tarps, and moved to industrial shelving on an outdoor cement pad for storage and reference. It is unknown if this storage facility was secure.
| | 11/8/2021 |
Granite Creek Mine Project
Premier Gold Mines Limited/i-80 Gold Corp. | Page 99
PEA NI 43-101 Technical Report |
Once the core was received at the logging facility, it was arranged sequentially from top of the hole to bottom of the hole.
Data captured on paper drill logs included footage of the core runs, lithology, alteration, major structural features, bedding dips, and fractures. A horizontal line was drawn across the log, indicating footage where core blocks were present within the drilled core. Footage of core cut and recovery were also recorded. Intervals with no recovery were indicated on the drill log by horizontal lines crossing the entire page, with a blanked-out zone of “no information,” making it readily apparent where information was missing.
Any discrepancies in the footage shown on the core blocks or in core recovery were noted by the logging geologist on the log. Where there was missing core, additional core blocks were inserted by the geologist reflecting the missing interval and a cursory explanation written on the core block stating why the interval was missing.
Graphic logs of the lithology were also produced to reflect the major rock types using conventional or agreed upon symbols. Major structural features including contact relationships, dips and fractures, bedding, and veins were plotted on the log and described as angle from core axis. Alteration and mineralization styles were also recorded along with a description of the lithology.
Methods for securing samples by companies conducting work at the Property prior to the formation of PMC are unknown. Between 1970 and 1996, during which time PMC was actively mining at the Property, samples were sent to the mine laboratory for analyses. It is not known what provisions PMC employed for sample security.
When Homestake operated PMC, samples were picked up and transported to the laboratory by ALS Chemex as part of the chain of custody. In 2003 and from 2007 to 2008, Barrick, as operator of PMC, conducted drilling programs. It is uncertain what protocols were employed by Barrick to ensure sample security.
Atna conducted exploration and development drilling between 2004 and 2006 and from 2012 to 2015. Once a set of samples was ready for shipment to the laboratory, the laboratory was contacted for a job number and a pickup time by the laboratory scheduler. It is unknown if samples were stored onsite or whether the sample storage area was secured. Both RC chips and core samples were placed in numbered bags and the bags placed in 4- x 4- x 3-foot wooden crates for shipping, along with a transmittal sheet indicating whether the samples were core or RC cuttings, the range of sample numbers, and the total number of samples. In some instances, an Atna geologist travelling to Reno delivered samples to the lab.
| 11.5 | Sample Preparation and Analysis |
Sample preparation procedures for the Granite Creek Mine were not recorded.
| | 11/8/2021 |
Granite Creek Mine Project
Premier Gold Mines Limited/i-80 Gold Corp. | Page 100
PEA NI 43-101 Technical Report |
PMC’s standard assaying practice was to run assays using atomic absorption (AA) methods. For all assays, this was generally done on a cyanide leach to aide in identifying leachable material (Sim, 2005). At some unknown point, PMC changed this to only run fire assay with AA finish on samples over 0.01 opt (0.34 g/t). Check assays were performed on high-grade zone samples at third-party laboratories. Detection limits for the PMC samples varied from <0.003 to <0.001 opt (<0.1 to <0.03 g/t), depending on the age of the assay.
| 11.5.2 | PMC - Homestake 1997 - 2000 |
When Homestake operated PMC, assays were analyzed by ALS Chemex in Reno, NV (ALS). Samples were prepared at ALS as follows:
| • | Primary crush and mill to 80% passing -10 mesh |
| • | 300-gram split of material for pulverization to 90% passing -150 mesh |
| • | 30-gram split for digestion and assay |
Samples were assayed using the Au-AA23 fire assay method with AA finish. Analyses were reported in parts per billion (ppb). Samples reporting Au values greater than 10,000 ppb were re-assayed by fire assay with a gravimetric finish.
Detection limits for gold analyses performed by ALS Chemex were 5 ppb and 0.0005 opt (0.017 g/t). For statistical purposes, most of the Homestake holes that reported “detection limit” gold were converted to 2.5 ppb and 0.0003 opt. (These values were subsequently converted back to -5 ppb and -0.0005 opt in the current database).
| 11.5.3 | PMC Barrick 2000 - 2008 |
American Assay Laboratories (AAL) located in Sparks, Nevada was used by PMC (Barrick) to prepare and analyze samples generated from its drilling programs.
Samples were dried, weighed, and crushed using either a roll or jaw crusher. A split of crushed material was pulverized for further analytical work. Samples were analyzed for gold using a one-assay ton (29.116 gram) fire assay with AA finish (Fire AA). Samples with a fire assay greater than 0.005 opt (0.17 g/t) were subject to a cyanide soluble leach assay by AA spectroscopy to determine gold recovery and carbon and sulfur analysis for metallurgical evaluation. Samples returning an initial gold assay >5 parts per million (ppm) were subject to fire assay with a gravimetric finish.
In addition to gold, PMC (Barrick) also had the samples analyzed for an additional 69 elements using an aqua regia digestion with an Induced Coupled Plasma Atomic Emission Spectroscopy (ICP-AES finish). PMC (Barrick) employed its own internal quality assurance/quality control (QA/QC) protocols. Once the assay results were received via email, the exploration database manager loaded the assay data into AcQuire database management software (ACQ). The ACQ software evaluated the gold values of the standards and flagged any standards that performed outside of acceptable limits. Failed standards were documented and reviewed by the geologist in charge of the project. Depending on the rate of failure, a selection of samples, or possibly the entire batch, was rejected and another round of analyses requested by the geologist.
| | 11/8/2021 |
Granite Creek Mine Project
Premier Gold Mines Limited/i-80 Gold Corp. | Page 101
PEA NI 43-101 Technical Report |
When samples needed re-assaying, the lab was notified of the failures, and a list of samples to be re-assayed were sent to the lab. Upon receipt of the results of the re-assayed samples by the database supervisor, they were loaded into ACQ, and XY-scatter plots were generated for the geologist to review for approval or rejection. Should the second round of analyses be rejected, a third round would ensue until acceptable results were achieved. Check samples were also collected and sent to a second lab to evaluate potential laboratory bias. It is unknown which laboratories were used to analyze the check samples.
Atna used Inspectorate American Laboratories (IAL), an ISO 9002-accredited facility located in Reno, Nevada, as their primary analytical lab for the Granite Creek Mine Project. Sample preparation procedures used by IAL follow.
The samples were dried and weighed prior to crushing. Crushing used a two-stage process. Once the sample was dried, it was passed through a jaw crusher to reduce it to a uniform size. It then passed through a roll mill to reduce the sample to >80% passing -10 mesh. A 300-gram split of this material was obtained using a Jones riffle splitter. The split material was further reduced to >90% passing -150 mesh using a ring and puck pulverizer.
After pulverization, a 30-gram sample of pulp was taken and digested and analyzed for gold using standard fire assay with AA finish. Samples returning gold values greater than 3 g/t were subjected to gravimetric analyses.
| 11.5.5 | Atna Underground 2011 - 2016 |
The new mine lab constructed adjacent to the administration building in 2012 was in operation from 2012 to 2016.
Underground samples were transported to the on-site laboratory by Atna personnel. Samples were logged in and checked against sample transmittal sheets. Samples were then dried and weighed before being passed through a small jaw crusher to minus 3/8-inch (0.95-centimeter) passing. Crushed material was then passed through a Jones splitter, multiple times if necessary, to produce a 200-gram to 300-gram sample split for pulverization. The pulp split was then transferred to the ring and puck pulverizer for grinding to 80% passing 150 mesh. Pulverized material was weighed out to a 30-gram fire assay sample charge (Pinson Mine, 2015).
The Property database has been subjected to three major campaigns of data validation by Atna, Barrick, and most recently OMC. The details of data validation completed by Atna and Barrick are described in detail in previous Technical Reports (Sim, 2005; Atna Resources Ltd., 2007; Gustavson, 2012; Golder Associates, 2014; AMC, 2020), Atna (2007), Gustavson (2012), and Golder (2014). A summary of this work is described herein.
| | 11/8/2021 |
Granite Creek Mine Project
Premier Gold Mines Limited/i-80 Gold Corp. | Page 102
PEA NI 43-101 Technical Report |
| 11.6.2 | Atna Review of Prior Data |
Atna completed a detailed review of historic data as part of due diligence studies, upon acquiring the Property. This process involved comparing data stored within a historic Microsoft Access database with digital files, databases, Vulcan files, and records stored onsite. Errors were corrected based on a “well maintained filing system containing most, if not all, drill logs, downhole surveys and Homestake assays” (Atna Resources Ltd., 2007). Validation errors such as overlapping samples and length discrepancies (i.e., surveys beyond hole depth) were investigated and corrected as appropriate.
Atna was unable to verify PMC analytical results because much of the historical analysis had been completed using the mine laboratory, and original certificates were not available. To assess historical analytical results, Atna reanalyzed 652 drill sample pulps from mineralized intercepts within the CX and Range Front target area. The pulps were sourced from the onsite pulp library maintained by PMC. Check pulp samples were submitted with Certified Reference Materials (CRMs). Atna concluded that re-assay results confirmed the accuracy of original Homestake and PMC assay results.
Atna subsequently completed two separate database audits. The first audit involved the selection of 20% of the 370 holes within the database, extracting assays greater than 0.08 opt (2.74 g/t) and checking assays. Out of 216 assays, 16 errors were noted and corrected. A second audit was completed by checking 15% of the drillholes completed by Atna in the Phase 2 program of 2006. Out of 1,653 assays, a total of 12 errors were identified.
| 11.6.3 | Barrick Review of Prior Data |
On exercising their earn-back option with Atna, Barrick conducted a detailed verification review of the historical drillhole database. This included reviewing the use of standards, blanks, and duplicates along with a second round of checks on the data entry and database maintenance. The results of the verification program are documented in an internal Barrick report that concluded that, “...10% of the database was checked, and it was considered adequate for use in a Scoping Level study...” (Golder Associates, 2014).
Barrick broadened the scope of their investigation of potential Mineral Resources at the Granite Creek Mine Project to include open pit potential and initiated a check of the accuracy of the historical database within an area of interest, which included checks on drillhole collars for 2,014 holes.
Barrick contracted Geostrata LLC of Bluffdale, Utah, to complete data verification checks on historical data. Collar coordinates, downhole surveys, from and to intervals, and assay values were reviewed. Six errors were identified out of 208 collars checked. Errors comprised transcription errors, where the collar coordinates or hole length was incorrect, and field errors, where data had been entered into the incorrect field. Out of a total of 18,013 assays, a total of 184 errors were identified (1%). Errors comprised:
| • | Data in the database but not in the drill log and vice versa |
| • | Incorrect numbers in the database according to the drill log |
| • | Discrepancy transcribing nil, trace, no sample, or detection limit values |
| • | Sample type is recorded in the drill log but not in the database |
| • | No assay data is available via certificate or drill log, but there was data in the database |
| | 11/8/2021 |
Granite Creek Mine Project
Premier Gold Mines Limited/i-80 Gold Corp. | Page 103
PEA NI 43-101 Technical Report |
Table 11-1 provides a summary of the errors.
Table 11-1: Summary of Errors Within the Granite Creek Project Database
| Company | Total Assays Reviewed | Missing Data | Incorrect Numbers | Discrepancies Nil, Trace, No Sample, Detection Limit | Sample Type Errors | No Certificate or Drill Log | Total Number of Errors |
| Atna | 1867 | 3 (0.16%) | 0 | 0 | 0 | 0 | 3 (0.1%) |
| PMC (Barrick) | | | | | | | |
| Cordex | 179 | 0 | 0 | 7 (3.9%) | 0 | 0 | 7 (3.9%) |
| Cordilleran | 435 | 4 (0.9%) | 0 | 2 (0.4%) | 0 | 1 (0.2%) | 7 (1.6%) |
| PMC (Homestake) | 3319 | 5 (0.15%) | 3 (0.09%) | 11 (0.3%) | 11 (0.3%) | 2 (0.06%) | 32 (0.9%) |
| Pinson Mine Co. | 12,392 | 71 (0.57%) | 47 (0.3%) | 16 (0.1%) | 0 | 1 (0.008%) | 135 (1.0%) |
| Total | 18,013 | 83 (0.46%) | 50 (0.27%) | 36 (0.19%) | 11 (0.06%) | 4 (0.02%) | 184 (1.0%) |
| 11.6.4 | OMC Data Compilation and Validation |
| 11.6.4.1 | Database Compilation |
In January of 2017, OMC contracted Maxwell Resources (Maxwell) to perform data migration of the drillhole database into their proprietary DataShed database software. Maxwell was supplied with collar, downhole survey, lithology, and original assay files.
While in operation, both mine labs used a digital assay file management system to keep track of assay and other data generated from drilling programs. Only raw digital assay files were located for assays generated by the new mine lab. The new mine lab used an Excel file with multiple tabs to record assay data throughout the assaying process. Only the tab marked as “final assay” was used by Maxwell and OMC for data uploads into DataShed. Assay data from the old mine lab was only available as paper copies with hand-written assays on the form. These paper copies were used to validate assay data in the DataShed database.
Maxwell supplied OMC with an SQL database in February of 2017. During the process of migrating the database into the new software, Maxwell noted that assay files were in various formats and that there were multiple errors in collar information.
All gold assays, including Cyanide Au and calculated values, were uploaded into one Au field. There were also a significant number of generic methods that had unknown (“UN_UN”) listed for the analytical method. The new data uploaded from the various labs added more analytical methods. After reviewing the database, it was determined that additional Au fields were needed to separate out the various analytical methods, i.e., Cyanide Au (Au_CN field), along with a field for calculating ounces per ton (opt) (AU_CALC field). It is important to be able to specify the analytical method used for Au analyses since DataShed automatically ranks the methods from most reliable method to least reliable method.
| | 11/8/2021 |
Granite Creek Mine Project
Premier Gold Mines Limited/i-80 Gold Corp. | Page 104
PEA NI 43-101 Technical Report |
| 11.6.4.2 | Database Corrections |
In 2018, OMC corrected the errors found by Maxwell during their data migration process. Errors that were corrected included duplicate holes, core recovery issues, and interval data that went past total hole depth. In addition, assay batches that were not uploaded correctly were flagged with a “NOCERT” or “assay method unknown” identifier.
In April of 2019, OMC contracted AMC and CSA Global to perform separate Mineral Resource updates on the Pinson underground mineralized zone. After detailed review of the drillhole database, AMC and CSA Global separately expressed concern with the number of “NO CERT” and “assay method unknown” assays. An area of interest surrounding the underground mineralized zone was subsequently defined, and original assay certificates were sourced and reloaded where possible. Analytical methods associated with assay data was updated during this process. Standards and blanks were also compiled and uploaded.
Details of assays reloaded are presented in Table 11-2 and Table 11-3.
Table 11-2: Initial Data Set and 18 April 2019 Data Subset
| | Starting Database | 18 April 2019 Database |
| Samples | 77,475 | 77,660 |
| Number of samples with "NOCERT" | 58,740 | 48,498 |
| Percentage of database with “NOCERT” | 75.80% | 62.40% |
Table 11-3: Assay Certificates and Samples Uploaded by Laboratory
| Laboratory | Number of Batches | Number of Samples |
| American assay lab | 66 | 9,098 |
| Inspectorate | 164 | 13,626 |
| Pinson Mine | 132 | 2,921 |
| Total | 362 | 25,645 |
Notes: Numbers are from the defined area of interest
Certificate headers contain the certificate identification, analyte, laboratory method, and assay unit. The raw assay headers from all the labs had to be re-formatted to facilitate direct import to DataShed. All certificates, regardless of the lab of origin, had the identifier “_2019” added to the end of the certificate number to aid in separating assays from the same certificate but which had different loading parameters. The 18 April 2019 database described in this section was used in the Mineral Resource estimate.
Significant work has been completed on the transfer of the old database into the new DataShed database and additional clean-up work still needs to be performed on the DataShed database to ensure its completeness and increase the confidence in the data.
| 11.7 | Quality Assurance/Quality Control Overview |
QA/QC data has been compiled from available databases for all drilling activities completed since 2005. No QA/QC data is available for work occurring prior to this time.
Drilling programs completed at the Property between 2005 and 2015 included QA/QC monitoring programs, which comprised the insertion of CRMs, blanks, and duplicates into the sample streams on a batch by batch basis. Table 11-4 provides a summary of QA/QC samples included during this period.
| | 11/8/2021 |
Granite Creek Mine Project
Premier Gold Mines Limited/i-80 Gold Corp. | Page 105
PEA NI 43-101 Technical Report |
Table 11-4: QA/QC 2005 - 2015
| Year | Company | Drill samples | CRMs | Blanks | Field duplicates |
| 2005 | Atna | 7,330 | 267 | 289 | 23 |
| 2006 | 4,859 | 265 | 263 | 39 |
| 2007 | Barrick | 3,644 | 123 | 107 | 2 |
| 2008 | 17,661 | 403 | 265 | 197 |
| 2012 | 1,515 | 0 | 0 | 0 |
| 2013 | Atna | 3,360 | 0 | 0 | 0 |
| 2015 | 1,320 | 23 | 0 | 0 |
| Total | | 39,689 | 1,081 | 924 | 261 |
Notes:
| • | Counts of individual samples. Multiple analyses types per sample (i.e., fire assay and gravimetric). |
Source: AMC Mining Consultants (Canada) Ltd. using data provided by Osgood Mining Company LLC
Table 11-5 shows the insertion rates of QA/QC samples between 2005-2015.
Table 11-5: QA/QC 2005 - 2015 Insertion Rates
| Year | Company | CRM's | Blanks | Field duplicates | QA/QC 1 |
| 2005 | Atna | 3.6% | 3.9% | 0.3% | 7.9% |
| 2006 | 5.5% | 5.4% | 0.8% | 11.7% |
| 2007 | Barrick | 3.4% | 2.9% | 0.1% | 6.4% |
| 2008 | 2.3% | 1.5% | 1.1% | 4.9% |
| 2012 | 0.0% | 0.0% | 0.0% | 0.0% |
| 2013 | Atna | 0.0% | 0.0% | 0.0% | 0.0% |
| 2015 | 1.7% | 0.0% | 0.0% | 1.7% |
| Total | | 2.7% | 2.3% | 0.7% | 5.7% |
Notes:
| • | Counts of individual samples. Multiple analyses types per sample (i.e., fire assay and gravimetric). |
| • | 1 Insertion rate for CRM, Blanks and Field Duplicates combined. |
Source: AMC Mining Consultants (Canada) Ltd. using data provided by Osgood Mining Company LLC
| 11.8 | Certified Reference Materials |
A total of 37 different CRMs was used at the Property between 2005 and 2015. CRMs were supplied by Rocklabs of New Zealand.
CRMs comprised on average 2.7% (and up to 5.5%) of samples submitted to the laboratory. CRM insertion formed part of the QA/QC program consistently in the period between 2005 and 2008. CRMs, during this time, were generally included systematically at a rate of 1 in 20 to 1 in 25 samples. CRMs do not appear to have been consistently used since 2008.
CRMs used in the 2005 and 2006 programs are discussed in the 2007 NI 43-101 Technical Report titled “Technical Report Update Pinson Gold Property, Humboldt County, Nevada, USA” effective 1 June 2007 (Atna Resources Ltd., 2007). There is no documentation available regarding CRM procedures for programs after 2006.
| | 11/8/2021 |
Granite Creek Mine Project
Premier Gold Mines Limited/i-80 Gold Corp. | Page 106
PEA NI 43-101 Technical Report |
Rocklabs CRMs were stored in bulk in plastic bin in the logging trailer. Individual CRMs were created by measuring 100 grams of the appropriate CRM into kraft envelopes. Packaged CRMs were then stored in separate labeled bins and inserted regularly into the sample stream.
Table 11-6 and Table 11-7 summarize CRMs by year and company.
Table 11-6: CRMs used in each year
| Period | Company | # CRMs | CRMs Used |
| 2005 | Atna | 16 | OxA45, OxE21, OxH29, OxK18, OXL25, OxN33, OxP32, SF12, SG31, SI15, SJ10, SK11, SN16, SP17, SQ18, UNKNOWN |
| 2006 | 16 | OxA45, OxE21, OxH29, OxI54, OxJ36, OxK18, OXL25, OxN33, OxP32, SF12, SI15, SJ10, SK11, SN16, SP17, SQ18 |
| 2007 | Barrick | 15 | OxA59, OxC58, OxD57, OxF53, OxG60, OxH52, OxI54, OxK48, OxN49, OxP50, SF23, SG31, SJ32, SK33, SN26 |
| 2008 | 18 | OxA59, OxC58, OxD57, OxF53, OxG60, OxH52, OxI54, OxJ36, OxK48, OxN49, OxP50, SF23, SG31, SI25, SJ32, SK33, SN26, UNKNOWN |
| 2012 | Atna | 0 | |
| 2013 | 0 | |
| 2015 | 6 | OxK119, OxN117, OxP91, SK78, SN75, SP73 |
Table 11-7: CRMs Used by Year and Company (2005 - 2015)
| CRM ID | Expected Au Value (ppm) | Stand Dev | Number of CRMs used 1 |
| Atna | Barrick | Atna | Total |
| 2005 | 2006 | 2007 | 2008 | 2015 |
| OxA45 | 0.081 | 0.0069 | 2 | 13 | | | | 15 |
| OxA59 | 0.082 | 0.0052 | | | 3 | 37 | | 40 |
| OxC58 | 0.201 | 0.007 | | | 7 | 30 | | 37 |
| OxD57 | 0.413 | 0.012 | | | 13 | 42 | | 55 |
| OxE21 | 0.651 | 0.026 | 30 | 26 | | | | 56 |
| OxF53 | 0.810 | 0.029 | | | 4 | 30 | | 34 |
| SF12 | 0.819 | 0.028 | 36 | 18 | | | | 54 |
| SF23 | 0.831 | 0.027 | | | 7 | 38 | | 45 |
| SG31 | 0.996 | 0.028 | 1 | | 4 | 36 | | 41 |
| OxG60 | 1.025 | 0.028 | | | 10 | 27 | | 37 |
| OxH52 | 1.291 | 0.025 | | | 18 | 28 | | 46 |
| OxH29 | 1.298 | 0.033 | 24 | 21 | | | | 45 |
| SI25 | 1.801 | 0.044 | | | | 22 | | 22 |
| SI15 | 1.805 | 0.067 | 1 | 4 | | | | 5 |
| OxI54 | 1.868 | 0.066 | | 1 | 6 | 33 | | 40 |
| OxJ36 | 2.398 | 0.073 | | 3 | | 1 | | 4 |
| SJ10 | 2.643 | 0.06 | 2 | 16 | | | | 18 |
| SJ32 | 2.645 | 0.068 | | | 5 | 30 | | 35 |
| OxK18 | 3.463 | 0.132 | 21 | 2 | | | | 23 |
| OxK48 | 3.557 | 0.042 | | | 10 | 22 | | 32 |
| OxK119 | 3.604 | 0.105 | | | | | 3 | 3 |
| SK33 | 4.041 | 0.103 | | | 9 | 15 | | 24 |
| SK78 | 4.134 | 0.138 | | | | | 4 | 4 |
| | 11/8/2021 |
Granite Creek Mine Project
Premier Gold Mines Limited/i-80 Gold Corp. | Page 107
PEA NI 43-101 Technical Report |
| CRM ID | Expected Au Value (ppm) | Stand Dev | Number of CRMs used 1 |
| Atna | Barrick | Atna | Total |
| 2005 | 2006 | 2007 | 2008 | 2015 |
| SK11 | 4.823 | 0.11 | 21 | 26 | | | | 47 |
| OXL25 | 5.852 | 0.105 | 29 | 25 | | | | 54 |
| OxN33 | 7.378 | 0.208 | 33 | 28 | | | | 61 |
| OxN49 | 7.635 | 0.189 | | | 19 | 6 | | 25 |
| OxN117 | 7.679 | 0.207 | | | | | 2 | 2 |
| SN16 | 8.367 | 0.217 | 17 | 21 | | | | 38 |
| SN26 | 8.543 | 0.175 | | | 2 | 3 | | 5 |
| SN75 | 8.671 | 0.199 | | | | | 4 | 4 |
| OxP91 | 14.820 | 0.3 | | | | | 3 | 3 |
| OxP50 | 14.890 | 0.493 | | | 6 | 3 | | 9 |
| OxP32 | 14.990 | 0.44 | 3 | 15 | | | | 18 |
| SP17 | 18.125 | 0.434 | 25 | 32 | | | | 57 |
| SP73 | 18.170 | 0.42 | | | | | 7 | 7 |
| SQ18 | 30.490 | 0.88 | 22 | 14 | | | | 36 |
Notes:
| • | 1 Counts of individual samples. Multiple analyses types per sample (i.e., fire assay and gravimetric). |
Source: AMC Mining Consultants (Canada) Ltd. using data provided by Osgood Mining Company LLC
| 11.9 | GRE Discussion on QA/QC |
The in-house QA/QC procedures for Granite Creek Mine Project (between 2005 and 2015) were reviewed. This review included:
| • | a considerable quality of data analysis and validation work performed by AMC in prior technical reports (AMC, 2020), (AMC, 2019) |
| • | a review of available data, checked against the Granite Creek Mine Project database. |
This review generated the following discussion and analysis.
| 11.9.1 | GRE Discussion on CRMs |
A total of 1,081 CRMs were inserted into the sample stream from 2005 to 2015 drilling campaigns program, including 555 CRMs by Atna in 2005, 2006, 2013, and 2015 and 526 CRMs by Barrick in 2007, 2008, and 2012. A total of 37 different CRMs were used at the property between 2005 and 2015 (see Table 11-8).
Figure 11-1 shows a scatter plot of the certified value for each assay standard compared to the assay value obtained. The laboratory’s analytical results generally correlate well with the standard values with few outliers. A 45-degree line represents an excellent correlation between the standard assay certified value and actual assay results. This line passes through all of the sample sets, with the majority of the points directly adjacent to the line, indicating acceptable accuracy performance for the standards. Larger scatter is seen as the grade of the samples increases. The increase in scatter is within an acceptable range in the opinion of the QP.
| | 11/8/2021 |
Granite Creek Mine Project
Premier Gold Mines Limited/i-80 Gold Corp. | Page 108
PEA NI 43-101 Technical Report |
Figure 11-1: Assay Standard Results (2005-2015)

In addition to control charts contained in (AMC, 2020), Dr. Samari of GRE selected some additional control charts to monitor the analytical performance of an individual CRM over time and to validate prior conclusions Control lines are also plotted on the chart for the expected value of the CRM, two standard deviations above and below the expected value, and three standard deviations above and below the expected value. CRM assay results are plotted in order of analysis. Control charts at various grades for the two main campaigns of work are presented for select CRMs (outlined in Table 11-8) in Figure 11-2 to Figure 11-7.
Table 11-8: CRMs Selected by GRE for Control Charts
| CRM | Au Value (ppm) | No. CRMs | Campaign |
| OxG60 | 1.025 | 36 | 2007-2009 |
| OxI54 | 1.868 | 40 | 2007-2009 |
| OXL25 | 5.852 | 54 | 2005-2006 |
| SG31 | 0.996 | 41 | 2007-2009 |
| SJ32 | 2.645 | 36 | 2007-2009 |
| SQ18 | 30.49 | 36 | 2005-2006 |
| | 11/8/2021 |
Granite Creek Mine Project
Premier Gold Mines Limited/i-80 Gold Corp. | Page 109
PEA NI 43-101 Technical Report |
Figure 11-2: CRM OxG60 (2007 - 2009) FA-ICP-ES
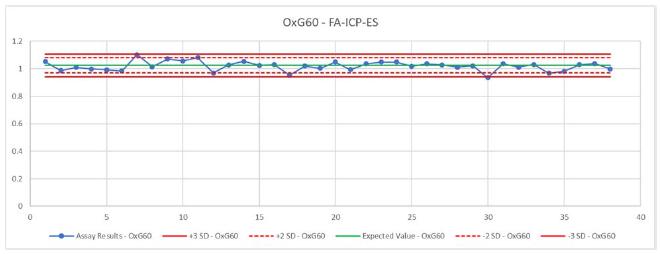
Figure 11-3: CRM OxI54 (2007 - 2009) FA-ICP-ES
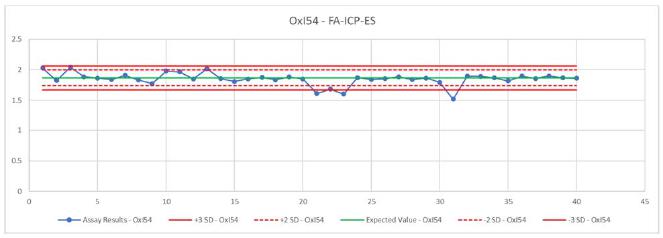
Figure 11-4: CRM OXL25 (2005 - 2006) FA-GRAV
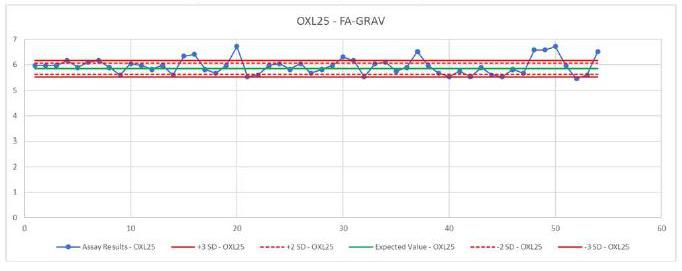
| | 11/8/2021 |
Granite Creek Mine Project
Premier Gold Mines Limited/i-80 Gold Corp. | Page 110
PEA NI 43-101 Technical Report |
Figure 11-5: CRM SG31 (2007 - 2009) FA-ICP-ES

Figure 11-6: CRM SJ32 (2007 - 2009) FA-ICP-ES
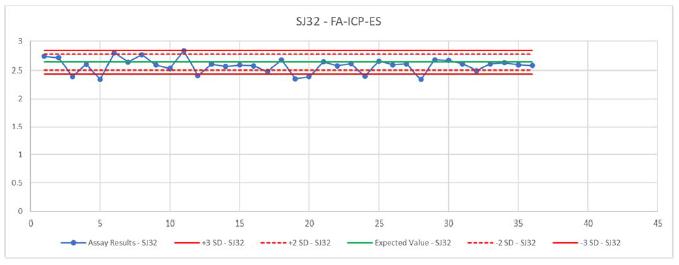
Figure 11-7: CRM SQ18 (2005 - 2006) FA-AAS
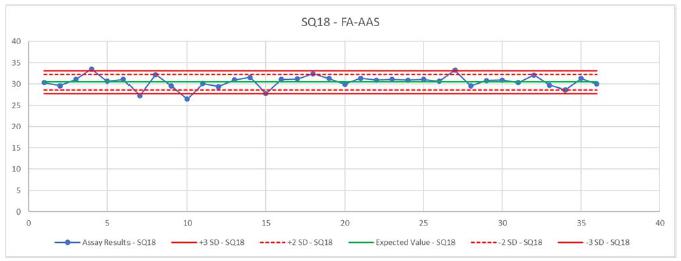
In general, CRMs show reasonable analytical accuracy but relatively poor precision when compared against the certified standard deviation. This poor precision occurs in a number of CRMs from two laboratories over a period of four years. At this time, it is not possible to definitely determine the cause of CRM high failure rate.
| | 11/8/2021 |
Granite Creek Mine Project
Premier Gold Mines Limited/i-80 Gold Corp. | Page 111
PEA NI 43-101 Technical Report |
| 11.9.2 | GRE Discussion on Blanks |
Dr. Samari of GRE reviewed and checked all blank samples in the database provided by i-80. Figure 11-8 shows the assay results of the blanks used in the QA/QC program between 2005 and 2008. A total of 1,249 blanks returned 270 excursion values, with a maximum value of 1.02 ppm Au. Apart from four samples, the remaining samples are below the probable lower limit of the cutoff grade. 78.4% of the samples are below the detection limit. The Dr. Samari believes the results indicate there is no artificially-introduced contamination in the sampling preparation process that would materially affect the mineral resource estimate.
Figure 11-8: Fire Assay Blank Samples (2005-2015)
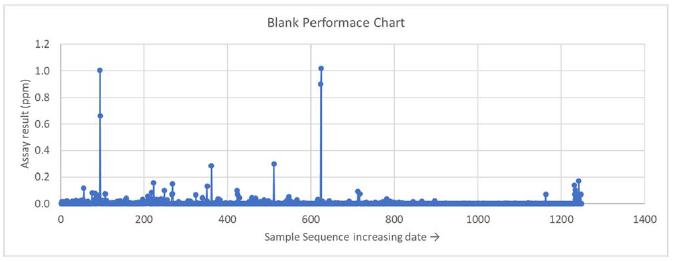
| 11.9.3 | GRE Discussion on Duplicates |
A total of 287 duplicate samples in the database provided by i-80 were checked by the QP. Figure 11-9 shows a comparison graph of the field duplicates. The scatter plots indicate some scatter in the data, with R2 values of 0.93. The scatter increases as the grade values increase but are still within acceptable ranges in the opinion of the QP.
| | 11/8/2021 |
Granite Creek Mine Project
Premier Gold Mines Limited/i-80 Gold Corp. | Page 112
PEA NI 43-101 Technical Report |
Figure 11-9: Laboratory Duplicate Comparison (2005-2015)
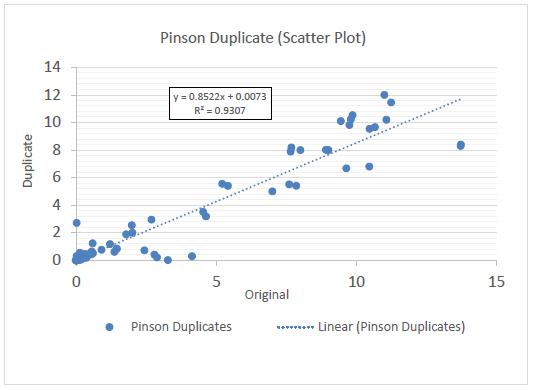
Drilling programs completed at the Property between 2005 and 2015 have included QA/QC monitoring programs that have incorporated the insertion of CRMs, blanks, and duplicates into the sample streams.
In 2021, the Dr. Samari of GRE QP reviewed all of AMC’s work on available QA/QC data between 2005 and 2015 (AMC, 2020). Dr. Samari of GRE also reviewed and checked QA/QC Procedures and the database provided by i-80. The Dr. Samari confirmed discussions and recommendations made in prior technical reports and noted the following:
| • | Formal, written procedures for data collection and handling should be developed and made available to PMC field personnel. These should include procedures and protocols for fieldwork, logging, database construction, sample chain of custody, and documentation trail. These procedures should also include detailed and specific QA/QC procedures for analytical work, including acceptance/rejection criteria for batches of samples. |
| • | A detailed review of field practices and sample collection procedures should be performed on a regular basis to ensure that the correct procedures and protocols are being followed. |
| • | Review and evaluation of laboratory work should be an on-going process, including occasional visits to the laboratories involved. |
In general, the QA/QC sample insertion rates used fall below general accepted industry standards. For future exploration campaigns, standards, blanks, and duplicates including one standard, one duplicate, and one blank sample should be inserted every 20 interval samples, as is common within industry standards.
| | 11/8/2021 |
Granite Creek Mine Project
Premier Gold Mines Limited/i-80 Gold Corp. | Page 113
PEA NI 43-101 Technical Report |
CRM samples show a reasonable level of accuracy but poor to moderate precision when using standard deviations provided by the CRM supplier. A maximum of three to five different CRM samples would be adequate to monitor laboratory performance at the approximate cut-off grades, average grades, and higher grades of the deposits.
Blank sample results are considered acceptable and suggest no systematic contamination has occurred throughout the analytical process.
Duplicate sample results show suboptimal performance, which may be a result of the heterogenous nature of mineralization, uncrushed samples, and sampling variance. Overall duplicate samples appear to be positively biased, with duplicate results returning higher grade than original samples.
Previous reporting suggests that umpire sampling has been completed at the Property. The results of this sampling were not available in the drillhole database and therefore the QP was not able to assess accuracy of the primary laboratory.
Although it is not possible to guarantee that there are no material impacts on the local scale, overall, based on the checking and reviewing the previous technical report dated 2020, the Dr. Samari considers the assay database to be acceptable for Mineral Resource estimation.
| | 11/8/2021 |
Granite Creek Mine Project
Premier Gold Mines Limited/i-80 Gold Corp. | Page 114
PEA NI 43-101 Technical Report |
The QPs are aware of the data verification requirements in Section 3.2 of NI 43-101. The following text describes the activities performed and methods employed to personally verify the data that forms the foundation of the report. In summary, these methods included an on-site inspection of the project site and chip tray storage facility, check sampling, and manual auditing of the project database. The QPs noted no limitations nor failures to verify data.
| 12.1 | GRE Site Inspection (2021) |
GRE’s QPs Dr. H. Samari, T. Lane, L. Breckenridge, and R. Mortiz conducted an on-site inspection of the project on April 20, 2021.
While on-site, Dr. Samari conducted a general geological inspection of the Pinson area, including visual inspection of key geologic formations, lithologies, structural geology, and mineralization. Dr. Samari checked all lithologies on the ground with the latest prepared geologic maps prepared by Osgood (2016).
At the time of site visit, entire core boxes of four holes, BMAG-019C, BMAG-020C, UGOG-017, and UGOG-034, were ready to be inspected by the Dr. Samari. RC and core samples are stored at the Pinson site in the open space with thick water-resistant covers (see Photo 12-1).
Photo 12-1: Core Boxes Are Stored at the Pinson Site
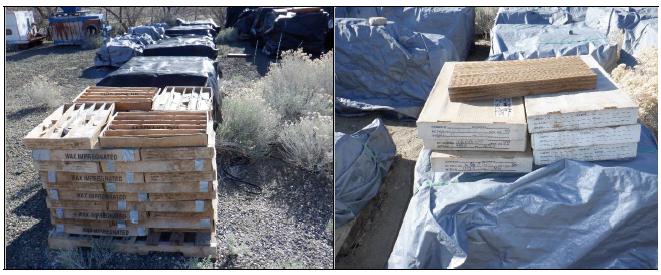
| 12.2 | Visual Sample Inspection and Check Sampling |
During the site visit on April 20, 2021, about 752 RC and core sample intervals from four separate drill holes, BMAG-019C, BMAG-020C, UGOG-017, and UGOG-034, were selected for visual inspection based on a review of the drill hole logs. The samples inspected accurately reflect the lithologies and sample descriptions recorded on the associated drill hole logs and within the project database.
In 2021, to verify the assay results, Dr. Samari collected a total of seven check samples (from four separate drill holes: BMAG-019C, BMAG-020C, UGOG-017, and UGOG-034) and two surface samples. All samples were bagged and labeled by the Dr. Samari. Samples were packed and delivered by Dr. Samari the QP to Hazen Research Inc. (Hazen) in Golden, Colorado, USA (Photo 12-2).
| | 11/8/2021 |
Granite Creek Mine Project
Premier Gold Mines Limited/i-80 Gold Corp. | Page 115
PEA NI 43-101 Technical Report |
On May 03, 2021, GRE received Hazen’s analytical report on nine selected samples by fire assay method for both gold and silver. The certificate of analysis from Hazen is given in Table 12-1. Except for sample UGOC-034-528-531, with an amount of 20 ppm silver, other samples showed less than three ppm of Ag.
A comparison of the original versus check assay values for the seven core samples shows good correlation between the results, with an R2 of 0.9944 (Figure 12-1). Standard t-Test statistical analysis was completed to look for any significant difference between the original and check assay population means. The results of the t-Test showed no statistically significant difference between the means of the two trials (original versus check assay).
Photo 12-2: Sample Intervals Selected for Check Assay
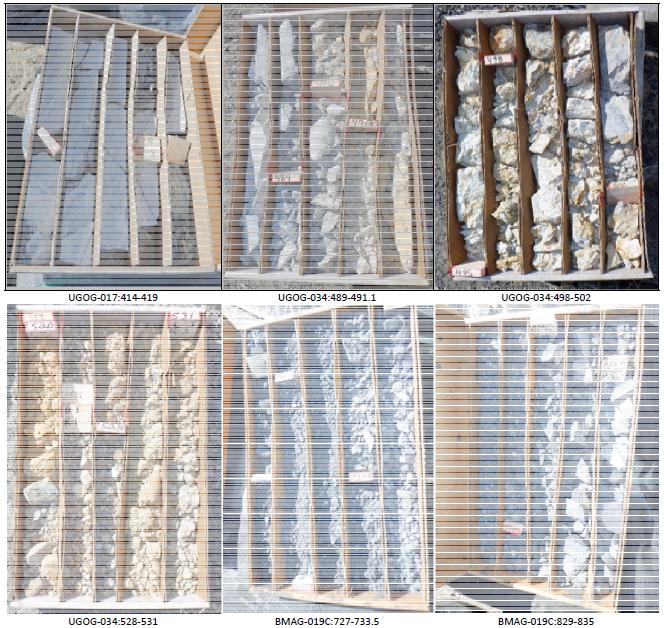
| | 11/8/2021 |
Granite Creek Mine Project
Premier Gold Mines Limited/i-80 Gold Corp. | Page 116
PEA NI 43-101 Technical Report |
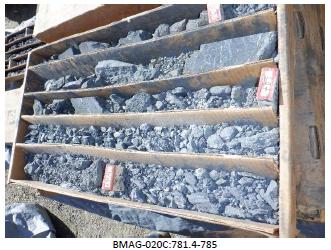
Table 12-1: Summary Table of Hazen Results with Original Assays
| No. | Sample No. | Type of Sample | Original Au Assay ppm | Hazen Au Assay ppm |
| 1 | UGOC-034-489-491.1 | Core | 27.497 | 23.7 |
| 2 | UGOC-034-498-502 | Core | 10.697 | 9.9 |
| 3 | UGOC-034-528-531 | Core | 25.851 | 26.0 |
| 4 | UGOC-017-414-419 | Core | 1.24 | 1.5 |
| 5 | BMAG-019-727-733.5 | Chip | 2.8389 | 2.6 |
| 6 | BMAG-019-829-835 | Chip | 0.0309 | <0.2 |
| 7 | BMAG-020-781.4-785 | Chip | 2.844 | 3.0 |
| 8 | GRE-R.S.S.1-St.3 | Surface sample (Chip) | - | <0.2 |
| 9 | GRE-R.S.S.2-St.6 | Surface sample (Chip) | - | <0.2 |
Figure 12-1: Sample Correlation Plot
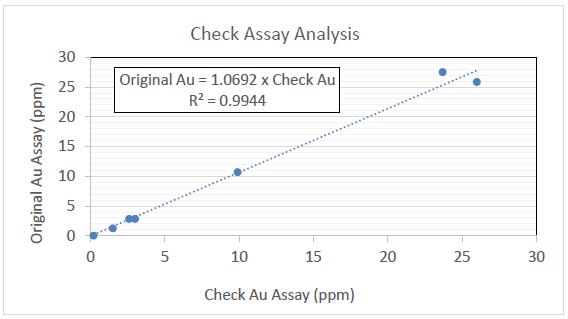
Two surface rock chip samples, GRE-R.S.S.1 and GRE-R.S.S.2, were taken by the Dr. Samari from the upper Comus formation (gray shale) and lower Comus formation (gray limestone), respectively (Photo 12-3). The assays show that when these two formations, which are the main gold deposit targets within the property, are not affected by faults, alterations, and mineralization conditions, they are barren (see Table 12-1). The result emphasizes that mineralization on the Property exhibits strong structural control.
| | 11/8/2021 |
Granite Creek Mine Project
Premier Gold Mines Limited/i-80 Gold Corp. | Page 117
PEA NI 43-101 Technical Report |
Photo 12-3: The Location of Two Surface Rock Chip Samples, the Upper Comus Formation (GRE-R.S.S.1-St.3, left) and the Lower Comus Formation (GRE-R.S.S.2-St.6, right)
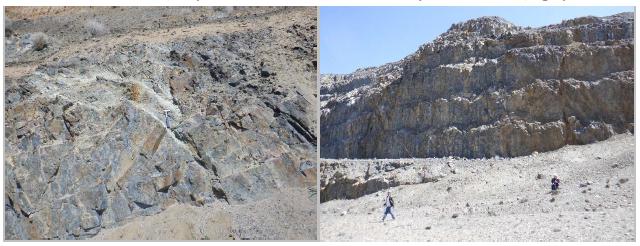
| 12.3 | QP Opinions on Adequacy |
Based on their area of expertise, the QPs present the following opinions on data verification and adequacy.
| 12.3.1 | Verification by Dr. Hamid Samari - Geology QP |
Based on the review of the project database and all existing project documents, and the QP’s observations of the geology and mineralization at the project during the site visit, Dr. Samari considers the lithology, mineralization, and assay data contained in the project database to be reasonably accurate and suitable for use in estimating mineral resources.
| 12.3.2 | Verification by Dr. Todd Harvey and Mr. Rick Moritz - Metallurgy QPs |
Dr. Todd Harvey and Rick Moritz - the Metallurgy QPs believe that the metallurgical testing was completed for the Getchell project by a number of well-known commercial metallurgical laboratories and by Granite Creek Mine operations. Dr. Harvey and Mr. Moritz reviewed the sample selection and compositing used in the metallurgical test work and found that the selection of samples was representative for this type of deposit and geology, and Mr. Moritz visited the site on April 20, 2021. The QPs found the metallurgical testwork and samples to be representative spatially with a spread of grades from very low grade to high grade that is typical for the grades found in the Pinson deposit. Dr. Harvey and Mr. Moritz also reviewed the process for preparing sample composites and found the selection of fresh core to be suitable for this level of study. Dr. Harvey and Mr. Moritz, while performing their data analysis, performed several mathematical tests to validate the metallurgical balances presented in the test work and they found the data presented in the metallurgical reports to be consistent with practices performed by reputable independent test laboratories. A complete discussion of the test work is provided in Section13.0. Though much of the work is historical in nature, the work appears to be professionally completed and is well documented, is supported by production data, and is suitable for estimation of heap leach. CIP, and toll autoclave mill gold recovery calculations in this PEA.
| | 11/8/2021 |
Granite Creek Mine Project
Premier Gold Mines Limited/i-80 Gold Corp. | Page 118
PEA NI 43-101 Technical Report |
| 12.3.3 | Verification by Ms. Terre Lane - Mine Planning and Evaluation QP |
Mining and processing methods, costs and infrastructure needs were verified by comparison to other similar sized open pit heap leach mines operating in the western USA and experience of the QPs, (Ms. Lane, Dr. Harvey, and Mr. Moritz). Costs were developed from vendor quotations and comparisons to published and internal data used by the QPs in the preparation of similar studies. Not all costs were competitively bid but were benchmarked to similar nearby operations, and unit costs of major consumables were also benchmarked to nearby operations. Other cost data used in the report was sourced from the most resent Infomine cost data report. All costs used in the analysis were verified and reviewed by Ms. Lane and were assessed to be current and appropriate for use. Finally, after the economic study was performed, the overall operating costs for different aspects of the operation (mining, process, and general & admin) were benchmarked against similar sized mines and recent feasibility studies to determine if they were similar; the results did benchmark well to other operations and economic studies.
The taxation rates used and applied were values available from US government sources at the time of the economic analysis.
Ms. Lane of GRE viewed and measured slope of existing pit walls during the April 20, 2021, site visit and viewed core photos to determine appropriate pit slopes. The pit slopes are further supported by similar deposits having moderate pit depths.
The topography used in the pit designs was provided as a detailed lidar survey and was reviewed in comparison to local topography available on the Internet such as Google Earth and the US Geological Survey’s web site.
| 12.3.4 | Verification by Mr. Larry Breckenridge - Environmental QP |
Due to the preliminary nature of the PEA, GRE environmental engineers did not perform a quality control check on prior environmental data and water samples. However, GRE confirmed that the site is in full compliance with stormwater discharge permits, air quality permits, quarterly monitoring requirements, and other Nevada State environmental permits. Many of these permits require specific data QA/QC procedures including duplicate samples, matrix spike samples, and field blanks. As a result, GRE infers that the environmental data collected thus far meets all State of Nevada data quality requirements. A further examination of the environmental data quality should be included in the next phase of engineering study.
| | 11/8/2021 |
Granite Creek Mine Project
Premier Gold Mines Limited/i-80 Gold Corp. | Page 119
PEA NI 43-101 Technical Report |
| 13.0 | MINERAL PROCESSING AND METALLURGICAL TESTING |
Multiple metallurgical programs were completed from 1999 to 2013. These programs were completed by Dawson Metallurgical Labs and McClelland Labs. The work was commissioned by both Homestake Mining and Atna. The test programs included cyanide solubility testing, pregnant solution robbing testing, bottle roll testing, percolation column testing, carbon-in-leach (CIL) testing and autoclave testing. The last metallurgical testing on the project was completed in 2013.
The Granite Creek Mine was an operating open pit mine, processing oxide material using both heap leaching and conventional milling from 1980 to 1999. Although some of the resource at Pinson is similar to the historically processed material, for the most part, the material is more difficult to treat than the historic oxide material. Atna mined high grade mineralized material from the Ogee underground deposit between 2012 and 2013. This material was treated at the Twin Creeks autoclave facility under a toll treatment agreement. The Twin Creeks facility was previously operated by Newmont Mining and is now operated by Nevada Gold Mines, a Newmont / Barrick joint venture of which Barrick is the operating partner.
The Author has reviewed the historical metallurgical testwork programs on Pinson feed material including:
| • | Report on Heap Leach, Direct and CIL Cyanidation, and “Preg-Robbing” Tests - Various Mag Pit Samples and Composites, and CX Pit Bulk Material, MLI Job No. 2532, Addendum, and Change Orders #1, #2, and #3, March 1999. (McClelland, 1999a) (Homestake) |
| • | Report on Column Heap Leach Testing, Pinson CX Pit Material Bulk Samples, MLI Job No. 2630, June 1999 (McClelland, 1999b) (Homestake) |
| • | Summary Report on Material Variability Testing - Mag Pit Pinson Drill Core Composites, MLI Job. No. 3746, 7 February 2013. (McClelland, 2013) (Atna) |
| • | Summary Report on Heap Leach Cyanidation Testing - Mag Pit Pinson Drill Core Composites, MLI Job No. 3746, 16 January 2014. (McClelland, 2014) (Atna) |
| • | Pinson Underground Autoclave-Cyanide Leach Tests, DML P-2895A,B&C, April 14,2006. (Dawson, 2006a) (Atna) |
| • | Results of Sample Preparation and Head Analysis on Ogee Samples, DML P-2895D April 2006. (Dawson, 2006b) (Atna) |
| • | Wilmot Metallurgical Consulting Met Testwork Results Atna-Pinson Project, (no date) (Wilmot, 2006). |
| • | Dawson autoclave leach report, DML P-2895, final date November 3, 2005. (Dawson, 2005)(Atna) |
These reports are the basis for estimating recoveries for the various materials at the Pinson site, including the Mag Pit and CX Pit and Ogee underground. Recoveries used in support of the economic evaluation are detailed within the geometallurgical subsections within this Section 13. Due to the refractory nature of the Ogee material, Atna treated this material offsite at the Newmont Twin Creeks autoclave.
Tables are from various reports, and the units have been left as direct quotes.
| | 11/8/2021 |
Granite Creek Mine Project
Premier Gold Mines Limited/i-80 Gold Corp. | Page 120
PEA NI 43-101 Technical Report |
| 13.2 | McClelland Laboratories, Inc. March and June 1999 |
During March and June of 1999, McClelland Laboratories completed a testwork program on samples sourced from the Mag Pit and CX Pit on behalf of Homestake Mining. The program was described as a multiphase program testing various Mag Pit bulk high grade samples, core and cuttings composites, and a CX Pit bulk material sample. The results were reported under two different McClelland labs job numbers: #2630 and #2532 (McClelland, 1999a; McClelland, 1999b).
Bulk material samples from Mag Pit (Mag Pit I to Mag Pit VI) and CX pit were tested for the following items:
| • | Pregnant solution robbing (preg-robbing) tests to establish preg-robbing characteristics |
| • | pH control tests to determine lime requirements for subsequent agitated cyanidation tests and column percolation leach tests |
| • | Direct and CIL Cyanidation tests on the CX Pit (CX-2) bulk material sample to confirm the non-preg-robbing character of the material |
| • | Column percolation leach tests on the Mag Pit bulk material samples at 4-inch size and on the CX bulk material sample at three different feed sizes: run-of-mine (ROM), 3-inch, and ¾-inch. |
Samples for the program were as follows:
| • | Six Mag Pit bulk material samples that were sampled from the pit. These samples were labeled as “Mag Pit I” through “Mag Pit VI”. The specific coordinates of these samples were not within the document. |
| • | One bulk material sample from the CX Pit labelled “C2.” The specific coordinates for this sample were not provided. |
| • | Six Mag Pit composites that were made up of drilled cuttings material. These were labeled as “Mag Pit Cuttings Composite 1” through “Mag Pit Cuttings Composite 6.” Drill hole and drill intervals were documented for all of these samples. |
| • | Five Mag Pit composites that were made up of drill core material. These were labelled as “Mag Pit Drillcore Composite 1” through “Mag Pit Drillcore Composite 5.” Drill hole and drill intervals were documented for all of these samples. |
| • | A Mag Pit master composite was made up of the Mag Pit drill core composites. All intervals and proportions of the composites were documented. |
The drillhole IDs and intervals used to make up the Mag Pit cuttings and drill core composites are shown in Table 13-1.
Table 13-1: Mag Pit Composites for 1999 Testwork Program
| Sample Description | Drill Hole Identification | Intervals |
| Mag pit cuttings composite 1 | HPC - 129 | 505 to 555, 600 to 615 |
| Mag pit cuttings composite 2 | HPC - 109 | 155 to 165 |
| Mag pit cuttings composite 2 | HPC - 129 | 190 to 200 |
| Map pit cutting composite 3 | HPC 129 | 455 to 465, 490 to 495, 570 to 580, 585 to 590 |
| | 11/8/2021 |
Granite Creek Mine Project
Premier Gold Mines Limited/i-80 Gold Corp. | Page 121
PEA NI 43-101 Technical Report |
| Sample Description | Drill Hole Identification | Intervals |
| Mag pit cutting composite 4 | HPC - 109 | 255 to 275, 280 to 290, 310 to 320 |
| Mag pit cutting composite 5 | HPC -129 | 210 to 220, 255 to 270, 275 to 285, 470 to 485 |
| Mag pit cutting composite 5 | HPC 109 | 200 to 205, 215 to 235 |
| Mag pit cutting composite 6 | HPC 109 | 275 to 280, 290 to 295, 300 to 305, 320 to 340, 345 to 350, 360 to 370 |
The Mag Pit master composite was created using material from Mag pit cutting composite 1 to Mag pit cutting composite 6. The material was blended using 11.6% of Mag Pit 1 sample, 21.7% of Mag Pit 2, 14.5% of Mag Pit 3, 24.6% of Mag Pit 4, and 27.6% of Mag Pit 5.
Preg-robbing tests were completed on some of the samples to determine the preg-robbing characteristics of the Mag Pit and CX Pit samples. In these tests, barren solutions were “spiked” with a diluted gold solution to create a 1 ppm gold solution. The donor solution was a barren solution from column leaching of oxide materials. A standard cyanide leach bottle roll test with a 1 kilogram (kg) rock charge was completed on the slurry with the spiked solution. The pregnant leach solution was then assayed for gold at 2, 6, 24, 48, 72, and 96 hours. The percentage of gold that was preg-robbed was determined by the following formula:
| Original gold solution concentration ‐ Final gold solution concentration |
| Original gold solution concentration (%) |
Preg-robbing testwork completed in this manner does not account for any dissolution of gold from the 1 kg rock charge; it only takes into account gold loss from the spike solution. Typically, tests are conducted first (base case) without spiking to determine how much gold will be dissolved, if any. The test is then repeated with the spiked solution, and the base test gold dissolution is included within the preg-rob calculation.
Table 13-2 shows the percentages of preg-robbed gold. Negative values indicate where the final gold concentration was higher than the original gold concentration. Cyanide is destroyed in the 1 ppm gold solution prior to conducting the test. Some samples have negative preg-robbed values. These samples leach gold during the test. This is most likely due to the presence of Weak Acid Dissociable cyanide which was not destroyed and yet available for continued leaching of the material during the bottle roll test.
Table 13-2: Preg-Robbing Test Results from the 1999 Testwork Program
| Sample | Sample Type | Feed Size | Preg-robbed Gold (%) |
| Mag Pit I | Bulk High Grade Material | P80 ¾-inch (19 millimeter [mm]) | 87.9% |
| Mag Pit II | P80 3/4-inch (19 mm) | 76.6% |
| Mag Pit III | P80 3/4-inch (19 mm) | -8.6% |
| Mag Pit IV | P80 3/4-inch (19 mm) | 76.0% |
| Mag Pit V | P80 3/4-inch (19 mm) | -8.6% |
| Mag Pit VI | P80 3/4-inch (19 mm) | -5.0% |
| CX-2 | P80 3/4-inch (19 mm) | -31.0% |
| Mag Pit cuttings composite 1 | Drill core | 10 Mesh (1.7 mm) | 14.1% |
| | 11/8/2021 |
Granite Creek Mine Project
Premier Gold Mines Limited/i-80 Gold Corp. | Page 122
PEA NI 43-101 Technical Report |
| Sample | Sample Type | Feed Size | Preg-robbed Gold (%) |
| Mag Pit cuttings composite 2 | Drill core | 10 Mesh (1.7 mm) | 14.9% |
| Mag Pit cuttings composite 3 | Drill core | 10 Mesh (1.7 mm) | 15.5% |
| Mag Pit cuttings composite 4 | Drill core | 10 Mesh (1.7 mm) | 19.1% |
| Mag Pit cuttings composite 5 | Drill core | 10 Mesh (1.7 mm) | 60.5% |
| Mag Pit cuttings composite 6 | Drill core | 10 Mesh (1.7 mm) | 47.4% |
Table 13-2 shows that many of the samples had relatively high preg-robbing values (greater than 50%), demonstrating that preg-robbing is a significant issue when processing some Pinson material.
Plotting of preg-robbed percentage vs. the Total Organic Carbon (TOC) of the feed material shows a trend. However, the correlation is not statistically significant. Additional metallurgical work might better define a mathematical relationship between TOC and preg-robbing. Predictors of recovery as they relate to Pinson and the currently available metallurgical data base is discussed within the geometallurgical section.
Cyanide leach bottle roll tests were completed on the Mag Pit bulk material samples using caustic soda (NaOH) to adjust pH, rather than hydrated lime. The testwork report postulated that NaOH passivates the preg-robbing (carbonaceous) surfaces by occupying active carbon sites with hydroxide (OH-)ions so the gold cyanide complex Au(CN)2- ions do not absorb onto the active carbon sides. Reducing the amount of Au(CN)2- ions which absorb onto the carbon sites would improve gold recovery. For each sample, two tests were conducted: at pH 10.5 and pH 12 (using NaOH to adjust pH). The results of these tests are shown in Table 13-3.
The test data shows an increase in recovery with higher pH as well as a reduction in cyanide consumption. The reduced cyanide consumption is most likely a direct result of the increase in pH.
Generally, the largest recovery increases between the pH 12.0 tests and the pH 10.5 tests were associated with samples that showed the highest preg-robbed gold. This would indicate the OH- ions are passivating sites on the available pre-robbing carbon and preventing the uptake of gold. No tests were completed using lime. Some gold processing facilities have had demonstrated success using a lime-boil for similar issues.
There were no baseline tests using lime on these samples, so a proper comparison between the use of lime and NaOH cannot be completed.
Table 13-3: NaOH Bottle Roll Tests from 1999 Testwork Program
| Sample | Preg-robbing Factor (%) | NaOH Tests |
| pH 10.5 Tests | pH 12.0 Tests | Difference in Gold Recovery between pH 12.0 Tests and pH 10.5 Tests |
| Gold Recovery (%) | Cyanide Consumption (pound [lb]/short ton) | Gold Recovery (%) | Cyanide Consumption (lb/short ton) |
| Mag Pit I | 87.9% | 8.5% | 1.1 | 32.0% | 1.0 | 23.5% |
| Mag Pit II | 76.6% | 13.2% | 3.0 | 24.7% | 1.5 | 11.5% |
| Mag Pit III | -8.6% | 74.2% | 1.4 | 83.6% | 0.7 | 9.4% |
| | 11/8/2021 |
Granite Creek Mine Project
Premier Gold Mines Limited/i-80 Gold Corp. | Page 123
PEA NI 43-101 Technical Report |
| Mag Pit IV | 76.0% | 26.4% | 1.6 | 40.8% | 0.5 | 14.4% |
| Mag Pit V | -8.6% | 50.0% | 1.8 | 53.8% | 0.4 | 3.8% |
| Mag Pit VI | -5.0% | 62.2% | 1.1 | 65.0% | 0.3 | 2.8% |
CIL tests were completed on the CX-2 bulk material and Mag Pit cuttings samples. The objective of these tests was to test the applicability of CIL processes to Pinson open pit material. The CIL process is used to help in overcoming the impact of the organic pre-robbing carbon that is naturally occurring in some of the Pinson material. The conditions of these tests were:
| • | Tests were conducted in agitated bench-scale beakers |
| • | Samples were ground to a P80 of 200 mesh (75 microns [µm]) |
| • | Kinetic samples taken at 6 hours, 12 hours, 24 hours, 36 hours, and 48 hours |
| • | Hydrated lime was added to raise the pH to 10.5 |
| • | A sodium cyanide (NaCN) concentration of 1 gram per litre (g/L) |
| • | Pulp density of 40% solids weight for weight (w/w) |
| • | Activated carbon was added to absorb the gold in solution onto the carbon. |
The results of these tests are shown in Table 13-4.
Table 13-4: CIL Tests from 1999 Testwork Program
| Sample | Gold Recovery
(%) | Cyanide Consumption
(lb/short ton) | Preg-Robbing (%) |
| CX-2 Bulk ore | 88.2% | 2.4 | -31.0% |
| Mag Pit cuttings composite 1 | 94.4% | 3.3 | 19.0% |
| Mag Pit cuttings composite 2 | 75.3% | 2.3 | 16.7% |
| Mag Pit cuttings composite 3 | 59.7% | 3.0 | 23.0% |
| Mag Pit cuttings composite 4 | 82.9% | 4.8 | 25.4% |
| Mag Pit cuttings composite 5 | 55.0% | 3.0 | 65.9% |
| Mag Pit cuttings composite 6 | 87.5% | 3.9 | 54.0% |
With the exception of Mag Pit 3 and Mag Pit 5 samples, these tests generally achieved high gold recoveries. When comparing the preg-robbing value to the CIL gold recovery, it can be seen there is not a strong correlation between the two values. There could be some sulfide refractory material present which is contributing to the refractory nature. CIL processes would be applicable to Pinson material.
Column leach tests were conducted on some of the samples from the 1999 program. Sixteen columns were completed representing 11 different samples. The samples were from the Mag Pit, bulk samples and core, and bulk samples from the CX Pit. The conditions of these tests were:
| • | Leach time of between 50 and 90 days. If the kinetic leach curve demonstrated that a test was approaching terminal gold recovery, the test was stopped. |
| | 11/8/2021 |
Granite Creek Mine Project
Premier Gold Mines Limited/i-80 Gold Corp. | Page 124
PEA NI 43-101 Technical Report |
| • | Hydrated lime was added to agglomerate the material in the column. |
| • | Lime was added to most tests to raise the pH to 10.5. |
| • | NaOH was added to the Mag Pit I and Mag Pit II samples, given the successful NaOH bottle roll tests on these samples. The pH was initially 10.5 but was increased to 12.0 later in the test to ascertain the impact on leaching. |
| • | NaCN was added at an initial concentration of 1 g/L and was pumped into the columns at a rate of 0.005 gpm per square foot (/ft2) of cross-sectional area. |
| • | Three tests with varying particle sizes were conducted on the CX Pit sample to ascertain the impact of crush size on gold recovery. |
Three tests were conducted on the Mag Pit master composite where pH and alkali were varied:
Table 13-5 shows the results from the from the 1999 column leach tests.
Table 13-5: Column Leach Tests from April 1999 Testwork Program
| Sample | Sample Type | Feed Size (inches) | Gold Recovery | Cyanide Consumption (lb/short ton) | Lime Consumption (lb/ short ton) |
| Mag Pit I | Bulk High-Grade Material | -4 | 18.8% | 9.9 | 5.2 |
| Mag Pit II | -4 | 35.3% | 9.0 | 10.2 |
| Mag Pit III | -4 | 93.1% | 4.6 | 5.2 |
| Mag Pit IV | -4 | 49.5% | 5.3 | 12.0 |
| Mag Pit V | -4 | 51.7% | 3.9 | 2.5 |
| Mag Pit VI | -4 | 60.7% | 3.7 | 4.0 |
| Mag Pit 2 | Drill core | -1 | 69.0% | 4.0 | 11.0 |
| Mag Pit 3 | Drill core | -1 | 62.0% | 1.6 | 9.6 |
| Mag Pit 4 | Drill core | -1 | 47.9% | 1.5 | 8.1 |
| Mag Pit 5 | Drill core | -1 | 61.7% | 2.1 | 10.0 |
| Mag Pit master (pH 10.5, Lime) | Drill core | -1 | 65.0% | 6.3 | 8.4 |
| Mag Pit master (pH 11.8, Lime) | Drill core | -1 | 70.7% | 4.2 | 19.3 |
| Mag Pit master (pH 11.8, NaOH) | Drill core | -1 | 69.0% | 3.5 | n/a |
| CX Pit, CX-2 | Bulk ore | -6 | 77.7% | 5.1 | 3.0 |
| CX Pit, CX-2 | Bulk ore | P80 3 | 81.7% | 4.8 | 3.0 |
| CX Pit, CX-2 | Bulk ore | P80 ¾ | 82.2% | 5.4 | 3.0 |
This testwork program had the following findings:
| • | There was a wide range of gold recoveries, varying from 19% to 93% |
| • | The bulk sample tested from the CX Pit showed near 5% improvement in recovery when crushing from 6 inches to ¾ inch. There was very little difference in recovery between the 3 inch and ¾ inch size, less than 1%. |
| | 11/8/2021 |
Granite Creek Mine Project
Premier Gold Mines Limited/i-80 Gold Corp. | Page 125
PEA NI 43-101 Technical Report |
The tests on the Mag Pit master composite sample had the following conclusions:
| • | Increasing pH demonstrated an increase in gold recovery |
| • | The NaOH and the lime test (pH 11.8) had a slightly less than 2% recovery difference. |
McClelland reported on an additional column leach test program in June 1999. The materials were all from the CX Pit area. Coordinates within the pit were not provided, although it appears a bench elevation within the pit was provided for each sample. Three bulk samples, 4840-Silty, 4840-Clay Ore and 4680-Typical CX-4, were tested at a 100% passing 1-inch crush size in percolation columns. The materials leach very well and rapidly. The majority of the leaching was complete in 30 days. The samples were run from 78 to 95 total days, which included leaching and washing.
Table 13-7 Column Leach Tests from June 1999 Testwork Program
| Sample | Sample Type | Column Feed Size | Gold Recovery | Cyanide Consumption (lb/short ton | Lime Consumption (lb/short ton) | Final pH | Calculated Head opt |
| 4840 Silty | Bulk Material | P100 1-inch | 91.9% | 3.16 | 3 | 10.1 | 0.111 |
| 4840 Clay Ore | Bulk Material | P100 1-inch | 95.6% | 2.36 | 3 | 9.4 | 0.110 |
| 4680 Typical CX-4 | Bulk Material | P100 1-inch | 94.2% | 2.73 | 3 | 10.9 | 0.119 |
McClelland noted in the final report that the Silty and Clay Ore materials demonstrated moderate to severe percolation issues. Agglomeration was recommended for commercial heap leaching operations. During the column testing, the pH levels were lower than desired. Additional lime, above 3 pounds per short ton, will be necessary to keep cyanide consumption to a minimum. For typical column leaching, the cyanide consumption is high. The CX materials are very amenable to heap leaching.
| 13.3 | McClelland Laboratories Inc 2013 & 2014 |
Atna commissioned a number of metallurgical testwork programs to be completed on Pinson samples.
| 13.3.1 | Atna Resources Ltd. |
McClelland Laboratories completed a metallurgical testwork program on Mag Pit samples on behalf of Atna in 2013 and 2014.
The 2013 program used a total of 32 drill core composite samples. The samples were well identified as to the drill hole and down-hole depth. Detailed head analysis, ICP scan, carbon and sulfur speciation analysis and preg-robbing tests were completed on the 32 samples.
Bottle roll tests were completed in pairs, with one being 80% ¼-inch and the second as a 150 Mesh sample. The intent of the program was to complete an evaluation of the impact of feed size, potential for heap leaching, and especially testing for preg-robbing problems associated with the Pinson materials.
| | 11/8/2021 |
Granite Creek Mine Project
Premier Gold Mines Limited/i-80 Gold Corp. | Page 126
PEA NI 43-101 Technical Report |
A summary of the drillholes and intervals used to make up the samples for this program are shown in Table 13-6. This is sourced from the appendix within the McClelland 2013 report (McClelland, 2013).
Table 13-6: Sample Composite List from 2013 Testwork Program
| Drillhole | Sample | Interval |
| To (ft) | From (ft) |
| Magmet-001 | Magmet-001-01 | 0.0 | 27.5 |
| Magmet-001-02 | 27.5 | 99.5 |
| Magmet-001-03 | 99.5 | 157.0 |
| Magmet-001-04 | 170.5 | 228.5 |
| Magmet-001-05 | 228.5 | 251.5 |
| Magmet-001-06 | 251.5 | 302.5 |
| Magmet-001-07 | 302.5 | 364.5 |
| Magmet-001-08 | 364.5 | 415.5 |
| Magmet-002 | Magmet-002-01 | 211.5 | 254.5 |
| Magmet-002-02 | 254.5 | 292.0 |
| Magmet-002-03 | 292.0 | 337.0 |
| Magmet-002-04 | 337.0 | 397.0 |
| Magmet-002-05 | 397.0 | 446.0 |
| Magmet-002-06 | 450.0 | 497.0 |
| Magmet-002-07 | 497.0 | 567.5 |
| Magmet-002-08 | 567.5 | 599.8 |
| Magmet-003 | Magmet-003-01 | 179.0 | 225.0 |
| Magmet-003-02 | 225.0 | 283.0 |
| Magmet-003-03 | 283.0 | 304.5 |
| Magmet-003-04 | 304.5 | 361.5 |
| Magmet-003-05 | 361.5 | 409.0 |
| Magmet-003-06 | 409.0 | 459.5 |
| Magmet-003-07 | 459.5 | 514.0 |
| Magmet-004 | Magmet-004-01 | 125.0 | 148.0 |
| Magmet-004-02 | 148.0 | 220.5 |
| Magmet-004-03 | 220.5 | 270.0 |
| Magmet-004-04 | 270.0 | 330.0 |
| Magmet-004-05 | 330.0 | 372.0 |
| Magmet-004-06 | 372.0 | 415.0 |
| Magmet-004-07 | 415.0 | 439.0 |
| Magmet-004-08 | 439.0 | 496.0 |
| Magmet-004-09 | 496.0 | 551.5 |
Cyanide leach bottle roll tests were conducted on Mag Pit samples. The objective of these tests was to identify the impact of particle size on gold recovery. The conditions for the bottle roll tests were:
| • | A pulp density of 40% solids w/w |
| • | pH was maintained between 10.8 to 11.2 using lime |
| • | NaCN was added at a concentration of 1 g/L |
| • | The bottle rolls were sampled at 6, 12, 24, 36, and 48 hours |
| | 11/8/2021 |
Granite Creek Mine Project
Premier Gold Mines Limited/i-80 Gold Corp. | Page 127
PEA NI 43-101 Technical Report |
| • | The tests were terminated at 48 hours and final analysis was completed |
Preg-rob factors were measured for each sample. The preg-robbing factor methodology was not presented within the laboratory report.
A summary of the results from the bottle roll tests is shown in Table 13-77.
Table 13-7: Bottle Roll Tests Results from 2013 Testwork Program
| Sample | Au head grade (oz/ton) | Preg-Rob Factor | Gold recovery (%) |
| P80 ¼-inch | 150 Mesh | Difference between 150
mesh test and P80 ¼-inch Test |
| Magmet-001-01 | 0.031 | 0 | 77.4% | 81.3% | 3.9% |
| Magmet-001-02 | 0.089 | 93 | 50.0% | 47.8% | -2.2% |
| Magmet-001-03 | 0.032 | 0 | 72.0% | 82.1% | 10.1% |
| Magmet-001-04 | 0.030 | 36 | 57.1% | 69.2% | 12.1% |
| Magmet-001-05 | 0.057 | 97 | 17.4% | 6.0% | -11.4% |
| Magmet-001-06 | 0.050 | 92 | 24.4% | 27.8% | 3.4% |
| Magmet-001-07 | 0.058 | 100 | 4.3% | 5.8% | 1.5% |
| Magmet-001-08 | 0.018 | 87 | 20.0% | 25.0% | 5.0% |
| Magmet-002-02 | 0.030 | 92 | 8.3% | 9.5% | 1.2% |
| Magmet-002-03 | 0.005 | 84 | 50.0% | 40.0% | -10.0% |
| Magmet-002-04 | 0.128 | 76 | 78.4% | 86.4% | 8.0% |
| Magmet-002-05 | 0.114 | 78 | 50.0% | 70.7% | 20.7% |
| Magmet-002-06 | 0.043 | 95 | 15.4% | 17.1% | 1.7% |
| Magmet-003-04 | 0.014 | 0 | 53.8% | 71.4% | 17.6% |
| Magmet-003-05 | 0.059 | 10 | 76.8% | 87.0% | 10.2% |
| Magmet-003-06 | 0.022 | 11 | 75.0% | 80.0% | 5.0% |
| Magmet-003-07 | 0.044 | 48 | 48.7% | 81.0% | 32.3% |
| Magmet-004-04 | 0.018 | 42 | 42.9% | 55.6% | 12.7% |
| Magmet-004-05 | 0.006 | 15 | 50.0% | 71.4% | 21.4% |
| Magmet-004-06 | 0.018 | 19 | 47.1% | 75.0% | 27.9% |
| Magmet-004-08 | 0.023 | 10 | 42.9% | 54.5% | 11.6% |
Some conclusions can be drawn from the results of the tests. The ¼-inch material had a recovery range from 4.3% to 78.4%, with an average of 45.8%. Gold recoveries for the 150 Mesh material ranged from 5.8% to 87.0% and averaged 52.9%. The recovery was not very sensitive to feed size considering the size difference.
McClelland stated the refractory nature of the Pinson material is poorly understood. Preg-robbing (PR factor) assay results indicate 11 of the 23 samples would be expected to exhibit moderate to severe preg-robbing character, PR factor >50%. There was not a good correlation obtained between recovery and PR factor. The presence of sulfides were noted during the tests and are probably also adding to the refractory.
Cyanide leach bottle roll tests were completed on some of the Mag Pit samples with the objective of using NaOH rather than lime for treating preg-robbing. For each sample type, tests were completed at pH 10.5 and 12.0. The conditions of these tests were:
| | 11/8/2021 |
Granite Creek Mine Project
Premier Gold Mines Limited/i-80 Gold Corp. | Page 128
PEA NI 43-101 Technical Report |
| • | NaOH was added to raise the pH |
| • | Samples were crushed to a P80 of ¼-inch |
| • | Residence time of 48 hours |
Table 13-8 shows that increasing the pH using NaOH demonstrated an increase in gold recovery for all tests.
Table 13-8: Results from Bottle Roll Tests Using NaOH from 2013 Testwork Program
| Sample | Au Head Grade
(oz/ton) | Gold Recovery (%) |
| pH 10.5 Test | pH 12.0 Test | Difference Between pH 12.0
Test and pH 10.5 Test |
| Magmet-001-02 | 0.089 | 53.2% | 60.8% | 7.6% |
| Magmet-001-05 | 0.057 | 14.0% | 43.1% | 29.1% |
| Magmet-002-02 | 0.030 | 12.5% | 20.8% | 8.3% |
| Magmet-002-06 | 0.043 | 20.5% | 35.1% | 14.6% |
| Magmet-003-05 | 0.059 | 75.0% | 78.2% | 3.2% |
Column leach tests were conducted on composites of the Mag Pit samples. The samples used to make up these composites are shown in Table 13-9. It was not clear from the report as to the rationale behind the compositing.
Prior to the column leach tests, bottle rolls tests were conducted on each composite to determine gold recovery kinetics and reagent addition rates. The conditions of the bottle roll tests were:
| • | Hydrated lime was added to raise the pH to 12.0 |
| • | Residence time for the column leach tests varied between 72 and 76 days |
Generally, the tests were conducted on samples that had been crushed to 2 inches. The Mag Column 2 sample had an additional test on a sample crushed to ½-inch to ascertain the impact of size on gold recovery. The ½-inch column recovered essentially the same as the 2-inch column of the same material and grade.
Lime was added to agglomerate the single ½-inch column. The lime was cured in the column for 72 hours prior to applying the leach solution. Agglomeration is required for any material that might exhibit percolation issues. Materials that exhibit mild percolation issues in the lab may exhibit more severe percolation issues during commercial operations. Larger and taller lab column tests can help predict the potential for percolation issues.
Lime additions were based on the bottle roll test lime requirements. This is typical for column tests and one of the intents of the bottle roll tests.
The results of the McClelland column tests are shown in Table 13-10.
| | 11/8/2021 |
Granite Creek Mine Project
Premier Gold Mines Limited/i-80 Gold Corp. | Page 129
PEA NI 43-101 Technical Report |
Table 13-9: Sample Composition for Column Leach Tests from 2013 Testwork Program
| Sample | % of Composite |
| Mag Column 1 |
| Magmet-001-01 | 14.3% |
| Magmet-001-03 | 15.5% |
| Magmet-001-04 | 33.2% |
| Magmet-003-05 | 17.1% |
| Magmet-004-04 | 19.9% |
| Mag Column 2 |
| Magmet-002-04 | 18.5% |
| Magmet-002-05 | 8.8% |
| Magmet-003-04 | 28.4% |
| Magmet-003-06 | 14.5% |
| Magmet-003-07 | 13.8% |
| Magmet-004-06 | 13.2% |
| Magmet-004-08 | 12.8% |
| Mag Column 3 |
| Magmet-001-02 | 26.2% |
| Magmet-001-05 | 6.4% |
| Magmet-001-06 | 10.1% |
| Magmet-001-07 | 17.7% |
| Magmet-001-08 | 13.9% |
| Magmet-002-02 | 12.2% |
| Magmet-002-06 | 13.5% |
| Mag Column 4 |
| Mag Column 1 | 13.8% |
| Mag Column 2 | 43.1% |
| Mag Column 3 | 43.1% |
Table 13-10: Bottle Roll and Column Test Results from 2013 Testwork Program
| Sample | Calc Au Grade (oz/short ton) | Test Type | Feed Size (inches) | Leach Time (days) | Gold Recovery (%) | Cyanide Consumption (lb/short ton ) | Lime Consumption (lb/short ton) |
| Mag Column 1 | 0.042 | Bottle roll | ¼ | 2 | 52.4% | 0.6 | 14.6 |
| 0.034 | Column | 2 | 73 | 61.8% | 2.5 | 14.6 |
| Mag Column 2 | 0.053 | Bottle roll | ¼ | 2 | 71.7% | 1.1 | 21.4 |
| 0.051 | Column | 2 | 76 | 82.4% | 3.3 | 21.4 |
| 0.050 | Column | ½ | 72 | 82.0% | 3.8 | 21.4 |
| Mag Column 3 | 0.040 | Bottle roll | ¼ | 2 | 32.5% | 0.7 | 16.1 |
| 0.057 | Column | 2 | 72 | 50.9% | 2.6 | 16.2 |
| Mag Column 4 | 0.043 | Bottle roll | ¼ | 2 | 51.2% | 0.8 | 17.3 |
| 0.049 | Column | 2 | 76 | 65.3% | 3.0 | 17.4 |
Table 13-100 shows that the gold recoveries in the column tests varied from 51% to 82%. The Mag Column 2 tests showed there was no benefit to gold recovery by crushing finer. For the materials tested, the ½ inch and 2-inch columns had similar recovery.
| | 11/8/2021 |
Granite Creek Mine Project
Premier Gold Mines Limited/i-80 Gold Corp. | Page 130
PEA NI 43-101 Technical Report |
| 13.3.2 | Dawson Metallurgical Program 2005 and 2006 |
Dawson Metallurgical Laboratories completed autoclave metallurgical testwork programs on samples from underground (Ogee samples) on behalf of Atna (Dawson, 2005; Dawson, 2006a; Dawson, 2006b). The 2005 report reported on samples LR&RR and 33941, 33942, 34259. These samples were treated to determine applicability of the material for autoclave treatment. This initial program was followed by the 2006 test work and report, which appears to be the final report.
This testwork program was completed on the following samples:
| • | A composite from the Ogee underground deposit labelled “Right Rib and Left Rib” |
| • | Composites from the RFZ labelled as: |
| • | Composites from the CX Zone labelled as (drill footages identified): |
| • | Met1 and Met 2 from the 2005 program (re-tested) |
| • | Met1 and Met 2 from the 2006 program (re-tested) |
The objective of these programs was to determine if the underground materials identified as refractory could be treated using autoclave pre-treatment. Atna was considering contracting with a third party for autoclave treatment and downstream processing of the underground material.
The scope of these testwork programs included:
| • | Head assays including gold, sulfur speciation, and carbon speciation |
| • | Baseline cyanide leach shake-out tests on ground feed samples |
| • | Pressure oxidation testwork: grinding of samples to either a P80 of 75 µm or 45 µm. |
| • | Acidulation, where sulfuric acid was added to achieve a pH of 1.8 to 2.0 and processed for one hour. The purpose of this stage was to digest carbonate minerals ahead of the autoclave stage and is a standard methodology for whole material autoclave treatment in Nevada. |
The acid leach residue was then processed in an autoclave with the following conditions:
| • | Residence time of one hour |
| | 11/8/2021 |
Granite Creek Mine Project
Premier Gold Mines Limited/i-80 Gold Corp. | Page 131
PEA NI 43-101 Technical Report |
| • | Pulp density of 35% solids w/w |
| • | Oxygen overpressure of 460 pounds per square inch (psi) |
Lime was added to the autoclave residue to raise the pH to a range of 10.0 to 10.5 prior to leaching with cyanide. The autoclave residue then underwent a cyanide leaching test simulating CIL (addition of carbon) processing to determine gold recovery.
The cyanide leach gold recoveries from the baseline tests and the autoclave tests are shown in Table 13-12. The refractory material responded well to the autoclave pre-treatment, and, for those tests with a baseline cyanide leach (no pre-treatment) compared to the autoclave pre-treatment, there was an increase from an average recovery of 52% to 92%.
An attempt was made to fit an equation to demonstrate the relationship between sulfide sulfur analysis and baseline gold recovery. The Coefficient of Determination was very low for the equation and for this reason it is not presented. There was an inverse relationship between sulfide sulfur content and cyanide solubility (no autoclave treatment). There is a range of recoveries from 11% to 86% for those samples with measured sulfide sulfur. Within the testwork completed by McClelland labs, it was similarly noted that the sulfide sulfur content did not correlate well with cyanide solubility. There are other potential issues that impact cyanide solubility, such as the presence of organic carbon, and not all of the gold is directly associated with pyrite, as demonstrated by the wide range of baseline cyanide solubility tests. Table 13-11Samples MET1 and MET2 did not undergo baseline cyanide leach tests. These samples were from prior autoclave tests and were submitted for re-testing.
Table 13-11: Autoclave Pre-treatment Tests from Dawson Testwork Program
| Sample | Year of Testwork Program | Grind P80 (µm) | Gold Head Assay (oz/ton) | Total Sulfide Sulfur (%) | Total Carbon (CO2) Head Assay | Cyanide Leach Gold Recovery (%) |
| Baseline Tests | Tests on Autoclave Residue |
| Ogee Samples |
| Ogee (Right Rib + Left Rib) | 2005 | 75 | 0.40 | 0.0 | 0.82 | 86% | 93% |
| RF Zone Samples |
| RF_Met-1 (33941) | 2005 | 75 | 0.24 | 1.21 | 2.27 | 52% | 93% |
| RF_Met-2 (33942) | 2005 | 75 | 0.43 | 2.61 | 1.76 | 61% | 95% |
| RF_Met-4 (34259) | 2005 | 75 | 0.43 | 2.32 | 2.43 | 11% | 89% |
| CX Zone Samples |
| APCX-204 | 2006 | 75 | 0.27 | 0.00 | 5.34 | 94% | N/A |
| APCX-211 | 2006 | 75 | 0.33 | 0.00 | 4.29 | 85% | N/A |
| APCX-219 | 2006 | 75 | 0.33 | 0.84 | 0.77 | 60% | 91% |
| APCX-226 | 2006 | 45 | 0.56 | 1.53 | 2.70 | 42% | 94% |
| Undefined Samples |
| AMW-002 | 2006 | 75 | 0.33 | 0.03 | 0.35 | 77% | N/A |
| MET 1 | 2005 | 75 | 0.51 | 1.21 | 2.27 | N/A | 93% |
| MET 2 | 2005 | 75 | 0.32 | 2.61 | 1.76 | N/A | 95% |
| | 11/8/2021 |
Granite Creek Mine Project
Premier Gold Mines Limited/i-80 Gold Corp. | Page 132
PEA NI 43-101 Technical Report |
| 13.4 | Sample Representivity |
Many of the samples used for the metallurgical testwork were bulk samples that were collected either underground or on the benches of the open pits. The precise location of these samples was not documented, although the samples were identified as to which pit the samples originated from. Mag pit and some C and CX samples did include some core drill samples that were well documented as to the precise drillhole location and interval.
Samples used for the metallurgical test work have been sourced from the open pits (Mag Pit, CX Pit, and underground). Within each zone, drilling has been localized to relatively small portions of the deposit. The metallurgical response of the samples is likely to represent the general behavior of the zone, but sampling different areas of each zone to confirm the metallurgical response will reduce uncertainty. Additional targeted drilling in different zones is recommended to mitigate the risk. Figure 13-1 and Figure 13-2 show the recommended targeted drill hole locations.
Figure 13-1: Plan View Showing Metallurgical Sample Locations
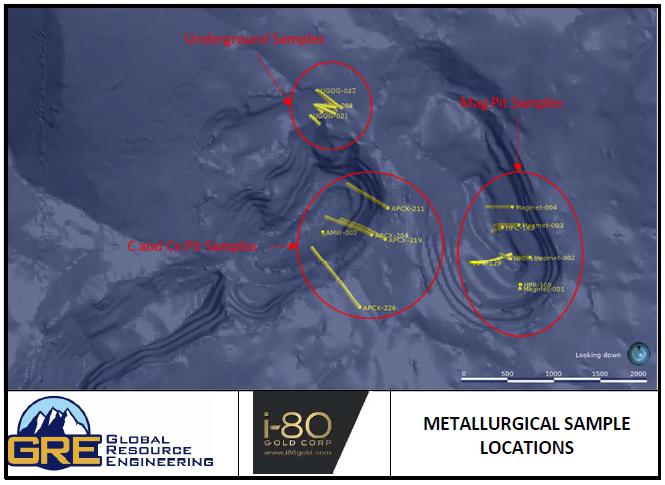
| | 11/8/2021 |
Granite Creek Mine Project
Premier Gold Mines Limited/i-80 Gold Corp. | Page 133
PEA NI 43-101 Technical Report |
Figure 13-2: Isometric View Showing Metallurgical Sample Locations
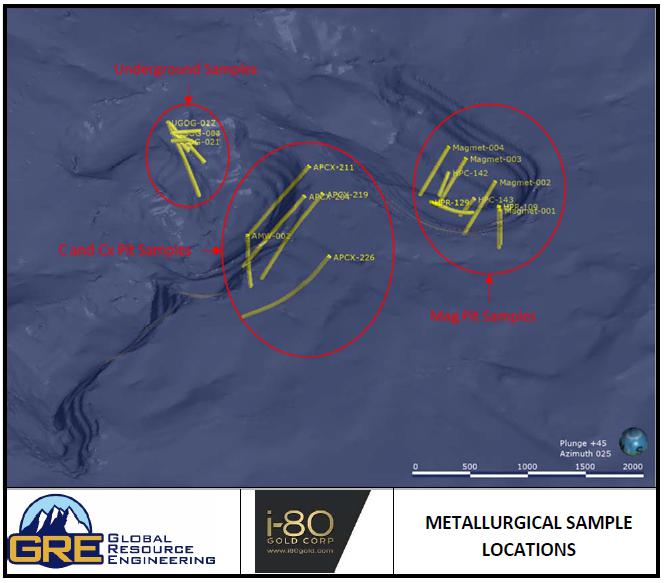
Bulk samples were sourced from the Mag Pit and CX Pit. Six bulk samples of approximately 1,000 lbs each were sourced from the Mag Pit and designated Mag Pit I through Mag Pit VI. One bulk sample of approximately 4,300 lbs was sourced from the CX Pit. The locations of the samples were not reported, so it is not possible to assess whether they are representative of the eventual Mineral Resource volume.
The samples selected from drilling on the Project over its life are listed in Table 13-12.
Table 13-12: Drillhole Sample Selection and Testing Matrix
| Sample ID | Location | Testing |
| HPR109 | Mag Pit | Preg-robbing, bottle roll, column percolation leach tests |
| HPR129 | Mag Pit |
| HPC142 | Mag Pit |
| HPC143 | Mag Pit |
| | 11/8/2021 |
Granite Creek Mine Project
Premier Gold Mines Limited/i-80 Gold Corp. | Page 134
PEA NI 43-101 Technical Report |
| Sample ID | Location | Testing |
| Magmet-001 | Mag Pit | Bottle roll, column percolation leach tests |
| Magmet-002 | Mag Pit |
| Magmet-003 | Mag Pit |
| Magmet-004 | Mag Pit |
| APCX-204 | CX Zone | Bottle roll, column percolation leach tests |
| APCX-211 | CX Zone |
| APCX-219 | CX Zone |
| APCX-226 | CX Zone |
| AMW-002 | CX Zone | Bottle roll, column percolation leach tests |
| UGOG-004 | Underground resource | Head assays and CN soluble Au only. |
| UGOG-010 | Underground |
| UGOG-013 | Underground |
| UGOG-015 | Underground |
| UGOG-017 | Underground |
| UGOG-018 | Underground |
| UGOG-019 | Underground |
| UGOG-021 | Underground |
| UGOG-022 | Underground |
Mag Pit drillholes intersect only one end of the mineralized domain. The sampling of the CX Pit is heavily clustered, and much of the mineralized domain has not been assessed metallurgically. Ogee (from the old underground developments) metallurgical test drilling intersects a restricted portion of the mineralized domain. The lens parallel to the existing workings is not intersected by any drilling. No metallurgical testwork is available for the A Pit and B Pit.
Generally, drilling intersects only limited areas of the mineralized domains, and testing of additional areas is recommended. The selection of further drilling and sampling for metallurgical testing should be guided by a future mine plan.
The lack of metallurgical testing that spatially represents all zones is a risk to the project.
| 13.4.4 | Metallurgical Composite Assembly |
For all test work conducted, composites for metallurgical testwork were prepared by combining drillhole intervals. From the information available, it is not apparent that the composites were prepared in way that represents the grade and mineralogical variability within the deposits.
The samples provided by Homestake in 1999 were composited in a manner that tended to reduce the variability in the provided samples. Table 13-13 displays the composite assay and the highest and lowest assays of the intervals in the composite.
Table 13-13: Composite Assays
| Composite | Composite Assay oz Au/ton | High/Low Interval oz Au/ton |
| Mag Pit Cuttings composite 1 | 0.094 | 0.027 - 0.266 |
| Mag Pit Cuttings composite 2 | 0.070 | 0.028 - 0.103 |
| Mag Pit Cuttings composite 3 | 0.068 | 0.036 - 0.125 |
| Mag Pit Cuttings composite 4 | 0.074 | 0.035 - 0.102 |
| | 11/8/2021 |
Granite Creek Mine Project
Premier Gold Mines Limited/i-80 Gold Corp. | Page 135
PEA NI 43-101 Technical Report |
| Composite | Composite Assay oz Au/ton | High/Low Interval oz Au/ton |
| Mag Pit Cuttings composite 5 | 0.059 | 0.014 - 0.142 |
| Mag Pit Cuttings composite 6 | 0.076 | 0.041 - 0.163 |
| Mag Pit Drill Core Composite 1 | 0.032 | 0.014 - 0.058 |
| Mag Pit Drill Core Composite 2 | 0.077 | 0.003 - 0.162 |
| Mag Pit Drill Core Composite 3 | 0.098 | 0.021 - 0.191 |
| Mag Pit Drill Core Composite 4 | 0.058 | 0.016 - 0.093 |
| Mag Pit Drill Core Composite 5 | 0.146 | 0.015 - 0.272 |
The QP concludes that the samples do not represent the variability of the mineralization, and testwork should be undertaken on samples that represent different grade variations of the mineralization. The lack of information on metallurgical performance of such samples remains a risk to the project.
Both arsenic (As) and mercury (Hg) are present in the mineralization. This is very common in Nevada gold deposits. The arsenic is not cyanide soluble. However, the mercury is cyanide soluble and must be collected using an appropriate technology at any thermal device processing, stripping, or regenerating carbon. Much like precious metals, the mercury will report to the carbon or zinc precipitate if Merrill-Crowe recovery methods are used.
Naturally occurring pregnant solution robbing organic carbon is also present within some of the materials at Pinson. This limits the applicable processing methods for these materials. High preg-robbing materials are not suitable for heap leaching and should be treated by CIL milling methods.
Any autoclave or roasting treatment for the underground refractory material will mobilize the arsenic. If there is adequate iron present within the autoclave discharge, the arsenic can be fixed as a ferric-arsenate. Any material treated by third party toll treatment will potentially be subject to additional charges for mercury, arsenic, sulfides, and organic carbon.
Test work conducted for Homestake did not report the presence or deportment of arsenic.
Mercury was assayed in Mag Pit and CX Pit bulk material samples. Assays ranged from 2.53 ppm to 43.12 ppm Hg; levels high enough to require consideration of mercury capture during refining.
TOC was present at greater than 4% in Mag Pit samples I, II, and IV, all of which displayed significant preg-robbing characteristics. TOC was less than 0.4% in the other samples, and gold recoveries were high in those samples. Based on the currently available metallurgical testwork, there is not a well-defined relationship between TOC and the level of preg-robbing. There is most likely a relationship between TOC, sulfide sulfur, and recovery.
| 13.5.2 | Atna Resources 2005 |
Drillhole samples from the underground extension of the CX Pit were received for autoclave and cyanide leach testing. These were assayed for arsenic, and measured values between 0.054% and 1.65% were reported and are tabulated with gold by fire assay in Table 13-14.
| | 11/8/2021 |
Granite Creek Mine Project
Premier Gold Mines Limited/i-80 Gold Corp. | Page 136
PEA NI 43-101 Technical Report |
Table 13-14: Gold and Arsenic Assays CX Pit
| Sample | Au (ppm) by Fire Assay | As (%) by AA |
| APCX-204 | 8.16 | 0.066 |
| APCX-211 | 8.33 | 0.130 |
| APCX-219 | 10.25 | 0.180 |
| APCX-226 | 17.5 | 1.650 |
| AMW-002 | 10.29 | 0.054 |
A further four samples designated R Rib & L Rib, 33941, 33942, and 34259 were also received for autoclave and cyanide leach testing. These tests were completed on three composite samples from the RFZ and one composite from the Ogee Zone mineralization. These samples are understood to be samples collected from the previously mined underground mineralized body. Assays for As and Hg were not reported and assumed not measured.
Approximately 200 samples from nine drillholes in the Ogee Underground resource area were submitted for sample preparation and assaying in March 2006 ( (Dawson, 2006a). The individual samples were composited into 21 samples for further work. Gold assays ranged from 7.1 ppm to 54.7 ppm and arsenic from 0.09% to 0.46%.
| 13.5.3 | Atna Resources 2013 |
Thirty-two (32) drill core composites from the Mag Pit area were submitted for heap leach amenability testing. A full elemental analysis was done on each sample, including As, Hg, copper (Cu), and organic carbon. The range of assays is shown in Table 13-15.
Table 13-15: Mag Pit Drill Core Composite Assays
| Element | Assay Range |
| As | 77 ppm to 671 ppm |
| Hg | 2.1 ppm to 30 ppm |
| Cu | 8.7 ppm to 154 ppm |
| C | 0.14% to 5.1% |
Twenty-three (23) of these composites were tested for heap leach amenability.
| 13.6 | Geometallurgical Modeling |
The test programs included cyanide solubility testing, pregnant solution robbing testing, bottle roll testing, percolation column testing, CIL testing, and autoclave testing. The objective of the study was to determine the factors that impact the cyanide solubility, and since the cyanide solubility information is not available for all the drill holes, a geometallurgical model was created to predict the cyanide solubility based on the available information in the drill hole data. A trend between the cyanide solubility and the Column test was determined to predict the Heap leach recovery.
The study is divided into 5 zones: Mag pit area, C and CX pit area, A pit area, and B pit area (associated with the open pit zones), and a single underground zone. In all the zones, the gold grade, alterations, and cyanide solubility in some intervals are available. A model for cyanide solubility was created in all zones based on the available cyanide solubility information, see Table 13-16.
| | 11/8/2021 |
Granite Creek Mine Project
Premier Gold Mines Limited/i-80 Gold Corp. | Page 137
PEA NI 43-101 Technical Report |
Table 13-16: Available Cyanide Solubility Data in Different Zones
| Zone | Number of Fire Assays Available | Number of CN Solubility Data Available | Percent of Data with CN Solubility Information |
| Mag Pit | 26,589 | 20,722 | 77.9% |
| C and CX Pit | 42,732 | 23,849 | 55.8% |
| A Pit | 4,234 | 1,211 | 28.6% |
| B Pit | 5,109 | 1,994 | 39.0% |
| Underground | 139,191 | 56,887 | 40.9% |
The deposit is mainly associated with silicification, iron oxide, argillization, pyrite, decarbonatization, carbonate, carbon, hydrogen chloride, bleaching, propylitic, and realgar orpiment alterations. All the alterations were logged as shown in Table 13-17.
Table 13-17: Numerical equivalent Alteration codes.
| Alteration Code | Description |
| 0 | None |
| 1 | Trace (Incipient) |
| 2 | Weak (Patchy, Poorly developed) |
| 3 | Moderate (Occurs through most rock) |
| 4 | Strong (Occurs throughout, textures remain) |
| 5 | Complete (Destruction of lithologic texture) |
To perform the geometallurgical modeling, different analysis were performed in all the zones:
| 1. | Principal Component Analysis: A principal component analysis was performed to better understand the relationship between the elements in the ICP geochemical data and its variability. Principal component analysis reduces the variables in a data set to components that attempt to describe the greatest amount of variance in the data set. The first component describes the greatest amount of variance in the data set, the second component is orthogonal to the first and describes the second greatest amount of variance, and so on. |
| a. | Scree Plots: A scree plot shows the variance of different principal components (variables). On a scree plot, dimensions indicate the amount of variance in the data set described by each component. |
| b. | Biplots: A biplot allows information on the variables of a data matrix to be displayed graphically, where variables are displayed as vectors. The further away these vectors are from a Principal Component origin, the more influence they have on that Principal Component. Biplots also hint at how variables correlate with the principal components and one another: a small angle implies positive correlation, a large one suggests a negative correlation, and a 90° angle indicates no correlation between two variables. |
| 2. | Regression Tree: Regression techniques contain a single output (cyanide solubility) variable and one or more input variables (alteration mineral species, elevation, and assay grades). The output variable is numerical, and the general regression tree building methodology allows input variables to be a mixture of continuous and categorical variables. A regression tree is generated when each decision node in the tree contains a test on some input variable's value. The terminal nodes of the tree contain the predicted output variable values. A regression tree is built through a process known as binary recursive partitioning, which is an iterative process that splits the data into partitions or branches, and then continues splitting each partition into smaller groups as the method moves up each branch. The prediction provided by the regression tree model is the mean cyanide solubility for the groups created. |
| | 11/8/2021 |
Granite Creek Mine Project
Premier Gold Mines Limited/i-80 Gold Corp. | Page 138
PEA NI 43-101 Technical Report |
| 3. | Multivariate Adaptive Regression Splines (MARS): MARS are a form of a non-parametric regression technique and can be seen as an extension of linear models that automatically model nonlinearities and interactions between variables. MARS can handle both continuous and categorical data. Building MARS models often requires little or no data preparation. The hinge functions automatically partition the input data, so the effect of outliers is contained. In this respect, MARS is similar to recursive partitioning which also partitions the data into disjointed regions, although using a different method. The result of the GRE’s non-parametric geometallurgical modeling effort was a formula (the MARS model formula) to determine the cyanide solubility for gold. |
| 13.6.1 | Cyanide Solubility for Different Zones |
For open pits, only the samples with Au >0.1 ppm (0.003 oz/ton) were considered in all zones. Assays less than this value were considered below cut-off grade and were removed from the study. The material below 0.1 ppm was removed to reduce the impact of waste material on the model.
There were 11,812 samples with cyanide solubility information and Au grade above 0.1 ppm. Figure 13-3 shows the Scree plot, where the first component comprises of the maximum variance. Figure 13-4 shows the biplot, where gold, pyrite, and iron oxides have strong positive correlation and strong negative correlation to elevation. Figure 13-5 shows the regression tree model, which shows that gold cyanide solubility is highly dependent on gold grade and elevation.
The MARS model for the gold cyanide solubility in the Mag pit area is shown by two different models, depending on the gold grade. The first model was created where the gold grade is less than 15 ppm, and the second model was created when the gold grade is above 15 ppm.
| 1. | Au >=0.1 ppm and Au <15 ppm |
The gold cyanide solubility when gold grade is greater than 0.1 ppm and less than 15 ppm is given by:
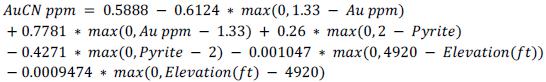
The cyanide solubility equation uses gold grade, pyrite alteration, and elevation in the model. The graph showing the observed and predicted gold cyanide solubility is given in Figure 13-6. The model has an R2 of 0.82, implying that the 82% of the variations are explained by the model.
| | 11/8/2021 |
Granite Creek Mine Project
Premier Gold Mines Limited/i-80 Gold Corp. | Page 139
PEA NI 43-101 Technical Report |
Figure 13-3: PCA- Scree Plot for Mag Pit
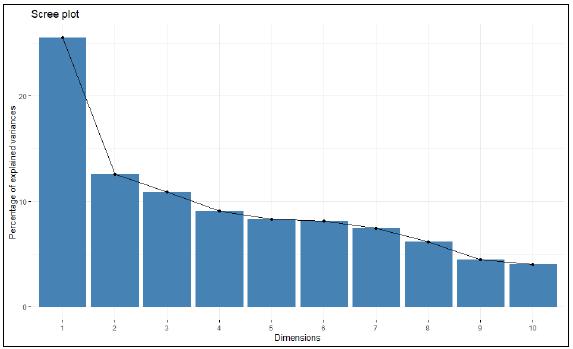
Figure 13-4: PCA - Biplot for Mag Pit
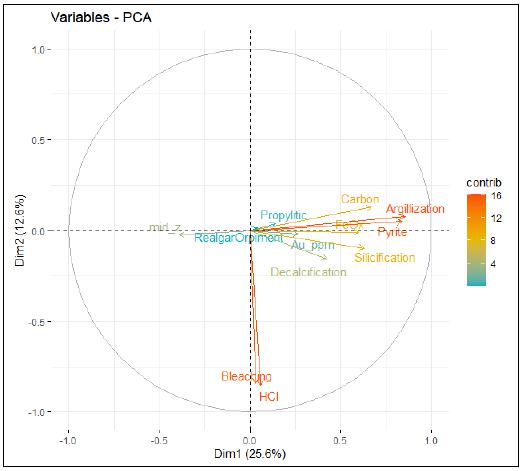
| | 11/8/2021 |
Granite Creek Mine Project
Premier Gold Mines Limited/i-80 Gold Corp. | Page 140
PEA NI 43-101 Technical Report |
Figure 13-5: Regression Tree Model for Mag Pit
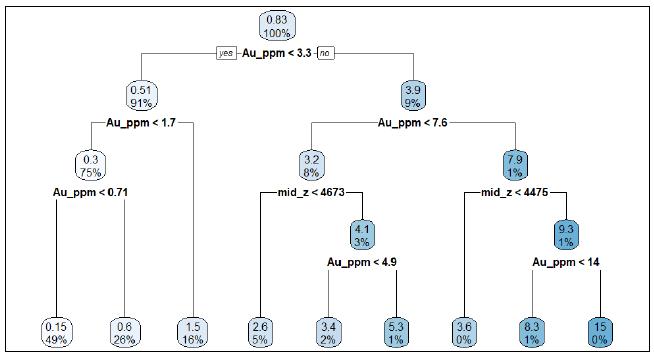
Figure 13-6: Observed and Predicted Cyanide Solubility for Gold (ppm)
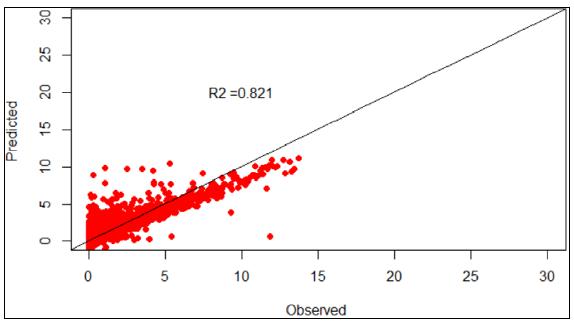
The gold cyanide solubility when gold grade is greater than 15 ppm is given by:
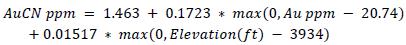
The cyanide solubility equation uses gold grade and elevation in the model. The graph showing the observed and predicted gold cyanide solubility is given in Figure 13-7. The model has an R2 of 0.84, implying that the 84% of the variations are explained by the model.
| | 11/8/2021 |
Granite Creek Mine Project
Premier Gold Mines Limited/i-80 Gold Corp. | Page 141
PEA NI 43-101 Technical Report |
Figure 13-7: Observed and Predicted Cyanide Solubility for Gold (ppm)
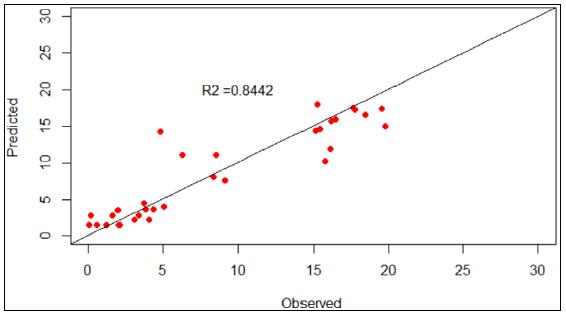
| 13.6.1.2 | C and Cx Pit Zone |
There were 5,656 samples with cyanide solubility information and Au grade above 0.1 ppm. Figure 13-8 shows the scree plot, where the first component comprises of the maximum variance and second component has relatively higher variance. Figure 13-9 shows the biplot, where gold, pyrite, and iron oxides have a weak positive correlation and week negative correlation to elevation. Figure 13-10 shows the regression tree model, which shows that gold cyanide solubility is highly dependent on only gold grade.
Figure 13-8: PCA- Scree Plot for C and Cx Pit
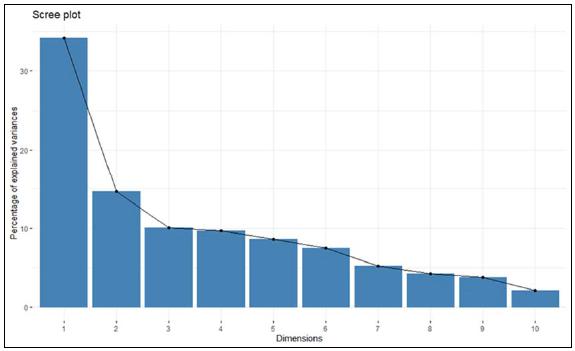
| | 11/8/2021 |
Granite Creek Mine Project
Premier Gold Mines Limited/i-80 Gold Corp. | Page 142
PEA NI 43-101 Technical Report |
Figure 13-9: PCA - Biplot for C and Cx Pit
Figure 13-10: Regression Tree Model for C and Cx Pit
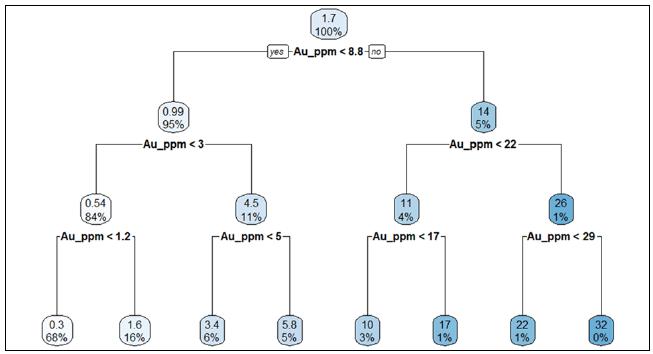
The MARS model for the gold cyanide solubility in C and Cx pit area is shown as:
| | 11/8/2021 |
Granite Creek Mine Project
Premier Gold Mines Limited/i-80 Gold Corp. | Page 143
PEA NI 43-101 Technical Report |
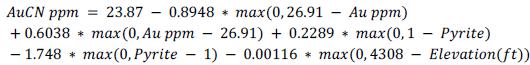
The cyanide solubility equation uses gold grade, pyrite alteration, and elevation in the model. The graph showing the observed and predicted gold cyanide solubility is given in Figure 13-11. The model has an R2 of 0.92, implying that the 92% of the variations are explained by the model.
Figure 13-11: Observed and Predicted Cyanide Solubility for Gold (ppm)

There were 487 samples with cyanide solubility information and Au grade above 0.1 ppm. Figure 13-12 shows the scree plot, where the first component comprises of the maximum variance. Figure 13-13 shows the biplot, where gold and elevation have a positive correlation. Figure 13-14 shows the regression tree model, which shows that gold cyanide solubility is highly dependent on only gold grade.
The MARS model for the gold cyanide solubility in A pit area is shown as:
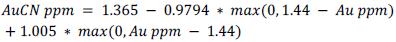
The cyanide solubility equation uses only gold grade in the model. The graph showing the observed and predicted gold cyanide solubility is given in Figure 13-15. The model has an R2 of 0.999, implying that the 99.9% of the variations are explained by the model.
| | 11/8/2021 |
Granite Creek Mine Project
Premier Gold Mines Limited/i-80 Gold Corp. | Page 144
PEA NI 43-101 Technical Report |
Figure 13-12: PCA- Scree Plot for A Pit
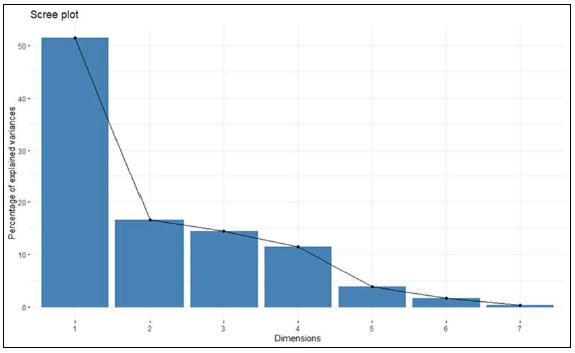
Figure 13-13: PCA - Biplot for A Pit

| | 11/8/2021 |
Granite Creek Mine Project
Premier Gold Mines Limited/i-80 Gold Corp. | Page 145
PEA NI 43-101 Technical Report |
Figure 13-14: Regression Tree Model for A Pit
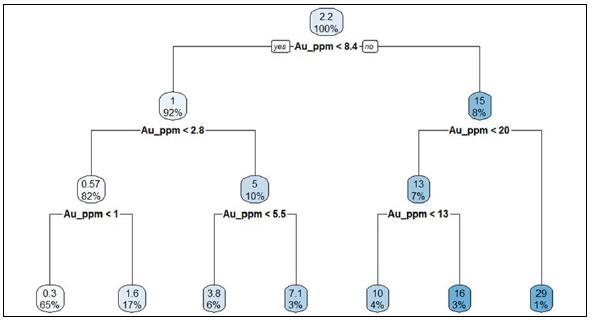
Figure 13-15: Observed and Predicted Cyanide Solubility for Gold (ppm)
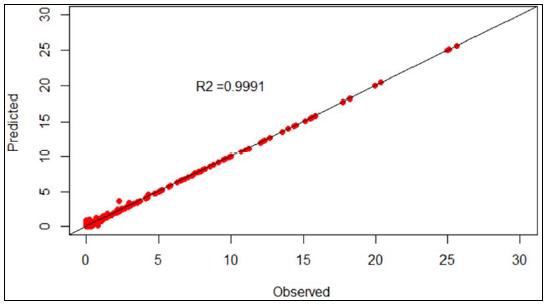
There were 617 samples with cyanide solubility information and Au grade above 0.1 ppm. Figure 13-16 shows the scree plot, where the first component comprises of the maximum variance. Figure 13-17 shows the biplot, where gold and elevation have a positive correlation. Figure 13-18 shows the regression tree model, which shows that gold cyanide solubility is highly dependent on gold grade and pyrite alteration.
The MARS model for the gold cyanide solubility in B pit area is shown as:

| | 11/8/2021 |
Granite Creek Mine Project
Premier Gold Mines Limited/i-80 Gold Corp. | Page 146
PEA NI 43-101 Technical Report |
Figure 13-16: PCA- Scree Plot for B Pit
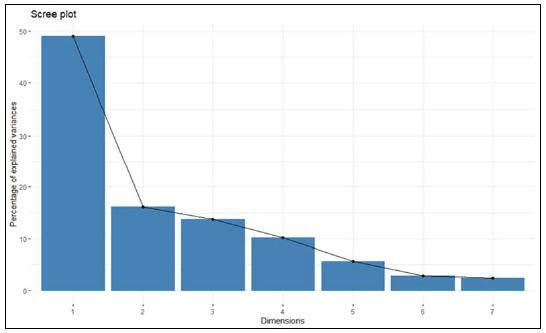
Figure 13-17: PCA - Biplot for B Pit
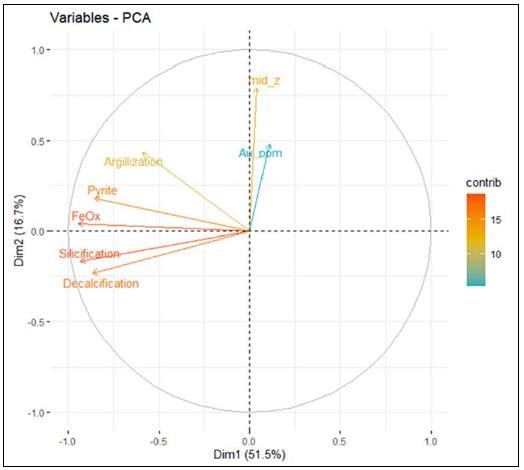
| | 11/8/2021 |
Granite Creek Mine Project
Premier Gold Mines Limited/i-80 Gold Corp. | Page 147
PEA NI 43-101 Technical Report |
Figure 13-18: Regression Tree Model for B Pit
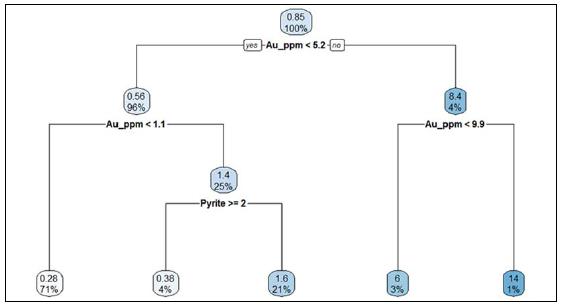
The cyanide solubility equation uses gold grade, pyrite alteration, and iron oxide alteration in the model. The graph showing the observed and predicted gold cyanide solubility is given in Figure 13-19Figure 13-15. The model has an R2 of 0.91, implying that the 91% of the variations are explained by the model.
Figure 13-19: Observed and Predicted Cyanide Solubility for Gold (ppm)
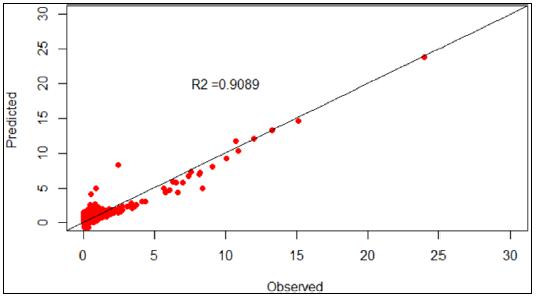
| 13.6.1.5 | Underground Zones |
There were 19,136 samples with cyanide solubility information and Au grade above 0.1 ppm. The test was performed for the entire dataset, but, at an elevation of 4670 feet, the model shows the presence of the refractory material and the quality of the model deteriorates below the elevation of 4670 feet. Thus, the model is created from material above the elevation of 4670 feet. The number of samples with cyanide solubility information, Au grade above 0.1 ppm and elevation >= 4670 feet is 9,863.
| | 11/8/2021 |
Granite Creek Mine Project
Premier Gold Mines Limited/i-80 Gold Corp. | Page 148
PEA NI 43-101 Technical Report |
Figure 13-20 shows the scree plot, where the first component comprises of the maximum variance. Figure 13-21 shows the biplot, where gold, pyrite, and iron oxides have strong positively correlation and a very week negative correlation to elevation. Figure 13-22 shows the regression tree model, which shows that gold cyanide solubility is dependent on only gold grade.
Figure 13-20: PCA- Scree Plot for Underground Zone
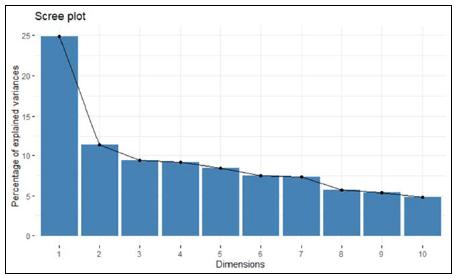
Figure 13-21: PCA - Biplot for Underground Zone
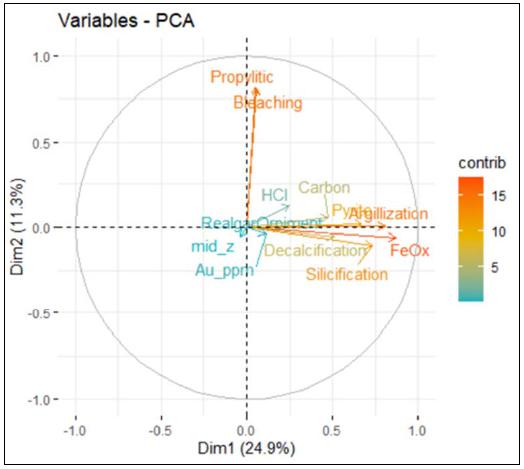
| | 11/8/2021 |
Granite Creek Mine Project
Premier Gold Mines Limited/i-80 Gold Corp. | Page 149
PEA NI 43-101 Technical Report |
Figure 13-22: Regression Tree Model for Underground Zone
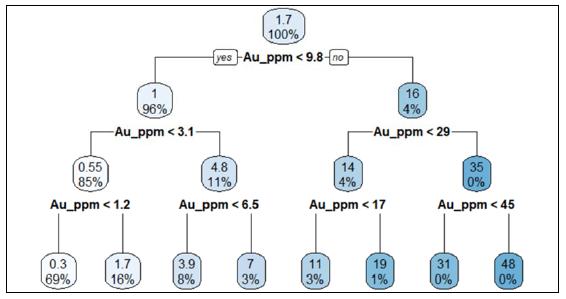
The MARS model for the gold cyanide solubility in Underground zone is shown as:
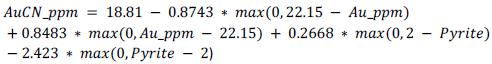
The cyanide solubility equation uses gold grade and pyrite alteration in the model. The graph showing the observed and predicted gold cyanide solubility is given in Figure 13-23. The model has an R2 of 0.955, implying that the 95.5% of the variations are explained by the model.
Figure 13-23: Observed and Predicted Cyanide Solubility for Gold (ppm)
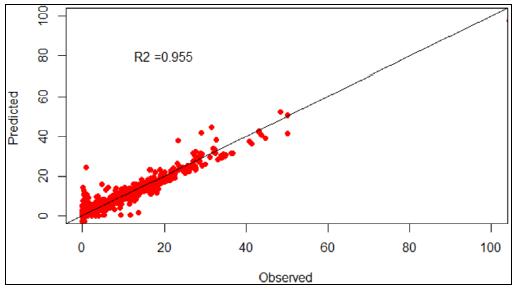
| 13.6.2 | Cyanide Solubility Estimation in the Block Model |
Using the drill hole information in each pit and the underground zone, the gold grades were estimated, and alteration information was coded for all the blocks. All the blocks are associated with the elevation, and the elevation for the block center is used for cyanide solubility estimation. Using the MARS model for each domain, the cyanide solubility information was calculated. This information was later used to calculate the recovery for each block.
| | 11/8/2021 |
Granite Creek Mine Project
Premier Gold Mines Limited/i-80 Gold Corp. | Page 150
PEA NI 43-101 Technical Report |
| 13.6.3 | Metallurgical Test and Recovery |
Column test and the CIL test information is available in the McClelland April 1999 report (McClelland, 1999a). The test samples are mostly located in the Mag pit area and a single sample in the C and Cx pit area. Autoclave results are available in the DML Wilmot 2005 -2006 Memo (Wilmot, 2006).
There are 16 Column leach tests available and seven CIL tests). The number of samples and the locations of the samples are not spatially representative of the deposit.
| | 11/8/2021 |
Granite Creek Mine Project
Premier Gold Mines Limited/i-80 Gold Corp. | Page 151
PEA NI 43-101 Technical Report |
Table 13-18: Column Test and CIL Test (McClelland April 1999 Report)
| Sample Composite | Sample Type | Column Feed Size | Column Au Recovery Percent | NaCN lb/ton | Lime lb/ton | NaOH | C organic Percent | CIL Au Percent | Calc Head opt | CN Solubility % |
| Mag Pit I | Bulk High-Grade Material | -4 inch | 18.8% | 9.94 | 5.2 | 2.8 | 4.55% | 94.4% | 0.138 | 19.5% |
| Mag Pit II | -4 inch | 35.3% | 8.96 | 10.2 | 2.34 | 4.25% | 75.3% | 0.085 | 19.6% |
| Mag Pit III | -4 inch | 93.1% | 4.55 | 5.2 | | 0.15% | 59.7% | 0.058 | 84.5% |
| Mag Pit IV | -4 inch | 49.5% | 5.30 | 12.0 | | 4.00% | 82.9% | 0.105 | 22.8% |
| Mag Pit V | -4 inch | 51.7% | 3.85 | 2.5 | | 0.40% | 55.0% | 0.029 | 50.0% |
| Mag Pit VI | -4 inch | 60.7% | 3.66 | 4.0 | | 0.45% | 87.5% | 0.028 | 61.8% |
| CX Pit, CX-2 | -6 inch | 77.7% | 5.11 | 3.0 | | 0.35% | 88.2% | 0.091 | 91.9% |
| CX Pit, CX-2 | P80 3 inch | 81.7% | 4.80 | 3.0 | | | | 0.089 | 91.9% |
| CX Pit, CX-2 | P80 3/4 inch | 82.2% | 5.39 | 3.0 | | | | 0.090 | 91.9% |
| Mag Pit 2 | Core Comp | Nom 1 inch | 69.0% | 3.98 | 11.0 | | | | 0.058 | 77.1% |
| Mag Pit 3 | Core Comp | Nom 1 inch | 62.0% | 1.60 | 9.6 | | | | 0.079 | 44.2% |
| Mag Pit 4 | Core Comp | Nom 1 inch | 47.9% | 1.51 | 8.1 | | | | 0.048 | 72.0% |
| Mag Pit 5 | Core Comp | Nom 1 inch | 61.7% | 2.08 | 10.0 | | | | 0.141 | 22.6% |
| Mag Pit Master (pH 10.5) | Core Comp | Nom 1 inch | 65.0% | 6.26 | 8.4 | | 2.25% | | 0.080 | 49.4% |
| Mag Pit Master (pH 11.8, Lime) | Core Comp | Nom 1 inch | 70.7% | 4.15 | 19.3 | | 2.25% | | 0.082 | 49.4% |
| Mag Pit Master (pH 12.0, NaOH) | Core Comp | Nom 1 inch | 69.0% | 3.48 | N/A | 10.7 | 2.25% | | 0.084 | 49.4% |
Assumption: The recovery properties observed in the Mag pit are similar to the entire area (Mag Pit, C and Cx pit, A Pit, B Pit, and Underground Zone).
| | 11/8/2021 |
Granite Creek Mine Project
Premier Gold Mines Limited/i-80 Gold Corp. | Page 152
PEA NI 43-101 Technical Report |
Recovery models are based on Table 13-18. The recovery models are based on the actual metallurgical tests. The Heap Leach Recovery model is used for both the open pit areas (Mag pit, C and Cx pit, A pit, and B pit) and the Underground area. CIL recovery model is used only in the open-pit area. The autoclave is used only for the underground area, except for any oxide material encountered above the 4670-foot level. The material above the 4670-foot level in the underground area can be treated in the heap leach or autoclave depending on the revenue generated by the blocks in different processing option.
Heap Leach Recovery
Heap Leach recovery is determined by plotting the cyanide solubility with the column recovery. Figure 13-24 shows that few samples have lower cyanide solubility but have variable column recovery, ranging from 20% to 70%.
Few samples show that at 20% cyanide solubility the model has 20% Column Recovery, at 50% cyanide solubility the model has 50% Column Recovery and at 60% cyanide solubility the model has 60% Column Recovery. Looking at the trend, a conservative model is created where up to 60% cyanide solubility, the heap leach recovery is 60%, and above 60% cyanide solubility, the model follows the trend on the regression line.
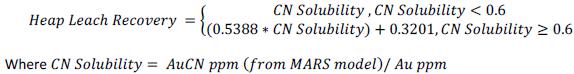
Figure 13-24: Cyanide Solubility vs Column Recovery
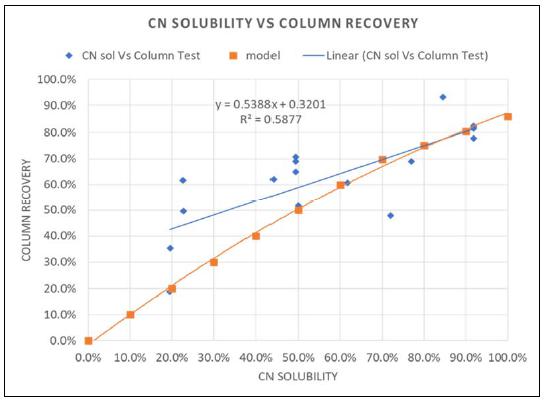
| | 11/8/2021 |
Granite Creek Mine Project
Premier Gold Mines Limited/i-80 Gold Corp. | Page 153
PEA NI 43-101 Technical Report |
Carbon in Leach Recovery
Within the Mag Pit, the samples were looked, and the trend between the calculated head grade and CIL Recovery was plotted (Figure 13-25).
Figure 13-25: Calculated Head Grade vs Carbon in Leach Recovery

Figure 13-25 shows that the two low-grade samples at 1 ppm have 55% recovery and 87.5% recovery, respectively. The higher recovery looks like an outlier and pushes the trend to have higher recovery at lower grades. To create a conservative model, the sample with higher grade recovery was removed, as shown in Figure 13-26.
By removing the low-grade sample with higher recovery (Figure 13-26), a good trend between the head grade and recovery can be observed. This trend is used to predict CIL recovery. The CIL recovery is capped at 95%.

| | 11/8/2021 |
Granite Creek Mine Project
Premier Gold Mines Limited/i-80 Gold Corp. | Page 154
PEA NI 43-101 Technical Report |
Figure 13-26: Calculated Head Grade vs Carbon in Leach Recovery (Outlier Removed)
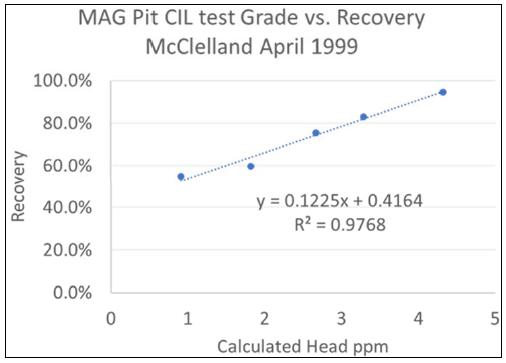
Autoclave Recovery
For the Autoclave recovery test, 9 samples were available (Table 13-19 and Table 13-20). All the tests had a very high recovery, ranging from 88.5 to 97%. A constant recovery of 92% was selected for the Autoclave recovery.
| | 11/8/2021 |
Granite Creek Mine Project
Premier Gold Mines Limited/i-80 Gold Corp. | Page 155
PEA NI 43-101 Technical Report |
Table 13-19: DML Wilmot 2005 -2006, Memo Autoclave Test Results (Samples from 2005)
| October 2005 | One hour 225 C, 460 psi, Acidulate to 1.8 to 2.0 pH Autoclave Discharge, 2 gm/l NaCN 24 hr | | | |
| Description | Test # | Sample ID | Grind P80 (microns) | Head Assay (ppm) | Head Calc (ppm) | Leach Residue (ppm) | Gold Extracted (ppm) | Gold Recovery (%) | Consumption | CN Shake Test |
CaO (Kg/Mt) | NaCN (Kg/Mt) |
| Ogee channel sample, oxide | 1 | LL&RR | 75 | 13.71 | 12.22 | 0.81 | 11.4 | 93.2% | 4.2 | 1.32 | 86% |
| Range Front Sample, surface drilling | 4 | 34259 | 75 | 14.74 | 14.8 | 1.49 | 13.1 | 88.5% | 32.1 | 4.72 | 11% |
| Range Front Sample, surface drilling | 2 | 33941 | 75 | 8.23 | 9.01 | 0.58 | 8.4 | 93.0% | 19.6 | 1.56 | 53% |
| Range Front Sample, surface drilling | 3 | 33942 | 75 | 14.74 | 15.63 | 0.67 | 14.9 | 95.2% | 47.2 | 2.37 | 61% |
| Range Front Sample, surface drilling | 5 | 33942 | 45 | 14.74 | 15.57 | 0.41 | 15.1 | 97.0% | 47.7 | 2.44 | 61% |
Table 13-20: DML Wilmot 2005 -2006, Memo Autoclave Test Results (Samples from 2006)
| April 14, 2006 | One hour 225 C, 460 psi, Acidulate to 1.8 to 2.0 pH Autoclave Discharge, 2 gm/l NaCN 24 hr | | | |
| Description | Test # | Sample ID | Grind P80 (microns) | Head Assay (ppm) | Head Calc (ppm) | Leach Residue (ppm) | Gold Extracted (ppm) | Gold Recovery (%) | Consumption | CN Shake Test |
CaO (Kg/Mt) | NaCN (Kg/Mt) |
| CX Sample composites | 8 | APCX-219 | 75 | 10.25 | 8.35 | 0.72 | 7.6 | 91.0% | 17.5 | 1.2 | 60% |
| CX Sample composites | 9 | APCX-226 | 75 | 17.5 | 15.81 | 0.89 | 14.84 | 93.8% | 21.2 | 2.38 | 42% |
| From Barrick pre-ground | 6 | MET 1 | 88 | n/a | 15.96 | 0.96 | 14.8 | 92.7% | 71.4 | 1.36 | n/a |
| From Barrick pre-ground | 7 | MET 2 | 88 | n/a | 10.06 | 2.06 | 7.81 | 77.6% | 23.4 | 0.88 | n/a |
| Coarse sample -3/8 | 2 | MET 1 | 75 | 8.23 | 9.01 | 0.58 | 8.38 | 93.0% | 19.6 | 1.56 | n/a |
| Coarse sample -3/8 | 3 | MET 2 | 75 | 14.74 | 15.63 | 0.67 | 14.88 | 95.2% | 47.2 | 2.37 | n/a |
| | | | | | | | | | | | | | | |
| | 11/8/2021 |
Granite Creek Mine Project
Premier Gold Mines Limited/i-80 Gold Corp. | Page 1
PEA NI 43-101 Technical Report |
| 13.6.4 | Recovery in the Block Model |
The recovery in the block model uses the estimated Cyanide solubility information (Section 13.6.2). For each block, the recovery equations from Section 13.6.3 are used to calculate the recovery in different processing destinations.
| 13.7.1 | Sample Representivity |
Within each zone, drilling has been localized to relatively small portions of the mineralized domains, as seen in Figure 13-1 and Figure 13-2. The metallurgical response of the samples is likely to represent the general behavior of the zone, but additional sampling of each zone to confirm the metallurgical response will reduce uncertainty. The lack of this metallurgical drilling remains a risk to the project.
| 13.7.2 | Testwork on Open Pit Samples |
Cyanide leach bottle roll tests and column leach tests were completed on samples from both the Mag and CX open pits. These tests were commissioned by both Homestead and Atna.
The testwork demonstrated that many of the Mag Pit samples had high preg-robbing factors due to carbonaceous material in the feed. The lack of representivity of the Mag Pit samples presents a risk to gold recovery in the Mag Pit due to variable preg-robbing characteristics of the feed material.
Bottle roll tests were conducted on Mag Pit samples using NaOH as an alternative to hydrated lime, as a method of treating material with preg-robbing characteristics. These tests demonstrated that raising the pH improved gold recovery and decreased cyanide consumption.
A column leach test on a Mag Pit sample showed that there was no gold recovery benefit in using NaOH rather than lime (at the equivalent pH).
Testwork on ground materials showed that Mag Pit materials were amenable to CIL methods.
Column leach tests on the Mag Pit samples achieved gold recoveries in the range of 19% to 82%.
Column leach tests on the CX Pit samples achieved gold recoveries of 82%.
| 13.7.3 | Testwork on Underground Samples |
Testwork on both underground and open pit material showed that there was a negative relationship between gold recovery and total sulfur grade. The relationship suggests that a higher sulfur head grade will have more refractory gold that will detrimentally impact gold recovery. There is not a direct correlation as not all gold within the deposits have a direct association with sulfide sulfur. The presence of TOC also masks the data.
Autoclave pre-treatment ahead of cyanide leach testwork was completed on the Ogee underground samples to treat refractory gold present in sulfide minerals. This testwork demonstrated significant increases in gold recovery relative to the baseline cyanide leach tests.
| | 11/8/2021 |
Granite Creek Mine Project
Premier Gold Mines Limited/i-80 Gold Corp. | Page 2
PEA NI 43-101 Technical Report |
The QP recommends the following actions for developing the Property.
| 13.8.1 | Testwork Recommendations |
A metallurgical drilling program should be undertaken after completion of the met drilling definition program to collect samples within the various zones which represent the spatial, mineralogical, and grade difference. The collected samples should be tested for the following:
| • | Paired fire assays and cyanide soluble assays to define cyanide solubility. |
| • | Bottle roll tests with and without carbon to predict reagent consumption as well as amenability to CIL treatment. |
| • | Column leach tests at various sizes to predict field recovery for material to be heap leached. This should be performed on those materials with a cyanide solubility of greater than 50%. Recovery by size fraction should be completed as part of the testing program. |
| • | Additional autoclave pretreatment of underground materials should be completed, especially for those materials which will be treated early in the mine life. |
| 13.8.2 | Geometallurgy Recommendations |
The geometallurgical work completed as part of this technical report should be expanded using the results from the planned metallurgical test program. The intent will be to confidently define those material that can be treated by heap leaching or CIL methods and those that require autoclave treatment.
| | 11/8/2021 |
Granite Creek Mine Project
Premier Gold Mines Limited/i-80 Gold Corp. | Page 3
PEA NI 43-101 Technical Report |
| 14.0 | MINERAL RESOURCE ESTIMATES |
The mineral resource statement presented herein represents the updated mineral resource estimate for the Pinson Deposit located in Humboldt County, Nevada, USA. This mineral resource estimate was prepared by GRE for i-80 to complete a NI 43-101 PEA Technical Report. The most recent previous mineral resource estimate was contained in the report titled “Osgood Pinson Deposit NI 43-101 Technical Report” produced by Osgood Mining Company, LLC (AMC, 2019).
The mineral resources were estimated in conformity with the CIM “Estimation of Mineral Resource and Mineral Reserves Best Practices” guidelines and are reported in accordance with the Canadian National Instrument 43-101. This mineral resource estimate includes inferred mineral resources. Inferred resources are defined as resources that are “...reasonably expected that the majority of the inferred mineral resources could be upgraded to indicated.” (CIM, 2014) by additional drilling. There is also no certainty that the inferred mineral resources will be converted to the measured or indicated categories through further drilling or into mineral reserves, once economic considerations are applied. Mineral resources are not mineral reserves and do not have demonstrated economic viability. There is no certainty that all or any part of the mineral resource will be converted into mineral reserves. The project presently has no mineral reserves. Whittle Pit optimization was applied to the open pit mineral resource estimate to assess the reasonable prospects for economic extraction for the resource.
The open pit and underground mineral resource estimates for the Granite Creek Mine Project was completed by Terre Lane, Principal Mining Engineer of GRE and independent Qualified Person as defined in NI 43-101. Both open pit and underground mineral resources were reviewed by Dr. Hamid Samari, Senior Geologist, and independent Qualified Person as defined in NI 43-101. The effective date of the resource statement is April 30, 2021. In the opinion of the qualified persons Terre Lane and Hamid Samari, the mineral resource estimate reported here is a reasonable representation of the global mineral resources found in the Granite Creek Mine Project at the current level of sampling.
Global resource engineering performed a data validation of the drill hole database prepared by i-80 for the Pinson deposit and determined it to be of suitable accuracy to perform a mineral resource estimate for the property. More detail regarding the validation of the drill hole database can be found in Section 12.0. The drill hole data for the Granite Creek Mine Project was delivered as a separate .csv file that contained exploration and production collar locations, drill hole survey orientations, sample intervals with gold assays in ppm, geologic intervals with lithology, alteration type, and alteration strength. The collar locations are projected in a local grid system, with planar and elevation units in feet. All downhole intervals are captured in feet.
The complete data set contained assays, collar, and survey data for a total of 2,855 exploration holes (surface, underground, and trench samples) and 695 production holes (surface and underground). Drilling is a mix of RC drilling, diamond drilling, and RC pre-collar with diamond drilling to final depth. The exploration assay file contains 212,839 gold assays. The production data assay file contains 1,477 gold assays. The drill hole collar locations are shown in Figure 14-1.
| | 11/8/2021 |
Granite Creek Mine Project
Premier Gold Mines Limited/i-80 Gold Corp. | Page 4
PEA NI 43-101 Technical Report |
Figure 14-1: Drill Holes Used Plan View on Topography
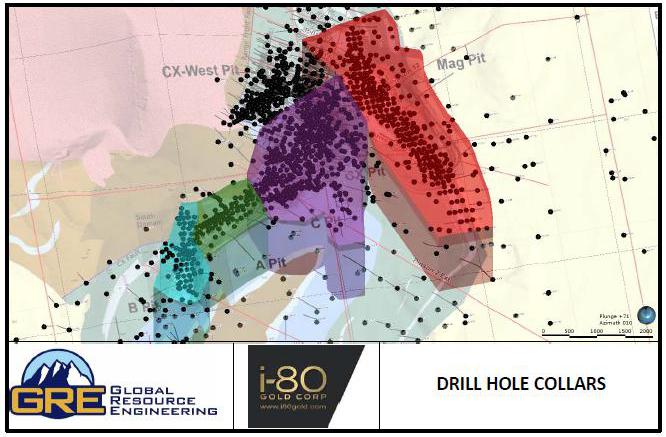
Note: This figure is intended to show the relative distribution of surface drill hole collars on topography around the areas of interest. This figure does not show all collars that have been drilled.
A number of negative, missing, and blank assay values exist in the drill hole data files provided to GRE by i-80. Missing intervals and values were assumed to be non-mineralized and therefore assigned a value of half of the most common detection limit used to assay the samples. Negative assay values were replaced according to Table 14-1.
Table 14-1: Negative Values in Drill Hole Database
Non-Positive
Value | Interpretation | Count In
Data Set | Action Taken |
| -0.005 | below detection limit of 0.005 opt | 6417 | replaced with 0.0857 ppm |
| -0.003 | below detection limit of 0.003 ppm | 2723 | replaced with 0.0015 ppm |
| -0.9943 | below detection limit of 0.029 opt | 429 | replaced with 0.0857 ppm |
| -5557 | Sample Not Received | 3 | Omit |
| -5556 | Sample Not Received | 80 | Omit |
| -0.0343 | Half the detection limit of 0.002opt | 926 | replaced with 0.0343 ppm |
| -0.1714 | below detection limit for 0.005 opt | 52 | replaced with 0.0857 ppm |
| -3394.2842 | conversion of -99 opt to ppm | 13 | replaced with 0.0857 ppm |
Topography was provided by i-80 as dxf files with triangulated surfaces. The files included both as built surfaces showing dimensions of previously mined pits at their maximum depths, and present topography which includes backfill, pits, dumps, and surrounding topography. The current topographic data was loaded into Leapfrog Geo and used to constrain the block model. The topographic data provided by i-80 was not rectangular, which is required within Leapfrog to generate models; therefore, GRE extrapolated topographic data around the edges to form a rectangular surface (Figure 14-2). The extrapolated area, however, is not part of the resource estimate.
| | 11/8/2021 |
Granite Creek Mine Project
Premier Gold Mines Limited/i-80 Gold Corp. | Page 5
PEA NI 43-101 Technical Report |
Figure 14-2: Current Topography Used for Resource Estimation
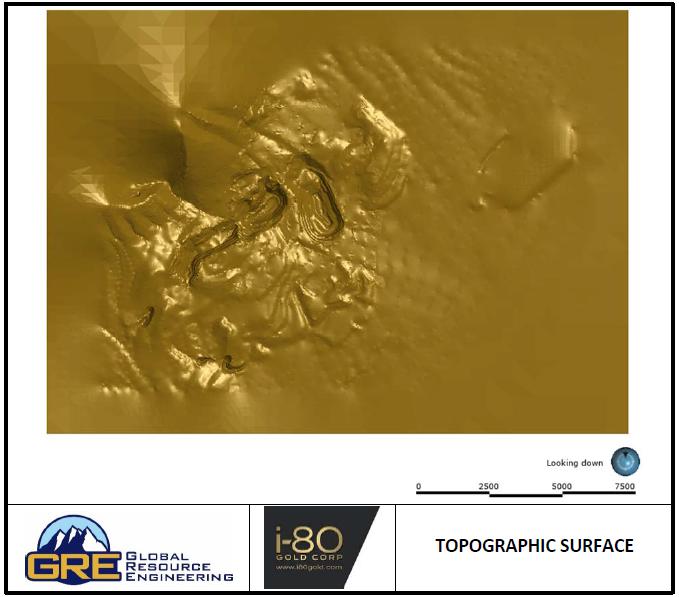
The geologic model used to complete the mineral resource estimate was developed by Dr. Samari of GRE using grouped majority composites for lithology based on data provided to GRE as part of the drill hole database. Material below the current topography and above the as-built surface was classified as backfill and assigned a Au ppm grade of zero. See Figure 14-3 for illustration of the geologic model used in the resource estimation. The model was validated for geologic accuracy and found to be suitable for the purpose of mineral resource estimation by Dr. Hamid Samari, Senior Geologist and independent Qualified Person as defined in NI 43-101.
| | 11/8/2021 |
Granite Creek Mine Project
Premier Gold Mines Limited/i-80 Gold Corp. | Page 6
PEA NI 43-101 Technical Report |
Figure 14-3: Geologic Model Oblique View
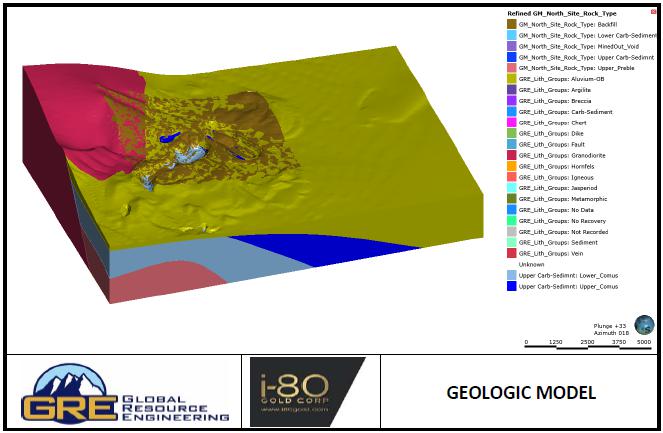
Estimation zones were recreated by bounding the assays that surround the pit areas (Figure 14-4). The underground zone to the North of Zone 3/CX Pit was not considered since this area was estimated in the underground resource section of this report. Vertical extents of the estimation zones range from 5500 feet amsl to 2500 feet amsl.
| | 11/8/2021 |
Granite Creek Mine Project
Premier Gold Mines Limited/i-80 Gold Corp. | Page 7
PEA NI 43-101 Technical Report |
Figure 14-4: Open Pit Estimation Zones
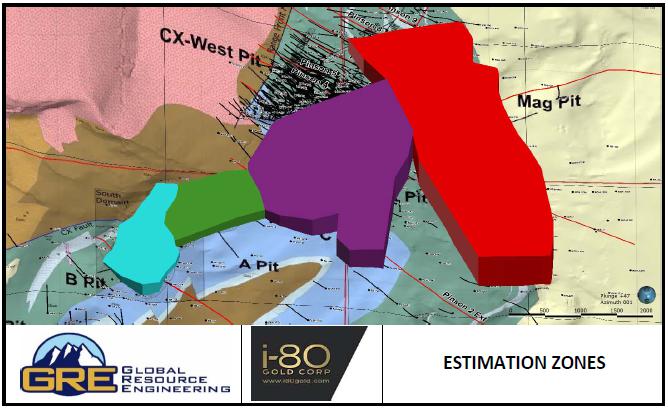
Table 14-2 summarizes the estimation zone numbers along with the corresponding pits.
Table 14-2: Open Pit Estimation Zone and Pit Name
| Estimation Zone | Pit Name |
| Zone 1 | A Pit |
| Zone 2 | MAG Pit |
| Zone 3 | CX Pit |
| Zone 4 | B Pit |
Numeric indicator models were constructed to better define the high-grade mineralized domains contained within the generalized estimation domains fit around the existing pits. The parameters used to define the indicator models are shown in Table 14-3.
Table 14-3: Open Pit Numeric Indicator Model Parameters
| Estimation Zone | Indicator Model
Cutoff (ppm) | ISO Value | Search Distance
(feet) | Dynamic Anisotropy |
| Zone 1 | 1.0 | 0.4 | 200 | CX Fault |
| Zone 2 | 1.0 | 0.3 | 250 | Mag Fault |
| Zone 3 CX | 0.1 | 0.4 | 180 | CX Fault |
| Zone 3 SOS DIKE | 0.1 | 0.4 | 100 | SOS Dike |
| Zone 3 SOS XSECTION | 0.1 | 0.3 | 150 | SOS X Section Fault |
| Zone 4 | 1.0 | 0.3 | 200 | NA* |
*Because Zone 4 did not use dynamic anisotropy, a global trend set to the following parameters was used: dip 90, dip Azimuth 100, pitch 75, and ellipse ratios max. 200, int. 200, min. 100.
| | 11/8/2021 |
Granite Creek Mine Project
Premier Gold Mines Limited/i-80 Gold Corp. | Page 8
PEA NI 43-101 Technical Report |
Initial search ellipse orientations were set from examining the spatial orientation of the composites greater than 1 g/t (see Figure 14-5). After initial construction of the high grade solids using indicator models, it was noted that some of the high grade numeric models had voids or otherwise poor geometry. When examining the fault structures, it was noted that the high grade domain corresponded well with the location and orientation of several fault structures. Dr. Samari of GRE then attempted to add a structural trend using dynamic anisotropy to the numeric model by constructing a structural trend from the fault meshes. This improved the continuity of the indicator models and helped eliminate voids that were previously present in the indicator models. ISO factors, which are defined as the probability that the enclosing volume encloses the values above the cutoff, for interpolants were based on visually examining the mineralized body and using an iterative process to select a value that produced a reasonable geologic shape. If small islands of volume were created off the major trend they were clipped out.
Figure 14-5: Example of Numeric Indicator High Grade Trend Analysis Mag Pit
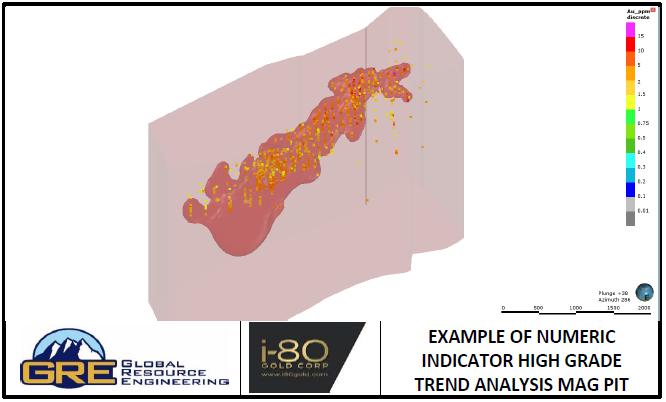
Note: The opaque red solid represents the high grade domain. The transparent red solid is the low grade domain. Composite grades are shown at a cutoff of 1ppm.
One resource estimation zone, Zone 3, was broken into several sub domains after failing to produce a reasonable high grade numeric indicator model using a single global trend within the Zone 3 domain. It was noted that during the initial attempt, branching solids formed displaying three distinct trends. Upon further investigation it was found that these trends corresponded to fault structures that crosscut the Zone 3 domain. The identified structural trends are the CX fault, the SOS Dike, and the SOS X-Section.
To construct estimation sub-domains, Dr. Samari of GRE offset the fault meshes both forwards and backwards to a thickness that contained the majority of the high grade intercept (see Figure 14-6). Separate numeric estimators were constructed within these domains, and high grade and low grade zones were defined within the zones that contained the mineralized trends (see Figure 14-7). To later avoid estimation boundary issues during resource estimation, the volumes on either side of the mineralized domains were separated into sub domains. These include the HW 1, HW 2, HW 3, and FW zones.
| | 11/8/2021 |
Granite Creek Mine Project
Premier Gold Mines Limited/i-80 Gold Corp. | Page 9
PEA NI 43-101 Technical Report |
Figure 14-6: Open Pit Zone 3 Sub-Domains
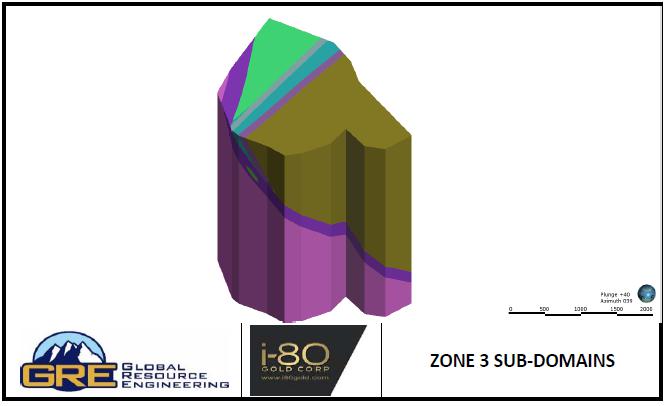
Figure 14-7: High Grade and Low Grade Open Pit Domains in CX Fault
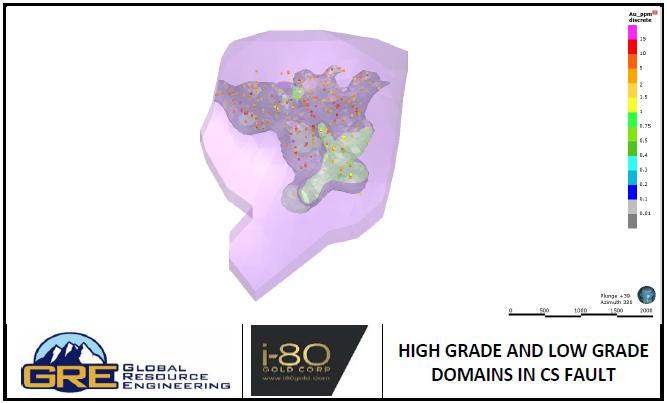
Note: The high grade zone is shown in green, the low grade domain is shown in purple.
| | 11/8/2021 |
Granite Creek Mine Project
Premier Gold Mines Limited/i-80 Gold Corp. | Page 10
PEA NI 43-101 Technical Report |
To check the validity of the high grade and low grade estimation domains, box and whisker plots were constructed, as shown in Figure 14-8. Generally, a good correlation was observed between the high grade and low grade solids and the distribution of the grades contained within them.
Figure 14-8: Box and Whisker Plot of Open Pit Estimation Domains
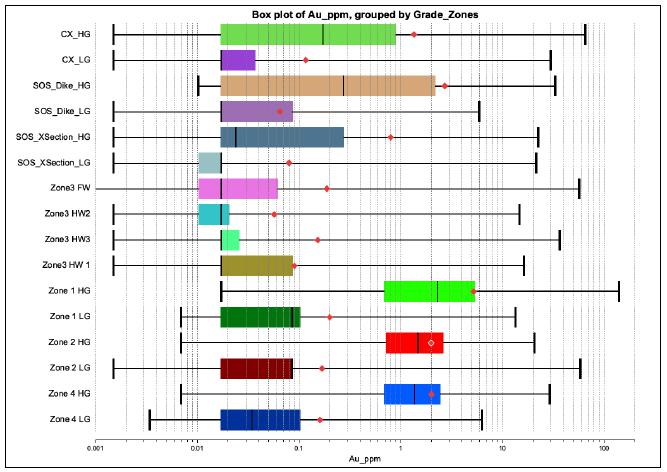
| | 11/8/2021 |
Granite Creek Mine Project
Premier Gold Mines Limited/i-80 Gold Corp. | Page 11
PEA NI 43-101 Technical Report |
Figure 14-9: HG and LG Distributions in Zones 1 and 2
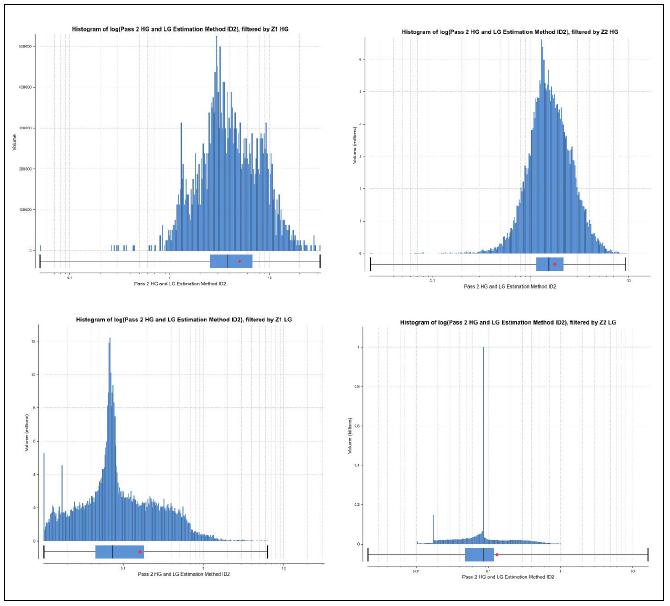
| | 11/8/2021 |
Granite Creek Mine Project
Premier Gold Mines Limited/i-80 Gold Corp. | Page 12
PEA NI 43-101 Technical Report |
Figure 14-10: HG and LG Distributions in Zones 3 and 4
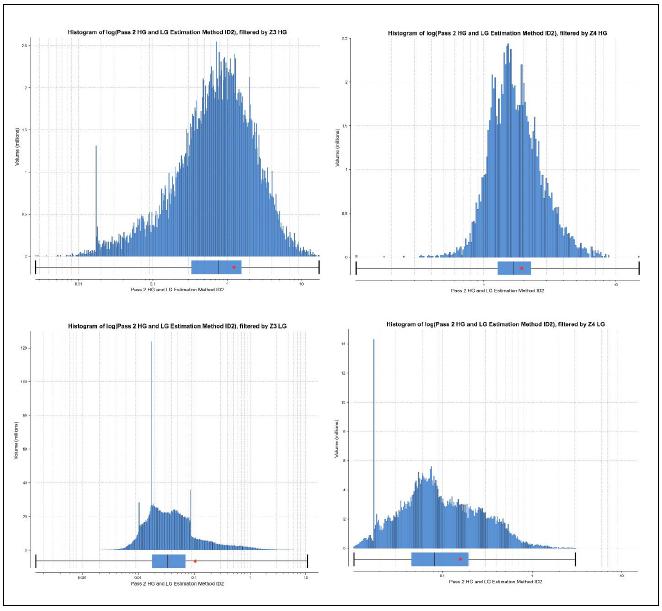
Sample data was composited to intervals of equal length to ensure that the samples used in statistical analysis and estimations were equally weighted. To accomplish compositing, Ms. Lane of GRE first examined the interval histogram to determine the most common assay length (see Figure 14-11).
| | 11/8/2021 |
Granite Creek Mine Project
Premier Gold Mines Limited/i-80 Gold Corp. | Page 13
PEA NI 43-101 Technical Report |
Figure 14-11: Open Pit Interval Length Statistics of Auppm Assays
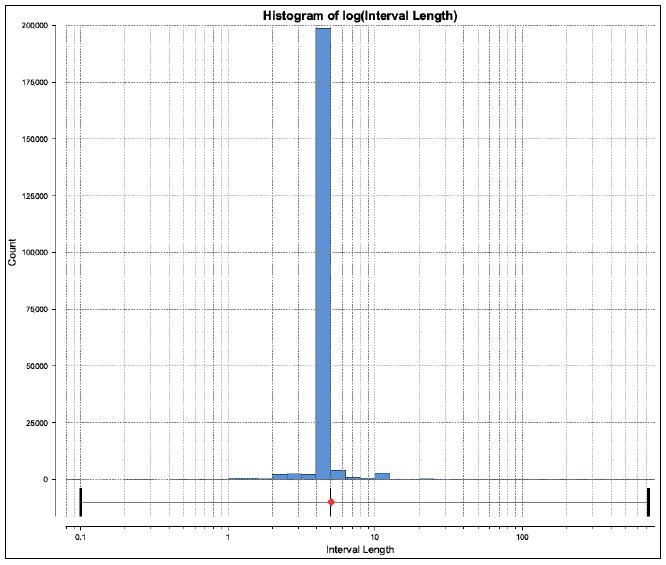
Once it was determined that five feet was the primary assay length, Ms. Lane of GRE evaluated various compositing lengths using 5-foot intervals to avoid splitting assays. It was decided that compositing on a 20-foot interval represented a significant decrease in the variance of the data while not adversely decreasing the mean of the data set, as shown in Table 14-4. Therefore, Ms. Lane of GRE selected a 20-foot composite interval.
Table 14-4: Open Pit Compositing Interval Statistics
| Statistic | AU_ppm_Assays | Composite Interval |
| 5-foot | 10-foot | 15-foot | 20-foot | 25-foot |
| Count | 221,062 | 264,712 | 133,121 | 88,217 | 66,103 | 52,752 |
| Length | 1,323,435.3 | 1,323,396.9 | 1,323,367.4 | 1,322,037.1 | 1,321,859.4 | 1,321,327.9 |
| Mean | 0.362 | 0.362 | 0.361 | 0.358 | 0.357 | 0.354 |
| SD | 2.58 | 2.49 | 2.31 | 2.08 | 1.95 | 1.87 |
| CV | 7.1 | 6.9 | 6.4 | 5.8 | 5.5 | 5.3 |
| Variance | 6.6 | 6.2 | 5.4 | 4.3 | 3.8 | 3.5 |
| Minimum | 0 | 0 | 0 | 0 | 0 | 0 |
| Q1 | 0.0170 | 0.0171 | 0.0171 | 0.0171 | 0.0171 | 0.0171 |
| | 11/8/2021 |
Granite Creek Mine Project
Premier Gold Mines Limited/i-80 Gold Corp. | Page 14
PEA NI 43-101 Technical Report |
| Statistic | AU_ppm_Assays | Composite Interval |
| 5-foot | 10-foot | 15-foot | 20-foot | 25-foot |
| Q2 | 0.0170 | 0.0171 | 0.0274 | 0.0343 | 0.0343 | 0.0343 |
| Q3 | 0.0860 | 0.0857 | 0.0857 | 0.0857 | 0.0857 | 0.0857 |
| Maximum | 290.06 | 290.06 | 290.06 | 119.89 | 94.33 | 85.08 |
A box plot comparison of the 20-foot composited and the uncomposited assays is shown in Figure 14-12. This comparison shows that compositing, while not changing the mean or quartiles, does drastically reduce the maximum value of grades.
Figure 14-12: Open Pit Compositing Comparison 20 Foot Intervals
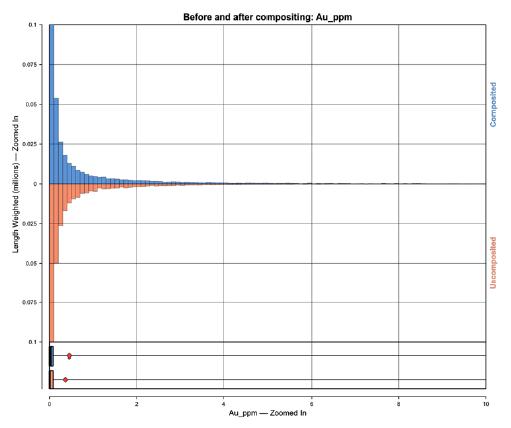
Table 14-5: Open Pit Compositing Comparison 20 Foot Intervals
| Statistic | Composited | Uncomposited |
| Count | 50,633 | 221,675 |
| Length | 1,011,524 | 1,327,165 |
| Mean | 0.45 | 0.36 |
| SD | 2.22 | 2.57 |
| CV | 4.93 | 7.13 |
| Variance | 4.93 | 6.63 |
| Minimum | 0 | 0 |
| Q1 | 0.02 | 0.02 |
| Q2 | 0.04 | 0.02 |
| Q3 | 0.09 | 0.09 |
| Maximum | 94.33 | 290.06 |
| | 11/8/2021 |
Granite Creek Mine Project
Premier Gold Mines Limited/i-80 Gold Corp. | Page 15
PEA NI 43-101 Technical Report |
| 14.5.3 | Evaluation of Outliers |
Cumulative probability plots for gold were completed for the composites within each estimation domain (see Figure 14-13 for an example) A break in the population was identified and marked with the clipping line. Based on this analysis, Ms. Lane of GRE applied a maximum allowable value for the gold grade within each separate domain, as shown in Table 14-6.
Figure 14-13: Example of Open Pit Cumulative Log Probability Plot Zone 1 HG
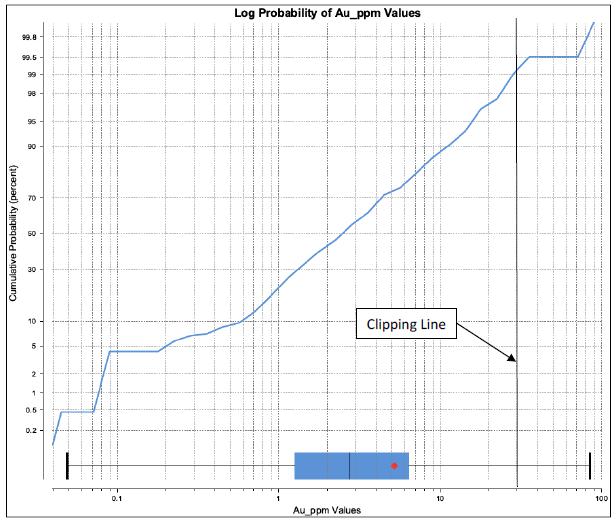
Table 14-6: Open Pit Upper Clipping Au ppm Values by Domain
| Zone | Sub-Domain | Clipping Value |
| Zone 1 | HG | 35 |
| LG | NA |
| Zone 2 | HG | 10 |
| LG | 5 |
| Zone 3 | CX HG | 20 |
| CX LG | 10 |
| SOS DIKE HG | NA |
| SOS DIKE LG | NA |
| SOS XSECTION HG | NA |
| SOS XSECTION LG | NA |
| HW 1 | 7 |
| HW 2 | 3 |
| HW 3 | 7 |
| FW | 12 |
| Zone 4 | HG | NA |
| LG | 3 |
| | 11/8/2021 |
Granite Creek Mine Project
Premier Gold Mines Limited/i-80 Gold Corp. | Page 16
PEA NI 43-101 Technical Report |
Density was assigned to each domain in the block model based on a combination of rock type and grade, as shown in Table 14-7. The bulk densities are the same as those used in the 2020 Getchell Project Technical Report (AMC, 2020) and were originally supplied by OMC. The results for each domain fit well with GRE’s experience with similar rock types.
Table 14-7: Open Pit Domain Density Summary
| Unit | Au>=0.008 opt (tonne/m3) | Au<0.008 opt (tonne/m3) |
| Backfill | 1.85 | 1.85 |
| Alluvium | 1.85 | 1.85 |
| Granodiorite | 2.7 | 2.7 |
| Upper Comus | 2.5 | 2.7 |
| Lower Comus | 2.51 | 2.64 |
| Preble | 2.42 | 2.6 |
After iterative analysis, a good fit for the gold grade variography was found using pairwise relative variograms. The pairwise relative variogram helps to smooth the variogram by scaling γ(h) using the square of the mean of each sample pair of the data from calculating γ(h). This makes the interpretation of the variogram model easier, and all variances calculated this way are relative to the mean of the sample pairs within the distribution.
Variogram analysis was completed on the samples within each of the high-grade and low-grade estimation domains to establish the direction of maximum continuity between sample pairs. The range for each variogram was found using a global variogram. The nugget was determined by examining the downhole variograms and determining where the short-range trend crossed the y-axis. Variograms were orientated along the strike and dip of the visually observed high grade trend of the composites, with the major axis oriented along the direction of maximum continuity.
Table 14-8: Open Pit Variogram Parameters
| Zone | Sub-Domain | Dip | Dip Azimuth | Pitch | Major Axis | Semi-Major Axis | Minor Axis |
| Zone 1 | Overall | 38 | 134 | 75 | 200 | 200 | 100 |
| HG | 38 | 134 | 160 | 160 | 160 | 75 |
| LG | 38 | 134 | 75 | 175 | 175 | 60 |
| | 11/8/2021 |
Granite Creek Mine Project
Premier Gold Mines Limited/i-80 Gold Corp. | Page 17
PEA NI 43-101 Technical Report |
| Zone | Sub-Domain | Dip | Dip Azimuth | Pitch | Major Axis | Semi-Major Axis | Minor Axis |
| Zone 2 | Overall | 50 | 70 | 105 | 250 | 250 | 100 |
| HG | 50 | 70 | 75 | 180 | 125 | 75 |
| LG | 50 | 70 | 105 | 300 | 200 | 200 |
| Zone 3 | Overall* | 56 | 135 | 75 | 160 | 160 | 125 |
| CX | 56 | 135 | 75 | 180 | 160 | 70 |
| CX HG | 56 | 135 | 75 | 80 | 80 | 50 |
| CX LG | 56 | 135 | 75 | 50 | 50 | 50 |
| SOS DIKE | 65 | 170 | 45 | 100 | 80 | 50 |
| SOS DIKE HG | 65 | 170 | 45 | 100 | 80 | 75 |
| SOS DIKE LG | 65 | 170 | 45 | 100 | 50 | 25 |
| SOS XSECTION | 80 | 170 | 80 | 150 | 125 | 50 |
| SOS XSECTION HG | 80 | 170 | 80 | 80 | 80 | 80 |
| SOS XSECTION LG | 80 | 170 | 105 | 150 | 125 | 50 |
| HW 1 | 56 | 135 | 150 | 160 | 100 | 125 |
| HW 2 | 56 | 135 | 100 | 160 | 160 | 125 |
| HW 3 | 56 | 135 | 75 | 160 | 160 | 125 |
| FW* | 56 | 135 | 70 | 140 | 125 | 125 |
| Zone 4 | Overall | 90 | 100 | 75 | 200 | 200 | 100 |
| HG | 90 | 100 | 90 | 60 | 60 | 25 |
| LG | 90 | 100 | 75 | 300 | 225 | 75 |
| 14.5.6 | Block Model Parameters |
A 3D block model was developed to represent the deposit using a block size of 25 feet x 25 feet x 20 feet. The block model dimensions and model limits are shown in Table 14-9. The coordinate system used for the 3D modelling was based on local grid system using imperial units of feet. The block model is un-rotated and contains no sub blocking.
Table 14-9: Block Model Parameters Open Pit
| Parameter | Value |
| Base point | 6000,7000,5800 (X,Y,Z) |
| Parent block size | 25x25x20 (X,Y,Z) |
| Azimuth | 0 |
| Boundary size | 9000,7000,3000 (X,Y,Z) |
| Size in Blocks | 360x280x150 (X,Y,Z) |
| Sub-blocking | None |
The estimation domains used to constrain the mineral resource estimate resulted from the numeric indicator models developed as part of the geologic model as discussed in Section 14.5.1.Figure 14-14 shows an overview of the estimation domains that were used to constrain the mineral resource estimation for the open pit mineral resource estimate.
| | 11/8/2021 |
Granite Creek Mine Project
Premier Gold Mines Limited/i-80 Gold Corp. | Page 18
PEA NI 43-101 Technical Report |
Figure 14-14: Open Pit Numeric Indicator Models
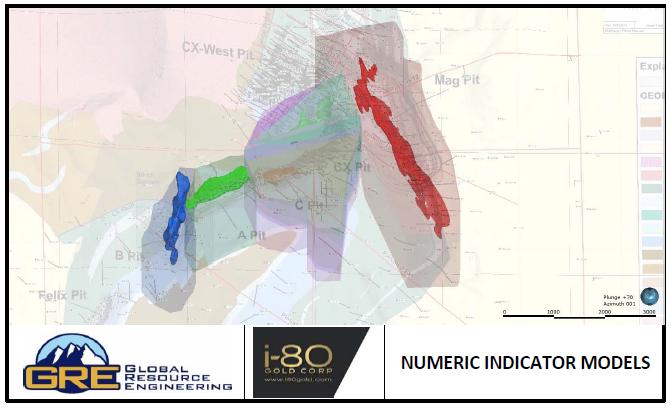
| 14.5.8 | Estimation Parameters |
Estimation within mineralized domain boundaries was performed using an inverse distance squared method with a minimum of 4 samples, a maximum of 20 samples, and a drill hole limit of 2. Declustering objects were applied to all high-grade estimation domains. Dynamic anisotropy was applied where it was applicable based on faults that structurally control mineralization. The exception to this was Zone 4, which has no apparent structural control that has yet been mapped. In this case, search ellipse orientation was determined from examining the spatial orientation of the composites greater than 1 g/t.
Search distances of the domained estimators were based on the variography for each sub-domain, as discussed in Section 14.5.4. Search distances for domains that showed poor variography were replaced by the overall sub-domain or overall domain search distances. This method was used for the Zone 4 HG and LG estimations and the Zone 3 sub-domains. All estimations used hard boundaries with the exception of the boundaries between Zone 1 HG and Zone 3 HG and between Zone 1 LG and Zone 4 LG. Soft 40-foot boundaries were setup with filters between these boundaries since they are immediately adjacent to each other and could potentially have continuity in grade estimation across these boundaries. The inverse distance estimation parameters for each domain are given in Table 14-10.
Table 14-10: Open Pit ID2 Estimation Parameters
| Zone | Sub-Domain | Dynamic
Anisotropy | Trend | Major | Semi-Major | Minor |
| Zone 1 | HG | Yes | CX Fault | 160 | 160 | 75 |
| LG | Yes | CX Fault | 175 | 175 | 60 |
| | 11/8/2021 |
Granite Creek Mine Project
Premier Gold Mines Limited/i-80 Gold Corp. | Page 19
PEA NI 43-101 Technical Report |
| Zone | Sub-Domain | Dynamic
Anisotropy | Trend | Major | Semi-Major | Minor |
| Zone 2 | HG | Yes | MAG Fault | 180 | 125 | 75 |
| LG | Yes | MAG Fault | 300 | 200 | 200 |
| Zone 3 | CX HG | Yes | CX Fault | 180 | 160 | 70 |
| CX LG | Yes | CX Fault | 180 | 160 | 70 |
| SOS DIKE HG | Yes | SOS Dike | 100 | 80 | 50 |
| SOS DIKE LG | Yes | SOS Dike | 100 | 80 | 50 |
| SOS XSECTION HG | Yes | SOS Xsection | 150 | 125 | 50 |
| SOS XSECTION LG | Yes | SOS Xsection | 150 | 125 | 50 |
| HW 1 | Yes | CX Fault | 160 | 100 | 125 |
| HW 2 | Yes | CX Fault | 160 | 160 | 125 |
| HW 3 | Yes | CX Fault | 160 | 160 | 125 |
| FW | Yes | CX Fault | 160 | 160 | 125 |
| Zone 4 | HG | No | 90,100,90 | 200 | 200 | 100 |
| LG | No | 90,100,75 | 200 | 200 | 100 |
After each domained estimator was constructed, a combined estimator was used to assign a hierarchical value to each domained estimation to produce a single gold grade value. The combined estimator hierarchy is shown in Table 14-11.
Table 14-11: Open Pit Combined Estimator Hierarchy
| Priority | Domained Estimation | Priority | Domained Estimation |
| 1 | Zone 1 HG | 11 | Zone 3 HW 3 |
| 2 | Zone 1 LG | 12 | Zone 3 HW 1 |
| 3 | Zone 2 HG | 13 | Zone 3 HW2 |
| 4 | Zone 2 LG | 14 | Zone 3 FW |
| 5 | Zone 3 CX HG | 15 | Zone 4 HG |
| 6 | Zone 3 CX LG | 16 | Zone 4 LG |
| 7 | SOS Dike HG | 17 | Zone 1 |
| 8 | SOS Dike LG | 18 | Zone 2 |
| 9 | SOS Xsection HG | 19 | Zone 3 |
| 10 | SOS Xsection LG | 20 | Zone 4 |
The overall domain grade estimations were assigned to priority 17 to 20 so that they would fill in areas of the numeric estimator domains that lacked the required number of samples to be able to estimate grade due to the small volume being estimated that excluded drill holes.
| 14.5.9 | Geometallurgical Modeling |
Section 13.6 goes into detail of how the gold recovery model was estimated and implemented in the block model.
Cyanide solubility was compared to all available interval information from the drilling data: gold assay, alteration, lithology, depth, etc. From this available data, a principal component analysis, regression tree, and multivariate adaptive regression spline analysis were performed. Using multivariate adaptive regression spline analysis model was created to predict cyanide solubility in different zones using the available drilling data. Heap Leach (HLCL) recovery is determined by plotting the cyanide solubility with the column recovery. The carbon in leach (CIL) recovery equation was determined by plotting the trend with the calculated head grade and CIL recovery.
| | 11/8/2021 |
Granite Creek Mine Project
Premier Gold Mines Limited/i-80 Gold Corp. | Page 20
PEA NI 43-101 Technical Report |
The input fields required in the recovery equations were added to the block estimations. Then, the recovery equations were applied to the block model for HLCH and CIL recoveries. These recoveries, along with the Whittle inputs from Table 14-15, were used to determine which of the two processes would be applied to each block.
| 14.6.1 | Block Model Validation |
Validation of the estimated block grades for the Pinson deposit was completed for each of the estimation domains. The resource block model estimate was validated by:
| • | Completing a series of visual inspections by comparisons of gold assay and composite grades to estimated block values across the deposit in both horizontal and vertical sections. |
| • | Statistical comparison of parameters such as means, quantiles, and variance between 20-foot composites, Nearest Neighbor (NN), Inverse Distance squared (ID2), and Ordinary Kriged (OK) estimators to ensure that the grade estimations are representative of the composites they are based on. |
| • | Comparing average composite sample values with average estimated block grades along east, north, and elevation orientations using swath grade trend plots. |
| 14.6.1.1 | Visual Inspection |
The model was examined in plan and section views to compare to drill hole locations and grades. Plan views and section views for each of the estimation areas are shown in Figure 14-15 though Figure 14-22. Comparison of the model grade from the assays did not reveal any major discrepancies.
| | 11/8/2021 |
Granite Creek Mine Project
Premier Gold Mines Limited/i-80 Gold Corp. | Page 21
PEA NI 43-101 Technical Report |
Figure 14-15: Open Pit Zone 1 Visual Comparison Composite to Block Model Grade Plan View
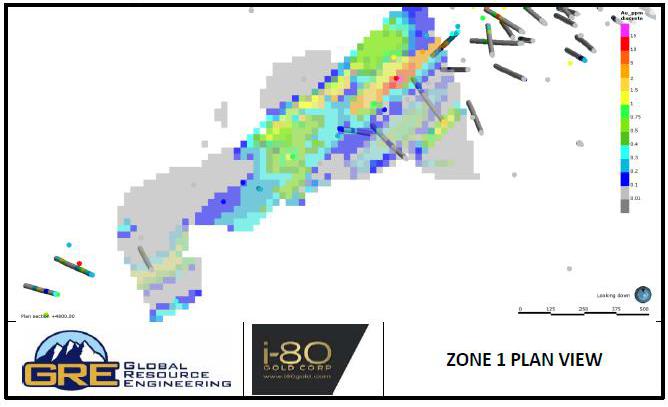
Figure 14-16: Open Pit Zone 2 Visual Comparison Composite to Block Model Grade Plan View
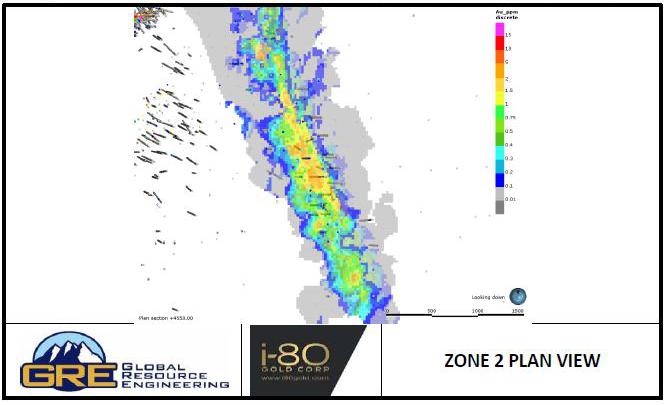
| | 11/8/2021 |
Granite Creek Mine Project
Premier Gold Mines Limited/i-80 Gold Corp. | Page 22
PEA NI 43-101 Technical Report |
Figure 14-17: Open Pit Zone 3 Visual Comparison Composite to Block Model Grade Plan View
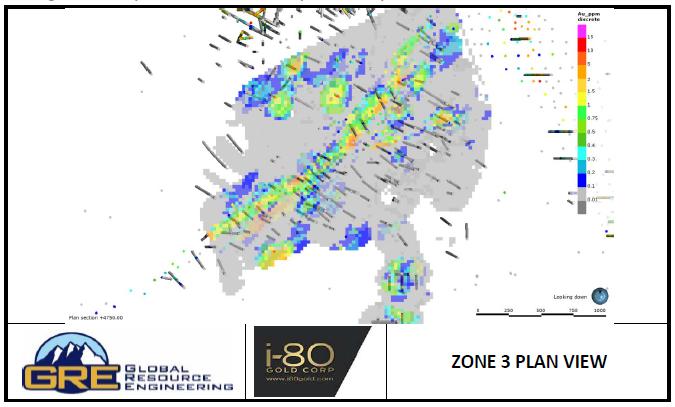
Figure 14-18: Open Pit Zone 4 Visual Comparison Composite to Block Model Grade Plan View
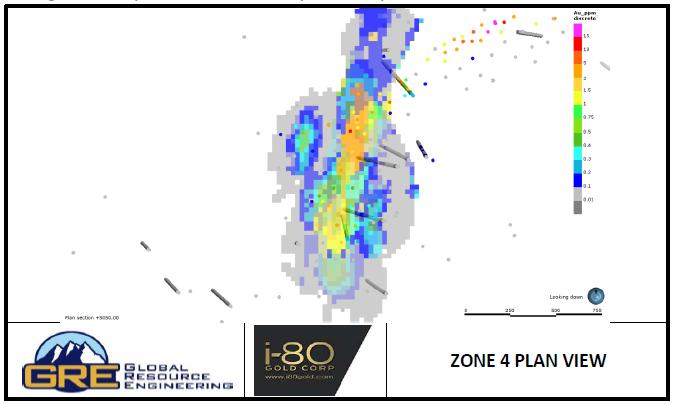
| | 11/8/2021 |
Granite Creek Mine Project
Premier Gold Mines Limited/i-80 Gold Corp. | Page 23
PEA NI 43-101 Technical Report |
Figure 14-19: Open Pit Zone 1 Section Composites and Block Model Cross Section
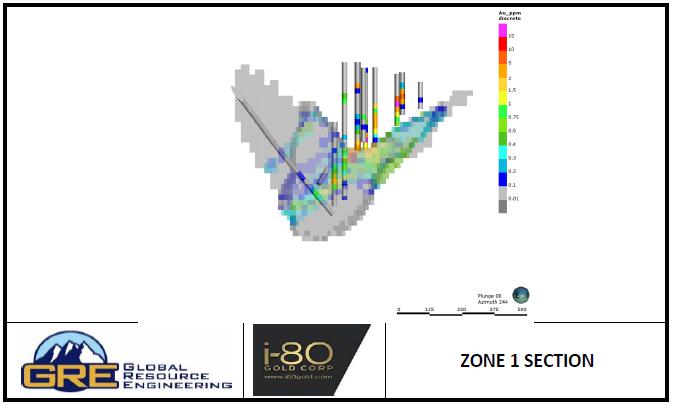
Figure 14-20: Open Pit Zone 2 Section Composites and Block Model Cross Section
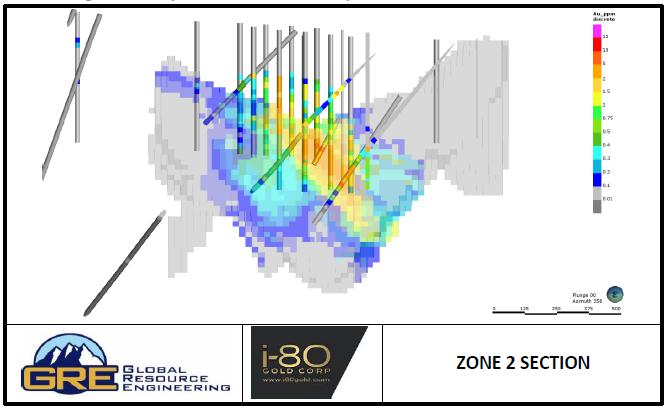
| | 11/8/2021 |
Granite Creek Mine Project
Premier Gold Mines Limited/i-80 Gold Corp. | Page 24
PEA NI 43-101 Technical Report |
Figure 14-21: Open Pit Zone 3 Section Composites and Block Model Cross Section
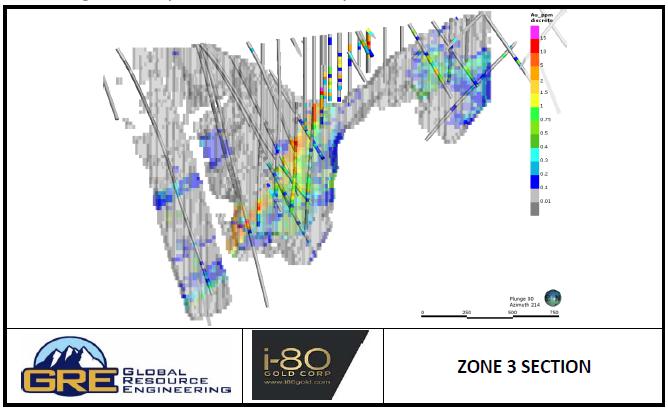
Figure 14-22: Open Pit Zone 4 Section Composites and Block Model Cross Section
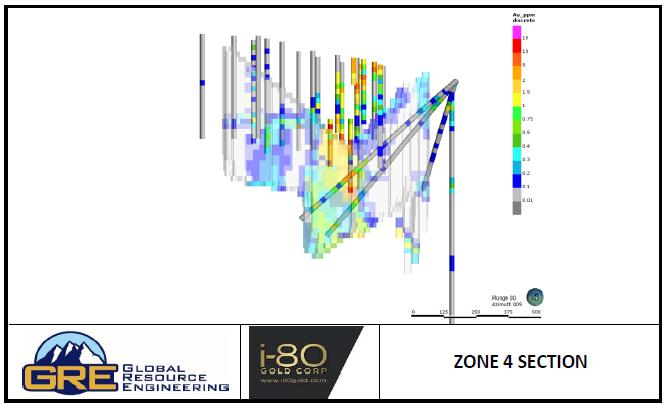
| | 11/8/2021 |
Granite Creek Mine Project
Premier Gold Mines Limited/i-80 Gold Corp. | Page 25
PEA NI 43-101 Technical Report |
| 14.6.1.2 | Statistical Comparison |
To ensure that the grade estimations are representative of the composites they are based on and validate the resource estimation results, the block model grade estimation statistics were analyzed. Ms. Lane of GRE compared the means, quantiles, and variance between 20-foot composites, Nearest Neighbor (NN), Inverse Distance squared (ID2), and Ordinary Kriged (OK) estimators, as shown in Table 14-12. Blocks are confined to the 2000 $/tr oz Whittle pit.
Table 14-12: Open Pit Comparison of Composite Values to Grade Estimation Methods
| Parameter | Composites | Parameter | NN | ID2 | OK |
| Count | 66,300 | Block Count | 216,544 | 253,284 | 216,544 |
| Mean | 0.36 | Mean | 0.35 | 0.31 | 0.36 |
| SD | 1.95 | SD | 0.81 | 1.07 | 0.78 |
| CV | 5.47 | CV | 2.31 | 3.49 | 2.19 |
| Variance | 3.80 | Variance | 0.66 | 1.14 | 0.62 |
| Minimum | 0.00 | Minimum | 0.00 | 0.00 | -0.35 |
| Q1 | 0.02 | Q1 | 0.03 | 0.02 | 0.03 |
| Q2 | 0.03 | Q2 | 0.08 | 0.05 | 0.08 |
| Q3 | 0.09 | Q3 | 0.27 | 0.09 | 0.28 |
| Maximum | 94.33 | Maximum | 32.11 | 35.00 | 27.39 |
As expected, the NN estimator generates more blocks due to the lack of restrictions of having to use multiple samples and multiple drillholes to estimate a block grade. Both ID2 and OK produced similar quantiles, means, variance, etc. The one marked difference seen between ID2 and OK is that is possible to have a negative value in Kriging as seen in the minimum value of the OK estimator.
Figure 14-23: Cumulative Frequency of Composite and Block Data
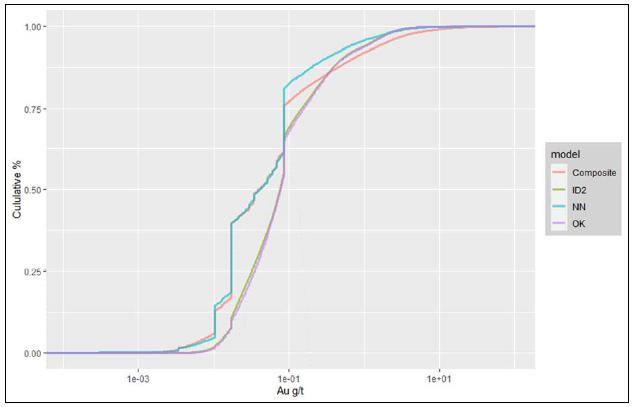
| | 11/8/2021 |
Granite Creek Mine Project
Premier Gold Mines Limited/i-80 Gold Corp. | Page 26
PEA NI 43-101 Technical Report |
Swath plots of the various estimation methods (NN, ID2, and OK) were used to compare the results from each estimation method to the composite values and examine which method smoothed the estimated grades. As an example, swatch plots are provided below for the Zone 1 high grade and low grade domains. The swatch plots show a general trend that the ID2 estimator smoothed out drastic swings in grade while not over smoothing local variability.
Figure 14-24: Open Pit Swath Plot X axis, Zone 1 High Grade Domain
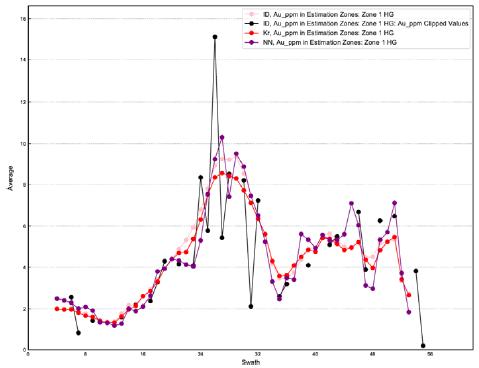
Figure 14-25: Open Pit Swath Plot Y axis, Zone 1 High Grade Domain
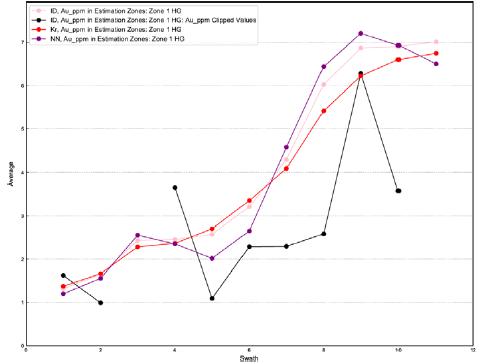
| | 11/8/2021 |
Granite Creek Mine Project
Premier Gold Mines Limited/i-80 Gold Corp. | Page 27
PEA NI 43-101 Technical Report |
Figure 14-26: Open Pit Swath Plot Z axis, Zone 1 High Grade Domain
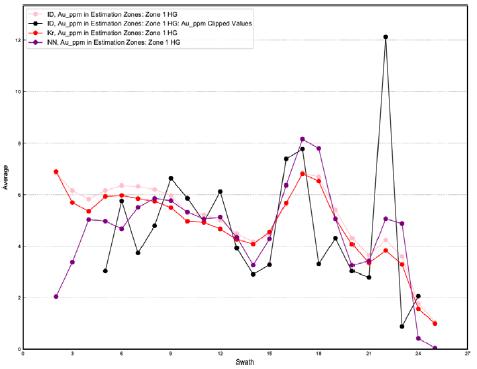
| 14.6.2 | Mineral Resource Classification |
Block model quantities and grade estimates for the Pinson deposit were classified according to the CIM Definition Standards for Mineral Resources and Mineral Reserves (May 2014). Mineral resources were estimated in conformity with generally accepted CIM “Estimation of Mineral Resource and Mineral Reserve Best Practices” Guidelines.
Mineral resources were classified as Measured, Indicated, or Inferred. To classify mineralization as a Measured mineral resource, “the nature, quality, quantity and distribution of data are such that the tonnage and grade or quality of the mineralization can be estimated to within close limits and that variation from the estimate would not significantly affect potential economic viability of the deposit” (CIM, 2014). Due to the density of drill hole spacing around the historical pit and underground excavations, Ms. Lane of GRE found it reasonable to classify portions of the resource as measured.
Mineral resource classification involved a two-step process using minimum distances and minimum numbers of samples to define resource classification initially before applying numeric indicator model to define a more continuous and reasonable resource classification. The criteria used in the first step of the resource classification are listed in Table 14-13. Parameters used for the numeric indicator models for the second step of the resource classifications are listed Table 14-14.
Table 14-13: Open Pit Mineral Resource Classification Parameters
Resource
Class | Minimum
Distance | Minimum Number of samples |
| Measured | 50 | 7 |
| Indicated | 100 | 5 |
| Inferred | 150 | NA |
| | 11/8/2021 |
Granite Creek Mine Project
Premier Gold Mines Limited/i-80 Gold Corp. | Page 28
PEA NI 43-101 Technical Report |
Table 14-14: Open Pit Parameters for Resource Class Numeric Indicator Model
| Resource Class | Shape | Interpolant Distance | ISO |
| Measured | Isotropic | 250 | 0.4 |
| Indicated | Isotropic | 250 | 0.4 |
| Inferred | NA | NA | NA |
Because the classification was performed across all resource estimation domains, an isotropic search was used along with an interpolant distance of 250, which was based on the average continuity of grade seen in the deposit. No numeric indicator model was constructed for the inferred resource class, rather it was defined as any block with a calculated gold grade that did not fall within the measured or indicated numeric indicator domains that had a calculated gold grade. A plan view of the estimated resource classes is shown in Figure 14-27.
Figure 14-27: Open Pit Constrained Resource Class All Areas Plan View
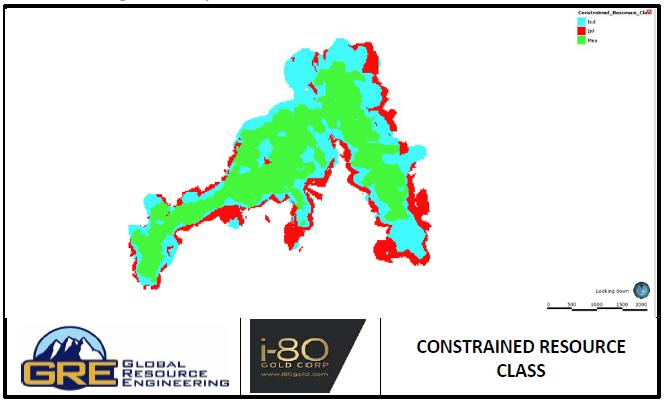
| 14.6.3 | Mineral Resource Statement |
CIM Definition Standards for Mineral Resources and Mineral Reserves (2014) defines a mineral resource as: “a concentration or occurrence of solid material of economic interest in or on the Earth’s crust in such form, grade or quality and quantity that there are reasonable prospects for eventual economic extraction. The location, quantity, grade or quality, continuity and other geological characteristics of a Mineral Resource are known, estimated or interpreted from specific geological evidence and knowledge, including sampling.” The mineral resources may be impacted by further infill and exploration drilling that may result in increase or decrease in future resource evaluations. The mineral resources may also be affected by subsequent assessment of mining, environmental, processing, permitting, taxation, socio-economic, and other factors. Mineral resources are not mineral reserves and do not have demonstrated economic viability. Mineral reserves can only be estimated based on the results of an economic evaluation as part of a Preliminary Feasibility Study or Feasibility Study. As a result, no mineral reserves have been estimated as part of this study. There is no certainty that all or any part of the mineral resources will be converted into a mineral reserve.
| | 11/8/2021 |
Granite Creek Mine Project
Premier Gold Mines Limited/i-80 Gold Corp. | Page 29
PEA NI 43-101 Technical Report |
The requirement, “reasonable prospects for eventual economic extraction,” generally implies that the quantity and grade estimates meet certain economic thresholds and that the mineral resources are reported at a cutoff grade considering appropriate extraction scenarios and processing recoveries. To meet this requirement, Ms. Lane of GRE considered that major portions of the Granite Creek deposit are amenable for open pit extraction.
To determine the quantities of material offering “reasonable prospects for eventual economic extraction” by an open pit, Ms. Lane of GRE constructed open pit scenarios developed from the resource block model estimate using Whittle’s Lerchs-Grossman miner “Pit Optimizer” software. Reasonable mining assumptions were applied to evaluate the portions of the block model (Measured, Indicated, and Inferred blocks) that could be “reasonably expected” to be mined from an open pit. The optimization parameters presented in Table 14-15 were selected based on experience and benchmarking against similar projects. The results are used as a guide to assist in the preparation of a mineral resource statement and to select an appropriate resource reporting cutoff grade. Ms. Lane of GRE considersconsidered that the blocks located within the resulting conceptual pit envelope show “reasonable prospects for economic extraction” and can be reported as a mineral resource.
Table 14-15: Pinson Resource Parameters for Open Pit Optimization
| Parameter | Items | Unit | Value |
| Costs | Mining Cost (waste/mineralized material) | $/tonne mined | 2.2 |
| Heap Leach* | $/tonne mineralized material treated | 9.92 |
| Carbon in Leach** | $/tonne mineralized material treated | 17.63 |
| Recovery | Heap Leach (HLCH) Recovery with CN Solubility <60 | % | CN Solubility*100 |
| HLCH Recovery with CN Solubility >= 60 | % | ((0.1225 * [Au_ppm]) + 0.4164)*100 |
| CIL Recovery | % | ((0.5388 * CN Solubility) + 0.3201)*100 |
| Net revenue gold | Gold price | $/oz | 1,600 |
| Selling costs and penalties*** | $/oz | 101 |
| Royalty | Total royalty (simplified) | % | 6.00% |
| Slope angles | Slope Angle | degrees | 41 |
| Limits | HLCH | tonnes per year | 2,920,000 |
| CIL | tonnes per year | 1,095,000 |
* HLCH and CIL costs include $1.1/tonne milled for admin costs
** Various royalties are applicable at various points throughout the mine life, however for the scope of this PEA, GRE has used a single 6% royalty for the open pit mineral resource.
*** This selling cost is used to apply the 6% royalty
| | 11/8/2021 |
Granite Creek Mine Project
Premier Gold Mines Limited/i-80 Gold Corp. | Page 30
PEA NI 43-101 Technical Report |
Due to the large ratio of deposit size to block size and method of grade estimation, the grade model is fully diluted, and the resource is 100% recoverable as estimated.
The Pinson open pit mineral resource constrained by a Whittle pit shell that corresponds to a gold price of $1,800 per troy ounce is shown in Table 14-16. The reader is cautioned that the results from the pit optimization are used solely for testing the “reasonable prospects for eventual economic extraction” by an open pit and do not represent an attempt to estimate mineral reserves. There are presently no mineral reserves on the project.
Table 14-16: Open Pit Mineral Resource
| Class | Zone | Total Process Material (1000s Tonnes) | Total Contained Au (1000s t. oz) | Au Grade (ppm) |
| Measured | Pit B | 2,584 | 119 | 1.44 |
| Pit A | 281 | 15 | 1.61 |
| CX | 9,447 | 436 | 1.44 |
| MAG | 8,546 | 418 | 1.52 |
| Total | 20,857 | 988 | 1.47 |
| Indicated | Pit B | 272 | 12 | 1.34 |
| Pit A | 504 | 14 | 0.89 |
| CX | 2,393 | 107 | 1.39 |
| MAG | 4,279 | 171 | 1.24 |
| Total | 7,448 | 304 | 1.27 |
| Measured + Indicated | Pit B | 2,856 | 131 | 1.43 |
| Pit A | 785 | 29 | 1.14 |
| CX | 11,840 | 543 | 1.43 |
| MAG | 12,824 | 588 | 1.43 |
| Total | 28,306 | 1,291 | 1.42 |
| Inferred | Pit B | 23 | 1 | 0.74 |
| Pit A | 120 | 2 | 0.62 |
| CX | 1,100 | 46 | 1.29 |
| MAG | 288 | 13 | 1.42 |
| Total | 1,531 | 62 | 1.26 |
| 1) The effective date of the Mineral Resources Estimate is May 4th, 2021. |
| 2) The Qualified Persons for the estimate are Terre Lane QP-MMSA and Hamid Samari QP-MMSA of GRE. |
| 3) Mineral resources are not ore reserves and are not demonstrably economically recoverable. |
| 4) Mineral resources are reported at a 0.35 g/t cutoff, an assumed gold price of 1,800 $/tr. oz, using variable recovery, a slope angle of 41 degrees, 6% royalty, heap leach processing cost $9.92 per tonne (includes admin), CIL processing cost of $17.63 per tonne (includes admin). |
| 14.6.4 | Mineral Resource Sensitivity By Domain |
Table 14-17 shows the sensitivity of the mineral resource to cutoff grade in each domain.
| | 11/8/2021 |
Granite Creek Mine Project
Premier Gold Mines Limited/i-80 Gold Corp. | Page 31
PEA NI 43-101 Technical Report |
Table 14-17: Mineral Resource Sensitivity to Cutoff Grade
| Class | Zone | Total Process Material (1000s Tonnes) | Total Contained Au (1000s t. oz) | Au Grade (ppm) |
| 0.35 ppm Cutoff |
| Measured | Pit B | 2,584 | 119 | 1.44 |
| Pit A | 281 | 15 | 1.61 |
| CX | 9,447 | 436 | 1.44 |
| MAG | 8,546 | 418 | 1.52 |
| Total | 20,857 | 988 | 1.47 |
| Indicated | Pit B | 272 | 12 | 1.34 |
| Pit A | 504 | 14 | 0.89 |
| CX | 2,393 | 107 | 1.39 |
| MAG | 4,279 | 171 | 1.24 |
| Total | 7,448 | 304 | 1.27 |
| Measured + Indicated | Pit B | 2,856 | 131 | 1.43 |
| Pit A | 785 | 29 | 1.14 |
| CX | 11,840 | 543 | 1.43 |
| MAG | 12,824 | 588 | 1.43 |
| Total | 28,306 | 1,291 | 1.42 |
| Inferred | Pit B | 23 | 1 | 0.74 |
| Pit A | 120 | 2 | 0.62 |
| CX | 1,100 | 46 | 1.29 |
| MAG | 288 | 13 | 1.42 |
| Total | 1,531 | 62 | 1.26 |
| 0.40 ppm Cutoff |
| Measured | Pit B | 2,405 | 117 | 1.52 |
| Pit A | 252 | 14 | 1.75 |
| CX | 8,945 | 430 | 1.50 |
| MAG | 8,321 | 415 | 1.55 |
| Total | 19,923 | 976 | 1.52 |
| Indicated | Pit B | 219 | 11 | 1.57 |
| Pit A | 433 | 14 | 0.97 |
| CX | 2,250 | 105 | 1.46 |
| MAG | 4,129 | 169 | 1.27 |
| Total | 7,031 | 299 | 1.32 |
| Measured + Indicated | Pit B | 2,623 | 128 | 1.52 |
| Pit A | 685 | 28 | 1.26 |
| CX | 11,195 | 535 | 1.49 |
| MAG | 12,450 | 584 | 1.46 |
| Total | 26,953 | 1,275 | 1.47 |
| Inferred | Pit B | 21 | 1 | 0.77 |
| Pit A | 97 | 2 | 0.68 |
| CX | 1,032 | 45 | 1.36 |
| MAG | 283 | 13 | 1.44 |
| Total | 1,432 | 61 | 1.32 |
| 0.45 ppm Cutoff |
| | 11/8/2021 |
Granite Creek Mine Project
Premier Gold Mines Limited/i-80 Gold Corp. | Page 32
PEA NI 43-101 Technical Report |
| Class | Zone | Total Process Material (1000s Tonnes) | Total Contained Au (1000s t. oz) | Au Grade (ppm) |
| Measured | Pit B | 2,230 | 115 | 1.60 |
| Pit A | 222 | 14 | 1.93 |
| CX | 8,460 | 423 | 1.56 |
| MAG | 8,081 | 412 | 1.58 |
| Total | 18,993 | 964 | 1.58 |
| Indicated | Pit B | 198 | 11 | 1.70 |
| Pit A | 373 | 13 | 1.06 |
| CX | 2,109 | 104 | 1.53 |
| MAG | 3,952 | 166 | 1.31 |
| Total | 6,631 | 293 | 1.38 |
| Measured + Indicated | Pit B | 2,428 | 126 | 1.61 |
| Pit A | 595 | 26 | 1.38 |
| CX | 10,569 | 527 | 1.55 |
| MAG | 12,033 | 578 | 1.49 |
| Total | 25,625 | 1,257 | 1.53 |
| Inferred | Pit B | 21 | 1 | 0.77 |
| Pit A | 81 | 2 | 0.73 |
| CX | 985 | 44 | 1.40 |
| MAG | 281 | 13 | 1.44 |
| Total | 1,368 | 60 | 1.36 |
| 14.7 | Underground Estimation |
| 14.7.1 | Underground Mining Area |
The mineral resource defined in this section accompanies the open pit resource at the Granite Creek Mine Project. The underground resource is considered separately from the open pit due to the narrow, vein-like structures associated with the resource. A small, selective block model is applied to this resource, while the open pit resource uses a larger block suitable for an open pit.
| 14.7.2 | Underground Domain Modelling |
Previous work by site geologists identified mineralized intercepts and grouped them by trend and probable domain. Ms. Lane of GRE applied Leapfrog Geo ™ Vein Modelling to the intercepts to create an intrinsically modeled domain for each group. When multiple groups were on the same trend, Ms. Lane of GRE created one vein containing both groups to cut down the modeling time. Veins typically follow the trend of the Adams Peak and Range Front Faults.
Intervals included in the veins were selected for high grade, 1 g/t. Intervals greater than 1 g/t remain outside the vein wireframes; however, they were not included due to not being on trend with other intervals. An example of intervals shaping the vein solids is shown in Figure 14-28.
| | 11/8/2021 |
Granite Creek Mine Project
Premier Gold Mines Limited/i-80 Gold Corp. | Page 33
PEA NI 43-101 Technical Report |
Figure 14-28: Example of Intervals in Vein Structure

Thirty-two veins were created from the 16 groups of 114 discrete vein solids previously identified by site geologists. The result of all veins modeled is shown in Figure 14-29.
| | 11/8/2021 |
Granite Creek Mine Project
Premier Gold Mines Limited/i-80 Gold Corp. | Page 34
PEA NI 43-101 Technical Report |
Figure 14-29: Plan View of Veins and Faults
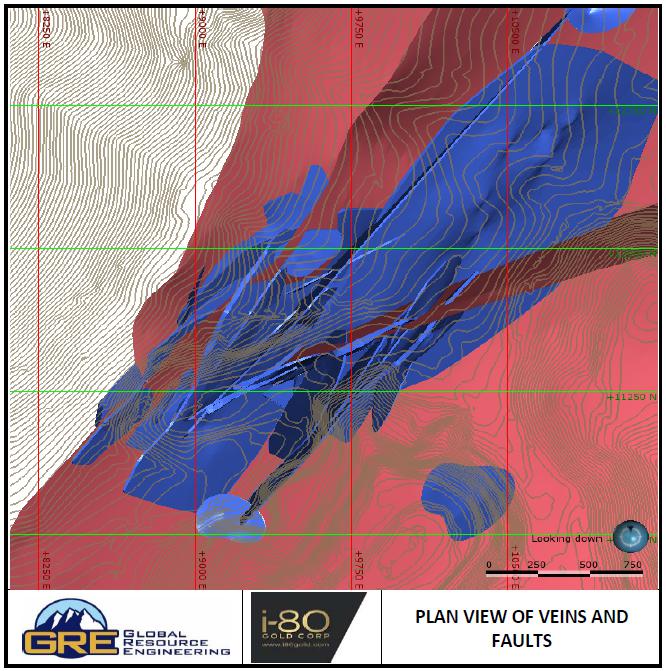
Veins have average grades greater than 1 g/t. The goal was to include most of the high grade intercepts in the underground zone. Low grade intercepts were also included surrounding the high grade areas of the vein. The low grades provide a barrier, preventing the high grade intercepts from influencing too great of a distance. The result is high grade veins with average grades greater than 1 g/t, as shown in Figure 14-30.
| | 11/8/2021 |
Granite Creek Mine Project
Premier Gold Mines Limited/i-80 Gold Corp. | Page 35
PEA NI 43-101 Technical Report |
Figure 14-30: Underground Gold Assay Boxplot by Domain Group
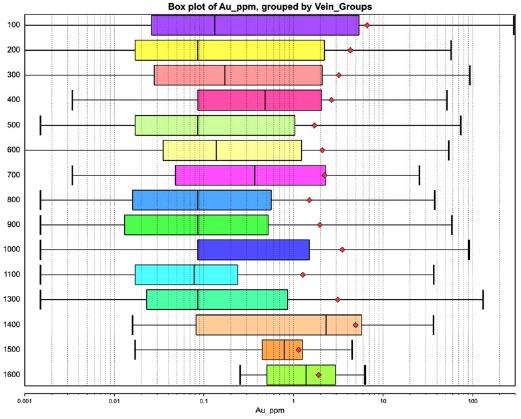
Assay interval data was composited to reduce the effect of isolated grades, smooth the overall grade population, reduce variability in the data set, and reduce the number of samples for ease of calculation.
Compositing was done on 1.524-meters (5-foot) intervals within the vein domain boundaries. The grade and distribution of composited assays represents the assay interval data well. Great similarity among the domain groups can be seen comparing the composite data in Figure 14-32 to the interval data in Figure 14-30.
Composite data was analyzed by domain, and outliers were capped in one domain, 100_03. Values were capped at the population break of 120 ppm Au. The domain analysis CFP is shown in Figure 14-31.
| | 11/8/2021 |
Granite Creek Mine Project
Premier Gold Mines Limited/i-80 Gold Corp. | Page 36
PEA NI 43-101 Technical Report |
Figure 14-31: CFP of UG Domain 100_03
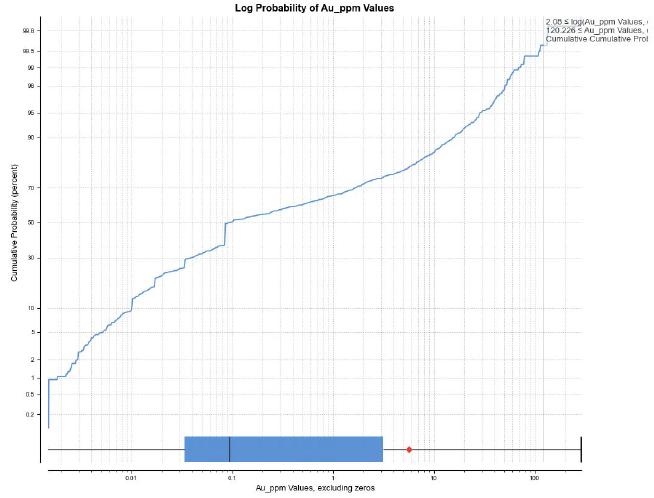
| | 11/8/2021 |
Granite Creek Mine Project
Premier Gold Mines Limited/i-80 Gold Corp. | Page 37
PEA NI 43-101 Technical Report |
Figure 14-32: Underground Gold Composite Boxplot by Domain Group
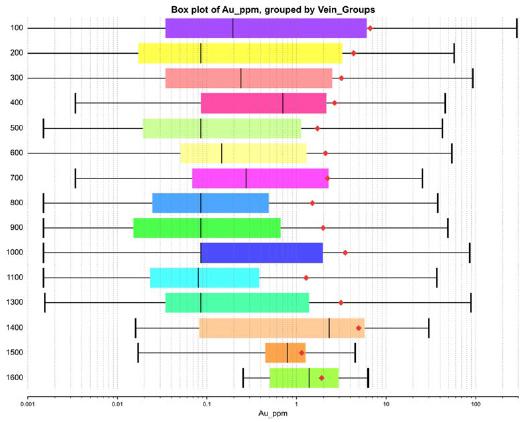
Variography was performed on each vein solid. Directional variograms were created to establish the direction and range of each search ellipse. Omnidirectional variograms were created for each vein to determine the maximum search range for grade estimation. Ellipses were initially set along the strike of the vein and analyzed along trends on that plane until continuity was established in the three principal directions. The results of the variography analysis are summarized in Table 14-18. An example of variogram analysis is shown in Figure 14-33.
Table 14-18: Underground Mineral Deposit Variography
| Vein Anisotropy | Axis Ranges | Rotation |
| Vein Group | Major | Semi-Major | Minor | Dip | Azimuth | Pitch |
| 100 | 85 | 40 | 30 | 90 | 310 | 130 |
| 200 | 80 | 55 | 30 | 80 | 130 | 80 |
| 300 | 100 | 45 | 30 | 85 | 155 | 50 |
| 400 | 40 | 25 | 25 | 75 | 295 | 100 |
| 500 | 140 | 75 | 55 | 66 | 125 | 4 |
| 600 | 120 | 55 | 54 | 85 | 310 | 140 |
| 700 | 65 | 25 | 30 | 85 | 325 | 88 |
| 800 | 100 | 50 | 30 | 50 | 130 | 145 |
| 900 | 120 | 55 | 30 | 65 | 140 | 11 |
| 1000 | 140 | 50 | 30 | 80 | 135 | 165 |
| 1100 | 100 | 55 | 30 | 50 | 120 | 45 |
| 1300 | 95 | 55 | 30 | 55 | 100 | 45 |
| 1400 | 100 | 100 | 50 | 60 | 120 | 90 |
| 1500 | 100 | 100 | 50 | 23 | 58 | 97 |
| 1600 | 100 | 100 | 50 | 88 | 290 | 90 |
| LG Zone | 105 | 65 | 60 | 65 | 120 | 105 |
| | 11/8/2021 |
Granite Creek Mine Project
Premier Gold Mines Limited/i-80 Gold Corp. | Page 38
PEA NI 43-101 Technical Report |
Figure 14-33: Example of Underground Domain Variography
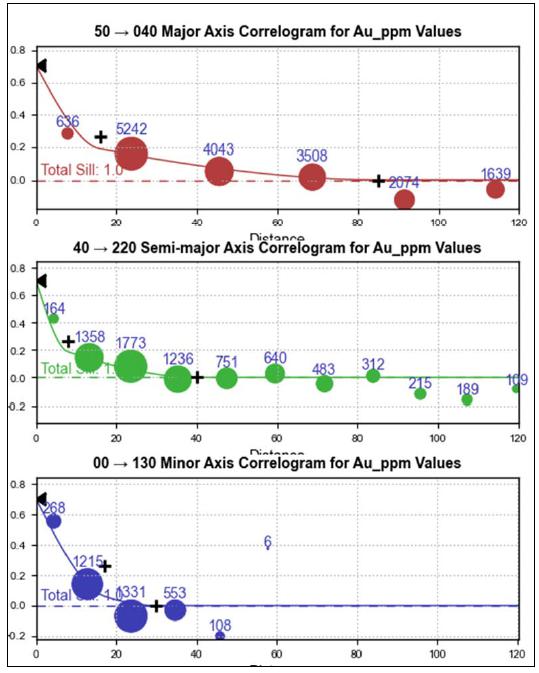
| | 11/8/2021 |
Granite Creek Mine Project
Premier Gold Mines Limited/i-80 Gold Corp. | Page 39
PEA NI 43-101 Technical Report |
| 14.8.3 | Block Model and Estimation |
The underground block model was sub-blocked to allow more precise volume estimation in narrow domains. Table 14-19 shows the block model size and location parameters.
Table 14-19: Underground Block Model Dimensions in Feet
| Block Model | X | Y | Z |
| Origin | 8,170 | 11,000 | 5,380 |
| Parent Block Size | 10 | 10 | 10 |
| Parent Block Count | 205 | 377 | 240 |
| Sub-Block Divisions | 2 | 2 | 1 |
| Rotation | 40 degrees Clockwise |
Grade estimation was performed using Inverse Distance Cubed (ID3). Search parameters were based on directional variogram and omnidirectional variograms. Directional variograms provide an ellipsoid search shape and first pass distance. Omnidirectional variograms provide maximum search range for primary axis of third pass. Second pass is average of the first and third pass distances. Below is a summary of the estimation parameters applied to gold block grades. Table 14-20 provides a summary of the descriptive statistics for the assay intervals, composite intervals, and blocks.
| • | First Pass: minimum of 6 composites, maximum of 20 composites, maximum of 2 composites per drillhole, search distances equal to the results of directional variograms |
| • | Second Pass: minimum of 4 composites, maximum of 20 composites, maximum of 2 composites per drillhole, search distances equal to the average of directional variograms and omnidirectional variograms |
| • | Third Pass: minimum of 2 composites, maximum of 20 composites, maximum of 2 composites per drillhole, search distances equal to omnidirectional variograms |
Table 14-20: Comparison of Descriptive Statistics for Underground Assay Intervals, Composited Intervals, and Blocks, Au ppm
| Gold Statistics | Count | Length/ Volume | Mean | Standard Deviation | Coefficient of Variation | Variance | Minimum | Median | Maximum |
| Assay | 13,151 | 50,039 | 3.68 | 10.57 | 2.87 | 111.69 | 0.00 | 0.09 | 290.06 |
| Composite | 10,003 | 49,882 | 3.68 | 10.08 | 2.74 | 101.64 | 0.00 | 0.10 | 290.06 |
| Block | 4,564,293 | 225,265,625 | 2.06 | 4.41 | 2.14 | 19.48 | 0.00 | 0.41 | 98.59 |
CFP plots compairing the block model estimates of ID3, NN, OK and the input composite data are shown in Figure 14-34. Comparing the modeling methods shows OK creates an overly smooth model, and ID3 accurately models the local variability of the observed data.
| | 11/8/2021 |
Granite Creek Mine Project
Premier Gold Mines Limited/i-80 Gold Corp. | Page 40
PEA NI 43-101 Technical Report |
Figure 14-34: Cumulative Frequency Plots of Underground Models (ID3, NN, and OK) and Composite Assay Data
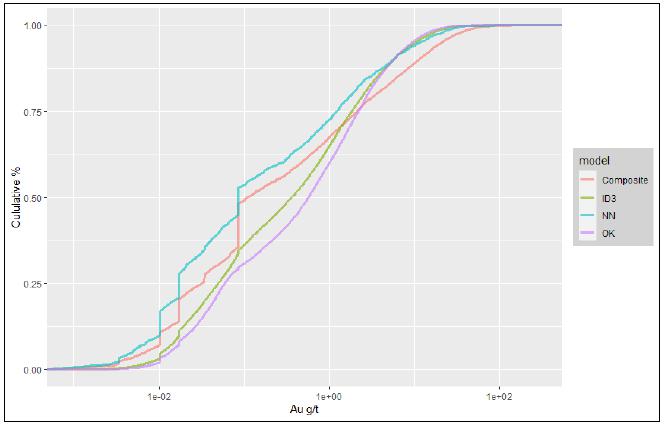
| 14.8.4 | Resource Classification |
The three passes for each estimate were the basis for resource classification. Measured was based on the first pass: six composite minimum, directional variogram search range, and three drillhole minimum. Indicated was based on the second pass estimation: four composite minimum, average range of directional and omnidirectional variograms, two drillhole minimum. Inferred resource was based on the third pass criteria: two composite minimum, search range based on the omnidirectional variogram.
| 14.8.5 | Statement of Mineral Resource |
Table 14-21: Underground Mineral Resource
| Resource Class | Tonnage (1000s of tonnes) | Gold Grade (g/t) | Gold Oz (1000s t. oz) |
| Measured | 483 | 10.07 | 156 |
| Indicated | 525 | 10.70 | 181 |
| M&I | 1,008 | 10.40 | 337 |
| Inferred | 741 | 13.41 | 319 |
Notes:
| 1) | Mineral Resources are not Mineral Reserves, and as such, do not have demonstrated economic viability. |
| 2) | Cut-off is 5 gpt based on Mining Cost of $100/ton, Process Cost of $106/ton, recovery of 92%, and a gold price of $1600/t. oz. |
| 3) | Effective Date is May 4, 2021. |
| 4) | Figures are rounded and may show apparent errors in subtotals. |
| | 11/8/2021 |
Granite Creek Mine Project
Premier Gold Mines Limited/i-80 Gold Corp. | Page 41
PEA NI 43-101 Technical Report |
| 15.0 | MINERAL RESERVE ESTIMATES |
“Mineral reserves” differ from “Mineral Resources” in that Mineral Reserves are known to be economically feasible for extraction. The CIM Definition Standards require the completion of a Preliminary Feasibility Study (PFS) as the minimum prerequisite for the conversion of Mineral Resources to Mineral Reserves. At this time, a PFS has not been completed for the Granite Creek Mine Project. Therefore, reserve estimates have not been made.
| | 11/8/2021 |
Granite Creek Mine Project
Premier Gold Mines Limited/i-80 Gold Corp. | Page 42
PEA NI 43-101 Technical Report |
The Granite Creek Mine Project will employ conventional open pit mining techniques using front end loaders and rear dump rigid frame haul trucks. As discussed in Section 17, open pit material will be treated using heap leach or CIL techniques, depending on grade and recovery of the material being processed. The mine plan is designed to deliver an average of 8,500 tonnes of high-grade heap leach material per day from the open pit to the crusher which will then be stacked on the heap leach pad, and 3,000 tonnes per day of CIL material to the mill. The average daily waste production rate over the life of the mine is 80,700 tonnes per day. Waste material would be either placed on waste rock storage facilities (WRSF) or as backfill in previously mined open pits.
There are three distinct open pit production areas on the project: B pit, CX pit, and Mag pit. The CX and Mag pits were each designed with three phases, for a total of seven mining phases for the project.
| 16.1.2 | Whittle Pit Shell Analysis |
Whittle pit shell analysis was used to provide a basis for creating the pit designs. The objective of the Whittle pit optimization was to maximize the economic extraction of the mineral resources contained in the block model. The inputs used to develop the Whittle pit shell analysis are listed in Table 16-1.
Table 16-1: Whittle Pitshell Analysis Parameters
| Parameter | Items | Unit | Value |
| Costs | Mining Cost (waste/mineralized material) | $/tonne mined | 2.2 |
| Heap Leach* | $/tonne mineralized material treated | 9.92 |
| Carbon in Leach** | $/tonne mineralized material treated | 17.63 |
| Recovery | HLCH Recovery CN Solubility <60 | % | CN Solubility*100 |
| HLCH Recovery CN Solubility >= 60 | % | ((0.1225 * [Au_ppm]) + 0.4164)*100 |
| CIL Recovery | % | ((0.5388 * CN Solubility) + 0.3201)*100 |
| Net Revenue Gold | Gold price | $/oz | 1,600 |
| Selling costs and penalties*** | $/oz | 101 |
| Royalty | Total royalty (simplified) | % | 6.00% |
| Slope angles | Slope Angle | degrees | 41 |
| Limits | HLCH | tonnes per year | 2,920,000 |
| CIL | tonnes per year | 1,095,000 |
* HLCH and CIL costs include $1.1/tonne milled for admin costs
** Various royalties are applicable at various points throughout the mine life, however for the scope of this PEA GRE has used a single 6% royalty for the open pit mineral resource.
*** This selling cost is used to apply the 6% royalty
| | 11/8/2021 |
Granite Creek Mine Project
Premier Gold Mines Limited/i-80 Gold Corp. | Page 43
PEA NI 43-101 Technical Report |
Due to the large ratio of deposit size to block size and method of grade estimation, the grade model is fully diluted, and the resource is 100% recoverable as estimated.
Revenue factors from 0.3125 to 1.25 in 0.0625 increments were applied to the base gold price of $1,600 per troy ounce to examine gold prices from $500 to $2,000 in $100 increments. After Whittle pit shells were run, Ms. Lane of GRE analyzed each resource area by examining the marginal impact on undiscounted cashflow. This analysis examines the impact that each incremental increase in the pit shell has on the undiscounted cashflow divided by the number of tonnes that are processed. Ms. Lane of GRE examined each pit area and selected a case that gave a local spike in the marginal impact on undiscounted cashflow at a revenue factor equal to or less than the base price of $1,600 as shown in Figure 16-1 through Figure 16-4. Pit shells were not adjusted for overlap of backslopes. Visually the overlap only occurs at the top of the pits. However, the effect of this overlap is relatively small and the results of this analysis can still guide the Whittle pit shell selection.
Figure 16-1: Marginal Impact Undiscounted Cashflow Mag Pit
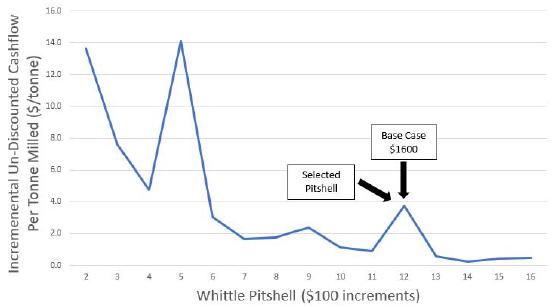
| | 11/8/2021 |
Granite Creek Mine Project
Premier Gold Mines Limited/i-80 Gold Corp. | Page 44
PEA NI 43-101 Technical Report |
Figure 16-2: Marginal Impact Undiscounted Cashflow CX Pit
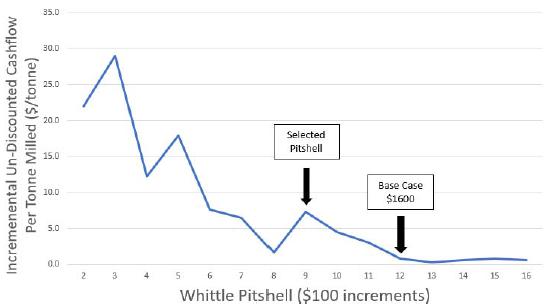
Figure 16-3: Marginal Impact Undiscounted Cashflow Pit B

| | 11/8/2021 |
Granite Creek Mine Project
Premier Gold Mines Limited/i-80 Gold Corp. | Page 45
PEA NI 43-101 Technical Report |
Figure 16-4: Marginal Impact Undiscounted Cashflow Pit A

A summary of the selected Whittle pit shells used to constrain the resource is listed in Table 16-2.
Table 16-2: Selected Whittle Pit Shells for Resource Areas
| Area | Whittle Pit Shell |
| Mag | 12 |
| CX | 9 |
| Pit A | 9 |
| Pit B | 8 |
Based on previous engineering analysis performed by Golder (Golder Associates, 2014), Ms. Lane of GRE used a triple bench format consisting of triple 20-foot vertical benches with a horizontal 30-foot catch bench every three vertical benches. The resulting open pit parameters are listed Table 16-3. In less competent zones of safety, benches will be wider or placed at more frequent intervals to reduce the slope angle.
Table 16-3: Geotechnical Design Parameters
| Pit Design Parameters | Value (degrees) |
| Max Inter-ramp Angle Hard Rock | 48 |
| Max Bench Face Angle | 68 |
| | 11/8/2021 |
Granite Creek Mine Project
Premier Gold Mines Limited/i-80 Gold Corp. | Page 46
PEA NI 43-101 Technical Report |
Figure 16-5: Cross-Section of Typical Pit Slope
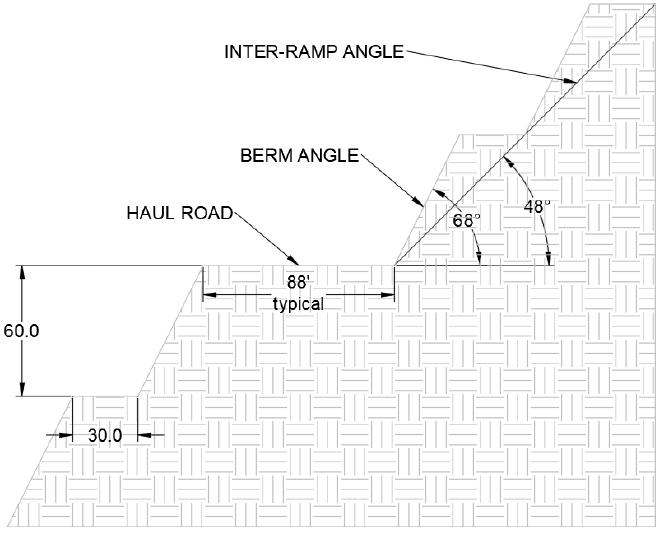
| 16.1.4.1 | Processing Method |
Ms. Lane of GRE coded each block in the block model with a processing method applicable for the block, either heap leach or CIL, or coded the block as waste based on the economic value of each block. The economic value of the block is calculated as:
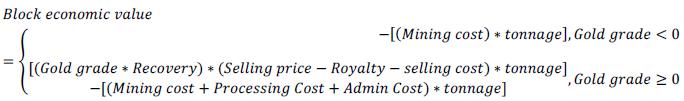
The selling price, royalty, selling cost, mining cost, processing cost, and admin cost used in the equation were the preliminary values input into the Whittle analysis, as summarized in Table 16-1. For each block, the economic value for the heap leach and CIL were evaluated using the above equation. Blocks were coded to be processed through CIL operation if the economic value for the block was positive and higher than the heap leach operation. Blocks were coded to be processed through heap leach operation if the economic value for the block was positive and higher than the CIL operation. Remaining blocks were coded as waste material.
| | 11/8/2021 |
Granite Creek Mine Project
Premier Gold Mines Limited/i-80 Gold Corp. | Page 47
PEA NI 43-101 Technical Report |
Ms. Lane of GRE coded each block in the block model with three potential recoveries:
| • | Multi-process recovery: each block coded with a CIL process method was coded with its calculated CIL recovery and each block coded with a heap leach process method was coded with its calculated heap leach recovery |
| • | Heap Leach only recovery: each block coded with a CIL processing method that was also heap leachable was coded with its calculated heap leach recovery and each block coded with a heap leach processing method was coded with its calculated heap leach recovery |
| • | CIL only recovery: each block coded with a CIL processing method was coded with its calculated CIL recovery and each block coded with a heap leach processing method was coded with its calculated CIL recovery. |
The proposed mining sequence is based on known engineering information, economic factors, and environmental considerations. The production pits would be sequentially mined with minor overlap of simultaneous production dependent on short term scheduling needs. The proposed mining sequence begins with Pit B and is shown in Table 16-4.
Table 16-4: Summary of Pit Phases
| Pit | Start Day | End Day |
| Pit B | -125 | 190 |
| CX 1 | -218 | 620 |
| CX 2 | 252 | 756 |
| CX 3 | 756 | 1,104 |
| MAG A | 1,008 | 1,171 |
| MAG B | 959 | 1,642 |
| MAG C | 1,326 | 2,233 |
Ms. Lane of GRE selected the heap leach and CIL processing at a cutoff grade of 0.55 g/t for high grade material for the base case with a low-grade to high-grade cutover grade of 0.35 g/t. The resources within the base case pits and phases are shown in Table 16-5.
Table 16-5: Base Case Pit Resource
| Pit/Phase | High Grade Leach Tonnes (1000s) | Low Grade Leach Tonnes (1000s) | CIL Tonnes (1000s) | Total Tonnes (1000s) | Au Troy Ounces Contained (1000s) | Au Grade (g/t) | Stripping Ratio |
| B | 1,699.3 | 938.5 | 343.2 | 15,451.1 | 122.2 | 1.28 | 4.18 |
| CX Phase 1 | 3,146.9 | 1,328.4 | 300.3 | 52,814.2 | 186.8 | 1.22 | 10.06 |
| | 11/8/2021 |
Granite Creek Mine Project
Premier Gold Mines Limited/i-80 Gold Corp. | Page 48
PEA NI 43-101 Technical Report |
| CX Phase 2 | 1,785.1 | 604.3 | 156.2 | 38,639.5 | 94.1 | 1.15 | 14.18 |
| CX Phase 3 | 2,998.7 | 620.6 | 479.5 | 19,051.5 | 204.8 | 1.55 | 3.65 |
| Mag Phase A | 628.5 | 585.8 | 54.9 | 12,584.9 | 38.6 | 0.95 | 8.92 |
| Mag Phase B | 2,701.8 | 388.2 | 2,284.8 | 42,413.6 | 266.9 | 1.54 | 6.89 |
| Mag Phase C | 2,376.8 | 822.7 | 3,697.2 | 44,391.5 | 286.3 | 1.29 | 5.44 |
| Total | 15,337.0 | 5,288.4 | 7,316.0 | 225,346.4 | 1,199.7 | 1.34 | 7.06 |
A preliminary mining schedule was generated from the base case pit resource estimate. Ms. Lane of GRE used the following assumptions to generate the schedule:
| • | Mining Production Rate: 11,000 tonnes per day (tpd) |
| • | Mine Operating Days per Week: 7 |
| • | Mine Operating Weeks per Year: 52 |
| • | Mine Operating Shifts per Day: 2 |
| • | Mine Operating Hours per Shift: 12 |
Pre-stripping of waste was included if waste occurred on a bench that had no corresponding processable material or if the tonnage of waste on a bench exceeded ten times the tonnage of processable material on that bench. The production rate for pre-strip benches was set to 10 times the leach material production rate, or 110,000 tpd. Processable material mined along with pre-stripped waste was placed into stockpiles for later processing.
For all other benches, all waste on a bench was scheduled to be mined over the same duration as the processable material on that bench. This scheduling method resulted in some years with high waste quantities relative to the processable material quantity mined. Ms. Lane of GRE used pre-stripping and phasing, as described above, as much as possible to smooth out the production, but the limitations of the scheduling program resulted in some inefficiencies.
For the economic model, the project was schedule by quarter for any pre-production years and for the first two production years, then by year for the remainder of the mine life. The mining schedule is summarized in Table 16-6 and illustrated in Figure 16-6.
| | 11/8/2021 |
Granite Creek Mine Project
Premier Gold Mines Limited/i-80 Gold Corp. | Page 49
PEA NI 43-101 Technical Report |
Table 16-6: Granite Creek Mine Project Open Pit Base Case Mine Schedule Summary
| Pit/Phase | Year -1 | Year 1 | Year 2 | Year 3 | Year 4 | Year 5 | Year 6 | Year 7 | Total |
| High Grade Heap Leach Tonnes (1000s) |
| B | 119.7 | 1,579.6 | 0.0 | 0.0 | 0.0 | 0.0 | 0.0 | 0.0 | 1,699.3 |
| CX Phase 1 | 121.2 | 1,377.4 | 1,648.3 | 0.0 | 0.0 | 0.0 | 0.0 | 0.0 | 3,146.9 |
| CX Phase 2 | 0.0 | 117.9 | 1,667.2 | 0.0 | 0.0 | 0.0 | 0.0 | 0.0 | 1,785.1 |
| CX Phase 3 | 0.0 | 0.0 | 248.0 | 2,750.7 | 0.0 | 0.0 | 0.0 | 0.0 | 2,998.7 |
| Mag Phase A | 0.0 | 0.0 | 0.0 | 162.9 | 465.6 | 0.0 | 0.0 | 0.0 | 628.5 |
| Mag Phase B | 0.0 | 0.0 | 0.0 | 0.0 | 2,673.4 | 28.4 | 0.0 | 0.0 | 2,701.8 |
| Mag Phase C | 0.0 | 0.0 | 0.0 | 0.0 | 0.0 | 2,353.6 | 23.2 | 0.0 | 2,376.8 |
| Total | 240.9 | 3,074.8 | 3,563.6 | 2,913.6 | 3,139.0 | 2,382.0 | 23.2 | 0.0 | 15,337.0 |
| Low Grade Heap Leach Tonnes (1000s) |
| B | 108.5 | 830.0 | 0.0 | 0.0 | 0.0 | 0.0 | 0.0 | 0.0 | 938.5 |
| CX Phase 1 | 63.2 | 885.9 | 379.3 | 0.0 | 0.0 | 0.0 | 0.0 | 0.0 | 1,328.4 |
| CX Phase 2 | 0.0 | 73.7 | 530.6 | 0.0 | 0.0 | 0.0 | 0.0 | 0.0 | 604.3 |
| CX Phase 3 | 0.0 | 0.0 | 56.2 | 564.3 | 0.0 | 0.0 | 0.0 | 0.0 | 620.6 |
| Mag Phase A | 0.0 | 0.0 | 0.0 | 380.4 | 205.4 | 0.0 | 0.0 | 0.0 | 585.8 |
| Mag Phase B | 0.0 | 0.0 | 0.0 | 3.3 | 384.9 | 0.0 | 0.0 | 0.0 | 388.2 |
| Mag Phase C | 0.0 | 0.0 | 0.0 | 0.0 | 0.0 | 822.7 | 0.0 | 0.0 | 822.7 |
| Total | 171.7 | 1,789.6 | 966.1 | 948.0 | 590.2 | 822.7 | 0.0 | 0.0 | 5,288.4 |
| CIL Tonnes (1000s) |
| B | 49.1 | 294.1 | 0.0 | 0.0 | 0.0 | 0.0 | 0.0 | 0.0 | 343.2 |
| CX Phase 1 | 1.3 | 91.0 | 208.0 | 0.0 | 0.0 | 0.0 | 0.0 | 0.0 | 300.3 |
| CX Phase 2 | 0.0 | 0.9 | 155.3 | 0.0 | 0.0 | 0.0 | 0.0 | 0.0 | 156.2 |
| CX Phase 3 | 0.0 | 0.0 | 17.0 | 462.5 | 0.0 | 0.0 | 0.0 | 0.0 | 479.5 |
| Mag Phase A | 0.0 | 0.0 | 0.0 | 16.6 | 38.2 | 0.0 | 0.0 | 0.0 | 54.9 |
| Mag Phase B | 0.0 | 0.0 | 0.0 | 0.0 | 768.4 | 1,516.4 | 0.0 | 0.0 | 2,284.8 |
| Mag Phase C | 0.0 | 0.0 | 0.0 | 0.0 | 0.0 | 278.8 | 3,418.4 | 0.0 | 3,697.2 |
| Total | 50.4 | 386.0 | 380.3 | 479.1 | 806.7 | 1,795.2 | 3,418.4 | 0.0 | 7,316.0 |
| Waste Tonnes (1000s) |
| B | 7,416.1 | 5,054.1 | 0.0 | 0.0 | 0.0 | 0.0 | 0.0 | 0.0 | 12,470.2 |
| CX Phase 1 | 15,304.8 | 22,095.1 | 10,638.8 | 0.0 | 0.0 | 0.0 | 0.0 | 0.0 | 48,038.6 |
| CX Phase 2 | 0.0 | 10,924.9 | 25,169.1 | 0.0 | 0.0 | 0.0 | 0.0 | 0.0 | 36,094.0 |
| CX Phase 3 | 0.0 | 0.0 | 1,609.8 | 13,342.9 | 0.0 | 0.0 | 0.0 | 0.0 | 14,952.8 |
| | 11/8/2021 |
Granite Creek Mine Project
Premier Gold Mines Limited/i-80 Gold Corp. | Page 50
PEA NI 43-101 Technical Report |
| Pit/Phase | Year -1 | Year 1 | Year 2 | Year 3 | Year 4 | Year 5 | Year 6 | Year 7 | Total |
| Mag Phase A | 0.0 | 0.0 | 0.0 | 4,789.3 | 6,526.5 | 0.0 | 0.0 | 0.0 | 11,315.8 |
| Mag Phase B | 0.0 | 0.0 | 0.0 | 13,559.2 | 20,214.3 | 3,265.2 | 0.0 | 0.0 | 37,038.7 |
| Mag Phase C | 0.0 | 0.0 | 0.0 | 0.0 | 8,784.6 | 22,790.4 | 5,919.9 | 0.0 | 37,494.8 |
| Total | 22,720.9 | 38,074.0 | 37,417.8 | 31,691.4 | 35,525.4 | 26,055.6 | 5,919.9 | 0.0 | 197,404.9 |
| Au Troy Ounces (1000s) |
| B | 13.4 | 108.8 | 0.0 | 0.0 | 0.0 | 0.0 | 0.0 | 0.0 | 122.2 |
| CX Phase 1 | 4.1 | 80.9 | 101.8 | 0.0 | 0.0 | 0.0 | 0.0 | 0.0 | 186.8 |
| CX Phase 2 | 0.0 | 4.4 | 89.7 | 0.0 | 0.0 | 0.0 | 0.0 | 0.0 | 94.1 |
| CX Phase 3 | 0.0 | 0.0 | 13.5 | 191.3 | 0.0 | 0.0 | 0.0 | 0.0 | 204.8 |
| Mag Phase A | 0.0 | 0.0 | 0.0 | 13.2 | 25.4 | 0.0 | 0.0 | 0.0 | 38.6 |
| Mag Phase B | 0.0 | 0.0 | 0.0 | 0.0 | 173.6 | 93.2 | 0.0 | 0.0 | 266.9 |
| Mag Phase C | 0.0 | 0.0 | 0.0 | 0.0 | 0.0 | 100.4 | 185.9 | 0.0 | 286.3 |
| Total | 17.4 | 194.1 | 205.0 | 204.5 | 199.0 | 193.6 | 185.9 | 0.0 | 1,199.7 |
| | 11/8/2021 |
Granite Creek Mine Project
Premier Gold Mines Limited/i-80 Gold Corp. | Page 51
PEA NI 43-101 Technical Report |
Figure 16-6: Granite Creek Mine Project Base Case Mine Schedule
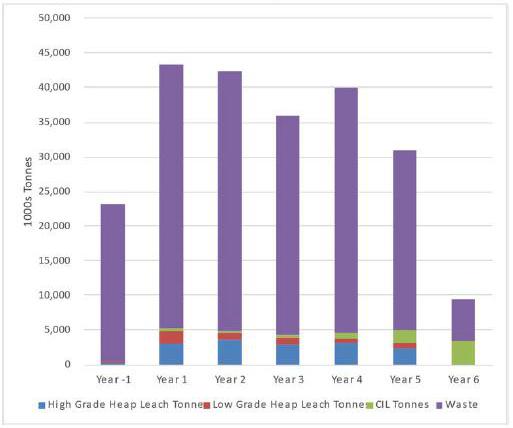
| 16.1.8 | Mine Operation and Layout |
Limited facilities for administrative offices, warehouse, and other facilities are present at the site near. Other facilities, such as crushing, the leach pad, the ADR and CIL plants will need to be constructed.
Ms. Lane of GRE developed conceptual layouts for the project, including waste dump locations and sizes, leach pad location and size, tailings storage facility, and stockpile locations and sizes. Figure 16-7 illustrates the conceptual project layout with pits, pads, and dumps. Phased site layout plans by year for the duration of open pit mining are shown in Figure 16-8through Figure 16-13.
| | 11/8/2021 |
Granite Creek Mine Project
Premier Gold Mines Limited/i-80 Gold Corp. | Page 52
PEA NI 43-101 Technical Report |
Figure 16-7: Conceptual Project Layout
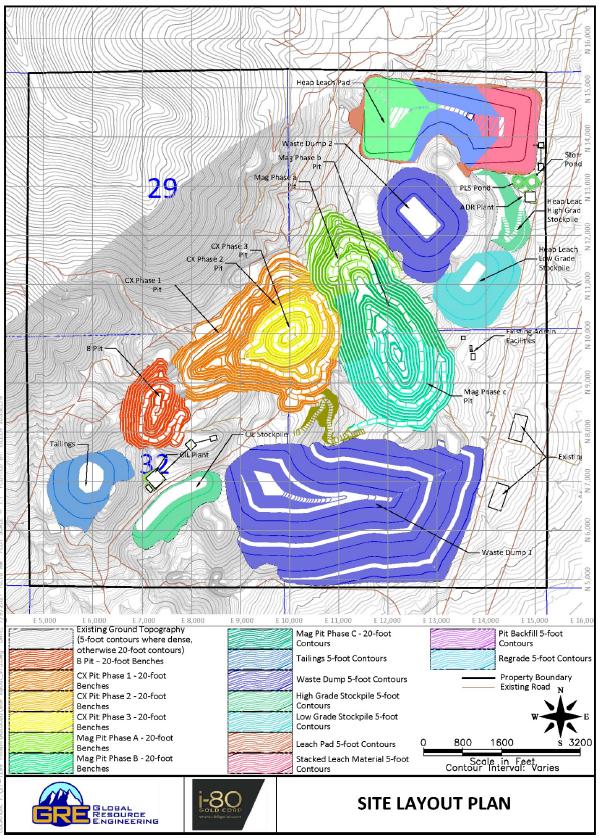
| | 11/8/2021 |
Granite Creek Mine Project
Premier Gold Mines Limited/i-80 Gold Corp. | Page 53
PEA NI 43-101 Technical Report |
Figure 16-8: Phased Pit and Site Plan Layout Year -1
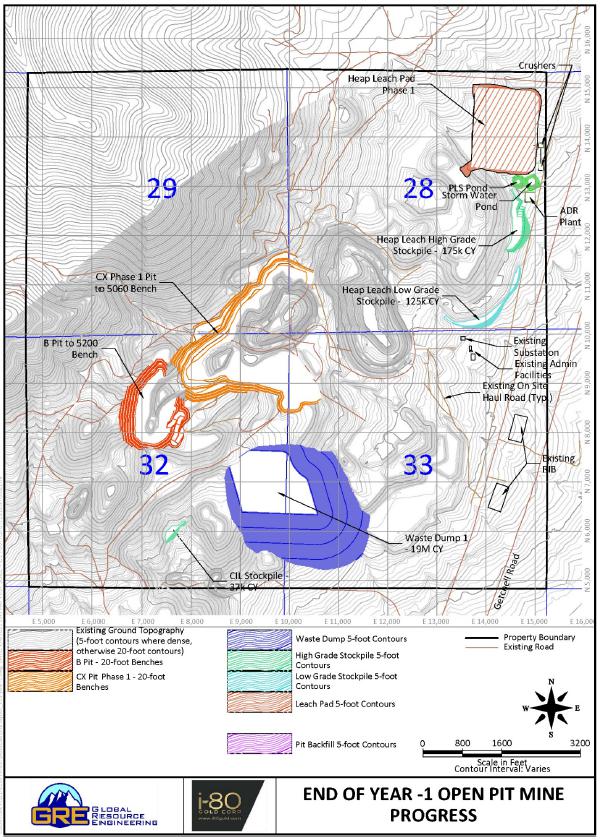
| | 11/8/2021 |
Granite Creek Mine Project
Premier Gold Mines Limited/i-80 Gold Corp. | Page 54
PEA NI 43-101 Technical Report |
Figure 16-9: Phased Pit and Site Plan Layout Year 1
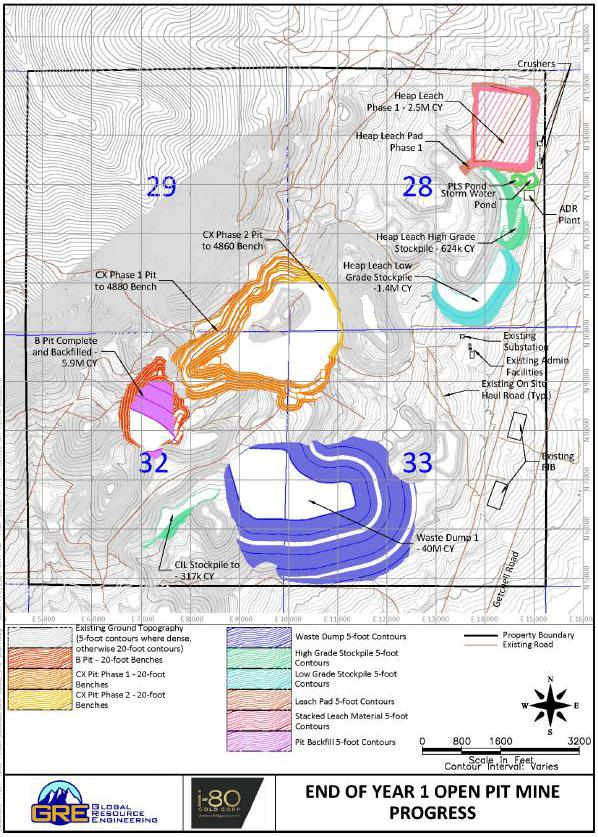
| | 11/8/2021 |
Granite Creek Mine Project
Premier Gold Mines Limited/i-80 Gold Corp. | Page 55
PEA NI 43-101 Technical Report |
Figure 16-10: Phased Pit and Site Plan Layout Year 2
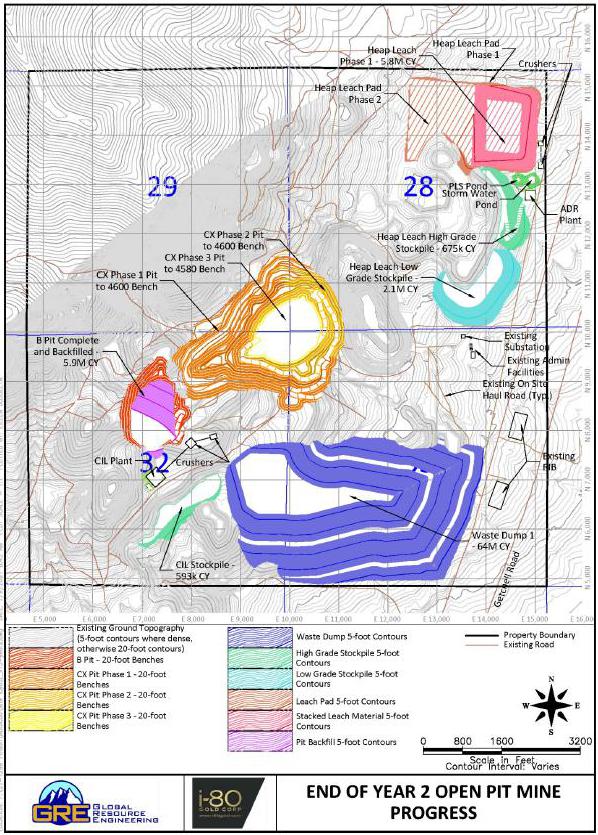
| | 11/8/2021 |
Granite Creek Mine Project
Premier Gold Mines Limited/i-80 Gold Corp. | Page 56
PEA NI 43-101 Technical Report |
Figure 16-11: Phased Pit and Site Plan Layout Year 3
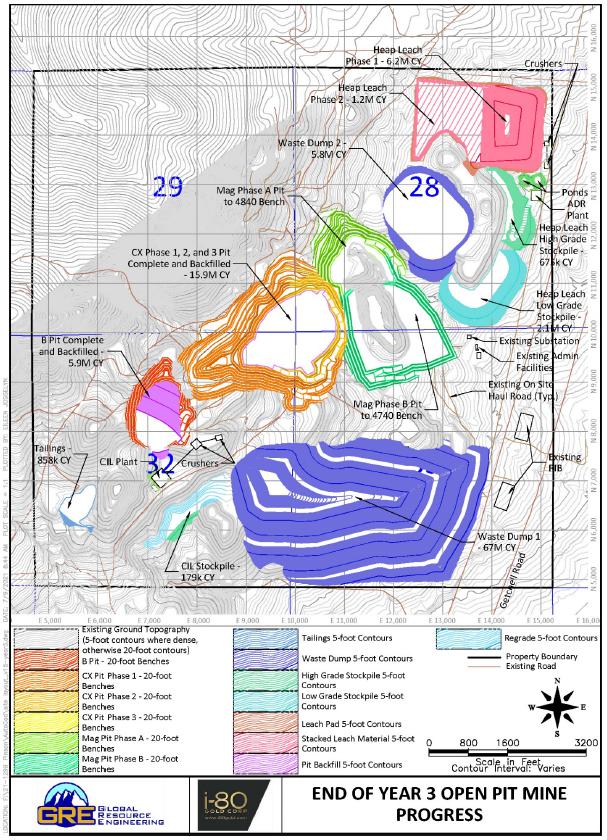
| | 11/8/2021 |
Granite Creek Mine Project
Premier Gold Mines Limited/i-80 Gold Corp. | Page 57
PEA NI 43-101 Technical Report |
Figure 16-12: Phased Pit and Site Plan Layout Year 4
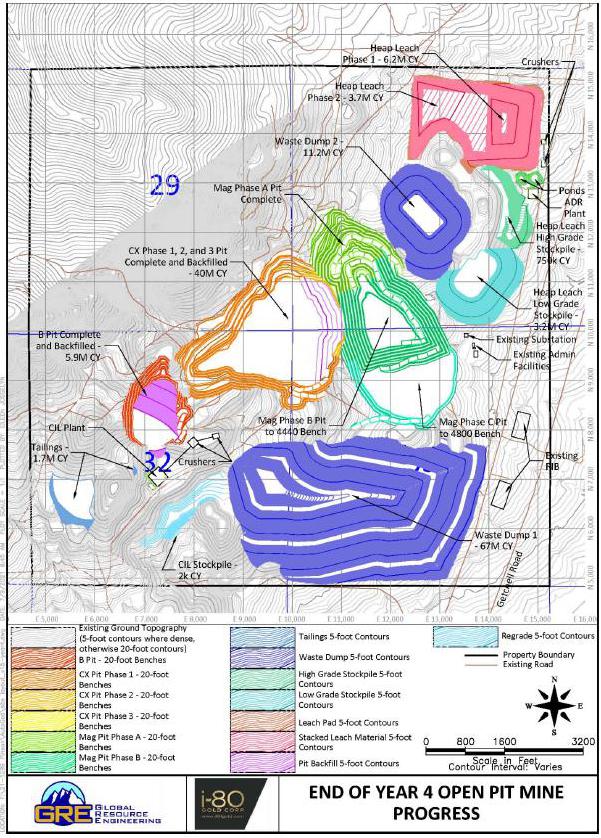
| | 11/8/2021 |
Granite Creek Mine Project
Premier Gold Mines Limited/i-80 Gold Corp. | Page 58
PEA NI 43-101 Technical Report |
Figure 16-13: Phased Pit and Site Plan Layout Year 5
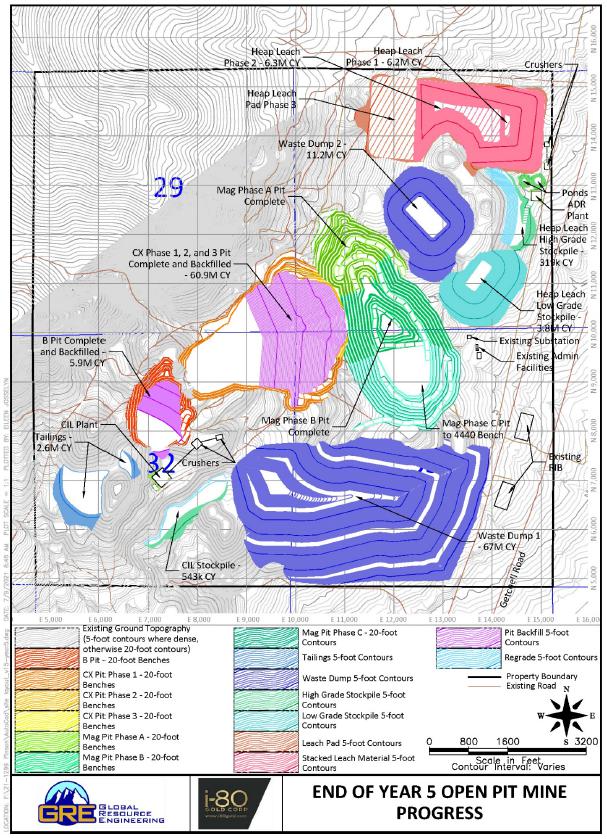
| | 11/8/2021 |
Granite Creek Mine Project
Premier Gold Mines Limited/i-80 Gold Corp. | Page 59
PEA NI 43-101 Technical Report |
Figure 16-14: Phased Pit and Site Plan Layout Year 6

| | 11/8/2021 |
Granite Creek Mine Project
Premier Gold Mines Limited/i-80 Gold Corp. | Page 60
PEA NI 43-101 Technical Report |
Figure 16-15: Phased Pit and Site Plan Layout Year 7
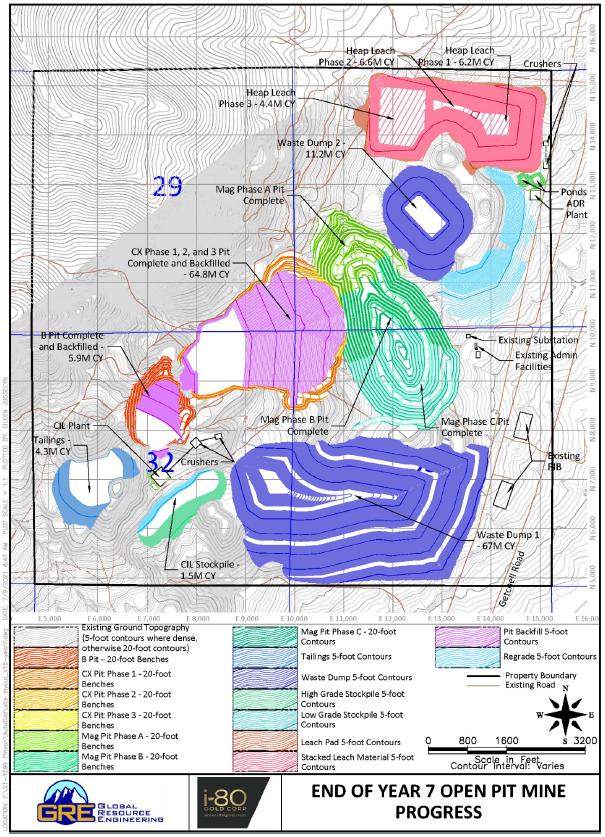
| | 11/8/2021 |
Granite Creek Mine Project
Premier Gold Mines Limited/i-80 Gold Corp. | Page 61
PEA NI 43-101 Technical Report |
Figure 16-16: Phased Pit and Site Plan Layout Year 8
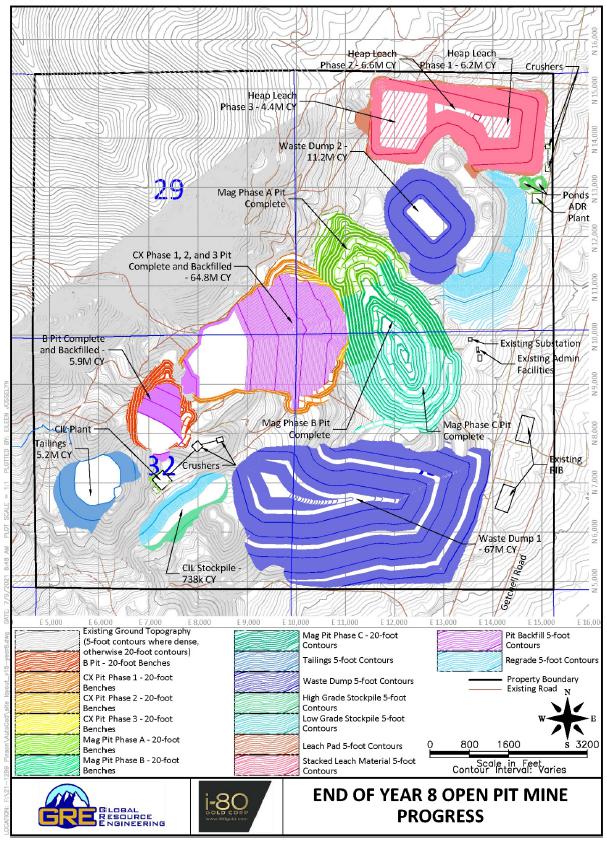
| | 11/8/2021 |
Granite Creek Mine Project
Premier Gold Mines Limited/i-80 Gold Corp. | Page 62
PEA NI 43-101 Technical Report |
Figure 16-17: Phased Pit and Site Plan Layout Year 9
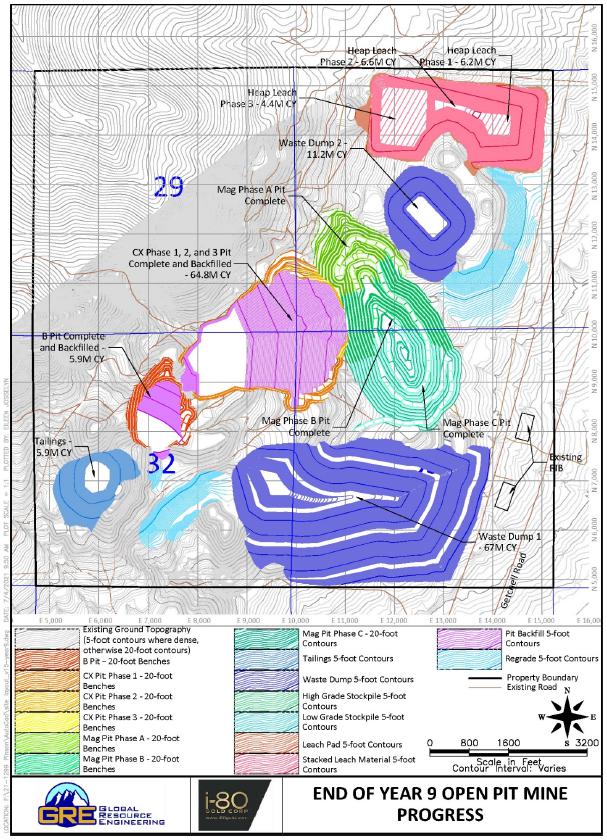
| | 11/8/2021 |
Granite Creek Mine Project
Premier Gold Mines Limited/i-80 Gold Corp. | Page 63
PEA NI 43-101 Technical Report |
To store the waste material generated during mining activities, two waste rock piles are proposed. The waste piles would be located south of the CX pit and east of the Mag pit. Additionally, as mining progresses, waste rock would be backfilled in portions of the mined-out B and CX pits. These locations are selected to minimize hauling distances and disturbed acreage. Up to approximately 78 million loose cy (approximately 108 million tonnes) of waste rock would be mined and placed into the waste rock piles and approximately 73 million cy (approximately 100 million tonnes) would be backfilled into mined out pits. Waste rock piles would be engineered to have overall final 3H:1V ultimate slopes.
The heap leach facility would be located on the northeast corner of the current property boundary. Ms. Lane of GRE has designed the structure with a maximum capacity of 23.5 million tonnes. The heap leach facility would be constructed as detailed in Section 17.0 by stacking lifts to a maximum height of 200 feet and with overall final 3H:1V ultimate slopes.
| 16.1.10 | Tailings Storage Facility |
The dry stack tailings storage facility would be located on the southwest corner of the current property boundary. Ms. Lane of GRE has designed the structure with a maximum capacity of 6.6 million loose cy (approximately 8.1 million tonnes). The dry stack tailings facility would be engineered to have overall final 3H:1V ultimate slopes.
| 16.1.11 | Drilling and Blasting |
Fresh mineralized material and waste rock is comprised of a mix of shale, limestone, dolomite, conglomerates, and granodiorite. All of this material would require drilling and blasting prior to excavation. Some areas within the pits to be excavated consist of alluvium or previous backfill; those areas would not require drilling and blasting, except to the extent drill holes are needed for grade control.
Drilling and blasting would employ conventional techniques, which would entail drilling 7-inch diameter blastholes spaced on 18-foot centers. The rock would be blasted with ammonium nitrate fuel oil (ANFO) blasting agent initiated with shock tube, boosters, and nonel blasting caps. Potential noise and dust from blasting is not anticipated to impact the surrounding community due to the project’s remote location far away from residential or commercial structures.
| 16.1.12 | Loading and Hauling |
The blasted rock or backfill would be loaded with a 17 cy capacity front end loader into 140-tonne capacity haul trucks.
Haulage pit ramps were designed with a minimum width of 88 feet and a maximum gradient of 12 percent. Haul ramps and roads have been designed to accommodate two-way traffic using 140-tonne haul trucks, water diversion ditches, and safety berms. Minor sections of temporary ramping for development purposes may be steeper and narrower. Haulage roads outside of the pit areas would typically be 100 feet wide, and in some areas would be up to 150 feet wide to allow for turning lanes, surface drainage, and separate lanes for auxiliary vehicle traffic. A minimum cross slope of 2% on haul roads will accommodate water drainage.
| | 11/8/2021 |
Granite Creek Mine Project
Premier Gold Mines Limited/i-80 Gold Corp. | Page 64
PEA NI 43-101 Technical Report |
| 16.1.14 | Mining Mobile Equipment |
A variety of mobile equipment likely to be used in conducting mining operations is presented in Table 16-7.
Table 16-7: Granite Creek Mine Project Open Pit Mobile Equipment Sizes and Quantities
| Major Equipment | Max Quantity |
| Loader CAT 993K | 4 |
| Haul Truck CAT 785D | 24 |
| Bulldozer CAT D10 | 3 |
| Drill | 3 |
| Support Equipment | |
| Wheel Dozer | 1 |
| Wheel Loader | 1 |
| Water Truck | 2 |
| ANFO Truck | 1 |
| Lube Truck | 2 |
| Mechanics Truck | 2 |
| Grader | 1 |
| Minor Equipment | |
| Small Excavator | 1 |
| Backhoe | 1 |
| Small Crane | 1 |
| Light Plant | 6 |
| Dewatering Pump | 2 |
| 4x4 Pickup | 10 |
Equipment sizes and quantities may vary slightly over the life of the mine in response to changes in stripping ratios, haul distances, or other factors.
The Granite Creek Mine Project has a zone of high grade material suitable for underground mining. The zone exists near the intersection of the Range Front, Adams Peak, and Cx West Faults. The steep hill nearby makes a pit for this resource untenable due to a very large stripping ratio. The planned stopes and development are featured in Figure 16-18.
| | 11/8/2021 |
Granite Creek Mine Project
Premier Gold Mines Limited/i-80 Gold Corp. | Page 65
PEA NI 43-101 Technical Report |
Figure 16-18: Pinson Underground Mine Layout
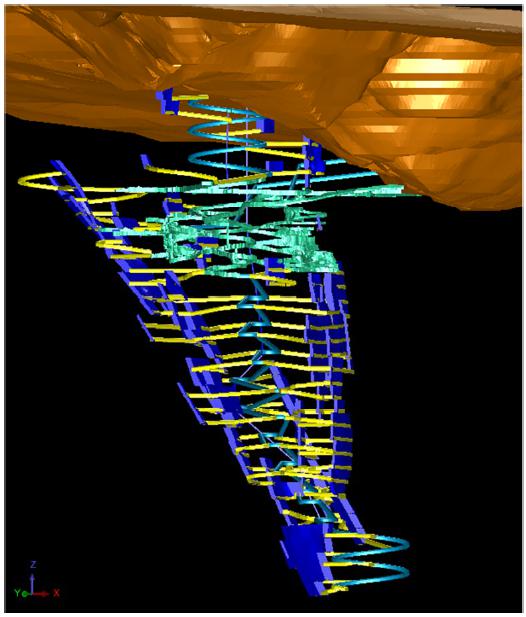
| 16.2.1 | Underground Mining Methods |
Three methods were considered for the Granite Creek Mine Project: Overhand Cut and Fill, Underhand Cut and Fill, and Longhole Stoping. Each method has a situational usefulness that can be applied when criteria are met. Underhand Cut and Fill will be used when the ground conditions are very poor. Overhand Cut and Fill will be used when the ground is stable, and the stope is narrow. Longhole Stoping will be used when rock quality is good and the stope is wide.
| 16.2.2 | Overhand Cut and Fill |
The underground mining method at Pinson will involve mining stopes sized 50 feet in height and 100 feet in length. Mining is fully mechanized with mobile equipment. Figure 16-19 shows an example of this type of mining. An access drift is driven through the bottom of the stope. Then, blast holes are drilled in the back of the drift and blasted. Once this mineralized material is mucked, backfill is placed to use as a working platform for the next cut and to stabilize the hanging wall and footwall of the open stope.
| | 11/8/2021 |
Granite Creek Mine Project
Premier Gold Mines Limited/i-80 Gold Corp. | Page 66
PEA NI 43-101 Technical Report |
Figure 16-19: Typical Stope
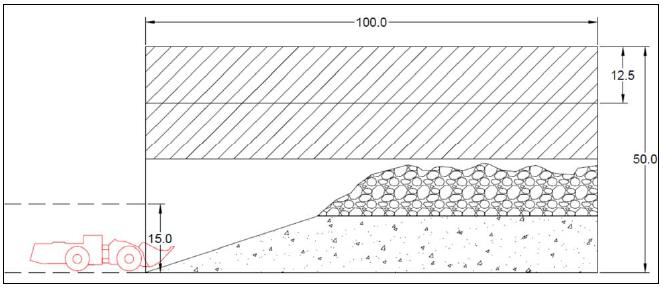
This method was chosen for its ability to mine a semi-narrow deposit with little dilution from the low grade or barren wall rock.
Development required to access stopes consists of ramps, level drifts, and ventilation excavations. The previous underground workings at the site will provide initial access and fulfill ventilation requirements in the early stages of the mine.
| 16.2.2.1 | Underhand Cut and Fill |
Underhand mining is used in areas of poor rock quality. The reason being that mining work takes place under a cemented, reinforced backfill that will remain intact when the surrounding wall rock fails. This method costs more, but is a far safer alternative. shows a typical Underhand Cut and Fill stope.
Figure -: Typical Underhand Cut and Fill Stope
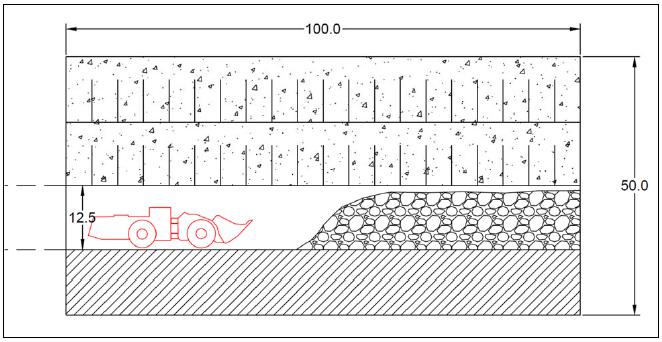
| | 11/8/2021 |
Granite Creek Mine Project
Premier Gold Mines Limited/i-80 Gold Corp. | Page 67
PEA NI 43-101 Technical Report |
Longhole Stoping will be used in areas of the mine where the average stope width is wide enough to allow full stope recovery and where the surrounding wall rock is competent enough to permit large, open stopes. shows an example of a typical longhole stope. Alternative bulk underground mining methods that can be used include long hole stoping with delayed fill, and AVOCA stoping methods.
Figure 16-20: Typical Longhole Stope
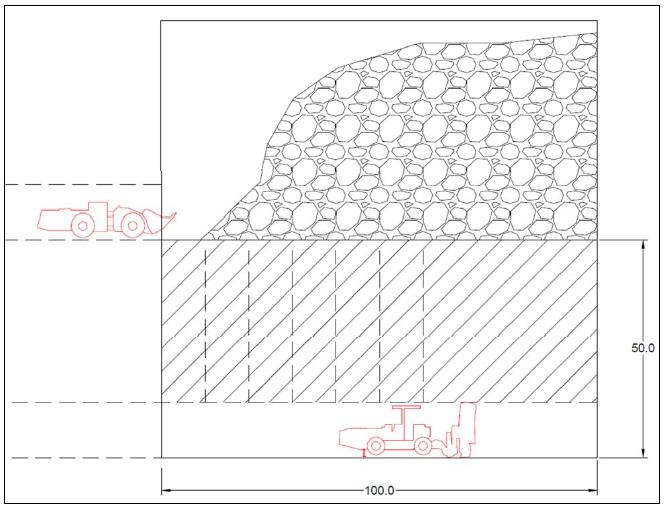
The production was scheduled to take stopes near or directly adjacent to existing underground development for an economically advantageous low cost of development.
Stopes are designed at dimensions of 50 feet in height, 100 feet in length, and a minimum of 10 feet wide. In places where the width of the vein was less than 10 feet, the stope incorporated the grade of the surrounding rock as dilution instead of an implied grade of 0 grams per tonne of gold. An example of a typical stope can be seen in Figure 16-19.
The typical planned dilution percentages and mineralized material loss are:
| | 11/8/2021 |
Granite Creek Mine Project
Premier Gold Mines Limited/i-80 Gold Corp. | Page 68
PEA NI 43-101 Technical Report |
| • | Wall Dilution: varies, 1 foot on both hanging wall and footwall sides |
| • | Mineralized material loss: 5% |
Development is sequenced to ensure that all necessary excavations are complete before production on a given level begins.
Ramps are driven at a 12% decline grade. A 10% allotment was included for muck bays, cutouts and passing areas to avoid equipment traffic congestion. Ramps are spaced far enough from production areas and other ramp areas to prevent geotechnical problems and are driven in the waste rock between mineralized areas. Ramp headings are 15 feet by 15 feet.
Level access drifts are driven horizontally and at a maximum of 12% to accommodate the elevation difference between the nearest ramp and the working level. Drifts connect utilities and ventilation from the ramp to production areas. Access drift headings are 15 feet by 15 feet.
Production drifts are driven through stopes to provide access to the ends of stopes and for the initial stope cut. Production drifts are 15 by 15 feet.
Ventilation shafts connect to ramps via a vent access drift nearly identical to the level access drifts. Ventilation shafts connect the ramp levels to the surface for a supply of fresh air. Shafts are driven from lower to higher elevations with an Alimak system. Vent shaft headings are 5 by 5 feet.
Horizontal development and production drilling is done with jumbo drill rigs. However, the drilling pattern for the development and production is different.
Blasting will utilize a mixture of ANFO and emulsion. The ANFO will be loaded into holes using a pneumatic loader, and the emulsion will be packaged in sticks to allow loading. Blasting will be initiated using blasting caps, boosters, and detonation cord. Blasting should be timed so that it coincides with entry and exit of employees to allow sufficient time for the ventilation system to clear contaminated air from the previous blast.
Mucking will be done with load-haul-dump (LHD) equipment. The LHD will muck the working face by tramming to a muck bay, where material will be rehandled and loaded into a haul truck that hauls to the surface.
| 16.2.6 | Productivity and Fleet Size |
Productivity estimates and tonnages were used to determine the number of operating hours required by equipment type. Equipment quantities were then estimated based on the number of required operating hours and the number of hours each piece of equipment can operate during a period, see Table 16-8.
| | 11/8/2021 |
Granite Creek Mine Project
Premier Gold Mines Limited/i-80 Gold Corp. | Page 69
PEA NI 43-101 Technical Report |
Table 16-8: Underground Contractor Fleet Size
| Equipment | Quantity |
| LHD 3.5 to 4.5 cu yd | 2 |
| LHD 5.0 to 6.5 cu yd | 3 |
| Haul Truck 23.5 to 34 cu yd | 4 |
| Jumbo DD321-40 | 2 |
| Longhole Drill DL311 | 1 |
| Rockbolter DS311 | 2 |
| Boom Truck Mine Mate BT3 | 1 |
| Fuel/Lube Mine Mate FL3 | 1 |
| Shotcreter Mine Mate SS3 | 1 |
| Personnel Carrier | 1 |
| Scissor Lift Mine Mate SL3 | 1 |
| Transmixer Mine Mate TM3 | 1 |
| Emulsion Loader Mine Mate EC3 | 1 |
| Grader CAT12M | 1 |
| Kubota side by side | 5 |
| Mechanics Runaround | 1 |
| Rescue/First Aid | 1 |
| Telehandler CAT TH407C | 1 |
| Sanitation Mine Mate CS3 Cassette | 1 |
The summary of the number of employees for each category and the total number of employees needed for the operation is listed in Table 16-9.
Table 16-9: Underground Labor by Year
| Position | -1 | 1 | 2 | 3 | 4 | 5 |
| Driller | 3 | 10 | 9 | 10 | 10 | 8 |
| Development Miner | 3 | 17 | 16 | 17 | 17 | 15 |
| UG Equipment Operator | 0 | 7 | 7 | 7 | 7 | 7 |
| Truck Driver | 0 | 12 | 12 | 12 | 12 | 12 |
| Laborer | 0 | 16 | 16 | 16 | 16 | 16 |
| Mechanic | 0 | 18 | 18 | 18 | 18 | 17 |
| Electrician | 0 | 0 | 0 | 0 | 0 | 0 |
| Exploration Drilling | 0 | 8 | 8 | 0 | 0 | 0 |
The mine will operate on two twelve-hour shifts 365 days per year. Target production is 7 stopes mined simultaneously for a production goal of 1,090 tonnes per day.
| | 11/8/2021 |
Granite Creek Mine Project
Premier Gold Mines Limited/i-80 Gold Corp. | Page 70
PEA NI 43-101 Technical Report |
Table 16-10: Underground Production by Year
| Item | -1 | 1 | 2 | 3 | 4 | 5 |
| Waste Tonnes | 160,393 | 141,021 | 66,700 | 236,837 | 45,306 | 3,657 |
| Ore Tonnes | 0 | 397,762 | 397,762 | 397,762 | 314,570 | 25,822 |
| Au grams | 0 | 3,058,743 | 3,439,258 | 3,525,345 | 2,503,833 | 220,824 |
| Au troy oz | 0 | 98,341 | 110,575 | 113,342 | 80,500 | 7,100 |
| Ore tonnes per day | 0 | 1,090 | 1,090 | 1,090 | 862 | 71 |
| Au g/t | 0.00 | 7.69 | 8.65 | 8.86 | 7.96 | 8.55 |
Table 16-11: Length of Underground Development Types by Year
| Item | -2 | -1 | 1 | 2 | 3 | 4 | 5 |
| Ramp (m) | 0 | 2,549 | 823 | 0 | 2,530 | 370 | 0 |
| Vent Raise (m) | 0 | 167 | 226 | 78 | 168 | 36 | 0 |
| Level Access (m) | 0 | 753 | 2,032 | 1,358 | 2,341 | 557 | 76 |
| Vent Access (m) | 0 | 17 | 53 | 22 | 41 | 12 | 0 |
| Production Drift (m) | 0 | 564 | 1,882 | 2,115 | 2,278 | 1,254 | 115 |
Underground development and production will take place below the groundwater table. It is expected that as the workings progress deeper, the flow rate will increase. It is also noted that seasonal changes will affect the groundwater inflow but that this will be largely limited to shallower workings. Dewatering pumps will be needed to remove the groundwater. Groundwater discharge will need to be managed as per applicable local laws and regulations.
The current ventilation plan is designed to supply fresh air down the ramp to active areas and to exhaust through vent raises using two 150-horsepower main fans per mining area. The number and size of ventilation fans is based on the number of active faces and total horsepower of major equipment. An example of air flow is shown in Figure 16-21 and Figure 16-22 shows an isometric view of the mine ventilation system. Green development represents the fresh air delivery via ramp, and red denotes the air exhausting to the surface by ventilation shaft.
| | 11/8/2021 |
Granite Creek Mine Project
Premier Gold Mines Limited/i-80 Gold Corp. | Page 71
PEA NI 43-101 Technical Report |
Figure 16-21: Typical Ventilation of a Stope
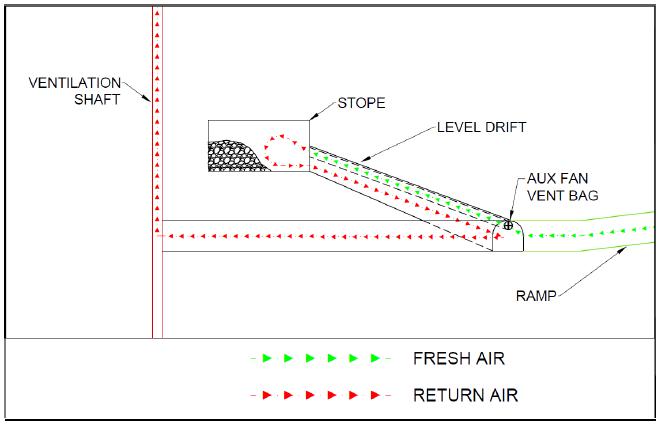
Figure 16-22: Isometric View of Ventilation Plan
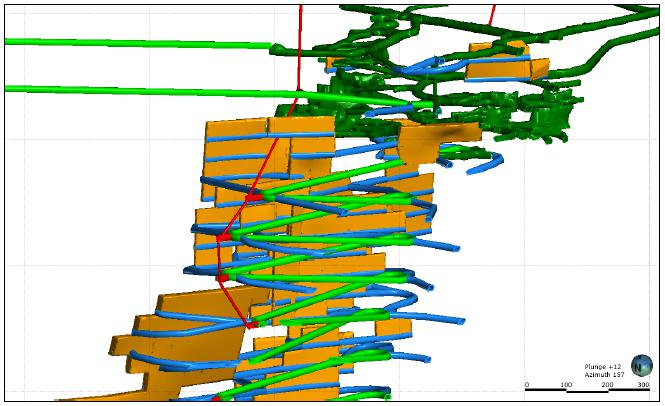
| | 11/8/2021 |
Granite Creek Mine Project
Premier Gold Mines Limited/i-80 Gold Corp. | Page 72
PEA NI 43-101 Technical Report |
| 17.1 | Heap Leach Process Description |
The Granite Creek Mine Project would employ open pit mining with a conventional heap leach system on a 365 day per year 24 hour per day basis. The heap leach will use crushed ROM material at a nominal size of 2 inches (51 mm). The crushed material would be agglomerated with lime and cement, as necessary, and transported to the heap leach via conveyor belt.
The heap leach would consist of a suitable area lined with a containment system, typically a linear low-density polyethylene (LLDPE) liner with an over liner of sized material to facilitate drainage and to protect the liner during initial stacking. Drainage pipes would be placed within this over liner to conduct the leach solution to the centralized solution collection ponds. The crushed material would be stacked in lifts on the lined pad by a radial stacker. The stacker would be fed by a series of jump or grasshopper conveyors that would be fed from the agglomeration. The lifts are targeted at 20 feet (6 meters) in height, with a total heap height of 200 feet (60 meters). Once a suitable area has been stacked (cell), the cell would be irrigated with dilute cyanide solution. Stacking would continue to advance, and each area irrigated with cyanide solution for a set period (primary leach cycle). The solution leaches gold and silver from the heap materials and is transported to the recovery circuit as pregnant leach solution (PLS).
This pregnant leach solution would be collected in a dedicated pond and either recirculated or processed in the Adsorption-Desorption-Recovery plant (ADR). The gold in the solution would be collected on activated carbon in a series of five carbon-in-column (CIC) vessels. The depleted “barren” solution would report back to the heap leach barren pond and have the reagent levels adjusted prior to being recirculated back to the heap.
Once the gold level on the carbon in the CIC circuit reaches a specific setpoint (e.g., 3,000 g/t in the lead column), the carbon is advanced and a set amount removed for gold recovery. Gold recovery would take place through stripping the activated carbon using a specifically designed process (ZADRA or Anglo American Research Laboratory are typical). The gold would be stripped from the carbon into an enriched solution that reports to an electrowinning circuit where the gold is recovered as a sludge that is ultimately smelted into high purity gold bars.
The heap leach is typically designed to have multiple lifts installed. Each new lift goes on top of the last lift until the heap reaches its ultimate height. The Pinson heap leach is targeting 200 feet (60 meters). The configuration of the heap leach is heavily dependent on the permeability characteristics of the material, the terrain available, and the geotechnical aspects of the site shows the conceptual flowsheet.
| | 11/8/2021 |
Granite Creek Mine Project
Premier Gold Mines Limited/i-80 Gold Corp. | Page 73
PEA NI 43-101 Technical Report |
Figure 17-1: Conceptual Heap Leach Flowsheet
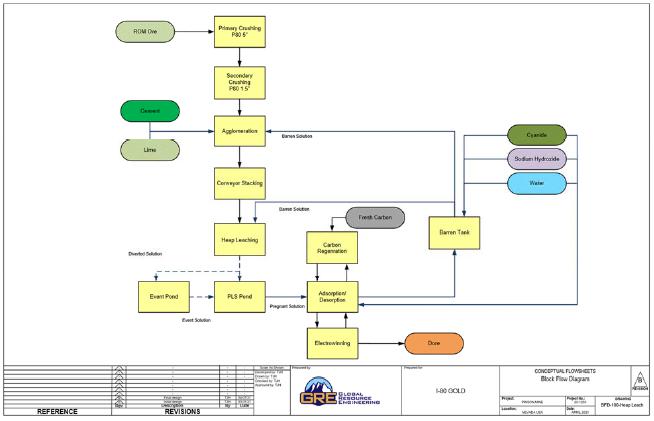
| | 11/8/2021 |
Granite Creek Mine Project
Premier Gold Mines Limited/i-80 Gold Corp. | Page 74
PEA NI 43-101 Technical Report |
The crusher has been designed to process approximately 9,370 short tons per day (tpd) (8,500 metric tonnes per day) on a 24-hour basis. The design crushing rate would be 389 short tons per hour (354 metric tonnes per hour).
The run of mine feed would pass over a vibrating grizzly with a 6-inch (150-mm) opening. The undersize would report directly to the jaw crusher discharge conveyor while the oversize would feed the jaw crusher. The jaw crusher would crush to a nominal 6-inch (150-mm), with the crushed product reporting to a vibrating screen for scalping undersize prior to secondary crushing. The double-deck screen would be equipped with a top deck with 4-inch (100-mm) openings and the lower deck with 2-inch (51-mm) openings. The screen undersize would report to the final product conveyor, and the screen oversize would be fed to a HP 500 crusher, or equivalent, with a closed side setting of 1 inch (25 mm). The discharge from the crushers would fall onto the final product conveyor. The secondary crushing circuit would be operated in open circuit. This crushing circuit would be capable of achieving a product of 100% passing two inches or a P80 of approximately 1½ inches (37.5 mm).
The final crushed product would be conveyed to a rotary drum agglomerator. Barren cyanide solution and cement/lime would be added to the material prior to mixing. The target would be to deliver approximately 50% of the total cyanide demand to the material while not exceeding 8 to 10% moisture by weight. The agglomerated material would be conveyed via a combination of overland and grasshopper conveyors to a prepared permanent leach pad.
The material would be stacked using a slewing radial stacker to lift heights of 20 feet (6 meters). Stacking would be conducted in retreat mode during the creation of each leach cell. The agglomerated mixture would be allowed to cure for several days prior to solution application.
Material would be stacked for a sufficient period to allow enough surface area to be created for irrigation; this also allows operations personnel to be a safe distance from active irrigation areas. Irrigation would be provided by an emitter-type irrigation system designed to deliver 0.005 gallons per minute per square foot (gpm/ft2) (12 liters per hour per square meter [lph/m2]). The emitter layout is designed to provide suitable material wetting. The heap would be placed under primary irrigation for a period of approximately 60 days. After the primary leach, irrigation would be discontinued and advanced to the next cell. No rinse phase is included because of the multiple lift system employed. Subsequent lifts would be placed on top of the previous lift up to a total of 10 lifts. Rinsing will be conducted as part of the final closure.
The precious metal leach solution or pregnant leach solution would flow from the heap leach pad to the PLS sump by gravity. The solution would be pumped from the sump to the recovery circuit. Excess solution would be diverted to the PLS pond. Solution would be collected from each heap cell by a series of drainpipes under the heap that transport the solution to perimeter piping. The solution can be directed to either the PLS or Event Pond piping. Storm water collected from the pad during heavy precipitation events can be diverted to an event pond. The storm water can be used as fresh make up water to the circuit.
| | 11/8/2021 |
Granite Creek Mine Project
Premier Gold Mines Limited/i-80 Gold Corp. | Page 75
PEA NI 43-101 Technical Report |
| 17.1.4 | Adsorption, Desorption, Recovery (ADR) |
During normal operations, PLS solution would be pumped to the CIC tanks. The CIC circuit would consist of one train of five CIC vessels, each containing four tons of carbon. Carbon is advanced counter current to the PLS flow as the first tank in the series reaches its loading limit. The target carbon loading would be 3,000 g/t of gold. Carbon would be advanced by recessed impeller pumps.
The loaded carbon from the first tank would be pumped across the loaded carbon screen to the acid wash column. The screen under flow would be returned to the PLS flow. Fine carbon from the screen underflow would be stockpiled and sent for separate off-site recovery.
The barren solution exiting the last of the CIC vessels would be returned to the heap leach barren solution pond after passing through a carbon safety screen. Loaded carbon would be acid washed with dilute nitric acid to remove calcium and adsorbed metals. Spent acid would be neutralized and disposed. After acid washing, the carbon would be passed to an elution column. Elution would be conducted by the modified ZADRA system. A solution of caustic and cyanide would be passed through the elution column to remove the adsorbed gold. The rich electrolyte would be pumped to electrowinning cells, where the gold and silver are recovered on the cathodes. The cathodes would be washed, and the recovered sludge would be refined in a conventional induction furnace after drying. The circuit is designed to conduct two strip cycles per day. The doré produced would be assayed and stored in a vault before being shipped off-site for payment.
Barren carbon from the elution column would be returned to the CIC circuit after passing across a carbon sizing screen. Fine carbon from the screen underflow would be stockpiled and sent for separate off-site recovery. Approximately 50% of the barren carbon would report to an indirect fired kiln for thermal regeneration. The regenerated carbon would report to a quench tank before being pumped to the carbon sizing screen. Fresh makeup carbon would be first sent to an attrition tank for fines removal before being pumped to the carbon sizing screen. The fine carbon from the screen underflow would be captured in a plate and frame filter.
| 17.1.5 | Conceptual Heap Leach Pad and Pond Design |
The heap leach facility (HLF) would consist of the following system components:
| • | Leachate (solution) collection system |
| • | Stormwater management system |
To minimize capital expenditure, the heap leach pad has been designed in phases, with each phase requiring advanced expansion of the engineered pad. The HLF would be constructed in three phases, with the pad foundation preparation, liner installation, and collection piping advanced as the leach pad expands. The capacity of each stacking stage includes an initial three-year period and two additional two-year periods.
| | 11/8/2021 |
Granite Creek Mine Project
Premier Gold Mines Limited/i-80 Gold Corp. | Page 76
PEA NI 43-101 Technical Report |
The initial HLF development (Phase 1) would also include the full development of the solution handling system, storm pond, and perimeter diversion ditches prior to commencing material stacking and leaching. Table 17-1 shows the development phases and the lift capacity in material volume and duration. Design details for each of the HLF components are discussed further in the following sections.
Table 17-1: Heap Capacity
| Development Phase | Elevation (abs meters) | Lift Capacity (days) | Mine Life (years) | Material Volume |
| (m3) | (cumulative m3) |
| 1 | 6 | 214 | 0.6 | 1,164,369 | 1,164,369 |
| 12 | 387 | 1.1 | 945,129 | 2,109,498 |
| 18 | 525 | 1.4 | 748,416 | 2,857,914 |
| 24 | 630 | 1.7 | 574,230 | 3,432,144 |
| 30 | 707 | 1.9 | 422,570 | 3,854,713 |
| 36 | 761 | 2.1 | 293,436 | 4,148,149 |
| 42 | 796 | 2.2 | 186,827 | 4,334,976 |
| 48 | 814 | 2.2 | 102,738 | 4,437,714 |
| 52 | 822 | 2.3 | 41,149 | 4,478,863 |
| 2 | 6 | 1039 | 2.8 | 1,183,999 | 5,662,863 |
| 12 | 1238 | 3.4 | 1,080,013 | 6,742,875 |
| 18 | 1417 | 3.9 | 976,026 | 7,718,901 |
| 24 | 1577 | 4.3 | 872,038 | 8,590,939 |
| 30 | 1718 | 4.7 | 768,051 | 9,358,990 |
| 36 | 1840 | 5.0 | 664,063 | 10,023,053 |
| 42 | 1942 | 5.3 | 560,076 | 10,583,128 |
| 48 | 2026 | 5.6 | 456,091 | 11,039,219 |
| 54 | 2091 | 5.7 | 352,126 | 11,391,345 |
| 60 | 2137 | 5.9 | 250,232 | 11,641,578 |
| 3 | 6 | 2272 | 6.2 | 739,989 | 12,381,566 |
| 12 | 2396 | 6.6 | 674,995 | 13,056,562 |
| 18 | 2508 | 6.9 | 610,002 | 13,666,564 |
| 24 | 2608 | 7.1 | 545,008 | 14,211,571 |
| 30 | 2696 | 7.4 | 480,012 | 14,691,583 |
| 36 | 2773 | 7.6 | 415,016 | 15,106,599 |
| 42 | 2837 | 7.8 | 350,017 | 15,456,616 |
| 48 | 2889 | 7.9 | 285,015 | 15,741,631 |
| 54 | 2929 | 8.0 | 220,006 | 15,961,637 |
The heap leach pad would consist of a perimeter berm, pad liner system, and leachate collection system to collect and convey the leachate solution to the ADR plant, which should be located adjacent to the heap leach facility. The leach pad would have an approximate final footprint area of 5,651,052 square feet (525,000 square meters). The heap leach pad is designed to be operated as a fully drained system with no leachate storage within the HLF. Prior to the start of each of the development stages, the pad foundation must be prepared. Foundation preparation involves stripping the topsoil and vegetation and removal of any rocks. The topsoil would be stockpiled at a convenient location and used for reclamation of the HLF area at closure. The underlying soils would be excavated down to a competent, stable foundation to provide a uniform and graded surface for the pad liner. Grading and backfill would be used to level the surface and to ensure that the pad grading will promote leachate flow towards the collection piping system and sump. A minimum pad grade of 1% to 2% would be required.
| | 11/8/2021 |
Granite Creek Mine Project
Premier Gold Mines Limited/i-80 Gold Corp. | Page 77
PEA NI 43-101 Technical Report |
A liner system is planned to maximize solution recovery and minimize environmental impacts by minimizing leachate losses through the bottom of the leach heap pad. The liner system would consist of both barrier and drainage layers using a combination of synthetic and natural materials to provide leachate solution containment that meets the accepted standards for leach pad design. The pad is designed to operate with minimal solution storage within the pad structure during normal operating conditions. The liner system is designed to meet the required performance standards assuming fully saturated solution storage conditions. A double liner system would be employed with two layers of synthetic material.
A liner system would be developed for the pad using an engineered composite double liner design. The double liner system is designed to be installed as the primary liner system under the entirety of the HLF. The double liner system would consist of the following components:
| • | 1.6-foot-thick (0.5-meter-thick) over liner (1.5-inch [38-mm] minus with less than 10% fines content) using mineralized rock as the material |
| • | 80-mil (2-mm) LLDPE geomembrane |
| • | 1-foot-thick (0.3-meter-thick) compacted low permeability soil liner |
| • | Leak Detection and Recovery System (LDRS) |
| • | 60-mil (1.5-mm) LLDPE geomembrane. |
| • | LLDPE was proposed for the geomembrane liner systems for the heap leach pad because it has the following benefits (Lupo, 2005): |
| • | Generally higher interface friction values, compared to other geomembrane materials |
| • | Ease of installation in cold climates due to added flexibility |
| • | Good performance under high confining stresses (large heap height) |
| • | Higher allowable strain for projects where moderate settlement may become an issue. |
Development of the heap leach liner would be constructed in three phases, with pad expansions proposed after three years of initial production to meet material stacking requirements. The liner system would be constructed with both the synthetic and natural layers extending to the top of the perimeter berms to provide full containment. The synthetic liners and geotextiles would be anchored and backfilled in a trench along the heap leach pad perimeter and perimeter berms to ensure that material loading does not compromise the liner coverage of the heap leach pad footprint by pulling the liner into the pad. Along the pad toe, all liners would be tied into their corresponding liner layer along the foundation of the pad to provide a continuous seal and drainage connection.
| | 11/8/2021 |
Granite Creek Mine Project
Premier Gold Mines Limited/i-80 Gold Corp. | Page 78
PEA NI 43-101 Technical Report |
The perimeter berm would be constructed as part of the liner tie-in around the perimeter of the pad footprint to ensure that heap solution is contained within the pad and to prevent surface runoff entering the pad collection system. A 1-foot-thick (0.3-meter-thick) bedding sand layer would be placed on the face of the confining embankment directly underneath the second (bottom) geomembrane liner to provide additional integrity protection to the liner.
A protective layer of approximately 1.5 feet (½ meter) of coarse crushed mineralized material/waste would be placed over the entire liner system footprint to protect the liner’s integrity from damage during material placement. The over liner acts as the drainage layer, allowing solution drainage into the pipe collection system. The over liner material must be competent and be free from fines.
| 17.1.11 | Solution Collection System |
Collection and recovery of the leach solution is facilitated by the solution collection system in conjunction with the heap leach liner, over liner, and LDRS. The collection system consists of the following pipe and sump components:
| • | Lateral collection pipes |
| • | Main header collection pipes |
| • | Leachate collection sumps |
The solution collection system would be designed to facilitate quick and efficient solution conveyance off the pad to reduce the potential risk of solution losses through the liner system. The entire piping system would be constructed from perforated corrugated plastic tubing (CPT), which is embedded within the over liner layer.
The lateral collection pipes, which would be spaced approximately 16 feet (five meters) apart under the entire pad footprint, feed directly into the collection header pipes, which then flow into the main header. The main header pipes would be positioned along the centerline of each heap leach pad cell and terminate at the upstream toe of the perimeter berm at the leachate collection ditch. Two leachate collection ditches allow solution to flow by gravity to the required storage pond. The collection pipes would be fitted with gate valves to allow solution to be directed to one of the three perimeter collection ditches - PLS, Barren, or Storm.
| 17.1.12 | Leak Detection and Recovery System |
The LDRS is designed to capture and convey any solution that may leak through the overlying primary geomembrane layer. The LDRS consists of a 1-foot-thick (0.3-meter-thick) sand layer embedded with 4-inch (100-mm) diameter perforated CPT collection pipes. Any leakage recovered by the LDRS would be conveyed into the LDRS sump at the downstream toe of the HLF. A level-switch controlled submersible sump pump would transfer the recovered solution via a pipe installed within the LDRS sand layer and connect into the main solution recovery line for processing. Monitoring of the leakage recovery would be undertaken by recording pump operating hours.
| | 11/8/2021 |
Granite Creek Mine Project
Premier Gold Mines Limited/i-80 Gold Corp. | Page 79
PEA NI 43-101 Technical Report |
| 17.1.13 | Leakage Detection Cells |
To facilitate more accurate leak identification, the entire pad solution collection system is typically subdivided into multiple independently monitored areas (cells) separated by small berms. Each of these cells would have a dedicated leakage detection collection system comprising a drain gravel layer beneath the inner composite liner system which conveys the leakage to a 4-inch (100-mm) diameter perforated collection pipe within the LDRS collection trench. The LDRS ditches flow by gravity at a minimum 0.5% slope towards the LDRS collection sump, located along the sides of the leach pad. The flow rates from the dedicated collection pipes are continuously monitored and measured prior to discharging into a sump.
The Event Pond is designed to provide storage for excess leachate and runoff generated during rainfall events. The pond would be situated immediately down gradient of the HLF, and pond flows would be conveyed via solution collection piping inside lined ditches. The Event Pond is designed to meet the following design criteria:
| • | Storage capacity to contain the excess HLF leachate and surface runoff from the 1 in 100-year 24- hour storm event without discharge |
| • | Overflow designed to discharge the 1 in 200-year 24-hour storm event |
The storage requirements for the Event Pond were established based on containment of the entire estimated surface runoff generated from the HLF (at the Phase 3 footprint) during the 1 in 100-year 24- hour storm event. Based on the surface runoff estimates, the following storage requirements for the events pond were identified:
| • | Total runoff estimates for 1 in 100-year 24-hour storm event: 744,055 cubic feet (21,069.3 cubic meters) |
| • | 10% additional factor of safety: 818,452 cubic feet (23,176 cubic meters) |
| • | Total pond storage capacity: 1,136,461 cubic feet (32,181 cubic meters) |
Solution stored in the Event Pond would be pumped back to the heap leach pad using the Event Pond pump station. The pump station is designed to be able to drain the storm volume over a period of approximately ten days.
| 17.1.14.2 | PLS Pond and Barren Tank |
The PLS pond and Barren tank are designed to provide storage for leachate and ADR plant return solutions. The PLS pond would be situated immediately down gradient of the HLF, and pond flows would be conveyed via solution collection piping and ditches. The PLS pond and Barren tank are designed to meet the following design criteria:
| | 11/8/2021 |
Granite Creek Mine Project
Premier Gold Mines Limited/i-80 Gold Corp. | Page 80
PEA NI 43-101 Technical Report |
| • | Storage capacity to contain sufficient solution volumes to maintain irrigation and feed to the ADR circuit |
| • | The PLS Pond is designed to contain up to 24 hours of solution assuming a maximum irrigation rate of 0.005 gpm/ft2 (12 lph/m2) |
| • | The PLS Pond is designed with a capacity of approximately 636,970 cubic feet (18,037 cubic meters). |
| • | The Barren tank is designed to hold 5 minutes of solution at a capacity of 1,624 cubic feet (46 cubic meters). |
Excess solution flows to any of these ponds/tanks would be diverted to the PLS or Event Storm Pond for recycle back to the heap.
The engineered double liner system designed for the ponds uses the same design principles as the HLF pad liner system. The liner design consists of the following layer configuration:
| • | 60-mil (1.5 mm) high-density polyethylene (HDPE) geomembrane |
| • | 1-foot-thick (0.3-meter-thick) low permeability soil liner |
| • | Geosynthetic “geonet” drainage layer |
| • | 60-mil HDPE geomembrane. |
The liner system installed on the upslope of the pond embankment would have an additional 1-foot-thick (0.3-meter-thick) bedding sand layer that would interface with the lower geomembrane layer to protect the integrity of the liner.
Installation of a LDRS is not required for the Storm Pond as the pond is operated as a dry facility and would only receive and store runoff water during significant storm events. In the event that leakage does occur through the double liner system, this water would be conveyed via the geonet layer to a 3-foot-thick (1-meter-thick) drainage blanket that underlies the Event Pond embankment. This drainage blanket discharges to a sump for solution return to the pond.
It is recommended that HDPE geomembrane be used for the pond liner system rather than LLDPE. Unlike the heap leach pad, the pond liner system would not be subjected to high confining stresses from material stacking, and HDPE has a higher ultraviolet resistance, which is critical for exposed surfaces like that of the ponds.
| 17.1.16 | Runoff Collection and Diversion |
The surface water management system proposed for the site consists of a series of ditches constructed around the perimeter of the HLF to intercept overland surface runoff around the HLF pad and to convey surface water away from the active site. The ditches are designed to meet the following design criteria:
| • | Conveys the 1 in 100-year 24-hour duration storm event |
| • | Minimum freeboard = 1-foot (0.3 meters) |
| • | Minimum ditch grade = 0.01 foot/foot (meter/meter) |
| | 11/8/2021 |
Granite Creek Mine Project
Premier Gold Mines Limited/i-80 Gold Corp. | Page 81
PEA NI 43-101 Technical Report |
| • | Channel shape = trapezoidal. |
Lining and protection of the ditch channels from erosion and scouring may be required for all permanent ditches. Temporary ditches would be constructed between heap phases.
| 17.2 | CIL Process Description |
The Granite Creek Mine Project would employ open pit mining with a CIL system on a 365 day per year 24 hour per day basis. The CIL circuit would use crushed ROM material at a nominal size of approximately 1/2 inch (17 mm). Crushed material would advance to a ball mill where lime would be added to control pH levels in the CIL circuit.
A pre-leach thickener would then be used to thicken the grinded material, and flocculant would be added to improve settling rates. The thickener underflow would then be pumped to a series of CIL tanks in which the slurry flows sequentially. As gold is extracted via cyanidation, it is quickly adsorbed onto carbon. Carbon would flow counter-current to the slurry and would be recovered in the first tank. The loaded carbon would then be treated with an acid wash to remove any deposits and would be pumped to an elution column. A stripping solution strips gold off the loaded carbon. The pregnant solution would then be pumped to the electrowinning process and the precious metal cathodes are smelted into Dore bars.
A regeneration kiln is used for the reactivation of barren carbon from the elution column. This reactivated carbon is pumped back into the last CIL tank. Fresh carbon may be added to the regeneration kiln as well. Tailings from the CIL tanks are pumped to a thickener and are properly stored. Figure 17-2 shows the conceptual flowsheet.
| | 11/8/2021 |
Granite Creek Mine Project
Premier Gold Mines Limited/i-80 Gold Corp. | Page 82
PEA NI 43-101 Technical Report |
Figure 17-2: Conceptual CIL Flowsheet
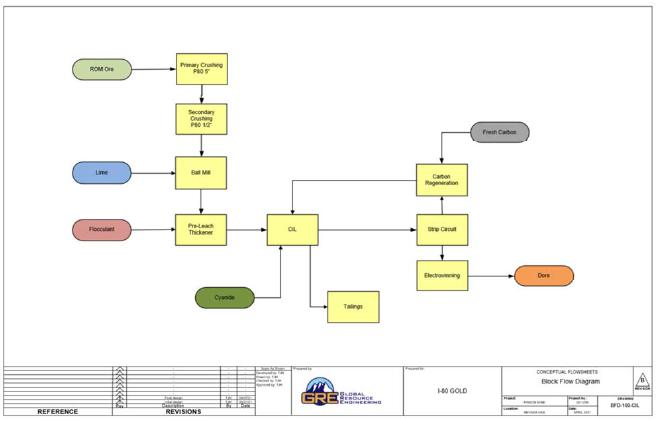
| 17.2.1 | CIL Crusher Circuit |
The crusher is designed to process approximately 4,150 tpd (3,750 metric tonnes per day) on a 24-hour basis. The design crushing rate is 172 short tons per hour (156 metric tonnes per hour).
The run of mine feed would pass over a vibrating grizzly with a 6-inch (150-mm) opening. The undersize would report directly to the jaw crusher discharge conveyor while the oversize would feed the jaw crusher. The jaw crusher would crush to a nominal 4-inch (100-mm), with the crushed product reporting to a vibrating screen for scalping undersize prior to secondary crushing. The double deck screen would be equipped with a top deck with 3-inch (75 mm) openings and the lower deck with 2/3-inch (17 mm) openings. The screen undersize would report to the final product conveyor and the screen oversize would be fed to a HP 800 crusher, or equivalent, with a closed side setting of 1 inch (27 mm). The discharge from the crushers would fall onto the final product conveyor. The secondary crushing circuit would be operated in open circuit. This crushing circuit would be capable of achieving a product of 100% passing 17 mm or a P80 of approximately ½-inch (11mm).
| 17.2.2 | Carbon in Leach (CIL) Circuit |
A pre-leach thickener is included to achieve higher and more constant leach feed density. The thickener tank has a retention time of 60 minutes with a flow rate of 350 cubic meters per hour.
Pre-leach thickener underflow would be pumped to the CIL circuit, consisting of six mechanically agitated tanks operating in series. Each tank would have a live volume of approximately 1,050 cubic meters, allowing a leach residence time of 24 hours. Slurry would flow sequentially through tanks as activated carbon advances through the circuit counter-current of slurry flow. As gold is extracted from the material, it would be adsorbed onto activated carbon. The loaded carbon would then be transported to an acid washing column.
| | 11/8/2021 |
Granite Creek Mine Project
Premier Gold Mines Limited/i-80 Gold Corp. | Page 83
PEA NI 43-101 Technical Report |
To replace the recovered loaded carbon, regenerated or fresh carbon would be pumped to CIL tank 6. Slurry discharging from tank 6 would gravitate to a carbon safety screen to recover any carbon leaking from worn screens or overflowing tanks. The slurry would then proceed to the tailings thickener from tank 6.
The loaded carbon from the first tank would be pumped across a loaded carbon screen to the acid wash column. Loaded carbon would be acid washed with dilute nitric acid to remove calcium and adsorbed metals. Spent acid would be neutralized and disposed. After acid washing, the carbon would be passed to an elution column. Elution is conducted by the modified ZADRA system at a rate of 5 tons/day. A solution of caustic and cyanide would be passed through the elution column to remove the adsorbed gold. The rich electrolyte would be pumped to electrowinning cells, where the gold and silver are recovered on the cathodes. The cathodes would be washed, and the recovered sludge would be refined in a conventional induction furnace after drying. The circuit is designed to conduct two strip cycles per day with a total recovery of approximately 600 oz. The doré produced would be assayed and stored in a vault before being shipped off-site for payment.
Barren carbon from the elution column would be returned to the CIL circuit after passing across a carbon sizing screen. Fine carbon from the screen underflow would be stockpiled and sent for separate off-site recovery. Approximately 50% of the barren carbon would report to an indirect fired kiln for thermal regeneration. The regenerated carbon would report to a quench tank before being pumped to the carbon sizing screen. Fresh makeup carbon would first be sent to an attrition tank for fines removal before being pumped to the carbon sizing screen. The fine carbon from the screen underflow would be captured in a plate and frame filter.
| | 11/8/2021 |
Granite Creek Mine Project
Premier Gold Mines Limited/i-80 Gold Corp. | Page 84
PEA NI 43-101 Technical Report |
| 18.0 | PROJECT INFRASTRUCTURE |
Pinson is a past operating mine and as such has a large portion of the necessary infrastructure in place. A paved county road, number 789, leads to the edge of the property with a short gravel section, less than one mile leading to the existing Granite Creek Mine office.
In addition to the office, the metallurgical laboratory is still on the site, although the analytical equipment has been removed. Within the lab are offices, a wet lab, sample preparation, and a fire assay area. Attached to the lab are a small warehouse and small shop facility.
A 120 kV line feeds the mine-owned transformer, which is further stepped down to 13.8 kV, with available power estimated at 2 MW. Power to the underground operations is supplied at 480 V. There is a small transformer at the mine portal.
Four mine dewatering wells are in place and operational. To keep the mine dry requires pumping approximately 110 gpm, which the system is fully capable of doing. Water from the dewatering system is discharged to one of two Rapid Infiltration Basins (RIBs) on the east side of the county road. Four RIBs have been permitted but has not been constructed. There is also process water well on the east side of the county road, which feeds a process water tank and distribution system. All power lines to the underground mine and dewatering system are above ground and mounted on poles.
There is a fully functional truck scale adjacent to the office facility. This was used to weight trucks when the underground material was toll treated by a third-party mill.
A complete well maintained road system allows access to the historic open pits and underground mine in the CX Pit.
| | 11/8/2021 |
Granite Creek Mine Project
Premier Gold Mines Limited/i-80 Gold Corp. | Page 85
PEA NI 43-101 Technical Report |
| 19.0 | MARKET STUDIES AND CONTRACTS |
No market studies or contracts were created for the project. Third party refiners are common in the international gold market, and gold doré is a readily marketable commodity.
| | 11/8/2021 |
Granite Creek Mine Project
Premier Gold Mines Limited/i-80 Gold Corp. | Page 86
PEA NI 43-101 Technical Report |
| 20.0 | ENVIRONMENTAL STUDIES, PERMITTING, AND SOCIAL OR COMMUNITY IMPACT |
| 20.1 | Environmental Setting |
Section 5.2 describes the generalized environmental setting. The site has been slightly impacted by prior mining activities and impacts, the majority of which have been reclaimed (see Section 4.4). In the valley to the east of the mine, there are several center-pivot irrigation systems raising hay. These adjacent water users may be beneficially impacted by the mine contributing groundwater to the RIBs and are far enough away (and in the opposite direction of the prevailing wind) thus making them unlikely to be impacted by noise or dust.
There is no nearby community. Indeed, apart from ranching, the nearest human activity is an adjacent operating mine (see Section 23).
| 20.2 | Environmental Permitting Requirements |
The following subsections summarize the environmental permitting requirements. Although the site has active permits for underground mining (See Section 4.5), these permits are not sufficient to cover the mining plan described in this PEA.
The National Environmental Policy Act (NEPA) is the largest single permitting hurdle that the project can be expected to face. This is usually in the form of an Environmental Impact Statement (EIS). An EIS is a slow and complicated process involving:
| • | A large database of baseline data (prior to the anticipated mining impact) |
| • | A detailed Plan of Operations (PoO) describing the mining plan in detail |
| • | An assessment of the environmental impacts |
| • | A discussion of mitigation measures |
| • | An Evaluation of the effectiveness of mitigation measures |
| • | A wide variety of supporting and supplementary reports, including |
| • | Wildlife, threatened and endangered species (biology) |
| • | Sound, noise, and vibration |
| | 11/8/2021 |
Granite Creek Mine Project
Premier Gold Mines Limited/i-80 Gold Corp. | Page 87
PEA NI 43-101 Technical Report |
| • | Vegetation impacts, etc. |
The EIS is prepared by a third party hired by the BLM (not the mining company, and not the consultants who prepare the supplemental environmental reports). It is submitted to the BLM, where it is given a public comment period. After a process that often takes multiple years from the commencement of baseline data collection, the BLM provides a Record of Decision (ROD), which acts as the permit.
The site needs several baseline reports for the State Permits and for the EIS. These will likely be:
| • | Archeological and cultural resources. |
The largest single data gap for the Pinson baseline studies is the lack of geochemistry data. Because of the age of the previous site permitting and the lack of a previous EIS, the site does not have a full geochemical characterization for Acid Rock Drainage (ARD) and Neutral Metals Release (NMR) from mine waste leachate or from pit lakes that meets the current state and federal standards. The site requires:
| • | A large database of Acid Base Accounting (ABA) data |
| • | Duplicate samples of the ABA with total metals and minerology (this is the multi-element suite currently standard-procedure for most exploration samples - metals by Inductively Coupled Plasma - Mass Spectrometry with Aqua Regia digestion) |
| • | Many Meteoric Water Mobility Procedure tests for NMR and ARD, also from new core or fresh rock |
| • | Laboratory humidity cell kinetic tests for ARD and NMR |
These tests are time consuming. The kinetic tests in particular require long-duration running times and may take as long as a year to reach completion.
| 20.2.1.2 | Supplemental Environmental Reports |
Supplemental Environmental Reports (SERs) are part of the NEPA process. These stand-alone documents are created by consultants (either by i-80’s consultants or the EIS consultant as determined by the BLM) using the baseline reports and are used by the NEPA 3rd party consultant in the preparation of the EIS. The site needs several SERs for the permitting and NEPA process, and the baseline collection and analysis needed for these should begin immediately. The mine will certainly need:
| • | A revised pit lake study for the CX pit |
| • | Backfill study for the mine waste below the water table in the MAG pit |
| | 11/8/2021 |
Granite Creek Mine Project
Premier Gold Mines Limited/i-80 Gold Corp. | Page 88
PEA NI 43-101 Technical Report |
| • | RIB water quality impact study (see Section 2.4). |
Because the site has never had a full EIS, it may require the following studies:
State permits are required for air quality protection, groundwater protection, surface water protection, and water rights. All of the permits presented in Table 4-2 will require revision with the new PoO. Several key state permits are described below.
| 20.2.2.1 | Water Pollution Control Permit |
The water pollution control permits are granted by the state of Nevada and cover any potential discharge of water to surface or groundwater. This permit will require revision to be consistent with the new PoO. In addition, the site has committed to build a surge pond for the RIBs and conduct an arsenic attenuation study. The water infiltrating into the RIB is three times the legal standard for arsenic, and attenuation of arsenic in the vadose zone is used to ensure compliance with the current arsenic standard at the monitoring wells. The regulators have accepted this situation and have asked for an arsenic attenuation study to determine the amount of attenuation of arsenic as it approaches the compliance points.
| 20.2.2.2 | Reclamation Permits |
Reclamation permits are overseen by the state and the BLM. Existing reclamation permits for surface mining and underground mining will have to be revised. A new closure bond must be calculated and provided in anticipation of the new mining impacts.
| 20.2.2.3 | Other State Permits |
Sewage disposal permits, stormwater permits, and air quality permits must be updated to be consistent with the new PoO. It is important to note that the MAG pit dewatering is currently permitted under the exploration permit, and it can commence prior to acquiring other permits and prior to the ROD on the EIS.
| 20.3 | Socioeconomic Setting |
This has not been included in the PEA.
| 20.4 | Monitoring Requirements |
During the Waterton tenure and to the present day, the site has been executing all environmental monitoring requirements required to maintain the Water Pollution Control Permits, air quality permits, reclamation permits, and other state permits. Samples of surface and groundwater are required quarterly, and quarterly and annual reports are provided to the regulators. Reclamation reports require annual disturbance reports and bond updates each three years. The stormwater permit requires quarterly inspections, and annual report, and an annual fee. All permit monitoring requirements are up-to-date.
| | 11/8/2021 |
Granite Creek Mine Project
Premier Gold Mines Limited/i-80 Gold Corp. | Page 89
PEA NI 43-101 Technical Report |
The mine closure cost estimate was derived using the Standardized Reclamation Cost Estimator Version 1.4, made by the Nevada Division of Environmental Protection. This software was developed by the Nevada regulators to calculate closure bond and closure cost requirements, and as a result, it is the only tool that could be reasonably applied for this estimate.
Mr. Breckenridge of GRE built on prior closure bond calculations provided by i-80 gold. These included the July 30th 2019 bond update, and the August 15th 2018 bond calculation modifications. These prior bond calculations were augmented and expanded to include the elements that would be constructed in the mine plan evaluated by this PEA.
| 20.5.1 | Mine Closure Design Criteria |
The following design criteria and assumptions were applied to closure:
| • | All key regulatory closure requirements will be met. |
| • | All regrading of mine waste structures is performed during operations. This includes creating tailings and waste rock facilities at a closure-ready 3:1 slope. |
| • | Waste rock and pit backfill is to be covered by 12 inches of growth media. This is consistent with the prior closure cover (see Section 4.4). |
| • | An approved rangeland grass mix will be used. Grassland and wildlife habitat with grazing is the anticipated post-mining land use. |
| • | The HLP will be covered with an Evapotranspiration Cover (ET Cover). In arid climates, ET covers have been shown to perform as well as HDPE covers in preventing mine waste leachate. The ET cover will be 18 inches thick. |
| • | All buildings, powerlines, and other infrastructure will be removed. |
| • | The RIBs will be filled-in and reclaimed. |
| • | Four stream channels will be reclaimed, allowing precipitation in the hills to have a reclaimed and restored streambed in which it can flow through the reclaimed mine down into the valley. |
| • | It will be necessary to evaporate approximately 700,000 m3 of HLP drain-down water upon the cessation of operations. This will be done over the top of the process ponds using commercial evaporators. Equipment and energy costs for these evaporators were obtained from recent vendor bids. |
| • | The water quality in the MAG pit lake will be unlikely to meet Nevada water quality standards due to NMR. However, Mr. Breckenridge of GRE anticipates that an ecological risk assessment and a pit lake hydrologic model will show that the pit is acting as a terminal sink (not contaminating groundwater) and is not a threat to wildlife. |
| • | Mr. Breckenridge of GRE assumes that the seepage from the CX pit backfill will not have a significant impact on groundwater quality. |
| | 11/8/2021 |
Granite Creek Mine Project
Premier Gold Mines Limited/i-80 Gold Corp. | Page 90
PEA NI 43-101 Technical Report |
| • | Other than the MAG pit lake and the CX backfill seepage, there are no other potential water quality or water quantity impacts at Pinson upon closure. |
Due to the preliminary nature of this study, Mr. Breckenridge of GRE was forced to make several assumptions with regards to the final layout of the project that will be better-defined in future engineering work products. As a result, Mr. Breckenridge of GRE applied a 20% contingency on the closure costs.
The closure costs are summarized in Table 20-1.
Table 20-1: Mine Closure Cost Summary
| Category | Cost | Notes |
| Earthwork Recontouring | $2,145,000 | Minimal recontouring is required because waste facilities are constructed at final closure grade. |
| Revegetation/Stabilization | $490,000 | Follows example of previous successful revegetation on site |
| Heap Leach Fluid Management | $750,000 | Cost of evaporating HLP drain-down water, industrial cleanup after closure |
| Structure, Equipment and Facility Removal, and Misc. | $1,603,000 | Includes plant removal, new fence around MAG pit lake upon closure. |
| Monitoring | $475,000 | Assumes more monitoring wells due to larger footprint. |
| Construction Management and Support | $436,000 | Calculated by the Reclamation Spreadsheet based on Nevada-based experience. |
| Contingency and Indirect Costs | $2,779,000 | Recommended indirect costs with contingency augmented to 20% |
| Total | $8,687,000 | This value is entered into the cost model. |
| 20.5.3 | Closure Cost Limitations |
The closure calculation is preliminary. Additional studies are required to confirm the design criteria are correct. Nearly all of these studies are ultimately part of the EIS and permitting effort (see Section 26).
| | 11/8/2021 |
Granite Creek Mine Project
Premier Gold Mines Limited/i-80 Gold Corp. | Page 91
PEA NI 43-101 Technical Report |
| 21.0 | CAPITAL AND OPERATING COSTS |
| 21.1 | Capital Cost Estimate |
The capital cost estimate has been prepared for the PEA under the assumption of processing of open pit mined material as follows: 8,500 tpd on a heap leach (HL), 3,000 tpd through a CIL beginning in year 3 and processing underground material at a rate of 11,050 tpy . Project costs were estimated using cost data from Infomine (2020) and experience of senior staff. The estimate assumes that the project will be operated by a contractor; therefore, no mining equipment capital costs were included as this equipment would be provided by the contractor.
Cost scheduling used the same schedule as was used for resource scheduling: quarterly for any pre-production years and the first two production years and annually thereafter. The initial capital costs are incurred in the quarters/years prior to production. GRE’s QP expects there will be 3 to 5 years of continued exploration, engineering, and permitting prior to a production decision.
Initial capital costs are defined as all costs until a sustained positive cash flow is reached. This includes labor and development costs in the pre-production years. Sustaining capital is defined as the capital costs incurred in the periods after a sustained positive cash flow is achieved through the end of mine life.
All capital cost estimates cited in this Report are referenced in US dollars with an effective date of May 2021.
Table 21-1: Granite Creek Mine Project Capital Costs
| Item | Year -1 | Year 1 | Year 2 | Year 3 | Year 4 | Year 5 | Year 6 | Year 7 | Year 8 | Year 9 | Year 10 | Capital Cost (millions) |
| OP Mining Equipment | $0.0 | $0.0 | $0.0 | $0.0 | $0.0 | $0.0 | $0.0 | $0.0 | $0.0 | $0.0 | $0.0 | $0.0 |
| UG Mining Equipment | $0.0 | $0.0 | $0.0 | $0.0 | $0.0 | $0.0 | $0.0 | $0.0 | $0.0 | $0.0 | $0.0 | $0.0 |
| CIL Process | $0.0 | $0.0 | $57.8 | $0.0 | $0.0 | $0.0 | $0.0 | $0.0 | $0.0 | $0.0 | $0.0 | $57.8 |
| HLCH Process | $36.7 | $0.0 | $7.4 | $0.0 | $4.6 | $0.0 | $0.0 | $0.0 | $0.0 | $0.0 | $0.0 | $48.7 |
| Infrastructure | $8.1 | $0.0 | $0.0 | $0.2 | $0.0 | $0.0 | $0.0 | $0.0 | $0.0 | $0.0 | $0.0 | $8.3 |
| G&A | $1.4 | $0.0 | $0.0 | $0.1 | $0.0 | $0.0 | $0.1 | $0.0 | $0.0 | $0.1 | $0.0 | $1.6 |
| Sustaining | $0.1 | $0.0 | $0.0 | $0.0 | $0.0 | $0.0 | $0.0 | $0.0 | $0.0 | $0.0 | $0.0 | $0.1 |
| Working | $14.4 | $0.0 | $0.0 | $0.0 | $0.0 | $0.0 | $0.0 | $0.0 | $0.0 | $0.0 | ($14.4) | $0.0 |
| Reclamation | $0.0 | $0.0 | $0.0 | $0.0 | $0.0 | $0.0 | $0.0 | $0.0 | $0.0 | $4.4 | $4.4 | $8.7 |
| Contingency | $9.3 | $0.0 | $13.0 | $0.1 | $0.9 | $0.0 | $0.0 | $0.0 | $0.0 | $0.0 | $0.0 | $23.3 |
| Subtotal | $69.9 | $0.0 | $78.2 | $0.3 | $5.5 | $0.0 | $0.1 | $0.0 | $0.0 | $4.4 | ($10.1) | $148.5 |
| OP Pre-stripping | $48.3 | $72.6 | $48.1 | $59.4 | $54.2 | $34.3 | $0.0 | $0.0 | $0.0 | $0.0 | $0.0 | $316.9 |
| UG Mine Development | $0.0 | $0.4 | $0.5 | $1.1 | $0.6 | $0.0 | $0.0 | $0.0 | $0.0 | $0.0 | $0.0 | $2.6 |
| Total | $118.3 | $73.0 | $126.8 | $60.8 | $60.3 | $34.4 | $0.1 | $0.0 | $0.0 | $4.4 | ($10.1) | $468.0 |
The $600,000 under Underground Mining Equipment is for a main ventilation fan, which would be provided by the owner. A contingency of 20% was applied to all capital costs.
| | 11/8/2021 |
Granite Creek Mine Project
Premier Gold Mines Limited/i-80 Gold Corp. | Page 92
PEA NI 43-101 Technical Report |
Initial capital costs total $69.9 million, as detailed in Table 21-2.
Table 21-2: Granite Creek Mine Project Initial Capital Costs
| Item | Initial Capital Cost (millions) |
| Open Pit Mine | $0.0 |
| Underground Mine | $0.0 |
| Plant | $36.7 |
| G&A | $1.4 |
| Infrastructure | $8.1 |
| Working | $14.4 |
| Sustaining | $0.1 |
| Reclamation | $0.0 |
| Contingency | $9.3 |
| Total | $69.9 |
Sustaining capital costs are set at 10% of the average yearly owner’s mobile equipment operating costs, or $0.1 million, and are incurred in quarter 4 of year -1.
All buildings and associated infrastructure installed on the property on a permanent or semi-permanent basis are considered facilities. They include material and installation cost. These costs are incurred in Quarters 3 and 4 of Year -1.
Each item’s capital cost was estimated based on knowledge of nearby mine operations or senior engineers’ experience. Table 21-3 shows total cost for each facility item.
Table 21-3: Granite Creek Mine Project Facilities Capital Cost
| Item | Capital Cost (millions) |
| Haul Roads | $0.5 |
| Office | Existing |
| Warehouse | $1.0 |
| Mine Shop | $3.5 |
| Fuel Bay | $0.1 |
| Wash Bay | $0.2 |
| 4x4 Pickup | $0.2 |
| Security and Fencing | Existing |
| Surface Water Management | $0.5 |
| Water Well with Pump | Existing |
| New Well Pump | Existing |
| Back Up Gen Set | $0.3 |
| Sub-Station | Existing |
| Power Line 33KV | $1.8 |
| Portal Construction | $0.2 |
| Total | $8.3 |
| | 11/8/2021 |
Granite Creek Mine Project
Premier Gold Mines Limited/i-80 Gold Corp. | Page 93
PEA NI 43-101 Technical Report |
The cost of the heap leach pad is incurred in quarters 2, 3, and 4 of year -1. Expansion costs are incurred in years 2 and 4. Costs for the ADR plant are incurred in quarters 2, 3, and 4 or year -1. Costs for the CIL plant are incurred in quarters 3 and 4 of year 2.
Because the project was assumed to be contractor-operated, no mine equipment capital costs were included.
General and administrative (G&A) capital costs include computers, software, technical support equipment, and office equipment. Initial capital costs for computers are $50k, occurring in the quarter 4 of year -1, with replacement costs occurring every three years for the life of the project. Initial capital costs for software are estimated at $150k, occurring in quarter 4 of year -1, with supplemental costs of $15,000 every year for the life of the project. The total G&A capital costs are summarized in Table 21-4.
Table 21-4: Granite Creek Mine Project G&A Capital Costs
| Item | Capital Cost (millions) |
| Computers | $0.2 |
| Software | $0.3 |
| Tech Equipment | $0.1 |
| Office Equipment | $0.3 |
| Metallurgical/Geotechnical Drilling and Assaying | $0.8 |
| Total | $1.6 |
Working capital is the necessary cash on hand for the next period’s operating cost. The estimated total is $12.7 million. This cost is recovered at the end of production.
Closure costs are estimated over two years at the end of production due to the need to rinse and neutralize the leached material. Total cost for site closure is $8.7 million. Additional detail on closure costs is presented in Section 20.5.
| 21.2 | Operating Cost Estimate |
The operating costs assume contractor operation. Capital recovery costs were included in the unit operating costs for each piece of equipment, and a 10% contractor’s premium was applied to all operating unit costs, labor unit rates, and supplies. Operating costs are summarized in Table 21-5.
| | 11/8/2021 |
Granite Creek Mine Project
Premier Gold Mines Limited/i-80 Gold Corp. | Page 94
PEA NI 43-101 Technical Report |
Table 21-5: Granite Creek Mine Project Operating Cost Summary
| Item | Total Operating Cost (millions) | Unit Operating Cost | Unit |
| Mining | $518.7 | $2.06 | $/tonne mined |
| Processing | $252.6 | $9.04 | $/tonne processed |
| G&A | $41.8 | $1.42 | $/tonne processed |
| Contingency | $198.6 | | |
| Total | $1,011.6 | | |
Hourly labor for the project is based on the number of people needed to operate and support equipment for each shift in a day plus additional crew to fill in for absences. Salaried labor in the project is based on job positions filled regardless of production changes or equipment units needed. Table 21-6 through Table 21-9 show the required labor, and Table 21-10 shows the estimated mining and G&A labor costs by year. Processing labor costs are built into the processing unit costs of $6.58/tonne.
Table 21-6: Granite Creek Mine Project Hourly Laborers by Year
| Position | Year -1 | Year 1 | Year 2 | Year 3 | Year 4 | Year 5 | Year 6 |
| Open Pit |
| Heavy Equipment Operator | 34 | 46 | 50 | 42 | 46 | 42 | 38 |
| Blasters | 2 | 2 | 2 | 2 | 2 | 2 | 2 |
| Mine Laborer | 6 | 8 | 8 | 8 | 8 | 8 | 8 |
| Drill Operator | 11 | 17 | 18 | 16 | 16 | 12 | 4 |
| Production Truck Driver | 2 | 38 | 62 | 40 | 64 | 52 | 36 |
| Oilers/Mechanic | 14 | 40 | 54 | 41 | 55 | 47 | 37 |
| Total | 69 | 151 | 194 | 149 | 191 | 163 | 125 |
| Underground |
| Driller | 2 | 10 | 10 | 10 | 10 | 8 | 0 |
| Development Miner | 2 | 10 | 10 | 10 | 10 | 8 | 0 |
| UG Equipment Operator | 0 | 7 | 7 | 7 | 7 | 7 | 0 |
| Truck Driver | 4 | 12 | 12 | 12 | 12 | 12 | 0 |
| Laborer | 4 | 16 | 16 | 16 | 16 | 16 | 0 |
| Mechanic | 3 | 15 | 15 | 15 | 15 | 14 | 0 |
| Electrician | 0 | 0 | 0 | 0 | 0 | 0 | 0 |
| Exploration Drilling | 0 | 8 | 8 | 0 | 0 | 0 | 0 |
| Total | 15 | 78 | 78 | 70 | 70 | 65 | 0 |
Table 21-7: Granite Creek Mine Project Salaried Workers, Mine Management
| Position | Number Each Year |
| Open Pit |
| Mine Superintendent | 1 |
| Mine Engineer | 1 |
| Geologist | 1 |
| Surveyor/Tech | 1 |
| General Foreman | 1 |
| | 11/8/2021 |
Granite Creek Mine Project
Premier Gold Mines Limited/i-80 Gold Corp. | Page 95
PEA NI 43-101 Technical Report |
| Position | Number Each Year |
| Shift Supervisor | 4 |
| Total | 9 |
| Underground |
| Mine Superintendent | 1 |
| Mine Engineer | 2 |
| Geologist | 1 |
| Surveyor/Tech | 0.5 |
| General Foreman | 0.5 |
| Shift Supervisor | 2 |
| Total | 7 |
Table 21-8: Granite Creek Mine Project General and Administrative Positions by Year
| Position | Number Each Year of Active Underground Mining (if no Open Pit Mining) | Number Each Year of Active Open Pit Mining | Number Each Year of Stockpile Processing | Number Each Year of Rinsing and Closure |
| General Manager | 1 | 1 | 1 | 1 |
| Purchasing Manager | 1 | 0 | 0 | 0 |
| Purchaser | 1 | 1 | 1 | 0 |
| Chief Accountant | 1 | 1 | 1 | 0 |
| Accounting Clerk | 1 | 2 | 1 | 1 |
| Human Resources/Relations Manager | 1 | 1 | 1 | 0 |
| Human Resources/Payroll Clerk | 1 | 1 | 1 | 1 |
| Security/Safety/Training Manager | 1 | 1 | 1 | 0 |
| Safety Officer | 1 | 2 | 1 | 1 |
| Environmental Supervisor | 1 | 0 | 1 | 0 |
| Environmental Technicians | 1 | 2 | 1 | 1 |
| Logistics Administrator | 0 | 0 | 0 | 0 |
| IT Manager | 0 | 0 | 0 | 0 |
| Warehouseman ON SITE | 1 | 2 | 2 | 1 |
| Accounts Payable Clerk | 1 | 1 | 0 | 1 |
| Receptionist/Secretary | 1 | 1 | 0 | 0 |
| Guards | 4 | 4 | 4 | 0 |
| Drivers | 0 | 1 | 0 | 0 |
| Laborers / Janitorial On Site | 1 | 2 | 1 | 0 |
| Total | 19 | 23 | 17 | 7 |
Table 21-9: Granite Creek Mine Project Processing Positions by Year
| Position | Number Each Year of Processing - HL | Number Each Year of Processing - CIL |
| Metallurgical Staff |
| Superintendent | 1 | 0 |
| General Foreman | 1 | 0 |
| Maintenance Foreman | 1 | 0 |
| | 11/8/2021 |
Granite Creek Mine Project
Premier Gold Mines Limited/i-80 Gold Corp. | Page 96
PEA NI 43-101 Technical Report |
| Position | Number Each Year of Processing - HL | Number Each Year of Processing - CIL |
| Shift Foreman | 4 | 4 |
| Chief Assay Chemist | 1 | 0 |
| Sr Metallurgist | 1 | 0 |
| Metallurgist | 1 | 1 |
| Process Technician | 0 | 0 |
| Instrument Technician | 1 | 0 |
| Subtotal | 11 | 5 |
| Laboratory |
| Sample Prep | 8 | 0 |
| Assayers | 4 | 0 |
| Analytical | 1 | |
| Subtotal | 13 | 0 |
| Crusher |
| Operator | 8 | 8 |
| FEL Operator | 4 | 4 |
| Maintenance | 2 | 2 |
| Electrical | 2 | 2 |
| Subtotal | 16 | 16 |
| Grinding |
| Operator | 0 | 8 |
| Maintenance | 0 | 0 |
| Electrical | 0 | 0 |
| Subtotal | 0 | 8 |
| Heap |
| Stacking | 4 | 0 |
| Agglomeration | 4 | 0 |
| Irrigation Operator | 2 | 0 |
| Reagent Operator | 0 | 0 |
| Dozer/FEL Operator | 4 | 0 |
| Assayers | 4 | 0 |
| Samplers | 0 | 0 |
| Reagent Operator | 0 | 0 |
| Mechanic | 1 | 0 |
| Electrician | 2 | 0 |
| Subtotal | 21 | 0 |
| ADR |
| Carbon Handling | 4 | 0 |
| EW Operators | 4 | 0 |
| Cathode Striping | 4 | 0 |
| Refiners | 2 | 0 |
| Mechanic | 1 | 0 |
| Electrician | 2 | 0 |
| Subtotal | 17 | 0 |
| CIL |
| Operator | 0 | 8 |
| Maintenance | 0 | 0 |
| | 11/8/2021 |
Granite Creek Mine Project
Premier Gold Mines Limited/i-80 Gold Corp. | Page 97
PEA NI 43-101 Technical Report |
| Position | Number Each Year of Processing - HL | Number Each Year of Processing - CIL |
| Electrical | 0 | 0 |
| Subtotal | 0 | 8 |
| Strip Circuit |
| Operator | 0 | 4 |
| Maintenance | 0 | 4 |
| Electrical | 0 | 2 |
| Subtotal | 0 | 10 |
| Tailings |
| Operator | 0 | 4 |
| Maintenance | 0 | 0 |
| Electrical | 0 | 0 |
| Subtotal | 0 | 4 |
| Total | 78 | 51 |
Table 21-10: Granite Creek Mine Project Labor Costs by Year (millions)
| Item | Year -1 | Year 1 | Year 2 | Year 3 | Year 4 | Year 5 | Year 6 | Year 7 | Year 8 | Year 9 | Year 10 | Total |
| Open Pit Hourly Labor | $4.6 | $13.3 | $17.2 | $13.5 | $17.3 | $14.7 | $11.3 | $0.0 | $0.0 | $0.0 | $0.0 | $91.9 |
| Open Pit Salaried Labor | $0.7 | $1.1 | $1.1 | $1.1 | $1.1 | $1.1 | $0.9 | $0.0 | $0.0 | $0.0 | $0.0 | $7.0 |
| Open Pit Contractor Labor | $3.2 | $3.4 | $2.4 | $2.7 | $2.7 | $2.7 | $0.0 | $0.0 | $0.0 | $0.0 | $0.0 | $17.2 |
| Underground Hourly Labor | $0.5 | $1.4 | $1.4 | $1.6 | $1.6 | $1.1 | $0.0 | $0.0 | $0.0 | $0.0 | $0.0 | $7.6 |
| Underground Salaried Labor | $0.1 | $0.3 | $0.3 | $0.3 | $0.3 | $0.3 | $0.0 | $0.0 | $0.0 | $0.0 | $0.0 | $1.6 |
| G&A Labor | $1.4 | $2.2 | $2.2 | $2.2 | $2.2 | $2.2 | $1.9 | $1.8 | $1.8 | $0.7 | $0.7 | $16.1 |
| Total | $10.4 | $21.8 | $24.6 | $21.4 | $25.2 | $22.2 | $14.1 | $1.8 | $1.8 | $0.7 | $0.7 | $141.6 |
| 21.2.2 | Mining Equipment and Consumables |
Mining equipment includes production equipment and support equipment. Mining production equipment hours are calculated using the equipment productivity estimates and the number of tonnes required to be moved. It was assumed that all mining will be contractor-operated. MS. Lane of GRE included a 20% surcharge to the estimated operating costs for account for contractor markup.
Mining support equipment hours are calculated using the number of shifts that the equipment is operated per day, the number of pieces of equipment, and the operating hours per day. The operating hours per day are calculated assuming utilization of 90%, availability of 95%, and two twelve-hour shifts per day. Table 21-11 and Table 21-12 summarize the mining costs by year.
| | 11/8/2021 |
Granite Creek Mine Project
Premier Gold Mines Limited/i-80 Gold Corp. | Page 98
PEA NI 43-101 Technical Report |
Table 21-11: Granite Creek Mine Project Mining Equipment Costs by Year (millions)
| Item | Year -1 | Year 1 | Year 2 | Year 3 | Year 4 | Year 5 | Year 6 | Total |
| Open Pit Production Equipment | $22.3 | $43.5 | $49.9 | $38.4 | $49.7 | $42.8 | $18.6 | $265.2 |
| Open Pit Support Equipment | $3.7 | $6.5 | $6.4 | $6.5 | $6.5 | $6.5 | $5.5 | $41.4 |
| Underground Production Equipment | $1.3 | $10.4 | $10.2 | $20.2 | $11.7 | $0.6 | $0.0 | $54.5 |
| Underground Support Equipment | $0.2 | $26.0 | $36.1 | $36.0 | $34.7 | $7.9 | $0.0 | $141.0 |
| Total | $27.5 | $86.3 | $102.6 | $101.2 | $102.6 | $57.8 | $24.1 | $502.1 |
Table 21-12: Granite Creek Mine Project Blasting Costs by Year (millions)
| Item | Year -1 | Year 1 | Year 2 | Year 3 | Year 4 | Year 5 | Year 6 | Total |
| Explosives | $3.0 | $5.6 | $5.7 | $4.7 | $4.8 | $4.2 | $1.3 | $29.3 |
| Primers | $0.4 | $0.7 | $0.7 | $0.6 | $0.6 | $0.5 | $0.2 | $3.7 |
| Material Control/Sample Testing | $0.7 | $1.2 | $1.2 | $1.0 | $1.1 | $0.9 | $0.3 | $6.4 |
| Misc | $0.3 | $0.5 | $0.5 | $0.5 | $0.5 | $0.5 | $0.4 | $3.2 |
| Total | $4.3 | $8.1 | $8.1 | $6.9 | $7.0 | $6.1 | $2.1 | $42.5 |
The processing operating costs include labor, reagents and consumables, and power. The unit rate for processing is $6.57/tonne of material processed on the heap leach and through the ADR plant. In addition, $0.75/tonne was included for rehandling of material from stockpiles. A summary of the process operating costs is provided in Table 21-13.
Table 21-13: Granite Creek Mine Project Processing Costs by Year (1000s)
| Item | Year -1 | Year 1 | Year 2 | Year 3 | Year 4 | Year 5 | Year 6 | Year 7 | Year 8 | Year 9 | Total |
| Heap Leach Processing | $0.0 | $20.2 | $20.2 | $20.2 | $20.2 | $20.2 | $18.1 | $21.0 | $0.0 | $0.0 | $140.3 |
| CIL Processing | $0.0 | $0.0 | $0.0 | $15.0 | $15.0 | $15.0 | $15.0 | $15.0 | $15.0 | $14.5 | $104.2 |
| Total | $0.0 | $20.2 | $20.2 | $35.2 | $35.2 | $35.2 | $33.1 | $35.9 | $15.0 | $14.5 | $244.4 |
| 21.2.4 | Taxes and Royalties |
GRE prepared a generalized tax computation for the Granite Creek Mine Project. The following is a summary of tax elections incorporated into this tax computation:
| • | The Granite Creek Mine Project consists of a single mine and property |
| • | The Granite Creek Mine Project will elect to treat mine development costs as incurred as deferred expenses |
| • | The Granite Creek Mine Project will elect out of bonus depreciation. |
| • | The Granite Creek Mine Project will elect to depreciate long-lived assets under the unit of production basis and all other assets will be depreciated using either 7-year or 15-year straight line depreciation |
| • | The Granite Creek Mine Project will elect to deduct reclamation costs under Section 468. |
| | 11/8/2021 |
Granite Creek Mine Project
Premier Gold Mines Limited/i-80 Gold Corp. | Page 99
PEA NI 43-101 Technical Report |
Royalties were included in the cost estimation on a block by block basis. The total royalty applied totaled approximately 6.4% of the gross revenue.
| 21.2.5 | General and Administrative |
General and administrative costs were estimated for four phases of the mine plan: open pit and underground production operating, stockpile operating, underground operations only, and rinse and closure. The G&A costs include both salaried and hourly labor, supplies, office equipment, and anticipated regular expenses. Open pit production years have a G&A cost of $4.6 million per year; stockpile operations years have a G&A cost of $2.9 million per year; underground operations only years have a G&A cost of $2.6 million per year, and rinse and closure years have a G&A cost of $1.8 million per year.
| | 11/8/2021 |
Granite Creek Mine Project
Premier Gold Mines Limited/i-80 Gold Corp. | Page 100
PEA NI 43-101 Technical Report |
Readers are advised that Mineral Resources that are not Mineral Reserves do not have demonstrated economic viability under National Instrument 43-101. This PEA is preliminary in nature and includes inferred Mineral Resources that are considered too speculative geologically to have the economic considerations applied to them that would enable them to be categorized as Mineral Reserves under CIM Definition Standards. Readers are advised that there is no certainty that the results projected in this preliminary economic assessment will be realized.
A multi scenario analysis method was used to analyze the economic performance of the project by varying the cutoff grade used, mining sequence, processing method or combination of methods, number of simultaneous underground stopes, heap leach processing rate, and owner vs. contractor operations.
Ms. Lane of GRE evaluated the following options:
| • | Cutoff grades of 0.35, 0.4, 0.45, 0.5, and 0.55 g/t. All cases with cutoff grade above 0.35 g/t also included low-grade material between 0.35 g/t and the cutoff grade. |
| • | Two mining sequences: B → Mag → CX and B → CX → Mag. |
| • | Two processing options: both CIL and heap leach and heap leach only. |
| • | Two simultaneous stopes options: 5 and 7. |
| • | Two heap leach processing rates: 8,500 tpd and 11,000 tpd. |
After analyzing the economic results of all cases considered, Ms. Lane of GRE selected the CIL and heap leach case with 0.55 g/t cutoff, mining sequence B → CX → Mag, 7 simultaneous stopes, 8,500 tpd heap leach processing, and contractor operation as the base case as it results in the best overall economic results.
The undergound mining method cutoff was determined in the stope design stage. The formula below was used to estimate an operating cutoff grade, xC.
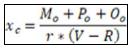
The formula uses these inputs:
| • | MO = Mining Cost of potentially economic material = 100 $/short ton |
| • | PO = Processing Cost of potentially economic material = 106 $/short ton |
| • | OO = Overhead (G&A) Cost of potentially economic material = 1 $/short ton |
| • | r = Process Recovery = 92% |
| • | V = Value of Gold = 1600 $/troy oz |
| • | R = Refining Cost = 5 $/troy oz |
The resulting cutoff grade was 0.141 troy oz/short ton or 4.8 grams/tonne. The cutoff grade was rounded up to 5 gpt, and this was used as the basis for mine design and the cutoff used for underground mining in all options of the economic model.
| | 11/8/2021 |
Granite Creek Mine Project
Premier Gold Mines Limited/i-80 Gold Corp. | Page 101
PEA NI 43-101 Technical Report |
Ms. Lane of GRE performed an economic analysis of the project by building an economic model based on the following assumptions:
| • | Federal corporate income tax rate of 21% |
| • | Proceeds of Minerals Tax - variable, with a maximum of 5% of Net Proceeds |
| • | Nevada gold and silver mine royalty - variable, with a maximum of 1.1% of gross revenue |
| • | Sales and use taxes are not included in the model |
| • | Equipment depreciated over a straight 7 or 15 years and has no salvage value at the end of mine life |
| • | Depletion allowance, lesser of 15% of net revenue or 50% of operating costs |
| • | Gold price of $1,650 per troy ounce |
| • | Gold recovery calculated per block as detailed in Section 13 |
| • | Leaching of 75% of the volume on the heap leach during the first year, 20% during the second year, and 5% during the third year |
| • | Underground material hauled off-site to a third-party Autoclave with 92% payable and $61/tonne material treatment charge and $5/tonne material transportation cost |
| • | Block by block royalties totaling 6.4% of gross revenue, and a 10% net profit royalty |
Ms. Lane of GRE considered the following key economic parameters to determine the best scenario: NPV, IRR, payback period, mine life, and initial capital cost. Table 22-1 summarizes the gold recoveries and revenues for the base case, and Table 22-2 summarizes the results of the economic model.
| | 11/8/2021 |
Granite Creek Mine Project
Premier Gold Mines Limited/i-80 Gold Corp. | Page 102
PEA NI 43-101 Technical Report |
Table 22-1: Granite Creek Mine Project Gold Recoveries and Revenues
| Item | Year -1 | Year 1 | Year 2 | Year 3 | Year 4 | Year 5 | Year 6 | Year 7 | Year 8 | Year 9 | Total |
| Recovered CIL Ounces (1000s) | 0.0 | 0.0 | 0.0 | 132.1 | 74.3 | 42.5 | 37.3 | 38.6 | 38.6 | 37.4 | 400.7 |
| Recovered HL Ounces (1000s) | 0.0 | 64.2 | 88.0 | 94.6 | 77.7 | 62.3 | 40.6 | 31.6 | 7.5 | 1.5 | 468.1 |
| Payable Underground Ounces (1000s) | 0.0 | 63.0 | 96.3 | 108.6 | 87.7 | 21.5 | 0.0 | 0.0 | 0.0 | 0.0 | 377.1 |
| Gross Revenue (millions) | $0.0 | $209.9 | $304.1 | $553.2 | $395.5 | $208.4 | $128.6 | $115.8 | $76.2 | $64.1 | $2,055.8 |
| Refining/Selling Cost (millions) | $0.0 | $0.3 | $0.4 | $1.1 | $0.8 | $0.5 | $0.4 | $0.4 | $0.2 | $0.2 | $4.3 |
| Transportation Charges (millions) | $0.0 | $0.0 | $0.0 | $0.0 | $0.0 | $0.0 | $0.0 | $0.0 | $0.0 | $0.0 | $0.0 |
| Autoclave Treatment Charge (millions) | $0.0 | $17.1 | $24.3 | $24.3 | $23.2 | $4.8 | $0.0 | $0.0 | $0.0 | $0.0 | $93.6 |
| Autoclave Transportation Cost (millions) | $0.0 | $1.4 | $2.0 | $2.0 | $1.9 | $0.4 | $0.0 | $0.0 | $0.0 | $0.0 | $7.7 |
| Royalty (millions) | $0.0 | $7.7 | $17.4 | $33.6 | $23.9 | $14.0 | $9.5 | $8.4 | $5.7 | $4.9 | $125.0 |
| Net Smelter Revenue (millions) | $0.0 | $183.4 | $260.0 | $492.2 | $345.8 | $188.7 | $118.7 | $107.1 | $70.3 | $59.0 | $1,825.2 |
Table 22-2: Granite Creek Mine Project Summary of Economic Model (millions)
| Item | Year -1 | Year 1 | Year 2 | Year 3 | Year 4 | Year 5 | Year 6 | Year 7 | Year 8 | Year 9 | Year 10 | Year 11 | Total |
| Net Smelter Revenue | $0.0 | $183.4 | $260.0 | $492.2 | $345.8 | $188.7 | $118.7 | $107.1 | $70.3 | $59.0 | $0.0 | $0.0 | $1,825.2 |
| Total Operating Costs | $52.8 | $174.5 | $197.1 | $207.7 | $213.8 | $155.7 | $93.2 | $50.4 | $22.4 | $20.5 | $2.1 | $1.2 | $1,191.4 |
| Pre-Tax Operating Cash Flow | ($52.8) | $9.0 | $63.5 | $271.2 | $124.7 | $35.4 | $27.3 | $54.6 | $46.1 | $37.9 | ($2.1) | ($1.2) | $613.6 |
| Taxes | | | | | | | | | | | | | |
| Federal Tax | $0.0 | $1.9 | $6.9 | $40.3 | $8.6 | $0.0 | $0.0 | $1.6 | $1.0 | $0.9 | $0.0 | $0.0 | $61.2 |
| State Tax | $0.0 | $3.5 | $5.1 | $15.6 | $7.1 | $2.2 | $0.9 | $2.7 | $1.9 | $1.7 | $0.0 | $0.0 | $40.5 |
| After-Tax Operating Cash Flow | ($52.8) | $3.7 | $51.6 | $215.4 | $109.0 | $33.2 | $26.4 | $50.4 | $43.2 | $35.4 | ($2.1) | ($1.2) | $511.9 |
| Nevada Property Tax | $3.3 | $3.8 | $6.3 | $1.7 | $1.5 | $1.1 | $0.7 | $0.5 | $0.2 | $0.1 | $0.0 | $0.0 | $19.2 |
| Total Capital Costs | $69.9 | $0.0 | $78.2 | $0.3 | $5.5 | $0.0 | $0.1 | $0.0 | $0.0 | $4.4 | ($10.1) | $0.0 | $148.5 |
| Net Cash Flow After Tax | ($126.0) | ($0.1) | ($33.0) | $213.3 | $102.0 | $32.1 | $25.5 | $49.9 | $43.0 | $30.8 | $7.9 | ($1.2) | $344.2 |
| Cumulative Net Cash Flow After Tax | ($126.0) | ($126.1) | ($159.1) | $54.2 | $156.2 | $188.3 | $213.8 | $263.7 | $306.7 | $337.5 | $345.4 | $344.2 | |
Note: OP pre-stripping costs and UG development costs have been expensed in the Economic Model.
| | 11/8/2021 |
Granite Creek Mine Project
Premier Gold Mines Limited/i-80 Gold Corp. | Page 103
PEA NI 43-101 Technical Report |
Table 22-3 summarizes the key economic results for the base case.
Table 22-3: Granite Creek Mine Project Key Economic Results
| After Tax Economic Measure | Value |
| After Tax NPV@5% (millions) | $244.9 |
| After Tax NPV@7% (millions) | $213.2 |
| After Tax NPV@9% (millions) | $185.1 |
| After Tax IRR | 34.2% |
| Initial Capital (millions) | $69.9 |
| Payback Period (years) | 3.75 |
| All-in Sustaining Cost ($/oz Au Produced) | $963.4 |
| Cash Cost ($/oz Au Produced) | $900.3 |
Ms. Lane of GRE evaluated the after-tax NPV@5% and IRR sensitivity to changes in gold price, capital costs, and operating costs. For this analysis, Ms. Lane of GRE used a base case gold price of $1,650/oz. The results indicate that the after-tax NPV@5% and IRR are most sensitive to gold price, moderately sensitive to operating cost, and least sensitive to capital costs (Figure 22-1 and Table 22-4 for NPV@5%, and Figure 22-2 and Table 22-5 for IRR).
Figure 22-1: After Tax NPV@5% Sensitivity to Varying Gold Price, Capital Costs, and Operating Costs
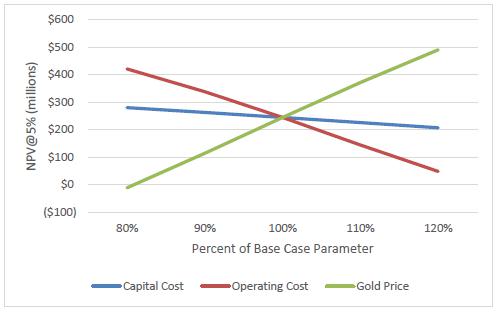
Table 22-4: After Tax NPV@5% (1000s) Sensitivity to Gold Price, Capital Costs, and Operating Costs
| Variable | % of Base Case |
| 80% | 90% | 100% | 110% | 120% |
| Capital Cost | $280.7 | $263.0 | $244.9 | $226.4 | $207.4 |
| Operating Cost | $421.1 | $338.4 | $244.9 | $144.7 | $48.8 |
| Gold Price | ($10.5) | $114.6 | $244.9 | $371.8 | $490.9 |
| | 11/8/2021 |
Granite Creek Mine Project
Premier Gold Mines Limited/i-80 Gold Corp. | Page 104
PEA NI 43-101 Technical Report |
Figure 22-2: IRR Sensitivity to Varying Gold Price, Capital Costs, and Operating Costs
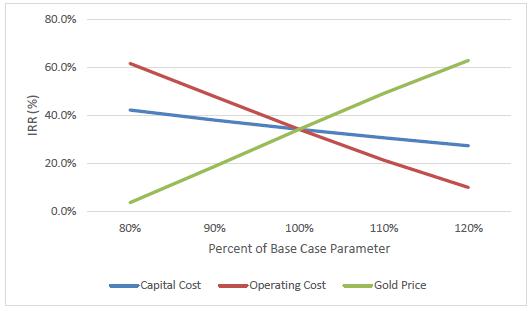
Table 22-5: IRR Sensitivity to Varying Gold Price, Capital Costs, and Operating Costs
| Variable | % of Base Case |
| 80% | 90% | 100% | 110% | 120% |
| Capital Cost | 42.2% | 38.1% | 34.2% | 30.7% | 27.4% |
| Operating Cost | 61.6% | 47.8% | 34.2% | 21.4% | 10.1% |
| Gold Price | 3.8% | 18.8% | 34.2% | 49.1% | 62.8% |
| 22.5 | Conclusions of Economic Model |
The project economics shown in the PEA are favorable, providing positive NPV values at varying gold prices, capital costs, and operating costs. The PEA is preliminary in nature and includes Inferred Mineral Resources that are considered too speculative geologically to have the economic considerations applied to them that would enable them to be categorized as Mineral Reserves under CIM Definition Standards. Readers are advised that there is no certainty that the results projected in this preliminary economic assessment will be realized.
| | 11/8/2021 |
Granite Creek Mine Project
Premier Gold Mines Limited/i-80 Gold Corp. | Page 105
PEA NI 43-101 Technical Report |
To the authors’ knowledge, the adjacent properties as of June 2021 were controlled by an affiliate of the Barrick/Newmont Joint Venture, called Nevada Gold Mines, and at the time of this report, no Mineral Resources have been identified on these properties. Additionally, no Mineral Resources described in this Report go beyond the boundaries of the properties controlled by i-80.
There are two operating mines in the Osgood Mountains which were recently merged. Newmont’s Twin Creeks mine and Barrick’s Turquoise Ridge Mine were merged in the Nevada Gold Mines JV. According to a 2019 resource estimate (Nevada Gold Mines LLC, 2020), Nevada Gold Mines reports 130 Mt M&I resource material grading gat 4.30 g/t for a total of 18M oz of gold. The mine extracts 2,700 tonnes per day from the Turquoise Ridge underground and 1,000 tonnes per day from the vista underground.
| | 11/8/2021 |
Granite Creek Mine Project
Premier Gold Mines Limited/i-80 Gold Corp. | Page 106
PEA NI 43-101 Technical Report |
| 24.0 | OTHER RELEVANT DATA AND INFORMATION |
The Mineral Resources were estimated in the local mine grid.
To convert from Pinson Local Mine Grid to North American Datum (NAD) 27 Universal Transverse Mercator (UTM) Zone 11 Meters Units, the following transformation is required:
At Point (BLM BRASS CAP SECS 27/28/33/34 PINSON grid) E15229.6300, N10098.4000:
| 2. | Rotate = 0d 10’ 03.7” clockwise. |
| 3. | Move = from Point E15229.6300, N10098.4000 (BLM BRASS CAP SECS 27/28/33/34 PINSON grid) to Point E479886.0530, N4553542.7910 (BLM BRASS CAP SECS 27/28/33/34 NAD27 UTM Z11 METERS grid). |
Only the base point “BLM BRASS CAP SECS 28/27/33/34” is held with the surveyed values. It is the base point in both grids.
Table 24-1 shows the monuments / points that can be used for checking the coordinate conversion.
Table 24-1: Transformation Check Points
| Pinson Grid | 27 UTM by Survey | 27 UTM Transform Check |
| CAP 27/28/33/34 | | CAP 27/28/33/34 (held) |
| E15229.6300 N10098.4000 | E479886.0530 N4553542.7910 | E479886.0530 N4553542.7910 |
| CAP ¼ 31-32 E4690.0700 | E476673.4010 | E476673.4034 |
| N7308.3200 | N4552702.3650 | N4552702.3779 |
| CAP 21/22/27/28 E15204.5100 | E473883.0550 | E479883.0508 |
| N15313.3100 | N4555131.1830 | N4555131.1821 |
Source: Osgood Mining Company LLC.
Section 27, References, provides a list of documents that were consulted in support of the PEA. No further data or information is necessary, in the opinion of the Authors, to make the PEA understandable and not misleading.
| | 11/8/2021 |
Granite Creek Mine Project
Premier Gold Mines Limited/i-80 Gold Corp. | Page 107
PEA NI 43-101 Technical Report |
| 25.0 | INTERPRETATION AND CONCLUSIONS |
The key economic results for the base case are summarized in Table 25-1.
Table 25-1: Granite Creek Mine Project Key Economic Results
| After Tax Economic Measure | Value |
| After Tax NPV@5% (millions) | $244.9 |
| After Tax NPV@7% (millions) | $213.2 |
| After Tax NPV@9% (millions) | $185.1 |
| After Tax IRR | 34.2% |
| Initial Capital (millions) | $69.9 |
| Payback Period (years) | 3.75 |
| All-in Sustaining Cost ($/oz Au Produced) | $963.4 |
| Cash Cost ($/oz Au Produced) | $900.3 |
The project economics shown in the PEA are favorable, providing positive NPV values at varying gold prices, capital costs, and operating costs. The PEA is preliminary in nature and includes Inferred Mineral Resources that are considered too speculative geologically to have the economic considerations applied to them that would enable them to be categorized as Mineral Reserves under CIM Definition Standards. Readers are advised that there is no certainty that the results projected in this preliminary economic assessment will be realized.
| | 11/8/2021 |
Granite Creek Mine Project
Premier Gold Mines Limited/i-80 Gold Corp. | Page 108
PEA NI 43-101 Technical Report |
| 26.0 | RECOMMENDATIONS and Opportunities |
The QP’s recommend the following items and budget to advanced the Granite Creek project towards production (Table 26-1).
Table 26-1 Estimated Costs to Complete the 2-Year Program
| Exploration Cost Area | Total |
| Underground Exploration Drilling | $4,000,000 |
| OP Exploration Drilling | $2,400,000 |
| Metallurgical Testing | $400,000 |
| Permitting | $1,500,000 |
| Engineering | $750,000 |
| Total | $9,050,000 |
| 26.1.1 | Metallurgical Testing |
Additional metallurgical test work should be completed on the project to better define recoveries for all zones of the deposit.
| • | Collect samples for testing which are more spatially and mineralogical representative. |
| • | Complete metallurgical testing to include: |
| • | Cyanide solubility and pregnant solution robbing tests |
| • | Bottle roll tests with carbon to simulate CIL treatment |
| • | Leach column tests to simulate heap leach processing |
| • | Expand the predictive geometallurgical model to better predict heap leach and CIL recovery |
| • | Complete additional autoclave tests, from underground materials, to predict recovery by any lithology or mineralogy variations. |
| 26.1.2 | Environmental Recommendations |
At the PEA stage, the environmental recommendations focus on the efforts required to get state and federal permits. These recommendations are summarized below.
| 26.1.2.1 | Requirements for the EIS |
As mentioned in Section 20, the site will require a full EIS as part of the NEPA permitting process. This process can take many years (even in a favorable jurisdiction like Nevada). As a result, the site will need baseline studies and supplemental environmental reports to prepare itself for the permit process.
To begin, the site needs several baseline reports. These will likely be:
| | 11/8/2021 |
Granite Creek Mine Project
Premier Gold Mines Limited/i-80 Gold Corp. | Page 109
PEA NI 43-101 Technical Report |
| • | Archeological and cultural resources |
The most-critical study is geochemistry. Mr. Breckenridge of GRE recommends that i-80 write a Sampling and Analysis Plan for regulator review and that they use upcoming exploration drilling to acquire the necessary samples as soon as possible. Because the kinetic geochemical tests have a year-long duration, the geochemistry study may be the critical path for permitting (and possibly production).
SERs are part of the NEPA process. Mr. Breckenridge of GRE recommends the commencement of the following
| • | Pit lake study for the MAG pit |
| • | Backfill study for the mine waste below the water table in the CX pit |
| • | RIB water quality impact study |
Because the site has never had a full EIS, it may require the following additional SERs:
These additional reports should be started as soon as possible so that they do not slow the critical path to permitting.
| 26.1.2.2 | Requirements for the RIBs |
i-80 has committed to more permitting work on the RIBs. Section 20.2.2.1 describes the required surge pond and arsenic attenuation study required. The site must also build two more RIBs to reach the full permitted capacity of 6,900 gpm. All four RIBs will be required to dewater the MAG pit prior to mining in year 3.
| 26.1.3 | Electrical Power Study |
There is an opportunity to eliminate CIL processing and conduct only heap leach processing, thereby reducing capital intensity and permitting requirements with the tradeoff of fewer ounces produced.
| | 11/8/2021 |
Granite Creek Mine Project
Premier Gold Mines Limited/i-80 Gold Corp. | Page 110
PEA NI 43-101 Technical Report |
There is an opportunity to truck CIL material off-site for processing to reduce capital intensity and permitting requirements with the tradeoff of higher operating costs.
| | 11/8/2021 |
Granite Creek Mine Project
Premier Gold Mines Limited/i-80 Gold Corp. | Page 111
PEA NI 43-101 Technical Report |
AMC. 2020. Technical Report Getchell Project NI 43-101 Technical Report, Premier Gold Mines Limited/Premier Gold Mines, USA, Inc., Humboldt county, Nevada, USA. 2020.
—. 2019. Technical Report, Osgood Pinson Deposit NI 43-101 Technical Report, Osgood Mining Company, LLC, Homboldt County, Nevada, USA. 2019.
Atna Resources Ltd. 2007. Technical Report Update Pinson Gold Property, Humboldt County, Nevada, USA. 2007.
Barrick. 2008. Pinson Geological/Geophysical Targeting. 2008.
BLM. 2001. Granite Creek Administrative Draft Environmental Assessment N63-EA01-xx, prepared for Pinson Mining Company. 2001.
Chadwick, T. H. 2002. Barrick Gold Exploration Inc. Pinson Mine, Humboldt Co., NV. Plate 1: Structure and Lithology of the CS, C and Portions of the A Pits, April. 2002.
Chevillon, V. E., et al. 2000. Geologic Overview of the Getchell Gold Mine Geology, Exploration and Ore Deposits, Humboldt County, Nevada. [ed.] A. E.J. Crafford. Geology and Ore Deposits 2000: The Great Basin and Beyond, Geological Society of Nevada Symposium Proceedings. 2000, pp. 113-121.
CIM. 2014. Definition Standards for Mineral Resources and Mineral Reserves. s.l. : CIM Standing Committe on Reserve Definitions, 2014.
Dawson. 2005. Dawson Autoclave Leach Report, 28 October, udpated 3 November. 2005.
—. 2006a. Pinson Underground Project, Results of Head Analyses and Autoclave/Cyanide Leach Tests on Samples from the Atna-Pinson Project, Project No. P-2895A, B & C, April 14. 2006a.
—. 2006b. Results of Sample Preparation and Head Analysis on Ogee Samples from the Atna-Pinson Project, Project No. P-2895D, April 24. 2006b.
Edmondo, G., McDonald, D. and Stanley, W. R. 2007. Technical Report Update Pinson Gold Property, Humboldt County, Nevada USA, June. 2007.
Foster, J. M. and Kretschmer, E. L. 1991. Geology of the Mag Deposit, Pinson Mine, Humboldt County, Nevada. [ed.] G. L. Raines, et al. Geology and Ore Deposits of the Great Basin: Geological Society of Nevada 1990 Symposium Proceedings. 1991, pp. 845-856.
Foster, J. M. 1994. Gold in Arsenian Framboidal Pyrite in Deep CX Core Hole DDH-1541: Unpublished Pinson Mining Company Report. 1994.
Fritz Geophysics. 2007. Data Processing and Interpretation of Gravity Data, Pinson Property, Elko County, Nevada. 2007.
| | 11/8/2021 |
Granite Creek Mine Project
Premier Gold Mines Limited/i-80 Gold Corp. | Page 112
PEA NI 43-101 Technical Report |
Golder Associates. 2014. NI 43-101 Technical Report Pinson Project Preliminary Feasibility Study, Humboldt County, Nevada, Atna Resources Ltd. 2014.
Gustavson. 2012. NI 43-101 Technical Report on the Mineral Resources of the Pinson Mine, Humboldt County, Nevada. 2012.
Hofstra, A. H. and Cline, J. S. 2000. Characteristics and Models for Carlin-Type Gold Deposits. Society of Economic Geologists Reviews. 2000, Vol. 13, pp. 163-220.
Hotz, P. E. and Willden, R. 1964. Geology and Mineral Deposits of the Osgood Mountains Quadrangle, Humboldt County, Nevada: U.S. Geological Survey Professional Paper 431. 1964.
2020. Infomine. costs.infomine.com. [Online] December 2020. https://costs.infomine.com/.
Jones, A. E. 1991. Tectonic Significance of Paleozoic and Early Mesozoic Terrane Accretion in Northern Nevada: Univeristy of California Berkeley, Ph.D. dissertation. 1991.
Kretschmer, E. L. 1985. Geology of the Mag Deposit, Pinson Mining Company Internal Report. 1985.
—. 1984. Geology of the Pinson and Preble Gold Deposits, Humboldt County, Nevada. Arizona Geological Society Digest. 1984, Vol. 15, pp. 59-66.
Leonardson, R. W. 2016. Pinson Narrative Nov 2016: Unpublished Osgood Mining LLC Company Report. 2016.
Lupo, J.F. 2005. Heap Leach Facility Liner Design. s.l. : Golder Associates, Inc., Lakewood, Colorado, 2005.
Magee Geophysical Services. 2006. Detailed Gravity Survey over the Pinson Property. 2006.
McClelland. 1999b. Report on Heap Leach Cyanidation, Column Leach Tests - Pinson Mine CX Pit Bulk Ore Samples, MLI Job No. 2630, June 16. 1999b.
—. 1999a. Report on Heap Leach, Direct and CIL Cyanidation and "Preg-Robbing" Tests - Various Mag Pit Samples and Composites, and CX Pit 'bulk Ore, MLI Job No. 2532, Addendum, and C.O. #1, 2 and 3, March. 1999a.
—. 2014. Summary Report on Heap Leach Cyanidation Testing - Mag Pit Pinson Drill Core composites, MLI Job No. 3746, January 16. 2014.
—. 2013. Summary Report on Ore Variability Testing - Mag Pit Pinson Drill Core Composites, MLI Job No. 3746, February 7. 2013.
McLachlan, C. D., Struhsacker, E. M. and Thompson, W. F. 2000. The Gold Deposits of Pinson Mining Company: A Review of the Geology and Mining History through 1999, Humboldt County, Nevada. [ed.] A. E.J. Crafford. Geology and Ore Deposits 2000: The Great Basin and Beyond: Geological Society of Nevada Symposium Proceedings. 2000, pp. 123-153.
Muntean, J. L., et al. 2011. Magnatic-Hydrothermal Origin of Nevada's Carlin-type Gold Deposits. Nature. 2011, Vol. 4, pp. 122-127.
| | 11/8/2021 |
Granite Creek Mine Project
Premier Gold Mines Limited/i-80 Gold Corp. | Page 113
PEA NI 43-101 Technical Report |
Nevada Gold Mines LLC. 2020. Technical Report on the Turquoise Rige Complex, State of Nevada, USA, NI 43-101 Report. 2020.
OMC. 2020. Fact Sheet, Osgood Mining Company, Pinson Mining Project, Permit No. Nev2005103 (Renewed 2018). 2020.
—. 2019. OMC Pinson Metallurgy Summary April 2019. 2019.
Pinson Mine. 2015. Internal Ore and Ore Stockpile Tracking and Control, 5 Oct. 2015.
Radtke, A. S. 1985. Geology of the Carlin Gold Deposit, Nevada, 1985: USGS Professional Paper 1267. 1985.
Ridgley, V., et al. 2005. Project Update Pinson Gold Project, Humboldt County, Nevada, USA. [ed.] H. N. Rhoden, R. C. Steinenger and P. G. Vikre. Symposium 2005 Window to the World: Geological Society of Nevada 2005 Symposium Proceedings. 2005, p. 103.
Silberman, M. L., Berger, B. R. and Koski, R. A. 1974. K-Ar Age Relations of Granodiorite Emplacement and Tungsten and Gold Mineralization Near the Getchell Mine, Humboldt County, Nevada. Economic Geology. 1974, Vol. 69, pp. 646-656.
Sim, R. 2005. Revised Technical Report on the Pinson Gold Property, Humboldt County, Nevada. 2005.
Stenger, D. P., et al. 1998. Deposition of Gold in Crlin-type Deposits: The Role of Sulphidation and Decarbonation at Twin Creeks, Nevada. Economic Geology. 1998, Vol. 93, pp. 201-215.
Stoker, P. T. 2006. Newmont Australia Technical Services Sampling Notes, AMC Report to Australia Technical Services, January. 2006.
Thompson, W. F. 2003. [Geologic] Stoping Report for the Pinson Properties: Intrernal Company Report, 2 March. 2003.
Wallace, A. and Wittkopp, R. W. 1983. The Mode of Occurrence of Gold at the Pinson Mine as Determined by Microprobe Analyses, and Metallurgical Implications: Unpublished Pinson Mining Company Report. 1983.
Wilmot. 2006. Wilmot Metallurgical Consulting Met Testwork Results Atna-Pinson Project. 2006.
| | 11/8/2021 |
Granite Creek Mine Project
Premier Gold Mines Limited/i-80 Gold Corp. | Page 114
PEA NI 43-101 Technical Report |
CERTIFICATE OF QUALIFIED PERSON
I, Terre A. Lane, of 600 Grant St., Suite 975, Denver, Colorado, 80203, the co-author of the report entitled “Preliminary Economic Assessment NI 43-101 Technical Report, Pinson Property, Humboldt County, Nevada, USA” with an effective date of May 4, 2021 and an issue date of November 8, 2021 (the “Technical Report”), DO HEREBY CERTIFY THAT:
| 1. | I am a MMSA Qualified Professional in Ore Reserves and Mining, #01407QP, and I am a Registered Member of the Society for Mining, Metallurgy, and Exploration |
| 2. | I hold a degree of Bachelor of Science (1982) in Mining Engineering from Michigan Technological University. |
| 3. | I have practiced my profession since 1982 in capacities from mining engineer to senior management positions for engineering, mine development, exploration, and mining companies. My relevant experience for the purpose of this PEA is as the resource estimator, mine planner, and economic modeler with 25 or more years of experience in each area. |
| 4. | I have taken classes in geology, structural geology, mineralogy, Mineral Resource estimation in university, and have taken several short courses in geostatistics subsequently. |
| 5. | I have worked in geology, managed geologic teams, created lithological and structural models, and I have been involved in or conducted the estimation of resources for several hundred projects at locations in North America, Central America, South America, Africa, Australian/New Zealand, India, China, Russia and Europe using nearly all estimation techniques. |
| 6. | I have estimated resources for many epithermal style gold deposits including, Santa Fe, Relief Canyon, Gilt Edge, Buffalo Valley, Golden Reward, Idaho Almaden, Aurora, and others, and have oversaw the resource estimate of many other similar gold deposits. |
| 7. | I have created or overseen the development of mine plans for several hundred open pit and underground projects and operating mines. |
| 8. | I have been involved in or managed several hundred studies including scoping studies, prefeasibility studies, and feasibility studies. |
| 9. | I have been involved with the mine development, construction, startup, and operation of several mines. |
| 10. | I have read the definition of “Qualified Person” set out in National Instrument 43-101 and certify that by reason of my education, affiliation with a professional organization (as defined in National Instrument 43-101) and past relevant work experience, I fulfill the requirements to be a “Qualified Person” for the purposes of National Instrument 43-101. |
| 11. | I most recently visited the Pinson property on April 20, 2021 for one day and have reviewed previous geological data, geochemical results, metallurgical and technical reports on the subject property. |
| 12. | I am responsible for Sections Sections 1.5, 1.6, 1.7, 1.8, 1.9, 1.10, 2, 3, 14, 15, 16, 21, 22, 24, 25, 26, and 27 of the Technical Report. |
| 13. | I am independent of i-80 as described in section 1.5 by National Instrument 43-101. |
| 14. | I have not previously worked on the Pinson Project. |
| 15. | I have read National Instrument 43-101 and Form 43-101F1. The Technical Report has been prepared in compliance with the National Instrument 43-101 and Form 43-101F1. |
| | 11/8/2021 |
Granite Creek Mine Project
Premier Gold Mines Limited/i-80 Gold Corp. | Page 115
PEA NI 43-101 Technical Report |
| 16. | As of the effective date of the Technical Report, to the best of my knowledge, information and belief, the Technical Report contains all scientific and technical information that is required to be disclosed to make the Technical Report not misleading. |
Terre A. Lane
“Terre A. Lane”
Mining Engineer
Global Resource Engineering, Ltd.
Denver, Colorado
Date of Signing: November 8, 2021
| | 11/8/2021 |
Granite Creek Mine Project
Premier Gold Mines Limited/i-80 Gold Corp. | Page 116
PEA NI 43-101 Technical Report |
CERTIFICATE OF QUALIFIED PERSON
I, J. Todd Harvey, of 600 Grant Street, Suite 975, Denver, CO 80203, the co-author of the report entitled “Preliminary Economic Assessment NI 43-101 Technical Report, Pinson Property, Humboldt County, Nevada, USA” with an effective date of May 4, 2021 and issue date of November 8, 2021 (the “Technical Report”), DO HEREBY CERTIFY THAT:
| 1. | I am currently employed as Principal Process and Mining Engineer by Global Resource Engineering, Ltd. |
| 2. | I graduated with Ph.D. in Mining Engineering from the Queen’s University at Kingston in 1994, a Master's degree in Mining Engineering from the Queen’s University at Kingston in 1990 and a Bachelors degree in Mining Engineering in 1988 all with a specialization in mineral processing. I also hold a degree in Metallurgical Engineering and Computer Science from Ryerson University in Toronto Canada graduating in 1986 as well as an MBA from the University of New Brunswick in Saint John Canada graduating in 2001. |
| 3. | I have worked as a Process Engineer for over 35 years since my graduation from university. My relevant experience includes process due diligence/competent persons evaluations of developmental phase and operational phase mines throughout the world, including mines in the USA, Canada, Kazakhstan, Brazil, Mexico, and Africa to name a few. I have a wide range of experience in multiple mineral fields including precious metal processing and base metals such as copper, lead, and zinc. |
| 4. | I am a Registered Member (No. 04144120) of the Society for Mining, Metallurgy & Exploration Inc. (SME). I am also a member of the Association for Mineral Exploration (AME), Minerals Engineering Journal Review Board, and the Journal of Hydrometallurgy Review Board. |
| 5. | I have read the definition of “Qualified Person” set out in National Instrument 43-101 and certify that by reason of my education, affiliation with a professional organization (as defined in National Instrument 43-101) and past relevant work experience, I fulfill the requirements to be a “Qualified Person” for the purposes of National Instrument 43-101. |
| 6. | I have not visited the Pinson Property. |
| 7. | I am responsible for Sections 13 and 17. |
| 8. | I am independent of /i-80 as described in section 1.5 by National Instrument 43-101. |
| 9. | I have not previously worked on the Granite Creek Mine Project. |
| 10. | I have read National Instrument 43-101 and Form 43-101F1. The Technical Report has been prepared in compliance with the National Instrument 43-101 and Form 43-101F1. |
| 11. | As of the effective date of the Technical Report, to the best of my knowledge, information and belief, the Technical Report contains all scientific and technical information that is required to be disclosed to make the Technical Report not misleading. |
J. Todd Harvey
“J. Todd Harvey”
Metallurgist
Global Resource Engineering, Ltd.
Denver, Colorado
Date of Signing: November 8, 2021
| | 11/8/2021 |
Granite Creek Mine Project
Premier Gold Mines Limited/i-80 Gold Corp. | Page 117
PEA NI 43-101 Technical Report |
CERTIFICATE OF QUALIFIED PERSON
I, Richard D. Moritz, of 600 Grant St., Suite 975, Denver, Colorado, 80203, the co-author of the report entitled “Preliminary Economic Assessment NI 43-101 Technical Report, Pinson Property, Humboldt County, Nevada, USA” with an effective date of May 4, 2021 and an issue date of November 8, 2021 (the “Technical Report”), DO HEREBY CERTIFY THAT:
| 1. | I am a MMSA Qualified Professional in Processing, #01256QP |
| 2. | I hold a degree of Bachelor of Science (1979) in Mining Engineering from University of Nevada, Reno and a Master’s in Business Administration (1987) from the University of Nevada, Reno. |
| 3. | I have practiced my profession since 1979 in capacities including mining engineer, mine superintendent, mine manager, processing superintendent, processing manager, and senior management positions for engineering, and mining companies. My relevant experience for the purpose of this PEA is as the mineral processing engineer with 35 or more years of experience. |
| 4. | I have taken classes in mining, mine economics, mineralogy, and mineral processing. |
| 5. | I have worked at producing operations utilizing heap leaching and milling for processing, designed precious metals recovery plants for an international engineering company, completed new mineral processing plant construction and commissioning. I have worked at locations in North America, Central America, South America, Africa, Australian, and former Russia. |
| 6. | I have been on multiple teams developing new mines from initial design through to construction and operation. |
| 7. | I have been involved in numerous studies including scoping studies, prefeasibility studies, and feasibility studies. |
| 8. | I have read the definition of “Qualified Person” set out in National Instrument 43-101 and certify that by reason of my education, affiliation with a professional organization (as defined in National Instrument 43-101) and past relevant work experience, I fulfill the requirements to be a “Qualified Person” for the purposes of National Instrument 43-101. |
| 9. | I most recently visited the Pinson property in April 2021 for one day and have reviewed previous metallurgical data and lab reports, and prior technical reports on the subject property. |
| 10. | I am responsible for Sections 13, 17, 18, 19, and 23 of the Technical Report. |
| 11. | I am independent of i-80 as described in section 1.5 by National Instrument 43-101. |
| 12. | I have not previously worked on the Granite Creek Mine Project. |
| 13. | I have read National Instrument 43-101 and Form 43-101F1. The Technical Report has been prepared in compliance with the National Instrument 43-101 and Form 43-101F1. |
| 14. | As of the effective date of the Technical Report, to the best of my knowledge, information and belief, the Technical Report contains all scientific and technical information that is required to be disclosed to make the Technical Report not misleading. |
Richard D. Moritz
“Richard D. Moritz”
Principal Mining and Mineral Processing Engineer
Global Resource Engineering, Ltd.
| | 11/8/2021 |
Granite Creek Mine Project
Premier Gold Mines Limited/i-80 Gold Corp. | Page 118
PEA NI 43-101 Technical Report |
Denver, Colorado
Date of Signing: November 8, 2021
| | 11/8/2021 |
Granite Creek Mine Project
Premier Gold Mines Limited/i-80 Gold Corp. | Page 119
PEA NI 43-101 Technical Report |
CERTIFICATE OF QUALIFIED PERSON
I, Hamid Samari, PhD, of 600 Grant St., Suite 975, Denver, Colorado, 80203, the co-author of the report entitled “Preliminary Economic Assessment NI 43-101 Technical Report, Pinson Property, Humboldt County, Nevada, USA” with an effective date of May 4, 2021 and an issue date of November 8, 2021 (the “Technical Report”), DO HEREBY CERTIFY THAT:
| 1. | I am currently employed as senior geologist by Global Resource Engineering, Ltd. |
| 2. | I am a MMSA Qualified Professional in Geology, #01519QP. |
| 3. | I graduated with Ph.D. in geology (Tectonics - structural geology) from Tehran Azad University (Sciences & Research Branch) in 2000, a Master's degree in geology (Tectonics) from the Beheshti’s University at Tehran in 1995 and a Bachelor’s degree in geology from the Beheshti’s University at Tehran in 1991. |
| 4. | I have practiced my profession since 1994 in capacities from expert of geology to senior geologist and project manager positions for geology, seismic hazard assessment and mining exploration. |
| 5. | I have been involved with many studies including scoping studies, prefeasibility studies, and feasibility studies. |
| 6. | I have read the definition of “Qualified Person” set out in National Instrument 43-101 and certify that by reason of my education, affiliation with a professional organization (as defined in National Instrument 43-101) and past relevant work experience, I fulfill the requirements to be a “Qualified Person” for the purposes of National Instrument 43-101. |
| 7. | I most recently visited the Pinson property on April 20, 2021 for one day and have reviewed previous geological data. I have personally inspected core samples, and collected verification samples. |
| 8. | I am responsible for Sections 4 through 12 of the Technical Report and for the geologic content in Sections 1, 14, and 23. |
| 9. | I am independent of i-80 as described in section 1.5 by National Instrument 43-101. |
| 10. | I have not previously worked on the Granite Creek Mine Project. |
| 11. | I have read National Instrument 43-101 and Form 43-101F1. The Technical Report has been prepared in compliance with the National Instrument 43-101 and Form 43-101F1. |
| 12. | As of the effective date of the Technical Report, to the best of my knowledge, information and belief, the Technical Report contains all scientific and technical information that is required to be disclosed to make the Technical Report not misleading. |
Hamid Samari, PhD
“Hamid Samari“
Geologist
Global Resource Engineering, Ltd.
Denver, Colorado
Date of Signing: November 8, 2021
| | 11/8/2021 |
Granite Creek Mine Project
Premier Gold Mines Limited/i-80 Gold Corp. | Page 120
PEA NI 43-101 Technical Report |
CERTIFICATE OF QUALIFIED PERSON
I, J. Larry Breckenridge, P.E., of 600 Grant St., Suite 975, Denver, Colorado, 80203, the co-author of the report entitled “NI 43-101 Technical Report, Waterloo Project, California, USA” with an effective date of May 4, 2021 and an issue date of November 8, 2021 (the “Technical Report”), DO HEREBY CERTIFY THAT:
| 1. | I am currently employed as principal environmental engineer by Global Resource Engineering, Ltd. |
| 2. | I am a graduate of Dartmouth College with a degree in Engineering Modified with Environmental Science (BA) and from the Colorado School of Mines with a Masters’ degree in Environmental Engineering. |
| 3. | I am a Qualified Person under NI 43-101 because I am a registered Environmental Engineer in the State of Colorado, USA, No. 38048. |
| 4. | I have practiced area of water management, geochemistry, and environmental management - exclusively for precious and base metals projects for over 25 years. I have worked with Global Resource Engineering in my same role for the last 12 years. I have participated in the permitting process for numerous mines in the United States and in Latin America. I have evaluated geochemical risk and permitting requirements for precious metals projects and also performed water availability studies. |
| 5. | I have read the definition of “qualified person” set out in National instrument 43-101 (“NI 43-101”) and certify that by reason of my education, affiliation with a professional association (as defined in NI 43-101) and past relevant work experience, I fulfill the requirements to be a “qualified person” for the purposes of NI 43-101. |
| 6. | I most recently visited the Pinson property on April 20, 2021 for one day and have reviewed previous environmental data, environmental reports, and interviewed the prior environmental manager. |
| 7. | I am responsible for Sections 4.4, 4.5, and 20. |
| 8. | I am independent of i-80 as described in section 1.5 by National Instrument 43-101. |
| 9. | I have not previously worked on the Granite Creek Mine Project. |
| 10. | I have read National Instrument 43-101 and Form 43-101F1 and confirm the sections of the Technical Report for which I am responsible (as listed above) have been prepared in compliance with that instrument and form. |
| 11. | As of the effective date of the Technical Report, to the best of my knowledge, information and belief, the Technical Report contains all scientific and technical information required to be disclosed to make the report not misleading. |
Mr. J. Larry Breckenrdige
“J Larry Breckenridge“
Principal Environmental Engineer
Global Resource Engineering, Ltd.
Denver, Colorado
Date of Signing: November 8, 2021
| | 11/8/2021 |