UNITED STATES
SECURITIES AND EXCHANGE COMMISSION
Washington, D.C. 20549
FORM N-CSR
CERTIFIED SHAREHOLDER REPORT OF REGISTERED
MANAGEMENT INVESTMENT COMPANIES
Investment Company Act file number | 811-23669 |
Nuveen Multi-Asset Income Fund
(Exact name of registrant as specified in charter)
Nuveen Investments
333 West Wacker Drive
Chicago, IL 60606
(Address of principal executive offices) (Zip code)
Mark L. Winget
Nuveen Investments
333 West Wacker Drive
Chicago, IL 60606
(Name and address of agent for service)
Registrant’s telephone number, including area code: (312) 917-7700
Date of fiscal year end: December 31
Date of reporting period: December 31, 2021
Form N-CSR is to be used by management investment companies to file reports with the Commission not later than 10 days after the transmission to stockholders of any report that is required to be transmitted to stockholders under Rule 30e-1 under the Investment Company Act of 1940 (17 CFR 270.30e-1). The Commission may use the information provided on Form N-CSR in its regulatory, disclosure review, inspection, and policymaking roles.
A registrant is required to disclose the information specified by Form N-CSR, and the Commission will make this information public. A registrant is not required to respond to the collection of information contained in Form N-CSR unless the Form displays a currently valid Office of Management and Budget (“OMB”) control number. Please direct comments concerning the accuracy of the information collection burden estimate and any suggestions for reducing the burden to Secretary, Securities and Exchange Commission, 450 Fifth Street, NW, Washington, DC 20549-0609. The OMB has reviewed this collection of information under the clearance requirements of 44 U.S.C. ss. 3507.
ITEM 1. REPORTS TO STOCKHOLDERS.

Closed-End Funds
31 December 2021
Nuveen Closed-End Funds
| NMAI | Nuveen Multi-Asset Income Fund |
As permitted by regulations adopted by the Securities and Exchange Commission, paper copies of the Fund’s annual and semi-annual shareholder reports will not be sent to you by mail unless you specifically request paper copies of the reports. Instead, the reports will be made available on the Fund’s website (www.nuveen.com), and you will be notified by mail each time a report is posted and provided with a website link to access the report.
You may elect to receive shareholder reports and other communications from the Fund electronically at any time by contacting the financial intermediary (such as a broker-dealer or bank) through which you hold your Fund shares or, if you are a direct investor, by enrolling at www.nuveen.com/e-reports.
You may elect to receive all future shareholder reports in paper free of charge at any time by contacting your financial intermediary or, if you are a direct investor, by calling 800-257-8787 and selecting option #2 or (ii) by logging into your Investor Center account at www.computershare.com/investor and clicking on “Communication Preferences”. Your election to receive reports in paper will apply to all funds held in your account with your financial intermediary or, if you are a direct investor, to all your directly held Nuveen Funds and any other directly held funds within the same group of related investment companies.
Annual Report
Life is Complex.
Nuveen makes things e-simple.
It only takes a minute to sign up for e-Reports. Once enrolled, you’ll receive an e-mail as soon as your Nuveen Fund information is ready. No more waiting for delivery by regular mail. Just click on the link within the e-mail to see the report and save it on your computer if you wish.
Free e-Reports right to your email!
www.investordelivery.com
If you receive your Nuveen Fund distributions and statements from your financial professional or brokerage account.
or
www.nuveen.com/client-access
If you receive your Nuveen Fund distributions and statements directly from Nuveen.
NOT FDIC INSURED MAY LOSE VALUE NO BANK GUARANTEE
| 4 | ||||
| 5 | ||||
| 6 | ||||
| 8 | ||||
| 9 | ||||
| 12 | ||||
| 14 | ||||
| 15 | ||||
| 45 | ||||
| 46 | ||||
| 47 | ||||
| 48 | ||||
| 50 | ||||
| 52 | ||||
| 62 | ||||
| 86 | ||||
| 87 | ||||
| 88 | ||||
| 94 | ||||
3
Chair’s Letter to Shareholders

Dear Shareholders,
We have seen a nearly full recovery in the economy and began to approach more normalcy in our daily lives, enabled by unprecedented help from governments and central banks and the development of effective COVID-19 vaccines and therapies.
As crisis-related monetary and fiscal supports are phasing out, global economic growth is expected to moderate from post-pandemic peak growth toward a more sustainable pace of expansion. In the U.S., the rapid rebound in the economy has pushed consumer prices higher, and ongoing supply chain disruptions have kept the inflation rate elevated for longer than expected. With the economy and employment on strong footing, the Federal Reserve is ending its pandemic bond buying program and will begin raising short-term interest rates in 2022 to help keep inflation in check. The Fed now faces the challenge of counteracting inflation pressures without stifling economic growth, which the markets will be watching closely. On the fiscal side, government spending will be lower from here, but the U.S. will begin funding projects with the $1.2 trillion Infrastructure Investment and Jobs Act enacted on November 15, 2021, and Europe, Japan and China are also expected to roll out fiscal support in 2022.
Inflation levels, the timing of monetary policy normalization and the global economy’s response to tighter financial conditions will be a key focus in the markets. We anticipate periodic volatility as markets digest incoming data on these impacts, as well as COVID-19 headlines, as there is still uncertainty about the course of the pandemic. Short-term market fluctuations can provide your Fund opportunities to invest in new ideas as well as upgrade existing positioning while providing long-term value for shareholders. For more than 120 years, the careful consideration of risk and reward has guided Nuveen’s focus on delivering long-term results to our shareholders.
To learn more about how your portfolio can take advantage of new opportunities arising from the normalizing global economy, we encourage you to review your time horizon, risk tolerance and investment goals with your financial professional.
On behalf of the other members of the Nuveen Fund Board, I look forward to continuing to earn your trust in the months and years ahead.
Sincerely,

Terence J. Toth
Chair of the Board
February 22, 2022
4
For Shareholders of
Nuveen Multi-Asset Income Fund (NMAI)
Fund Reorganizations
Nuveen Multi-Asset Income Fund (NYSE NMAI) was formed for the purpose of completing the reorganizations of Nuveen Diversified Dividend and Income Fund (JDD), Nuveen Tax-Advantaged Total Return Strategy Fund (JTA), and Nuveen Tax-Advantaged Dividend Growth Fund (JTD). The reorganizations were successfully completed prior to the opening of the New York Stock Exchange on November 22, 2021. Refer to Note 1 and Note 9 of the Notes to Financial Statements within this report for further details on the reorganizations.
5
Nuveen Multi-Asset Income Fund (NMAI)
Nuveen Multi-Asset Income Fund (NMAI) features a dynamic multi-asset allocation strategy that may invest in a portfolio of equity and debt securities of issuers located around word through access to all the different types of equity and income strategies offered by Nuveen Asset Management, LLC (NAM), Teachers Advisors, LLC (TAL) and Winslow Capital Management LLC (Winslow). NAM, TAL and Winslow each serve as a sub-adviser to the Fund (Sub-Adviser) and are each an affiliate of Nuveen Fund Advisors, LLC, the Fund’s investment adviser. Nathan S. Shetty, CFA, FRM, and Anurag Dugar are the portfolio managers in NAM responsible for implementing the dynamic multi-asset allocation strategy and for allocating the Fund’s assets among various strategies at a Sub-Adviser. The allocation of the Fund’s assets across strategies and asset classes may change over time.
Here the Fund’s portfolio management team reviews key investment strategies and the performance of the Fund for the abbreviated reporting period ended December 31, 2021. For more information on the Fund’s investment objectives and policies, please refer to the Shareholder Update section at the end of the report.
What key strategies were used to manage the Fund during the abbreviated reporting period since the Fund’s commencement of operations on November 22, 2021 through December 31, 2021?
The Fund’s investment objective is to provide attractive total return through high current income and capital appreciation. The Fund dynamically invests in a portfolio of equity and debt securities of issuers located around the world. This dynamic investment strategy uses a risk-based framework to determine the allocations. The relative allocations of the Fund’s managed assets for investment between equity and debt securities, and relative allocations to the different types of equity and income strategies, will vary from time to time, consistent with the Fund’s investment objective. The Fund uses leverage.
How did the Fund perform during the abbreviated reporting period since the Fund’s commencement of operations on November 22, 2021 through December 31, 2021?
For the abbreviated reporting period since the Fund’s commencement of operations on November 22, 2021 through December 31, 2021, the Fund outperformed the NMAI Blended Benchmark, which consists of: 1) 50% MSCI ACWI Index (Net) and 2) 50% Bloomberg U.S. Corporate High Yield Bond Index.
This material is not intended to be a recommendation or investment advice, does not constitute a solicitation to buy, sell or hold a security or an investment strategy and is not provided in a fiduciary capacity. The information provided does not take into account the specific objectives or circumstances of any particular investor, or suggest any specific course of action. Investment decisions should be made based on an investor’s objectives and circumstances and in consultation with his or her advisors.
Certain statements in this report are forward-looking statements. Discussions of specific investments are for illustration only and are not intended as recommendations of individual investments. The forward-looking statements and other views expressed herein are those of the portfolio managers as of the date of this report. Actual future results or occurrences may differ significantly from those anticipated in any forward-looking statements and the views expressed herein are subject to change at any time, due to numerous market and other factors. The Fund disclaims any obligation to update publicly or revise any forward-looking statements or views expressed herein.
The Fund uses credit quality ratings for its portfolio securities provided by Standard & Poor’s Group, Moody’s Investors Service, Inc. and Fitch, Inc. If all three provide a rating for a security, the middle is used; if two of the three agencies rate a security, the lower rating is used; and if only one rating agency rates a security, that rating is used. This treatment of split-rated securities may differ from that used for other purposes, such as for Fund investment policies. Credit ratings are subject to change. AAA, AA, A and BBB are investment grade ratings; BB, B, CCC, CC, C and D are below-investment grade ratings. Holdings designated N/R are not rated by these national rating agencies. Refer to the Glossary of Terms Used in this Report for further definition of the terms used within this section.
Refer to the Glossary of Terms Used in this Report for further definition of the terms used within this section.
6
Since the reorganizations took place late in the reporting period, NMAI has been repositioning investments across equities and fixed income in accordance with the Fund’s strategy. Within equities, the Fund is sourcing a significant portion of long term equity beta from international equities. The Fund also has an allocation to US large-cap value, US real estate investment trust (REITs) and global infrastructure equities as the investment team prefers cyclicality in the current market environment.
Within fixed income, the Fund owns preferred securities and leveraged loans as a source of attractive risk-adjusted income. The investment team favors preferred securities as the balance sheets and profitability of the financial sector, the largest sector weighting within the preferreds asset class, are likely to remain robust and may potentially benefit from yield curve steepening. The investment team also believes that above-average inflation will persist and that the corporate default cycle will remain benign in the near-term, and favors shorter-duration, higher yielding credit, such as leveraged loans, in this market environment. The Fund also has an allocation to emerging market debt, an area that the investment team finds attractively valued.
7
IMPACT OF THE FUND’S LEVERAGE STRATEGY ON PERFORMANCE
One important factor impacting the returns of the Fund’s common shares relative to its comparative benchmarks was the Fund’s use of leverage through the use of bank borrowings and mortgage dollars rolls. The Fund uses leverage because our research has shown that, over time, leveraging provides opportunities for additional income. The opportunity arises when short-term rates that the Fund pays on its leveraging instruments are lower than the interest the Fund earns on its portfolio securities that it has bought with the proceeds of that leverage. This has been particularly true in the recent market environment where short-term rates have been low by historical standards.
However, use of leverage can expose Fund common shares to additional price volatility. When a Fund uses leverage, the Fund’s common shares will experience a greater increase in their net asset value if the securities acquired through the use of leverage increase in value, but will also experience a correspondingly larger decline in their net asset value if the bonds acquired through leverage decline in value. All this will make the shares’ total return performance more variable, over time.
In addition, common share income in levered funds will typically decrease in comparison to unlevered funds when short-term interest rates increase and increase when short-term interest rates decrease. In recent quarters, fund leverage expenses have generally tracked the overall movement of short-term tax-exempt interest rates. While fund leverage expenses are somewhat higher than their recent lows, leverage nevertheless continues to provide the opportunity for incremental common share income, particularly over longer-term periods.
The Fund’s use of leverage had a positive impact on total return performance during this reporting period.
As of December 31, 2021, the Fund’s percentages of leverage are as shown in the accompanying table.
| NMAI | ||||
Effective Leverage* | 31.13 | % | ||
Regulatory Leverage* | 21.05 | % | ||
| * | Effective leverage is a Fund’s effective economic leverage, and includes both regulatory leverage and the leverage effects of reverse repurchase agreements, certain derivative and other investments in the Fund’s portfolio that increase the Fund’s investment exposure. Regulatory leverage consists of preferred shares issued or borrowings of the Fund. Both of these are part of a Fund’s capital structure. The Fund, however, may from time to time borrow on a typically transient basis in connection with its day-to-day operations, primarily in connection with the need to settle portfolio trades. Such incidental borrowings are excluded from the calculation of the Fund’s effective leverage ratio. Regulatory leverage is subject to asset coverage limits set forth in the Investment Company Act of 1940. |
THE FUND’S REGULATORY LEVERAGE
Bank Borrowings
As noted previously, the Fund employs leverage through the use of bank borrowings. The Fund’s bank borrowing activities are as shown in the accompanying table.
| Current Reporting Period | Subsequent to the Close of the Reporting Period | |||||||||||||||||||||||||||||||||
Outstanding November 22, 2021* | Draws | Paydowns | Outstanding Balance as of December 31, 2021 | Average Balance Outstanding | Draws | Paydowns | Outstanding Balance as of February 25, 2022 | |||||||||||||||||||||||||||
| $178,550,000 | $39,838,700 | $(39,838,700 | ) | $178,550,000 | $178,550,000 | $24,500,000 | $ — | $203,050,000 | ||||||||||||||||||||||||||
| * | Commencement of operations |
Refer to Notes to Financial Statements, Note 8 – Borrowing Arrangements for further details.
8
DISTRIBUTION INFORMATION
The following information regarding the Fund’s distributions is current as of December 31, 2021, the Fund’s fiscal and tax year end, and may differ from previously issued distribution notifications.
This notice provides shareholders with information regarding fund distributions, as required by current securities laws. You should not draw any conclusions about the Fund’s investment performance from the amount of the distribution or from the terms of the Fund’s Managed Distribution Policy.
The Fund may in certain periods distribute more than its income and net realized capital gains, and the Fund currently estimates that it has done so for the fiscal year-to-date period. In such instances, a portion of the distribution may be a return of capital. A return of capital may occur, for example, when some or all of the money that you invested in the Fund is paid back to you. A return of capital distribution does not necessarily reflect the Fund’s investment performance and should not be confused with “yield” or “income.”
The amounts and sources of distributions reported in this notice are for financial reporting purposes and are not being provided for tax reporting purposes. The actual amounts and character of the distributions for tax reporting purposes will be reported to shareholders on Form 1099-DIV which will be sent to shareholders shortly after calendar year-end. More details about the Fund’s distributions and the basis for these estimates are available on www.nuveen.com/cef.
The following tables provide information regarding the Fund’s common share distributions and total return performance for the fiscal year ended December 31, 2021. This information is intended to help you better understand whether the Fund’s returns for the specified time period were sufficient to meet its distributions.
Data as of December 31, 2021
| Per Share Sources of Distribution | Percentage of the Distribution | |||||||||||||||||||||||||||||||||||
| NMAI (FYE 12/31) | Per Share Distribution | Net Investment Income | Long-Term Gains | Short-Term Gains | Return of Capital1 | Net Investment Income | Long-Term Gains | Short-Term Gains | Return of Capital1 | |||||||||||||||||||||||||||
Fiscal YTD | $ | 0.3500 | $ | 0.0590 | $ | 0.1759 | $ | 0.1151 | $ | 0.0000 | 16.86 | % | 50.25 | % | 32.89 | % | 0.00 | % | ||||||||||||||||||
| Annualized | ||||||||||||||||||||
| NMAI (FYE 12/31) Inception Date | Net Asset Value (NAV) | 1-Year Return on NAV | 5-Year Return on NAV | Since Inception Return on NAV | Fiscal YTD Dist Rate on NAV | |||||||||||||||
Nov 2021 | $ | 20.03 | N/A | N/A | 1.90 | % | 1.75 | % | ||||||||||||
| 1 | Return of Capital may represent unrealized gains, return of shareholder’s principal, or both. In certain circumstances, all or a portion of the return of capital may be characterized as ordinary income under federal tax law. The actual tax characterization will be provided to shareholders on Form 1099-DIV shortly after calendar year-end. |
NUVEEN CLOSED-END FUND DISTRIBUTION AMOUNTS
The Nuveen Closed-End Funds’ monthly and quarterly periodic distributions to shareholders are posted on www.nuveen.com and can be found on Nuveen’s enhanced closed-end fund resource page, which is at https://www.nuveen.com/resource-center-closed-end-funds, along with other Nuveen closed-end fund product updates. To ensure timely access to the latest information, shareholders may use a subscribe function, which can be activated at this web page (https://www.nuveen.com/subscriptions).
9
Common Share Information (continued)
OTHER COMMON SHARE INFORMATION
As of December 31, 2021, the Fund’s common share price was trading at a premium/(discount) to its common share NAV and trading at an average premium/(discount) to NAV during the current reporting period, as follows:
| NMAI | ||||
Common share NAV | $ | 20.03 | ||
Common share price | $ | 18.65 | ||
Premium/(Discount) to NAV | (6.89 | )% | ||
Average premium/(discount) to NAV | (7.36 | )% | ||
10
THIS PAGE INTENTIONALLY LEFT BLANK
11
NMAI | Nuveen Multi-Asset Income Fund Performance Overview and Holding Summaries as of December 31, |
Refer to the Glossary of Terms Used in this Report for further definition of the terms used within this section.
Cumulative Total Returns as of December 31, 2021
| Since Inception | ||||
| NMAI at Common Share NAV | 1.90% | |||
| NMAI at Common Share Price | (5.00)% | |||
S&P 500® Index | 1.92% | |||
NMAI Blended Benchmark1,2 | 0.87% | |||
Since inception returns are from 11/22/21. Past performance is not predictive of future results. Current performance may be higher or lower than the data shown. Returns do not reflect the deduction of taxes that shareholders may have to pay on Fund distributions or upon the sale of Fund shares. Returns at NAV are net of Fund expenses, and assume reinvestment of distributions. Comparative index return information is provided for the Fund’s shares at NAV only. Indexes are not available for direct investment.
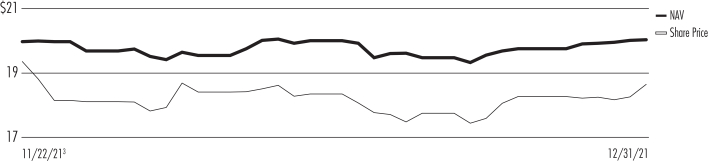
Daily Common Share NAV and Share Price
| 1 | For purposes of Fund performance, relative results are measured against this benchmark/index. |
| 2 | NMAI Blended Benchmark consists of: 1) 50% MSCI ACWI Index (Net) and 2) 50% Bloomberg U.S. Corporate High Yield Bond Index. |
| 3 | The Fund commenced operations on November 22, 2021 following the reorganizations of Nuveen Diversified Dividend and Income Fund (JDD), Nuveen Tax-Advantaged Total Return Strategy Fund (JTA), and Nuveen Tax-Advantaged Dividend Growth Fund (JTD) into the Fund. The Fund was the accounting and performance survivor of the reorganization. Accordingly, its performance history commenced on November 22, 2021. |
12
This data relates to the securities held in the Fund’s portfolio of investments as of the end of the reporting period. It should not be construed as a measure of performance for the Fund itself. Holdings are subject to change.
The Fund uses credit quality ratings for its portfolio securities provided by Standard & Poor’s Group, Moody’s Investors Service, Inc. and Fitch, Inc. If all three provide a rating for a security, the middle is used; if two of the three agencies rate a security, the lower rating is used; and if only one rating agency rates a security, that rating is used. This treatment of split-rated securities may differ from that used for other purposes, such as for Fund investment policies. Credit ratings are subject to change. AAA, AA, A and BBB are investment grade ratings; BB, B, CCC, CC, C and D are below-investment grade ratings. Holdings designated N/R are not rated by these national rating agencies.
Fund Allocation
(% of net assets)
| Common Stocks | 61.6% | |||
| Asset-Backed and Mortgage-Backed Securities | 18.5% | |||
| Variable Rate Senior Loan Interests | 16.5% | |||
| REIT Common Stocks | 15.6% | |||
| $1,000 Par (or similar) Institutional Preferred | 9.2% | |||
| Emerging Market Debt and Foreign Corporate Bonds | 8.5% | |||
| Contingent Capital Securities | 7.1% | |||
| $25 Par (or similar) Retail Preferred | 4.0% | |||
| Corporate Bonds | 2.4% | |||
| Warrants | 0.1% | |||
| Investment Companies | 0.0% | |||
| Repurchase Agreements | 0.1% | |||
| Other Assets Less Liabilities | (16.9)% | |||
Net Assets Plus Borrowings | 126.7% | |||
| Borrowings | (26.7)% | |||
Net Assets | 100% |
Portfolio Credit Quality
(% of total fixed-income investments)
| AAA | 28.1% | |||
| AA | 0.9% | |||
| A | 0.9% | |||
| BBB | 18.8% | |||
| BB or Lower | 49.3% | |||
| N/R | 2.0% | |||
Total | 100% |
Portfolio Composition
(% of total investments)
| Asset-Backed and Mortgage-Backed Securities | 12.9% | |||
| Real Estate Investment Trust Common Stocks | 10.8% | |||
| Banks | 10.1% | |||
| Emerging Market Debt and Foreign Corporate Bonds | 5.9% | |||
| Capital Markets | 3.2% | |||
| Software | 3.1% | |||
| Pharmaceuticals | 3.1% | |||
| Oil, Gas & Consumable Fuels | 2.9% | |||
| Insurance | 2.9% | |||
| Hotels, Restaurants & Leisure | 2.7% | |||
| Media | 2.3% | |||
| Health Care Providers & Services | 2.1% | |||
| Chemicals | 2.1% | |||
| Electric Utilities | 1.8% | |||
| Transportation Infrastructure | 1.5% | |||
| Interactive Media & Services | 1.5% | |||
| Semiconductors & Semiconductor Equipment | 1.4% | |||
| IT Services | 1.3% | |||
| Internet & Direct Marketing Retail | 1.3% | |||
| Food Products | 1.1% | |||
| Health Care Equipment & Supplies | 1.1% | |||
| Commercial Services & Supplies | 1.1% | |||
| Textiles, Apparel & Luxury Goods | 1.0% | |||
| Specialty Retail | 1.0% | |||
| Multi-Utilities | 1.0% | |||
| Communications Equipment | 1.0% | |||
| Other1 | 19.7% | |||
| Investment Companies | 0.0% | |||
| Repurchase Agreements | 0.1% | |||
Total | 100% |
Top Five Issuers
(% of total investments)
| Fannie Mae TBA | 9.7% | |||
| Ginnie Mae II Pool | 3.2% | |||
| JPMorgan Chase & Co | 1.0% | |||
| American Tower Corp | 1.0% | |||
| Microsoft Corp | 0.9% |
Country Allocation2
(% of total investments)
| United States | 61.4% | |||
| United Kingdom | 5.3% | |||
| France | 3.3% | |||
| China | 3.1% | |||
| Japan | 3.1% | |||
| Canada | 2.7% | |||
| Germany | 2.5% | |||
| Switzerland | 1.7% | |||
| Netherlands | 1.6% | |||
| Australia | 1.5% | |||
| Other | 13.8% | |||
Total | 100% |
| 1 | See the Portfolio of Investments for the remaining industries comprising “Other” and not listed in the Portfolio Composition above. |
| 2 | Includes 12.2% (as a percentage of total investments) in emerging market countries. |
13
Report of Independent Registered
Public Accounting Firm
To the Shareholders and Board of Trustees
Nuveen Multi-Asset Income Fund:
Opinion on the Financial Statements
We have audited the accompanying statement of assets and liabilities of Nuveen Multi-Asset Income Fund (the Fund), including the portfolio of investments, as of December 31, 2021, the related statements of operations, changes in net assets, and cash flows for the period from November 22, 2021 (commencement of operations) to December 31, 2021, and the related notes (collectively, the financial statements) and the financial highlights for the period from November 22, 2021 (commencement of operations) to December 31, 2021. In our opinion, the financial statements and financial highlights present fairly, in all material respects, the financial position of the Fund as of December 31, 2021, the results of its operations, changes in net assets, and cash flows for the period from November 22, 2021 (commencement of operations) to December 31, 2021, and the financial highlights for the period from November 22, 2021 (commencement of operations) to December 31, 2021, in conformity with U.S. generally accepted accounting principles.
Basis for Opinion
These financial statements and financial highlights are the responsibility of the Fund’s management. Our responsibility is to express an opinion on these financial statements and financial highlights based on our audit. We are a public accounting firm registered with the Public Company Accounting Oversight Board (United States) (PCAOB) and are required to be independent with respect to the Fund in accordance with the U.S. federal securities laws and the applicable rules and regulations of the Securities and Exchange Commission and the PCAOB.
We conducted our audit in accordance with the standards of the PCAOB. Those standards require that we plan and perform the audit to obtain reasonable assurance about whether the financial statements and financial highlights are free of material misstatement, whether due to error or fraud. Our audit included performing procedures to assess the risks of material misstatement of the financial statements and financial highlights, whether due to error or fraud, and performing procedures that respond to those risks. Such procedures included examining, on a test basis, evidence regarding the amounts and disclosures in the financial statements and financial highlights. Such procedures also included confirmation of securities owned as of December 31, 2021, by correspondence with custodians and brokers or other appropriate auditing procedures. Our audit also included evaluating the accounting principles used and significant estimates made by management, as well as evaluating the overall presentation of the financial statements and financial highlights. We believe that our audit provides a reasonable basis for our opinion.
/s/ KPMG LLP
We have served as the auditor of one or more Nuveen investment companies since 2014.
Chicago, Illinois
February 28, 2022
14
| NMAI | Nuveen Multi-Asset Income Fund
Portfolio of Investments December 31, 2021 |
| Shares | Description (1) | Value | ||||||||||||||||||||
LONG-TERM INVESTMENTS – 143.5% (99.9% of Total Investments) | ||||||||||||||||||||||
COMMON STOCKS – 61.6% (42.9% of Total Investments) | ||||||||||||||||||||||
| Aerospace & Defense – 1.1% | ||||||||||||||||||||||
| 9,089 | Airbus SE, (2), (14) | $ | 1,162,881 | |||||||||||||||||||
| 86,883 | BAE Systems PLC | 2,587,810 | ||||||||||||||||||||
| 3,494 | Boeing Co, (14) | 703,412 | ||||||||||||||||||||
| 5,999 | General Dynamics Corp | 1,250,612 | ||||||||||||||||||||
| 3,727 | Lockheed Martin Corp | 1,324,613 | ||||||||||||||||||||
Total Aerospace & Defense | 7,029,328 | |||||||||||||||||||||
| Air Freight & Logistics – 0.4% | ||||||||||||||||||||||
| 41,448 | Deutsche Post AG, (2) | 2,665,967 | ||||||||||||||||||||
| Auto Components – 0.1% | ||||||||||||||||||||||
| 12,780 | Valeo, (2) | 385,398 | ||||||||||||||||||||
| Automobiles – 0.8% | ||||||||||||||||||||||
| 3,557,400 | Astra International Tbk PT, (2) | 1,423,857 | ||||||||||||||||||||
| 32,052 | General Motors Co, (14) | 1,879,209 | ||||||||||||||||||||
| 1,180 | Tesla Inc, (14) | 1,247,000 | ||||||||||||||||||||
| 45,200 | Toyota Motor Corp, (2), (14) | 835,413 | ||||||||||||||||||||
Total Automobiles | 5,385,479 | |||||||||||||||||||||
| Banks – 3.7% | ||||||||||||||||||||||
| 127,166 | Banco Bilbao Vizcaya Argentaria SA, (2) | 754,219 | ||||||||||||||||||||
| 90,182 | Bank Leumi Le-Israel BM, (2) | 967,293 | ||||||||||||||||||||
| 14,908 | BNP Paribas SA, (2) | 1,030,754 | ||||||||||||||||||||
| 29,625 | BOC Hong Kong Holdings Ltd | 1,941,738 | ||||||||||||||||||||
| 1,166,000 | China Construction Bank Corp, (2) | 807,975 | ||||||||||||||||||||
| 24,531 | Citigroup Inc | 1,481,427 | ||||||||||||||||||||
| 11,050 | Credicorp Ltd | 1,348,874 | ||||||||||||||||||||
| 74,493 | ING Groep NV | 1,036,943 | ||||||||||||||||||||
| 95,346 | ING Groep NV, (2) | 1,325,596 | ||||||||||||||||||||
| 32,495 | JPMorgan Chase & Co | 5,145,583 | ||||||||||||||||||||
| 144,793 | Nordea Bank Abp, (2) | 1,774,015 | ||||||||||||||||||||
| 15,900 | Sumitomo Mitsui Financial Group Inc, (2) | 542,942 | ||||||||||||||||||||
| 51,258 | Toronto-Dominion Bank | 3,930,464 | ||||||||||||||||||||
| 61,400 | Wells Fargo & Co | 2,945,972 | ||||||||||||||||||||
Total Banks | 25,033,795 | |||||||||||||||||||||
| Beverages – 1.2% | ||||||||||||||||||||||
| 19,723 | Coca-Cola Co | 1,167,799 | ||||||||||||||||||||
| 24,263 | Diageo PLC, (2) | 1,326,605 | ||||||||||||||||||||
| 31,581 | Fomento Economico Mexicano SAB de CV | 2,454,159 | ||||||||||||||||||||
| 13,975 | Keurig Dr Pepper Inc | 515,118 | ||||||||||||||||||||
| 7,888 | Monster Beverage Corp, (14) | 757,564 | ||||||||||||||||||||
| 9,124 | PepsiCo Inc | 1,584,930 | ||||||||||||||||||||
Total Beverages | 7,806,175 | |||||||||||||||||||||
| Biotechnology – 0.7% | ||||||||||||||||||||||
| 29,579 | AbbVie Inc | 4,004,997 | ||||||||||||||||||||
| 4,509 | Seagen Inc, (14) | 697,091 | ||||||||||||||||||||
Total Biotechnology | 4,702,088 | |||||||||||||||||||||
| Building Products – 0.3% | ||||||||||||||||||||||
| 8,348 | Trane Technologies PLC | 1,686,546 | ||||||||||||||||||||
| Capital Markets – 1.8% | ||||||||||||||||||||||
| 13,554 | Charles Schwab Corp | 1,139,891 | ||||||||||||||||||||
| 3,955 | CME Group Inc | 903,559 | ||||||||||||||||||||
| 44,411 | Deutsche Boerse AG | 737,667 | ||||||||||||||||||||
15
| NMAI | Nuveen Multi-Asset Income Fund (continued) | |
| Portfolio of Investments December 31, 2021 | ||
| Shares | Description (1) | Value | ||||||||||||||||||||||||||||||
| Capital Markets (continued) | ||||||||||||||||||||||||||||||||
| 3,511 | Goldman Sachs Group Inc | $ | 1,343,133 | |||||||||||||||||||||||||||||
| 40,022 | Macquarie Group Ltd | 5,976,733 | ||||||||||||||||||||||||||||||
| 22,403 | Morgan Stanley | 2,199,079 | ||||||||||||||||||||||||||||||
Total Capital Markets | 12,300,062 | |||||||||||||||||||||||||||||||
| Chemicals – 2.7% | ||||||||||||||||||||||||||||||||
| 4,562 | Air Liquide SA, (2) | 795,632 | ||||||||||||||||||||||||||||||
| 10,594 | Dow Inc | �� | 600,892 | |||||||||||||||||||||||||||||
| 19,133 | DuPont de Nemours Inc | 1,545,564 | ||||||||||||||||||||||||||||||
| 13,415 | International Flavors & Fragrances Inc | 2,020,970 | ||||||||||||||||||||||||||||||
| 100,588 | Koninklijke DSM NV | 5,694,286 | ||||||||||||||||||||||||||||||
| 12,232 | Linde PLC | 4,237,532 | ||||||||||||||||||||||||||||||
| 4,380 | Linde PLC, (2) | 1,519,893 | ||||||||||||||||||||||||||||||
| 14,852 | Nutrien Ltd | 1,116,351 | ||||||||||||||||||||||||||||||
| 7,772 | Sociedad Quimica y Minera de Chile SA | 391,942 | ||||||||||||||||||||||||||||||
Total Chemicals | 17,923,062 | |||||||||||||||||||||||||||||||
| Commercial Services & Supplies – 0.4% | ||||||||||||||||||||||||||||||||
| 7,373 | Biffa PLC, 144A | 35,777 | ||||||||||||||||||||||||||||||
| 125,037 | Cleanaway Waste Management Ltd, (2) | 284,632 | ||||||||||||||||||||||||||||||
| 5,939 | GFL Environmental Inc | 224,791 | ||||||||||||||||||||||||||||||
| 5,505 | Republic Services Inc | 767,672 | ||||||||||||||||||||||||||||||
| 11,626 | Waste Connections Inc | 1,584,275 | ||||||||||||||||||||||||||||||
Total Commercial Services & Supplies | 2,897,147 | |||||||||||||||||||||||||||||||
| Communications Equipment – 1.0% | ||||||||||||||||||||||||||||||||
| 67,316 | Cisco Systems Inc | 4,265,815 | ||||||||||||||||||||||||||||||
| 7,929 | Motorola Solutions Inc | 2,154,309 | ||||||||||||||||||||||||||||||
Total Communications Equipment | 6,420,124 | |||||||||||||||||||||||||||||||
| Construction & Engineering – 0.6% | ||||||||||||||||||||||||||||||||
| 1,943 | Eiffage SA, (2) | 200,330 | ||||||||||||||||||||||||||||||
| 38,075 | Ferrovial SA, (2) | 1,190,745 | ||||||||||||||||||||||||||||||
| 25,459 | Vinci SA, (2) | 2,688,847 | ||||||||||||||||||||||||||||||
Total Construction & Engineering | 4,079,922 | |||||||||||||||||||||||||||||||
| Construction Materials – 0.2% | ||||||||||||||||||||||||||||||||
| 13,293 | CRH PLC, (2) | 703,732 | ||||||||||||||||||||||||||||||
| 7,975 | HeidelbergCement AG, (2) | 539,724 | ||||||||||||||||||||||||||||||
Total Construction Materials | 1,243,456 | |||||||||||||||||||||||||||||||
| Consumer Finance – 0.3% | ||||||||||||||||||||||||||||||||
| 11,044 | American Express Co | 1,806,798 | ||||||||||||||||||||||||||||||
| Containers & Packaging – 0.8% | ||||||||||||||||||||||||||||||||
| 317,073 | Amcor PLC | 3,808,047 | ||||||||||||||||||||||||||||||
| 5,548 | Crown Holdings Inc | 613,720 | ||||||||||||||||||||||||||||||
| 5,741 | Packaging Corp of America | 781,637 | ||||||||||||||||||||||||||||||
Total Containers & Packaging | 5,203,404 | |||||||||||||||||||||||||||||||
| Diversified Financial Services – 0.6% | ||||||||||||||||||||||||||||||||
| 39,682 | ORIX Corp | 4,038,834 | ||||||||||||||||||||||||||||||
| Diversified Telecommunication Services – 1.1% | ||||||||||||||||||||||||||||||||
| 38,087 | AT&T Inc | 936,940 | ||||||||||||||||||||||||||||||
| 11,212 | Cellnex Telecom SA, 144A, (2) | 649,484 | ||||||||||||||||||||||||||||||
| 102,000 | HKBN Ltd, (2) | 125,176 | ||||||||||||||||||||||||||||||
| 215,999 | HKT Trust & HKT Ltd | 2,903,523 | ||||||||||||||||||||||||||||||
| 9,836 | IHS Holding Ltd, (14) | 138,688 | ||||||||||||||||||||||||||||||
| 67,079 | Infrastrutture Wireless Italiane SpA, 144A, (2) | 813,403 | ||||||||||||||||||||||||||||||
| 182,100 | NetLink NBN Trust | 135,129 | ||||||||||||||||||||||||||||||
| 4,936 | Radius Global Infrastructure Inc, (14) | 79,470 | ||||||||||||||||||||||||||||||
| 4,376,900 | Telkom Indonesia Persero Tbk PT, (2) | 1,249,177 | ||||||||||||||||||||||||||||||
Total Diversified Telecommunication Services | 7,030,990 | |||||||||||||||||||||||||||||||
16
| Shares | Description (1) | Value | ||||||||||||||||||||||||||||||
| Electric Utilities – 2.2% | ||||||||||||||||||||||||||||||||
| 31,100 | Alupar Investimento SA, (2) | $ | 134,422 | |||||||||||||||||||||||||||||
| 2,121 | American Electric Power Co Inc | 188,705 | ||||||||||||||||||||||||||||||
| 30,000 | CK Infrastructure Holdings Ltd, (2) | 191,136 | ||||||||||||||||||||||||||||||
| 7,286 | Duke Energy Corp | 764,301 | ||||||||||||||||||||||||||||||
| 75,145 | EDP – Energias de Portugal SA, (2) | 412,794 | ||||||||||||||||||||||||||||||
| 695 | Elia Group SA/NV, (2) | 91,605 | ||||||||||||||||||||||||||||||
| 212,815 | Enel SpA, (2) | 1,701,685 | ||||||||||||||||||||||||||||||
| 1,469 | Evergy Inc | 100,788 | ||||||||||||||||||||||||||||||
| 1,799 | Eversource Energy | 163,673 | ||||||||||||||||||||||||||||||
| 8,602 | FirstEnergy Corp | 357,757 | ||||||||||||||||||||||||||||||
| 75,335 | Iberdrola SA, (2) | 891,965 | ||||||||||||||||||||||||||||||
| 35,632 | NextEra Energy Inc | 3,326,604 | ||||||||||||||||||||||||||||||
| 2,199 | Orsted AS, 144A, (2) | 281,620 | ||||||||||||||||||||||||||||||
| 3,746 | Southern Co | 256,901 | ||||||||||||||||||||||||||||||
| 163,623 | SSE PLC | 3,647,157 | ||||||||||||||||||||||||||||||
| 6,882 | SSE PLC, (2) | 153,848 | ||||||||||||||||||||||||||||||
| 67,812 | Terna – Rete Elettrica Nazionale, (2) | 548,575 | ||||||||||||||||||||||||||||||
| 21,545 | Xcel Energy Inc | 1,458,597 | ||||||||||||||||||||||||||||||
Total Electric Utilities | 14,672,133 | |||||||||||||||||||||||||||||||
| Electrical Equipment – 0.3% | ||||||||||||||||||||||||||||||||
| 6,973 | Eaton Corp PLC | 1,205,074 | ||||||||||||||||||||||||||||||
| 4,611 | Schneider Electric SE, (2) | 906,501 | ||||||||||||||||||||||||||||||
Total Electrical Equipment | 2,111,575 | |||||||||||||||||||||||||||||||
| Electronic Equipment, Instruments & Components – 0.4% | ||||||||||||||||||||||||||||||||
| 224,500 | AAC Technologies Holdings Inc, (2) | 884,794 | ||||||||||||||||||||||||||||||
| 52,907 | Alps Alpine Co Ltd | 996,990 | ||||||||||||||||||||||||||||||
| 20,000 | Hitachi Ltd, (2) | 1,083,466 | ||||||||||||||||||||||||||||||
Total Electronic Equipment, Instruments & Components | 2,965,250 | |||||||||||||||||||||||||||||||
| Energy Equipment & Services – 0.0% | ||||||||||||||||||||||||||||||||
| 7,368 | Transocean Ltd, (14) | 20,336 | ||||||||||||||||||||||||||||||
| Entertainment – 1.0% | ||||||||||||||||||||||||||||||||
| 168,937 | HUYA Inc, (14) | 1,172,423 | ||||||||||||||||||||||||||||||
| 4,198 | Metro-Goldwyn-Mayer Inc, (2), (14) | 538,742 | ||||||||||||||||||||||||||||||
| 30,000 | NetEase Inc, (2) | 606,559 | ||||||||||||||||||||||||||||||
| 5,515 | Nintendo Co Ltd, (2) | 2,580,232 | ||||||||||||||||||||||||||||||
| 22,121 | Universal Music Group NV | 624,078 | ||||||||||||||||||||||||||||||
| 7,367 | Walt Disney Co, (14) | 1,141,074 | ||||||||||||||||||||||||||||||
Total Entertainment | 6,663,108 | |||||||||||||||||||||||||||||||
| Food & Staples Retailing – 0.8% | ||||||||||||||||||||||||||||||||
| 2,678 | Costco Wholesale Corp | 1,520,301 | ||||||||||||||||||||||||||||||
| 194,340 | Tesco PLC, (2) | 765,131 | ||||||||||||||||||||||||||||||
| 330,600 | Wal-Mart de Mexico SAB de CV | 1,230,658 | ||||||||||||||||||||||||||||||
| 14,866 | Walmart Inc | 2,150,961 | ||||||||||||||||||||||||||||||
Total Food & Staples Retailing | 5,667,051 | |||||||||||||||||||||||||||||||
| Food Products – 0.8% | ||||||||||||||||||||||||||||||||
| 16,881 | Mondelez International Inc | 1,119,379 | ||||||||||||||||||||||||||||||
| 23,157 | Nestle SA | 3,250,548 | ||||||||||||||||||||||||||||||
| 374,000 | Tingyi Cayman Islands Holding Corp, (2) | 769,165 | ||||||||||||||||||||||||||||||
Total Food Products | 5,139,092 | |||||||||||||||||||||||||||||||
| Gas Utilities – 0.6% | ||||||||||||||||||||||||||||||||
| 4,519 | AltaGas Ltd | 97,564 | ||||||||||||||||||||||||||||||
| 33,014 | APA Group, (2) | 241,523 | ||||||||||||||||||||||||||||||
| 14,000 | China Resources Gas Group Ltd | 79,089 | ||||||||||||||||||||||||||||||
| 119,000 | Hong Kong & China Gas Co Ltd, (2) | 185,612 | ||||||||||||||||||||||||||||||
| 21,915 | Italgas SpA, (2) | 150,641 | ||||||||||||||||||||||||||||||
17
| NMAI | Nuveen Multi-Asset Income Fund (continued) | |
| Portfolio of Investments December 31, 2021 | ||
| Shares | Description (1) | Value | ||||||||||||||||||||||||||||
| Gas Utilities (continued) | ||||||||||||||||||||||||||||||
| 4,474 | Snam SpA, (2) | $ | 26,948 | |||||||||||||||||||||||||||
| 275,516 | Snam SpA | 3,308,947 | ||||||||||||||||||||||||||||
Total Gas Utilities | 4,090,324 | |||||||||||||||||||||||||||||
| Health Care Equipment & Supplies – 1.1% | ||||||||||||||||||||||||||||||
| 14,855 | Abbott Laboratories | 2,090,693 | ||||||||||||||||||||||||||||
| 17,261 | Baxter International Inc | 1,481,684 | ||||||||||||||||||||||||||||
| 17,422 | Boston Scientific Corp, (14) | 740,086 | ||||||||||||||||||||||||||||
| 380,600 | Hartalega Holdings Bhd | 523,485 | ||||||||||||||||||||||||||||
| 25,657 | Medtronic PLC | 2,654,217 | ||||||||||||||||||||||||||||
Total Health Care Equipment & Supplies | 7,490,165 | |||||||||||||||||||||||||||||
| Health Care Providers & Services – 1.2% | ||||||||||||||||||||||||||||||
| 7,209 | Anthem Inc | 3,341,660 | ||||||||||||||||||||||||||||
| 11,706 | Fresenius Medical Care AG & Co KGaA, (2) | 758,879 | ||||||||||||||||||||||||||||
| 12,280 | Millennium Health LLC, (3), (14) | 6,422 | ||||||||||||||||||||||||||||
| 11,534 | Millennium Health LLC, (3), (14) | 4,879 | ||||||||||||||||||||||||||||
| 7,389 | UnitedHealth Group Inc | 3,710,313 | ||||||||||||||||||||||||||||
Total Health Care Providers & Services | 7,822,153 | |||||||||||||||||||||||||||||
| Hotels, Restaurants & Leisure – 2.1% | ||||||||||||||||||||||||||||||
| 83,128 | 24 Hour Fitness Worldwide Inc, (2), (14) | 155,865 | ||||||||||||||||||||||||||||
| 174,789 | 24 Hour Fitness Worldwide Inc, (2), (14) | 174,789 | ||||||||||||||||||||||||||||
| 587,639 | Arcos Dorados Holdings Inc, (14) | 3,425,935 | ||||||||||||||||||||||||||||
| 5,155 | Darden Restaurants Inc | 776,549 | ||||||||||||||||||||||||||||
| 9,728 | McDonald’s Corp | 2,607,785 | ||||||||||||||||||||||||||||
| 180,789 | Melco Resorts & Entertainment Ltd, (14) | 1,840,432 | ||||||||||||||||||||||||||||
| 41,344 | Restaurant Brands International Inc | 2,508,754 | ||||||||||||||||||||||||||||
| 667,600 | Sands China Ltd, (2), (14) | 1,549,364 | ||||||||||||||||||||||||||||
| 1,444,800 | Wynn Macau Ltd, (2), (14) | 1,173,248 | ||||||||||||||||||||||||||||
Total Hotels, Restaurants & Leisure | 14,212,721 | |||||||||||||||||||||||||||||
| Household Durables – 0.4% | ||||||||||||||||||||||||||||||
| 14,176 | PulteGroup Inc | 810,300 | ||||||||||||||||||||||||||||
| 15,200 | Sony Group Corp, (2) | 1,919,428 | ||||||||||||||||||||||||||||
Total Household Durables | 2,729,728 | |||||||||||||||||||||||||||||
| Household Products – 0.6% | ||||||||||||||||||||||||||||||
| 8,255 | Procter & Gamble Co | 1,350,353 | ||||||||||||||||||||||||||||
| 154,626 | Reckitt Benckiser Group PLC | 2,705,955 | ||||||||||||||||||||||||||||
Total Household Products | 4,056,308 | |||||||||||||||||||||||||||||
| Independent Power & Renewable Electricity Producers – 0.1% | ||||||||||||||||||||||||||||||
| 11,660 | Brookfield Renewable Corp | 429,438 | ||||||||||||||||||||||||||||
| 4,643 | Clearway Energy Inc | 167,287 | ||||||||||||||||||||||||||||
| 4,187 | NextEra Energy Partners LP | 353,383 | ||||||||||||||||||||||||||||
Total Independent Power & Renewable Electricity Producers | 950,108 | |||||||||||||||||||||||||||||
| Industrial Conglomerates – 1.0% | ||||||||||||||||||||||||||||||
| 10,263 | Honeywell International Inc | 2,139,938 | ||||||||||||||||||||||||||||
| 27,566 | Siemens AG, (2) | 4,774,508 | ||||||||||||||||||||||||||||
Total Industrial Conglomerates | 6,914,446 | |||||||||||||||||||||||||||||
| Insurance – 1.2% | ||||||||||||||||||||||||||||||
| 16,742 | Ageas SA/NV, (2) | 867,022 | ||||||||||||||||||||||||||||
| 55,639 | AIA Group Ltd | 2,243,615 | ||||||||||||||||||||||||||||
| 3,353 | Allianz SE, (2) | 790,834 | ||||||||||||||||||||||||||||
| 7,548 | Chubb Ltd | 1,459,104 | ||||||||||||||||||||||||||||
| 3,467 | Everest Re Group Ltd | 949,680 | ||||||||||||||||||||||||||||
| 10,184 | Marsh & McLennan Cos Inc | 1,770,183 | ||||||||||||||||||||||||||||
Total Insurance | 8,080,438 | |||||||||||||||||||||||||||||
18
| Shares | Description (1) | Value | ||||||||||||||||||||||||||||
| Interactive Media & Services – 1.8% | ||||||||||||||||||||||||||||||
| 623 | Alphabet Inc, (14) | $ | 1,804,856 | |||||||||||||||||||||||||||
| 30,222 | Baidu Inc, (14) | 4,496,731 | ||||||||||||||||||||||||||||
| 1,890 | Meta Platforms Inc, (14) | 635,702 | ||||||||||||||||||||||||||||
| 75,000 | Tencent Holdings Ltd, (2) | 4,376,333 | ||||||||||||||||||||||||||||
| 16,405 | Yandex NV, (14) | 992,502 | ||||||||||||||||||||||||||||
Total Interactive Media & Services | 12,306,124 | |||||||||||||||||||||||||||||
| Internet & Direct Marketing Retail – 1.7% | ||||||||||||||||||||||||||||||
| 251,100 | Alibaba Group Holding Ltd, (2), (14) | 3,690,060 | ||||||||||||||||||||||||||||
| 568 | Amazon.com Inc, (14) | 1,893,905 | ||||||||||||||||||||||||||||
| 40,996 | Baozun Inc, (14) | 569,844 | ||||||||||||||||||||||||||||
| 50,850 | JD Health International Inc, 144A, (2), (14) | 401,127 | ||||||||||||||||||||||||||||
| 33,928 | JD.com Inc, (2), (14) | 1,168,899 | ||||||||||||||||||||||||||||
| 4,337 | Naspers Ltd, (2) | 673,150 | ||||||||||||||||||||||||||||
| 7,493 | Pinduoduo Inc, (14) | 436,842 | ||||||||||||||||||||||||||||
| 19,467 | Prosus NV, (2) | 1,612,354 | ||||||||||||||||||||||||||||
| 131,361 | Vipshop Holdings Ltd, (14) | 1,103,433 | ||||||||||||||||||||||||||||
Total Internet & Direct Marketing Retail | 11,549,614 | |||||||||||||||||||||||||||||
| IT Services – 1.5% | ||||||||||||||||||||||||||||||
| 7,554 | Accenture PLC | 3,131,511 | ||||||||||||||||||||||||||||
| 3,887 | Capgemini SE, (2) | 952,628 | ||||||||||||||||||||||||||||
| 10,028 | Fidelity National Information Services Inc | 1,094,556 | ||||||||||||||||||||||||||||
| 22,653 | GDS Holdings Ltd, (14) | 1,068,315 | ||||||||||||||||||||||||||||
| 51,913 | NEXTDC Ltd, (2), (14) | 482,045 | ||||||||||||||||||||||||||||
| 6,823 | PayPal Holdings Inc, (14) | 1,286,681 | ||||||||||||||||||||||||||||
| 57,315 | StoneCo Ltd, (14) | 966,331 | ||||||||||||||||||||||||||||
| 4,756 | Visa Inc | 1,030,673 | ||||||||||||||||||||||||||||
Total IT Services | 10,012,740 | |||||||||||||||||||||||||||||
| Life Sciences Tools & Services – 0.2% | ||||||||||||||||||||||||||||||
| 1,520 | Lonza Group AG, (2) | 1,265,534 | ||||||||||||||||||||||||||||
| Machinery – 0.1% | ||||||||||||||||||||||||||||||
| 4,062 | Caterpillar Inc | 839,778 | ||||||||||||||||||||||||||||
| 1,845 | Evoqua Water Technologies Corp, (14) | 86,254 | ||||||||||||||||||||||||||||
Total Machinery | 926,032 | |||||||||||||||||||||||||||||
| Media – 0.9% | ||||||||||||||||||||||||||||||
| 57,513 | Comcast Corp | 2,894,629 | ||||||||||||||||||||||||||||
| 267,500 | Converge Information and Communications Technology Solutions Inc, (2), (14) |
| 167,302 | |||||||||||||||||||||||||||
| 2 | Cumulus Media Inc, (14) | 22 | ||||||||||||||||||||||||||||
| 145,216 | Grupo Televisa SAB | 1,360,674 | ||||||||||||||||||||||||||||
| 48,800 | Hakuhodo DY Holdings Inc, (2) | 812,030 | ||||||||||||||||||||||||||||
| 655,185 | Hibu plc, (2), (14) | 3,276 | ||||||||||||||||||||||||||||
| 159,316 | iClick Interactive Asia Group Ltd, (14) | 734,447 | ||||||||||||||||||||||||||||
| 6,370 | Tribune Co, (2), (14) | 64 | ||||||||||||||||||||||||||||
Total Media | 5,972,444 | |||||||||||||||||||||||||||||
| Metals & Mining – 0.7% | ||||||||||||||||||||||||||||||
| 87,158 | AngloGold Ashanti Ltd | 1,828,575 | ||||||||||||||||||||||||||||
| 30,774 | BHP Group PLC, (2) | 915,671 | ||||||||||||||||||||||||||||
| 43,360 | Freeport-McMoRan Inc | 1,809,413 | ||||||||||||||||||||||||||||
Total Metals & Mining | 4,553,659 | |||||||||||||||||||||||||||||
| Multiline Retail – 0.2% | ||||||||||||||||||||||||||||||
| 1 | Belk Inc, (2), (14) | 19 | ||||||||||||||||||||||||||||
| 5,888 | Target Corp | 1,362,719 | ||||||||||||||||||||||||||||
Total Multiline Retail | 1,362,738 | |||||||||||||||||||||||||||||
19
| NMAI | Nuveen Multi-Asset Income Fund (continued) | |
| Portfolio of Investments December 31, 2021 | ||
| Shares | Description (1) | Value | ||||||||||||||||||||||||||||
| Multi-Utilities – 1.3% | ||||||||||||||||||||||||||||||
| 5,301 | ACEA SpA, (2) | $ | 113,261 | |||||||||||||||||||||||||||
| 6,002 | Ameren Corp | 534,238 | ||||||||||||||||||||||||||||
| 1,022 | Brookfield Infrastructure Corp | 69,762 | ||||||||||||||||||||||||||||
| 14,777 | CenterPoint Energy Inc | 412,426 | ||||||||||||||||||||||||||||
| 18,170 | Dominion Energy Inc | 1,427,435 | ||||||||||||||||||||||||||||
| 4,887 | DTE Energy Co | 584,192 | ||||||||||||||||||||||||||||
| 42,836 | Engie SA, (2) | 634,203 | ||||||||||||||||||||||||||||
| 80,105 | National Grid PLC, (2) | 1,155,057 | ||||||||||||||||||||||||||||
| 36,343 | RWE AG, (2) | 1,472,492 | ||||||||||||||||||||||||||||
| 153,700 | Sembcorp Industries Ltd, (2) | 228,164 | ||||||||||||||||||||||||||||
| 4,549 | Sempra Energy | 601,742 | ||||||||||||||||||||||||||||
| 8,126 | Veolia Environnement SA, (2) | 298,418 | ||||||||||||||||||||||||||||
| 9,967 | WEC Energy Group Inc | 967,497 | ||||||||||||||||||||||||||||
Total Multi-Utilities | 8,498,887 | |||||||||||||||||||||||||||||
| Oil, Gas & Consumable Fuels – 3.4% | ||||||||||||||||||||||||||||||
| 14,613 | Cheniere Energy Inc | 1,482,050 | ||||||||||||||||||||||||||||
| 24,817 | Chevron Corp | 2,912,275 | ||||||||||||||||||||||||||||
| 6,260 | Diamondback Energy Inc | 675,141 | ||||||||||||||||||||||||||||
| 5,676 | DT Midstream Inc | 272,334 | ||||||||||||||||||||||||||||
| 91,860 | Enbridge Inc | 3,589,889 | ||||||||||||||||||||||||||||
| 62,903 | Enterprise Products Partners LP | 1,381,350 | ||||||||||||||||||||||||||||
| 35,407 | Equinor ASA, (2) | 937,552 | ||||||||||||||||||||||||||||
| 23,963 | Exxon Mobil Corp | 1,466,296 | ||||||||||||||||||||||||||||
| 7,238 | Fieldwood Energy LLC, (2), (14) | 680,372 | ||||||||||||||||||||||||||||
| 2,768 | Gibson Energy Inc | 49,060 | ||||||||||||||||||||||||||||
| 10,095 | Keyera Corp | 227,685 | ||||||||||||||||||||||||||||
| 48,829 | Kinder Morgan Inc | 774,428 | ||||||||||||||||||||||||||||
| 2,472 | ONEOK Inc | 145,255 | ||||||||||||||||||||||||||||
| 9,635 | Pembina Pipeline Corp | 292,261 | ||||||||||||||||||||||||||||
| 10,156 | Phillips 66 | 735,904 | ||||||||||||||||||||||||||||
| 9,578 | Plains GP Holdings LP, Class A | 97,121 | ||||||||||||||||||||||||||||
| 6,709 | Targa Resources Corp | 350,478 | ||||||||||||||||||||||||||||
| 37,463 | TC Energy Corp | 1,742,320 | ||||||||||||||||||||||||||||
| 57,611 | TotalEnergies SE | 2,849,440 | ||||||||||||||||||||||||||||
| 536,200 | United Tractors Tbk PT, (2) | 832,492 | ||||||||||||||||||||||||||||
| 54,242 | Williams Cos Inc | 1,412,462 | ||||||||||||||||||||||||||||
Total Oil, Gas & Consumable Fuels | 22,906,165 | |||||||||||||||||||||||||||||
| Personal Products – 0.4% | ||||||||||||||||||||||||||||||
| 13,000 | Kao Corp, (2) | 680,866 | ||||||||||||||||||||||||||||
| 42,349 | Unilever PLC | 2,277,953 | ||||||||||||||||||||||||||||
Total Personal Products | 2,958,819 | |||||||||||||||||||||||||||||
| Pharmaceuticals – 3.4% | ||||||||||||||||||||||||||||||
| 250,747 | Astellas Pharma Inc | 4,079,654 | ||||||||||||||||||||||||||||
| 19,787 | AstraZeneca PLC | 1,152,593 | ||||||||||||||||||||||||||||
| 11,989 | AstraZeneca PLC, (2) | 1,399,948 | ||||||||||||||||||||||||||||
| 21,700 | Daiichi Sankyo Co Ltd, (2) | 552,296 | ||||||||||||||||||||||||||||
| 19,875 | GlaxoSmithKline PLC | 876,487 | ||||||||||||||||||||||||||||
| 37,376 | Hikma Pharmaceuticals PLC | 2,246,683 | ||||||||||||||||||||||||||||
| 14,838 | Merck & Co Inc | 1,137,184 | ||||||||||||||||||||||||||||
| 55,443 | Novo Nordisk A/S | 6,209,616 | ||||||||||||||||||||||||||||
| 3,078 | Roche Holding AG, (2) | 1,276,942 | ||||||||||||||||||||||||||||
| 77,243 | Sanofi | 3,869,874 | ||||||||||||||||||||||||||||
Total Pharmaceuticals | 22,801,277 | |||||||||||||||||||||||||||||
| Professional Services – 0.6% | ||||||||||||||||||||||||||||||
| 66,105 | Experian PLC | 3,259,638 | ||||||||||||||||||||||||||||
| 13,600 | Recruit Holdings Co Ltd, (2) | 827,637 | ||||||||||||||||||||||||||||
Total Professional Services | 4,087,275 | |||||||||||||||||||||||||||||
| Real Estate Management & Development – 0.1% | ||||||||||||||||||||||||||||||
| 51,085 | Tricon Residential Inc | 780,579 | ||||||||||||||||||||||||||||
20
| Shares | Description (1) | Value | ||||||||||||||||||||||||||||
| Road & Rail – 1.1% | ||||||||||||||||||||||||||||||
| 4,995 | Canadian National Railway Co | $ | 613,686 | |||||||||||||||||||||||||||
| 2,853 | Canadian Pacific Railway Ltd | 205,245 | ||||||||||||||||||||||||||||
| 11,660 | Canadian Pacific Railway Ltd | 838,631 | ||||||||||||||||||||||||||||
| 31,555 | CSX Corp | 1,186,468 | ||||||||||||||||||||||||||||
| 6,700 | East Japan Railway Co, (2) | 411,886 | ||||||||||||||||||||||||||||
| 1,491 | Norfolk Southern Corp | 443,886 | ||||||||||||||||||||||||||||
| 14,174 | Union Pacific Corp | 3,570,856 | ||||||||||||||||||||||||||||
| 4,500 | West Japan Railway Co, (2) | 188,203 | ||||||||||||||||||||||||||||
Total Road & Rail | 7,458,861 | |||||||||||||||||||||||||||||
| Semiconductors & Semiconductor Equipment – 1.8% | ||||||||||||||||||||||||||||||
| 2,891 | ASML Holding NV, (2) | 2,315,748 | ||||||||||||||||||||||||||||
| 4,867 | Broadcom Inc | 3,238,550 | ||||||||||||||||||||||||||||
| 11,196 | Daqo New Energy Corp, (14) | 451,423 | ||||||||||||||||||||||||||||
| 18,276 | Infineon Technologies AG, (2) | 841,399 | ||||||||||||||||||||||||||||
| 39,011 | Intel Corp | 2,009,067 | ||||||||||||||||||||||||||||
| 12,936 | Taiwan Semiconductor Manufacturing Co Ltd | 1,556,330 | ||||||||||||||||||||||||||||
| 9,122 | Texas Instruments Inc | 1,719,223 | ||||||||||||||||||||||||||||
Total Semiconductors & Semiconductor Equipment |
| 12,131,740 | ||||||||||||||||||||||||||||
| Software – 2.6% | ||||||||||||||||||||||||||||||
| 17,731 | Dassault Systemes SE, (2) | 1,052,252 | ||||||||||||||||||||||||||||
| 25,215 | Microsoft Corp | 8,480,309 | ||||||||||||||||||||||||||||
| 14,108 | Oracle Corp | 1,230,359 | ||||||||||||||||||||||||||||
| 5,063 | salesforce.com Inc, (14) | 1,286,660 | ||||||||||||||||||||||||||||
| 27,740 | SAP SE | 3,886,651 | ||||||||||||||||||||||||||||
| 1,799 | ServiceNow Inc, (14) | 1,167,749 | ||||||||||||||||||||||||||||
Total Software | 17,103,980 | |||||||||||||||||||||||||||||
| Specialty Retail – 1.1% | ||||||||||||||||||||||||||||||
| 4,012 | Home Depot Inc | 1,665,020 | ||||||||||||||||||||||||||||
| 21,953 | Industria de Diseno Textil SA, (2) | 707,985 | ||||||||||||||||||||||||||||
| 11,900 | Lowe’s Cos Inc | 3,075,912 | ||||||||||||||||||||||||||||
| 19,713 | TJX Cos Inc | 1,496,611 | ||||||||||||||||||||||||||||
| 492,000 | Topsports International Holdings Ltd, 144A, (2) | 498,315 | ||||||||||||||||||||||||||||
Total Specialty Retail | 7,443,843 | |||||||||||||||||||||||||||||
| Technology Hardware, Storage & Peripherals – 1.1% | ||||||||||||||||||||||||||||||
| 34,062 | Apple Inc | 6,048,389 | ||||||||||||||||||||||||||||
| 1,136,000 | Lenovo Group Ltd, (2) | 1,305,589 | ||||||||||||||||||||||||||||
Total Technology Hardware, Storage & Peripherals |
| 7,353,978 | ||||||||||||||||||||||||||||
| Textiles, Apparel & Luxury Goods – 1.5% | ||||||||||||||||||||||||||||||
| 21,781 | adidas AG | 3,136,464 | ||||||||||||||||||||||||||||
| 1,509 | Kering SA, (2) | 1,210,748 | ||||||||||||||||||||||||||||
| 25,253 | LVMH Moet Hennessy Louis Vuitton SE | 4,179,372 | ||||||||||||||||||||||||||||
| 8,644 | NIKE Inc | 1,440,695 | ||||||||||||||||||||||||||||
Total Textiles, Apparel & Luxury Goods | 9,967,279 | |||||||||||||||||||||||||||||
| Tobacco – 0.3% | ||||||||||||||||||||||||||||||
| 22,032 | Philip Morris International Inc | 2,093,040 | ||||||||||||||||||||||||||||
| Trading Companies & Distributors – 0.9% | ||||||||||||||||||||||||||||||
| 71,705 | ITOCHU Corp | 4,381,197 | ||||||||||||||||||||||||||||
| 33,500 | Mitsui & Co Ltd, (2) | 793,879 | ||||||||||||||||||||||||||||
| 1,794 | United Rentals Inc, (14) | 596,128 | ||||||||||||||||||||||||||||
Total Trading Companies & Distributors | 5,771,204 | |||||||||||||||||||||||||||||
21
| NMAI | Nuveen Multi-Asset Income Fund (continued) | |
| Portfolio of Investments December 31, 2021 | ||
| Shares | Description (1) | Value | ||||||||||||||||||||||||||||
| Transportation Infrastructure – 2.2% | ||||||||||||||||||||||||||||||
| 12,964 | Aena SME SA, 144A, (2), (14) | $ | 2,041,622 | |||||||||||||||||||||||||||
| 65,106 | Atlantia SpA, (2), (14) | 1,291,818 | ||||||||||||||||||||||||||||
| 205,725 | Atlas Arteria Ltd, (2) | 1,035,300 | ||||||||||||||||||||||||||||
| 170,426 | Auckland International Airport Ltd, (2), (14) | 897,094 | ||||||||||||||||||||||||||||
| 122,000 | China Merchants Port Holdings Co Ltd, (2) | 222,659 | ||||||||||||||||||||||||||||
| 104,000 | COSCO SHIPPING Ports Ltd, (2) | 90,389 | ||||||||||||||||||||||||||||
| 32,801 | Enav SpA, 144A, (2), (14) | 146,825 | ||||||||||||||||||||||||||||
| 2,422 | Flughafen Wien AG, (2), (14) | 73,313 | ||||||||||||||||||||||||||||
| 3,709 | Flughafen Zurich AG, (2), (14) | 666,076 | ||||||||||||||||||||||||||||
| 6,205 | Fraport AG Frankfurt Airport Services Worldwide, (2), (14) |
| 415,465 | |||||||||||||||||||||||||||
| 64,166 | Getlink SE, (2) | 1,062,735 | ||||||||||||||||||||||||||||
| 11,273 | Grupo Aeroportuario del Centro Norte SAB de CV, ADR |
| 605,247 | |||||||||||||||||||||||||||
| 5,394 | Grupo Aeroportuario del Pacifico SAB de CV ADR |
| 741,513 | |||||||||||||||||||||||||||
| 1,624 | Grupo Aeroportuario del Sureste SAB de CV ADR |
| 334,804 | |||||||||||||||||||||||||||
| 2,570 | International Container Terminal Services Inc | 10,080 | ||||||||||||||||||||||||||||
| 11,500 | Japan Airport Terminal Co Ltd, (2), (14) | 479,633 | ||||||||||||||||||||||||||||
| 25,900 | Kamigumi Co Ltd, (2) | 490,436 | ||||||||||||||||||||||||||||
| 44,439 | Port of Tauranga Ltd, (2) | 202,818 | ||||||||||||||||||||||||||||
| 38,640 | Promotora y Operadora de Infraestructura SAB de CV |
| 301,488 | |||||||||||||||||||||||||||
| 103,181 | Qube Holdings Ltd, (2) | 238,182 | ||||||||||||||||||||||||||||
| 50,868 | Sydney Airport, (2), (14) | 321,154 | ||||||||||||||||||||||||||||
| 275,129 | Transurban Group, (2) | 2,763,477 | ||||||||||||||||||||||||||||
Total Transportation Infrastructure | 14,432,128 | |||||||||||||||||||||||||||||
| Water Utilities – 0.2% | ||||||||||||||||||||||||||||||
| 2,307 | American Water Works Co Inc | 435,700 | ||||||||||||||||||||||||||||
| 60,000 | Guangdong Investment Ltd, (2) | 76,270 | ||||||||||||||||||||||||||||
| 21,273 | Pennon Group PLC, (2) | 336,798 | ||||||||||||||||||||||||||||
| 10,272 | Severn Trent PLC, (2) | 410,181 | ||||||||||||||||||||||||||||
| 15,299 | United Utilities Group PLC, (2) | 225,743 | ||||||||||||||||||||||||||||
Total Water Utilities | 1,484,692 | |||||||||||||||||||||||||||||
| Wireless Telecommunication Services – 0.9% | ||||||||||||||||||||||||||||||
| 248,210 | KDDI Corp | 3,636,276 | ||||||||||||||||||||||||||||
| 153,189 | Vodafone Group PLC | 2,287,112 | ||||||||||||||||||||||||||||
Total Wireless Telecommunication Services | 5,923,388 | |||||||||||||||||||||||||||||
Total Common Stocks (cost $319,432,706) | 412,369,531 | |||||||||||||||||||||||||||||
Principal Amount (000) | Description (1) | Coupon | Maturity | Ratings (4) | Value | |||||||||||||||||||||||||
ASSET-BACKED AND MORTGAGE-BACKED SECURITIES – 18.5% ( 12.9% of Total Investments) |
| |||||||||||||||||||||||||||||
| $ | 2,000 | Fannie Mae TBA, (MDR), (WI/DD) | 1.500% | TBA | AAA | $ | 2,001,836 | |||||||||||||||||||||||
| 7,000 | Fannie Mae TBA, (MDR), (WI/DD) | 2.000% | TBA | AAA | 7,155,451 | |||||||||||||||||||||||||
| 3,000 | Fannie Mae TBA, (MDR), (WI/DD) | 2.500% | TBA | AAA | 3,098,504 | |||||||||||||||||||||||||
| 26,000 | Fannie Mae TBA, (MDR), (WI/DD) | 3.000% | TBA | AAA | 26,895,436 | |||||||||||||||||||||||||
| 25,000 | Fannie Mae TBA, (MDR), (WI/DD) | 2.000% | TBA | AAA | 24,867,308 | |||||||||||||||||||||||||
| 29,000 | Fannie Mae TBA, (MDR), (WI/DD) | 2.500% | TBA | AAA | 29,513,304 | |||||||||||||||||||||||||
| 7,000 | Ginnie Mae II Pool, (MDR), (WI/DD) | 2.000% | TBA | AAA | 7,050,346 | |||||||||||||||||||||||||
| 14,000 | Ginnie Mae II Pool, (MDR), (WI/DD) | 2.500% | TBA | AAA | 14,305,688 | |||||||||||||||||||||||||
| 9,000 | Ginnie Mae II Pool, (MDR), (WI/DD) | 3.000% | TBA | AAA | 9,295,351 | |||||||||||||||||||||||||
| $ | 122,000 | Asset-Backed and Mortgage-Backed Securities (cost $124,327,883) |
| 124,183,224 | ||||||||||||||||||||||||||
Principal Amount (000) | Description (1) | Coupon (5) | Reference Rate (5) | Spread (5) | Maturity (6) | Ratings (4) | Value | |||||||||||||||||||||||
VARIABLE RATE SENIOR LOAN INTERESTS – 16.5% (11.5% of Total Investments) |
| |||||||||||||||||||||||||||||
| Aerospace & Defense – 0.1% | ||||||||||||||||||||||||||||||
| $ | 154 | Dynasty Acquisition Co., Inc., Term Loan B2 | 3.724% | 3-Month LIBOR | 3.500% | 4/08/26 | B– | $ | 150,552 | |||||||||||||||||||||
| 83 | Dynasty Acquisition Co., Inc., Term Loan B2 | 3.724% | 3-Month LIBOR | 3.500% | 4/08/26 | B– | 80,942 | |||||||||||||||||||||||
| 750 | Maxar Technologies Ltd., Term Loan B, (DD1) | 2.860% | 1-Month LIBOR | 2.750% | 10/05/24 | B | 745,312 | |||||||||||||||||||||||
| 987 | Total Aerospace & Defense | 976,806 | ||||||||||||||||||||||||||||
22
Principal Amount (000) | Description (1) | Coupon (5) | Reference Rate (5) | Spread (5) | Maturity (6) | Ratings (4) | Value | |||||||||||||||||||||||
| Airlines – 0.3% | ||||||||||||||||||||||||||||||
| $ | 162 | AAdvantage Loyalty IP Ltd., Term Loan | 5.500% | 3-Month LIBOR | 4.750% | 4/20/28 | Ba2 | $ | 168,547 | |||||||||||||||||||||
| 450 | Air Canada, Term Loan B | 4.250% | 3-Month LIBOR | 3.500% | 8/11/28 | BB | 450,241 | |||||||||||||||||||||||
| 136 | American Airlines, Inc., Term Loan, First Lien | 2.110% | 3-Month LIBOR | 2.000% | 12/14/23 | B | 133,196 | |||||||||||||||||||||||
| 443 | Kestrel Bidco Inc., Term Loan B, (DD1) | 4.000% | 6-Month LIBOR | 3.000% | 12/11/26 | B | 431,401 | |||||||||||||||||||||||
| 250 | SkyMiles IP Ltd., Term Loan B, (WI/DD) | TBD | TBD | TBD | TBD | Baa1 | 265,000 | |||||||||||||||||||||||
| 496 | United Airlines, Inc., Term Loan B | 4.500% | 3-Month LIBOR | 3.750% | 4/21/28 | BB | 499,153 | |||||||||||||||||||||||
| 1,937 | Total Airlines | 1,947,538 | ||||||||||||||||||||||||||||
| Auto Components – 0.2% | ||||||||||||||||||||||||||||||
| 371 | Adient US LLC, Term Loan B | 3.604% | 1-Month LIBOR | 3.500% | 4/08/28 | BB– | 371,792 | |||||||||||||||||||||||
| 380 | Clarios Global LP, Term Loan B | 3.354% | 1-Month LIBOR | 3.250% | 4/30/26 | B+ | 378,870 | |||||||||||||||||||||||
| 114 | DexKo Global Inc., Term Loan | 4.250% | 3-Month LIBOR | 3.750% | 10/04/28 | B+ | 113,179 | |||||||||||||||||||||||
| 22 | DexKo Global Inc., Term Loan, (13) | 4.250% | 3-Month LIBOR | 3.750% | 10/04/28 | B+ | 21,558 | |||||||||||||||||||||||
| 375 | Driven Holdings, LLC, Term Loan B, (WI/DD) | TBD | TBD | TBD | TBD | B2 | 375,469 | |||||||||||||||||||||||
| 245 | Les Schwab Tire Centers, Term Loan B | 4.000% | 3-Month LIBOR | 3.250% | 11/02/27 | B | 245,203 | |||||||||||||||||||||||
| 1,507 | Total Auto Components | 1,506,071 | ||||||||||||||||||||||||||||
| Beverages – 0.1% | ||||||||||||||||||||||||||||||
| 583 | Triton Water Holdings, Inc, Term Loan, (DD1) | 4.000% | 3-Month LIBOR | 3.500% | 3/31/28 | B+ | 577,264 | |||||||||||||||||||||||
| Building Products – 0.2% | ||||||||||||||||||||||||||||||
| 310 | Advanced Drainage Systems Inc, Term Loan B | 2.375% | 3-Month LIBOR | 2.250% | 9/24/26 | BBB– | 311,002 | |||||||||||||||||||||||
| 200 | Anticimex International AB, Term Loan B1 | 4.000% | 3-Month LIBOR | 3.500% | 11/16/28 | B | 199,812 | |||||||||||||||||||||||
| 655 | Chamberlain Group Inc, Term Loan B, (DD1) | 4.000% | 1-Month LIBOR | 3.500% | 10/22/28 | B | 655,207 | |||||||||||||||||||||||
| 111 | Cornerstone Building Brands, Inc., Term Loan B | 3.750% | 1-Month LIBOR | 3.250% | 4/12/28 | B+ | 110,353 | |||||||||||||||||||||||
| 168 | Quikrete Holdings, Inc., Term Loan, First Lien | 2.604% | 1-Month LIBOR | 2.500% | 1/31/27 | BB– | 166,669 | |||||||||||||||||||||||
| 1,444 | Total Building Products | 1,443,043 | ||||||||||||||||||||||||||||
| Capital Markets – 0.1% | ||||||||||||||||||||||||||||||
| 650 | Astra Acquisition Corp., Term Loan, First Lien, (WI/DD) | TBD | TBD | TBD | TBD | B | 639,711 | |||||||||||||||||||||||
| 154 | RPI Intermediate Finance Trust, Term Loan B1 | 1.854% | 1-Month LIBOR | 1.750% | 2/11/27 | BBB– | 153,570 | |||||||||||||||||||||||
| 804 | Total Capital Markets | 793,281 | ||||||||||||||||||||||||||||
| Chemicals – 0.4% | ||||||||||||||||||||||||||||||
| 1,196 | Atotech B.V., Term Loan B | 3.000% | 3-Month LIBOR | 2.500% | 3/18/28 | B+ | 1,194,766 | |||||||||||||||||||||||
| 55 | Atotech B.V., Term Loan B | 3.000% | 1-Month LIBOR | 2.500% | 3/18/28 | B+ | 55,569 | |||||||||||||||||||||||
| 515 | Diamond (BC) B.V., Term Loan B, (DD1) | 3.500% | 3-Month LIBOR | 3.000% | 9/29/28 | BB– | 514,073 | |||||||||||||||||||||||
| 100 | INEOS Styrolution US Holding LLC, Term Loan B | 3.250% | 1-Month LIBOR | 2.750% | 1/29/26 | BB | 99,334 | |||||||||||||||||||||||
| 500 | W.R. Grace & Co. – Conn., Term Loan B, (WI/DD) | TBD | TBD | TBD | TBD | B+ | 501,500 | |||||||||||||||||||||||
| 2,366 | Total Chemicals | 2,365,242 | ||||||||||||||||||||||||||||
| Commercial Services & Supplies – 0.9% | ||||||||||||||||||||||||||||||
| 56 | Brand Energy & Infrastructure Services, Inc., Term Loan | 5.250% | 3-Month LIBOR | 4.250% | 6/21/24 | B– | 54,531 | |||||||||||||||||||||||
| 250 | CCRR Parent, Inc, Term Loan B, (WI/DD) | TBD | �� | TBD | TBD | TBD | B | 250,157 | ||||||||||||||||||||||
| 175 | Clean Harbors Inc., Term Loan B | 2.104% | 1-Month LIBOR | 2.000% | 10/08/28 | BBB– | 175,110 | |||||||||||||||||||||||
| 223 | Covanta Holding Corp, Term Loan, (WI/DD) | TBD | TBD | TBD | TBD | BB+ | 223,778 | |||||||||||||||||||||||
| 17 | Covanta Holding Corp, Term Loan, (WI/DD) | TBD | TBD | TBD | TBD | BB+ | 16,762 | |||||||||||||||||||||||
| 1,847 | Delta 2 (LUX) S.a.r.l., Term Loan, (DD1) | 3.500% | 1-Month LIBOR | 2.500% | 2/01/24 | B+ | 1,847,514 | |||||||||||||||||||||||
| 500 | Garda World Security Corporation, Term Loan B, (WI/DD) | TBD | TBD | TBD | TBD | B+ | 499,950 | |||||||||||||||||||||||
| 700 | GFL Environmental Inc., Term Loan | 3.500% | 1-Month LIBOR | 3.000% | 5/30/25 | BB– | 702,809 | |||||||||||||||||||||||
| 344 | Prime Security Services Borrower, LLC, Term Loan, (DD1) | 3.500% | 12-Month LIBOR | 2.750% | 9/23/26 | BB– | 344,109 | |||||||||||||||||||||||
| 605 | Prime Security Services Borrower, LLC, Term Loan, (DD1) | 3.500% | 1-Month LIBOR | 2.750% | 9/23/26 | BB– | 604,963 | |||||||||||||||||||||||
| 124 | Sabert Corporation, Term Loan B | 5.500% | 1-Month LIBOR | 4.500% | 12/10/26 | B | 124,436 | |||||||||||||||||||||||
| 247 | Spin Holdco Inc., Term Loan | 4.750% | 3-Month LIBOR | 4.000% | 3/04/28 | B– | 248,600 | |||||||||||||||||||||||
| 203 | Trans Union, LLC, Term Loan B5 | 1.854% | 1-Month LIBOR | 1.750% | 11/13/26 | BBB– | 201,759 | |||||||||||||||||||||||
23
| NMAI | Nuveen Multi-Asset Income Fund (continued) | |
| Portfolio of Investments December 31, 2021 | ||
Principal Amount (000) | Description (1) | Coupon (5) | Reference Rate (5) | Spread (5) | Maturity (6) | Ratings (4) | Value | |||||||||||||||||||||||
| Commercial Services & Supplies (continued) | ||||||||||||||||||||||||||||||
| $ | 448 | Travelport Finance (Luxembourg) S.a.r.l., Term Loan, (cash 3.500%, PIK 6.500%), (DD1) | 3.500% | 3-Month LIBOR | 2.500% | 2/28/25 | B– | $ | 461,382 | |||||||||||||||||||||
| 118 | West Corporation, Term Loan B1 | 4.500% | 3-Month LIBOR | 3.500% | 10/10/24 | B | 111,471 | |||||||||||||||||||||||
| 93 | WEX Inc., Term Loan | 2.354% | 1-Month LIBOR | 2.250% | 4/01/28 | BB | 92,514 | |||||||||||||||||||||||
| 5,950 | Total Commercial Services & Supplies | 5,959,845 | ||||||||||||||||||||||||||||
| Communications Equipment – 0.5% | ||||||||||||||||||||||||||||||
| 250 | Avaya, Inc., Term Loan B, (WI/DD) | TBD | TBD | TBD | TBD | B+ | 251,069 | |||||||||||||||||||||||
| 183 | CommScope, Inc., Term Loan B | 3.352% | 1-Month LIBOR | 3.250% | 4/04/26 | BB– | 180,611 | |||||||||||||||||||||||
| 375 | Cyxtera DC Holdings, Inc., Term Loan B, (WI/DD) | TBD | TBD | TBD | TBD | B | 371,886 | |||||||||||||||||||||||
| 495 | Eagle Broadband Investments LLC, Term Loan | 3.750% | 3-Month LIBOR | 3.000% | 11/12/27 | B+ | 495,216 | |||||||||||||||||||||||
| 497 | MetroNet Systems Holdings, LLC, Term Loan, First Lien | 4.500% | 1-Month LIBOR | 3.750% | 6/02/28 | B | 498,133 | |||||||||||||||||||||||
| 333 | MLN US HoldCo LLC, Term Loan, First Lien, (WI/DD) | TBD | TBD | TBD | TBD | B– | 322,632 | |||||||||||||||||||||||
| 390 | Plantronics Inc, Term Loan B | 2.604% | 1-Month LIBOR | 2.500% | 7/02/25 | BB | 382,946 | |||||||||||||||||||||||
| 748 | Riverbed Technology, Inc., Term Loan B, (DD1) | 2.000% | 3-Month LIBOR | 2.000% | 12/07/26 | N/R | 733,355 | |||||||||||||||||||||||
| 151 | Univision Communications Inc., Term Loan C5 | 3.750% | 1-Month LIBOR | 2.750% | 3/15/24 | B | 150,753 | |||||||||||||||||||||||
| 3,422 | Total Communications Equipment | 3,386,601 | ||||||||||||||||||||||||||||
| Construction & Engineering – 0.1% | ||||||||||||||||||||||||||||||
| 116 | AECOM, Term Loan B | 1.852% | 1-Month LIBOR | 1.750% | 4/13/28 | BBB– | 115,914 | |||||||||||||||||||||||
| 190 | Brown Group Holding, LLC, Term Loan B | 3.000% | 3-Month LIBOR | 2.500% | 4/22/28 | B+ | 190,277 | |||||||||||||||||||||||
| 220 | Centuri Group, Inc, Term Loan B | 3.000% | 3-Month LIBOR | 2.500% | 8/27/28 | BB | 219,580 | |||||||||||||||||||||||
| 95 | Rexnord LLC, Term Loan B | 2.750% | 1-Month LIBOR | 2.250% | 10/04/28 | BB | 95,178 | |||||||||||||||||||||||
| 621 | Total Construction & Engineering | 620,949 | ||||||||||||||||||||||||||||
| Containers & Packaging – 0.0% | ||||||||||||||||||||||||||||||
| 135 | Grinding Media Inc., Term Loan B | 4.750% | 3-Month LIBOR | 4.000% | 10/12/28 | B | 134,747 | |||||||||||||||||||||||
| 149 | Reynolds Group Holdings Inc. , Term Loan B2 | 4.000% | 1-Month LIBOR | 3.500% | 9/24/28 | B+ | 149,625 | |||||||||||||||||||||||
| 284 | Total Containers & Packaging | 284,372 | ||||||||||||||||||||||||||||
| Distributors – 0.1% | ||||||||||||||||||||||||||||||
| 177 | Core & Main LP, Term Loan B | 2.602% | 1-Month LIBOR | 2.500% | 6/10/28 | BB– | 176,500 | |||||||||||||||||||||||
| 165 | Univar Solutions USA Inc., Term Loan B6 | 2.104% | 1-Month LIBOR | 2.000% | 6/03/28 | BBB– | 164,263 | |||||||||||||||||||||||
| 342 | Total Distributors | 340,763 | ||||||||||||||||||||||||||||
| Diversified Consumer Services – 0.1% | ||||||||||||||||||||||||||||||
| 500 | Cengage Learning, Inc., Term Loan B, (WI/DD) | TBD | TBD | TBD | TBD | B | 502,005 | |||||||||||||||||||||||
| Diversified Financial Services – 0.2% | ||||||||||||||||||||||||||||||
| 50 | Avaya, Inc., Term Loan B, (WI/DD) | TBD | TBD | TBD | TBD | N/R | 49,834 | |||||||||||||||||||||||
| 214 | Ditech Holding Corporation, Term Loan, (7) | 0.000% | N/A | N/A | 6/30/22 | N/R | 43,015 | |||||||||||||||||||||||
| 375 | Filtration Group Corporation, Term Loan, First Lien, (WI/DD) | TBD | TBD | TBD | TBD | B | 375,079 | |||||||||||||||||||||||
| 118 | Lions Gate Capital Holdings LLC, Term Loan B | 2.354% | 1-Month LIBOR | 2.250% | 3/24/25 | BB | 117,654 | |||||||||||||||||||||||
| 749 | Verscend Holding Corp., Term Loan B | 4.104% | 1-Month LIBOR | 4.000% | 8/27/25 | B+ | 749,396 | |||||||||||||||||||||||
| 1,506 | Total Diversified Financial Services | 1,334,978 | ||||||||||||||||||||||||||||
| Diversified Telecommunication Services – 0.3% | ||||||||||||||||||||||||||||||
| 970 | Altice France S.A., Term Loan B13 | 4.118% | 2-Month LIBOR | 4.000% | 8/14/26 | B | 966,605 | |||||||||||||||||||||||
| 120 | Altice France S.A., Term Loan B13 | 3.811% | 3-Month LIBOR | 3.688% | 1/31/26 | B | 118,831 | |||||||||||||||||||||||
| 98 | CenturyLink, Inc., Term Loan A | 2.354% | 1-Month LIBOR | 2.250% | 3/15/27 | BB+ | 96,850 | |||||||||||||||||||||||
| 225 | Cincinnati Bell, Inc., Term Loan B2 | 3.750% | 3-Month LIBOR | 3.250% | 11/23/28 | B+ | 225,253 | |||||||||||||||||||||||
| 383 | Frontier Communications Corp., DIP Term Loan B | 4.500% | 3-Month LIBOR | 3.750% | 10/08/27 | B+ | 382,975 | |||||||||||||||||||||||
| 118 | Intelsat Jackson Holdings S.A., Term Loan B4, (7) | 8.750% | Prime | 5.500% | 1/02/24 | N/R | 118,411 | |||||||||||||||||||||||
| 189 | Intelsat Jackson Holdings S.A., Term Loan B5, (7) | 8.625% | N/A | N/A | 1/02/24 | N/R | 189,576 | |||||||||||||||||||||||
| 2,103 | Total Diversified Telecommunication Services |
| 2,098,501 | |||||||||||||||||||||||||||
24
Principal Amount (000) | Description (1) | Coupon (5) | Reference Rate (5) | Spread (5) | Maturity (6) | Ratings (4) | Value | |||||||||||||||||||||||
| Electric Utilities – 0.0% | ||||||||||||||||||||||||||||||
| $ | 3 | Vistra Operations Company LLC, Term Loan, First Lien B3 | 1.855% | 1-Month LIBOR | 1.750% | 12/31/25 | BBB– | $ | 2,916 | |||||||||||||||||||||
| Electrical Equipment – 0.1% | ||||||||||||||||||||||||||||||
| 557 | Ingram Micro Inc., Term Loan B | 4.000% | 3-Month LIBOR | 3.500% | 7/02/28 | BB– | 558,105 | |||||||||||||||||||||||
| Electronic Equipment, Instruments & Components – 0.1% | ||||||||||||||||||||||||||||||
| 375 | II-VI Inc, Term Loan, (WI/DD) | TBD | TBD | TBD | TBD | BB | 375,079 | |||||||||||||||||||||||
| Entertainment – 0.1% | ||||||||||||||||||||||||||||||
| 15 | AMC Entertainment Holdings, Inc. , Term Loan B | 3.103% | 1-Month LIBOR | 3.000% | 4/22/26 | B– | 13,234 | |||||||||||||||||||||||
| 420 | Crown Finance US, Inc., Term Loan | 3.500% | 6-Month LIBOR | 2.500% | 2/28/25 | CCC | 326,349 | |||||||||||||||||||||||
| 85 | Crown Finance US, Inc., Term Loan | 3.750% | 6-Month LIBOR | 2.750% | 9/20/26 | CCC | 65,347 | |||||||||||||||||||||||
| 71 | Crown Finance US, Inc., Term Loan | 9.250% | 6-Month LIBOR | 8.250% | 5/23/24 | B– | 76,550 | |||||||||||||||||||||||
| 49 | Metro-Goldwyn-Mayer Inc., Term Loan, First Lien | 2.602% | 1-Month LIBOR | 2.500% | 7/03/25 | BB– | 48,581 | |||||||||||||||||||||||
| 248 | William Morris Endeavor Entertainment, LLC, Term Loan, First Lien | 2.860% | 1-Month LIBOR | 2.750% | 5/16/25 | B | 243,246 | |||||||||||||||||||||||
| 888 | Total Entertainment | 773,307 | ||||||||||||||||||||||||||||
| Equity Real Estate Investment Trust – 0.0% | ||||||||||||||||||||||||||||||
| 60 | Installed Building Products Inc, Term Loan, (WI/DD) | TBD | TBD | TBD | TBD | BB+ | 60,125 | |||||||||||||||||||||||
| Food & Staples Retailing – 0.2% | ||||||||||||||||||||||||||||||
| 505 | CHG PPC Parent LLC, Term Loan, (DD1) | 3.500% | 3-Month LIBOR | 3.000% | 12/08/28 | B+ | 504,053 | |||||||||||||||||||||||
| 244 | Chobani, LLC, Term Loan B | 4.500% | 1-Month LIBOR | 3.500% | 10/23/27 | B– | 244,695 | |||||||||||||||||||||||
| 375 | H Food Holdings LLC, Term Loan B, (WI/DD) | TBD | TBD | TBD | TBD | B | 373,125 | |||||||||||||||||||||||
| 310 | US Foods, Inc., Term Loan B, (WI/DD) | TBD | TBD | TBD | TBD | BB | 310,232 | |||||||||||||||||||||||
| 1,434 | Total Food & Staples Retailing | 1,432,105 | ||||||||||||||||||||||||||||
| Food Products – 0.0% | ||||||||||||||||||||||||||||||
| 200 | Sycamore Buyer LLC, Term Loan, (WI/DD) | TBD | TBD | TBD | TBD | BB+ | 199,313 | |||||||||||||||||||||||
| Health Care Equipment & Supplies – 0.4% | ||||||||||||||||||||||||||||||
| 497 | Insulet Corporation, Term Loan B | 3.750% | 1-Month LIBOR | 3.250% | 5/04/28 | BB– | 498,589 | |||||||||||||||||||||||
| 227 | Maravai Intermediate Holdings, LLC, Term Loan B | 4.750% | 1-Month LIBOR | 3.750% | 10/19/27 | B+ | 227,942 | |||||||||||||||||||||||
| 2,250 | Medline Borrower, LP, Term Loan B, (DD1) | 3.750% | 1-Month LIBOR | 3.250% | 10/21/28 | B+ | 2,252,036 | |||||||||||||||||||||||
| 2,974 | Total Health Care Equipment & Supplies | 2,978,567 | ||||||||||||||||||||||||||||
| Health Care Providers & Services – 1.3% | ||||||||||||||||||||||||||||||
| 144 | 24 Hour Fitness Worldwide, Inc., Exit Term Loan, (13) | 3.000% | 3-Month LIBOR | 2.000% | 9/30/26 | N/R | 143,275 | |||||||||||||||||||||||
| 199 | ADMI Corp., Term Loan B2 | 3.875% | 1-Month LIBOR | 3.375% | 12/23/27 | B | 197,507 | |||||||||||||||||||||||
| 499 | AHP Health Partners, Inc., Term Loan B | 4.000% | 1-Month LIBOR | 3.500% | 8/23/28 | B+ | 499,531 | |||||||||||||||||||||||
| 115 | CHG Healthcare Services Inc., Term Loan | 4.000% | 3-Month LIBOR | 3.500% | 9/30/28 | B+ | 114,870 | |||||||||||||||||||||||
| 375 | Electron BidCo Inc., Term Loan, (WI/DD) | TBD | TBD | TBD | TBD | B+ | 374,565 | |||||||||||||||||||||||
| 394 | Envision Healthcare Corporation, Term Loan, First Lien, (WI/DD) | TBD | TBD | TBD | TBD | CCC+ | 318,279 | |||||||||||||||||||||||
| 393 | Gates Global LLC, Term Loan B3 | 3.250% | 1-Month LIBOR | 2.500% | 3/31/27 | B+ | 393,068 | |||||||||||||||||||||||
| 100 | Global Medical Response, Inc., Term Loan B | 5.250% | 6-Month LIBOR | 4.250% | 3/14/25 | B | 99,511 | |||||||||||||||||||||||
| 990 | Global Medical Response, Inc., Term Loan B | 5.250% | 3-Month LIBOR | 4.250% | 10/02/25 | B | 987,719 | |||||||||||||||||||||||
| 157 | Onex TSG Intermediate Corp., Term Loan B | 5.500% | 3-Month LIBOR | 4.750% | 2/26/28 | B | 156,864 | |||||||||||||||||||||||
| 450 | Phoenix Guarantor Inc, Term Loan B | 3.354% | 1-Month LIBOR | 3.250% | 3/05/26 | B+ | 447,713 | |||||||||||||||||||||||
| 121 | Phoenix Guarantor Inc, Term Loan B | 3.604% | 1-Month LIBOR | 3.500% | 3/05/26 | B+ | 120,917 | |||||||||||||||||||||||
| 2,556 | RegionalCare Hospital Partners Holdings, Inc., Term Loan B, (DD1) | 3.852% | 1-Month LIBOR | 3.750% | 11/16/25 | B+ | 2,557,595 | |||||||||||||||||||||||
| 491 | Select Medical Corporation, Term Loan B | 2.360% | 1-Month LIBOR | 2.250% | 3/06/25 | BB | 489,247 | |||||||||||||||||||||||
| 1,394 | Surgery Center Holdings, Inc., Term Loan, (DD1) | 4.500% | 1-Month LIBOR | 3.750% | 8/31/26 | B+ | 1,395,192 | |||||||||||||||||||||||
| 500 | Team Health Holdings, Inc., Term Loan, First Lien, (WI/DD) | TBD | TBD | TBD | TBD | B– | 479,500 | |||||||||||||||||||||||
| 8,878 | Total Health Care Providers & Services | 8,775,353 | ||||||||||||||||||||||||||||
25
| NMAI | Nuveen Multi-Asset Income Fund (continued) | |
| Portfolio of Investments December 31, 2021 | ||
Principal Amount (000) | Description (1) | Coupon (5) | Reference Rate (5) | Spread (5) | Maturity (6) | Ratings (4) | Value | |||||||||||||||||||||||
| Health Care Technology – 0.3% | ||||||||||||||||||||||||||||||
| $ | 1,543 | Change Healthcare Holdings LLC, Term Loan B | 3.500% | 1-Month LIBOR | 2.500% | 3/01/24 | B+ | $ | 1,543,023 | |||||||||||||||||||||
| 490 | Zelis Healthcare Corporation, Term Loan | 3.599% | 1-Month LIBOR | 3.500% | 9/30/26 | B | 487,462 | |||||||||||||||||||||||
| 2,033 | Total Health Care Technology | 2,030,485 | ||||||||||||||||||||||||||||
| Hotels, Restaurants & Leisure – 1.5% | ||||||||||||||||||||||||||||||
| 1,103 | 1011778 B.C. Unlimited Liability Company, Term Loan B4 | 1.854% | 1-Month LIBOR | 1.750% | 11/19/26 | BB+ | 1,089,473 | |||||||||||||||||||||||
| 357 | 24 Hour Fitness Worldwide, Inc., Exit Term Loan, (cash 0.220%, PIK 5.000%) | 5.220% | 3-Month LIBOR | 5.000% | 12/29/25 | B– | 265,146 | |||||||||||||||||||||||
| 838 | Caesars Resort Collection, LLC, Term Loan, First Lien B | 2.851% | 1-Month LIBOR | 2.750% | 12/22/24 | B+ | 834,612 | |||||||||||||||||||||||
| 128 | Churchill Downs Incorporated, Term Loan B1 | 2.110% | 1-Month LIBOR | 2.000% | 3/17/28 | BBB– | 127,721 | |||||||||||||||||||||||
| 750 | ClubCorp Holdings, Inc., Term Loan B, (WI/DD) | TBD | TBD | TBD | TBD | B– | 723,855 | |||||||||||||||||||||||
| 124 | Crown Finance US Inc, Term Loan, (cash 7.132%, PIK 8.250%) | 7.132% | 3-Month LIBOR | 7.000% | 5/23/24 | B– | 149,053 | |||||||||||||||||||||||
| 500 | Equinox Holdings, Inc., Term Loan, First Lien, (WI/DD) | TBD | TBD | TBD | TBD | CCC | 476,875 | |||||||||||||||||||||||
| 871 | Golden Nugget, Inc., Term Loan B, (DD1) | 3.250% | 2-Month LIBOR | 2.500% | 10/04/23 | B | 865,964 | |||||||||||||||||||||||
| 744 | Golden Nugget, Inc., Term Loan B, (DD1) | 3.250% | 3-Month LIBOR | 2.500% | 10/04/23 | B | 741,081 | |||||||||||||||||||||||
| 248 | Hilton Grand Vacations Borrower LLC, Term Loan B | 3.500% | 1-Month LIBOR | 3.000% | 8/02/28 | BB+ | 248,714 | |||||||||||||||||||||||
| 121 | IRB Holding Corp, Term Loan | 4.250% | 3-Month LIBOR | 3.250% | 12/15/27 | B+ | 121,411 | |||||||||||||||||||||||
| 998 | Scientific Games International, Inc., Term Loan B5, (DD1) | 2.854% | 1-Month LIBOR | 2.750% | 8/14/24 | B+ | 996,041 | |||||||||||||||||||||||
| 399 | SeaWorld Parks & Entertainment, Inc., Term Loan B | 3.500% | 1-Month LIBOR | 3.000% | 8/25/28 | BB– | 398,044 | |||||||||||||||||||||||
| 2,275 | Stars Group Holdings B.V. (The), Term Loan, (DD1) | 2.474% | 3-Month LIBOR | 2.250% | 7/10/25 | BBB– | 2,269,814 | |||||||||||||||||||||||
| 750 | Twin River Worldwide Holdings, Inc., Term Loan B | 3.750% | 6-Month LIBOR | 3.250% | 10/01/28 | BB | 751,301 | |||||||||||||||||||||||
| 10,206 | Total Hotels, Restaurants & Leisure | 10,059,105 | ||||||||||||||||||||||||||||
| Household Durables – 0.1% | ||||||||||||||||||||||||||||||
| 17 | Serta Simmons Bedding, LLC, Term Loan, (7) | 8.500% | 3-Month LIBOR | 7.500% | 8/10/23 | B | 17,438 | |||||||||||||||||||||||
| 148 | Serta Simmons Bedding, LLC, Term Loan, (7) | 8.500% | 3-Month LIBOR | 7.500% | 8/10/23 | B– | 139,319 | |||||||||||||||||||||||
| 13 | Weber-Stephen Products LLC, Term Loan B | 4.000% | 6-Month LIBOR | 3.250% | 10/30/27 | BB | 13,127 | |||||||||||||||||||||||
| 432 | Weber-Stephen Products LLC, Term Loan B | 4.000% | 1-Month LIBOR | 3.250% | 10/30/27 | BB | 433,531 | |||||||||||||||||||||||
| 610 | Total Household Durables | 603,415 | ||||||||||||||||||||||||||||
| Insurance – 0.5% | ||||||||||||||||||||||||||||||
| 491 | Acrisure, LLC, Term Loan B | 3.724% | 3-Month LIBOR | 3.500% | 2/15/27 | B | 486,583 | |||||||||||||||||||||||
| 499 | Alliant Holdings Intermediate, LLC, Term Loan B3 | 4.000% | 1-Month LIBOR | 3.500% | 11/12/27 | B | 498,840 | |||||||||||||||||||||||
| 378 | Asurion LLC, Term Loan B8 | 3.229% | 1-Month LIBOR | 3.125% | 11/03/23 | BB– | 377,566 | |||||||||||||||||||||||
| 400 | Asurion LLC, Term Loan B8 | 5.354% | 1-Month LIBOR | 5.250% | 1/15/29 | B | 398,876 | |||||||||||||||||||||||
| 393 | Broadstreet Partners, Inc., Term Loan B | 3.104% | 1-Month LIBOR | 3.000% | 1/27/27 | B+ | 388,600 | |||||||||||||||||||||||
| 375 | Broadstreet Partners, Inc., Term Loan B, (WI/DD) | TBD | TBD | TBD | TBD | B+ | 372,891 | |||||||||||||||||||||||
| 500 | HUB International Ltd, Term Loan, (WI/DD) | TBD | TBD | TBD | TBD | B | 500,597 | |||||||||||||||||||||||
| 148 | Ryan Specialty Group, LLC, Term Loan | 3.750% | 1-Month LIBOR | 3.000% | 9/01/27 | BB– | 148,366 | |||||||||||||||||||||||
| 3,184 | Total Insurance | 3,172,319 | ||||||||||||||||||||||||||||
| Interactive Media & Services – 0.3% | ||||||||||||||||||||||||||||||
| 497 | Adevinta ASA, Term Loan B | 3.500% | 3-Month LIBOR | 2.750% | 11/04/27 | BB– | 498,523 | |||||||||||||||||||||||
| 85 | Mission Broadcasting, Inc., Term Loan B | 2.599% | 3-Month LIBOR | 2.500% | 6/03/28 | BBB– | 84,469 | |||||||||||||||||||||||
| 1,321 | Rackspace Technology Global, Inc., Term Loan B | 3.500% | 3-Month LIBOR | 2.750% | 2/09/28 | B+ | 1,313,037 | |||||||||||||||||||||||
| 1,903 | Total Interactive Media & Services | 1,896,029 | ||||||||||||||||||||||||||||
| Internet & Direct Marketing Retail – 0.1% | ||||||||||||||||||||||||||||||
| 498 | CNT Holdings I Corp, Term Loan | 4.250% | 3-Month LIBOR | 3.750% | 11/08/27 | B | 498,433 | |||||||||||||||||||||||
26
Principal Amount (000) | Description (1) | Coupon (5) | Reference Rate (5) | Spread (5) | Maturity (6) | Ratings (4) | Value | |||||||||||||||||||||||
| Internet Software & Services – 0.2% | ||||||||||||||||||||||||||||||
| $ | 496 | Banff Merger Sub Inc, Term Loan | 3.974% | 3-Month LIBOR | 3.750% | 10/02/25 | B | $ | 493,081 | |||||||||||||||||||||
| 624 | Greeneden U.S. Holdings II, LLC, Term Loan B4 | 4.750% | 1-Month LIBOR | 4.000% | 12/01/27 | B– | 627,172 | |||||||||||||||||||||||
| 375 | IGT Holding IV AB, Term Loan, (WI/DD) | TBD | TBD | TBD | TBD | B | 374,767 | |||||||||||||||||||||||
| 1,495 | Total Internet Software & Services | 1,495,020 | ||||||||||||||||||||||||||||
| IT Services – 0.3% | ||||||||||||||||||||||||||||||
| 445 | CCC Intelligent Solutions Inc., Term Loan B, (DD1) | 3.000% | 3-Month LIBOR | 2.500% | 9/21/28 | B+ | 445,209 | |||||||||||||||||||||||
| 535 | Intrado Corporation, Term Loan | 5.000% | 3-Month LIBOR | 4.000% | 10/10/24 | B | 509,642 | |||||||||||||||||||||||
| 499 | Magenta Buyer LLC, Term Loan, First Lien | 5.750% | 3-Month LIBOR | 5.000% | 7/27/28 | B | 498,204 | |||||||||||||||||||||||
| 841 | Tempo Acquisition LLC, Extended Term Loan | 3.750% | 1-Month LIBOR | 3.250% | 10/31/26 | BB– | 843,194 | |||||||||||||||||||||||
| 2,320 | Total IT Services | 2,296,249 | ||||||||||||||||||||||||||||
| Leisure Products – 0.1% | ||||||||||||||||||||||||||||||
| 403 | Hayward Industries, Inc., Term Loan | 3.000% | 1-Month LIBOR | 2.500% | 5/28/28 | BB– | 402,115 | |||||||||||||||||||||||
| 10 | SRAM, LLC , Term Loan B | 3.250% | 1-Month LIBOR | 2.750% | 5/18/28 | BB– | 10,441 | |||||||||||||||||||||||
| 18 | SRAM, LLC , Term Loan B | 3.250% | 3-Month LIBOR | 2.750% | 5/18/28 | BB– | 17,401 | |||||||||||||||||||||||
| 61 | SRAM, LLC , Term Loan B | 3.250% | 6-Month LIBOR | 2.750% | 5/18/28 | BB– | 60,905 | |||||||||||||||||||||||
| 492 | Total Leisure Products | 490,862 | ||||||||||||||||||||||||||||
| Life Sciences Tools & Services – 0.5% | ||||||||||||||||||||||||||||||
| 80 | Avantor Funding, Inc., Term Loan B5 | 2.750% | 1-Month LIBOR | 2.250% | 11/06/27 | BB+ | 79,858 | |||||||||||||||||||||||
| 600 | ICON Luxembourg S.A.R.L., Term Loan, (WI/DD) | TBD | TBD | TBD | TBD | BB+ | 601,366 | |||||||||||||||||||||||
| 150 | ICON Luxembourg S.A.R.L., Term Loan, (WI/DD) | TBD | TBD | TBD | TBD | BB+ | 149,830 | |||||||||||||||||||||||
| 2,476 | Parexel International Corporation, Term Loan B, (WI/DD) | TBD | TBD | TBD | TBD | B+ | 2,479,417 | |||||||||||||||||||||||
| 3,306 | Total Life Sciences Tools & Services | 3,310,471 | ||||||||||||||||||||||||||||
| Machinery – 0.3% | ||||||||||||||||||||||||||||||
| 500 | Ali Group Srl, Term Loan, (WI/DD) | TBD | TBD | TBD | TBD | BBB– | 497,570 | |||||||||||||||||||||||
| 311 | Alliance Laundry Systems LLC, Term Loan B | 4.250% | 3-Month LIBOR | 3.500% | 10/08/27 | B | 311,065 | |||||||||||||||||||||||
| 336 | Standard Industries Inc., Term Loan B | 3.000% | 3-Month LIBOR | 2.500% | 9/22/28 | BBB– | 336,704 | |||||||||||||||||||||||
| 593 | Vertical US Newco Inc, Term Loan B, (DD1) | 4.000% | 6-Month LIBOR | 3.500% | 7/31/27 | B+ | 594,569 | |||||||||||||||||||||||
| 491 | Vertiv Group Corporation, Term Loan B | 2.844% | 1-Month LIBOR | 2.750% | 3/02/27 | BB– | 489,008 | |||||||||||||||||||||||
| 2,231 | Total Machinery | 2,228,916 | ||||||||||||||||||||||||||||
| Marine – 0.0% | ||||||||||||||||||||||||||||||
| 235 | HGIM Corp., Exit Term Loan, (DD1) | 7.000% | 3-Month LIBOR | 6.000% | 7/02/23 | CCC– | 198,205 | |||||||||||||||||||||||
| Media – 2.0% | ||||||||||||||||||||||||||||||
| 80 | ABG Intermediate Holdings 2 LLC, Term Loan, (WI/DD) | TBD | TBD | TBD | TBD | CCC+ | 80,400 | |||||||||||||||||||||||
| 335 | ABG Intermediate Holdings 2 LLC, Term Loan, (WI/DD) | TBD | TBD | TBD | TBD | B+ | 333,744 | |||||||||||||||||||||||
| 370 | Cable One, Inc., Term Loan B4 | 2.102% | 1-Month LIBOR | 2.000% | 5/03/28 | BB+ | 370,618 | |||||||||||||||||||||||
| 1,541 | Clear Channel Outdoor Holdings, Inc., Term Loan B, (DD1) | 3.629% | 3-Month LIBOR | 3.500% | 8/21/26 | B+ | 1,522,381 | |||||||||||||||||||||||
| 195 | CSC Holdings, LLC, Term Loan B1 | 2.360% | 3-Month LIBOR | 2.250% | 7/17/25 | BB | 192,710 | |||||||||||||||||||||||
| 1,183 | CSC Holdings, LLC, Term Loan B1 | 2.360% | 3-Month LIBOR | 2.250% | 1/15/26 | BB | 1,169,261 | |||||||||||||||||||||||
| 850 | CSC Holdings, LLC, Term Loan B1 | 2.610% | 3-Month LIBOR | 2.500% | 4/15/27 | BB | 840,235 | |||||||||||||||||||||||
| 73 | Cumulus Media New Holdings Inc., Term Loan B | 4.750% | 3-Month LIBOR | 3.750% | 3/31/26 | B | 73,043 | |||||||||||||||||||||||
| 355 | Diamond Sports Group, LLC, Term Loan, (DD1) | 3.353% | 1-Month LIBOR | 3.250% | 8/24/26 | CCC+ | 166,841 | |||||||||||||||||||||||
| 1,306 | DirecTV Financing, LLC, Term Loan | 5.750% | 3-Month LIBOR | 5.000% | 8/02/27 | BB | 1,308,826 | |||||||||||||||||||||||
| 500 | Dotdash Meredith Inc, Term Loan B, (WI/DD) | TBD | TBD | TBD | TBD | BB– | 500,938 | |||||||||||||||||||||||
| 277 | Gray Television, Inc., Term Loan B | 2.349% | 3-Month LIBOR | 2.250% | 2/07/24 | BB | 276,281 | |||||||||||||||||||||||
| 829 | iHeartCommunications, Inc., Term Loan | 3.104% | 1-Month LIBOR | 3.000% | 5/01/26 | B+ | 824,604 | |||||||||||||||||||||||
| 912 | Intelsat Jackson Holdings S.A., Term Loan B3, (7) | 8.000% | 1-Month LIBOR | 4.750% | 11/27/23 | N/R | 912,131 | |||||||||||||||||||||||
| 553 | Intelsat Jackson Holdings S.A., DIP Term Loan, (7), (13) | 5.750% | 3-Month LIBOR | 4.750% | 7/13/22 | N/R | 553,480 | |||||||||||||||||||||||
27
| NMAI | Nuveen Multi-Asset Income Fund (continued) | |
| Portfolio of Investments December 31, 2021 | ||
Principal Amount (000) | Description (1) | Coupon (5) | Reference Rate (5) | Spread (5) | Maturity (6) | Ratings (4) | Value | |||||||||||||||||||||||
| Media (continued) | ||||||||||||||||||||||||||||||
| $ | 279 | McGraw-Hill Global Education Holdings, LLC, Term Loan | 5.250% | 1-Month LIBOR | 4.750% | 7/30/28 | B | $ | 278,472 | |||||||||||||||||||||
| 339 | Nexstar Broadcasting, Inc., Term Loan B3 | 2.354% | 1-Month LIBOR | 2.250% | 1/17/24 | BBB– | 338,611 | |||||||||||||||||||||||
| 500 | Radiate Holdco LLC, Term Loan, (WI/DD) | TBD | TBD | TBD | TBD | N/R | 498,960 | |||||||||||||||||||||||
| 80 | Radiate Holdco, LLC, Term Loan | 4.000% | 1-Month LIBOR | 3.250% | 9/25/26 | B+ | 79,834 | |||||||||||||||||||||||
| 156 | Sinclair Television Group Inc., Term Loan B1 | 2.360% | 1-Month LIBOR | 2.250% | 1/03/24 | BB | 154,565 | |||||||||||||||||||||||
| 385 | Springer Nature Deutschland GmbH, Term Loan B18 | 3.750% | 1-Month LIBOR | 3.000% | 8/14/26 | B+ | 385,580 | |||||||||||||||||||||||
| 1,000 | Virgin Media Bristol LLC, Term Loan N | 2.610% | 3-Month LIBOR | 2.500% | 1/31/28 | BB– | 992,295 | |||||||||||||||||||||||
| 1,231 | Ziggo Financing Partnership, Term Loan I | 2.610% | 3-Month LIBOR | 2.500% | 4/30/28 | B+ | 1,219,451 | |||||||||||||||||||||||
| 13,329 | Total Media | 13,073,261 | ||||||||||||||||||||||||||||
| Multiline Retail – 0.0% | ||||||||||||||||||||||||||||||
| 1 | Belk, Inc., Term Loan | 8.500% | 3-Month LIBOR | 7.500% | 7/31/25 | B– | 1,694 | |||||||||||||||||||||||
| 8 | Belk, Inc., Term Loan, (cash 5.000%, PIK 8.000%) | 13.000% | 3-Month LIBOR | 13.000% | 7/31/25 | CCC– | 5,682 | |||||||||||||||||||||||
| 220 | EG America LLC, Term Loan | 4.224% | 3-Month LIBOR | 4.000% | 2/05/25 | B– | 219,243 | |||||||||||||||||||||||
| 229 | Total Multiline Retail | 226,619 | ||||||||||||||||||||||||||||
| Office Electronics – 0.0% | ||||||||||||||||||||||||||||||
| 51 | Pitney Bowes Inc, Term Loan | 4.110% | 1-Month LIBOR | 4.000% | 3/19/28 | BBB– | 51,228 | |||||||||||||||||||||||
| Oil, Gas & Consumable Fuels – 0.2% | ||||||||||||||||||||||||||||||
| 10 | DT Midstream, Inc, Term Loan B | 2.500% | 3-Month LIBOR | 2.000% | 6/10/28 | BBB– | 9,536 | |||||||||||||||||||||||
| 87 | DT Midstream, Inc, Term Loan B | 2.500% | 1-Month LIBOR | 2.000% | 6/10/28 | BBB– | 87,775 | |||||||||||||||||||||||
| 500 | Gulf Finance LLC, Term Loan, (WI/DD) | TBD | TBD | TBD | TBD | B | 468,907 | |||||||||||||||||||||||
| 365 | QuarterNorth Energy Holding Inc., Exit Term Loan, Second Lien | 9.000% | 3-Month LIBOR | 8.000% | 8/27/26 | B | 367,024 | |||||||||||||||||||||||
| 235 | TransMontaigne Operating Company L.P., Term Loan B | 4.000% | 1-Month LIBOR | 3.500% | 11/05/28 | BB– | 236,322 | |||||||||||||||||||||||
| 1,197 | Total Oil, Gas & Consumable Fuels | 1,169,564 | ||||||||||||||||||||||||||||
| Paper & Forest Products – 0.1% | ||||||||||||||||||||||||||||||
| 311 | Asplundh Tree Expert, LLC, Term Loan B | 1.854% | 1-Month LIBOR | 1.750% | 9/04/27 | BBB– | 310,199 | |||||||||||||||||||||||
| Personal Products – 0.2% | ||||||||||||||||||||||||||||||
| 499 | Conair Holdings, LLC, Term Loan B | 3.970% | 3-Month LIBOR | 3.750% | 5/17/28 | B+ | 499,595 | |||||||||||||||||||||||
| 134 | Journey Personal Care Corp., Term Loan B | 5.500% | 3-Month LIBOR | 4.250% | 3/01/28 | B | 134,437 | |||||||||||||||||||||||
| 0 | (12) | Kronos Acquisition Holdings Inc., Term Loan B | 4.250% | 3-Month LIBOR | 3.750% | 12/22/26 | B | 15 | ||||||||||||||||||||||
| 746 | Revlon Consumer Products Corporation, Term Loan B, (3) | 4.250% | 3-Month LIBOR | 3.500% | 9/07/23 | CC | 592,285 | |||||||||||||||||||||||
| 1,379 | Total Personal Products | 1,226,332 | ||||||||||||||||||||||||||||
| Pharmaceuticals – 1.0% | ||||||||||||||||||||||||||||||
| 1,325 | Bausch Health Companies Inc., Term Loan B | 3.104% | 1-Month LIBOR | 3.000% | 6/02/25 | BB | 1,320,752 | |||||||||||||||||||||||
| 103 | Bausch Health Companies Inc., Term Loan B | 2.854% | 1-Month LIBOR | 2.750% | 11/27/25 | BB | 102,590 | |||||||||||||||||||||||
| 375 | Driven Holdings, LLC, Term Loan B, (WI/DD) | TBD | TBD | TBD | TBD | N/R | 375,469 | |||||||||||||||||||||||
| 852 | Endo Luxembourg Finance Company I S.a r.l., Term Loan, (DD1) | 5.750% | 3-Month LIBOR | 5.000% | 3/25/28 | B– | 831,203 | |||||||||||||||||||||||
| 1,207 | Gainwell Acquisition Corp., Term Loan B | 4.750% | 3-Month LIBOR | 4.000% | 10/01/27 | B+ | 1,211,667 | |||||||||||||||||||||||
| 998 | Jazz Financing Lux S.a.r.l., Term Loan, (DD1) | 4.000% | 1-Month LIBOR | 3.500% | 5/05/28 | BB | 1,002,428 | |||||||||||||||||||||||
| 375 | LSCS Holdings Inc, Term Loan, (WI/DD) | TBD | TBD | TBD | TBD | B2 | 375,563 | |||||||||||||||||||||||
| 29 | Mallinckrodt International Finance S.A., Term Loan B, (WI/DD), (7) | TBD | TBD | TBD | TBD | D | 27,496 | |||||||||||||||||||||||
| 1,085 | Organon & Co, Term Loan | 3.500% | 3-Month LIBOR | 3.000% | 6/02/28 | BB | 1,087,285 | |||||||||||||||||||||||
| 6,349 | Total Pharmaceuticals | 6,334,453 | ||||||||||||||||||||||||||||
| Professional Services – 0.3% | ||||||||||||||||||||||||||||||
| 1,235 | Ceridian HCM Holding Inc., Term Loan B | 2.577% | 1-Week LIBOR | 2.500% | 4/30/25 | B+ | 1,222,363 | |||||||||||||||||||||||
| 121 | Dun & Bradstreet Corporation (The), Term Loan | 3.352% | 1-Month LIBOR | 3.250% | 2/08/26 | B+ | 120,895 | |||||||||||||||||||||||
28
Principal Amount (000) | Description (1) | Coupon (5) | Reference Rate (5) | Spread (5) | Maturity (6) | Ratings (4) | Value | |||||||||||||||||||||||
| Professional Services (continued) | ||||||||||||||||||||||||||||||
| $ | 376 | Nielsen Finance LLC, Term Loan B4 | 2.102% | 1-Month LIBOR | 2.000% | 10/04/23 | BBB– | $ | 376,389 | |||||||||||||||||||||
| 375 | Trans Union, LLC, Term Loan B5 | 2.750% | 1-Month LIBOR | 2.250% | 12/01/28 | BBB– | 374,531 | |||||||||||||||||||||||
| 2,107 | Total Professional Services | 2,094,178 | ||||||||||||||||||||||||||||
| Road & Rail – 0.3% | ||||||||||||||||||||||||||||||
| 154 | Avolon TLB Borrower 1 (US) LLC, Term Loan B3 | 2.500% | 1-Month LIBOR | 1.750% | 1/15/25 | BBB | 154,146 | |||||||||||||||||||||||
| 97 | First Student Bidco Inc, Term Loan B | 4.000% | 3-Month LIBOR | 3.000% | 7/21/28 | BB– | 97,094 | |||||||||||||||||||||||
| 264 | First Student Bidco Inc, Term Loan B | 3.500% | 3-Month LIBOR | 3.000% | 7/21/28 | BB– | 262,854 | |||||||||||||||||||||||
| 413 | Fly Funding II S.a.r.l., Term Loan B | 1.900% | 3-Month LIBOR | 1.750% | 8/09/25 | BB+ | 405,427 | |||||||||||||||||||||||
| 802 | Hertz Corporation, (The), Term Loan B, (DD1) | 3.750% | 1-Month LIBOR | 3.250% | 6/30/28 | BB+ | 803,714 | |||||||||||||||||||||||
| 152 | Hertz Corporation, (The), Term Loan C, (DD1) | 3.750% | 1-Month LIBOR | 3.250% | 6/30/28 | BB+ | 152,146 | |||||||||||||||||||||||
| 1,882 | Total Road & Rail | 1,875,381 | ||||||||||||||||||||||||||||
| Semiconductors & Semiconductor Equipment – 0.2% | ||||||||||||||||||||||||||||||
| 980 | Bright Bidco B.V., Term Loan B, (WI/DD) | TBD | TBD | TBD | TBD | CCC | 759,451 | |||||||||||||||||||||||
| 610 | MKS Instruments Inc, Term Loan, (WI/DD) | TBD | TBD | TBD | TBD | BB+ | 609,466 | |||||||||||||||||||||||
| 42 | Synaptics Inc, Term Loan, (WI/DD) | TBD | TBD | TBD | TBD | Baa3 | 41,981 | |||||||||||||||||||||||
| 1,632 | Total Semiconductors & Semiconductor Equipment |
| 1,410,898 | |||||||||||||||||||||||||||
| Software – 1.7% | ||||||||||||||||||||||||||||||
| 375 | AppLovin Corporation, Term Loan B, (WI/DD) | TBD | TBD | TBD | TBD | B+ | 374,882 | |||||||||||||||||||||||
| 159 | Apttus Corporation, Term Loan | 5.000% | 3-Month LIBOR | 4.250% | 5/06/28 | B– | 159,778 | |||||||||||||||||||||||
| 250 | Camelot U.S. Acquisition 1 Co., Term Loan B, (WI/DD) | TBD | TBD | TBD | TBD | B+ | 248,594 | |||||||||||||||||||||||
| 495 | Camelot U.S. Acquisition 1 Co., Term Loan B | 4.000% | 1-Month LIBOR | 3.000% | 10/31/26 | B+ | 495,309 | |||||||||||||||||||||||
| 995 | Delta TopCo, Inc., Term Loan B | 4.500% | 3-Month LIBOR | 3.750% | 12/01/27 | B | 997,313 | |||||||||||||||||||||||
| 933 | Epicor Software Corporation, Term Loan | 4.000% | 1-Month LIBOR | 3.250% | 7/31/27 | B | 933,629 | |||||||||||||||||||||||
| 1,125 | Finastra USA, Inc., Term Loan, First Lien, (WI/DD) | TBD | TBD | TBD | TBD | B | 1,121,484 | |||||||||||||||||||||||
| 775 | Informatica LLC, Term Loan B, (DD1) | 2.875% | 1-Month LIBOR | 2.750% | 10/14/28 | BB– | 773,547 | |||||||||||||||||||||||
| 250 | Instructure Holdings, Inc., Term Loan B, (WI/DD) | TBD | TBD | TBD | TBD | Ba1 | 249,375 | |||||||||||||||||||||||
| 78 | IQVIA Inc., Term Loan B3 | 1.974% | 3-Month LIBOR | 1.750% | 6/11/25 | BBB– | 77,727 | |||||||||||||||||||||||
| 241 | MA FinanceCo., LLC, Term Loan B | 2.854% | 1-Month LIBOR | 2.750% | 6/21/24 | BB– | 239,304 | |||||||||||||||||||||||
| 309 | McAfee, LLC, Term Loan B | 3.852% | 1-Month LIBOR | 3.750% | 9/29/24 | BB | 309,433 | |||||||||||||||||||||||
| 512 | Proofpoint, Inc., Term Loan, First Lien | 3.750% | 3-Month LIBOR | 3.250% | 8/31/28 | B | 510,682 | |||||||||||||||||||||||
| 229 | RealPage, Inc, Term Loan, First Lien | 3.750% | 1-Month LIBOR | 3.250% | 4/22/28 | B | 229,032 | |||||||||||||||||||||||
| 1,626 | Seattle Spinco, Inc., Term Loan B3 | 2.854% | 1-Month LIBOR | 2.750% | 6/21/24 | BB– | 1,616,081 | |||||||||||||||||||||||
| 1,281 | Sophia, L.P., Term Loan, First Lien | 4.000% | 3-Month LIBOR | 3.500% | 10/07/27 | B | 1,282,069 | |||||||||||||||||||||||
| 178 | SS&C European Holdings Sarl, Term Loan B4 | 1.854% | 1-Month LIBOR | 1.750% | 4/16/25 | BB+ | 176,449 | |||||||||||||||||||||||
| 205 | SS&C Technologies Inc., Term Loan B3 | 1.854% | 1-Month LIBOR | 1.750% | 4/16/25 | BB+ | 203,172 | |||||||||||||||||||||||
| 80 | Tibco Software Inc., Term Loan B3 | 3.852% | 1-Month LIBOR | 3.750% | 7/03/26 | B | 79,032 | |||||||||||||||||||||||
| 750 | UKG Inc, Term Loan, (WI/DD) | TBD | TBD | TBD | TBD | B– | 747,341 | |||||||||||||||||||||||
| 302 | Ultimate Software Group Inc (The), Term Loan | 4.000% | | 3-Month LIBOR | | 3.250% | 5/04/26 | B+ | 300,535 | |||||||||||||||||||||
| 302 | Ultimate Software Group Inc (The), Term Loan, Second Lien, (WI/DD) | TBD | TBD | TBD | TBD | CCC+ | 303,428 | |||||||||||||||||||||||
| 11,450 | Total Software | 11,428,196 | ||||||||||||||||||||||||||||
| Specialty Retail – 0.4% | ||||||||||||||||||||||||||||||
| 375 | Bali Finco Inc, Term Loan, (WI/DD) | TBD | TBD | TBD | TBD | B | 371,953 | |||||||||||||||||||||||
| 477 | Birkenstock GmbH & Co. KG, Term Loan B | 3.750% | 6-Month LIBOR | 3.250% | 4/28/28 | B+ | 476,009 | |||||||||||||||||||||||
| 250 | Jo-Ann Stores, Inc., Term Loan B1, (WI/DD) | TBD | TBD | TBD | TBD | B | 247,891 | |||||||||||||||||||||||
| 1,238 | PetSmart, Inc., Term Loan B, (DD1) | 4.500% | 3-Month LIBOR | 3.750% | 2/12/28 | BB– | 1,241,636 | |||||||||||||||||||||||
| 199 | Restoration Hardware, Inc., Term Loan B | 3.000% | 3-Month LIBOR | 2.500% | 10/15/28 | BB | 199,350 | |||||||||||||||||||||||
| 2,539 | Total Specialty Retail | 2,536,839 | ||||||||||||||||||||||||||||
| Technology Hardware, Storage & Peripherals – 0.1% | ||||||||||||||||||||||||||||||
| 489 | NCR Corporation, Term Loan | 2.630% | 3-Month LIBOR | 2.500% | 8/28/26 | BB+ | 485,087 | |||||||||||||||||||||||
| 121 | Peraton Corp., Term Loan B | 4.500% | 1-Month LIBOR | 3.750% | 2/01/28 | B+ | 121,509 | |||||||||||||||||||||||
| 610 | Total Technology Hardware, Storage & Peripherals |
| 606,596 | |||||||||||||||||||||||||||
| Textiles, Apparel & Luxury Goods – 0.0% | ||||||||||||||||||||||||||||||
| 75 | CBI Buyer, Inc., Term Loan | 3.750% | 3-Month LIBOR | 3.250% | 1/06/28 | B+ | 74,470 | |||||||||||||||||||||||
29
| NMAI | Nuveen Multi-Asset Income Fund (continued) | |
| Portfolio of Investments December 31, 2021 | ||
Principal Amount (000) | Description (1) | Coupon (5) | Reference Rate (5) | Spread (5) | Maturity (6) | Ratings (4) | Value | |||||||||||||||||||||||
| Transportation Infrastructure – 0.0% | ||||||||||||||||||||||||||||||
| $ | 300 | KKR Apple Bidco, LLC, Term Loan | 3.500% | 1-Month LIBOR | 3.000% | 9/23/28 | B+ | $ | 299,458 | |||||||||||||||||||||
| Wireless Telecommunication Services – 0.0% | ||||||||||||||||||||||||||||||
| 249 | GOGO Intermediate Holdings LLC, Term Loan B | 4.500% | 3-Month LIBOR | 3.750% | 4/30/28 | B | 249,039 | |||||||||||||||||||||||
| $ | 111,927 | Total Variable Rate Senior Loan Interests (cost $110,659,812) |
| 110,538,349 | ||||||||||||||||||||||||||
| Shares | Description (1) | Value | ||||||||||||||||||||||||||||
REAL ESTATE INVESTMENT TRUST COMMON STOCKS – 15.6% (10.8% of Total Investments) |
| |||||||||||||||||||||||||||||
| Diversified – 0.1% | ||||||||||||||||||||||||||||||
| 34,617 | Empire State Realty Trust Inc |
| $ | 308,091 | ||||||||||||||||||||||||||
| 16,448 | STORE Capital Corp |
| 565,811 | |||||||||||||||||||||||||||
Total Diversified |
| 873,902 | ||||||||||||||||||||||||||||
| Health Care – 0.9% | ||||||||||||||||||||||||||||||
| 15,677 | Healthcare Trust of America Inc |
| 523,455 | |||||||||||||||||||||||||||
| 37,135 | Healthpeak Properties Inc | 1,340,202 | ||||||||||||||||||||||||||||
| 22,900 | Parkway Life Real Estate Investment Trust, (2) | 87,198 | ||||||||||||||||||||||||||||
| 31,060 | Ventas Inc | 1,587,787 | ||||||||||||||||||||||||||||
| 24,663 | Welltower Inc | 2,115,346 | ||||||||||||||||||||||||||||
Total Health Care | 5,653,988 | |||||||||||||||||||||||||||||
| Hotels – 0.2% | ||||||||||||||||||||||||||||||
| 53,271 | Host Hotels & Resorts Inc, (14) | 926,383 | ||||||||||||||||||||||||||||
| 22,528 | Park Hotels & Resorts Inc, (14) | 425,328 | ||||||||||||||||||||||||||||
Total Hotels | 1,351,711 | |||||||||||||||||||||||||||||
| Industrial – 2.1% | ||||||||||||||||||||||||||||||
| 3,283 | EastGroup Properties Inc | 748,032 | ||||||||||||||||||||||||||||
| 4,145 | Innovative Industrial Properties Inc | 1,089,762 | ||||||||||||||||||||||||||||
| 44,423 | Prologis Inc | 7,479,056 | ||||||||||||||||||||||||||||
| 42,771 | Rexford Industrial Realty Inc | 3,469,156 | ||||||||||||||||||||||||||||
| 15,367 | Terreno Realty Corp | 1,310,651 | ||||||||||||||||||||||||||||
Total Industrial | 14,096,657 | |||||||||||||||||||||||||||||
| Office – 0.9% | ||||||||||||||||||||||||||||||
| 9,476 | Alexandria Real Estate Equities Inc | 2,112,769 | ||||||||||||||||||||||||||||
| 11,607 | Boston Properties Inc | 1,336,895 | ||||||||||||||||||||||||||||
| 9,209 | Kilroy Realty Corp | 612,030 | ||||||||||||||||||||||||||||
| 24,878 | Orion Office REIT Inc, (14) | 464,472 | ||||||||||||||||||||||||||||
| 7,163 | SL Green Realty Corp | 513,587 | ||||||||||||||||||||||||||||
| 16,401 | Vornado Realty Trust | 686,546 | ||||||||||||||||||||||||||||
Total Office | 5,726,299 | |||||||||||||||||||||||||||||
| Residential – 3.9% | ||||||||||||||||||||||||||||||
| 57,479 | American Homes 4 Rent, Class A | 2,506,659 | ||||||||||||||||||||||||||||
| 8,064 | Apartment Income REIT Corp | 440,859 | ||||||||||||||||||||||||||||
| 15,987 | AvalonBay Communities Inc | 4,038,156 | ||||||||||||||||||||||||||||
| 5,142 | Camden Property Trust | 918,773 | ||||||||||||||||||||||||||||
| 20,683 | Equity LifeStyle Properties Inc | 1,813,072 | ||||||||||||||||||||||||||||
| 43,039 | Equity Residential | 3,895,029 | ||||||||||||||||||||||||||||
| 7,396 | Essex Property Trust Inc | 2,605,093 | ||||||||||||||||||||||||||||
| 136,279 | Ingenia Communities Group, (2) | 616,530 | ||||||||||||||||||||||||||||
| 72,007 | Invitation Homes Inc | 3,264,797 | ||||||||||||||||||||||||||||
| 6,765 | Mid-America Apartment Communities Inc | 1,552,162 | ||||||||||||||||||||||||||||
| 16,444 | Sun Communities Inc | 3,452,747 | ||||||||||||||||||||||||||||
| 20,472 | UDR Inc | 1,228,115 | ||||||||||||||||||||||||||||
Total Residential | 26,331,992 | |||||||||||||||||||||||||||||
30
| Shares | Description (1) | Value | ||||||||||||||||||||||||||||
| Retail – 2.3% | ||||||||||||||||||||||||||||||
| 7,044 | Agree Realty Corp | $ | 502,660 | |||||||||||||||||||||||||||
| 54,845 | Brixmor Property Group Inc | 1,393,611 | ||||||||||||||||||||||||||||
| 76,654 | Kimco Realty Corp | 1,889,521 | ||||||||||||||||||||||||||||
| 1 | Kite Realty Group Trust | 22 | ||||||||||||||||||||||||||||
| 26,624 | Macerich Co | 460,063 | ||||||||||||||||||||||||||||
| 19,524 | Realty Income Corp | 1,397,723 | ||||||||||||||||||||||||||||
| 17,584 | Regency Centers Corp | 1,324,954 | ||||||||||||||||||||||||||||
| 42,822 | Simon Property Group Inc | 6,841,671 | ||||||||||||||||||||||||||||
| 44,117 | SITE Centers Corp | 698,372 | ||||||||||||||||||||||||||||
| 12,287 | Spirit Realty Capital Inc | 592,111 | ||||||||||||||||||||||||||||
| 24,764 | Tanger Factory Outlet Centers Inc | 477,450 | ||||||||||||||||||||||||||||
Total Retail | 15,578,158 | |||||||||||||||||||||||||||||
| Specialized – 5.2% | ||||||||||||||||||||||||||||||
| 31,484 | American Tower Corp | 9,209,070 | ||||||||||||||||||||||||||||
| 21,311 | Crown Castle International Corp | 4,448,458 | ||||||||||||||||||||||||||||
| 6,598 | CyrusOne Inc | 591,973 | ||||||||||||||||||||||||||||
| 14,720 | Digital Realty Trust Inc | 2,603,526 | ||||||||||||||||||||||||||||
| 5,678 | Equinix Inc | 4,802,680 | ||||||||||||||||||||||||||||
| 6,569 | Extra Space Storage Inc | 1,489,389 | ||||||||||||||||||||||||||||
| 6,481 | Gaming and Leisure Properties Inc | 315,366 | ||||||||||||||||||||||||||||
| 8,261 | Lamar Advertising Co | 1,002,059 | ||||||||||||||||||||||||||||
| 10,273 | National Storage Affiliates Trust | 710,892 | ||||||||||||||||||||||||||||
| 24,756 | Outfront Media Inc | 663,956 | ||||||||||||||||||||||||||||
| 8,190 | Public Storage | 3,067,646 | ||||||||||||||||||||||||||||
| 6,548 | SBA Communications Corp | 2,547,303 | ||||||||||||||||||||||||||||
| 26,744 | VICI Properties Inc | 805,262 | ||||||||||||||||||||||||||||
| 54,984 | Weyerhaeuser Co | 2,264,241 | ||||||||||||||||||||||||||||
Total Specialized | 34,521,821 | |||||||||||||||||||||||||||||
Total Real Estate Investment Trust Common Stocks (cost $75,520,666) |
| 104,134,528 | ||||||||||||||||||||||||||||
Principal Amount (000) | Description (1) | Coupon | Maturity | Ratings (4) | Value | |||||||||||||||||||||||||
$1,000 PAR (OR SIMILAR) INSTITUTIONAL PREFERRED – 9.2% (6.4% of Total Investments) |
| |||||||||||||||||||||||||||||
| Automobiles – 0.4% | ||||||||||||||||||||||||||||||
| $ | 932 | General Motors Financial Co Inc | 5.700% | N/A (8) | BB | $ | 1,062,480 | |||||||||||||||||||||||
| 1,285 | General Motors Financial Co Inc | 6.500% | N/A (8) | BB | 1,421,351 | |||||||||||||||||||||||||
| 2,217 | Total Automobiles | 2,483,831 | ||||||||||||||||||||||||||||
| Banks – 4.4% | ||||||||||||||||||||||||||||||
| 2,410 | Bank of America Corp | 6.500% | N/A (8) | BBB– | 2,638,878 | |||||||||||||||||||||||||
| 240 | Bank of America Corp | 6.300% | N/A (8) | BBB– | 270,000 | |||||||||||||||||||||||||
| 75 | Bank of America Corp | 6.100% | N/A (8) | BBB– | 81,281 | |||||||||||||||||||||||||
| 2,050 | CIT Group Inc | 5.800% | N/A (8) | B+ | 2,078,187 | |||||||||||||||||||||||||
| 2,325 | Citigroup Inc | 6.250% | N/A (8) | BB+ | 2,622,135 | |||||||||||||||||||||||||
| 1,000 | Citigroup Inc | 5.950% | N/A (8) | BB+ | 1,070,000 | |||||||||||||||||||||||||
| 260 | Citizens Financial Group Inc | 6.375% | N/A (8) | BB+ | 271,375 | |||||||||||||||||||||||||
| 325 | CoBank ACB | 6.250% | N/A (8) | BBB+ | 367,517 | |||||||||||||||||||||||||
| 415 | Goldman Sachs Group Inc | 3.800% | N/A (8) | BB+ | 412,925 | |||||||||||||||||||||||||
| 805 | Huntington Bancshares Inc/OH | 5.625% | N/A (8) | BB+ | 918,706 | |||||||||||||||||||||||||
| 660 | JPMorgan Chase & Co | 5.000% | N/A (8) | BBB | 678,150 | |||||||||||||||||||||||||
| 125 | JPMorgan Chase & Co | 6.100% | N/A (8) | BBB | 131,875 | |||||||||||||||||||||||||
| 2,760 | JPMorgan Chase & Co | 6.750% | N/A (8) | BBB | 2,991,495 | |||||||||||||||||||||||||
| 345 | JPMorgan Chase & Co | 3.650% | N/A (8) | BBB | 344,138 | |||||||||||||||||||||||||
| 625 | Lloyds Bank PLC, 144A | 12.000% | N/A (8) | BBB– | 632,313 | |||||||||||||||||||||||||
| 50 | M&T Bank Corp | 5.125% | N/A (8) | BBB– | 53,532 | |||||||||||||||||||||||||
| 1,425 | M&T Bank Corp | 6.450% | N/A (8) | BBB– | 1,528,312 | |||||||||||||||||||||||||
| 2,550 | PNC Financial Services Group Inc, (3-Month LIBOR reference rate + 3.678% spread), (9) |
| 3.804% | N/A (8) | BBB | 2,537,502 | ||||||||||||||||||||||||
| 305 | PNC Financial Services Group Inc | 3.400% | N/A (8) | BBB | 300,193 | |||||||||||||||||||||||||
| 1,050 | Regions Financial Corp | 5.750% | N/A (8) | BB+ | 1,149,750 | |||||||||||||||||||||||||
| 200 | SVB Financial Group | 4.100% | N/A (8) | BBB | 197,800 | |||||||||||||||||||||||||
| 910 | SVB Financial Group | 4.000% | N/A (8) | BBB | 914,550 | |||||||||||||||||||||||||
| 385 | Truist Financial Corp | 4.800% | N/A (8) | BBB | 401,363 | |||||||||||||||||||||||||
31
| NMAI | Nuveen Multi-Asset Income Fund (continued) | |
| Portfolio of Investments December 31, 2021 | ||
Principal Amount (000) | Description (1) | Coupon | Maturity | Ratings (4) | Value | |||||||||||||||||||||||||
| Banks (continued) | ||||||||||||||||||||||||||||||
| $ | 600 | Truist Financial Corp | 5.100% | N/A (8) | BBB | $ | 670,500 | |||||||||||||||||||||||
| 535 | Truist Financial Corp | 5.050% | N/A (8) | BBB | 542,356 | |||||||||||||||||||||||||
| 1,200 | Wells Fargo & Co | 3.900% | N/A (8) | BBB | 1,233,000 | |||||||||||||||||||||||||
| 1,950 | Wells Fargo & Co | 5.875% | N/A (8) | BBB | 2,130,375 | |||||||||||||||||||||||||
| 1,650 | Zions Bancorp NA | 7.200% | N/A (8) | BB+ | 1,757,250 | |||||||||||||||||||||||||
| 27,230 | Total Banks | 28,925,458 | ||||||||||||||||||||||||||||
| Capital Markets – 0.5% | ||||||||||||||||||||||||||||||
| 395 | Bank of New York Mellon Corp | 4.700% | N/A (8) | BBB+ | 421,366 | |||||||||||||||||||||||||
| 2,000 | Charles Schwab Corp | 5.375% | N/A (8) | BBB | 2,180,000 | |||||||||||||||||||||||||
| 330 | Goldman Sachs Group Inc | 4.125% | N/A (8) | BB+ | 335,424 | |||||||||||||||||||||||||
| 650 | Goldman Sachs Group Inc | 5.300% | N/A (8) | BB+ | 707,688 | |||||||||||||||||||||||||
| 3,375 | Total Capital Markets | 3,644,478 | ||||||||||||||||||||||||||||
| Consumer Finance – 0.6% | ||||||||||||||||||||||||||||||
| 590 | Ally Financial Inc | 4.700% | N/A (8) | BB– | 611,710 | |||||||||||||||||||||||||
| 400 | Ally Financial Inc | 4.700% | N/A (8) | BB– | 412,320 | |||||||||||||||||||||||||
| 1,250 | American Express Co | 3.550% | N/A (8) | BBB– | 1,252,187 | |||||||||||||||||||||||||
| 295 | Capital One Financial Corp | 3.950% | N/A (8) | BB+ | 296,475 | |||||||||||||||||||||||||
| 1,525 | Discover Financial Services | 5.500% | N/A (8) | BB | 1,629,844 | |||||||||||||||||||||||||
| 4,060 | Total Consumer Finance | 4,202,536 | ||||||||||||||||||||||||||||
| Diversified Financial Services – 0.4% | ||||||||||||||||||||||||||||||
| 1,200 | American AgCredit Corp, 144A | 5.250% | N/A (8) | BB+ | 1,221,000 | |||||||||||||||||||||||||
| 1,215 | Voya Financial Inc | 6.125% | N/A (8) | BB+ | 1,262,956 | |||||||||||||||||||||||||
| 2,415 | Total Diversified Financial Services | 2,483,956 | ||||||||||||||||||||||||||||
| Electric Utilities – 0.4% | ||||||||||||||||||||||||||||||
| 310 | American Electric Power Co Inc | 3.875% | 2/15/62 | BBB– | 314,707 | |||||||||||||||||||||||||
| 300 | Edison International | 5.000% | N/A (8) | BB | 306,540 | |||||||||||||||||||||||||
| 1,760 | Emera Inc | 6.750% | 6/15/76 | BB+ | 2,024,000 | |||||||||||||||||||||||||
| 335 | Southern Co | 4.000% | 1/15/51 | BBB– | 342,538 | |||||||||||||||||||||||||
| 2,705 | Total Electric Utilities | 2,987,785 | ||||||||||||||||||||||||||||
| Food Products – 0.4% | ||||||||||||||||||||||||||||||
| 2,250 | Land O’ Lakes Inc, 144A | 8.000% | N/A (8) | BB | 2,435,512 | |||||||||||||||||||||||||
| Independent Power & Renewable Electricity Producers – 0.0% | ||||||||||||||||||||||||||||||
| 185 | Vistra Corp, 144A | 7.000% | N/A (8) | BB– | 187,385 | |||||||||||||||||||||||||
| Industrial Conglomerates – 0.2% | ||||||||||||||||||||||||||||||
| 1,515 | General Electric Co, (3-Month LIBOR reference rate + 3.330% spread), (9) |
| 3.533% | N/A (8) | BBB– | 1,499,850 | ||||||||||||||||||||||||
| Insurance – 1.2% | ||||||||||||||||||||||||||||||
| 250 | American International Group Inc | 5.750% | 4/01/48 | BBB– | 280,625 | |||||||||||||||||||||||||
| 325 | Enstar Finance LLC | 5.750% | 9/01/40 | BB+ | 333,557 | |||||||||||||||||||||||||
| 1,230 | Markel Corp | 6.000% | N/A (8) | BBB– | 1,348,388 | |||||||||||||||||||||||||
| 525 | MetLife Inc, 144A | 9.250% | 4/08/38 | BBB | 777,230 | |||||||||||||||||||||||||
| 1,000 | MetLife Inc | 10.750% | 8/01/39 | BBB | 1,685,822 | |||||||||||||||||||||||||
| 745 | Provident Financing Trust I | 7.405% | 3/15/38 | BB+ | 908,900 | |||||||||||||||||||||||||
| 420 | QBE Insurance Group Ltd, 144A | 5.875% | N/A (8) | BBB | 453,600 | |||||||||||||||||||||||||
| 1,075 | SBL Holdings Inc, 144A | 6.500% | N/A (8) | BB | 1,058,875 | |||||||||||||||||||||||||
| 1,500 | SBL Holdings Inc, 144A | 7.000% | N/A (8) | BB | 1,500,000 | |||||||||||||||||||||||||
| 7,070 | Total Insurance | 8,346,997 | ||||||||||||||||||||||||||||
| Multi-Utilities – 0.2% | ||||||||||||||||||||||||||||||
| 125 | CMS Energy Corp | 4.750% | 6/01/50 | BBB– | 135,938 | |||||||||||||||||||||||||
| 900 | Sempra Energy | 4.875% | N/A (8) | BBB– | 963,702 | |||||||||||||||||||||||||
| 1,025 | Total Multi-Utilities | 1,099,640 | ||||||||||||||||||||||||||||
| Oil, Gas & Consumable Fuels – 0.2% | ||||||||||||||||||||||||||||||
| 265 | Energy Transfer LP | 6.500% | N/A (8) | BB | 269,637 | |||||||||||||||||||||||||
| 270 | MPLX LP | 6.875% | N/A (8) | BB+ | 270,675 | |||||||||||||||||||||||||
32
Principal Amount (000) | Description (1) | Coupon | Maturity | Ratings (4) | Value | |||||||||||||||||||||||||
| Oil, Gas & Consumable Fuels (continued) | ||||||||||||||||||||||||||||||
| $ | 800 | Transcanada Trust | 5.875% | 8/15/76 | BBB– | $ | 874,000 | |||||||||||||||||||||||
| 1,335 | Total Oil, Gas & Consumable Fuels | 1,414,312 | ||||||||||||||||||||||||||||
| Trading Companies & Distributors – 0.1% | ||||||||||||||||||||||||||||||
| 395 | Air Lease Corp | 4.650% | N/A (8) | BB+ | 409,319 | |||||||||||||||||||||||||
| U.S. Agency – 0.1% | ||||||||||||||||||||||||||||||
| 525 | Farm Credit Bank of Texas, 144A | 6.200% | N/A (8) | Baa1 | 564,375 | |||||||||||||||||||||||||
| Wireless Telecommunication Services – 0.1% | ||||||||||||||||||||||||||||||
| 500 | Vodafone Group PLC | 7.000% | 4/04/79 | BB+ | 604,739 | |||||||||||||||||||||||||
| $ | 56,802 | Total $1,000 Par (or similar) Institutional Preferred (cost $58,694,820) |
| 61,290,173 | ||||||||||||||||||||||||||
Principal Amount (000) (10) | Description (1) | Coupon | Maturity | Ratings (4) | Value | |||||||||||||||||||||||||
EMERGING MARKET DEBT AND FOREIGN CORPORATE BONDS – 8.5% (5.9% of Total Investments) |
| |||||||||||||||||||||||||||||
| Angola – 0.2% | ||||||||||||||||||||||||||||||
| $ | 335 | Angolan Government International Bond, 144A | 8.250% | 5/09/28 | B3 | $ | 336,072 | |||||||||||||||||||||||
| 270 | Angolan Government International Bond, 144A |
| 9.375% | 5/08/48 | B3 | 263,812 | ||||||||||||||||||||||||
| 400 | Angolan Government International Bond, Reg S | 8.000% | 11/26/29 | CCC+ | 393,904 | |||||||||||||||||||||||||
Total Angola | 993,788 | |||||||||||||||||||||||||||||
| Argentina – 0.1% | ||||||||||||||||||||||||||||||
| 1,326 | Argentine Republic Government International Bond |
| 1.125% | 7/09/35 | CCC+ | 424,217 | ||||||||||||||||||||||||
| 290 | Argentine Republic Government International Bond |
| 2.500% | 7/09/41 | CCC+ | 102,225 | ||||||||||||||||||||||||
| 76 | YPF SA, 144A | 8.750% | 4/04/24 | Caa2 | 65,437 | |||||||||||||||||||||||||
| 100 | YPF SA, 144A | 8.500% | 3/23/25 | CCC+ | 85,909 | |||||||||||||||||||||||||
| 139 | YPF SA, 144A | 6.950% | 7/21/27 | CCC+ | 91,003 | |||||||||||||||||||||||||
| 50 | YPF SA, Reg S | 8.500% | 7/28/25 | Caa2 | 37,375 | |||||||||||||||||||||||||
| 20 | YPF SA, Reg S |
| 6.950% | 7/21/27 | CCC+ | 13,094 | ||||||||||||||||||||||||
Total Argentina | 819,260 | |||||||||||||||||||||||||||||
| Armenia – 0.1% | ||||||||||||||||||||||||||||||
| 200 | Republic of Armenia International Bond, 144A | 3.600% | 2/02/31 | Ba3 | 186,324 | |||||||||||||||||||||||||
| 455 | Republic of Armenia International Bond, Reg S |
| 7.150% | 3/26/25 | Ba3 | 507,055 | ||||||||||||||||||||||||
| 200 | Republic of Armenia International Bond, Reg S |
| 3.600% | 2/02/31 | N/R | 186,252 | ||||||||||||||||||||||||
Total Armenia | 879,631 | |||||||||||||||||||||||||||||
| Australia – 0.1% | ||||||||||||||||||||||||||||||
| 370 | QBE Insurance Group Ltd, Reg S |
| 6.750% | 12/02/44 | BBB | 409,738 | ||||||||||||||||||||||||
| Azerbaijan – 0.1% | ||||||||||||||||||||||||||||||
| 200 | Southern Gas Corridor CJSC, 144A | 6.875% | 3/24/26 | Ba1 | 229,728 | |||||||||||||||||||||||||
| 585 | Southern Gas Corridor CJSC, Reg S |
| 6.875% | 3/24/26 | Ba1 | 672,047 | ||||||||||||||||||||||||
Total Azerbaijan | 901,775 | |||||||||||||||||||||||||||||
| Benin – 0.1% | ||||||||||||||||||||||||||||||
| 190 | EUR | Benin Government International Bond, 144A |
| 4.950% | 1/22/35 | B+ | 206,057 | |||||||||||||||||||||||
| 100 | EUR | Benin Government International Bond, 144A |
| 6.875% | 1/19/52 | B+ | 113,319 | |||||||||||||||||||||||
Total Benin | 319,376 | |||||||||||||||||||||||||||||
| Bermuda – 0.0% | ||||||||||||||||||||||||||||||
| 200 | Bermuda Government International Bond, 144A |
| 4.750% | 2/15/29 | A+ | 229,500 | ||||||||||||||||||||||||
| Brazil – 0.5% | ||||||||||||||||||||||||||||||
| 200 | B3 SA – Brasil Bolsa Balcao, 144A | 4.125% | 9/20/31 | Ba1 | 192,752 | |||||||||||||||||||||||||
| 200 | Banco BTG Pactual SA/Cayman Islands, 144A | 2.750% | 1/11/26 | Ba2 | 189,752 | |||||||||||||||||||||||||
| 200 | Banco do Brasil SA/Cayman, Reg S | 4.625% | 1/15/25 | BB– | 208,502 | |||||||||||||||||||||||||
| 200 | Braskem Netherlands Finance BV, 144A | 4.500% | 1/31/30 | BBB– | 212,700 | |||||||||||||||||||||||||
| 825 | BRL | Brazil Notas do Tesouro Nacional Serie F | 10.000% | 1/01/25 | BB– | 145,940 | ||||||||||||||||||||||||
| 200 | Brazilian Government International Bond | 3.750% | 9/12/31 | BB– | 188,000 | |||||||||||||||||||||||||
33
| NMAI | Nuveen Multi-Asset Income Fund (continued) | |
| Portfolio of Investments December 31, 2021 | ||
Principal Amount (000) (10) | Description (1) | Coupon | Maturity | Ratings (4) | Value | |||||||||||||||||||||||||
| Brazil (continued) | ||||||||||||||||||||||||||||||
| $ | 210 | Brazilian Government International Bond | 5.000% | 1/27/45 | BB– | $ | 196,770 | |||||||||||||||||||||||
| 200 | Brazilian Government International Bond | 4.750% | 1/14/50 | BB– | 177,702 | |||||||||||||||||||||||||
| 200 | BRF SA, 144A | 4.875% | 1/24/30 | Ba2 | 202,552 | |||||||||||||||||||||||||
| 200 | Centrais Eletricas Brasileiras SA, 144A | 4.625% | 2/04/30 | BB– | 198,002 | |||||||||||||||||||||||||
| 200 | Embraer Netherlands Finance BV, 144A | 6.950% | 1/17/28 | BB+ | 220,800 | |||||||||||||||||||||||||
| 395 | Itau Unibanco Holding SA/Cayman Island, 144A | 2.900% | 1/24/23 | BB– | 399,147 | |||||||||||||||||||||||||
| 200 | JSM Global Sarl, 144A | 4.750% | 10/20/30 | BB | 184,252 | |||||||||||||||||||||||||
| 200 | MARB BondCo PLC, 144A | 3.950% | 1/29/31 | BB | 191,002 | |||||||||||||||||||||||||
| 145 | Petrobras Global Finance BV | 6.750% | 6/03/50 | BB– | 151,706 | |||||||||||||||||||||||||
| 115 | Petrobras Global Finance BV | 5.500% | 6/10/51 | BB– | 106,663 | |||||||||||||||||||||||||
| 200 | Suzano Austria GmbH | 2.500% | 9/15/28 | BBB– | 193,000 | |||||||||||||||||||||||||
| 70 | Vale Overseas Ltd |
| 3.750% | 7/08/30 | BBB– | 72,451 | ||||||||||||||||||||||||
Total Brazil | 3,431,693 | |||||||||||||||||||||||||||||
| Cameroon – 0.0% | ||||||||||||||||||||||||||||||
| 100 | EUR | Republic of Cameroon International Bond, 144A |
| 5.950% | 7/07/32 | B | 106,242 | |||||||||||||||||||||||
| Canada – 0.2% | ||||||||||||||||||||||||||||||
| 550 | Enbridge Inc | 5.750% | 7/15/80 | BBB– | 610,500 | |||||||||||||||||||||||||
| 750 | GFL Environmental Inc, 144A |
| 5.125% | 12/15/26 | BB– | 780,000 | ||||||||||||||||||||||||
Total Canada | 1,390,500 | |||||||||||||||||||||||||||||
| Chile – 0.3% | ||||||||||||||||||||||||||||||
| 200 | Alfa Desarrollo SpA, 144A |
| 4.550% | 9/27/51 | BBB– | 197,400 | ||||||||||||||||||||||||
| 200 | Banco del Estado de Chile, 144A | 2.704% | 1/09/25 | A+ | 204,002 | |||||||||||||||||||||||||
| 205 | Celulosa Arauco y Constitucion SA, 144A | 5.150% | 1/29/50 | BBB– | 233,392 | |||||||||||||||||||||||||
| 200 | Corp Nacional del Cobre de Chile, 144A | 3.000% | 9/30/29 | A– | 202,195 | |||||||||||||||||||||||||
| 150 | Empresa Nacional de Telecomunicaciones SA, 144A |
| 3.050% | 9/14/32 | BBB– | 147,377 | ||||||||||||||||||||||||
| 315 | Empresa Nacional del Petroleo, Reg S | 3.750% | 8/05/26 | BBB– | 323,269 | |||||||||||||||||||||||||
| 205 | Interchile SA, 144A | 4.500% | 6/30/56 | Baa1 | 217,812 | |||||||||||||||||||||||||
| 160 | VTR Comunicaciones SpA, 144A |
| 5.125% | 1/15/28 | BB– | 163,200 | ||||||||||||||||||||||||
Total Chile | 1,688,647 | |||||||||||||||||||||||||||||
| China – 0.1% | ||||||||||||||||||||||||||||||
| 200 | Agile Group Holdings Ltd, Reg S |
| 5.500% | 5/17/26 | B+ | 117,000 | ||||||||||||||||||||||||
| 200 | Country Garden Holdings Co Ltd, Reg S |
| 5.625% | 1/14/30 | Baa3 | 186,554 | ||||||||||||||||||||||||
| 200 | ENN Clean Energy International Investment Ltd, 144A |
| 3.375% | 5/12/26 | Baa3 | 198,826 | ||||||||||||||||||||||||
| 200 | Lenovo Group Ltd, 144A |
| 3.421% | 11/02/30 | BBB– | 201,604 | ||||||||||||||||||||||||
| 200 | Tencent Holdings Ltd, 144A |
| 2.390% | 6/03/30 | A+ | 195,950 | ||||||||||||||||||||||||
Total China |
| 899,934 | ||||||||||||||||||||||||||||
| Colombia – 0.5% | ||||||||||||||||||||||||||||||
| 320 | Bancolombia SA |
| 3.000% | 1/29/25 | Baa2 | 321,198 | ||||||||||||||||||||||||
| 270 | Colombia Government International Bond |
| 3.000% | 1/30/30 | BB+ | 246,780 | ||||||||||||||||||||||||
| 550 | Colombia Government International Bond |
| 3.125% | 4/15/31 | BB+ | 493,130 | ||||||||||||||||||||||||
| 205 | Colombia Government International Bond |
| 3.250% | 4/22/32 | BB+ | 184,244 | ||||||||||||||||||||||||
| 200 | Colombia Government International Bond |
| 5.625% | 2/26/44 | BB+ | 193,624 | ||||||||||||||||||||||||
| 600 | Colombia Government International Bond |
| 5.000% | 6/15/45 | BB+ | 541,500 | ||||||||||||||||||||||||
| 120 | Ecopetrol SA |
| 5.375% | 6/26/26 | BB+ | 126,451 | ||||||||||||||||||||||||
| 200 | Ecopetrol SA |
| 4.625% | 11/02/31 | BB+ | 194,440 | ||||||||||||||||||||||||
| 200 | Ecopetrol SA |
| 5.875% | 11/02/51 | BB+ | 187,388 | ||||||||||||||||||||||||
| 200 | Empresas Publicas de Medellin ESP, 144A |
| 4.250% | 7/18/29 | Baa3 | 189,702 | ||||||||||||||||||||||||
| 200 | Grupo Aval Ltd, 144A |
| 4.375% | 2/04/30 | Ba1 | 191,750 | ||||||||||||||||||||||||
| 180 | Millicom International Cellular SA, 144A |
| 6.250% | 3/25/29 | Ba1 | 195,696 | ||||||||||||||||||||||||
Total Colombia |
| 3,065,903 | ||||||||||||||||||||||||||||
| Costa Rica – 0.1% | ||||||||||||||||||||||||||||||
| 435 | Costa Rica Government International Bond, 144A |
| 6.125% | 2/19/31 | B | 438,806 | ||||||||||||||||||||||||
| 200 | Costa Rica Government International Bond, Reg S |
| 7.000% | 4/04/44 | B | 195,750 | ||||||||||||||||||||||||
| 200 | Instituto Costarricense de Electricidad, 144A |
| 6.750% | 10/07/31 | B1 | 202,000 | ||||||||||||||||||||||||
Total Costa Rica |
| 836,556 | ||||||||||||||||||||||||||||
34
Principal Amount (000) (10) | Description (1) | Coupon | Maturity | Ratings (4) | Value | |||||||||||||||||||||||||
| Cote d’Ivoire – 0.1% | ||||||||||||||||||||||||||||||
| $ | 395 | Ivory Coast Government International Bond, Reg S |
| 6.125% | 6/15/33 | BB– | $ | 415,935 | ||||||||||||||||||||||
| 270 | EUR | Ivory Coast Government International Bond, Reg S |
| 6.875% | 10/17/40 | BB– | 320,188 | |||||||||||||||||||||||
Total Cote d’Ivoire |
| 736,123 | ||||||||||||||||||||||||||||
| Dominican Republic – 0.2% | ||||||||||||||||||||||||||||||
| 150 | Dominican Republic International Bond, 144A |
| 4.875% | 9/23/32 | BB– | 152,438 | ||||||||||||||||||||||||
| 250 | Dominican Republic International Bond, 144A |
| 6.400% | 6/05/49 | BB– | 262,503 | ||||||||||||||||||||||||
| 105 | Dominican Republic International Bond, Reg S |
| 5.500% | 1/27/25 | BB– | 113,506 | ||||||||||||||||||||||||
| 470 | Dominican Republic International Bond, Reg S |
| 4.875% | 9/23/32 | BB– | 477,637 | ||||||||||||||||||||||||
| 425 | Dominican Republic International Bond, Reg S |
| 7.450% | 4/30/44 | BB– | 502,562 | ||||||||||||||||||||||||
Total Dominican Republic |
| 1,508,646 | ||||||||||||||||||||||||||||
| Ecuador – 0.2% | ||||||||||||||||||||||||||||||
| 119 | Ecuador Government International Bond, 144A |
| 0.000% | 7/31/30 | B– | 66,849 | ||||||||||||||||||||||||
| 823 | Ecuador Government International Bond, 144A |
| 1.000% | 7/31/35 | B– | 539,774 | ||||||||||||||||||||||||
| 467 | Ecuador Government International Bond, 144A |
| 0.500% | 7/31/40 | B– | 273,319 | ||||||||||||||||||||||||
| 137 | Ecuador Government International Bond, Reg S |
| 1.000% | 7/31/35 | N/R | 89,907 | ||||||||||||||||||||||||
Total Ecuador |
| 969,849 | ||||||||||||||||||||||||||||
| Egypt – 0.1% | ||||||||||||||||||||||||||||||
| 200 | Egypt Government International Bond, 144A |
| 3.875% | 2/16/26 | B | 186,920 | ||||||||||||||||||||||||
| 220 | Egypt Government International Bond, 144A |
| 7.300% | 9/30/33 | B+ | 202,409 | ||||||||||||||||||||||||
| 205 | Egypt Government International Bond, 144A |
| 8.875% | 5/29/50 | B+ | 185,808 | ||||||||||||||||||||||||
| 300 | Egypt Government International Bond, Reg S |
| 7.903% | 2/21/48 | B+ | 250,920 | ||||||||||||||||||||||||
Total Egypt |
| 826,057 | ||||||||||||||||||||||||||||
| El Salvador – 0.0% | ||||||||||||||||||||||||||||||
| 190 | El Salvador Government International Bond, 144A |
| 7.125% | 1/20/50 | B– | 104,025 | ||||||||||||||||||||||||
| 40 | El Salvador Government International Bond, Reg S |
| 5.875% | 1/30/25 | B– | 25,201 | ||||||||||||||||||||||||
| 135 | El Salvador Government International Bond, Reg S |
| 6.375% | 1/18/27 | B– | 81,676 | ||||||||||||||||||||||||
| 65 | El Salvador Government International Bond, Reg S |
| 7.650% | 6/15/35 | B– | 36,644 | ||||||||||||||||||||||||
Total El Salvador |
| 247,546 | ||||||||||||||||||||||||||||
| Ghana – 0.1% | ||||||||||||||||||||||||||||||
| 235 | Ghana Government International Bond, 144A |
| 7.750% | 4/07/29 | B– | 196,435 | ||||||||||||||||||||||||
| 250 | Ghana Government International Bond, 144A | 8.627% | 6/16/49 | B– | 197,688 | |||||||||||||||||||||||||
| 355 | Ghana Government International Bond, Reg S |
| 7.625% | 5/16/29 | B– | 295,253 | ||||||||||||||||||||||||
| 200 | Tullow Oil PLC, 144A | 10.250% | 5/15/26 | B | 202,078 | |||||||||||||||||||||||||
Total Ghana | 891,454 | |||||||||||||||||||||||||||||
| Guatemala – 0.1% | ||||||||||||||||||||||||||||||
| 200 | Guatemala Government Bond, 144A | 3.700% | 10/07/33 | BB– | 197,250 | |||||||||||||||||||||||||
| 200 | Guatemala Government Bond, 144A | 6.125% | 6/01/50 | BB– | 229,002 | |||||||||||||||||||||||||
| 200 | Investment Energy Resources Ltd, 144A | 6.250% | 4/26/29 | BB– | 214,752 | |||||||||||||||||||||||||
Total Guatemala | 641,004 | |||||||||||||||||||||||||||||
| Honduras – 0.0% | ||||||||||||||||||||||||||||||
| 200 | Honduras Government International Bond, Reg S | 7.500% | 3/15/24 | BB– | 211,502 | |||||||||||||||||||||||||
| Hong Kong – 0.0% | ||||||||||||||||||||||||||||||
| 200 | AIA Group Ltd, 144A | 3.200% | 9/16/40 | A | 205,421 | |||||||||||||||||||||||||
| Hungary – 0.0% | ||||||||||||||||||||||||||||||
| 200 | Hungary Government International Bond, 144A | 2.125% | 9/22/31 | BBB | 196,770 | |||||||||||||||||||||||||
| India – 0.2% | ||||||||||||||||||||||||||||||
| 200 | Adani Ports & Special Economic Zone Ltd, 144A | 3.100% | 2/02/31 | BBB– | 190,368 | |||||||||||||||||||||||||
| 200 | Export-Import Bank of India, 144A | 2.250% | 1/13/31 | BBB– | 187,994 | |||||||||||||||||||||||||
| 200 | Network i2i Ltd, 144A | 3.975% | 6/03/70 | BB | 200,500 | |||||||||||||||||||||||||
| 200 | Power Finance Corp Ltd, 144A | 3.950% | 4/23/30 | Baa3 | 206,653 | |||||||||||||||||||||||||
35
| NMAI | Nuveen Multi-Asset Income Fund (continued) | |
| Portfolio of Investments December 31, 2021 | ||
Principal Amount (000) (10) | Description (1) | Coupon | Maturity | Ratings (4) | Value | |||||||||||||||||||||||||
| India (continued) | ||||||||||||||||||||||||||||||
| $ | 200 | ReNew Wind Energy AP2 / ReNew Power Pvt Ltd other 9 Subsidiaries, 144A | 4.500% | 7/14/28 | Ba3 | $ | 200,602 | |||||||||||||||||||||||
| 200 | UltraTech Cement Ltd, 144A | 2.800% | 2/16/31 | Baa3 | 193,096 | |||||||||||||||||||||||||
Total India | 1,179,213 | |||||||||||||||||||||||||||||
| Indonesia – 0.2% | ||||||||||||||||||||||||||||||
| 200 | Medco Platinum Road Pte Ltd, 144A | 6.750% | 1/30/25 | B+ | 203,870 | |||||||||||||||||||||||||
| 500 | Pertamina Persero PT, 144A | 2.300% | 2/09/31 | Baa2 | 476,841 | |||||||||||||||||||||||||
| 335 | Perusahaan Perseroan Persero PT Perusahaan Listrik Negara, Reg S | 3.875% | 7/17/29 | BBB | 354,306 | |||||||||||||||||||||||||
| 200 | Perusahaan Perseroan Persero PT Perusahaan Listrik Negara, Reg S | 5.250% | 5/15/47 | Baa2 | 223,304 | |||||||||||||||||||||||||
| 200 | Saka Energi Indonesia PT, 144A | 4.450% | 5/05/24 | B1 | 194,086 | |||||||||||||||||||||||||
Total Indonesia | 1,452,407 | |||||||||||||||||||||||||||||
| Iraq – 0.1% | ||||||||||||||||||||||||||||||
| 325 | Iraq International Bond, 144A | 5.800% | 1/15/28 | N/R | 310,440 | |||||||||||||||||||||||||
| Israel – 0.3% | ||||||||||||||||||||||||||||||
| 85 | Energean Israel Finance Ltd, 144A, Reg S | 4.500% | 3/30/24 | BB– | 85,595 | |||||||||||||||||||||||||
| 80 | Energean Israel Finance Ltd, 144A, Reg S | 4.875% | 3/30/26 | BB– | 79,307 | |||||||||||||||||||||||||
| 295 | Israel Electric Corp Ltd, 144A, Reg S | 5.000% | 11/12/24 | BBB+ | 320,040 | |||||||||||||||||||||||||
| 807 | Israel Electric Corp Ltd, 144A, Reg S | 4.250% | 8/14/28 | BBB+ | 886,005 | |||||||||||||||||||||||||
| 32 | Leviathan Bond Ltd, 144A, Reg S | 6.125% | 6/30/25 | BB– | 33,771 | |||||||||||||||||||||||||
| 127 | Leviathan Bond Ltd, 144A, Reg S | 6.500% | 6/30/27 | BB– | 136,032 | |||||||||||||||||||||||||
| 75 | Leviathan Bond Ltd, 144A, Reg S | 6.750% | 6/30/30 | BB– | 80,482 | |||||||||||||||||||||||||
| 175 | EUR | Teva Pharmaceutical Finance Netherlands II BV | 4.375% | 5/09/30 | BB | 196,287 | ||||||||||||||||||||||||
Total Israel | 1,817,519 | |||||||||||||||||||||||||||||
| Jamaica – 0.1% | ||||||||||||||||||||||||||||||
| 215 | Jamaica Government International Bond | 8.000% | 3/15/39 | B | 297,506 | |||||||||||||||||||||||||
| 215 | Jamaica Government International Bond | 7.875% | 7/28/45 | B | 297,507 | |||||||||||||||||||||||||
Total Jamaica | 595,013 | |||||||||||||||||||||||||||||
| Jordan – 0.1% | ||||||||||||||||||||||||||||||
| 200 | Jordan Government International Bond, 144A | 7.375% | 10/10/47 | B+ | 201,870 | |||||||||||||||||||||||||
| 225 | Jordan Government International Bond, Reg S | 7.375% | 10/10/47 | B+ | 227,250 | |||||||||||||||||||||||||
Total Jordan | 429,120 | |||||||||||||||||||||||||||||
| Kazakhstan – 0.1% | ||||||||||||||||||||||||||||||
| 200 | KazMunayGas National Co JSC, 144A | 5.375% | 4/24/30 | Baa2 | 233,100 | |||||||||||||||||||||||||
| 200 | KazMunayGas National Co JSC, 144A | 3.500% | 4/14/33 | Baa2 | 207,187 | |||||||||||||||||||||||||
| 200 | KazMunayGas National Co JSC, Reg S | 6.375% | 10/24/48 | Baa2 | 262,401 | |||||||||||||||||||||||||
Total Kazakhstan | 702,688 | |||||||||||||||||||||||||||||
| Macau – 0.0% | ||||||||||||||||||||||||||||||
| 200 | Sands China Ltd | 5.125% | 8/08/25 | BBB– | 209,812 | |||||||||||||||||||||||||
| Malaysia – 0.1% | ||||||||||||||||||||||||||||||
| 200 | Petronas Capital Ltd, 144A | 3.500% | 4/21/30 | A | 216,129 | |||||||||||||||||||||||||
| 205 | Petronas Capital Ltd, 144A | 3.404% | 4/28/61 | A | 209,920 | |||||||||||||||||||||||||
Total Malaysia | 426,049 | |||||||||||||||||||||||||||||
| Mexico – 0.6% | ||||||||||||||||||||||||||||||
| 200 | Banco Nacional de Comercio Exterior SNC/Cayman Islands, 144A |
| 2.720% | 8/11/31 | Baa3 | 197,502 | ||||||||||||||||||||||||
| 200 | Braskem Idesa SAPI, 144A | 6.990% | 2/20/32 | B+ | 200,752 | |||||||||||||||||||||||||
| 200 | Cemex SAB de CV, 144A | 3.875% | 7/11/31 | BB | 199,266 | |||||||||||||||||||||||||
| 230 | Comision Federal de Electricidad, 144A | 3.348% | 2/09/31 | BBB | 225,105 | |||||||||||||||||||||||||
| 200 | Electricidad Firme de Mexico Holdings SA de CV, 144A | 4.900% | 11/20/26 | Ba2 | 198,252 | |||||||||||||||||||||||||
| 200 | Grupo Axo SAPI de CV, 144A | 5.750% | 6/08/26 | Ba2 | 200,750 | |||||||||||||||||||||||||
| 3,800 | MXN | Mexican Bonos | 7.500% | 6/03/27 | BBB+ | 186,076 | ||||||||||||||||||||||||
| 3,600 | MXN | Mexican Bonos | 8.500% | 11/18/38 | BBB+ | 185,006 | ||||||||||||||||||||||||
36
Principal Amount (000) (10) | Description (1) | Coupon | Maturity | Ratings (4) | Value | |||||||||||||||||||||||||
| Mexico (continued) | ||||||||||||||||||||||||||||||
| $ | 225 | Mexico City Airport Trust, Reg S | 4.250% | 10/31/26 | BBB– | $ | 238,219 | |||||||||||||||||||||||
| 440 | Mexico Government International Bond | 4.280% | 8/14/41 | BBB | 455,950 | |||||||||||||||||||||||||
| 25 | Petroleos Mexicanos | 6.500% | 1/23/29 | BB– | 25,937 | |||||||||||||||||||||||||
| 545 | Petroleos Mexicanos | 7.000% | 1/23/30 | BB– | 563,841 | |||||||||||||||||||||||||
| 245 | Petroleos Mexicanos | 5.950% | 1/28/31 | BB– | 238,073 | |||||||||||||||||||||||||
| 140 | Petroleos Mexicanos | 6.375% | 1/23/45 | BB– | 121,590 | |||||||||||||||||||||||||
| 712 | Petroleos Mexicanos | 6.750% | 9/21/47 | BB– | 631,900 | |||||||||||||||||||||||||
| 355 | Petroleos Mexicanos | 7.690% | 1/23/50 | BB– | 342,575 | |||||||||||||||||||||||||
Total Mexico | 4,210,794 | |||||||||||||||||||||||||||||
| Morocco – 0.1% | ||||||||||||||||||||||||||||||
| 200 | OCP SA, 144A | 3.750% | 6/23/31 | BB+ | 194,080 | |||||||||||||||||||||||||
| 200 | OCP SA, 144A | 5.125% | 6/23/51 | BB+ | 188,643 | |||||||||||||||||||||||||
Total Morocco | 382,723 | |||||||||||||||||||||||||||||
| Netherlands – 0.1% | ||||||||||||||||||||||||||||||
| 200 | VEON Holdings BV, Reg S | 4.000% | 4/09/25 | BBB– | 203,526 | |||||||||||||||||||||||||
| 200 | VEON Holdings BV, Reg S | 3.375% | 11/25/27 | BBB– | 195,216 | |||||||||||||||||||||||||
Total Netherlands | 398,742 | |||||||||||||||||||||||||||||
| Nigeria – 0.1% | ||||||||||||||||||||||||||||||
| 200 | �� | Access Bank PLC, 144A | 6.125% | 9/21/26 | B2 | 199,000 | ||||||||||||||||||||||||
| 200 | Nigeria Government International Bond, Reg S | 7.625% | 11/28/47 | B | 178,664 | |||||||||||||||||||||||||
Total Nigeria | 377,664 | |||||||||||||||||||||||||||||
| Oman – 0.2% | ||||||||||||||||||||||||||||||
| 200 | Oman Government International Bond, 144A | 6.250% | 1/25/31 | Ba3 | 218,466 | |||||||||||||||||||||||||
| 305 | Oman Government International Bond, 144A | 6.750% | 1/17/48 | Ba3 | 309,910 | |||||||||||||||||||||||||
| 385 | Oman Government International Bond, Reg S | 5.625% | 1/17/28 | Ba3 | 408,100 | |||||||||||||||||||||||||
| 400 | Oman Government International Bond, Reg S | 6.750% | 1/17/48 | Ba3 | 406,440 | |||||||||||||||||||||||||
| 200 | OQ SAOC, 144A | 5.125% | 5/06/28 | Ba3 | 203,260 | |||||||||||||||||||||||||
Total Oman | 1,546,176 | |||||||||||||||||||||||||||||
| Pakistan – 0.1% | ||||||||||||||||||||||||||||||
| 200 | Pakistan Government International Bond, 144A | 6.000% | 4/08/26 | B3 | 199,660 | |||||||||||||||||||||||||
| 515 | Pakistan Government International Bond, Reg S | 6.875% | 12/05/27 | B– | 518,863 | |||||||||||||||||||||||||
| 200 | Pakistan Water & Power Development Authority, Reg S | 7.500% | 6/04/31 | B– | 193,500 | |||||||||||||||||||||||||
Total Pakistan | 912,023 | |||||||||||||||||||||||||||||
| Panama – 0.2% | ||||||||||||||||||||||||||||||
| 200 | Aeropuerto Internacional de Tocumen SA, 144A | 5.125% | 8/11/61 | BBB | 209,252 | |||||||||||||||||||||||||
| 200 | C&W Senior Financing DAC, 144A | 6.875% | 9/15/27 | B+ | 208,000 | |||||||||||||||||||||||||
| 200 | Empresa de Transmision Electrica SA, 144A | 5.125% | 5/02/49 | Baa2 | 220,752 | |||||||||||||||||||||||||
| 190 | Panama Bonos del Tesoro | 3.362% | 6/30/31 | BBB | 190,950 | |||||||||||||||||||||||||
| 330 | Panama Notas del Tesoro | 3.750% | 4/17/26 | BBB | 350,163 | |||||||||||||||||||||||||
Total Panama | 1,179,117 | |||||||||||||||||||||||||||||
| Paraguay – 0.2% | ||||||||||||||||||||||||||||||
| 295 | Paraguay Government International Bond, Reg S | 4.625% | 1/25/23 | BB+ | 304,590 | |||||||||||||||||||||||||
| 640 | Paraguay Government International Bond, Reg S | 5.000% | 4/15/26 | BB+ | 709,600 | |||||||||||||||||||||||||
Total Paraguay | 1,014,190 | |||||||||||||||||||||||||||||
| Peru – 0.2% | ||||||||||||||||||||||||||||||
| 120 | Banco de Credito del Peru, 144A | 3.125% | 7/01/30 | BBB | 118,501 | |||||||||||||||||||||||||
| 65 | Banco de Credito del Peru, 144A | 3.250% | 9/30/31 | BBB | 64,188 | |||||||||||||||||||||||||
| 200 | Kallpa Generacion SA, Reg S | 4.875% | 5/24/26 | Baa3 | 211,750 | |||||||||||||||||||||||||
| 125 | Peruvian Government International Bond | 4.125% | 8/25/27 | BBB+ | 137,345 | |||||||||||||||||||||||||
| 670 | Peruvian Government International Bond | 2.783% | 1/23/31 | BBB+ | 666,657 | |||||||||||||||||||||||||
| 200 | Volcan Cia Minera SAA, 144A | 4.375% | 2/11/26 | Ba2 | 192,750 | |||||||||||||||||||||||||
Total Peru |
| 1,391,191 | ||||||||||||||||||||||||||||
37
| NMAI | Nuveen Multi-Asset Income Fund (continued) | |
| Portfolio of Investments December 31, 2021 | ||
Principal Amount (000) (10) | Description (1) | Coupon | Maturity | Ratings (4) | Value | |||||||||||||||||||||||||
| Qatar – 0.5% | ||||||||||||||||||||||||||||||
| $ | 200 | Ooredoo International Finance Ltd, 144A | 2.625% | 4/08/31 | A– | $ | 200,750 | |||||||||||||||||||||||
| 200 | Qatar Energy, 144A | 1.375% | 9/12/26 | AA– | 196,028 | |||||||||||||||||||||||||
| 200 | Qatar Energy, 144A | 2.250% | 7/12/31 | AA– | 198,113 | |||||||||||||||||||||||||
| 710 | Qatar Energy, 144A | 3.300% | 7/12/51 | AA– | 730,851 | |||||||||||||||||||||||||
| 1,079 | Qatar Government International Bond, Reg S | 3.750% | 4/16/30 | AA– | 1,209,883 | |||||||||||||||||||||||||
| 405 | Qatar Government International Bond, Reg S | 4.400% | 4/16/50 | AA– | 502,836 | |||||||||||||||||||||||||
| 200 | QNB Finance Ltd, Reg S | 3.500% | 3/28/24 | A+ | 209,480 | |||||||||||||||||||||||||
| 200 | QNB Finance Ltd, Reg S | 2.625% | 5/12/25 | A+ | 205,250 | |||||||||||||||||||||||||
Total Qatar |
| 3,453,191 | ||||||||||||||||||||||||||||
| Russia – 0.3% | ||||||||||||||||||||||||||||||
| 200 | Lukoil Capital DAC, 144A | 3.600% | 10/26/31 | Baa1 | 194,524 | |||||||||||||||||||||||||
| 9,050 | RUB | Russian Federal Bond-OFZ | 7.100% | 10/16/24 | N/R | 117,375 | ||||||||||||||||||||||||
| 9,125 | RUB | Russian Federal Bond-OFZ | 7.650% | 4/10/30 | Baa2 | 117,282 | ||||||||||||||||||||||||
| 400 | Russian Foreign Bond-Eurobond | 5.100% | 3/28/35 | Baa2 | 471,760 | |||||||||||||||||||||||||
| 400 | Russian Foreign Bond-Eurobond, Reg S | 4.750% | 5/27/26 | Baa2 | 436,799 | |||||||||||||||||||||||||
| 400 | Russian Foreign Bond-Eurobond, Reg S | 5.250% | 6/23/47 | Baa2 | 506,016 | |||||||||||||||||||||||||
Total Russia |
| 1,843,756 | ||||||||||||||||||||||||||||
| Rwanda – 0.1% | ||||||||||||||||||||||||||||||
| 300 | Rwanda International Government Bond, 144A | 5.500% | 8/09/31 | B+ | 302,220 | |||||||||||||||||||||||||
| Saudi Arabia – 0.2% | ||||||||||||||||||||||||||||||
| 200 | Saudi Arabian Oil Co, Reg S | 2.875% | 4/16/24 | A2 | 206,374 | |||||||||||||||||||||||||
| 595 | Saudi Arabian Oil Co, Reg S | 4.250% | 4/16/39 | A2 | 670,658 | |||||||||||||||||||||||||
| 200 | Saudi Government International Bond, Reg S | 2.500% | 2/03/27 | A1 | 206,057 | |||||||||||||||||||||||||
| 385 | Saudi Government International Bond, Reg S | 3.750% | 1/21/55 | A1 | 412,574 | |||||||||||||||||||||||||
Total Saudi Arabia |
| 1,495,663 | ||||||||||||||||||||||||||||
| Senegal – 0.1% | ||||||||||||||||||||||||||||||
| 100 | EUR | Senegal Government International Bond, 144A | 5.375% | 6/08/37 | BB– | 107,646 | ||||||||||||||||||||||||
| 200 | Senegal Government International Bond, 144A | 6.750% | 3/13/48 | BB– | 195,860 | |||||||||||||||||||||||||
| 215 | Senegal Government International Bond, Reg S | 6.750% | 3/13/48 | BB– | 210,506 | |||||||||||||||||||||||||
Total Senegal |
| 514,012 | ||||||||||||||||||||||||||||
| Singapore – 0.1% | ||||||||||||||||||||||||||||||
| 200 | BOC Aviation USA Corp, 144A | 1.625% | 4/29/24 | A– | 199,698 | |||||||||||||||||||||||||
| 690 | Temasek Financial I Ltd, 144A | 2.500% | 10/06/70 | AAA | 641,977 | |||||||||||||||||||||||||
Total Singapore |
| 841,675 | ||||||||||||||||||||||||||||
| South Africa – 0.1% | ||||||||||||||||||||||||||||||
| 500 | Eskom Holdings SOC Ltd, 144A | 6.750% | 8/06/23 | CCC+ | 512,961 | |||||||||||||||||||||||||
| 3,075 | ZAR | Republic of South Africa Government Bond | 7.000% | 2/28/31 | BB | 162,019 | ||||||||||||||||||||||||
| 2,875 | ZAR | Republic of South Africa Government Bond | 8.875% | 2/28/35 | BB | 161,788 | ||||||||||||||||||||||||
Total South Africa |
| 836,768 | ||||||||||||||||||||||||||||
| Sri Lanka – 0.1% | ||||||||||||||||||||||||||||||
| 335 | Sri Lanka Government International Bond, 144A | 6.200% | 5/11/27 | CCC | 168,458 | |||||||||||||||||||||||||
| 415 | Sri Lanka Government International Bond, Reg S | 6.850% | 11/03/25 | CCC | 212,762 | |||||||||||||||||||||||||
| 230 | Sri Lanka Government International Bond, Reg S | 6.200% | 5/11/27 | CCC | 115,658 | |||||||||||||||||||||||||
Total Sri Lanka |
| 496,878 | ||||||||||||||||||||||||||||
| Tanzania, United Republic Of – 0.0% | ||||||||||||||||||||||||||||||
| 200 | AngloGold Ashanti Holdings PLC | 3.375% | 11/01/28 | BBB– | 197,998 | |||||||||||||||||||||||||
| Thailand – 0.0% | ||||||||||||||||||||||||||||||
| 200 | Bangkok Bank PCL/Hong Kong, 144A | 3.466% | 9/23/36 | Baa3 | 200,073 | |||||||||||||||||||||||||
| Turkey – 0.2% | ||||||||||||||||||||||||||||||
| 200 | Arcelik AS, 144A | 5.000% | 4/03/23 | BB+ | 200,000 | |||||||||||||||||||||||||
| 200 | KOC Holding AS, 144A | 6.500% | 3/11/25 | BB– | 201,920 | |||||||||||||||||||||||||
38
Principal Amount (000) (10) | Description (1) | Coupon | Maturity | Ratings (4) | Value | |||||||||||||||||||||||||
| Turkey (continued) | ||||||||||||||||||||||||||||||
| $ | 215 | Turkey Government International Bond | 3.250% | 3/23/23 | Ba3 | $ | 208,772 | |||||||||||||||||||||||
| 245 | Turkey Government International Bond | 5.125% | 2/17/28 | Ba3 | 219,216 | |||||||||||||||||||||||||
| 575 | Turkey Government International Bond | 5.750% | 5/11/47 | Ba3 | 464,313 | |||||||||||||||||||||||||
| 200 | Turkiye Ihracat Kredi Bankasi AS, 144A | 6.125% | 5/03/24 | B1 | 195,476 | |||||||||||||||||||||||||
Total Turkey | 1,489,697 | |||||||||||||||||||||||||||||
| Ukraine – 0.3% | ||||||||||||||||||||||||||||||
| 425 | Ukraine Government International Bond, 144A | 6.876% | 5/21/29 | B | 375,466 | |||||||||||||||||||||||||
| 323 | Ukraine Government International Bond, 144A | 7.375% | 9/25/32 | B | 287,554 | |||||||||||||||||||||||||
| 985 | Ukraine Government International Bond, 144A | 7.253% | 3/15/33 | B | 866,800 | |||||||||||||||||||||||||
| 115 | Ukraine Government International Bond, Reg S | 7.750% | 9/01/22 | B | 113,795 | |||||||||||||||||||||||||
| 100 | Ukraine Government International Bond, Reg S | 7.750% | 9/01/26 | B | 95,202 | |||||||||||||||||||||||||
| 255 | Ukraine Government International Bond, Reg S | 7.375% | 9/25/32 | B | 227,016 | |||||||||||||||||||||||||
Total Ukraine | 1,965,833 | |||||||||||||||||||||||||||||
| United Arab Emirates – 0.3% | ||||||||||||||||||||||||||||||
| 270 | Abu Dhabi Government International Bond, 144A | 3.125% | 4/16/30 | AA | 292,342 | |||||||||||||||||||||||||
| 410 | Abu Dhabi Government International Bond, 144A | 3.125% | 9/30/49 | AA | 418,374 | |||||||||||||||||||||||||
| 500 | DAE Funding LLC, 144A | 3.375% | 3/20/28 | Baa3 | 505,000 | |||||||||||||||||||||||||
| 400 | Emirate of Dubai Government International Bonds, Reg S | 3.900% | 9/09/50 | N/R | 382,500 | |||||||||||||||||||||||||
| 435 | Galaxy Pipeline Assets Bidco Ltd, 144A | 2.625% | 3/31/36 | Aa2 | 424,992 | |||||||||||||||||||||||||
| 240 | Galaxy Pipeline Assets Bidco Ltd, 144A | 2.940% | 9/30/40 | Aa2 | 238,852 | |||||||||||||||||||||||||
Total United Arab Emirates | 2,262,060 | |||||||||||||||||||||||||||||
| Uzbekistan – 0.0% | ||||||||||||||||||||||||||||||
| 200 | Republic of Uzbekistan International Bond, Reg S | 4.750% | 2/20/24 | BB– | 207,919 | |||||||||||||||||||||||||
Total Emerging Market Debt and Foreign Corporate Bonds (cost $58,170,978) |
| 57,049,539 | ||||||||||||||||||||||||||||
| Principal Amount (000) | Description (1) | Coupon | Maturity | Ratings (4) | Value | |||||||||||||||||||||||||
CONTINGENT CAPITAL SECURITIES – 7.1% (5.0% of Total Investments) (11) |
| |||||||||||||||||||||||||||||
| Banks – 5.4% | ||||||||||||||||||||||||||||||
| $ | 200 | Absa Group Ltd, Reg S | 6.375% | N/A (8) | B2 | $ | 203,332 | |||||||||||||||||||||||
| 240 | Australia & New Zealand Banking Group Ltd/United Kingdom, 144A |
| 6.750% | N/A (8) | BBB | 272,700 | ||||||||||||||||||||||||
| 600 | Banco Bilbao Vizcaya Argentaria SA | 6.125% | N/A (8) | Ba2 | 633,750 | |||||||||||||||||||||||||
| 800 | Banco Bilbao Vizcaya Argentaria SA | 6.500% | N/A (8) | Ba2 | 849,000 | |||||||||||||||||||||||||
| 500 | Banco Mercantil del Norte SA/Grand Cayman, 144A | 7.625% | N/A (8) | BB | 536,747 | |||||||||||||||||||||||||
| 800 | Banco Santander SA, Reg S | 7.500% | N/A (8) | Ba1 | 860,000 | |||||||||||||||||||||||||
| 800 | Banco Santander SA | 4.750% | N/A (8) | Ba1 | 799,432 | |||||||||||||||||||||||||
| 200 | Bank Hapoalim BM, 144A, Reg S | 3.255% | 1/21/32 | BBB | 198,400 | |||||||||||||||||||||||||
| 1,475 | Barclays PLC | 8.000% | N/A (8) | BB | 1,630,288 | |||||||||||||||||||||||||
| 1,265 | Barclays PLC | 7.750% | N/A (8) | BB | 1,357,497 | |||||||||||||||||||||||||
| 965 | Barclays PLC | 6.125% | N/A (8) | BB | 1,044,226 | |||||||||||||||||||||||||
| 420 | Barclays PLC | 4.375% | N/A (8) | BB | 411,390 | |||||||||||||||||||||||||
| 200 | BBVA Bancomer SA/Texas, 144A | 5.125% | 1/18/33 | BB | 205,252 | |||||||||||||||||||||||||
| 290 | BNP Paribas SA, 144A | 7.000% | N/A (8) | BBB– | 339,431 | |||||||||||||||||||||||||
| 1,555 | BNP Paribas SA, 144A | 7.375% | N/A (8) | BBB– | 1,766,869 | |||||||||||||||||||||||||
| 1,265 | BNP Paribas SA, 144A | 6.625% | N/A (8) | BBB– | 1,361,519 | |||||||||||||||||||||||||
| 1,005 | Credit Agricole SA, 144A | 7.875% | N/A (8) | BBB | 1,099,219 | |||||||||||||||||||||||||
| 980 | Credit Agricole SA, 144A | 8.125% | N/A (8) | BBB | 1,160,565 | |||||||||||||||||||||||||
| 660 | Credit Suisse Group AG, 144A | 5.250% | N/A (8) | BB+ | 681,450 | |||||||||||||||||||||||||
| 270 | Danske Bank A/S, Reg S | 6.125% | N/A (8) | BBB– | 284,850 | |||||||||||||||||||||||||
| 340 | Danske Bank A/S, Reg S | 4.375% | N/A (8) | BBB– | 339,150 | |||||||||||||||||||||||||
| 235 | Danske Bank A/S, Reg S | 7.000% | N/A (8) | BBB– | 258,148 | |||||||||||||||||||||||||
| 275 | HSBC Holdings PLC | 4.000% | N/A (8) | Baa2 | 273,281 | |||||||||||||||||||||||||
| 570 | HSBC Holdings PLC | 6.375% | N/A (8) | Baa2 | 611,325 | |||||||||||||||||||||||||
| 2,270 | HSBC Holdings PLC | 6.375% | N/A (8) | Baa2 | 2,449,966 | |||||||||||||||||||||||||
| 1,740 | HSBC Holdings PLC | 6.000% | N/A (8) | Baa2 | 1,872,675 | |||||||||||||||||||||||||
| 755 | ING Groep NV, Reg S | 6.750% | N/A (8) | Baa2 | 813,512 | |||||||||||||||||||||||||
| 500 | ING Groep NV | 6.500% | N/A (8) | BB+ | 544,625 | |||||||||||||||||||||||||
| 845 | ING Groep NV | 5.750% | N/A (8) | Baa2 | 909,431 | |||||||||||||||||||||||||
| 1,140 | Intesa Sanpaolo SpA, 144A | 7.700% | N/A (8) | BB– | 1,276,800 | |||||||||||||||||||||||||
39
| NMAI | Nuveen Multi-Asset Income Fund (continued) | |
| Portfolio of Investments December 31, 2021 | ||
| Principal Amount (000) | Description (1) | Coupon | Maturity | Ratings (4) | Value | |||||||||||||||||||||||||
| Banks (continued) | ||||||||||||||||||||||||||||||
| $ | 1,695 | Lloyds Banking Group PLC | 7.500% | N/A (8) | BBB– | $ | 1,874,009 | |||||||||||||||||||||||
| 1,025 | Lloyds Banking Group PLC | 7.500% | N/A (8) | BBB– | 1,158,469 | |||||||||||||||||||||||||
| 500 | Macquarie Bank Ltd/London, 144A | 6.125% | N/A (8) | BB+ | 533,540 | |||||||||||||||||||||||||
| 1,035 | NatWest Group PLC | 8.000% | N/A (8) | BBB– | 1,201,894 | |||||||||||||||||||||||||
| 810 | NatWest Group PLC | 6.000% | N/A (8) | BB+ | 886,399 | |||||||||||||||||||||||||
| 610 | Nordea Bank Abp, 144A | 6.625% | N/A (8) | BBB | 693,113 | |||||||||||||||||||||||||
| 245 | Societe Generale SA, 144A | 8.000% | N/A (8) | BB | 283,198 | |||||||||||||||||||||||||
| 865 | Societe Generale SA, 144A | 7.875% | N/A (8) | BB | 946,094 | |||||||||||||||||||||||||
| 320 | Societe Generale SA, 144A | 6.750% | N/A (8) | BB | 351,200 | |||||||||||||||||||||||||
| 615 | Societe Generale SA, 144A | 4.750% | N/A (8) | BB | 624,477 | |||||||||||||||||||||||||
| 570 | Standard Chartered PLC, 144A | 4.300% | N/A (8) | BB+ | 548,625 | |||||||||||||||||||||||||
| 820 | Standard Chartered PLC, 144A | 6.000% | N/A (8) | BB+ | 874,325 | |||||||||||||||||||||||||
| 420 | Standard Chartered PLC, 144A | 7.750% | N/A (8) | BB+ | 445,725 | |||||||||||||||||||||||||
| 665 | UniCredit SpA, Reg S | 8.000% | N/A (8) | Ba3 | 728,175 | |||||||||||||||||||||||||
| 33,355 | Total Banks | 36,194,073 | ||||||||||||||||||||||||||||
| Capital Markets – 1.7% | ||||||||||||||||||||||||||||||
| 1,285 | Credit Suisse Group AG, 144A | 7.500% | N/A (8) | BB+ | 1,358,887 | |||||||||||||||||||||||||
| 300 | Credit Suisse Group AG, 144A | 6.375% | N/A (8) | BB | 323,340 | |||||||||||||||||||||||||
| 1,845 | Credit Suisse Group AG, 144A | 7.250% | N/A (8) | BB+ | 2,027,434 | |||||||||||||||||||||||||
| 575 | Credit Suisse Group AG, 144A | 7.500% | N/A (8) | BB+ | 621,000 | |||||||||||||||||||||||||
| 2,200 | Deutsche Bank AG | 6.000% | N/A (8) | BB– | 2,285,250 | |||||||||||||||||||||||||
| 1,415 | UBS Group AG, Reg S | 7.000% | N/A (8) | BBB | 1,574,187 | |||||||||||||||||||||||||
| 255 | UBS Group AG, Reg S | 5.125% | N/A (8) | BBB | 270,938 | |||||||||||||||||||||||||
| 1,165 | UBS Group AG, 144A | 7.000% | N/A (8) | BBB | 1,256,161 | |||||||||||||||||||||||||
| 1,090 | UBS Group AG, Reg S | 6.875% | N/A (8) | BBB | 1,211,263 | |||||||||||||||||||||||||
| 685 | UBS Group AG, 144A | 3.875% | N/A (8) | BBB | 675,033 | |||||||||||||||||||||||||
| 10,815 | Total Capital Markets | 11,603,493 | ||||||||||||||||||||||||||||
| $ | 44,170 | Total Contingent Capital Securities (cost $47,710,637) |
| 47,797,566 | ||||||||||||||||||||||||||
| Shares | Description (1) | Coupon | Ratings (4) | Value | ||||||||||||||||||||||||||
$25 PAR (OR SIMILAR) RETAIL PREFERRED – 4.0% (2.8% of Total Investments) |
| |||||||||||||||||||||||||||||
| Banks – 1.1% | ||||||||||||||||||||||||||||||
| 179,300 | Banco Bradesco SA, (2) | 0.000% | N/R | $ | 621,599 | |||||||||||||||||||||||||
| 35,400 | Citigroup Inc | 7.125% | BB+ | 968,544 | ||||||||||||||||||||||||||
| 13,325 | CoBank ACB, (2) | 6.250% | BBB+ | 1,345,825 | ||||||||||||||||||||||||||
| 4,750 | Farm Credit Bank of Texas, 144A, (2) | 6.750% | Baa1 | 496,375 | ||||||||||||||||||||||||||
| 37,722 | Fifth Third Bancorp | 6.625% | BB+ | 1,050,180 | ||||||||||||||||||||||||||
| 15,925 | KeyCorp | 6.125% | BB+ | 481,572 | ||||||||||||||||||||||||||
| 22,531 | Regions Financial Corp | 6.375% | BB+ | 651,371 | ||||||||||||||||||||||||||
| 13,700 | Synovus Financial Corp | 5.875% | BB– | 369,900 | ||||||||||||||||||||||||||
| 37,100 | Western Alliance Bancorp | 4.250% | Ba1 | 972,020 | ||||||||||||||||||||||||||
| 14,500 | Wintrust Financial Corp | 6.875% | Ba2 | 395,995 | ||||||||||||||||||||||||||
Total Banks | 7,353,381 | |||||||||||||||||||||||||||||
| Capital Markets – 0.4% | ||||||||||||||||||||||||||||||
| 5,100 | Goldman Sachs Group Inc | 5.500% | BB+ | 134,895 | ||||||||||||||||||||||||||
| 75,260 | Morgan Stanley | 7.125% | BBB– | 2,080,939 | ||||||||||||||||||||||||||
| 25,000 | Morgan Stanley | 6.875% | BBB– | 692,750 | ||||||||||||||||||||||||||
Total Capital Markets | 2,908,584 | |||||||||||||||||||||||||||||
| Communications Equipment – 0.0% | ||||||||||||||||||||||||||||||
| 3,288 | Riverbed Technology Inc, (2), (14) | 0.000% | N/R | 62,466 | ||||||||||||||||||||||||||
| Consumer Finance – 0.2% | ||||||||||||||||||||||||||||||
| 26,800 | Capital One Financial Corp | 5.000% | BB+ | 716,900 | ||||||||||||||||||||||||||
| 27,448 | Synchrony Financial | 5.625% | BB– | 739,175 | ||||||||||||||||||||||||||
Total Consumer Finance | 1,456,075 | |||||||||||||||||||||||||||||
40
| Shares | Description (1) | Coupon | Ratings (4) | Value | ||||||||||||||||||||||||||
| Diversified Financial Services – 0.2% | ||||||||||||||||||||||||||||||
| 13,200 | Equitable Holdings Inc | 5.250% | BBB– | $ | 349,800 | |||||||||||||||||||||||||
| 23,800 | Voya Financial Inc | 5.350% | BB+ | 702,814 | ||||||||||||||||||||||||||
Total Diversified Financial Services | 1,052,614 | |||||||||||||||||||||||||||||
| Diversified Telecommunication Services – 0.0% | ||||||||||||||||||||||||||||||
| 7,900 | AT&T Inc | 4.750% | BB+ | 207,454 | ||||||||||||||||||||||||||
| Food Products – 0.5% | ||||||||||||||||||||||||||||||
| 8,807 | CHS Inc | 7.875% | N/R | 250,559 | ||||||||||||||||||||||||||
| 44,746 | CHS Inc | 7.100% | N/R | 1,229,620 | ||||||||||||||||||||||||||
| 54,670 | CHS Inc | 6.750% | N/R | 1,516,546 | ||||||||||||||||||||||||||
Total Food Products | 2,996,725 | |||||||||||||||||||||||||||||
| Insurance – 0.9% | ||||||||||||||||||||||||||||||
| 34,900 | American Equity Investment Life Holding Co | 5.950% | BB– | 959,750 | ||||||||||||||||||||||||||
| 20,300 | American Equity Investment Life Holding Co | 6.625% | BB | 569,821 | ||||||||||||||||||||||||||
| 32,400 | Aspen Insurance Holdings Ltd | 5.950% | BB+ | 873,180 | ||||||||||||||||||||||||||
| 15,200 | Aspen Insurance Holdings Ltd | 5.625% | BB+ | 397,936 | ||||||||||||||||||||||||||
| 41,036 | Athene Holding Ltd | 6.350% | BBB | 1,211,382 | ||||||||||||||||||||||||||
| 28,290 | Athene Holding Ltd | 6.375% | BBB | 806,831 | ||||||||||||||||||||||||||
| 5,300 | Axis Capital Holdings Ltd | 5.500% | BBB | 133,984 | ||||||||||||||||||||||||||
| 18,700 | Enstar Group Ltd | 7.000% | BB+ | 552,772 | ||||||||||||||||||||||||||
| 25,900 | Reinsurance Group of America Inc | 5.750% | BBB+ | 759,388 | ||||||||||||||||||||||||||
Total Insurance | 6,265,044 | |||||||||||||||||||||||||||||
| Multi-Utilities – 0.0% | ||||||||||||||||||||||||||||||
| 10,000 | NiSource Inc | 6.500% | BB+ | 272,200 | ||||||||||||||||||||||||||
| Oil, Gas & Consumable Fuels – 0.3% | ||||||||||||||||||||||||||||||
| 5,400 | Energy Transfer LP | 7.600% | BB | 136,890 | ||||||||||||||||||||||||||
| 31,400 | NuStar Energy LP | 6.969% | B | 794,420 | ||||||||||||||||||||||||||
| 40,500 | NuStar Energy LP | 7.625% | B | 911,250 | ||||||||||||||||||||||||||
Total Oil, Gas & Consumable Fuels | 1,842,560 | |||||||||||||||||||||||||||||
| Thrifts & Mortgage Finance – 0.3% | ||||||||||||||||||||||||||||||
| 15,000 | Federal Agricultural Mortgage Corp | 5.700% | N/R | 406,073 | ||||||||||||||||||||||||||
| 42,814 | New York Community Bancorp Inc | 6.375% | BB– | 1,214,633 | ||||||||||||||||||||||||||
Total Thrifts & Mortgage Finance | 1,620,706 | |||||||||||||||||||||||||||||
| Trading Companies & Distributors – 0.1% | ||||||||||||||||||||||||||||||
| 20,500 | Air Lease Corp | 6.150% | BB+ | 532,180 | ||||||||||||||||||||||||||
Total $25 Par (or similar) Retail Preferred (cost $25,216,192) |
| 26,569,989 | ||||||||||||||||||||||||||||
| Principal Amount (000) | Description (1) | Coupon | Maturity | Ratings (4) | Value | |||||||||||||||||||||||||
CORPORATE BONDS – 2.4% (1.7% of Total Investments) |
| |||||||||||||||||||||||||||||
| Airlines – 0.1% | ||||||||||||||||||||||||||||||
| $ | 375 | United Airlines Inc, 144A | 4.625% | 4/15/29 | BB | $ | 386,719 | |||||||||||||||||||||||
| Auto Components – 0.1% | ||||||||||||||||||||||||||||||
| 450 | Adient US LLC, 144A | 9.000% | 4/15/25 | BB– | 478,125 | |||||||||||||||||||||||||
| Commercial Services & Supplies – 0.2% | ||||||||||||||||||||||||||||||
| 1,125 | Prime Security Services Borrower LLC / Prime Finance Inc, 144A |
| 5.750% | 4/15/26 | BB– | 1,207,879 | ||||||||||||||||||||||||
| 250 | Prime Security Services Borrower LLC / Prime Finance Inc, 144A |
| 6.250% | 1/15/28 | B– | 260,625 | ||||||||||||||||||||||||
| 1,375 | Total Commercial Services & Supplies | 1,468,504 | ||||||||||||||||||||||||||||
| Diversified Telecommunication Services – 0.1% | ||||||||||||||||||||||||||||||
| 500 | Frontier Communications Holdings LLC, 144A | 5.875% | 10/15/27 | B+ | 528,750 | |||||||||||||||||||||||||
41
| NMAI | Nuveen Multi-Asset Income Fund (continued) | |
| Portfolio of Investments December 31, 2021 | ||
| Principal Amount (000) | Description (1) | Coupon | Maturity | Ratings (4) | Value | |||||||||||||||||||||||||
| Electronic Equipment, Instruments & Components – 0.1% | ||||||||||||||||||||||||||||||
| $ | 500 | Imola Merger Corp, 144A | 4.750% | 5/15/29 | BB– | $ | 513,025 | |||||||||||||||||||||||
| Energy Equipment & Services – 0.1% | ||||||||||||||||||||||||||||||
| 500 | Bausch Health Cos Inc, 144A | 6.125% | 4/15/25 | B | 509,280 | |||||||||||||||||||||||||
| Equity Real Estate Investment Trust – 0.0% | ||||||||||||||||||||||||||||||
| 250 | RLJ Lodging Trust LP, 144A | 3.750% | 7/01/26 | BB– | 251,375 | |||||||||||||||||||||||||
| Health Care Providers & Services – 0.6% | ||||||||||||||||||||||||||||||
| 250 | CHS/Community Health Systems Inc, 144A | 6.000% | 1/15/29 | B | 266,562 | |||||||||||||||||||||||||
| 1,000 | Legacy LifePoint Health LLC, 144A | 4.375% | 2/15/27 | B+ | 1,007,500 | |||||||||||||||||||||||||
| 250 | LifePoint Health Inc, 144A | 5.375% | 1/15/29 | CCC+ | 248,750 | |||||||||||||||||||||||||
| 600 | Team Health Holdings Inc, 144A | 6.375% | 2/01/25 | CCC | 564,750 | |||||||||||||||||||||||||
| 250 | Tenet Healthcare Corp, 144A | 4.625% | 9/01/24 | B+ | 255,625 | |||||||||||||||||||||||||
| 250 | Tenet Healthcare Corp, 144A | 4.875% | 1/01/26 | B+ | 256,783 | |||||||||||||||||||||||||
| 750 | Tenet Healthcare Corp, 144A | 4.625% | 6/15/28 | B+ | 770,625 | |||||||||||||||||||||||||
| 375 | Tenet Healthcare Corp, 144A | 6.125% | 10/01/28 | CCC+ | 396,079 | |||||||||||||||||||||||||
| 3,725 | Total Health Care Providers & Services | 3,766,674 | ||||||||||||||||||||||||||||
| Hotels, Restaurants & Leisure – 0.2% | ||||||||||||||||||||||||||||||
| 1,000 | Caesars Entertainment Inc, 144A | 6.250% | 7/01/25 | B+ | 1,049,625 | |||||||||||||||||||||||||
| 375 | Life Time Inc, 144A |
| 5.750% | 1/15/26 | B | 388,125 | ||||||||||||||||||||||||
| 1,375 | Total Hotels, Restaurants & Leisure |
| 1,437,750 | |||||||||||||||||||||||||||
| Insurance – 0.3% | ||||||||||||||||||||||||||||||
| 500 | Alliant Holdings Intermediate LLC / Alliant Holdings Co-Issuer, 144A |
| 4.250% | 10/15/27 | B | 500,000 | ||||||||||||||||||||||||
| 1,482 | Assurant Inc |
| 7.000% | 3/27/48 | BB+ | �� | 1,687,627 | |||||||||||||||||||||||
| 1,982 | Total Insurance |
| 2,187,627 | |||||||||||||||||||||||||||
| Media – 0.4% | ||||||||||||||||||||||||||||||
| 250 | Clear Channel Outdoor Holdings Inc, 144A |
| 7.750% | 4/15/28 | CCC | 267,500 | ||||||||||||||||||||||||
| 250 | Clear Channel Outdoor Holdings Inc, 144A | 7.500% | 6/01/29 | CCC | 266,875 | |||||||||||||||||||||||||
| 625 | DISH DBS Corp, 144A | 5.250% | 12/01/26 | BB– | 634,865 | |||||||||||||||||||||||||
| 52 | iHeartCommunications Inc | 8.375% | 5/01/27 | CCC+ | 54,872 | |||||||||||||||||||||||||
| 750 | iHeartCommunications Inc, 144A | 5.250% | 8/15/27 | B+ | 780,075 | |||||||||||||||||||||||||
| 500 | LCPR Senior Secured Financing DAC, 144A | 5.125% | 7/15/29 | B+ | 502,500 | |||||||||||||||||||||||||
| 375 | Outfront Media Capital LLC / Outfront Media Capital Corp, 144A |
| 5.000% | 8/15/27 | B+ | 383,730 | ||||||||||||||||||||||||
| 2,802 | Total Media |
| 2,890,417 | |||||||||||||||||||||||||||
| Oil, Gas & Consumable Fuels – 0.0% | ||||||||||||||||||||||||||||||
| 375 | Matador Resources Co |
| 5.875% | 9/15/26 | B+ | 386,250 | ||||||||||||||||||||||||
| Pharmaceuticals – 0.0% | ||||||||||||||||||||||||||||||
| 250 | Endo Dac / Endo Finance LLC / Endo Finco Inc, 144A |
| 9.500% | 7/31/27 | CCC | 254,480 | ||||||||||||||||||||||||
| Software – 0.2% | ||||||||||||||||||||||||||||||
| 1,000 | Avaya Inc, 144A | 6.125% | 9/15/28 | B+ | 1,060,000 | |||||||||||||||||||||||||
| $ | 15,459 | Total Corporate Bonds (cost $16,052,888) |
| 16,118,976 | ||||||||||||||||||||||||||
| Shares | Description (1) | Value | ||||||||||||||||||||||||||||
WARRANTS – 0.1% (0.0% of Total Investments) |
| |||||||||||||||||||||||||||||
| Entertainment – 0.0% | ||||||||||||||||||||||||||||||
| 34,453 | Cineworld Warrant, (2) | $ | 11,197 | |||||||||||||||||||||||||||
| Oil, Gas & Consumable Fuels – 0.1% | ||||||||||||||||||||||||||||||
| 3,996 | Fieldwood Energy LLC, (2) | 375,624 | ||||||||||||||||||||||||||||
| 2,870 | Fieldwood Energy LLC, (2) | 22,243 | ||||||||||||||||||||||||||||
| 5,530 | Fieldwood Energy LLC, (2) | 28,109 | ||||||||||||||||||||||||||||
| 12,396 | Total Oil, Gas & Consumable Fuels | 425,976 | ||||||||||||||||||||||||||||
Total Warrants (cost $54,810) | 437,173 | |||||||||||||||||||||||||||||
42
| Shares | Description (1) | Value | ||||||||||||||||||||||||||||
INVESTMENT COMPANIES – 0.0% (0.0% of Total Investments) |
| |||||||||||||||||||||||||||||
| 16,288 | 3i Infrastructure PLC | $ | 78,256 | |||||||||||||||||||||||||||
| 60,316 | Cordiant Digital Infrastructure Ltd/Fund, (14) | 92,254 | ||||||||||||||||||||||||||||
Total Investment Companies (cost $164,729) |
| 170,510 | ||||||||||||||||||||||||||||
Total Long-Term Investments (cost $836,006,121) |
| 960,659,558 | ||||||||||||||||||||||||||||
Principal Amount (000) | Description (1) | Coupon | Maturity | Value | ||||||||||||||||||||||||||
SHORT-TERM INVESTMENTS – 0.1% (0.1% of Total Investments) |
| |||||||||||||||||||||||||||||
| REPURCHASE AGREEMENTS – 0.1% (0.1% of Total Investments) | ||||||||||||||||||||||||||||||
| $ | 983 | Repurchase Agreement with Fixed Income Clearing Corporation, dated 12/31/21, repurchase price $983,413, collateralized by $868,700, U.S. Treasury Inflation Index Notes, 0.125%, due 4/15/22, value $1,003,157 |
| 0.000% | 1/03/22 | $ | 983,413 | |||||||||||||||||||||||
Total Short-Term Investments (cost $983,413) |
| 983,413 | ||||||||||||||||||||||||||||
Total Investments (cost $836,989,534) – 143.6% |
| 961,642,971 | ||||||||||||||||||||||||||||
Borrowings – (26.7)% (15), (16) | (178,550,000 | ) | ||||||||||||||||||||||||||||
Other Assets Less Liabilities – (16.9)% |
| (113,482,047 | ) | |||||||||||||||||||||||||||
Net Assets Applicable to Common Shares – 100% |
| 669,610,924 | ||||||||||||||||||||||||||||
43
| NMAI | Nuveen Multi-Asset Income Fund (continued) | |
| Portfolio of Investments December 31, 2021 | ||
For Fund portfolio compliance purposes, the Fund’s industry classifications refer to any one or more of the industry sub-classifications used by one or more widely recognized market indexes or ratings group indexes, and/or as defined by Fund management. This definition may not apply for purposes of this report, which may combine industry sub-classifications into sectors for reporting ease.
| (1) | All percentages shown in the Portfolio of Investments are based on net assets applicable to common shares unless otherwise noted. |
| (2) | For fair value measurement disclosure purposes, investment classified as Level 2. |
| (3) | Investment valued at fair value using methods determined in good faith by, or at the discretion of, the Board. For fair value measurement disclosure purposes, investment classified as Level 3. |
| (4) | The Fund uses credit quality ratings for its portfolio securities provided by Standard & Poor’s Group (“Standard & Poor’s”), Moody’s Investors Service, Inc. (“Moody’s”) and Fitch, Inc. (“Fitch”). If all three provide a rating for a security, the middle is used; if two of the three agencies rate a security, the lower rating is used; and if only one rating agency rates a security, that rating is used. AAA, AA, A, and BBB are investment grade ratings; BB, B, CCC/CC/C and D are below-investment grade ratings. Credit ratings are subject to change. Holdings designated N/R are not rated by Moody’s, S&P or Fitch. Ratings are not covered by the report of independent registered public accounting firm. |
| (5) | Senior loans generally pay interest at rates which are periodically adjusted by reference to a base short-term, floating lending rate (Reference Rate) plus an assigned fixed rate (Spread). These floating lending rates are generally (i) the lending rate referenced by the London Inter-Bank Offered Rate (“LIBOR”), or (ii) the prime rate offered by one or more major United States banks. Senior loans may be considered restricted in that the Fund ordinarily is contractually obligated to receive approval from the agent bank and/or borrower prior to the disposition of a senior loan. The rate shown is the coupon as of the end of the reporting period. |
| (6) | Senior Loans generally are subject to mandatory and/or optional prepayment. Because of these mandatory prepayment conditions and because there may be significant economic incentives for a borrower to prepay, prepayments of senior loans may occur. As a result, the actual remaining maturity of senior loans held may be substantially less than the stated maturities shown. |
| (7) | Defaulted security. A security whose issuer has failed to fully pay principal and/or interest when due, or is under the protection of bankruptcy. |
| (8) | Perpetual security. Maturity date is not applicable. |
| (9) | Variable rate security. The rate shown is the coupon as of the end of the reporting period. |
| (10) | Principal Amount (000) denominated in U.S. Dollars, unless otherwise noted. |
| (11) | Contingent Capital Securities (“CoCos”) are hybrid securities with loss absorption characteristics built into the terms of the security for the benefit of the issuer. For example, the terms may specify an automatic write-down of principal or a mandatory conversion into the issuer’s common stock under certain adverse circumstances, such as the issuer’s capital ratio falling below a specified level. |
| (12) | Principal Amount (000) rounds to less than $1,000. |
| (13) | Investment, or portion of investment, represents an outstanding unfunded senior loan commitment. |
| (14) | Non-income producing; issuer has not declared an ex-dividend date within the past twelve months. |
| (15) | Borrowings as a percentage of Total Investments is 18.6%. |
| (16) | The Fund may pledge up to 100% of its eligible investments (excluding any investments separately pledged as collateral for specific investments in derivatives, when applicable) in the Portfolio of Investments as collateral for borrowings. As of the end of the reporting period investments with a value of $460,483,113 have been pledged as collateral for borrowings. |
| 144A | Investment is exempt from registration under Rule 144A of the Securities Act of 1933, as amended. These investments may only be resold in transactions exempt from registration, which are normally those transactions with qualified institutional buyers. |
| ADR | American Depositary Receipt |
| BRL | Brazilian Real |
| DD1 | Portion of investment purchased on a delayed delivery basis. |
| EUR | Euro |
| LIBOR | London Inter-Bank Offered Rate |
| MDR | Denotes investment is subject to dollar roll transactions. |
| MXN | Mexican Peso |
| N/A | Not Applicable. |
| PIK | Payment-in-kind (“PIK”) security. Depending on the terms of the security, income may be received in the form of cash, securities, or a combination of both. The PIK rate shown, where applicable, represents the annualized rate of the last PIK payment made by the issuer as of the end of the reporting period. |
| Reg S | Regulation S allows U.S. companies to sell securities to persons or entities located outside of the United States without registering those securities with the Securities and Exchange Commission. Specifically, Regulation S provides a safe harbor from the registration requirements of the Securities Act for the offers and sales of securities by both foreign and domestic issuers that are made outside the United States. |
| REIT | Real Estate Investment Trust |
| RUB | Russian Ruble |
| TBA | To be announced. Maturity date not known prior to settlement of this transaction. |
| TBD | Senior loan purchased on a when-issued or delayed-delivery basis. Certain details associated with this purchase are not known prior to the settlement date of the transaction. In addition, senior loans typically trade without accrued interest and therefore a coupon rate is not available prior to settlement. At settlement, if still unknown, the borrower or counterparty will provide the Fund with the final coupon rate and maturity date. |
| WI/DD | Purchased on a when-issued or delayed delivery basis. |
| ZAR | South African Rand |
See accompanying notes to financial statements.
44
Statement of Assets and Liabilities
December 31, 2021
Assets | ||||
Long-term investments, at value (cost $836,006,121) | $ | 960,659,558 | ||
Short-term investments, at value (cost approximates value) | 983,413 | |||
Cash | 2,264,599 | |||
Cash denominated in foreign currencies (cost $95,000) | 95,195 | |||
Receivables for: | ||||
Dividends | 901,865 | |||
Interest | 3,368,464 | |||
Investments sold | 41,417,093 | |||
Reclaims | 523,029 | |||
Due from affiliates | 13,349 | |||
Other assets | 350,365 | |||
Total assets | 1,010,576,930 | |||
Liabilities | ||||
Borrowings | 178,550,000 | |||
Payables for: | ||||
Investments purchased - regular settlement | 2,197,811 | |||
Investments purchased - when-issued/delayed-delivery settlement | 158,626,071 | |||
Unfunded senior loans | 175,744 | |||
Accrued expenses: | ||||
Interest | 82,574 | |||
Management fees | 690,899 | |||
Trustees fees | 244,166 | |||
Other | 398,741 | |||
Total liabilities | 340,966,006 | |||
Net assets applicable to common shares | $ | 669,610,924 | ||
Common shares outstanding | 33,425,645 | |||
Net asset value (“NAV”) per common share outstanding | $ | 20.03 | ||
Net assets applicable to common shares consist of: | ||||
Common shares, $0.01 par value per share | $ | 334,256 | ||
Paid-in-surplus | 487,158,273 | |||
Total distributable earnings (loss) | 182,118,395 | |||
Net assets applicable to common shares | $ | 669,610,924 | ||
Authorized shares: | ||||
Common | Unlimited | |||
Preferred | Unlimited |
See accompanying notes to financial statements.
45
For the period November 22, 2021 (commencement of operations) through December 31, 2021
Investment Income | ||||
Dividends | $ | 1,912,713 | ||
Interest | 1,669,120 | |||
Foreign tax withheld on dividend income | (64,523 | ) | ||
Total Investment Income | 3,517,310 | |||
Expenses | ||||
Management fees | 877,068 | |||
Interest expense | 85,767 | |||
Custodian fees | 22,483 | |||
Trustees fees | 2,663 | |||
Professional fees | 60,376 | |||
Shareholder reporting expenses | 22,101 | |||
Shareholder servicing agent fees | 80 | |||
Stock exchange listing fees | 727 | |||
Investor relations expenses | 13,822 | |||
Reorganization expenses | 64,168 | |||
Other | 1,433 | |||
Total expenses | 1,150,688 | |||
Net investment income (loss) | 2,366,622 | |||
Realized and Unrealized Gain (Loss) | ||||
Net realized gain (loss) from investments and foreign currency | 74,803,452 | |||
Change in net unrealized appreciation (depreciation) of investments and foreign currency | (64,374,361 | ) | ||
Net realized and unrealized gain (loss) | 10,429,091 | |||
Net increase (decrease) in net assets applicable to common shares from operations | $ | 12,795,713 |
See accompanying notes to financial statements.
46
Statement of Changes in Net Assets
| For the period 11/22/21 (commencement of operations) through 12/31/21 | ||||
Operations | ||||
Net investment income (loss) | $ | 2,366,622 | ||
Net realized gain (loss) from investments and foreign currency | 74,803,452 | |||
Change in net unrealized appreciation (depreciation) of investments and foreign currency | (64,374,361 | ) | ||
Net increase (decrease) in net assets applicable to common shares from operations | 12,795,713 | |||
Distributions to Common Shareholders | ||||
Dividends | (11,698,976 | ) | ||
Decrease in net assets applicable to common shares from distributions to common shareholders | (11,698,976 | ) | ||
Capital Share Transactions | ||||
Issued in the Reorganization | 668,514,167 | |||
Net increase (decrease) in net assets applicable to common shares from capital share transactions | 668,514,167 | |||
Net increase (decrease) in net assets applicable to common shares | 669,610,904 | |||
Net assets applicable to common shares at the beginning of period | 20 | |||
Net assets applicable to common shares at the end of period | $ | 669,610,924 | ||
See accompanying notes to financial statements.
47
For the period November 22, 2021 (commencement of operations) through December 31, 2021
Cash Flows from Operating Activities: | ||||
Net Increase (Decrease) in Net Assets Applicable to Common Shares from Operations | $ | 12,795,713 | ||
Adjustments to reconcile the net increase (decrease) in net assets applicable to common shares from operations to net cash provided by (used in) operating activities: | ||||
Purchases of investments | (727,266,887 | ) | ||
Proceeds from sales and maturities of investments | 613,218,583 | |||
Proceeds from (Purchase of) short-term investments, net | 3,603,327 | |||
Proceeds from (Payments for) closed foreign currency spot contracts | 131,164 | |||
Payment-in-kind distributions | 4,439 | |||
Amortization (Accretion) of premiums and discounts, net | (218,097 | ) | ||
(Increase) Decrease in: | ||||
Receivable for dividends | 638,884 | |||
Receivable for interest | (1,401,334 | ) | ||
Receivable for investments sold | (38,463,093 | ) | ||
Receivable for reclaims | (523,029 | ) | ||
Other assets | (135,660 | ) | ||
Increase (Decrease) in: | ||||
Payable investments purchased – regular settlement | (4,028,654 | ) | ||
Payable investments purchased – when-issued/delayed-delivery settlement | 158,626,071 | |||
Payable for unfunded senior loans | (14,885 | ) | ||
Accrued management fees | 690,899 | |||
Accrued interest | (29,842 | ) | ||
Accrued Trustees fees | 244,166 | |||
Accrued other expenses | (1,211,491 | ) | ||
Net realized (gain) loss from investments and foreign currency | (74,803,452 | ) | ||
Change in net unrealized appreciation (depreciation) of investments and foreign currency | 64,374,361 | |||
Net cash provided by (used in) operating activities | 6,231,183 | |||
Cash Flow from Financing Activities: | ||||
Proceeds from borrowings | 39,838,700 | |||
(Repayments of) borrowings | (39,838,700 | ) | ||
Cash distributions paid to common shareholders | (11,698,976 | ) | ||
Net cash provided by (used in) financing activities | (11,698,976 | ) | ||
Net Increase (Decrease) in Cash and Cash Denominated in Foreign Currencies | (5,467,793 | ) | ||
Cash and cash denominated in foreign currencies at the beginning of period | 20 | |||
Cash and cash denominated in foreign currencies acquired in connection with the Reorganizations | 7,827,567 | |||
Cash and cash denominated in foreign currencies at the end of period | $ | 2,359,794 | ||
The following table provides a reconciliation of cash and cash denominated in foreign currencies to the statement of assets and liabilities: | ||||
Cash | $ | 2,264,599 | ||
Cash denominated in foreign currencies | 95,195 | |||
Total cash and cash denominated in foreign currencies | $ | 2,359,794 | ||
| Supplemental Disclosure of Cash Flow Information(1) | ||||
Cash paid for interest (excluding amortization of offering costs) | $ | 104,433 | ||
| (1) | See Notes to Financial Statements, Note 1 – General Information for more information of the non-cash activities related to the Fund’s Reorganizations. |
See accompanying notes to financial statements.
48
THIS PAGE INTENTIONALLY LEFT BLANK
49
Selected data for a share outstanding throughout each period:
| Investment Operations | Less Distributions to Common Shareholders | Common Share | ||||||||||||||||||||||||||||||||||||||
| Beginning Common Share NAV | Net Investment Income (Loss)(a) | Net Realized/ Unrealized Gain (Loss) | Total | From Net Investment Income | From Accum- ulated Net Realized Gains | Return of Capital | Total | Ending NAV | Ending Share Price | |||||||||||||||||||||||||||||||
Year Ended 12/31: |
| |||||||||||||||||||||||||||||||||||||||
2021(e) | $ | 20.00 | $ | 0.07 | $ | 0.31 | $ | 0.38 | $ | (0.06 | ) | $ | (0.29 | ) | $ | — | $ | (0.35 | ) | $ | 20.03 | $ | 18.65 | |||||||||||||||||
| Borrowings at the End of Period | ||||||||
| Aggregate Amount Outstanding (000) | Asset Coverage Per $1,000 | |||||||
Year Ended 12/31: |
| |||||||
2021(e) | $ | 178,550 | $ | 4,750 | ||||
50
| Common Share Supplemental Data/ Ratios Applicable to Common Shares | ||||||||||||||||||||||
| Common Share Total Returns | Ratios to Average Net Assets(c) | |||||||||||||||||||||
| Based on NAV(b) | Based | Ending Net Assets (000) | Expenses | Net Investment Income (Loss) | Portfolio Turnover Rate(d) | |||||||||||||||||
| 1.90 | % | (5.00 | )% | $ | 669,611 | 1.63 | %* | 3.35 | %* | 66 | % | |||||||||||
| (a) | Per share Net Investment Income (Loss) is calculated using the average daily common shares method. |
| (b) | Total Return Based on Common Share NAV is the combination of changes in common share NAV, reinvested dividend income at NAV and reinvested capital gains distributions at NAV, if any. The last dividend declared in the period, which is typically paid on the first business day of the following month, is assumed to be reinvested at the ending NAV. The actual reinvest price for the last dividend declared in the period may often be based on the Fund’s market price (and not its NAV), and therefore may be different from the price used in the calculation. Total returns are not annualized. |
Total Return Based on Common Share Price is the combination of changes in the market price per common share and the effect of reinvested dividend income and reinvested capital gains distributions, if any, at the average price paid per common share at the time of reinvestment. The last dividend declared in the period, which is typically paid on the first business day of the following month, is assumed to be reinvested at the ending market price. The actual reinvestment for the last dividend declared in the period may take place over several days, and in some instances may not be based on the market price, so the actual reinvestment price may be different from the price used in the calculation. Total returns are not annualized.
| (c) | • Net Investment Income (Loss) ratios reflect income earned and expenses incurred on assets attributable to borrowings (as described in Note 8 – Borrowing Arrangements). |
• Each ratio includes the effect of all interest expense paid and other costs related to borrowings as follows: |
| Ratios of Borrowings Interest Expense to Average Net Assets Applicable to Common Shares | ||||
Year Ended 12/31: | ||||
2021(e) | 0.12 | %* | ||
| (d) | Portfolio Turnover Rate is calculated based on the lesser of long-term purchases or sales (as disclosed in Note 4 – Portfolio Securities and Investments in Derivatives) divided by the average long-term market value during the period. |
| (e) | For the period November 22, 2021 (commencement of operations) through December 31, 2021. |
| * | Annualized. |
See accompanying notes to financial statements.
51
1. General Information
Fund Information
Nuveen Multi-Asset Income Fund (the “Fund”) is registered under the Investment Company Act of 1940 (the “1940 Act”), as amended, as a diversified closed-end management investment company. The Fund was formed from the reorganization of three closed-end funds, as further described below, and commenced operations on November 22, 2021. The Fund’s common shares are listed on the New York Stock Exchange (“NYSE”) and trade under the ticker symbol “NMAI.” The Fund was organized as a Massachusetts business trust on April 22, 2021.
The end of the reporting period for the Fund is December 31, 2021, and the period covered by these Notes to Financial Statements is the commencement of operation to December 31, 2021 (the “current fiscal period”).
Investment Adviser and Sub-Adviser
The Fund’s investment adviser is Nuveen Fund Advisors, LLC (the “Adviser”), a subsidiary of Nuveen, LLC (“Nuveen”). Nuveen is the investment management arm of Teachers Insurance and Annuity Association of America (TIAA). The Adviser has overall responsibility for management of the Fund, oversees the management of the Fund’s portfolio, manages the Fund’s business affairs and provides certain clerical, bookkeeping and other administrative services.
As of December 31, 2021, the Adviser has entered into sub-advisory agreements (each a “Sub-Advisory Agreement”) with each of Nuveen Asset Management, LLC (“NAM”), Teachers Advisors, LLC (“TAL”) and Winslow Capital Management LLC (“Winslow”) (NAM, TAL and Winslow are each a “Sub-Adviser”), each of which are affiliates of the Adviser. Pursuant to the Sub-Advisory Agreement with NAM, NAM is responsible for the Fund’s dynamic asset allocation strategy and for allocating the Fund’s assets among each of the various Sub-Advisers. NAM, TAL and Winslow under each Sub-Advisory Agreement manages the investment portfolios of the Fund allocated to it.
Prior December 31, 2021, the Adviser had entered into sub-advisory agreements with NWQ Investment Management Company, LLC (“NWQ”) and Santa Barbara Asset Management, LLC. (“SBAM”), also affiliates of the Adviser. Effective December 31, 2021, the sub-advisory agreements with NWQ and SBAM were terminated in connection with the transfer of investment management personnel from NWQ and SBAM into NAM. On that date, any assets of the Fund that were managed by NWQ and SBAM were reallocated to NAM with the NWQ and SBAM personnel who served as portfolio managers continuing to do so as NAM personnel.
Fund Reorganizations
The Fund was formed from the reorganizations of the following three closed-end funds (each a “Target Fund” and collectively, the “Target Funds”) with and into a wholly-owned subsidiary of the Fund (the “Reorganization Sub”) (the “Reorganizations”):
| • | Nuveen Diversified Dividend and Income Fund (JDD) |
| • | Nuveen Tax-Advantaged Total Return Strategy Fund (JTA) |
| • | Nuveen Tax-Advantaged Dividend Growth Fund (JTD) |
The Reorganizations became effective prior to the opening of business on November 22, 2021. Upon the closing of the Reorganizations, each Target Fund merged with and into the Reorganization Sub. Shareholders of each Target Fund received newly issued shares of the Fund, the aggregate net asset value (“NAV”) of which was equal to the aggregate NAV of the shares of each Target Fund held immediately prior to the Reorganizations (including for this purpose fractional Fund shares to which shareholders would have been entitled). Following completion of the Reorganizations, the Reorganization Sub distributed its assets to the Fund, the Fund, assumed the liabilities of the Reorganization Sub, in complete liquidation and dissolution of the Reorganization Sub. As a result of the Reorganizations, the assets of the Target Funds were combined, and the shareholders of each Target Fund became shareholders of the Fund. Details of the Reorganizations are further described in Note 9 – Fund Reorganizations.
The Fund is treated as the survivor of the Reorganizations for accounting and performance reporting purposes. Accordingly, all performance and other information shown for the Fund is from its commencement of operations on November 22, 2021, and there is no historical performance or other information to present for the Target Funds.
Developments Regarding the Fund’s Control Share By-Law
On October 5, 2020, the Fund and certain other closed-end funds in the Nuveen fund complex amended their by-laws. Among other things, the amended by-laws included provisions pursuant to which, in summary, a shareholder who obtains beneficial ownership of common shares in a Control Share Acquisition (as defined in the by-laws) shall have the same voting rights as other common shareholders only to the extent authorized by the other disinterested shareholders (the “Control Share By-Law”). On January 14, 2021, a shareholder of certain Nuveen closed-end funds filed a civil complaint in the U.S. District Court for the
52
Southern District of New York (the “District Court”) against certain Nuveen funds and their trustees, seeking a declaration that such funds’ Control Share By-Laws violate the 1940 Act, rescission of such fund’s Control Share By-Laws and a permanent injunction against such funds applying the Control Share By-Laws. On February 18, 2022, the District Court granted judgment in favor of the plaintiff’s claim for rescission of such funds’ Control Share By-Laws and the plaintiff’s declaratory judgment claim, and declared that such funds’ Control Share By-Laws violate Section 18(i) of the 1940 Act. Following review of the judgment of the District Court, on February 22, 2022, the Board of Trustees amended the Fund’s by-laws to provide that the Fund’s Control Share By-Law shall be of no force and effect for so long as the judgment of the District Court is effective and that if the judgment of the District Court is reversed, overturned, vacated, stayed, or otherwise nullified, the Fund’s Control Share By-Law will be automatically reinstated and apply to any beneficial owner of common shares acquired in a Control Share Acquisition, regardless of whether such Control Share Acquisition occurs before or after such reinstatement, for the duration of the stay or upon issuance of the mandate reversing, overturning, vacating or otherwise nullifying the judgment of the District Court.
Other Matters
The outbreak of the novel coronavirus (“COVID-19”) and subsequent global pandemic began significantly impacting the U.S. and global financial markets and economies during the calendar quarter ended March 31, 2020. The worldwide spread of COVID-19 has created significant uncertainty in the global economy. The duration and extent of COVID-19 over the long term cannot be reasonably estimated at this time. The ultimate impact of COVID-19 and the extent to which COVID-19 impacts the Fund’s normal course of business, results of operations, investments, and cash flows will depend on future developments, which are highly uncertain and difficult to predict. Management continues to monitor and evaluate this situation.
2. Significant Accounting Policies
The accompanying financial statements were prepared in accordance with accounting principles generally accepted in the United States of America (“U.S. GAAP”), which may require the use of estimates made by management and the evaluation of subsequent events. Actual results may differ from those estimates. The Fund is an investment company and follows the accounting guidance in the Financial Accounting Standards Board (“FASB”) Accounting Standards Codification 946, Financial Services – Investment Companies. The NAV for financial reporting purposes may differ from the NAV for processing security and common share transactions. The NAV for financial reporting purposes includes security and common share transactions through the date of the report. Total return is computed based on the NAV used for processing security and common share transactions. The following is a summary of the significant accounting policies consistently followed by the Fund.
Compensation
The Fund pays no compensation directly to those of its trustees who are affiliated with the Adviser or to its officers, all of whom receive remuneration for their services to the Fund from the Adviser or its affiliates. The Fund’s Board of Trustees (the “Board”) has adopted a deferred compensation plan for independent trustees that enables trustees to elect to defer receipt of all or a portion of the annual compensation they are entitled to receive from certain Nuveen-advised funds. Under the plan, deferred amounts are treated as though equal dollar amounts had been invested in common shares of select Nuveen-advised funds.
Distributions to Common Shareholders
Distributions to common shareholders are recorded on the ex-dividend date. The amount, character and timing of distributions are determined in accordance with federal income tax regulations, which may differ from U.S. GAAP.
The Fund makes quarterly cash distributions to common shareholders of a stated dollar amount per share. Subject to approval and oversight by the Board, the Fund seeks to maintain a stable distribution level designed to deliver the long-term return potential of the Fund’s investment strategy through regular quarterly distributions (a “Managed Distribution Program”). Total distributions during a calendar year generally will be made from the Fund’s net investment income, net realized capital gains and net unrealized capital gains in the Fund’s portfolio, if any. The portion of distributions paid attributed to net unrealized gains, if any, is distributed from the Fund’s assets and is treated by shareholders as a nontaxable distribution (“return of capital”) for tax purposes. In the event that total distributions during a calendar year exceed a Fund’s total return on NAV, the difference will reduce NAV per share. If the Fund’s total return on NAV exceeds total distributions during a calendar year, the excess will be reflected as an increase in NAV per share. The final determination of the source and character of all distributions paid by the Fund during the fiscal year is made after the end of the fiscal year and is reflected in the financial statements contained in the annual report as of December 31 each year.
Foreign Currency Transactions and Translation
To the extent that the Fund invests in securities and/or contracts that are denominated in a currency other than U.S. dollars, the Fund will be subject to currency risk, which is the risk that an increase in the U.S. dollar relative to the foreign currency will reduce returns or portfolio value. Generally, when the U.S. dollar rises in value against a foreign currency, the Fund’s investments denominated in that currency will lose value because its currency is worth fewer U.S. dollars; the opposite effect occurs if the U.S. dollar falls in relative value. Investments and other assets and liabilities denominated in foreign currencies are converted into U.S. dollars on a spot (i.e. cash) basis at the spot rate prevailing in the foreign currency exchange market at the time of valuation. Purchases and sales of investments and income denominated in foreign currencies are translated into U.S. dollars on the respective dates of such transactions.
53
Notes to Financial Statements (continued)
The books and records of the Fund are maintained in U.S. dollars. Assets, including investments, and liabilities denominated in foreign currencies are translated into U.S. dollars at the end of each day. Purchases and sales of securities, income and expenses are translated into U.S. dollars at the prevailing exchange rate on the respective dates of the transactions.
Net realized foreign currency gains and losses resulting from changes in exchange rates associated with (i) foreign currency, (ii) investments and (iii) derivatives include foreign currency gains and losses between trade date and settlement date of the transactions, foreign currency transactions, and the difference between the amounts of interest and dividends recorded on the books of the Fund and the amounts actually received are recognized as a component of “Net realized gain (loss) from investments and foreign currency” on the Statement of Operations, when applicable.
The unrealized gains and losses resulting from changes in foreign currency exchange rates and changes in foreign exchange rates associated with (i) investments and (ii) other assets and liabilities are recognized as a component of “Change in net unrealized appreciation (depreciation) of investments and foreign currency” on the Statement of Operations, when applicable. The unrealized gains and losses resulting from changes in foreign exchange rates associated with investments in derivatives are recognized as a component of the respective derivative’s related “Change in net unrealized appreciation (depreciation)” on the Statement of Operations, when applicable.
As of the end of the reporting period, the Fund’s investments in non-U.S. securities were as follows:
| Value | % of Total Investments | |||||||
Country: | ||||||||
United Kingdom | $ | 50,556,657 | 5.3 | % | ||||
France | 31,890,045 | 3.3 | ||||||
China | 29,464,706 | 3.1 | ||||||
Japan | 29,331,298 | 3.1 | ||||||
Canada | 26,019,243 | 2.7 | ||||||
Germany | 23,761,457 | 2.5 | ||||||
Switzerland | 16,458,794 | 1.7 | ||||||
Netherlands | 15,641,864 | 1.6 | ||||||
Australia | 14,544,825 | 1.5 | ||||||
Other | 133,336,198 | 13.8 | ||||||
Total non-U.S. securities | $ | 371,005,087 | 38.6 | % | ||||
Indemnifications
Under the Fund’s organizational documents, its officers and trustees are indemnified against certain liabilities arising out of the performance of their duties to the Fund. In addition, in the normal course of business, the Fund enters into contracts that provide general indemnifications to other parties. The Fund’s maximum exposure under these arrangements is unknown as this would involve future claims that may be made against the Fund that have not yet occurred. However, the Fund has not had prior claims or losses pursuant to these contracts and expects the risk of loss to be remote.
Investments and Investment Income
Securities transactions are accounted for as of the trade date for financial reporting purposes. Trade date for senior and subordinated loans purchased in the “primary market” is considered the date on which the loan allocations are determined. Trade date for senior and subordinated loans purchased in the “secondary market” is the date on which the transaction is entered into. Realized gains and losses on securities transactions are based upon the specific identification method. Dividend income is recorded on the ex-dividend date or, for foreign securities, when information is available. Non-cash dividends received in the form of stock, if any, are recognized on the ex-dividend date and recorded at fair value. Interest income, which is recorded on an accrual basis and includes accretion of discounts and amortization of premiums for financial reporting purposes. Interest income also reflects payment-in-kind (“PIK”) interest, paydown gains and losses and fee income, if any. PIK interest represents income received in the form of securities in lieu of cash. Fee income consists primarily of amendment fees, when applicable. Amendment fees are earned as compensation for evaluating and accepting changes to an original senior loan agreement and are recognized when received. Rehypothecation income is comprised of fees earned in connection with the rehypothecation of pledged collateral as further described in Note 8 – Borrowing Arrangements.
Netting Agreements
In the ordinary course of business, the Fund may enter into transactions subject to enforceable master repurchase agreements, International Swaps and Derivative Association, Inc. (ISDA) master agreements or other similar arrangements (“netting agreements”). Generally, the right to offset in netting agreements allows the Fund to offset certain securities and derivatives with a specific counterparty, when applicable, as well as any collateral received or delivered to that counterparty based on the terms of the agreements. Generally, the Fund manages its cash collateral and securities collateral on a counterparty basis.
The Fund’s investments subject to netting agreements as of the end of the reporting period, if any, are further described in Note 4 – Portfolio Securities and Investments in Derivatives.
54
New Accounting Pronouncements and Rule Issuances
Reference Rate Reform
In March 2020, FASB issued Accounting Standards Update (“ASU”) 2020-04, Reference Rate Reform: Facilitation of the Effects of Reference Rate Reform on Financial Reporting. The main objective of the new guidance is to provide relief to companies that will be impacted by the expected change in benchmark interest rates, when participating banks will no longer be required to submit London Interbank Offered Rate (LIBOR) quotes by the UK Financial Conduct Authority (FCA). The new guidance allows companies to, provided the only changes to existing contracts are a change to an approved benchmark interest rate, account for modifications as a continuance of the existing contract without additional analysis. For new and existing contracts, the Fund may elect to apply the amendments as of March 12, 2020 through December 31, 2022. Management has not yet elected to apply the amendments, is continuously evaluating the potential effect a discontinuation of LIBOR could have on the Fund’s investments and has currently determined that it is unlikely the ASU’s adoption will have a significant impact on the Fund’s financial statements and various filings.
Securities and Exchange Commission (“SEC”) Adopts New Rules to Modernize Fund Valuation Framework
In December 2020, the SEC voted to adopt a new rule governing fund valuation practices. New Rule 2a-5 under the 1940 Act establishes requirements for determining fair value in good faith for purposes of the 1940 Act. Rule 2a-5 will permit fund boards to designate certain parties to perform fair value determinations, subject to board oversight and certain other conditions. Rule 2a-5 also defines when market quotations are “readily available” for purposes of Section 2(a)(41) of the 1940 Act, which requires a fund to fair value a security when market quotations are not readily available. The SEC also adopted new Rule 31a-4 under the 1940 Act, which sets forth the recordkeeping requirements associated with fair value determinations. Finally, the SEC is rescinding previously issued guidance on related issues, including the role of a board in determining fair value and the accounting and auditing of fund investments. Rule 2a-5 and Rule 31a-4 became effective on March 8, 2021, with a compliance date of September 8, 2022. A fund may voluntarily comply with the rules after the effective date, and in advance of the compliance date, under certain conditions. Management is currently assessing the impact of these provisions on the Fund’s financial statements.
3. Investment Valuation and Fair Value Measurements
The Fund’s investments in securities are recorded at their estimated fair value utilizing valuation methods approved by the Board. Fair value is defined as the price that would be received upon selling an investment or transferring a liability in an orderly transaction to an independent buyer in the principal or most advantageous market for the investment. U.S. GAAP establishes the three-tier hierarchy which is used to maximize the use of observable market data and minimize the use of unobservable inputs and to establish classification of fair value measurements for disclosure purposes. Observable inputs reflect the assumptions market participants would use in pricing the asset or liability. Observable inputs are based on market data obtained from sources independent of the reporting entity. Unobservable inputs reflect management’s assumptions about the assumptions market participants would use in pricing the asset or liability. Unobservable inputs are based on the best information available in the circumstances. The following is a summary of the three-tiered hierarchy of valuation input levels.
| Level 1 – | Inputs are unadjusted and prices are determined using quoted prices in active markets for identical securities. | |
| Level 2 – | Prices are determined using other significant observable inputs (including quoted prices for similar securities, interest rates, credit spreads, etc.). | |
| Level 3 – | Prices are determined using significant unobservable inputs (including management’s assumptions in determining the fair value of investments). |
A description of the valuation techniques applied to the Fund’s major classifications of assets and liabilities measured at fair value follows:
Equity securities and exchange-traded funds listed or traded on a national market or exchange are valued based on their sale price at the official close of business of such market or exchange on the valuation date. Foreign equity securities and registered investment companies that trade on a foreign exchange are valued at the last sale price or official closing price reported on the exchange where traded and converted to U.S. dollars at the prevailing rates of exchange on the date of valuation. To the extent these securities are actively traded and that valuation adjustments are not applied, they are generally classified as Level 1. If there is no official close of business, then the latest available sale price is utilized. If no sales are reported, then the mean of the latest available bid and ask prices is utilized and these securities are generally classified as Level 2.
Prices of certain American Depositary Receipts (“ADR”) held by the Funds that trade in the United States are valued based on the last traded price, official closing price, or an evaluated price provided by the independent pricing service (“pricing service”) and are generally classified as Level 1 or 2.
Prices of fixed-income securities are generally provided by a pricing service approved by the Board. The pricing service establishes a security’s fair value using methods that may include consideration of the following: yields or prices of investments of comparable quality, type of issue, coupon, maturity and rating, market quotes or indications of value from security dealers, evaluations of anticipated cash flows or collateral, general market conditions and other information and analysis, including the obligor’s credit characteristics considered relevant. In pricing certain securities, particularly less liquid and lower quality securities, the pricing service may consider information about a security, its issuer or market activity provided by the Adviser. These securities are generally classified as Level 2.
Investments in investment companies are valued at their respective NAVs on the valuation date and are generally classified as Level 1.
For events affecting the value of foreign securities between the time when the exchange on which they are traded closes and the time when the Fund’s net assets are calculated, such securities will be valued at fair value in accordance with procedures adopted by the Board. These foreign securities are generally classified as Level 2.
55
Notes to Financial Statements (continued)
Repurchase agreements are valued at contract amount plus accrued interest, which approximates market value. These securities are generally classified as Level 2.
Any portfolio security or derivative for which market quotations are not readily available or for which the above valuation procedures are deemed not to reflect fair value are valued at fair value, as determined in good faith using procedures approved by the Board. As a general principle, the fair value of a security would appear to be the amount that the owner might reasonably expect to receive for it in a current sale. A variety of factors may be considered in determining the fair value of such securities, which may include consideration of the following: yields or prices of investments of comparable quality, type of issue, coupon, maturity and rating, market quotes or indications of value from security dealers, evaluations of anticipated cash flows or collateral, general market conditions and other information and analysis, including the obligor’s credit characteristics considered relevant. To the extent the inputs are observable and timely, the values would be classified as Level 2 of the fair value hierarchy; otherwise they would be classified as Level 3.
The following table summarizes the market value of the Fund’s investments as of the end of the reporting period, based on the inputs used to value them:
| Level 1 | Level 2 | Level 3 | Total | |||||||||||||
Long-Term Investments*: | ||||||||||||||||
Common Stocks | $ | 310,859,455 | $ | 101,498,775 | ** | $ | 11,301 | ** | $ | 412,369,531 | ||||||
Asset-Backed and Mortgage-Backed Securities | — | 124,183,224 | — | 124,183,224 | ||||||||||||
Variable Rate Senior Loan Interests | — | 109,946,064 | 592,285 | ** | 110,538,349 | |||||||||||
Real Estate Investment Trust Common Stocks | 103,430,800 | 703,728 | ** | — | 104,134,528 | |||||||||||
$1,000 Par (or similar) Institutional Preferred | — | 61,290,173 | — | 61,290,173 | ||||||||||||
Emerging Market Debt and Foreign Corporate Bonds | — | 57,049,539 | — | 57,049,539 | ||||||||||||
Contingent Capital Securities | — | 47,797,566 | — | 47,797,566 | ||||||||||||
$25 Par (or similar) Retail Preferred | 24,043,724 | 2,526,265 | ** | — | 26,569,989 | |||||||||||
Corporate Bonds | — | 16,118,976 | — | 16,118,976 | ||||||||||||
Warrants | — | 437,173 | ** | — | 437,173 | |||||||||||
Investment Companies | 170,510 | — | — | 170,510 | ||||||||||||
Short-Term Investments: | ||||||||||||||||
Repurchase Agreements | — | 983,413 | — | 983,413 | ||||||||||||
Total | $ | 438,504,489 | $ | 522,534,896 | $ | 603,586 | $ | 961,642,971 | ||||||||
| * | Refer to the Fund’s Portfolio of Investments for industry and country classifications, where applicable. |
| ** | Refer to the Fund’s Portfolio of Investments for securities classified as Level 2 and/or Level 3, when applicable. |
4. Portfolio Securities and Investments in Derivatives
Portfolio Securities
Dollar Roll Transactions
The Fund may enter into mortgage dollar rolls in which the Fund sells mortgage securities for delivery in the current month, realizing a gain (loss), and simultaneously contracts to repurchase similar securities on a specified future date. During the roll period, the Fund forgoes principal and interest paid on the securities. The Fund is compensated by the interest earned on the cash proceeds of the initial sale and by the lower repurchase price at the future date. The difference between the sales proceeds and the repurchase price is recorded as a realized gain or loss.
Unfunded Commitments
Pursuant to the terms of certain of the variable rate senior loan agreements, the Fund may have unfunded senior loan commitments. The Fund will maintain with its custodian, cash, liquid securities and/or liquid senior loans having an aggregate value at least equal to the amount of unfunded senior loan commitments. As of the end of the reporting period, the Fund had $175,744 in outstanding unfunded senior loan commitments.
Participation Commitments
With respect to the senior loans held in the Fund’s portfolio, the Fund may: 1) invest in assignments; 2) act as a participant in primary lending syndicates; or 3) invest in participations. If the Fund purchases a participation of a senior loan interest, the Fund would typically enter into a contractual agreement with the lender or other third party selling the participation, rather than directly with the borrower. As such, the Fund not only assumes the credit risk of the borrower, but also that of the selling participant or other persons interpositioned between the Fund and the borrower. As of the end of the reporting period, the Fund had no such outstanding participation commitments.
Repurchase Agreements
In connection with transactions in repurchase agreements, it is the Fund’s policy that its custodian take possession of the underlying collateral securities, the fair value of which exceeds the principal amount of the repurchase transaction, including accrued interest, at all times. If the counterparty defaults, and the fair value of the collateral declines, realization of the collateral may be delayed or limited.
56
The following table presents the repurchase agreements for the Fund that are subject to netting agreements as of the end of the reporting period, and the collateral delivered related to those repurchase agreements.
| Counterparty | Short-Term Investments, at Value | Collateral Pledged (From) Counterparty | ||||||
Fixed Income Clearing Corporation | $ | 983,413 | $ | (1,003,157 | ) | |||
Zero Coupon Securities
A zero coupon security does not pay a regular interest coupon to its holders during the life of the security. Income to the holder of the security comes from accretion of the difference between the original purchase price of the security at issuance and the par value of the security at maturity and is effectively paid at maturity. The market prices of zero coupon securities generally are more volatile than the market prices of securities that pay interest periodically.
Investment Transactions
Long-term purchases and sales (including maturities and dollar roll transactions) during the current fiscal period aggregated $727,266,887 and $613,218,583, respectively.
The Fund may purchase securities on a when-issued or delayed-delivery basis. Securities purchased on a when-issued or delayed-delivery basis may have extended settlement periods; interest income is not accrued until settlement date. Any securities so purchased are subject to market fluctuation during this period. The Fund has earmarked securities in its portfolio with a current value at least equal to the amount of the when-issued/delayed-delivery purchase commitments. If the Fund has outstanding when-issued/delayed-delivery purchases commitments as of the end of the reporting period, such amounts are recognized on the Statement of Assets and Liabilities.
Investments in Derivatives
The Fund is authorized to invest in certain derivative instruments, such as futures, options and swap contracts. The Fund limits its investments in futures, options on futures and swap contracts to the extent necessary for the Adviser to claim the exclusion from registration by the Commodity Futures Trading Commission as a commodity pool operator with respect to the Fund. The Fund records derivative instruments at fair value, with changes in fair value recognized on the Statement of Operations, when applicable. Even though the Fund’s investments in derivatives may represent economic hedges, they are not considered to be hedge transactions for financial reporting purposes.
Although the Fund is authorized to invest in derivative instruments and may do so in the future, it did not make any such investments during the current fiscal period.
Market and Counterparty Credit Risk
In the normal course of business the Fund may invest in financial instruments and enter into financial transactions where risk of potential loss exists due to changes in the market (market risk) or failure of the other party to the transaction to perform (counterparty credit risk). The potential loss could exceed the value of the financial assets recorded on the financial statements. Financial assets, which potentially expose the Fund to counterparty credit risk, consist principally of cash due from counterparties on forward, option and swap transactions, when applicable. The extent of the Fund’s exposure to counterparty credit risk in respect to these financial assets approximates their carrying value as recorded on the Statement of Assets and Liabilities.
The Fund helps manage counterparty credit risk by entering into agreements only with counterparties the Adviser believes have the financial resources to honor their obligations and by having the Adviser monitor the financial stability of the counterparties. Additionally, counterparties may be required to pledge collateral daily (based on the daily valuation of the financial asset) on behalf of the Fund with a value approximately equal to the amount of any unrealized gain above a pre-determined threshold. Reciprocally, when the Fund has an unrealized loss, the Fund has instructed the custodian to pledge assets of the Fund as collateral with a value approximately equal to the amount of the unrealized loss above a pre-determined threshold. Collateral pledges are monitored and subsequently adjusted if and when the valuations fluctuate, either up or down, by at least the pre-determined threshold amount.
5. Fund Shares
Common Shares Transactions
Transactions in common shares during the current fiscal period were as follows:
For the period 11/22/21 (commencement of operations) through 12/31/21 | ||||
Common shares: | ||||
Issued in the Reorganizations | 33,425,644 | |||
57
Notes to Financial Statements (continued)
6. Income Tax Information
The Fund intends to distribute substantially all of its net investment company taxable income to shareholders and to otherwise comply with the requirements of Subchapter M of the Internal Revenue Code applicable to regulated investment companies. In any year when the Fund realizes net capital gains, the Fund may choose to distribute all or a portion of its net capital gains to shareholders, or alternatively, to retain all or a portion of its net capital gains and pay federal corporate income taxes on such retained gains.
For all open tax years and all major taxing jurisdictions, management of the Fund has concluded that there are no significant uncertain tax positions that would require recognition in the financial statements. Open tax years are those that are open for examination by taxing authorities (i.e., generally the last four tax year ends and the interim tax period since then). Furthermore, management of the Fund is also not aware of any tax positions for which it is reasonably possible that the total amounts of unrecognized tax benefits will significantly change in the next twelve months.
The following information is presented on an income tax basis. Differences between amounts for financial statement and federal income tax purposes are primarily due to recognition of premium amortization and timing differences in recognizing certain gains and losses on investment transactions. To the extent that differences arise that are permanent in nature, such amounts are reclassified within the capital accounts as detailed below. Temporary differences do not require reclassification. Temporary and permanent differences do not impact the NAV of the Fund.
The table below presents the cost and unrealized appreciation (depreciation) of the Fund’s investment portfolio, as determined on a federal income tax basis as of December 31, 2021.
Tax cost of investments | $ | 841,844,012 | ||
Gross unrealized: | ||||
Appreciation | 138,536,412 | |||
Depreciation | (18,737,453 | ) | ||
Net unrealized appreciation (depreciation) of investments | $ | 119,798,959 |
Permanent differences, primarily due to foreign currency transactions, distribution reallocations, bond premium amortization adjustments, investments in passive foreign investment companies, real estate investment trust adjustments, nondeductible reorganization expenses, reorganization adjustments, and complex securities character adjustments, resulted in reclassifications among the Fund’s components of net assets as of December 31, 2021, the Fund’s tax year end.
The tax components of undistributed net ordinary income and net long-term capital gains as of December 31, 2021, the Fund’s tax year end, were as follows:
Undistributed net ordinary income | $ | — | ||
Undistributed net long-term capital gains | 62,313,614 |
The tax character of distributions paid during the Fund’s tax year ended December 31, 2021 was designated for purposes of the dividends paid deduction as follows:
Distributions from net ordinary income1 | $ | 5,818,970 | ||
Distributions from net long-term capital gains2 | 5,880,006 |
| 1 | Net ordinary income consists of net taxable income derived from dividends, interest, and net short-term capital gains, if any. |
| 2 | The Fund hereby designates as long-term capital gain dividend, pursuant to Internal Revenue Code 852(b)(3), the amount necessary to reduce earnings and profits of the Fund related to net capital gain to zero for the period November 22, 2021 (commencement of operations) through December 31, 2021. |
During the Fund’s tax year ended December 31, 2021, the Fund utilized $554,862 of its capital loss carryforward that was acquired from JTA as part of the Reorganization previously described in Note 1 - General Information.
7. Management Fees
The Fund’s management fee compensates the Adviser for overall investment advisory and administrative services and general office facilities. The Sub-Advisers are compensated for their services to the Fund from the management fees paid to the Adviser.
The Fund’s management fee consists of two components – a fund-level fee, based only on the amount of assets within the Fund, and a complex-level fee, based on the aggregate amount of all eligible fund assets managed by the Adviser. This pricing structure enables Fund shareholders to benefit from growth in the assets within the Fund as well as from growth in the amount of complex-wide assets managed by the Adviser.
58
The annual fund-level fee, payable monthly, is calculated according to the following schedule:
| Average Daily Managed Assets* | Fund-Level Fee Rate | |||
For the first $500 million | 0.7000 | % | ||
For the next $500 million | 0.6750 | |||
For the next $500 million | 0.6500 | |||
For the next $500 million | 0.6250 | |||
For managed assets over $2 billion | 0.6000 | |||
The annual complex-level fee, payable monthly, is calculated by multiplying the current complex-wide fee rate, determined according to the following schedule by the Fund’s daily managed assets:
| Complex-Level Eligible Asset Breakpoint Level* | Effective Complex-Level Fee Rate at Breakpoint Level | |||
$55 billion | 0.2000 | % | ||
$56 billion | 0.1996 | |||
$57 billion | 0.1989 | |||
$60 billion | 0.1961 | |||
$63 billion | 0.1931 | |||
$66 billion | 0.1900 | |||
$71 billion | 0.1851 | |||
$76 billion | 0.1806 | |||
$80 billion | 0.1773 | |||
$91 billion | 0.1691 | |||
$125 billion | 0.1599 | |||
$200 billion | 0.1505 | |||
$250 billion | 0.1469 | |||
$300 billion | 0.1445 | |||
| * | For the complex-level fees, managed assets include closed-end fund assets managed by the Adviser that are attributable to certain types of leverage. For these purposes, leverage includes the funds’ use of preferred stock and borrowings and certain investments in the residual interest certificates (also called inverse floating rate securities) in tender option bond (TOB) trusts, including the portion of assets held by a TOB trust that has been effectively financed by the trust’s issuance of floating rate securities, subject to an agreement by the Adviser as to certain funds to limit the amount of such assets for determining managed assets in certain circumstances. The complex-level fee is calculated based upon the aggregate daily managed assets of all Nuveen open-end and closed-end funds that constitute “eligible assets.” Eligible assets do not include assets attributable to investments in other Nuveen funds or assets in excess of a determined amount (originally $2 billion) added to the Nuveen fund complex in connection with the Adviser’s assumption of the management of the former First American Funds effective January 1, 2011, but do not included certain assets of certain Nuveen funds that were reorganized into funds advised by an affiliate of the Adviser during the 2019 calendar year. As of December 31, 2021, the complex-level fee for the Fund was 0.1531%. |
8. Borrowing Arrangements
Borrowings
The Fund has entered into a $300,000,000 (maximum commitment amount) borrowing arrangements (“Borrowings”) as a means of leverage. As of the end of the reporting period, the outstanding balance on these Borrowings was $178,550,000.
Interest is charged on the Borrowings at a rate per annum equal to OBFR (Overnight Bank Funding Rate) plus a spread that is determined by a portion of the underlying collateral pledged to secure the amount borrowed. The Fund is typically charged an undrawn fee of 0.50% per annum if the undrawn portion of the Borrowings on that day is more than 20% of the maximum commitment amount, which was waived during the reporting period.
During the current fiscal period, the average daily balance outstanding (which was for the period November 22, 2021 through December 31, 2021) and average annual interest rate on these Borrowings were $178,550,000 and 0.53%, respectively.
In order to maintain these Borrowings, the Fund must meet certain collateral, asset coverage and other requirements. The Fund’s Borrowings outstanding is fully secured by eligible securities held in its portfolio of investments (“Pledged Collateral”).
Borrowings outstanding are recognized as “Borrowings” on the Statement of Assets and Liabilities. Interest expense incurred on the borrowed amount and undrawn balance are recognized as components of “Interest expense” on the Statement of Operations.
Rehypothecation
The Fund has entered into a Rehypothecation Side Letter (“Side Letter”) with its prime brokerage lender, allowing it to re-register the Pledged Collateral in its own name or in a name other than the Fund’s to pledge, repledge, hypothecate, rehypothecate, sell, lend or otherwise transfer or use the Pledged Collateral (the “Hypothecated Securities”) with all rights of ownership as described in the Side Letter. Subject to certain conditions, the total value of the
59
Notes to Financial Statements (continued)
outstanding Hypothecated Securities shall not exceed the lesser of (i) 98% of the outstanding balance on the Borrowings to which the Pledged Collateral relates and (ii) 331⁄3% of the Fund’s total assets. The Fund may designate any Pledged Collateral as ineligible for rehypothecation. The Fund may also recall Hypothecated Securities on demand.
The Fund also has the right to apply and set-off an amount equal to one-hundred percent (100%) of the then-current fair market value of such Pledged Collateral against the current Borrowings under the Side Letter in the event that the prime brokerage lender fails to timely return the Pledged Collateral and in certain other circumstances. In such circumstances, however, the Fund may not be able to obtain replacement financing required to purchase replacement securities and, consequently, the Fund’s income generating potential may decrease. Even if the Fund is able to obtain replacement financing, it might not be able to purchase replacement securities at favorable prices.
The Fund will receive a fee in connection with the Hypothecated Securities (“Rehypothecation Fees”) in addition to any principal, interest, dividends and other distributions paid on the Hypothecated Securities.
As of the end of the reporting period, the Fund did not have any Hypothecated Securities.
Inter-Fund Borrowing and Lending
The SEC has granted an exemptive order permitting registered open-end and closed-end Nuveen funds to participate in an inter-fund lending facility whereby the Nuveen funds may directly lend to and borrow money from each other for temporary purposes (e.g., to satisfy redemption requests or when a sale of securities “fails,” resulting in an unanticipated cash shortfall) (the “Inter-Fund Program”). The closed-end Nuveen funds, including the Fund covered by this shareholder report, will participate only as lenders, and not as borrowers, in the Inter-Fund Program because such closed-end funds rarely, if ever, need to borrow cash to meet redemptions. The Inter-Fund Program is subject to a number of conditions, including, among other things, the requirements that (1) no fund may borrow or lend money through the Inter-Fund Program unless it receives a more favorable interest rate than is typically available from a bank or other financial institution for a comparable transaction; (2) no fund may borrow on an unsecured basis through the Inter-Fund Program unless the fund’s outstanding borrowings from all sources immediately after the inter-fund borrowing total 10% or less of its total assets; provided that if the borrowing fund has a secured borrowing outstanding from any other lender, including but not limited to another fund, the inter-fund loan must be secured on at least an equal priority basis with at least an equivalent percentage of collateral to loan value; (3) if a fund’s total outstanding borrowings immediately after an inter-fund borrowing would be greater than 10% of its total assets, the fund may borrow through the inter-fund loan on a secured basis only; (4) no fund may lend money if the loan would cause its aggregate outstanding loans through the Inter-Fund Program to exceed 15% of its net assets at the time of the loan; (5) a fund’s inter-fund loans to any one fund shall not exceed 5% of the lending fund’s net assets; (6) the duration of inter-fund loans will be limited to the time required to receive payment for securities sold, but in no event more than seven days; and (7) each interfund loan may be called on one business day’s notice by a lending fund and may be repaid on any day by a borrowing fund. In addition, a Nuveen fund may participate in the Inter-Fund Program only if and to the extent that such participation is consistent with the fund’s investment objective and investment policies. The Board is responsible for overseeing the Inter-Fund Program.
The limitations detailed above and the other conditions of the SEC exemptive order permitting the Inter-Fund Program are designed to minimize the risks associated with Inter-Fund Program for both the lending fund and the borrowing fund. However, no borrowing or lending activity is without risk. When a fund borrows money from another fund, there is a risk that the loan could be called on one day’s notice or not renewed, in which case the fund may have to borrow from a bank at a higher rate or take other actions to payoff such loan if an inter-fund loan is not available from another fund. Any delay in repayment to a lending fund could result in a lost investment opportunity or additional borrowing costs.
During the current reporting period, the Fund did not enter into any inter-fund loan activity.
9. Fund Reorganizations
The Reorganizations as previously described in Note 1 – General Information were structured to qualify as tax-free reorganizations under the Internal Revenue Code for federal income tax purposes, and the Target Funds’ shareholders recognized no gain or loss for federal income tax purposes as a result. Prior to the closing of the Reorganizations, the Target Funds distributed all of its net investment income and capital gains, if any. Such a distribution may be taxable to the Target Funds’ shareholders for federal income tax purposes.
Investments
The cost, fair value and net unrealized appreciation (depreciation) of the investments (including investments in derivatives) of the Target Funds as of the date of the Reorganizations, were as follows:
| JDD | JTA | JTD | ||||||||||
Cost of investments | $ | 225,449,207 | $ | 172,019,376 | $ | 258,138,698 | ||||||
Fair value of investments | 268,901,728 | 212,083,392 | 362,712,011 | |||||||||
Net unrealized appreciation (depreciation) of investments | 43,452,521 | 40,064,016 | 104,573,313 | |||||||||
60
For financial reporting purposes, assets received and shares issued by the Fund were recorded at fair value; however, the cost basis of the investments received from the Target Funds were carried forward to align ongoing reporting of the Fund’s realized and unrealized gains and losses with amounts distributable to shareholders for tax purposes.
Common Shares
The common shares outstanding, net assets applicable to common shares and NAV per common share outstanding immediately before and after the Reorganizations were as follows:
| Target Funds – Prior to Reorganizations | JDD | JTA | JTD | |||||||||
Common shares outstanding | 19,668,517 | 13,850,897 | 14,484,340 | |||||||||
Net assets applicable to common shares | $230,667,199 | $174,050,706 | $263,796,262 | |||||||||
NAV per common share outstanding | $ 11.73 | $ 12.57 | $ 18.21 | |||||||||
| The Fund – Prior to Reorganizations | ||||||||||||
Common shares outstanding | 1 | |||||||||||
Net assets applicable to common shares | $ 20 | |||||||||||
NAV per common share outstanding | $ 20.00 | |||||||||||
| The Fund – Post Reorganizations | ||||||||||||
Common shares outstanding | 33,425,645 | |||||||||||
Net assets applicable to common shares | $668,514,187 | |||||||||||
NAV per common share outstanding | $ 20.00 | |||||||||||
Pro Forma Results of Operations
There are no pro forma results of operations to present for the Fund from the period January 1, 2021, the beginning of the Target Funds’ current fiscal period, through November 22, 2021, as the Fund had not commenced operations prior to the closing of the Reorganizations.
Because the combined investment portfolios for the Reorganizations have been managed as a single integrated portfolio since the Reorganizations were completed, it is not practicable to separate the amounts of revenue and earnings of the Target Funds that have been included in the Statement of Operations for the Fund since the Reorganizations were consummated.
Costs and Expenses
In connection with the Reorganizations, the Acquiring Fund incurred certain associated costs and expenses. Such amounts were included as components of “Accrued other expenses” on the Statement of Assets and Liabilities and “Reorganization expenses” on the Statement of Operations.
61
(Unaudited)
CURRENT INVESTMENT OBJECTIVES, INVESTMENT POLICIES AND PRINCIPAL RISKS OF THE FUND
NUVEEN MULTI-ASSET INCOME FUND (NMAI)
Investment Objectives
The Fund’s investment objective is to provide total return through high current income and capital appreciation.
Investment Policies
Under normal circumstances, the Fund will dynamically invest in a portfolio of equity and debt securities of issuers located around the world. This dynamic investment strategy uses a risk-based framework in which any amount can be allocated to an asset-class at any time. The Fund may invest in equity and debt securities of any type. The Fund may use derivatives for a variety of reasons, including but not limited to, adjusting its exposures to markets, sectors, asset classes and securities, and may utilize derivatives of any type.
As part of its investment strategy, the Fund may employ an options strategy whereby the Fund sells (writes) call options on a percentage of the market value of the Fund’s equity portfolio. The Fund is not required to allocate its investments among asset classes, issuer jurisdiction, or any other investment parameter in any fixed proportion except as specifically described herein.
The Fund will employ a dynamic asset allocation strategy in seeking to achieve the Fund’s investment objective. Nuveen Asset Management, LLC (“Nuveen Asset Management”) will implement the Fund’s dynamic multi-asset income strategy by allocating the Fund’s assets among equity and debt investments.
The relative allocations of the Fund’s Managed Assets (as defined below) for investment between equity and debt securities, and relative allocations to the different types of equity and income strategies, will vary from time to time consistent with the Fund’s investment objective.
“Managed Assets” mean the total assets of the Fund, minus the sum of its accrued liabilities (other than Fund liabilities incurred for the express purpose of creating leverage). Total assets for this purpose shall include assets attributable to the Fund’s use of leverage (whether or not those assets are reflected in the Fund’s financial statements for purposes of generally accepted accounting principles), and derivatives will be valued at their market value.
Under normal market conditions:
| • | The Fund may invest in equity securities of any type and across various investment styles (e.g., growth- or value-oriented styles), sectors, market capitalizations (e.g., large-, mid-, and small-cap) and geographic regions throughout the world (including the U.S., non-U.S. developed markets, and emerging markets) without limit. |
| • | The Fund may invest in debt securities of any type without limit. The Fund may invest in debt securities paying a fixed or fluctuating rate of interest, and with any maturity or duration. The Fund may invest in debt securities across various geographic regions throughout the world (including the U.S., non-U.S. developed markets, and emerging markets) without limit. |
| • | The Fund may invest in debt securities of any rating (including below-investment-grade debt securities, commonly known as “high yield” or “junk” bonds), distressed securities, and in debt securities that are unrated. |
| • | The Acquiring Fund may invest in the securities of companies of any market capitalization. |
| • | The Fund may invest in illiquid securities (i.e., securities that are not readily marketable), including, but not limited to, restricted securities (securities the disposition of which is restricted under the federal securities laws), securities that may be resold only pursuant to Rule 144A under the Securities Act of 1933 Act, as amended (the “1933 Act”), and repurchase agreements with maturities in excess of seven days. |
| • | The Fund may invest in inverse floating rate securities. |
The foregoing policies apply only at the time of any new investment.
Approving Changes in Investment Policies
The Board of Trustees of the Fund may change the policies described above without a shareholder vote.
Portfolio Contents
The Fund may invest in equity securities of any type and across various investment styles (e.g., growth- or value-oriented styles), sectors, market capitalizations (e.g., large-, mid-, and small-cap) and geographic regions throughout the world (including the U.S. and emerging markets) without limit.
62
These securities may include, but are not limited to, common stock, preferred stock, securities convertible into common, depositary receipts, stock, master-limited partnership (“MLPs”) and other partnership interests, real estate investment trusts (“REITs”), rights and warrants, or securities or other instruments whose price is linked to (or derived from) the value of common stock.
Common stocks generally represent an ownership interest in an issuer, without preference over any other class of securities, including such issuer’s debt securities, preferred stock and other senior equity securities. Common stocks are entitled to the income and increase in the value of the assets and business of the issuer after all its debt obligations and obligations to preferred stockholders are satisfied. Common stocks generally have voting rights. Common stocks fluctuate in price in response to many factors, including historical and prospective earnings of the issuer, the value of its assets, general economic conditions, interest rates, investor perceptions and market liquidity.
Equity securities in which the Fund may invest include MLPs. An MLP is an entity, most commonly a limited partnership, that is taxed as a partnership, publicly traded and listed on a national securities exchange. Holders of common units of MLPs typically have limited control and limited voting rights as compared to holders of a corporation’s common shares.
The Fund may invest in all types of preferred securities, including both traditional preferred securities and non-traditional preferred securities. Traditional preferred securities are generally equity securities of the issuer that have priority over the issuer’s common shares as to the payment of dividends (i.e., the issuer cannot pay dividends on its common shares until the dividends on the preferred shares are current) and as to the payout of proceeds of a bankruptcy or other liquidation, but are subordinate to an issuer’s senior debt and junior debt as to both types of payments. Additionally, in a bankruptcy or other liquidation, traditional preferred securities are generally subordinate to an issuer’s trade creditors and other general obligations. Traditional preferred securities may be perpetual or have a term, and typically have a fixed liquidation (or “par”) value.
The Fund may invest in contingent capital securities (sometimes referred to as “CoCos”). CoCos are hybrid securities, issued primarily by non-U.S. financial institutions, which have loss absorption mechanisms benefitting the issuer built into their terms. CoCos generally provide for mandatory conversion into the common stock of the issuer or a write-down of the principal amount or value of the CoCos upon the occurrence of certain triggers linked to regulatory capital thresholds. In addition, they may provide for mandatory conversion or a principal write-down upon the occurrence of certain events such as regulatory actions calling into question the issuing banking institution’s continued viability as a going-concern. Equity conversion or principal write-down features are tailored to the issuer and its regulatory requirements and, unlike traditional convertible securities, conversions are not voluntary.
The Fund may invest in REITs. REITs are publicly traded corporations or trusts that specialize in acquiring, holding, and managing residential, commercial or industrial real estate. A REIT is not taxed at the entity level on income distributed to its shareholders or unitholders if it distributes to shareholders or unitholders at least 90% of its taxable income for each taxable year and complies with regulatory requirements relating to its organization, ownership, assets and income.
The Fund may invest in equity securities of special purpose acquisition companies (“SPACs”). Also known as a “blank check company,” a SPAC is a company with no commercial operations that is formed solely to raise capital from investors for the purpose of acquiring one or more existing private companies. SPACs often have pre-determined time frames to make an acquisition (typically two years), or the SPAC will liquidate.
The Fund may invest in debt securities of any type without limit, including but not limited to debt securities of the U.S. government and other governments throughout the world (including emerging markets) as well as their agencies and instrumentalities and government-sponsored enterprises, municipal securities, domestic and foreign corporate debt obligations, convertible bonds, municipal bonds, structured notes, credit-linked notes, loan assignments and participations, repurchase agreements, residential and commercial mortgage-backed securities, asset-backed securities, debt obligations of MLPs, and securities issued or guaranteed by certain international organizations such as the World Bank.
The debt obligations in which the Fund may invest may have variable, floating, or fixed interest rates. Variable rate securities provide for periodic adjustments in the interest rate. Floating rate securities are generally offered at an initial interest rate which is at or above prevailing market rates. The interest rate paid on floating rate securities is then reset periodically (commonly every 90 days) to an increment over some predetermined interest rate index. Commonly utilized indices include the three-month Treasury bill rate, the 180-day Treasury bill rate, the one-month or three-month London Inter-bank Offered Rate (“LIBOR”), the prime rate of a bank, the commercial paper rates, or the longer-term rates on U.S. Treasury securities. Variable and floating rate securities are relatively long-term instruments that often carry demand features permitting the holder to demand payment of principal at any time or at specified intervals prior to maturity plus accrued interest. In order to most effectively use these securities, the must correctly assess probable movements in interest rates.
The Fund may invest in debt securities paying a fixed or fluctuating rate of interest, including senior loans and secured and unsecured junior loans, and with any maturity or duration.
The Fund may invest in debt securities across various geographic regions throughout the world (including the U.S., non-U.S. developed markets, and emerging markets) without limit.
63
Shareholder Update (continued)
(Unaudited)
The Fund may invest in foreign securities payable in either U.S. dollars or foreign currencies. These securities may include securities issued or guaranteed by (i) the Government of Canada, any Canadian Province or any instrumentality and political subdivision thereof; (ii) any other foreign government agency or instrumentality; (iii) foreign subsidiaries of U.S. corporations; and (iv) other foreign issuers.
The Fund has no geographic limits on where it may invest, and therefore may invest in the securities of corporate and governmental issuers in both developed and emerging markets around the world. The Fund may emphasize foreign securities when the Fund’s applicable sub-adviser expects these investments to outperform U.S. securities. In addition to investing in foreign securities, the Fund may actively manage its exposure to foreign currencies through the use of forward currency contracts and other currency derivatives.
The Fund will classify an issuer of a security as being a U.S. or non-U.S. issuer based on the determination of an unaffiliated, recognized financial data provider. Such determinations are based on a number of criteria, such as the issuer’s country of domicile, the primary exchange on which the security predominately trades, the location from which the majority of the issuer’s revenue comes, and the issuer’s reporting currency. The Fund will classify an issuer of a security as being a U.S. or non-U.S. issuer based on the determination of an unaffiliated, recognized financial data provider. Such determinations are based on a number of criteria, such as the issuer’s country of domicile, the primary exchange on which the security predominately trades, the location from which the majority of the issuer’s revenue comes, and the issuer’s reporting currency. Furthermore, a country is considered to be an “emerging market” if it has a relatively low gross national product per capita compared to the world’s major economies and the potential for rapid economic growth. The Fund considers a country an emerging market country based on the determination of an international organization, such as the International Monetary Fund (“IMF”), or an unaffiliated, recognized financial data provider.
The Fund may invest in debt securities of any rating (including below-investment-grade debt securities, commonly known as “high yield” or “junk” bonds), distressed securities, and in debt securities that are unrated. The Fund may invest in junk bonds and distressed securities when the Fund’s applicable sub-adviser believes that they will provide an attractive total return, relative to their risk, as compared to higher quality debt securities. The Fund may invest in distressed securities when the Fund’s applicable sub-adviser believes they offer significant potential for higher returns or can be exchanged for other securities that offer this potential.
The Fund may invest in debt securities of governmental issuers in all countries, including emerging market countries. These debt securities may include: debt securities issued or guaranteed by governments and governmental agencies or instrumentalities; debt securities issued by government owned, controlled or sponsored entities; interests in entities organized and operated for the purpose of restructuring the investment characteristics of instruments issued by any of the above issuers; Brady Bonds, which are debt securities issued under the framework of the Brady Plan as a means for debtor nations to restructure their outstanding external indebtedness; participations in loans between governments and financial institutions; or debt securities issued by supranational entities such as the World Bank or the European Economic Community. A supranational entity is a bank, commission or company established or financially supported by the national governments of one or more countries to promote reconstruction or development.
The Fund may invest in U.S. dollar-denominated “Brady Bonds.” Brady Bonds are created through the exchange of existing commercial bank loans to public and private entities in certain emerging markets for new obligations in connection with debt restructurings. These foreign debt obligations, which may be fixed rate par bonds or floating rate discount bonds, are generally collateralized in full as to repayment of principal at maturity by U.S. Treasury zero-coupon obligations that have the same maturity as the Brady Bonds. Brady Bonds can be viewed as having three or four valuation components: (i) the collateralized repayment of principal at final maturity; (ii) the collateralized interest payments; (iii) the uncollateralized interest payments; and (iv) any uncollateralized repayment of principal at maturity.
The Fund may invest in convertible securities, which may include convertible debt, convertible preferred stock, synthetic convertible securities and may also include secured and unsecured debt, based upon the judgment of the Fund’s applicable sub-adviser. Convertible securities may pay interest or dividends that are based on a fixed or floating rate. A convertible security is a preferred stock, warrant or other security that may be converted into or exchanged for a prescribed amount of common stock or other security of the same or a different issuer or into cash within a particular period of time at a specified price or formula.
The Fund may invest corporate debt securities. Corporate debt securities are bonds, senior loans and notes issued by corporations or other business entities.
Corporate debt securities are fully taxable debt obligations that fund capital improvements, expansions, debt refinancing or acquisitions that require more capital than would ordinarily be available from a single lender. Investors in corporate debt securities lend money to the issuing corporation in exchange for interest payments and repayment of the principal at a set maturity date. Rates on corporate debt securities are set according to prevailing interest rates at the time of the issue, the credit rating of the issuer, the length of the maturity and other terms of the security, such as a call feature. Corporate debt securities are subject to the risk of an issuer’s inability to meet principal and interest payments on the obligations and may also be subject to price volatility due to such factors as market interest rates, market perception of the creditworthiness of the issuer and general market liquidity. In addition, corporate restructurings, such as mergers, leveraged buyouts, takeovers or similar corporate transactions are often financed by an increase in a corporate issuer’s debt securities. As a result of the added debt burden, the credit quality and market value of an issuer’s existing debt securities may decline significantly.
64
The Fund may invest in exchange-traded notes (“ETNs”). ETNs are a type of senior, unsecured, unsubordinated debt security issued by financial institutions that combines both aspects of bonds and ETFs. An ETN’s returns are based on the performance of a market index minus fees and expenses. ETNs are listed on an exchange and traded in the secondary market. An ETN can be held until the ETN’s maturity, at which time the issuer will pay a return linked to the performance of the market index to which the ETN is linked minus certain fees.
The Fund may invest in the securities of companies of any market capitalization. The Fund will generally seek diversification across markets and industries.
The Fund may invest in senior loans. Senior loans typically hold the most senior position in the capital structure of a business entity, are typically secured with specific collateral and have a claim on the assets and/or stock of the issuer that is senior to that held by subordinated debt holders and stockholders of the issuer.
Senior loans generally include: (i) senior loans made by banks or other financial institutions to U.S. and non-U.S. corporations, partnerships and other business entities (each a “Borrower” and, collectively, “Borrowers”), (ii) assignments of such interests in senior loans, or (iii) participation interests in senior loans. Generally, an assignment is the actual sale of the loan, in whole or in part. A participation, on the other hand, means that the original lender maintains ownership over the loan and the participant has only a contract right against the original lender, not a credit relationship with the Borrower. Senior loans typically hold the most senior position in the capital structure of a Borrower, are typically secured with specific collateral and have a claim on the assets and/or stock of the Borrower that is senior to that held by subordinated debt holders and stockholders of the Borrower. The capital structure of a Borrower may include senior loans, senior and junior subordinated debt, preferred stock and common stock issued by the Borrower, typically in descending order of seniority with respect to claims on the Borrower’s assets. The proceeds of senior loans primarily are used by Borrowers to finance leveraged buyouts, recapitalizations, mergers, acquisitions, stock repurchases, refinancings, internal growth and for other corporate purposes. A senior loan is typically originated, negotiated and structured by a U.S. or non-U.S. commercial bank, insurance company, finance company or other financial institution (“Agent”) for a lending syndicate of financial institutions which typically includes the Agent (“Lenders”). The Agent typically administers and enforces the senior loan on behalf of the other Lenders in the syndicate. In addition, an institution, typically but not always the Agent, holds any collateral on behalf of the Lenders. The Fund normally will rely primarily on the Agent to collect principal of and interest on a senior loan. Also, the Fund usually will rely on the Agent to monitor compliance by the Borrower with the restrictive covenants in a loan agreement.
Senior loans typically have rates of interest that are redetermined either daily, monthly, quarterly or semi-annually by reference to a base lending rate plus a premium or credit spread. These base lending rates are primarily the London Inter-Bank Offered Rate (“LIBOR”), and secondarily the prime rate offered by one or more major U.S. banks and the certificate of deposit rate or other base lending rates used by commercial lenders. The base rate for senior loans has not yet been determined with the upcoming discontinuation of LIBOR. As adjustable rate loans, the frequency of how often a senior loan resets its interest rate will impact how closely such senior loans track current market interest rates.
The Fund may purchase participation interests in the original syndicate making senior loans. Loan participation interests typically represent direct participations in a loan to a corporate Borrower, and generally are offered by banks or other financial institutions or lending syndicates. The Fund may participate in such syndications, or can buy part of a senior loan, becoming a Lender. When purchasing a participation interest, the Fund assumes the credit risk associated with the corporate Borrower and may assume the credit risk associated with an interposed bank or other financial intermediary. The participation interests in which the Fund may invest may not be rated by any nationally recognized statistical rating organization.
The Fund may invest in second lien loans and unsecured loans. Such loans are made by public and private corporations and other non-governmental Borrowers for a variety of purposes. As in the case of senior loans, the Fund may purchase interests in second lien loans and unsecured loans through assignments or participations. Second lien loans have similar characteristics as senior loans except that such interests are junior in priority to debt secured with a first lien. Second lien loans are second in priority of payment to one or more senior loans of the related Borrower and are typically secured by a second priority security interest or lien to or on specified collateral securing the Borrower’s obligation under the indebtedness. They typically have similar protections and rights as senior loans. Second lien loans are not (and by their terms cannot become) subordinate in priority of payment to any obligation of the related Borrower other than senior loans of such Borrower. Second lien loans may feature fixed or floating rate interest payments. Because second lien loans are junior to senior loans, they present a greater degree of investment risk but often pay interest at higher rates reflecting this additional risk. In addition, second lien loans of below investment grade quality share many of the risk characteristics of other below investment grade debt instruments.
Unsecured loans generally have lower priority in right of payment compared to holders of secured interests of the Borrower. Unsecured loans are not secured by a security interest or lien to or on specified collateral securing the Borrower’s obligation under the indebtedness. Unsecured loans by their terms may be or may become subordinate in right of payment to other obligations of the Borrower, including senior loans, second lien loans and other interests. Unsecured loans may have fixed or adjustable floating rate interest payments. Because unsecured loans are subordinate to senior loans and other secured debt of the Borrower, they present a greater degree of investment risk but often pay interest at higher rates reflecting this additional risk. Such investments generally are of below investment grade quality. Unsecured loans of below investment grade quality share many of the same risks of other below investment grade debt instruments.
65
Shareholder Update (continued)
(Unaudited)
The Fund may invest in subordinated loans that are primarily unsecured and that provide for relatively high, adjustable rates of interest, providing the Fund with significant current interest income. The subordinated loans in which the Fund may invest may have interest-only payments in the early years, with amortization of principal deferred to the later years of the subordinated loans. In some cases, the Fund may acquire subordinated loans that, by their terms, convert into equity or additional debt instruments or defer payments of interest for the first few years after issuance. Also, in some cases the subordinated loans in which the Fund may invest will be collateralized by a subordinated lien on some or all of the assets of the Borrower.
The Fund may invest in asset-backed securities (“ABS”). ABS are securities that are secured or “backed” by pools of various types of assets on which cash payments are due at fixed intervals over set periods of time. ABS are created in a process called securitization.
In a securitization transaction, an originator of loans or an owner of accounts receivables of a certain type of asset class sells such underlying assets in a “true sale” to a special purpose entity, so that there is no recourse to such originator or owner. Payments of principal and interest on asset-backed securities typically are tied to payments made on the pool of underlying assets in the related securitization. Such payments on the underlying assets are effectively “passed through” to the asset-backed security holders on a monthly or other regular, periodic basis. The level of seniority of a particular asset-backed security will determine the priority in which the holder of such asset-backed security is paid, relative to other security holders and parties in such securitization.
The Fund may invest in mortgage-backed securities (“MBS”). MBS are structured debt obligations collateralized by pools of commercial or residential mortgages. Pools of mortgage loans and mortgage-related loans, such as mezzanine loans, are assembled into pools of assets that secure or back securities sold to investors by various governmental, government-related and private organizations. MBS in which the Fund may invest include those with fixed, floating or variable interest rates, those with interest rates that change based on a specified index of interest rates and those with interest rates that change inversely to changes in interest rates, as well as those that do not bear interest.
The Fund may invest in residential mortgage-backed securities (“RMBS”). RMBS are securities with payments which depend (except for rights or other assets designed to assure the servicing or timely distribution of proceeds to holders of such securities) primarily on the cash flow from residential mortgage loans made to borrowers that are secured on a first priority basis or second priority basis, subject to permitted liens, easements and other encumbrances by residential real estate (one-to four-family properties) the proceeds of which are used to purchase real estate and purchase or construct dwellings thereon (or to refinance indebtedness previously so used). Residential mortgage loans are obligations of the borrowers thereunder only and are not typically insured or guaranteed by any other person or entity. The ability of a borrower to repay a loan secured by residential property is dependent upon the income or assets of the borrower. A number of factors, including a general economic downturn, acts of God, terrorism, social unrest and civil disturbances, may impair borrowers’ abilities to repay their loans.
The Fund may invest in commercial mortgage-backed securities (“CMBS”). CMBS generally are multi-class debt or pass-through certificates secured or backed by mortgage loans on commercial properties. CMBS generally are structured to provide protection to the senior class investors against potential losses on the underlying mortgage loans. This protection generally is provided by having the holders of subordinated classes of securities take the first loss if there are defaults on the underlying commercial mortgage loans. Other protection, which may benefit all of the classes or particular classes, may include issuer guarantees, reserve funds, cross-collateralization and over-collateralization. The Fund may invest in CMBS issued or sponsored by commercial banks, savings and loan institutions, mortgage bankers, private mortgage insurance companies and other non-governmental issuers. CMBS have no governmental guarantee.
The Fund may purchase event-linked bonds or “catastrophe bonds.” Event-linked bonds are asset-backed securities generally issued by special purpose vehicles organized by insurance companies, with interest payments tied to the insurance losses of casualty insurance contracts. Large insurance losses, such as those caused by a trigger event, such as a hurricane, earthquake or other physical or weather related phenomenon, will reduce the interest payments and, accordingly, the Fund may lose a portion or all of its principal invested in the bond or suffer a reduction in credited interest. Small losses will lead to above-market interest payments. Generally, event-linked bonds are issued as Rule 144A securities (i.e., securities which are not registered under the 1933 Act, but which can be sold to certain institutional buyers in accordance with Rule 144A under the Securities Act). If a trigger event causes losses exceeding a specific amount in the geographic region and time period specified in a bond, liability under the terms of the bond is limited to the principal and accrued interest of the bond. If no trigger event occurs, the Fund will recover its principal plus interest. Often, event-linked bonds provide for extensions of maturity that are mandatory, or optional at the discretion of the issuer, in order to process and audit loss claims in those cases where a trigger event has, or possibly has, occurred. An extension of maturity may increase volatility.
The Fund may invest in Collateralized Debt Obligations (“CDOs”) and Collateralized Loan Obligations (“CLOs”). CDOs are debt obligations typically issued by a private special-purpose entity and collateralized principally by debt securities, including, for example, high yield, high-risk bonds, structured finance securities including ABS, mortgage-backed securities and REITs. CLOs are similar to CDOs, but are typically collateralized principally by a pool of loans, which may include, among others, domestic and foreign senior secured loans, senior unsecured loans, and subordinate corporate loans, including loans that may be rated below investment grade (commonly known as “high yield” or “junk” bonds). The special purpose entity typically issues one or more classes (sometimes referred to as “tranches”) of rated debt securities, one or more unrated classes of debt securities that are generally treated as
66
equity interests, and a residual equity interest. The tranches of CDOs and CLOs typically have different interest rates, projected weighted average lives and ratings, with the higher rated tranches paying lower interest rates. One or more forms of credit enhancement are almost always necessary in a CDO/CLO structure to obtain the desired credit ratings for the most highly rated debt securities issued by a CDO or CLO. The types of credit enhancement used include “internal” credit enhancement provided by the underlying assets themselves, such as subordination, excess spread and cash collateral accounts, hedges provided by interest rate swaps, and “external” credit enhancement provided by third parties, principally financial guaranty insurance issued by monoline insurers. Despite this credit enhancement, CDO and CLO tranches can experience substantial losses due to actual defaults, increased sensitivity to defaults due to collateral default and the disappearance of lower rated protecting tranches, market anticipation of defaults, as well as aversion to CDO and CLO securities as a class.
The Fund may invest in municipal securities. Municipal securities include municipal bonds, notes, securities issued to finance and refinance public projects, certificates of participation, variable rate demand obligations, lease obligations, municipal notes, pre-refunded municipal bonds, private activity bonds, securities issued by tender option bond trusts, including inverse floating rate securities, and other forms of municipal bonds and securities, and other related instruments that create exposure to municipal bonds, notes and securities that provide for the payment of interest income that is exempt from regular U.S. federal income tax.
Municipal securities are debt obligations generally issued by states, cities and local authorities and certain possessions and territories of the United States (such as Puerto Rico and Guam) to finance or refinance public purpose projects such as roads, schools, and water supply systems.
The Fund may invest in tobacco settlement bonds, which are municipal securities that are backed solely by expected revenues to be derived from lawsuits involving tobacco related deaths and illnesses which were settled between certain states and American tobacco companies. Tobacco settlement bonds are secured by an issuing state’s proportionate share in the Master Settlement Agreement.
The Fund may enter into mortgage dollar rolls in which the Fund sells mortgage securities for delivery in the current month, realizing a gain (loss), and simultaneously contracts to repurchase similar securities on a specified future date. During the roll period, the Fund forgoes principal and interest paid on the securities. The Fund is compensated by the interest earned on the cash proceeds of the initial sale and by the lower repurchase price at the future date. The difference between the sales proceeds and the repurchase price is recorded as a realized gain or loss.
The Fund’s investments in foreign securities may include investment in depositary receipts, including American Depositary Receipts (“ADRs”), European Depositary Receipts (“EDRs”) and Global Depositary Receipts (“GDRs”). U.S. dollar-denominated ADRs, which are traded in the United States on exchanges or over-the-counter, are issued by domestic banks. ADRs represent the right to receive securities of foreign issuers deposited in a domestic bank or a correspondent bank. In general, there is a large, liquid market in the United States for many ADRs. The information available for ADRs is subject to the accounting, auditing and financial reporting standards of the domestic market or exchange on which they are traded, which standards are more uniform and more exacting than those to which many foreign issuers may be subject.
The Fund may also invest in EDRs, GDRs and in other similar instruments representing securities of foreign companies. EDRs and GDRs are securities that are typically issued by foreign banks or foreign trust companies, although U.S. banks or U.S. trust companies may issue them. EDRs and GDRs are structured similarly to the arrangements of ADRs. EDRs, in bearer form, are designed for use in European securities markets and are not necessarily denominated in the currency of the underlying security.
The Fund may invest in inflation protected securities. Inflation protected securities are debt securities designed to provide protection against the negative effects of inflation. Two structures are common. The U.S. Treasury and some other issuers use a structure that accrues inflation into the principal value of the bond. Most other issuers pay out the inflation accruals as part of a semiannual coupon.
The Fund may invest a portion of their assets in securities of companies offering shares in initial public offerings (“IPOs”). IPOs may have a magnified performance impact on the Fund with a small asset base. The impact of IPOs on the Fund’s performance likely will decrease as the Fund’s asset size increases, which could reduce the Fund’s total returns. IPOs may not be consistently available to the Fund for investing, particularly as the Fund’s asset base grows. Because IPO shares frequently are volatile in price, the Fund may hold IPO shares for a very short period of time.
The Fund may invest in participatory notes issued by banks or broker-dealers that are designed to replicate the performance of certain non-U.S. companies traded on a non-U.S. exchange. Participatory notes are a type of equity-linked derivative which generally are traded over-the-counter.
The Fund may invest in debentures the interest on which may be paid in other securities rather than cash (“PIKs”) or may be delayed (“delayed interest securities”).
The Fund may buy and sell securities on a when-issued or delayed delivery basis, making payment or taking delivery at a later date, normally within 15 to 45 days of the trade date.
The Fund may hold a portion of its assets in cash or cash equivalents, including foreign cash equivalents or foreign bank deposits.
67
Shareholder Update (continued)
(Unaudited)
As part of its investment strategy, the Fund may employ an options strategy whereby the Fund sells (writes) call options on a varying percentage of the market value of the Fund’s equity portfolio. The Fund may also buy calls, buy puts, and sell puts as a secondary emphasis of the options strategy. This may also include certain uncovered options positions. The options may be on indexes, custom baskets of securities and individual securities. The Fund’s options strategy may include options traded in the over-the-counter (“OTC”) market and exchange-traded options.
An option contract is a contract that gives the holder of the option, in return for a premium, the right to buy from (in the case of a call) or sell to (in the case of a put) the writer of the option the reference instrument underlying the option (or the cash value of the index) at a specified exercise price at any time during the term of the option. The writer of an option on a security has the obligation upon exercise of the option to deliver the reference instrument (or the cash) upon payment of the exercise price or to pay the exercise price upon delivery of the reference instrument (or the cash). Upon exercise of an index option, the writer of an option on an index is obligated to pay the difference between the cash value of the index and the exercise price multiplied by the specified multiplier for the index option. Options may be “covered,” meaning that the party required to deliver the reference instrument if the option is exercised owns that instrument (or has set aside sufficient assets to meet its obligation to deliver the instrument). Options may be listed on an exchange or traded in the OTC market. In general, exchange-traded options have standardized exercise prices and expiration dates and may require the parties to post margin against their obligations, and the performance of the parties’ obligations in connection with such options is guaranteed by the exchange or a related clearing corporation.
The Fund may invest in illiquid securities (i.e., securities that are not readily marketable), including, but not limited to, restricted securities (securities the disposition of which is restricted under the federal securities laws), securities that may be resold only pursuant to Rule 144A under the 1933 Act, and repurchase agreements with maturities in excess of seven days.
The Fund may purchase equity securities in a private placement that are issued by issuers who have outstanding, publicly-traded equity securities of the same class (“private investments in public equity” or “PIPES”). Shares in PIPES generally are not registered with the SEC until after a certain time period from the date the private sale is completed. This restricted period can last many months. Until the public registration process is completed, PIPES are restricted as to resale and the Fund cannot freely trade the securities. Generally, such restrictions cause the PIPES to be illiquid during this time.
The Fund may use certain derivative instruments in pursuit of its investment objective. Such instruments include financial futures contracts, forward contracts, swap contracts (including interest rate, total return and credit default swaps), options on financial futures, options on swap contracts or other derivative instruments. The credit default swaps in which the Fund may invest include credit default swap indexes and single-name credit default swaps. A credit default swap index is a portfolio of credit default swaps with similar characteristics, such as credit default swaps on high-yield bonds. The Fund will usually enter into interest rate swaps on a net basis; that is, the two payment streams will be netted out in a cash settlement on the payment date or dates specified in the instrument, with the Fund receiving or paying, as the case may be, only the net amount of the two payments.
The Fund may also invest in securities of other open- or closed-end investment companies (including exchange-traded funds (“ETFs”)) that invest primarily in securities of the types in which the Fund may invest directly, to the extent permitted by the Investment Company Act of 1940 Act, as amended (the “1940 Act”), the rules and regulations issued thereunder and applicable exemptive orders issued by the Securities and Exchange Commission (“SEC”).
Use of Leverage
The Fund may use leverage to seek to achieve its investment objective. The Fund may use leverage to the extent permitted under the 1940 Act. The Fund may source leverage through a number of methods including borrowings, the issuance of preferred shares, commercial paper or notes, by entering into reverse repurchase agreements, and by investing in inverse floating rate securities. In addition, the Fund may also use certain derivatives that have the economic effect of leverage by creating additional investment exposure. The amount and sources of leverage will vary depending on market conditions.
Temporary Defensive Periods
During temporary defensive periods the Fund may invest any percentage of its total assets in short-term high quality debt securities. The Fund may not achieve its investment objective during such periods.
68
PRINCIPAL RISKS OF THE FUND
The factors that are most likely to have a material effect on the Fund’s portfolio as a whole are called “principal risks.” The Fund is subject to the principal risks indicated below, whether through direct investment or derivative positions. The Fund may be subject to additional risks other than those identified and described below because the types of investments made by the Fund can change over time.
| Risks of Nuveen Multi-Asset Income Fund (NMAI) | ||||
| Portfolio Level Risks | ||||
Basis Risk | ||||
Below Investment Grade Risk | ||||
Bond Market Liquidity Risk | ||||
Call Option Risk | ||||
Collateralized Loan Obligation (“CLO”) Risk | ||||
Common Stock Risk | ||||
Contingent Capital Security (“CoCos”) Risk | ||||
Convertible Securities Risk | ||||
Credit Risk | ||||
Credit Spread Risk | ||||
Debt Securities Risk | ||||
Deflation Risk | ||||
Derivatives Risk | ||||
Dividend Paying Securities Risk | ||||
Downgrade Risk | ||||
Duration Risk | ||||
Emerging Markets Risk | ||||
Exchange-Traded Funds (“ETF”) Risk | ||||
Extension Risk | ||||
Financial Futures and Options Transactions Risk | ||||
Floating and Variable Rate Securities Risk | ||||
Foreign Currency Risk | ||||
Foreign Currency Contracts Risk | ||||
Foreign Debt Investment Risk | ||||
Growth Stock Risk | ||||
Hedging Risk | ||||
Illiquid Investments Risk | ||||
Income Risk | ||||
Income Volatility Risk | ||||
Inflation Risk | ||||
Infrastructure Sector Risk | ||||
Interest Rate Risk | ||||
Inverse Floating Rate Securities Risk | ||||
Large-Cap Company Risk | ||||
Loan Risk | ||||
London Inter-Band Offered Rate (“LIBOR”) Replacement Risk | ||||
Master Limited Partnerships (“MLPs”) Risk | ||||
69
Shareholder Update (continued)
(Unaudited)
| Risks of Nuveen Multi-Asset Income Fund (NMAI) | ||||
Mid-Cap Company Risk | ||||
Mortgage-Backed Securities (“MBS” and Asset-Backed Securities (“ABS”) Risk | ||||
Mortgage Roll Risk | ||||
Municipal Securities Risk | ||||
Non-U.S. Securities Risk | ||||
Other Investment Companies Risk | ||||
Preferred Securities Risk | ||||
Prepayment Risk | ||||
Put Options Risk | ||||
Real Estate Related Securities Risk | ||||
Reinvestment Risk | ||||
Rights and Warrants Risk | ||||
Rule 144A Securities Risk | ||||
Senior Loan Risk | ||||
Senior Loan Agent Risk | ||||
Smaller-Cap Company Risk | ||||
Sovereign Government and Supranational Debt Risk | ||||
Special Risks for Inflation-Indexed Bonds | ||||
Swap Transactions Risk | ||||
Unrated Securities Risk | ||||
U.S. Government Securities Risk | ||||
Valuation Risk | ||||
When-Issued and Delayed-Delivery Transactions Risk | ||||
Value Stock Risk | ||||
| Fund Level and Other Risks | ||||
Allocation Risk | ||||
Anti-Takeover Provisions | ||||
Borrowing Risk | ||||
Counterparty Risk | ||||
Cybersecurity Risk | ||||
Global Economic Risk | ||||
Investment and Market Risk | ||||
Legislation and Regulatory Risk | ||||
Leverage Risk | ||||
Market Discount from Net Asset Value | ||||
Multi-Manager Risk | ||||
Portfolio Turnover Risk | ||||
Recent Market Conditions | ||||
Reverse Repurchase Agreement Risk | ||||
Tax Risk | ||||
70
Portfolio Level Risks:
Basis Risk. As short-term rates change, interest income from floating rate loans may not increase in concert with increases in the costs of floating rate leverage or other borrowings, introducing basis or imperfect hedging risk.
Below Investment Grade Risk. Securities of below investment grade quality are regarded as having speculative characteristics with respect to the issuer’s capacity to pay interest and repay principal, and may be subject to higher price volatility and default risk than investment grade securities of comparable terms and duration. Issuers of lower grade securities may be highly leveraged and may not have available to them more traditional methods of financing. The prices of these lower grade securities are typically more sensitive to negative developments, such as a decline in the issuer’s revenues or a general economic downturn. The secondary market for lower rated securities may not be as liquid as the secondary market for more highly rated securities, a factor which may have an adverse effect on the Fund’s ability to dispose of a particular security. If a below investment grade security goes into default, or its issuer enters bankruptcy, it might be difficult to sell that security in a timely manner at a reasonable price.
Bond Market Liquidity Risk. Dealer inventories of bonds, which provide an indication of the ability of financial intermediaries to “make markets” in those bonds, are at or near historic lows in relation to market size. This reduction in market making capacity has the potential to decrease liquidity and increase price volatility in the fixed income markets in which the Fund invests, particularly during periods of economic or market stress. In addition, recent federal banking regulations may cause certain dealers to reduce their inventories of bonds, which may further decrease the Fund’s ability to buy or sell bonds. As a result of this decreased liquidity, the Fund may have to accept a lower price to sell a security, sell other securities to raise cash, or give up an investment opportunity, any of which could have a negative effect on performance. If the Fund needed to sell large blocks of bonds to meet shareholder redemption requests or to raise cash, those sales could further reduce the bonds’ prices and hurt performance.
Call Option Risk. As the writer of a call option, the Fund foregoes, during the option’s life, the opportunity to profit from increases in the market value of the instrument underlying the call option above the sum of the premium and the strike price of the option, but will retain the risk of loss should the market value of the instrument underlying the call option decline. The purchaser of the call option has the right to any appreciation in the value of the underlying instrument over the exercise price upon the exercise of the call option or the expiration date. As the Fund increases the option overlay percentage, its ability to benefit from capital appreciation becomes more limited and the risk of net asset value (“NAV”) erosion increases. If the Fund experiences NAV erosion, which itself may have a negative effect on the market price of the Fund’s shares, the Fund will have a reduced asset base over which to write call options, which may eventually lead to reduced distributions to shareholders.
In addition, because the exercise of index options is settled in cash, sellers of index call options, such as the Fund, cannot provide in advance for their potential settlement obligations by acquiring and holding the underlying securities. The Fund bears a risk that the value of the securities held by the Fund will vary from the value of the underlying index and relative to the written index call option positions. Accordingly, the Fund may incur losses on the index call options that it has sold that exceed gains on the Fund’s equity portfolio. The value of index options written by the Fund, which will be priced daily, will be affected by changes in the value of and dividend rates of the underlying common stocks in the index, changes in the actual or perceived volatility of the stock market and the remaining time to the options’ expiration. The value of the index options also may be adversely affected if the market for the index options becomes less liquid or smaller.
Collateralized Loan Obligation (“CLO”) Risk. A CLO is an asset-backed security whose underlying collateral is a pool of loans, which may include, among others, domestic and foreign floating rate and fixed rate senior secured loans, senior unsecured loans, and subordinate corporate loans, including loans that may be rated below investment grade or equivalent unrated loans. In addition to the risks associated with loans, illiquid investments and high-yield securities described below, investments in CLOs carry additional risks including, but not limited to, the risk that: (1) distributions from the collateral may not be adequate to make interest or other payments; (2) the quality of the collateral may decline in value or default; (3) the Fund may invest in tranches of CLOs that are subordinate to other tranches; (4) the complex structure of the CLO may not be fully understood at the time of investment and may produce disputes with the issuer or unexpected investment results; and (5) the CLO’s manager may perform poorly. CLOs may charge management and other administrative fees, which are in addition to those of the Fund.
Common Stock Risk. Common stocks have experienced significantly more volatility in returns and may significantly underperform relative to fixed-income securities during certain periods. An adverse event, such as an unfavorable earnings report, may depress the value of a particular common stock held by the Fund. Also, the price of common stocks is sensitive to general movements in the stock market, and a drop in the stock market may depress the price of common stocks to which the Fund has exposure. Common stock prices fluctuate for several reasons, including changes in investors’ perceptions of the financial condition of an issuer, the general condition of the relevant stock market or the current and expected future conditions of the broader economy, or when political or economic events affecting the issuer in particular or the stock market in general occur. In addition, common stock prices may be particularly sensitive to rising interest rates, as the cost of capital rises and borrowing costs increase.
Contingent Capital Securities (“CoCos”) Risk. A loss absorption mechanism trigger event for CoCos would likely be the result of, or related to, the deterioration of the issuer’s financial condition (e.g., a decrease in the issuer’s capital ratio) and status as a going concern. In such a case, with respect to CoCos that provide for conversion into common stock upon the occurrence of the trigger event, the market price of the issuer’s common stock received
71
Shareholder Update (continued)
(Unaudited)
by the Fund will have likely declined, perhaps substantially, and may continue to decline, which may adversely affect the Fund’s NAV. Further, the issuer’s common stock would be subordinate to the issuer’s other classes of securities and therefore would worsen the Fund’s standing in a bankruptcy proceeding. In addition, because the common stock of the issuer may not pay a dividend, investors in these instruments could experience a reduced income rate, potentially to zero. In view of the foregoing, CoCos are often rated below investment grade and are subject to the risks of below investment grade securities.
CoCos may be subject to an automatic write-down (i.e., the automatic write-down of the principal amount or value of the securities, potentially to zero, and the cancellation of the securities) under certain circumstances, which could result in the Fund losing a portion or all of its investment in such securities. In addition, the Fund may not have any rights with respect to repayment of the principal amount of the securities that has not become due or the payment of interest or dividends on such securities for any period from (and including) the interest or dividend payment date falling immediately prior to the occurrence of such automatic write-down. An automatic write-down could also result in a reduced income rate if the dividend or interest payment is based on the security’s par value. Coupon payments on CoCos may be discretionary and may be cancelled by the issuer for any reason or may be subject to approval by the issuer’s regulator and may be suspended in the event there are insufficient distributable reserves.
In certain scenarios, investors in CoCos may suffer a loss of capital ahead of equity holders or when equity holders do not. There is no guarantee that the Fund will receive a return of principal on CoCos. Any indication that an automatic write-down or conversion event may occur can be expected to have a material adverse effect on the market price of CoCos.
The prices of CoCos may be volatile. Additionally, the trading behavior of a given issuer’s CoCo may be strongly impacted by the trading behavior of other issuers’ CoCos, such that negative information from an unrelated CoCo may cause a decline in value of one or more CoCos held by afund. Accordingly, the trading behavior of CoCos may not follow the trading behavior of other similarly structured securities.
CoCos are issued primarily by financial institutions. Therefore, CoCos present substantially increased risks at times of financial turmoil, which could affect financial institutions more than companies in other sectors and industries.
Convertible Securities Risk. Convertible securities have characteristics of both equity and debt securities and, as a result, are exposed to certain additional risks that are typically associated with debt, including but not limited to Interest Rate Risk, Credit Risk, Below Investment Grade Risk and Unrated Securities Risk. The value of a convertible security is influenced by both the yield of non-convertible securities of comparable issuers and by the value of the underlying common stock. Convertible securities generally offer lower interest or dividend yields than non-convertible securities of similar credit quality. The market values of convertible securities tend to decline as interest rates increase and, conversely, to increase as interest rates decline. However, the convertible security’s market value tends to reflect the market price of the common stock of the issuing company when that stock price is greater than the convertible security’s “conversion price.” The conversion price is defined as the predetermined price at which the convertible security could be exchanged for the associated common stock. As the market price of the underlying common stock declines, the price of the convertible security tends to be influenced more by the yield of the convertible security. Thus, the convertible security may not decline in price to the same extent as the underlying common stock. Convertible securities fall below debt obligations of the same issuer in order of preference or priority in the event of a liquidation and are typically unrated or rated lower than such debt obligations.
Credit Risk. Issuers of securities in which the Fund may invest may default on their obligations to pay principal or interest when due. This non-payment would result in a reduction of income to the Fund, a reduction in the value of a security experiencing non-payment and potentially a decrease in the NAV of the Fund. To the extent that the credit rating assigned to a security in the Fund’s portfolio is downgraded, the market price and liquidity of such security may be adversely affected.
Credit Spread Risk. Credit spread risk is the risk that credit spreads (i.e., the difference in yield between securities that is due to differences in their credit quality) may increase when the market believes that securities generally have a greater risk of default. Increasing credit spreads may reduce the market values of the Fund’s securities. Credit spreads often increase more for lower rated and unrated securities than for investment grade securities. In addition, when credit spreads increase, reductions in market value will generally be greater for longer-maturity securities.
Debt Securities Risk. Issuers of debt instruments in which the Fund may invest may default on their obligations to pay principal or interest when due. This non-payment would result in a reduction of income to the Fund, a reduction in the value of a debt instrument experiencing non-payment and, potentially, a decrease in the NAV of the Fund. There can be no assurance that liquidation of collateral would satisfy the issuer’s obligation in the event of non-payment of scheduled interest or principal or that such collateral could be readily liquidated. In the event of bankruptcy of an issuer, the Fund could experience delays or limitations with respect to its ability to realize the benefits of any collateral securing a security. To the extent that the credit rating assigned to a security in the Fund’s portfolio is downgraded, the market price and liquidity of such security may be adversely affected.
Deflation Risk. Deflation risk is the risk that prices throughout the economy decline over time. Deflation may have an adverse effect on the creditworthiness of issuers and may make issuer default more likely, which may result in a decline in the value of the Fund’s portfolio.
72
Derivatives Risk. The use of derivatives involves additional risks and transaction costs which could leave the Fund in a worse position than if it had not used these instruments. Derivative instruments can be used to acquire or to transfer the risk and returns of a security or other asset without buying or selling the security or asset. These instruments may entail investment exposures that are greater than their cost would suggest. As a result, a small investment in derivatives can result in losses that greatly exceed the original investment. Derivatives can be highly volatile, illiquid and difficult to value. An over-the-counter derivative transaction between the Fund and a counterparty that is not cleared through a central counterparty also involves the risk that a loss may be sustained as a result of the failure of the counterparty to the contract to make required payments. The payment obligation for a cleared derivative transaction is guaranteed by a central counterparty, which exposes the Fund to the creditworthiness of the central counterparty.
It is possible that developments in the derivatives market, including changes in government regulation, could adversely impact the Fund’s ability to invest in certain derivatives.
Dividend-Paying Securities Risk. The Fund’s investment in dividend-paying stocks could cause the Fund to underperform similar funds that invest without consideration of a company’s track record of paying dividends. Stocks of companies with a history of paying dividends may not participate in a broad market advance to the same degree as most other stocks, and a sharp rise in interest rates or economic downturn could cause a company to unexpectedly reduce or eliminate its dividend. There is no guarantee that the issuers of the stocks held by the Fund will declare dividends in the future or that, if declared, they will remain at their current levels or increase over time. The Fund may also be harmed by changes to the favorable federal income tax treatment generally afforded to dividends.
Downgrade Risk. The risk that securities are subsequently downgraded should the Fund’s applicable sub-adviser and/or rating agencies believe the issuer’s business outlook or creditworthiness has deteriorated. If this occurs, the values of these investments may decline, or it may affect the issuer’s ability to raise additional capital for operational or financial purposes and increase the chance of default, as a downgrade may be seen in the financial markets as a signal of an issuer’s deteriorating financial position.
Duration Risk. Duration is the sensitivity, expressed in years, of the price of a fixed-income security to changes in the general level of interest rates (or yields). Securities with longer durations tend to be more sensitive to interest rate (or yield) changes, which typically corresponds to increased volatility and risk, than securities with shorter durations. For example, if a security or portfolio has a duration of three years and interest rates increase by 1%, then the security or portfolio would decline in value by approximately 3%. Duration differs from maturity in that it considers potential changes to interest rates, and a security’s coupon payments, yield, price and par value and call features, in addition to the amount of time until the security matures. The duration of a security will be expected to change over time with changes in market factors and time to maturity.
Emerging Markets Risk. Risks of investing in securities of emerging markets issuers include: smaller market capitalization of securities markets, which may suffer periods of relative illiquidity; significant price volatility; restrictions on foreign investment; and possible restrictions on repatriation of investment income and capital. In addition, foreign investors may be required to register the proceeds of sales; and future economic or political crises could lead to price controls, forced mergers, expropriation or confiscatory taxation, seizure, nationalization, or creation of government monopolies. Certain emerging markets also may face other significant internal or external risks, including a heightened risk of war, and ethnic, religious and racial conflicts. In addition, governments in many emerging market countries participate to a significant degree in their economies and securities markets, which may impair investment and economic growth, and which may in turn diminish the value of the securities in those markets. The considerations noted below in “Non-U.S. Securities Risk” are generally intensified for investments in emerging market countries.
Exchange-Traded Funds (“ETF”) Risk. Like any fund, an ETF is subject to the risks of the underlying securities that it holds. In addition, investments in ETFs present certain risks that do not apply to investments in traditional mutual funds. For index-based ETFs, while such ETFs seek to achieve the same returns as a particular market index, the performance of an ETF may diverge from the performance of such index (commonly known as tracking error). ETFs are subject to fees and expenses (like management fees and operating expenses) and the Fund will indirectly bear its proportionate share of any such fees and expenses paid by the ETFs in which it invests. Moreover, ETF shares may trade at a premium or discount to their NAV. As ETFs trade on an exchange, they are subject to the risks of any exchange-traded instrument, including: (i) an active trading market for its shares may not develop or be maintained, (ii) market makers or authorized participants may decide to reduce their role or step away from these activities in times of market stress, (iii) trading of its shares may be halted by the exchange, and (iv) its shares may be delisted from the exchange.
Extension Risk. The risk that, during periods of rising interest rates, borrowers may pay off their mortgage loans later than expected, preventing the Fund from reinvesting principal proceeds at higher interest rates, resulting in less income than potentially available. These risks are normally present in mortgage-backed securities and other asset-backed securities. For example, homeowners have the option to prepay their mortgages. Therefore, the duration of a security backed by home mortgages can lengthen depending on homeowner prepayment activity. A decline in the prepayment rate and the resulting increase in duration of debt securities held by the Fund can result in losses to investors in the Fund.
Financial Futures and Options Transactions Risk. The Fund may use certain transactions for hedging the portfolio’s exposure to credit risk and the risk of increases in interest rates, which could result in poorer overall performance for the Fund. There may be an imperfect correlation between price movements of the futures and options and price movements of the portfolio securities being hedged.
73
Shareholder Update (continued)
(Unaudited)
If the Fund engages in futures transactions or in the writing of options on futures, it will be required to maintain initial margin and maintenance margin and may be required to make daily variation margin payments in accordance with applicable rules of the exchanges and the Commodity Futures Trading Commission (“CFTC”). If the Fund purchases a financial futures contract or a call option or writes a put option in order to hedge the anticipated purchase of securities, and if the Fund fails to complete the anticipated purchase transaction, the Fund may have a loss or a gain on the futures or options transaction that will not be offset by price movements in the securities that were the subject of the anticipatory hedge. There can be no assurance that a liquid market will exist at a time when the Fund seeks to close out a derivatives or futures or a futures option position, and the Fund would remain obligated to meet margin requirements until the position is closed.
Floating and Variable Rate Securities Risk. Floating and variable rate securities provide for adjustment in the interest rate paid on the obligations. The terms of such obligations typically provide that interest rates are adjusted based upon an interest or market rate adjustment as provided in the respective obligations. The adjustment intervals may be regular, and range from daily up to annually, or may be event-based, such as based on a change in the prime rate. Because of the interest rate adjustment feature, floating and variable rate securities provide an investor with a certain degree of protection against rises in interest rates, although the investor will participate in any declines in interest rates as well. Generally, changes in interest rates will have a smaller effect on the market value of floating and variable rate securities than on the market value of comparable fixed-income obligations. Thus, investing in floating and variable rate securities generally allows less opportunity for capital appreciation and depreciation than investing in comparable fixed-income securities. Floating and variable rate securities may be subject to greater liquidity risk than other debt securities, meaning that there may be limitations on the Fund’s ability to sell the securities at any given time. Such securities also may lose value.
Foreign Currency Risk. Because the Fund may invest in securities denominated or quoted in currencies other than the U.S. dollar, changes in foreign currency exchange rates may affect the value of securities held by the Fund and the unrealized appreciation or depreciation of investments. Currencies of certain countries may be volatile and therefore may affect the value of securities denominated in such currencies, which means that the Fund’s NAV could decline as a result of changes in the exchange rates between foreign currencies and the U.S. dollar. In addition, certain countries, particularly emerging market countries, may impose foreign currency exchange controls or other restrictions on the transferability, repatriation or convertibility of currency.
Forward Currency Contracts Risk. Forward currency contracts are not standardized; rather, banks and dealers act as principals in these markets, negotiating each transaction on an individual basis. Forward and “cash” trading is substantially unregulated; there is no limitation on daily price movements and speculative position limits are not applicable. The principals who deal in the forward currency markets are not required to continue to make markets in the securities they trade and these markets can experience periods of illiquidity, sometimes of significant duration. There have been periods during which certain participants in these markets have refused to quote prices for certain securities or have quoted prices with an unusually wide spread between the price at which they were prepared to buy and that at which they were prepared to sell. Market illiquidity or disruption could result in major losses to the Fund. In addition, trading forward currency contracts can have the effect of financial leverage by creating additional investment exposure.
Foreign Debt Investment Risk. Foreign investments, which may include debt securities of foreign issuers, or securities or contracts payable or denominated in non-U.S. currencies, can involve special risks that arise from one or more of the following events or circumstances: (1) changes in currency exchange rates; (2) possible imposition of market controls or currency exchange controls; (3) possible imposition of withholding taxes on dividends and interest; (4) possible seizure, expropriation or nationalization of assets; (5) more limited financial information about the foreign debt issuer or difficulties interpreting it because of foreign regulations and accounting standards; (6) lower liquidity and higher volatility in some foreign markets; (7) the impact of political, social or diplomatic events; (8) economic sanctions or other measures by the United States or other governments; (9) the difficulty of evaluating some foreign economic trends; and (10) the possibility that a foreign government could restrict an issuer from paying principal and interest on its debt obligations to investors outside the country. It may also be difficult to use foreign laws and courts to force a foreign issuer to make principal and interest payments on its debt obligations. In addition, the cost of servicing external debt will also generally be adversely affected by rising international interest rates because many external debt obligations bear interest at rates which are adjusted based upon international interest rates. To the extent the Fund invests a significant portion of its assets in the securities of companies in a single country or region, it is more likely to be impacted by events or conditions affecting that country or region. Investment in the Fund may be more exposed to a single country or a region’s economic cycles, stock market valuations and currency, which could increase its risk compared with a more geographically diversified fund. In addition, political, social, regulatory, economic or environmental events that occur in a single country or region may adversely affect the values of that country or region’s securities and thus the holdings of the Fund.
Growth Stock Risk. The growth stocks in which the Fund may invest tend to be more volatile than certain other types of stocks and their prices usually fluctuate more dramatically than the overall stock market. Growth stocks may be more expensive relative to their earnings or assets compared to other types of equity securities. Accordingly, a stock with growth characteristics can have sharp price declines due to decreases in current or expected earnings and may lack dividends that can help cushion its share price in a declining market. In addition, growth stocks, at times, may not perform as well as value stocks or the stock market in general, and may be out of favor with investors for varying periods of time. Growth companies may be newer or smaller companies and may retain a large part of their earnings for research, development or investments in capital assets.
74
Hedging Risk. The Fund’s use of derivatives or other transactions to reduce risk involves costs and will be subject to the investment adviser’s and/or the applicable sub-adviser’s ability to predict correctly changes in the relationships of such hedge instruments to the Fund’s portfolio holdings or other factors. No assurance can be given that the investment adviser’s and/or the applicable sub-adviser’s judgment in this respect will be correct, and no assurance can be given that the Fund will enter into hedging or other transactions at times or under circumstances in which it may be advisable to do so. Hedging activities may reduce the Fund’s opportunities for gain by offsetting the positive effects of favorable price movements and may result in net losses.
Illiquid Investments Risk. Illiquid investments are investments that are not readily marketable and may include restricted securities, which are securities that may not be resold unless they have been registered under the 1933 Act or that can be sold in a private transaction pursuant to an available exemption from such registration. Illiquid investments involve the risk that the investments will not be able to be sold at the time desired by the Fund or at prices approximating the value at which the Fund is carrying the investments on its books from time to time.
Income Risk. The Fund’s income could decline due to falling market interest rates. This is because, in a falling interest rate environment, the Fund generally will have to invest the proceeds from maturing portfolio securities in lower-yielding securities.
Income Volatility Risk. Income volatility refers to the degree and speed with which changes in prevailing market interest rates diminish the level of current income from a portfolio of debt securities. The risk of income volatility is that the level of current income from a portfolio of debt securities may decline in certain interest rate environments.
Inflation Risk. Inflation risk is the risk that the value of assets or income from investments will be worth less in the future as inflation decreases the value of money. As inflation increases, the real value of the common shares and distributions can decline.
Infrastructure Sector Risk. A Fund that invests significantly in infrastructure-related securities has greater exposure to adverse economic, regulatory, political, legal, and other changes affecting the issuers of such securities. Infrastructure-related businesses are subject to a variety of factors that may adversely affect their business or operations, including high interest costs in connection with capital construction programs, costs associated with environmental and other regulations, the effects of economic slowdown and surplus capacity, increased competition from other providers of services, uncertainties concerning the availability of fuel and natural resources at reasonable prices, the effects of energy conservation policies, increased susceptibility to terrorist acts and other factors. Additionally, infrastructure-related entities may be subject to regulation by various governmental authorities and may also be affected by governmental regulation of rates charged to consumers, service interruption and/or legal challenges due to environmental, operational or other mishaps and the imposition of special tariffs and changes in tax laws, regulatory policies and accounting standards. There is also the risk that corruption may negatively affect publicly-funded infrastructure projects, especially in emerging markets, resulting in delays and cost overruns as well as cause negative publicity, which may adversely affect the value of an entity’s securities.
Inverse Floating Rate Securities Risk. The Fund may invest in inverse floating rate securities. In general, income on inverse floating rate securities will decrease when short-term interest rates increase and increase when short-term interest rates decrease. Investments in inverse floating rate securities may subject the Fund to the risks of reduced or eliminated interest payments and losses of principal. In addition, inverse floating rate securities may increase or decrease in value at a greater rate than the underlying interest rate, which effectively leverages the Fund’s investment. As a result, the market value of such securities generally will be more volatile than that of fixed rate securities.
The Fund may invest in inverse floating rate securities issued by special purpose trusts that have recourse to the Fund. In such instances, the Fund may be at risk of loss that exceeds its investment in the inverse floating rate securities.
The Fund may be required to sell its inverse floating rate securities at less than favorable prices, or liquidate other Fund portfolio holdings in certain circumstances, including, but not limited to, the following:
| • | If the Fund has a need for cash and the securities in a special purpose trust are not actively trading due to adverse market conditions; |
| • | If special purpose trust sponsors (as a collective group or individually) experience financial hardship and consequently seek to terminate their respective outstanding special purpose trusts; and |
| • | If the value of an underlying security declines significantly and if additional collateral has not been posted by the Fund. |
Large-Cap Company Risk. While large-cap companies may be less volatile than those of mid-and small-cap companies, they still involve risk. To the extent the Fund invests in large-capitalization securities, the Fund may underperform funds that invest primarily in securities of smaller capitalization companies during periods when the securities of such companies are in favor. Large-capitalization companies may be unable to respond as quickly as smaller capitalization companies to competitive challenges or to changes in business, product, financial or other market conditions.
Loan Risk. The lack of an active trading market for certain loans may impair the ability of the Fund to realize full value in the event of the need to sell a loan and may make it difficult to value such loans. Portfolio transactions in loans may settle in as short as seven days but typically can take up to two or three
75
Shareholder Update (continued)
(Unaudited)
weeks, and in some cases much longer. As a result of these extended settlement periods, the Fund may incur losses if it is required to sell other investments or temporarily borrow to meet its cash needs, including satisfying redemption requests. The risks associated with unsecured loans, which are not backed by a security interest in any specific collateral, are higher than those for comparable loans that are secured by specific collateral. For secured loans, there is a risk that the value of any collateral securing a loan in which the Fund has an interest may decline and that the collateral may not be sufficient to cover the amount owed on the loan. Interests in loans made to finance highly leveraged companies or transactions such as corporate acquisitions may be especially vulnerable to adverse changes in economic or market conditions. Loans may have restrictive covenants limiting the ability of a borrower to further encumber its assets. However, in periods of high demand by lenders like the Fund for loan investments, borrowers may limit these covenants and weaken a lender’s ability to access collateral securing the loan; reprice the credit risk associated with the borrower; and mitigate potential loss. The Fund may experience relatively greater realized or unrealized losses or delays and expenses in enforcing its rights with respect to loans with fewer restrictive covenants. Additionally, loans may not be considered “securities” and, as a result, the Fund may not be entitled to rely on the anti-fraud protections of the securities laws. Because junior loans have a lower place in an issuer’s capital structure and may be unsecured, junior loans involve a higher degree of overall risk than senior loans of the issuer.
London Interbank Offered Rate (“LIBOR”) Replacement Risk. The use of LIBOR will begin to be phased out in the near future, which may adversely affect the Fund’s investments whose value is tied to LIBOR. There remains uncertainty regarding the future use of LIBOR and the nature of any replacement reference rate. Actions by regulators have resulted in the establishment of alternative reference rates to LIBOR in most major currencies and markets are slowly developing in response to these new rates. The transition process away from LIBOR may involve, among other things, increased volatility in markets for instruments that currently rely on LIBOR. The potential effect of a discontinuation of LIBOR on the Fund’s investments will vary depending on, among other things: (1) existing fallback provisions that provide a replacement reference rate if LIBOR is no longer available; (2) termination provisions in individual contracts; and (3) whether, how, and when industry participants develop and adopt new reference rates and fallbacks for both legacy and new products and instruments held by the Fund. Accordingly, it is difficult to predict the full impact of the transition away from LIBOR until it is clearer how the Fund’s products and instruments will be impacted by this transition.
Master Limited Partnerships (“MLPs”) Risk. An MLP is an investment that combines the tax benefits of a limited partnership with the liquidity of publicly traded securities. Entities commonly referred to as MLPs are generally organized under state law as limited partnerships or limited liability companies. An investment in MLP units involves risks that differ from a similar investment in equity securities, such as common stock, of a corporation. Holders of MLP units have the rights typically afforded to limited partners in a limited partnership. As compared to common stockholders of a corporation, holders of MLP units have significantly more limited rights to exercise control over the partnership and to vote on matters affecting the partnership. In addition, state law governing partnerships is often less restrictive than state law governing corporations. Accordingly, there may be fewer protections afforded investors in an MLP than investors in a corporation. Investments held by MLPs may be relatively illiquid, limiting the MLPs’ ability to vary their portfolios promptly in response to changes in economic or other conditions. MLPs may have limited financial resources and their securities may trade infrequently and in limited volumes and be subject to more abrupt or erratic price movements than securities of larger or more broadly-based companies. The Fund’s investment in MLPs also subjects the Fund to the risks associated with the specific industry or industries in which the MLPs invest. Currently, most MLPs operate in the energy, natural resources or real estate sectors. Additionally, since MLPs generally conduct business in multiple states, the Fund may be subject to income or franchise tax in each of the states in which the partnership does business. The additional cost of preparing and filing the tax returns and paying the related taxes may adversely impact the Fund’s return on its investment in MLPs. The value of any investment by the Fund in MLP units will depend on the MLP’s ability to qualify as a partnership for federal income tax purposes. If an MLP fails to meet the requirements for partnership status under the Code, or if the MLP is unable to do so because of changes in tax law or regulation, the MLP could be taxed as a corporation. In that case, the MLP would be obligated to pay federal income tax at the entity level, and distributions received by the Fund would be taxed as dividend income. The Fund may also invest in debt securities issued by MLPs.
Mid-Cap Company Risk. While securities of mid-cap companies may be slightly less volatile than those of small-cap companies, they still involve substantial risk. Mid-cap companies may have limited product lines, markets or financial resources, and they may be dependent on a limited management group. Securities of mid-cap companies may be subject to more abrupt or erratic market movements than those of larger, more established companies or broader market averages in general.
Mortgage-Backed Securities (“MBS”) and Asset-Backed Securities (“ABS”) Risk. These securities generally can be prepaid at any time, and prepayments that occur either more quickly or more slowly than expected can adversely impact the value of such securities. They are also subject to extension risk, which is the risk that rising interest rates could cause mortgages or other obligations underlying the securities to be prepaid more slowly than expected, thereby lengthening the duration of such securities, increasing their sensitivity to interest rate changes and causing their prices to decline. MBS may be negatively affected by the quality of the mortgages underlying such security, the credit quality of its issuer or guarantor, and the nature and structure of its credit support.
Mortgage Roll Risk. The risk that the Fund’s adviser or an applicable sub-adviser will not correctly predict mortgage prepayments and interest rates, which will diminish the investment performance of the Fund compared with what such performance would have been without the use of the strategy.
76
Municipal Securities Risk. The values of municipal securities may be adversely affected by local political and economic conditions and developments. Adverse conditions in an industry significant to a local economy could have a correspondingly adverse effect on the financial condition of local issuers. Other factors that could affect municipal securities include a change in the local, state, or national economy, a downgrade of a state’s credit rating or the rating of authorities or political subdivisions of the state, demographic factors, ecological or environmental concerns, inability or perceived inability of a government authority to collect sufficient tax or other revenues, statutory limitations on the issuer’s ability to increase taxes, and other developments generally affecting the revenue of issuers (for example, legislation or court decisions reducing state aid to local governments or mandating additional services). This risk would be heightened to the extent that the Fund invests a substantial portion of the below-investment grade quality portion of its portfolio in the bonds of similar projects (such as those relating to the education, health care, housing, transportation, or utilities industries), in industrial development bonds, or in particular types of municipal securities (such as general obligation bonds, municipal lease obligations, private activity bonds or moral obligation bonds) that are particularly exposed to specific types of adverse economic, business or political events. The value of municipal securities may also be adversely affected by rising health care costs, increasing unfunded pension liabilities, and by the phasing out of federal programs providing financial support. In recent periods, a number of municipal issuers have defaulted on obligations, been downgraded or commenced insolvency proceedings. Financial difficulties of municipal issuers may continue or get worse. In addition, the amount of public information available about municipal bonds is generally less than for certain corporate equities or bonds, meaning that the investment performance of the Fund may be more dependent on the analytical abilities of the Fund’s applicable sub-advisers than funds that invest in stock or other corporate investments.
To the extent that a fund invests a significant portion of its assets in the securities of issuers located in a given state or U.S. territory, it will be disproportionally affected by political and economic conditions and developments in that state or territory and may involve greater risk than funds that invest in a larger universe of securities. In addition, economic, political or regulatory changes in that state or territory could adversely affect municipal securities issuers in that state or territory and therefore the value of a fund’s investment portfolio.
Non-U.S. Securities Risk. Investments in securities of non-U.S. issuers involve special risks, including: less publicly available information about non-U.S. issuers or markets due to less rigorous disclosure or accounting standards or regulatory practices; many non-U.S. markets are smaller, less liquid and more volatile; the economies of non-U.S. countries may grow at slower rates than expected or may experience a downturn or recession; the impact of economic, political, social or diplomatic events; and withholding and other non-U.S. taxes may decrease the Fund’s return. These risks are more pronounced to the extent that the Fund invests a significant amount of its assets in issuers located in one region.
Other Investment Companies Risk. The Fund may invest in the securities of other investment companies, including ETFs. Investing in an investment company exposes the Fund to all of the risks of that investment company’s investments. The Fund, as a holder of the securities of other investment companies, will bear its pro rata portion of the other investment companies’ expenses, including advisory fees. These expenses are in addition to the direct expenses of the Fund’s own operations. As a result, the cost of investing in investment company shares may exceed the costs of investing directly in its underlying investments. In addition, securities of other investment companies may be leveraged. As a result, the Fund may be indirectly exposed to leverage through an investment in such securities and therefore magnify the Fund’s leverage risk.
With respect to ETF’s, an ETF that is based on a specific index may not be able to replicate and maintain exactly the composition and relative weighting of securities in the index. The value of an ETF based on a specific index is subject to change as the values of its respective component assets fluctuate according to market volatility. ETFs typically rely on a limited pool of authorized participants to create and redeem shares, and an active trading market for ETF shares may not develop or be maintained. The market value of shares of ETFs and closed-end funds may differ from their NAV.
Preferred Securities Risk. Preferred securities are subordinated to bonds and other debt instruments in a company’s capital structure, and therefore are subject to greater credit risk. In addition, preferred stockholders (such as the Fund, to the extent it invests in preferred stocks of other issuers) generally have no voting rights with respect to the issuing company unless preferred dividends have been in arrears for a specified number of periods, at which time the preferred stockholders may elect a number of directors to the issuer’s board. Generally, once all the arrearages have been paid, the preferred stockholders no longer have voting rights. In the case of certain taxable preferred stocks, holders generally have no voting rights, except (i) if the issuer fails to pay dividends for a specified period of time or (ii) if a declaration of default occurs and is continuing. In such an event, rights of preferred stockholders generally would include the right to appoint and authorize a trustee to enforce the trust or special purpose entity’s rights as a creditor under the agreement with its operating company. In certain varying circumstances, an issuer of preferred stock may redeem the securities prior to a specified date. For instance, for certain types of preferred stock, a redemption may be triggered by a change in U.S. federal income tax or securities laws. As with call provisions, a redemption by the issuer may negatively impact the return of the security held by the Fund.
Prepayment Risk. The risk that, during periods of falling interest rates, borrowers may pay off their mortgage loans sooner than expected, forcing a Fund to reinvest the unanticipated proceeds at lower interest rates, resulting in a decline in income. These risks are normally present in MBS and other ABS. For example, homeowners have the option to prepay their mortgages. Therefore, the duration of a security backed by home mortgages can shorten depending on homeowner prepayment activity. A rise in the prepayment rate and the resulting decline in duration of debt securities held by the Fund can result in losses to investors in the Fund.
77
Shareholder Update (continued)
(Unaudited)
Put Options Risk. By writing put options, the Fund takes on the risk of declines in the value of the underlying instrument, including the possibility of a loss up to the entire strike price of each option it sells but without the corresponding opportunity to benefit from potential increases in the value of the underlying instrument. When the Fund writes a put option, it assumes the risk that it must purchase the underlying instrument at a strike price that may be higher than the market price of the instrument. If there is a broad market decline and the Fund is not able to close out its written put options, it may result in substantial losses to the Fund. The Fund will receive a premium from writing options, but the premium received may not be sufficient to offset any losses sustained from exercised put options.
Real Estate Related Securities Risk. Real estate companies have been subject to substantial fluctuations and declines on a local, regional and national basis in the past and may continue to be in the future. Real property values and incomes from real property may decline due to general and local economic conditions, overbuilding and increased competition for tenants, increases in property taxes and operating expenses, changes in zoning laws, casualty or condemnation losses, regulatory limitations on rents, changes in neighborhoods and in demographics, increases in market interest rates, or other factors. Factors such as these may adversely affect companies that own and operate real estate directly, companies that lend to them, and companies that service the real estate industry. Equity REITs may be affected by changes in the values of and incomes from the properties they own, while mortgage REITs may be affected by the credit quality of the mortgage loans they hold. REITs are subject to other risks as well, including the fact that REITs are dependent on specialized management skills, which may affect their ability to generate cash flow for operating purposes and to make distributions to shareholders or unitholders. REITs may have limited diversification and are subject to the risks associated with obtaining financing for real property. A U.S. domestic REIT can pass its income through to shareholders or unitholders without any U.S. federal income tax at the entity level if it complies with various requirements under the Code. There is the risk that a REIT held by the Fund will fail to qualify for this tax-free pass-through treatment of its income, in which case the REIT would become subject to U.S. federal income tax. Similarly, REITs formed under the laws of non-U.S. countries may fail to qualify for corporate tax benefits made available by the governments of such countries. The Fund, as a holder of a REIT, will bear its pro rata portion of the REIT’s expenses.
Reinvestment Risk. Reinvestment risk is the risk that income from the Fund’s portfolio will decline if and when the Fund invests the proceeds from matured, traded or called securities at market interest rates that are below the portfolio’s current earnings rate. A decline in income could affect the common shares’ market price, NAV and/or a common shareholder’s overall returns.
Rights and Warrants Risk. Rights and warrants are subject to the same market risks as common stocks, but are more volatile in price. Rights and warrants do not carry the right to dividends or voting rights with respect to their underlying securities, and they do not represent any rights in the assets of the issuer. An investment in rights or warrants may be considered speculative. In addition, the value of a right or warrant does not necessarily change with the value of the underlying security and a right or warrant ceases to have value if it is not exercised prior to its expiration date. The purchase of warrants or rights involves the risk that the Fund could lose the purchase value of a right or warrant if the right to subscribe for additional shares is not exercised prior to the rights’ or warrants’ expiration. Also, the purchase of rights and warrants involves the risk that the effective price paid for the right or warrant added to the subscription price of the related security may exceed the value of the subscribed security’s market price such as when there is no movement in the price of the underlying security.
Rule 144A Securities Risk. The market for Rule 144A securities typically is less active than the market for publicly-traded securities. Rule 144A securities carry the risk that their liquidity may become impaired and the Fund may be unable to dispose of the securities promptly or at reasonable prices.
Senior Loan Risk. Senior loans typically hold the most senior position in the capital structure of a business entity, are typically secured with specific collateral and have a claim on the assets and/or stock of the issuer that is senior to that held by subordinated debt holders and stockholders of the issuer. Senior loans are usually rated below investment grade, and share the same risks of other below investment grade debt instruments.
Although the Fund may invest in senior loans that are secured by specific collateral, there can be no assurance that the liquidation of such collateral would satisfy an issuer’s obligation to the Fund in the event of issuer default or that such collateral could be readily liquidated under such circumstances. If the terms of a senior loan do not require the issuer to pledge additional collateral in the event of a decline in the value of the already pledged collateral, the Fund will be exposed to the risk that the value of the collateral will not at all times equal or exceed the amount of the issuer’s obligations under the senior loan.
In the event of bankruptcy of an issuer, the Fund could also experience delays or limitations with respect to its ability to realize the benefits of any collateral securing a senior loan. Some senior loans are subject to the risk that a court, pursuant to fraudulent conveyance or other similar laws, could subordinate the senior loans to presently existing or future indebtedness of the issuer or take other action detrimental to lenders, including the Fund. Such court action could under certain circumstances include invalidation of senior loans.
Senior Loan Agent Risk. A financial institution’s employment as an agent under a senior loan might be terminated in the event that it fails to observe a requisite standard of care or becomes insolvent. A successor agent would generally be appointed to replace the terminated agent, and assets held by the agent under the loan agreement would likely remain available to holders of such indebtedness. However, if assets held by the terminated agent for the benefit of the Fund were determined to be subject to the claims of the agent’s general creditors, the Fund might incur certain costs and delays in realizing
78
payment on a senior loan or loan participation and could suffer a loss of principal and/or interest. In situations involving other interposed financial institutions (e.g., an insurance company or government agency) similar risks may arise.
Smaller-Cap Company Risk. Small-cap stocks involve substantial risk. Prices of small-cap stocks may be subject to more abrupt or erratic movements, and to wider fluctuations, than stock prices of larger, more established companies or the market averages in general. It may be difficult to sell small-cap stocks at the desired time and price. While mid-cap stocks may be slightly less volatile than small-cap stocks, they still involve similar risks.
Sovereign Government and Supranational Debt Risk. Investments in sovereign debt, including supranational debt, involves special risks. Foreign governmental issuers of debt or the governmental authorities that control the repayment of the debt may be unable or unwilling to repay principal or pay interest when due. In the event of default, there may be limited or no legal recourse in that, generally, remedies for defaults must be pursued in the courts of the defaulting party. Political conditions, especially a sovereign entity’s willingness to meet the terms of its debt obligations, are of considerable significance. The ability of a foreign sovereign issuer, especially an emerging market country, to make timely payments on its debt obligations will also be strongly influenced by the sovereign issuer’s balance of payments, including export performance, its access to international credit facilities and investments, fluctuations of interest rates and the extent of its foreign reserves. A country whose exports are concentrated in a few commodities or whose economy depends on certain strategic imports could be vulnerable to fluctuations in international prices of these commodities or imports. If a sovereign issuer cannot generate sufficient earnings from foreign trade to service its external debt, it may need to depend on continuing loans and aid from foreign governments, commercial banks, and multinational organizations. The cost of servicing external debt will also generally be adversely affected by rising international interest rates, as many external debt obligations bear interest at rates which are adjusted based upon international interest rates. Foreign investment in certain sovereign debt is restricted or controlled to varying degrees, including requiring governmental approval for the repatriation of income, capital or proceeds of sales by foreign investors. There are no bankruptcy proceedings similar to those in the U.S. by which defaulted sovereign debt may be collected.
Special Risks for Inflation-Indexed Bonds. The risk that market values of inflation-indexed investments held by the Fund may be adversely affected by a number of factors, including changes in the market’s inflation expectations, changes in real rates of interest or declines in inflation (or deflation). There is a risk that interest payments in inflation-indexed investments may fall because of a decline in inflation (or deflation). In addition, the Consumer Price Index for All Urban Consumers (“CPI-U”) may not accurately reflect the true rate of inflation. If the market perceives that any of these events have occurred, then the market value of those investments could be adversely affected.
Swap Transactions Risk. The Fund may enter into debt-related derivative instruments such as credit default swap contracts and interest rate swaps. Like most derivative instruments, the use of swaps is a highly specialized activity that involves investment techniques and risks different from those associated with ordinary portfolio securities transactions. In addition, the use of swaps requires an understanding by the adviser and/or the applicable sub-adviser of not only the referenced asset, rate or index, but also of the swap itself. If the investment adviser and/or the applicable sub-adviser is incorrect in its forecasts of default risks, market spreads or other applicable factors or events, the investment performance of the Fund would diminish compared with what it would have been if these techniques were not used.
Unrated Securities Risk. The Fund may purchase securities that are not rated by any rating organization. The investment adviser may, after assessing such securities’ credit quality, internally assign ratings to certain of those securities in categories similar to those of rating organizations. Some unrated securities may not have an active trading market or may be difficult to value, which means the Fund might have difficulty selling them promptly at an acceptable price. To the extent that the Fund invests in unrated securities, the Fund’s ability to achieve its investment objectives will be more dependent on the investment adviser’s credit analysis than would be the case when the Fund invests in rated securities.
U.S. Government Securities Risk. U.S. government securities are guaranteed only as to the timely payment of interest and the payment of principal when held to maturity. Accordingly, the current market values for these securities will fluctuate with changes in interest rates. Securities issued or guaranteed by U.S. government agencies and instrumentalities are supported by varying degrees of credit but generally are not backed by the full faith and credit of the U.S. government. No assurance can be given that the U.S. government will provide financial support to its agencies and instrumentalities if it is not obligated by law to do so.
Valuation Risk. The securities in which the Fund invests typically are valued by a pricing service utilizing a range of market-based inputs and assumptions, including readily available market quotations obtained from broker-dealers making markets in such instruments, cash flows and transactions for comparable instruments. There is no assurance that the Fund will be able to sell a portfolio security at the price established by the pricing service, which could result in a loss to the Fund. Pricing services generally price securities assuming orderly transactions of an institutional “round lot” size, but some trades may occur in smaller, “odd lot” sizes, often at lower prices than institutional round lot trades. Different pricing services may incorporate different assumptions and inputs into their valuation methodologies, potentially resulting in different values for the same securities. As a result, if the Fund were to change pricing services, or if the Fund’s pricing service were to change its valuation methodology, there could be a material impact, either positive or negative, on the Fund’s NAV.
79
Shareholder Update (continued)
(Unaudited)
Value Stock Risk. Value stocks are securities of companies that typically trade at a perceived discount to their intrinsic value and at valuation discounts relative to companies in the same industry. Value stocks often times are also in sectors that trade at a discount to the broader market. The reasons for their discount may vary greatly, but some examples may include adverse business, industry or other developments that may cause the company to be subject to special risks. The intrinsic value of a stock with value characteristics may be difficult to identify and may not be fully recognized by the market for a long time or a stock identified to be undervalued may actually be appropriately priced at a low level.
When-Issued and Delayed-Delivery Transactions Risk. The Fund may invest in securities on a “when-issued” or “delayed-delivery” basis. When-issued and delayed-delivery transactions may involve an element of risk because no interest accrues on the securities prior to settlement and, because securities are subject to market fluctuations, the value of the securities at time of delivery may be less (or more) than their cost. A separate account of the Fund will be established with its custodian consisting of cash equivalents or liquid securities having a market value at all times at least equal to the amount of any delayed payment commitment.
Fund Level and Other Risks:
Allocation Risk. The Fund’s ability to achieve its investment objective depends upon Nuveen Asset Management’s skill in determining the Fund’s allocation to different sub-advisers and strategies. There is the risk that Nuveen Asset Management’s evaluations and assumptions used in making such allocations may be incorrect.
Anti-Takeover Provisions. The Fund’s organizational documents include provisions that could limit the ability of other entities or persons to acquire control of the Fund or convert the Fund to open-end status. These provisions could have the effect of depriving the common shareholders of opportunities to sell their common shares at a premium over the then-current market price of the common shares.
Borrowing Risk. In addition to borrowing for leverage, the Fund may borrow for temporary or emergency purposes, to pay dividends, repurchase its shares, or clear portfolio transactions. Borrowing may exaggerate changes in the NAV of the Fund’s shares and may affect the Fund’s net income. When the Fund borrows money, it must pay interest and other fees, which will reduce the Fund’s returns if such costs exceed the returns on the portfolio securities purchased or retained with such borrowings. Any such borrowings are intended to be temporary. However, under certain market circumstances, such borrowings might be outstanding for longer periods of time.
Counterparty Risk. Changes in the credit quality of the companies that serve as the Fund’s counterparties with respect to derivatives or other transactions supported by another party’s credit will affect the value of those instruments. Certain entities that have served as counterparties in the markets for these transactions have incurred or may incur in the future significant financial hardships including bankruptcy and losses as a result of exposure to sub-prime mortgages and other lower-quality credit investments. As a result, such hardships have reduced these entities’ capital and called into question their continued ability to perform their obligations under such transactions. By using such derivatives or other transactions, the Fund assumes the risk that its counterparties could experience similar financial hardships. In the event of the insolvency of a counterparty, the Fund may sustain losses or be unable to liquidate a derivatives position.
Cybersecurity Risk. The Fund and its service providers are susceptible to operational and information security risk resulting from cyber incidents. Cyber incidents refer to both intentional attacks and unintentional events including: processing errors, human errors, technical errors including computer glitches and system malfunctions, inadequate or failed internal or external processes, market-wide technical-related disruptions, unauthorized access to digital systems (through “hacking” or malicious software coding), computer viruses, and cyber-attacks which shut down, disable, slow or otherwise disrupt operations, business processes or website access or functionality (including denial of service attacks). Cyber incidents could adversely impact the Fund and cause the Fund to incur financial loss and expense, as well as face exposure to regulatory penalties, reputational damage, and additional compliance costs associated with corrective measures. In addition, substantial costs may be incurred in order to prevent any cyber incidents in the future. Furthermore, the Fund cannot control the cybersecurity plans and systems put in place by its service providers or any other third parties whose operations may affect the Fund.
Global Economic Risk. National and regional economies and financial markets are becoming increasingly interconnected, which increases the possibilities that conditions in one country, region or market might adversely impact issuers in a different country, region or market. Changes in legal, political, regulatory, tax and economic conditions may cause fluctuations in markets and securities prices around the world, which could negatively impact the value of the Fund’s investments. Major economic or political disruptions, particularly in large economies like China’s, may have global negative economic and market repercussions. Additionally, events such as war, terrorism, natural and environmental disasters and the spread of infectious illnesses or other public health emergencies may adversely affect the global economy and the markets and issuers in which the Fund invests. Recent examples of such events include the outbreak of a novel coronavirus known as COVID-19 that was first detected in China in December 2019 and heightened concerns regarding North Korea’s nuclear weapons and long-range ballistic missile programs. These events could reduce consumer demand or economic output, result in market closure, travel restrictions or quarantines, and generally have a significant impact on the economy. These events could also impair the information technology and other operational systems upon which the Fund’s service providers, including the investment adviser and applicable
80
sub-adviser, rely, and could otherwise disrupt the ability of employees of the Fund’s service providers to perform essential tasks on behalf of the Fund. Governmental and quasi-governmental authorities and regulators throughout the world have in the past responded to major economic disruptions with a variety of significant fiscal and monetary policy changes, including but not limited to, direct capital infusions into companies, new monetary programs and dramatically lower interest rates. An unexpected or quick reversal of these policies, or the ineffectiveness of these policies, could increase volatility in securities markets, which could adversely affect the Fund’s investments.
Investment and Market Risk. An investment in the Fund’s common shares is subject to investment risk, including the possible loss of the entire principal amount that you invest. Common shares frequently trade at a discount to their NAV. An investment in common shares represents an indirect investment in the securities owned by the Fund. Common shares at any point in time may be worth less than your original investment, even after taking into account the reinvestment of Fund dividends and distributions.
Legislation and Regulatory Risk. At any time after the date of this report, legislation or additional regulations may be enacted that could negatively affect the assets of the Fund, securities held by the Fund or the issuers of such securities. Fund shareholders may incur increased costs resulting from such legislation or additional regulation. There can be no assurance that future legislation, regulation or deregulation will not have a material adverse effect on the Fund or will not impair the ability of the Fund to achieve its investment objectives.
The SEC recently adopted rules governing the use of derivatives by registered investment companies, which could affect the nature and extent of derivatives used by the Fund. The full impact of such rules is uncertain at this time. It is possible that such rules, as interpreted, applied and enforced by the SEC, could limit the implementation of the Fund’s use of derivatives, which could have an adverse impact on the Fund.
Leverage Risk. The use of leverage creates special risks for common shareholders, including potential interest rate risks and the likelihood of greater volatility of NAV and market price of, and distributions on, the common shares. The use of leverage in a declining market will likely cause a greater decline in the Fund’s NAV, which may result at a greater decline of the common share price, than if the Fund were not to have used leverage.
The Fund will pay (and common shareholders will bear) any costs and expenses relating to the Fund’s use of leverage, which will result in a reduction in the Fund’s NAV. The investment adviser may, based on its assessment of market conditions and composition of the Fund’s holdings, increase or decrease the amount of leverage. Such changes may impact the Fund’s distributions and the price of the common shares in the secondary market.
The Fund may seek to refinance its leverage over time, in the ordinary course, as current forms of leverage mature or it is otherwise desirable to refinance; however, the form that such leverage will take cannot be predicted at this time. If the Fund is unable to replace existing leverage on comparable terms, its costs of leverage will increase. Accordingly, there is no assurance that the use of leverage may result in a higher yield or return to common shareholders.
The amount of fees paid to the investment adviser and the applicable sub-adviser for investment advisory services will be higher if the Fund uses leverage because the fees will be calculated based on the Fund’s Managed Assets — this may create an incentive for the investment adviser and the applicable sub-adviser to leverage the Fund or increase the Fund’s leverage.
Market Discount from Net Asset Value. Shares of closed-end investment companies like the Fund frequently trade at prices lower than their NAV. This characteristic is a risk separate and distinct from the risk that the Fund’s NAV could decrease as a result of investment activities. Whether investors will realize gains or losses upon the sale of the common shares will depend not upon the Fund’s NAV but entirely upon whether the market price of the common shares at the time of sale is above or below the investor’s purchase price for the common shares. Furthermore, management may have difficulty meeting the Fund’s investment objectives and managing its portfolio when the underlying securities are redeemed or sold during periods of market turmoil and as investors’ perceptions regarding closed-end funds or their underlying investments change. Because the market price of the common shares will be determined by factors such as relative supply of and demand for the common shares in the market, general market and economic circumstances, and other factors beyond the control of the Fund, the Fund cannot predict whether the common shares will trade at, below or above NAV. The common shares are designed primarily for long-term investors, and you should not view the Fund as a vehicle for short-term trading purposes.
Multi-Manager Risk. The interplay of the various strategies employed by portfolio managers of Nuveen and its affiliates may result in the Fund holding a significant amount of certain types of securities. This may be beneficial or detrimental to the Fund’s performance depending upon the performance of those securities and the overall economic environment. The portfolio managers may make investment decisions which conflict with each other; for example, at any particular time, portfolio manager of one strategy may be purchasing shares of an issuer whose shares are being sold by portfolio managers of another strategy. Consequently, the Fund could indirectly incur transaction costs without accomplishing any net investment result. In addition, the multi-manager approach could increase the Fund’s portfolio turnover rate which may result in higher transaction costs and a greater amount of tax on the Fund’s shareholders.
Portfolio Turnover Risk. In pursuing its investment objective, the Fund may engage in trading that results in a high portfolio turnover rate, which may vary greatly from year to year, as well as within a given year. A higher portfolio turnover rate may result in correspondingly greater transactional expenses that are borne by the Fund. Such expenses may include bid-ask spreads, dealer mark-ups, and other transactional costs on the sale of securities and reinvestment in other securities, and may result in the realization of taxable capital gains (including short-term gains, which are generally taxed for federal
81
Shareholder Update (continued)
(Unaudited)
income tax purposes to shareholders as ordinary income when distributed). These costs, which are not reflected in annual fund operating expenses or in the example thereunder, may affect the Fund’s performance.
Recent Market Conditions. In response to the financial crisis and recent market events, policy and legislative changes by the United States government and the Federal Reserve to assist in the ongoing support of financial markets, both domestically and in other countries, are changing many aspects of financial regulation. The impact of these changes on the markets, and the practical implications for market participants, may not be fully known for some time. Withdrawal of government support, failure of efforts in response to the crisis, or investor perception that such efforts are not succeeding, could adversely impact the value and liquidity of certain securities. The severity or duration of adverse economic conditions may also be affected by policy changes made by governments or quasi-governmental organizations, including changes in tax laws and the imposition of trade barriers. The impact of new financial regulation legislation on the markets and the practical implications for market participants may not be fully known for some time. Changes to the Federal Reserve policy may affect the value, volatility and liquidity of dividend and interest paying securities. In addition, the contentious domestic political environment, as well as political and diplomatic events within the United States and abroad, such as the U.S. government’s inability at times to agree on a long-term budget and deficit reduction plan, the threat of a federal government shutdown and threats not to increase the federal government’s debt limit, may affect investor and consumer confidence and may adversely impact financial markets and the broader economy, perhaps suddenly and to a significant degree.
Interest rates have been unusually low in recent years in the United States and abroad but there is consensus that interest rates will increase during the life of the Fund, which could negatively impact the price of debt securities. Because there is little precedent for this situation, it is difficult to predict the impact of a significant rate increase on various markets.
The current political climate has intensified concerns about a potential trade war between China and the United States, as each country has recently imposed tariffs on the other country’s products. These actions may trigger a significant reduction in international trade, the oversupply of certain manufactured goods, substantial price reductions of goods and possible failure of individual companies and/or large segments of China’s export industry, which could have a negative impact on the Fund’s performance.
The impact of these developments in the near- and long-term is unknown and could have additional adverse effects on economies, financial markets and asset valuations around the world.
Reverse Repurchase Agreement Risk. A reverse repurchase agreement, in economic essence, constitutes a securitized borrowing by the Fund from the security purchaser. The Fund may enter into reverse repurchase agreements for the purpose of creating a leveraged investment exposure and, as such, their usage involves essentially the same risks associated with a leveraging strategy generally since the proceeds from these agreements may be invested in additional portfolio securities. Reverse repurchase agreements tend to be short-term in tenor, and there can be no assurances that the purchaser (lender) will commit to extend or “roll” a given agreement upon its agreed-upon repurchase date or an alternative purchaser can be identified on similar terms. Reverse repurchase agreements also involve the risk that the purchaser fails to return the securities as agreed upon, files for bankruptcy or becomes insolvent. The Fund may be restricted from taking normal portfolio actions during such time, could be subject to loss to the extent that the proceeds of the agreement are less than the value of securities subject to the agreement and may experience adverse tax consequences.
Tax Risk. The Fund has elected to be treated and intends to qualify each year as a Regulated Investment Company (“RIC”) under the Internal Revenue Code of 1986, as amended (the “Code”). As a RIC, the Fund is not expected to be subject to U.S. federal income tax to the extent that it distributes its investment company taxable income and net capital gains. To qualify for the special tax treatment available to a RIC, the Fund must comply with certain investment, distribution, and diversification requirements. Under certain circumstances, the Fund may be forced to sell certain assets when it is not advantageous in order to meet these requirements, which may reduce the Fund’s overall return. If the Fund fails to meet any of these requirements, subject to the opportunity to cure such failures under applicable provisions of the Code, the Fund’s income would be subject to a double level of U.S. federal income tax. The Fund’s income, including its net capital gain, would first be subject to U.S. federal income tax at regular corporate rates, even if such income were distributed to shareholders and, second, all distributions by the Fund from earnings and profits, including distributions of net capital gain (if any), would be taxable to shareholders as dividends.
82
EFFECTS OF LEVERAGE
The following table is furnished in response to requirements of the SEC. It is designed to illustrate the effects of leverage through the use of senior securities, as that term is defined under Section 18 of the 1940 Act, as well as certain other forms of leverage, such as reverse repurchase agreements, on common share total return, assuming investment portfolio total returns (consisting of income and changes in the value of investments held in a Fund’s portfolio) of -10%, -5%, 0%, 5% and 10%. The table below reflects each Fund’s (i) continued use of leverage as of December 31, 2021 as a percentage of Managed Assets (including assets attributable to such leverage), (ii) the estimated annual effective interest expense rate payable by the Fund on such instruments (based on actual leverage costs incurred during the fiscal year ended December 31, 2021) as set forth in the table, and (iii) the annual return that the Fund’s portfolio must experience (net of expenses) in order to cover such costs of leverage based on such estimated annual effective interest expense rate. The information below does not reflect any Fund’s use of certain other forms of economic leverage achieved through the use of certain derivative instruments.
The numbers are merely estimates, used for illustration. The costs of leverage may vary frequently and may be significantly higher or lower than the estimated rate. The assumed investment portfolio returns in the table below are hypothetical figures and are not necessarily indicative of the investment portfolio returns experienced or expected to be experienced by the Fund. Your actual returns may be greater or less than those appearing below.
Nuveen Multi-Asset (NMAI) | ||||
Estimated Leverage as a Percentage of Managed Assets (Including Assets Attributable to Leverage) | 31.13% | |||
Estimated Annual Effective Leverage Expense Rate Payable by Fund on Leverage | 0.55% | |||
Annual Return Fund Portfolio Must Experience (net of expenses) to Cover Estimated Annual Effective Interest Expense Rate on Leverage | 0.17% | |||
Common Share Total Return for (10.00)% Assumed Portfolio Total Return | (14.77)% | |||
Common Share Total Return for (5.00)% Assumed Portfolio Total Return | (7.51)% | |||
Common Share Total Return for 0.00% Assumed Portfolio Total Return | (0.25)% | |||
Common Share Total Return for 5.00% Assumed Portfolio Total Return | 7.01% | |||
Common Share Total Return for 10.00% Assumed Portfolio Total Return | 14.27% | |||
Common Share total return is composed of two elements — the distributions paid by the Fund to holders of common shares (the amount of which is largely determined by the net investment income of the Fund after paying dividend payments on any preferred shares issued by the Fund and expenses on any forms of leverage outstanding) and gains or losses on the value of the securities and other instruments the Fund owns. As required by SEC rules, the table assumes that the Fund are more likely to suffer capital losses than to enjoy capital appreciation. For example, to assume a total return of 0%, the Fund must assume that the income it receives on its investments is entirely offset by losses in the value of those investments. This table reflects hypothetical performance of a Fund’s portfolio and not the actual performance of the Fund’s common shares, the value of which is determined by market forces and other factors. Should the Fund elect to add additional leverage to its portfolio, any benefits of such additional leverage cannot be fully achieved until the proceeds resulting from the use of such leverage have been received by the Fund and invested in accordance with the Fund’s investment objectives and policies. As noted above, the Fund’s willingness to use additional leverage, and the extent to which leverage is used at any time, will depend on many factors.
83
Shareholder Update (continued)
(Unaudited)
DIVIDEND REINVESTMENT PLAN
Nuveen Closed-End Funds Automatic Reinvestment Plan
Your Nuveen Closed-End Fund allows you to conveniently reinvest distributions in additional Fund shares. By choosing to reinvest, you’ll be able to invest money regularly and automatically, and watch your investment grow through the power of compounding. Just like distributions in cash, there may be times when income or capital gains taxes may be payable on distributions that are reinvested. It is important to note that an automatic reinvestment plan does not ensure a profit, nor does it protect you against loss in a declining market.
Easy and convenient
To make recordkeeping easy and convenient, each quarter you’ll receive a statement showing your total distributions, the date of investment, the shares acquired and the price per share, and the total number of shares you own.
How shares are purchased
The shares you acquire by reinvesting will either be purchased on the open market or newly issued by the Fund. If the shares are trading at or above NAV at the time of valuation, the Fund will issue new shares at the greater of the NAV or 95% of the then-current market price. If the shares are trading at less than NAV, shares for your account will be purchased on the open market. If Computershare Trust Company, N.A. (the “Plan Agent”) begins purchasing Fund shares on the open market while shares are trading below NAV, but the Fund’s shares subsequently trade at or above their NAV before the Plan Agent is able to complete its purchases, the Plan Agent may cease open-market purchases and may invest the uninvested portion of the distribution in newly-issued Fund shares at a price equal to the greater of the shares’ NAV or 95% of the shares’ market value on the last business day immediately prior to the purchase date. Distributions received to purchase shares in the open market will normally be invested shortly after the distribution payment date. No interest will be paid on distributions awaiting reinvestment. Because the market price of the shares may increase before purchases are completed, the average purchase price per share may exceed the market price at the time of valuation, resulting in the acquisition of fewer shares than if the distribution had been paid in shares issued by the Fund. A pro rata portion of any applicable brokerage commissions on open market purchases will be paid by Dividend Reinvestment Plan (the “Plan”) participants. These commissions usually will be lower than those charged on individual transactions.
Flexible
You may change your distribution option or withdraw from the Plan at any time, should your needs or situation change. You can reinvest whether your shares are registered in your name, or in the name of a brokerage firm, bank, or other nominee. Ask your investment advisor if his or her firm will participate on your behalf. Participants whose shares are registered in the name of one firm may not be able to transfer the shares to another firm and continue to participate in the Plan. The Fund reserves the right to amend or terminate the Plan at any time. Although the Fund reserves the right to amend the Plan to include a service charge payable by the participants, there is no direct service charge to participants in the Plan at this time.
Call today to start reinvesting distributions
For more information on the Nuveen Automatic Reinvestment Plan or to enroll in or withdraw from the Plan, speak with your financial professional or call us at (800) 257-8787.
84
CHANGES OCCURRING DURING THE FISCAL YEAR
The following information in this annual report is a summary of certain changes during the most recent fiscal year. This information may not reflect all of the changes that have occurred since you purchased shares of a Fund.
During the most recent fiscal year, there have been no changes to: (i) the Funds’ investment objectives and principal investment policies that have not been approved by shareholders, (ii) the principal risks of the Fund, (iii) the portfolio managers of the Funds; (iv) a Fund’s charter or by-laws that would delay or prevent a change of control of the Fund that have not been approved by shareholders.
85
Additional Fund Information (Unaudited)
| Board of Trustees | ||||||||||
| Jack B. Evans | William C. Hunter | Amy B.R. Lancellotta | Joanne T. Medero | Albin F. Moschner | John K. Nelson | |||||
Judith M. Stockdale | Carole E. Stone | Matthew Thornton III | Terence J. Toth | Margaret L. Wolff | Robert L. Young |
Investment Adviser Nuveen Fund Advisors, LLC 333 West Wacker Drive Chicago, IL 60606 | Custodian State Street Bank One Lincoln Street Boston, MA 02111 | Legal Counsel Chapman and Cutler LLP Chicago, IL 60603 | Independent Registered KPMG LLP 200 East Randolph Street Chicago, IL 60601 | Transfer Agent and Computershare Trust Company, N.A. 150 Royall Street Canton, MA 02021 (800) 257-8787 | ||||
Distribution Information
The Fund hereby designates its percentage of dividends paid from net ordinary income as dividends qualifying for the dividends received deduction (“DRD”) for corporations, its percentage of qualified dividend income (“QDI”) for individuals under Section 1(h)(11) of the Internal Revenue Code, and its percentage of qualified business income (“QBI”) for individuals under Section 199A of the Internal Revenue Code as shown in the accompanying table. The actual qualified dividend and business income distributions will be reported to shareholders on Form 1099-DIV which will be sent to shareholders shortly after calendar year end.
| NMAI | ||||
% of DRD | 10.0% | |||
% of QDI | 19.6% | |||
% of QBI | 4.3% | |||
The Fund hereby designates its percentage of dividends paid from net ordinary income as dividends qualifying as Interest-Related Dividends and/or short-term capital gain dividends as defined in the Internal Revenue Code Section 871(k) for the taxable year ended December 31, 2021.
| NMAI | ||||
% of Interest-Related Dividends | 20.2% | |||
The Fund had the following percentage, or maximum amount allowable, of ordinary dividends treated as Section 163(j) interest dividends pursuant to Section 163(j) of the Internal Revenue Code for the taxable year ended December 31, 2021:
| NMAI | ||||
% of Section 163(j) Interest Dividends | 18.2% | |||
Portfolio of Investments Information
The Fund is required to file its complete schedule of portfolio holdings with the Securities and Exchange Commission (SEC) for the first and third quarters of each fiscal year as an exhibit to its report on Form N-PORT. You may obtain this information directly from the SEC’s website at http://www.sec.gov.
Nuveen Funds’ Proxy Voting Information
You may obtain (i) information regarding how each fund voted proxies relating to portfolio securities held during the most recent twelve-month period ended June 30, without charge, upon request, by calling Nuveen toll-free at (800) 257-8787 or on Nuveen’s website at www.nuveen.com and (ii) a description of the policies and procedures that each fund used to determine how to vote proxies relating to portfolio securities without charge, upon request, by calling Nuveen toll free at (800) 257-8787. You may also obtain this information directly from the SEC. Visit the SEC on-line at http://www.sec.gov.
CEO Certification Disclosure
The Fund’s Chief Executive Officer (CEO) has submitted to the New York Stock Exchange (NYSE) the annual CEO certification as required by Section 303A.12(a) of the NYSE Listed Company Manual. The Fund has filed with the SEC the certification of its CEO and Chief Financial Officer required by Section 302 of the Sarbanes-Oxley Act.
FINRA BrokerCheck
The Financial Industry Regulatory Authority (FINRA) provides information regarding the disciplinary history of FINRA member firms and associated investment professionals. This information as well as an investor brochure describing FINRA BrokerCheck is available to the public by calling the FINRA BrokerCheck Hotline number at (800) 289-9999 or by visiting www.FINRA.org.
86
Used in this Report
(Unaudited)
| ∎ | Average Annual Total Return: This is a commonly used method to express an investment’s performance over a particular, usually multi-year time period. It expresses the return that would have been necessary each year to equal the investment’s actual cumulative performance (including change in NAV or market price and reinvested dividends and capital gains distributions, if any) over the time period being considered. |
| ∎ | Effective Leverage: Effective leverage is a fund’s effective economic leverage, and includes both regulatory leverage (see below) and the leverage effects of certain derivative investments in the fund’s portfolio. |
| ∎ | Leverage: Leverage is created whenever a fund has investment exposure (both reward and/or risk) equivalent to more than 100% of the investment capital. |
| ∎ | NMAI Blended Benchmark: Consists of: 1) 50% MSCI ACWI Index (Net), which is designed to measure the performance of large and mid-cap stocks across 23 developed and 25 emerging markets, and 2) 50% Bloomberg U.S. Corporate High Yield Bond Index, which is designed to measure the performance of the USD-denominated, fixed-rate corporate high yield bond market. Index returns assume reinvestment of distributions, but do not reflect any applicable sales charges or management fees. |
| ∎ | Net Asset Value (NAV) Per Share: A fund’s Net Assets is equal to its total assets (securities, cash, accrued earnings and receivables) less its total liabilities. NAV per share is equal to the fund’s Net Assets divided by its number of shares outstanding. |
| ∎ | Regulatory Leverage: Regulatory leverage consists of preferred shares issued by or borrowings of a fund. Both of these are part of a fund’s capital structure. Regulatory leverage is subject to asset coverage limits set in the Investment Company Act of 1940. |
| ∎ | S&P 500® Index: An index generally considered representative of the U.S. equity market. The index includes 500 leading companies and covers approximately 80% of available market capitalization. Index returns assume reinvestment of distributions, but do not reflect any applicable sales charges or management fees. |
87
Annual Investment Management Agreement Approval Process
(Unaudited)
The Board of Trustees (the “Board,” and each Trustee, a “Board Member”) of the Fund, which is comprised entirely of Board Members who are not “interested persons” (as defined under the Investment Company Act of 1940 (the “1940 Act”)) (the “Independent Board Members”), is responsible for determining whether to approve the Fund’s advisory arrangements. At a meeting held on April 21-22, 2021 (the “Meeting”), the Board considered and approved the investment management agreement (the “Investment Management Agreement”) pursuant to which Nuveen Fund Advisors, LLC (the “Adviser”) would serve as investment adviser to the Fund and the investment sub-advisory agreements (each, a “Sub-Advisory Agreement”) pursuant to which Nuveen Asset Management, LLC (“NAM”), NWQ Investment Management Company, LLC (“NWQ”), Santa Barbara Asset Management, LLC (“SBAM”), Teachers Advisors, LLC (“TAL”) and Winslow Capital Management, LLC (“Winslow”), each of which was an affiliate of the Adviser, would serve as investment sub-advisers to the Fund. NAM, NWQ, SBAM, TAL and Winslow are each hereafter a “Sub-Adviser” and the Adviser and the Sub-Advisers are each hereafter a “Fund Adviser.” The Investment Management Agreement and the Sub-Advisory Agreements are each hereafter an “Advisory Agreement” and collectively, the “Advisory Agreements.”
Although the 1940 Act requires that the Advisory Agreements be approved by the in-person vote of a majority of the Independent Board Members, the Meeting was held virtually through the internet in view of the health risks associated with holding an in-person meeting during the COVID-19 pandemic and governmental restrictions on gatherings. The Meeting was held virtually in reliance on certain exemptive relief issued by the Securities and Exchange Commission which provided registered investment companies temporary relief from the in-person voting requirements of the 1940 Act with respect to the approval of a fund’s advisory agreement in light of challenges arising in connection with the COVID-19 pandemic.
The Board recognized that the Fund was newly formed for the purpose of effectuating the consolidation of Nuveen Diversified Dividend and Income Fund (JDD) (the “Dividend and Income Fund”), Nuveen Tax-Advantaged Total Return Strategy Fund (JTA) (the “Total Return Strategy Fund”) and Nuveen Tax-Advantaged Dividend Growth Fund (JTD) (the “Dividend Growth Fund” and together with the Dividend and Income Fund and the Total Return Strategy Fund, the “Target Funds” and each, a “Target Fund”) and the restructuring of their combined portfolios (with respect to each Target Fund, a “Reorganization” and collectively, the “Reorganizations”). At the Meeting and/or at prior meetings, the Adviser made presentations to and responded to questions from the Board. During the Meeting and/or at prior meetings, the Independent Board Members also met privately with their legal counsel to, among other things, review the Board’s duties under the 1940 Act, the general principles of state law in reviewing and approving advisory contracts, the standards used by courts in determining whether investment company boards of directors have fulfilled their duties, factors to be considered in voting on advisory contracts and an adviser’s fiduciary duty with respect to advisory agreements and compensation. It is with this background that the Independent Board Members considered the Advisory Agreements.
As outlined in more detail below, the Independent Board Members considered various factors they believed relevant with respect to the Fund, including, among other factors: (a) the nature, extent and quality of the services expected to be provided by the Fund Advisers; (b) the expertise and background of the Fund Advisers with respect to the Fund’s investment strategy; (c) certain performance-related information (as described below); (d) the profitability of Nuveen and its affiliates for their advisory activities; (e) the proposed management fees of the Fund Advisers; (f) the expected expenses of the Fund; and (g) the soft dollar practices of the Fund Advisers, if any. Each Board Member may have accorded different weight to the various factors and information discussed below in reaching his or her conclusions with respect to the Fund’s Advisory Agreements. The Independent Board Members also drew on information that they had received in their capacity as trustees and directors, as applicable, of other registered investment companies advised by the Fund Advisers.
| A. | Nature, Extent and Quality of Services |
At the Meeting and/or at prior meetings, the Independent Board Members considered information regarding the rationale for the Reorganizations, including the investment objectives and strategies of the Target Funds compared to those of the Fund. In this regard, the Board recognized that in contrast to the Target Funds, each of which followed a static asset allocation strategy that generally took a long-term view that did not change based on prevailing market conditions, the Fund was
88
expected to follow a dynamic multi-asset income strategy providing the ability to adapt asset allocations to changing market environments from both a risk and return standpoint.
The Independent Board Members considered the nature, extent and quality of the respective Fund Adviser’s services expected to be provided to the Fund, including portfolio management services and administrative services. Given that the Adviser and the Sub-Advisers already served as adviser and sub-adviser, respectively, to other Nuveen funds overseen by the Board Members, the Board had a good understanding of each such Fund Adviser’s organization, operations, personnel and services. Further, as the Independent Board Members meet regularly throughout the year to oversee the Nuveen funds, including funds currently advised or sub-advised (as applicable) by the Fund Advisers, the Independent Board Members have relied upon their knowledge from their meetings and any other interactions throughout the year with the respective Fund Adviser in evaluating the Advisory Agreements. The Board was aware that the Adviser served as investment adviser to each Target Fund. In addition, the Board noted that although there was some overlap in the sub-advisers used by the Target Funds and the Sub-Advisers, there were also some differences. More specifically, (a) NAM and NWQ each served as a sub-adviser to each Target Fund; (b) SBAM served as a sub-adviser to the Dividend Growth Fund; (c) TAL and Winslow did not serve as sub-advisers to any Target Fund; and (d) two sub-advisers to the Dividend and Income Fund (each of which was unaffiliated with the Adviser) would not serve as Sub-Advisers to the Fund. At the Meeting and/or at prior meetings, the Independent Board Members reviewed materials outlining, among other things, the respective Fund Adviser’s organization and business; the types of services that such Fund Adviser or its affiliates provide to the Nuveen funds and are expected to provide to the Fund; and the experience of the respective Fund Adviser with applicable investment strategies.
In considering the services that were expected to be provided by the Fund Advisers, at the Meeting and/or at prior meetings, the Board has recognized that the Adviser provides a vast array of services to the Nuveen funds, the scope of which has expanded over the years in light of regulatory, market and other developments, such as the development of expanded compliance programs for the Nuveen funds. The Board has also noted the extensive resources, tools and capabilities the Adviser and its affiliates devote to the various operations of the Nuveen funds. In this regard, services provided to the Nuveen funds include, but are not limited to: investment oversight, risk management and securities valuation services; product management; fund administration; oversight of shareholder services and transfer agency functions; Board relations services; compliance and regulatory oversight services; legal support and oversight of outside law firms; and providing leverage, capital and distribution management services. In addition to the services provided by the Adviser, the Board has also considered the risks borne by the Adviser and its affiliates in managing the Nuveen funds, including entrepreneurial, operational, reputational, regulatory and litigation risks.
The Board considered the division of responsibilities between the Adviser and the Sub-Advisers and recognized that NAM would be responsible for implementing the Fund’s dynamic asset allocation strategy and allocating the Fund’s assets among the Sub-Advisers, which would include NAM. The Board was aware that the Fund may allocate its assets to any investment strategy offered by the Sub-Advisers and was provided with information prepared by the Adviser regarding the anticipated asset allocation process. Further, the Board was aware that the portfolio managers managing the investment strategies that would be available to the Fund would include individuals who did not serve as portfolio managers to a Target Fund and may change over time. The Board also considered the backgrounds of the two portfolio managers who would be responsible for the Fund’s asset allocation strategy and recognized that they were members of Nuveen’s multi-asset investment team (the “Multi-Asset Team”).
Based on its review, the Board found that, overall, the nature, extent and quality of services expected to be provided to the Fund under each Advisory Agreement were satisfactory.
| B. | Investment Performance |
The Fund was new and, therefore, did not have its own performance history. The Board was, however, familiar with the performance records of the Target Funds and recognized that the Reorganizations were being proposed in light of, among other things, (a) the potential to deliver superior risk-adjusted returns as a result of adopting a dynamic risk-based asset allocation framework in contrast to the Target Funds’ static asset allocation strategies with fixed target asset allocations; and (b) the potential for a more consistent return profile. In addition, the Board reviewed certain performance information
89
Annual Investment Management Agreement Approval Process (continued)
(Unaudited)
relating to a multi-asset strategy managed by the Multi-Asset Team. The Board was also provided with certain performance information relating to various investment strategies that were expected to be potentially relevant to the Fund, including annualized returns for the one-, three- and five-year periods as of December 31, 2020.
| C. | Fees, Expenses and Profitability |
| 1. | Fees and Expenses |
The Independent Board Members evaluated the proposed management fees and estimated expenses of the Fund. The Fund’s management fee is comprised of two components – a fund-level fee, based only on the amount of assets within the Fund, and a complex-level fee, based on the aggregate amount of all eligible fund assets managed by the Adviser. The Independent Board Members noted that the fund-level management fee schedule of the Fund would be the same as that applicable to the Dividend and Income Fund and Total Return Strategy Fund, but would provide for a lower fund-level management fee rate at all levels than the fund-level management fee schedule applicable to the Dividend Growth Fund. The Board further noted that the Reorganizations were intended to result in reduced net operating expenses as a result of certain fixed costs being spread over the larger asset base of the Fund and a potentially lower effective fund-level management fee rate due to the ability of the Fund’s assets to achieve breakpoints in its fee schedule (assuming all three Reorganizations were completed). Moreover, the Independent Board Members took into account the proposed sub-advisory fees for the Fund.
The Independent Board Members recognized that assets attributable to the Fund’s use of leverage would be included in the amount of assets upon which the advisory fee is calculated. In this regard, the Independent Board Members noted that the advisory fee is based on a percentage of average daily “Managed Assets.” “Managed Assets” generally means the total assets of the Fund, minus the sum of its accrued liabilities (other than Fund liabilities incurred for the express purpose of creating leverage). “Total assets” for this purpose includes assets attributable to the Fund’s use of leverage (whether or not those assets are reflected in the Fund’s financial statements for purposes of generally accepted accounting principles), and derivatives will be valued at their market value. The Independent Board Members recognized that the fact that a decision to employ or increase the Fund’s leverage will have the effect, all other things being equal, of increasing Managed Assets (and, in turn, increasing the Adviser’s and the Sub-Advisers’ management fees), means that the Adviser and the Sub-Advisers may have a conflict of interest in determining whether to use or increase leverage. The Independent Board Members noted, however, that the Adviser and the Sub-Advisers would seek to manage that potential conflict by using leverage when they determine that such action would be in the best interests of the Fund and its common shareholders, and by periodically reviewing with the Board the Fund’s performance and the Fund’s degree of overall use of leverage and the impact of the use of leverage on that performance.
The Independent Board Members considered the proposed management fee rate for the Fund before any fund-level and complex-wide breakpoints. In addition, the Independent Board Members considered the Fund’s fund-level and complex-wide breakpoint schedules (described in further detail below). Based on their review of the fee and expense information provided, the Independent Board Members determined that the Fund’s management fees (as applicable) to a Fund Adviser were reasonable in light of the nature, extent and quality of services expected to be provided to the Fund.
| 2. | Comparisons with the Fees of Other Clients |
At the Meeting and/or at prior meetings, the Board has reviewed information regarding the fee rates that the Fund Advisers charge for certain other types of clients and the types of services provided to these other clients. With respect to the Adviser and/or the Sub-Advisers, such other clients may include retail and institutional managed accounts advised by a Sub-Adviser (with respect to NAM, NWQ, SBAM and Winslow); investment companies offered outside the Nuveen family and sub-advised by a Sub-Adviser (with respect to NAM, NWQ and Winslow); foreign investment companies offered by Nuveen and sub-advised by a Sub-Adviser (with respect to NAM, NWQ, SBAM, Winslow and TAL); collective investment trusts sub-advised by a Sub-Adviser (with respect to NAM and Winslow); and certain funds advised by a Sub-Adviser (with respect to TAL). Further, the Board has noted that the Adviser also advises and TAL sub-advises certain exchange-traded funds (“ETFs”) sponsored by Nuveen.
90
In considering the fee data of other clients, the Board has considered, among other things, the differences in the amount, type and level of services provided to the Nuveen funds relative to other clients as well as the differences in portfolio investment policies, investor profiles, account sizes and regulatory requirements (as applicable), all of which contribute to the variations in the fee schedules. The Board has recognized the complexity and myriad of services the Adviser provides to the Nuveen funds compared to the other types of clients as the Adviser is principally responsible for all aspects of operating the funds, including complying with the increased regulatory requirements required when managing the funds as well as the increased entrepreneurial, legal and regulatory risks that the Adviser incurs in sponsoring and managing the funds. Further, with respect to ETFs, the Board has considered that Nuveen ETFs have been passively managed compared to the active management of the other Nuveen funds which has contributed to the differences in fee levels between the Nuveen ETFs and other Nuveen funds. In general, higher fee levels reflect higher levels of service provided by the Adviser, increased investment management complexity, greater product management requirements, and higher levels of business risk or some combination of these factors. In addition, the Board has considered that each Sub-Adviser’s fee is essentially for portfolio management services and therefore more comparable to the fees it receives for retail wrap accounts and other external sub-advisory mandates, as applicable. The Board has recognized that the varying levels of fees were justified given, among other things, the inherent differences in the products and the level of services provided to the Nuveen funds versus other clients, the differing regulatory requirements and legal liabilities and the entrepreneurial, legal and regulatory risks incurred in sponsoring and advising a registered investment company.
| 3. | Profitability of Fund Advisers |
In conjunction with their review of fees, at the Meeting and/or at prior meetings, the Independent Board Members have considered information regarding Nuveen’s level of profitability for its advisory services to the Nuveen funds for the calendar years 2019 and 2018. The Board has previously reviewed, among other things, Nuveen’s net margins (pre-tax) (both including and excluding distribution expenses); gross and net revenue margins (pre- and post-tax); revenues, expenses, and net income (pre-tax and after-tax and before distribution) of Nuveen for fund advisory services; and comparative profitability data comparing the margins of Nuveen compared to the adjusted margins of certain peers with publicly available data and with the most comparable assets under management (based on asset size and asset composition) for the 2018 and 2019 calendar years. The Board has also reviewed the revenues and expenses the Adviser derived from its ETF product line for the 2018 and 2019 calendar years.
In reviewing the profitability data, the Independent Board Members have recognized the subjective nature of calculating profitability as the information is not audited and is dependent on cost allocation methodologies to allocate expenses of Nuveen and its affiliates between the fund and non-fund businesses. The expenses to be allocated include direct expenses in servicing the Nuveen funds as well as indirect and/or shared costs (such as overhead, legal and compliance) some of which are attributed to the Nuveen funds pursuant to the cost allocation methodologies. The Independent Board Members have reviewed a description of the cost allocation methodologies employed to develop the financial information and a summary of the history of changes to the methodology over the eleven-year period from 2008 to 2019. The Board has also appointed three Independent Board Members, along with the assistance of independent counsel, to serve as the Board’s liaisons to review the development of the profitability data and any proposed changes to the cost allocation methodology prior to incorporating any such changes and to report to the full Board. The Board has recognized that other reasonable and valid allocation methodologies could be employed and could lead to significantly different results. Based on the data, the Independent Board Members have noted that Nuveen’s net margins were higher in 2019 than the previous year and considered the key drivers behind the revenue and expense changes that impacted Nuveen’s net margins between the years. The Board has also noted the reinvestments of some of the profits into the business through, among other things, the investment of seed capital in certain funds and continued investments in enhancements to information technology, internal infrastructure and data management improvements and global investment and innovation projects.
As indicated above, the Independent Board Members have also considered the operating margins of Nuveen Investments, Inc. compared to the adjusted margins of certain peers with publicly available data and with the most comparable assets under management (based on asset size and asset composition) to Nuveen for the calendar years 2019 and 2018. The Independent Board Members have noted that the operating margins of Nuveen Investments, Inc. were in the lower half of
91
Annual Investment Management Agreement Approval Process (continued)
(Unaudited)
the peer group range. The Independent Board Members, however, have recognized that it is difficult to make comparisons of profitability with other investment adviser peers given that comparative data is not generally public and the calculation of profitability is subjective and affected by numerous factors (such as types of funds a peer manages, its business mix, its cost of capital, the numerous assumptions underlying the methodology used to allocate expenses and other factors) which can have a significant impact on the results.
Aside from Nuveen’s profitability, the Board has recognized that the Adviser is a subsidiary of Nuveen, LLC, the investment management arm of Teachers Insurance and Annuity Association of America (“TIAA”). As such, the Board has also reviewed a balance sheet for TIAA reflecting its assets, liabilities and capital and contingency reserves for the 2019 and 2018 calendar years to consider the financial strength of TIAA. The Board has recognized the benefit of having an investment adviser and its parent with significant resources, particularly during periods of market stress.
In addition to Nuveen, the Independent Board Members have also considered the profitability of each Sub-Adviser from its relationships with the Nuveen funds. In this regard, with respect to NAM, NWQ, SBAM and Winslow, the Independent Board Members have reviewed, among other things, each such Sub-Adviser’s revenues, expenses and net revenue margins (pre- and post-tax) for its advisory activities for the calendar year ended December 31, 2019 as well as its pre-tax and after-tax net revenue margins for 2019 compared to such margins for 2018. The Independent Board Members have also reviewed a profitability analysis reflecting the revenues, expenses and revenue margin (pre- and post-tax) by asset type for NAM for the calendar year ended December 31, 2019 and the pre- and post-tax revenue margins from 2019 and 2018. With respect to TAL, the Independent Board Members have reviewed the revenues, expenses and net operating income for its advisory services to the ETFs and closed-end funds for 2019.
In evaluating the reasonableness of the compensation, the Independent Board Members have also considered any other ancillary benefits derived by the respective Fund Adviser from its relationship with the Nuveen funds as discussed in further detail below.
Based on a consideration of all the information provided, the Board has noted that Nuveen’s and the Sub-Advisers’ level of profitability was acceptable and not unreasonable in light of the services to be provided.
| D. | Economies of Scale and Whether Fee Levels Reflect These Economies of Scale |
The Board considered whether the Fund could be expected to benefit from any economies of scale. The Board has recognized that although economies of scale are difficult to measure, there are several methods to help share the benefits of economies of scale, including breakpoints in the management fee schedule, fee waivers and/or expense limitations, the pricing of Nuveen funds at scale at inception and investments in Nuveen’s business which can enhance the services provided to the funds for the fees paid. The Board has noted that Nuveen generally has employed these various methods with respect to the Nuveen funds. In this regard, the Board has noted that the management fee of the Adviser is generally comprised of a fund-level component and a complex-level component, each with its own breakpoint schedule, subject to certain exceptions. In general terms, the fund-level breakpoint schedules are designed to share economies of scale with shareholders if the particular fund grows, and the complex-level breakpoint schedule is designed to deliver the benefits of economies of scale to shareholders when the eligible assets in the complex pass certain thresholds even if the assets of a particular fund are unchanged or have declined. Accordingly, the Independent Board Members reviewed and considered the proposed management fees for the Fund, taking into account the fund-level and complex-level breakpoint schedules. As indicated above, the Board noted that the Reorganizations were intended to result in reduced net operating expenses as a result of certain fixed costs being spread over the larger asset base of the Fund and a potentially lower effective fund-level management fee rate due to the ability of the Fund’s assets to achieve breakpoints in its fee schedule (assuming all three Reorganizations were completed). Further, the Independent Board Members have recognized that although closed-end funds may from time to time make additional share offerings, the growth of their assets would occur primarily through the appreciation of such funds’ investment portfolios.
The Independent Board Members have also recognized the Adviser’s continued reinvestment in its business through, among other things, investments in its business infrastructure and information technology, portfolio accounting system and other
92
systems and platforms that will, among other things, support growth, simplify and enhance information sharing, and enhance the investment process to the benefit of all of the Nuveen funds.
Based on its review, the Board concluded that the proposed fee structure was acceptable and reflected economies of scale to be shared with the Fund’s shareholders when assets under management increase.
| E. | Indirect Benefits |
The Independent Board Members received and considered information at the Meeting and/or at prior meetings regarding other benefits the respective Fund Adviser or its affiliates may receive as a result of their relationship with the Nuveen funds. With respect to closed-end funds, the Board has considered the compensation received by an affiliate of the Adviser for serving as co-manager in the initial public offerings of new closed-end funds and for serving as an underwriter on shelf offerings of existing closed-end funds. In addition, the Independent Board Members have noted that various sub-advisers (including NAM, NWQ, SBAM and Winslow) may engage in soft dollar transactions pursuant to which they may receive the benefit of research products and other services provided by broker-dealers executing portfolio transactions on behalf of the applicable Nuveen funds, although the Board has recognized that certain sub-advisers may be phasing out the use of soft dollars over time. Further, the Board noted that TAL does not participate in soft dollar arrangements with respect to Nuveen fund portfolio transactions.
In addition, the Board has noted that the benefits for a sub-adviser when transacting in fixed-income securities may be more limited as such securities generally trade on a principal basis and therefore do not generate brokerage commissions. Further, the Board has considered that although a sub-adviser that engages in soft dollar transactions may benefit from the receipt of research and other services that it may otherwise have to pay for out of its own resources, the research may also benefit the Nuveen funds to the extent it enhances the ability of the sub-adviser to manage such funds or is acquired through the commissions paid on portfolio transactions of other clients.
Based on its review, the Board concluded that any indirect benefits expected to be received by a Fund Adviser as a result of its relationship with the Fund were reasonable and within acceptable parameters.
| F. | Approval |
The Independent Board Members did not identify any single factor discussed previously as all-important or controlling. The Board Members, including a majority of the Independent Board Members, concluded that the terms of the Investment Management Agreement and the Sub-Advisory Agreements were fair and reasonable, that the respective Fund Adviser’s fees were reasonable in light of the services expected to be provided to the Fund and that the Investment Management Agreement and Sub-Advisory Agreements should be and were approved on behalf of the Fund.
| G. | Subsequent Board Actions |
At a meeting held on November 16-18, 2021, the Board approved the termination of the Sub-Advisory Agreements with NWQ and SBAM, effective on or about December 31, 2021 (the “Termination Date”). In this regard, it was contemplated that in connection with certain strategic initiatives identifying opportunities across the Nuveen equities and fixed income platform, seeking to drive greater collaboration and alignment across Nuveen’s investment specialists, the strategies and personnel of NWQ and SBAM would be absorbed by NAM. Accordingly, the Board considered, among other things, that any Fund assets managed by NWQ and/or SBAM on the Termination Date would be reallocated to NAM and managed by NAM under the terms of NAM’s Sub-Advisory Agreement.
93
(Unaudited)
The management of the Funds, including general supervision of the duties performed for the Funds by the Adviser, is the responsibility of the Board of Trustees of the Funds. None of the trustees who are not “interested” persons of the Funds (referred to herein as “independent board members”) has ever been a director or employee of, or consultant to, Nuveen or its affiliates. The names and business addresses of the trustees and officers of the Funds, their principal occupations and other affiliations during the past five years, the number of portfolios each Trustee oversees and other directorships they hold are set forth below.
Name, Year of Birth & Address | Position(s) Held with the Funds | Year First Elected or Appointed and Term(1) | Principal Occupation(s) Including other Directorships During Past 5 Years | Number of Portfolios in Fund Complex Overseen by Board Member | ||||
| Independent Board Members: | ||||||||
∎ TERENCE J. TOTH | Formerly, a Co-Founding Partner, Promus Capital (investment advisory firm) (2008-2017); Director, Quality Control Corporation (manufacturing) (since 2012); member: Catalyst Schools of Chicago Board (since 2008) and Mather Foundation Board (philanthropy) (since 2012), and chair of its Investment Committee; formerly, Member, Chicago Fellowship Board (philanthropy) (2005-2016); formerly, Director, Fulcrum IT Services LLC (information technology services firm to government entities) (2010-2019); formerly, Director, LogicMark LLC (health services) (2012-2016); formerly, Director, Legal & General Investment Management America, Inc. (asset management) (2008-2013); formerly, CEO and President, Northern Trust Global Investments (financial services) (2004-2007): Executive Vice President, Quantitative Management & Securities Lending (2000-2004); prior thereto, various positions with Northern Trust Company (financial services) (since 1994); formerly, Member, Northern Trust Mutual Funds Board (2005-2007), Northern Trust Global Investments Board (2004-2007), Northern Trust Japan Board (2004-2007), Northern Trust Securities Inc. Board (2003-2007) and Northern Trust Hong Kong Board (1997-2004). | |||||||
1959 333 W. Wacker Drive Chicago, IL 6o6o6 | Chairman and Board Member | 2008 Class II | 142 | |||||
∎ JACK B. EVANS | Chairman (since 2019), formerly, President (1996-2019), The Hall-Perrine Foundation, (private philanthropic corporation); Life Trustee of Coe College; formerly, Member and President Pro-Tem of the Board of Regents for the State of Iowa University System (2007- 2013); Director and Chairman (2009-2021), United Fire Group, a publicly held company; Director, Public Member, American Board of Orthopaedic Surgery (2015-2020); Director (2000-2004), Alliant Energy; Director (1996-2015), The Gazette Company (media and publishing); Director (1997- 2003), Federal Reserve Bank of Chicago; President and Chief Operating Officer (1972-1995), SCI Financial Group, Inc., (regional financial services firm). | |||||||
1948 333 W. Wacker Drive Chicago, IL 6o6o6 | Board Member | 1999 Class III | 142 | |||||
∎ WILLIAM C. HUNTER | Dean Emeritus, formerly, Dean, Tippie College of Business, University of (2006-2012); Director of Wellmark, Inc. (since 2009); past Director (2005- 2015), and past President (2010-2014) Beta Gamma Sigma, Inc., The International Business Honor Society; formerly, Director (2004-2018) of Xerox Corporation; formerly, Dean and Distinguished Professor of Finance, School of Business at the University of Connecticut (2003-2006); previously, Senior Vice President and Director of Research at the Federal Reserve Bank of Chicago (1995-2003); formerly, Director (1997-2007), Credit Research Center at Georgetown University. | |||||||
1948 333 W. Wacker Drive Chicago, IL 6o6o6 | Board Member | 2003 Class I | 142 | |||||
∎ AMY B. R. LANCELLOTTA | Formerly, Managing Director, Independent Directors Council (IDC) (supports the fund independent director community and is part of the Investment Company Institute (ICI), which represents regulated investment companies) (2006-2019); formerly, various positions with ICI (1989-2006); Member of the Board of Directors, Jewish Coalition Against Domestic Abuse (JCADA) (since 2020). | |||||||
1959 333 W. Wacker Drive Chicago, IL 6o6o6 | Board Member | 2021 Class II | 142 | |||||
94
Name, Year of Birth & Address | Position(s) Held with the Funds | Year First Elected or Appointed and Term(1) | Principal Occupation(s) Including other Directorships During Past 5 Years | Number of Portfolios in Fund Complex Overseen by Board Member | ||||
| Independent Board Members (continued): | ||||||||
∎ JOANNE T. MEDERO | Formerly, Managing Director, Government Relations and Public Policy (2009-2020) and Senior Advisor to the Vice Chairman (2018-2020), BlackRock, Inc. (global investment management firm); formerly, Managing (Director, Global Head of Government Relations and Public Policy, Barclays Group (IBIM) (investment banking, investment management and wealth management businesses) (2006-2009); formerly, Managing Director, Global General Counsel and Corporate Secretary, Barclays Global Investors (global investment management firm) (1996-2006); formerly, Partner, Orrick, Herrington & Sutcliffe LLP (law firm) (1993-1995); formerly, General Counsel, Commodity Futures Trading Commission (government agency overseeing U.S. derivatives markets) (1989-1993); formerly, Deputy Associate Director/ Associate Director for Legal and Financial Affairs, Office of Presidential Personnel, The White House (1986-1989); Member of the Board of Directors, Baltic-American Freedom Foundation (seeks to provide opportunities for citizens of the Baltic states to gain education and professional development through exchanges in the U.S.) (since 2019). | |||||||
1954 333 W. Wacker Drive Chicago, IL 6o6o6 | Board Member | 2021 Class III | 142 | |||||
∎ ALBIN F. MOSCHNER | Founder and Chief Executive Officer, Northcroft Partners, LLC, (management consulting) (since 2012); formerly, Chairman (2019), and Director (2012-2019), USA Technologies, Inc., (provider of solutions and services to facilitate electronic payment transactions); formerly, Director, Wintrust Financial Corporation (1996-2016); previously, held positions at Leap Wireless International, Inc., (consumer wireless services) including Consultant (2011- 2012), Chief Operating Officer (2008-2011), and Chief Marketing Officer (2004- 2008); formerly, President, Verizon Card Services division of Verizon Communications, Inc. (2000-2003); formerly, President, One Point Services at One Point Communications (telecommunication services) (1999-2000); formerly, Vice Chairman of the Board, Diba, Incorporated (internet technology provider) (1996-1997); formerly, various executive positions (1991-1996) including Chief Executive Officer (1995-1996) of Zenith Electronics Corporation (consumer electronics). | |||||||
1952 333 W. Wacker Drive Chicago, IL 6o6o6 | Board Member | 2016 Class III | 142 | |||||
∎ JOHN K. NELSON | Member of Board of Directors of Core12 LLC. (private firm which develops branding, marketing and communications strategies for clients) (since 2008); served on The President’s Council of Fordham University (2010-2019) and previously a Director of the Curran Center for Catholic American Studies (2009- 2018); formerly, senior external advisor to the Financial Services practice of Deloitte Consulting LLP. (2012-2014); former Chair of the Board of Trustees of Marian University (2010-2014 as trustee, 2011-2014 as Chair); formerly Chief Executive Officer of ABN AMRO Bank N.V., North America, and Global Head of the Financial Markets Division (2007-2008), with various executive leadership roles in ABN AMRO Bank N.V. between 1996 and 2007. | |||||||
1962 333 W. Wacker Drive Chicago, IL 6o6o6 | Board Member | 2013 Class II | 142 | |||||
∎ JUDITH M. STOCKDALE | Board Member, Land Trust Alliance (national public charity addressing natural land and water conservation in the U.S.) (since 2013); formerly, Board Member, U.S. Endowment for Forestry and Communities (national endowment addressing forest health, sustainable forest production and markets, and economic health of forest-reliant communities in the U.S.) (2013-2019); formerly, Executive Director (1994-2012), Gaylord and Dorothy Donnelley Foundation (private foundation endowed to support both natural land conservation and artistic vitality); prior thereto, Executive Director, Great Lakes Protection Fund (endowment created jointly by seven of the eight Great Lake states’ Governors to take a regional approach to improving the health of the Great Lakes) (1990-1994). | |||||||
1947 333 W. Wacker Drive Chicago, IL 6o6o6 | Board Member | 1997 Class I | 142 | |||||
95
Board Members & Officers (continued)
(Unaudited)
Name, Year of Birth & Address | Position(s) Held with the Funds | Year First Elected or Appointed and Term(1) | Principal Occupation(s) Including other Directorships During Past 5 Years | Number of Portfolios in Fund Complex Overseen by Board Member | ||||
| Independent Board Members (continued): | ||||||||
∎ CAROLE E. STONE | Former Director, Chicago Board Options Exchange, Inc. (2006-2017); and C2 Options Exchange, Incorporated (2009-2017); formerly Director, Cboe, Global Markets, Inc., (2010-2020) formerly named CBOE Holdings, Inc.; formerly, Commissioner, New York State Commission on Public Authority Reform (2005-2010). | |||||||
1947 333 W. Wacker Drive Chicago, IL 6o6o6 | Board Member | 2007 Class I | 142 | |||||
∎ MATTHEW THORNTON III | Formerly, Executive Vice President and Chief Operating Officer (2018-2019), FedEx Freight Corporation, a subsidiary of FedEx Corporation (“FedEx”) (provider of transportation, e-commerce and business services through its portfolio of companies); formerly, Senior Vice President, U.S. Operations (2006-2018), Federal Express Corporation, a subsidiary of FedEx; formerly, Member of the Board of Directors (2012-2018), Safe Kids Worldwide® (a non-profit organization dedicated to preventing childhood injuries). Member of the Board of Directors (since 2014), The Sherwin-Williams Company (develops, manufactures, distributes and sells paints, coatings and related products); Director (since 2020), Crown Castle International (provider of communications infrastructure). | |||||||
1958 333 West Wacker Drive Chicago, IL 60606 | Board Member | 2020 Class III | 142 | |||||
∎ MARGARET L. WOLFF | Formerly, member of the Board of Directors (2013-2017) of Travelers Insurance Company of Canada and The Dominion of Canada General Insurance Company (each, a part of Travelers Canada, the Canadian operation of The Travelers Companies, Inc.); formerly, Of Counsel, Skadden, Arps, Slate, Meagher & Flom LLP (Mergers & Acquisitions Group) (legal services) (2005-2014); Member of the Board of Trustees of New York-Presbyterian Hospital (since 2005); Member (since 2004) and Chair (since 2015) of the Board of Trustees of The John A. Hartford Foundation (philanthropy dedicated to improving the care of older adults); formerly, Member (2005-2015) and Vice Chair (2011-2015) of the Board of Trustees of Mt. Holyoke College. | |||||||
1955 333 W. Wacker Drive Chicago, IL 6o6o6 | Board Member | 2016 Class I | 142 | |||||
∎ ROBERT L. YOUNG | Formerly, Chief Operating Officer and Director, J.P.Morgan Investment Management Inc. (financial services) (2010-2016); formerly, President and Principal Executive Officer (2013-2016), and Senior Vice President and Chief Operating Officer (2005-2010), of J.P.Morgan Funds; formerly, Director and various officer positions for J.P.Morgan Investment Management Inc. (formerly, JPMorgan Funds Management, Inc. and formerly, One Group Administrative Services) and JPMorgan Distribution Services, Inc. (financial services) (formerly, One Group Dealer Services, Inc.) (1999-2017). | |||||||
1963 333 W. Wacker Drive Chicago, IL 6o6o6 | Board Member | 2017 Class II | 142 | |||||
96
Name, Year of Birth & Address | Position(s) Held with the Funds | Year First Elected or Appointed(2) | Principal Occupation(s) During Past 5 Years | |||
| Officers of the Funds: | ||||||
∎ DAVID J. LAMB | Man1aging Director of Nuveen Fund Advisors, LLC (since 2019) Senior Managing Director (since 2021), formerly, Managing Director (2020-2021) of Nuveen Securities, LLC; Senior Managing Director (since 2021), formerly, Managing Director (2017-2021), Senior Vice President of Nuveen (2006-2017), Vice President prior to 2006. | |||||
1963 333 W. Wacker Drive Chicago, IL 6o6o6 | Chief Administrative Officer | 2015 | ||||
∎ MARK J. CZARNIECKI | Vice President and Assistant Secretary of Nuveen Securities, LLC (since 2016) and Nuveen Fund Advisors (since 2017); Managing Director and Associate General Counsel (since January 2022), formerly, Vice President and Associate General Counsel of Nuveen (2013-2021) and Vice President, Assistant Secretary and Associate General Counsel of Nuveen Asset Management LLC (since 2018). | |||||
1979 901 Marquette Avenue Minneapolis, MN 55402 | Vice President and Assistant Secretary | 2013 | ||||
∎ DIANA R. GONZALEZ | Vice President and Assistant Secretary of Nuveen Fund Advisors, LLC (since 2017); Vice President and Associate General Counsel of Nuveen (since 2017); formerly, Associate General Counsel of Jackson National Asset Management (2012-2017). | |||||
1978 333 W. Wacker Drive Chicago, IL 6o6o6 | Vice President and Assistant Secretary | 2017 | ||||
∎ NATHANIEL T. JONES | Senior Managing Director (since 2021), formerly, Managing Director (2017-2021), Senior Vice President (2016-2017), Vice President (2011-2016) of Nuveen; Managing Director (since 2015) of Nuveen Fund Advisors, LLC; Chartered Financial Analyst. | |||||
1979 333 W. Wacker Drive Chicago, IL 6o6o6 | Vice President and Treasurer | 2016 | ||||
∎ TINA M. LAZAR | Managing Director (since 2017), formerly, Senior Vice President (2014-2017) of Nuveen Securities, LLC. | |||||
1961 333 W. Wacker Drive Chicago, IL 6o6o6 | Vice President | 2002 | ||||
∎ BRIAN J. LOCKHART | Managing Director (since 2019) of Nuveen Fund Advisors, LLC; Senior Managing Director (since 2021), formerly, Managing Director (2017-2021), Vice President (2010-2017) of Nuveen; Head of Investment Oversight (since 2017), formerly, Team Leader of Manager Oversight (2015-2017); Chartered Financial Analyst and Certified Financial Risk Manager. | |||||
1974 333 W. Wacker Drive Chicago, IL 6o6o6 | Vice President | 2019 | ||||
∎ JACQUES M. LONGERSTAEY | Senior Managing Director, Chief Risk Officer, Nuveen, LLC (since May 2019); Senior Managing Director (since May 2019) of Nuveen Fund Advisors, LLC; formerly, Chief Investment and Model Risk Officer, Wealth & Investment Management Division, Wells Fargo Bank (NA) (2013-2019). | |||||
1963 8500 Andrew Carnegie Blvd. Charlotte, NC 28262 | Vice President | 2019 | ||||
∎ KEVIN J. MCCARTHY | Senior Managing Director (since 2017) and Secretary and General Counsel (since 2016) of Nuveen Investments, Inc., formerly, Executive Vice President (2016-2017) and Managing Director and Assistant Secretary (2008-2016); Senior Managing Director (since 2017) and Assistant Secretary (since 2008) of Nuveen Securities, LLC, formerly Executive Vice President (2016-2017) and Managing Director (2008- 2016); Senior Managing Director (since 2017), and Secretary (since 2016) of Nuveen Fund Advisors, LLC, formerly, Co-General Counsel (2011-2020), Executive Vice President (2016-2017), Managing Director (2008-2016) and Assistant Secretary (2007-2016); Senior Managing Director (since 2017), Secretary (since 2016) of Nuveen Asset Management, LLC, formerly, Associate General Counsel (2011-2020), Executive Vice President (2016-2017) and Managing Director and Assistant Secretary (2011- 2016); Vice President (since 2007) and Secretary (since 2016), formerly, Assistant Secretary, of NWQ Investment Management Company, LLC, Santa Barbara Asset Management, LLC and Winslow Capital Management, LLC (since 2010). Senior Managing Director (since 2017) and Secretary (since 2016) of Nuveen Alternative Investments, LLC. | |||||
1966 333 W. Wacker Drive Chicago, IL 6o6o6 | Vice President and Assistant Secretary | 2007 | ||||
97
Board Members & Officers (continued)
(Unaudited)
Name, Year of Birth & Address | Position(s) Held with the Funds | Year First Elected or Appointed(2) | Principal Occupation(s) During Past 5 Years | |||
| Officers of the Funds (continued): | ||||||
∎ JON SCOTT MEISSNER | Managing Director of Mutual Fund Tax and Financial Reporting groups at Nuveen (since 2017); Managing Director of Nuveen Fund Advisors, LLC (since 2019); Senior Director of Teachers Advisors, LLC and TIAA-CREF Investment Management, LLC (since 2016); Senior Director (since 2015) Mutual Fund Taxation to the TIAA-CREF Funds, the TIAA-CREF Life Funds, the TIAA Separate Account VA-1 and the CREF Accounts; has held various positions with TIAA since 2004. | |||||
1973 8500 Andrew Charlotte, NC 28262 | Vice President and Assistant Secretary | 2019 | ||||
∎ DEANN D. MORGAN | President, Nuveen Fund Advisors, LLC (since 2020); Executive Vice President, Global Head of Product at Nuveen (since 2019); Co-Chief Executive Officer of Nuveen Securities, LLC since 2020); Managing Member of MDR Collaboratory LLC (since 2018); formerly,Managing Director, (Head of Wealth Management Product Structuring & COO Multi Asset Investing. The Blackstone Group (2013-2017). | |||||
1969 730 Third Avenue New York, NY 10017 | Vice President | 2020 | ||||
∎ CHRISTOPHER M. ROHRBACHER | Managing Director and Assistant Secretary (since 2017) of Nuveen Securities, LLC; Managing Director (since 2017) General Counsel (since 2020), and Assistant Secretary (since 2016), formerly, Senior Vice President (2016-2017), of Nuveen Fund Advisors, LLC; Managing Director, Associate General Counsel and Assistant Secretary of Nuveen Asset Management, LLC (since 2020); Managing Director (since 2017), and Associate General Counsel (since 2016), formerly, Senior Vice President (2012-2017) and Assistant General Counsel (2008-2016) of Nuveen. | |||||
1971 333 W. Wacker Drive Chicago, IL 6o6o6 | Vice President and Assistant Secretary | 2008 | ||||
∎ WILLIAM A. SIFFERMANN | Managing Director (since 2017), formerly Senior Vice President (2016-2017) and Vice President (2011-2016) of Nuveen. | |||||
1975 333 W. Wacker Drive Chicago, IL 6o6o6 | Vice President | 2017 | ||||
∎ E. SCOTT WICKERHAM | Senior Managing Director, Head of Public Investment Finance at Nuveen (since 2019), formerly, Managing Director; Senior Managing Director (since 2019) of Nuveen Fund Advisers, (LLC; Principal Financial Officer, Principal Accounting Officer and Treasurer (since 2017) of the TIAA- CREF Funds, the TIAA-CREF Life Funds, the TIAA Separate Account VA-1 and Principal Financial Officer, Principal Accounting Officer (since 2020) and Treasurer (since 2017) to the CREF Accounts; formerly, Senior Director, TIAA-CREF Fund Administration (2014-2015); has held various positions with TIAA since 2006. | |||||
1973 8500 Andrew Charlotte, NC 28262 | Vice President and Controller | 2019 | ||||
∎ MARK L. WINGET | Vice President and Assistant Secretary of Nuveen Securities, LLC (since 2008), and Nuveen Fund Advisors, LLC (since 2019); Vice President, Associate General Counsel and Assistant Secretary of Nuveen Asset Management, LLC (since 2020); Vice President (since 2010) and Associate General Counsel (since 2019), formerly, Assistant General Counsel (2008-2016) of Nuveen. | |||||
1968 333 W. Wacker Drive Chicago, IL 60606 | Vice President and Secretary | 2008 | ||||
∎ GIFFORD R. ZIMMERMAN | Formerly, Managing Director (2002-2020) and Assistant Secretary (2002-2020) of Nuveen Securities, LLC; formerly, Managing Director (2002-2020), Assistant Secretary (1997-2020) and Co-General Counsel (2011- 2020) of Nuveen Fund Advisors, LLC; formerly, Managing Director (2004-2020) and Assistant Secretary (1994-2020) of Nuveen Investments, Inc.; formerly, Managing Director, Assistant Secretary and Associate General Counsel of Nuveen Asset Management, LLC (2011-2020); formerly, Vice President and Assistant Secretary of NWQ Investment Management Company, LLC (2002-2020), Santa Barbara Asset Management, LLC (2006-2020) and Winslow Capital Management, LLC (2010-2020); Chartered Financial Analyst. | |||||
1956 333 W. Wacker Drive Chicago, IL 60606 | Vice President and Chief Compliance Officer | 1988 | ||||
| (1) | The Board of Trustees is divided into three classes, Class I, Class II, and Class III, with each being elected to serve until the third succeeding annual shareholders’ meeting subsequent to its election or thereafter in each case when its respective successors are duly elected or appointed, except two board members are elected by the holders of Preferred Shares, when applicable, to serve until the next annual shareholders’ meeting subsequent to its election or thereafter in each case when its respective successors are duly elected or appointed. The year first elected or appointed represents the year in which the board member was first elected or appointed to any fund in the Nuveen complex. |
| (2) | Officers serve indefinite terms until their successor has been duly elected and qualified, their death or their resignation or removal. The year first elected or appointed represents the year in which the Officer was first elected or appointed to any fund in the Nuveen complex. |
98
Notes
99
Nuveen:
Serving Investors for Generations
Since 1898, financial professionals and their clients have relied on Nuveen to provide
dependable investment solutions through continued adherence to proven, long-term investing
principles. Today, we offer a range of high quality solutions designed to
be integral components of a well-diversified core portfolio.
Focused on meeting investor needs.
Nuveen is the investment manager of TIAA. We have grown into one of the world’s premier global asset managers, with specialist knowledge across all major asset classes and particular strength in solutions that provide income for investors and that draw on our expertise in alternatives and responsible investing. Nuveen is driven not only by the independent investment processes across the firm, but also the insights, risk management, analytics and other tools and resources that a truly world-class platform provides. As a global asset manager, our mission is to work in partnership with our clients to create solutions which help them secure their financial future.
Find out how we can help you.
To learn more about how the products and services of Nuveen may be able to help you meet your financial goals, talk to your financial professional, or call us at (800) 257-8787. Please read the information provided carefully before you invest. Investors should consider the investment objective and policies, risk considerations, charges and expenses of any investment carefully. Where applicable, be sure to obtain a prospectus, which contains this and other relevant information. To obtain a prospectus, please contact your securities representative or Nuveen, 333 W. Wacker Dr., Chicago, IL 60606. Please read the prospectus carefully before you invest or send money.
Learn more about Nuveen Funds at: www.nuveen.com/closed-end-funds
| Nuveen Securities, LLC, member FINRA and SIPC | 333 West Wacker Drive Chicago, IL 60606 | www.nuveen.com | EAN-D-1221D 2007019-INV-Y-02/23 |
ITEM 2. CODE OF ETHICS.
As of the end of the period covered by this report, the registrant has adopted a code of ethics that applies to the registrant’s principal executive officer, principal financial officer, principal accounting officer or controller, or persons performing similar functions. There were no amendments to or waivers from the Code during the period covered by this report. The registrant has posted the code of ethics on its website at www.nuveen.com/fund-governance. (To view the code, click on Code of Conduct.)
ITEM 3. AUDIT COMMITTEE FINANCIAL EXPERT.
As of the end of the period covered by this report, the registrant’s Board of Directors or Trustees (“Board”) determined that the registrant has at least one “audit committee financial expert” (as defined in Item 3 of Form N-CSR) serving on its Audit Committee. The registrant’s audit committee financial experts are Carole E. Stone, Jack B. Evans, William C. Hunter and Albin F. Moschner who are “independent” for purposes of Item 3 of Form N-CSR.
Ms. Stone served for five years as Director of the New York State Division of the Budget. As part of her role as Director, Ms. Stone was actively involved in overseeing the development of the State’s operating, local assistance and capital budgets, its financial plan and related documents; overseeing the development of the State’s bond-related disclosure documents and certifying that they fairly presented the State’s financial position; reviewing audits of various State and local agencies and programs; and coordinating the State’s system of internal audit and control. Prior to serving as Director, Ms. Stone worked as a budget analyst/examiner with increasing levels of responsibility over a 30 year period, including approximately five years as Deputy Budget Director. Ms. Stone has also served as Chair of the New York State Racing Association Oversight Board, as Chair of the Public Authorities Control Board, as a Commissioner on the New York State Commission on Public Authority Reform and as a member of the Boards of Directors of several New York State public authorities. These positions have involved overseeing operations and finances of certain entities and assessing the adequacy of project/entity financing and financial reporting. Currently, Ms. Stone is on the Board of Directors of CBOE Holdings, Inc., of the Chicago Board Options Exchange, and of C2 Options Exchange. Ms. Stone’s position on the boards of these entities and as a member of both CBOE Holdings’ Audit Committee and its Finance Committee has involved, among other things, the oversight of audits, audit plans and preparation of financial statements.
Mr. Evans was formerly President and Chief Operating Officer of SCI Financial Group, Inc., a full service registered broker-dealer and registered investment adviser (“SCI”). As part of his role as President and Chief Operating Officer, Mr. Evans actively supervised the Chief Financial Officer (the “CFO”) and actively supervised the CFO’s preparation of financial statements and other filings with various regulatory authorities. In such capacity, Mr. Evans was actively involved in the preparation of SCI’s financial statements and the resolution of issues raised in connection therewith. Mr. Evans has also served on the audit committee of various reporting companies. At such companies, Mr. Evans was involved in the oversight of audits, audit plans, and the preparation of financial statements. Mr. Evans also formerly chaired the audit committee of the Federal Reserve Bank of Chicago.
Mr. Hunter was formerly a Senior Vice President at the Federal Reserve Bank of Chicago. As part of his role as Senior Vice President, Mr. Hunter was the senior officer responsible for all operations of each of the Economic Research, Statistics, and Community and Consumer Affairs units at the Federal Reserve Bank of Chicago. In such capacity, Mr. Hunter oversaw the subunits of the Statistics and Community and Consumer Affairs divisions responsible for the analysis and evaluation of bank and bank holding company financial statements and financial filings. Prior to serving as Senior Vice President at the Federal Reserve Bank of Chicago, Mr. Hunter was the Vice President of the Financial Markets unit at the Federal Reserve Bank of Atlanta where he supervised financial staff and bank holding company analysts who analyzed and evaluated bank and bank holding company financial statements. Mr. Hunter also currently serves on the Boards of Directors of Xerox Corporation and Wellmark, Inc. as well as on the Audit Committees of such Boards. As an Audit Committee member, Mr. Hunter’s responsibilities include, among other things, reviewing financial statements, internal audits and internal controls over financial reporting. Mr. Hunter also formerly was a Professor of Finance at the University of Connecticut School of Business and has authored numerous scholarly articles on the topics of finance, accounting and economics.
Mr. Moschner, Founder and Chief Executive Officer, Northcroft Partners, LLC, (management consulting) (since 2012); formerly, Chairman (2019), and Director (2012-2019), USA Technologies, Inc., (provider of solutions and services to facilitate electronic payment transactions); formerly, Director, Wintrust Financial Corporation (1996-2016); previously, held positions at Leap Wireless International, Inc., (consumer wireless services) including Consultant (2011-2012), Chief Operating Officer (2008-2011), and Chief Marketing Officer (2004-2008); formerly, President, Verizon Card Services division of Verizon Communications, Inc. (2000-2003); formerly, President, One Point Services at One Point Communications (telecommunication services) (1999-2000); formerly, Vice Chairman of the Board, Diba, Incorporated (internet technology provider) (1996-1997); formerly, various executive positions (1991-1996), including Chief Executive Officer (1995-1996) of Zenith Electronics Corporation (consumer electronics).
ITEM 4. PRINCIPAL ACCOUNTANT FEES AND SERVICES.
The following tables show the amount of fees that KPMG LLP, the Fund’s auditor, billed to the Fund during the Fund’s last two full fiscal years. For engagements with KPMG LLP the Audit Committee approved in advance all audit services and non-audit services that KPMG LLP provided to the Fund, except for those non-audit services that were subject to the pre-approval exception under Rule 2-01 of Regulation S-X (the “pre-approval exception”). The pre-approval exception for services provided directly to the Fund waives the pre-approval requirement for services other than audit, review or attest services if: (A) the aggregate amount of all such services provided constitutes no more than 5% of the total amount of revenues paid by the Fund to its accountant during the fiscal year in which the services are provided; (B) the Fund did not recognize the services as non-audit services at the time of the engagement; and (C) the services are promptly brought to the Audit Committee’s attention, and the Committee (or its delegate) approves the services before the audit is completed.
The Audit Committee has delegated certain pre-approval responsibilities to its Chair (or, in her absence, any other member of the Audit Committee).
SERVICES THAT THE FUND’S AUDITOR BILLED TO THE FUND
Fiscal Year Ended | Audit Fees Billed to Fund 1 | Audit-Related Fees Billed to Fund 2 | Tax Fees Billed to Fund 3 | All Other Fees Billed to Fund 4 | ||||||||||||
December 31, 2021 | $ | 58,280 | $ | 0 | $ | 0 | $ | 0 | ||||||||
|
|
|
|
|
|
|
| |||||||||
| ||||||||||||||||
Percentage approved pursuant to pre-approval exception | 0 | % | 0 | % | 0 | % | 0 | % | ||||||||
|
|
|
|
|
|
|
| |||||||||
| ||||||||||||||||
December 31, 2020 | $ | 0 | $ | 0 | $ | 0 | $ | 0 | ||||||||
|
|
|
|
|
|
|
| |||||||||
| ||||||||||||||||
Percentage approved pursuant to pre-approval exception | 0 | % | 0 | % | 0 | % | 0 | % | ||||||||
|
|
|
|
|
|
|
| |||||||||
1 “Audit Fees” are the aggregate fees billed for professional services for the audit of the Fund’s annual financial statements and services provided in connection with statutory and regulatory filings or engagements.
2 “Audit Related Fees” are the aggregate fees billed for assurance and related services reasonably related to the performance of the audit or review of financial statements that are not reported under “Audit Fees”. These fees include offerings related to the Fund’s common shares and leverage.
3 “Tax Fees” are the aggregate fees billed for professional services for tax advice, tax compliance, and tax planning. These fees include: all global withholding tax services; excise and state tax reviews; capital gain, tax equalization and taxable basis calculation performed by the principal accountant.
4 “ All Other Fees” are the aggregate fees billed for products and services other than “Audit Fees”, “Audit-Related Fees” and “Tax Fees”. These fees represent all “Agreed-Upon Procedures” engagements pertaining to the Fund’s use of leverage.
5 NMAIF is a new shell that absorbed JTA, JTD & JDD on 11/19/2021
SERVICES THAT THE FUND’S AUDITOR BILLED TO THE
ADVISER AND AFFILIATED FUND SERVICE PROVIDERS
The following tables show the amount of fees billed by KPMG LLP to Nuveen Fund Advisors, LLC (formerly Nuveen Fund Advisors, Inc.) (the “Adviser”), and any entity controlling, controlled by or under common control with the Adviser that provides ongoing services to the Fund (“Affiliated Fund Service Provider”), for engagements directly related to the Fund’s operations and financial reporting, during the Fund’s last two full fiscal years.
The tables also show the percentage of fees subject to the pre-approval exception. The pre-approval exception for services provided to the Adviser and any Affiliated Fund Service Provider (other than audit, review or attest services) waives the pre-approval requirement if: (A) the aggregate amount of all such services provided constitutes no more than 5% of the total amount of revenues paid to KPMG LLP by the Fund, the Adviser and Affiliated Fund Service Providers during the fiscal year in which the services are provided that would have to be pre-approved by the Audit Committee; (B) the Fund did not recognize the services as non-audit services at the time of the engagement; and (C) the services are promptly brought to the Audit Committee’s attention, and the Committee (or its delegate) approves the services before the Fund’s audit is completed.
Fiscal Year Ended | Audit-Related Fees Billed to Adviser and Affiliated Fund Service Providers | Tax Fees Billed to Adviser and Affiliated Fund Service Providers | All Other Fees Billed to Adviser and Affiliated Fund Service Providers | |||||||||
December 31, 2021 | $ | 0 | $ | 0 | $ | 0 | ||||||
|
|
|
|
|
| |||||||
| ||||||||||||
Percentage approved pursuant to pre-approval exception | 0 | % | 0 | % | 0 | % | ||||||
|
|
|
|
|
| |||||||
| ||||||||||||
December 31, 2020 | $ | 0 | $ | 0 | $ | 0 | ||||||
|
|
|
|
|
| |||||||
| ||||||||||||
Percentage approved pursuant to pre-approval exception | 0 | % | 0 | % | 0 | % | ||||||
|
|
|
|
|
| |||||||
NON-AUDIT SERVICES
The following table shows the amount of fees that KPMG LLP billed during the Fund’s last two full fiscal years for non-audit services. The Audit Committee is required to pre-approve non-audit services that KPMG LLP provides to the Adviser and any Affiliated Fund Services Provider, if the engagement related directly to the Fund’s operations and financial reporting (except for those subject to the pre-approval exception described above). The Audit Committee requested and received information from KPMG LLP about any non-audit services that KPMG LLP rendered during the Fund’s last fiscal year to the Adviser and any Affiliated Fund Service Provider. The Committee considered this information in evaluating KPMG LLP’s independence.
Fiscal Year Ended | Total Non-Audit Fees Billed to Fund | Total Non-Audit Fees billed to Adviser and Affiliated Fund Service Providers (engagements related directly to the operations and financial reporting of the Fund) | Total Non-Audit Fees billed to Adviser and Affiliated Fund Service Providers (all other engagements) | Total | ||||||||||||
December 31, 2021 | $ | 0 | $ | 0 | $ | 0 | $ | 0 | ||||||||
December 31, 2020 | $ | 0 | $ | 0 | $ | 0 | $ | 0 | ||||||||
“Non-Audit Fees billed to Fund” for both fiscal year ends represent “Tax Fees” and “All Other Fees” billed to Fund in their respective amounts from the previous table.
Less than 50 percent of the hours expended on the principal accountant’s engagement to audit the registrant’s financial statements for the most recent fiscal year were attributed to work performed by persons other than the principal accountant’s full-time, permanent employees.
Audit Committee Pre-Approval Policies and Procedures. Generally, the Audit Committee must approve (i) all non-audit services to be performed for the Fund by the Fund’s independent accountants and (ii) all audit and non-audit services to be performed by the Fund’s independent accountants for the Affiliated Fund Service Providers with respect to operations and financial reporting of the Fund. Regarding tax and research projects conducted by the independent accountants for the Fund and Affiliated Fund Service Providers (with respect to operations and financial reports of the Fund) such engagements will be (i) pre-approved by the Audit Committee if they are expected to be for amounts greater than $10,000; (ii) reported to the Audit Committee chair for her verbal approval prior to engagement if they are expected to be for amounts under $10,000 but greater than $5,000; and (iii) reported to the Audit Committee at the next Audit Committee meeting if they are expected to be for an amount under $5,000.
ITEM 5. AUDIT COMMITTEE OF LISTED REGISTRANTS.
The registrant’s Board has a separately designated Audit Committee established in accordance with Section 3(a)(58)(A) of the Securities Exchange Act of 1934, as amended (15 U.S.C. 78c(a)(58)(A)). As of the end of the period covered by this report, the members of the audit committee are Jack B. Evans, William C. Hunter, John K. Nelson, Judith M. Stockdale, Albin F. Moschner and Carole E. Stone, Chair.
ITEM 6. SCHEDULE OF INVESTMENTS.
(a) See Portfolio of Investments in Item 1.
(b) Not applicable.
ITEM 7. DISCLOSURE OF PROXY VOTING POLICIES AND PROCEDURES FOR CLOSED-END MANAGEMENT INVESTMENT COMPANIES.
Teachers Advisors LLC (“Teachers Advisors”)
Proxy Voting Guidelines
As a general matter, the Trust’s Board has delegated to Teachers Advisors responsibility for voting proxies of the Fund’s portfolio companies in accordance with Trust’s Board approved. Guidelines for voting proxy proposals are articulated in the TIAA Policy Statement on Responsible Investing, attached as an Appendix.
Teachers Advisors has a dedicated team of professionals responsible for reviewing and voting proxies. In analyzing a proposal, in addition to exercising their professional judgment, these professionals utilize various sources of information to enhance their ability to evaluate the proposal. These sources may include research from third party proxy advisory firms and other consultants, various corporate governance-focused organizations, related publications and TIAA investment professionals. Based on their analysis of proposals and guided by the TIAA Policy Statement on Responsible Investing, these professionals then vote in a manner intended solely to advance the best interests of the Funds’ shareholders. Occasionally, when a proposal relates to issues not addressed in the TIAA Policy Statement on Responsible Investing, Teachers Advisors may seek guidance from the Trust’s Board or a designated committee thereof.
The Trust and Teachers Advisors believes that they have implemented policies, procedures and processes designed to prevent conflicts of interest from influencing proxy voting decisions. These include (i) oversight by TIAA’s Board of Trustees and or a designated committee thereof; (ii) a clear separation of proxy voting functions from external client relationship and sales functions; and (iii) the active monitoring of required annual disclosures of potential conflicts of interest by individuals who have direct roles in executing or influencing the Funds’ proxy voting (e.g., Teachers Advisors’ proxy voting professionals, a Trustee, or a senior executive of the Trust, Teachers Advisors or Teachers Advisors’ affiliates) by Teachers Advisors’ legal and compliance professionals.
There could be rare instances in which an individual who has a direct role in executing or influencing the Funds’ proxy voting (e.g., Teachers Advisors’ proxy voting professionals, a Trustee or a senior executive of the Trust, Teachers Advisors or Teachers Advisors’ affiliates) is either a director or executive of a portfolio company or may have some other association with a portfolio company. In such cases, this individual is required to recuse himself or herself from all decisions related to proxy voting for that portfolio company.
A record of all proxy votes cast for the Funds for the 12-month period ended June 30 can be obtained, free of charge, at www.tiaa.org, and on the SEC’s website at www.sec.gov.
Winslow Capital Management, LLC (“Winslow”)
Winslow will vote all proxies appurtenant to shares of corporate stock held by a plan or account with respect to which it serves as investment manager, unless the investment management contract expressly precludes Winslow, as investment manager, from voting such proxy.
Winslow has delegated the authority to vote proxies in accordance with its Proxy Voting Policies and Procedures to Institutional Shareholder Services Inc. (“ISS”), a third party proxy-voting agency. Winslow subscribes to ISS’s Implied Consent service feature. As ISS research is completed, the ISS Account Manager executes the ballots as Winslow’s agent according to the vote recommendations and consistent with the applicable ISS Proxy Voting Guidelines. If new material public information becomes available after ISS recommends a vote or ISS finds that a report contains a material error, ISS issues a proxy alert to inform Winslow of any corrections and, if necessary, any resulting changes in the vote recommendations. In casting its vote, Winslow reviews any updated information from ISS.
Winslow retains the ability to override any vote if it disagrees with ISS’s vote recommendation, and always maintains the option to review and amend votes before they are cast, except in the case of a conflict of interest. When there is an apparent conflict of interest, or the appearance of a conflict of interest, e.g., where Winslow may receive fees from a company for advisory or other services at the same time that Winslow has investments in the stock of that company, Winslow will follow the vote recommendation of ISS. Winslow retains documentation of all amended votes.
Although Winslow has affiliates that provide investment advisory, broker-dealer, insurance or other financial services, Winslow does not receive non-public information about the business arrangements of such affiliates (except with regard to major distribution partners of its investment products) or the directors, officers and employees of such affiliates. Therefore, Winslow is unable to consider such information when determining whether there are material conflicts of interests.
Winslow has adopted ISS Proxy Voting Guidelines. While these guidelines are not intended to be all-inclusive, they do provide guidance on the Sub-Adviser’s general voting policies. ISS’s website at http://www.issgovernance.com/policy-gateway/voting-policies provides access to all of the current ISS Proxy Voting Guidelines.
ITEM 8. PORTFOLIO MANAGERS OF CLOSED-END MANAGEMENT INVESTMENT COMPANIES
Nuveen Fund Advisors (“NFALLC”) is the registrant’s investment adviser (NFALLC is also referred to as the “Adviser”.) NFALLC is responsible for the selection and on-going monitoring of the Fund’s investment portfolio, managing the Fund’s business affairs and providing certain clerical, bookkeeping and administrative services. The Adviser has engaged Nuveen Asset Management, LLC (“Nuveen Asset Management”), Teachers Advisors LLC (“Teachers Advisors”) and Winslow Capital Management, LLC (“Winslow”), as Sub-Advisers to provide discretionary investment advisory services, respectively (Nuveen Asset Management, Teachers Advisors and Winslow are also collectively referred to as “Sub-Advisers”). The following section provides information on the portfolio managers at Nuveen Asset Management:
| Item 8(a)(1). | PORTFOLIO MANAGER BIOGRAPHIES |
As of the date of filing this report, the following individuals at the Sub-Adviser (the “Portfolio Managers”) have primary responsibility for the day-to-day implementation of the Fund’s investment strategy:
Nathan Shetty, CFA, oversees Nuveen’s Multi-Asset team. Nathan joined the firm from UBS, where he was global co-head of portfolio management for Investment Solutions. Prior to that, he launched the Investment Solutions group at Mesirow Financial after having been a senior portfolio manager in the currency group. Prior to that, he was at Pareto Partners. He started in the industry in 2001. Nathan graduated with a Master of Science in Communication from Northwestern University, an M.B.A. from the University of Chicago and a Master of Science in Statistics from Texas A&M. He holds the CFA designation and FRM certification from the Global Association of Risk Professionals.
Anurag Dugar is a portfolio manager on Nuveen’s Multi-Asset portfolio management team. Prior to joining Nuveen in July 2017, Anurag worked at BlackRock where his primary responsibilities were portfolio management, multi-asset investment research and construction of model portfolios and investment solutions. Prior to BlackRock, Anurag worked at Mellon Capital Management as a senior research analyst in the Multi-Asset research group where he researched and developed fixed income models and strategies that were used in Mellon’s Global Fixed Income Hedge Fund and Global Opportunities Hedge Fund. Anurag graduated with a Masters in Computer Engineering from Texas A&M University and a Masters in Financial Engineering from University of California, Berkeley.
Item 8 (a)(2). OTHER ACCOUNTS MANAGED BY PORTFOLIO MANAGERS
In addition to the Fund, as of December 31, 2021, the portfolio managers are also primarily responsible for the day-to-day portfolio management of the following accounts:
(ii) Number of Other Accounts Managed and Assets by Account Type* | (iii) Number of Other Accounts and Assets for Which Advisory Fee is Performance-Based | |||||||||||||||||||||||||||||||||||||||||||||||
| (i) Name of Portfolio Manager | Other Registered Investment Companies | Other Pooled Investment Vehicles | Other Accounts | Other Registered Investment Companies | Other Pooled Investment Vehicles | Other Accounts | ||||||||||||||||||||||||||||||||||||||||||
Nathan Shetty | 0 | $ | 0 | 0 | $ | 0 | 8 | $ | 375.49 million | 0 | 0 | 0 | 0 | 0 | 0 | |||||||||||||||||||||||||||||||||
Anurag Dugar | 0 | $ | 0 | 0 | $ | 0 | 7 | $ | 98.42 million | 0 | 0 | 0 | 0 | 0 | 0 | |||||||||||||||||||||||||||||||||
* Assets are as of December 31, 2021.
POTENTIAL MATERIAL CONFLICTS OF INTEREST
Actual or apparent conflicts of interest may arise when a portfolio manager has day-to-day management responsibilities with respect to more than one account. More specifically, portfolio managers who manage multiple accounts are presented a number of potential conflicts, including, among others, those discussed below.
The management of multiple accounts may result in a portfolio manager devoting unequal time and attention to the management of each account. Nuveen Asset Management seeks to manage such competing interests for the time and attention of portfolio managers by having portfolio managers focus on a particular investment discipline. Most accounts managed by a portfolio manager in a particular investment strategy are managed using the same investment models.
If a portfolio manager identifies a limited investment opportunity which may be suitable for more than one account, an account may not be able to take full advantage of that opportunity due to an allocation of filled purchase or sale orders across all eligible accounts. To deal with these situations, Nuveen Asset Management has adopted procedures for allocating limited opportunities across multiple accounts.
With respect to many of its clients’ accounts, Nuveen Asset Management determines which broker to use to execute transaction orders, consistent with its duty to seek best execution of the transaction. However, with respect to certain other accounts, Nuveen Asset Management may be limited by the client with respect to the selection of brokers or may be instructed to direct trades through a particular broker. In these cases, Nuveen Asset Management may place separate, non-simultaneous, transactions for a Fund and other accounts which may temporarily affect the market price of the security or the execution of the transaction, or both, to the detriment of the Fund or the other accounts.
Some clients are subject to different regulations. As a consequence of this difference in regulatory requirements, some clients may not be permitted to engage in all the investment techniques or transactions or to engage in these transactions to the same extent as the other accounts managed by the portfolio manager. Finally, the appearance of a conflict of interest may arise where Nuveen Asset Management has an incentive, such as a performance-based management fee, which relates to the management of some accounts, with respect to which a portfolio manager has day-to-day management responsibilities.
Conflicts of interest may also arise when the Sub-Adviser invests one or more of its client accounts in different or multiple parts of the same issuer’s capital structure, including investments in public versus private securities, debt versus equity, or senior versus junior/subordinated debt, or otherwise where there are different or inconsistent rights or benefits. Decisions or actions such as investing, trading, proxy voting, exercising, waiving or amending rights or covenants, workout activity, or serving on a board, committee or other involvement in governance may result in conflicts of interest between clients holding different securities or investments. Generally, individual portfolio managers will seek to act in a manner that they believe serves the best interest of the accounts they manage. In cases where a portfolio manager or team faces a conflict among its client accounts, it will seek to act in a manner that it believes best reflects its overall fiduciary duty, which may result in relative advantages or disadvantages for particular accounts.
Nuveen Asset Management has adopted certain compliance procedures which are designed to address these types of conflicts common among investment managers. However, there is no guarantee that such procedures will detect each and every situation in which a conflict arises.
| Item 8 (a)(3). | FUND MANAGER COMPENSATION |
As of the most recently completed fiscal year end, the primary Portfolio Managers’ compensation is as follows:
Portfolio manager compensation consists primarily of base salary and variable components consisting of (i) a cash bonus; (ii) a long-term performance award; and (iii) participation in a profits interest plan.
Base salary. A portfolio manager’s base salary is determined based upon an analysis of the portfolio manager’s general performance, experience and market levels of base pay for such position.
Cash bonus. A portfolio manager is eligible to receive an annual cash bonus that is based on three variables: risk-adjusted investment performance relative to benchmark generally measured over the most recent one, three and five year periods (unless the portfolio manager’s tenure is shorter), ranking versus Morningstar peer funds generally measured over the most recent one, three and five year periods (unless the portfolio manager’s tenure is shorter), and management and peer reviews.
Long-term performance award. A portfolio manager is eligible to receive a long-term performance award that vests after three years. The amount of the award when granted is based on the same factors used in determining the cash bonus. The value of the award at the completion of the three-year vesting period is adjusted based on the risk-adjusted investment performance of Fund(s) managed by the portfolio manager during the vesting period and the performance of the TIAA organization as a whole.
Profits interest plan. Portfolio managers are eligible to receive profits interests in Nuveen Asset Management and its affiliate, Teachers Advisors, LLC, which vest over time and entitle their holders to a percentage of the firms’ annual profits. Profits interests are allocated to each portfolio manager based on such person’s overall contribution to the firms.
There are generally no differences between the methods used to determine compensation with respect to the Fund and the Other Accounts shown in the table above.
| Item 8 (a)(4). | OWNERSHIP OF NMAI SECURITIES AS OF DECEMBER 31, 2021 |
Name of Portfolio Manager | None | $1 - $10,000 | $10,001 - $50,000 | $50,001 - $100,000 | $100,001 - $500,000 | $500,001 - $1,000,000 | Over $1,000,000 | |||||||||||||||||||||
Nathan Shetty | X | |||||||||||||||||||||||||||
Anurag Dugar | X | |||||||||||||||||||||||||||
ITEM 9. PURCHASES OF EQUITY SECURITIES BY CLOSED-END MANAGEMENT INVESTMENT COMPANY AND AFFILIATED PURCHASERS.
Not applicable.
ITEM 10. SUBMISSION OF MATTERS TO A VOTE OF SECURITY HOLDERS.
There have been no material changes to the procedures by which shareholders may recommend nominees to the registrant’s Board implemented after the registrant last provided disclosure in response to this Item.
ITEM 11. CONTROLS AND PROCEDURES.
| (a) | The registrant’s principal executive and principal financial officers, or persons performing similar functions, have concluded that the registrant’s disclosure controls and procedures (as defined in Rule 30a-3(c) under the Investment Company Act of 1940, as amended (the “1940 Act”) (17 CFR 270.30a-3(c))) are effective, as of a date within 90 days of the filing date of this report that includes the disclosure required by this paragraph, based on their evaluation of the controls and procedures required by Rule 30a-3(b) under the 1940 Act (17 CFR 270.30a-3(b)) and Rules 13a-15(b) or 15d-15 (b) under the Securities Exchange Act of 1934, as amended (the “Exchange Act”) (17 CFR 240.13a-15(b) or 240.15d-15 (b)). |
| (b) | There were no changes in the registrant’s internal control over financial reporting (as defined in Rule 30a-3(d) under the 1940 Act (17 CFR 270.30a-3(d)) that occurred during the period covered by this report that has materially affected, or is reasonably likely to materially affect, the registrant’s internal control over financial reporting. |
ITEM 12. DISCLOSURE OF SECURITIES LENDING ACTIVITIES FOR CLOSED-END MANAGEMENT INVESTMENT
COMPANIES.
Not applicable.
ITEM 13. EXHIBITS.
File the exhibits listed below as part of this Form.
(a)(1) Any code of ethics, or amendment thereto, that is the subject of the disclosure required by Item 2, to the extent that the registrant intends to satisfy the Item 2 requirements through filing of an exhibit: Not applicable because the code is posted on registrant’s website at www.nuveen.com/fund-governance and there were no amendments during the period covered by this report. (To view the code, click on Code of Conduct.)
(a)(3) Any written solicitation to purchase securities under Rule 23c-1 under the 1940 Act (17 CFR 270.23c-1) sent or given during the period covered by the report by or on behalf of the registrant to 10 or more persons. Not applicable.
(a)(4) Change in registrant’s independent public accountant. Not applicable.
SIGNATURES
Pursuant to the requirements of the Securities Exchange Act of 1934 and the Investment Company Act of 1940, the registrant has duly caused this report to be signed on its behalf by the undersigned, thereunto duly authorized.
(Registrant) Nuveen Multi-Asset Income Fund
| By (Signature and Title) | /s/ Mark L. Winget | |||
| Mark L. Winget | ||||
| Vice President and Secretary | ||||
| Date: March 9, 2022 | ||||
Pursuant to the requirements of the Securities Exchange Act of 1934 and the Investment Company Act of 1940, this report has been signed below by the following persons on behalf of the registrant and in the capacities and on the dates indicated.
| By (Signature and Title) | /s/ David J. Lamb | |||
| David J. Lamb | ||||
| Chief Administrative Officer | ||||
| (principal executive officer) | ||||
| Date: March 9, 2022 | ||||
| By (Signature and Title) | /s/ E. Scott Wickerham | |||
| E. Scott Wickerham | ||||
| Vice President and Controller | ||||
| (principal financial officer) | ||||
| Date: March 9, 2022 | ||||