| | | FREE WRITING PROSPECTUS |
| | | FILED PURSUANT TO RULE 433 |
| | | REGISTRATION FILE NO.: 333-255934-05 |
| Dated May 15, 2023 | BMO 2023-C5 |
Structural and Collateral Term Sheet |
BMO 2023-C5 Mortgage Trust |
$662,700,174 (Approximate Mortgage Pool Balance) |
| |
$[ ] (Approximate Offered Certificates) |
| |
BMO Commercial Mortgage Securities LLC Depositor |
|
Commercial Mortgage Pass-Through Certificates, Series 2023-C5 |
|
| |
Bank of Montreal Citi Real Estate Funding Inc. KeyBank National Association Zions Bancorporation, N.A. BSPRT CMBS Finance, LLC 3650 Real Estate Investment Trust 2 LLC Starwood Mortgage Capital LLC German American Capital Corporation UBS AG Mortgage Loan Sellers |
BMO Capital
Markets | KeyBanc Capital
Markets | Deutsche Bank
Securities | UBS
Securities
LLC | Citigroup |
| Co-Lead Managers and Joint Bookrunners |
Bancroft Capital, LLC
Co-Manager | | Drexel Hamilton
Co-Manager |
| THE INFORMATION IN THIS STRUCTURAL AND COLLATERAL TERM SHEET IS NOT COMPLETE AND MAY BE AMENDED PRIOR TO THE TIME OF SALE. THIS TERM SHEET IS NOT AN OFFER TO SELL THESE SECURITIES AND IT IS NOT A SOLICITATION OF AN OFFER TO BUY THESE SECURITIES IN ANY JURISDICTION WHERE THE OFFER OR SALE IS NOT PERMITTED. |
| | | |
| Dated May 15, 2023 | BMO 2023-C5 |
This material is for your information, and none of BMO Capital Markets Corp., Deutsche Bank Securities Inc., KeyBanc Capital Markets Inc., Citigroup Global Markets Inc., UBS Securities LLC, Bancroft Capital, LLC and Drexel Hamilton, LLC (the “Underwriters”) are soliciting any action based upon it. This material is not to be construed as an offer to sell or the solicitation of any offer to buy any security in any jurisdiction where such an offer or solicitation would be illegal.
The depositor has filed a registration statement (including the prospectus) with the Securities and Exchange Commission (File No. 333-255934) for the offering to which this communication relates. Before you invest, you should read the prospectus in the registration statement and other documents the depositor has filed with the Securities and Exchange Commission for more complete information about the depositor, the issuing entity and this offering. You may get these documents for free by visiting EDGAR on the SEC website at www.sec.gov. Alternatively, the depositor or BMO Capital Markets Corp., any other underwriter, or any dealer participating in this offering will arrange to send you the prospectus if you request it by calling 1-866-864-7760. The Offered Certificates referred to in these materials, and the asset pool backing them, are subject to modification or revision (including the possibility that one or more Classes of Certificates may be split, combined or eliminated at any time prior to issuance or availability of a final prospectus) and are offered on a “when, as and if issued” basis. You understand that, when you are considering the purchase of these Certificates, a contract of sale will come into being no sooner than the date on which the relevant Class has been priced and we have verified the allocation of Certificates to be made to you; any “indications of interest” expressed by you, and any “soft circles” generated by us, will not create binding contractual obligations for you or us.
Neither this document nor anything contained in this document shall form the basis for any contract or commitment whatsoever. The information contained in this document is preliminary as of the date of this document, supersedes any previous such information delivered to you and will be superseded by any such information subsequently delivered prior to the time of sale. These materials are subject to change, completion or amendment from time to time. The information should be reviewed only in conjunction with the entire offering document relating to the Commercial Mortgage Pass-Through Certificates, Series 2023-C5 (the “Offering Document”). All of the information contained herein is subject to the same limitations and qualifications contained in the Offering Document. The information contained herein does not contain all relevant information relating to the underlying mortgage loans or mortgaged properties. Such information is described elsewhere in the Offering Document. The information contained herein will be more fully described elsewhere in the Offering Document. The information contained herein should not be viewed as projections, forecasts, predictions or opinions with respect to value. Prior to making any investment decision, prospective investors are strongly urged to read the Offering Document its entirety. Neither the Securities and Exchange Commission nor any state securities commission has approved or disapproved of these securities or determined if this free writing prospectus is truthful or complete. Any representation to the contrary is a criminal offense.
This document has been prepared by the Underwriters for information purposes only and does not constitute, in whole or in part, a prospectus for the purposes of Regulation (EU) 2017/1129 (as amended or superseded) and/or Part VI of the Financial Services and Markets Act 2000 (as amended) or other offering document.
The attached information contains certain tables and other statistical analyses (the “Computational Materials”) which have been prepared in reliance upon information furnished by the Mortgage Loan Sellers. Numerous assumptions were used in preparing the Computational Materials, which may or may not be reflected herein. As such, no assurance can be given as to the Computational Materials’ accuracy, appropriateness or completeness in any particular context; or as to whether the Computational Materials and/or the assumptions upon which they are based reflect present market conditions or future market performance. The Computational Materials should not be construed as either projections or predictions or as legal, tax, financial or accounting advice. You should consult your own counsel, accountant and other advisors as to the legal, tax, business, financial and related aspects of a purchase of these Certificates. Any weighted average lives, yields and principal payment periods shown in the Computational Materials are based on prepayment and/or loss assumptions, and changes in such prepayment and/or loss assumptions may dramatically affect such weighted average lives, yields and principal payment periods. In addition, it is possible that prepayments or losses on the underlying assets will occur at rates higher or lower than the rates shown in the attached Computational Materials. The specific characteristics of the Certificates may differ from those shown in the Computational Materials due to differences between the final underlying assets and the preliminary underlying assets used in preparing the Computational Materials. The principal amount and designation of any security described in the Computational Materials are subject to change prior to issuance. None of the Underwriters or any of their respective affiliates make any representation or warranty as to the actual rate or timing of payments or losses on any of the underlying assets or the payments or yield on the Certificates. The information in this presentation is based upon management forecasts and reflects prevailing conditions and management’s views as of this date, all of which are subject to change. In preparing this presentation, we have relied upon and assumed, without independent verification, the accuracy and completeness of all information available from public sources or which was provided to us by or on behalf of the Mortgage Loan Sellers or which was otherwise reviewed by us.
This document contains forward-looking statements. If and when included in this document, the words “expects”, “intends”, “anticipates”, “estimates” and analogous expressions and all statements that are not historical facts, including statements about our beliefs or expectations, are intended to identify forward-looking statements. Any forward-looking statements are made subject to risks and uncertainties which could cause actual results to differ materially from those stated. Those risks and uncertainties include, among other things, declines in general economic and business conditions, increased competition, changes in demographics, changes in political and social conditions, regulatory initiatives and changes in consumer preferences, many of which are beyond our control and the control of any other person or entity related to this offering. The forward-looking statements made in this document are made as of the date hereof. We have no obligation to update or revise any forward-looking statement.
BMO Capital Markets is a trade name used by BMO Financial Group for the wholesale banking businesses of Bank of Montreal, BMO Harris Bank N.A. (member FDIC), Bank of Montreal Europe p.l.c, and Bank of Montreal (China) Co. Ltd, the institutional broker dealer business of BMO Capital Markets Corp. (Member FINRA and SIPC) and the agency broker dealer business of Clearpool Execution Services, LLC (Member FINRA and SIPC) in the U.S., and the institutional broker dealer businesses of BMO Nesbitt Burns Inc. (Member Investment Industry Regulatory Organization of Canada and Member Canadian Investor Protection Fund) in Canada and Asia, Bank of Montreal Europe p.l.c. (authorized and regulated by the Central Bank of Ireland) in Europe and BMO Capital Markets Limited (authorized and regulated by the Financial Conduct Authority) in the UK and Australia.
Securities and investment banking activities in the United States are performed by Deutsche Bank Securities Inc., a member of NYSE, FINRA and SIPC, and its broker-dealer affiliates. Lending and other commercial banking activities in the United States are performed by Deutsche Bank AG and its banking affiliates.
| THE INFORMATION IN THIS STRUCTURAL AND COLLATERAL TERM SHEET IS NOT COMPLETE AND MAY BE AMENDED PRIOR TO THE TIME OF SALE. THIS TERM SHEET IS NOT AN OFFER TO SELL THESE SECURITIES AND IT IS NOT A SOLICITATION OF AN OFFER TO BUY THESE SECURITIES IN ANY JURISDICTION WHERE THE OFFER OR SALE IS NOT PERMITTED. |
| | 2 | |
| Dated May 15, 2023 | BMO 2023-C5 |
IMPORTANT NOTICE RELATING TO AUTOMATICALLY-GENERATED EMAIL DISCLAIMERS
Any legends, disclaimers or other notices that may appear at the bottom of any email communication to which this document is attached relating to (1) these materials not constituting an offer (or a solicitation of an offer), (2) no representation that these materials are accurate or complete and may not be updated or (3) these materials possibly being confidential, are not applicable to these materials and should be disregarded. Such legends, disclaimers or other notices have been automatically generated as a result of these materials having been sent via Bloomberg or another system.
THE CERTIFICATES REFERRED TO IN THESE MATERIALS ARE SUBJECT TO MODIFICATION OR REVISION (INCLUDING THE POSSIBILITY THAT ONE OR MORE CLASSES OF CERTIFICATES MAY BE SPLIT, COMBINED OR ELIMINATED AT ANY TIME PRIOR TO ISSUANCE OR AVAILABILITY OF A FINAL PROSPECTUS) AND ARE OFFERED ON A “WHEN, AS AND IF ISSUED” BASIS.
THE UNDERWRITERS MAY FROM TIME TO TIME PERFORM INVESTMENT BANKING SERVICES FOR, OR SOLICIT INVESTMENT BANKING BUSINESS FROM, ANY COMPANY NAMED IN THESE MATERIALS. THE UNDERWRITERS AND/OR THEIR AFFILIATES OR RESPECTIVE EMPLOYEES MAY FROM TIME TO TIME HAVE A LONG OR SHORT POSITION IN ANY CERTIFICATE OR CONTRACT DISCUSSED IN THESE MATERIALS.
| THE INFORMATION IN THIS STRUCTURAL AND COLLATERAL TERM SHEET IS NOT COMPLETE AND MAY BE AMENDED PRIOR TO THE TIME OF SALE. THIS TERM SHEET IS NOT AN OFFER TO SELL THESE SECURITIES AND IT IS NOT A SOLICITATION OF AN OFFER TO BUY THESE SECURITIES IN ANY JURISDICTION WHERE THE OFFER OR SALE IS NOT PERMITTED. |
| | 3 | |
| Structural and Collateral Term Sheet | | BMO 2023-C5 |
| Collateral Characteristics |
Mortgage Loan Seller | Number of Mortgage Loans | Number of Mortgaged Properties | Aggregate
Cut-off Date Balance | | Roll-up Aggregate Cut-off Date Balance | Roll-up Aggregate % of Cut-off Date Balance |
| BMO | 12 | 25 | $187,243,111 | 28.3% | $212,243,111 | 32.0% |
| CREFI | 4 | 102 | $108,859,465 | 16.4% | $123,859,465 | 18.7% |
| KeyBank | 5 | 50 | $104,573,000 | 15.8% | $104,573,000 | 15.8% |
| ZBNA | 1 | 1 | $64,958,243 | 9.8% | $64,958,243 | 9.8% |
| BSPRT | 3 | 3 | $45,625,000 | 6.9% | $45,625,000 | 6.9% |
| 3650 REIT | 3 | 3 | $36,220,000 | 5.5% | $36,220,000 | 5.5% |
| SMC | 2 | 2 | $29,442,427 | 4.4% | $29,442,427 | 4.4% |
| GACC | - | - | - | - | $27,500,000 | 4.1% |
| UBS AG | 3 | 3 | $18,278,928 | 2.8% | $18,278,928 | 2.8% |
| BMO, GACC | 1 | 1 | $37,500,000 | 5.7% | - | - |
| CREFI, BMO | 1 | 1 | $30,000,000 | 4.5% | - | - |
| Total: | 35 | 191 | $662,700,174 | 100.0% | $662,700,174 | 100.0% |
| Loan Pool | |
| | Initial Pool Balance (“IPB”): | $662,700,174 |
| | Number of Mortgage Loans: | 35 |
| | Number of Mortgaged Properties: | 191 |
| | Average Cut-off Date Balance per Mortgage Loan: | $18,934,291 |
| | Weighted Average Current Mortgage Rate: | 6.63691% |
| | 10 Largest Mortgage Loans as % of IPB: | 56.0% |
| | Weighted Average Remaining Term to Maturity: | 107 months |
| | Weighted Average Seasoning: | 3 months |
| | | |
| Credit Statistics | |
| | Weighted Average UW NCF Debt Service Coverage Ratio (“DSCR”): | 1.73x |
| | Weighted Average UW NOI Debt Yield (“DY”): | 13.0% |
| | Weighted Average Cut-off Date Loan-to-Value Ratio (“LTV”): | 54.0% |
| | Weighted Average Maturity Date/ARD LTV: | 51.5% |
| | | |
| Other Statistics | |
| | % of Mortgage Loans with Additional Debt: | 11.3% |
| | % of Mortgage Loans with Single Tenants: | 21.1% |
| % of Mortgage Loans secured by Multiple Properties: | 30.7% |
| | |
| Amortization | |
| | Weighted Average Original Amortization Term: | 337 months |
| | Weighted Average Remaining Amortization Term: | 335 months |
| | % of Mortgage Loans with Interest-Only: | 65.7% |
| | % of Mortgage Loans with Amortizing Balloon: | 24.3% |
| | % of Mortgage Loans with Partial Interest-Only followed by Amortizing Balloon: | 10.0% |
| | | |
| Lockboxes | |
| | % of Mortgage Loans with Hard Lockboxes: | 68.4% |
| | % of Mortgage Loans with Springing Lockboxes: | 29.3% |
| | % of Mortgage Loans with Soft Springing Lockboxes: | 2.3% |
| | | |
| Reserves | |
| | % of Mortgage Loans Requiring Monthly Tax Reserves: | 71.3% |
| | % of Mortgage Loans Requiring Monthly Insurance Reserves: | 48.1% |
| | % of Mortgage Loans Requiring Monthly CapEx Reserves: | 59.5% |
| | % of Mortgage Loans Requiring Monthly TI/LC Reserves: | 41.3% |
| THE INFORMATION IN THIS STRUCTURAL AND COLLATERAL TERM SHEET IS NOT COMPLETE AND MAY BE AMENDED PRIOR TO THE TIME OF SALE. THIS TERM SHEET IS NOT AN OFFER TO SELL THESE SECURITIES AND IT IS NOT A SOLICITATION OF AN OFFER TO BUY THESE SECURITIES IN ANY JURISDICTION WHERE THE OFFER OR SALE IS NOT PERMITTED. |
| | 4 | |
| Structural and Collateral Term Sheet | | BMO 2023-C5 |
| Collateral Characteristics |
| Ten Largest Mortgage Loans |
| No. | Loan Name | City, State | Mortgage Loan Seller | No.
of Prop. | Cut-off Date Balance | % of IPB | Square Feet / Rooms / Units | Property Type | UW
NCF DSCR | UW NOI DY | Cut-off Date LTV | Maturity Date/ARD LTV |
| 1 | Brier Creek Commons | Raleigh, NC | ZBNA | 1 | $64,958,243 | 9.8% | 519,277 | Retail | 1.25x | 10.4% | 62.4% | 54.3% |
| 2 | Central Florida Industrial Portfolio | Various, FL | KeyBank | 4 | $42,240,000 | 6.4% | 419,886 | Industrial | 1.58x | 10.3% | 60.0% | 60.0% |
| 3 | Hyatt Regency Indianapolis | Indianapolis, IN | CREFI | 1 | $39,943,123 | 6.0% | 499 | Hospitality | 1.65x | 15.4% | 41.5% | 36.4% |
| 4 | Cincinnati Multifamily Portfolio | Cincinnati, OH | BMO | 3 | $39,000,000 | 5.9% | 375 | Multifamily | 1.49x | 10.7% | 64.4% | 64.4% |
| 5 | Great Lakes Crossing Outlets | Auburn Hills, MI | BMO, GACC | 1 | $37,500,000 | 5.7% | 1,128,332 | Retail | 2.50x | 17.5% | 45.0% | 45.0% |
| 6 | Oak Street NLP Fund Portfolio | Various, Various | KeyBank | 42 | $30,000,000 | 4.5% | 6,470,388 | Various | 2.71x | 17.9% | 32.3% | 32.3% |
| 7 | Harborside 2-3 | Jersey City, NJ | CREFI, BMO | 1 | $30,000,000 | 4.5% | 1,599,029 | Office | 2.36x | 14.7% | 56.8% | 56.8% |
| 8 | Cross Island Plaza | Rosedale, NY | BMO | 1 | $30,000,000 | 4.5% | 256,930 | Office | 1.53x | 10.8% | 56.0% | 56.0% |
| 9 | 500 Mamaroneck | Harrison, NY | BMO | 1 | $29,500,000 | 4.5% | 1,502,820 | Other | 1.23x | 8.5% | 65.1% | 65.1% |
| 10 | Sayville Plaza(1) | Bohemia, NY | CREFI | 1 | $28,000,000 | 4.2% | 237,093 | Retail | 1.21x | 10.9% | 52.6% | 52.6% |
| | | | | | | | | | | | | |
| | Top 3 Total/Weighted Average | | 6 | $147,141,366 | 22.2% | | | 1.45x | 11.7% | 56.0% | 51.1% |
| | Top 5 Total/Weighted Average | | 10 | $223,641,366 | 33.7% | | | 1.64x | 12.5% | 55.6% | 52.4% |
| | Top 10 Total/Weighted Average | | 56 | $371,141,366 | 56.0% | | | 1.71x | 12.5% | 54.4% | 52.4% |
| | Non-Top 10 Total/Weighted Average | | 135 | $291,558,808 | 44.0% | | | 1.77x | 13.6% | 53.5% | 50.2% |
| (1) | The origination of the Sayville Plaza Mortgage Loan is expected to occur on May 15, 2023 and the materials provided herein regarding the Sayville Plaza are premised upon drafts of the Sayville Plaza Mortgage Loan documents, however, there can be no assurance that the Mortgage Loan will be originated as expected or at all.
|
| THE INFORMATION IN THIS STRUCTURAL AND COLLATERAL TERM SHEET IS NOT COMPLETE AND MAY BE AMENDED PRIOR TO THE TIME OF SALE. THIS TERM SHEET IS NOT AN OFFER TO SELL THESE SECURITIES AND IT IS NOT A SOLICITATION OF AN OFFER TO BUY THESE SECURITIES IN ANY JURISDICTION WHERE THE OFFER OR SALE IS NOT PERMITTED. |
| | 5 | |
| Structural and Collateral Term Sheet | | BMO 2023-C5 |
| Collateral Characteristics |
| Pari Passu Companion Loan Summary |
No. | Loan Name | | Trust Cut-off Date Balance | Aggregate Pari Passu Loan Cut-off Date Balance | Controlling Pooling/Trust & Servicing Agreement | Master Servicer | Special Servicer | Related Pari Passu Loan(s) Securitizations | Related Pari Passu Loan(s) Original Balance |
| 1 | Brier Creek Commons | ZBNA | $64,958,243 | $19,987,152 | BMO 2023-C5 | Midland | Rialto | Future Securitization(s) | $20,000,000 |
| 3 | Hyatt Regency Indianapolis | CREFI | $39,943,123 | $18,573,552 | BMO 2023-C5 | Midland | Rialto | Future Securitization(s) | $18,600,000 |
| 5 | Great Lakes Crossing Outlets | BMO, GACC | $37,500,000 | $142,500,000 | BMO 2023-C4 | Midland | LNR | BMO 2023-C4 Future Securitization(s) | $25,750,000 $116,750,000 |
| 6 | Oak Street NLP Fund Portfolio | KeyBank | $30,000,000 | $310,000,000 | OAKST 2023-NLP | KeyBank | Situs | OAKST 2023-NLP BANK52023-5Y1 BBCMS 2023-C19 | $190,000,000 $97,500,000 $22,500,000 |
| 7 | Harborside 2-3 | CREFI, BMO | $30,000,000 | $195,000,000 | BMARK 2023-V2 | Midland | 3650 REIT | BMARK 2023-V2 Future Securitization(s) | $65,000,000 $130,000,000 |
| 8 | Cross Island Plaza | BMO | $30,000,000 | $12,500,000 | BMO 2023-C5 | Midland | Rialto | Future Securitization(s) | $12,500,000 |
| 11 | Jaylor - Burger King Portfolio | CREFI | $27,916,343 | $24,925,306 | BMO 2023-C5(1) | Midland(1) | Rialto(1) | Future Securitization(s) | $25,000,000 |
| 14 | Orizon Aerostructures | BMO | $22,595,000 | $38,500,000 | BMO 2023-C5 | Midland | Rialto | BMO 2023-C4 Future Securitization(s) | $27,000,000 $11,500,000 |
| 17 | Pacific Design Center | BMO | $15,000,000 | $230,000,000 | BMARK 2023-B38 | Midland | Argentic | BMARK 2023-B38 BMARK 2023-C19 Future Securitization(s) | $65,600,000 $65,000,000 $99,400,000 |
| 18 | La Habra Marketplace | 3650 REIT | $15,000,000 | $80,000,000 | BMO 2022-C3(2) | Midland(2) | Midland(2) | BMO 2022-C3 Future Securitization(s) | $20,000,000 $60,000,000 |
| 23 | 800 Cesar Chavez | 3650 REIT | $10,000,000 | $28,000,000 | 3650R 2022-PF2 | Midland | 3650 REIT | 3650R 2022-PF2 BMO 2023-C4 | $13,000,000 $15,000,000 |
| (1) | Until the securitization of the related controlling pari passu companion loan, the related whole loan will be serviced and administered pursuant to the pooling and servicing agreement for the BMO 2023-C5 securitization transaction by the parties thereto. Upon the securitization of the related controlling pari-passu companion loan, servicing of the related whole loan will shift to the servicers under the servicing agreement with respect to such future securitization transaction, which servicing agreement will become the controlling pooling and servicing agreement. |
| | (2) | Until the securitization of the related controlling pari passu companion loan, the related whole loan will be serviced and administered pursuant to the pooling and servicing agreement for the BMO 2022-C3 securitization transaction by the parties thereto. Upon the securitization of the related controlling pari-passu companion loan, servicing of the related whole loan will shift to the servicers under the servicing agreement with respect to such future securitization transaction, which servicing agreement will become the controlling pooling and servicing agreement. |
| THE INFORMATION IN THIS STRUCTURAL AND COLLATERAL TERM SHEET IS NOT COMPLETE AND MAY BE AMENDED PRIOR TO THE TIME OF SALE. THIS TERM SHEET IS NOT AN OFFER TO SELL THESE SECURITIES AND IT IS NOT A SOLICITATION OF AN OFFER TO BUY THESE SECURITIES IN ANY JURISDICTION WHERE THE OFFER OR SALE IS NOT PERMITTED. |
| | 6 | |
| Structural and Collateral Term Sheet | | BMO 2023-C5 |
| Collateral Characteristics |
| Mortgaged Properties by Type |
| | | | | | Weighted Average |
| Property Type | Property Subtype | Number of Properties | Cut-off Date Principal Balance | % of IPB | UW
NCF DSCR | UW
NOI DY | Cut-off Date LTV | Maturity Date/ARD LTV |
| Retail | Anchored | 3 | $107,958,243 | 16.3% | 1.39x | 10.3% | 59.8% | 54.9% |
| | Single Tenant | 130 | 42,182,931 | 6.4 | 2.10x | 19.2% | 31.2% | 20.4% |
| | Outlet Center | 1 | 37,500,000 | 5.7 | 2.50x | 17.5% | 45.0% | 45.0% |
| | Subtotal: | 134 | $187,641,174 | 28.3% | 1.77x | 13.7% | 50.4% | 45.2% |
| Industrial | Warehouse / Distribution | 10 | $55,762,286 | 8.4% | 2.11x | 14.6% | 47.5% | 47.5% |
| | Flex | 5 | 54,682,427 | 8.3 | 1.53x | 10.7% | 59.6% | 57.9% |
| | Manufacturing | 4 | 22,595,000 | 3.4 | 1.83x | 12.6% | 48.9% | 48.9% |
| | Warehouse | 2 | 21,220,000 | 3.2 | 1.93x | 11.5% | 60.2% | 60.2% |
| | R&D | 1 | 10,657,949 | 1.6 | 1.94x | 12.9% | 41.2% | 41.2% |
| | Subtotal: | 22 | $164,917,662 | 24.9% | 1.84x | 12.5% | 52.9% | 52.4% |
| Hospitality | Full Service | 2 | $66,193,123 | 10.0% | 1.69x | 15.8% | 49.6% | 44.0% |
| | Limited Service | 5 | 37,380,039 | 5.6 | 1.79x | 16.9% | 55.5% | 51.1% |
| | Subtotal: | 7 | $103,573,161 | 15.6% | 1.73x | 16.2% | 51.7% | 46.6% |
| Multifamily | Garden | 16 | $77,297,000 | 11.7% | 1.39x | 10.4% | 64.1% | 62.9% |
| Office | CBD | 2 | $60,000,000 | 9.1% | 1.95x | 12.8% | 56.4% | 56.4% |
| | Medical | 2 | 13,125,000 | 2.0 | 1.49x | 10.4% | 60.7% | 60.7% |
| | Suburban | 4 | 2,313,176 | 0.3 | 2.71x | 17.9% | 32.3% | 32.3% |
| | Subtotal: | 8 | $75,438,176 | 11.4% | 1.89x | 12.5% | 56.4% | 56.4% |
| Other | Leased Fee | 1 | $29,500,000 | 4.5% | 1.23x | 8.5% | 65.1% | 65.1% |
| Mixed Use | Office/Showroom/Lab | 1 | $15,000,000 | 2.3% | 2.17x | 13.8% | 47.8% | 47.8% |
| | Subtotal: | 1 | $15,000,000 | 2.3% | 2.17x | 13.8% | 47.8% | 47.8% |
| Self Storage | Self Storage | 2 | $9,333,000 | 1.4% | 1.51x | 10.3% | 43.6% | 43.6% |
| Total / Weighted Average: | 191 | $662,700,174 | 100.0% | 1.73x | 13.0% | 54.0% | 51.5% |
| THE INFORMATION IN THIS STRUCTURAL AND COLLATERAL TERM SHEET IS NOT COMPLETE AND MAY BE AMENDED PRIOR TO THE TIME OF SALE. THIS TERM SHEET IS NOT AN OFFER TO SELL THESE SECURITIES AND IT IS NOT A SOLICITATION OF AN OFFER TO BUY THESE SECURITIES IN ANY JURISDICTION WHERE THE OFFER OR SALE IS NOT PERMITTED. |
| | 7 | |
| Structural and Collateral Term Sheet | | BMO 2023-C5 |
| No. 1 – Brier Creek Commons |
| THE INFORMATION IN THIS STRUCTURAL AND COLLATERAL TERM SHEET IS NOT COMPLETE AND MAY BE AMENDED PRIOR TO THE TIME OF SALE. THIS TERM SHEET IS NOT AN OFFER TO SELL THESE SECURITIES AND IT IS NOT A SOLICITATION OF AN OFFER TO BUY THESE SECURITIES IN ANY JURISDICTION WHERE THE OFFER OR SALE IS NOT PERMITTED. |
| | 8 | |
| Structural and Collateral Term Sheet | | BMO 2023-C5 |
| No. 1 – Brier Creek Commons |
| THE INFORMATION IN THIS STRUCTURAL AND COLLATERAL TERM SHEET IS NOT COMPLETE AND MAY BE AMENDED PRIOR TO THE TIME OF SALE. THIS TERM SHEET IS NOT AN OFFER TO SELL THESE SECURITIES AND IT IS NOT A SOLICITATION OF AN OFFER TO BUY THESE SECURITIES IN ANY JURISDICTION WHERE THE OFFER OR SALE IS NOT PERMITTED. |
| | 9 | |
| Structural and Collateral Term Sheet | | BMO 2023-C5 |
| No. 1 – Brier Creek Commons |
| Mortgage Loan Information | | Property Information |
| Mortgage Loan Seller: | ZBNA | | Single Asset / Portfolio: | Single Asset |
| Original Principal Balance(1): | $65,000,000 | | Title: | Fee |
| Cut-off Date Principal Balance(1): | $64,958,243 | | Property Type – Subtype: | Retail – Anchored |
| % of IPB: | 9.8% | | Net Rentable Area (SF): | 519,277 |
| Loan Purpose: | Refinance | | Location: | Raleigh, NC |
| Borrower: | BC Retail, LLC | | Year Built / Renovated: | 2001 / NAP |
| Borrower Sponsor: | Maria Beatrice Countess Arco | | Occupancy: | 98.5% |
| Interest Rate: | 6.91000% | | Occupancy Date: | 4/1/2023 |
| Note Date: | 4/20/2023 | | 4th Most Recent NOI (As of): | $8,215,540 (12/31/2020) |
| Maturity Date: | 5/6/2033 | | 3rd Most Recent NOI (As of): | $8,479,332 (12/31/2021) |
| Interest-only Period: | None | | 2nd Most Recent NOI (As of): | $8,569,797 (12/31/2022) |
| Original Term: | 120 months | | Most Recent NOI (As of): | $8,650,973 (TTM 2/28/2023) |
| Original Amortization Term: | 360 months | | UW Economic Occupancy: | 95.0% |
| Amortization Type: | Amortizing Balloon | | UW Revenues: | $12,422,790 |
| Call Protection(2): | L(25),D(91),O(4) | | UW Expenses: | $3,616,139 |
| Lockbox / Cash Management: | Springing / Springing | | UW NOI: | $8,806,651 |
| Additional Debt(1): | Yes | | UW NCF: | $8,430,175 |
| Additional Debt Balance(1): | $19,987,152 | | Appraised Value / Per SF: | $136,200,000 / $262 |
| Additional Debt Type(1): | Pari Passu | | Appraisal Date: | 3/22/2023 |
| | | | | |
| Escrows and Reserves(3) | | Financial Information(1) |
| | Initial | Monthly | Initial Cap | | Cut-off Date Loan / SF: | $164 |
| Taxes: | $752,049 | $83,561 | N/A | | Maturity Date Loan / SF: | $142 |
| Insurance: | $0 | Springing | N/A | | Cut-off Date LTV: | 62.4% |
| Replacement Reserves: | $0 | $6,491 | N/A | | Maturity Date LTV: | 54.3% |
| TI/LC: | $0 | $28,128 | $1,250,000 | | UW NCF DSCR: | 1.25x |
| Rent Concession Reserve: | $58,333 | $0 | N/A | | UW NOI Debt Yield: | 10.4% |
| | | | | | | |
| Sources and Uses |
| Sources | Proceeds | % of Total | | Uses | Proceeds | % of Total | |
| Whole Loan | $85,000,000 | 100.0% | | Loan Payoff | $70,400,945 | 82.8 | % |
| | | | | Partnership Equity Buyout(4) | 10,271,111 | 12.1 | |
| | | | | Return of Equity | 2,060,070 | 2.4 | |
| | | | | Closing Costs | 1,457,492 | 1.7 | |
| | | | | Upfront Reserves | 810,382 | 1.0 | |
| Total Sources | $85,000,000 | 100.0% | | Total Uses | $85,000,000 | 100.0 | % |
| (1) | The Brier Creek Commons Mortgage Loan (as defined below) is part of a whole loan evidenced by three pari passu notes with an aggregate original principal balance of $85,000,000. Financial Information in the chart above reflects the Brier Creek Commons Whole Loan (as defined below). For additional information, see “The Loan” below. |
| (2) | Defeasance is permitted any time after the earlier of (i) April 20, 2026 and (ii) two years from the closing date of the securitization that includes the last pari passu note of the Brier Creek Commons Whole Loan to be securitized. The assumed lockout period of 25 payments is based on the closing date of this transaction in June 2023. The actual lockout period may be longer. |
| (3) | For a full description of Escrows and Reserves, please refer to “Escrows and Reserves” below. |
| (4) | The borrower sponsor used $10,271,111 of the loan proceeds to buy out a corporate equity partner in the non-recourse carveout guarantor, AAC Consolidated Properties, LLC (the “Guarantor”, as further described in “The Borrower Sponsor”). |
The Loan. The largest mortgage loan (the “Brier Creek Commons Mortgage Loan”) is part of a fixed rate whole loan (the “Brier Creek Commons Whole Loan”) evidenced by three pari passu promissory notes in the aggregate original principal amount of $85,000,000, secured by the borrower’s fee interest in an anchored retail power center located in Raleigh, North Carolina (the “Brier Creek Commons Property”). The Brier Creek Commons Mortgage Loan is evidenced by the controlling Note A-1, which has an outstanding principal balance as of the Cut-off Date of $64,958,243. The Brier Creek Commons Mortgage Loan will be included in the BMO 2023-C5 securitization trust and represents approximately 9.8% of the Initial Pool Balance. The Brier Creek Commons Whole Loan was originated on April 20, 2023 by Zions Bancorporation, N.A. (“ZBNA”) and proceeds were used to refinance the existing debt held by MetLife Investment Management on the Brier
| THE INFORMATION IN THIS STRUCTURAL AND COLLATERAL TERM SHEET IS NOT COMPLETE AND MAY BE AMENDED PRIOR TO THE TIME OF SALE. THIS TERM SHEET IS NOT AN OFFER TO SELL THESE SECURITIES AND IT IS NOT A SOLICITATION OF AN OFFER TO BUY THESE SECURITIES IN ANY JURISDICTION WHERE THE OFFER OR SALE IS NOT PERMITTED. |
| | 10 | |
| Structural and Collateral Term Sheet | | BMO 2023-C5 |
| No. 1 – Brier Creek Commons |
Creek Commons Property, fund upfront reserves, pay origination costs, buy out a corporate equity owner’s interests in the Guarantor and return cash equity to the borrower sponsor. The Brier Creek Commons Whole Loan accrues interest at a fixed rate of 6.91000% per annum. The table below summarizes the promissory notes that comprise the Brier Creek Commons Whole Loan. The relationship between the holders of the Brier Creek Commons Whole Loan is governed by a co-lender agreement as described under “Description of the Mortgage Pool—The Whole Loans—The Serviced Pari Passu Whole Loans” in the Preliminary Prospectus. The Brier Creek Commons Whole Loan will be serviced pursuant to the pooling and servicing agreement for the BMO 2023-C5 trust. See “The Pooling and Servicing Agreement” in the Preliminary Prospectus.
| Whole Loan Summary |
| Note | Original Balance | Cut-off Date Balance | | Note Holder | Controlling Piece |
| A-1 | $65,000,000 | $64,958,243 | | BMO 2023-C5 | Yes |
| A-2(1) | $10,000,000 | $9,993,576 | | ZBNA | No |
| A-3(1) | $10,000,000 | $9,993,576 | | ZBNA | No |
| Whole Loan | $85,000,000 | $84,945,395 | | | |
| (1) | Expected to be contributed to one or more future securitization(s). |
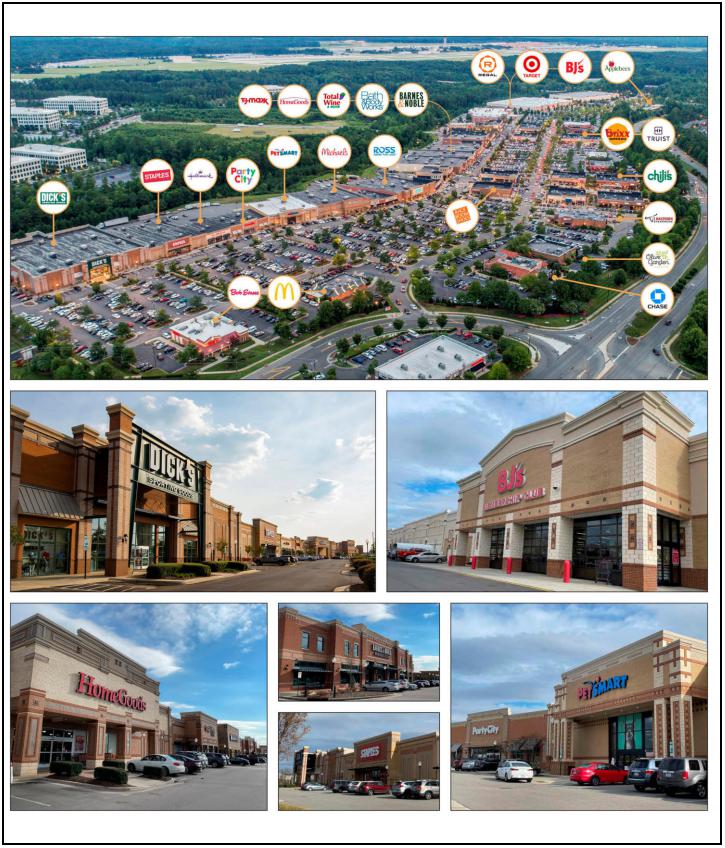
The Property.
The Brier Creek Commons Property is a 519,277 square foot, 20-building, Class A anchored retail power center located in Raleigh, North Carolina, approximately 5.8 miles east of the Research Triangle Park (“RTP”). Built in 2001 by the borrower sponsor, the property is situated on a 71.0-acre parcel and is anchored by BJ's Warehouse Club, Dick's Sporting Goods, Ross Dress for Less, TJ Maxx and HomeGoods. Additional notable junior anchor and in-line tenants include Michaels, Staples, PetSmart, Barnes & Noble, Party City, Rack Room Shoes, Total Wine, Talbots, Men’s Wearhouse, Vitamin Shoppe, Crumbl Cookies and Verizon Wireless, plus several dining options including McDonald’s, Chili’s, Olive Garden, Jason’s Deli, Brixx Wood Fired Pizza, Noodles & Co., Caribou Coffee and Bruegger’s Bagels. Four of the anchor tenants, collectively comprising 25.0% of net rentable area and 17.2% of underwritten base rent, are investment-grade rated by Moody’s and S&P (see the “Tenant Summary” table below). Fifteen tenants totaling 57.8% of NRA and 39.7% of underwritten base rent have been in occupancy for at least 20 years, including all five of the anchor tenants. The borrower sponsor completed approximately $3.4 million in capital expenditures from 2017-2022, including a roof replacement, asphalt pavement sealing and striping and exterior painting at the Brier Creek Commons Property.
As of April 1, 2023, the Brier Creek Commons Property was 98.5% occupied by 67 tenants and has averaged 99.1% occupancy from 2013-2022. No single tenant represents more than 11.2% of underwritten base rent and only BJ’s Wholesale Club represents more than 6.7% of underwritten base rent. The Brier Creek Commons Property contains 3,095 surface parking spaces, resulting in a parking ratio of approximately 6.0 spaces per 1,000 square feet of rentable area. There are four tenants totaling 4.9% of underwritten base rent that are ground lease tenants and own their improvements (Olive Garden, Truist Bank, McDonald’s and Chili’s). The Brier Creek Commons Property is shadow anchored by Target and Regal Cinemas; the spaces occupied by Target and Regal Cinemas are not part of the collateral securing the Brier Creek Commons Whole Loan.
The borrower sponsor developed the larger 1,450-acre Brier Creek master planned community, which includes the non-collateral 82,708 square foot Brierdale Commons retail center, the Brier Creek Corporate Center I, II, IV and V totaling 436,022 square feet, a 265-unit multifamily community under construction and future phases planned to include a Westin hotel property, multifamily and additional office buildings totaling approximately 1.5 million square feet.
| THE INFORMATION IN THIS STRUCTURAL AND COLLATERAL TERM SHEET IS NOT COMPLETE AND MAY BE AMENDED PRIOR TO THE TIME OF SALE. THIS TERM SHEET IS NOT AN OFFER TO SELL THESE SECURITIES AND IT IS NOT A SOLICITATION OF AN OFFER TO BUY THESE SECURITIES IN ANY JURISDICTION WHERE THE OFFER OR SALE IS NOT PERMITTED. |
| | 11 | |
| Structural and Collateral Term Sheet | | BMO 2023-C5 |
| No. 1 – Brier Creek Commons |
Anchor Tenants. The three largest tenants based on underwritten base rent are BJ’s Wholesale Club, Dick’s Sporting Goods and Ross Dress for Less, each of which is an anchor tenant.
BJ’s Wholesale Club (108,532 square feet; 20.9% of NRA, 11.2% of underwritten base rent, Moody’s/S&P/Fitch: Ba1/BB+/NR): Founded in 1984 and headquartered in Marlborough, Massachusetts, BJ’s Wholesale Club (“BJ’s”) is a warehouse club operator and retailer with 237 clubs and 165 gas stations, located primarily in the eastern United States. BJ’s is a membership only retailer and has over 6.5 million members as of April 2023. BJ’s annual total revenue was approximately $19.3 billion in its fiscal year ending January 28, 2023. BJ’s has been a tenant at the Brier Creek Commons Property since June 2001, with its current lease expiration date in September 2026 and three remaining 5-year extension options.
Dick’s Sporting Goods (45,000 square feet; 8.7% of NRA, 6.7% of underwritten base rent, Moody’s/S&P/Fitch: Baa3/BBB/NR): Founded by Richard T. Stack in 1948 and headquartered in Pittsburgh, Pennsylvania, Dick’s Sporting Goods (“Dick’s”) is a sporting goods retail chain with 850 stores including Dick’s, Golf Galaxy, Field & Stream, Public Lands, Going Going Gone! and Warehouse Sale stores. Dick’s has been a tenant at the Brier Creek Commons Property since March 2002, with its current lease expiration date in January 2028. Dick’s has one 5-year extension option remaining.
Ross Dress for Less (30,064 square feet; 5.8% of NRA, 4.3% of underwritten base rent, Moody’s/S&P/Fitch: A2/BBB+/NR): Founded in 1982 and headquartered in Dublin, California, Ross Dress for Less (“Ross”) is one of the largest off-price apparel and home fashion chains in the United States, with 1,693 locations in 40 states and an additional 322 dd’s Discounts stores, each as of January 28, 2023. Ross has been a tenant at the Brier Creek Commons Property since January 2003, with its current lease expiration date in January 2028. Ross has one 5-year extension option remaining.
Environmental. The Phase I environmental assessment at the Brier Creek Commons Property dated March 24, 2023 did not identify any recognized environmental conditions. See “Description of the Mortgage Pool—Environmental Considerations” in the Preliminary Prospectus for additional information.
The following table presents certain information relating to the historical occupancy of the Brier Creek Commons Property:
| Historical and Current Occupancy |
| 2018(1) | 2019(1) | 2020(1) | 2021(1) | 2022(1) | Current(2) |
| 99.4% | 99.3% | 95.4% | 99.8% | 98.3% | 98.5% |
| (1) | Historical Occupancies are as of December 31 of each respective year. |
| (2) | Based on the underwritten rent roll dated April 1, 2023. |
| THE INFORMATION IN THIS STRUCTURAL AND COLLATERAL TERM SHEET IS NOT COMPLETE AND MAY BE AMENDED PRIOR TO THE TIME OF SALE. THIS TERM SHEET IS NOT AN OFFER TO SELL THESE SECURITIES AND IT IS NOT A SOLICITATION OF AN OFFER TO BUY THESE SECURITIES IN ANY JURISDICTION WHERE THE OFFER OR SALE IS NOT PERMITTED. |
| | 12 | |
| Structural and Collateral Term Sheet | | BMO 2023-C5 |
| No. 1 – Brier Creek Commons |
The following table presents certain information relating to the largest tenants based on net rentable area of the Brier Creek Commons Property:
| Tenant Summary(1) |
| Tenant | Ratings
Moody’s/S&P/Fitch(2) | Net Rentable Area (SF) | % of
Total NRA | UW Base Rent PSF(3) | UW Base Rent(3) | % of Total
UW Base Rent(3) | Sales PSF/Year(4) | UW Occ. Costs(5) | Lease
Exp. Date |
| BJ’s Wholesale Club | Ba1/BB+/NR | 108,532 | 20.9 | % | $10.03 | $1,088,576 | 11.2% | NAV | NAV | 9/16/2026 |
| Dick’s Sporting Goods | Baa3/BBB/NR | 45,000 | 8.7 | | $14.50 | 652,500 | 6.7 | NAV | NAV | 1/31/2028 |
| Ross Dress for Less | A2/BBB+/NR | 30,064 | 5.8 | | $14.00 | 420,896 | 4.3 | NAV | NAV | 1/31/2028 |
| TJ Maxx | A2/A/NR | 30,000 | 5.8 | | $10.78 | 323,333 | 3.3 | $435 | 3.6% | 4/30/2032 |
| HomeGoods | A2/A/NR | 25,000 | 4.8 | | $10.78 | 269,444 | 2.8 | $447 | 3.5% | 4/30/2032 |
| Michaels | B3/B-/NR | 23,928 | 4.6 | | $12.00 | 287,136 | 3.0 | $176 | 9.7% | 10/31/2032 |
| Staples | B3/B/NR | 23,000 | 4.4 | | $11.97 | 275,238 | 2.8 | NAV | NAV | 4/30/2024 |
| Barnes & Noble | NR/NR/NR | 22,975 | 4.4 | | $12.50 | 287,187 | 3.0 | NAV | NAV | 3/31/2025 |
| PetSmart | B1/B+/NR | 18,968 | 3.7 | | $15.00 | 284,520 | 2.9 | NAV | NAV | 1/31/2028 |
| Party City(6) | NR/NR/NR | 12,000 | 2.3 | | $16.50 | 198,000 | 2.0 | NAV | NAV | 7/31/2033 |
| Top 10 Tenants | | 339,467 | 65.4 | % | $12.04 | $4,086,831 | 42.1% | | | |
| Other Tenants(7) | | 172,085 | 33.1 | % | $30.07(7) | $5,617,412 | 57.9% | | | |
| Occupied Collateral Total / Wtd. Avg. | | 511,552 | 98.5 | % | $18.08(7) | $9,704,243 | 100.0% | | | |
| | | | | | | | | | |
| Vacant Space | | 7,725 | 1.5 | % | | | | | | |
| | | | | | | | | | |
| Collateral Total | | 519,277 | 100.0 | % | | | | | | |
| | | | | | | | | | |
| (1) | Based on the underwritten rent roll dated April 1, 2023. |
| (2) | In certain instances, ratings provided are those of the parent company of the entity shown, whether or not the parent company guarantees the lease. |
| (3) | UW Base Rent, % of Total UW Base Rent and UW Base Rent PSF include contractual rent steps through April 2024 for 18 tenants totaling $49,722 and straight-line rent averaging for the investment-grade tenants TJ Maxx and HomeGoods totaling $15,278. |
| (4) | Sales PSF/Year are as of the trailing 12-month period ending January 31, 2022 for TJ Maxx and HomeGoods and as of the trailing 12-month period ending December 31, 2022 for Michaels, as provided by the tenants to the Brier Creek Commons Borrower. |
| (5) | UW Occ. Costs are based on underwritten base rent and reimbursements and most recently reported sales. |
| (6) | Party City Holdco Inc., the parent company of Party City, filed for Chapter 11 bankruptcy protection on January 17, 2023. Party City has not announced a store closure at the Brier Creek Commons Property and is current on its rent payments. |
| (7) | Four tenants totaling 4.9% of underwritten base rent (Olive Garden, Truist Bank, McDonald’s and Chili’s) are ground lease tenants and own their improvements with no associated NRA. An additional 1,073 square feet (0.2% of the NRA) is attributed to a storage space with no corresponding lease or applicable base rent. The weighted average UW Base Rent PSF calculations exclude the underwritten base rent, if any, associated with these ground lease tenants and the storage space. |
| THE INFORMATION IN THIS STRUCTURAL AND COLLATERAL TERM SHEET IS NOT COMPLETE AND MAY BE AMENDED PRIOR TO THE TIME OF SALE. THIS TERM SHEET IS NOT AN OFFER TO SELL THESE SECURITIES AND IT IS NOT A SOLICITATION OF AN OFFER TO BUY THESE SECURITIES IN ANY JURISDICTION WHERE THE OFFER OR SALE IS NOT PERMITTED. |
| | 13 | |
| Structural and Collateral Term Sheet | | BMO 2023-C5 |
| No. 1 – Brier Creek Commons |
The following table presents certain information relating to the tenant lease expirations at the Brier Creek Commons Property:
| Lease Rollover Schedule(1)(2) |
| Year | Number of Leases Expiring(3) | Net Rentable Area Expiring(3) | % of NRA Expiring(3) | UW Base Rent Expiring(4) | % of UW Base Rent Expiring(4) | Cumulative Net Rentable Area Expiring(3) | Cumulative % of NRA Expiring(3) | Cumulative UW Base Rent Expiring(4) | Cumulative % of UW Base Rent Expiring(4) |
| Vacant | NAP | 7,725 | 1.5 | % | NAP | NA | P | 7,725 | 1.5% | NAP | NAP | |
| 2023 & MTM | 1 | 4,856 | 0.9 | | $145,680 | 1.5 | % | 12,581 | 2.4% | $145,680 | 1.5% | |
| 2024 | 6 | 44,434 | 8.6 | | 820,045 | 8.5 | | 57,015 | 11.0% | $965,725 | 10.0% | |
| 2025 | 8 | 41,584 | 8.0 | | 1,014,525 | 10.5 | | 98,599 | 19.0% | $1,980,250 | 20.4% | |
| 2026 | 6 | 120,324 | 23.2 | | 1,420,968 | 14.6 | | 218,923 | 42.2% | $3,401,217 | 35.0% | |
| 2027 | 14 | 33,507 | 6.5 | | 1,175,817 | 12.1 | | 252,430 | 48.6% | $4,577,034 | 47.2% | |
| 2028 | 16 | 130,274 | 25.1 | | 2,580,880 | 26.6 | | 382,704 | 73.7% | $7,157,915 | 73.8% | |
| 2029 | 3 | 21,809 | 4.2 | | 478,052 | 4.9 | | 404,513 | 77.9% | $7,635,967 | 78.7% | |
| 2030 | 2 | 2,492 | 0.5 | | 269,891 | 2.8 | | 407,005 | 78.4% | $7,905,858 | 81.5% | |
| 2031 | 1 | 2,596 | 0.5 | | 110,382 | 1.1 | | 409,601 | 78.9% | $8,016,240 | 82.6% | |
| 2032 | 6 | 85,728 | 16.5 | | 1,130,079 | 11.6 | | 495,329 | 95.4% | $9,146,318 | 94.3% | |
| 2033 | 3 | 22,875 | 4.4 | | 557,925 | 5.7 | | 518,204 | 99.8% | $9,704,243 | 100.0% | |
| 2034 & Beyond(5) | 1 | 1,073 | 0.2 | | 0 | 0.0 | | 519,277 | 100.0% | $9,704,243 | 100.0% | |
| Total | 67 | 519,277 | 100.0 | % | $9,704,243 | 100.0 | % | | | | |
| (1) | Based on the underwritten rent roll dated April 1, 2023. |
| (2) | Certain tenants may have lease termination options that are exercisable prior to the originally stated expiration date of the subject lease and that are not considered in the lease rollover schedule. |
| (3) | Four tenants totaling 4.9% of underwritten base rent (Olive Garden, Truist Bank, McDonald’s and Chili’s) are ground lease tenants and own their improvements with no associated NRA. |
| (4) | UW Base Rent Expiring, % of UW Base Rent Expiring, Cumulative UW Base Rent Expiring and Cumulative % of UW Base Rent Expiring include contractual rent steps through April 2024 and straight-line rent averaging for the investment-grade tenants TJ Maxx and HomeGoods. |
| (5) | Represents shopping center storage space with no corresponding lease or applicable base rent. |
| THE INFORMATION IN THIS STRUCTURAL AND COLLATERAL TERM SHEET IS NOT COMPLETE AND MAY BE AMENDED PRIOR TO THE TIME OF SALE. THIS TERM SHEET IS NOT AN OFFER TO SELL THESE SECURITIES AND IT IS NOT A SOLICITATION OF AN OFFER TO BUY THESE SECURITIES IN ANY JURISDICTION WHERE THE OFFER OR SALE IS NOT PERMITTED. |
| | 14 | |
| Structural and Collateral Term Sheet | | BMO 2023-C5 |
| No. 1 – Brier Creek Commons |
The following table presents certain information relating to the operating history and underwritten cash flows of the Brier Creek Commons Property:
| Operating History and Underwritten Net Cash Flow |
| | 2020 | 2021 | 2022 | 2/28/2023 TTM(1) | Underwritten(1) | Per Square Foot | %(2) |
| Base Rent | $8,739,023 | $9,190,973 | $9,202,936 | $9,235,283 | $9,704,243 | $18.69 | 74.2 | % |
| Grossed Up Vacant Space | 0 | 0 | 0 | 0 | 278,100 | 0.54 | 2.1 | |
| Gross Potential Rent | $8,739,023 | $9,190,973 | $9,202,936 | $9,235,283 | $9,982,343 | $19.22 | 76.3 | % |
| Other Income(3) | 26,787 | 1,964 | 2,798 | 2,677 | 2,677 | 0.01 | 0.0 | |
| Percentage Rent(4) | 2,615 | 1,790 | 55,389 | 67,052 | 39,917 | 0.08 | 0.3 | |
| Total Reimbursements | 2,651,132 | 2,520,286 | 2,884,346 | 2,808,635 | 3,051,543 | 5.88 | 23.3 | |
| Net Rental Income | $11,419,557 | $11,715,014 | $12,145,468 | $12,113,647 | $13,076,480 | $25.18 | 100.0 | % |
| (Vacancy & Credit Loss)(5) | 0 | 0 | 0 | 0 | (653,690)(5) | (1.26) | (5.0 | ) |
| Effective Gross Income | $11,419,557 | $11,715,014 | $12,145,468 | $12,113,647 | $12,422,790 | $23.92 | 95.0 | % |
| Total Expenses(6) | 3,204,017 | 3,235,682 | 3,575,672 | 3,462,674 | 3,616,139 | 6.96 | 29.1 | |
| Net Operating Income | $8,215,540 | $8,479,332 | $8,569,797 | $8,650,973 | $8,806,651 | $16.96 | 70.9 | % |
| Capital Expenditures | 0 | 0 | 0 | 0 | 77,892 | 0.15 | 0.6 | |
| TI / LC | 0 | 0 | 0 | 0 | 298,584 | 0.58 | 2.4 | |
| Net Cash Flow | $8,215,540 | $8,479,332 | $8,569,797 | $8,650,973 | $8,430,175 | $16.23 | 67.9 | % |
| (1) | TTM reflects the trailing 12-month period ending February 28, 2023. Underwritten rents are higher than TTM Rents due to the inclusion of rent steps underwritten per the tenants' contractual lease terms through April 2024 for 18 tenants totaling $49,722 and straight-line rent averaging for the investment-grade tenants TJ Maxx and HomeGoods totaling $15,278. |
| (2) | % column represents percent of Net Rental Income for all revenue lines and represents percent of Effective Gross Income for the remainder of fields. |
| (3) | Other Income reflects the Brier Creek Commons Borrower’s miscellaneous income. |
| (4) | Includes percentage rent for tenants Crumbl Cookies and Bath and Body Works based on trailing 12-month sales and current sales breakpoints in each respective lease. |
| (5) | The underwritten economic occupancy is 95.0%. The Brier Creek Commons Property was 98.5% physically occupied based on the April 1, 2023 rent roll. |
| (6) | The management fee is underwritten to reflect 3.0% of Effective Gross Income. The fee per the in-place management agreement is 4.0% and is paid to a borrower sponsor affiliate. All management fees above 3.0% have been subordinated to the Brier Creek Commons Whole Loan. |
| THE INFORMATION IN THIS STRUCTURAL AND COLLATERAL TERM SHEET IS NOT COMPLETE AND MAY BE AMENDED PRIOR TO THE TIME OF SALE. THIS TERM SHEET IS NOT AN OFFER TO SELL THESE SECURITIES AND IT IS NOT A SOLICITATION OF AN OFFER TO BUY THESE SECURITIES IN ANY JURISDICTION WHERE THE OFFER OR SALE IS NOT PERMITTED. |
| | 15 | |
| Structural and Collateral Term Sheet | | BMO 2023-C5 |
| No. 1 – Brier Creek Commons |
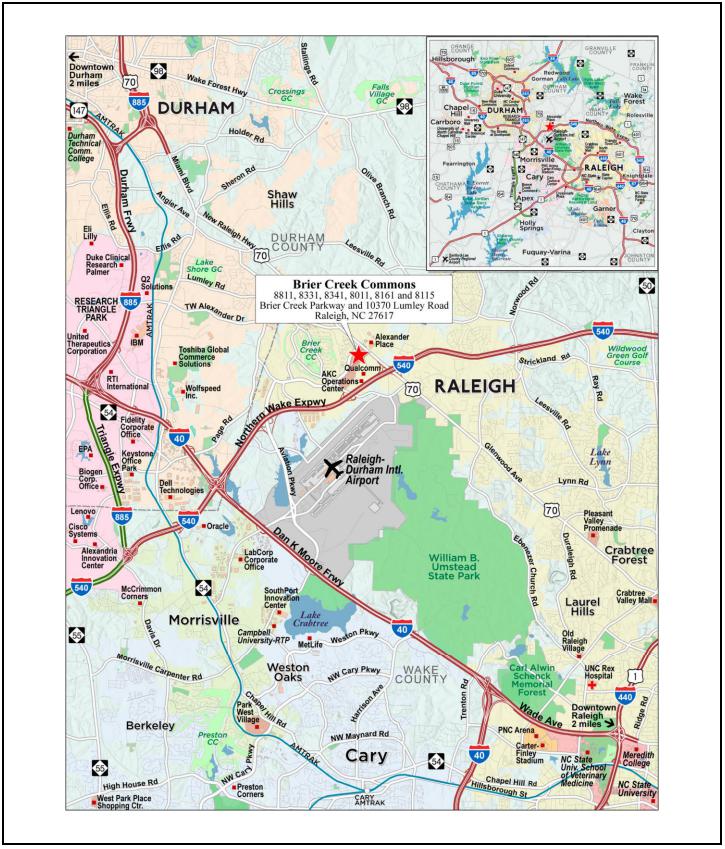
The Market. The Brier Creek Commons Property is located along Interstate 540 between Raleigh and Durham, North Carolina, approximately 13.8 miles northwest of the Raleigh central business district (“CBD”) and 10.6 miles southeast of the Durham CBD. Per the appraisal, combined traffic counts total over 81,000 vehicles per day at the Brier Creek Commons Property. Primary access to the area is provided by Interstates 40 and 540 and Highway 70 (Glenwood Avenue), with approximate driving times to the Raleigh CBD, Durham CBD, RTP and Raleigh-Durham International Airport of 24, 18, 10 and 8 minutes, respectively.
According to the appraisal, the RTP is situated at the Brier Creek Commons Property neighborhood’s western boundary. The RTP is the largest research park in the United States encompassing 7,000 acres, home to over 200 companies and over 50,000 employees. In the Raleigh, NC Metropolitan Statistical Area, approximately 49.4% of individuals over the age of 24 have a college degree, with 31.0% holding a bachelor's degree and 18.4% holding a graduate degree, per the appraisal. Duke University, North Carolina State University and the University of North Carolina at Chapel Hill are each situated approximately 12.4 to 17.4 miles from the Brier Creek Commons Property. This employment base has and continues to generate residential development in the surrounding areas. The immediate area surrounding the Brier Creek Commons Property is a relatively newer area of development, per the appraisal, consisting primarily of residential uses with much of the development being built during the 1990s, 2000s, and 2010s. According to the appraisal, Raleigh and the Research Triangle region continue to be among the fastest-growing metros in the nation. Among markets with populations over 1 million, only Austin grew at a faster rate.
According to the appraisal, within a three- and five-mile radius of the Brier Creek Commons Property, the 2022 average household income was approximately $131,110 and $133,029, respectively; and within the same radii, the 2022 estimated population was 42,109 and 96,661, respectively. The appraisal noted the Raleigh, NC Metropolitan Statistical Area’s 2022 average household income as being $117,896 and the United States Census Bureau noted the 2017-2021 State of North Carolina’s median household income as being $60,516. Since 2010, the population within a three-mile radius has increased by approximately 53.6% and the number of households has increased by approximately 61.7%, with annual growth rates of 3.6% and 4.1%, respectively. According to the appraisal, the top three industries within the area are Prof/Scientific/Tech Services, Health Care/Social Assistance and Retail Trade, which represent a combined total of 37% of the workforce.
According to a third-party market research report, the Brier Creek Commons Property is situated within the RTP/RDU retail submarket of the Raleigh - NC retail market. As of April 10, 2023, the submarket reported total inventory of approximately 2.9 million square feet with a 1.4% vacancy rate and average asking rents of $31.92 per square foot.
| THE INFORMATION IN THIS STRUCTURAL AND COLLATERAL TERM SHEET IS NOT COMPLETE AND MAY BE AMENDED PRIOR TO THE TIME OF SALE. THIS TERM SHEET IS NOT AN OFFER TO SELL THESE SECURITIES AND IT IS NOT A SOLICITATION OF AN OFFER TO BUY THESE SECURITIES IN ANY JURISDICTION WHERE THE OFFER OR SALE IS NOT PERMITTED. |
| | 16 | |
| Structural and Collateral Term Sheet | | BMO 2023-C5 |
| No. 1 – Brier Creek Commons |
The following table presents certain information relating to the seven competitive retail properties to the Brier Creek Commons Property, ranging in size from 103,240 square feet to 388,318 square feet, that reported occupancy rates ranging from 91% to 100% and quoted rents ranging from $14.00 to $40.00 per square foot.
| Competitive Retail Properties(1) |
| Property Name/Location | Year Built/Renovated | Size (SF) | Occupancy | Anchor Tenants | Quoted Rate PSF (NNN) | Distance to Subject (mi.) |
Brier Creek Commons(2) 8811, 8331, 8341, 8011, 8161 and 8115 Brier Creek Parkway and 10370 Lumley Road Raleigh, NC (Subject) | 2001/NAP | 519,277 | 98.5% | BJ’s Warehouse Club, Dick's Sporting Goods, Ross Dress for Less, TJ Maxx, HomeGoods | $10.03 - $42.52 | -- |
Plantation Point 6305 Capital Boulevard Raleigh, NC | 2006/NAV | 388,318 | 93.0% | BJ's, Burlington, Tuesday Morning, Big Lots, Lifetime Fitness | $14.00 - $25.00 | 11.0 |
Stone Creek Village 98 Cornerstone Dr Cary, NC | 2006/NAV | 137,201 | 100.0% | Harris Teeter | $26.00 - $32.00 | 8.8 |
Southpoint Crossing 202 NC Highway 54 Durham, NC | 1999/NAV | 103,240 | 98.0% | Harris Teeter | $19.00 - $25.00 | 8.6 |
Freedom Town Center 612 Congenial Court Fayetteville, NC | 2017/NAV | 350,895 | 100.0% | Dick's Sporting Goods/Field & Stream, Hobby Lobby, Sprouts Farmers Market, HomeGoods, Burke's Outlet, Cost Plus World Market, Buy Buy Baby, DSW, Petco, Five Below | $32.00 - $40.00 | 60.0 |
Holly Springs Towne Center NC 55 and New Hill Road Holly Springs, NC | 2013/2015 | 354,847 | 95.0% | Marshall's, Michaels, Dick's Sporting Goods, Petco, Bed, Bath & Beyond, DSW, Target, AMC Dine-in Theater | $36.00 - $38.00 | 17.0 |
Park West Village – Phase II 2100 Village Market Place Morrisville, NC | 2011/2013 | 190,454 | 91.0% | Stone Theaters, HomeGoods, Michael's | $33.00 - $37.00 | 7.0 |
Wendover Village 4217 Wendover Avenue Greensboro, NC | 2004/NAV | 306,653 | 99.0% | Costco, Five Below, TJ Maxx, Bed Bath and Beyond, Golfsmith, Petco | $25.00 - $38.00 | 63.0 |
| (2) | Based on the underwritten rent roll dated April 1, 2023. |
The following table presents certain information relating to the appraisal’s market rent conclusion for the Brier Creek Commons Property:
| Market Rent Summary(1) |
| | Anchor Space | Jr. Anchor Space | Small Shop Space | Large Shop Space | Restaurant Space | Outparcel (Ground Lease) Space |
| Market Rent (PSF) | $14.00 | $18.00 | $35.00 | $28.00 | $36.00 | $3.07(2) |
| Lease Term (Years) | 10 | 10 | 5 | 5 | 10 | 10 |
| Lease Type (Reimbursements) | NNN | NNN | NNN | NNN | NNN | NNN |
| Tenant Improvements | None | None | None | None | None | None |
| Concessions | 0 months | 0 months | 0 months | 0 months | 0 months | 0 months |
| (2) | The Market Rent (PSF) of the Outparcel (Ground Lease) Space is based on the gross leasable area and not the square footage of the non-collateral leasehold improvements. |
The table below presents certain information relating to comparable sales pertaining to the Brier Creek Commons Property identified by the appraiser:
| Comparable Sales(1) |
| |
| Property Name | Location | Rentable Area (SF) | Sale Date | Sale Price (PSF) |
| Shoppes at Park Place | Pinellas Park, FL | 361,250 | Oct-2022 | $235 |
| The Shoppes at Webb Gin | Snellville, GA | 329,665 | Jun-2022 | $294 |
| Forum on Peachtree Parkway | Peachtree Corners, GA | 503,567 | Mar-2022 | $266 |
| Fontainebleau Park Plaza | Unincorporated Miami-Dade County, FL | 233,350 | Feb-2022 | $300 |
| Freedom Town Center | Fayetteville, NC | 350,834 | Feb-2022 | $219 |
| Promenade at Carolina Reserve | Indian Land, SC | 278,278 | Feb-2022 | $241 |
| The Village at Waterside | Chattanooga, TN | 202,862 | Feb-2022 | $250 |
| Homestead Pavilion | Homestead, FL | 285,833 | Jan-2022 | $290 |
| THE INFORMATION IN THIS STRUCTURAL AND COLLATERAL TERM SHEET IS NOT COMPLETE AND MAY BE AMENDED PRIOR TO THE TIME OF SALE. THIS TERM SHEET IS NOT AN OFFER TO SELL THESE SECURITIES AND IT IS NOT A SOLICITATION OF AN OFFER TO BUY THESE SECURITIES IN ANY JURISDICTION WHERE THE OFFER OR SALE IS NOT PERMITTED. |
| | 17 | |
| Structural and Collateral Term Sheet | | BMO 2023-C5 |
| No. 1 – Brier Creek Commons |
The Borrower. The borrower for the Brier Creek Commons Whole Loan is BC Retail, LLC (“Brier Creek Commons Borrower"), a Delaware limited liability company and a bankruptcy remote single purpose entity with two independent directors. Legal counsel to the Brier Creek Commons Borrower delivered a non-consolidation opinion in connection with the origination of the Brier Creek Commons Whole Loan.
The Borrower Sponsor. The non-recourse carveout guarantor is AAC Consolidated Properties, LLC and the borrower sponsor is Maria Beatrice Countess Arco, the President of AAC Consolidated Management, LLC, an affiliate of American Asset Corporation (“AAC”). AAC is a diversified real estate company specializing in development, construction management, leasing and brokerage, and asset and property management. Headquartered in New York with offices in Charlotte and Raleigh, North Carolina, AAC was founded in 1986 and has been involved in over 8.0 million square feet of real estate projects, including development of over 6.0 million square feet. AAC developed and has owned the Brier Creek Commons Property since construction. AAC’s current portfolio comprises nearly 6.0 million square feet of retail, office, and flex space, in addition to 4.5 million square feet of land held for planned development. Approximately 3.0 million square feet of developed retail space is situated in North Carolina and South Carolina, inclusive of the Brier Creek Commons Property. AAC also owns and operates the 582,651 square foot Arboretum Shopping Center in Charlotte, NC.
Property Management. The Brier Creek Commons Property is managed by AAC, an affiliate of the borrower sponsor (see “The Borrower Sponsor” above).
Escrows and Reserves. At the time of origination of the Brier Creek Commons Whole Loan, the Brier Creek Commons Borrower deposited approximately (i) $752,049 into a real estate tax reserve account and (ii) $58,333 into a rent concession reserve representing the amount of future rent credits or abatements under the existing lease with Sephora.
Tax Escrows – The Brier Creek Commons Borrower is required to deposit into a real estate tax reserve, on a monthly basis in an amount equal to one-twelfth of the real estate taxes that the lender estimates will be payable during the next 12 months (initially $83,561 monthly); provided, however, that the Brier Creek Commons Borrower is not required to make the monthly tax reserve deposit attributable to the Chili’s, McDonalds and Olive Garden parcels (each, a “Self-Pay Tax Tenant”) as long as (i) no event of default is continuing; (ii) such Self-Pay Tax Tenant is obligated to pay taxes directly and is actually making such payments; (iii) the Brier Creek Commons Borrower delivers timely evidence to the lender that the applicable taxes have been paid prior to delinquency; and (iv) such Self-Pay Tax Tenant’s lease is in full force and effect with neither the Brier Creek Commons Borrower nor such Self-Pay Tenant being in default of any obligations thereunder beyond any applicable notice and cure periods.
Insurance Escrows – The Brier Creek Commons Whole Loan documents do not require ongoing monthly insurance reserve deposits as long as (i) no event of default is continuing; (ii) the Brier Creek Commons Property is covered under a blanket or umbrella policy acceptable to the lender; (iii) the Brier Creek Commons Borrower provides the lender with evidence of renewal of such policies; and (iv) the Brier Creek Commons Borrower provides the lender with paid receipts for payment of the insurance premiums by no later than five days prior to the policy expiration dates.
Replacement Reserves – The Brier Creek Commons Whole Loan documents require ongoing monthly replacement reserve deposits of $6,491, which the lender may require the Brier Creek Commons Borrower to increase (not more than once per year) upon 30 days’ notice to the Brier Creek Commons Borrower if the lender reasonably determines such increase is necessary to maintain the proper operation of the Brier Creek Commons Property.
Leasing Reserves – The Brier Creek Commons Whole Loan documents require ongoing monthly general tenant improvements and leasing commissions reserves of $28,128. Deposits into the leasing reserve (exclusive of any pending disbursements therefrom) will be capped at $1,250,000 as long as no Cash Trap Event Period (as defined below) is continuing.
Lockbox / Cash Management. The Brier Creek Commons Whole Loan is structured with a springing lockbox and springing cash management. Upon the occurrence of a Cash Trap Event Period, the Brier Creek Commons Borrower is required to (i) execute a deposit account control agreement to establish a deposit account with a clearing bank and (ii) send executed letters directing all tenants to deposit all sums due under their respective leases directly into said deposit account. All funds in the deposit account are required to be swept periodically to a lender-controlled cash management account. If the Brier Creek Commons Borrower or property manager receive any rents or income directly, each is required to deposit such
| THE INFORMATION IN THIS STRUCTURAL AND COLLATERAL TERM SHEET IS NOT COMPLETE AND MAY BE AMENDED PRIOR TO THE TIME OF SALE. THIS TERM SHEET IS NOT AN OFFER TO SELL THESE SECURITIES AND IT IS NOT A SOLICITATION OF AN OFFER TO BUY THESE SECURITIES IN ANY JURISDICTION WHERE THE OFFER OR SALE IS NOT PERMITTED. |
| | 18 | |
| Structural and Collateral Term Sheet | | BMO 2023-C5 |
| No. 1 – Brier Creek Commons |
amounts into the deposit account within five business days of receipt. So long as a Cash Trap Event Period is in effect, all excess funds will be swept to an excess cash flow subaccount controlled by the lender and held for so long as such Cash Trap Event Period is continuing, provided, however, that during a Cash Trap Event Period caused solely by a Major Tenant Event Period (as defined below, and provided that no other Cash Trap Event Period subsequently commences or is continuing) such sweep will be subject to a cap of $1,250,000. For the avoidance of doubt, the Major Tenant Event Period cap is independent and in addition to any cap contemplated for the leasing reserve discussed in “Escrows and Reserves” above.
A “Cash Trap Event Period” will commence upon the earlier of the following:
| (i) | the occurrence of an event of default; |
| (ii) | the net operating income debt service coverage ratio, assuming an amortization period of 30 years (“Amortizing NOI DSCR”) falling below 1.15x (tested quarterly) (a “Low DSCR Event”); or |
| (iii) | a Major Tenant Event Period. |
A Cash Trap Event Period will end upon the occurrence of the following:
| ● | with regard to clause (i), the cure of such event of default; |
| ● | with regard to clause (ii), (x) the Amortizing NOI DSCR being equal to or greater than 1.20x for two consecutive calendar quarters or (y) upon five business days of written notice from the lender, the Brier Creek Commons Borrower having delivered cash and cash equivalents or a letter of credit in an amount equal to six months of excess cash flow (forward looking from the time of such calculation), as determined by the lender in its reasonable discretion, with such deposit being required every subsequent six month period in which a Low DSCR Event is continuing; or |
| ● | with regard to clause (iii), a Major Tenant Event Period Cure (as defined below). |
A “Major Tenant Event Period” will commence upon the earliest to occur of the following with respect to BJ’s, as well as its successors and assigns, and any replacement tenant for all or a portion of such tenant’s space (individually or collectively, as applicable, “Major Tenant”):
| (i) | a Major Tenant, or its parent or guarantor filing, or otherwise becoming involved as debtor in, a bankruptcy or similar insolvency proceeding; |
| (ii) | a Major Tenant “going dark”, vacating or otherwise failing to continually occupy its space (or any material portion thereof), or giving notice of its intent to commence any of the foregoing; |
| (iii) | a Major Tenant surrendering, terminating or canceling its lease (or any material portion thereof), or otherwise failing or ceasing to be in full force and effect, or a Major Tenant giving notice of, or commencing a legal proceeding asserting any of the foregoing; |
| (iv) | a default occurring (beyond any applicable notice and cure period) under a Major Tenant lease; or |
| (v) | a Major Tenant failing to renew or extend the term of its lease on or prior to the date that is the earlier of (x) six months prior to the date of scheduled expiration and (y) the deadline to renew such lease as set forth therein, to the extent that such lease expressly provides for such deadline. |
A “Major Tenant Event Period Cure” will occur upon:
| ● | solely with regards to clause (i) above, (x) a Major Tenant Re-Tenanting Event (as defined below) having occurred or (y) two consecutive calendar quarters after the bankruptcy or insolvency proceeding having terminated in a manner satisfactory to the lender, such Major Tenant’s lease having been affirmed and the terms of such lease, as affirmed, being satisfactory to the lender; |
| ● | solely with regards to clause (ii) above, (x) a Major Tenant Re-Tenanting Event having occurred or (y) the applicable Major Tenant having resumed its normal business operations in its entire space for a period of two consecutive calendar quarters; |
| ● | solely with regards to clause (iii) above, (x) a Major Tenant Re-Tenanting Event having occurred or (y) such Major Tenant having (A) validly and irrevocably waived any notification of any such termination, cancellation, |
| THE INFORMATION IN THIS STRUCTURAL AND COLLATERAL TERM SHEET IS NOT COMPLETE AND MAY BE AMENDED PRIOR TO THE TIME OF SALE. THIS TERM SHEET IS NOT AN OFFER TO SELL THESE SECURITIES AND IT IS NOT A SOLICITATION OF AN OFFER TO BUY THESE SECURITIES IN ANY JURISDICTION WHERE THE OFFER OR SALE IS NOT PERMITTED. |
| | 19 | |
| Structural and Collateral Term Sheet | | BMO 2023-C5 |
| No. 1 – Brier Creek Commons |
| | or surrender of such lease and (B) delivered to the lender a tenant estoppel certificate reasonably acceptable to the lender; |
| ● | solely with regards to clause (iv) above, (x) a Major Tenant Re-Tenanting Event having occurred or (y) the subject default having been cured and no other default under the related lease having occurred (beyond any notice and cure period) for a period of two consecutive calendar quarters; or |
| ● | solely with regards to clause (v) above, (x) a Major Tenant Re-Tenanting Event having occurred or (y) the lender having received evidence that the Major Tenant either (A) extended the term of its lease pursuant to the terms thereof (or on terms and conditions otherwise acceptable to the lender) or (B) entered into a new lease for the applicable Major Tenant space (to the extent that no additional renewal options remain under the related lease), in each case, such evidence to include, without limitation, a tenant estoppel certificate from the applicable Major Tenant acceptable to the lender, confirming that all obligations of the Brier Creek Commons Borrower to such Major Tenant with respect to tenant improvements and leasing commissions having been satisfied in full and that such Major Tenant is then paying full, unabated rent pursuant to the terms thereof. |
A “Major Tenant Re-Tenanting Event” will occur upon the lender receiving satisfactory evidence (including, without limitation, a satisfactory estoppel) that (i) space at the Brier Creek Commons Property in an amount equal to all or substantially all of the applicable Major Tenant space (or applicable portion thereof) has been leased to one or more satisfactory replacement tenants pursuant to a satisfactory replacement lease; (ii) each such tenant is in occupancy of its premises, is open for normal business and is paying full, unabated rent pursuant to the terms of its lease (or such abatement having been reserved); and (iii) all tenant improvement costs and leasing commissions provided in each such replacement lease have been paid (or sufficient funds have been deposited into the leasing reserve subaccount for payment of such amounts).
Subordinate Debt. None.
Mezzanine Debt. None.
Partial Release. Not permitted.
Ground Lease. None.
| THE INFORMATION IN THIS STRUCTURAL AND COLLATERAL TERM SHEET IS NOT COMPLETE AND MAY BE AMENDED PRIOR TO THE TIME OF SALE. THIS TERM SHEET IS NOT AN OFFER TO SELL THESE SECURITIES AND IT IS NOT A SOLICITATION OF AN OFFER TO BUY THESE SECURITIES IN ANY JURISDICTION WHERE THE OFFER OR SALE IS NOT PERMITTED. |
| | 20 | |
| Structural and Collateral Term Sheet | | BMO 2023-C5 |
| No. 2 – Central Florida Industrial Portfolio |
| THE INFORMATION IN THIS STRUCTURAL AND COLLATERAL TERM SHEET IS NOT COMPLETE AND MAY BE AMENDED PRIOR TO THE TIME OF SALE. THIS TERM SHEET IS NOT AN OFFER TO SELL THESE SECURITIES AND IT IS NOT A SOLICITATION OF AN OFFER TO BUY THESE SECURITIES IN ANY JURISDICTION WHERE THE OFFER OR SALE IS NOT PERMITTED. |
| | 21 | |
| Structural and Collateral Term Sheet | | BMO 2023-C5 |
| No. 2 – Central Florida Industrial Portfolio |
| THE INFORMATION IN THIS STRUCTURAL AND COLLATERAL TERM SHEET IS NOT COMPLETE AND MAY BE AMENDED PRIOR TO THE TIME OF SALE. THIS TERM SHEET IS NOT AN OFFER TO SELL THESE SECURITIES AND IT IS NOT A SOLICITATION OF AN OFFER TO BUY THESE SECURITIES IN ANY JURISDICTION WHERE THE OFFER OR SALE IS NOT PERMITTED. |
| | 22 | |
| Structural and Collateral Term Sheet | | BMO 2023-C5 |
| No. 2 – Central Florida Industrial Portfolio |
| Mortgage Loan Information | | Property Information |
| Mortgage Loan Seller: | KeyBank | | Single Asset / Portfolio: | Portfolio |
| Original Principal Balance: | $42,240,000 | | Title: | Fee |
| Cut-off Date Principal Balance: | $42,240,000 | | Property Type – Subtype: | Industrial – Flex |
| % of IPB: | 6.4% | | Net Rentable Area (SF): | 419,886 |
| Loan Purpose(1): | Acquisition/Recapitalization | | Location: | Various, FL |
| Borrowers: | Small Bay I Orlando DST, Small Bay I Corporex DST, Small Bay I Brandywine DST and Small Bay I Presidents DST | | Year Built / Renovated(3): | Various / Various |
| | | Occupancy: | 93.5% |
| | | Occupancy Date: | Various |
| Borrower Sponsor: | NexPoint Real Estate Advisors, L.P. | | 4th Most Recent NOI (As of)(4): | NAV |
| Interest Rate: | 6.21000% | | 3rd Most Recent NOI (As of)(4): | NAV |
| Note Date: | 4/28/2023 | | 2nd Most Recent NOI (As of)(4): | NAV |
| Maturity Date: | 5/1/2033 | | Most Recent NOI (As of)(4): | $3,937,119 (12/31/2021) |
| Interest-only Period: | 120 months | | UW Economic Occupancy: | 91.5% |
| Original Term: | 120 months | | UW Revenues: | $7,554,885 |
| Original Amortization Term: | None | | UW Expenses: | $3,200,036 |
| Amortization Type: | Interest Only | | UW NOI: | $4,354,850 |
| Call Protection: | L(25),D(92),O(3) | | UW NCF: | $4,208,700 |
| Lockbox / Cash Management: | Hard / In Place | | Appraised Value / Per SF: | $70,400,000 / $168 |
| Additional Debt: | No | | Appraisal Date: | 3/20/2023 |
| Additional Debt Balance: | N/A | | | |
| Additional Debt Type: | N/A | | | |
| | | | | |
| Escrows and Reserves(2) | | Financial Information |
| | Initial | Monthly | Initial Cap | | Cut-off Date Loan / SF: | $101 |
| Taxes: | $467,442 | $66,778 | N/A | | Maturity Date Loan / SF: | $101 |
| Insurance: | $348,474 | $62,504 | N/A | | Cut-off Date LTV: | 60.0% |
| Replacement Reserves: | $375,000 | Springing | $375,000 | | Maturity Date LTV: | 60.0% |
| TI / LC Reserve: | $3,500,000 | Springing | $3,500,000 | | UW NCF DSCR: | 1.58x |
| Other: | $378,548 | $0 | N/A | | UW NOI Debt Yield: | 10.3% |
| | | | | | | |
| Sources and Uses |
| Sources | Proceeds | % of Total | | Uses | Proceeds | % of Total |
| Mortgage Loan | $42,240,000 | 64.4 | % | | Purchase Price(5) | $33,000,000 | 50.3 | % |
| Borrower Sponsor Equity | 23,383,521 | 35.6 | | | Loan Payoff(5) | 22,056,296 | 33.6 | |
| | | | | | Closing Costs | 5,497,760 | 8.4 | |
| | | | | | Reserves | 5,069,465 | 7.7 | |
| Total Sources | $65,623,521 | 100.0 | % | | Total Uses | $65,623,521 | 100.0 | % |
| (1) | Three of the Central Florida Industrial Portfolio Properties (as defined below) were acquired at origination of the Central Florida Industrial Portfolio Mortgage Loan (as defined below) and one of the Central Florida Industrial Portfolio Properties had interim financing from an affiliate acquisition before membership interests were transferred to the borrowers at origination of the Central Florida Industrial Portfolio Mortgage Loan. |
| (2) | For a full description of escrows and reserves, please refer to “Escrows and Reserves” below. |
| (3) | See “Portfolio Summary” table herein. |
| (4) | With the exception of the 2021 financials, historical financials were not provided by the sellers of Central Florida Industrial Portfolio Properties. |
| (5) | The Purchase Price of $33,000,000 represents the acquisition of the Tampa Properties (as defined below) and the Loan Payoff of approximately $22,056,296 represents the payoff of previous interim financing from an affiliate acquisition of the Orlando International Business Center Property (as defined below). |
The Loan. The second largest mortgage loan (the “Central Florida Industrial Portfolio Mortgage Loan”) is secured by the borrowers’ fee interest in four industrial properties located in Tampa and Orlando, Florida (the “Central Florida Industrial Portfolio Properties”). The Central Florida Industrial Portfolio Mortgage Loan was originated on April 28, 2023, by KeyBank National Association. The Central Florida Industrial Portfolio Mortgage Loan has a 10-year interest only term and accrues interest at a rate of 6.21000% per annum.
| THE INFORMATION IN THIS STRUCTURAL AND COLLATERAL TERM SHEET IS NOT COMPLETE AND MAY BE AMENDED PRIOR TO THE TIME OF SALE. THIS TERM SHEET IS NOT AN OFFER TO SELL THESE SECURITIES AND IT IS NOT A SOLICITATION OF AN OFFER TO BUY THESE SECURITIES IN ANY JURISDICTION WHERE THE OFFER OR SALE IS NOT PERMITTED. |
| | 23 | |
| Structural and Collateral Term Sheet | | BMO 2023-C5 |
| No. 2 – Central Florida Industrial Portfolio |
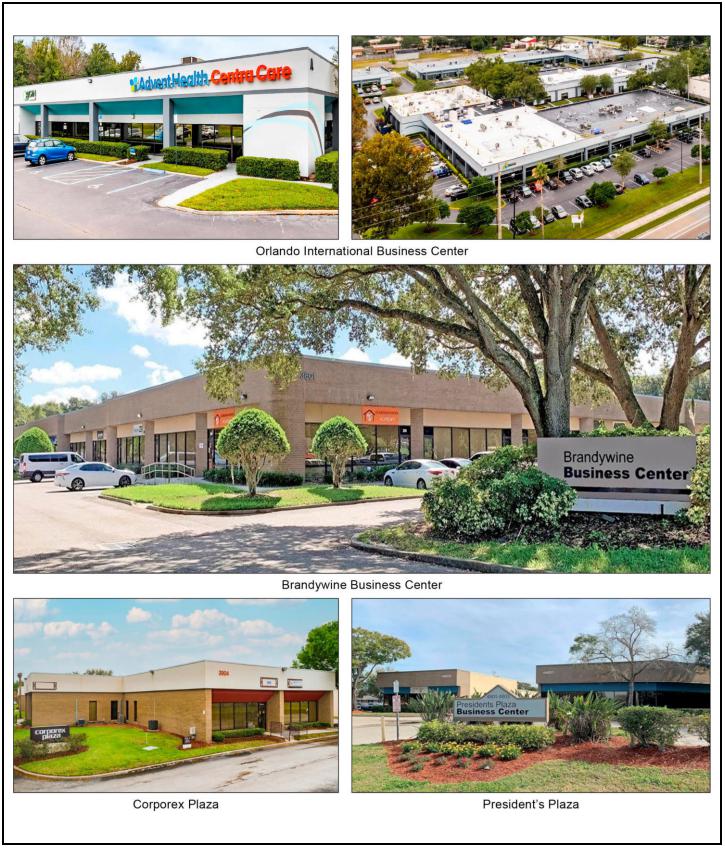
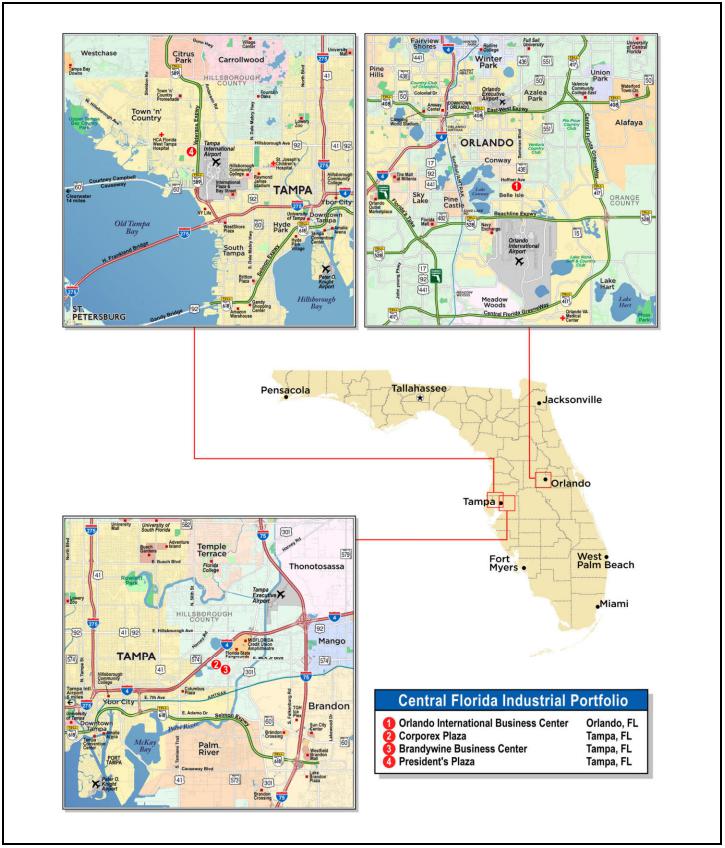
The Properties. The Central Florida Industrial Portfolio Properties consist of four industrial flex properties, with an aggregate of 419,886 square feet. The Central Florida Industrial Portfolio Properties are located in Central Florida, with three properties in Tampa (the “Tampa Properties”) and one property in Orlando. The Central Florida Industrial Portfolio Properties are all multi-tenant with an aggregate of 81 tenants and a portfolio occupancy of 93.5%. No tenant represents more than 10.2% of the portfolio net rentable area or 8.7% of the portfolio underwritten base rent. The Tampa Properties were acquired at origination of the Central Florida Industrial Portfolio Mortgage Loan for a combined purchase price of $33,000,000. The Orlando International Business Center Property was acquired in December 2022 by an affiliate of the borrower sponsor and the membership interests in the Orlando International Business Center Property were subsequently transferred to the DST borrowers for a consideration of $54,500,000. The total combined purchase price of $87,500,000 results in a loan-to-purchase price ratio of 48.3%.
The following table presents certain information relating to the Central Florida Industrial Portfolio Properties:
| Portfolio Summary |
| Property Name | Year Built / Renovated | Net Rentable Area (SF) (1) | Occupancy %(1) | Allocated Loan Amount (“ALA”) | % of ALA | Appraised Value | % of Appraised Value | UW NCF | % of UW NCF |
| Orlando International Business Center | 1983, 1985 / 2022 | 196,228 | 91.1 | % | $22,265,000 | 52.7 | % | $36,500,000 | 51.8 | % | $2,221,740 | 52.8 | % |
| Corporex Plaza | 1984-1985 / NAP | 100,265 | 93.4 | | 9,087,000 | 21.5 | | 15,400,000 | 21.9 | | 911,237 | 21.7 | |
| Brandywine Business Center | 1986 / NAP | 79,124 | 100.0 | | 6,793,000 | 16.1 | | 12,000,000 | 17.0 | | 663,908 | 15.8 | |
| President’s Plaza | 1988 / NAP | 44,269 | 92.3 | | 4,095,000 | 9.7 | | 6,500,000 | 9.2 | | 411,816 | 9.8 | |
| Total | | 419,886 | 93.5 | % | $42,240,000 | 100.0 | % | $70,400,000 | 100.0 | % | $4,208,700 | 100.0 | % |
| (1) | Based on underwritten rent rolls dated as of March 15, 2023, for the Orlando International Business Center Property and as of February 27, 2023, for the Corporex Plaza Property, the Brandywine Business Center Property and the President’s Plaza Property. |
Orlando International Business Center. The “Orlando International Business Center Property” is a 196,228 square foot, industrial flex property containing six, single-story buildings located in southeastern Orlando, Florida, at the intersection of South Semoran Boulevard and Hoffner Avenue. The improvements were constructed in two phases in 1983 and 1985. The buildings contain 80.0% office buildout, with the remaining space primarily used as small-bay warehouse. The Orlando International Business Center Property features a total of 28 drive-in doors with 15 foot clear heights and a total of 536 surface parking spaces. As of March 15, 2023, the Orlando International Business Center Property is 91.1% leased to 44 tenants, with suite sizes ranging from 768 to 13,581 square feet. No tenant occupies more than 6.9% of the net rentable area at the Orlando International Business Center Property.
Corporex Plaza. The “Corporex Plaza Property” is a 100,265 square foot, industrial flex property containing three, single-story buildings located in eastern Tampa, Florida, at the northwest corner of Corporex Park Drive and Lakeview Center Drive. The improvements were constructed between 1984 and 1985. The buildings contain 53.0% office buildout, with the remaining space primarily used as small-bay warehouse. The Corporex Plaza Property features a total of 29 dock-high doors, eight drive-in doors, 15 foot clear heights and a total of 198 surface parking spaces. As of February 27, 2023, the Corporex Plaza Property is 93.4% leased to 23 tenants, with suite sizes ranging from 1,011 to 14,098 square feet. No tenant occupies more than 14.1% of the net rentable area at the Corporex Plaza Property.
Brandywine Business Center. The “Brandywine Business Center Property” is a 79,124 square foot, industrial flex property containing two, single-story buildings located in eastern Tampa, Florida, at the southeast corner of Corporex Park Drive and East MLK Jr. Boulevard. The improvements were constructed in 1986. The flex buildings contain 55.0% office buildout, with the remaining space primarily used as small-bay warehouse. The Brandywine Business Center Property features a total of 20 drive-in doors, 12 dock-high doors, 16 to 18 foot clear heights and a total of 178 surface parking spaces. As of February 27, 2023, the Brandywine Business Center Property is 100.0% leased to seven tenants, with suite sizes ranging from 764 to 33,497 square feet. The largest tenant at the Brandywine Business Center Property is Joffrey’s Coffee and Tea Company (42.3% of property NRA; 10.2% of portfolio NRA), which also occupies space at the Corporex Plaza Property.
President’s Plaza. The “President’s Plaza Property” is a 44,269 square foot, industrial flex property containing two, single-story buildings located in western Tampa, Florida, along the east side of George Road. The improvements were constructed in 1988. The flex buildings contain 74.0% office buildout, with the remaining space primarily used as small-bay warehouse. The President’s Plaza Property features a total of 17 drive-in doors with 14 foot clear heights and a total of 132 surface
| THE INFORMATION IN THIS STRUCTURAL AND COLLATERAL TERM SHEET IS NOT COMPLETE AND MAY BE AMENDED PRIOR TO THE TIME OF SALE. THIS TERM SHEET IS NOT AN OFFER TO SELL THESE SECURITIES AND IT IS NOT A SOLICITATION OF AN OFFER TO BUY THESE SECURITIES IN ANY JURISDICTION WHERE THE OFFER OR SALE IS NOT PERMITTED. |
| | 24 | |
| Structural and Collateral Term Sheet | | BMO 2023-C5 |
| No. 2 – Central Florida Industrial Portfolio |
parking spaces. As of February 27, 2023, the President’s Plaza Property is 92.3% leased to nine tenants, with suite sizes ranging from 1,511 to 8,114 square feet. No tenant occupies more than 18.3% of the net rentable area at the President’s Plaza Property.
Major Tenants.
Joffrey's Coffee and Tea Company (43,031 square feet; 10.2% NRA; 8.7% of underwritten base rent): Joffrey’s Coffee and Tea Company (“Joffrey’s”) is a specialty coffee roaster that produces and sells artisan roasted coffee and tea. Joffrey’s was founded in Tampa in 1984 and currently maintains one flagship retail location in Midtown Tampa. Additionally, Joffrey’s has been the official specialty coffee of Walt Disney World, Disneyland and the Disney Vacation Club since 2012, operating dozens of locations throughout the Disney properties. Joffrey’s offerings include espressos, lattes, cold brew, nitro cold brew, hand-blended teas and specialty beverages. as well as breakfast items and baked goods. Joffrey’s currently leases 33,497 square feet at the Brandywine Business Center Property and 9,534 square feet at the Corporex Plaza Property. Joffrey’s has been a tenant at the Brandywine Business Center Property since 2002, expanding multiple times at that property, and eventually expanding into the Corporex Plaza Property in 2022. The current lease expires May 31, 2026, and has one, five-year extension option remaining. Pursuant to its lease, if Joffrey’s does not renew its contract with The Walt Disney Company by October 31, 2024, then Joffrey’s may exercise a one-time right to terminate 5,304 square feet of its space at the Brandywine Business Center Property provided that it give the lender 30 days’ prior notice.
Acree Air Conditioning, Inc. (16,938 square feet; 4.0% NRA; 3.7% of underwritten base rent): Acree Air Conditioning, Inc. (“Acree”) is a full-service residential air conditioning, heating, plumbing, and electrical contractor providing service to the Tampa Bay area since 1967. Acree utilizes its space as its main office headquarters as well as warehouse space for the intake and distribution of its HVAC units. Acree has been a tenant at the Brandywine Business Center Property since 2005, originally leasing 2,717 square feet and expanding multiple times to reach the 16,938 square feet that Acree currently leases. The current lease expires January 31, 2027, and has two, five-year extension options remaining and no early termination options.
Environmental. According to the Phase I environmental assessments dated between October and November 2022, there was no evidence of any recognized environmental conditions at the Central Florida Industrial Portfolio Properties.
The following table presents certain information relating to the historical and current occupancy of the Central Florida Industrial Portfolio Properties:
| Historical and Current Occupancy |
| 2020(1) | 2021(1) | 2022(1) | Current(2) |
| 86.4% | 94.0% | 94.2% | 93.5% |
| (1) | 2020 and 2021 historical occupancies are as of December 31 of each respective year. 2022 historical occupancy is as of December 31, 2022, for the Orlando International Business Center Property and as of November 15, 2022, for the Tampa Properties. |
| (2) | Current occupancy is based on the underwritten rent rolls dated as of March 15, 2023, for the Orlando International Business Center Property and as of February 27, 2023, for the Corporex Plaza Property, the Brandywine Business Center Property and the President’s Plaza Property. |
| THE INFORMATION IN THIS STRUCTURAL AND COLLATERAL TERM SHEET IS NOT COMPLETE AND MAY BE AMENDED PRIOR TO THE TIME OF SALE. THIS TERM SHEET IS NOT AN OFFER TO SELL THESE SECURITIES AND IT IS NOT A SOLICITATION OF AN OFFER TO BUY THESE SECURITIES IN ANY JURISDICTION WHERE THE OFFER OR SALE IS NOT PERMITTED. |
| | 25 | |
| Structural and Collateral Term Sheet | | BMO 2023-C5 |
| No. 2 – Central Florida Industrial Portfolio |
The following table presents certain information relating to the largest tenants based on net rentable area at the Central Florida Industrial Portfolio Properties:
| Top Tenant Summary(1) |
| Tenant | Property | Ratings
Moody’s/S&P/ Fitch(2) | Net Rentable Area (SF) | % of
Total NRA | UW
Base Rent PSF(3) |
UW
Base Rent(3) | % of Total
UW Base Rent | Lease
Exp. Date |
| Joffrey's | Various(4) | NR/NR/NR | 43,031 | 10.2 | % | $9.58 | $412,213 | 8.7 | % | 5/31/2026(5) |
| Acree | Brandywine Business Center | NR/NR/NR | 16,938 | 4.0 | | $10.44 | 176,811 | 3.7 | | 1/31/2027 |
| Total Renal Care, Inc. | Orlando International Business Center | B1/BB/NR | 14,213 | 3.4 | | $12.39 | 176,065 | 3.7 | | Various(6) |
| Ademco, Inc. | Corporex Plaza | NR/BB+/NR | 14,098 | 3.4 | | $8.20 | 115,540 | 2.4 | | 10/31/2025 |
| MSE Group, LLC | Orlando International Business Center | NR/NR/NR | 13,581 | 3.2 | | $10.76 | 146,132 | 3.1 | | 6/30/2025 |
| Central Florida Regional Workforce Development Board | Orlando International Business Center | NR/NR/NR | 12,363 | 2.9 | | $16.48 | 203,742 | 4.3 | | 9/30/2024 |
| Children's Home Society of FL | Orlando International Business Center | NR/NR/NR | 10,531 | 2.5 | | $11.89 | 125,214 | 2.6 | | 3/31/2027 |
| Vocational Development Group | Orlando International Business Center | NR/NR/NR | 10,399 | 2.5 | | $14.45 | 150,266 | 3.2 | | 3/31/2027 |
| Pharmscript of Florida | Brandywine Business Center | NR/NR/NR | 9,710 | 2.3 | | $12.00 | 116,520 | 2.4 | | 12/31/2026 |
| National Flood Experts, LLC | President’s Plaza | NR/NR/NR | 9,168 | 2.2 | | $12.08 | 110,755 | 2.3 | | 1/31/2027 |
| Major Tenants | | | 154,032 | 36.7 | % | $11.25 | $1,733,257 | 36.4 | % | |
| | | | | | | | | |
| Other Tenants | | | 238,386 | 56.8 | % | $12.71 | $3,030,891 | 63.6 | % | |
| | | | | | | | | |
| Occupied Collateral Total / Wtd. Avg. | | 392,418 | 93.5 | % | $12.14 | $4,764,148 | 100.0 | % | |
| | | | | | | | | |
| Vacant Space | | | 27,468 | 6.5 | % | | | | |
| | | | | | | | | |
| Collateral Total | | | 419,886 | 100.0 | % | | | | |
| | | | | | | | | |
| | | | | | | | | |
| (1) | Based on underwritten rent rolls dated as of March 15, 2023, for the Orlando International Business Center Property and as of February 27, 2023, for the Corporex Plaza Property, the Brandywine Business Center Property and the President’s Plaza Property. |
| (2) | Ratings provided are for the parent company of the entity listed in the “Tenant” field whether or not the parent company guarantees the lease. |
| (3) | UW Base Rent PSF and UW Base Rent include contractual rent steps per the tenants’ lease terms through April 2024 totaling $116,409. |
| (4) | Joffrey’s leases 33,497 square feet at the Brandywine Business Center Property and 9,534 square feet at the Corporex Plaza Property. |
| (5) | If Joffrey’s does not renew its contract with The Walt Disney Company by October 31, 2024, Joffrey’s may exercise a one-time right to terminate 5,304 square feet of its space at the Brandywine Business Center Property provided that it give the lender 30 days’ prior notice. |
| (6) | Total Renal Care, Inc. leases 10,531 square feet with an expiration date of September 30, 2026, and 3,682 square feet with an expiration date of February 28, 2027. |
| THE INFORMATION IN THIS STRUCTURAL AND COLLATERAL TERM SHEET IS NOT COMPLETE AND MAY BE AMENDED PRIOR TO THE TIME OF SALE. THIS TERM SHEET IS NOT AN OFFER TO SELL THESE SECURITIES AND IT IS NOT A SOLICITATION OF AN OFFER TO BUY THESE SECURITIES IN ANY JURISDICTION WHERE THE OFFER OR SALE IS NOT PERMITTED. |
| | 26 | |
| Structural and Collateral Term Sheet | | BMO 2023-C5 |
| No. 2 – Central Florida Industrial Portfolio |
The following table presents certain information relating to the tenant lease expirations at the Central Florida Industrial Portfolio Properties:
| Lease Rollover Schedule(1)(2) |
| Year | Number of Leases Expiring | Net Rentable Area Expiring | % of NRA Expiring | UW Base Rent Expiring(3) | % of UW Base Rent Expiring(3) | Cumulative Net Rentable Area Expiring | Cumulative % of NRA Expiring | Cumulative UW Base Rent Expiring(3) | Cumulative % of UW Base Rent Expiring(3) |
| Vacant | NAP | 27,468 | 6.5 | % | NAP | NA | P | 27,468 | 6.5% | NAP | NAP | |
| 2023 & MTM | 11 | 31,648 | 7.5 | | $416,774 | 8.7 | % | 59,116 | 14.1% | $416,774 | 8.7% | |
| 2024 | 23 | 99,723 | 23.8 | | 1,255,480 | 26.4 | | 158,839 | 37.8% | $1,672,255 | 35.1% | |
| 2025 | 20 | 80,862 | 19.3 | | 957,381 | 20.1 | | 239,701 | 57.1% | $2,629,635 | 55.2% | |
| 2026 | 12 | 98,545 | 23.5 | | 1,071,728 | 22.5 | | 338,246 | 80.6% | $3,701,364 | 77.7% | |
| 2027 | 11 | 61,538 | 14.7 | | 758,619 | 15.9 | | 399,784 | 95.2% | $4,459,983 | 93.6% | |
| 2028 | 3 | 12,669 | 3.0 | | 210,376 | 4.4 | | 412,453 | 98.2% | $4,670,359 | 98.0% | |
| 2029 | 1 | 3,031 | 0.7 | | 34,099 | 0.7 | | 415,484 | 99.0% | $4,704,457 | 98.7% | |
| 2030 | 1 | 4,402 | 1.0 | | 59,691 | 1.3 | | 419,886 | 100.0% | $4,764,148 | 100.0% | |
| 2031 | 0 | 0 | 0.0 | | 0 | 0.0 | | 419,886 | 100.0% | $4,764,148 | 100.0% | |
| 2032 | 0 | 0 | 0.0 | | 0 | 0.0 | | 419,886 | 100.0% | $4,764,148 | 100.0% | |
| 2033 | 0 | 0 | 0.0 | | 0 | 0.0 | | 419,886 | 100.0% | $4,764,148 | 100.0% | |
| 2034 & Beyond | 0 | 0 | 0.0 | | 0 | 0.0 | | 419,886 | 100.0% | $4,764,148 | 100.0% | |
| Total | 82 | 419,886 | 100.0 | % | $4,764,148 | 100.0 | % | | | | |
| (1) | Based on underwritten rent rolls dated as of March 15, 2023, for the Orlando International Business Center Property and as of February 27, 2023, for the Corporex Plaza Property, the Brandywine Business Center Property and the President’s Plaza Property. |
| (2) | Certain leases may have termination options that are exercisable prior to the originally stated expiration date of the lease and that are not considered in this Lease Rollover Schedule. |
| (3) | UW Base Rent Expiring, % of UW Base Rent Expiring, Cumulative UW Base Rent Expiring and Cumulative % of UW Base Rent Expiring include contractual rent steps per the tenants’ lease terms through April 2024 totaling $116,409. |
The following table presents certain information relating to the operating history and underwritten cash flows of the Central Florida Industrial Portfolio Properties:
| Operating History and Underwritten Net Cash Flow(1) |
| | 2021 | Underwritten | Per Square Foot | %(2) | |
| Rents in Place(3) | $4,205,206 | $4,764,148 | $11.35 | | 57.7 | % |
| Vacant Income | 0 | 380,221 | 0.91 | | 4.6 | |
| Gross Potential Rent | $4,205,206 | $5,144,369 | $12.25 | | 62.3 | % |
| Total Reimbursements | 1,482,701 | 3,107,341 | 7.40 | | 37.7 | |
| Net Rental Income | $5,687,908 | $8,251,710 | $19.65 | | 100.0 | % |
| Other Income(4) | 41,601 | 6,000 | 0.01 | | 0.1 | |
| (Vacancy/Credit Loss) | 0 | (702,825) | (1.67) | | (8.5 | ) |
| Effective Gross Income | $5,729,508 | $7,554,885 | $17.99 | | 91.6 | % |
| Total Expenses | $1,792,389 | $3,200,036 | $7.62 | | 42.4 | % |
| Net Operating Income | $3,937,119 | $4,354,850 | $10.37 | | 57.6 | % |
| Total TI/LC, Capex/RR(5) | 0 | 146,150 | 0.35 | | 1.9 | |
| Net Cash Flow | $3,937,119 | $4,208,700 | $10.02 | | 55.7 | % |
| (1) | With the exception of the 2021 financials, historical financials were not provided by the sellers of Central Florida Industrial Portfolio Properties. |
| (2) | % column represents percent of Net Rental Income for all revenue lines and represents percent of Effective Gross Income for the remainder of fields. |
| (3) | Underwritten Rents in Place includes contractual rent steps per the tenants’ lease terms through April 2024 totaling $116,409. |
| (4) | 2021 Other Income represents lates fees and miscellaneous income. Underwritten Other Income represents income from a billboard leased to Outfront Media at the Orlando International Business Center Property. |
| (5) | Total TI/LC, Capex/RR includes a credit of $387,500 (approximately $0.92 per square foot) associated with the upfront TI/LC reserve and replacement reserve deposits in the aggregate amount of $3,875,000 (approximately $9.23 per square foot). |
| THE INFORMATION IN THIS STRUCTURAL AND COLLATERAL TERM SHEET IS NOT COMPLETE AND MAY BE AMENDED PRIOR TO THE TIME OF SALE. THIS TERM SHEET IS NOT AN OFFER TO SELL THESE SECURITIES AND IT IS NOT A SOLICITATION OF AN OFFER TO BUY THESE SECURITIES IN ANY JURISDICTION WHERE THE OFFER OR SALE IS NOT PERMITTED. |
| | 27 | |
| Structural and Collateral Term Sheet | | BMO 2023-C5 |
| No. 2 – Central Florida Industrial Portfolio |
The Markets. The Central Florida Industrial Portfolio Properties are located across the Tampa-St. Petersburg-Clearwater, FL metropolitan statistical area (three properties; 53.3% of NRA; 48.3% of underwritten base rent) and the Orlando-Kissimmee-Sanford metropolitan statistical area (one property; 46.7% of NRA; 51.7% of underwritten base rent).
The Tampa metropolitan area is a four-county area comprised of approximately 3.1 million residents, making it the second largest metropolitan area in the state of Florida. In recent years, Tampa has experienced above-average levels of in-migration, particularly with the in-migration of the working-age population. According to the appraisal, Tampa has added 100,000 new workers to its labor force since early 2020. Major employment sectors driving the economy include financial services, health, hospitality, and retail sectors. The largest employers in the area include BayCare Health System, Publix Super Markets, Inc., Hillsborough County School District and HCA West Florida Division.
The Orlando economy has recently been fueled by steady in-migration and a 1.8% annual population growth rate over the past five years, which is above the national average of 0.4% for the same time period. Orlando benefits from a growing roster of technology and financial technology companies, the established and expanding defense sector, as well as the presence of multiple theme parks and tourist destinations. Employment has seen year-over-year growth in leisure and hospitality, manufacturing, trade, transportation and utilities, and professional and business services. Major private employers in Orlando include Walt Disney World Resort, AdventHealth, Universal Studios Florida, Orlando Health, and Publix Super Markets, Inc.
The following table presents certain market information with respect to the Central Florida Industrial Portfolio Properties:
| Market Area Summary(1) |
| Property Name | Market | Submarket | Submarket Vacancy | UW Base Rent PSF | Market Rental Rate PSF |
| Orlando International Business Center | Orlando | SE Orange County | 6.1% | $13.78 | $15.08 |
| Corporex Plaza | Tampa | East Tampa | 4.6% | $10.72 | $13.17 |
| Brandywine Business Center | Tampa | East Tampa | 4.6% | $10.67 | $13.17 |
| President’s Plaza | Tampa | NW Hillsborough | 4.4% | $11.09 | $16.00 |
| (1) | Source: Appraisals as of the fourth quarter of 2022. |
The Borrowers. The borrowers are Small Bay I Orlando DST, Small Bay I Corporex DST, Small Bay I Presidents DST and Small Bay I Brandywine DST, each a Delaware statutory trust with a Delaware trustee and one independent trustee that satisfies the requirements of an independent director. The borrowers have master leased each of the Central Florida Industrial Portfolio Properties to four master tenants (individually and collectively, the “Master Tenant”) affiliated with the guarantor. Each Master Tenant’s interest in all tenant rents was assigned to the applicable borrower and the borrowers then assigned their interest in all tenant rents to the lender pursuant to a tenant landlord subordination agreement (the “Tenant Subordination Agreement”). The master lease is subordinate to the Central Florida Industrial Portfolio Mortgage Loan and, upon an event of default under the Central Florida Industrial Portfolio Mortgage Loan documents, the lender has the right to cause the termination of the master lease. Counsel to the borrowers provided a non-consolidation opinion in connection with the origination of the Central Florida Industrial Portfolio Mortgage Loan. See “Description of the Mortgage Pool—Statistical Characteristics of the Mortgage Pool—Delaware Statutory Trusts” in the Preliminary Prospectus.
The Borrower Sponsor. The nonrecourse carve-out guarantor is Highland Income Fund, a closed-end fund managed by NexPoint Asset Management, L.P. The borrower sponsor is NexPoint Real Estate Advisors, L.P. (“NexPoint”), an alternative investment platform comprised of a group of investment advisors and sponsors, a broker-dealer, and other related investment vehicles. NexPoint has over $13.3 billion in assets under management and has been involved in $18.4 billion in real estate transactions. NexPoint’s real estate investment expertise includes experience across a range of property types, including multifamily, single-tenant rental, office and retail, self-storage, and hospitality.
Property Management. The Central Florida Industrial Portfolio Properties are managed by WMG Small Bay Management, LLC.
| THE INFORMATION IN THIS STRUCTURAL AND COLLATERAL TERM SHEET IS NOT COMPLETE AND MAY BE AMENDED PRIOR TO THE TIME OF SALE. THIS TERM SHEET IS NOT AN OFFER TO SELL THESE SECURITIES AND IT IS NOT A SOLICITATION OF AN OFFER TO BUY THESE SECURITIES IN ANY JURISDICTION WHERE THE OFFER OR SALE IS NOT PERMITTED. |
| | 28 | |
| Structural and Collateral Term Sheet | | BMO 2023-C5 |
| No. 2 – Central Florida Industrial Portfolio |
Escrows and Reserves. At origination, the borrowers deposited into escrow $3,500,000 for tenant improvements and leasing commissions, approximately $467,442 for real estate taxes, $375,000 for replacement reserves, approximately $348,474 for insurance premiums, $228,190 for outstanding tenant improvement obligations, $100,813 for immediate repairs and $49,545 for rent concessions.
Tax Escrows – On a monthly basis, the borrowers are required to escrow 1/12th of the annual estimated tax payments, which currently equates to approximately $66,778.
Insurance Escrows – On a monthly basis, the borrowers are required to escrow 1/12th of the premiums payable during the next 12 months, which currently equates to approximately $62,504.
Replacement Reserve – On the next ensuing payment date after the balance of the replacement reserve falls below $375,000 and on each payment date thereafter until the balance of the replacement reserve is at least $375,000, the borrowers will pay (or cause the applicable Master Tenant to pay) into escrow monthly the amount of approximately $5,249 for replacement reserves (equal to approximately $0.15 per square foot annually).
TI/LC Reserve – On the next ensuing payment date after the balance of the TI/LC reserve falls below $1,000,000 and on each payment date thereafter until the balance of the replacement reserve is at least $3,500,000 (the “TI/LC Reserve Cap”), the borrowers will pay (or cause the applicable Master Tenant to pay) into escrow monthly the amount of $31,492 for TI/LC reserves (equal to approximately $0.90 per square foot annually). Following the balance of the TI/LC reserve reaching the TI/LC Reserve Cap, monthly reserve payments will resume at any time the balance of the TI/LC reserve falls below TI/LC Reserve Cap.
Lockbox / Cash Management. The Central Florida Industrial Portfolio Mortgage Loan is structured with a hard lockbox and in place cash management. In connection with the origination of the Central Florida Industrial Portfolio Mortgage Loan, the borrowers delivered tenant instruction letters requiring the Master Tenant to deposit all rents payable under the master leases into the clearing account controlled by the lender. Notwithstanding the foregoing, the Master Tenant is required to deposit all revenues otherwise received into the clearing account within two business days of receipt. All sums on deposit in the clearing account are required to be transferred on each business day to a cash management account controlled by the lender and are required to be applied and disbursed in accordance with the Central Florida Industrial Portfolio Mortgage Loan documents. Upon the occurrence and during the continuance of a Cash Sweep Period, any excess cash is required to be held by the lender as additional security for the Central Florida Industrial Portfolio Mortgage Loan. Pursuant to the Tenant Subordination Agreement, upon the occurrence of an event of default under the Central Florida Industrial Portfolio Mortgage Loan documents, the lender is entitled to mandate the use of lockbox accounts or other depository accounts in the name of the Master Tenant to be maintained under the control and supervision of the lender, for all income of the Central Florida Industrial Portfolio Properties, including all rents, service charges and insurance payments.
A “Cash Sweep Period” will commence upon: (i) the occurrence of an event of default under the Central Florida Industrial Portfolio Mortgage Loan documents and will continue until such event of default is cured; (ii) the occurrence of any bankruptcy action of the borrowers, principal (which is the signatory trustee while the borrowers are a Delaware statutory trust) or master DST (in no event will a Cash Sweep Period due to a bankruptcy action of the borrowers, principal or master DST be cured); (iii) the occurrence of any bankruptcy action of the property manager, and will continue until the borrowers or Master Tenants replace the property manager with a qualified manager under a replacement management agreement within 60 days of such bankruptcy action and such parties simultaneously enter into a replacement assignment of management agreement; or (iv) the date on which the amortizing debt service coverage ratio as calculated in accordance with the Central Florida Industrial Portfolio Mortgage Loan documents based on the trailing three-month period is less than 1.15x and will continue until the amortizing debt service coverage ratio based on the trailing three-month period is at least 1.20x for two consecutive quarters.
Subordinate Debt. None.
Mezzanine Debt. None.
| THE INFORMATION IN THIS STRUCTURAL AND COLLATERAL TERM SHEET IS NOT COMPLETE AND MAY BE AMENDED PRIOR TO THE TIME OF SALE. THIS TERM SHEET IS NOT AN OFFER TO SELL THESE SECURITIES AND IT IS NOT A SOLICITATION OF AN OFFER TO BUY THESE SECURITIES IN ANY JURISDICTION WHERE THE OFFER OR SALE IS NOT PERMITTED. |
| | 29 | |
| Structural and Collateral Term Sheet | | BMO 2023-C5 |
| No. 2 – Central Florida Industrial Portfolio |
Partial Release. At any time after the date that is two years after the closing date of the BMO 2023-C5 securitization trust, and prior to February 2, 2033, the borrowers may obtain the release of one or more of the Central Florida Industrial Portfolio Properties, provided that, among other things, (i) no event of default has occurred and is continuing, (ii) the borrowers defease a portion of the Central Florida Industrial Portfolio Mortgage Loan equal to 120% of the allocated loan amount of the property being released, (iii) the debt service coverage ratio for the remaining properties following the release based on the immediately preceding trailing 12 month period is equal to or greater than the greater of (a) the amortizing debt service coverage ratio based on the trailing 12 month period immediately preceding such release and (b) 1.35x, and (iv) the loan-to-value ratio after giving effect to such release is equal to or less than 50%.
Ground Lease. None.
| THE INFORMATION IN THIS STRUCTURAL AND COLLATERAL TERM SHEET IS NOT COMPLETE AND MAY BE AMENDED PRIOR TO THE TIME OF SALE. THIS TERM SHEET IS NOT AN OFFER TO SELL THESE SECURITIES AND IT IS NOT A SOLICITATION OF AN OFFER TO BUY THESE SECURITIES IN ANY JURISDICTION WHERE THE OFFER OR SALE IS NOT PERMITTED. |
| | 30 | |
| Structural and Collateral Term Sheet | | BMO 2023-C5 |
| No. 3 – Hyatt Regency Indianapolis |

| THE INFORMATION IN THIS STRUCTURAL AND COLLATERAL TERM SHEET IS NOT COMPLETE AND MAY BE AMENDED PRIOR TO THE TIME OF SALE. THIS TERM SHEET IS NOT AN OFFER TO SELL THESE SECURITIES AND IT IS NOT A SOLICITATION OF AN OFFER TO BUY THESE SECURITIES IN ANY JURISDICTION WHERE THE OFFER OR SALE IS NOT PERMITTED. |
| | 31 | |
| Structural and Collateral Term Sheet | | BMO 2023-C5 |
| No. 3 – Hyatt Regency Indianapolis |
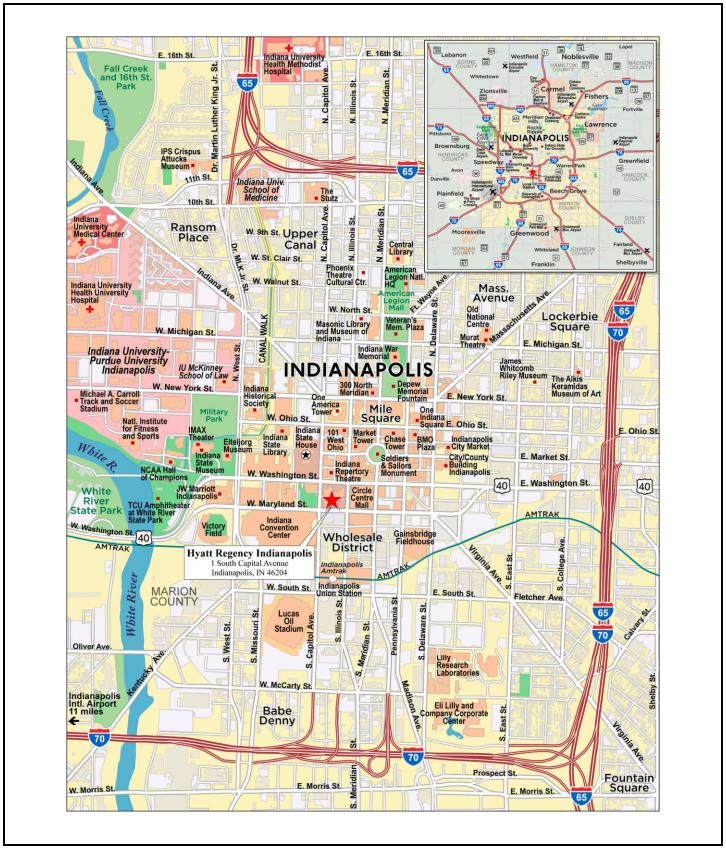
| THE INFORMATION IN THIS STRUCTURAL AND COLLATERAL TERM SHEET IS NOT COMPLETE AND MAY BE AMENDED PRIOR TO THE TIME OF SALE. THIS TERM SHEET IS NOT AN OFFER TO SELL THESE SECURITIES AND IT IS NOT A SOLICITATION OF AN OFFER TO BUY THESE SECURITIES IN ANY JURISDICTION WHERE THE OFFER OR SALE IS NOT PERMITTED. |
| | 32 | |
| Structural and Collateral Term Sheet | | BMO 2023-C5 |
| No. 3 – Hyatt Regency Indianapolis |
| Mortgage Loan Information | | Property Information |
| Mortgage Loan Seller: | CREFI | | Single Asset / Portfolio: | Single Asset |
| Original Principal Balance(1): | $40,000,000 | | Title: | Fee |
| Cut-off Date Principal Balance(1): | $39,943,123 | | Property Type - Subtype: | Hospitality – Full Service |
| % of Pool by IPB: | 6.0% | | Net Rentable Area (Rooms): | 499 |
| Loan Purpose: | Refinance | | Location: | Indianapolis, IN |
| Borrower: | CP Indy DT, LLC | | Year Built / Renovated: | 1977 / 2020 |
| Borrower Sponsors: | William J. Yung III, Martha Yung, | | Occupancy / ADR / RevPAR: | 63.4% / $174.52 / $110.66 |
| | William J. Yung IV, Joseph A. Yung, | | Occupancy / ADR / RevPAR Date: | TTM 2/28/2023 |
| | Julie A. Haught, Judith A. Yung, | | 4th Most Recent NOI (As of): | ($811,821) (12/31/2020) |
| | Jennifer A. Yung, Michelle M. | | 3rd Most Recent NOI (As of): | $4,488,072 (12/31/2021) |
| | Christensen and Scott A. Yung | | 2nd Most Recent NOI (As of): | $9,119,802 (12/31/2022) |
| Interest Rate: | 7.08000% | | Most Recent NOI (As of): | $9,085,755 (TTM 2/28/2023) |
| Note Date: | 4/5/2023 | | UW Occupancy / ADR / RevPAR: | 63.4% / $174.52 / $110.66 |
| Maturity Date: | 4/6/2033 | | UW Revenues: | $32,008,192 |
| Interest-only Period: | None | | UW Expenses: | $22,967,684 |
| Original Term: | 120 months | | UW NOI: | $9,040,508 |
| Original Amortization Term: | 360 months | | UW NCF: | $7,760,180 |
| Amortization Type: | Amortizing Balloon | | Appraised Value / Per Room: | $140,900,000 / $282,365 |
| Call Protection(2): | L(26),D(90),O(4) | | Appraisal Date: | 2/2/2023 |
| Lockbox / Cash Management: | Hard / Springing | | | |
| Additional Debt(1): | Yes | | | |
| Additional Debt Balance(1): | $18,573,552 | | | |
| Additional Debt Type(1): | Pari Passu | | | |
| | | | | |
| Escrows and Reserves(3) | | Financial Information(1) |
| | Initial | Monthly | Initial Cap | | Cut-off Date Loan / Room: | $117,268 |
| Taxes: | $157,268 | $157,268 | N/A | | Maturity Date Loan / Room: | $102,665 |
| Insurance: | $0 | Springing | N/A | | Cut-off Date LTV: | 41.5% |
| FF&E Reserve: | $0 | $106,694 | N/A | | Maturity Date LTV: | 36.4% |
| Immediate Repairs: | $72,600 | $0 | N/A | | UW NCF DSCR: | 1.65x |
| Other Reserve(4): | $127,022 | $27,945 | N/A | | UW NOI Debt Yield: | 15.4% |
| | | | | | | |
| Sources and Uses |
| Sources | Proceeds | % of Total | | Uses | Proceeds | % of Total |
| Whole Loan | $58,600,000 | 70.2 | % | | Loan Payoff | $81,937,533 | 98.2 | % |
| Borrower Sponsor Equity | 24,877,326 | 29.8 | | | Closing Costs | 1,182,903 | 1.4 | |
| | | | | | Upfront Reserves | 356,890 | 0.4 | |
| | | | | | | | |
| Total Sources | $83,477,326 | 100.0 | % | | Total Uses | $83,477,326 | 100.0 | % |
| (1) | The Hyatt Regency Indianapolis Mortgage Loan (as defined below) is part of the Hyatt Regency Indianapolis Whole Loan (as defined below), which is comprised of two pari passu promissory notes with an aggregate original balance of $58,600,000. The Hyatt Regency Indianapolis Whole Loan was originated by Citi Real Estate Funding Inc. (“CREFI”). For additional information, see “The Loan” below. The financial information presented above is calculated based on the Hyatt Regency Indianapolis Whole Loan. |
| (2) | Defeasance of the Hyatt Regency Indianapolis Whole Loan is permitted at any time after the earlier to occur of (a) the end of the two-year period commencing on the closing date of the securitization of the last promissory note representing a portion of the Hyatt Regency Indianapolis Whole Loan to be securitized and (b) April 5, 2027. The assumed defeasance lockout period of 26 payments is based on the anticipated closing date of the BMO 2023-C5 securitization trust in June 2023. The actual lockout period may be longer. |
| (3) | For full description of Escrows and Reserves, see “Escrows and Reserves” below. |
| (4) | Other Reserves include an initial seasonality reserve of $127,022, an initial monthly seasonality reserve of $27,945, and a springing PIP reserve. See “Escrows and Reserves” below. |
| THE INFORMATION IN THIS STRUCTURAL AND COLLATERAL TERM SHEET IS NOT COMPLETE AND MAY BE AMENDED PRIOR TO THE TIME OF SALE. THIS TERM SHEET IS NOT AN OFFER TO SELL THESE SECURITIES AND IT IS NOT A SOLICITATION OF AN OFFER TO BUY THESE SECURITIES IN ANY JURISDICTION WHERE THE OFFER OR SALE IS NOT PERMITTED. |
| | 33 | |
| Structural and Collateral Term Sheet | | BMO 2023-C5 |
| No. 3 – Hyatt Regency Indianapolis |
The Loan. The third largest mortgage loan (the “Hyatt Regency Indianapolis Mortgage Loan”) is part of a whole loan (the “Hyatt Regency Indianapolis Whole Loan”) evidenced by two pari passu promissory notes in the aggregate original principal amount of $58,600,000 secured by a first lien mortgage on the borrower’s fee simple interest in a 499-room full-service hospitality property located in Indianapolis, Indiana (the “Hyatt Regency Indianapolis Property”). The Hyatt Regency Indianapolis Whole Loan was originated on April 5, 2023 by CREFI and has 10-year term that amortizes on a 30-year amortization schedule and accrues interest at a fixed rate of 7.08000% per annum. The scheduled maturity date of the Hyatt Regency Indianapolis Whole Loan is the due date that occurs on April 6, 2033. The Hyatt Regency Indianapolis Mortgage Loan is evidenced by the controlling Note A-1, with an outstanding principal balance as of the Cut-off Date of $39,943,123. The Hyatt Regency Indianapolis Mortgage Loan will be serviced pursuant to the pooling and servicing agreement for the BMO 2023-C5 securitization. The table below summarizes the promissory notes that comprise the Hyatt Regency Indianapolis Whole Loan. See “Description of the Mortgage Pool—The Whole Loans—The Serviced Pari Passu Whole Loans” in the Preliminary Prospectus.
| Whole Loan Summary |
| Note | Original Balance | Cut-off Date Balance | Note Holder | Controlling Piece |
| A-1 | $40,000,000 | $39,943,123 | BMO 2023-C5 | Yes |
| A-2 | $18,600,000 | $18,573,552 | CREFI(1) | No |
| Whole Loan | $58,600,000 | $58,516,675 | | |
| (1) | Expected to be contributed to one or more future securitization transactions. |
The Property. The Hyatt Regency Indianapolis Property is a 22-story, 499-room, full-service hotel with four on-site food and beverage outlets located in downtown Indianapolis, Indiana. The Hyatt Regency Indianapolis Property was originally constructed in 1977 and recently underwent an $8.8 million renovation between 2018 and 2020. Renovations included new finishes for all rooms at the Hyatt Regency Indianapolis Property along with renovations to the ballrooms and meeting spaces on the second and third floors. The Hyatt Regency Indianapolis Property features access to the Circle Centre Mall and Indiana Convention Center via an elevated skywalk and has access to the Indianapolis International Airport, which is approximately 13 miles southwest of the property, via Interstate 70. According to a third-party market research report, the estimated demand segmentation for the Hyatt Regency Indianapolis Property consisted of 52.1% meeting and group, 28.1% leisure, and 19.8% contract.
The Hyatt Regency Indianapolis Property contains 249 king guestrooms, 247 double queen guestrooms, and three suites. Amenities at the Hyatt Regency Indianapolis Property include approximately 29,662 square feet of meeting space, three bars and restaurants, a business center, indoor swimming pool, and fitness center. On-site services at the Hyatt Regency Indianapolis Property include valet parking, room service, concierge service, and laundry and dry cleaning. The food and beverage outlets at the Hyatt Regency Indianapolis Property include the Fat Rooster, a freshly-sourced farm to table diner that serves breakfast and lunch, The Eagle’s Nest, a rooftop restaurant with a 360° view of downtown Indianapolis, Level One, a ground floor cocktail lounge, bar and restaurant, and a Starbucks coffee shop located in the lobby.
The franchise agreement between the borrower and Hyatt Franchising, L.L.C., a Delaware limited liability company (“Hyatt”), commenced on April 4, 2018 and expires on April 4, 2038. Among other things, the franchise agreement requires the borrower to pay Hyatt, on a monthly basis, a royalty fee of 6.0% of gross room revenue and 3.0% of gross food and beverage revenue.
The following table presents certain information relating to the 2023 demand analysis with respect to the Hyatt Regency Indianapolis Property based on market segmentation, as provided by a third-party market research report for the Hyatt Regency Indianapolis Property:
| Demand Segmentation(1) |
| Property | Rooms | Meeting & Group | Transient | Contract |
| Hyatt Regency Indianapolis | 499 | 52.1% | 28.1% | 19.8% |
| (1) | Source: February 2023 third party market research report. |
| THE INFORMATION IN THIS STRUCTURAL AND COLLATERAL TERM SHEET IS NOT COMPLETE AND MAY BE AMENDED PRIOR TO THE TIME OF SALE. THIS TERM SHEET IS NOT AN OFFER TO SELL THESE SECURITIES AND IT IS NOT A SOLICITATION OF AN OFFER TO BUY THESE SECURITIES IN ANY JURISDICTION WHERE THE OFFER OR SALE IS NOT PERMITTED. |
| | 34 | |
| Structural and Collateral Term Sheet | | BMO 2023-C5 |
| No. 3 – Hyatt Regency Indianapolis |
The following tables present certain information relating to the current and historical occupancy, ADR and RevPAR at the Hyatt Regency Indianapolis Property and its competitors:
| Historical Occupancy, ADR, RevPAR(1) |
| | Competitive Set(2) | Hyatt Regency Indianapolis(3) | Penetration Factor(4) |
| Year | Occupancy | ADR | RevPAR | Occupancy | ADR | RevPAR | Occupancy | ADR | RevPAR |
| 2019 | 70.9% | $166.13 | $117.76 | 74.7% | $158.37 | $118.24 | 105.3% | 95.3% | 100.4% |
| 2020 | 22.1% | $146.79 | $32.42 | 23.2% | $142.44 | $33.12 | 105.3% | 97.0% | 102.1% |
| 2021 | 40.3% | $153.42 | $61.90 | 41.6% | $157.23 | $65.38 | 103.1% | 102.5% | 105.6% |
| 2022 | 57.3% | $180.84 | $103.60 | 62.5% | $174.09 | $108.81 | 109.1% | 96.3% | 105.0% |
| TTM(5) | 58.6% | $179.14 | $104.98 | 63.4% | $174.52 | $110.66 | 108.2% | 97.4% | 105.4% |
| (1) | Variances between the underwriting, the appraisal and the above table with respect to Occupancy, ADR and RevPAR at the Hyatt Regency Indianapolis Property are attributable to variances in reporting methodologies and/or timing differences. |
| (2) | Occupancy, ADR and RevPAR for the Competitive Set are based on data provided by a third-party hospitality research report. The Competitive Set includes Embassy Suites by Hilton Indianapolis Downtown, Sheraton Hotel Indianapolis City Centre, Crowne Plaza Indianapolis Union Station, Westin Indianapolis, Omni Severin Hotel, Hilton Indianapolis Hotel & Suites and Marriott Indianapolis Downtown. |
| (3) | Occupancy, ADR and RevPAR for the Hyatt Regency Indianapolis Property are based on the underwritten cash flow. |
| (4) | Penetration Factor is calculated based on the underwritten cash flow and competitive set data provided by a third-party hospitality research report. |
| (5) | TTM represents the trailing 12-month period ending February 28, 2023. |
Environmental. According to the Phase I environmental assessment dated February 14, 2023, there was no evidence of any recognized environmental conditions at the Hyatt Regency Indianapolis Property.
The following table presents certain information relating to the operating history and underwritten cash flows of the Hyatt Regency Indianapolis Property:
| Operating History and Underwritten Net Cash Flow |
| | 2019 | 2020 | 2021 | 2022 | TTM(1) | Underwritten | Per Room(2) | %(3) |
| Occupancy | 74.7% | 23.2% | 41.6% | 62.5% | 63.4% | 63.4% | | |
| ADR | $158.37 | $142.44 | $157.23 | $174.09 | $174.52 | $174.52 | | |
| RevPAR | $118.24 | $33.12 | $65.38 | $108.81 | $110.66 | $110.66 | | |
| | | | | | | | | |
| Room Revenue | $21,534,812 | $6,048,157 | $11,907,876 | $19,818,964 | $20,154,861 | $20,154,861 | $40,391 | 63.0 | % |
| Food & Beverage Revenue | 11,046,617 | 3,784,081 | 6,348,723 | 10,247,693 | 10,588,783 | 10,588,783 | 21,220 | 33.1 | |
| Other Revenue(4) | 1,281,613 | 664,063 | 2,103,520 | 1,445,757 | 1,264,549 | 1,264,549 | 2,534 | 4.0 | |
| Total Revenue | $33,863,043 | $10,496,300 | $20,360,119 | $31,512,414 | $32,008,192 | $32,008,192 | $64,145 | 100.0 | % |
| | | | | | | | | |
| Room Expense | $5,723,701 | $2,357,703 | $3,684,138 | $5,849,102 | $5,883,080 | $5,883,080 | $11,790 | 29.2 | % |
| Food & Beverage Expense | 5,906,930 | 2,079,822 | 3,330,180 | 4,971,812 | 5,187,253 | 5,187,253 | 10,395 | 49.0 | |
| Other Departmental Expenses | 10,858 | 29,250 | 0 | 0 | 304 | 304 | 1 | 0.0 | |
| Departmental Expenses | $11,641,489 | $4,466,776 | $7,014,319 | $10,820,914 | $11,070,638 | $11,070,638 | $22,186 | 34.6 | % |
| | | | | | | | | |
| Departmental Profit | $22,221,554 | $6,029,525 | $13,345,801 | $20,691,500 | $20,937,554 | $20,937,554 | $41,959 | 65.4 | % |
| | | | | | | | | |
| Management Fee | $970,673 | $301,418 | $564,063 | $912,253 | $927,932 | $960,246 | $1,924 | 3.0 | % |
| Marketing and Franchise Fee | 4,041,014 | 1,573,706 | 1,912,464 | 3,232,381 | 3,379,527 | 3,377,471 | 6,768 | 10.6 | |
| Other Undistributed Expenses | 5,066,045 | 3,000,133 | 4,144,627 | 5,192,774 | 5,296,826 | 5,296,826 | 10,615 | 16.5 | |
| Total Undistributed Expenses | $10,077,731 | $4,875,257 | $6,621,154 | $9,337,408 | $9,604,285 | $9,634,543 | $19,308 | 30.1 | % |
| | | | | | | | | |
| Real Estate Taxes | $2,082,043 | $1,609,414 | $1,857,752 | $1,808,486 | $1,808,486 | $1,873,945 | $3,755 | 5.9 | % |
| Property Insurance | 463,166 | 356,675 | 378,823 | 425,804 | 439,028 | 388,559 | 779 | 1.2 | |
| Net Operating Income | $9,598,614 | ($811,821) | $4,488,072 | $9,119,802 | $9,085,755 | $9,040,508 | $18,117 | 28.2 | % |
| | | | | | | | | |
| FF&E | 1,354,522 | 419,852 | 814,405 | 1,260,497 | 1,280,328 | 1,280,328 | 2,566 | 4.0 | % |
| Net Cash Flow | $8,244,092 | ($1,231,673) | $3,673,667 | $7,859,305 | $7,805,427 | $7,760,180 | $15,551 | 24.2 | % |
| (1) | TTM represents the trailing 12-month period ending February 28, 2023. |
| (2) | Per Room values are based on 499 rooms. |
| (3) | % column represents percent of Total Revenue except for Room Expense, Food & Beverage Expense and Other Departmental Expenses which are based on their corresponding revenue line items. |
| (4) | Other Revenue includes parking, internet and telephone revenue, wedding/event services, valet revenue, office & building rental, club membership fees, and vending sales and commissions. |
| THE INFORMATION IN THIS STRUCTURAL AND COLLATERAL TERM SHEET IS NOT COMPLETE AND MAY BE AMENDED PRIOR TO THE TIME OF SALE. THIS TERM SHEET IS NOT AN OFFER TO SELL THESE SECURITIES AND IT IS NOT A SOLICITATION OF AN OFFER TO BUY THESE SECURITIES IN ANY JURISDICTION WHERE THE OFFER OR SALE IS NOT PERMITTED. |
| | 35 | |
| Structural and Collateral Term Sheet | | BMO 2023-C5 |
| No. 3 – Hyatt Regency Indianapolis |
The Market. The Hyatt Regency Indianapolis Property is located on the corner of South Capitol Avenue and Washington Street in downtown Indianapolis, Indiana and is part of the Indianapolis-Carmel-Anderson metropolitan statistical area. The Hyatt Regency Indianapolis Property is connected via skywalks to the Circle Centre Mall and Indiana Convention Center and is approximately 0.4 miles from Lucas Oil Stadium. Nearby demand generators for the Hyatt Regency Indianapolis Property include Lucas Oil Stadium, IUPUI, Victory Field, White River State Park, Central Canal, Indiana State Museum, the Eiteljorg Museum, and the Indianapolis Zoo. The Hyatt Regency Indianapolis Property benefits from access to Interstate 70 and the Indianapolis International Airport, which is approximately 13 miles southwest of the property.
The following table presents certain information relating to the primary competition for the Hyatt Regency Indianapolis Property:
| Competitive Set(1) |
| Property | Number of Rooms | Year Built | Estimated
2022 Occupancy | Estimated
2022 ADR | Estimated
2022 RevPAR |
| Hyatt Regency Indianapolis(2) | 499 | 1977 | 62.5% | $174.09 | $108.81 |
| Embassy Suites by Hilton Indianapolis Downtown | 360 | 1985 | 55.0% - 60.0% | $175.00 - $180.00 | $100.00 - $105.00 |
| Sheraton Hotel Indianapolis City Centre | 378 | 1975 | 55.0% - 60.0% | $160.00 - $165.00 | $90.00 - $95.00 |
| Crowne Plaza Indianapolis Union Station | 273 | 1986 | 55.0% - 60.0% | $155.00 - $160.00 | $85.00 - $90.00 |
| Westin Indianapolis | 574 | 1989 | 60.0% - 65.0% | $190.00 - $195.00 | $120.00 - $125.00 |
| Omni Severin Hotel | 424 | 1913 | 45.0% - 50.0% | $175.00 - $180.00 | $85.00 - $90.00 |
| Hilton Indianapolis Hotel & Suites | 352 | 2000 | 65.0% - 70.0% | $180.00 - $185.00 | $115.00 - $120.00 |
| Marriott Indianapolis Downtown | 650 | 2001 | 60.0% - 65.0% | $185.00 - $190.00 | $115.00 - $120.00 |
| Total Avg. Competitive Set(3) | | | 58.0% | $180.00 | $105.00 |
| (2) | Occupancy, ADR and RevPar are based on operating statements provided by the borrower dated as of December 31, 2022. |
| (3) | Excludes the Hyatt Regency Indianapolis Property. |
The Borrower. The borrower is CP Indy DT, LLC, a Delaware limited liability company and single purpose entity with two independent directors in its organizational structure. Legal counsel to the borrower delivered a non-consolidation opinion in connection with the origination of the Hyatt Regency Indianapolis Whole Loan.
The Borrower Sponsors. The borrower sponsors are William J. Yung III, Martha Yung, William J. Yung IV, Joseph A. Yung, Julie A. Haught, Judith A. Yung, Jennifer A. Yung, Michelle M. Christensen and Scott A. Yung and the non-recourse carveout guarantor is CSC Holdings, LLC. The Yung family owns Columbia Sussex Corporation, a private hotel company based in Crestview Hills, Kentucky. Founded in 1972, Columbia Sussex Corporation owns and operates hotels across the United States. Columbia Sussex Corporation currently operates 49 hotels under five different brands including Marriott Hotels, JW Marriott, Renaissance, Hilton Hotels and Resorts, Double Tree and Hyatt Regency.
Property Management. The Hyatt Regency Indianapolis Property is currently managed by Crestview Management, LLC, an affiliate of the borrower sponsors.
Escrows and Reserves. At origination of the Hyatt Regency Indianapolis Whole Loan, the borrower deposited approximately (i) $157,268 into a real estate tax reserve account, (ii) $72,600 into an immediate repairs reserve account, and (iii) $127,022 into a seasonality reserve account.
Tax Escrows – The borrower is required to deposit into a real estate tax reserve, on a monthly basis, 1/12th of the taxes that the lender reasonably estimates will be payable over the next-ensuing 12-month period (initially estimated to be approximately $157,268).
Insurance Reserve – The borrower is required to deposit into an insurance reserve, on a monthly basis, 1/12th of the amount which would be sufficient to pay the insurance premiums due for the renewal of coverage afforded by such policies; provided, however, such insurance reserve has been conditionally waived so long as the borrower maintains a blanket policy meeting the requirements of the Hyatt Regency Indianapolis Whole Loan documents. At origination of the Hyatt Regency Indianapolis Whole Loan, an acceptable blanket policy was in place.
| THE INFORMATION IN THIS STRUCTURAL AND COLLATERAL TERM SHEET IS NOT COMPLETE AND MAY BE AMENDED PRIOR TO THE TIME OF SALE. THIS TERM SHEET IS NOT AN OFFER TO SELL THESE SECURITIES AND IT IS NOT A SOLICITATION OF AN OFFER TO BUY THESE SECURITIES IN ANY JURISDICTION WHERE THE OFFER OR SALE IS NOT PERMITTED. |
| | 36 | |
| Structural and Collateral Term Sheet | | BMO 2023-C5 |
| No. 3 – Hyatt Regency Indianapolis |
FF&E Reserve – The borrower is required to deposit into a furniture, fixtures and equipment (“FF&E”) reserve, on a monthly basis, an amount equal to the greater of (i) an amount equal to 1/12th of 4.0% of the greater of (1) the annual gross revenues for the hotel related operations at the Hyatt Regency Indianapolis Property for the preceding calendar year and (2) the projected annual gross revenues for the hotel related operations at the Hyatt Regency Indianapolis Property for the calendar year in which such monthly payment occurs as set forth in the then-current approved annual budget and (ii) the amount of the deposit (if any) then required by the franchisor on account of FF&E under the franchise agreement.
PIP Reserve - The borrower is required to deposit into a property improvement plan (“PIP”) reserve, (i) the applicable PIP Deposit (as defined below) (A) in the case of any existing or renewal franchise agreement, prior to the required commencement date of any PIP imposed thereunder and (B) in the case of any new franchise agreement, on or prior to the date such new franchise agreement is executed and delivered, and (ii) if a Hyatt Regency Indianapolis Trigger Period (as defined below) is continuing solely due to a Franchise Renewal Trigger Event (as defined below), all excess cash flow until the borrower has deposited cash or a letter of credit in an amount equal to 115% of the costs associated with any PIP included in the renewal or extension of the franchise agreement (or new franchise agreement), less any sums on deposit in the FF&E reserve account and the PIP reserve account. The lender is required to make disbursements from the PIP reserve funds as requested by the borrower to reimburse or pay for the borrower’s actual, out-of-pocket expenses incurred in connection with the performance of the related PIP work.
“PIP Deposit” means, with respect to any PIP, an amount equal to 110% of the costs of the related work that is the subject of such PIP, as estimated by the lender in its reasonable discretion.
“Franchise Renewal Trigger Event” means an event which will be deemed to have occurred if, among other things, the franchise agreement is not extended or replaced for a term expiring no earlier than three years after the maturity date of the Hyatt Regency Indianapolis Whole Loan, on or before the date which is 12 months prior to the expiration of the then-applicable term of the franchise agreement.
Seasonality Reserve - The borrower is required to deposit into a seasonality reserve, (i) on each Seasonality Reserve Monthly Deposit Date (as defined below) from May 2023 through November 2023, $27,945, and (ii) on each Seasonality Reserve Monthly Deposit Date thereafter, determined by lender and will be equal to 110% of the quotient of (x) the aggregate Negative Monthly Amounts (as defined below) for the twelve month period divided by (y) the number of months for which there is no Negative Monthly Amount, based on the then current seasonality annual budget, such seasonality reserve monthly deposit to be adjusted annually on February 1st of each calendar year by lender.
“Negative Monthly Amount” means, with respect to any monthly payment date, the amount, if any, by which operating income for the Hyatt Regency Indianapolis Property for the calendar month is insufficient to establish a debt service coverage ratio of 1.00 to 1.00 based on the then current annual budget to be adjusted annually on February 1st of each year by lender.
“Seasonality Reserve Monthly Deposit Date” shall mean (a) for the first year of the Hyatt Regency Indianapolis Whole Loan, the monthly payment dates occurring in February through November, 2023, and (b) thereafter, the monthly payment dates with a seasonality reserve monthly deposit as set forth on the seasonality reserve schedule as determined on February 1st of each year in accordance with the Hyatt Regency Indianapolis Whole Loan documents.
Lockbox / Cash Management. The Hyatt Regency Indianapolis Whole Loan is structured with a hard lockbox and springing cash management. The borrower is required to deliver direction letters to each of the credit card companies with which borrower has entered into a merchant’s or other credit card agreement directing them to pay to the lender-controlled lockbox account all payments which would otherwise be paid to borrower under the applicable credit card processing agreement. The borrower is required to (or cause the property manager to) immediately deposit all revenue generated by the Hyatt Regency Indianapolis Property into the lender-controlled lockbox account. All funds deposited into the lockbox are required to be transferred on each business day to or at the direction of the borrower unless a Hyatt Regency Indianapolis Trigger Period exists. Upon the occurrence and during the continuance of an Hyatt Regency Indianapolis Trigger Period, all funds in the lockbox account are required to be swept on each business day to a cash management account under the control of the lender to be applied and disbursed in accordance with the Hyatt Regency Indianapolis Whole Loan documents, and all excess cash flow funds remaining in the cash management account after the application of such funds in accordance with the Hyatt Regency Indianapolis Whole Loan documents may be held by the lender in an excess cash flow reserve account as additional collateral for the Hyatt Regency Indianapolis Whole Loan.
| THE INFORMATION IN THIS STRUCTURAL AND COLLATERAL TERM SHEET IS NOT COMPLETE AND MAY BE AMENDED PRIOR TO THE TIME OF SALE. THIS TERM SHEET IS NOT AN OFFER TO SELL THESE SECURITIES AND IT IS NOT A SOLICITATION OF AN OFFER TO BUY THESE SECURITIES IN ANY JURISDICTION WHERE THE OFFER OR SALE IS NOT PERMITTED. |
| | 37 | |
| Structural and Collateral Term Sheet | | BMO 2023-C5 |
| No. 3 – Hyatt Regency Indianapolis |
An “Hyatt Regency Indianapolis Trigger Period” means a period (B) commencing upon the occurrence of any of the following: (i) the occurrence of an event of default, (ii) the debt service coverage ratio falling below 1.30x, (iii) a Hyatt Regency Indianapolis Franchise Agreement Trigger Event (as defined below), (iv) a Franchise Renewal Trigger Event, and (v) any bankruptcy action of the manager, and (B) expiring upon the occurrence (a) with respect to any Hyatt Regency Indianapolis Trigger Period caused solely by the events described in clause (i) above, the acceptance by lender of a cure of such event of default or waiver of such event of default, (b) with regard to any Hyatt Regency Indianapolis Trigger Period caused solely by the events described in clause (ii) above, the debt service coverage ratio being equal to or greater than 1.30x for one calendar quarter, (c) with regard to any Hyatt Regency Indianapolis Trigger Period caused solely by the events described in clause (iii) above, the occurrence of a Hyatt Regency Indianapolis Franchise Agreement Cure Event (as defined below), (d) with regard to any Hyatt Regency Indianapolis Trigger Period caused solely by the events described in clause (iv) above, the occurrence of a Hyatt Regency Indianapolis Franchise Renewal Event (as defined below), and (e) with regard to any Hyatt Regency Indianapolis Trigger Period caused solely by the events described in clause (v) above, the replacement of the manager by the borrower pursuant to the Hyatt Regency Indianapolis Whole Loan documents.
“Hyatt Regency Indianapolis Franchise Agreement Trigger Event” means the occurrence of any of the following: (i) borrower being in default under the franchise agreement beyond any applicable notice and cure periods, (ii) borrower or franchisor giving notice that it is terminating the franchise agreement, (iii) any termination or cancellation of the franchise agreement (including, without limitation, rejection in any bankruptcy or similar insolvency proceeding of franchisor) and/or the franchise agreement expiring or otherwise failing to otherwise be in full force and effect and (iv) any bankruptcy or similar insolvency of franchisor.
“Hyatt Regency Indianapolis Franchise Agreement Cure Event” means lender’s receipt of evidence reasonably acceptable to lender of (1) (a) the satisfaction of the Hyatt Regency Indianapolis Franchise Agreement Cure Conditions (as defined below) or (b) the branding, “flagging” and operation of the Hyatt Regency Indianapolis Property pursuant to a replacement franchise agreement entered into in accordance with the terms of the Hyatt Regency Indianapolis Whole Loan documents, and (2) to the extent a PIP is required in connection with the foregoing, the deposit of the corresponding PIP deposit into the PIP reserve account in accordance with the Hyatt Regency Indianapolis Whole Loan documents.
"Hyatt Regency Indianapolis Franchise Agreement Cure Conditions” means each of the following (i) borrower has cured all defaults (if any) under the franchise agreement to the satisfaction of the applicable franchisor, (ii) borrower and the applicable franchisor have re-affirmed the franchise agreement as being in full force and effect, (iii) the Hyatt Regency Indianapolis Property continues to be operated, “flagged” and branded pursuant to the franchise agreement, (iv) all permits applicable to the related franchise agreement are in full force and effect, and (v) with respect to any applicable bankruptcy or insolvency proceedings involving the applicable franchisor, such franchisor is no longer insolvent or subject to any bankruptcy or insolvency proceedings and has affirmed such franchise agreement pursuant to a final, non-appealable order of a court of competent jurisdiction.
Subordinate Debt. None.
Mezzanine Debt. None.
Partial Release. Not Permitted.
Ground Lease. None.
| THE INFORMATION IN THIS STRUCTURAL AND COLLATERAL TERM SHEET IS NOT COMPLETE AND MAY BE AMENDED PRIOR TO THE TIME OF SALE. THIS TERM SHEET IS NOT AN OFFER TO SELL THESE SECURITIES AND IT IS NOT A SOLICITATION OF AN OFFER TO BUY THESE SECURITIES IN ANY JURISDICTION WHERE THE OFFER OR SALE IS NOT PERMITTED. |
| | 38 | |
| Structural and Collateral Term Sheet | | BMO 2023-C5 |
| No. 4 – Cincinnati Multifamily Portfolio |
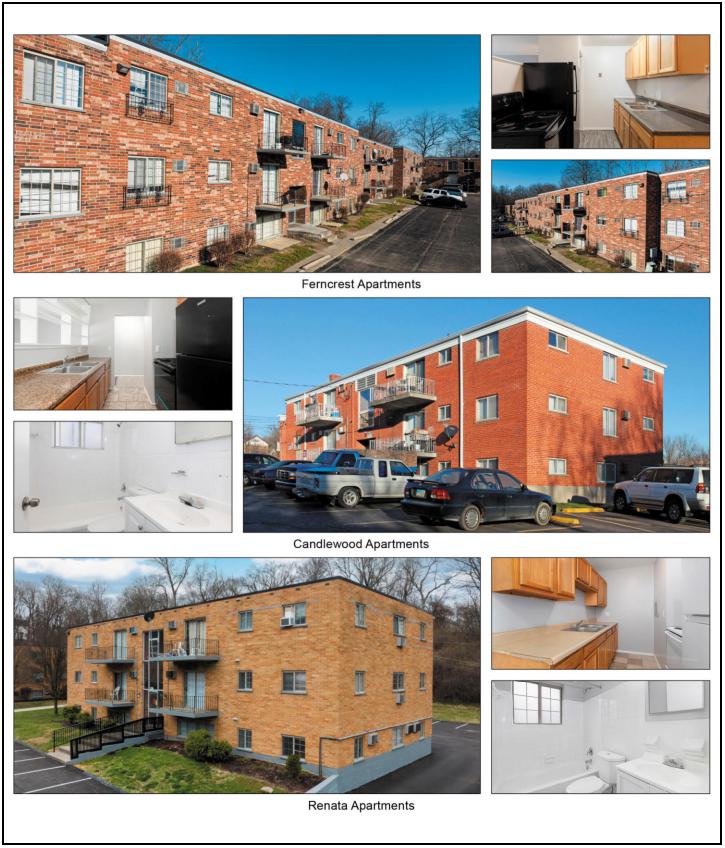
| THE INFORMATION IN THIS STRUCTURAL AND COLLATERAL TERM SHEET IS NOT COMPLETE AND MAY BE AMENDED PRIOR TO THE TIME OF SALE. THIS TERM SHEET IS NOT AN OFFER TO SELL THESE SECURITIES AND IT IS NOT A SOLICITATION OF AN OFFER TO BUY THESE SECURITIES IN ANY JURISDICTION WHERE THE OFFER OR SALE IS NOT PERMITTED. |
| | 39 | |
| Structural and Collateral Term Sheet | | BMO 2023-C5 |
| No. 4 – Cincinnati Multifamily Portfolio |
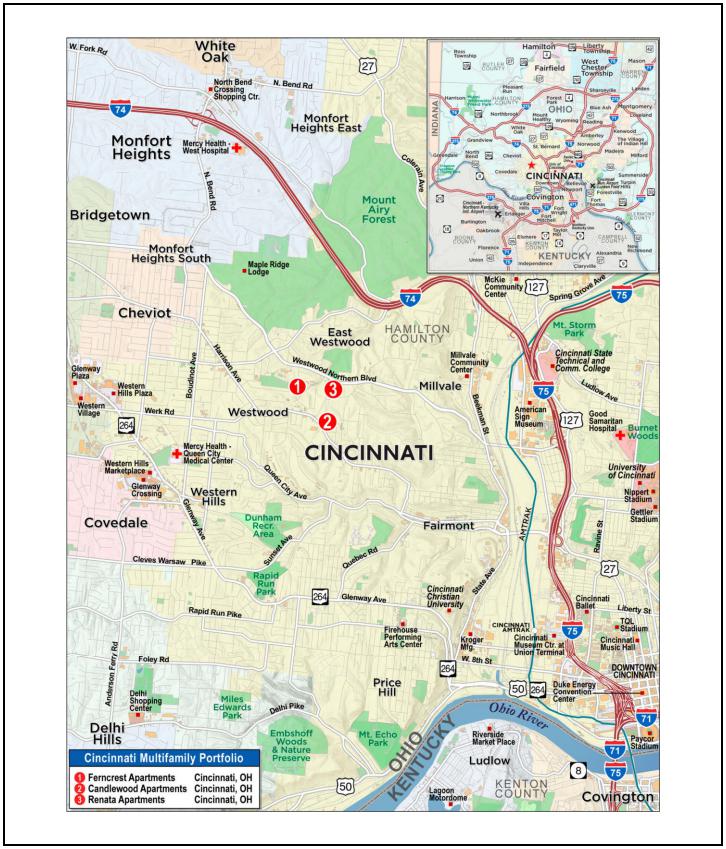
| THE INFORMATION IN THIS STRUCTURAL AND COLLATERAL TERM SHEET IS NOT COMPLETE AND MAY BE AMENDED PRIOR TO THE TIME OF SALE. THIS TERM SHEET IS NOT AN OFFER TO SELL THESE SECURITIES AND IT IS NOT A SOLICITATION OF AN OFFER TO BUY THESE SECURITIES IN ANY JURISDICTION WHERE THE OFFER OR SALE IS NOT PERMITTED. |
| | 40 | |
| Structural and Collateral Term Sheet | | BMO 2023-C5 |
| No. 4 – Cincinnati Multifamily Portfolio |
| Mortgage Loan Information | | Property Information |
| Mortgage Loan Seller: | BMO | | Single Asset / Portfolio: | Portfolio |
| Original Principal Balance: | $39,000,000 | | Title: | Fee |
| Cut-off Date Principal Balance: | $39,000,000 | | Property Type – Subtype: | Multifamily – Garden |
| % of IPB: | 5.9% | | Net Rentable Area (Units): | 375 |
| Loan Purpose: | Recapitalization | | Location: | Cincinnati, OH |
| Borrowers: | Candlewood Residents LLC, | | Year Built / Renovated: | Various / Various |
| | Cincinnati Portfolio Realty LLC and | | Occupancy: | 97.9% |
| | Renata Apartments LLC | | Occupancy Date: | 3/1/2023 |
| Borrower Sponsor: | Mendel Steiner | | 4th Most Recent NOI (As of): | NAV |
| Interest Rate: | 6.91000% | | 3rd Most Recent NOI (As of): | $2,331,745 (12/31/2020) |
| Note Date: | 4/3/2023 | | 2nd Most Recent NOI (As of): | $2,995,316 (12/31/2021) |
| Maturity Date: | 4/6/2033 | | Most Recent NOI (As of): | $3,908,477 (TTM 1/31/2023) |
| Interest-only Period: | 120 months | | UW Economic Occupancy: | 97.1% |
| Original Term: | 120 months | | UW Revenues: | $5,305,652 |
| Original Amortization Term: | None | | UW Expenses: | $1,147,080 |
| Amortization Type: | Interest Only | | UW NOI: | $4,158,572 |
| Call Protection: | L(26),D(90),O(4) | | UW NCF: | $4,072,322 |
| Lockbox / Cash Management: | Springing / Springing | | Appraised Value / Per Unit(2): | $60,600,000 / $161,600 |
| Additional Debt: | No | | Appraisal Date: | 3/2/2023 |
| Additional Debt Balance: | NAP | | | |
| Additional Debt Type: | NAP | | | |
| | | | | |
| | | | | |
| Escrows and Reserves(1) | | Financial Information |
| | Initial | Monthly | Initial Cap | | | |
| Taxes: | $42,247 | $8,449 | N/A | | Cut-off Date Loan / Unit: | $104,000 |
| Insurance: | $114,212 | $10,383 | N/A | | Maturity Date Loan / Unit: | $104,000 |
| Replacement Reserve: | $337,500 | Springing | $337,500 | | Cut-off Date LTV(2): | 64.4% |
| Deferred Maintenance: | $94,956 | $0 | N/A | | Maturity Date LTV(2): | 64.4% |
| Other: | $100,000 | $0 | N/A | | UW NCF DSCR: | 1.49x |
| | | | | | UW NOI Debt Yield: | 10.7% |
| | | | | | | |
| Sources and Uses |
| Sources | Proceeds | % of Total | | Uses | Proceeds | % of Total | |
| Mortgage Loan | $39,000,000 | 69.6 | % | | Return of Equity | $20,485,820 | 36.6 | % |
| Borrower Sponsor Equity | 17,010,000 | 30.4 | | | Partnership Buyout | 17,010,000 | 30.4 | |
| | | | | | Loan Payoff | 16,881,343 | 30.1 | |
| | | | | | Closing Costs | 943,921 | 1.7 | |
| | | | | | Upfront Reserves | 688,915 | 1.2 | |
| Total Sources | $56,010,000 | 100.0 | % | | Total Uses | $56,010,000 | 100.0 | % |
| (1) | For a full description of Escrows and Reserves, see “Escrows and Reserves” below. |
| (2) | The Cut-off Date LTV and Maturity Date LTV are based on the aggregate "as-is" appraised value of the three properties of $60,600,000. |
The Loan. The fourth largest mortgage loan (the “Cincinnati Multifamily Portfolio Mortgage Loan”) is secured by the borrowers’ fee interest in three garden-style multifamily properties located in Cincinnati, Ohio (the “Cincinnati Multifamily Portfolio Properties”). The Cincinnati Multifamily Portfolio Mortgage Loan was originated on April 3, 2023 by Bank of Montreal. The Cincinnati Multifamily Portfolio Mortgage Loan accrues interest at an interest rate of 6.91000% per annum. The Cincinnati Multifamily Mortgage Loan has an original term of 120 months, has a remaining term of 118 months as of the Cut-off Date and is interest only for the entire term. The scheduled maturity date of the Cincinnati Multifamily Portfolio Mortgage Loan is the monthly payment date that occurs on April 6, 2033.
| THE INFORMATION IN THIS STRUCTURAL AND COLLATERAL TERM SHEET IS NOT COMPLETE AND MAY BE AMENDED PRIOR TO THE TIME OF SALE. THIS TERM SHEET IS NOT AN OFFER TO SELL THESE SECURITIES AND IT IS NOT A SOLICITATION OF AN OFFER TO BUY THESE SECURITIES IN ANY JURISDICTION WHERE THE OFFER OR SALE IS NOT PERMITTED. |
| | 41 | |
| Structural and Collateral Term Sheet | | BMO 2023-C5 |
| No. 4 – Cincinnati Multifamily Portfolio |
The Properties. The Cincinnati Multifamily Portfolio Properties are comprised of three multifamily garden-style properties located in Cincinnati, Ohio that were built in 1970, 1961 and 1966, the “Ferncrest Apartments Property”, the “Candlewood Apartments Property”, and the “Renata Apartments Property” respectively. The Candlewood Apartments Property was renovated in 2018.
The following table presents certain information relating to the Cincinnati Multifamily Portfolio Properties:
| Portfolio Summary(1) |
| Property Name | Year Built / Renovated | Units(2) | Occupancy %(2) | Allocated
Cut-off Date Loan Amount (“ALA”) | % of ALA | Appraised Value | % of Appraised Value | UW NOI(2) | % of UW NOI(2) |
| Ferncrest Apartments | 1970 / NAP | 144 | 97.9% | $14,046,600 | 36.0% | $21,800,000 | 36.0 | % | $1,513,288 | 36.4 | % |
| Candlewood Apartments | 1961 / 2018 | 110 | 98.2% | 13,494,400 | 34.6 | 21,000,000 | 34.7 | | 1,414,810 | 34.0 | % |
| Renata Apartments | 1966 / NAP | 121 | 97.5% | 11,459,000 | 29.4 | 17,800,000 | 29.4 | | 1,230,474 | 29.6 | % |
| Total/Wtd. Avg. | | 375 | 97.9% | $39,000,000 | 100.0% | $60,600,000 | 100.0 | % | $4,158,572 | 100.0 | % |
| (1) | Source: Appraisal unless otherwise indicated. |
| (2) | Based on the underwritten rent roll as of March 1, 2023. |
Ferncrest Apartments Property. As of March 1, 2023, the Ferncrest Apartments Property was 97.9% occupied. The 6.51-acre parcel is improved with 3 three-story apartment buildings. The improvements are brick construction. The Ferncrest Apartments Property features 144 units total with one- and two-bedroom layouts ranging in size from 500 to 900 square feet. Market rents range from $850 to $1,055 per month, with an average market rent of approximately $1,039 and an average unit size of 836 square feet. Unit features include laminate countertops, wood cabinets and granite vanities. Community amenities include a playground and a leasing office.
The following table presents detailed information with respect to the current market rate units at the Ferncrest Apartments Property:
| As Is Market Rate Unit Summary(1) |
| Unit Type | No. of Units | % of Total | Average Unit Size (SF)(1) | Average Monthly Rental Rate(1)(2) | Average Monthly Rental Rate per SF(1)(2) | Average Monthly Market Rental Rate(3) | Average Monthly Market Rental Rate per SF(3) |
| 1 Bedroom | 10 | 6.9 | % | 500 | $848 | $1.70 | $850 | $1.70 |
| 2 Bedroom | 134 | 93.1 | | 861 | $1,043 | $1.21 | $1,053 | $1.23 |
| Total/Wtd. Avg. | 144 | 100.0 | % | 836 | $1,029 | $1.23 | $1,039 | $1.24 |
| (1) | Based on the underwritten rent roll dated as of March 1, 2023. |
| (2) | Based only on occupied units. |
Candlewood Apartments Property. As of March 1, 2023, the Candlewood Apartments Property was 98.2% occupied. The 5.49-acre parcel is improved with 10 three-story apartment buildings. The improvements are brick construction. The Candlewood Apartments Property features 110 units total, with one-, two- and three-bedroom layouts ranging in size from 750 to 950 square feet. Market rents range from $850 to $1,460 per month, with an average market rent of $1,255 and an average unit size of 894 square feet. Unit features include laminate countertops, wood cabinets and granite vanities. Community amenities include a playground and a leasing office.
| THE INFORMATION IN THIS STRUCTURAL AND COLLATERAL TERM SHEET IS NOT COMPLETE AND MAY BE AMENDED PRIOR TO THE TIME OF SALE. THIS TERM SHEET IS NOT AN OFFER TO SELL THESE SECURITIES AND IT IS NOT A SOLICITATION OF AN OFFER TO BUY THESE SECURITIES IN ANY JURISDICTION WHERE THE OFFER OR SALE IS NOT PERMITTED. |
| | 42 | |
| Structural and Collateral Term Sheet | | BMO 2023-C5 |
| No. 4 – Cincinnati Multifamily Portfolio |
The following table presents detailed information with respect to the current market rate units at the Candlewood Apartments Property:
| As Is Market Rate Unit Summary(1) |
| Unit Type | No. of Units | % of Total | Average Unit Size (SF)(1) | Average Monthly Rental Rate(1)(2) | Average Monthly Rental Rate per SF(1)(2) | Average Monthly Market Rental Rate(3) | Average Monthly Market Rental Rate per SF(3) |
| 1 Bedroom | 31 | 28.2 | % | 750 | $855 | $1.14 | $850 | $1.13 |
| 2 Bedroom | 9 | 8.2 | | 950 | $1,057 | $1.11 | $1,050 | $1.11 |
| 3 Bedroom | 70 | 63.6 | | 950 | $1,453 | $1.53 | $1,460 | $1.54 |
| Total/Wtd. Avg. | 110 | 100.0 | % | 894 | $1,258 | $1.41 | $1,255 | $1.40 |
| (1) | Based on the underwritten rent roll dated as of March 1, 2023. |
| (2) | Based only on occupied units. |
Renata Apartments Property. As of March 1, 2023, the Renata Apartments Property was 97.5% occupied. The 6.38-acre parcel is improved with 11 three-story apartment buildings. The improvements are brick construction. The Renata Apartments Property features 121 units total, with one-, two- and three-bedroom layouts ranging in size from 650 to 1,300 square feet. Market rents range from $850 to $1,425 per month, with an average market rent of $1,026 and an average unit size of 866 square feet. Unit features include laminate countertops, wood cabinets and granite vanities. Community amenities include a playground and a leasing office.
The following table presents detailed information with respect to the current market rate units at the Renata Apartments Property:
| As Is Market Rate Unit Summary(1) |
| Unit Type | No. of Units | % of Total | Average Unit Size (SF)(1) | Average Monthly Rental Rate(1)(2) | Average Monthly Rental Rate per SF(1)(2) | Average Monthly Market Rental Rate(3) | Average Monthly Market Rental Rate per SF(3) |
| 1 Bedroom | 26 | 21.5 | % | 650 | $854 | $1.31 | $850 | $1.31 |
| 2 Bedroom | 89 | 73.6 | | 900 | $1,056 | $1.17 | $1,050 | $1.17 |
| 3 Bedroom | 6 | 5.0 | | 1,300 | $1,205 | $0.93 | $1,425 | $1.10 |
| Total/Wtd. Avg. | 121 | 100.0 | % | 866 | $1,019 | $1.18 | $1,026 | $1.18 |
| (1) | Based on the underwritten rent roll dated as of March 1, 2023. |
| (2) | Based only on occupied units. |
Environmental. According to the Phase I environmental assessments dated March 27, 2023, and March 29, 2023, there was no evidence of any recognized environmental conditions at the Cincinnati Multifamily Portfolio Properties.
The following table presents certain information relating to the historical and current occupancy of the Cincinnati Multifamily Portfolio Properties:
| Historical and Current Occupancy(1) |
| Property | 2020 | 2021 | 2022 | Current(2) |
| Ferncrest Apartments | 79.0% | 87.0% | 94.0% | 97.9% |
| Candlewood Apartments | 73.0% | 85.0% | 97.0% | 98.2% |
| Renata Apartments | 71.0% | 83.0% | 95.0% | 97.5% |
| (1) | Historical occupancy is as of December 31 of each respective year. |
| (2) | Current Occupancy is as of March 1, 2023. |
| THE INFORMATION IN THIS STRUCTURAL AND COLLATERAL TERM SHEET IS NOT COMPLETE AND MAY BE AMENDED PRIOR TO THE TIME OF SALE. THIS TERM SHEET IS NOT AN OFFER TO SELL THESE SECURITIES AND IT IS NOT A SOLICITATION OF AN OFFER TO BUY THESE SECURITIES IN ANY JURISDICTION WHERE THE OFFER OR SALE IS NOT PERMITTED. |
| | 43 | |
| Structural and Collateral Term Sheet | | BMO 2023-C5 |
| No. 4 – Cincinnati Multifamily Portfolio |
The following table presents certain information relating to the operating history and underwritten cash flows of the Cincinnati Multifamily Portfolio Properties:
| Operating History and Underwritten Net Cash Flow |
| | 2020 | 2021 | TTM(1) | Underwritten | Per Unit | %(2) |
| Gross Potential Rent | $4,598,341 | $4,632,350 | $4,946,520 | $4,959,849 | $13,226 | 100.0 | % |
| Net Rental Income | $4,598,341 | $4,632,350 | $4,946,520 | $4,959,849 | $13,226 | 100.0 | % |
| (Vacancy/Credit Loss) | (1,278,120) | (749,184) | (384,124) | (145,785) | (389) | (2.9 | ) |
| Other Income | 325,140 | 354,854 | 490,712 | 491,588 | 1,311 | 9.9 | |
| Effective Gross Income | $3,645,361 | $4,238,020 | $5,053,108 | $5,305,652 | $14,148 | 107.0 | % |
| Total Expenses | 1,313,616 | 1,242,704 | 1,144,631 | 1,147,080 | 3,059 | 21.6 | |
| Net Operating Income | $2,331,745 | $2,995,316 | $3,908,477 | $4,158,572 | $11,090 | 78.4 | % |
| Total TI/LC, Capex/RR | 0 | 0 | 0 | 86,250 | 230 | 1.6 | |
| Net Cash Flow | $2,331,745 | $2,995,316 | $3,908,477 | $4,072,322 | $10,860 | 76.8 | % |
| (1) | TTM reflects the trailing 12 months ending January 31, 2023. |
| (2) | % column represents percent of Net Rental Income for revenue fields and represents percent of Effective Gross Income for the remainder of fields. |
The Markets. According to the appraisals, the Cincinnati Multifamily Portfolio Properties are located in the Cincinnati multifamily market. According to the appraisals, as of the fourth quarter of 2022, the Cincinnati multifamily market average monthly asking rent per unit was $1,147 and the average vacancy rate was 5.4%. According to the appraisals, the Cincinnati Multifamily Portfolio Properties are located in the Northwest Cincinnati submarket. As of the fourth quarter of 2022, the Northwest Cincinnati multifamily submarket average monthly asking rent per unit was $840 and the average vacancy rate was 4.9%.
According to the appraisals, the estimated 2023 population within a one-, three- and five-mile radius of the Ferncrest Apartments Property and the Candlewood Apartments Property is 16,215, 120,625 and 287,327, respectively. The estimated 2023 median household income within the same radii is $36,990, $44,506 and $52,029, respectively.
According to the appraisals, the estimated 2023 population within a one-, three- and five-mile radius of the Renata Apartments Property is 14,907, 116,999 and 296,881, respectively. The estimated 2023 median household income within the same radii is $36,588, $44,245 and $51,804, respectively.
| THE INFORMATION IN THIS STRUCTURAL AND COLLATERAL TERM SHEET IS NOT COMPLETE AND MAY BE AMENDED PRIOR TO THE TIME OF SALE. THIS TERM SHEET IS NOT AN OFFER TO SELL THESE SECURITIES AND IT IS NOT A SOLICITATION OF AN OFFER TO BUY THESE SECURITIES IN ANY JURISDICTION WHERE THE OFFER OR SALE IS NOT PERMITTED. |
| | 44 | |
| Structural and Collateral Term Sheet | | BMO 2023-C5 |
| No. 4 – Cincinnati Multifamily Portfolio |
The following table presents certain information relating to comparable multifamily rental properties to the Cincinnati Multifamily Portfolio Properties:
| Comparable Rental Summary(1) |
Property Name /
Property Address | Year Built / Renovated | Occupancy | # of Units | Unit Mix | Average SF per Unit | Average Rent per SF | Average Rent per Unit |
Candlewood Apartments(2) 2400 Harrison Avenue Cincinnati, OH | 1961 / 2018 | 98.2% | 110 | 1 Bedroom 2 Bedroom 3 Bedroom | 750 950 950 | $1.14 $1.11 $1.53 | $855 $1,057 $1,453 |
Ferncrest Apartments(2) 3173 Ferncrest Court Cincinnati, OH | 1970 / NAP | 97.9% | 144 | 1 Bedroom 2 Bedroom | 500 861 | $1.70 $1.21 | $848 $1,043 |
Renata Apartments(2) 2459 Westwood Northern Boulevard Cincinnati, OH | 1966 / NAP | 97.5% | 121 | 1 Bedroom 2 Bedroom 3 Bedroom | 650 900 1,300 | $1.31 $1.17 $0.93 | $854 $1,056 $1,205 |
Vista West 3382 McHenry Avenue Cincinnati, OH | 1973 / NAP | 100.0% | 28 | 2BR / 2BA | 850 | $1.12 | $950 |
Mayridge Apartments 3153-3225 Mayridge Court Cincinnati, OH | 1964 / NAP | 95.0% | 107 | Studio 1BR / 1BA 2BR / 1BA 3BR / 2BA | 450 610 796 1,045 | $1.33 $1.18 $1.08 $1.15 | $600 $718 $862 $1,200 |
| (1) | Source: Appraisal, unless otherwise indicated. |
| (2) | Based on the underwritten rent roll dated as of March 1, 2023. |
The Borrowers. The borrowers are Candlewood Residents LLC, Cincinnati Portfolio Realty LLC and Renata Apartments LLC, each a New York or Ohio limited liability company and special purpose entity with one independent director. Legal counsel to the borrowers provided a non-consolidation opinion in connection with the origination of the Cincinnati Multifamily Portfolio Mortgage Loan.
The Borrower Sponsor. The borrower sponsor and guarantor is Mendel Steiner.
Property Management. The Cincinnati Multifamily Portfolio Properties are managed by Aven Realty 1 LLC, a third party property management company.
Escrows and Reserves. At origination, the borrowers were required to deposit into escrow (i) approximately $42,247 for real estate taxes, (ii) approximately $114,212 for insurance premiums, (iii) $337,500 for replacement reserves, (iv) approximately $94,956 for deferred maintenance and (v) $100,000 for a radon testing reserve.
Tax Escrows – On a monthly basis, the borrowers are required to escrow 1/12th of the annual estimated tax payments on a monthly basis, which currently equates to approximately $8,449.
Insurance Escrows – On a monthly basis, the borrowers are required to escrow 1/12th of the annual insurance premium payments on a monthly basis, which currently equates to approximately $10,383, waived if the borrowers maintain a blanket policy acceptable to the lender.
Replacement Reserves – On a monthly basis, after funds in the replacement reserve initially fall below $112,500, the borrowers are required to escrow $9,375 for replacement reserves, so long as there is no event of default and funds in the replacement reserve do not exceed $337,500.
| THE INFORMATION IN THIS STRUCTURAL AND COLLATERAL TERM SHEET IS NOT COMPLETE AND MAY BE AMENDED PRIOR TO THE TIME OF SALE. THIS TERM SHEET IS NOT AN OFFER TO SELL THESE SECURITIES AND IT IS NOT A SOLICITATION OF AN OFFER TO BUY THESE SECURITIES IN ANY JURISDICTION WHERE THE OFFER OR SALE IS NOT PERMITTED. |
| | 45 | |
| Structural and Collateral Term Sheet | | BMO 2023-C5 |
| No. 4 – Cincinnati Multifamily Portfolio |
Lockbox / Cash Management. The Cincinnati Multifamily Portfolio Mortgage Loan is structured with a springing lockbox and springing cash management. Upon the occurrence of a Trigger Period (as defined below), the borrower or property manager will deposit all revenues relating to the Cincinnati Multifamily Portfolio Properties into a lender-controlled lockbox account within two business days of receipt. Upon the occurrence and during the continuance of a Trigger Period, all funds in the lockbox account are required to be swept on each business day to a cash management account under the control of the lender to be applied and disbursed in accordance with the Cincinnati Multifamily Portfolio Mortgage Loan documents, and all excess cash flow funds remaining in the cash management account after the application of such funds in accordance with the Cincinnati Multifamily Portfolio Mortgage Loan documents may be held by the lender in an excess cash flow reserve account as additional collateral for the Cincinnati Multifamily Portfolio Mortgage Loan.
A “Trigger Period” will commence upon the earliest of the following: (i) the occurrence of an event of default under the Cincinnati Multifamily Portfolio Mortgage Loan documents or (ii) the debt service coverage ratio for the Cincinnati Multifamily Portfolio Mortgage Loan being less than 1.30x and will be cured when (A) with regard to clause (i) above, upon the cure of such event of default and (B) with regard to clause (ii) above, upon the debt service coverage ratio for the Cincinnati Multifamily Portfolio Mortgage Loan being greater than or equal to 1.30x for two consecutive calendar quarters.
Subordinate Debt. None.
Mezzanine Debt. None.
Partial Release. At any time after the date that is two years after the closing date of the BMO 2023-C5 securitization transaction, the borrowers may release one or more of the Cincinnati Multifamily Portfolio Properties from the lien of the Cincinnati Multifamily Portfolio Mortgage Loan in connection with the sale of such release parcel to a third party subject to satisfaction of the applicable conditions set forth in the Cincinnati Multifamily Portfolio Mortgage Loan documents , including, without limitation, that: (i) no event of default has occurred and is continuing under the Cincinnati Multifamily Portfolio Mortgage Loan documents, and (ii) the greatest of (1) the defeasance collateral or partial prepayment, as applicable, is in an amount equal to 120% of the allocated loan amount for the individual Cincinnati Multifamily Portfolio Property to be released, and (2) the adjusted defeasance amount is such that (a) the debt service coverage ratio for the undefeased note based on income from the remaining property is not less than 1.45x, (b) the debt yield for the undefeased note based on income from the remaining property is not less than 10.5% and (c) the loan-to-value ratio for the undefeased note for the remaining property does not exceed 65%.
Ground Lease. None.
| THE INFORMATION IN THIS STRUCTURAL AND COLLATERAL TERM SHEET IS NOT COMPLETE AND MAY BE AMENDED PRIOR TO THE TIME OF SALE. THIS TERM SHEET IS NOT AN OFFER TO SELL THESE SECURITIES AND IT IS NOT A SOLICITATION OF AN OFFER TO BUY THESE SECURITIES IN ANY JURISDICTION WHERE THE OFFER OR SALE IS NOT PERMITTED. |
| | 46 | |
| Structural and Collateral Term Sheet | | BMO 2023-C5 |
| No. 5 – Great Lakes Crossing Outlets |
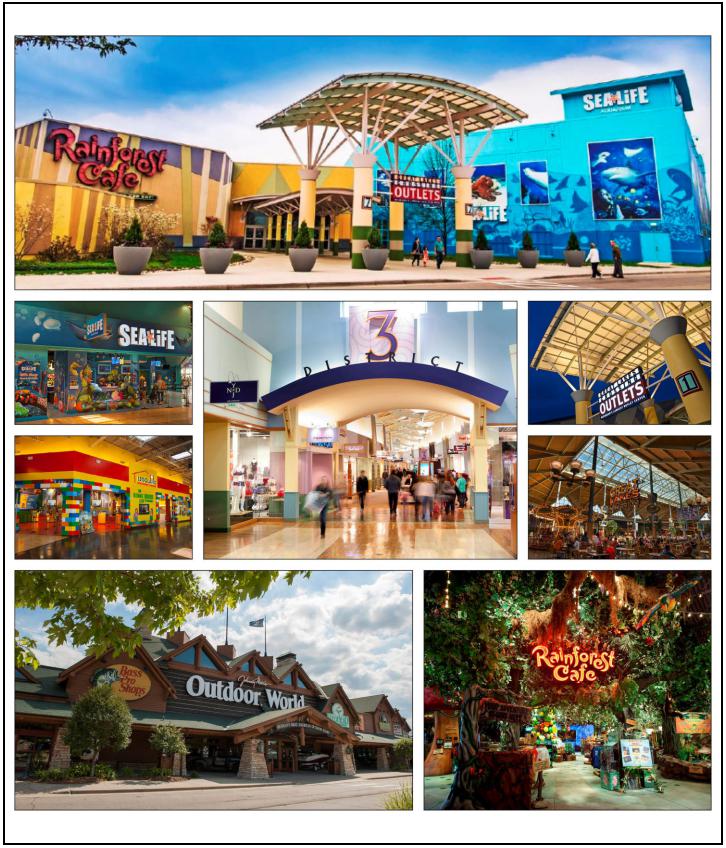
| THE INFORMATION IN THIS STRUCTURAL AND COLLATERAL TERM SHEET IS NOT COMPLETE AND MAY BE AMENDED PRIOR TO THE TIME OF SALE. THIS TERM SHEET IS NOT AN OFFER TO SELL THESE SECURITIES AND IT IS NOT A SOLICITATION OF AN OFFER TO BUY THESE SECURITIES IN ANY JURISDICTION WHERE THE OFFER OR SALE IS NOT PERMITTED. |
| | 47 | |
| Structural and Collateral Term Sheet | | BMO 2023-C5 |
| No. 5 – Great Lakes Crossing Outlets |
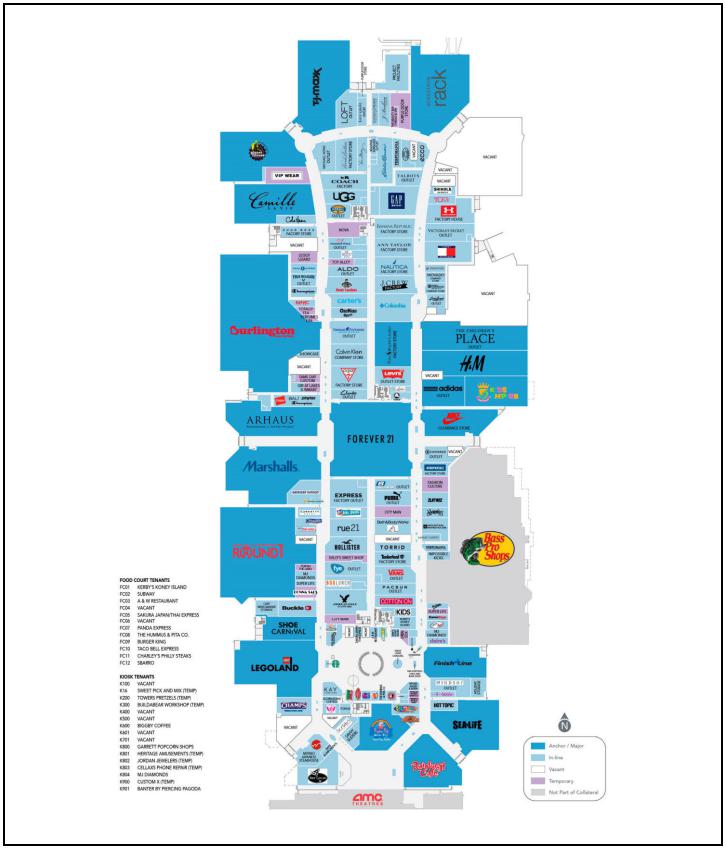
| THE INFORMATION IN THIS STRUCTURAL AND COLLATERAL TERM SHEET IS NOT COMPLETE AND MAY BE AMENDED PRIOR TO THE TIME OF SALE. THIS TERM SHEET IS NOT AN OFFER TO SELL THESE SECURITIES AND IT IS NOT A SOLICITATION OF AN OFFER TO BUY THESE SECURITIES IN ANY JURISDICTION WHERE THE OFFER OR SALE IS NOT PERMITTED. |
| | 48 | |
| Structural and Collateral Term Sheet | | BMO 2023-C5 |
| No. 5 – Great Lakes Crossing Outlets |
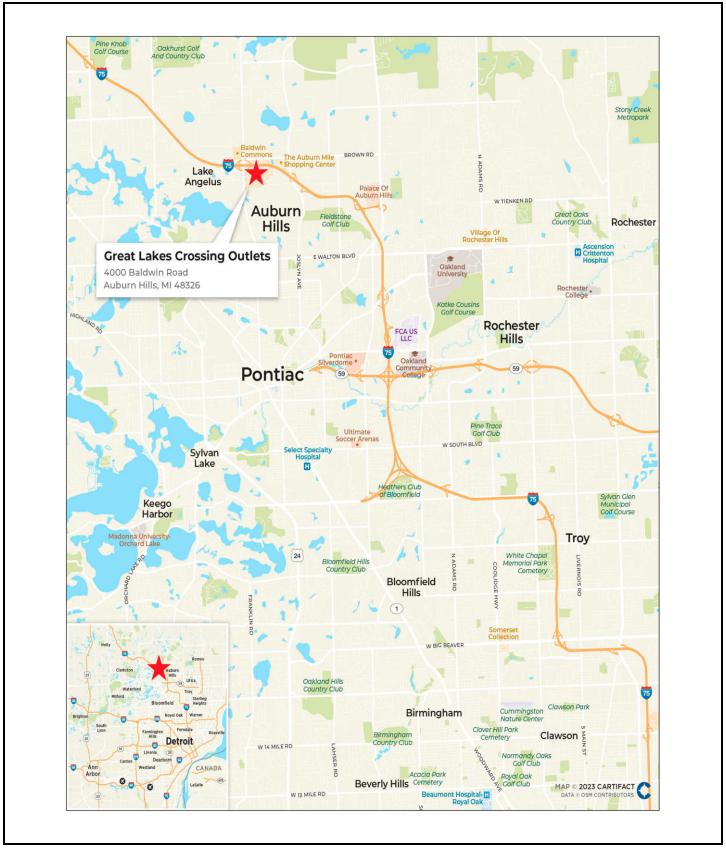
| THE INFORMATION IN THIS STRUCTURAL AND COLLATERAL TERM SHEET IS NOT COMPLETE AND MAY BE AMENDED PRIOR TO THE TIME OF SALE. THIS TERM SHEET IS NOT AN OFFER TO SELL THESE SECURITIES AND IT IS NOT A SOLICITATION OF AN OFFER TO BUY THESE SECURITIES IN ANY JURISDICTION WHERE THE OFFER OR SALE IS NOT PERMITTED. |
| | 49 | |
| Structural and Collateral Term Sheet | | BMO 2023-C5 |
| No. 5 – Great Lakes Crossing Outlets |
| Mortgage Loan Information | | Property Information |
| Mortgage Loan Seller: | BMO, GACC | | Single Asset / Portfolio: | Single Asset |
| Original Principal Balance(1): | $37,500,000 | | Title: | Fee |
| Cut-off Date Principal Balance(1): | $37,500,000 | | Property Type – Subtype: | Retail – Outlet Center |
| % of IPB: | 5.7% | | Net Rentable Area (SF): | 1,128,332 |
| Loan Purpose: | Refinance | | Location: | Auburn Hills, MI |
| Borrower: | Taubman Auburn Hills Associates Limited Partnership | | Year Built / Renovated: | 1998 / 2010 |
| Borrower Sponsor: | The Taubman Realty Group LLC | | Occupancy(5): | 89.6% |
| Interest Rate: | 6.52100% | | Occupancy Date: | 11/30/2022 |
| Note Date: | 1/5/2023 | | 4th Most Recent NOI (As of): | $34,244,744 (12/31/2019) |
| Maturity Date: | 2/1/2033 | | 3rd Most Recent NOI (As of): | $27,851,384 (12/31/2020) |
| Interest-only Period: | 120 months | | 2nd Most Recent NOI (As of): | $32,911,337 (12/31/2021) |
| Original Term: | 120 months | | Most Recent NOI (As of): | $31,655,635 (TTM 11/30/2022) |
| Original Amortization Term: | None | | UW Economic Occupancy: | 92.6% |
| Amortization Type: | Interest Only | | UW Revenues: | $47,000,639 |
| Call Protection(2): | L(28),D(86),O(6) | | UW Expenses: | $15,438,872 |
| Lockbox / Cash Management: | Hard / Springing | | UW NOI: | $31,561,767 |
| Additional Debt(1): | Yes | | UW NCF: | $29,734,689 |
| Additional Debt Balance(1): | 142,500,000 | | Appraised Value / Per SF: | $400,000,000 / $355 |
| Additional Debt Type(1): | Pari Passu | | Appraisal Date: | 11/10/2022 |
| | | | | |
| Escrows and Reserves(3) | | Financial Information(1) |
| | Initial | Monthly | Initial Cap | | Cut-off Date Loan / SF: | $160 |
| Taxes: | $0 | Springing | N/A | | Maturity Date Loan / SF: | $160 |
| Insurance: | $0 | Springing | N/A | | Cut-off Date LTV: | 45.0% |
| Replacement Reserves: | $0 | Springing | $519,033 | | Maturity Date LTV: | 45.0% |
| TI / LC: | $0 | $94,028 | $2,256,664 | | UW NCF DSCR: | 2.50x |
| Other Reserves(4): | $1,805,623 | $0 | N/A | | UW NOI Debt Yield: | 17.5% |
| | | | | | | |
| Sources and Uses |
| Sources | Proceeds | % of Total | | Uses | Proceeds | % of Total | |
| Whole Loan | $180,000,000 | 99.5 | % | | Loan Payoff | $177,589,210 | 98.1 | % |
| Borrower Sponsor Equity | 962,977 | 0.5 | | | Upfront Reserves | 1,805,623 | 1.0 | |
| | | | | Closing Costs | 1,568,144 | 0.9 | |
| Total Sources | $180,962,977 | 100.0 | % | | Total Uses | $180,962,977 | 100.0 | % |
| | | | | | | |
| (1) | The Great Lakes Crossing Outlets Mortgage Loan (as defined below) is part of a whole loan evidenced by 11 pari passu notes with an aggregate original principal balance of $180,000,000. Financial Information in the chart above reflects the Cut-off Date Balance and Maturity Date Balance of the Great Lakes Crossing Outlets Whole Loan (as defined below). For additional information, see “The Loan” below. |
| (2) | The defeasance lockout period will be at least 28 payments beginning with and including the first payment date of March 1, 2023. The borrower sponsor has the option to defease the entire $180.0 million Great Lakes Crossing Outlets Whole Loan in whole (and not in part) after the earlier to occur of (i) two years after the closing date of the securitization that includes the last note to be securitized and (ii) March 1, 2026. The assumed defeasance lockout period of 28 months is based on the expected closing date of the BMO 2023-C5 securitization in June 2023. The actual lockout period may be longer. Prepayment in whole, but not in part, of the Great Lakes Crossing Outlets Whole Loan is permitted after August 1, 2032 without the payment of a yield maintenance premium. |
| (3) | For a full description of Escrows and Reserves, please refer to “Escrows and Reserves” below. |
| (4) | Other reserves include the Initial Outstanding TI/LC reserve (approximately $1,581,204) and the initial Gap Rent Reserve (approximately $224,418). |
| (5) | Occupancy includes all tenants in place and tenants with signed leases as of the reporting period. Occupancy excludes non-collateral tenants. |
The Loan. The fifth largest mortgage loan (the “Great Lakes Crossing Outlets Mortgage Loan”) has an original and Cut-off Date balance of $37,500,000 and is part of a whole loan evidenced by 11 pari passu promissory notes in the aggregate original principal amount of $180,000,000 (the “Great Lakes Crossing Outlets Whole Loan”). The Great Lakes Crossing Outlets Mortgage Loan is evidenced by the non-controlling Notes A-3-3, A-2-1-A and A-2-3, which have an aggregate
| THE INFORMATION IN THIS STRUCTURAL AND COLLATERAL TERM SHEET IS NOT COMPLETE AND MAY BE AMENDED PRIOR TO THE TIME OF SALE. THIS TERM SHEET IS NOT AN OFFER TO SELL THESE SECURITIES AND IT IS NOT A SOLICITATION OF AN OFFER TO BUY THESE SECURITIES IN ANY JURISDICTION WHERE THE OFFER OR SALE IS NOT PERMITTED. |
| | 50 | |
| Structural and Collateral Term Sheet | | BMO 2023-C5 |
| No. 5 – Great Lakes Crossing Outlets |
outstanding principal balance as of the Cut-off Date of $37,500,000. The Great Lakes Crossing Outlets Whole Loan is secured by a first mortgage lien on the borrower’s fee interest in a 1,128,332 square foot retail outlet center property located in Auburn Hills, Michigan (the “Great Lakes Crossing Outlets Property”). The Great Lakes Crossing Outlets Whole Loan was co-originated on January 5, 2023 by Bank of Montreal (“BMO”), Goldman Sachs Bank USA (“GS”), and DBR Investments Co. Limited (“DBRI”). The Great Lakes Crossing Outlets Whole Loan has a 10-year term and is interest only for the entire term. The Great Lakes Crossing Outlets Whole Loan proceeds were used to refinance the existing debt on the Great Lakes Crossing Outlets Property, fund upfront reserves, and pay origination costs. The Great Lakes Crossing Outlets Whole Loan accrues interest at a fixed rate of 6.52100% per annum. The Great Lakes Crossing Outlets Mortgage Loan is being serviced pursuant to the pooling and servicing agreement for the Benchmark 2023-B38 securitization. See “The Pooling and Servicing Agreement” in the Preliminary Prospectus. The table below summarizes the promissory notes that comprise the Great Lakes Crossing Outlets Whole Loan. The relationship between the holders of the Great Lakes Crossing Outlets Whole Loan is governed by a co-lender agreement as described under “Description of the Mortgage Pool—The Whole Loans—The Outside Serviced Pari Passu Whole Loans” and “The Pooling and Servicing Agreement—Servicing of the Outside Serviced Mortgage Loans” in the Preliminary Prospectus.
| Whole Loan Summary |
| Note | Original Balance | Cut-off Date Balance | | Note Holder | Controlling Piece |
| A-1-1 | $27,500,000 | $27,500,000 | | Benchmark 2023-B38 | Yes |
| A-1-2(1) | $17,500,000 | $17,500,000 | | GS | No |
| A-1-3(1) | $17,500,000 | $17,500,000 | | GS | No |
| A-1-4(1) | $17,500,000 | $17,500,000 | | GS | No |
| A-2-1-A | $12,500,000 | $12,500,000 | | BMO 2023-C5 | No |
| A-2-1-B | $7,500,000 | $7,500,000 | | Benchmark 2023-B38 | No |
| A-2-2 | $15,000,000 | $15,000,000 | | Benchmark 2023-B38 | No |
| A-2-3 | $15,000,000 | $15,000,000 | | BMO 2023-C5 | No |
| A-3-1 | $25,750,000 | $25,750,000 | | BMO 2023-C4 | No |
| A-3-2(1) | $14,250,000 | $14,250,000 | | BMO | No |
| A-3-3 | $10,000,000 | $10,000,000 | | BMO 2023-C5 | No |
| Whole Loan | $180,000,000 | $180,000,000 | | | |
| (1) | Expected to be contributed to one or more future securitization(s). |
The Property. The Great Lakes Crossing Outlets Property is a retail outlet center comprised of a single story shopping center, totaling 1,357,631 square feet, of which 229,299 square feet is not included in the collateral, on an approximately 163.76-acre site in Auburn Hills, Michigan. The Great Lakes Crossing Outlets Property was built in 1998 and renovated in 2010. The Great Lakes Crossing Outlets Property has a total of 7,797 parking spaces, resulting in a ratio of approximately 6.91 spaces per 1,000 square feet of collateral. As of November 30, 2022, the Great Lakes Crossing Outlets Property was 89.6% occupied by 169 tenants. The collateral does not include 229,299 of square feet owned by Bass Pro Shops Outdoor World and AMC Theatre.
Major Tenants.
Burlington Coat Factory (81,082 square feet; 7.2% of NRA, 2.5% of underwritten base rent, Moody’s/S&P/Fitch: NR/BB+/NR): Founded in 1972 and headquartered in Burlington, New Jersey, Burlington Coat Factory (“Burlington”) is a nationally recognized off-price retailer headquartered in New Jersey. As of the fiscal year ending in 2022, Burlington operates 927 stores in 46 states and Puerto Rico. The firm is a Fortune 500 company and its common stock trades on the New York Stock Exchange under the ticker symbol “BURL”. Burlington’s stores offer an extensive selection of in-season, fashion-focused merchandise at up to 60% off other retailers’ prices, including women’s ready-to-wear apparel, menswear, youth apparel, baby, beauty, footwear, accessories, home, toys, gifts and coats. Burlington’s lease expires in January 2030 and has two 5-year renewal options remaining.
Round 1 Bowling Amusement (59,071 square feet; 5.2% of NRA, 3.2% of underwritten base rent, Moody’s/S&P/Fitch: NR/NR/NR): Founded in 2009 and headquartered in Brea, California, Round 1 Bowling Amusement (“Round 1”) is a multi-entertainment complex offering an array of activities including bowling, arcade games, billiards, ping pong, darts, food and drinks. Round 1’s parent company was founded in Japan in 1993 and quickly expanded across the country due to its growing demand. In 2008, the firm began exploring opportunities overseas, and in 2010 it opened its first United States location in Los Angeles. Round 1’s lease expires in September 2027 and has two 5-year renewal options remaining.
| THE INFORMATION IN THIS STRUCTURAL AND COLLATERAL TERM SHEET IS NOT COMPLETE AND MAY BE AMENDED PRIOR TO THE TIME OF SALE. THIS TERM SHEET IS NOT AN OFFER TO SELL THESE SECURITIES AND IT IS NOT A SOLICITATION OF AN OFFER TO BUY THESE SECURITIES IN ANY JURISDICTION WHERE THE OFFER OR SALE IS NOT PERMITTED. |
| | 51 | |
| Structural and Collateral Term Sheet | | BMO 2023-C5 |
| No. 5 – Great Lakes Crossing Outlets |
Forever 21 (47,203 square feet, 4.2% of NRA, 1.6% of underwritten rent, Moody’s/S&P/Fitch: NR/NR/NR): Founded in 1984 and headquartered in Los Angeles, California, “Forever 21” is a global fashion retailer headquartered in Los Angeles, California. With more than 540 locations worldwide and online, Forever 21 operates to make high style designs and fashion basics accessible to all consumers. Forever 21’s lease expired in January of 2023; however, the tenant is still in occupancy and current on rent.
Environmental. According to a Phase I environmental report dated November 16, 2022, there was no evidence of any recognized environmental conditions at the Great Lakes Crossing Outlets Property. However, the Phase I report identified an environmental issue at the Great Lakes Crossing Outlets Property in connection with a wetlands conservation easement agreement between the borrower and the Michigan Department of Environment, Great Lakes and Energy. The assessor recommended maintenance of the onsite regulated wetlands in accordance with the conservation easement agreement.
The following table presents certain information relating to the historical and current occupancy of the Great Lakes Crossing Outlets Property:
| Historical and Current Occupancy |
| 2019(1) | 2020(1) | 2021(1) | Current(2) |
| 92.9% | 91.0% | 91.9% | 89.6% |
| (1) | Historical Occupancies are as of December 31 of each respective year. |
| (2) | Current Occupancy is as of November 30, 2022. |
The following table presents certain information relating to the largest tenants based on net rentable area of the Great Lakes Crossing Outlets Property:
| Top 10 Tenant Summary(1) |
| Tenant | Ratings
Moody’s/S&P/Fitch(2) | Net Rentable Area (SF) | % of
Total NRA | UW Base Rent PSF(3) | UW Base Rent(3) | % of Total
UW Base Rent(3) | Lease
Exp. Date |
| Burlington Coat Factory(4) | NR/BB+/NR | 81,082 | 7.2 | % | $12.67 | $1,026,943 | 2.5 | % | 1/31/2030 |
| Round 1 Bowling Amusement(4) | NR/NR/NR | 59,071 | 5.2 | | $22.13 | 1,307,500 | 3.2 | | 9/30/2027 |
| Forever 21(4)(5) | NR/NR/NR | 47,203 | 4.2 | | $14.26 | 673,193 | 1.6 | | 1/31/2023 |
| Marshalls(4) | NR/NR/NR | 35,191 | 3.1 | | $21.16 | 744,692 | 1.8 | | 1/31/2027 |
| TJ Maxx(4) | A2/A/NR | 34,766 | 3.1 | | $21.16 | 735,699 | 1.8 | | 1/31/2027 |
| Nordstrom Rack(4) | Ba1/BB+/BBB- | 34,613 | 3.1 | | $17.00 | 588,421 | 1.4 | | 6/30/2030 |
| Legoland Discovery Center(4) | B2/B-/NR | 32,543 | 2.9 | | $10.82 | 352,178 | 0.9 | | 12/31/2031 |
| Planet Fitness | NR/NR/NR | 27,710 | 2.5 | | $14.48 | 401,373 | 1.0 | | 12/31/2028 |
| Camille La Vie | NR/NR/NR | 22,963 | 2.0 | | $16.72 | 383,835 | 0.9 | | 1/31/2028 |
| Arhaus The Loft | NR/NR/NR | 22,726 | 2.0 | | $22.66 | 515,023 | 1.3 | | 1/31/2030 |
| | | | | | | | |
| Major Tenants | 397,868 | 35.3 | % | $16.91 | $6,728,859 | 16.5 | % | |
| Other Tenants | 612,876 | 54.3 | % | $55.70 | $34,137,204 | 83.5 | % | |
| Occupied Collateral Total / Wtd. Avg. | 1,010,744 | 89.6 | % | $40.43 | $40,866,062 | 100.0 | % | |
| | | | | | | | |
| Vacant Space | | 117,588 | 10.4 | % | | | | |
| | | | | | | | |
| Collateral Total | | 1,128,332 | 100.0 | % | | | | |
| | | | | | |
| (1) | Based on underwritten rent roll dated as of November 30, 2022. |
| (2) | Ratings provided are for the parent company of the entity listed in the “Tenant” field whether or not the parent company guarantees the lease. |
| (3) | UW Base Rent, UW Base Rent PSF and % of Total UW Base Rent are comprised of underwritten base rent inclusive of contractual rent steps through January 2024, percentage rent in lieu, total recoveries (excluding utilities) at step and overage rent. |
| (4) | Anchor tenants for the Great Lakes Crossing Outlets Property represent approximately 28.8% of Net Rentable Area and approximately 13.3% of Total UW Base Rent. Forever 21’s lease expired in January 2023; however, the tenant is in occupancy and current on rent. |
| (5) | Forever 21’s lease expired in January 2023; however, the tenant is in occupancy and current on rent. |
| THE INFORMATION IN THIS STRUCTURAL AND COLLATERAL TERM SHEET IS NOT COMPLETE AND MAY BE AMENDED PRIOR TO THE TIME OF SALE. THIS TERM SHEET IS NOT AN OFFER TO SELL THESE SECURITIES AND IT IS NOT A SOLICITATION OF AN OFFER TO BUY THESE SECURITIES IN ANY JURISDICTION WHERE THE OFFER OR SALE IS NOT PERMITTED. |
| | 52 | |
| Structural and Collateral Term Sheet | | BMO 2023-C5 |
| No. 5 – Great Lakes Crossing Outlets |
The following table presents certain information relating to the tenant lease expirations at the Great Lakes Crossing Outlets Property:
| Lease Rollover Schedule(1)(2) |
| Year | Number of Leases Expiring | Net Rentable Area Expiring | % of NRA Expiring | UW Base Rent Expiring(3) | % of UW Base Rent Expiring(3) | Cumulative Net Rentable Area Expiring | Cumulative % of NRA Expiring | Cumulative UW Base Rent Expiring | Cumulative % of UW Base Rent Expiring(3) |
| Vacant | NAP | 117,588 | 10.4 | % | NAP | NA | P | 117,588 | 10.4% | | NAP | NAP | |
| 2023 & MTM | 33 | 149,599 | 13.3 | | $5,576,821 | 13.6 | % | 267,187 | 23.7% | | $5,576,821 | 13.6% | |
| 2024 | 38 | 88,679 | 7.9 | | 4,847,810 | 11.9 | | 355,866 | 31.5% | | $10,424,632 | 25.5% | |
| 2025 | 34 | 141,288 | 12.5 | | 8,770,136 | 21.5 | | 497,154 | 44.1% | | $19,194,767 | 47.0% | |
| 2026 | 16 | 43,108 | 3.8 | | 3,665,300 | 9 | | 540,262 | 47.9% | | $22,860,067 | 55.9% | |
| 2027 | 20 | 187,481 | 16.6 | | 6,903,724 | 16.9 | | 727,743 | 64.5% | | $29,763,791 | 72.8% | |
| 2028 | 14 | 124,499 | 11.0 | | 4,180,946 | 10.2 | | 852,242 | 75.5% | | $33,944,737 | 83.1% | |
| 2029 | 8 | 34,775 | 3.1 | | 1,377,153 | 3.4 | | 887,017 | 78.6% | | $35,321,890 | 86.4% | |
| 2030 | 9 | 183,219 | 16.2 | | 3,885,077 | 9.5 | | 1,070,236 | 94.9% | | $39,206,967 | 95.9% | |
| 2031 | 3 | 38,939 | 3.5 | | 854,484 | 2.1 | | 1,109,175 | 98.3% | | $40,061,451 | 98.0% | |
| 2032 | 4 | 3,576 | 0.3 | | 446,249 | 1.1 | | 1,112,751 | 98.6% | | $40,507,699 | 99.1% | |
| 2033 | 1 | 15,581 | 1.4 | | 358,363 | 0.9 | | 1,128,332 | 100.0% | | $40,866,062 | 100.0% | |
| 2034 & Beyond | 0 | 0 | 0. | | 0 | 0 | | 1,128,332 | 100.0% | | $40,866,062 | 100.0% | |
| Collateral Total | 180 | 1,128,332 | 100.0 | % | $40,866,062 | 100.0 | % | | | | |
| (1) | Based on the underwritten rent roll dated as of November 30, 2022. |
| (2) | Certain leases may have termination options that are exercisable prior to the originally stated expiration date of the lease and that are not considered in this Lease Rollover Schedule. |
| (3) | UW Base Rent Expiring, % of UW Base Rent Expiring and Cumulative % of UW Base Rent Expiring are comprised of underwritten base rent inclusive of contractual rent steps through January 2024, percentage rent in lieu, total recoveries (excluding utilities) at step and overage rent. |
The following table presents certain information relating to the operating history and underwritten cash flows of the Great Lakes Crossing Outlets Property:
| Operating History and Underwritten Net Cash Flow(1) |
| | 2019 | 2020 | 2021 | TTM(2) | Underwritten | Per Square Foot | %(3) |
| Rents in Place | $27,351,881 | $24,157,616 | $25,715,947 | $27,665,175 | $28,969,473 | $25.67 | 57.1 | % |
| Other Revenue/Rents(4) | 21,677,084 | 19,516,740 | 19,612,241 | 19,003,929 | 21,777,155 | 19.30 | 42.9 | |
| Gross Potential Rent | $49,028,964 | $43,674,356 | $45,328,188 | $46,669,104 | $50,746,628 | $44.97 | 100.0 | % |
| (Vacancy/Credit Loss) | (479,579) | (2,965,788) | 1,933,578 | (244,977) | (3,745,989) | (3.32) | (7.4 | ) |
| Effective Gross Income | $48,549,386 | $40,708,568 | $47,261,766 | $46,424,127 | $47,000,639 | $41.65 | 92.6 | % |
| | | | | | | | | |
| Total Expenses(5) | $14,304,642 | $12,857,184 | $14,350,428 | $14,768,491 | $15,438,872 | $13.68 | 32.8 | % |
| | | | | | | | |
| Net Operating Income | $34,244,744 | $27,851,384 | $32,911,337 | $31,655,635 | $31,561,767 | $27.97 | 67.2 | % |
| | | | | | | | |
| Capital Expenditures | 0 | 0 | 0 | 0 | 259,516 | 0.23 | 0.6 | |
| TI / LC | 0 | 0 | 0 | 0 | 1,567,562 | 1.39 | 3.3 | |
| | | | | | | | |
| Net Cash Flow | $34,244,744 | $27,851,384 | $32,911,337 | $31,655,635 | $29,734,689 | $26.35 | 63.3 | % |
| (1) | Based on the underwritten rent roll dated November 30, 2022. |
| (2) | TTM represents the trailing 12-month period ending November 30, 2022. |
| (3) | % column represents percent of Gross Potential Rent for all revenue lines and represents percent of Effective Gross Income for the remainder of fields. |
| (4) | Other Revenue/Rents consists of overage rent, short term temporary tenant rent, RMU/center ops rents, market revenue from vacant units total commercial reimbursement revenue and other revenue. |
| (5) | Total Expenses include real estate taxes and a management fee equal to 4.0% of Effective Gross Income. |
| THE INFORMATION IN THIS STRUCTURAL AND COLLATERAL TERM SHEET IS NOT COMPLETE AND MAY BE AMENDED PRIOR TO THE TIME OF SALE. THIS TERM SHEET IS NOT AN OFFER TO SELL THESE SECURITIES AND IT IS NOT A SOLICITATION OF AN OFFER TO BUY THESE SECURITIES IN ANY JURISDICTION WHERE THE OFFER OR SALE IS NOT PERMITTED. |
| | 53 | |
| Structural and Collateral Term Sheet | | BMO 2023-C5 |
| No. 5 – Great Lakes Crossing Outlets |
The Market. The Great Lakes Crossing Outlets Property is located in Auburn Hills, Michigan, within the Detroit metropolitan statistical area (the “Detroit MSA”). According to the appraisal, the Detroit MSA has grown to be the second largest metropolitan area in the Midwest, having a strategic regional location, a good transportation system, and a large manufacturing base. The presence of Ford, General Motors and Chrysler has historically supported much of the economic growth and employment in the Detroit MSA, and as of the past few decades is beginning to rely on the health care industry for long-term growth. According to the appraisal, as of August 2022, the unemployment rate in the Detroit MSA was 3.5%, representing a 2.65% increase in employment from the year prior.
The Great Lakes Crossing Outlets Property is located alongside I-75, which according to the appraisal has a daily traffic count of 71,265 vehicles. According to the appraisal, the Great Lakes Crossing Outlets Property is conveniently accessible to the 2.1 million residents that live within the trade area, providing a strong local customer base. Further, given its proximate location to Canada, the Great Lakes Crossing Outlets Property benefits from cross-border commerce. According to the appraisal, as of 2022, the estimated population within a one-mile, three-mile and five-mile radius totaled 2,140, 42,016 and 135,040 people, respectively, and average household income for the same radii was $89,356, $90,320 and $99,774, respectively.
According to the appraisal, the Great Lakes Crossing Outlets Property is situated within the Detroit retail market and the Pontiac submarket. As of the third quarter of 2022, the Detroit retail market contained total inventory of approximately 260.5 million square feet with an approximate 5.0% vacancy rate and average annual rental rates of $17.80 per square foot, and the Pontiac submarket contained a total inventory of approximately 8.2 million square feet with an approximate 2.7% vacancy rate and average annual rental rates of $17.93 per square foot.
The appraiser identified five comparable retail properties to the Great Lakes Crossing Outlets Property:
| Competitive Retail Center Summary(1) |
| Property Name/Location | Year Built / Renovated or Expanded | Total NRA (SF)(2) | Total Occupancy | Distance to Subject | Sales PSF(2) | Anchor Tenants |
Great Lakes Crossing Outlets 4000 Baldwin Road Auburn Hills, MI | 1998 / 2010 | 1,128,332 | 89.6% | NAP | $503.40(3) | Round 1 Bowling Amusement Forever 21 Marshalls Legoland Discovery Center Nordstrom Rack TJ Maxx Burlington Coat Factory |
Westfield Santa Anita Arcadia, CA | 1973 / 2014, 2021 | 1,480,000 | 89.0% | 2,287 miles | $608.00 | JCPenney Nordstrom Macy’s |
Biltmore Fashion Park Scottsdale, AZ | 1963 / 2021 | 384,342 | 87.0% | 2,024 miles | $830.00 | Sak’s Fifth Avenue Macy’s |
Westfield Brandon Brandon, FL | 1995 / 2007 | 1,149,543 | 93.0% | 1,213 miles | $711.00(4) | Dillard’s Macy’s JCPenney |
Galleria Edina Edina, MN | 1974 / 2006 | 398,585 | 99.0% | 720 miles | $891.00 | Rypen Furniture |
University Mall South Burlington, VT | 1979 / 2018 | 613,915 | 95.0% | 637 miles | $325.00 | Target JCPenney Kohl’s |
| (1) | Source: Appraisal unless otherwise indicated. |
| (2) | Based on the underwritten rent roll dated November 30, 2022, including four tenants that have signed leases but have not taken physical occupancy. The Total NRA (SF) and Sales PSF information represented in the above table for the Great Lakes Crossing Outlets Property is only for the collateral for the Great Lakes Crossing Outlets Whole Loan. |
| (3) | Based on October 2022 trailing twelve months reported sales figures. |
| (4) | Includes Apple sales figures. Sales excluding Apple are $550. |
| THE INFORMATION IN THIS STRUCTURAL AND COLLATERAL TERM SHEET IS NOT COMPLETE AND MAY BE AMENDED PRIOR TO THE TIME OF SALE. THIS TERM SHEET IS NOT AN OFFER TO SELL THESE SECURITIES AND IT IS NOT A SOLICITATION OF AN OFFER TO BUY THESE SECURITIES IN ANY JURISDICTION WHERE THE OFFER OR SALE IS NOT PERMITTED. |
| | 54 | |
| Structural and Collateral Term Sheet | | BMO 2023-C5 |
| No. 5 – Great Lakes Crossing Outlets |
The Borrower. The borrower is Taubman Auburn Hills Associates Limited Partnership, a Delaware limited partnership. The borrower is a single purpose bankruptcy-remote entity with two independent managers in its organizational structure. Legal counsel to the borrower delivered a non-consolidation opinion in connection with the origination of the Great Lakes Crossing Outlets Whole Loan.
The Borrower Sponsor. The borrower sponsor and non-recourse carveout guarantor is The Taubman Realty Group LLC (“Taubman”). Founded in 1950, Taubman develops and manages regional, super-regional and outlet shopping centers. Including Great Lakes Crossing Outlets, Taubman owns and operates 24 regional, super-regional and outlet malls across 11 states, Puerto Rico, China, and South Korea.
Pursuant to the Great Lakes Crossing Outlets Whole Loan documents, so long as one or more of Taubman, Simon Property Group, Inc., Simon Property Group, L.P. or an affiliate of any of the foregoing is the non-recourse carveout guarantor, the non-recourse carveout guarantor’s liability is limited to 20% of the outstanding principal balance at such time, in the aggregate, plus all of the reasonable out-of-pocket costs and expenses (including court costs and reasonable attorneys’ fees) incurred by the lender in the enforcement of the related guaranty or the preservation of the lender’s rights under such guaranty
Property Management. The Great Lakes Crossing Outlets Property is managed by The Taubman Company LLC, which is an affiliate of the borrower sponsor.
Escrows and Reserves. At origination of the Great Lakes Crossing Outlets Whole Loan, the borrower was required to deposit into escrow (i) $1,581,204.38 for a reserve with respect to outstanding tenant improvement allowances, leasing commissions and unfunded obligations under leases for the tenants Kids Empire, Nordstrom Rack, Showcase, Tumi, UGG and Vineyard Vines (the “Outstanding TI/LC Reserve”) and (ii) $224,418.36 for a reserve with respect to gap rent under leases for the tenants Savvy Sliders, Cotton On Kids, Cotton On and Kids Empire (the “Gap Rent Reserve”). In lieu of remitting such amounts for deposit, provided that no event of default is continuing the borrower may fund the Outstanding TI/LC Reserve or the Gap Rent Reserve by delivering to the lender (i) upon at least 10 days’ written notice to the lender, a qualifying letter of credit in the applicable amount or (ii) a qualifying guaranty in the applicable amount, in each case in accordance with the Great Lakes Crossing Outlets Whole Loan documents.
Tax Escrows – During a Lockbox Event Period (as defined below) or at any time (x) any taxes are not paid by the borrower prior to the assessment of any penalty for late payment and prior to the date that such taxes become delinquent (unless the borrower is contesting such taxes in accordance with the terms of the Great Lakes Crossing Outlets Whole Loan documents), or (y) upon request of the lender, the borrower fails to promptly provide evidence reasonably satisfactory to the lender that such taxes have been paid prior to the assessment of any penalty for late payment and prior to the date that such taxes become delinquent (unless the borrower is contesting such taxes in accordance with the terms of the Great Lakes Crossing Outlets Whole Loan documents), the borrower is required to deposit into a real estate tax reserve, on a monthly basis, 1/12 of the reasonably estimated annual real estate taxes; in lieu of remitting such amounts for deposit, the borrower may fund the tax reserve by delivering to the lender (i) upon at least 10 days written notice to the lender, a qualifying letter of credit in such amount or (ii) provided that no event of default is continuing, a qualifying guaranty in such amount, in each case in accordance with the Great Lakes Crossing Outlets Whole Loan documents.
Insurance Escrows – In the event that during a Lockbox Event Period the borrower has not provided satisfactory evidence to the lender that the Great Lakes Crossing Outlets Property is covered by policies that are being maintained as part of a reasonably acceptable blanket insurance policy in accordance with the Great Lakes Crossing Outlets Whole Loan documents, on each monthly payment date during the Lockbox Event Period, the borrower is required to deposit into an insurance reserve, 1/12 of reasonably estimated insurance premiums; in lieu of remitting such amounts for deposit, the borrower may fund the insurance reserve by delivering to the lender (i) upon at least 10 days written notice to the lender, a qualifying letter of credit in such amount or (ii) provided that no event of default is continuing, a qualifying guaranty in such amount, in each case in accordance with the Great Lakes Crossing Outlets Whole Loan documents.
Replacement Reserve – On each monthly payment date during a Lockbox Event Period, the borrower is required to deposit into a replacement reserve, an amount equal to $21,626.36 if the balance on deposit in the replacement reserve account is less than $519,032.72 for reasonably estimated replacements and repairs required to be made to the Great Lakes Crossing
| THE INFORMATION IN THIS STRUCTURAL AND COLLATERAL TERM SHEET IS NOT COMPLETE AND MAY BE AMENDED PRIOR TO THE TIME OF SALE. THIS TERM SHEET IS NOT AN OFFER TO SELL THESE SECURITIES AND IT IS NOT A SOLICITATION OF AN OFFER TO BUY THESE SECURITIES IN ANY JURISDICTION WHERE THE OFFER OR SALE IS NOT PERMITTED. |
| | 55 | |
| Structural and Collateral Term Sheet | | BMO 2023-C5 |
| No. 5 – Great Lakes Crossing Outlets |
Outlets Property during each calendar year; provided, however, that in lieu of remitting such amounts for deposit, the borrower may fund the replacement reserve by delivering to the lender (i) upon at least 10 days written notice to the lender, a qualifying letter of credit in such amount or (ii) provided that no Control Event (as defined below) or event of default is continuing, a qualifying guaranty in such amount, in each case in accordance with the Great Lakes Crossing Outlets Whole Loan documents.
TI/LC Reserve – The borrower is required to deposit into a rollover reserve, on a monthly basis, an amount equal to $94,027.67 if the balance of the rollover reserve falls below $2,256,664; in lieu of remitting such amounts for deposit, the borrower may fund the rollover reserve by delivering to the lender (i) upon at least 10 days written notice to the lender, a qualifying letter of credit in such amount or (ii) provided that no Control Event or event of default is continuing, a qualifying guaranty in such amount, in each case in accordance with the Great Lakes Crossing Outlets Whole Loan documents.
A “Control Event” means that any combination of Taubman, Simon Property Group, Inc. or Simon Property Group, L.P. does not own, in the aggregate, at least 30% of the direct or indirect interests in the borrower or does not control the borrower.
Lockbox / Cash Management. The Great Lakes Crossing Outlets Whole Loan is structured with a hard lockbox and springing cash management. At origination of the Great Lakes Crossing Outlets Whole Loan, the borrower was required to direct each tenant to remit all rents directly to a lender-controlled lockbox account. In addition, the borrower is required to, and is required to cause the property manager to, cause all amounts constituting rents received by the borrower or the property manager with respect to the Great Lakes Crossing Outlets Property to be deposited into the lockbox account or a lender-controlled cash management account by the end of the second business day following receipt. In addition, the borrower is required to, and is required to cause the property manager to, instruct all persons that maintain open accounts with the borrower or property manager with respect to the Great Lakes Crossing Outlets Property or with whom the borrower or property manager does business on an “accounts receivable” basis with respect to the Great Lakes Crossing Outlets Property to deliver all payments due under such accounts to the lockbox account. On a weekly basis during the continuance of a Lockbox Event Period under the Great Lakes Crossing Outlets Whole Loan documents, all amounts in the lockbox are required to be remitted to the cash management account. On a daily basis at any time no Lockbox Event Period is in effect, all amounts in the lockbox account are required to be remitted to a borrower-controlled operating account.
Notwithstanding anything to the contrary in the foregoing, the borrower may maintain an account in its name into which it may deposit or cause to be deposited rents from persons who are parties to a Great Lakes Crossing Outlets License Agreement (as defined below) and miscellaneous amounts received by the borrower that are not rents, payments, reimbursements or other amounts paid under leases, provided that if a Lockbox Event Period exists, at the lender’s direction, the borrower is required to direct all persons who are parties to a Great Lakes Crossing Outlets License Agreement to deliver all sums due under such Great Lakes Crossing Outlets License Agreements directly to the lockbox account. To the extent any such sums are collected directly by the borrower or property manager, the borrower is required to, and is required to cause the property manager to, cause all such sums received by the borrower or property manager to be deposited into the lockbox account by the end of the second business day following receipt.
On each due date during the continuance of a Lockbox Event Period, all funds on deposit in the cash management account after payment of debt service on the Great Lakes Crossing Outlets Whole Loan, required reserves and budgeted operating expenses are required to be deposited into an excess cash flow reserve account as additional collateral for the Great Lakes Crossing Outlets Whole Loan.
A “Great Lakes Crossing Outlets License Agreement” means any license or occupancy agreement granted by the borrower (or a predecessor-in-interest) to (i) an operator of a cart, kiosk or similar merchandising facilities located in the common areas of the Great Lakes Crossing Outlets Property or (ii) a licensee or occupant of an in-line space for a term of one year or less.
A “Lockbox Event” means the occurrence of: (i) an event of default; (ii) any bankruptcy action of the borrower; (iii) a bankruptcy action of the property manager if the property manager is an affiliate of the borrower, provided that the property manager is not replaced within 60 days with a qualified property manager; or (iv) a Debt Yield Trigger Event (as defined below).
| THE INFORMATION IN THIS STRUCTURAL AND COLLATERAL TERM SHEET IS NOT COMPLETE AND MAY BE AMENDED PRIOR TO THE TIME OF SALE. THIS TERM SHEET IS NOT AN OFFER TO SELL THESE SECURITIES AND IT IS NOT A SOLICITATION OF AN OFFER TO BUY THESE SECURITIES IN ANY JURISDICTION WHERE THE OFFER OR SALE IS NOT PERMITTED. |
| | 56 | |
| Structural and Collateral Term Sheet | | BMO 2023-C5 |
| No. 5 – Great Lakes Crossing Outlets |
A “Lockbox Event Period” means the period commencing on the occurrence of a Lockbox Event and continuing until the occurrence of the applicable Lockbox Termination Event (as defined below).
A “Debt Yield Trigger Event” means, as of any date of determination, the debt yield based on the trailing four calendar quarter period immediately preceding such date of determination is less than 12.00% for two consecutive calendar quarters.
A “Lockbox Termination Event” means (a) if the Lockbox Event is caused solely by the occurrence of a Debt Yield Trigger Event, the achievement of a debt yield for the Great Lakes Crossing Outlets Whole Loan of 12.00% or greater for two consecutive calendar quarters, (b) if the Lockbox Event is caused solely by an event of default, the acceptance by the lender of a cure of such event of default (which cure the lender is not obligated to accept and may reject or accept in its sole and absolute discretion) provided that the lender has not accelerated the Great Lakes Crossing Outlets Whole Loan, moved for a receiver or commenced foreclosure proceedings or (c) if the Lockbox Event is caused solely by a bankruptcy action of the property manager, if the borrower replaces the property manager with a qualified property manager under a replacement property management agreement within 60 days or such bankruptcy action of the property manager is discharged or dismissed within 90 days without any adverse consequences to the Great Lakes Crossing Outlets Property or the Great Lakes Crossing Outlets Whole Loan; provided, however, that, each such Lockbox Termination Event is subject to the following conditions: (i) no other Lockbox Event has occurred and is continuing, (ii) no other event of default has occurred and is continuing under the Great Lakes Crossing Outlets Whole Loan documents, (iii) the borrower may not cure a Lockbox Event (x) more than a total of five times in the aggregate during the term of the Great Lakes Crossing Outlets Whole Loan or (y) triggered by a bankruptcy action of the borrower at any time during the term of the Great Lakes Crossing Outlets Whole Loan and (iv) the borrower has paid all of the lender’s reasonable out-of-pocket expenses incurred in connection with such Lockbox Termination Event, including reasonable attorney’s fees and expenses.
Subordinate Debt. None.
Mezzanine Debt. None.
Partial Release. Not permitted.
Ground Lease. None.
| THE INFORMATION IN THIS STRUCTURAL AND COLLATERAL TERM SHEET IS NOT COMPLETE AND MAY BE AMENDED PRIOR TO THE TIME OF SALE. THIS TERM SHEET IS NOT AN OFFER TO SELL THESE SECURITIES AND IT IS NOT A SOLICITATION OF AN OFFER TO BUY THESE SECURITIES IN ANY JURISDICTION WHERE THE OFFER OR SALE IS NOT PERMITTED. |
| | 57 | |
| Structural and Collateral Term Sheet | | BMO 2023-C5 |
| No. 6 – Oak Street NLP Fund Portfolio |
| THE INFORMATION IN THIS STRUCTURAL AND COLLATERAL TERM SHEET IS NOT COMPLETE AND MAY BE AMENDED PRIOR TO THE TIME OF SALE. THIS TERM SHEET IS NOT AN OFFER TO SELL THESE SECURITIES AND IT IS NOT A SOLICITATION OF AN OFFER TO BUY THESE SECURITIES IN ANY JURISDICTION WHERE THE OFFER OR SALE IS NOT PERMITTED. |
| | 58 | |
| Structural and Collateral Term Sheet | | BMO 2023-C5 |
| No. 6 – Oak Street NLP Fund Portfolio |
| THE INFORMATION IN THIS STRUCTURAL AND COLLATERAL TERM SHEET IS NOT COMPLETE AND MAY BE AMENDED PRIOR TO THE TIME OF SALE. THIS TERM SHEET IS NOT AN OFFER TO SELL THESE SECURITIES AND IT IS NOT A SOLICITATION OF AN OFFER TO BUY THESE SECURITIES IN ANY JURISDICTION WHERE THE OFFER OR SALE IS NOT PERMITTED. |
| | 59 | |
| Structural and Collateral Term Sheet | | BMO 2023-C5 |
| No. 6 – Oak Street NLP Fund Portfolio |
| Mortgage Loan Information | | Property Information |
| Mortgage Loan Seller: | KeyBank | | Single Asset / Portfolio: | Portfolio |
| Original Principal Balance(1): | $30,000,000 | | Title: | Fee/Leasehold |
| Cut-off Date Principal Balance(1): | $30,000,000 | | Property Type – Subtype(5): | Various – Various |
| % of IPB: | 4.5% | | Net Rentable Area (SF): | 6,470,388 |
| Loan Purpose: | Recapitalization | | Location: | Various |
| Borrowers: | Various(2) | | Year Built / Renovated(5): | Various / Various |
| Borrower Sponsors: | Blue Owl Capital, Inc. and Oak Street Real Estate Capital, LLC | | Occupancy(6): | 100.0% |
| | | Occupancy Date: | 2/23/2023 |
| Interest Rate: | 6.13800% | | 4th Most Recent NOI (As of)(7): | NAV |
| Note Date: | 2/23/2023 | | 3rd Most Recent NOI (As of)(7): | NAV |
| Maturity Date: | 3/11/2028 | | 2nd Most Recent NOI (As of)(7): | NAV |
| Interest-only Period: | 60 months | | Most Recent NOI (As of)(8): | $55,257,111 (12/31/2022) |
| Original Term: | 60 months | | UW Economic Occupancy: | 95.0% |
| Original Amortization Term: | None | | UW Revenues: | $82,796,630 |
| Amortization Type: | Interest Only | | UW Expenses: | $21,989,943 |
| Call Protection: | L(27),D(26),O(7) | | UW NOI: | $60,806,687 |
| Lockbox / Cash Management: | Hard / In Place | | UW NCF: | $57,258,714 |
| Additional Debt(1): | Yes | | Appraised Value / Per SF: | $1,051,080,000 / $162 |
| Additional Debt Balance(1): | $310,000,000 / $85,000,000 | | Appraisal Date(9): | Various |
| Additional Debt Type(1): | Pari Passu / Subordinate | | | |
| | | | | |
| Escrows and Reserves(3) | | Financial Information(1) |
| | Initial | Monthly | Initial Cap | | | Senior Notes | Whole Loan |
| Taxes: | $0 | Springing | N/A | | Cut-off Date Loan / SF: | $53 | $66 |
| Insurance: | $0 | Springing | N/A | | Maturity Date Loan / SF: | $53 | $66 |
| Immediate Repairs(4): | $27,550 | $0 | N/A | | Cut-off Date LTV: | 32.3% | 40.4% |
| Save Mart LOC Reserve: | $0 | Springing | N/A | | Maturity Date LTV: | 32.3% | 40.4% |
| | | | | | UW NCF DSCR: | 2.71x | 2.16x |
| | | | | | UW NOI Debt Yield: | 17.9% | 14.3% |
| | | | | | | |
| Sources and Uses |
| Sources | Proceeds | % of Total | | Uses | Proceeds | % of Total |
| Senior Loan | $340,000,000 | 80.0 | % | | Return of Equity(10) | $413,683,950 | 97.3 | % |
| Subordinate Loan | 85,000,000 | 20.0 | | | Closing Costs | 11,288,500 | 2.7 | |
| | | | | Reserves | 27,550 | 0.0 | |
| Total Sources | $425,000,000 | 100.0 | % | | Total Uses | $425,000,000 | 100.0 | % |
| (1) | The Oak Street NLP Fund Portfolio Mortgage Loan (as defined below) is part of a whole loan evidenced by seven senior pari passu notes totaling $340.0 million and two subordinate companion notes totaling $85.0 million, with an aggregate outstanding principal balance as of the Cut-off Date of $425.0 million. The Financial Information presented in the chart above reflects the Oak Street NLP Fund Portfolio Senior Loan (as defined below) and the Oak Street NLP Fund Portfolio Whole Loan. |
| (2) | The borrowers are BGCT001 LLC, BIGDUOK001 LLC, BIGTRPA001 LLC, Save Mart Portfolio Owner NLP CA LLC, Save Mart Portfolio Owner NLP NV LLC, NSDBRFL001 LLC, BCDC Portfolio Owner LLC, BCHQ Owner LLC and NAICHOK001 LLC. |
| (3) | For a full description of escrows and reserves, please refer to “Escrows and Reserves” below. |
| (4) | Property condition reports dated between January 3, 2023 and January 25, 2023, identified immediate repairs in the aggregate amount of approximately $2,205,183, which are the responsibility of the tenants at the Oak Street NLP Fund Portfolio Properties (as defined below) and for which only the life safety and ADA repairs were reserved. |
| (5) | See “Portfolio Summary” table herein. |
| (6) | The Oak Street NLP Fund Portfolio Properties are 100.0% leased and 96.2% physically occupied. |
| (7) | Historical NOI is unavailable as the Oak Street NLP Fund Portfolio Properties were acquired by the borrowers between May 2019 and August 2022, and such information was not provided by the sellers. |
| (8) | Represents partial year financial information for eight assets acquired in 2022. |
| (9) | The individual appraisal valuation dates range from December 12, 2022 to January 3, 2023. |
| (10) | The Oak Street NLP Fund Portfolio Properties were acquired between May 2019 and August 2022 and were previously unencumbered. |
| THE INFORMATION IN THIS STRUCTURAL AND COLLATERAL TERM SHEET IS NOT COMPLETE AND MAY BE AMENDED PRIOR TO THE TIME OF SALE. THIS TERM SHEET IS NOT AN OFFER TO SELL THESE SECURITIES AND IT IS NOT A SOLICITATION OF AN OFFER TO BUY THESE SECURITIES IN ANY JURISDICTION WHERE THE OFFER OR SALE IS NOT PERMITTED. |
| | 60 | |
| Structural and Collateral Term Sheet | | BMO 2023-C5 |
| No. 6 – Oak Street NLP Fund Portfolio |
The Loan. The sixth largest mortgage loan (the “Oak Street NLP Fund Portfolio Mortgage Loan”) is part of a whole loan (the “Oak Street NLP Fund Portfolio Whole Loan”) that is evidenced by seven pari passu senior promissory notes in the aggregate original principal amount of $340,000,000 (collectively, the “Oak Street NLP Fund Portfolio Senior Loan”) and two pari passu subordinate promissory notes in the aggregate original principal amount of $85,000,000 (collectively, the “Oak Street NLP Fund Portfolio Subordinate Companion Loan”). The Oak Street NLP Fund Portfolio Whole Loan was co-originated on February 23, 2023, by Wells Fargo Bank, National Association (“WFB”) and KeyBank. The Oak Street NLP Fund Portfolio Whole Loan is secured by a first priority mortgage on the borrowers’ fee simple interests in retail, office and industrial properties comprising 6,320,757 square feet and a leasehold interest in a 149,631 square foot retail property, located across eight states (collectively, the “Oak Street NLP Fund Portfolio Properties” and, each individually, an “Oak Street NLP Fund Portfolio Property”). The Oak Street NLP Fund Portfolio Mortgage Loan is evidenced by the non-controlling promissory note A-6 in the original principal amount of $30,000,000. The remaining promissory notes comprising the Oak Street NLP Fund Portfolio Whole Loan are summarized in the table below. The Oak Street NLP Fund Portfolio Whole Loan is being serviced pursuant to the trust and servicing agreement for the OAKST 2023-NLP securitization trust. The Oak Street NLP Fund Portfolio Senior Loan pari passu notes other than those evidencing the Oak Street NLP Fund Portfolio Mortgage Loan are referred to herein as the “Oak Street NLP Fund Portfolio Non-Serviced Pari Passu Companion Loans”. See “Description of the Mortgage Pool—The Whole Loans—The Oak Street NLP Fund Portfolio Pari Passu A-B Whole Loan” and “The Pooling and Servicing Agreement—Servicing of the Outside Serviced Mortgage Loans” in the Preliminary Prospectus.
| Whole Loan Summary |
| Note | Original Balance | Cut-off Date Balance | Note Holder | Controlling Piece |
| A-1 | $123,500,000 | | $123,500,000 | OAKST 2023-NLP | Yes |
| A-2 | $50,000,000 | | $50,000,000 | BANK5 2023-5YR1 | No |
| A-3 | $27,500,000 | | $27,500,000 | BANK5 2023-5YR1 | No |
| A-4 | $20,000,000 | | $20,000,000 | BANK5 2023-5YR1 | No |
| A-5 | $66,500,000 | | $66,500,000 | OAKST 2023-NLP | No |
| A-6 | $30,000,000 | | $30,000,000 | BMO 2023-C5 | No |
| A-7 | $22,500,000 | | $22,500,000 | BBCMS 2023-C19 | No |
| Total Senior Loan | $340,000,000 | | $340,000,000 | | |
| B-1, B-2 | $85,000,000 | | $85,000,000 | OAKST 2023-NLP | No |
| Whole Loan | $425,000,000 | | $425,000,000 | | |
The Properties. The Oak Street NLP Fund Portfolio Properties comprise 31 retail properties, seven industrial properties and four office properties totaling 6,470,388 square feet that are located across eight states. The Oak Street NLP Fund Portfolio Properties are located in California (27 properties, 28.6% of net rentable area), Oklahoma (two properties, 22.5% of net rentable area), Pennsylvania (one property, 20.0% of net rentable area), Florida (six properties, 11.7% of net rentable area), Georgia (one property, 8.3% of net rentable area), North Carolina (one property, 5.7% of net rentable area), Nevada (three properties, 2.3% of net rentable area), and Connecticut (one property, 0.9% of net rentable area).
Built between 1912 and 2019, with 16 properties renovated between 1954 and 2022, the Oak Street NLP Fund Portfolio Properties range in size from 8,270 square feet to 1,296,562 square feet.
The Oak Street NLP Fund Portfolio Properties are net leased to six tenants: Save Mart Supermarkets (“Save Mart”), Big Lots, Inc. (“Big Lots”), W.S. Badcock Corporation (“Badcock”), Chandler Insurance Company, LTD., Nation Motor Club, LLC (“Nation Motor Club”) and Big Y Foods, Inc. (“Big Y”), all of which are subject to eight triple-net leases. All of the Oak Street NLP Fund Portfolio Properties have leases expiring after the stated maturity date of the Oak Street NLP Fund Portfolio Whole Loan with a weighted average remaining lease term of 18.2 years. No tenants have termination options. As of February 23, 2023, the Oak Street NLP Fund Portfolio Properties are 100.0% leased and 96.2% physically occupied.
| THE INFORMATION IN THIS STRUCTURAL AND COLLATERAL TERM SHEET IS NOT COMPLETE AND MAY BE AMENDED PRIOR TO THE TIME OF SALE. THIS TERM SHEET IS NOT AN OFFER TO SELL THESE SECURITIES AND IT IS NOT A SOLICITATION OF AN OFFER TO BUY THESE SECURITIES IN ANY JURISDICTION WHERE THE OFFER OR SALE IS NOT PERMITTED. |
| | 61 | |
| Structural and Collateral Term Sheet | | BMO 2023-C5 |
| No. 6 – Oak Street NLP Fund Portfolio |
The following table presents certain information relating to the Oak Street NLP Fund Portfolio Properties:
| Portfolio Summary |
| Property Name | Allocated
Whole Loan Amount (“ALA”) | % of ALA | Property Type | Year Built/ Renovated | Net Rentable Area (SF) | Appraised Value | Allocated Cut-off Date LTV(1) | % of UW NOI |
| Big Lots - Tremont, PA | $68,510,000 | 16.1 | % | Industrial | 2000 / NAP | 1,294,548 | $169,430,000 | 40.4 | % | 14.0 | % |
| Big Lots - Durant, OK | 55,780,000 | 13.1 | | Industrial | 2003 / NAP | 1,296,562 | 138,000,000 | 40.4 | | 14.3 | |
| Badcock - LaGrange, GA | 24,360,000 | 5.7 | | Industrial | 2015 / NAP | 537,855 | 60,250,000 | 40.4 | | 6.1 | |
| Badcock - Mebane, NC | 17,990,000 | 4.2 | | Industrial | 2004 / 2019 | 369,420 | 44,500,000 | 40.4 | | 4.5 | |
| Badcock - Mulberry, FL | 17,530,000 | 4.1 | | Industrial | 1991 / 2002 | 371,240 | 43,360,000 | 40.4 | | 4.8 | |
| NAICO - Chandler, OK | 16,660,000 | 3.9 | | Office | 1920 / 2022 | 158,430 | 41,200,000 | 40.4 | | 4.1 | |
| Save Mart Supermarkets - San Pablo, CA(2) | 14,070,000 | 3.3 | | Retail | 1973 / NAP | 109,876 | 34,800,000 | 40.4 | | 3.3 | |
| Nation Safe Driver - Boca Raton, FL | 13,610,000 | 3.2 | | Office | 1981 / 2022 | 139,785 | 33,660,000 | 40.4 | | 3.6 | |
| Save Mart Supermarkets - Fresno, CA (4)(2) | 12,860,000 | 3.0 | | Retail | 1981 / 2007, 2008 | 186,652 | 31,800,000 | 40.4 | | 3.2 | |
| Save Mart Supermarkets - El Cerrito, CA | 10,690,000 | 2.5 | | Retail | 2001 / NAP | 66,778 | 26,430,000 | 40.4 | | 2.4 | |
| Save Mart Supermarkets - Stockton, CA(3) | 10,140,000 | 2.4 | | Retail | 1978 / 2001 | 119,916 | 25,080,000 | 40.4 | | 2.5 | |
| Save Mart Supermarkets - Modesto, CA (4) | 9,280,000 | 2.2 | | Retail | 2001 / NAP | 54,605 | 22,960,000 | 40.4 | | 2.2 | |
| Save Mart Supermarkets - Grass Valley, CA | 9,010,000 | 2.1 | | Retail | 1990 / NAP | 43,737 | 22,290,000 | 40.4 | | 1.9 | |
| Save Mart Supermarkets - Fresno, CA (5)(2) | 8,940,000 | 2.1 | | Retail | 1978 / 1996, 2004, 2015 | 148,270 | 22,100,000 | 40.5 | | 2.0 | |
| Save Mart Supermarkets - Ceres, CA(2) | 8,270,000 | 1.9 | | Retail | 1980 / 2004 | 116,789 | 20,450,000 | 40.4 | | 1.8 | |
| Save Mart Supermarkets - Bakersfield, CA | 8,090,000 | 1.9 | | Retail | 1979 / NAP | 68,337 | 20,010,000 | 40.4 | | 1.8 | |
| Big Y - Milford, CT | 8,010,000 | 1.9 | | Retail | 2019 / NAP | 55,000 | 19,800,000 | 40.5 | | 1.5 | |
| Save Mart Supermarkets - Sparks, NV (2) | 7,210,000 | 1.7 | | Retail | 1999 / 2018 | 52,368 | 17,830,000 | 40.4 | | 1.6 | |
| Save Mart Supermarkets - Tracy, CA | 7,080,000 | 1.7 | | Retail | 1997 / NAP | 61,660 | 17,500,000 | 40.5 | | 1.5 | |
| Save Mart Supermarkets - Folsom, CA(4) | 6,920,000 | 1.6 | | Retail | 1990 / NAP | 49,769 | 17,110,000 | 40.4 | | 1.4 | |
| Save Mart Supermarkets - Tracy, CA (2)(3)(5) | 6,780,000 | 1.6 | | Retail | 1966 / NAP | 149,631 | 16,780,000 | 40.4 | | 2.7 | |
| Save Mart Supermarkets - Napa, CA(2) | 6,170,000 | 1.5 | | Retail | 1969 / 1989 | 51,845 | 15,250,000 | 40.5 | | 1.4 | |
| Badcock - Mulberry, FL (4) | 5,700,000 | 1.3 | | Industrial | 1964 / 1992 | 184,000 | 14,100,000 | 40.4 | | 1.7 | |
| Save Mart Supermarkets - Chico, CA | 5,350,000 | 1.3 | | Retail | 1989 / 2001 | 42,294 | 13,230,000 | 40.4 | | 1.1 | |
| Save Mart Supermarkets - Salinas, CA(4) | 5,330,000 | 1.3 | | Retail | 1998 / 2012 | 62,565 | 13,170,000 | 40.5 | | 1.2 | |
| Save Mart Supermarkets - Kingsburg, CA | 5,260,000 | 1.2 | | Retail | 1999 / NAP | 41,368 | 13,000,000 | 40.5 | | 1.1 | |
| Save Mart Supermarkets - Clovis, CA (3) | 5,220,000 | 1.2 | | Retail | 2002 / NAP | 50,918 | 12,900,000 | 40.5 | | 1.1 | |
| Save Mart Supermarkets - Clovis, CA (2) | 4,850,000 | 1.1 | | Retail | 1984 / 2002 | 52,576 | 11,990,000 | 40.5 | | 1.0 | |
| Save Mart Supermarkets - Vacaville, CA (2) | 4,790,000 | 1.1 | | Retail | 1988 / NAP | 42,630 | 11,840,000 | 40.5 | | 1.0 | |
| Save Mart Supermarkets - Elk Grove, CA | 4,730,000 | 1.1 | | Retail | 1994 / NAP | 45,642 | 11,700,000 | 40.4 | | 1.0 | |
| Save Mart Supermarkets - Manteca, CA | 4,380,000 | 1.0 | | Retail | 1984 / NAP | 35,312 | 10,820,000 | 40.5 | | 1.1 | |
| Save Mart Supermarkets - Fresno, CA (3) | 4,150,000 | 1.0 | | Retail | 1994 / NAP | 58,360 | 10,260,000 | 40.4 | | 0.9 | |
| Save Mart Supermarkets - Lodi, CA | 4,100,000 | 1.0 | | Retail | 1996 / NAP | 50,342 | 10,150,000 | 40.4 | | 0.9 | |
| Save Mart Supermarkets - Sparks, NV | 3,880,000 | 0.9 | | Retail | 1993 / NAP | 47,404 | 9,600,000 | 40.4 | | 0.8 | |
| Save Mart Supermarkets - Carson City, NV | 3,660,000 | 0.9 | | Retail | 1995 / NAP | 52,079 | 9,060,000 | 40.4 | | 0.8 | |
| Save Mart Supermarkets - Oakland, CA(4) | 3,390,000 | 0.8 | | Retail | 1965 / NAP | 21,258 | 8,380,000 | 40.5 | | 0.7 | |
| Save Mart Supermarkets - Coalinga, CA | 3,280,000 | 0.8 | | Retail | 2006 / NAP | 49,749 | 8,100,000 | 40.5 | | 0.8 | |
| Save Mart Supermarkets - Marysville, CA | 3,240,000 | 0.8 | | Retail | 1973 / NAP | 30,080 | 8,010,000 | 40.4 | | 0.7 | |
| Save Mart Supermarkets - Jackson, CA | 2,980,000 | 0.7 | | Retail | 1994 / NAP | 40,593 | 7,370,000 | 40.4 | | 0.7 | |
| Badcock - Mulberry, FL (3) | 2,070,000 | 0.5 | | Office | 1915 / 1986 | 42,750 | 5,130,000 | 40.4 | | 0.6 | |
| Badcock - Mulberry, FL (2) | 430,000 | 0.1 | | Office | 1912 / 1954 | 8,270 | 1,060,000 | 40.6 | | 0.1 | |
| Badcock - Mulberry, FL (5) | 250,000 | 0.1 | | Industrial | 1978 / NAP | 9,125 | 620,000 | 40.3 | | 0.1 | |
| Total/Weighted Average | $425,000,000 | 100.0 | % | | | 6,470,388 | $1,051,080,000 | 40.4 | % | 100.0 | % |
| (1) | Calculated based on the Oak Street NLP Fund Portfolio Whole Loan. |
| (2) | Represents one of five properties where the Save Mart Master Lease incorporates both an anchor space where Save Mart operates a grocery store and additional in-line space, which Save Mart is responsible for subleasing. |
| (3) | Represents one of two properties where the Save Mart Master Lease incorporates both an anchor space where Save Mart subleases or intends to sublease both the anchor space and additional in-line space. |
| (4) | Represents one of three properties where Save Mart subleases its anchor space. |
| (5) | The anchor space at the Save Mart Supermarkets - Tracy, CA (2) property totaling 44,870 square feet is currently dark. |
| THE INFORMATION IN THIS STRUCTURAL AND COLLATERAL TERM SHEET IS NOT COMPLETE AND MAY BE AMENDED PRIOR TO THE TIME OF SALE. THIS TERM SHEET IS NOT AN OFFER TO SELL THESE SECURITIES AND IT IS NOT A SOLICITATION OF AN OFFER TO BUY THESE SECURITIES IN ANY JURISDICTION WHERE THE OFFER OR SALE IS NOT PERMITTED. |
| | 62 | |
| Structural and Collateral Term Sheet | | BMO 2023-C5 |
| No. 6 – Oak Street NLP Fund Portfolio |
The following table presents certain information relating to retail tenant sales history at the Oak Street NLP Fund Portfolio Properties:
| Tenant Sales(1) |
| Property Name | Net Rentable Area (SF) | Anchor SF | 2018 Sales (PSF)(2) | 2019 Sales (PSF)(2) | 2020 Sales (PSF)(2) | 2021 Sales (PSF)(2) | 2022 Sales (PSF)(2) | Occupancy Cost(3) |
| Save Mart Supermarkets - San Pablo, CA(4) | 109,876 | 63,140 | $555 | $561 | $603 | $553 | $620 | 6.1% |
| Save Mart Supermarkets - Fresno, CA (4)(4) | 186,652 | 52,070 | $425 | $419 | $477 | $443 | $479 | 7.8% |
| Save Mart Supermarkets - El Cerrito, CA | 66,778 | 66,778 | $339 | $360 | $482 | $393 | $403 | 5.8% |
| Save Mart Supermarkets - Stockton, CA | 119,916 | 119,916 | NAV | NAV | NAV | NAV | NAV | NAV |
| Save Mart Supermarkets - Modesto, CA (4) | 54,605 | 54,605 | $562 | $586 | $716 | $711 | $718 | 3.4% |
| Save Mart Supermarkets - Grass Valley, CA | 43,737 | 43,737 | $710 | $705 | $809 | $780 | $765 | 3.6% |
| Save Mart Supermarkets - Fresno, CA (5)(4) | 148,270 | 52,620 | $299 | $315 | $422 | $421 | $434 | 5.7% |
| Save Mart Supermarkets - Ceres, CA(4) | 116,789 | 41,095 | $512 | $570 | $698 | $702 | $652 | 4.3% |
| Save Mart Supermarkets - Bakersfield, CA | 68,337 | 68,337 | $427 | $426 | $520 | $495 | $534 | 3.2% |
| Big Y - Milford, CT | 55,000 | 55,000 | NAV | NAV | NAV | NAV | NAV | NAV |
| Save Mart Supermarkets - Sparks, NV (2) | 52,368 | 52,368 | $503 | $546 | $654 | $658 | $558 | 3.4% |
| Save Mart Supermarkets - Tracy, CA | 61,660 | 61,660 | $446 | $468 | $545 | $510 | $507 | 3.1% |
| Save Mart Supermarkets - Folsom, CA | 49,769 | 49,769 | NAV | NAV | NAV | NAV | NAV | NAV |
| Save Mart Supermarkets - Tracy, CA (2) | 149,631 | 149,631 | NAV | NAV | NAV | NAV | NAV | NAV |
| Save Mart Supermarkets - Napa, CA(4) | 51,845 | 39,886 | $336 | $356 | $434 | $395 | $389 | 6.2% |
| Save Mart Supermarkets - Chico, CA | 42,294 | 42,294 | $441 | $498 | $571 | $535 | $548 | 3.1% |
| Save Mart Supermarkets - Salinas, CA | 62,565 | 62,565 | NAV | NAV | NAV | NAV | NAV | NAV |
| Save Mart Supermarkets - Kingsburg, CA | 41,368 | 41,368 | $472 | $497 | $689 | $655 | $696 | 2.4% |
| Save Mart Supermarkets - Clovis, CA (3) | 50,918 | 50,918 | $401 | $414 | $538 | $498 | $506 | 2.8% |
| Save Mart Supermarkets - Clovis, CA (2) | 52,576 | 52,576 | $303 | $329 | $432 | $396 | $410 | 3.1% |
| Save Mart Supermarkets - Vacaville, CA (2) | 42,630 | 42,630 | $339 | $356 | $445 | $419 | $413 | 3.6% |
| Save Mart Supermarkets - Elk Grove, CA | 45,642 | 45,642 | $339 | $356 | $463 | $449 | $473 | 2.9% |
| Save Mart Supermarkets - Manteca, CA | 35,312 | 35,312 | $429 | $470 | $585 | $535 | $565 | 3.3% |
| Save Mart Supermarkets - Fresno, CA (3) | 58,360 | 58,360 | $288 | $291 | $341 | $325 | $337 | 2.9% |
| Save Mart Supermarkets - Lodi, CA | 50,342 | 50,342 | $304 | $325 | $418 | $485 | $484 | 2.2% |
| Save Mart Supermarkets - Sparks, NV | 47,404 | 47,404 | $283 | $303 | $364 | $356 | $388 | 2.8% |
| Save Mart Supermarkets - Carson City, NV | 52,079 | 52,079 | $231 | $245 | $294 | $274 | $305 | 3.0% |
| Save Mart Supermarkets - Oakland, CA | 21,258 | 21,258 | NAV | NAV | NAV | NAV | NAV | NAV |
| Save Mart Supermarkets - Coalinga, CA | 49,749 | 49,749 | $271 | $281 | $341 | $361 | $398 | 2.4% |
| Save Mart Supermarkets - Marysville, CA | 30,080 | 30,080 | $395 | $424 | $582 | $628 | $639 | 2.2% |
| Save Mart Supermarkets - Jackson, CA | 40,593 | 40,593 | $214 | $235 | $320 | $303 | $307 | 3.3% |
| Total/Weighted Average | 2,058,403 | 1,693,782 | $393 | $412 | $506 | $486 | $497 | 3.8% |
| (1) | Information obtained from the borrower, which was provided by the tenant. |
| (2) | Sales PSF are calculated based on the Save Mart sales from the grocery store operated at the site and the square footage occupied by the corresponding grocery store. |
| (3) | Occupancy Cost is based on the underwritten base rent paid by Save Mart on the entire center divided by the 2022 sales from the grocery store operated at the site. The Save Mart underwritten base rent used in the calculation has not been adjusted for the additional in-line space at the five centers where Save Mart is responsible for subleasing the in-line space. |
| (4) | Represents one of five properties where the Save Mart Master Lease incorporates both an anchor space where Save Mart operates a grocery store and additional in-line space, which Save Mart is responsible for subleasing. |
Major Tenants. The three largest tenants based upon underwritten base rent are Save Mart, Big Lots and Badcock.
Save Mart (2,003,403 square feet; 31.0% of portfolio NRA; 44.4% of portfolio underwritten base rent): Save Mart is a grocery chain that operates approximately 200 stores under the banners of Save Mart, Lucky California and FoodMaxx throughout California and Nevada. Save Mart was acquired by Kingswood Capital Management LP (“Kingswood”) in March 2022. Thirty of the Oak Street NLP Fund Portfolio Properties are leased to Save Mart under a master lease (“Save Mart Master Lease Properties”), which expires on November 30, 2044, with no termination options and one, five-year renewal option and one, five-year and 11-month renewal option (the “Save Mart Master Lease”). At 25 of the Save Mart Master Lease Properties, a Save Mart-operated grocery store is the anchor tenant. These 25 stores report weighted average 2022 sales
| THE INFORMATION IN THIS STRUCTURAL AND COLLATERAL TERM SHEET IS NOT COMPLETE AND MAY BE AMENDED PRIOR TO THE TIME OF SALE. THIS TERM SHEET IS NOT AN OFFER TO SELL THESE SECURITIES AND IT IS NOT A SOLICITATION OF AN OFFER TO BUY THESE SECURITIES IN ANY JURISDICTION WHERE THE OFFER OR SALE IS NOT PERMITTED. |
| | 63 | |
| Structural and Collateral Term Sheet | | BMO 2023-C5 |
| No. 6 – Oak Street NLP Fund Portfolio |
of $497 per square foot with a weighted average occupancy cost of 3.8%. Of the remaining five Save Mart Master Lease Properties, Save Mart subleased four anchor locations and is in discussions for a potential sublease for one vacant space. Seven of the Save Mart Master Lease Properties cover the entire center where Save Mart occupies only the anchor space and is responsible for subleasing the remaining in-line space.
In connection with Kingswood’s acquisition of Save Mart, Kingswood was required to provide a letter of credit (the “Save Mart LOC”) in an amount equal to 18 months of the then base rent under the Save Mart Master Lease. See “Escrows and Reserves” below.
Big Lots (2,591,110 square feet; 40.0% of portfolio NRA; 28.4% of portfolio underwritten base rent). Big Lots (NYSE: BIG) is a Columbus, Ohio based discount retailer that operates 1,431 stores across 47 states, in addition to an e-commerce platform, as of January 29, 2022. The company sells a variety of brand name products across seven merchandise categories: Food; Consumables; Soft Home; Hard Home; Furniture; Seasonal; and Apparel, Electronics, & Other – all within the discount retail segment. Two of the industrial properties within the Oak Street NLP Fund Portfolio Properties are leased to Big Lots through June 30, 2040, under separate leases. The Big Lots - Durant, OK property has 10, five-year renewal options and the Big Lots - Tremont, PA property has one, five-year, one, four-year, and eight, five-year renewal options. Big Lots does not have any termination options under either lease.
Badcock (1,522,660 square feet; 23.5% of portfolio NRA; 17.9% of portfolio underwritten base rent): Founded in 1904, Badcock is a home furnishing company that operates 383 stores in eight southeastern states. On November 22, 2021, Franchise Group, Inc. (NASDAQ: FRG) acquired Badcock in an all-cash transaction valued at approximately $580.0 million. Seven of the Oak Street NLP Fund Portfolio Properties are leased to Badcock (the “Badcock Properties”), including five industrial properties totaling 1,471,640 square feet (22.7% of portfolio NRA; 96.6% of Badcock Properties NRA) and two office properties totaling 51,020 square feet (0.8% of portfolio NRA; 3.4% of Badcock Properties NRA). Three of the Badcock Properties totaling 1,278,515 square feet are subject to a master lease through June 30, 2039, and four of the Badcock Properties totaling 244,145 square feet are subject to a master lease through August 31, 2039; each has three, five-year renewal options and no termination options.
Environmental. According to the Phase I environmental assessments dated from January 4, 2023 to January 27, 2023, recognized environmental conditions were identified at the following 12 properties: Save Mart Supermarkets - Fresno, CA (4), Save Mart Supermarkets - Stockton, CA, Save Mart Supermarkets - Fresno, CA (5), Save Mart Supermarkets - Bakersfield, CA, Save Mart Supermarkets - Tracy, CA (2), Save Mart Supermarkets - Napa, CA, Save Mart Supermarkets - Vacaville, CA (2), Save Mart Supermarkets - Fresno, CA (3), Save Mart Supermarkets - Lodi, CA, Save Mart Supermarkets - Oakland, CA, Badcock - Mulberry, FL (3) and Badcock - Mulberry, FL (5). The environmental consultant did not recommend further investigation of the Save Mart Supermarkets – Lodi, CA property and recommended that Phase II environmental site assessments (“Phase II ESAs”) be performed at the remaining 11 properties. In lieu of Phase II ESAs, the lender obtained a lender’s environmental insurance policy and opinions of probable cost in the event that any remediation was necessary in the future, which identified at a 90% confidence interval that any aggregate remediation would not exceed approximately $13.9 million.
No recognized environmental conditions were identified at the remaining 30 Oak Street NLP Fund Portfolio Properties. See “Description of the Mortgage Pool—Environmental Considerations” in the Preliminary Prospectus.
The following table presents certain information relating to the historical and current occupancy of the Oak Street NLP Fund Portfolio Properties:
| Historical and Current Occupancy |
| 2020(1) | 2021(1) | 2022(1) | Current(2)(3) |
| NAV | NAV | NAV | 100.0% |
| (1) | Historical occupancy information is not available, as the Oak Street NLP Fund Portfolio Properties were acquired by the borrowers between May 2019 and August 2022, and such information was not provided by the seller. |
| (2) | Current occupancy is based on the underwritten rent rolls dated as of February 23, 2023. |
| (3) | The Oak Street NLP Fund Portfolio Properties are 100.0% leased and 96.2% physically occupied. |
| THE INFORMATION IN THIS STRUCTURAL AND COLLATERAL TERM SHEET IS NOT COMPLETE AND MAY BE AMENDED PRIOR TO THE TIME OF SALE. THIS TERM SHEET IS NOT AN OFFER TO SELL THESE SECURITIES AND IT IS NOT A SOLICITATION OF AN OFFER TO BUY THESE SECURITIES IN ANY JURISDICTION WHERE THE OFFER OR SALE IS NOT PERMITTED. |
| | 64 | |
| Structural and Collateral Term Sheet | | BMO 2023-C5 |
| No. 6 – Oak Street NLP Fund Portfolio |
The following table presents certain information relating to the largest tenants based on underwritten base rent at the Oak Street NLP Fund Portfolio Properties:
| Top Tenant Summary(1) |
| Tenant | No. of Properties | Ratings
Moody’s/S&P/Fitch(2) | Net Rentable Area (SF) | % of
Total SF | UW
Base Rent PSF(3) |
UW
Base Rent(3) | % of Total
UW Base Rent(3) | Lease
Exp. Date | Term. Option (Y/N) |
| Save Mart(4) | 30 | NR/NR/NR | 2,003,403 | 31.0 | % | $14.26 | $28,565,196 | 44.4 | % | 11/30/2044(5) | N |
| Big Lots | 2 | NR/NR/NR | 2,591,110 | 40.0 | | $7.06 | 18,291,830 | 28.4 | | 6/30/2040(6) | N |
| Badcock | 7 | NR/NR/NR | 1,522,660 | 23.5 | | $7.55 | 11,503,050 | 17.9 | | Various(7) | N |
| Chandler Insurance Company, LTD. | 1 | NR/NR/NR | 158,430 | 2.4 | | $16.46 | 2,607,191 | 4.1 | | 8/31/2039(8) | N |
| Nation Motor Club | 1 | NR/NR/NR | 139,785 | 2.2 | | $17.03 | 2,379,995 | 3.7 | | 12/31/2041(9) | N |
| Big Y | 1 | NR/NR/NR | 55,000 | 0.9 | | $18.00 | 990,000 | 1.5 | | 12/31/2039(10) | N |
| Occupied Collateral Total / Wtd. Avg. | 6,470,388 | 100.0 | % | $9.94 | $64,337,263 | 100.0 | % | | |
| | | | | | | | | | |
| | | | | | | | | | |
| Vacant Space(11) | | | 0 | 0.0 | % | | | | | |
| | | | | | | | | | |
| Collateral Total | | | 6,470,388 | 100.0 | % | | | | | |
| | | | | | | | | | |
| (1) | Based on the underwritten rent roll dated as of February 23, 2023. |
| (2) | Ratings provided are for the parent company of the entity listed in the “Tenant” field whether or not the parent company guarantees the lease. |
| (3) | UW Base Rent PSF, UW Base Rent and % of Total UW Base Rent includes contractual rent steps through December 1, 2023, totaling $1,143,912. |
| (4) | Save Mart has subleased three freestanding properties totaling 133,592 square feet to various tenants. At five of the Save Mart Master Lease Properties totaling 613,432 square feet, the lease covers the entire center where Save Mart occupies only the anchor space (248,811 square feet) and has subleased the in-line space (364,621 square feet) to various tenants. At two of the Save Mart Master Lease Properties totaling 269,547 square feet, the lease covers the entire center where Save Mart has subleased or intends to sublease both the anchor space (88,934 square feet, which includes dark anchor space at Save Mart Supermarket - Tracy, CA (2) totaling 44,870 square feet) and the in-line space (180,613 square feet) to various tenants. |
| (5) | Save Mart has one, five-year extension option and one, five-year and 11-month extension option. |
| (6) | The Big Lots - Durant, OK property has 10, five-year extension options and the Big Lots - Tremont, PA property has one, five-year, one, four-year, and eight, five-year extension options. |
| (7) | Three of the Badcock Properties totaling 1,278,515 square feet are subject to a master lease through June 30, 2039, and four of the Badcock Properties totaling 244,145 square feet are subject to a master lease through August 31, 2039. Each lease contains three, five-year extension options. |
| (8) | Chandler Insurance Company, LTD. has five, ten-year extension options. |
| (9) | Nation Motor Club has two, five-year extension options. |
| (10) | Big Y has four, five-year extension options. |
| (11) | The Oak Street NLP Fund Portfolio Properties are 100.0% leased and 96.2% physically occupied. There is one dark anchor space at Save Mart Supermarket - Tracy, CA (2) totaling 44,870 square feet in addition to 197,957 square feet of vacant in-line space, which Save Mart is responsible for subleasing. |
| THE INFORMATION IN THIS STRUCTURAL AND COLLATERAL TERM SHEET IS NOT COMPLETE AND MAY BE AMENDED PRIOR TO THE TIME OF SALE. THIS TERM SHEET IS NOT AN OFFER TO SELL THESE SECURITIES AND IT IS NOT A SOLICITATION OF AN OFFER TO BUY THESE SECURITIES IN ANY JURISDICTION WHERE THE OFFER OR SALE IS NOT PERMITTED. |
| | 65 | |
| Structural and Collateral Term Sheet | | BMO 2023-C5 |
| No. 6 – Oak Street NLP Fund Portfolio |
The following table presents certain information relating to the tenant lease expirations at the Oak Street NLP Fund Portfolio Properties:
| Lease Rollover Schedule(1) |
| Year | Number of Leases Expiring | Net Rentable Area Expiring | % of NRA Expiring | UW Base Rent Expiring(2) | % of UW Base Rent Expiring(2) | Cumulative Net Rentable Area Expiring | Cumulative % of NRA Expiring | Cumulative UW Base Rent Expiring(2) | Cumulative % of UW Base Rent Expiring(2) |
| Vacant | NAP | 0 | 0.0 | % | NAP | NA | P | 0 | 0.0% | NAP | NAP | |
| 2023 & MTM | 0 | 0 | 0.0 | | $0 | 0.0 | % | 0 | 0.0% | $0 | 0.0% | |
| 2024 | 0 | 0 | 0.0 | | 0 | 0.0 | | 0 | 0.0% | $0 | 0.0% | |
| 2025 | 0 | 0 | 0.0 | | 0 | 0.0 | | 0 | 0.0% | $0 | 0.0% | |
| 2026 | 0 | 0 | 0.0 | | 0 | 0.0 | | 0 | 0.0% | $0 | 0.0% | |
| 2027 | 0 | 0 | 0.0 | | 0 | 0.0 | | 0 | 0.0% | $0 | 0.0% | |
| 2028 | 0 | 0 | 0.0 | | 0 | 0.0 | | 0 | 0.0% | $0 | 0.0% | |
| 2029 | 0 | 0 | 0.0 | | 0 | 0.0 | | 0 | 0.0% | $0 | 0.0% | |
| 2030 | 0 | 0 | 0.0 | | 0 | 0.0 | | 0 | 0.0% | $0 | 0.0% | |
| 2031 | 0 | 0 | 0.0 | | 0 | 0.0 | | 0 | 0.0% | $0 | 0.0% | |
| 2032 | 0 | 0 | 0.0 | | 0 | 0.0 | | 0 | 0.0% | $0 | 0.0% | |
| 2033 | 0 | 0 | 0.0 | | 0 | 0.0 | | 0 | 0.0% | $0 | 0.0% | |
| 2034 & Beyond | 8 | 6,470,388 | 100.0 | | 64,337,263 | 100.0 | | 6,470,388 | 100.0% | $64,337,263 | 100.0% | |
| Total | 8 | 6,470,388 | 100.0 | % | $64,337,263 | 100.0 | % | | | | |
| (1) | Based on the underwritten rent roll dated as of February 23, 2023. |
| (2) | UW Base Rent Expiring, % of UW Base Rent Expiring, Cumulative UW Base Rent Expiring and Cumulative % of UW Base Rent Expiring include contractual rent steps through December 1, 2023, totaling $1,143,912. |
The following table presents certain information relating to the operating history and underwritten cash flows of the Oak Street NLP Fund Portfolio Properties:
| Operating History and Underwritten Net Cash Flow(1) |
| | 2022(2) | Underwritten | Per Square Foot | %(3) |
| Rents in Place | $55,257,111 | $63,193,350 | $9.77 | | 72.5 | % |
| Rent Steps(4) | 0 | 1,143,912 | 0.18 | | 1.3 | |
| Gross Potential Rent | $55,257,111 | $64,337,263 | $9.94 | | 73.8 | % |
| Total Reimbursements | 0 | 22,817,084 | 3.53 | | 26.2 | |
| Net Rental Income | $55,257,111 | $87,154,347 | $13.47 | | 100.0 | % |
| (Vacancy/Credit Loss) | 0 | (4,357,717) | (0.67) | | (5.0 | ) |
| Effective Gross Income | $55,257,111 | $82,796,630 | $12.80 | | 95.0 | % |
| Total Expenses | $0 | $21,989,943 | $3.40 | | 26.6 | % |
| Net Operating Income | $55,257,111 | $60,806,687 | $9.40 | | 73.4 | % |
| Total TI/LC, Capex/RR | 0 | 3,547,972 | 0.55 | | 4.3 | |
| Net Cash Flow | $55,257,111 | $57,258,714 | $8.85 | | 69.2 | % |
| (1) | Historical operating statements prior to 2022 are not available, as the borrowers acquired the Oak Street NLP Fund Portfolio Properties between May 2019 and August 2022, and such information was not provided by the sellers. |
| (2) | Represents partial year financial information for eight assets acquired in 2022. |
| (3) | % column represents percent of Net Rental Income for all revenue lines and represents percent of Effective Gross Income for the remainder of fields. |
| (4) | Underwritten Rent Steps represent contractual rent steps through December 1, 2023. |
| THE INFORMATION IN THIS STRUCTURAL AND COLLATERAL TERM SHEET IS NOT COMPLETE AND MAY BE AMENDED PRIOR TO THE TIME OF SALE. THIS TERM SHEET IS NOT AN OFFER TO SELL THESE SECURITIES AND IT IS NOT A SOLICITATION OF AN OFFER TO BUY THESE SECURITIES IN ANY JURISDICTION WHERE THE OFFER OR SALE IS NOT PERMITTED. |
| | 66 | |
| Structural and Collateral Term Sheet | | BMO 2023-C5 |
| No. 6 – Oak Street NLP Fund Portfolio |
The Markets. The Oak Street NLP Fund Portfolio Properties are located across 23 unique metropolitan areas within eight states. The top three metropolitan areas by underwritten base rent are Durant, Oklahoma (20.0% of NRA and 14.2% of underwritten base rent), Scranton, Pennsylvania (20.0% of NRA and 14.2% of underwritten base rent), and Fresno, California (9.1% of NRA and 9.9% of underwritten base rent), comprising a combined 49.1% of total square footage and 38.3% of underwritten base rent. California properties account for 28.6% of the total square footage and 41.3% of the underwritten base rent. The markets with the largest portion of underwritten base rent in California are Fresno, California (9.9%), followed by Stockton, California (8.6%), San Francisco, California (4.4%) and Modesto, California (3.9%).
The Borrowers. The borrowers are BGCT001 LLC, BIGDUOK001 LLC, BIGTRPA001 LLC, Save Mart Portfolio Owner NLP CA LLC, Save Mart Portfolio Owner NLP NV LLC, NSDBRFL001 LLC, BCDC Portfolio Owner LLC, BCHQ Owner LLC and NAICHOK001 LLC, each a single-purpose, Delaware limited liability company with two independent directors. Legal counsel to the borrowers delivered a non-consolidation opinion in connection with the origination of the Oak Street NLP Fund Portfolio Whole Loan.
The Borrower Sponsors. The borrower sponsors are Blue Owl Capital, Inc. (“Blue Owl”) and Oak Street Real Estate Capital, LLC (“Oak Street”) and the non-recourse carveout guarantors are Oak Street Real Estate Capital Net Lease Property Fund, LP, Oak Street Real Estate Capital Net Lease Property Fund (A), LP and Oak Street Real Estate Capital Net Lease Property Fund (P), LP.
Founded in 2009, Oak Street is a Chicago-based real estate private equity firm. Oak Street currently has approximately $23.6 billion in assets under management, owns over 1,665 real estate assets and has completed over 170 transactions since its inception. Oak Street focuses on acquiring properties that are net-leased to investment grade and creditworthy tenants and provides strategic capital solutions that are subject to a target long-term lease of over 15 years. Oak Street was purchased in 2021 by Blue Owl (NYSE: OWL), an alternative asset manager with over $138.2 billion of assets under management.
Property Management. The Oak Street NLP Fund Portfolio Properties are self-managed.
Escrows and Reserves. At origination of the Oak Street NLP Fund Portfolio Whole Loan, the borrowers deposited into escrow $27,550 for immediate repairs.
Taxes – During the continuance of a Cash Trap Event Period (as defined below), the borrowers will be required to pay monthly real estate tax reserves of 1/12th of the real estate taxes for each Oak Street NLP Fund Portfolio Property that the lender estimates will be payable during the next 12 months if the Tax Reserve Waiver Condition (as defined below) is not satisfied. The “Tax Reserve Waiver Condition” means (i) the tenant is required to pay taxes directly pursuant to its applicable lease, (ii) such tenant is actually paying such taxes prior to delinquency and (iii) such tenant is not in monetary or material non-monetary default under its applicable lease.
Insurance – During the continuance of a Cash Trap Event Period, the borrowers will be required to pay monthly insurance premiums of 1/12th of the insurance premiums for each Oak Street NLP Fund Portfolio Property that the lender estimates will be payable during the next 12 months if the Insurance Reserve Waiver Condition (as defined below) is not satisfied. The “Insurance Reserve Waiver Condition” means (a) (i) no event of default has occurred and is continuing and (ii) the borrowers provide evidence to the lender that the applicable Oak Street NLP Fund Portfolio Property is insured under a blanket policy or (b) the tenant is (1) required to pay insurance premiums directly pursuant to its applicable lease, (2) such tenant is actually paying such insurance premiums when due and (3) such tenant is not in monetary or material non-monetary default under its applicable lease.
Save Mart LOC Reserve – The Oak Street NLP Fund Portfolio Whole Loan documents require that, upon the borrower drawing on the Save Mart LOC for any portion of the amount available, the borrowers will be required to direct the LOC Issuer (as defined below) to deposit such amounts directly with lender and send written notice to the Save Mart master tenant requiring that they deposit an amount in cash sufficient to replenish the security deposit to its original amount with the borrowers.
| THE INFORMATION IN THIS STRUCTURAL AND COLLATERAL TERM SHEET IS NOT COMPLETE AND MAY BE AMENDED PRIOR TO THE TIME OF SALE. THIS TERM SHEET IS NOT AN OFFER TO SELL THESE SECURITIES AND IT IS NOT A SOLICITATION OF AN OFFER TO BUY THESE SECURITIES IN ANY JURISDICTION WHERE THE OFFER OR SALE IS NOT PERMITTED. |
| | 67 | |
| Structural and Collateral Term Sheet | | BMO 2023-C5 |
| No. 6 – Oak Street NLP Fund Portfolio |
The current Save Mart LOC is in the amount of $41,805,053 and was issued by Wells Fargo Bank, N.A. (“LOC Issuer”). The LOC Issuer has agreed to a consent of assignment of proceeds and will direct any draws under the Save Mart LOC to an account controlled by the lender.
Lockbox / Cash Management. The Oak Street NLP Fund Portfolio Whole Loan is structured with a hard lockbox and in-place cash management. The borrowers are required to direct the tenants to pay rent directly into the lockbox account. On each business day, funds in the lockbox will be transferred into the cash management account, to be applied in accordance with the cash flow waterfall required in the cash management agreement. If no Cash Trap Event Period exists, after satisfaction of the cash flow waterfall, all excess cash flow will be disbursed to the borrowers. During the continuance of a Cash Trap Event Period, excess cash flow will be held by the lender as additional collateral.
A “Cash Trap Event Period” will commence upon the earlier of the following: (i) the occurrence of an event of default under the Oak Street NLP Fund Portfolio Whole Loan documents and will continue until such event of default is cured and (ii) the net operating income debt yield (“NOI DY”) being less than 11.75% (tested quarterly) and will continue until, (a) the NOI DY being equal to or greater than 11.75% for two consecutive calendar quarters, (b) sufficient excess cash flow has been trapped by the lender such that, if such amounts were applied as a principal prepayment of the Oak Street NLP Fund Portfolio Whole Loan, it would result in an NOI DY of at least 11.75% (without the two consecutive quarter requirement), (c) the borrowers deposit cash collateral with the lender in an amount which, if applied as a principal prepayment of the Oak Street NLP Fund Portfolio Whole Loan, would result in an NOI DY of at least 11.75% (without the two consecutive quarter requirement), or (d) the borrowers deliver to the lender a letter of credit in an amount which, if applied as a principal prepayment of the Oak Street NLP Fund Portfolio Whole Loan, would result in an NOI DY of at least 11.75%.
Subordinate Debt. The Oak Street NLP Fund Portfolio Properties also secure the Oak Street NLP Fund Portfolio Non-Serviced Pari Passu Companion Loans, which have an aggregate Cut-off Date principal balance of $310,000,000 and the Oak Street NLP Fund Portfolio Subordinate Companion Loan, which has an aggregate Cut-off Date principal balance of $85,000,000. Promissory note A-1, which is the controlling note, is one of the Oak Street NLP Fund Portfolio Non-Serviced Pari Passu Companion Loans and is included in the OAKST 2023-NLP securitization. The Oak Street NLP Fund Portfolio Non-Serviced Pari Passu Companion Loans and the Oak Street NLP Fund Portfolio Subordinate Companion Loan are coterminous with the Oak Street NLP Fund Portfolio Mortgage Loan. The Oak Street NLP Fund Portfolio Non-Serviced Pari Passu Companion Loans and Oak Street NLP Fund Portfolio Subordinate Companion Loan accrue interest at the same rate as the Oak Street NLP Fund Portfolio Mortgage Loan. The Oak Street NLP Fund Portfolio Mortgage Loan and the Oak Street NLP Fund Portfolio Non-Serviced Pari Passu Companion Loans are each pari passu in right of payment and together are senior in right of payment to the Oak Street NLP Fund Portfolio Subordinate Companion Loan. The holders of the Oak Street NLP Fund Portfolio Mortgage Loan, the Oak Street NLP Fund Portfolio Non-Serviced Pari Passu Companion Loans and the Oak Street NLP Fund Portfolio Subordinate Companion Loan have entered into a co-lender agreement which sets forth the allocation of collections on the Oak Street NLP Fund Portfolio Whole Loan. See “Description of the Mortgage Pool—The Whole Loans—The Oak Street NLP Fund Portfolio Pari Passu-AB Whole Loan”.
The following table presents certain information relating to the Oak Street NLP Fund Portfolio Subordinate Companion Loan:
| Subordinate Debt Summary |
| | Original Principal Balance | Interest Rate | Original Term (mos.) | Original Amort. Term (mos.) | Original IO Term (mos.) | Whole Loan UW NCF DSCR | Whole Loan UW NOI Debt Yield | Whole Loan Cut-off Date LTV |
| Oak Street NLP Fund Portfolio Subordinate Companion Loan | $85,000,000 | 6.1380% | 60 | 0 | 60 | 2.16x | 14.3% | 40.4% |
Mezzanine Debt. None.
Partial Release. After the lockout release date, the borrowers may obtain the release of any of the Oak Street NLP Fund Portfolio Properties, provided the following conditions, among others, are satisfied: (i) no event of default is continuing; (ii) partial defeasance of the Oak Street NLP Fund Portfolio Whole Loan in an amount equal to the greater of (a) the Release Price (as defined below), (b) an amount equal to the Release Price plus any additional amount necessary to achieve the Release Debt Yield (the “DY Cure Amount”), and (c) such greater amount as may be required to maintain REMIC requirements; (iii) the NOI DY after giving effect to such release shall be no less than the greater of 14.73% and the NOI
| THE INFORMATION IN THIS STRUCTURAL AND COLLATERAL TERM SHEET IS NOT COMPLETE AND MAY BE AMENDED PRIOR TO THE TIME OF SALE. THIS TERM SHEET IS NOT AN OFFER TO SELL THESE SECURITIES AND IT IS NOT A SOLICITATION OF AN OFFER TO BUY THESE SECURITIES IN ANY JURISDICTION WHERE THE OFFER OR SALE IS NOT PERMITTED. |
| | 68 | |
| Structural and Collateral Term Sheet | | BMO 2023-C5 |
| No. 6 – Oak Street NLP Fund Portfolio |
DY immediately prior to the release (the “Release Debt Yield”); and (iv) if the Oak Street NLP Fund Portfolio Property being released is conveyed to an affiliate of the borrowers, a new non-consolidation opinion.
The “Release Price” is equal to (i) 105% of the original allocated whole loan amount for such individual property that, when aggregated with all prior partial defeasances of individual properties pursuant to this clause (i), the aggregated allocated whole loan amount of all individual properties theretofore defeased is less than or equal to 10% of the original principal balance of the Oak Street NLP Fund Portfolio Whole Loan, (ii) 110% of the original allocated whole loan amount for such individual property if, when aggregated with all prior partial defeasances of individual properties pursuant to clauses (i) and (ii), would not result in the aggregated allocated Oak Street NLP Fund Portfolio Whole Loan amount of all individual properties theretofore defeased is greater than 10% but less than or equal to 15% of the original principal balance of the Oak Street NLP Fund Portfolio Whole Loan, (iii) 115% of the original allocated whole loan amount for such individual property if, when aggregated with all prior partial defeasances of individual properties pursuant to clauses (i) – (iii), would not result in the aggregated allocated whole loan amount of all individual properties theretofore defeased is greater than 15% but less than or equal to 20% of the original principal balance of the Oak Street NLP Fund Portfolio Whole Loan, and (iv) thereafter, 125% of the original allocated whole loan amount for each such individual property being released provided; provided, if the release of any Mortgaged Property will cause the aggregate amount defeased or prepaid to exceed 10%, 15%, or 20% of the original principal balance of the Oak Street NLP Fund Portfolio Loan, as applicable, then the “Release Price” for such Mortgaged Property will equal the product of (x) the allocated loan amount for the applicable mortgaged property and (y) the pro rata weighted average of the Release Price “premiums” listed above.
Default Release. Notwithstanding the foregoing, in the event the lender has given the borrowers notice of a non-monetary event of default under any Oak Street NLP Fund Portfolio Whole Loan documents with respect to any Oak Street NLP Fund Portfolio Property, the borrowers may elect to obtain a release of such Oak Street NLP Fund Portfolio Property (“Default Release”), provided, (i) the borrowers are unable to cure such default after using commercially reasonable efforts to do so and (ii) such event of default is not the result of the willful misconduct or bad faith actions of the borrowers or any affiliates. Any such Default Release will be subject to the partial release conditions, except the requirement that no event of default then be continuing, so long as the only continuing event of default will be cured by the Default Release.
Purchase Option Release. Prior to the lockout release date, solely in connection with the exercise of a Save Mart Purchase Option (as defined below) or a Modesto Purchase Option (as defined below), the borrowers may obtain the release of the applicable Save Mart Purchase Option Property (as defined below) or the Save Mart Supermarkets - Modesto, CA (4) property (the “Modesto Purchase Option Property”, and together with the Save Mart Purchase Option Properties, the “Purchase Option Properties” or each a “Purchase Option Property”), upon satisfaction of the conditions (ii)-(iv) above (in Partial Release) with the additional condition that the borrowers pay the Release Price for such Purchase Option Property, together with the yield maintenance premium in lieu of a partial defeasance event. The borrowers will not be required to satisfy the condition that no event of default is continuing in connection with the release of any Purchase Option Property.
Save Mart Purchase Option. The Save Mart Supermarkets - Jackson, CA property and the Save Mart Supermarkets - El Cerrito, CA property (each a “Save Mart Purchase Option Property” and collectively “Save Mart Purchase Option Properties”) are subject to purchase options with the developer of the remaining portion of each shopping center, in the event such site fails to operate for six months in the case of the Save Mart Supermarkets - Jackson, CA property, or for 12 months in the case of the Save Mart Supermarkets - El Cerrito, CA property (each a “Save Mart Purchase Option”). The purchase price under the Save Mart Purchase Options is the fair market value of such Save Mart Purchase Option Property. In the event a Save Mart Purchase Option is exercised, the payment to the lender of the release price for the affected mortgaged property is recourse to the borrowers and the guarantors.
The Save Mart Master Lease provides that, in the event a Save Mart Purchase Option Property fails to operate for more than two months (subject to force majeure), with respect to the Save Mart Supermarkets - Jackson, CA property, or six months, with respect to site the Save Mart Supermarkets - El Cerrito, CA property, in a manner that, if continued for six months (subject to force majeure) with respect to Save Mart Supermarkets - Jackson, CA property or 12 months with respect to the Save Mart Supermarkets - El Cerrito, CA property, would permit the exercise of the applicable Save Mart Purchase Option, then, borrowers will have the right to engage another party to operate the applicable site in the manner reasonably necessary to avoid the exercise of the applicable Save Mart Purchase Option.
| THE INFORMATION IN THIS STRUCTURAL AND COLLATERAL TERM SHEET IS NOT COMPLETE AND MAY BE AMENDED PRIOR TO THE TIME OF SALE. THIS TERM SHEET IS NOT AN OFFER TO SELL THESE SECURITIES AND IT IS NOT A SOLICITATION OF AN OFFER TO BUY THESE SECURITIES IN ANY JURISDICTION WHERE THE OFFER OR SALE IS NOT PERMITTED. |
| | 69 | |
| Structural and Collateral Term Sheet | | BMO 2023-C5 |
| No. 6 – Oak Street NLP Fund Portfolio |
In the event a Save Mart Purchase Option is exercised with respect to a Save Mart Purchase Option Property, (i) upon consummation of the sale of such Save Mart Purchase Option Property in accordance with the applicable Save Mart Purchase Option, the Save Mart Master Lease will terminate solely with respect to such Save Mart Purchase Option Property; (ii) Save Mart must reimburse the borrowers for the out-of-pocket third-party transaction costs; (iii) the borrowers will receive all proceeds of such sale; and (iv) tenant must pay to landlord an amount equal to the positive difference of (a) the quotient of (x) the allocated rent for such Save Mart Purchase Option Property divided by (y) 5% less (b) the total proceeds received by the borrowers from such sale. Failure to make such payment would result in a default under the Save Mart Master Lease and permit the borrowers to draw upon the Save Mart LOC.
Modesto Purchase Option. The Save Mart Supermarkets - Modesto, CA (4) property is subject to a purchase option with the developer of the remaining portion of the shopping center, in the event no business is operated on the Save Mart Supermarkets - Modesto, CA (4) for 24 consecutive months (the “Modesto Purchase Option”). The purchase price under the Modesto Purchase Option is the fair market value of the Save Mart Supermarkets - Modesto, CA (4), subject to a floor equal to the unamortized amount of any indebtedness of the property owner secured by a mortgage plus any premium, penalty, fee or other expense required by the lender to prepay the indebtedness. In the event the Modesto Purchase Option is exercised, the payment to the lender of the release price for the Save Mart Supermarkets - Modesto, CA (4) is recourse to the borrowers and guarantors.
The borrowers shall be permitted to prepay the outstanding principal balance in excess of the Release Price for the applicable Save Mart Purchase Option Property in an amount equal to the lesser of (A) the amount necessary such that the total amount prepaid equals 125% of the allocated loan amount for such property and (B) the amount necessary to satisfy the DY Cure Amount. So long as borrowers have paid the Release Price for the applicable Save Mart Purchase Option Property and paid the DY Cure Amount, (i) the requirement to achieve the Release Debt Yield will be deemed satisfied, and (ii) the release of a Save Mart Purchase Option Property after the lockout release date will be consummated as a partial defeasance event.
Ground Lease. The borrowers have an approximately 149,631 square foot ground lease related to the Save Mart Supermarkets - Tracy, CA (2) property from CDN-CBN, a California general partnership, that is in turn sub-leased to Save Mart under the Save Mart Master Lease. The borrowers are required to pay ground rent of approximately $615,850 to the ground lessor. The ground lease expires December 31, 2064, with two, 10-year renewal options and no termination options.
The borrowers will pay percentage rent to the ground lessor equal to 25% of the increase in the annual gross rents received by the borrowers from all subtenants in excess of the initial gross rent. So long as the Save Mart Master Lease is in place, any income attributed to the Save Mart Master Lease will be excluded; however, any rents actually paid to Save Mart by the subtenants at the Save Mart Supermarkets - Tracy, CA (2) property will be included in the calculations of gross rent. In 2021, no percentage rent was due as the gross rents on the Save Mart Supermarkets - Tracy, CA (2) property were less than the initial gross rent.
Ground rent for each year is subject to increase by an amount equal to 80% of that portion of percentage rent paid to the ground lessor for the immediately preceding year which is solely and directly attributable to increases in the fixed monthly rent payable by subtenants of the property.
Rights of First Offer / Rights of First Refusal. The tenant or master tenant at each of the following properties has a right of first refusal (“ROFR”) to purchase the related Oak Street NLP Fund Portfolio Property: Save Mart Master Lease Properties; Big Lots - Tremont, PA; Big Lots - Durant, OK; and Nation Safe Driver - Boca Raton, FL. The tenant or master tenant at each of the following properties has a right of first offer (“ROFO”) to purchase the related Oak Street NLP Fund Portfolio Property: the Badcock Properties and Big Y - Milford, CT. Each ROFO / ROFR is not extinguished by a foreclosure of the related Oak Street NLP Fund Portfolio Property; however, each ROFO / ROFR does not apply to foreclosure or deed-in-lieu thereof or to any subsequent transfer or sale by mortgagee or its nominee. See “Description of the Mortgage Pool—Tenant Issues—Purchase Options, Rights of First Offer and Rights of First Refusal” in the Preliminary Prospectus.
| THE INFORMATION IN THIS STRUCTURAL AND COLLATERAL TERM SHEET IS NOT COMPLETE AND MAY BE AMENDED PRIOR TO THE TIME OF SALE. THIS TERM SHEET IS NOT AN OFFER TO SELL THESE SECURITIES AND IT IS NOT A SOLICITATION OF AN OFFER TO BUY THESE SECURITIES IN ANY JURISDICTION WHERE THE OFFER OR SALE IS NOT PERMITTED. |
| | 70 | |
| Structural and Collateral Term Sheet | | BMO 2023-C5 |
| No. 7 – Harborside 2-3 |
| THE INFORMATION IN THIS STRUCTURAL AND COLLATERAL TERM SHEET IS NOT COMPLETE AND MAY BE AMENDED PRIOR TO THE TIME OF SALE. THIS TERM SHEET IS NOT AN OFFER TO SELL THESE SECURITIES AND IT IS NOT A SOLICITATION OF AN OFFER TO BUY THESE SECURITIES IN ANY JURISDICTION WHERE THE OFFER OR SALE IS NOT PERMITTED. |
| | 71 | |
| Structural and Collateral Term Sheet | | BMO 2023-C5 |
| No. 7 – Harborside 2-3 |
| THE INFORMATION IN THIS STRUCTURAL AND COLLATERAL TERM SHEET IS NOT COMPLETE AND MAY BE AMENDED PRIOR TO THE TIME OF SALE. THIS TERM SHEET IS NOT AN OFFER TO SELL THESE SECURITIES AND IT IS NOT A SOLICITATION OF AN OFFER TO BUY THESE SECURITIES IN ANY JURISDICTION WHERE THE OFFER OR SALE IS NOT PERMITTED. |
| | 72 | |
| Structural and Collateral Term Sheet | | BMO 2023-C5 |
| No. 7 – Harborside 2-3 |
| Mortgage Loan Information | | Property Information |
| Mortgage Loan Seller(1): | CREFI, BMO | | Single Asset / Portfolio: | Single Asset |
| Original Principal Balance(1): | $30,000,000 | | Title: | Fee |
| Cut-off Date Principal Balance(1): | $30,000,000 | | Property Type – Subtype: | Office – CBD |
| % of IPB: | 4.5% | | Net Rentable Area (SF): | 1,599,029 |
| Loan Purpose: | Acquisition | | Location: | Jersey City, NJ |
| Borrowers: | SL Harborside Owner 2 & 3 LLC | | Year Built / Renovated: | 1930 / 2021 |
| | and Harborside Owner 2A LLC | | Occupancy: | 75.1% |
| Borrowers’ Sponsors: | Mark Karasick and Michael | | Occupancy Date: | 3/22/2023 |
| | Silberberg | | 4th Most Recent NOI (As of): | $25,379,091 (12/31/2019) |
| Interest Rate: | 5.84000% | | 3rd Most Recent NOI (As of): | $26,127,537 (12/31/2020) |
| Note Date: | 4/4/2023 | | 2nd Most Recent NOI (As of): | $29,403,655 (12/31/2021) |
| Maturity Date: | 4/6/2028 | | Most Recent NOI (As of): | $31,486,880 (12/31/2022) |
| Interest-only Period: | 60 months | | UW Economic Occupancy: | 74.5% |
| Original Term: | 60 months | | UW Revenues: | $51,753,039 |
| Original Amortization Term: | None | | UW Expenses: | $18,582,167 |
| Amortization Type: | Interest Only | | UW NOI: | $33,170,872 |
| Call Protection(2): | L(26),D(27),O(7) | | UW NCF: | $31,463,647 |
| Lockbox / Cash Management: | Hard / Springing | | Appraised Value / Per SF: | $396,000,000 / $248 |
| Additional Debt(1): | Yes | | Appraisal Date: | 2/7/2023 |
| Additional Debt Balance(1): | $195,000,000 / $55,000,000 / | | | |
| | $19,000,000 | | | |
| Additional Debt Type(1): | Pari Passu / Mezzanine / | | | |
| | Preferred Equity | | | |
| | | | | |
| Escrows and Reserves(3) | | Financial Information(1) |
| | Initial | Monthly | Initial Cap | | | Whole Loan | Total Debt |
| Taxes: | $696,822 | $696,822 | N/A | | Cut-off Date Loan / SF: | $141 | $175 |
| Insurance: | $272,774 | $136,387 | N/A | | Maturity Date Loan / SF: | $141 | $175 |
| Replacement Reserves: | $8,000,000 | $26,650 | N/A | | Cut-off Date LTV: | 56.8% | 70.7% |
| TI/LC: | $15,000,000 | Springing | $15,000,000 | | Maturity Date LTV: | 56.8% | 70.7% |
| Other Reserve(4): | $40,614,319 | $0 | N/A | | UW NCF DSCR: | 2.36x | 1.64x |
| | | | | | UW NOI Debt Yield: | 14.7% | 11.8% |
| | | | | | | |
| Sources and Uses |
| Sources | Proceeds | % of Total | | | Uses | Proceeds | % of Total | |
| Whole Loan(1) | $225,000,000 | 48.0 | % | | Purchase Price | $377,000,000 | 80.5 | % |
| Borrower Sponsor Equity | 119,820,041 | 25.6 | | | Upfront Reserves | 64,583,916 | 13.8 | |
| Mezzanine Loan(5) | 55,000,000 | 11.7 | | | Closing Costs | 26,869,593 | 5.7 | |
| Other Sources(6) | 49,633,468 | 10.6 | | | | | |
| Preferred Equity | 19,000,000 | 4.1 | | | | | | |
| Total Sources | $468,453,509 | 100.0 | % | | Total Uses | $468,453,509 | 100.0 | % |
| (1) | The Harborside 2-3 Mortgage Loan (as defined below) is part of the Harborside 2-3 Whole Loan (as defined below) which is comprised of 11 pari passu promissory notes with an aggregate original balance of $225,000,000. The Harborside 2-3 Whole Loan was co-originated by Citi Real Estate Funding Inc. (“CREFI”) and Bank of Montreal (“BMO”). The Financial Information in the chart above is based on the aggregate outstanding principal balance as of the Cut-off Date of the Harborside 2-3 Whole Loan. |
| (2) | Defeasance of the Harborside 2-3 Whole Loan is permitted at any time after the earlier to occur of (i) the end of the two-year period commencing on the closing date of the securitization of the last promissory note representing a portion of the Harborside 2-3 Whole Loan to be securitized and (ii) April 4, 2026. The assumed defeasance lockout period of 26 payments is based on the anticipated closing date of the BMO 2023-C5 securitization trust in June 2023. The actual lockout period may be longer. |
| (3) | For a full description of Escrows and Reserves, please refer to “Escrows and Reserves” below. |
| (4) | Other Initial reserves include (i) a sea wall repair reserve of $25,000,000, (ii) an unfunded obligations reserve of $14,195,734, and (iii) an elevator modernization reserve of approximately $1,418,585. See “Escrows and Reserves” below. |
| (5) | Concurrently with the funding of the Harborside 2-3 Whole Loan, NongHyup Bank funded a mezzanine loan in the amount of $55,000,000 (the “Harborside 2-3 Mezzanine Loan” and together with the Harborside 2-3 Whole Loan, the “Harborside 2-3 Total Debt”). The Harborside 2-3 Mezzanine Loan accrues interest at a rate of 7.0000% per annum to be paid as part of each monthly debt service payment amount, and an additional 3.5000% per annum shall accrue through the loan term and be due on the maturity date. The Harborside 2-3 Mezzanine Loan has a final maturity date of April 6, 2028. An intercreditor agreement has been entered into between |
| THE INFORMATION IN THIS STRUCTURAL AND COLLATERAL TERM SHEET IS NOT COMPLETE AND MAY BE AMENDED PRIOR TO THE TIME OF SALE. THIS TERM SHEET IS NOT AN OFFER TO SELL THESE SECURITIES AND IT IS NOT A SOLICITATION OF AN OFFER TO BUY THESE SECURITIES IN ANY JURISDICTION WHERE THE OFFER OR SALE IS NOT PERMITTED. |
| | 73 | |
| Structural and Collateral Term Sheet | | BMO 2023-C5 |
| No. 7 – Harborside 2-3 |
| | | the lender under the Harborside 2-3 Whole Loan and the lender under the Harborside 2-3 Mezzanine Loan. Based on the Harborside 2-3 Total Debt, the Cut-off Date LTV Ratio and Maturity Date LTV Ratio are 70.7%, the DSCR based on Underwritten NOI / NCF is 1.73x / 1.64x, and the Debt Yield based on Underwritten NOI / NCF is 11.8% / 11.2%. See “Mezzanine Debt” below. |
| (6) | Other Sources primarily consists of a Sea Wall credit of $27,610,000, tenant improvement and rent credits of approximately $12,104,859, a rate buydown credit of $6,250,000, and other miscellaneous credits. |
The Loan. The seventh largest mortgage loan (the “Harborside 2-3 Mortgage Loan”) is part of a whole loan (the “Harborside 2-3 Whole Loan”) secured by the borrowers’ fee interest in a 1,599,029 square foot office property located in Jersey City, New Jersey (the “Harborside 2-3 Property”). The Harborside 2-3 Whole Loan is comprised of 11 pari passu notes, with an aggregate outstanding principal balance as of the Cut-off Date of $225,000,000. The Harborside 2-3 Whole Loan was co-originated on April 4, 2023 by CREFI and BMO and accrues interest at a fixed rate of 5.84000% per annum. The Harborside 2-3 Whole Loan has an initial term of five-years and is interest-only for the full term. The scheduled maturity date of the Harborside 2-3 Whole Loan is the due date that occurs April 6, 2028. The Harborside 2-3 Mortgage Loan is evidenced by the non-controlling Note A-2-2 and Note A-6-1 with an aggregate outstanding principal balance as of the Cut-off Date of $30,000,000. The remaining notes are currently held by CREFI and BMO and are expected to be contributed to one or more future securitization trust(s). The Harborside 2-3 Total Debt consists of the Harborside 2-3 Whole Loan and the Harborside 2-3 Mezzanine Loan. For additional information, see “Mezzanine Debt” below. The relationship between the holders of the Harborside 2-3 Whole Loan is governed by a co-lender agreement as described under “Description of the Mortgage Pool—The Whole Loans—The Outside Serviced Pari Passu Whole Loans” and “The Pooling and Servicing Agreement—Servicing of the Outside Serviced Mortgage Loans” in the Preliminary Prospectus.
| Whole Loan Summary |
| Note | Original Balance | Cut-off Date Balance | Note Holder | Controlling Piece |
| A-1 | $50,000,000 | $50,000,000 | Benchmark 2023-V2 | Yes |
| A-2-1(1) | $35,000,000 | $35,000,000 | CREFI | No |
| A-2-2 | $15,000,000 | $15,000,000 | BMO 2023-C5 | No |
| A-3(1) | $25,000,000 | $25,000,000 | CREFI | No |
| A-4(1) | $25,000,000 | $25,000,000 | CREFI | No |
| A-5(1) | $22,500,000 | $22,500,000 | BMO | No |
| A-6-1 | $15,000,000 | $15,000,000 | BMO 2023-C5 | No |
| A-6-2(1) | $2,500,000 | $2,500,000 | BMO | No |
| A-7(1) | $15,000,000 | $15,000,000 | Benchmark 2023-V2 | No |
| A-8(1) | $10,000,000 | $10,000,000 | BMO | No |
| A-9(1) | $10,000,000 | $10,000,000 | BMO | No |
| Whole Loan | $225,000,000 | $225,000,000 | | |
| (1) | Expected to be contributed to one or more securitization trust(s). |
The Property. The collateral for the Harborside 2-3 Whole Loan is an interconnected two-building, 10-story Class A office property located along the waterfront in Jersey City, New Jersey totaling 1,599,029 SF. The Harborside 2-3 Property is a part of a larger development, which includes Harborside 1, 2, 3, 5 and 6 along with 101 Hudson Street, a water tax lot, and a waterfront promenade (the “Harborside Development”). The Harborside Development was built in 1930 and was recently renovated in 2021. As part of the renovation the Harborside 2-3 Property received an approximately $64.7 million renovation that consisted of updating the retail area along the Hudson Waterfront entrance side, enhancing the food hall area, lobby and elevator renovations, and exterior façade work. The borrowers’ sponsors additionally plan to invest $25.5 million in future capital expenditures including a tenant lounge, rooftop deck and improvements to the common areas.
The Harborside 2-3 Property is comprised of office and ground floor retail space and features a multi-story atrium lobby in the center of the Harborside 2-3 Property. The lobby area includes a food hall that generates additional income through license agreements with tenants. Parking is provided at the Harborside 2-3 Property by a parking garage that is located in the adjacent Harborside Plaza 5 building and has 1,100 covered parking spaces, of which 942 parking spaces are allocated for use by the Harborside 2-3 Property with an additional 413 spaces located at the nearby Harborside Plaza 6 building allocated for use by the Harborside 2-3 Property, resulting in a parking ratio of approximately 0.85 spaces per 1,000 SF. As of March 22, 2023, the Harborside 2-3 Property was 75.1% occupied to 31 tenants with the largest tenant accounting for
| THE INFORMATION IN THIS STRUCTURAL AND COLLATERAL TERM SHEET IS NOT COMPLETE AND MAY BE AMENDED PRIOR TO THE TIME OF SALE. THIS TERM SHEET IS NOT AN OFFER TO SELL THESE SECURITIES AND IT IS NOT A SOLICITATION OF AN OFFER TO BUY THESE SECURITIES IN ANY JURISDICTION WHERE THE OFFER OR SALE IS NOT PERMITTED. |
| | 74 | |
| Structural and Collateral Term Sheet | | BMO 2023-C5 |
| No. 7 – Harborside 2-3 |
8.6% of net rentable area and a weighted average lease term remaining of 8.7 years. Additionally, 61.2% of underwritten base rent at the Harborside 2-3 Property is from investment-grade tenants.
Major Tenants. The three largest tenants based on underwritten base rent are MUFG Bank Ltd. (“MUFG”), E-Trade Financial Corporation (“E-Trade”) and Collectors Universe.
MUFG (137,076 square feet; 8.6% NRA; 12.8% of underwritten base rent): MUFG is a Japanese based bank with over 13,000 employees in the Americas and offers services in corporate, investment, commercial, transaction and consumer banking, as well as securities and wealth management. MUFG has been a tenant at the Harborside 2-3 Property since June 1989 and has a current lease term though August 2029 followed by one, five-year extension option.
E-Trade (132,265 square feet; 8.3% NRA; 11.8% of underwritten base rent): E-Trade, a subsidiary of Morgan Stanley, is an online trading platform for retail investors and offers services in wealth management, investment advisory services, research and market insights. E-Trade’s lease at the Harborside 2-3 Property commenced in October 2006 and has a lease expiration in January 2031 followed by one, five-year extension option.
Collectors Universe (130,419 square feet; 8.2% NRA; 10.5% of underwritten base rent): Collectors Universe was founded in 1986 and provides third-party authentication and grading services to collectors, retail buyers and sellers of collectibles. Collectors Universe has been a tenant at the Harborside 2-3 Property since May 2022 and has a current lease term though November 2038 followed by two, five-year extension options.
Environmental. According to a Phase I environmental assessment dated March 24, 2023, there was no evidence of any recognized environmental conditions at the Harborside 2-3 Property. However, the Phase I environmental assessment identifies controlled recognized environmental conditions and historical recognized environmental conditions for the Harborside 2-3 Property associated with historic site operations and impacts to site soils and groundwater caused by contaminated historic fill material. See “Description of the Mortgage Pool—Environmental Considerations” in the Preliminary Prospectus.
The following table presents certain information relating to the historical and current occupancy of the Harborside 2-3 Property:
| Historical and Current Occupancy(1) |
| 2019 | 2020 | 2021 | 2022 | Current(2) |
| 84.6% | 82.3% | 83.6% | 82.5% | 75.1% |
| (1) | Historical Occupancies are the annual average physical occupancy of each respective year. |
| (2) | Current Occupancy is based on the underwritten rent roll dated March 22, 2023. |
| THE INFORMATION IN THIS STRUCTURAL AND COLLATERAL TERM SHEET IS NOT COMPLETE AND MAY BE AMENDED PRIOR TO THE TIME OF SALE. THIS TERM SHEET IS NOT AN OFFER TO SELL THESE SECURITIES AND IT IS NOT A SOLICITATION OF AN OFFER TO BUY THESE SECURITIES IN ANY JURISDICTION WHERE THE OFFER OR SALE IS NOT PERMITTED. |
| | 75 | |
| Structural and Collateral Term Sheet | | BMO 2023-C5 |
| No. 7 – Harborside 2-3 |
The following table presents certain information relating to the largest tenants based on underwritten base rent at the Harborside 2-3 Property:
| Top Tenant Summary(1) |
| Tenant | Ratings Moody’s/S&P/Fitch(2) | Net Rentable Area (SF) | % of Total NRA | UW Base Rent PSF(3) | UW Base Rent(3) | % of Total UW Base Rent(3) | Lease Expiration Date |
| MUFG Bank Ltd. | A1/A/A- | 137,076 | 8.6 | % | $46.50 | $6,374,033 | 12.8 | % | 8/31/2029 |
| E-Trade Financial Corporation | A1/A-/NR | 132,265 | 8.3 | | $44.33 | 5,863,218 | 11.8 | | 1/31/2031 |
| Collectors Universe | NR/NR/NR | 130,419 | 8.2 | | $40.00 | 5,216,760 | 10.5 | | 11/30/2038 |
| Sumitomo Mitsui Banking | A1/A/NR | 111,605 | 7.0 | | $44.35 | 4,949,637 | 10.0 | | 12/31/2036 |
| Arch Insurance Company | A2/A+/NR | 106,815 | 6.7 | | $40.50 | 4,326,008 | 8.7 | | 5/31/2024 |
| Cardinia Real Estate LLC | Baa1/BBB+/NR | 79,771 | 5.0 | | $43.32 | 3,455,677 | 7.0 | | 4/30/2032 |
| Zurich American Ins. Co.(4)(5) | A3/A/NR | 64,414 | 4.0 | | $49.96 | 3,218,338 | 6.5 | | 5/31/2032 |
| New Jersey City University | NR/NR/NR | 84,929 | 5.3 | | $36.72 | 3,118,962 | 6.3 | | 8/31/2035 |
| JC Restaurants LLC | NR/NR/NR | 46,207 | 2.9 | | $45.00 | 2,079,315 | 4.2 | | 9/30/2033 |
| Whole Foods Market Services | A1/AA-/NR | 47,398 | 3.0 | | $41.37 | 1,960,855 | 3.9 | | 3/31/2032 |
| Largest Tenants | | 940,899 | 58.8 | % | $43.11 | $40,562,803 | 81.6 | % | |
| Remaining Tenants | | 259,525 | 16.2 | | $35.16 | 9,125,272 | 18.4 | | |
| Total Occupied | | 1,200,424 | 75.1 | % | $41.39 | $49,688,075 | 100.0 | % | |
| Vacant Space | | 398,605 | 24.9 | | | | | |
| Total / Wtd. Avg. | | 1,599,029 | 100.0 | % | | | | |
| (1) | Based on the underwritten rent roll dated March 22, 2023. |
| (2) | In certain instances, ratings provided are those of the parent company of the entity shown, whether or not the parent company guarantees the lease. |
| (3) | UW Base Rent PSF, UW Base Rent and % of Total UW Base Rent include straight-line rent averaging for certain investment grade tenants (MUFG, E-Trade, Cardinia Real Estate LLC, Zurich American Ins. Co., Whole Foods Market Services and Sumitomo Mitsui Banking) through lease maturity totaling $1,229,273 and contractual rent steps through January 2024 totaling $261,077. |
| (4) | Zurich American Ins. Co has a contraction option for 15,902 SF effective June 1, 2028 with 12 months’ notice and a contraction fee of six months’ rent and unamortized TIs, LCs, and free rent on the returned space. |
| (5) | Zurich American Ins. Co subleases 32,473 SF to Springer Nature America, Inc. |
| THE INFORMATION IN THIS STRUCTURAL AND COLLATERAL TERM SHEET IS NOT COMPLETE AND MAY BE AMENDED PRIOR TO THE TIME OF SALE. THIS TERM SHEET IS NOT AN OFFER TO SELL THESE SECURITIES AND IT IS NOT A SOLICITATION OF AN OFFER TO BUY THESE SECURITIES IN ANY JURISDICTION WHERE THE OFFER OR SALE IS NOT PERMITTED. |
| | 76 | |
| Structural and Collateral Term Sheet | | BMO 2023-C5 |
| No. 7 – Harborside 2-3 |
The following table presents certain information relating to tenant lease expirations at the Harborside 2-3 Property:
| Lease Rollover Schedule(1)(2) |
| Year | Number of Leases Expiring | Net Rentable Area Expiring | % of NRA Expiring | UW Base Rent Expiring(3) | % of UW Base Rent Expiring(3) | Cumulative Net Rentable Area Expiring | Cumulative % of NRA Expiring | Cumulative UW Base Rent Expiring(3) | Cumulative % of UW Base Rent Expiring(3) |
| Vacant | NAP | 398,605 | 24.9 | % | NAP | NA | P | 398,605 | | 24.9% | | NAP | NAP | |
| 2023 & MTM(4) | 6 | 0 | 0.0 | | $36,000 | 0.1 | % | 398,605 | | 24.9% | | $36,000 | 0.1% | |
| 2024 | 5 | 126,250 | 7.9 | | 5,157,929 | 10.4 | | 524,855 | | 32.8% | | $5,193,929 | 10.5% | |
| 2025 | 4 | 78,064 | 4.9 | | 1,823,652 | 3.7 | | 602,919 | | 37.7% | | $7,017,581 | 14.1% | |
| 2026 | 1 | 6,344 | 0.4 | | 250,588 | 0.5 | | 609,263 | | 38.1% | | $7,268,169 | 14.6% | |
| 2027 | 2 | 4,451 | 0.3 | | 288,345 | 0.6 | | 613,714 | | 38.4% | | $7,556,514 | 15.2% | |
| 2028 | 3 | 30,346 | 1.9 | | 1,263,653 | 2.5 | | 644,060 | | 40.3% | | $8,820,167 | 17.8% | |
| 2029 | 1 | 137,076 | 8.6 | | 6,374,033 | 12.8 | | 781,136 | | 48.9% | | $15,194,200 | 30.6% | |
| 2030 | 1 | 28,000 | 1.8 | | 1,064,000 | 2.1 | | 809,136 | | 50.6% | | $16,258,200 | 32.7% | |
| 2031 | 1 | 132,265 | 8.3 | | 5,863,218 | 11.8 | | 941,401 | | 58.9% | | $22,121,418 | 44.5% | |
| 2032 | 6 | 284,468 | 17.8 | | 12,201,982 | 24.6 | | 1,225,869 | | 76.7% | | $34,323,400 | 69.1% | |
| 2033 | 1 | 46,207 | 2.9 | | 2,079,315 | 4.2 | | 1,272,076 | | 79.6% | | $36,402,715 | 73.3% | |
| 2034 & Beyond | 7 | 326,953 | 20.4 | | 13,285,359 | 26.7 | | 1,599,029 | | 100.0% | | $49,688,075 | 100.0% | |
| Total | 38 | 1,599,029 | 100.0 | % | $49,688,075 | 100.0 | % | | | | |
| (1) | Based on the underwritten rent roll dated March 22, 2023. |
| (2) | Certain tenants have more than one lease. Certain tenants may have lease termination or contraction options that are exercisable prior to the originally stated expiration date of the subject lease and that are not considered in the lease rollover schedule. |
| (3) | UW Base Rent Expiring, % of UW Base Rent Expiring, Cumulative UW Base Rent Expiring and Cumulative % of UW Base Rent Expiring include straight-line rent averaging for certain investment grade tenants (MUFG, E-Trade, Cardinia Real Estate LLC, Zurich American Ins. Co., Whole Foods Market Services and Sumitomo Mitsui Banking), Zurich American Insurance, Whole Foods Market Services and SMBC) through lease maturity totaling $1,229,273 and contractual rent steps through January 2024 totaling $261,077. |
| (4) | 2023 & MTM includes six food hall tenants that are on month to month leases and do not have square footage attributable to them. Underwritten rent is only attributable to Angry Archies ($18,000) and The Belgian Plate ($18,000) which had leases in place as of March 22, 2023. |
| THE INFORMATION IN THIS STRUCTURAL AND COLLATERAL TERM SHEET IS NOT COMPLETE AND MAY BE AMENDED PRIOR TO THE TIME OF SALE. THIS TERM SHEET IS NOT AN OFFER TO SELL THESE SECURITIES AND IT IS NOT A SOLICITATION OF AN OFFER TO BUY THESE SECURITIES IN ANY JURISDICTION WHERE THE OFFER OR SALE IS NOT PERMITTED. |
| | 77 | |
| Structural and Collateral Term Sheet | | BMO 2023-C5 |
| No. 7 – Harborside 2-3 |
The following table presents certain information relating to operating history and underwritten cash flows at the Harborside 2-3 Property:
| Operating History and Underwritten Net Cash Flow |
| | 2019 | 2020 | 2021 | TTM(1) | Underwritten | Per Square Foot | %(2) |
| Rents in Place | $41,941,974 | $43,765,220 | $44,836,663 | $45,934,802 | $48,197,725 | $30.14 | 69.8 | % |
| Contractual Rent Steps(3) | 0 | 0 | 0 | 0 | 1,490,350 | 0.93 | 2.2 | |
| Vacant Income | 0 | 0 | 0 | 0 | 17,305,219 | 10.82 | 25.1 | |
| Total Reimbursements | 462,010 | 117,040 | 1,781,772 | 2,608,869 | 835,286 | 0.52 | 1.2 | |
| Other Income(4) | 686,264 | 734,802 | 832,439 | 770,425 | 1,229,679 | 0.77 | 1.8 | |
| Gross Potential Rent | $43,090,248 | $44,617,062 | $47,450,874 | $49,314,096 | $69,058,258 | $43.19 | 100.0 | % |
| (Vacancy/Credit Loss) | 0 | 0 | 0 | 0 | (17,305,219) | (10.82) | (25.1 | ) |
| Effective Gross Income | $43,090,248 | $44,617,062 | $47,450,874 | $49,314,096 | $51,753,039 | $32.37 | 74.9 | % |
| Real Estate Taxes | 5,989,391 | 6,988,199 | 6,969,969 | 6,476,738 | 6,373,673 | 3.99 | 12.3 | |
| Insurance | 498,719 | 693,812 | 987,947 | 1,339,686 | 1,558,710 | 0.97 | 3.0 | |
| Management Fee | 1,000,000 | 1,000,000 | 1,000,000 | 1,000,000 | 1,000,000 | 0.63 | 1.9 | |
| Other Operating Expenses(5) | 10,223,047 | 9,807,514 | 9,089,302 | 9,010,793 | 9,649,784 | 6.03 | 18.6 | |
| Total Expenses | $17,711,157 | $18,489,525 | $18,047,218 | $17,827,217 | $18,582,167 | $11.62 | 35.9 | |
| Net Operating Income(5) | $25,379,091 | $26,127,537 | $29,403,655 | $31,486,880 | $33,170,872 | $20.74 | 64.1 | % |
| Replacement Reserves | 0 | 0 | 0 | 0 | 319,806 | 0.20 | 0.6 | |
| TI/LC | 0 | 0 | 0 | 0 | 1,387,420 | 0.87 | 2.7 | |
| Net Cash Flow | $25,379,091 | $26,127,537 | $29,403,655 | $31,486,880 | $31,463,647 | $19.68 | 60.8 | % |
| (1) | TTM reflects the trailing 12-month period ending December 31, 2022. |
| (2) | % column represents percent of Gross Potential Rent for all revenue lines and represents percent of Effective Gross Income for the remainder of fields. |
| (3) | Underwritten Contractual Rent Steps include straight-line rent averaging for certain investment grade tenants (MUFG, E-Trade, Cardinia Real Estate LLC, Zurich American Ins. Co., Whole Foods Market Services and Sumitomo Mitsui Banking) through lease maturity totaling $1,229,273 and contractual rent steps through January 2024 totaling $261,077. |
| (4) | Other Income includes antenna income, submetered electric income, tenant services income, rooftop generator fees, income from third party events with catering/amenities and percentage rent from the food hall tenants. |
| (5) | Other Operating Expenses are primarily attributable to repairs & maintenance ($2.13/SF), cleaning costs ($1.12/SF), contract services ($1.08/SF) and utilities ($0.98/SF). |
The Market. The Harborside 2-3 Property is located along the Hudson waterfront in Jersey City, New Jersey within Hudson County. The immediate area is influenced by its proximity to New York City and the Jersey City Waterfront, accessibility to the highway system and access to public transportation. Primary access to the Harborside 2-3 Property is provided by the PATH system, NJ transit bus and light rail services, NY Waterway ferry system and nearby major highways including Interstate-495 and Routes 1&9.
The Harborside 2-3 Property is located in the Hudson Waterfront Office submarket directly adjacent to the ExchangePlace PATH station, light rail and Harborside Ferry Terminal. As of December 31, 2022, the submarket had an inventory of 18,950,000 SF, a vacancy rate of 16.4%, positive absorption of 761,000 SF, and average asking rent of $45.86 PSF.
According to the appraisal, the 2022 population and average household income within a one-, three- and five-mile radius of the Harborside 2-3 Property was 74,579, 812,770, and 1,914,845 and $233,262, $182,615 and $178,254, respectively.
According to the appraisal, the 2022 population and average household income within a one-, three- and five-mile radius of the Harborside 2-3 Property was 74,579, 812,770, and 1,914,845 and $233,262, $182,615 and $178,254, respectively.
| THE INFORMATION IN THIS STRUCTURAL AND COLLATERAL TERM SHEET IS NOT COMPLETE AND MAY BE AMENDED PRIOR TO THE TIME OF SALE. THIS TERM SHEET IS NOT AN OFFER TO SELL THESE SECURITIES AND IT IS NOT A SOLICITATION OF AN OFFER TO BUY THESE SECURITIES IN ANY JURISDICTION WHERE THE OFFER OR SALE IS NOT PERMITTED. |
| | 78 | |
| Structural and Collateral Term Sheet | | BMO 2023-C5 |
| No. 7 – Harborside 2-3 |
The following table presents certain information relating to comparable office sales to the Harborside 2-3 Property:
| Summary of Comparable Office Sales(1) |
| Property Name / Address | Location | Year Built / Renovated | Transaction Date | Price | Price/SF | Size (SF) |
| Harborside 2-3 | Jersey City, NJ | 1930/2021 | April 2023 | $377,000,000 | $235.77 | 1,599,029(2) |
| 70 Hudson Street | Jersey City, NJ | 2001/NAP | February 2022 | $300,000,000 | $695.35 | 431,438 |
| 15 Exchange Place | Jersey City, NJ | 1900/2022 | February 2022 | $48,000,000 | $354.49 | 135,405 |
| 111 River Street | Hoboken, NJ | 2002/NAP | January 2022 | $225,000,000 | $405.87 | 554,360 |
| 545 Washington Boulevard | Jersey City, NJ | 2001/NAP | January 2020 | $372,750,000 | $430.08 | 866,706 |
| 570 Washington Boulevard | Jersey City, NJ | 2002/NAP | March 2019 | $170,000,000 | $430.33 | 395,050 |
| (2) | Based on the underwritten rent roll dated March 22, 2023. |
The Borrowers. The borrowers are SL Harborside Owner 2 & 3 LLC and Harborside Owner 2A LLC, each a Delaware limited liability company and single purpose entity having at least one independent director in its organizational structure, as tenants-in-common. Legal counsel to the borrowers delivered a non-consolidation opinion in connection with the origination of the Harborside 2-3 Whole Loan.
The Borrowers’ Sponsors. The borrowers’ sponsors and non-recourse carveout guarantors are Mark Karasick and Michael Silberberg. Mark Karasick and Michael Silberberg are both members of the 601W Companies, a Manhattan-based real estate investment firm specializing in acquisition, development and management of properties throughout the United States.
Property Management. The Harborside 2-3 Property is managed by Jones Lang LaSalle Americas, Inc., a third-party property management company, with Harborside Property Manager, LLC, an affiliated property management company, having certain sub-management responsibilities.
Escrows and Reserves. At origination of the Harborside 2-3 Whole Loan, the borrowers deposited approximately (i) $696,822 into a reserve account for real estate taxes, (ii) $272,774 into a reserve account for insurance, (iii) $8,000,000 into a reserve account for replacement reserves, (iv) $15,000,000 into a reserve account for tenant improvements and leasing commissions, (v) $25,000,000 into a sea wall repair reserve account to preserve and stabilize the sea wall at the Harborside 2-3 Property, (vi) $14,195,734 into an unfunded obligations reserve account for outstanding obligations with respect to certain unfunded free rent, prepaid rent, reimbursements and tenant improvement/leasing commissions, and (vii) $1,418,585 into an elevator modernization reserve account.
Tax Reserve – The borrowers are required to deposit into a real estate tax reserve, on a monthly basis, 1/12 of the taxes that the lender estimates will be payable over the next-ensuing 12-month period (initially estimated to be approximately $696,822).
Insurance Reserve – The borrowers are required to deposit into an insurance reserve, on a monthly basis, 1/12 of the amount which will be sufficient to pay the insurance premiums due for the renewal of coverage afforded by such policies (initially estimated to be approximately $136,387).
Replacement Reserve – The borrowers are required to deposit into a replacement reserve, on a monthly basis, an amount equal to approximately $26,650. In addition, if the Adjusted Initial Replacement Deposit Amount (as defined below) at any time is less than or equal to $5,000,000, within 10 business days after notice from lender, the borrowers are required to make a deposit into the replacement reserve account that would cause the Adjusted Initial Replacement Deposit Amount to be equal to $10,000,000 (“Replacement Reserve True-Up Deposit”); provided, however, (i) to the extent that a Replacement Reserve True-Up Deposit would cause the Adjusted Replacement Reserve Deposit Amount to exceed the actual cost of any work set forth in the closing date capital expenditures budget then remaining to be completed (as reasonably determined by lender based on evidence provided by the borrowers) (the “Remaining Budgeted CapEx
| THE INFORMATION IN THIS STRUCTURAL AND COLLATERAL TERM SHEET IS NOT COMPLETE AND MAY BE AMENDED PRIOR TO THE TIME OF SALE. THIS TERM SHEET IS NOT AN OFFER TO SELL THESE SECURITIES AND IT IS NOT A SOLICITATION OF AN OFFER TO BUY THESE SECURITIES IN ANY JURISDICTION WHERE THE OFFER OR SALE IS NOT PERMITTED. |
| | 79 | |
| Structural and Collateral Term Sheet | | BMO 2023-C5 |
| No. 7 – Harborside 2-3 |
Costs”), the Replacement Reserve True-Up Deposit Amount will be decreased on a dollar-for-dollar basis by such excess, and (ii) at such time as the Adjusted Replacement Reserve Deposit Amount exceeds the Remaining Budgeted Capex Costs, Borrower shall have no further obligation to make Replacement Reserve True-Up Deposits. Notwithstanding the immediately preceding sentence, if borrower provides evidence reasonably acceptable to the lender that the actual cost of the work relating to any line item in the closing date capital expenditures budget is less the amount set forth in the closing date capital expenditures budget (such difference, the “Capital Expenditures Budget Savings Amount”), then the applicable Replacement Reserve True-Up Deposit shall be reduced on a dollar-for-dollar basis by the Capital Expenditures Budget Savings Amount.
An “Adjusted Initial Replacement Deposit Amount” means, as of the date of calculation, an amount equal to the sum on deposit in the replacement reserve account, less any replacement reserve monthly deposits.
TI/LC Reserve – On each monthly payment date that the amount in the tenant improvements and leasing commissions account is less than $10,000,000 the borrowers are required to deposit into a tenant improvement and leasing commissions reserve an amount equal to approximately $133,252, subject to a cap of $15,000,000.
Lockbox / Cash Management. The Harborside 2-3 Whole Loan is structured with a hard lockbox and springing cash management. At origination of the Harborside 2-3 Whole Loan, the borrowers were required to deliver a notice to each tenant directing them to remit all payments under the applicable lease directly to the lender-controlled lockbox account. All funds received by the borrowers, or the property manager, are required to be deposited in the lockbox account immediately following receipt. All funds deposited into the lockbox are required to be released to the borrowers on each business day unless a Trigger Period (as defined below) or a Mezzanine Trigger Period (as defined below) exists. Upon the occurrence and during the continuance of a Trigger Period or a Mezzanine Trigger Period, all funds in the lockbox account are required to be swept on each business day to a lender-controlled cash management account to be applied and disbursed in accordance with the Harborside 2-3 Whole Loan documents, and all excess cash flow funds remaining in the cash management account after the application of such funds will be applied in accordance with the Harborside 2-3 Whole Loan documents.
A “Trigger Period” means a period (A) commencing upon the earliest of (i) the occurrence and continuance of an event of default under the Harborside 2-3 Whole Loan documents, (ii) the aggregate debt service coverage ratio falling below 1.25x (taking into account, among other things, the aggregate outstanding principal balance of the Harborside 2-3 Whole Loan and the Harborside 2-3 Mezzanine Loan, and in accordance with the Harborside 2-3 Whole Loan documents), and (iii) the debt service coverage ratio falling below 1.81x (taking into account the Harborside 2-3 Whole Loan only, and in accordance with the Harborside 2-3 Whole Loan documents) and (B) expiring upon (1) with regard to clause (i) above, the cure (if applicable) of such event of default, (2) with regard to clause (ii) above, the date that the aggregate debt service coverage ratio (taking into account, among other things, the aggregate outstanding principal balance of the Harborside 2-3 Whole Loan and the Harborside 2-3 Mezzanine Loan, and in accordance with the Harborside 2-3 Whole Loan documents) is equal to or greater than 1.25x for two consecutive calendar quarters, and (3) with regard to clause (iii) above, the date that the debt service coverage ratio (taking into account the Harborside 2-3 Whole Loan only, and in accordance with the Harborside 2-3 Whole Loan documents) is equal to or greater than 1.81x for two consecutive calendar quarters.
A “Mezzanine Trigger Period” means the period (i) commencing on the date that mezzanine lender delivers written notice to lender that an event of default exists under the Harborside 2-3 Mezzanine Loan, and (ii) terminating on the date that mezzanine lender delivers written notice to lender that an event of default exists under the Harborside 2-3 Mezzanine Loan no longer exists.
Subordinate Debt. None.
Mezzanine Debt. Concurrently with the funding of the Harborside 2-3 Whole Loan, NongHyup Bank funded a mezzanine loan in the amount of $55,000,000 to be secured by the mezzanine borrowers’ interests in the borrowers, as collateral for the Harborside 2-3 Mezzanine Loan. The Harborside 2-3 Mezzanine Loan is coterminous with the Harborside 2-3 Whole Loan. The Harborside 2-3 Mezzanine Loan accrues interest at a rate of 7.0000% per annum to be paid as part of each monthly debt service payment amount and an additional 3.5000% per annum which shall accrue through the loan term and be due on the maturity date, plus an additional 2.2900% per annum (the “PIK Interest”) which will accrue and automatically be converted and added to the principal balance of the Harborside 2-3 Mezzanine Loan if, as of April 6, 2028, at least 75%
| THE INFORMATION IN THIS STRUCTURAL AND COLLATERAL TERM SHEET IS NOT COMPLETE AND MAY BE AMENDED PRIOR TO THE TIME OF SALE. THIS TERM SHEET IS NOT AN OFFER TO SELL THESE SECURITIES AND IT IS NOT A SOLICITATION OF AN OFFER TO BUY THESE SECURITIES IN ANY JURISDICTION WHERE THE OFFER OR SALE IS NOT PERMITTED. |
| | 80 | |
| Structural and Collateral Term Sheet | | BMO 2023-C5 |
| No. 7 – Harborside 2-3 |
of the aggregate rentable square feet of Harborside 1 in the Harborside Development and Harborside 2-3 in the Harborside Development has not been leased in accordance with the requirements of the Harborside 2-3 Whole Loan documents, the Harborside 2-3 Mezzanine Loan documents and the Harborside 2-3 Mezzanine Loan has not been paid in full, and in such event, all PIK Interest, together with all other outstanding principal, shall become immediately due and payable on such date.
Solely in the event that Harborside 2-3 Mezzanine Loan is simultaneously repaid upon the consummation of an assumption of the Harborside 2-3 Whole Loan, the Harborside 2-3 Whole Loan documents permit a future third-party mezzanine loan secured by a pledge of direct equity interest in the borrower upon such assumption of the Harborside 2-3 Whole Loan in accordance with the Harborside 2-3 Whole Loan documents and subject to the satisfaction of certain conditions including, among others, (i) the combined loan-to-value ratio based on the outstanding balance of the Harborside 2-3 Whole Loan and the new third-party mezzanine loan and, if applicable, the additional lender-mezzanine loan, may not exceed 75.0%, (ii) the aggregate debt service coverage ratio (taking into account, among other things, the aggregate outstanding principal balance of the Harborside 2-3 Whole Loan and the new third-party mezzanine loan, as calculated in accordance with the Harborside 2-3 Whole Loan documents), is at least 1.25x, (iii) the debt service coverage ratio of the Harborside 2-3 Whole Loan, as of the date of the closing of the proposed new third-party mezzanine loan, as calculated in accordance with the Harborside 2-3 Whole Loan documents, is at least 1.81x, (iv) execution of a subordination and intercreditor agreement reasonably acceptable to the lender and the rating agencies, and (v) receipt of a rating agency confirmation with respect to such new third-party mezzanine loan.
Preferred Equity. Concurrently with the funding of the Harborside 2-3 Whole Loan, NongHyup Bank provided $19,000,000 to SL Harborside JV LLC in exchange for a preferred membership interest in the company. The preferred equity documents include, among other things, a recourse guaranty and an equity contribution guaranty in an amount of $20,000,000, in each case made by the guarantors of the Harborside 2-3 Whole Loan.
Partial Release. Not permitted.
Ground Lease. None.
| THE INFORMATION IN THIS STRUCTURAL AND COLLATERAL TERM SHEET IS NOT COMPLETE AND MAY BE AMENDED PRIOR TO THE TIME OF SALE. THIS TERM SHEET IS NOT AN OFFER TO SELL THESE SECURITIES AND IT IS NOT A SOLICITATION OF AN OFFER TO BUY THESE SECURITIES IN ANY JURISDICTION WHERE THE OFFER OR SALE IS NOT PERMITTED. |
| | 81 | |
| Structural and Collateral Term Sheet | | BMO 2023-C5 |
| No. 8 – Cross Island Plaza |

| THE INFORMATION IN THIS STRUCTURAL AND COLLATERAL TERM SHEET IS NOT COMPLETE AND MAY BE AMENDED PRIOR TO THE TIME OF SALE. THIS TERM SHEET IS NOT AN OFFER TO SELL THESE SECURITIES AND IT IS NOT A SOLICITATION OF AN OFFER TO BUY THESE SECURITIES IN ANY JURISDICTION WHERE THE OFFER OR SALE IS NOT PERMITTED. |
| | 82 | |
| Structural and Collateral Term Sheet | | BMO 2023-C5 |
| No. 8 – Cross Island Plaza |
| THE INFORMATION IN THIS STRUCTURAL AND COLLATERAL TERM SHEET IS NOT COMPLETE AND MAY BE AMENDED PRIOR TO THE TIME OF SALE. THIS TERM SHEET IS NOT AN OFFER TO SELL THESE SECURITIES AND IT IS NOT A SOLICITATION OF AN OFFER TO BUY THESE SECURITIES IN ANY JURISDICTION WHERE THE OFFER OR SALE IS NOT PERMITTED. |
| | 83 | |
| Structural and Collateral Term Sheet | | BMO 2023-C5 |
| No. 8 – Cross Island Plaza |
| Mortgage Loan Information | | Property Information |
| Mortgage Loan Seller: | BMO | | Single Asset / Portfolio: | Single Asset |
| Original Principal Balance(1): | $30,000,000 | | Title: | Fee |
| Cut-off Date Principal Balance(1): | $30,000,000 | | Property Type – Subtype: | Office – CBD |
| % of IPB: | 4.5% | | Net Rentable Area (SF): | 256,930 |
| Loan Purpose: | Refinance | | Location: | Rosedale, NY |
| Borrowers: | Cross Island Plaza LLC and CIP Land LLC | | Year Built / Renovated: | 1982 / 2021 |
| Borrower Sponsors: | Chaim Simkowitz and Abraham J. Hoffman | | Occupancy: | 90.7% |
| Interest Rate: | 6.60500% | | Occupancy Date: | 3/20/2023 |
| Note Date: | 5/2/2023 | | 4th Most Recent NOI (As of)(4): | NAV |
| Maturity Date: | 5/6/2033 | | 3rd Most Recent NOI (As of)(4): | NAV |
| Interest-only Period: | 120 months | | 2nd Most Recent NOI (As of)(4): | NAV |
| Original Term: | 120 months | | Most Recent NOI (As of): | $3,540,289 (12/31/2022) |
| Original Amortization Term: | None | | UW Economic Occupancy: | 89.1% |
| Amortization Type: | Interest Only | | UW Revenues: | $8,112,684 |
| Call Protection(2): | L(25),D(91),O(4) | | UW Expenses: | $3,515,080 |
| Lockbox / Cash Management: | Hard / Springing | | UW NOI: | $4,597,605 |
| Additional Debt(1): | Yes | | UW NCF: | $4,366,368 |
| Additional Debt Balance(1): | $12,500,000 | | Appraised Value / Per SF: | $75,900,000 / $295 |
| Additional Debt Type(1): | Pari Passu | | Appraisal Date: | 2/20/2023 |
| | | | | |
| Escrows and Reserves(3) | | Financial Information(1) |
| | Initial | Monthly | Initial Cap | | | Whole Loan |
| Taxes: | $657,606 | $109,601 | N/A | | Cut-off Date Loan / SF: | $165 |
| Insurance: | $22,894 | $7,631 | N/A | | Maturity Date Loan / SF: | $165 |
| Replacement Reserves: | $0 | $3,212 | N/A | | Cut-off Date LTV: | 56.0% |
| TI/LC: | $2,700,000 | Springing | $500,000 | | Maturity Date LTV: | 56.0% |
| Deferred Maintenance: | $457,600 | $0 | N/A | | UW NCF DSCR: | 1.53x |
| | | | | | UW NOI Debt Yield: | 10.8% |
| | | | | | | |
| Sources and Uses |
| Sources | Proceeds | % of Total | | | Uses | Proceeds | % of Total | |
| Whole Loan(1) | $42,500,000 | 100.0 | % | | Loan Payoff | $28,547,718 | 67.2 | % |
| | | | | | Return of Equity | 8,860,177 | 20.8 | |
| | | | | | Upfront Reserve | 3,838,100 | 9.0 | |
| | | | | | Closing Costs | 1,254,006 | 3.0 | |
| Total Sources | $42,500,000 | 100.0 | % | | Total Uses | $42,500,000 | 100.0 | % |
| (1) | The Cross Island Plaza Mortgage Loan (as defined below) is part of a whole loan evidenced by two pari passu senior notes totaling $42.5 million, with an aggregate outstanding principal balance as of the Cut-off Date of $42.5 million (the “Cross Island Plaza Whole Loan”). The Financial Information in the chart above reflects the Cut-off Date Balance and Maturity Date Balance of the Cross Island Plaza Whole Loan. |
| (2) | The lockout period will be at least 25 months beginning with and including the first payment date on June 6, 2023. Defeasance of the Cross Island Plaza Mortgage Loan is permitted after the date that is the earlier of (i) two years from the closing date of the securitization that includes the last note to be securitized and (ii) May 2, 2027. The assumed lockout period of 25 payments is based on the anticipated closing date of the BMO 2023-C5 securitization trust in June 2023. The actual lockout period may be longer. |
| (3) | For a full description of Escrows and Reserves, please refer to “Escrows and Reserves” below. |
| (4) | The cash flow from 2019 to 2021 is unavailable due to the borrower acquiring the property in April 2021. |
| THE INFORMATION IN THIS STRUCTURAL AND COLLATERAL TERM SHEET IS NOT COMPLETE AND MAY BE AMENDED PRIOR TO THE TIME OF SALE. THIS TERM SHEET IS NOT AN OFFER TO SELL THESE SECURITIES AND IT IS NOT A SOLICITATION OF AN OFFER TO BUY THESE SECURITIES IN ANY JURISDICTION WHERE THE OFFER OR SALE IS NOT PERMITTED. |
| | 84 | |
| Structural and Collateral Term Sheet | | BMO 2023-C5 |
| No. 8 – Cross Island Plaza |
The Loan. The eighth largest mortgage loan (the “Cross Island Plaza Mortgage Loan”) is part of the Cross Island Plaza Whole Loan that is evidenced by two pari passu senior notes with an aggregate outstanding principal balance as of the Cut-off Date of $42,500,000. The Cross Island Plaza Whole Loan was originated by Bank of Montreal (“BMO”) on May 2, 2023. The Cross Island Plaza Whole Loan is secured by the borrowers’ fee interest in a 256,930 square foot, CBD office property located in Rosedale, New York (the “Cross Island Plaza Property”). The controlling Note A-1 has an outstanding principal balance as of the Cut-off Date of $30,000,000 and will be included in the BMO 2023-C5 trust. The Cross Island Plaza Whole Loan has a 10-year term, is interest-only for the full term of the loan and accrues interest at a rate of 6.60500% per annum on an Actual/360 basis. The Cross Island Plaza Whole Loan will be serviced under the BMO 2023-C5 pooling and servicing agreement. See “Description of the Mortgage Pool—The Whole Loans—The Serviced Pari Passu Whole Loans” in the Preliminary Prospectus.
| Whole Loan Summary |
| Note | Original Balance | Cut-off Date Balance | Note Holder | Lead Servicer for Whole Loan | Controlling Piece |
| A-1(1) | $30,000,000 | $30,000,000 | BMO 2023-C5 | Yes | Yes |
| A-2(2) | $12,500,000 | $12,500,000 | BMO | No | No |
| Whole Loan | $42,500,000 | $42,500,000 | | | |
| (1) | Note A-1 is the controlling note for the Cross Island Plaza Whole Loan. |
| (2) | Expected to be contributed to future securitizations. |
The Property. The Cross Island Plaza Property is a three-story office building totaling 256,930 square feet located in Rosedale, New York on a 5.44-acre site. The Cross Island Plaza Property was built in 1982. The Cross Island Plaza Property has 650 surface parking spaces (approximately 2.5 spaces per 1,000 square feet). The Cross Island Plaza Property is located in Queens County and is accessible by Merrick Boulevard, within six blocks from the Rosedale train station where the Babylon, Far Rockaway, and Long Beach train branches are available. The Cross Island Plaza Property is 90.7% occupied by 65 tenants as of March 20, 2023.
Major Tenants. The three largest tenants based on net rentable area are OEC Freight, Schenker Inc. and Gregory Spektor.
OEC Freight (28,110 square feet; 10.9% of NRA; 12.6% of underwritten base rent; Moody’s/S&P/Fitch: NR/NR/NR). OEC Freight is a global logistics and freight forwarding company headquartered in Taipei, Taiwan, with officed in over 50 countries. The company was founded in 1981 and has since grown to become one of the largest logistics providers in the world, with a range of services that include air freight, ocean freight, land transportation, customs brokerage, warehousing, and supply chain management. The Cross Island Plaza Property serves as OEC Freight’s East Coast headquarters. Other major facilities in the United States include Los Angeles and Chicago.
Schenker Inc. (16,585 square feet; 6.5% of NRA; 7.0% of underwritten base rent; Moody’s/S&P/Fitch: Aa1/AA-/NR). Schenker Inc. is a global logistics and transportation company that provides a range of services to customers in industries such as automotive, consumer goods, healthcare, industrial, and retail. The company is a subsidiary of DB Schenker, a division of Deutsche Bahn AG, and has its headquarters in Essen, Germany. Schenker Inc. with approximately 1,850 locations around the world with over 76,100 employees.
Gregory Spektor (13,989 square feet; 5.4% of NRA; 6.6% of underwritten base rent; Moody’s/S&P/Fitch NR/NR/NR). Gregory Spektor is a law firm based in New York, New York, providing legal services in various areas of law, including immigration law, business law, real estate law, and intellectual property law. The firm's founder and principal attorney, Gregory Spektor, is admitted to practice in the state of New York, as well as the U.S. District Court for the Southern and Eastern Districts of New York. He has represented clients in a range of industries, including finance, healthcare, technology, and real estate.
Environmental. The Phase I environmental assessment dated February 24, 2023 identified a recognized environmental condition (the “REC”) at the Cross Island Plaza Property in connection with auto repair shops/gasoline filling stations that were historically located in three areas of the Cross Island Plaza Property, and since no prior investigations appear to have been performed address potential impacts, these auto repair shops/gasoline filling stations represent a REC. See “Description of the Mortgage Pool—Environmental Considerations” in the Preliminary Prospectus.
| THE INFORMATION IN THIS STRUCTURAL AND COLLATERAL TERM SHEET IS NOT COMPLETE AND MAY BE AMENDED PRIOR TO THE TIME OF SALE. THIS TERM SHEET IS NOT AN OFFER TO SELL THESE SECURITIES AND IT IS NOT A SOLICITATION OF AN OFFER TO BUY THESE SECURITIES IN ANY JURISDICTION WHERE THE OFFER OR SALE IS NOT PERMITTED. |
| | 85 | |
| Structural and Collateral Term Sheet | | BMO 2023-C5 |
| No. 8 – Cross Island Plaza |
The following table presents certain information relating to the historical and current occupancy of the Cross Island Plaza Property.
| Historical and Current Occupancy(1) |
| 2019 | 2020 | 2021 | 2022 | Current(2) |
| 96.1% | 86.7% | 85.2% | 86.4% | 90.7% |
| (1) | Historical occupancies are as of December 31 of each respective year. |
| (2) | Current occupancy is as of March 20, 2023 |
The following table presents certain information relating to the largest tenants based on net rentable area of the Cross Island Plaza Property:
| Top Tenant Summary(1) |
| Tenant | Ratings
Moody’s/S&P/Fitch(2) | Net Rentable Area (SF) | % of
Total NRA | UW Base Rent PSF(3) | UW Base Rent(3) | % of Total
UW Base Rent(3) | Lease
Expiration Date |
| OEC Freight | NR/NR/NR | 28,110 | 10.9 | % | $30.82 | $866,443 | 12.6 | % | 5/31/2025 |
| Schenker Inc. | Aa1/AA-/NR | 16,585 | 6.5 | | $28.86 | 478,651 | 7.0 | | 3/31/2027 |
| Gregory Spektor | NR/NR/NR | 13,989 | 5.4 | | $32.43 | 453,660 | 6.6 | | 11/30/2032 |
| Kocher & Associates | NR/NR/NR | 11,037 | 4.3 | | $19.81 | 218,661 | 3.2 | | 12/31/2029 |
| DAMCO USA | Baa2/BBB+/NR | 8,274 | 3.2 | | $27.42 | 226,903 | 3.3 | | 1/31/2026 |
| Snap, Inc. | NR/NR/NR | 7,657 | 3.0 | | $26.10 | 199,836 | 2.9 | | 3/31/2024 |
| Holt Construction | NR/NR/NR | 7,353 | 2.9 | | $31.93 | 234,781 | 3.4 | | 6/30/2024 |
| Ocasa | NR/NR/NR | 7,320 | 2.8 | | $33.48 | 245,037 | 3.6 | | 9/30/2029 |
| Weida Freight Systems, Inc. | NR/NR/NR | 6,478 | 2.5 | | $20.22 | 130,984 | 1.9 | | 8/31/2024 |
| Bolloré Logistics USA | NR/NR/NR | 6,430 | 2.5 | | $34.10 | 219,235 | 3.2 | | 9/30/2027 |
| Top 10 Tenants | | 113,233 | 44.1 | % | $28.92 | $3,274,191 | 47.6 | % | |
| | | | | | | | |
| Other Tenants | | 119,760 | 46.6 | % | $30.07 | $3,601,444 | 52.4 | % | |
| | | | | | | | |
| Occupied Collateral Total / Wtd. Avg. | 232,993 | 90.7 | % | $29.51 | $6,875,635 | 100.0 | % | |
| Vacant Space | | 23,937 | 9.3 | % | | | | |
| | | | | | | | |
| Collateral Total | | 256,930 | 100.0 | % | | | | |
| | | | | | | | |
| (1) | Based on the underwritten rent roll dated as of March 20, 2023. |
| (2) | In certain instances, ratings provided are those of the parent company of the entity shown, whether or not the parent company guarantees the lease. |
| (3) | UW Base Rent, UW Base Rent PSF and % of Total UW Base Rent are comprised of underwritten base rent inclusive of contractual rent steps through June 2024. |
| THE INFORMATION IN THIS STRUCTURAL AND COLLATERAL TERM SHEET IS NOT COMPLETE AND MAY BE AMENDED PRIOR TO THE TIME OF SALE. THIS TERM SHEET IS NOT AN OFFER TO SELL THESE SECURITIES AND IT IS NOT A SOLICITATION OF AN OFFER TO BUY THESE SECURITIES IN ANY JURISDICTION WHERE THE OFFER OR SALE IS NOT PERMITTED. |
| | 86 | |
| Structural and Collateral Term Sheet | | BMO 2023-C5 |
| No. 8 – Cross Island Plaza |
The following table presents certain information relating to the tenant lease expirations of the Cross Island Plaza Property:
| Lease Rollover Schedule(1) |
| Year | Number of Leases Expiring | Net Rentable Area Expiring | % of NRA Expiring | UW Base Rent Expiring(2) | % of UW Base Rent Expiring(2) | Cumulative Net Rentable Area Expiring | Cumulative % of NRA Expiring | Cumulative UW Base Rent Expiring(2) | Cumulative % of UW Base Rent Expiring(2) |
| Vacant | NAP | 23,937 | 9.3 | % | NAP | NA | P | 23,937 | 9.3% | | NAP | NAP | |
| 2023 & MTM(3) | 11 | 25,959 | 10.1 | | 663,326 | 9.6 | % | 49,896 | 19.4% | | $663,326 | 9.6% | |
| 2024 | 13 | 38,400 | 14.9 | | 1,063,744 | 15.5 | | 88,296 | 34.4% | | $1,727,070 | 25.1% | |
| 2025 | 11 | 40,770 | 15.9 | | 1,259,439 | 18.3 | | 129,066 | 50.2% | | $2,986,509 | 43.4% | |
| 2026 | 14 | 37,166 | 14.5 | | 1,119,523 | 16.3 | | 166,232 | 64.7% | | $4,106,032 | 59.7% | |
| 2027 | 6 | 32,685 | 12.7 | | 1,024,727 | 14.9 | | 198,917 | 77.4% | | $5,130,759 | 74.6% | |
| 2028 | 5 | 15,075 | 5.9 | | 486,933 | 7.1 | | 213,992 | 83.3% | | $5,617,692 | 81.7% | |
| 2029 | 3 | 24,561 | 9.6 | | 655,243 | 9.5 | | 238,553 | 92.8% | | $6,272,935 | 91.2% | |
| 2030 | 0 | 0 | 0.0 | | 0 | 0.0 | | 238,553 | 92.8% | | $6,272,935 | 91.2% | |
| 2031 | 0 | 0 | 0.0 | | 0 | 0.0 | | 238,553 | 92.8% | | $6,272,935 | 91.2% | |
| 2032 | 2 | 18,377 | 7.2 | | 602,700 | 8.8 | | 256,930 | 100.0% | | $6,875,635 | 100.0% | |
| 2033 | 0 | 0 | 0.0 | | 0 | 0.0 | | 256,930 | 100.0% | | $6,875,635 | 100.0% | |
| 2034 & Beyond | 0 | 0 | 0.0 | | 0 | 0.0 | | 256,930 | 100.0% | | $6,875,635 | 100.0% | |
| Total | 65 | 256,930 | 100.0 | % | $6,875,635 | 100.0 | % | | | | |
| (1) | Based on the underwritten rent roll dated as of March 20, 2023. |
| (2) | UW Base Rent Expiring, % of UW Base Rent Expiring, Cumulative UW Base Rent Expiring and % of Cumulative UW Base Rent Expiring are comprised of underwritten base rent inclusive of contractual rent steps through June 2024. |
| (3) | 2023 & MTM is inclusive of amenity square footage and NYG Limousine. |
The following table presents certain information relating to the operating history and underwritten cash flows of the Cross Island Plaza Property:
| Operating History and Underwriting Net Cash Flow |
| | 12/31/2022 | Underwritten | Per Square Foot | %(1) |
| Base Rent(2) | $6,115,916 | $7,459,630 | $29.03 | 82.5 | % |
| Rent Steps(3) | 0 | 205,926 | 0.80 | 2.3 | |
| Recoveries | 557,960 | 896,190 | 3.49 | 9.9 | |
| Gross Potential Rent | $6,673,876 | $8,561,746 | $33.32 | 94.6 | % |
| Parking and Storage Income | 77,064 | 192,419 | 0.75 | 2.1 | |
| Total Other Income | 217,833 | 293,000 | 1.14 | 3.2 | |
| Net Rental Income | $6,968,773 | $9,047,165 | $35.21 | 100.0 | % |
| (Vacancy) | 0 | (934,481) | (3.64) | (10.3 | ) |
| Effective Gross Income | $6,968,773 | $8,112,684 | $31.58 | 89.7 | % |
| Total Expenses | 3,428,484 | 3,515,080 | 13.68 | 43.3 | |
| Net Operating Income | $3,540,289 | $4,597,605 | $17.89 | 56.7 | % |
| Total TI/LC, Capex/RR | 0 | 231,237 | 0.90 | 2.9 | |
| Net Cash Flow | $3,540,289 | $4,366,368 | $16.99 | 53.8 | % |
| (1) | % column represents percent of Net Rental Income for all revenue lines and represents percent of Effective Gross Income for the remainder of the fields. |
| (2) | Base Rent is based on the underwritten rent roll as of March 20, 2023. |
| (3) | Comprised of contractual rent steps through June 2024. |
| THE INFORMATION IN THIS STRUCTURAL AND COLLATERAL TERM SHEET IS NOT COMPLETE AND MAY BE AMENDED PRIOR TO THE TIME OF SALE. THIS TERM SHEET IS NOT AN OFFER TO SELL THESE SECURITIES AND IT IS NOT A SOLICITATION OF AN OFFER TO BUY THESE SECURITIES IN ANY JURISDICTION WHERE THE OFFER OR SALE IS NOT PERMITTED. |
| | 87 | |
| Structural and Collateral Term Sheet | | BMO 2023-C5 |
| No. 8 – Cross Island Plaza |
The Market. The Cross Island Plaza Property is situated within the South Queens office submarket of the Queens office market. According to the 2020 census, the population of Queens was 2.40 million, making it the second largest borough in New York City. Over the past ten years the Queens office market had a compound annual growth rate of 0.9% per year. Vacancy has ranged from 3.9% to 10.0% with an average of 6.5%. As of the fourth quarter of 2022, the Queens office market had an inventory of 48,038,572 square feet with 4,693,850 square feet being vacant, indicating a current vacancy rate of 9.8%.
According to the appraisal, as of 2022, the South Queens office submarket had an inventory of approximately 4,714,265 square feet, overall vacancy in the market of approximately 5.9% and average asking rents of $26.82 per square foot. According to the appraisal, the estimated 2022 population in the postal area of the Cross Island Plaza Property was 33,106. The 2022 average household income within the same area was $124,407.
The following table presents certain information relating to comparable office leases for the Cross Island Plaza Property:
| Comparable Office Leases(1) |
| Property / Location | Tenant SF | Year Built / Renovated | Tenant | Rent PSF | Lease Date | Lease Term | Structure |
Cross Island Plaza 13333 Brookville Boulevard Rosedale, NY | 256,930(2) | 1982 / 2021 | Various(2) | $29.51(2) | Various(2) | Various(2) | Modified Gross |
Lefrak Center 97-77 Queens Boulevard Rego Park, NY | 307,297 | 1964 / 2010 | City of New York Department of Parks | $37.00 | 6/1/2023 | 21.0 Yrs. | Modified Gross |
Whitestone Executive Center 30-50 Whitestone Expressway College Point, NY | 105,000 | 1988 / 2001 | Confidential | $30.00 | 3/15/2023 | 5.0 Yrs. | Modified Gross |
Lefrak Center 97-77 Queens Boulevard Rego Park, NY | 307,297 | 1964 / 2010 | New York Life | $44.00 | 12/25/2022 | 10.0 Yrs. | Modified Gross |
Flushing Plaza 41-61 Kissena Boulevard Flushing, NY | 363,663 | 1973 / 1995 | NY School Construction Authority | $35.00 | 7/1/2022 | 15.0 Yrs. | Modified Gross |
112-25 Queens Boulevard Forest Hills, NY | 27,300 | 1929 / NAP | Queens Democratic Org | $38.00 | 10/11/2022 | 5.0 Yrs. | Modified Gross |
241-02 Northern Boulevard Douglaston, NY | 22,116 | 1989 / NAP | Kent Prep, Inc. | $35.00 | 9/23/2022 | 10.0 Yrs. | Modified Gross |
| (1) | Source: Appraisal unless otherwise indicated. |
| (2) | Tenant SF, Tenant, Rent PSF, Lease Date and Lease Term for the Cross Island Plaza Property is based on underwritten rent from the underwritten rent roll dated March 20, 2023. |
The Borrowers. The borrowers are Cross Island Plaza LLC and CIP Land LLC, each a Delaware limited liability company and a single purpose bankruptcy-remote entity, with one independent director. Legal counsel to the borrowers delivered a non-consolidation opinion in connection with the origination of the Cross Island Plaza Whole Loan.
The Borrower Sponsors. The borrower sponsors and non-recourse carveout guarantors and environmental indemnitors are Chaim Simkowitz and Abraham J. Hoffman.
Property Management. The Cross Island Plaza Property is managed by Guardian Realty Management Inc., a third-party property management company.
Escrows and Reserves. At origination, the borrowers deposited into escrow (i) approximately $657,606 for real estate taxes, (ii) approximately $22,894 for insurance premiums, (iii) $457,600 for immediate repairs and (iv) $2,700,000 for the TI/LC reserve (the “Initial Rollover Deposit”)
Tax Escrows – On a monthly basis, the borrowers are required to escrow 1/12th of the annual estimated real estate taxes, which currently equates to approximately $109,601.
Insurance Escrows – On a monthly basis, the borrowers are required to escrow 1/12th of the annual estimated insurance premiums, which currently equates to approximately $7,631, waived if the borrower maintains an approved blanket policy.
Replacement Reserve – On a monthly basis, the borrowers are required to escrow $3,212 for replacement reserves.
| THE INFORMATION IN THIS STRUCTURAL AND COLLATERAL TERM SHEET IS NOT COMPLETE AND MAY BE AMENDED PRIOR TO THE TIME OF SALE. THIS TERM SHEET IS NOT AN OFFER TO SELL THESE SECURITIES AND IT IS NOT A SOLICITATION OF AN OFFER TO BUY THESE SECURITIES IN ANY JURISDICTION WHERE THE OFFER OR SALE IS NOT PERMITTED. |
| | 88 | |
| Structural and Collateral Term Sheet | | BMO 2023-C5 |
| No. 8 – Cross Island Plaza |
TI/LC Reserve –- On a monthly basis, the borrowers are required to escrow $21,411 if less than 90% of the rentable commercial space at the Cross Island Plaza Property is leased and the amount of funds on deposit in the rollover reserve (excluding the Initial Rollover Deposit) is less than $500,000.
Lockbox / Cash Management. The Cross Island Plaza Whole Loan is structured with a hard lockbox and springing cash management upon the occurrence and continuance of a Trigger Period (as defined below). The borrowers are required to cause each tenant at the Cross Island Plaza Property to deposit rents directly into a lender-controlled lockbox account. In addition, the borrowers are required to cause all rents received by the borrowers or property manager with respect to the Cross Island Plaza Property to be deposited into such lockbox account within two business days of receipt. During the continuance of a Trigger Period, all funds in the lockbox account are required to be swept each business day to a lender-controlled cash management account and disbursed in accordance with the Cross Island Plaza Whole Loan documents, and excess funds on deposit in the cash management account (after payments of required monthly reserve deposits, debt service payment on the Cross Island Plaza Whole Loan, operating expenses and cash management bank fees) will be applied in accordance with the Cross Island Plaza Whole Loan documents.
A “Trigger Period” means a period commencing upon the occurrence of the earlier of (i) an event of default under the Cross Island Plaza Whole Loan, (ii) as of the date of calculation, the debt service coverage ratio on the Cross Island Plaza Whole Loan is less than 1.30x, or (iii) upon the occurrence of a Specified Tenant Trigger Period (as defined below); and will end (x) with respect to clause (i) above, if the lender has accepted a cure of such event of default; (y) with respect to clause (ii) above, the date that the debt service coverage ratio on the Cross Island Plaza Whole Loan is at least equal to 1.30x and (z) with respect to clause (iii) above, upon a Specified Tenant Trigger Period ceasing to exist.
A “Specified Tenant Trigger Event” will commence upon the earliest to occur of (i) any Specified Tenant (as defined below) is in default of any monetary or material non-monetary term of its Specified Tenant lease, (ii) any Specified Tenant (a) terminates its lease or (b) notifies the borrowers or manager, in writing, that it intends to terminate its Specified Tenant lease, (iii) any Specified Tenant becomes insolvent or a debtor in any bankruptcy action, (iv) any Specified Tenant goes dark, or (v) any Specified Tenant fails to extend or renew the applicable Specified Tenant lease.
A “Specified Tenant” means (i) OEC Freight, (ii) any tenant that occupies over 10% of net rentable area, (iii) any tenant that accounts for over 10% of total rental income or (iv) any guarantors of the applicable related Specified Tenant leases at the Cross Island Plaza Property, and thereafter, any acceptable significant replacement tenant.
Subordinate Debt. None.
Mezzanine Debt. None.
Partial Release. Not permitted.
Ground Lease. None.
| THE INFORMATION IN THIS STRUCTURAL AND COLLATERAL TERM SHEET IS NOT COMPLETE AND MAY BE AMENDED PRIOR TO THE TIME OF SALE. THIS TERM SHEET IS NOT AN OFFER TO SELL THESE SECURITIES AND IT IS NOT A SOLICITATION OF AN OFFER TO BUY THESE SECURITIES IN ANY JURISDICTION WHERE THE OFFER OR SALE IS NOT PERMITTED. |
| | 89 | |
| Structural and Collateral Term Sheet | | BMO 2023-C5 |
| No. 9 – 500 Mamaroneck |
| THE INFORMATION IN THIS STRUCTURAL AND COLLATERAL TERM SHEET IS NOT COMPLETE AND MAY BE AMENDED PRIOR TO THE TIME OF SALE. THIS TERM SHEET IS NOT AN OFFER TO SELL THESE SECURITIES AND IT IS NOT A SOLICITATION OF AN OFFER TO BUY THESE SECURITIES IN ANY JURISDICTION WHERE THE OFFER OR SALE IS NOT PERMITTED. |
| | 90 | |
| Structural and Collateral Term Sheet | | BMO 2023-C5 |
| No. 9 – 500 Mamaroneck |
| THE INFORMATION IN THIS STRUCTURAL AND COLLATERAL TERM SHEET IS NOT COMPLETE AND MAY BE AMENDED PRIOR TO THE TIME OF SALE. THIS TERM SHEET IS NOT AN OFFER TO SELL THESE SECURITIES AND IT IS NOT A SOLICITATION OF AN OFFER TO BUY THESE SECURITIES IN ANY JURISDICTION WHERE THE OFFER OR SALE IS NOT PERMITTED. |
| | 91 | |
| Structural and Collateral Term Sheet | | BMO 2023-C5 |
| No. 9 – 500 Mamaroneck |
| Mortgage Loan Information | | Property Information |
| Mortgage Loan Seller: | BMO | | Single Asset / Portfolio: | Single Asset |
| Original Principal Balance: | $29,500,000 | | Title: | Fee |
| Cut-off Date Principal Balance: | $29,500,000 | | Property Type – Subtype: | Other – Leased Fee |
| % of IPB: | 4.5% | | Net Rentable Area (SF): | 1,502,820 |
| Loan Purpose: | Acquisition | | Location: | Harrison, NY |
| Borrower: | Harrison NY Holdings LLC | | Year Built / Renovated: | NAP / NAP |
| Borrower Sponsor: | Abraham Hoffman | | Occupancy: | NAP |
| Interest Rate: | 6.83000% | | Occupancy Date: | NAP |
| Note Date: | 4/5/2023 | | 4th Most Recent NOI (As of): | NAV |
| Maturity Date: | 4/6/2033 | | 3rd Most Recent NOI (As of): | NAV |
| Interest-only Period: | 120 months | | 2nd Most Recent NOI (As of): | NAV |
| Original Term: | 120 months | | Most Recent NOI (As of): | NAV |
| Original Amortization Term: | None | | UW Economic Occupancy: | 100.0% |
| Amortization Type: | Interest Only | | UW Revenues: | $2,522,053 |
| Call Protection: | L(26),D(90),O(4) | | UW Expenses: | $0 |
| Lockbox / Cash Management: | Hard / Springing | | UW NOI: | $2,522,053 |
| Additional Debt: | No | | UW NCF: | $2,522,053 |
| Additional Debt Balance: | NAP | | Appraised Value / Per SF: | $45,300,000 / $30 |
| Additional Debt Type: | NAP | | Appraisal Date: | 2/24/2023 |
| | | | | |
| Escrows and Reserves(1) | | Financial Information |
| | Initial | Monthly | Initial Cap | | Cut-off Date Loan / SF: | $20 |
| Taxes: | $0 | Springing | N/A | | Maturity Date Loan / SF: | $20 |
| Insurance: | $0 | Springing | N/A | | Cut-off Date LTV: | 65.1% |
| Replacement Reserves: | $0 | Springing | N/A | | Maturity Date LTV: | 65.1% |
| TI/LC Reserves: | $0 | Springing | N/A | | UW NCF DSCR: | 1.23x |
| Other: | $0 | $0 | N/A | | UW NOI Debt Yield: | 8.5% |
| | | | | | | |
| Sources and Uses |
| Sources | Proceeds | % of Total | | | Uses | Proceeds | % of Total | |
| Mortgage Loan | $29,500,000 | 71.7 | % | | Purchase Price | $40,000,000 | 97.2 | % |
| Borrower Sponsor Equity | 11,634,728 | 28.3 | | | Closing Costs | 1,134,728 | 2.8 | |
| Total Sources | $41,134,728 | 100.0 | % | | Total Uses | $41,134,728 | 100.0 | % |
| (1) | For a full description of Escrows and Reserves, please refer to “Escrows and Reserves” below. |
The Loan. The ninth largest mortgage loan (the “500 Mamaroneck Mortgage Loan”) has an outstanding principal balance as of the Cut-off Date of $29,500,000. The 500 Mamaroneck Mortgage Loan was originated by Bank of Montreal (“BMO”) on April 5, 2023. The 500 Mamaroneck Mortgage Loan is secured by a 1,502,820 square foot leased fee land parcel (the “500 Mamaroneck Property”). The leasehold improvements (which are not part of the collateral for the 500 Mamaroneck Mortgage Loan) consists of a 297,548 square foot, Class-A suburban office property located in Harrison, New York (the “Non-Collateral Improvements”). The 500 Mamaroneck Mortgage Loan has a 10-year term, is interest-only for the full term of the loan and accrues interest at a rate of 6.83000% per annum on an Actual/360 basis.
The Property. The 500 Mamaroneck Property is a 1,502,820 square foot leased fee land parcel. The Non-Collateral Improvements include a three-story office building totaling 297,548 square feet located in Harrison, New York on a 34.43-acre site. The Non-Collateral Improvements were built in 1986 and most recently renovated in 2019. The Non-Collateral Improvements have 900 surface parking spaces (approximately 3.0 spaces per 1,000 square feet). The Non-Collateral Improvements are located in Westchester County and is just south of the Hutchinson Parkway and two miles north of the New England Thruway I-95, approximately three miles west of the Harrison Metro-North train station, which offers commuter rail service to Manhattan every 20 minutes. As of March 1, 2023 the Non-Collateral Improvements are 86.7% occupied by 32 tenants.
| THE INFORMATION IN THIS STRUCTURAL AND COLLATERAL TERM SHEET IS NOT COMPLETE AND MAY BE AMENDED PRIOR TO THE TIME OF SALE. THIS TERM SHEET IS NOT AN OFFER TO SELL THESE SECURITIES AND IT IS NOT A SOLICITATION OF AN OFFER TO BUY THESE SECURITIES IN ANY JURISDICTION WHERE THE OFFER OR SALE IS NOT PERMITTED. |
| | 92 | |
| Structural and Collateral Term Sheet | | BMO 2023-C5 |
| No. 9 – 500 Mamaroneck |
Non-Collateral Improvements Major Tenants. The three largest tenants based on net rentable area of the Non-Collateral Improvements are O’Connor, Universal Remote Control and Mariner Investment.
O’Connor (45,361 of Non-Collateral Improvements square feet; 15.2% of Non-Collateral Improvements NRA; 17.2% of Non-Collateral Improvements underwritten base rent; Moody’s/S&P/Fitch: NR/NR/NR). PKF O’Connor Davies provides accounting, assurance, administrative, advisory, tax compliance and planning services to clients primarily focused in the northeast. O’Connor leases three units at the 500 Mamaroneck Property that are each set to expire on June 30, 2026.
Universal Remote Control (22,072 of Non-Collateral Improvements square feet; 7.4% of Non-Collateral Improvements NRA; 8.0% of Non-Collateral Improvements underwritten base rent; Moody’s/S&P/Fitch: NR/NR/NR). Universal Remote Control is a global leader in smart home automation and control solutions. URC control systems include Total Control and Complete Control. Innovative user interfaces include tabletop controllers, in-wall touchscreens, handheld remotes, keypads and mobile apps – plus voice control integration with Amazon Alexa and Google Assistant.
Mariner Investment (16,296 of Non-Collateral Improvements square feet; 5.5% of Non-Collateral Improvements NRA; 6.2% of Non-Collateral Improvements underwritten base rent; Moody’s/S&P/Fitch: NR/NR/NR). Mariner Investment Group is an alternative investment management firm founded in 1992 that offers highly specialized strategies, managed by top-tier professionals, that invest across both public and private markets. The firm has approximately $6.0 billion assets under management as of March 31, 2023, with eight offices worldwide housing 15 different strategy teams.
Ground Lease Tenant. The (“Ground Lease Tenant”) is Harrison Members LLC.
Environmental. According to a Phase I environmental assessment dated February 24, 2023, there was no evidence of any recognized environmental conditions at the 500 Mamaroneck Property.
The following table presents certain information relating to the historical and current occupancy of the Non-Collateral Improvements at the 500 Mamaroneck Property.
| Non-Collateral Improvements Tenants Historical and Current Occupancy(1)(2) |
| 2019 | 2020 | 2021 | 2022 | Current(3) |
| 96.2% | 89.0% | 85.4% | 87.7% | 86.7% |
| (1) | Historical occupancies are as of December 31 of each respective year. |
| (2) | Occupancies are based on tenants that occupy the Non-Collateral Improvements. The collateral is only the land square footage of 1,502,820 square feet. |
| (3) Current | occupancy is as of March 1, 2023. |
| THE INFORMATION IN THIS STRUCTURAL AND COLLATERAL TERM SHEET IS NOT COMPLETE AND MAY BE AMENDED PRIOR TO THE TIME OF SALE. THIS TERM SHEET IS NOT AN OFFER TO SELL THESE SECURITIES AND IT IS NOT A SOLICITATION OF AN OFFER TO BUY THESE SECURITIES IN ANY JURISDICTION WHERE THE OFFER OR SALE IS NOT PERMITTED. |
| | 93 | |
| Structural and Collateral Term Sheet | | BMO 2023-C5 |
| No. 9 – 500 Mamaroneck |
The following table presents certain information relating to the largest Non-Collateral Improvement tenants based on net rentable area of the Non-Collateral Improvements at the 500 Mamaroneck Property:
| Non-Collateral Improvements Top Tenant Summary(1) |
| Tenant | Ratings
Moody’s/S&P/Fitch(2) | Net Rentable Area (SF) | % of
Total NRA | UW Base Rent PSF(3) | UW Base Rent(3) | % of Total
UW Base Rent(3) | Lease
Expiration Date |
| O'Connor | NR/NR/NR | 45,361 | 15.2 | % | $29.22 | $1,325,250 | 17.2 | % | 6/30/2026 |
| Universal Remote Control | NR/NR/NR | 22,072 | 7.4 | | $28.00 | 618,016 | 8.0 | | 11/30/2025 |
| Mariner Investment | NR/NR/NR | 16,296 | 5.5 | | $29.50 | 480,732 | 6.2 | | 5/31/2026 |
| Orthopaedic & Neurosurgery Specialists | NR/NR/NR | 15,425 | 5.2 | | $33.00 | 509,025 | 6.6 | | 9/30/2028 |
| Pasternak Baum | NR/NR/NR | 14,595 | 4.9 | | $31.75 | 463,391 | 6.0 | | 10/31/2025 |
| York International | NR/NR/NR | 14,109 | 4.7 | | $29.25 | 412,688 | 5.4 | | 1/31/2028 |
| Stark Business Solutions of Harrison | NR/NR/NR | 13,758 | 4.6 | | $32.00 | 440,256 | 5.7 | | 1/31/2028 |
| Keevily Spero-Whitelaw | NR/NR/NR | 12,704 | 4.3 | | $27.50 | 349,360 | 4.5 | | 9/30/2033 |
| JDS Therapeutics | NR/NR/NR | 11,457 | 3.9 | | $28.09 | 321,882 | 4.2 | | 2/29/2028 |
| Gordon Rees | NR/NR/NR | 8,135 | 2.7 | | $49.03 | 398,826 | 5.2 | | 5/31/2027 |
| Top 10 Tenants | | 173,912 | 58.4 | % | $30.59 | $5,319,426 | 69.0 | % | |
| | | | | | | | |
| Other Tenants | | 84,115 | 28.3 | % | $28.45 | $2,392,827 | 31.0 | % | |
| | | | | | | | |
| Occupied Non-Collateral Total / Wtd. Avg. | 258,027 | 86.7 | % | $29.89 | $7,712,253 | 100.0 | % | |
| Vacant Space | | 39,521 | 13.3 | % | | | | |
| | | | | | | | |
| Non-Collateral Total | | 297,548 | 100.0 | % | | | | |
| | | | | | | | |
| (1) | Based on the underwritten rent roll dated March 1, 2023. |
| (2) | In certain instances, ratings provided are those of the parent company of the entity shown, whether or not the parent company guarantees the lease. |
| (3) | UW Base Rent PSF, UW Base Rent and % of Total UW Base Rent are comprised of underwritten base rent inclusive of contractual six month rent steps. |
The following table presents certain information relating to the sole tenant based on net rentable area of the 500 Mamaroneck Property:
| Top Tenant Summary(1) |
| Tenant | Ratings
Moody’s/S&P/Fitch(2) | Net Rentable Area (SF) | % of
Total NRA | UW Base Rent PSF | UW Base Rent(3) | % of Total
UW Base Rent | Lease
Expiration Date |
| Harrison Members LLC | NR/NR/NR | 1,502,820 | 100.0% | $8.48 | $2,522,053 | 100.0% | | 4/30/2122 |
| Top Tenant | | 1,502,820 | 100.0% | $8.48 | $2,522,053 | 100.0% | | |
| | | | | | | | |
| Other Tenants | | 0 | 0.0% | $0.00 | $0 | 0.0% | | |
| | | | | | | | |
| Occupied Collateral Total / Wtd. Avg. | 1,502,820 | 100.0% | $8.48 | $2,522,053 | 100.0% | | |
| Vacant Space | | 0 | 0.0% | | | | |
| | | | | | | | |
| Collateral Total | | 1,502,820 | 100.0% | | | | |
| | | | | | | | |
| (1) | Based on the Ground Lease (as defined below). |
| (2) | In certain instances, ratings provided are those of the parent company of the entity shown, whether or not the parent company guarantees the lease. |
| (3) | UW Base Rent PSF, UW Base Rent and % of Total UW Base Rent are based on the 10-year average under the Ground Lease subject to yearly increases and adjustments based on CPI. |
| THE INFORMATION IN THIS STRUCTURAL AND COLLATERAL TERM SHEET IS NOT COMPLETE AND MAY BE AMENDED PRIOR TO THE TIME OF SALE. THIS TERM SHEET IS NOT AN OFFER TO SELL THESE SECURITIES AND IT IS NOT A SOLICITATION OF AN OFFER TO BUY THESE SECURITIES IN ANY JURISDICTION WHERE THE OFFER OR SALE IS NOT PERMITTED. |
| | 94 | |
| Structural and Collateral Term Sheet | | BMO 2023-C5 |
| No. 9 – 500 Mamaroneck |
The following table presents certain information relating to the tenant lease expirations of the leasehold improvements at the Non-Collateral Improvements:
| Non-Collateral Improvements Lease Rollover Schedule(1) |
| Year | Number of Leases Expiring | Net Rentable Area Expiring | % of NRA Expiring | UW Base Rent Expiring(3) | % of UW Base Rent Expiring(3) | Cumulative Net Rentable Area Expiring | Cumulative % of NRA Expiring | Cumulative UW Base Rent Expiring(3) | Cumulative % of UW Base Rent Expiring(3) |
| Vacant | NAP | 39,521 | 13.3 | % | NAP | NA | P | 39,521 | 13.3% | | NAP | NAP | |
| 2023 & MTM(2) | 3 | 7,838 | 2.6 | | 89,216 | 1.2 | % | 47,359 | 15.9% | | $89,216 | 1.2% | |
| 2024 | 4 | 12,156 | 4.1 | | 361,807 | 4.7 | | 59,515 | 20.0% | | $451,023 | 5.8% | |
| 2025 | 6 | 50,695 | 17.0 | | 1,544,782 | 20.0 | | 110,210 | 37.0% | | $1,995,804 | 25.9% | |
| 2026 | 5 | 72,356 | 24.3 | | 2,108,613 | 27.3 | | 182,566 | 61.4% | | $4,104,418 | 53.2% | |
| 2027 | 6 | 29,845 | 10.0 | | 1,052,629 | 13.6 | | 212,411 | 71.4% | | $5,157,047 | 66.9% | |
| 2028 | 4 | 54,749 | 18.4 | | 1,683,851 | 21.8 | | 267,160 | 89.8% | | $6,840,898 | 88.7% | |
| 2029 | 1 | 2,477 | 0.8 | | 73,580 | 1.0 | | 269,637 | 90.6% | | $6,914,477 | 89.7% | |
| 2030 | 2 | 10,489 | 3.5 | | $302,158 | 3.9 | | 280,126 | 94.1% | | $7,216,635 | 93.6% | |
| 2031 | 0 | 0 | 0.0 | | 0 | 0.0 | | 280,126 | 94.1% | | $7,216,635 | 93.6% | |
| 2032 | 1 | 4,718 | 1.6 | | 146,258 | 1.9 | | 284,844 | 95.7% | | $7,362,893 | 95.5% | |
| 2033 | 1 | 12,704 | 4.3 | | $349,360 | 4.5 | | 297,548 | 100.0% | | $7,712,253 | 100.0% | |
| 2034 & Beyond | 0 | 0 | 0.0 | | 0 | 0 | | 297,548 | 100.0% | | $7,712,253 | 100.0% | |
| Total | 33 | 297,548 | 100.0 | % | $7,712,253 | 100.0 | % | | | | |
| (1) | Based on the underwritten rent roll dated March 1, 2023. |
| (2) | CHO Enterprises and ESRT Conference Center are being treated as MTM leases. |
| (3) | UW Base Rent Expiring, % of UW Base Rent Expiring, Cumulative UW Base Rent Expiring and % of Cumulative UW Base Rent Expiring are comprised of underwritten base rent inclusive of contractual six month rent steps. |
The following table presents certain information relating to the operating history and underwritten cash flows of the leasehold portion of the Non-Collateral Improvements:
| Non-Collateral Improvements Operating History and Underwriting Net Cash Flow |
| | 2019 | 2020 | 2021 | 2022 | Underwritten | Per Square Foot | %(1) |
| Base Rent(2) | $7,071,781 | $6,782,912 | $7,027,516 | $7,383,360 | $8,834,120 | $29.69 | | 106.7 | % |
| Rent Steps(3) | 0 | 0 | 0 | 0 | 103,285 | 0.35 | | 1.2 | |
| Reimbursements | 698,073 | 672,557 | 806,254 | 815,223 | 564,817 | 1.90 | | 6.8 | |
| Gross Potential Rent | $7,769,853 | $7,455,468 | $7,833,770 | $8,198,584 | $9,502,221 | $31.94 | | 114.8 | % |
| (Total Vacancy) | 0 | 0 | 0 | 0 | (1,225,151) | (4.12) | | (14.8 | ) |
| Net Rental Income | $7,769,853 | $7,455,468 | $7,833,770 | $8,198,584 | $8,277,070 | $27.82 | | 100.0 | % |
| Other Income | 303,046 | 274,474 | 250,680 | 262,716 | 546,200 | 1.84 | | 6.6 | |
| Effective Gross Income | $8,072,899 | $7,729,942 | $8,084,450 | $8,461,300 | $8,823,270 | $29.65 | | 106.6 | % |
| Total Expenses | 4,395,066 | 3,686,779 | 3,798,653 | 4,340,338 | 3,794,600 | 12.75 | | 43.0 | |
| Net Operating Income | $3,677,833 | $4,043,163 | $4,285,797 | $4,120,962 | $5,028,671 | $16.90 | | 57.0 | % |
| Total TI/LC, Capex/RR | 0 | 0 | 0 | 0 | 0 | 0.00 | | 0.0 | |
| Net Cash Flow | $3,677,833 | $4,043,163 | $4,285,797 | $4,120,962 | $5,028,671 | $16.90 | | 57.0 | % |
| (1) | % column represents percent of Net Rental Income for all revenue lines and represents percent of Effective Gross Income for the remainder of the fields. |
| (2) | Base Rent is based on the underwritten rent roll dated as of March 1, 2023. |
| (3) | Rent steps are based on six-month rent steps per the in-place rent roll. |
| THE INFORMATION IN THIS STRUCTURAL AND COLLATERAL TERM SHEET IS NOT COMPLETE AND MAY BE AMENDED PRIOR TO THE TIME OF SALE. THIS TERM SHEET IS NOT AN OFFER TO SELL THESE SECURITIES AND IT IS NOT A SOLICITATION OF AN OFFER TO BUY THESE SECURITIES IN ANY JURISDICTION WHERE THE OFFER OR SALE IS NOT PERMITTED. |
| | 95 | |
| Structural and Collateral Term Sheet | | BMO 2023-C5 |
| No. 9 – 500 Mamaroneck |
The following table presents certain information relating to the operating history and underwritten cash flows of the leased fee portion of the 500 Mamaroneck Property:
| Operating History and Underwriting Net Cash Flow |
| | Underwritten(1) | Per Square Foot | %(2) |
| Base Rent(3) | $2,522,053 | $1.68 | 100.0% |
| Rent Steps | 0 | 0.00 | 0.0 |
| Reimbursements | 0 | 0.00 | 0.0 |
| Gross Potential Rent | $2,522,053 | $1.68 | 100.0% |
| (Total Vacancy) | 0 | 0.00 | 0.0 |
| Net Rental Income | $2,522,053 | $1.68 | 100.0% |
| Other Income | 0 | 0.00 | 0.0 |
| Effective Gross Income | $2,522,053 | $1.68 | 100.0% |
| Total Expenses | 0 | 0.00 | 0.0 |
| Net Operating Income | $2,522,053 | $1.68 | 100.0% |
| Total TI/LC, Capex/RR | 0 | 0.00 | 0.0 |
| Net Cash Flow | $2,522,053 | $1.68 | 100.0% |
| (1) | Based on the underwritten rent roll as of March 1, 2023. |
| (2) | % column represents percent of Net Rental Income for all revenue lines and represents percent of Effective Gross Income for the remainder of the fields. |
| (3) | Base rent is based on the 10-year average under the Ground Lease. |
| THE INFORMATION IN THIS STRUCTURAL AND COLLATERAL TERM SHEET IS NOT COMPLETE AND MAY BE AMENDED PRIOR TO THE TIME OF SALE. THIS TERM SHEET IS NOT AN OFFER TO SELL THESE SECURITIES AND IT IS NOT A SOLICITATION OF AN OFFER TO BUY THESE SECURITIES IN ANY JURISDICTION WHERE THE OFFER OR SALE IS NOT PERMITTED. |
| | 96 | |
| Structural and Collateral Term Sheet | | BMO 2023-C5 |
| No. 9 – 500 Mamaroneck |
The Market. The 500 Mamaroneck Property is situated within the East I 287 / White Plains office submarket of the Westchester County office market. There are several large companies with corporate headquarters located in Harrison including MasterCard, PepsiCo, Atlas Air and subsidiary Polar Air Cargo, and Morgan Stanley. The subject’s location within Harrison Township is also about three miles south of the White Plains Central Business District, which has historically been the Central Business District for all of Westchester County and remains one of Westchester’s largest office and retail markets. The White Plains CBD contains over six million square feet of office space. According to Costar, there are 125 office buildings in the central business district including 20 class A office buildings. Over the past ten years the market had a compound annual growth rate of 0.3% per year. Vacancy has ranged from 13.9% to 18.0% with an average of 15.9%. As of the fourth quarter of 2022, the Westchester County office market had an inventory of 23,681,107 square feet with a current vacancy rate of 18.0% and an average asking rent of $30.31 per square foot. There have been no new constructions since 2018.
According to a third-party report, as of 2022, the East I 287 / White Plains office submarket had an inventory of 14,986,186 square feet, overall vacancy in the submarket of approximately 16.7% and average asking rents of $30.92 per square foot. According to a third-party market report, the 2022 population in the postal area of the 500 Mamaroneck Property was 13,085. The 2022 median household income within the same area was $136,303.
The following table presents certain information relating to comparable office leases for the Non-Collateral Improvements at the 500 Mamaroneck Property:
| Comparable Offices and Leases(1)(2) |
| Property / Location(2)(3) | Tenant SF | Year Built / Renovated | Tenant | Rent PSF | Lease Date | Lease Term | Structure |
500 Mamaroneck 500 Mamaroneck Road Harrison, NY | 297,548(2)(3) | 1986 / 2019 | Various(3) | $29.89(2)(3) | Various(2)(3) | Various(2)(3) | Modified Gross |
3111 North Street White Plains, NY | 2,622 | 1978 / 2008 | Confidential | $32.00 | Nov-22 | 10.0 Yrs. | Modified Gross |
1230 Mamaroneck Avenue White Plains, NY | 1,200 | 2005 / NAP | SKF | $32.00 | Oct-22 | 3.0 Yrs. | Modified Gross |
550 Mamaroneck Avenue Harrison, NY | 4,964 | 1986 / NAP | Audiology Associates of Westchester | $31.32 | Jun-22 | 11.0 Yrs. | Modified Gross |
120 Bloomingdale Road White Plains, NY | 28,944 | 1956 / NAP | Byram Healthcare Centers | $27.57 | Feb-22 | 2.2 Yrs. | Modified Gross |
1025 Winchester Avenue White Plains, NY | 1,314 | 1976 / 1992 | Confidential | $28.00 | Aug-21 | 5.0 Yrs. | Modified Gross |
1 N. Broadway White Plains, NY | 5,083 | 1987 / NAP | Cognitive & Behavioral Consultants | $35.00 | Feb-21 | 5.0 Yrs. | Modified Gross |
| (1) | Source: Appraisal unless otherwise indicated. |
| (2) | Refers to the Non-Collateral Improvements and leases compared to the Non-Collateral Improvements for the 500 Mamaroneck Property. |
| (3) | Based on the underwritten rent roll dated March 1, 2023. |
| (4) | Rent PSF is comprised of underwritten base rent inclusive of contractual six month rent steps. |
The Borrower. The borrower is Harrison NY Holdings LLC, a Delaware limited liability company. The borrower is structured as a single purpose bankruptcy-remote entity, with one independent director. Legal counsel to the borrower delivered a non-consolidation opinion in connection with the origination of the 500 Mamaroneck Mortgage Loan. The non-recourse carveout guarantor and environmental indemnitor with respect to the 500 Mamaroneck Mortgage Loan is Abraham Hoffman.
The Borrower Sponsor. The borrower sponsor is Abraham Hoffman.
Property Management. The 500 Mamaroneck Property is self-managed by Harrison NY Holdings LLC.
Escrows and Reserves.
Tax Escrows – On a monthly basis during the continuance of a Trigger Period (as defined below), the borrower is required to deposit into a tax reserve, 1/12th of the taxes that the lender estimates will be payable over the next-ensuing 12-month period, waived upon satisfaction of the Tax and Insurance Waiver Requirements (as defined below).
Insurance Escrows – During a trigger period, in the event that the borrower has not provided satisfactory evidence to the lender that the 500 Mamaroneck Property is covered by policies that are being maintained as part of a reasonably
| THE INFORMATION IN THIS STRUCTURAL AND COLLATERAL TERM SHEET IS NOT COMPLETE AND MAY BE AMENDED PRIOR TO THE TIME OF SALE. THIS TERM SHEET IS NOT AN OFFER TO SELL THESE SECURITIES AND IT IS NOT A SOLICITATION OF AN OFFER TO BUY THESE SECURITIES IN ANY JURISDICTION WHERE THE OFFER OR SALE IS NOT PERMITTED. |
| | 97 | |
| Structural and Collateral Term Sheet | | BMO 2023-C5 |
| No. 9 – 500 Mamaroneck |
acceptable blanket insurance policy in accordance with the 500 Mamaroneck Mortgage Loan documents, the borrower is required to deposit into an insurance reserve, on a monthly basis, 1/12th of the annual estimated insurance premiums, waived upon satisfaction of the Tax and Insurance Waiver Requirements.
Replacement Reserve – On a monthly basis, the borrower is required to escrow approximately $24,796 for replacement reserves, waived upon (i) no event of default, (ii) the Ground Lease (as defined below) is in full effect, (iii) the Ground Lease obligates the Ground Lease Tenant (as defined below) to pay for any capital improvements at the 500 Mamaroneck Property, and (iv) the Ground Tenant pays for any capital improvements at the 500 Mamaroneck Property.
Rollover Reserve –- On a monthly basis, the borrower is required to escrow approximately $5,482 for rollover reserves, waived upon (i) no event of default; (ii) the Ground Lease is in full effect.
The “Tax and Insurance Waiver Requirements” means (i) no event of default, (ii) the Ground Lease is in full effect ,(iii) Ground Lease Tenant is required under the Ground Lease to pay all taxes for the 500 Mamaroneck Property directly to the appropriate governmental taxing authority and to maintain insurance covering the 500 Mamaroneck Property, (iv) the policies maintained by the Ground Tenant covering the 500 Mamaroneck Property are approved by the lender, (v) Ground Tenant pays all taxes with respect to the 500 Mamaroneck Property directly to the appropriate governmental taxing authority and the borrower delivers to the lender no less than five business days prior to the respective due dates evidence reasonably satisfactory to the lender of the timely payment of all taxes for the 500 Mamaroneck Property, (vi) the Ground Tenant maintains all such insurance policies in full force and effect and the lender receives, no less than five business days prior to the lapse of such policies, evidence reasonably satisfactory to the lender that the Ground Tenant has paid any and all insurance premiums together with evidence of renewals of such insurance policies, (vii) the Ground Tenant has not expressed its intent to surrender, cancel or terminate the premises demised under the Ground, including in connection with any Lease Sweep Tenant Party Insolvency Proceeding (as defined below) and (viii) the occurrence of a Lease Sweep Tenant Party Insolvency Proceeding with respect to the Ground Tenant has not occurred.
Lockbox / Cash Management. The 500 Mamaroneck Mortgage Loan is structured with a hard lockbox and springing cash management upon the occurrence and continuance of a Trigger Period. The borrower is required to cause each tenant at the 500 Mamaroneck Property to deposit rents directly into a lender-controlled lockbox account. In addition, the borrower is required to cause all rents received by the borrower or property manager with respect to the 500 Mamaroneck Property to be deposited into such lockbox account within two business days. During the continuance of a Trigger Period, all funds in the lockbox account are required to be transferred each business day to a lender-controlled cash management account and disbursed in accordance with the 500 Mamaroneck Mortgage Loan documents, and excess funds on deposit in the cash management account (after payments of required monthly reserve deposits, debt service payment on the 500 Mamaroneck Mortgage Loan, operating expenses and cash management bank fees) will be applied in accordance with the 500 Mamaroneck Mortgage Loan documents.
A “Trigger Period” means a period commencing upon the occurrence of (i) an event of default, (ii) the debt service coverage ratio is less than 1.05x for two consecutive calendar quarters, (iii) the commencement of a Lease Sweep Period (as defined below), and will end (x) with respect to clause (i) above, if the lender has accepted a cure of such event of default, (y) with respect to clause (ii) above, the debt service coverage ratio is at least equal to 1.10x for two consecutive calendar quarters, and (z) with respect to clause (iii) above, the end of such Lease Sweep Period.
A ”Lease Sweep Period” will commence on the first payment date following the occurrence of, (i) the borrower or manager receives receipt from any tenant on a Lease Sweep Lease (as defined below) exercising a right to terminate their Lease Sweep Lease, (ii) the date that a Lease Sweep Lease is surrendered, cancelled or terminated prior to its expiration date, or the date that the borrower receives receipt of intent to surrender, cancel or terminate from any tenant on a Lease Sweep Lease, (iii) upon material non-monetary default by any tenant on a Lease Sweep Lease, and (iv) the occurrence of a Lease Sweep Tenant Party Insolvency Proceeding, and will end (w) with respect to clauses (i), (ii) and (iii) above, the occurrence of an Acceptable Lease Sweep Lease Event (as defined below) (x) with respect to clause (i) above, the termination option is revoked by the applicable tenant, (y) with respect to clause (iii) above, the date upon which the default has been cured and no other default under such Lease Sweep Lease occurs for a period of six consecutive months following such cure, and (z) with respect to clause (iv) above, either (a) the applicable Lease Sweep Tenant Party Insolvency Proceeding has terminated or (b) the applicable Lease Sweep Lease has been assumed by a third-party.
| THE INFORMATION IN THIS STRUCTURAL AND COLLATERAL TERM SHEET IS NOT COMPLETE AND MAY BE AMENDED PRIOR TO THE TIME OF SALE. THIS TERM SHEET IS NOT AN OFFER TO SELL THESE SECURITIES AND IT IS NOT A SOLICITATION OF AN OFFER TO BUY THESE SECURITIES IN ANY JURISDICTION WHERE THE OFFER OR SALE IS NOT PERMITTED. |
| | 98 | |
| Structural and Collateral Term Sheet | | BMO 2023-C5 |
| No. 9 – 500 Mamaroneck |
A “Lease Sweep Lease” means (i) the Ground Lease or (ii) any renewal or replacement lease with respect to all or a portion of the Lease Sweep Lease space.
An “Acceptable Lease Sweep Lease Event” means the entirety of the Lease Sweep Lease space is leased pursuant to one or more qualified leases in accordance with the 500 Mamaroneck Mortgage Loan documents.
A “Lease Sweep Tenant Party Insolvency Proceeding” means (i) the admission in writing by any tenant on a Lease Sweep Lease of its inability to pay its debts generally, or the making of a general assignment for the benefit of creditors, or the instituting by such tenant of any proceeding seeking to adjudicate it insolvent or seeking a liquidation or dissolution, or declaring bankruptcy or utilizing bankruptcy privileges, or (ii) the instituting of any proceeding against or with respect to any tenant on a Lease Sweep Lease seeking liquidation of its assets or the appointment of a receiver, liquidator, conservator, trustee or similar official in respect of it or the whole or any substantial part of its properties or assets.
Subordinate Debt. None.
Mezzanine Debt. None.
Partial Release. Not permitted.
Ground Lease. The 500 Mamaroneck Property is subject to a ground lease (the “Ground Lease”) dated as of April 5, 2023 between the borrower as the lessor, and the Ground Lease Tenant, as the lessee, with a term expiring on April 30, 2122. The current annual ground lease rent as of the Cut-off Date is equal to $2,200,000. Base rent for the next 10 subsequent lease years will be subject to the greater of 3.0% increase or the fixed net rent subject to CPI adjustment, then 2.5% increases for the proceeding four years and in year 15 it will be reset to the greater of 2.5% increase of the fixed net rent subject CPI adjustment. See “Description of the Mortgage Pool—Statistical Characteristics of the Mortgage Loans—Leasehold Interests” in the Preliminary Prospectus.
| THE INFORMATION IN THIS STRUCTURAL AND COLLATERAL TERM SHEET IS NOT COMPLETE AND MAY BE AMENDED PRIOR TO THE TIME OF SALE. THIS TERM SHEET IS NOT AN OFFER TO SELL THESE SECURITIES AND IT IS NOT A SOLICITATION OF AN OFFER TO BUY THESE SECURITIES IN ANY JURISDICTION WHERE THE OFFER OR SALE IS NOT PERMITTED. |
| | 99 | |
| Structural and Collateral Term Sheet | | BMO 2023-C5 |
| No. 10 – Sayville Plaza |
| THE INFORMATION IN THIS STRUCTURAL AND COLLATERAL TERM SHEET IS NOT COMPLETE AND MAY BE AMENDED PRIOR TO THE TIME OF SALE. THIS TERM SHEET IS NOT AN OFFER TO SELL THESE SECURITIES AND IT IS NOT A SOLICITATION OF AN OFFER TO BUY THESE SECURITIES IN ANY JURISDICTION WHERE THE OFFER OR SALE IS NOT PERMITTED. |
| | 100 | |
| Structural and Collateral Term Sheet | | BMO 2023-C5 |
| No. 10 – Sayville Plaza |
| THE INFORMATION IN THIS STRUCTURAL AND COLLATERAL TERM SHEET IS NOT COMPLETE AND MAY BE AMENDED PRIOR TO THE TIME OF SALE. THIS TERM SHEET IS NOT AN OFFER TO SELL THESE SECURITIES AND IT IS NOT A SOLICITATION OF AN OFFER TO BUY THESE SECURITIES IN ANY JURISDICTION WHERE THE OFFER OR SALE IS NOT PERMITTED. |
| | 101 | |
| Structural and Collateral Term Sheet | | BMO 2023-C5 |
| No. 10 – Sayville Plaza |
| THE INFORMATION IN THIS STRUCTURAL AND COLLATERAL TERM SHEET IS NOT COMPLETE AND MAY BE AMENDED PRIOR TO THE TIME OF SALE. THIS TERM SHEET IS NOT AN OFFER TO SELL THESE SECURITIES AND IT IS NOT A SOLICITATION OF AN OFFER TO BUY THESE SECURITIES IN ANY JURISDICTION WHERE THE OFFER OR SALE IS NOT PERMITTED. |
| | 102 | |
| Structural and Collateral Term Sheet | | BMO 2023-C5 |
| No. 10 – Sayville Plaza |
| Mortgage Loan Information | | Property Information |
| Mortgage Loan Seller: | CREFI | | Single Asset / Portfolio: | Single Asset |
| Original Principal Balance: | [$28,000,000] | | Title: | Fee |
| Cut-off Date Principal Balance: | [$28,000,000] | | Property Type – Subtype: | Retail – Anchored |
| % of IPB: | 4.2% | | Net Rentable Area (SF): | 237,093 |
| Loan Purpose: | Refinance | | Location: | Bohemia, NY |
| Borrower: | Transform Bohemia NY LLC | | Year Built / Renovated: | 1969 / 2021 |
| Borrower Sponsor: | Transform Midco LLC | | Occupancy: | 96.6% |
| Interest Rate: | [7.65000%] | | Occupancy Date: | 5/12/2023 |
| Note Date(1): | [5/15/2023] | | 4th Most Recent NOI (As of)(5): | NAV |
| Maturity Date: | [6/6/2028] | | 3rd Most Recent NOI (As of)(5): | NAV |
| Interest-only Period: | 60 months | | 2nd Most Recent NOI (As of)(5): | NAV |
| Original Term: | 60 months | | Most Recent NOI (As of)(5): | NAV |
| Original Amortization Term: | None | | UW Economic Occupancy: | 95.0% |
| Amortization Type: | Interest Only | | UW Revenues: | $4,738,005 |
| Call Protection(2): | L(2),YM1(51),O(7) | | UW Expenses: | $1,915,173 |
| Lockbox / Cash Management: | Hard / Springing | | UW NOI: | $2,822,832 |
| Additional Debt: | No | | UW NCF: | $2,627,530 |
| Additional Debt Balance: | N/A | | Appraised Value / Per SF: | $49,400,000 / $208 |
| Additional Debt Type: | N/A | | Appraisal Date: | 3/13/2023 |
| | | | | |
| Escrows and Reserves(3) | | Financial Information |
| | Initial | Monthly | Initial Cap | | Cut-off Date Loan / SF: | $118 |
| Taxes: | [$108,377] | [$108,377] | N/A | | Maturity Date Loan / SF: | $118 |
| Insurance: | [$158,031] | [$15,803] | N/A | | Cut-off Date LTV(6): | 52.6% |
| Replacement Reserves: | [$0] | [$2,872] | N/A | | Maturity Date LTV(6): | 52.6% |
| TI / LC Reserve: | [$828,029] | [$13,403] | N/A | | UW NCF DSCR: | 1.21x |
| Other Reserve(4): | [$3,143,565] | [$0] | N/A | | UW NOI Debt Yield(6): | 10.9% |
| | | | | | | |
| Sources and Uses |
| Sources | Proceeds | % of Total | | | Uses | Proceeds | % of Total |
| Mortgage Loan | [$28,000,000] | [92.2%] | | | Loan Payoff | [$24,054,055] | [79.2 | %] |
| Borrower Sponsor Equity | [2,355,228] | [7.8] | | | Closing Costs | [2,063,171] | [6.8] | |
| | | | | | Upfront Reserves | [4,238,003] | [14.0] | |
| Total Sources | [$30,355,228] | [100.0%] | | | Total Uses | [$30,355,228] | [100.0 | %] |
| (1) | The origination of the Sayville Plaza Mortgage Loan (as defined below) is expected to occur on [May 15, 2023] and the materials provided herein are premised upon drafts of the Sayville Plaza Mortgage Loan documents, however, there can be no assurance that the Sayville Plaza Mortgage Loan will be originated as expected or at all. |
| (2) | Prepayment of the Sayville Plaza Mortgage Loan is permitted at any time on or after the end of the 60-day period commencing on the closing date of the BMO 2023-C5 trust. The Yield Maintenance lockout period of 2 payments is based on the anticipated closing date of the BMO 2023-C5 securitization trust in June 2023. The actual lockout period may be longer. |
| (3) | For a full description of Escrows and Reserves, please refer to “Escrows and Reserves” below. |
| (4) | Other Reserves include an initial (i) pad holdback reserve funds of [$2,000,000] and (ii) landlord work reserve funds of [$1,143,565]. See “Escrows and Reserves” below. |
| (5) | Historical financial information is not available for the Sayville Plaza Property (as defined below) since the sponsor acquired the property in 2021. |
| (6) | Cut-off Date LTV, Maturity Date LTV and UW NOI Debt Yield calculations have been adjusted to net out the $[2,000,000] pad holdback reserve deposited at origination of the Sayville Plaza Mortgage Loan. The unadjusted Cut-off Date LTV, Maturity Date LTV and UW NOI Debt Yield are 56.7%, 56.7% and 10.1%. See “Escrows and Reserves“ below. |
The Loan. The tenth largest mortgage loan (the “Sayville Plaza Mortgage Loan”) is secured by the borrower’s fee interest in an anchored retail property totaling 237,093 square feet located in Bohemia, New York (the “Sayville Plaza Property”). The Sayville Plaza Mortgage Loan is expected to have an outstanding principal balance as of the Cut-off Date of [$28,000,000]. The Sayville Plaza Mortgage Loan is expected to be originated on [May 15, 2023] by Citi Real Estate Funding Inc. and accrues interest at a fixed rate of [7.65000]% and has an initial term of five years and is interest only for the full term. The first payment date for the Sayville Plaza Mortgage Loan is July 6, 2023.
| THE INFORMATION IN THIS STRUCTURAL AND COLLATERAL TERM SHEET IS NOT COMPLETE AND MAY BE AMENDED PRIOR TO THE TIME OF SALE. THIS TERM SHEET IS NOT AN OFFER TO SELL THESE SECURITIES AND IT IS NOT A SOLICITATION OF AN OFFER TO BUY THESE SECURITIES IN ANY JURISDICTION WHERE THE OFFER OR SALE IS NOT PERMITTED. |
| | 103 | |
| Structural and Collateral Term Sheet | | BMO 2023-C5 |
| No. 10 – Sayville Plaza |
The Property. The Sayville Plaza Property is an anchored retail center in Bohemia, New York totaling 237,093 square feet. The Sayville Plaza Property was originally constructed in 1969 and was recently renovated in 2021 after the sponsor acquired the property. The Sayville Plaza Property has 1,204 parking spaces resulting in a parking ratio of approximately 5.08 spaces per 1,000 square feet. The Sayville Plaza Property is situated on an approximately 23.4-acre site and consists of a 229,767 square foot anchored retail center and two out parcel ground leased restaurants. The two restaurant parcels are ground leased to Taco Bell and Chick-Fil-A. Pursuant to each such ground lease, the applicable tenant is responsible for constructing certain improvements upon the leased parcels. Pursuant to the Sayville Plaza Mortgage Loan documents, if such tenants do not complete the applicable improvements by [June 6, 2025] then the borrower must, no later than [June 6, 2026] either (i) complete the work necessary to construct a “white box” shell building on each parcel or (ii) demolish any improvements constructed on the parcels. All unfunded obligations for these spaces were reserved at closing including tenant improvements, leasing commissions, free rent and gap rent.
The Sayville Plaza Property also benefits from primary street frontage along the Sunrise Highway and six shadow anchor buildings that include national tenants such as Old Navy, Burger King, and Chipotle. Since renovating the Sayville Plaza Property in 2021, the sponsor has executed leases with At Home, Floor & Décor, Jo-Ann Fabrics, Aldi, Chick-Fil-A and Taco Bell. As of May 12, 2023, the Sayville Plaza Property was 96.6% leased by the aforementioned six tenants with a weighted average lease term remaining of approximately 11.6 years as of the Cut-off Date.
Major Tenants. The three largest tenants based on underwritten base rent are At Home, Floor & Décor and Jo-Ann Fabrics.
At Home (88,728 square feet; 37.4% of NRA; 31.4% of underwritten base rent): Founded in 1979, At Home specializes in home furnishings and décor including living room furniture, outdoor seating and decorations, wall décor, rugs, curtains and seasonal items. At Home also features collections from designers Laila Ali, Tracey Boyd, Willow Crossley, Grace Mitchell and Ty Pennington. As of March 29, 2023, At Home had a total store count of 262. At Home has been at the Sayville Plaza Property since November 2021 under a lease expiring in June 2032 with three, five-year renewal options. The At Home lease has no co-tenancy provisions or termination options.
Floor & Décor (79,607 square feet; 33.6% of NRA; 24.1% of underwritten base rent): Founded in 2000, Floor & Décor is a specialty retailer of hard surface flooring, offering a selection of tile, wood, stone, related tools and flooring accessories. As of December 29, 2022, Floor & Décor operated 191 warehouse-format stores and five design studios across 36 states. Floor & Décor stores additionally offer free design services and dedicated pro sales teams. Floor & Décor has been at the Sayville Plaza Property since September 2021 under a lease expiring in September 2036 with four, five-year renewal options. The Floor & Décor lease has no co-tenancy provisions or termination options.
Jo-Ann Fabrics (31,484 square feet; 13.3% of NRA; 21.2% of underwritten base rent): Founded in 1943, Jo-Ann Fabrics is a fabric and crafts specialty retailer with approximately 850 stores in 49 states. Jo-Ann Fabrics offers a variety of merchandise used in sewing, crafting and home decorating including fabric, crafts, frames, artificial plants, and finished seasonal and home décor items. Jo-Ann Fabrics recently took occupancy at the Sayville Plaza Property in April 2023 under a lease expiring in January 2034 with three, five-year renewal options. The Jo-Ann Fabrics lease has no termination options.
Environmental. According to the Phase I environmental assessment dated March 15, 2023, there was no evidence of any recognized environmental conditions at the Sayville Plaza Property.
The following table presents certain information relating to the historical and current occupancy of the Sayville Plaza Property:
| Historical and Current Occupancy(1) |
| 2020 | 2021 | 2022 | Current(2) |
| NAV | NAV | NAV | 96.6% |
| (1) | Historical occupancies is not available for the Sayville Plaza Property since the sponsor acquired and subsequently renovated the property in 2021. |
| (2) | Current Occupancy is based on the underwritten rent roll dated May 12, 2023. |
| THE INFORMATION IN THIS STRUCTURAL AND COLLATERAL TERM SHEET IS NOT COMPLETE AND MAY BE AMENDED PRIOR TO THE TIME OF SALE. THIS TERM SHEET IS NOT AN OFFER TO SELL THESE SECURITIES AND IT IS NOT A SOLICITATION OF AN OFFER TO BUY THESE SECURITIES IN ANY JURISDICTION WHERE THE OFFER OR SALE IS NOT PERMITTED. |
| | 104 | |
| Structural and Collateral Term Sheet | | BMO 2023-C5 |
| No. 10 – Sayville Plaza |
The following table presents certain information relating to the largest tenants based on underwritten base rent at the Sayville Plaza Property:
| Top Tenant Summary(1) |
| Tenant | Ratings Moody’s/S&P/Fitch(2) | Net Rentable Area (SF) | % of Total NRA | UW Base Rent PSF | UW Base Rent | % of Total UW Base Rent | Lease Expiration Date |
| At Home(3) | NR/NR/NR | 88,728 | 37.4 | % | $10.54 | $935,000 | 31.4 | % | 6/30/2032 |
| Floor & Décor(4) | NR/BB/NR | 79,607 | 33.6 | | $9.00 | 716,463 | 24.1 | | 9/30/2036 |
| Jo-Ann Fabrics(5) | NR/NR/NR | 31,484 | 13.3 | | $20.00 | 629,680 | 21.2 | | 1/31/2034 |
| Aldi(6) | NR/NR/NR | 21,948 | 9.3 | | $12.75 | 279,837 | 9.4 | | 8/31/2037 |
| Chick-Fil-A(7)(8) | NR/NR/NR | 5,226 | 2.2 | | $47.84 | 250,000 | 8.4 | | 5/31/2043 |
| Taco Bell(8)(9) | NR/NR/NR | 2,100 | 0.9 | | $78.57 | 165,000 | 5.5 | | 4/1/2044 |
| Total Occupied | | 229,093 | 96.6 | % | $12.99 | $2,975,980 | 100.0 | % | |
| Vacant Space | | 8,000 | 3.4 | | | | | |
| Total / Wtd. Avg. | | 237,093 | 100.0 | % | | | | |
| (1) | Based on the underwritten rent roll dated May 12, 2023. |
| (2) | In certain instances, ratings provided are those of the parent company of the entity shown, whether or not the parent company guarantees the lease. |
| (3) | At Home has three, five-year renewal options remaining. |
| (4) | Floor & Décor has four, five-year renewal options remaining. |
| (5) | Jo-Ann Fabrics has three, five-year renewal options remaining. |
| (6) | Aldi Fabrics has five, five-year renewal options remaining. |
| (7) | Chick Fil-A has six, five-year renewal options remaining. |
| (8) | Chick-Fil-A and Taco Bell have not yet taken possession of their respective premises. There can be no assurance that such tenants will complete their respective improvements, that such tenants’ leases will commence or that such tenants will take possession of the applicable premises and begin paying rent as expected or at all. |
| (9) | Taco Bell has four, five-year renewal options remaining. |
The following table presents certain information relating to tenant lease expirations at the Sayville Plaza Property:
| Lease Rollover Schedule(1)(2) |
| Year | Number of Leases Expiring | Net Rentable Area Expiring | % of NRA Expiring | UW Base Rent Expiring | % of UW Base Rent Expiring | Cumulative Net Rentable Area Expiring | Cumulative % of NRA Expiring | Cumulative UW Base Rent Expiring | Cumulative % of UW Base Rent Expiring |
| Vacant | NAP | 8,000 | 3.4 | % | NAP | NA | P | 8,000 | 3.4% | | NAP | NAP | |
| 2023 & MTM | 0 | 0 | 0.0 | | $0 | 0.0 | % | 8,000 | 3.4% | | $0 | 0.0% | |
| 2024 | 0 | 0 | 0.0 | | 0 | 0.0 | | 8,000 | 3.4% | | $0 | 0.0% | |
| 2025 | 0 | 0 | 0.0 | | 0 | 0.0 | | 8,000 | 3.4% | | $0 | 0.0% | |
| 2026 | 0 | 0 | 0.0 | | 0 | 0.0 | | 8,000 | 3.4% | | $0 | 0.0% | |
| 2027 | 0 | 0 | 0.0 | | 0 | 0.0 | | 8,000 | 3.4% | | $0 | 0.0% | |
| 2028 | 0 | 0 | 0.0 | | 0 | 0.0 | | 8,000 | 3.4% | | $0 | 0.0% | |
| 2029 | 0 | 0 | 0.0 | | 0 | 0.0 | | 8,000 | 3.4% | | $0 | 0.0% | |
| 2030 | 0 | 0 | 0.0 | | 0 | 0.0 | | 8,000 | 3.4% | | $0 | 0.0% | |
| 2031 | 0 | 0 | 0.0 | | 0 | 0.0 | | 8,000 | 3.4% | | $0 | 0.0% | |
| 2032 | 1 | 88,728 | 37.4 | | 935,000 | 31.4 | | 96,728 | 40.8% | | $935,000 | 31.4% | |
| 2033 | 0 | 0 | 0.0 | | 0 | 0.0 | | 96,728 | 40.8% | | $935,000 | 31.4% | |
| 2034 & Beyond | 5 | 140,365 | 59.2 | | 2,040,980 | 68.6 | | 237,093 | 100.0% | | $2,975,980 | 100.0% | |
| Total | 6 | 237,093 | 100.0 | % | $2,975,980 | 100.0 | % | | | | |
| (1) | Based on the underwritten rent roll dated May 12, 2023. |
| (2) | Certain tenants have more than one lease. Certain tenants may have lease termination options that are exercisable prior to the originally stated expiration date of the subject lease and that are not considered in the lease rollover schedule. |
| THE INFORMATION IN THIS STRUCTURAL AND COLLATERAL TERM SHEET IS NOT COMPLETE AND MAY BE AMENDED PRIOR TO THE TIME OF SALE. THIS TERM SHEET IS NOT AN OFFER TO SELL THESE SECURITIES AND IT IS NOT A SOLICITATION OF AN OFFER TO BUY THESE SECURITIES IN ANY JURISDICTION WHERE THE OFFER OR SALE IS NOT PERMITTED. |
| | 105 | |
| Structural and Collateral Term Sheet | | BMO 2023-C5 |
| No. 10 – Sayville Plaza |
The following table presents certain information relating to the underwritten cash flows at the Sayville Plaza Property:
| Underwritten Net Cash Flow(1) |
| | Underwritten | Per Square Foot | %(2) |
| Rents in Place | $2,975,980 | $12.55 | 59.7 | % |
| Vacant Income | 224,615 | 0.95 | 4.5 | |
| Gross Potential Rent | $3,200,595 | $13.50 | 64.2 | % |
| Total Reimbursements | 1,786,779 | 7.54 | 35.8 | |
| Net Rental Income | $4,987,374 | $21.04 | 100.0 | % |
| (Vacancy/Credit Loss) | (249,369) | (1.05) | (5.0) | |
| Effective Gross Income | $4,738,005 | $19.98 | 95.0 | % |
| Real Estate Taxes | 1,304,568 | 5.50 | 27.5 | |
| Insurance | 180,607 | 0.76 | 3.8 | |
| Management Fee | 142,140 | 0.60 | 3.0 | |
| Other Operating Expenses(3) | 287,858 | 1.21 | 6.1 | |
| Total Expenses | $1,915,173 | $8.08 | 40.4 | % |
| Net Operating Income | $2,822,832 | $11.91 | 59.6 | % |
| Replacement Reserves | 34,465 | 0.15 | 0.7 | |
| TI/LC | 160,837 | 0.68 | 3.4 | |
| Net Cash Flow | $2,627,530 | $11.08 | 55.5 | % |
| (1) | Historical financial information is not available for the Sayville Plaza Property since the sponsor acquired the property in 2021. |
| (2) | % column represents percent of Net Rental Income for all revenue lines and represents percent of Effective Gross Income for the remainder of fields. |
| (3) | Other Operating Expenses primarily consists of repairs and maintenance and utilities expenses. |
The Market. The Sayville Plaza Property is located within Suffolk County at 5151 Sunrise Highway in Bohemia, New York. The Sayville Plaza Property is part of the New York-Newark-Jersey City metro area and has frontage off of Sunrise Highway which provides primary access to the Sayville Plaza Property. Public transportation to the Sayville Plaza Property is provided by the Long Island Railroad Main Line at the Ronkonkoma Station and by the Suffolk County Transit bus.
According to the Appraisal, the Sayville Plaza Property is located with the Central Suffolk retail submarket. As of December 31, 2022, the Central Suffolk retail submarket had retail inventory of 27,191,359 square feet with a vacancy rate of 4.20% and an average asking rental rate of $24.07 per square foot. As of December 31, 2022, the Central Suffolk retail submarket reported completions of 24,831 square feet and positive net absorption of 179,694 square feet.
According to a third-party market research report, the estimated 2022 population within a one-, three-, and five-mile radius of the Sayville Plaza Property was 7,775, 71,829, and 180,002, respectively and the estimated 2022 average household income with the same radii was approximately $134,810, $150,581, and $144,943, respectively.
| THE INFORMATION IN THIS STRUCTURAL AND COLLATERAL TERM SHEET IS NOT COMPLETE AND MAY BE AMENDED PRIOR TO THE TIME OF SALE. THIS TERM SHEET IS NOT AN OFFER TO SELL THESE SECURITIES AND IT IS NOT A SOLICITATION OF AN OFFER TO BUY THESE SECURITIES IN ANY JURISDICTION WHERE THE OFFER OR SALE IS NOT PERMITTED. |
| | 106 | |
| Structural and Collateral Term Sheet | | BMO 2023-C5 |
| No. 10 – Sayville Plaza |
The following table presents certain information relating to comparable retail leases to the Sayville Plaza Property:
| Summary of Comparable Leases(1) |
| Property Name / Address | Location | Year Built / Renovated | Size (SF) | Rent/SF | Commencement | Lease Term (Months) |
| Sayville Plaza | Bohemia, NY | 1969/2021 | 237,093(2) | $12.99(2) | Various(2) | Various(2) |
| North Ocean Avenue | Farmingville, NY | 2022/NAP | 35,053 | $25.00 | Jun-2022 | 180 |
| 3350 Hillside Avenue | New Hyde Park, NY | 1985/NAP | 20,000 | $30.00 | Apr-2021 | 120 |
| 867 East Gate Boulevard | Westbury, NY | 2020/NAP | 50,000 | $43.00 | Nov-2020 | 180 |
| 2280-2390 North Ocean Avenue | Farmingville, NY | 1978/2021 | 281,012 | $11.79 | Jan-2020 | 60 |
| (1) | Source: Appraisal unless otherwise indicated. |
| (2) | Based on the underwritten rent roll as of May 12, 2023. |
The Borrower. The borrower is Transform Bohemia NY LLC, a Delaware limited liability company and single purpose entity having at least one independent director in its organizational structure. Legal counsel to the borrower delivered a non-consolidation opinion in connection with the origination of the Sayville Plaza Mortgage Loan.
The Borrower’s Sponsor. The borrower sponsor and non-recourse carveout guarantor is Transform Midco LLC. Transform Midco LLC is an affiliate of Transformco Properties, which is the dedicated real estate investment and operating division of Transform Holdco LLC which is responsible for the management and monetization of a portfolio consisting of former Kmart and Sears properties around the United States. The borrower sponsor and nonrecourse carveout guarantor also provided a completion guaranty pursuant to which the borrower sponsor guaranteed the borrower’s obligations to complete the improvements required under the Taco Bell and Chick-Fil-A leases.
Property Management. The Sayville Plaza Mortgage Property is managed by TFP Property Management LLC, a borrower-affiliated management company.
Escrows and Reserves. At origination of the Sayville Plaza Mortgage Loan, the borrower deposited approximately (i) [$108,377] into a reserve account for real estate taxes, (ii) [$158,031] into a reserve account for insurance, (iii) [$828,029] into a reserve account for tenant improvements and leasing commissions, (iv) [$1,143,565] into a landlord work reserve account for the purposes of funding the borrower’s landlord work in connection with the leases for Taco Bell and Chick-Fil-A, and (v) [$2,000,000] into a pad holdback reserve account.
Tax Reserve – The borrower is required to deposit into a real estate tax reserve, on a monthly basis, 1/12 of the taxes that the lender estimates will be payable over the next-ensuing 12-month period (initially estimated to be approximately [$108,377]).
Insurance Reserve – The borrower is required to deposit into an insurance reserve, on a monthly basis, 1/12 of the amount which will be sufficient to pay the insurance premiums due for the renewal of coverage afforded by such policies (initially estimated to be approximately [$15,803]).
Replacement Reserve – The borrower is required to deposit into a replacement reserve, on a monthly basis, an amount equal to approximately [$2,872].
TI/LC Reserve – On each monthly payment date the borrower is required to deposit into a tenant improvement and leasing commissions reserve an amount equal to approximately [$13,403].
Pad Holdback Reserve Funds – At origination of the Sayville Plaza Mortgage Loan, the borrower was required to deposit [$2,000,000] into a pad holdback reserve account ([$1,200,000] of which is allocated for the Chick-Fil-A lease and [$800,000] of which is allocated for the Taco Bell lease) (the “Pad Holdback Reserve Funds”) to be held as additional cash collateral for the Sayville Plaza Mortgage, portions of which are allocable to gap rent and leasing commissions due under the applicable leases for Taco Bell and Chick-Fil-A. The lender will disburse to the borrower the Pad Holdback Reserve
| THE INFORMATION IN THIS STRUCTURAL AND COLLATERAL TERM SHEET IS NOT COMPLETE AND MAY BE AMENDED PRIOR TO THE TIME OF SALE. THIS TERM SHEET IS NOT AN OFFER TO SELL THESE SECURITIES AND IT IS NOT A SOLICITATION OF AN OFFER TO BUY THESE SECURITIES IN ANY JURISDICTION WHERE THE OFFER OR SALE IS NOT PERMITTED. |
| | 107 | |
| Structural and Collateral Term Sheet | | BMO 2023-C5 |
| No. 10 – Sayville Plaza |
Funds for Taco Bell or Chick-Fil-A, as applicable, upon satisfaction by the borrower, among other conditions set forth in the Sayville Plaza Mortgage Loan documents, of the following conditions (i) on the date the borrower requests such disbursement, no event of default and no Trigger Period (as defined below) exist and remain uncured; (ii) the improvements required to be constructed by Taco Bell or Chick-Fil-A, as applicable, to each such tenant’s leased parcel pursuant to each tenant’s respective lease have been fully completed and (iii) Taco Bell or Chick-Fil-A, as applicable, are in possession of their applicable parcel improvements, are open for business and operating, and paying full and unabated rent.
Lockbox / Cash Management. The Sayville Plaza Mortgage Loan is structured with a hard lockbox and springing cash management. At origination of the Sayville Plaza Mortgage Loan, the borrower was required to deliver a notice to each tenant directing them to remit all payments under the applicable lease directly to the lender-controlled lockbox account. All funds received by the borrower, or the property manager, are required to be deposited in the lockbox account within two business days following receipt. All funds deposited into the lockbox are required to be released to the borrower on each business day unless a Trigger Period exists and the lender elects to deliver a restricted account notice to the borrower. Upon the occurrence and during the continuance of a Trigger Period, all funds in the lockbox account are required to be swept on each business day to a lender-controlled cash management account to be applied and disbursed in accordance with the Sayville Plaza Mortgage Loan documents, and all excess cash flow funds remaining in the cash management account after the application of such funds are required to be held by the lender in an excess cash flow reserve account as additional collateral for the Sayville Plaza Mortgage Loan. Upon the cure of the applicable Trigger Period, so long as no other Trigger Period exists, the lender is required to return any amounts remaining on deposit in the excess cash flow reserve account to the borrower. Upon an event of default under the Sayville Plaza Mortgage Loan documents, the lender will apply funds to the debt in such priority as it may determine.
A “Trigger Period” means a period (A) commencing upon the earliest of (i) the occurrence and continuance of an event of default, (ii) the debt yield falling below 8.75% as of any calendar quarter, (iii) the occurrence of Specified Tenant Trigger Period (as defined below), and (iv) the failure of the guarantor to maintain a net worth of not less than [$25,000,000] and liquid assets of not less than [$2,500,000]; and (B) expiring upon (1) with regard to clause (i) above, the cure (if applicable) of such event of default, (2) with regard to clause (ii) above, the date that the debt yield is equal to or greater than 8.75% for two consecutive calendar quarters, (3) with regard to clause (iii) above, a Specified Tenant Trigger Period ceasing to exist, and (iv) with regard to clause (iv) above, the date that the guarantor maintains a net worth of not less than [$25,000,000] and liquid assets of not less than [$2,500,000] for two consecutive calendar quarters.
A ”Specified Tenant Triger Period” means a period (A) commencing upon the first to occur of (i) any Specified Tenant (as defined below) being in monetary default or material non-monetary default under the applicable Specified Tenant lease beyond applicable notice and cure periods, (ii) any Specified Tenant failing to be in actual, physical possession of its applicable Specified Tenant space (or applicable portion thereof), (iii) after a Specified Tenant has started paying rent and has opened for business, such Specified Tenant failing to be open for business during customary hours and/or “going dark” in the Specified Tenant space (or applicable portion thereof) for a period of 180 consecutive days, (iv) any Specified Tenant giving notice that it is terminating its lease for more than 25% of its applicable Specified Tenant space, (v) any termination or cancellation of any Specified Tenant lease (including, without limitation, rejection in any bankruptcy or similar insolvency proceeding) and/or any Specified Tenant lease failing to otherwise be in full force and effect, (vi) any bankruptcy or similar insolvency of Specified Tenant, (vii) any Specified Tenant failing to extend or renew the applicable Specified Tenant lease on or prior the applicable Specified Tenant extension deadline in accordance with the applicable terms and conditions thereof and hereof for five years, and (viii) any Specified Tenant ceasing to satisfy its applicable credit rating condition (a “Credit Rating Trigger”); and (B) expiring upon the first to occur of (1) the satisfaction of the applicable Specified Tenant Cure Conditions (as defined below); or (2) the borrower leasing the entire Specified Tenant space (or applicable portion thereof) for a minimum term of five years, pursuant to one or more leases in accordance with the applicable terms and conditions of the Sayville Plaza Mortgage Loan documents, the applicable tenant(s) under such lease(s) being in actual, physical occupancy of space demised under any such lease, all contingencies to effectiveness of each such lease having expired or been satisfied, each such lease having commenced and a rent commencement date having been established (without possibility of delay) and, in the lender’s judgment, the applicable Specified Tenant Excess Cash Flow Condition (as defined below) is satisfied in connection therewith.
A “Specified Tenant” means (i) At Home, (ii) Floor & Décor and/or (iii) Jo-Ann Fabrics.
| THE INFORMATION IN THIS STRUCTURAL AND COLLATERAL TERM SHEET IS NOT COMPLETE AND MAY BE AMENDED PRIOR TO THE TIME OF SALE. THIS TERM SHEET IS NOT AN OFFER TO SELL THESE SECURITIES AND IT IS NOT A SOLICITATION OF AN OFFER TO BUY THESE SECURITIES IN ANY JURISDICTION WHERE THE OFFER OR SALE IS NOT PERMITTED. |
| | 108 | |
| Structural and Collateral Term Sheet | | BMO 2023-C5 |
| No. 10 – Sayville Plaza |
“Specified Tenant Cure Conditions” mean each of the following, as applicable (i) the applicable Specified Tenant has cured all monetary and material non-monetary defaults under the applicable Specified Tenant lease and no other such default under such Specified Tenant lease remains beyond applicable notice and cure periods, (ii) the applicable Specified Tenant is in actual, physical possession of the Specified Tenant space (or applicable portion thereof) and open for business during customary hours and not “dark” in the Specified Tenant space (or applicable portion thereof), (iii) the applicable Specified Tenant has revoked or rescinded all termination or cancellation notices with respect to the applicable Specified Tenant lease and has re-affirmed the applicable Specified Tenant lease as being in full force and effect, (iv) in the event the Specified Tenant Trigger Period is due to the applicable Specified Tenant’s failure to extend or renew the applicable Specified Tenant lease in accordance with clause (vii) of the definition of “Specified Tenant Trigger Period”, if the applicable Specified Tenant has renewed or extended the applicable Specified Tenant lease in accordance with the terms thereof and of the Sayville Plaza Mortgage Loan documents for five years and, in lender’s reasonable judgment, the applicable Specified Tenant Excess Cash Flow Condition is satisfied in connection therewith, (v) with respect to any applicable bankruptcy or insolvency proceedings involving the applicable Specified Tenant and/or the applicable Specified Tenant lease, the applicable Specified Tenant is no longer insolvent or subject to any bankruptcy or insolvency proceedings and has affirmed the applicable Specified Tenant lease pursuant to final, non-appealable order of a court of competent jurisdiction, (vi) the applicable Specified Tenant is paying full, unabated rent under the applicable Specified Tenant lease, and (vii) in the event the Specified Tenant Trigger Period is due to a Credit Rating Trigger, the applicable Specified Tenant with respect to which such Credit Rating Trigger occurred maintains for at least two consecutive calendar quarters a long-term unsecured debt rating no lower than such entity’s rating as of the date of origination of the Sayville Plaza Mortgage Loan (if any) from S&P and an equivalent rating from each of the other rating agencies which rate such entity.
“Specified Tenant Excess Cash Flow Condition” means (a) with respect to curing any Specified Tenant Trigger Period by re-tenanting the applicable Specified Tenant space, sufficient funds have been accumulated in the excess cash flow account and the leasing reserve account (during the continuance of the subject Specified Tenant Trigger Period) to cover all anticipated leasing commissions, tenant improvement costs, tenant allowances, free rent periods, and/or rent abatement periods to be incurred in connection with any such re-tenanting; and (b) with respect to curing any Specified Tenant Trigger Period by renewal/extension of any Specified Tenant Lease, sufficient funds have been accumulated in the excess cash flow account and the leasing reserve account (during the continuance of the subject Specified Tenant Trigger Period) to cover all anticipated leasing commissions, tenant improvement costs, tenant allowances, free rent periods, and/or rent abatement periods to be incurred in connection with any such renewal/extension. In no event will any excess cash flow funds which are being utilized to satisfy the Specified Tenant Excess Cash Flow Condition with respect to the cure of any Specified Tenant Trigger Period be available, credited, or otherwise taken into account in satisfying the Specified Tenant Excess Cash Flow Condition with respect to any other Specified Tenant Trigger Period.
Subordinate Debt. None.
Mezzanine Debt. None.
Partial Release. On any business day on or after the date that is 60 days after the closing date of the BMO 2023-C5 securitization, the borrower may obtain the release of those certain portions of the Sayville Plaza Mortgage Property which are ground leased to Taco Bell and Chick-Fil-A, respectively, as more particularly described in the Sayville Plaza Mortgage Loan documents (each, a “Release Parcel”), upon a bona fide third-party sale of such Release Parcel, in each case, provided that, among other conditions: (i) immediately before such release, no event of default is continuing under the Sayville Plaza Mortgage Loan documents; (ii) the borrower (a) makes a prepayment of principal in an amount equal to (x) (A) with respect to the Release Parcel associated with Taco Bell, $1,750,000 and (B) with respect to the Release Parcel associated with Chick-Fil-A, $2,425,000 and (y) 90% of the net sales proceeds with respect to such Release Parcel, and (b) in the event that, after giving effect to such transfer and prepayment pursuant to subclause (a), the ratio of the unpaid principal balance of the Sayville Plaza Mortgage Loan to the value of the remaining property is more than 125%, the principal balance of the Sayville Plaza Mortgage Loan must be prepaid by an amount equal to the least of the following amounts: (1) the net sales proceeds of such sale; (2) the fair market value of such Release Parcel at the time of the release; and (3) an amount such that the loan-to-value ratio of the Sayville Plaza Mortgage Loan does not increase after the release of such Release Parcel, unless the lender receives an opinion of counsel that if such amount is not paid, the applicable securitization will not fail to maintain its status as a REMIC Trust as a result of the release of such Release Parcel; (iii) the borrower delivers a REMIC opinion, (iv) as of the date of the consummation of the partial release, after giving effect to the release, the debt service coverage ratio and debt yield with respect to the remaining Sayville Plaza Mortgaged Property is no less
| THE INFORMATION IN THIS STRUCTURAL AND COLLATERAL TERM SHEET IS NOT COMPLETE AND MAY BE AMENDED PRIOR TO THE TIME OF SALE. THIS TERM SHEET IS NOT AN OFFER TO SELL THESE SECURITIES AND IT IS NOT A SOLICITATION OF AN OFFER TO BUY THESE SECURITIES IN ANY JURISDICTION WHERE THE OFFER OR SALE IS NOT PERMITTED. |
| | 109 | |
| Structural and Collateral Term Sheet | | BMO 2023-C5 |
| No. 10 – Sayville Plaza |
than the greater of (a) the debt service coverage ratio and debt yield as of the date of origination of the Sayville Plaza Mortgage Loan and (b) the debt service coverage ratio and debt yield for the remaining Sayville Plaza Mortgaged Property immediately prior to the consummation of the partial release; and (v) as of the date of the consummation of the partial release, after giving effect to the release, the loan-to-value ratio with respect to the remaining Sayville Plaza Mortgaged Property is no greater than the lesser of (a) the loan-to-value ratio as of the date of origination of the Sayville Plaza Mortgage Loan and (b) the loan-to-value ratio for the remaining Sayville Plaza Mortgaged Property immediately prior to the consummation of the partial release.
Ground Lease. None
| THE INFORMATION IN THIS STRUCTURAL AND COLLATERAL TERM SHEET IS NOT COMPLETE AND MAY BE AMENDED PRIOR TO THE TIME OF SALE. THIS TERM SHEET IS NOT AN OFFER TO SELL THESE SECURITIES AND IT IS NOT A SOLICITATION OF AN OFFER TO BUY THESE SECURITIES IN ANY JURISDICTION WHERE THE OFFER OR SALE IS NOT PERMITTED. |
| | 110 | |